Display Lighting Systems With Circadian Effects
Petluri; Raghuram L.V ; et al.
U.S. patent application number 16/393660 was filed with the patent office on 2019-08-15 for display lighting systems with circadian effects. This patent application is currently assigned to EcoSense Lighting, Inc.. The applicant listed for this patent is EcoSense Lighting, Inc.. Invention is credited to Raghuram L.V Petluri, Paul Kenneth Pickard.
| Application Number | 20190254142 16/393660 |
| Document ID | / |
| Family ID | 67219888 |
| Filed Date | 2019-08-15 |


View All Diagrams
| United States Patent Application | 20190254142 |
| Kind Code | A1 |
| Petluri; Raghuram L.V ; et al. | August 15, 2019 |
DISPLAY LIGHTING SYSTEMS WITH CIRCADIAN EFFECTS
Abstract
Display systems for displaying digital content. The display systems have one or more LED-based lighting channels adapted to generate a circadian-inducing blue light output in first operational mode and a less-circadian-inducing blue light output in a second operational mode. The circadian-inducing blue light can have a first circadian-stimulating energy characteristic related to the associated first spectral power distributions of light generated in the first operational mode, and the non-circadian-inducing blue light can have a second circadian-stimulating energy characteristic related to the associated second spectral power distribution of light generated in the second operational mode. Disclosure methods of generating digital display content with the display systems described herein. The methods can generate a circadian-inducing blue light output in first operational mode and a less-circadian-inducing blue light output in a second operational mode.
| Inventors: | Petluri; Raghuram L.V; (Los Angeles, CA) ; Pickard; Paul Kenneth; (Los Angeles, CA) | ||||||||||
| Applicant: |
|
||||||||||
|---|---|---|---|---|---|---|---|---|---|---|---|
| Assignee: | EcoSense Lighting, Inc. Los Angeles CA |
||||||||||
| Family ID: | 67219888 | ||||||||||
| Appl. No.: | 16/393660 | ||||||||||
| Filed: | April 24, 2019 |
Related U.S. Patent Documents
| Application Number | Filing Date | Patent Number | ||
|---|---|---|---|---|
| PCT/US19/13380 | Jan 11, 2019 | |||
| 16393660 | ||||
| PCT/US2018/020790 | Mar 2, 2018 | |||
| PCT/US19/13380 | ||||
| PCT/US2018/020787 | Mar 2, 2018 | |||
| PCT/US2018/020790 | ||||
| PCT/US2018/020793 | Mar 2, 2018 | |||
| PCT/US2018/020787 | ||||
| PCT/US2019/013356 | Jan 11, 2019 | |||
| PCT/US2018/020793 | ||||
| PCT/US2019/013359 | Jan 11, 2019 | |||
| PCT/US2019/013356 | ||||
| 62758411 | Nov 9, 2018 | |||
| 62616401 | Jan 11, 2018 | |||
| 62616404 | Jan 11, 2018 | |||
| 62634798 | Feb 23, 2018 | |||
| 62616423 | Jan 11, 2018 | |||
| 62616414 | Jan 11, 2018 | |||
| 62712182 | Jul 30, 2018 | |||
| 62712191 | Jul 30, 2018 | |||
| 62757672 | Nov 8, 2018 | |||
| 62757664 | Nov 8, 2018 | |||
| Current U.S. Class: | 1/1 |
| Current CPC Class: | G09G 1/10 20130101; H05B 45/20 20200101; G09G 3/3413 20130101; G09G 3/2003 20130101; G09G 3/32 20130101; H05B 45/60 20200101; G09G 2380/08 20130101 |
| International Class: | H05B 33/08 20060101 H05B033/08 |
Claims
1. A computer display system, comprising: a pixel array; wherein each pixel in the pixel array includes a plurality of sub-pixel color points comprising four different colors, wherein at least two of the four different colors comprise blue color points each having a peak intensity wavelength between 380 nm and 500 nm, wherein the blue color points comprise a first blue color point and a second blue color point, the first blue color point and the second blue color point configured to produce two different colors of blue, wherein the first blue color point is selected to affect a user's circadian rhythms by having a first spectral power distribution having a first emission spectrum between 440 nm and 500 nm, wherein the second blue color point has a second spectral power distribution having a second emission spectrum between 440 nm and 500 nm; and a processor adapted to select an intensity for each of the first blue color point and the second blue color point, wherein the processor controls the intensities of the first blue color point and the second blue color point based on sensor feedback.
2. The computer display system of claim 1, wherein the sensor feedback comprises one or more data sources that describe a user of the computer display system.
3. The computer display system of claim 2, wherein the one or more data sources comprises a wearable sensor worn by the user.
4. The computer display system of claim 2, wherein the one or more data sources comprises a physiological sensor that senses a physiological characteristic of the user.
5. The computer display system of claim 4, wherein the physiological characteristic is one of the user's temperature, blood pressure, heart rate, oxygen saturation, activity type, activity level, galvanic skin response, respiratory rate, cholesterol level, hormone or adrenal levels, histamine levels, immune system characteristics, blood alcohol levels, drug content, macro and micro nutrients, mood, emotional state, alertness, and sleepiness.
6. The computer display system of claim 4, wherein the physiological sensor comprises one or more wearable devices incorporated in armbands, wrist bands, chest bands, glasses, or clothing.
7. The computer display system of claim 1, wherein the sensor feedback comprises data from ambient sensors measuring one or more of temperature, pressure, ambient lighting conditions, localized lighting conditions, lighting spectrum characteristics, humidity, UV light, sound, particles, pollutants, gases, radiation, location of objects or items, and motion.
8. The computer display system of claim 1, wherein: a first percentage comprises the percentage of the spectral power between 380 nm and 780 nm in the first spectral power distribution between 440 nm and 490 nm; and a second percentage comprises the percentage of the spectral power between 380 nm and 780 nm in the second spectral power distribution between 440 nm and 490 nm.
9. The computer display system of claim 8, wherein a ratio of the first percentage to the second percentage is between about 13 and about 30.
10. The computer display system of claim 9, wherein the ratio of the first percentage to the second percentage is between about 15 and about 25.
11. The computer display system of claim 9, wherein the ratio of the first percentage to the second percentage is between about 20 and about 25.
12. The computer display system of claim 9, wherein the ratio of the first percentage to the second percentage is between about 20 and about 30.
13. The computer display system of claim 9, wherein the ratio of the first percentage to the second percentage is between about 18 and about 22.
14. The computer display system of claim 8, wherein the first percentage is between about 15% and about 25%.
15. The computer display system of claim 14, wherein the first percentage is between about 16% and about 22%.
16. The computer display system of claim 8, wherein the second percentage is between about 0.85% and about 1.05%.
17. The computer display system of claim 16, wherein the second percentage is between about 0.85% and about 0.95%.
18. The computer display system of claim 16, wherein the second percentage is between about 0.90% and about 0.95%.
19. The computer display system of claim 1, wherein: the first spectral power distribution has a first equivalent melanopic lux (EML) value; and the second spectral power distribution has a second equivalent melanopic lux (EML) value.
20. The computer display system of claim 19, wherein a ratio of the first EML value to the second EML value comprises a ratio between about 2.0 and about 10.0.
21. The computer display system of claim 20, wherein a ratio of the first EML value to the second EML value comprises a ratio between about 2.0 and about 5.5.
22. The computer display system of claim 20, wherein a ratio of the first EML value to the second EML value comprises a ratio between about 3.0 and about 5.0.
23. The computer display system of claim 20, wherein a ratio of the first EML value to the second EML value comprises a ratio between about 2.8 and about 3.8.
24. The computer display system of claim 20, wherein a ratio of the first EML value to the second EML value comprises a ratio between about 2.6 and about 3.3.
25. The computer display system of claim 20, wherein a ratio of the first EML value to the second EML value comprises a ratio between about 4.0 and about 5.5.
26. The computer display system of claim 20, wherein a ratio of the first EML value to the second EML value comprises a ratio between about 5.5 and about 6.5.
27. The computer display system of claim 1, wherein the peak intensity wavelength of the first blue color point is between 480 nm and 500 nm.
28. The computer display system of claim 1, wherein the peak intensity wavelength of the first blue color point is between 440 nm and 460 nm.
29. The computer display system of claim 1, wherein the peak intensity wavelength of the second blue color point is between 440 nm and 460 nm.
30. The computer display system of claim 1, wherein the peak intensity wavelength of the second blue color point is between 400 nm and 420 nm.
Description
CROSS-REFERENCE TO RELATED APPLICATIONS
[0001] This application is a Continuation of International Patent Application No. PCT/US2019/013380 filed Jan. 11, 2019, which claims benefit of U.S. Provisional Application No. 62/616,401 filed Jan. 11, 2018; U.S. Provisional Application No. 62/616,404 filed Jan. 11, 2018; U.S. Provisional Application No. 62/616,414 filed Jan. 11, 2018; U.S. Provisional Application No. 62/616,423 filed Jan. 11, 2018; U.S. Provisional Application No. 62/634,798 filed Feb. 23, 2018; U.S. Provisional Application No. 62/712,182 filed Jul. 30, 2018; U.S. Provisional Application No. 62/712,191 filed Jul. 30, 2018; U.S. Provisional Patent Application No. 62/757,672 filed Nov. 8, 2018; U.S. Provisional Patent Application No. 62/757,664 filed Nov. 8, 2018; U.S. Provisional Patent Application No. 62/758,411 filed Nov. 9, 2018; and International Patent Application Nos. PCT/US2018/020787 filed Mar. 2, 2018; PCT/US2018/020790 filed Mar. 2, 2018; PCT/US2018/020792 filed Mar. 2, 2018; PCT/US2018/020793 filed Mar. 2, 2018; PCT/US2019/013356 file Jan. 11, 2019; and PCT/US2019/013359 filed Jan. 11, 2019, the contents of which are incorporated by reference herein in their entirety as if fully set forth herein.
FIELD OF THE DISCLOSURE
[0002] This disclosure is in the field digital display devices. In particular, the disclosure relates to devices for use in, and methods of, providing lighting systems for use in digital display systems that can provide controllable biological effects.
BACKGROUND
[0003] A wide variety of light emitting devices are known in the art including, for example, incandescent light bulbs, fluorescent lights, and semiconductor light emitting devices such as light emitting diodes ("LEDs").
[0004] Displays for digital content can rely on arrays of pixels that produce individual color points. Displays can be backlit with a white light source, which can be LED-based, and then filtered at the pixel-level to produce colored pixels as desired. Alternatively, displays that are not based on backlighting with white light and filtering downstream can include LEDs at the pixel-level that directly emit light at each colored pixel.
[0005] There are a variety of resources utilized to describe the light produced from a light emitting device, one commonly used resource is 1931 CIE (Commission Internationale de l'Eclairage) Chromaticity Diagram. The 1931 CIE Chromaticity Diagram maps out the human color perception in terms of two CIE parameters x and y. The spectral colors are distributed around the edge of the outlined space, which includes all of the hues perceived by the human eye. The boundary line represents maximum saturation for the spectral colors, and the interior portion represents less saturated colors including white light. The diagram also depicts the Planckian locus, also referred to as the black body locus (BBL), with correlated color temperatures, which represents the chromaticity coordinates (i.e., color points) that correspond to radiation from a black-body at different temperatures. Illuminants that produce light on or near the BBL can thus be described in terms of their correlated color temperatures (CCT). These illuminants yield pleasing "white light" to human observers, with general illumination typically utilizing CCT values between 1,800K and 10,000K.
[0006] Color rendering index (CRI) is described as an indication of the vibrancy of the color of light being produced by a light source. In practical terms, the CRI is a relative measure of the shift in surface color of an object when lit by a particular lamp as compared to a reference light source, typically either a black-body radiator or the daylight spectrum. The higher the CRI value for a particular light source, the better that the light source renders the colors of various objects it is used to illuminate.
[0007] Color rendering performance may be characterized via standard metrics known in the art. Fidelity Index (Rf) and the Gamut Index (Rg) can be calculated based on the color rendition of a light source for 99 color evaluation samples ("CES"). The 99 CES provide uniform color space coverage, are intended to be spectral sensitivity neutral, and provide color samples that correspond to a variety of real objects. Rf values range from 0 to 100 and indicate the fidelity with which a light source renders colors as compared with a reference illuminant. In practical terms, the Rf is a relative measure of the shift in surface color of an object when lit by a particular lamp as compared to a reference light source, typically either a black-body radiator or the daylight spectrum. The higher the Rf value for a particular light source, the better that the light source renders the colors of various objects it is used to illuminate. The Gamut Index Rg evaluates how well a light source saturates or desaturates the 99 CES compared to the reference source.
[0008] LEDs have the potential to exhibit very high power efficiencies relative to conventional incandescent or fluorescent lights. Most LEDs are substantially monochromatic light sources that appear to emit light having a single color. Thus, the spectral power distribution of the light emitted by most LEDs is tightly centered about a "peak" wavelength, which is the single wavelength where the spectral power distribution or "emission spectrum" of the LED reaches its maximum as detected by a photo-detector. LEDs typically have a full-width half-maximum wavelength range of about 10 nm to 30 nm, comparatively narrow with respect to the broad range of visible light to the human eye, which ranges from approximately from 380 nm to 800 nm.
[0009] In order to use LEDs to generate white light, lighting systems have been provided that include two or more LEDs that each emit a light of a different color. The different colors combine to produce a desired intensity and/or color of white light. For example, by simultaneously energizing red, green and blue LEDs, the resulting combined light may appear white, or nearly white, depending on, for example, the relative intensities, peak wavelengths and spectral power distributions of the source red, green and blue LEDs. The aggregate emissions from red, green, and blue LEDs typically provide poor color rendering for general illumination applications due to the gaps in the spectral power distribution in regions remote from the peak wavelengths of the LEDs.
[0010] White light may also be produced by utilizing one or more luminescent materials such as phosphors to convert some of the light emitted by one or more LEDs to light of one or more other colors. The combination of the light emitted by the LEDs that is not converted by the luminescent material(s) and the light of other colors that are emitted by the luminescent material(s) may produce a white or near-white light.
[0011] LED lamps have been provided that can emit white light with different CCT values within a range. Such lamps utilize two or more LEDs, with or without luminescent materials, with respective drive currents that are increased or decreased to increase or decrease the amount of light emitted by each LED. By controllably altering the power to the various LEDs in the lamp, the overall light emitted can be tuned to different CCT values. The range of CCT values that can be provided with adequate color rendering values and efficiency is limited by the selection of LEDs.
[0012] The spectral profiles of light emitted by white artificial lighting can impact circadian physiology, alertness, and cognitive performance levels. Bright artificial light can be used in a number of therapeutic applications, such as in the treatment of seasonal affective disorder (SAD), certain sleep problems, depression, jet lag, sleep disturbances in those with Parkinson's disease, the health consequences associated with shift work, and the resetting of the human circadian clock. Artificial lighting may change natural processes, interfere with melatonin production, or disrupt the circadian rhythm. Blue light may have a greater tendency than other colored light to affect living organisms through the disruption of their biological processes which can rely upon natural cycles of daylight and darkness. Exposure to blue light late in the evening and at night may be detrimental to one's health. Some blue or royal blue light within lower wavelengths can have hazardous effects to human eyes and skin, such as causing damage to the retina.
[0013] Significant challenges remain in providing LED lamps that can provide white light across a range of CCT values while simultaneously achieving high efficiencies, high luminous flux, good color rendering, and acceptable color stability. It is also a challenge to provide lighting apparatuses that can provide desirable lighting performance while allowing for the control of circadian energy performance.
DISCLOSURE
[0014] In some aspects, the present disclosure provides display systems for displaying digital content, wherein the display systems comprise one or more LED-based lighting channels adapted to generate a circadian-inducing blue light output in first operational mode and a less-circadian-inducing blue light output in a second operational mode. The circadian-inducing blue light can have a first circadian-stimulating energy characteristic related to the associated first spectral power distributions of light generated in the first operational mode, and the non-circadian-inducing blue light can have a second circadian-stimulating energy characteristic related to the associated second spectral power distribution of light generated in the second operational mode. In certain implementations, the LED-based lighting channels can provide the individual pixels in a pixel array of the display systems. In some implementations, the individual pixels can be provided as microLED pixels or OLED pixels. In certain implementations, different combinations of different types of pixels can be used in different operational modes to generate more or less circadian-inducing blue light output. In some implementations, a first type of pixel is used in the first operational mode to provide the first spectral power distribution having the first circadian-stimulating energy characteristic. In other implementations, the LED-based lighting channels can provide white light sources for backlighting systems in the display systems. In certain implementations, the white light sources for backlighting systems can be provided as white lighting channels comprising an LED and an associated luminophoric medium that a produce a combined white light at a white color point within .+-.7 DUV of the Planckian locus on the 1931 CIE Chromaticity Diagram. In some implementations, the display systems can have two or more white lighting channels that are used in different operational modes to generate more or less circadian-inducing blue light output. In further implementations, the white light sources for backlighting systems can be provided as a combination of a plurality of lighting channels, each of the plurality of lighting channels comprising an LED and an associated luminophoric medium that produce a combined light at a color point, with the combinations of the plurality of lighting channels producing combined white light at a white color points within .+-.7 DUV of the Planckian locus on the 1931 CIE Chromaticity Diagram. In certain implementations, different combinations of the plurality of lighting channels of the display systems can be used in different operational modes to generate more or less circadian-inducing blue light output.
[0015] The present disclosure methods of generating digital display content with the display systems described herein. In certain implementations, the methods comprise generate a circadian-inducing blue light output in first operational mode and a less-circadian-inducing blue light output in a second operational mode.
[0016] The general disclosure and the following further disclosure are exemplary and explanatory only and are not restrictive of the disclosure, as defined in the appended claims. Other aspects of the present disclosure will be apparent to those skilled in the art in view of the details as provided herein. In the figures, like reference numerals designate corresponding parts throughout the different views. All callouts and annotations are hereby incorporated by this reference as if fully set forth herein.
DRAWINGS
[0017] The summary, as well as the following detailed description, is further understood when read in conjunction with the appended drawings. For the purpose of illustrating the disclosure, there are shown in the drawings exemplary implementations of the disclosure; however, the disclosure is not limited to the specific methods, compositions, and devices disclosed. In addition, the drawings are not necessarily drawn to scale. In the drawings:
[0018] FIG. 1 illustrates aspects of display systems according to the present disclosure;
[0019] FIG. 2 illustrates aspects of display systems according to the present disclosure, including aspects of lighting systems therein;
[0020] FIGS. 3a, 3b, 3c, and 3d illustrates aspects of display systems according to the present disclosure, including spectral power distributions for some exemplary lighting channels;
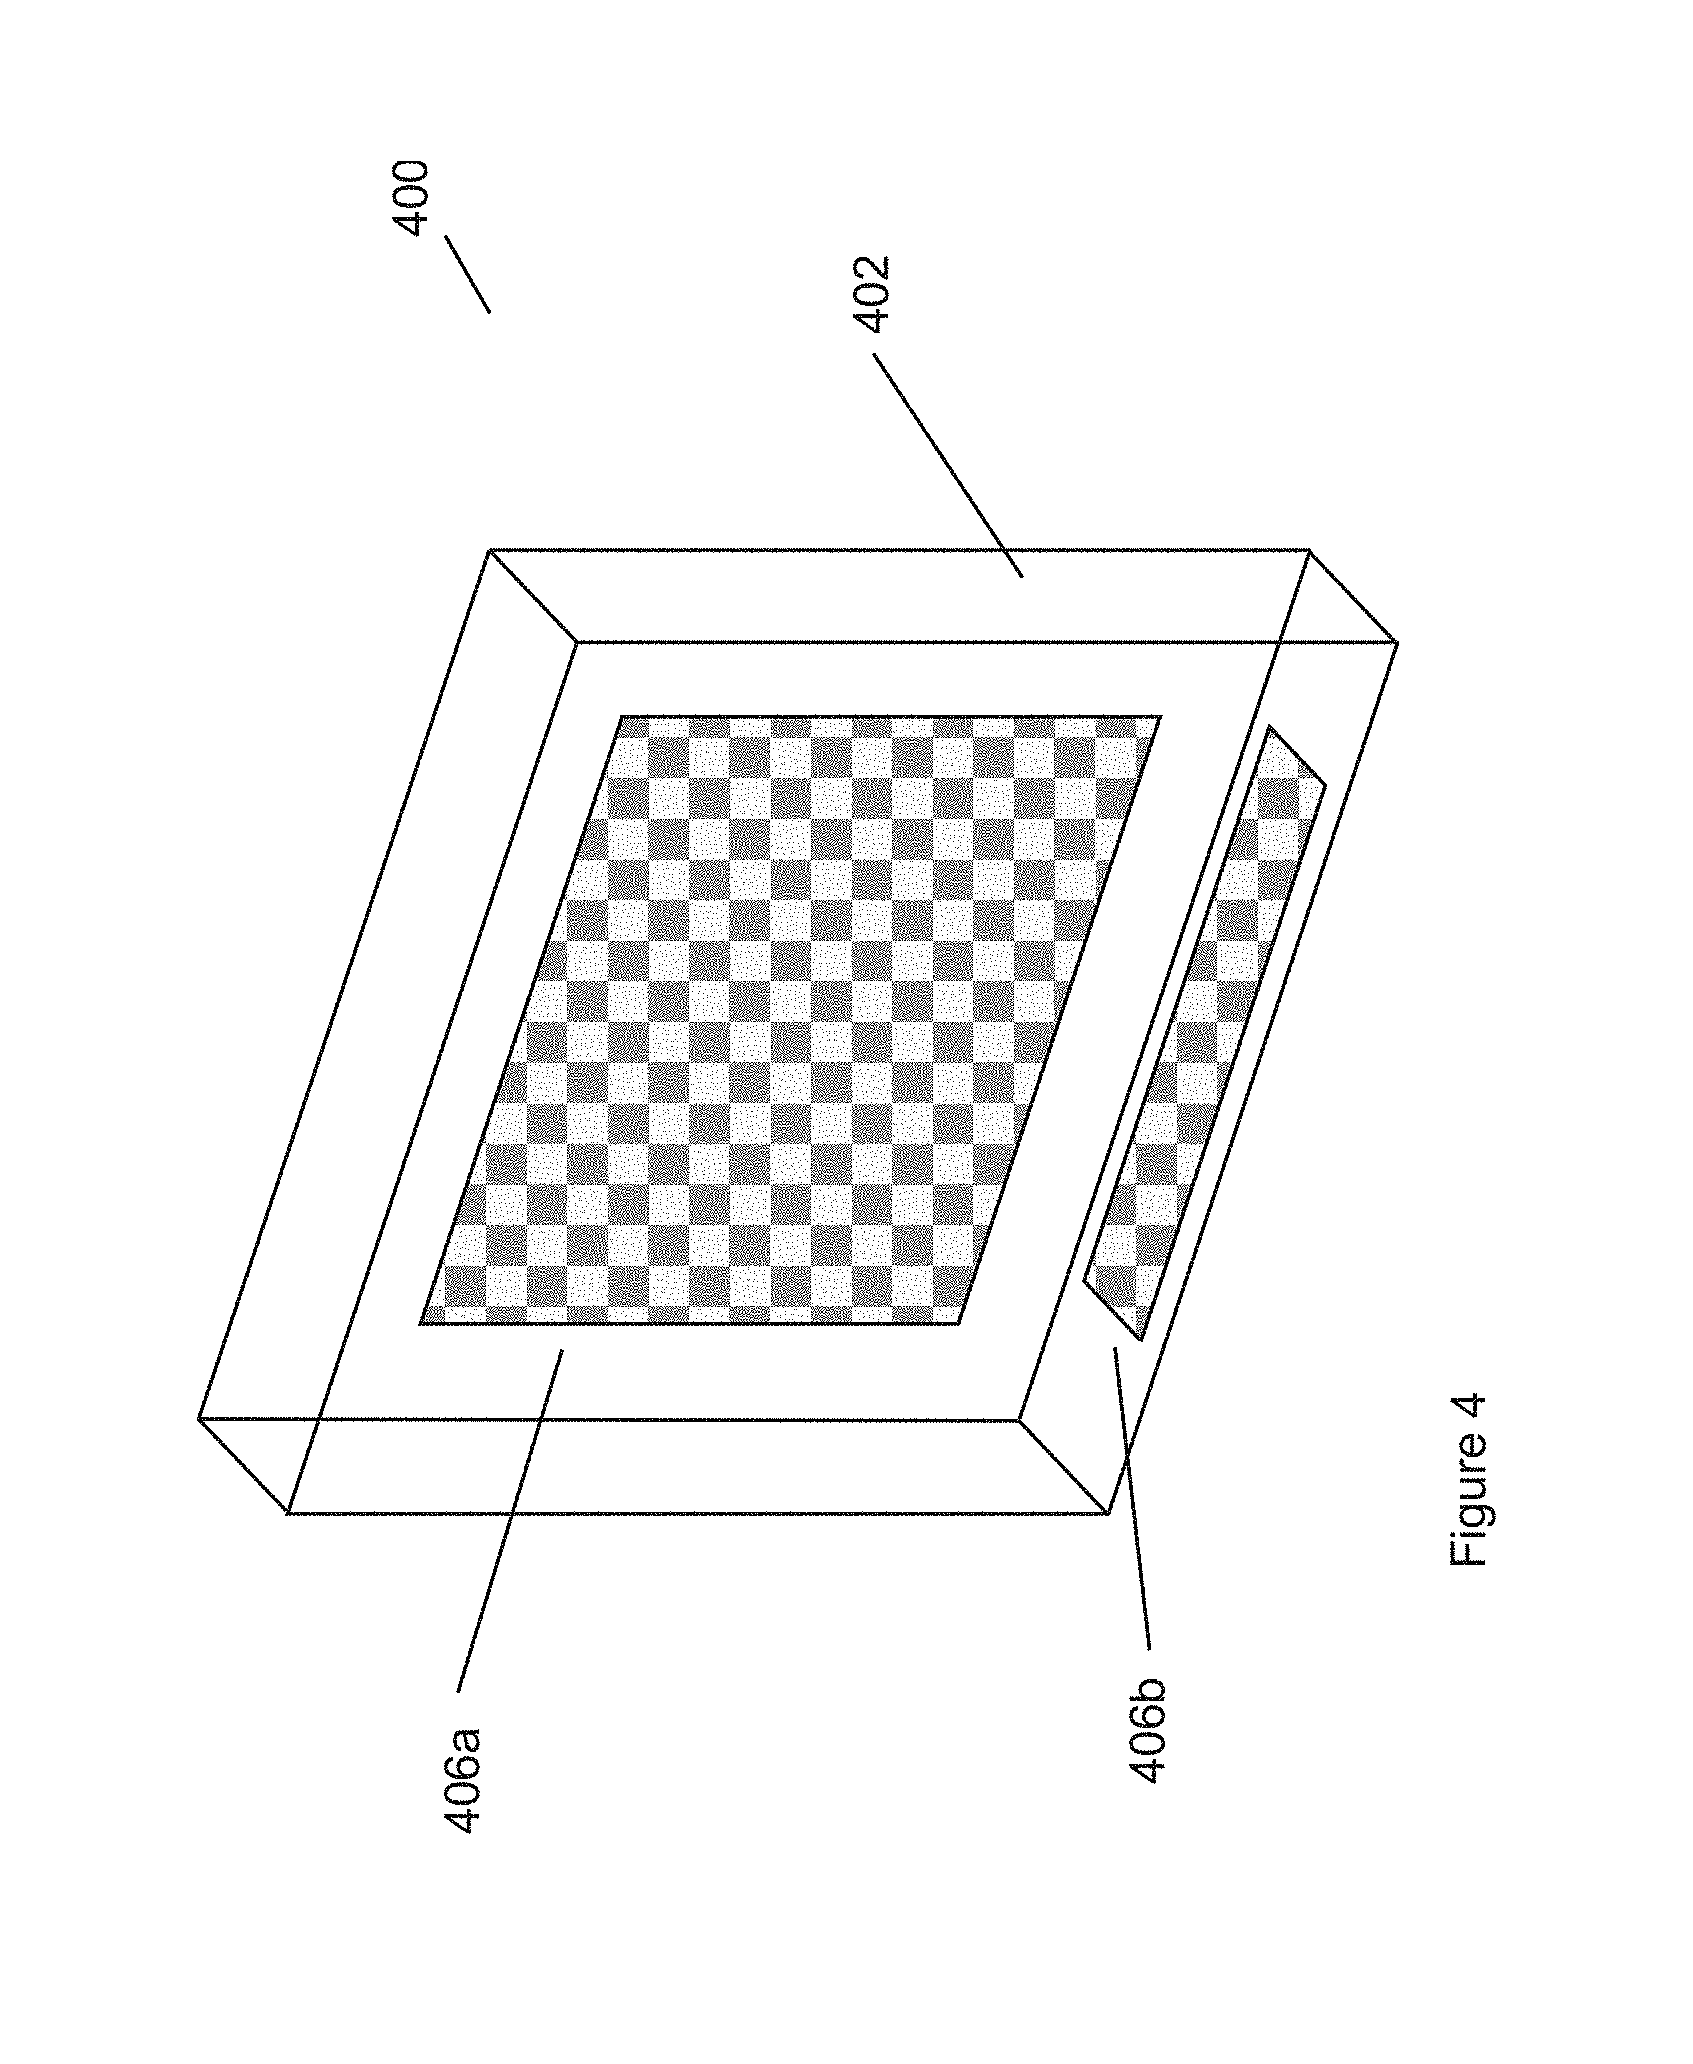
[0021] FIG. 4 illustrates aspects of display systems according to the present disclosure;
[0022] FIG. 5 illustrates some aspects of display systems according to the present disclosure, including aspects of spectral power distributions for light generated by components of the devices;
[0023] FIG. 6 illustrates some aspects of display systems according to the present disclosure, including aspects of spectral power distributions for light generated by components of the devices;
[0024] FIG. 7 illustrates some aspects of display systems according to the present disclosure, including aspects of spectral power distributions for light generated by components of the devices;
[0025] FIG. 8 illustrates some aspects of display systems according to the present disclosure, including aspects of spectral power distributions for light generated by components of the devices;
[0026] FIG. 9 illustrates some aspects of display systems according to the present disclosure, including aspects of spectral power distributions for light generated by components of the devices;
[0027] FIG. 10 illustrates some aspects of display systems according to the present disclosure, including aspects of spectral power distributions for light generated by components of the devices;
[0028] FIG. 11 illustrates some aspects of display systems according to the present disclosure, including aspects of spectral power distributions for light generated by components of the devices;
[0029] FIG. 12 illustrates some aspects of display systems according to the present disclosure, including aspects of spectral power distributions for light generated by components of the devices;
[0030] FIG. 13 illustrates some aspects of display systems according to the present disclosure, including aspects of spectral power distributions for light generated by components of the devices;
[0031] FIG. 14 illustrates some aspects of display systems according to the present disclosure, including some suitable color ranges for light generated by components of the devices
[0032] FIG. 15 illustrates some aspects of display systems according to the present disclosure, including some suitable color points for light generated by components of the display systems;
[0033] FIG. 16 illustrates some aspects of display systems according to the present disclosure, including some suitable color ranges for light generated by components of the display systems;
[0034] FIG. 17A and FIG. 17B illustrate some aspects of display systems according to the present disclosure, including some suitable color ranges for light generated by components of the display systems;
[0035] FIG. 18 illustrates some aspects of display systems according to the present disclosure in comparison with some prior art and some theoretical light sources, including some light characteristics of white light generated by display systems in various operational modes;
[0036] FIG. 19 illustrates some aspects of display systems according to the present disclosure, including aspects of spectral power distributions for light generated by components of the display systems;
[0037] FIG. 20 illustrates some aspects of display systems according to the present disclosure, including aspects of spectral power distributions for light generated by components of the display systems;
[0038] FIG. 21 illustrates some aspects of display systems according to the present disclosure, including aspects of spectral power distributions for light generated by components of the display systems;
[0039] FIGS. 22A-22B illustrate some aspects of display systems according to the present disclosure, including some suitable color ranges for light generated by components of the display systems;
[0040] FIG. 23 illustrates some aspects of display systems according to the present disclosure, including some suitable color ranges for light generated by components of the display systems;
[0041] FIG. 24 illustrates some aspects of display systems according to the present disclosure, including some suitable color ranges for light generated by components of the display systems;
[0042] FIG. 25 illustrates some aspects of display systems according to the present disclosure, including some suitable color ranges for light generated by components of the display systems;
[0043] FIG. 26 illustrates some aspects of display systems according to the present disclosure, including some suitable color ranges for light generated by components of the display systems;
[0044] FIG. 27 illustrates some aspects of display systems according to the present disclosure, including some suitable color ranges for light generated by components of the display systems; and
[0045] FIG. 28 illustrates some aspects of display systems according to the present disclosure, including some suitable color ranges for light generated by components of the display systems.
[0046] All descriptions and callouts in the Figures are hereby incorporated by this reference as if fully set forth herein.
FURTHER DISCLOSURE
[0047] The present disclosure may be understood more readily by reference to the following detailed description taken in connection with the accompanying figures and examples, which form a part of this disclosure. It is to be understood that this disclosure is not limited to the specific devices, methods, applications, conditions or parameters described and/or shown herein, and that the terminology used herein is for the purpose of describing particular exemplars by way of example only and is not intended to be limiting of the claimed disclosure. Also, as used in the specification including the appended claims, the singular forms "a," "an," and "the" include the plural, and reference to a particular numerical value includes at least that particular value, unless the context clearly dictates otherwise. The term "plurality", as used herein, means more than one. When a range of values is expressed, another exemplar includes from the one particular value and/or to the other particular value. Similarly, when values are expressed as approximations, by use of the antecedent "about," it will be understood that the particular value forms another exemplar. All ranges are inclusive and combinable.
[0048] The term "circadian-stimulating energy characteristics" refers to any characteristics of a spectral power distribution that may have biological effects on a subject. In some aspects, the circadian-stimulating energy characteristics of aspects of the lighting systems of this disclosure can include one or more of CS, CLA, EML, BLH, CER, CAF, LEF, circadian power, circadian flux, and the relative amount of power within one or more particular wavelength ranges.
[0049] It is to be appreciated that certain features of the disclosure which are, for clarity, described herein in the context of separate exemplar, may also be provided in combination in a single exemplary implementation. Conversely, various features of the disclosure that are, for brevity, described in the context of a single exemplary implementation, may also be provided separately or in any subcombination. Further, reference to values stated in ranges include each and every value within that range.
[0050] The 1931 CIE Chromaticity diagram is a two-dimensional chromaticity space in which every visible color is represented by a point having x- and y-coordinates, also referred to herein as (ccx, ccy) coordinates. Fully saturated (monochromatic) colors appear on the outer edge of the diagram, while less saturated colors (which represent a combination of wavelengths) appear on the interior of the diagram. The term "saturated", as used herein, means having a purity of at least 85%, the term "purity" having a well-known meaning to persons skilled in the art, and procedures for calculating purity being well-known to those of skill in the art. The Planckian locus, or black body locus (BBL), is known to those of skill in the art and follows the color an incandescent black body would take in the chromaticity space as the temperature of the black body changes from about 1000K to 10,000 K. The black body locus goes from deep red at low temperatures (about 1000 K) through orange, yellowish white, white, and finally bluish white at very high temperatures. The temperature of a black body radiator corresponding to a particular color in a chromaticity space is referred to as the "correlated color temperature." In general, light corresponding to a correlated color temperature (CCT) of about 2700 K to about 6500 K is considered to be "white" light. In particular, as used herein, "white light" generally refers to light having a chromaticity point that is within a 10-step MacAdam ellipse of a point on the black body locus having a CCT between 2700K and 6500K. However, it will be understood that tighter or looser definitions of white light can be used if desired. For example, white light can refer to light having a chromaticity point that is within a seven step MacAdam ellipse of a point on the black body locus having a CCT between 2700K and 6500K. The distance from the black body locus can be measured in the CIE 1960 chromaticity diagram, and is indicated by the symbol Auv, or DUV or duv as referred to elsewhere herein. If the chromaticity point is above the Planckian locus the DUV is denoted by a positive number; if the chromaticity point is below the locus, DUV is indicated with a negative number. If the DUV is sufficiently positive, the light source may appear greenish or yellowish at the same CCT. If the DUV is sufficiently negative, the light source can appear to be purple or pinkish at the same CCT. Observers may prefer light above or below the Planckian locus for particular CCT values, and light above or below the Planckian locus may be more or less suitable for use in displaying digital content on display systems in different settings or operational modes. DUV calculation methods are well known by those of ordinary skill in the art and are more fully described in ANSI C78.377, American National Standard for Electric Lamps-Specifications for the Chromaticity of Solid State Lighting (SSL) Products, which is incorporated by reference herein in its entirety for all purposes. The CIE Standard Illuminant D65 illuminant is intended to represent average daylight and has a CCT of approximately 6500K and the spectral power distribution is described more fully in Joint ISO/CIE Standard, ISO 10526:1999/CIE 5005/E-1998, CIE Standard Illuminants for Colorimetry, which is incorporated by reference herein in its entirety for all purposes.
[0051] The color points described in the present disclosure can be within color-point ranges defined by geometric shapes on the 1931 CIE Chromaticity Diagram that enclose a defined set of ccx, ccy color coordinates. It should be understood that any gaps or openings in any described or depicted boundaries for color-point ranges should be closed with straight lines to connect adjacent endpoints in order to define a closed boundary for each color-point range.
[0052] The light emitted by a light source may be represented by a point on a chromaticity diagram, such as the 1931 CIE chromaticity diagram, having color coordinates denoted (ccx, ccy) on the X-Y axes of the diagram. A region on a chromaticity diagram may represent light sources having similar chromaticity coordinates.
[0053] The ability of a light source to accurately reproduce color in illuminated objects can be characterized using the color rendering index ("CRI"), also referred to as the CIE Ra value. The Ra value of a light source is a modified average of the relative measurements of how the color rendition of an illumination system compares to that of a reference black-body radiator or daylight spectrum when illuminating eight reference colors R1-R8. Thus, the Ra value is a relative measure of the shift in surface color of an object when lit by a particular lamp. The Ra value equals 100 if the color coordinates of a set of test colors being illuminated by the illumination system are the same as the coordinates of the same test colors being irradiated by a reference light source of equivalent CCT. For CCTs less than 5000K, the reference illuminants used in the CRI calculation procedure are the SPDs of blackbody radiators; for CCTs above 5000K, imaginary SPDs calculated from a mathematical model of daylight are used. These reference sources were selected to approximate incandescent lamps and daylight, respectively. Daylight generally has an Ra value of nearly 100, incandescent bulbs have an Ra value of about 95, fluorescent lighting typically has an Ra value of about 70 to 85, while monochromatic light sources have an Ra value of essentially zero. Light sources for general illumination applications with an Ra value of less than 50 are generally considered very poor and are typically only used in applications where economic issues preclude other alternatives. The calculation of CIE Ra values is described more fully in Commission Internationale de l'Eclairage. 1995. Technical Report: Method of Measuring and Specifying Colour Rendering Properties of Light Sources, CIE No. 13.3-1995. Vienna, Austria: Commission Internationale de l'Eclairage, which is incorporated by reference herein in its entirety for all purposes. In addition to the Ra value, a light source can also be evaluated based on a measure of its ability to render a saturated red reference color R9, also known as test color sample 9 ("TCS09"), with the R9 color rendering value ("R9 value"). Light sources can also be evaluated based on a measure of ability to render additional colors R10-R15, which include realistic colors like yellow, green, blue, Caucasian skin color (R13), tree leaf green, and Asian skin color (R15), respectively. Light sources can further be evaluated by calculating the gamut area index ("GAI"). Connecting the rendered color points from the determination of the CIE Ra value in two dimensional space will form a gamut area. Gamut area index is calculated by dividing the gamut area formed by the light source with the gamut area formed by a reference source using the same set of colors that are used for CRI. GAI uses an Equal Energy Spectrum as the reference source rather than a black body radiator. A gamut area index related to a black body radiator ("GAIBB") can be calculated by using the gamut area formed by the blackbody radiator at the equivalent CCT to the light source.
[0054] The ability of a light source to accurately reproduce color in illuminated objects can be characterized using the metrics described in IESMethod for Evaluating Light Source Color Rendition, Illuminating Engineering Society, Product ID: TM-30-15 (referred to herein as the "TM-30-15 standard"), which is incorporated by reference herein in its entirety for all purposes. The TM-30-15 standard describes metrics including the Fidelity Index (Rf) and the Gamut Index (Rg) that can be calculated based on the color rendition of a light source for 99 color evaluation samples ("CES"). The 99 CES provide uniform color space coverage, are intended to be spectral sensitivity neutral, and provide color samples that correspond to a variety of real objects. Rf values range from 0 to 100 and indicate the fidelity with which a light source renders colors as compared with a reference illuminant. Rg values provide a measure of the color gamut that the light source provides relative to a reference illuminant. The range of Rg depends upon the Rf value of the light source being tested. The reference illuminant is selected depending on the CCT. For CCT values less than or equal to 4500K, Planckian radiation is used. For CCT values greater than or equal to 5500K, CIE Daylight illuminant is used. Between 4500K and 5500K a proportional mix of Planckian radiation and the CIE Daylight illuminant is used, according to the following equation:
S r , M ( .lamda. , T t ) = 5500 - T t 1000 S r , P ( .lamda. , T t ) + ( 1 - 5500 - T t 1000 ) S r , D ( .lamda. , T t ) , ##EQU00001##
where T.sub.t is the CCT value, S.sub.r,M(.lamda., T.sub.t) is the proportional mix reference illuminant, S.sub.r,P(.lamda., T) is Planckian radiation, and S.sub.r,D(.lamda., T.sub.t) is the CIE Daylight illuminant.
[0055] Circadian illuminance (CLA) is a measure of circadian effective light, spectral irradiance distribution of the light incident at the cornea weighted to reflect the spectral sensitivity of the human circadian system as measured by acute melatonin suppression after a one-hour exposure, and CS, which is the effectiveness of the spectrally weighted irradiance at the cornea from threshold (CS=0.1) to saturation (CS=0.7). The values of CLA are scaled such that an incandescent source at 2856K (known as CIE Illuminant A) which produces 1000 lux (visual lux) will produce 1000 units of circadian lux (CLA). CS values are transformed CLA values and correspond to relative melotonian suppression after one hour of light exposure for a 2.3 mm diameter pupil during the mid-point of melotonian production. CS is calculated from
CS = | 0.7 ( 1 - 1 1 + ( CLA 355.7 ) ^ 1.126 ) . ##EQU00002##
The calculation of CLA is more fully described in Rea et al., "Modelling the spectral sensitivity of the human circadian system," Lighting Research and Technology, 2011; 0: 1-12, and Figueiro et al., "Designing with Circadian Stimulus", October 2016, LD+A Magazine, Illuminating Engineering Society of North America, which are incorporated by reference herein in its entirety for all purposes. Figueiro et al. describe that exposure to a CS of 0.3 or greater at the eye, for at least one hour in the early part of the day, is effective for stimulating the circadian system and is associated with better sleep and improved behavior and mood.
[0056] Equivalent Melanopic Lux (EML) provides a measure of photoreceptive input to circadian and neurophysiological light responses in humans, as described in Lucas et al., "Measuring and using light in the melanopsin age." Trends in Neurosciences, January 2014, Vol. 37, No. 1, pages 1-9, which is incorporated by reference herein in its entirety, including all appendices, for all purposes. Melanopic lux is weighted to a photopigment with Amax 480 nm with pre-receptoral filtering based on a 32 year old standard observer, as described more fully in the Appendix A, Supplementary Data to Lucas et al. (2014), User Guide: Irradiance Toolbox (Oxford 18 Oct. 2013), University of Manchester, Lucas Group, which is incorporated by reference herein in its entirety for all purposes. EML values are shown in the tables and Figures herein as the ratio of melanopic lux to luminous flux, with luminous flux considered to be 1000 lumens. It can be desirable for biological effects on users to provide illumination having higher EML in the morning, but lower EML in the late afternoon and evening.
[0057] Blue Light Hazard (BLH) provides a measure of potential for a photochemical induced retinal injury that results from radiation exposure. Blue Light Hazard is described in IEC/EN 62471, Photobiological Safety of Lamps and Lamp Systems and Technical Report IEC/TR 62778: Application of IEC 62471 for the assessment of blue light hazard to light sources and luminaires, which are incorporated by reference herein in their entirety for all purposes. A BLH factor can be expressed in (weighted power/lux) in units of .mu.W/cm.sup.2/lux.
[0058] In some aspects the present disclosure relates to lighting devices and methods to provide light having particular vision energy and circadian energy performance. Many figures of merit are known in the art, some of which are described in Ji Hye Oh, Su Ji Yang and Young Rag Do, "Healthy, natural, efficient and tunable lighting: four-package white LEDs for optimizing the circadian effect, color quality and vision performance," Light: Science & Applications (2014) 3: e141-e149, which is incorporated herein in its entirety, including supplementary information, for all purposes. Luminous efficacy of radiation ("LER") can be calculated from the ratio of the luminous flux to the radiant flux (S(.lamda.)), i.e. the spectral power distribution of the light source being evaluated, with the following equation:
LER ( lm W ) = 683 ( lm W ) .intg. V ( .lamda. ) S ( .lamda. ) d .lamda. .intg. S ( .lamda. ) d .lamda. . ##EQU00003##
Circadian efficacy of radiation ("CER") can be calculated from the ratio of circadian luminous flux to the radiant flux, with the following equation:
CER ( blm W ) = 683 ( blm W ) .intg. C ( .lamda. ) S ( .lamda. ) d .lamda. .intg. S ( .lamda. ) d .lamda. . ##EQU00004##
Circadian action factor ("CAF") can be defined by the ratio of CER to LER, with the following equation:
( blm lm ) = CER ( blm W ) LER ( lm W ) . ##EQU00005##
The term "blm" refers to biolumens, units for measuring circadian flux, also known as circadian lumens. The term "lm" refers to visual lumens. V(.lamda.) is the photopic spectral luminous efficiency function and C(.lamda.) is the circadian spectral sensitivity function. The calculations herein use the circadian spectral sensitivity function, C(.lamda.), from Gall et al., Proceedings of the CIE Symposium 2004 on Light and Health: Non-Visual Effects, 30 Sep.-2 Oct. 2004; Vienna, Austria 2004. CIE: Wien, 2004, pp 129-132, which is incorporated herein in its entirety for all purposes. By integrating the amount of light (milliwatts) within the circadian spectral sensitivity function and dividing such value by the number of photopic lumens, a relative measure of melatonin suppression effects of a particular light source can be obtained. A scaled relative measure denoted as melatonin suppressing milliwatts per hundred lumens may be obtained by dividing the photopic lumens by 100. The term "melatonin suppressing milliwatts per hundred lumens" consistent with the foregoing calculation method is used throughout this application and the accompanying figures and tables.
[0059] The ability of a light source to provide illumination that allows for the clinical observation of cyanosis is based upon the light source's spectral power density in the red portion of the visible spectrum, particularly around 660 nm. The cyanosis observation index ("COI") is defined by AS/NZS 1680.2.5 Interior Lighting Part 2.5: Hospital and Medical Tasks, Standards Australia, 1997 which is incorporated by reference herein in its entirety, including all appendices, for all purposes. COI is applicable for CCTs from about 3300K to about 5500K, and is preferably of a value less than about 3.3. If a light source's output around 660 nm is too low a patient's skin color may appear darker and may be falsely diagnosed as cyanosed. If a light source's output at 660 nm is too high, it may mask any cyanosis, and it may not be diagnosed when it is present. COI is a dimensionless number and is calculated from the spectral power distribution of the light source. The COI value is calculated by calculating the color difference between blood viewed under the test light source and viewed under the reference lamp (a 4000 K Planckian source) for 50% and 100% oxygen saturation and averaging the results. The lower the value of CO, the smaller the shift in color appearance results under illumination by the source under consideration.
[0060] The ability of a light source to accurately reproduce color in illuminated objects can be characterized by the Television Lighting Consistency Index ("TLCI-2012" or "TLCI") value Qa, as described fully in EBU Tech 3355, Method for the Assessment of the Colorimetric Properties of Luminaires, European Broadcasting Union ("EBU"), Geneva, Switzerland (2014), and EBU Tech 3355-s1, An Introduction to Spectroradiometry, which are incorporated by reference herein in their entirety, including all appendices, for all purposes. The TLCI compares the test light source to a reference luminaire, which is specified to be one whose chromaticity falls on either the Planckian or Daylight locus and having a color temperature which is that of the CCT of the test light source. If the CCT is less than 3400 K, then a Planckian radiator is assumed. If the CCT is greater than 5000 K, then a Daylight radiator is assumed. If the CCT lies between 3400 K and 5000 K, then a mixed illuminant is assumed, being a linear interpolation between Planckian at 3400 K and Daylight at 5000 K. Therefore, it is necessary to calculate spectral power distributions for both Planckian and Daylight radiators. The mathematics for both operations is known in the art and is described more fully in CIE Technical Report 15:2004, Colorimetry 3.sup.rd ed., International Commission on Illumination (2004), which is incorporated herein in its entirety for all purposes.
Displays
[0061] Aspects of the present inventions relate to display systems that are adapted to produce and display color(s) at the pixel level that can be used to help in inducing and/or regulating a circadian rhythm cycle in a person looking at the displays or otherwise proximate the display. The display systems may be computer displays or television displays. The lighting system for the display systems pixels may be arranged to produce colors of the pixels in the display that effect the circadian rhythm over the course of time. The lighting system may be adapted to generate a circadian-inducing blue frequency of light (e.g. cyan, energy at and/or near 485 nm) that causes activity associated with `waking` the person through the circadian cycle (e.g. effecting, causing, or maintaining a wakeful and alert state in the viewer by enabling melatonin suppression by exciting the Intrinsically photosensitive retinal ganglion cells (ipRGCs)). It may also be adapted to reduce the circadian-inducing blue frequency over time to reduce the `waking` effect. The lighting system may further be adapted with two or more separate blue frequencies such that either or both may be used to generate the blue in the pixels of the display. One of the blue frequencies may be a standard blue color (e.g. substantial energy around approximately 450 nm, a narrow band emission around approximately 450 nm) such that the display pixel generates standard display colors and another blue frequency may be a circadian-inducing blue (e.g. a cyan emission, substantial energy around approximately 485 nm, a narrow or broad band emission around approximately 485 nm) that is designed to effect the circadian rhythm in a more significant way by waking the person. With such a display, the display pixel colors can be changed from standard colors to represent colors accurately, according to display color standards, to display colors that are similar but not necessarily standard colors to generate an effect of the person's circadian rhythm. While the non-standard blue pixels may not be standard and may not display computer generated content in accordance with a standard color pallet, in many situations the colors may be acceptable by a user because the colors may still be acceptable while also inducing a circadian rhythm to awaken the person while using the display in the special color mode.
[0062] The circadian-inducing blue may have significant energy at a longer wavelength than the typical blue used in a display. The inventors have appreciated that longer wavelengths in the blue and cyan regions (e.g. wavelengths between the typical display blue and typical display green) can be used to both generate acceptable colors in the computer-generated content and also have a greater effect on a person's circadian rhythm. In embodiments, the energy may be provided in a narrow band (e.g. a typical LED narrow band emission spectra with a maximum energy between 460 nm and 500 nm, 460 nm and 480 nm, 470 nm and 480 nm, or 490 nm and 500 nm). In embodiments, the energy may be more broadly spread (e.g. through the use of a phosphor or quantum dot structure) such that there is significant energy produced in the region between 460 nm and 500 nm. In such broad width systems the maximum energy may or may not fall within the 460 nm to 500 nm region. For example, the peak may be at or near the typical display blue of 450 nm and also have significant energy in the 460 nm to 500 nm region. The significant energy may be an intensity of more than 10%, 20%, 30%, 40%, or 50% of the maximum energy. That significant energy may fall within the regions of 460 and 470 nm, 470 nm and 480 nm, or 490 nm and 500 nm for example.
[0063] A computer display according to the principles of the present inventions may include a micro-LED array where the micro-LED array includes a pixel array formed of micro-LEDs including red, green and blue generating LEDs. In embodiments, the blue LED may be a circadian rhythm inducing blue LED (as described herein). If only three colors are arranged in the pixel array, the circadian-inducing blue for the pixel may not fall within the standard color gamut for the display but will generally generate acceptable colors while effecting the circadian rhythm. In embodiments, the pixel array includes two different color generating blue LEDs, one with a standard color for the display and one that may not be within the standard color gamut for display but that is adapted to effect the circadian rhythm to induce a waking effect. This arrangement would include four colors per pixel in the pixel array of the micro-LED array. In embodiments, the computer display includes only a portion of micro-LEDs with the circadian rhythm effecting blue. The micro-LED pixels may be built with different color generating LEDs, white LEDs with filters, LEDs with phosphors, etc.
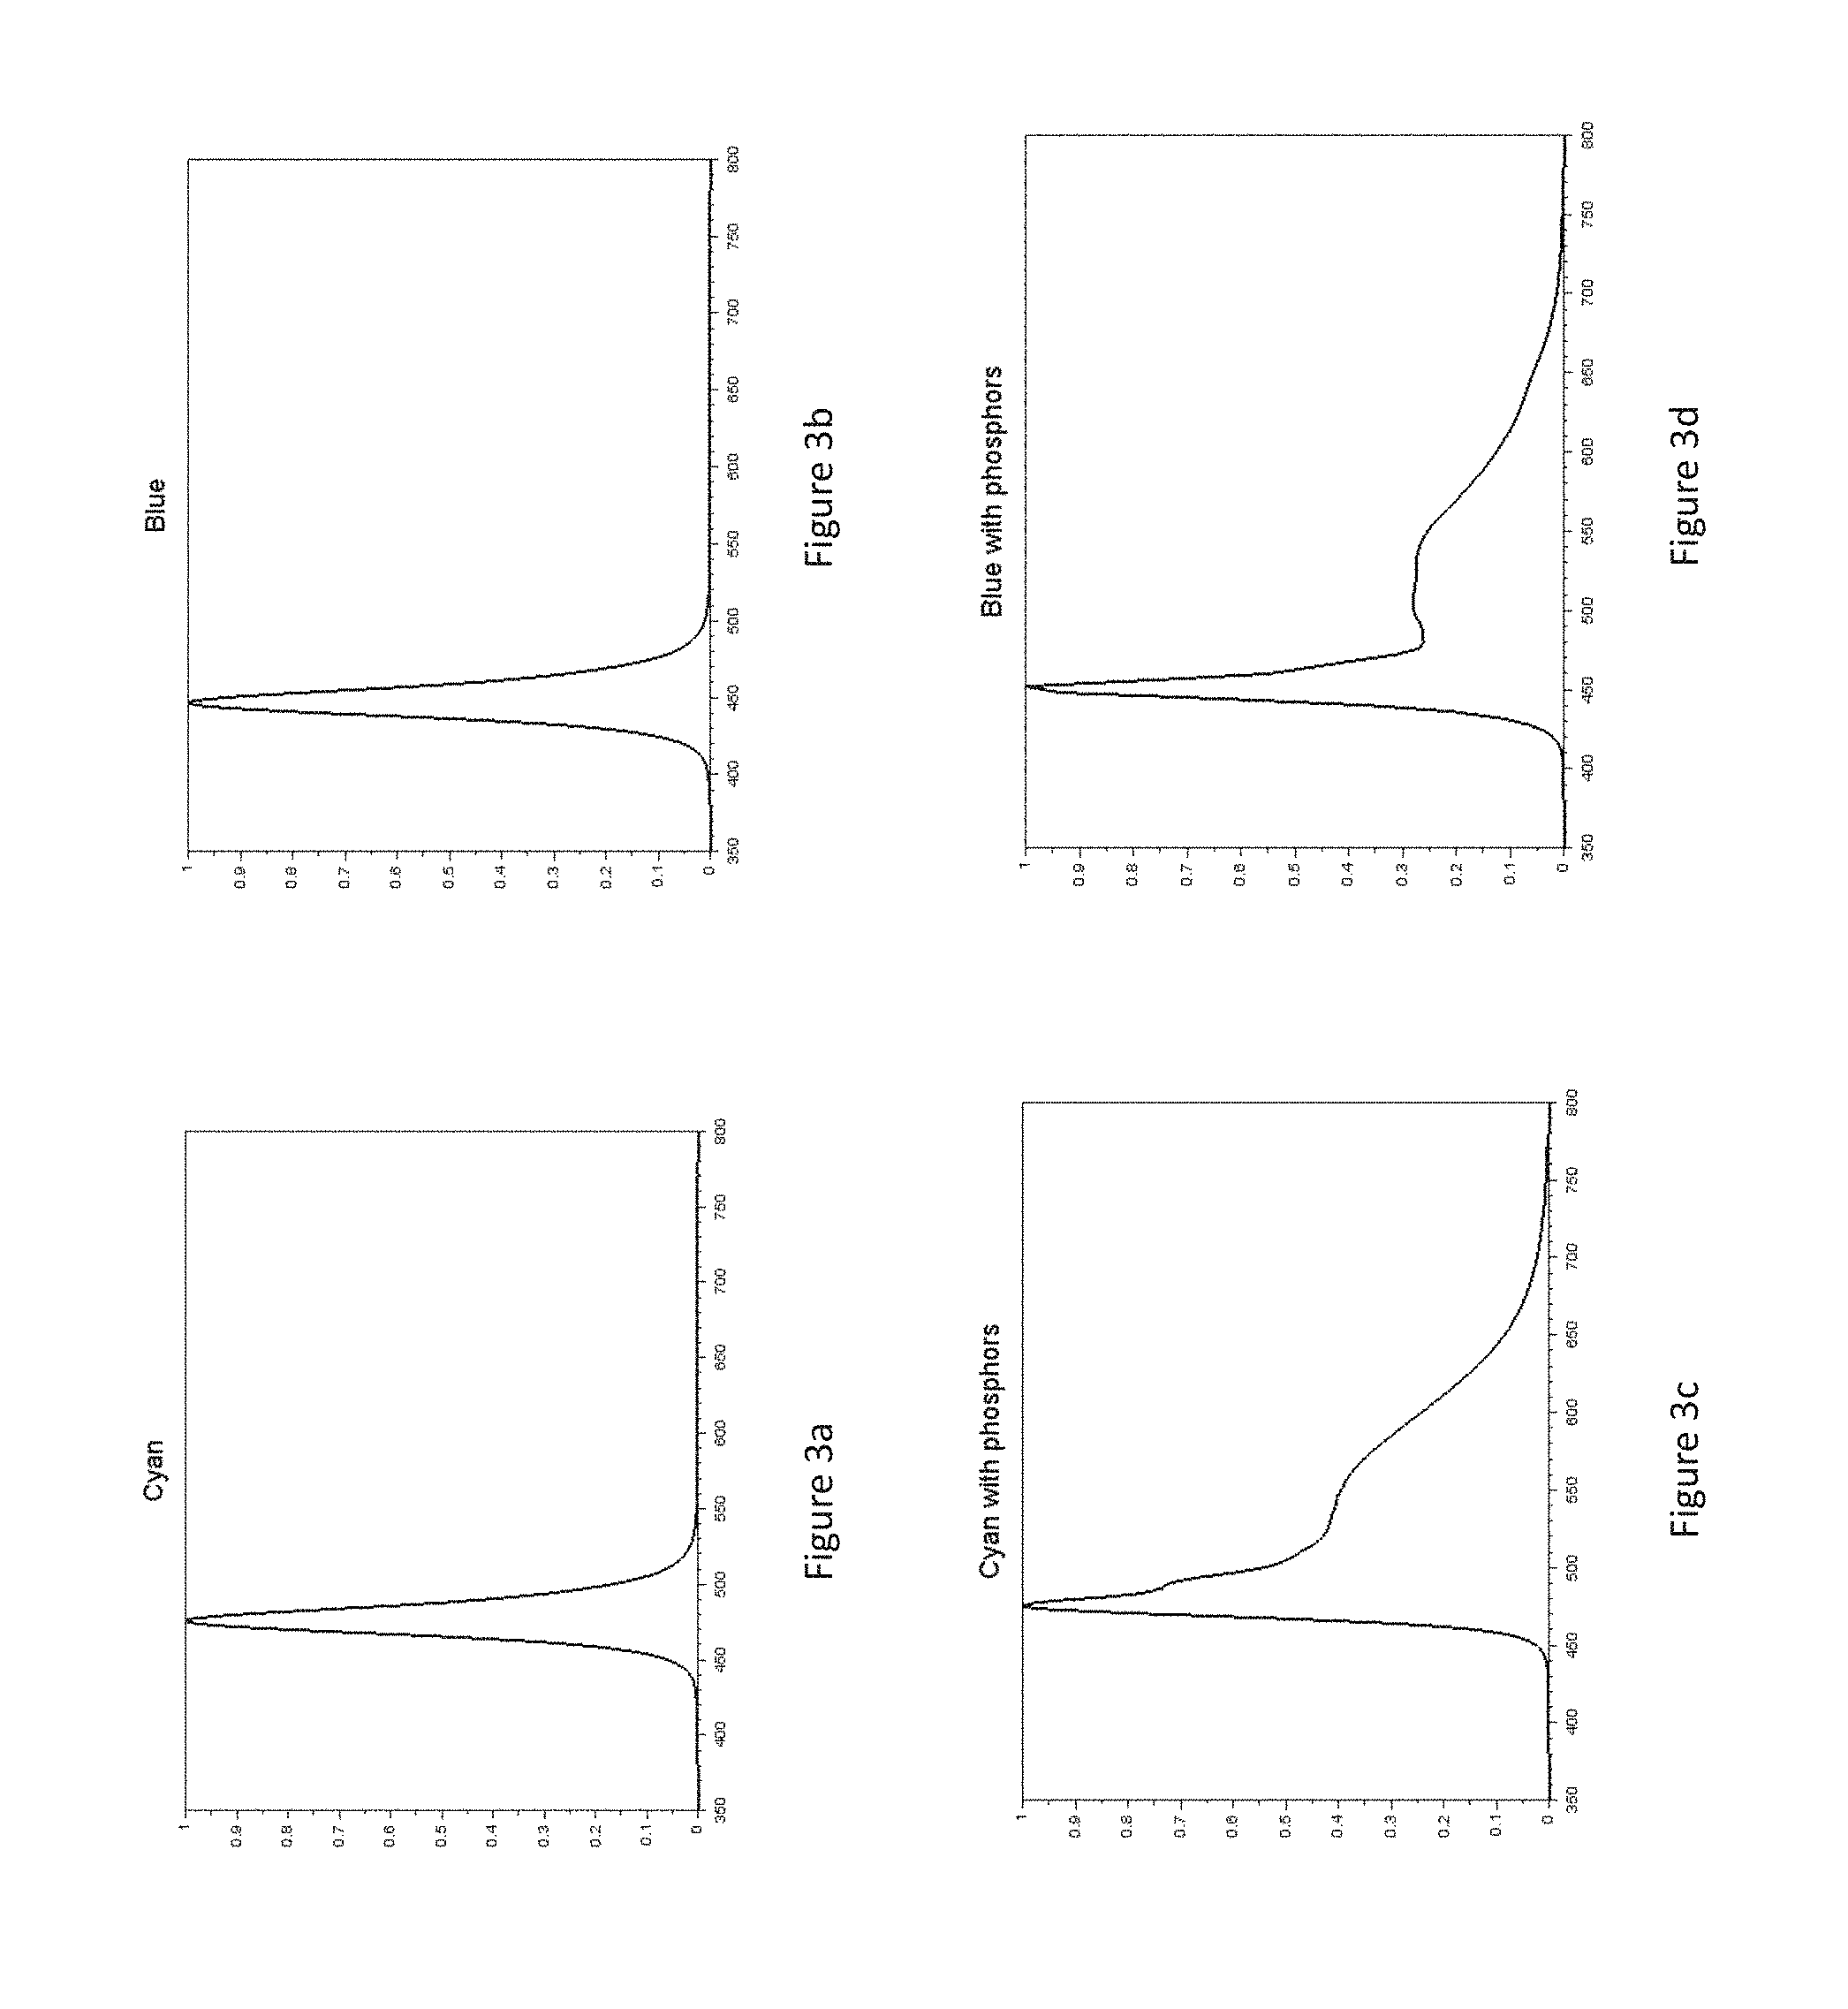
[0064] In embodiments, the circadian-inducing blue microLED may have a narrow emission characteristic where substantially all of the energy is produced over 120 nm or so and having a full width at half maximum (FWHM) of about 40 nm. FIG. 3a illustrates and example spectral power distribution of such a microLED. In embodiments, the circadian-inducing blue microLED may have a broader emission characteristic. FIG. 3c illustrates one such example spectral power distribution. The broader emission may be developed by adding a phosphor to the microLED system, by using a number of narrow band emission microLEDs, etc. In embodiments, a filter may be associated with the microLED. For example, the desired blue color point may include an emission band that is broader than is achievable through a single narrow emission microLED so a phosphor or multiple narrow band LEDs may be used to broaden the emission and then a filter may be used to cut the broader emission down to the desired amount.
[0065] A standard color computer display may use a blue LED with a narrow emission characteristic, such as is illustrated in FIG. 3b. In embodiments, the standard blue may be replaced with a broader band blue, such as is illustrated in FIG. 3d, to add some cyan to the emission (i.e. slightly longer wavelength energy). This configuration may also include a filter to cut the long tail but maintain some emission in the circadian blue emission region.
[0066] A computer display according to the principles of the present inventions may include an LCD backlit pixel array. Generally, an LCD backlit display has a backlight that generates a broadband of colors (e.g. white LEDs, white fluorescent) or one that generates narrow bands of color (e.g. red, green, and blue LEDs). Manufactures have typically adopted an arrangement where the backlight is a broadband white LED based system and each pixel of the LCD array is associated with a colored filter (e.g. red, green and blue) to produce the full color gamut for each pixel of the display. In embodiments, the LCD pixel array includes filters to produce three colors per pixel based on a backlighting system that produces white light. The pixel filters filter the white light into red, green and blue. The backlight also generally produces a constant amount of light and the LCD's at each sub pixel color are changed to regulate the intensity of the color of the sub pixel (e.g. 256 steps based on a polarization setting at the sub pixel level). In embodiments, the blue filter is adapted to transmit light that is more effective at effecting the circadian rhythm (e.g. 485 nm). In embodiments, each pixel includes a fourth filter for a fourth sub pixel color. The fourth pixel uses a circadian blue pass filter such that light transmitting the sub pixel filter effects the circadian cycle in a more significant way than light passing through a standard blue filter in the pixel array. With the fourth filter configuration, the display may be set to use one and/or the other color of blue to form the blue in the pixels.
[0067] In other embodiments, the backlight produces red, green and blue in a sequence and only one LCD is used per pixel position such that the one LCD will turn on in sequence with the desired corresponding required color for the pixel. The sequential lighting system may than include a circadian-inducing blue color to effect the circadian rhythm. The sequential lighting system may further include two different colors of blue (e.g. standard blue and circadian blue) and the sequence cycles through all four colors. In embodiments, the circadian blue color may or may not be included in every cycle of the sequence. Reducing the number of cycles involves may have an effect on the perceived combined color of the pixel and of the effect of the circadian rhythm.
[0068] In embodiments of the LCD configuration(s), the backlight may be modified to include enhanced emission at the circadian blue region. For example, a cyan LED may be included in the backlight itself such that it produces enough emission in the circadian blue region that it can generate adequate color for display and effect on the person's circadian rhythm. The backlight may include a broadband emission source (e.g. as illustrated in FIG. 3c) or a narrow emission source (e.g. as illustrated in FIG. 3a) for this purpose. The filter associated with the circadian blue pixels can then be adjusted to transmit the desired bandwidth of light in the region. Traditionally, the backlights used in a display do not produce much emission in this desired region so changing the lighting system to include more emission in this region may be desirable.
[0069] A computer display according to the principles of the present inventions may include an OLED pixel array where the OLED array includes a pixel array formed of OLED sub pixels. The OLEDs may including red, green and blue generating OLEDs. In other embodiments, the OLEDs may produce white light and include filters to pass only the particular color desired for the sub pixel. In embodiments, the blue OLED or filter may be adapted to produce a circadian rhythm inducing blue color. If only three colors are arranged in the pixel array, the blue for the pixel may not fall within the standard color for the display but will generally generate acceptable colors while effecting the circadian rhythm. In embodiments, the pixel array may include two different color blue OLEDs, one with a standard color for the display and one that may not be within the standard color gamut for display but that is adapted to effect the circadian rhythm wake cycle. This arrangement would include four colors per pixel in the pixel array of the OLED array. In embodiments, the computer display includes only a portion of OLEDs with the circadian rhythm effecting blue.
[0070] In embodiments, the circadian-inducing OLED may produce a broadband of light in the region and be filtered. In embodiments, the circadian-inducing OLED may produce a narrow band emission and possibly be filtered or not.
[0071] Aspects of the present inventions relate to the inclusion of more than three standard colors in a computer display pixel array. The more than three colors may include the addition of a color(s) that is intended to provide a display that is switchable between a standard color gamut and a modified color gamut. The modification to the pixel colors may be adapted to produce pixel colors that can effect a person's circadian rhythm while maintaining the display as an effective computer display for the presentation of digital content. A computer processor associated with the display may be used, either automatically (e.g. based on sensed conditions, based on time of day, based on a schedule) or through a user interface, to switch between the two modes. Such a system may also be operated in a mode where both a standard blue and circadian blue are operated simultaneously or through a rapid switching mode (e.g. pulse width modulation to regulate the apparent intensity of each one). The modified color pixel array may be regulated by the computer system to change the pixel colors over time to assist in regulating the person's circadian cycle. The control system may further operate based on data sources that describe the user of the display (e.g. wearable sensors, sleep sensors, as described herein).
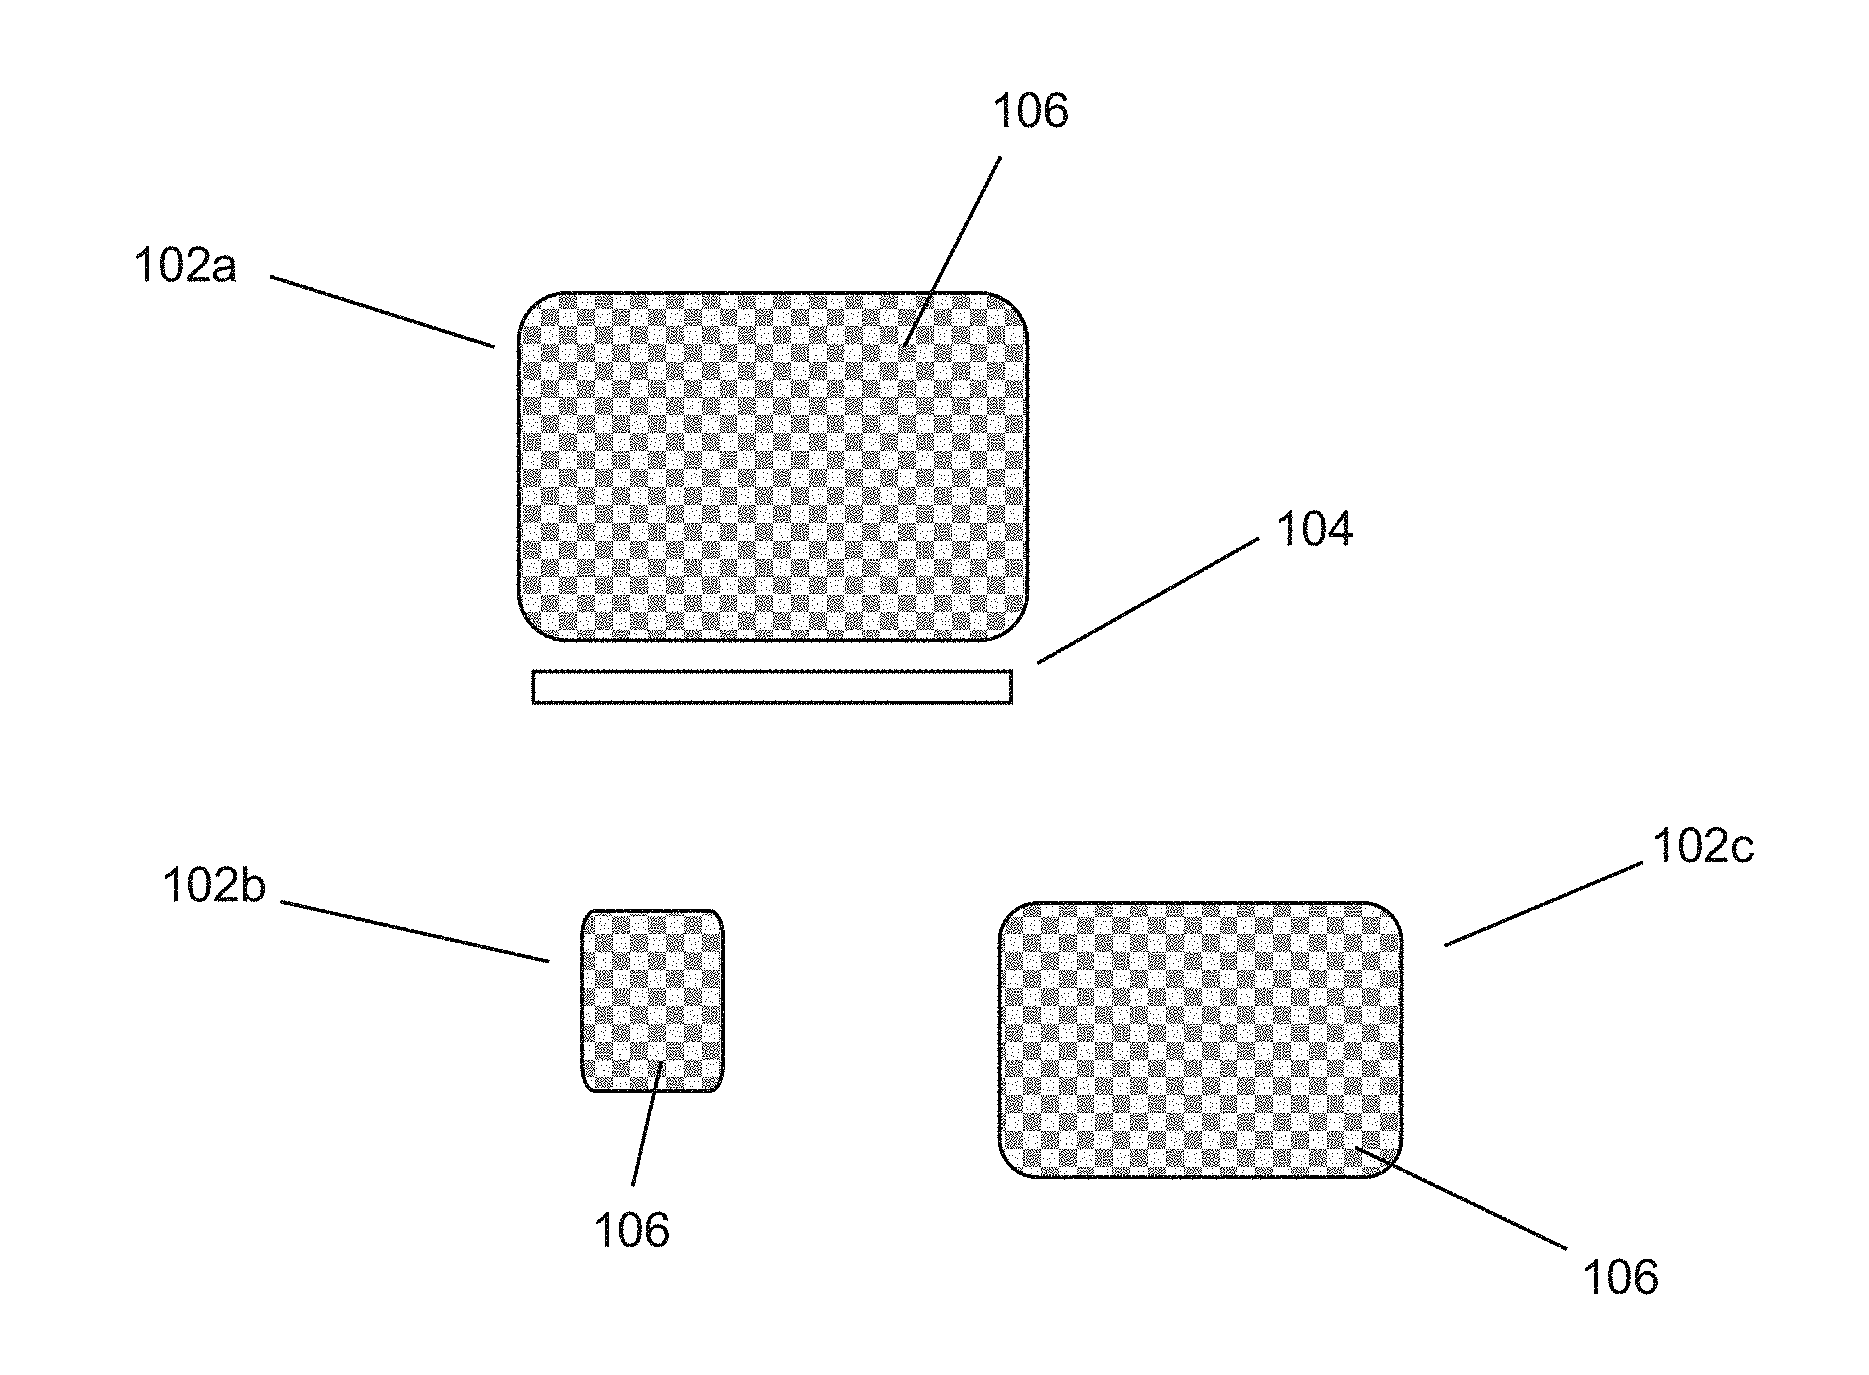
[0072] FIG. 1 illustrates some examples of computer displays 102 in various configurations. Each of the configurations includes an array of pixels 106 positioned and controlled to display computer-generated content. One configuration is a desktop computer display 102a. The desktop configuration includes a peripheral 104 (e.g. keyboard, mouse, drawing pad, Bluetooth connected device, WiFi connected device). The desktop, or any other configuration, may receive data from personal devices (e.g. a user's fitbit, sleep sensor) and adjust the color and/or intensity of the light emitted by the pixels 106. Device 102b is a small touch screen device (e.g. phone, pda). Device 102c is a tablet device, which may have a touch screen. The display could also be a television, which may be an Internet device, radio receiver device, cable TV device, satellite TV device, etc.
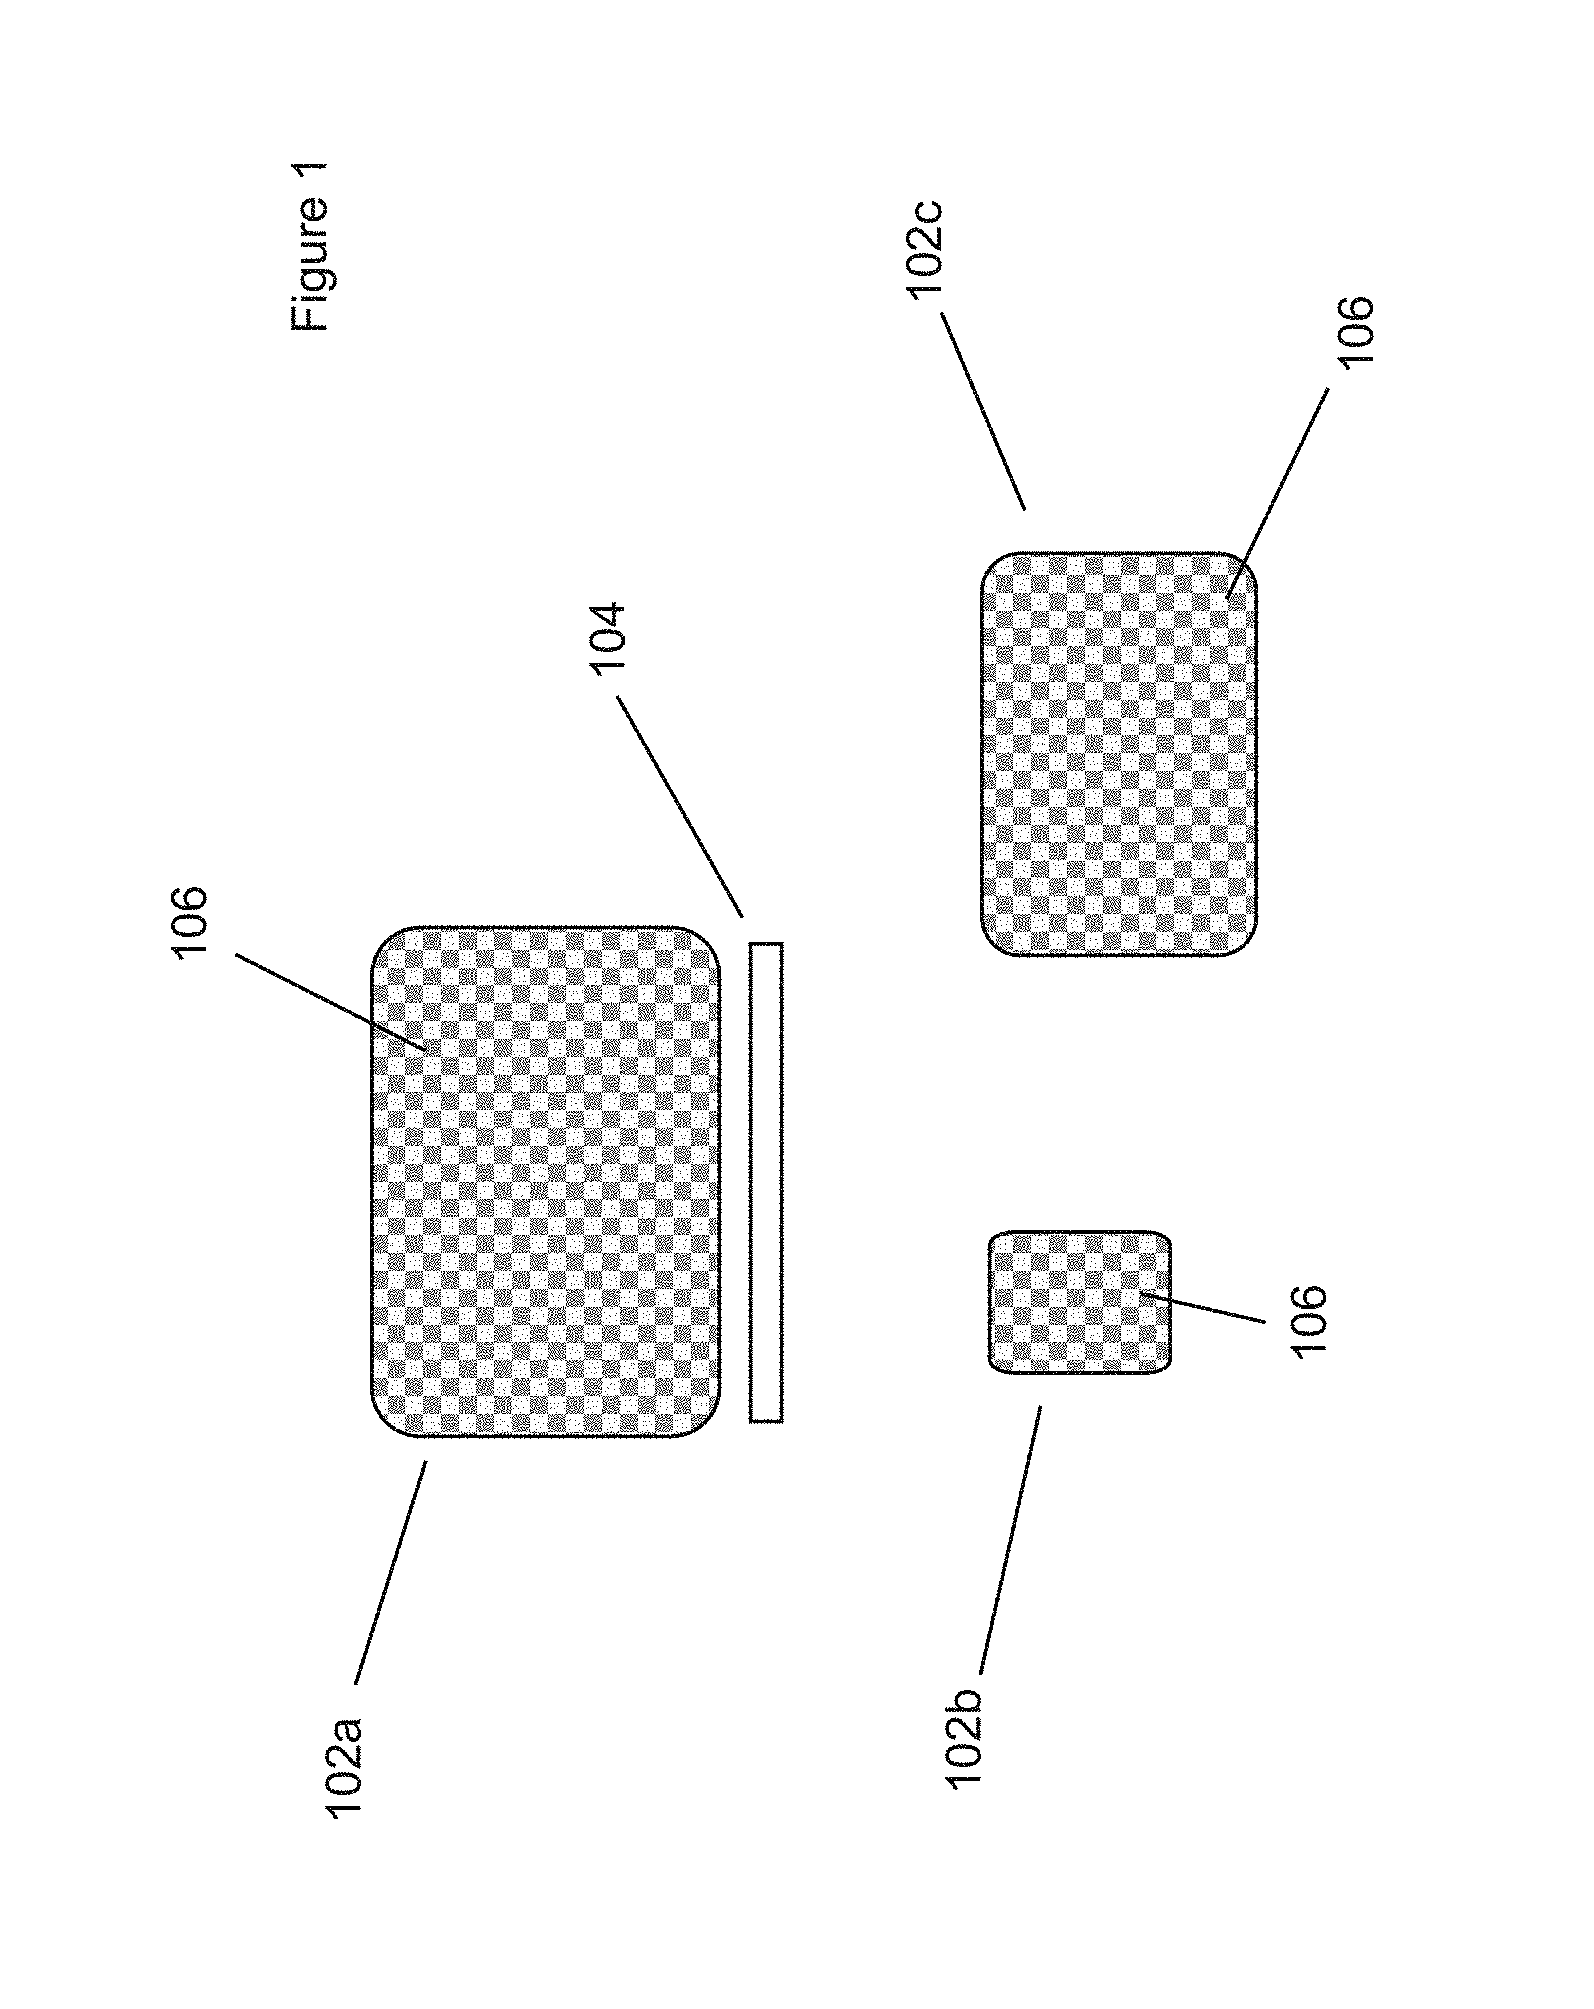
[0073] FIG. 2 illustrates various examples of circadian lighting pixel constructions that may be built into a display in accordance with the principles of the present inventions. These examples are simplified examples of the basic construction of the various display technologies at a pixel level. The three examples presented are the microLED 200, OLED 230, and backlit LCD 240. Each of these examples uses a pixel technology that generates light at the pixel level that is outside of the normal display color gamut and at a color point or frequency that is known to effect a person's circadian rhythm.
[0074] A microLED based computer display may be based on an array of microLED pixels 200. Each micoLED pixel 200 in the area of the display may include different color producing microLEDs 200, electrodes 208 to power and control each microLED in each pixel, and a substrate 208. Each of the microLEDs may emit light of a particular color based on the materials used in the construction of the microLED. As a secondary example, the microLED(s) may be arranged to irradiate a phosphor for color conversion or they may be arranged to transmit light through a filter. In embodiments, the microLEDs in the pixel may be red, green and circadian blue. The circadian blue may be a blue outside of the normal blue gamut that is used in a display. It may be a blue with spectral characteristics of the circadian lighting systems disclosed herein. In a configuration where only three colors are included in the pixel, the color gamut of the display may always be outside of the standard display gamut. This may be acceptable to a user that is less concerned about the exact color of displayed content and more concerned with receiving a light that effects the user's circadian rhythm while still having reasonable colors produced. In another embodiment, the pixel may include four colors: red, green, standard display blue and circadian blue. This configuration lends itself to a control system that can switch between the standard blue and the circadian blue. The circadian blue may be used in the morning hours, for example, and then the display may switch to the standard blue in later hours. In yet later hours, the standard blue may be turned down to further reduce the stimulation of the circadian rhythm. The two blues may fade in and out in a synchronized fashion. Both may be on at one time to reduce the circadian blue as the system transitions to the standard blue.
[0075] An OLED based computer display may be based on an array of OLED pixels 230. The OLED pixel 230 may have three separately controllable OLEDs 212 in each pixel. Each one may emit a similar color (e.g. white) and each one may be optically associated with a different colored filter 211 to generate red, green and circadian blue. In an alternate construction, each OLED emitter may generate its own color (e.g. through a different material, through a phosphor conversion). Each OLED pixel may be constructed with electrodes 214 to power and control each color and a substrate 216. In embodiments, the color set includes a circadian blue (e.g. as described herein). In embodiments, the color set has only three colors, including the circadian blue, and the display produces colors outside of the standard display color gamut. In embodiments, the color set has four colors, including a standard blue and a circadian blue, such that a control system could choose which blue to activate and control as described herein.
[0076] A backlit LCD based computer display may be based on an array of backlit LCD pixels 240. The construction of the LCD display may include liquid crystals 206 for multiple channels at each pixel where each liquid crystal in the pixel is associated with a filter that filters the light from a backlight 210. In this configuration, the backlight 210 makes white light and the filters cut the white light into a particular color, generally red, green and blue. In embodiments, the blue filter in the color filter layer 210 is a circadian blue color filter. In embodiments, the filter layer 210 includes two blue filters, associated with two separate liquid crystals: one for circadian blue and one for the standard display blue. In embodiments, the color set includes a circadian blue (e.g. as described herein). In embodiments, the filter color set has only three colors, including the circadian blue, and the display produces colors outside of the standard display color gamut. In embodiments, the filter color set has four colors, including a standard blue and a circadian blue, such that a control system could choose which blue to activate and control.
[0077] In embodiments, the LCD pixels may be arranged with a backlight 210 that sequentially cycles through separate colors and the liquid crystal layer in this arrangement may only have one liquid crystal per pixel and it may not include a filter layer. As the backlight sequences through its colors the liquid crystal can be turned on to emit the correct color. By quickly cycling through the colors the user's eye can integrate the color and perceive it as a combined color. For example, leaving the liquid crystal in the `on` or transmit mode and cycling very quickly between red and blue of equal intensity can cause the person to perceive the pixel as purple. In such a construction, the backlight 210 may include a circadian blue emitter(s). In embodiments, the backlight 210 includes both a standard display blue and a circadian blue.
[0078] Another aspect of the present inventions relates to a computer display edge lighting system or peripheral. An edge lighting system may surround the computer display and emit light that effects the circadian rhythm of a person using or proximate the computer display. The edge lighting system may include a lighting system similar to the display lighting systems described herein or a panel lighting system as described herein. The edge lighting system may be coordinated with the pixels of the display (e.g. through a computer system associated with both devices). It may otherwise be controlled separately (e.g. as described herein).
Types of Circadian Lighting Systems for Display Systems
[0079] Lighting systems that may be used in display systems in accordance with the principles of the present inventions include, for example, 2-channel, 3-channel, 4-channel, 5-channel, or 6-channel LED-based color-tuning systems. Individual channels within the multi-channel systems may have particular color points and spectral power distributions for the light output generated by the channel. As used herein, the term "channel" refers to all the components in a light-generating pathway from an LED (microLED, OLED) through any filtering or other components until the light exits the display system.
[0080] In some implementations, 2-channel systems can be used having two white light channels. The two white light channels can be those described more fully in U.S. Provisional Patent Application No. 62/757,664, filed Nov. 8, 2018, entitled "Two-Channel Tunable Lighting Systems with Controllable Equivalent Melanopic Lux and Correlated Color Temperature Outputs," and International Patent Application No. PCT/US2019/013356, filed Jan. 11, 2019, entitled "Two-Channel Tunable Lighting Systems With Controllable Equivalent Melanopic Lux And Correlated Color Temperature Outputs" the entirety of which is incorporated herein for all purposes.
White Light Channels
[0081] In some aspects, the present disclosure provides for display systems that incorporate two white lighting channels, which can be referred to herein as a first lighting channel and a second lighting channel. The white lighting channels can be used to backlight a display system that utilizes color filtering in order to generate a digital display.
[0082] First Lighting Channels
[0083] In some aspects, the present disclosure provides first lighting channels for use in lighting systems. The first lighting channels can have first color points with CCT values between about 4000K and about 6500K. In some implementations, the first color point can have a CCT of about 4000K. In certain implementations, the first color point can have a CCT of about 4000K, about 4100K, about 4200K, about 4300K, about 4400K, about 4500K, about 4600K, about 4700K, about 4800K, about 4900K, about 5000K, about 5100K, about 5200K, about 5300K, about 5400K, about 5500K, about 5600K, about 5700K, about 5800K, about 5900K, about 6000K, about 6100K, about 6200K, about 6300K, about 6400K, or about 6500K.
[0084] In some implementations, the first lighting channel can have one or more LEDs having an emission with a first peak wavelength of between about 440 nm and about 510 nm. In certain implementations, the first lighting channel can have one or more LEDs having an emission with a first peak wavelength of about 450 nm.
[0085] In some implementations, the first lighting channel can have a first color point with a CCT value of about 4000K. The first lighting channel can have a first color point with a color-point range 304A can be defined by a polygonal region on the 1931 CIE Chromaticity Diagram defined by the following ccx, ccy color coordinates: (0.4006, 0.4044), (0.3736, 0.3874), (0.3670, 0.3578), (0.3898, 0.3716), which correlates to an ANSI C78.377-2008 standard 4000K nominal CCT white light with target CCT and tolerance of 3985.+-.275K and target duv and tolerance of 0.001.+-.0.006, as more fully described in American National Standard ANSI C78.377-2008, "Specifications for the Chromaticity of Solid State Lighting Products," National Electrical Manufacturers Association, American National Standard Lighting Group, which is incorporated herein in its entirety for all purposes. In some implementations, suitable color-point ranges for the first color point can be described as MacAdam ellipse color ranges in the 1931 CIE Chromaticity Diagram color space, as illustrated schematically in FIG. 14, which depicts a color-point range 402, the black body locus 401, and a line 403 of constant ccy coordinates on the 1931 CIE Chromaticity Diagram. In FIG. 14, MacAdam ellipse ranges are described with major axis "a", minor axis "b", and ellipse rotation angle .theta. relative to line 403. In some implementations, the color-point range for the first color point can be range 304B, an embodiment of color range 402, and can be defined as a single 5-step MacAdam ellipse with center point (0.3818, 0.3797) with a major axis "a" of 0.01565, minor axis "b" of 0.00670, with an ellipse rotation angle .theta. of 52.70.degree., shown relative to a line 403. In some implementations, the color-point range for the first color point can be range 304C, an embodiment of color range 402, and can be defined as a single 3-step MacAdam ellipse with center point (0.3818, 0.3797) with a major axis "a" of 0.00939, minor axis "b" of 0.00402, with an ellipse rotation angle .theta. of 53.7.degree., shown relative to a line 403. In further implementations, the first color point can be within the color-point ranges described in Table 57 for the selected boundary for each nominal CCT value. In other implementations, the color-point range for the first color point can be a region on the 1931 CIE Chromaticity Diagram defined by a polygon connecting the (ccx, ccy) coordinates (0.0.3670, 0.3575), (0.3737, 0.3875), (0.4007, 0.4047), and (0.3898, 0.3720). In yet further implementations, the color-point range for the first color point can be a region on the 1931 CIE Chromaticity Diagram defined by a 4-step MacAdam ellipse centered at 3985K CCT and duv=+0.9845. In other implementations, the color-point range for the first color point can be a region on the 1931 CIE Chromaticity Diagram defined by a polygon connecting the (ccx, ccy) coordinates (0.3703, 0.3590), (0.3851, 0.3679), (0.3942, 0.3972), and (0.3769, 0.3864).
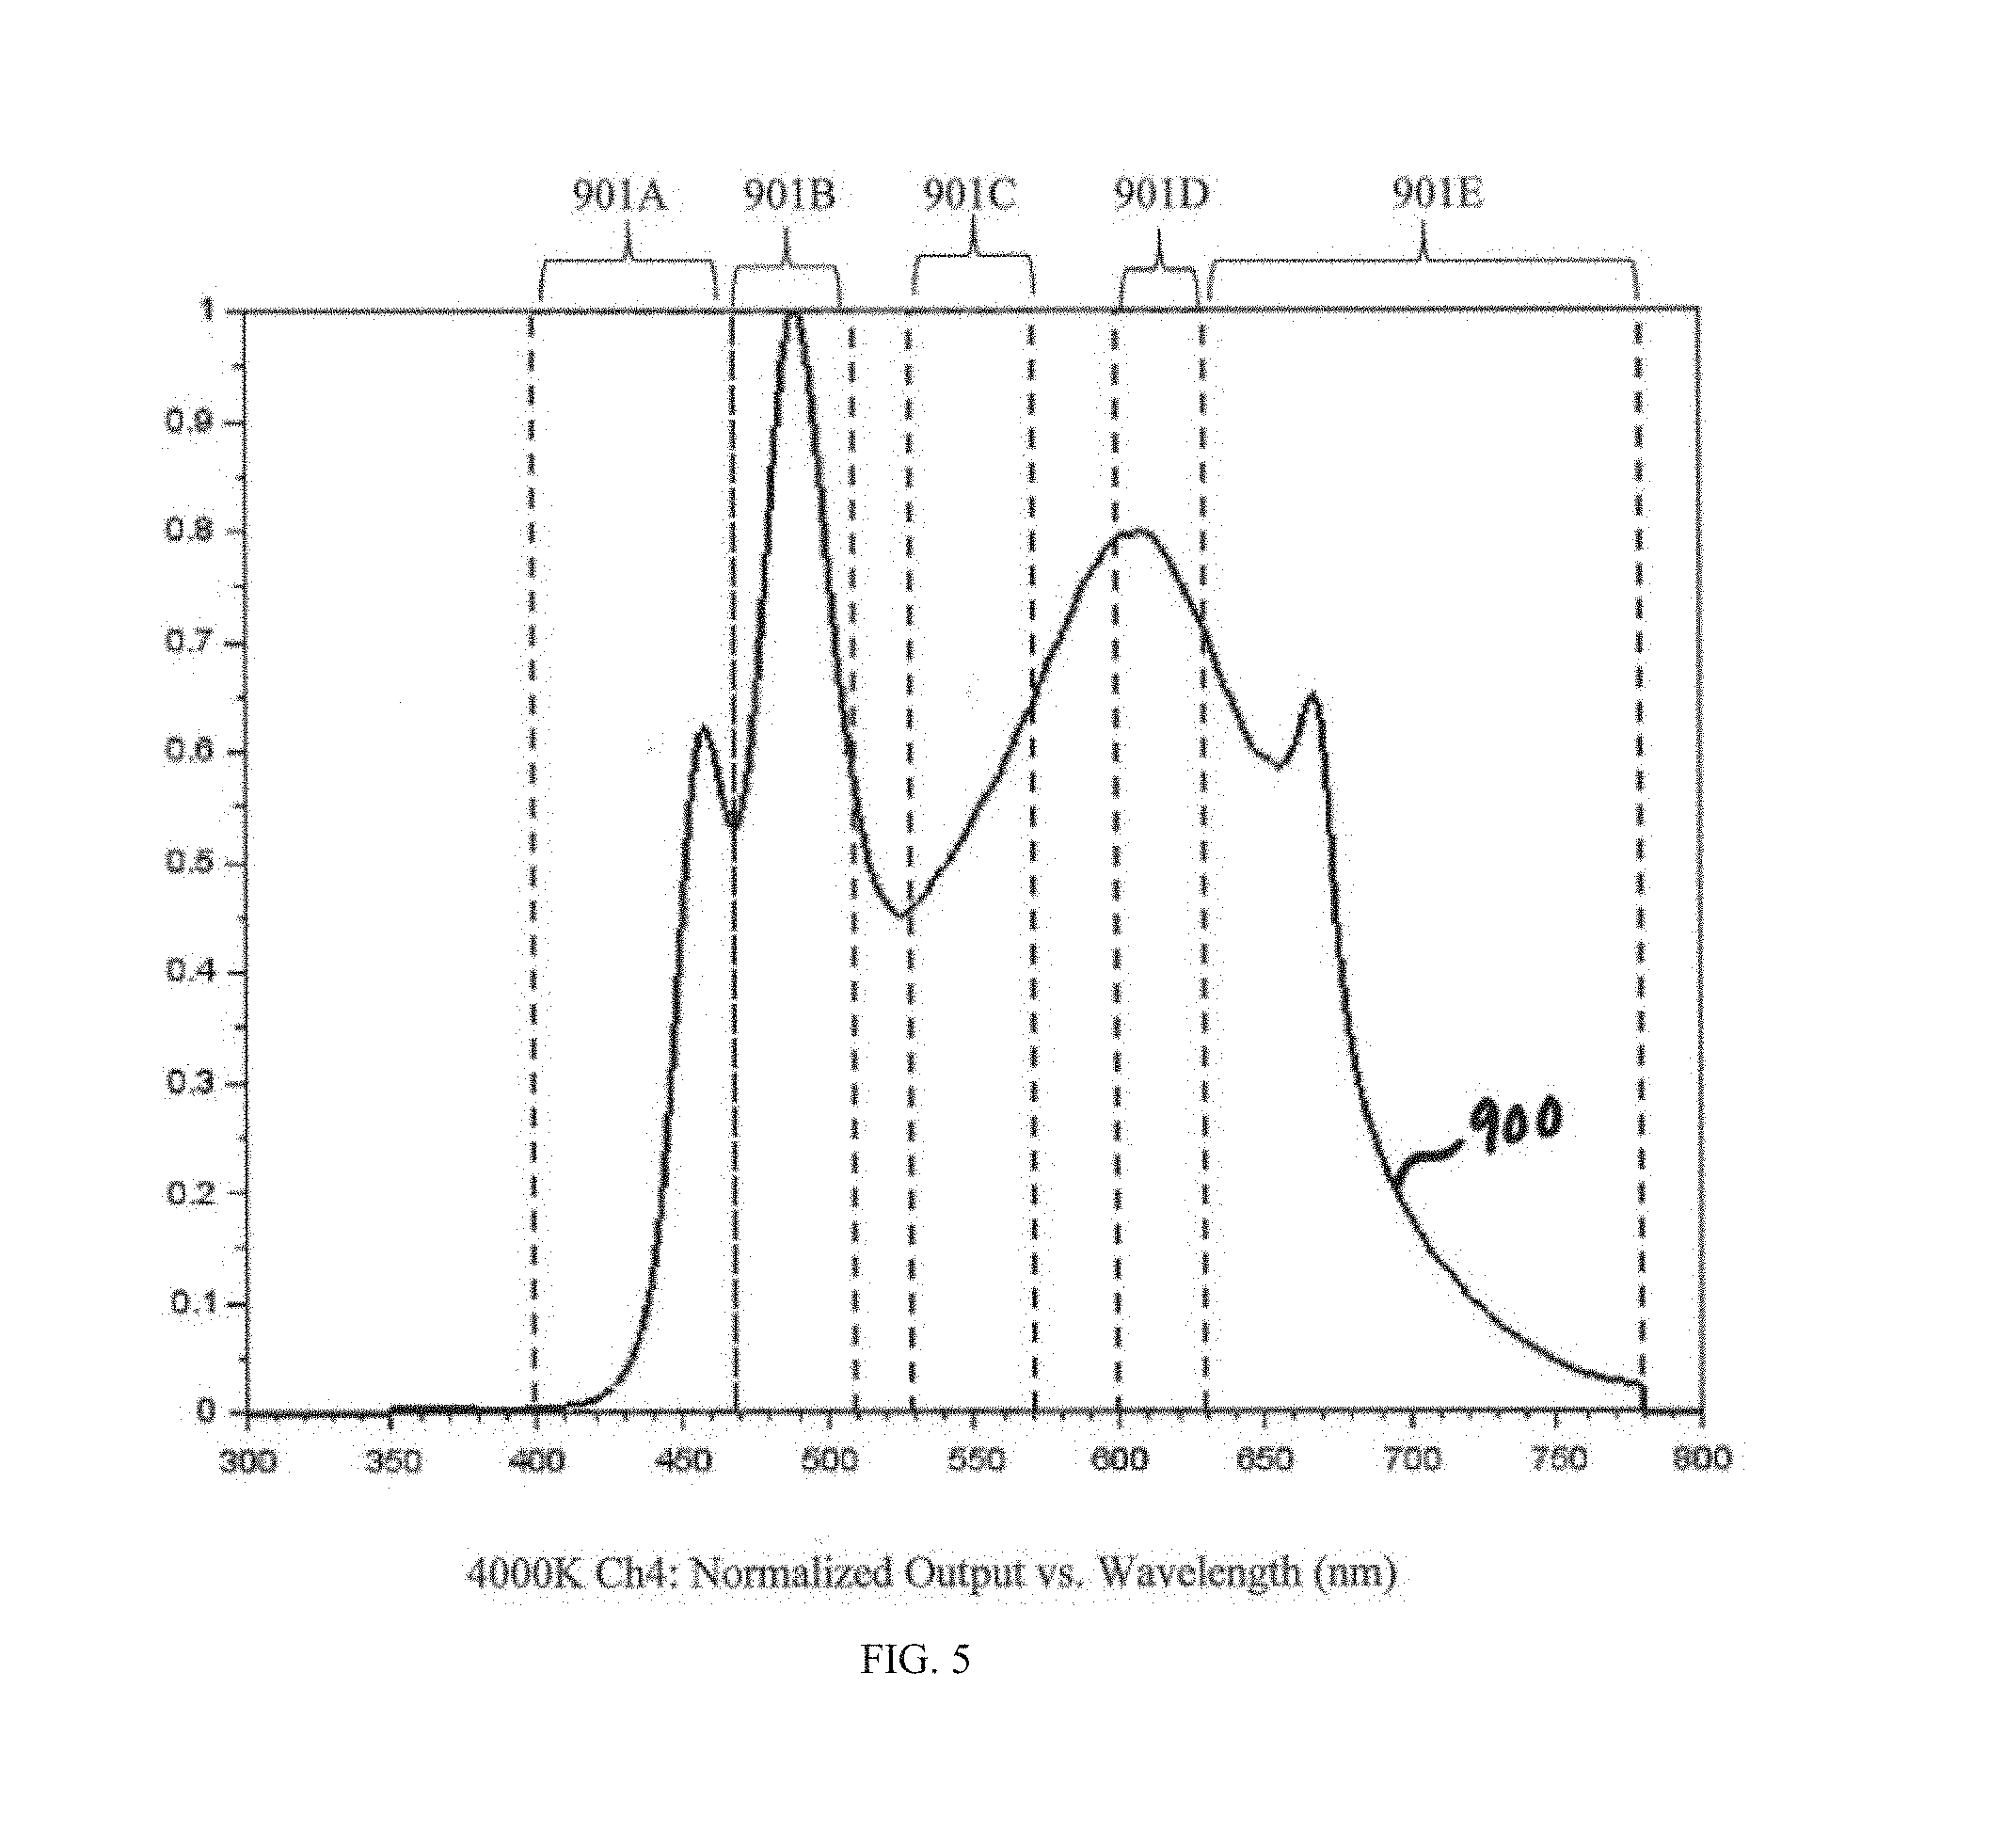
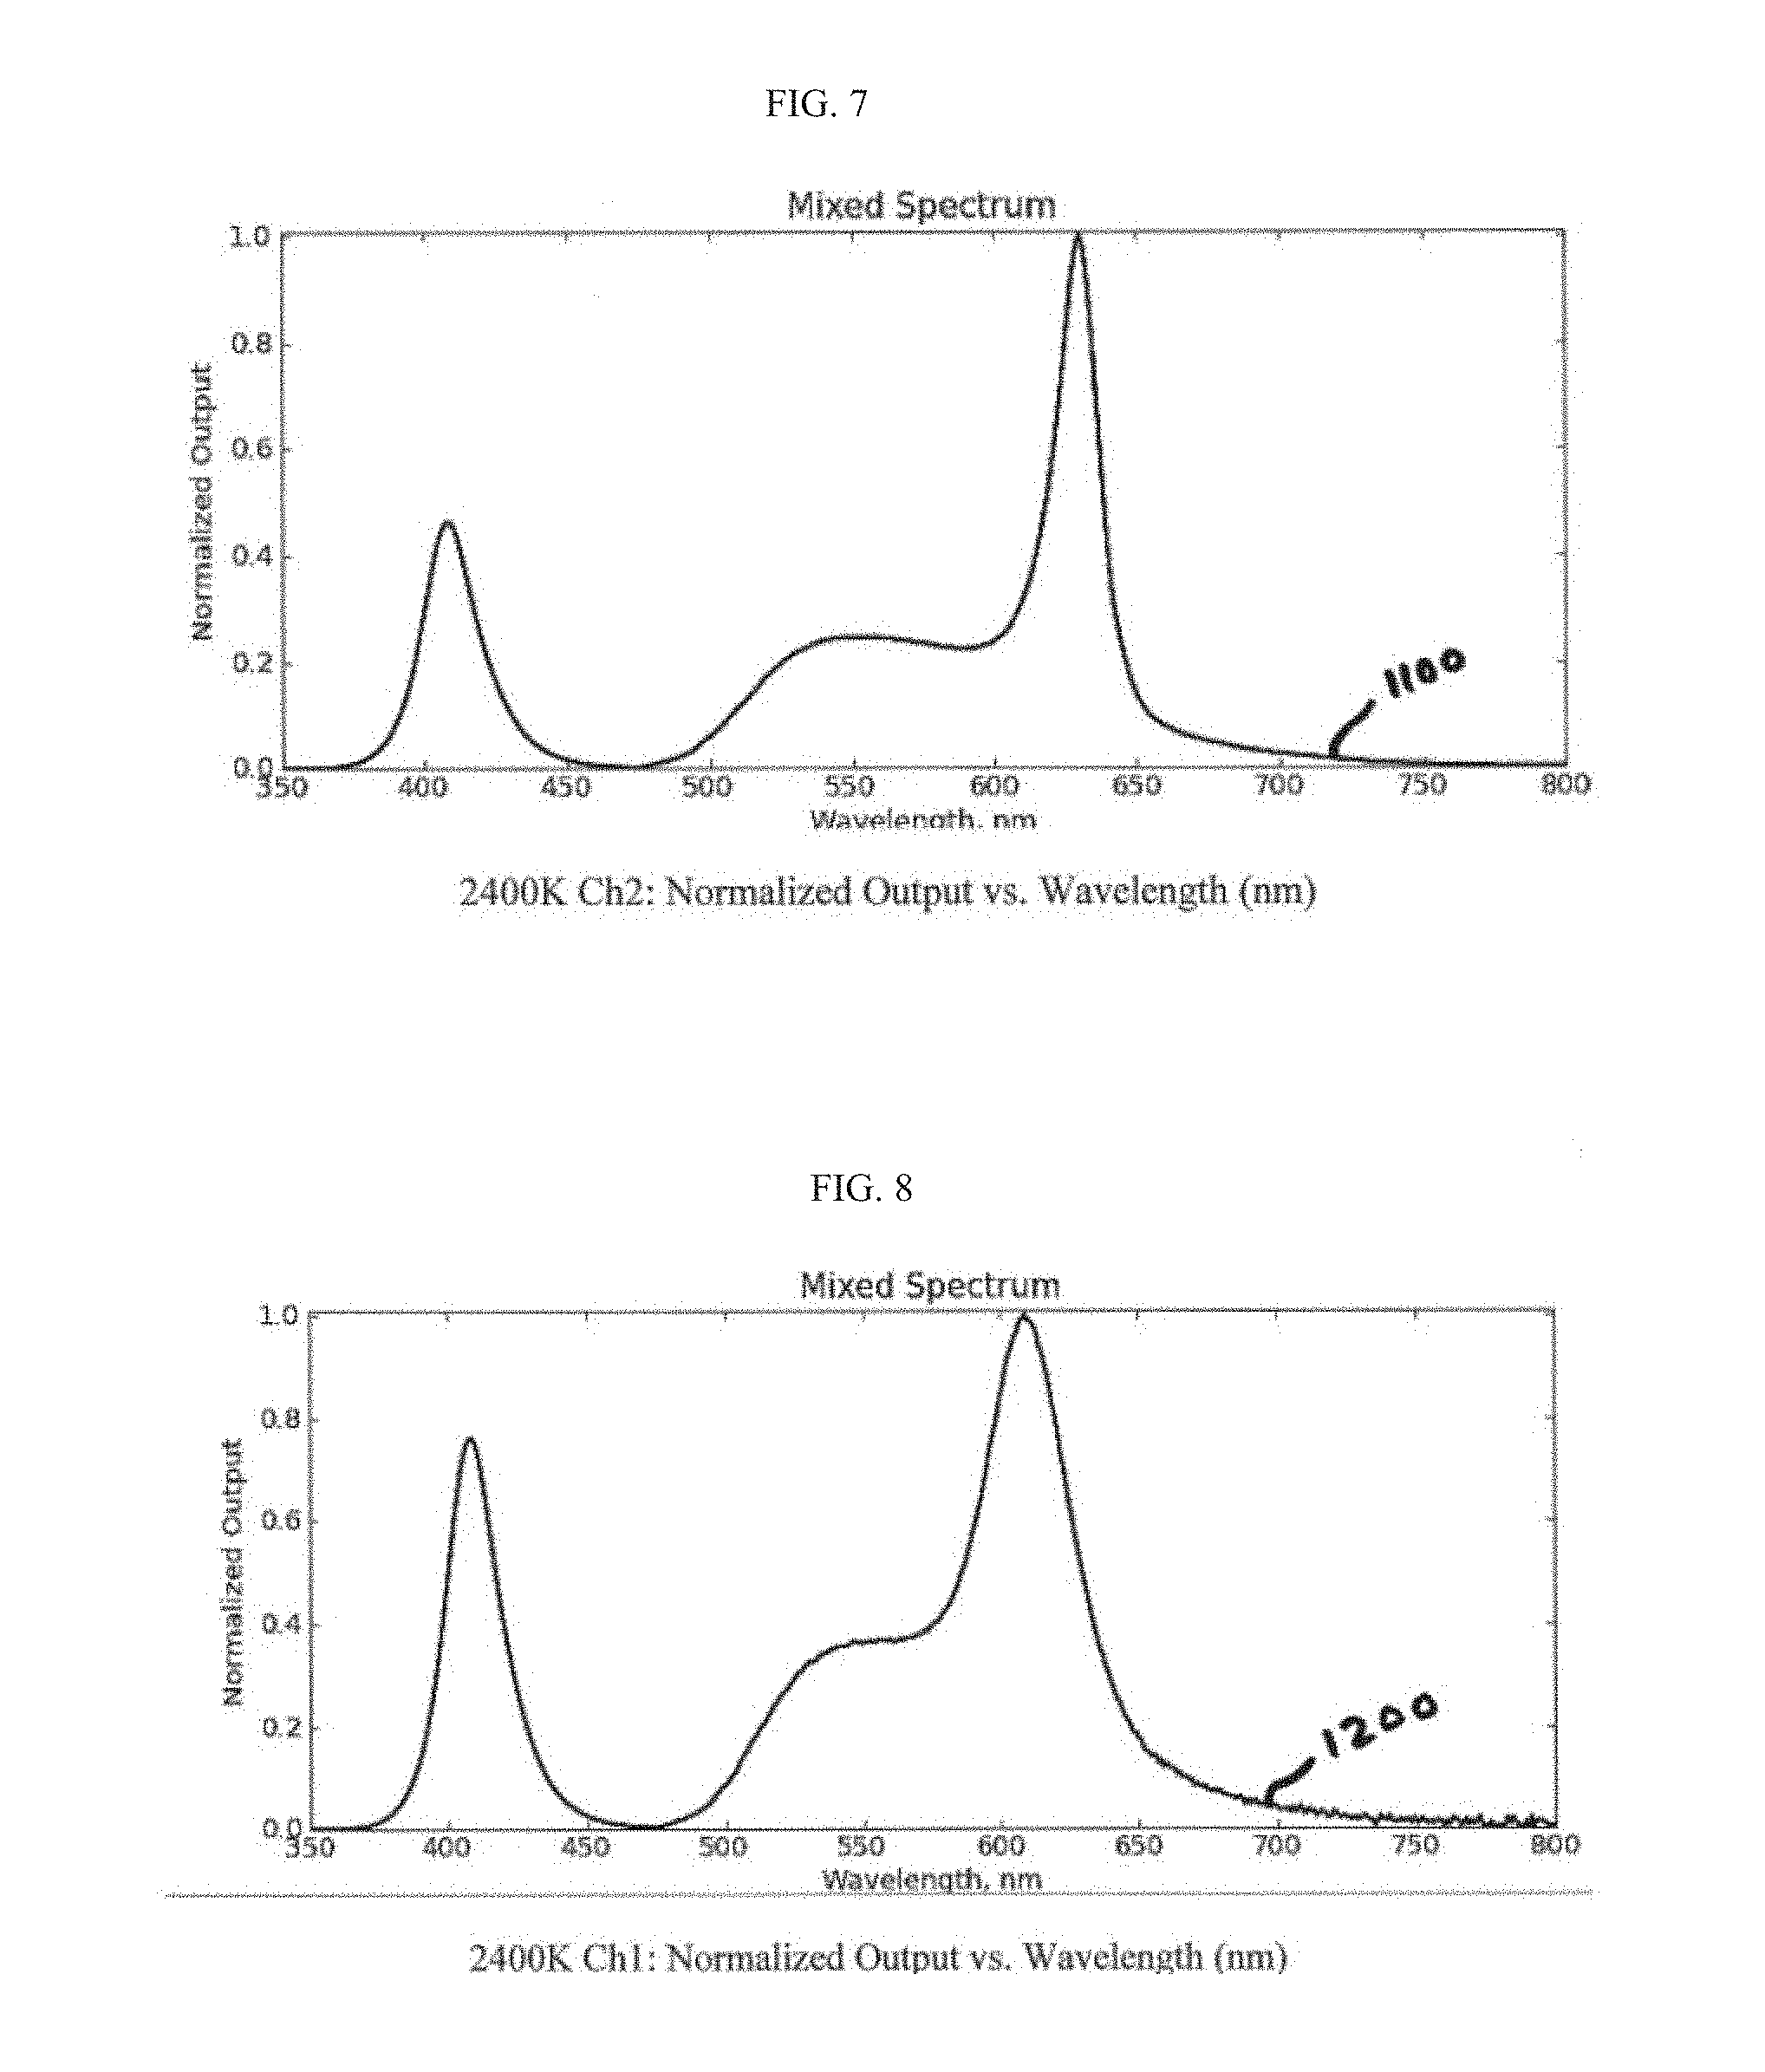
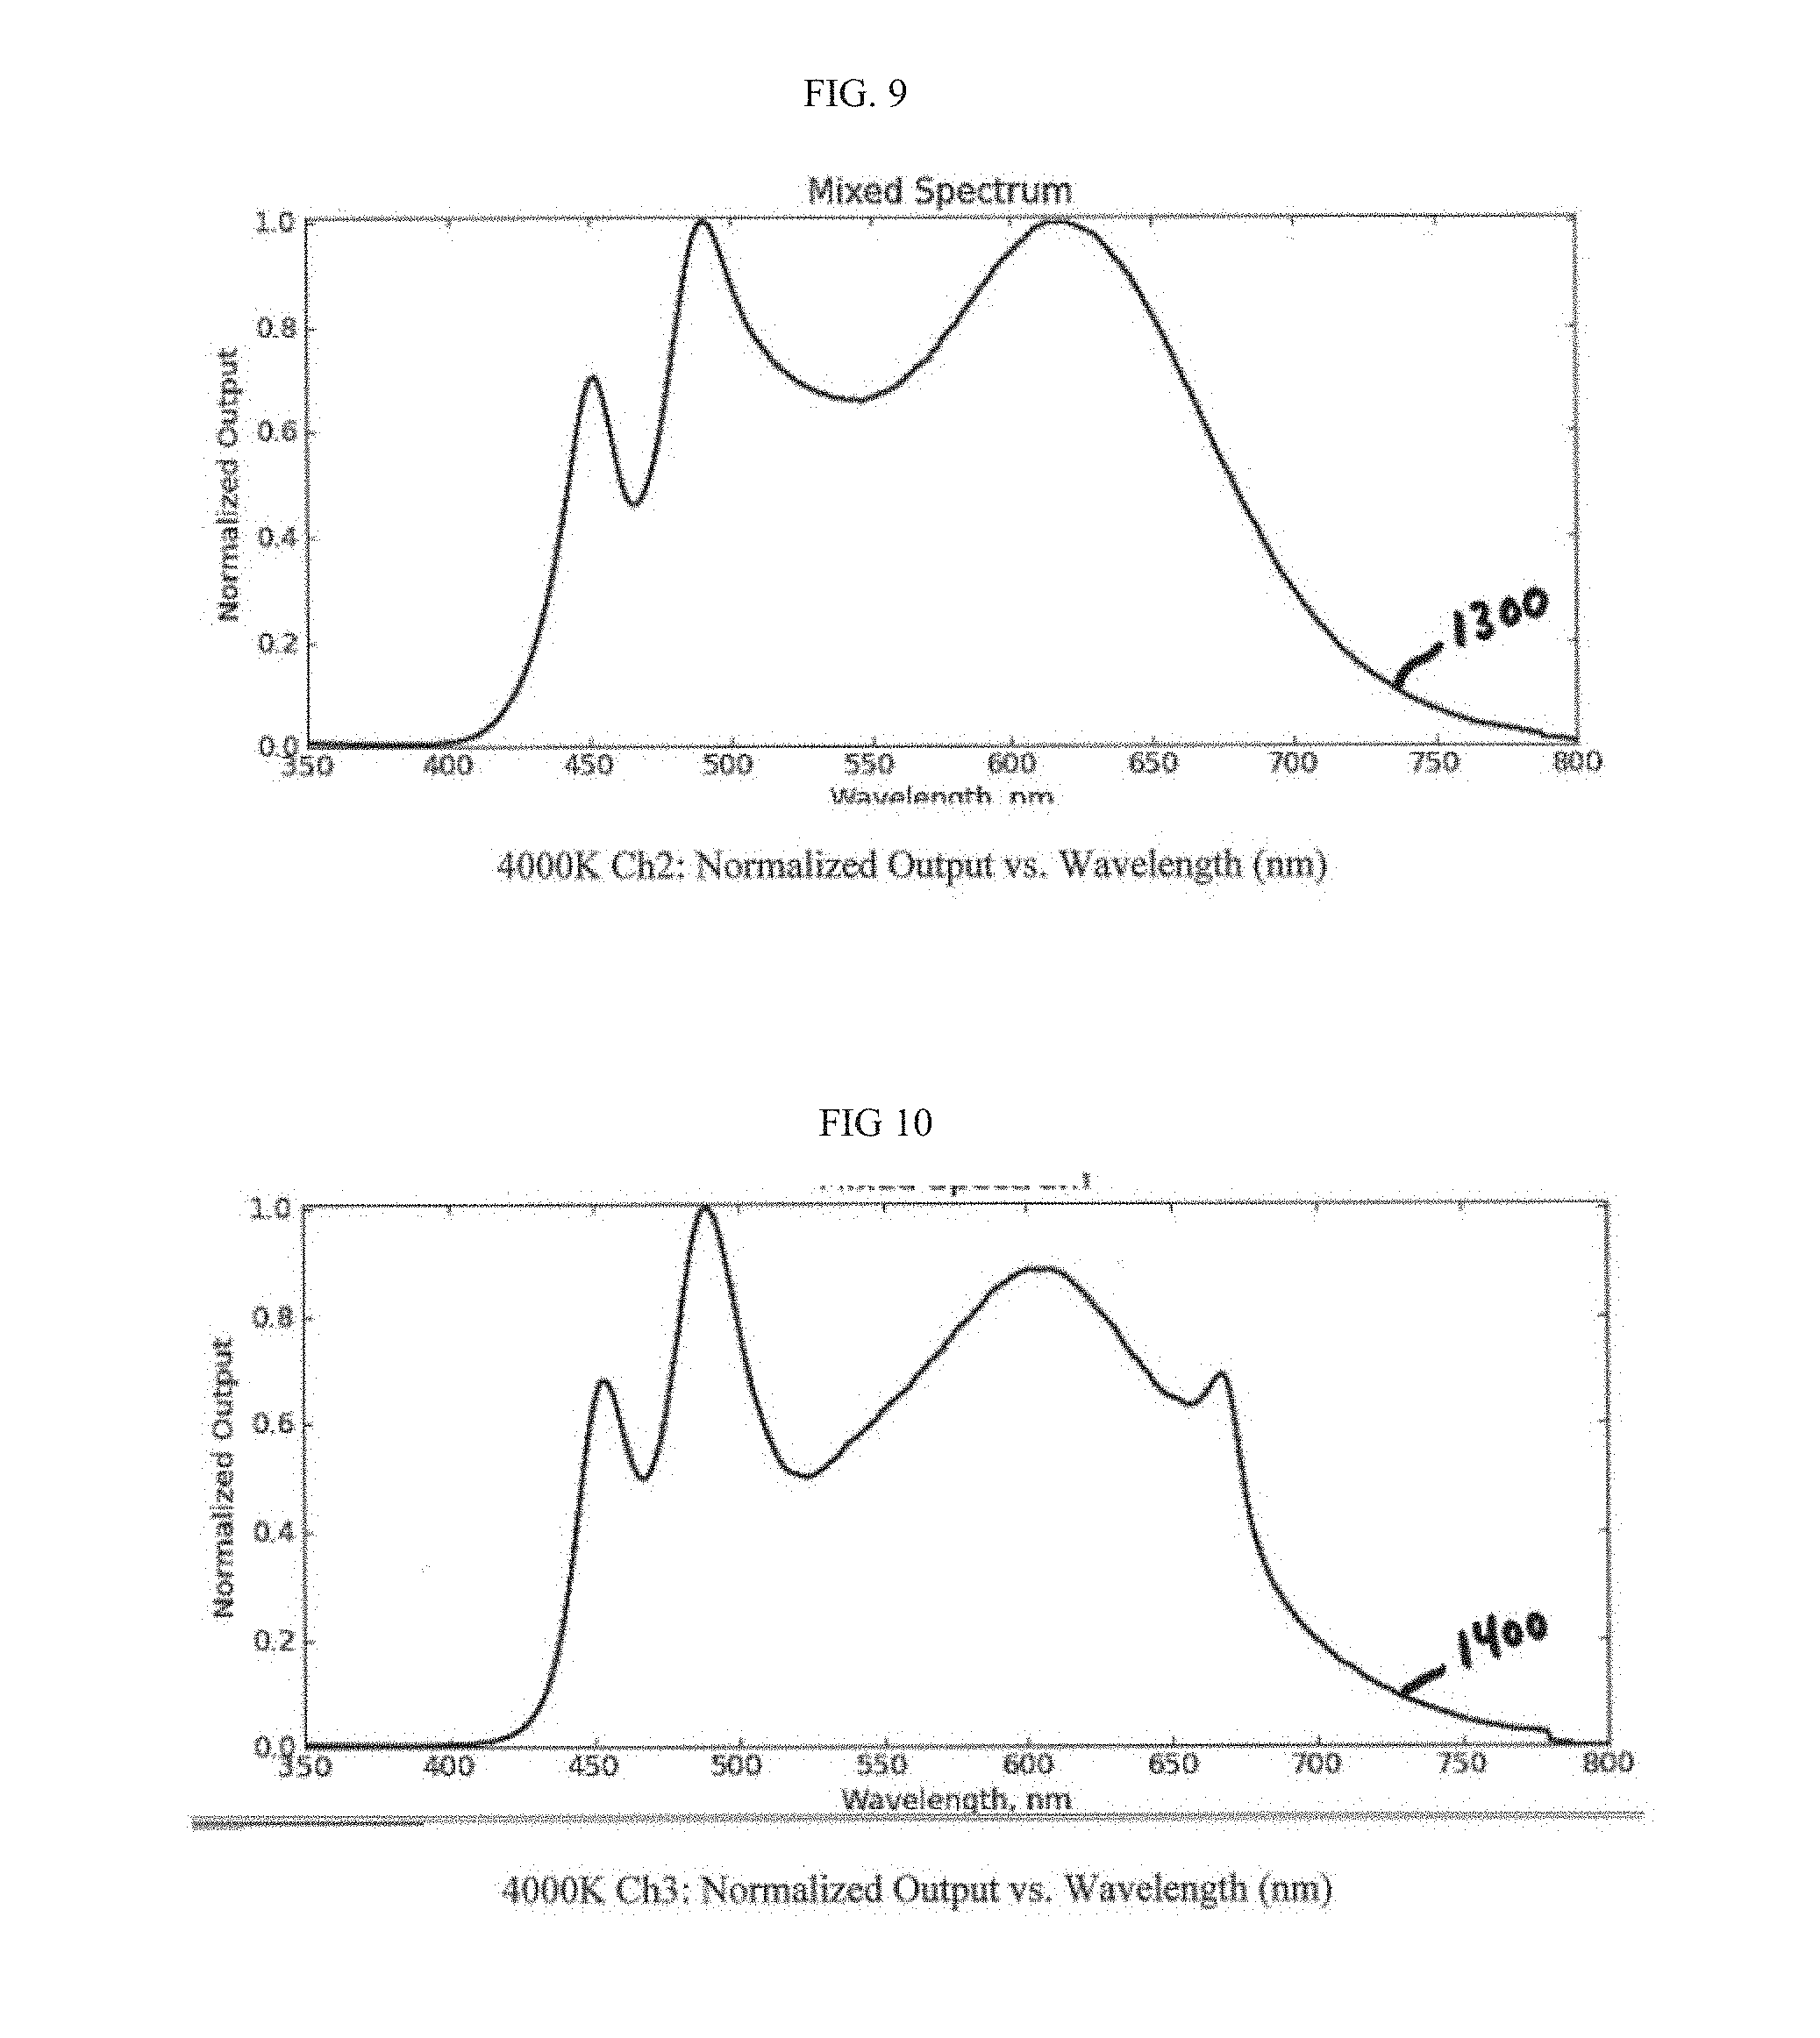
[0086] In some implementations, the first lighting channel can have certain spectral power distributions. Some aspects of some exemplary first lighting channels are shown in Table 44. Aspects of the spectral power distributions for the exemplary first lighting channels shown in Table 44 and an average of the exemplary first lighting channels (shown as "Exemplary 1st channels avg") are provided in Tables 46, 48, 50, 52, and 53, which show the ratios of spectral power within wavelength ranges, with an arbitrary reference wavelength range selected for each exemplary first lighting channel or average thereof and normalized to a value of 100.0, except for Table 53, in which the values are normalized to a value of 1.000. In certain implementations, the first lighting channel can have a first spectral power distribution with spectral power in one or more of the wavelength ranges other than the reference wavelength range increased or decreased within 30% greater or less, within 20% greater or less, within 10% greater or less, or within 5% greater or less than the values shown in Tables 46, 48, 50, 52, and 53. In some implementations, the first lighting channel can have a spectral power distribution that falls between the minimum (shown as "min") and maximum (shown as "max") values in each of the wavelength ranges as shown in one or more of the Tables 46, 48, 50, 52, and 53. In further implementations, the first lighting channel can have a spectral power distribution that falls between values 5% less, 10% less, 20% less, or 30% less than the minimum (shown as "min") and values 5% more, 10% more, 20% more, or 30% more than the maximum (shown as "max") values in each of the wavelength ranges as shown in one or more of the Tables 46, 48, 50, 52, and 53. FIGS. 5, 9, 10, and 12 depict aspects of first spectral power distributions for the exemplary first lighting channels described herein. FIG. 12 depicts a spectral power distribution 1600 for the exemplary lighting channel "5000K Ch1" listed in Table 44 and further characterized elsewhere herein. FIG. 10 depicts a spectral power distribution 1400 for the exemplary lighting channel "4000K Ch3" listed in Table 44 and further characterized elsewhere herein. FIG. 9 depicts a spectral power distribution 1300 for the exemplary lighting channel "4000K Ch2" listed in Table 44 and further characterized elsewhere herein. FIG. 9 depicts a spectral power distribution 900 for the exemplary lighting channel "4000K Ch4" listed in Table 44 and further characterized elsewhere herein. FIG. 5 further depicts some exemplary wavelength ranges 901A, 901B, 901C, 901D, and 901E, which correspond to the wavelength ranges shown in Table 53. As shown in Table 53, in some implementations, first lighting channels may have particular spectral power values within one or more of wavelength ranges 901A, 901B, 901C, 901D, and 901E, or other wavelength ranges not depicted in FIG. 5 or shown in Table 53 but described elsewhere herein.
[0087] In some aspects, the first lighting channel can have a first white light having a first color point with a CCT and EML value that falls within a range of possible pairings of CCT and EML values, also referred to herein as a CCT-EML range. A suitable CCT-EML range 1710 for first lighting channels of the present disclosure is shown graphically in FIG. 13, which also shows exemplary point pairings of CCT and EML for the exemplary first lighting channels shown in Table 3. Tables 1 and 2 show CCT and EML values for color points generated by some commercially-available fixed-CCT LED-driven white light systems having Ra values of approximately 80.
[0088] Second Lighting Channels
[0089] In some aspects, the present disclosure provides second lighting channels for use in lighting systems. The second lighting channels can have second color points with CCT values between about 1800K and about 2700K. In some implementations, the first color point can have a CCT of about 2400K. In some implementations, the first color point can have a CCT of about 1800K, about 1900K, about 2000K, about 2100K, about 2200K, about 2300K, about 2400K, about 2500K, about 2600K, or about 2700K.
[0090] In some implementations, the second lighting channel can have one or more LEDs having an emission with a second peak wavelength of between about 380 nm and about 420 nm. In certain implementations, the second lighting channel can have one or more LEDs having an emission with a second peak wavelength of about 410 nm. In some aspects, the use of a different peak wavelength for the LEDs in the second lighting channel in comparison to the LEDs in the first lighting channel can contribute to the desired performance of the lighting systems of the disclosure.
[0091] In some implementations of the present disclosure, the second lighting channel can produce light having a second color point within a suitable color-point range. In certain implementations, the second color point can be within the color-point ranges described in Table 57 for the selected boundary for each nominal CCT value. In some implementations, the second color point can be within a color-point range defined by a region bounded by a polygon connecting the (ccx, ccy) coordinates on the 1931 CIE Chromaticity Diagram of (0.4593, 0.3944), (0.5046, 0.4007), (0.5262 0.4381), and (0.4813 0.4319). In further implementations, the second color point can be within a color-point range defined by a region bounded by a 4-step MacAdam ellipse centered at 2370K CCT value and duv=-0.3. In yet further implementations, the second color point can be within a color-point range defined by a region bounded by a polygon connecting the (ccx, ccy) coordinates on the 1931 CIE Chromaticity Diagram of (0.4745, 0.4025), (0.4880, 0.4035), (0.5036, 0.4254), (0.4880, 0.4244).
[0092] In some implementations, the second lighting channel can have certain spectral power distributions. Some aspects of some exemplary second lighting channels are shown in Table 44. Aspects of the spectral power distributions for the exemplary second lighting channels shown in Table 44 and an average of the exemplary second lighting channels (shown as "Exemplary 2nd channels avg") are provided in Tables 45, 47, 49, 51, and 53, which show the ratios of spectral power within wavelength ranges, with an arbitrary reference wavelength range selected for each exemplary second lighting channel or average thereof and normalized to a value of 100.0, except for Table 53, in which the values are normalized to a value of 1.000. In certain implementations, the second lighting channel can have a spectral power distribution with spectral power in one or more of the wavelength ranges other than the reference wavelength range increased or decreased within 30% greater or less, within 20% greater or less, within 10% greater or less, or within 5% greater or less than the values shown in one or more of Tables 45, 47, 49, 51, and 53. In some implementations, the second lighting channel can have a spectral power distribution that falls between the minimum (shown as "min") and maximum (shown as "max") values in each of the wavelength ranges as shown in one or more of the Tables 45, 47, 49, 51, and 53. In further implementations, the second lighting channel can have a spectral power distribution that falls between values 5% less, 10% less, 20% less, or 30% less than the minimum (shown as "min") and values 5% more, 10% more, 20% more, or 30% more than the maximum (shown as "max") values in each of the wavelength ranges as shown in one or more of the Tables 45, 47, 49, 51, and 53. FIG. 7 depicts a spectral power distribution 1100 for the exemplary lighting channel "2400K Ch2" listed in Table 44 and further characterized elsewhere herein. FIG. 8 depicts a spectral power distribution 1200 for the exemplary lighting channel "2400K Ch3" listed in Table 44 and further characterized elsewhere herein. FIG. 11 depicts a spectral power distribution 1500 for the exemplary lighting channel "1800K Ch1" listed in Table 44 and further characterized elsewhere herein. FIG. 6 depicts a spectral power distribution 1000 for the exemplary lighting channel "2400K Ch3" listed in Table 44 and further characterized elsewhere herein. FIG. 6 further depicts some exemplary wavelength ranges 1001A, 1001B, 1001C, 1001D, and 1001E, which correspond to the wavelength ranges shown in Table 53. As shown in Table 53, in some implementations, second lighting channels may have particular spectral power values within one or more of wavelength ranges 1001A, 1001B, 1001C, 1001D, and 1001E, or other wavelength ranges not depicted in FIG. 6 or shown in Table 12 but described elsewhere herein.
Colored Lighting Channels
[0093] In some implementations, the 3-channel LED-based color-tuning systems can include channels as described in U.S. Provisional Patent Application No. 62/712,182 filed Jul. 30, 2018, and U.S. Provisional Patent Application No. 62/757,672, filed Nov. 8, 2018, entitled "Switchable Systems for White Light with High Color Rendering and Biological Effects," which is incorporated herein in its entirety for all purposes.
[0094] In certain implementations, the 4-channel, 5-channel, and 6-channel LED-based color tuning systems can include channels as described more fully in U.S. Provisional Patent Application No. 62/757,672, filed Nov. 8, 2018, entitled "Switchable Systems for White Light with High Color Rendering and Biological Effects," which is incorporated herein in its entirety for all purposes.
[0095] In some implementations, display systems can comprise standard lighting channels for red, blue, and green color points used in digital display systems known to those of skill in the art, such as those described herein and shown in FIG. 3b, and additional lighting channels each comprising a cyan lighting channel with an output with a color point in a cyan color region. The standard lighting channels may have light emissions with substantially all of the spectral energy distribution contained within a wavelength range of about 120 nm a full width at half maximum (FWHM) of about 40 nm. In certain implementations, the cyan lighting channel may include cyan lighting elements and channels as described in International Patent Application No. PCT/US2018/020792, filed Mar. 2, 2018, as short-blue-pumped cyan channels driven by LEDs having peak wavelengths of between about 430 nm to about 460 nm (referred to as "green" therein) and long-blue-pumped cyan channels driven by LEDs having peak wavelengths ranging from about 460 nm to about 485 nm (referred to as "cyan" therein). In further implementations, the cyan lighting channel may include cyan lighting elements and channels as described in U.S. Provisional Application No. 62/757,672, filed Nov. 8, 2018, as long-blue-pumped cyan and short-blue-pumped cyan. In some implementations, the display systems can comprise at least one lighting channel that comprises a short-blue-pumped cyan channel and at least one lighting channel that comprises a long-blue-pumped cyan channel.
[0096] In some implementations, the cyan light channels can have spectral power distributions. Tables 1-4 show the ratios of spectral power within wavelength ranges, with an arbitrary reference wavelength range selected for each color range and normalized to a value of 100.0. In certain implementations, the spectral power distribution of a cyan light channel falls between minimum and maximum values in particular wavelength ranges relative to an arbitrary reference wavelength range. In some implementations, the short-blue-pumped cyan can fall within the values between Short-blue-pumped cyan minimum 1 and Short-blue-pumped cyan maximum 1 in the wavelength ranges shown in Table 1, Table 2, or both Tables 1 and 2. In other implementations, the short-blue-pumped cyan can fall within the values between Short-blue-pumped cyan minimum 1 and Short-blue-pumped cyan maximum 2 in the wavelength ranges shown in Table 1. In some implementations, the Long-Blue-Pumped Cyan lighting channel can produce light with spectral power distribution that falls within the values between Long-Blue-Pumped Cyan minimum 1 and Long-Blue-Pumped Cyan maximum 1 in the wavelength ranges shown in Table 1, Table 2, or both Tables 1 and 2. Tables 3 and 4 show the ratios of spectral power within wavelength ranges, with an arbitrary reference wavelength range selected for the short-blue-pumped cyan color range and normalized to a value of 100.0, for a short-blue-pumped cyan channel that may be used in some implementations of the disclosure. The exemplary Short-blue-pumped cyan Channel 1 has a ccx, ccy color coordinate shown in Table 5. In certain implementations, the short-blue-pumped cyan channel can have a spectral power distribution with spectral power in one or more of the wavelength ranges other than the reference wavelength range increased or decreased within 30% greater or less, within 20% greater or less, within 10% greater or less, or within 5% greater or less than the values shown in Table 3 or 4. In some implementations, the long-blue-pumped cyan channel can produce cyan light having certain spectral power distributions. Tables 3 and 4 shows ratios of spectral power within wavelength ranges, with an arbitrary reference wavelength range selected for the long-blue-pumped cyan color range and normalized to a value of 100.0, for several non-limiting embodiments of the long-blue-pumped cyan channel. The exemplary Long-blue-pumped cyan Channel 1 has a ccx, ccy color coordinate Shown in Table 5. In certain implementations, the long-blue-pumped cyan channel can have a spectral power distribution with spectral power in one or more of the wavelength ranges other than the reference wavelength range increased or decreased within 30% greater or less, within 20% greater or less, within 10% greater or less, or within 5% greater or less than the values shown in Table 3 and 4.
[0097] Blue Channels
[0098] In some implementations of the present disclosure, lighting systems can include blue channels that produce light with a blue color point that falls within a blue color range. In certain implementations, suitable blue color ranges can include blue color ranges 301A-F. FIG. 22A depicts a blue color range 301A defined by a line connecting the ccx, ccy color coordinates of the infinity point of the Planckian locus (0.242, 0.24) and (0.12, 0.068), the Planckian locus from 4000K and infinite CCT, the constant CCT line of 4000K, the line of purples, and the spectral locus. FIG. 22A also depicts a blue color range 301D defined by a line connecting (0.3806, 0.3768) and (0.0445, 0.3), the spectral locus between the monochromatic point of 490 nm and (0.12, 0.068), a line connecting the ccx, ccy color coordinates of the infinity point of the Planckian locus (0.242, 0.24) and (0.12, 0.068), and the Planckian locus from 4000K and infinite CCT. The blue color range may also be the combination of ranges 301A and 301D together. FIG. 25 depicts a blue color range 301B can be defined by a 60-step MacAdam ellipse at a CCT of 20000K, 40 points below the Planckian locus. FIG. 26 depicts a blue color range 301C that is defined by a polygonal region on the 1931 CIE Chromaticity Diagram defined by the following ccx, ccy color coordinates: (0.22, 0.14), (0.19, 0.17), (0.26, 0.26), (0.28, 0.23). FIG. 10 depicts blue color ranges 301E and 301F. Blue color range 301E is defined by lines connecting (0.231, 0.218), (0.265, 0.260), (0.2405, 0.305), and (0.207, 0.256).
TABLE-US-00001 TABLE 1 Spectral Power Distribution for Wavelength Ranges (nm) 380 < 420 < 460 < 500 < 540 < 580 < 620 < 660 < 700 < 740 < .lamda. .ltoreq. 420 .lamda. .ltoreq. 460 .lamda. .ltoreq. 500 .lamda. .ltoreq. 540 .lamda. .ltoreq. 580 .lamda. .ltoreq. 620 .lamda. .ltoreq. 660 .lamda. .ltoreq. 700 .lamda. .ltoreq. 740 .lamda. .ltoreq. 780 Blue minimum 1 0.3 100.0 0.8 15.2 25.3 26.3 15.1 5.9 1.7 0.5 Blue maximum 1 110.4 100.0 196.1 61.3 59.2 70.0 80.2 22.1 10.2 4.1 Red minimum 1 0.0 10.5 0.1 0.1 2.2 36.0 100.0 2.2 0.6 0.3 Red maximum 1 2.0 1.4 3.1 7.3 22.3 59.8 100.0 61.2 18.1 5.2 Short-blue- 3.9 100.0 112.7 306.2 395.1 318.2 245.0 138.8 39.5 10.3 pumped cyan minimum 1 Short-blue- 130.6 100.0 553.9 2660.6 4361.9 3708.8 2223.8 712.2 285.6 99.6 pumped cyan maximum 1 Short-blue- 130.6 100.0 553.9 5472.8 9637.9 12476.9 13285.5 6324.7 1620.3 344.7 pumped cyan maximum 2 Long-blue- 0.0 0.0 100.0 76.6 38.0 33.4 19.6 7.1 2.0 0.6 pumped cyan minimum 1 Long-blue- 1.8 36.1 100.0 253.9 202.7 145.0 113.2 63.1 24.4 7.3 pumped cyan maximum 1
TABLE-US-00002 TABLE 2 Spectral Power Distribution for Wavelength Ranges (nm) 380 < .lamda. .ltoreq. 500 < .lamda. .ltoreq. 600 < .lamda. .ltoreq. 700 < .lamda. .ltoreq. 500 600 700 780 Blue minimum 1 100.0 27.0 19.3 20.5 Blue maximum 1 100.0 74.3 46.4 51.3 Red minimum 1 100.0 51.4 575.6 583.7 Red maximum 1 100.0 2332.8 8482.2 9476.2 Short-blue-pumped 100.0 279.0 170.8 192.8 cyan minimum 1 Short-blue-pumped 100.0 3567.4 4366.3 4696.6 cyan maximum 1 Long-blue-pumped 100.0 155.3 41.1 43.5 cyan minimum 1 Long-blue-pumped 100.0 503.0 213.2 243.9 cyan maximum 1
TABLE-US-00003 TABLE 3 Spectral Power Distribution for Wavelength Ranges (nm) Exemplary Color 380 < 400 < 420 < 440 < 460 < 480 < 500 < 520 < 540 < 560 < 580 < Channels .lamda. .ltoreq. 400 .lamda. .ltoreq. 420 .lamda. .ltoreq. 440 .lamda. .ltoreq. 460 .lamda. .ltoreq. 480 .lamda. .ltoreq. 500 .lamda. .ltoreq. 520 .lamda. .ltoreq. 540 .lamda. .ltoreq. 560 .lamda. .ltoreq. 580 .lamda. .ltoreq. 600 Blue 0.1 1.2 20.6 100 49.2 35.7 37.2 36.7 33.4 26.5 19.8 Channel 1 Red 0.0 0.3 1.4 1.3 0.4 0.9 4.2 9.4 15.3 26.4 45.8 Channel 1 Short-Blue- 0.2 1.2 8.1 22.2 17.5 46.3 88.2 98.5 100.0 90.2 73.4 Pumped Cyan Channel 1 Long-Blue- 0.0 0.1 0.7 9.9 83.8 100 75.7 65.0 62.4 55.5 43.4 Pumped Cyan Channel 1 Blue 0.4 2.5 17.2 100 60.9 30.9 29.3 30.2 28.6 24.3 20.7 Channel 2 Red 0.1 0.4 1.1 3.4 3.6 2.7 5.9 11.0 16.9 28.1 46.8 Channel 2 Short-Blue- 0.5 0.6 3.4 13.5 16.6 47.2 83.7 95.8 100.0 95.8 86.0 Pumped Cyan Channel 2 Long-Blue- 0.1 0.2 1.0 9.1 54.6 100.0 99.6 75.7 65.5 56.8 48.9 Pumped Cyan Channel 2 Exemplary Color 600 < 620 < 640 < 660 < 680 < 700 < 720 < 740 < 760 < 780 < Channels .lamda. .ltoreq. 620 .lamda. .ltoreq. 640 .lamda. .ltoreq. 660 .lamda. .ltoreq. 680 .lamda. .ltoreq. 700 .lamda. .ltoreq. 720 .lamda. .ltoreq. 740 .lamda. .ltoreq. 760 .lamda. .ltoreq. 780 .lamda. .ltoreq. 800 Blue 14.4 10.6 7.6 4.7 2.6 1.4 0.7 0.4 0.2 0.0 Channel 1 Red 66.0 87.0 100.0 72.5 42.0 22.3 11.6 6.1 3.1 0.0 Channel 1 Short-Blue- 57.0 48.1 41.4 27.0 15.1 7.9 4.0 2.1 1.0 0.0 Pumped Cyan Channel 1 Long-Blue- 30.9 21.5 14.5 8.5 4.5 2.4 1.3 0.7 0.3 0.0 Pumped Cyan Channel 1 Blue 18.5 16.6 13.6 9.5 6.0 3.5 2.0 1.2 0.8 0.0 Channel 2 Red 68.9 92.6 100.0 73.9 44.5 24.7 13.1 6.8 3.5 0.0 Channel 2 Short-Blue- 76.4 74.6 68.3 46.1 26.1 14.0 7.2 3.6 1.8 0.0 Pumped Cyan Channel 2 Long-Blue- 41.3 33.3 24.1 15.8 9.4 5.4 3.0 1.7 1.1 0.0 Pumped Cyan Channel 2
TABLE-US-00004 TABLE 4 Spectral Power Distribution for Wavelength Ranges (nm) Exemplary Color 380 < 420 < 460 < 500 < 540 < 580 < 620 < 660 < 700 < 740 < Channels .lamda. .ltoreq. 420 .lamda. .ltoreq. 460 .lamda. .ltoreq. 500 .lamda. .ltoreq. 540 .lamda. .ltoreq. 580 .lamda. .ltoreq. 620 .lamda..ltoreq. 660 .lamda. .ltoreq. 700 .lamda. .ltoreq. 740 .lamda. .ltoreq. 780 Red Channel 1 0.2 1.4 0.7 7.3 22.3 59.8 100.0 61.2 18.1 4.9 Red Channel 2 1.8 4.2 2.7 7.2 19.3 59.1 100.0 59.5 20.4 5.9 Blue Channel 1 1.1 100.0 70.4 61.3 49.7 28.4 15.1 6.0 1.7 0.5 Blue Channel 2 25.7 100.0 69.4 31.6 38.7 38.3 33.7 14.9 5.6 2.0 Short-Blue-Pumped 0.7 15.9 33.5 98.2 100.0 68.6 47.1 22.1 6.3 1.7 Cyan Channel 1 Short-Blue-Pumped 30.3 100.0 313.2 1842.7 2770.2 2841.2 2472.2 1119.1 312.7 77.8 Cyan Channel 2 Long-blue-pumped 0.0 5.8 100.0 76.6 64.1 40.4 19.6 7.1 2.0 0.6 cyan Channel 1 Long-blue-pumped 0.4 5.3 100.0 165.3 105.4 77.0 49.0 22.7 8.1 2.3 cyan Channel 2
TABLE-US-00005 TABLE 5 Exemplary LED pump peak Color Channels ccx ccy wavelength Red Channel 1 0.5932 0.3903 450-455 nm Blue Channel 1 0.2333 0.2588 450-455 nm Long-Blue-Pumped 0.2934 0.4381 505 nm Cyan Channel 1 Short-Blue-Pumped 0.373 0.4978 450-455 nm Cyan Channel 1 Violet Channel 1 0.3585 0.3232 380 nm Violet Channel 2 0.3472 0.3000 400 nm Violet Channel 3 0.2933 0.2205 410 nm Violet Channel 4 0.3333 0.2868 420 nm Violet Channel 5 400 nm Yellow Channel 1 0.4191 0.5401 380 nm Yellow Channel 2 0.4218 0.5353 400 nm Yellow Channel 3 0.4267 0.5237 410 nm Yellow Channel 4 0.4706 0.4902 420 nm Yellow Channel 5 400 nm Yellow Channel 6 410 nm
[0099] In certain implementations, the cyan lighting channels described herein, including short-blue-pumped cyan channels and long-blue-pumped cyan channels as described herein, can generate light outputs with cyan color points that fall within a cyan color range. In certain implementations, suitable cyan color ranges can include cyan color ranges 303A-E, which can be seen in FIGS. 22B, 23, and 24. Cyan color range 303A is defined by a line connecting the ccx, ccy color coordinates (0.18, 0.55) and (0.27, 0.72), the constant CCT line of 9000K, the Planckian locus between 9000K and 1800K, the constant CCT line of 1800K, and the spectral locus on the 1931 CIE Chromaticity Diagram. A cyan color range 303B can be defined by the region bounded by lines connecting (0.360, 0.495), (0.371, 0.518), (0.388, 0.522), and (0.377, 0.499). A cyan color range 303C is defined by a line connecting the ccx, ccy color coordinates (0.18, 0.55) and (0.27, 0.72), the constant CCT line of 9000K, the Planckian locus between 9000K and 4600K, the constant CCT line of 4600K, and the spectral locus. A cyan color range 303D is defined by the constant CCT line of 4600K, the spectral locus, the constant CCT line of 1800K, and the Planckian locus between 4600K and 1800K. In some implementations, the long-blue-pumped cyan channel can provide a color point within a cyan color region 303E defined by lines connecting (0.497, 0.469), (0.508, 0.484), (0.524, 0.472), and (0.513, 0.459).
[0100] In some implementations, the LEDs in the cyan color channels can be LEDs with peak emission wavelengths at or below about 535 nm. In some implementations, the LEDs emit light with peak emission wavelengths between about 360 nm and about 535 nm. In some implementations, the LEDs in the cyan color channels can be formed from InGaN semiconductor materials. In some implementations, the LEDs used in the long-blue-pumped cyan channels can be LEDs having peak emission wavelengths between about 360 nm and about 535 nm, between about 380 nm and about 520 nm, between about 470 nm and about 505 nm, about 480 nm, about 470 nm, about 460 nm, about 455 nm, about 450 nm, or about 445 nm. In certain implementations, the LEDs used in long-blue-pumped cyan channels can have a peak wavelength between about 460 nm and 515 nm. In some implementations, the LEDs in the long-blue-pumped cyan channels can include one or more LUXEON Rebel Blue LEDs (LXML-PB01, LXML-PB02) of color bins 1, 2, 3, 4, or 5, which have peak wavelengths ranging from 460 nm to 485 nm, or LUXEON Rebel Cyan LEDs (LXML-PE01) of color bins 1, 2, 3, 4, or 5, which have peak wavelengths raving from 460 nm to 485 nm. In some implementations, the short-blue-pumped cyan channels can have LEDs having a peak wavelength between about 405 nm and about 485 nm, between about 430 nm and about 460 nm, between about 430 nm and about 455 nm, between about 430 nm and about 440 nm, between about 440 nm and about 450 nm, between about 440 nm and about 445 nm, or between about 445 nm and about 450 nm. The LEDs used in the short-blue-pumped cyan channels may have full-width half-maximum wavelength ranges of between about 10 nm and about 30 nm. In some preferred implementations, the short-blue-pumped cyan channels can include one or more LUXEON Z Color Line royal blue LEDs (product code LXZ1-PR01) of color bin codes 3, 4, 5, or 6, one or more LUXEON Z Color Line blue LEDs (LXZ1-PB01) of color bin code 1 or 2, or one or more LUXEON royal blue LEDs (product code LXML-PR01 and LXML-PR02) of color bins 3, 4, 5, or 6 (Lumileds Holding B.V., Amsterdam, Netherlands).
[0101] Yellow Channels
[0102] In some implementations of the present disclosure, lighting systems can include yellow channels that produce light with a yellow color point that falls within a yellow color range. Non-limiting FIGS. 17A and 17B depicts some aspects of suitable yellow color ranges for implementations of yellow channels of the present disclosure. In some implementations, the yellow channels can produce light having a yellow color point that falls within a yellow color range 1401, with boundaries defined on the 1931 CIE Chromaticity Diagram of the constant CCT line of 5000K from the Planckian locus to the spectral locus, the spectral locus, and the Planckian locus from 5000K to 550K. In certain implementations, the yellow channels can produce light having a yellow color point that falls within a yellow color range 1402, with boundaries defined on the 1931 CIE Chromaticity Diagram by a polygon connecting (ccx, ccy) coordinates of (0.47, 0.45), (0.48, 0.495), (0.41, 0.57), and (0.40, 0.53). In some implementations, the yellow channels can produce light having a color point at one of the exemplary yellow color points 1403A-D shown in FIG. 17B and described more fully elsewhere herein.
[0103] Violet Channels
[0104] In some implementations of the present disclosure, lighting systems can include violet channels that produce light with a violet color point that falls within a violet color range. Non-limiting FIG. 16 depicts some aspects of suitable violet color ranges for implementations of violet channels of the present disclosure. In some implementations, the violet channels can produce light having a violet color point that falls within a violet color range 1301, with boundaries defined on the 1931 CIE Chromaticity Diagram of the Planckian locus between 1600K CCT and infinite CCT, a line between the infinite CCT point on the Planckian locus and the monochromatic point of 470 nm on the spectral locus, the spectral locus between the monochromatic point of 470 nm and the line of purples, the line of purples from the spectral locus to the constant CCT line of 1600K, and the constant CCT line of 1600K between the line of purples and the 1600K CCT point on the Planckian locus. In certain implementations, the violet channels can produce light having a violet color point that falls within a violet color range 1302, with boundaries defined on the 1931 CIE Chromaticity Diagram by a 40-step MacAdam ellipse centered at 6500K CCT with DUV=-40 points. In some implementations, the violet channels can produce light having a color point at one of the exemplary violet color points 1303A-D shown in FIG. 16 and described more fully elsewhere herein.
[0105] Red Channels
[0106] In some implementations of the present disclosure, lighting systems can include red channels that produce light with a red color point that falls within a red color range. In certain implementations, suitable red color ranges can include red color ranges 302A-D. FIG. 22B depicts a red color range 302A defined by the spectral locus between the constant CCT line of 1600K and the line of purples, the line of purples, a line connecting the ccx, ccy color coordinates (0.61, 0.21) and (0.47, 0.28), and the constant CCT line of 1600K. FIG. 23 depicts some suitable color ranges for some implementations of the disclosure. FIG. 25 shows a red color range 302B that can be defined by a 20-step MacAdam ellipse at a CCT of 1200K, 20 points below the Planckian locus. FIG. 24 depicts some further color ranges suitable for some implementations of the disclosure. A red color range 302C is defined by a polygonal region on the 1931 CIE Chromaticity Diagram defined by the following ccx, ccy color coordinates: (0.53, 0.41), (0.59, 0.39), (0.63, 0.29), (0.58, 0.30). In FIG. 26, a red color range 302C is depicted and can be defined by a polygonal region on the 1931 CIE Chromaticity Diagram defined by the following ccx, ccy color coordinates: (0.53, 0.41), (0.59, 0.39), (0.63, 0.29), (0.58, 0.30). FIG. 27 depicts a red color range 302D defined by lines connecting the ccx, ccy coordinates (0.576, 0.393), (0.583, 0.400), (0.604, 0.387), and (0.597, 0.380).
Spectral Power Distributions of Colored Channels:
[0107] In implementations utilizing LEDs that emit substantially saturated light at wavelengths between about 360 nm and about 535 nm, the display systems can include suitable recipient luminophoric mediums for each LED in order to produce light having color points within the suitable blue color ranges 301A-F, red color ranges 302A-D, cyan color ranges 303A-E, violet color ranges 1301, 1302, and yellow color ranges 1401, 1402 described herein. The light emitted by each lighting channel (from each LED string, i.e., the light emitted from the LED(s) and associated recipient luminophoric medium together) can have a suitable spectral power distribution ("SPD") having spectral power with ratios of power across the visible wavelength spectrum from about 380 nm to about 780 nm or across the visible and near-visible wavelength spectrum from about 320 nm to about 800 nm. While not wishing to be bound by any particular theory, it is speculated that the use of such LEDs in combination with recipient luminophoric mediums to create unsaturated light within the suitable color ranges 301A-F, 302A-D, 303A-E, 1301, 1302, 1401, and 1402 provides for improved color rendering performance for white light across a predetermined range of CCTs from a single display systems. Further, while not wishing to be bound by any particular theory, it is speculated that the use of such LEDs in combination with recipient luminophoric mediums to create unsaturated light within the suitable color ranges 301A-F, 302A-D, 303A-E, 1301, 1302, 1401, and 1402 provides for improved light rendering performance, providing higher EML performance along with color-rendering performance, for white light across a predetermined range of CCTs from a single display systems. Some suitable ranges for spectral power distribution ratios of the lighting channels of the present disclosure are shown in Tables 1-4 and 7-15. The Tables show the ratios of spectral power within wavelength ranges, with an arbitrary reference wavelength range selected for each color range and normalized to a value of 100.0 except where indicated otherwise.
[0108] In some implementations, the lighting channels of the present disclosure can each product a colored light that falls between minimum and maximum values in particular wavelength ranges relative to an arbitrary reference wavelength range. Tables 1, 2, and 7-15 show some exemplary minimum and maximum spectral power values for the blue, red, short-blue-pumped cyan, long-blue-pumped cyan, yellow, and violet channels of the disclosure. In certain implementations, the blue lighting channel can produce light with spectral power distribution that falls within the values between Blue minimum 1 and Blue maximum 1 in the wavelength ranges shown in Table 1, Table 2, or both Tables 1 and 2. In some implementations, the red lighting channel can produce light with spectral power distribution that falls within the values between Red minimum 1 and Red maximum 1 in the wavelength ranges shown in Table 1, Table 2, or both Tables 1 and 2. In some implementations, the red channel can produce red light having a spectral power distribution that falls within the ranges between the Exemplary Red Channels Minimum and the Exemplary Red Channels Maximum in the wavelength ranges shown in one or more of Tables 7-9. In some implementations, the short-blue-pumped cyan can fall within the values between Short-blue-pumped cyan minimum 1 and Short-blue-pumped cyan maximum 1 in the wavelength ranges shown in Table 1, Table 2, or both Tables 1 and 2. In other implementations, the short-blue-pumped cyan can fall within the values between Short-blue-pumped cyan minimum 1 and Short-blue-pumped cyan maximum 2 in the wavelength ranges shown in Table 1. In some implementations, the Long-Blue-Pumped Cyan lighting channel can produce light with spectral power distribution that falls within the values between Long-Blue-Pumped Cyan minimum 1 and Long-Blue-Pumped Cyan maximum 1 in the wavelength ranges shown in Table 1, Table 2, or both Tables 1 and 2. In some implementations, the yellow channel can produce yellow light having a spectral power distribution that falls within the ranges between the Exemplary Yellow Channels Minimum and the Exemplary Yellow Channels Maximum in the wavelength ranges shown in one or more of Tables 13-15. In some implementations, the violet channel can produce violet light having a spectral power distribution that falls within the ranges between the Exemplary Violet Channels Minimum and the Exemplary Violet Channels Maximum in the wavelength ranges shown in one or more of Tables 10-12. While not wishing to be bound by any particular theory, it is speculated that because the spectral power distributions for generated light with color points within the blue, long-blue-pumped cyan, short-blue-pumped cyan, yellow, and violet color ranges contains higher spectral intensity across visible wavelengths as compared to lighting apparatuses and methods that utilize more saturated colors, this allows for improved color rendering for test colors other than R1-R8. International Patent Application No. PCT/US2018/020792, filed Mar. 2, 2018, discloses aspects of some additional red, blue, short-pumped-blue (referred to as "green" therein), and long-pumped-blue (referred to as "cyan" therein) channel elements that may be suitable for some implementations of the present disclosure, the entirety of which is incorporated herein for all purposes.
[0109] In some implementations, the short-blue-pumped cyan channel can produce cyan light having certain spectral power distributions. Tables 3 and 4 show the ratios of spectral power within wavelength ranges, with an arbitrary reference wavelength range selected for the short-blue-pumped cyan color range and normalized to a value of 100.0, for a short-blue-pumped cyan channel that may be used in some implementations of the disclosure. The exemplary Short-blue-pumped cyan Channel 1 has a ccx, ccy color coordinate shown in Table 5. In certain implementations, the short-blue-pumped cyan channel can have a spectral power distribution with spectral power in one or more of the wavelength ranges other than the reference wavelength range increased or decreased within 30% greater or less, within 20% greater or less, within 10% greater or less, or within 5% greater or less than the values shown in Table 3 or 4.
[0110] In some implementations, the long-blue-pumped cyan channel can produce cyan light having certain spectral power distributions. Tables 3 and 4 shows ratios of spectral power within wavelength ranges, with an arbitrary reference wavelength range selected for the long-blue-pumped cyan color range and normalized to a value of 100.0, for several non-limiting embodiments of the long-blue-pumped cyan channel. The exemplary Long-blue-pumped cyan Channel 1 has a ccx, ccy color coordinate Shown in Table 5. In certain implementations, the long-blue-pumped cyan channel can have a spectral power distribution with spectral power in one or more of the wavelength ranges other than the reference wavelength range increased or decreased within 30% greater or less, within 20% greater or less, within 100/% greater or less, or within 5% greater or less than the values shown in Table 3 and 4.
[0111] In some implementations, the red channel can produce red light having certain spectral power distributions. Tables 3-4 and 7-9 show the ratios of spectral power within wavelength ranges, with an arbitrary reference wavelength range selected for the red color range and normalized to a value of 100.0, for red lighting channels that may be used in some implementations of the disclosure. The exemplary Red Channel 1 has a ccx, ccy color coordinate of (0.5932, 0.3903). In certain implementations, the red channel can have a spectral power distribution with spectral power in one or more of the wavelength ranges other than the reference wavelength range increased or decreased within 30% greater or less, within 20% greater or less, within 10% greater or less, or within 5% greater or less than the values shown in Tables 3-4 and 7-9 for Red Channels 1-11 and the Exemplary Red Channels Average.
[0112] In some implementations, the blue channel can produce blue light having certain spectral power distributions. Tables 3 and 4 show the ratios of spectral power within wavelength ranges, with an arbitrary reference wavelength range selected for the blue color range and normalized to a value of 100.0, for a blue channel that may be used in some implementations of the disclosure. Exemplary Blue Channel 1 has a ccx, ccy color coordinate of (0.2333, 0.2588). In certain implementations, the blue channel can have a spectral power distribution with spectral power in one or more of the wavelength ranges other than the reference wavelength range increased or decreased within 30% greater or less, within 20% greater or less, within 10% greater or less, or within 5% greater or less than the values shown in Tables 3 and 4.
[0113] In some implementations, the yellow channel can have certain spectral power distributions. Tables 13-15 show the ratios of spectral power within wavelength ranges, with an arbitrary reference wavelength range selected and normalized to a value of 100.0 for exemplary yellow lighting channels, Yellow Channels 1-6. Table 5 shows some aspects of the exemplary yellow lighting channels for some implementations of the disclosure. In certain implementations, the yellow channel can have a spectral power distribution with spectral power in one or more of the wavelength ranges other than the reference wavelength range increased or decreased within 30% greater or less, within 20% greater or less, within 10% greater or less, or within 5% greater or less than the values shown in one or more of Tables 13-15 for Yellow Channels 1-6 and the Exemplary Yellow Channels Average.
[0114] In some implementations, the violet channel can have certain spectral power distributions. Tables 13-15 show the ratios of spectral power within wavelength ranges, with an arbitrary reference wavelength range selected and normalized to a value of 100.0 for exemplary violet lighting channels, Violet Channels 1-5. Table 5 shows some aspects of the exemplary violet lighting channels for some implementations of the disclosure. In certain implementations, the violet channel can have a spectral power distribution with spectral power in one or more of the wavelength ranges other than the reference wavelength range increased or decreased within 30% greater or less, within 20% greater or less, within 10% greater or less, or within 5% greater or less than the values shown in one or more of Tables 12-15 for one or more of Violet Channels 1-6 and the Exemplary Violet Channels Average.
[0115] In some implementations, the lighting channels of the present disclosure can each product a colored light having spectral power distributions having particular characteristics. In certain implementations, the spectral power distributions of some lighting channels can have peaks, points of relatively higher intensity, and valleys, points of relatively lower intensity that fall within certain wavelength ranges and have certain relative ratios of intensity between them.
[0116] Tables 38 and 39 and FIG. 19 show some aspects of exemplary violet lighting channels for some implementations of the disclosure. In certain implementations, a Violet Peak (VP) is present in a range of about 380 nm to about 460 nm. In further implementations, a Violet Valley (Vv) is present in a range of about 450 nm to about 510 nm. In some implementations, a Green Peak (Gp) is present in a range of about 500 nm to about 650 nm. In certain implementations, a Red Valley (Rv) is present in a range of about 650 nm to about 780 nm. Table 38 shows the relative intensities of the peaks and valleys for exemplary violet lighting channels of the disclosure, with the VP values assigned an arbitrary value of 1.0 in the table. The wavelength at which each peak or valley is present is also shown in Table 38. Table 39 shows the relative ratios of intensity between particular pairs of the peaks and valleys of the spectral power distributions for exemplary violet lighting channels and minimum, average, and maximum values thereof. In certain implementations, the violet channel can have a spectral power distribution with the relative intensities of Vv, GP, and Rv increased or decreased within 30% greater or less, within 20% greater or less, within 10% greater or less, or within 5% greater or less than the values shown in Table 38 for one or more of Violet Channels 1-5 and the Exemplary Violet Channels Average. In some implementations, the violet channel can produce violet light having a spectral power distribution with peak and valley intensities that fall between the Exemplary Violet Channels Minimum and the Exemplary Violet Channels Maximum shown in Table 38. In further implementations, the violet channel can produce violet light having a spectral power distribution with relative ratios of intensity between particular pairs of the peak and valley intensities that fall between the Exemplary Violet Channels Minimum and the Exemplary Violet Channels Maximum values shown in Table 39. In certain implementations, the violet channel can have a spectral power distribution with the relative ratios of intensity between particular pairs of the peak and valley intensities increased or decreased within 30% greater or less, within 20% greater or less, within 10% greater or less, or within 5% greater or less than the relative ratio values shown in Table 39 for one or more of Violet Channels 1-5 and the Exemplary Violet Channels Average.
[0117] Tables 40 and 41 and FIG. 20 show some aspects of exemplary yellow lighting channels for some implementations of the disclosure. In certain implementations, a Violet Peak (Vp) is present in a range of about 330 nm to about 430 nm. In further implementations, a Violet Valley (Vv) is present in a range of about 420 nm to about 510 nm. In some implementations, a Green Peak (Gp) is present in a range of about 500 nm to about 780 nm. Table 40 shows the relative intensities of the peaks and valleys for exemplary yellow lighting channels of the disclosure, with the GP values assigned an arbitrary value of 1.0 in the table. The wavelength at which each peak or valley is present is also shown in Table 40. Table 41 shows the relative ratios of intensity between particular pairs of the peaks and valleys of the spectral power distributions for exemplary yellow lighting channels and minimum, average, and maximum values thereof. In certain implementations, the yellow channel can have a spectral power distribution with the relative intensities of VP and Vv increased or decreased within 30% greater or less, within 20% greater or less, within 10% greater or less, or within 5% greater or less than the values for one or more of Yellow Channels 1-6 and the Exemplary Yellow Channels Average shown in Table 40. In some implementations, the yellow channel can produce yellow light having a spectral power distribution with peak and valley intensities that fall between the Exemplary Yellow Channels Minimum and the Exemplary Yellow Channels Maximum shown in Table 40. In further implementations, the yellow channel can produce yellow light having a spectral power distribution with relative ratios of intensity between particular pairs of the peak and valley intensities that fall between the Exemplary Yellow Channels Minimum and the Exemplary Yellow Channels Maximum values shown in Table 41. In certain implementations, the yellow channel can have a spectral power distribution with the relative ratios of intensity between particular pairs of the peak and valley intensities increased or decreased within 30% greater or less, within 20% greater or less, within 10% greater or less, or within 5% greater or less than the relative ratio values for one or more of Yellow Channels 1-6 and the Exemplary Yellow Channels Average shown in Table 41.
[0118] Tables 42 and 43 and FIG. 21 show some aspects of exemplary red lighting channels for some implementations of the disclosure. In certain implementations, a Blue Peak (BP) is present in a range of about 380 nm to about 460 nm. In further implementations, a Blue Valley (Bv) is present in a range of about 450 nm to about 510 nm. In some implementations, a Red Peak (RP) is present in a range of about 500 nm to about 780 nm. Table 42 shows the relative intensities of the peaks and valleys for exemplary red lighting channels of the disclosure, with the RP values assigned an arbitrary value of 1.0 in the table. The wavelength at which each peak or valley is present is also shown in Table 42. Table 43 shows the relative ratios of intensity between particular pairs of the peaks and valleys of the spectral power distributions for exemplary red lighting channels and minimum, average, and maximum values thereof. In certain implementations, the red channel can have a spectral power distribution with the relative intensities of BP and By increased or decreased within 30% greater or less, within 20% greater or less, within 10% greater or less, or within 5% greater or less than the values for one or more of Red Channels 1, 3-6, and 9-17 and the Exemplary Red Channels Average shown in Table 42. In some implementations, the red channel can produce red light having a spectral power distribution with peak and valley intensities that fall between the Exemplary Red Channels Minimum and the Exemplary Red Channels Maximum shown in Table 42. In further implementations, the red channel can produce red light having a spectral power distribution with relative ratios of intensity between particular pairs of the peak and valley intensities that fall between the Exemplary Red Channels Minimum and the Exemplary Red Channels Maximum values shown in Table 43. In certain implementations, the red channel can have a spectral power distribution with the relative ratios of intensity between particular pairs of the peak and valley intensities increased or decreased within 30% greater or less, within 20% greater or less, within 10% greater or less, or within 5% greater or less than the relative ratio values for one or more of Red Channels 1, 3-6, and 9-17 and the Exemplary Red Channels Average shown in Table 43.
Luminescent Materials and Luminophoric Mediums
[0119] Blends of luminescent materials can be used in luminophoric mediums having the desired saturated color points when excited by their respective LED strings including luminescent materials such as those disclosed in co-pending application PCT/US2016/015318 filed Jan. 28, 2016, entitled "Compositions for LED Light Conversions", the entirety of which is hereby incorporated by this reference as if fully set forth herein. Traditionally, a desired combined output light can be generated along a tie line between the LED string output light color point and the saturated color point of the associated recipient luminophoric medium by utilizing different ratios of total luminescent material to the encapsulant material in which it is incorporated. Increasing the amount of luminescent material in the optical path will shift the output light color point towards the saturated color point of the luminophoric medium. In some instances, the desired saturated color point of a recipient luminophoric medium can be achieved by blending two or more luminescent materials in a ratio. The appropriate ratio to achieve the desired saturated color point can be determined via methods known in the art. Generally speaking, any blend of luminescent materials can be treated as if it were a single luminescent material, thus the ratio of luminescent materials in the blend can be adjusted to continue to meet a target CIE value for LED strings having different peak emission wavelengths. Luminescent materials can be tuned for the desired excitation in response to the selected LEDs used in the LED strings, which may have different peak emission wavelengths within the range of from about 360 nm to about 535 nm. Suitable methods for tuning the response of luminescent materials are known in the art and may include altering the concentrations of dopants within a phosphor, for example. In some implementations of the present disclosure, luminophoric mediums can be provided with combinations of two types of luminescent materials. The first type of luminescent material emits light at a peak emission between about 515 nm and about 590 nm in response to the associated LED string emission. The second type of luminescent material emits at a peak emission between about 590 nm and about 700 nm in response to the associated LED string emission. In some instances, the luminophoric mediums disclosed herein can be formed from a combination of at least one luminescent material of the first and second types described in this paragraph. In implementations, the luminescent materials of the first type can emit light at a peak emission at about 515 nm, 525 nm, 530 nm, 535 nm, 540 nm, 545 nm, 550 nm, 555 nm, 560 nm, 565 nm, 570 nm, 575 nm, 580 nm, 585 nm, or 590 nm in response to the associated LED string emission. In preferred implementations, the luminescent materials of the first type can emit light at a peak emission between about 520 nm to about 555 nm. In implementations, the luminescent materials of the second type can emit light at a peak emission at about 590 nm, about 595 nm, 600 nm, 605 nm, 610 nm, 615 nm, 620 nm, 625 nm, 630 nm, 635 nm, 640 nm, 645 nm, 650 nm, 655 nm, 670 nm, 675 nm, 680 nm, 685 nm, 690 nm, 695 nm, or 700 nm in response to the associated LED string emission. In preferred implementations, the luminescent materials of the first type can emit light at a peak emission between about 600 nm to about 670 nm. Some exemplary luminescent materials of the first and second type are disclosed elsewhere herein and referred to as Compositions A-F. Table 6 shows aspects of some exemplar luminescent materials and properties.
[0120] Blends of Compositions A-F can be used in luminophoric mediums having desired saturated color points when excited by respective LED strings in the lighting channels of the disclosure. In some implementations, one or more blends of one or more of Compositions A-F can be used to produce luminophoric mediums. In some preferred implementations, one or more of Compositions A, B, and D and one or more of Compositions C, E, and F can be combined to produce luminophoric mediums. In some preferred implementations, the encapsulant for luminophoric mediums comprises a matrix material having density of about 1.1 mg/mm3 and refractive index of about 1.545 or from about 1.4 to about 1.6. In some implementations, Composition A can have a refractive index of about 1.82 and a particle size from about 18 micrometers to about 40 micrometers. In some implementations, Composition B can have a refractive index of about 1.84 and a particle size from about 13 micrometers to about 30 micrometers. In some implementations, Composition C can have a refractive index of about 1.8 and a particle size from about 10 micrometers to about 15 micrometers. In some implementations, Composition D can have a refractive index of about 1.8 and a particle size from about 10 micrometers to about 15 micrometers. Suitable phosphor materials for Compositions A, B, C, and D are commercially available from phosphor manufacturers such as Mitsubishi Chemical Holdings Corporation (Tokyo, Japan), Intematix Corporation (Fremont, Calif.), EMD Performance Materials of Merck KGaA (Darmstadt, Germany), and PhosphorTech Corporation (Kennesaw, Ga.).
TABLE-US-00006 TABLE 6 Emission Emission Peak FWHM Density Peak FWHM Range Range Designator Exemplary Material(s) (g/mL) (nm) (nm) (nm) (nm) Composition Luag: Cerium doped 6.73 535 95 530-540 90-100 ''A'' lutetium aluminum garnet (Lu.sub.3Al.sub.5O.sub.12) Composition Yag: Cerium doped 4.7 550 110 545-555 105-115 ''B'' yttrium aluminum garnet (Y.sub.3Al.sub.5O.sub.12) Composition a 650 nm-peak 3.1 650 90 645-655 85-95 ''C'' wavelength emission phosphor: Europium doped calcium aluminum silica nitride (CaAlSiN.sub.3) Composition a 525 nm-peak 3.1 525 60 520-530 55-65 ''D'' wavelength emission phosphor: GBAM: BaMgAl.sub.10O.sub.17: Eu Composition a 630 nm-peak 5.1 630 40 625-635 35-45 ''E'' wavelength emission quantum dot: any semiconductor quantum dot material of appropriate size for desired emission wavelengths Composition a 610 nm-peak 5.1 610 40 605-615 35-45 ''F'' wavelength emission quantum dot: any semiconductor quantum dot material of appropriate size for desired emission wavelengths
Circadian-Inducing Blue Properties
[0121] In some aspects, the circadian-inducing blue light in the display systems can have circadian-stimulating energy characteristics that lead to biological effects in users. The circadian-inducing blue, and overall light emissions including the circadian-inducing blue, can have a first circadian-stimulating energy characteristic related to the associated first spectral power distribution of the circadian-inducing blue or overall light emissions, while light emissions from the non-circadian-inducing blue and related overall light emissions can have a second circadian-stimulating energy characteristic related to the associated second spectral power distribution of the circadian-inducing blue or overall light emissions.
[0122] In certain implementations, the first circadian-stimulating energy characteristic and the second circadian-stimulating energy characteristic can be the percentage of the spectral power in the associated first spectral power distribution and the second spectral power distribution, respectively, between a first wavelength value and a second wavelength value, forming a particular wavelength range therein greater than the first wavelength value and less than or equal to the second wavelength value. In some instances, the first and second circadian-stimulating energy characteristics can be one or more of the percentage of spectral power in the wavelength ranges of 470 nm<.lamda..ltoreq.480 nm, 480 nm<.lamda..ltoreq.490 nm, and 490 nm<.lamda..ltoreq.500 nm in comparison to the total energy from 320 nm<.lamda..ltoreq.800 nm in the first and second spectral power distributions respectively. In some implementations, the percentage of spectral power in the wavelength ranges of 470 nm<.lamda..ltoreq.480 nm in comparison to the total energy from 320 nm<.lamda..ltoreq.800 nm of the first spectral power distribution can be between about 2.50 and about 6.00, between about 3.00 and about 5.50, between about 3.00 and about 4.00, between about 3.50 and about 4.00, about 3.0, about 3.1, about 3.2, about 3.3, about 3.4, about 3.5, about 3.6, about 3.7, about 3.8, about 3.9, about 4.0, about 4.1, about 4.2, about 4.3, about 4.4, about 4.5, about 4.6, about 4.7, about 4.8, about 4.9, about 5.0, about 5.1, about 5.2, about 5.3, about 5.4, about 5.5, about 5.6, about 5.7, about 5.8, about 5.9, or about 6.0. In certain implementations, the percentage of spectral power in the wavelength ranges of 480 nm<.lamda..ltoreq.490 nm in comparison to the total energy from 320 nm<.lamda..ltoreq.800 nm in the first spectral power distribution can be between about 4.0 and about 6.5, between about 4.5 and about 5.5, between about 4.4 and about 4.6, between about 5.2 and about 5.8, about 4.0, about 4.1, about 4.2, about 4.3, about 4.4, about 4.5, about 4.6, about 4.7, about 4.8, about 4.9, about 5.0, about 5.1, about 5.2, about 5.3, about 5.4, about 5.5, about 5.6, about 5.7, about 5.8, about 5.9, about 6.0, about 6.1, about 6.2, about 6.3, about 6.4, or about 6.5. In some implementations, the percentage of spectral power in the wavelength ranges of 490 nm<.lamda..ltoreq.500 nm in comparison to the total energy from 320 nm<.lamda..ltoreq.800 nm in the first spectral power distribution can be between about 3.5 and about 6.0, between about 4.0 and about 5.0, between about 4.5 and about 5.5, between about 4.5 and about 5.0, about 3.5, about 3.6, about 3.7, about 3.8, about 3.9, about 4.0, about 4.1, about 4.2, about 4.3, about 4.4, about 4.5, about 4.6, about 4.7, about 4.8, about 4.9, about 5.0, about 5.1, about 5.2, about 5.3, about 5.4, about 5.5, about 5.6, about 5.7, about 5.8, about 5.9, or about 6.0. In some implementations, the percentage of spectral power in the wavelength ranges of 470 nm<.lamda..ltoreq.480 nm in comparison to the total energy from 320 nm<.lamda..ltoreq.800 nm in the second spectral power distribution can be between about 0.025 and about 0.080, between about 0.030 and about 0.060, between about 0.050 and about 0.070, between about 0.050 and about 0.060, about 0.025, about 0.030, about 0.035, about 0.040, about 0.045, about 0.050, about 0.055, about 0.56, about 0.57, about 0.58, about 0.59, about 0.060, about 0.61, about 0.62, about 0.63, about 0.64, about 0.065, about 0.66, about 0.67, about 0.68, about 0.69, about 0.070, about 0.075, or about 0.080. In certain implementations, the percentage of spectral power in the wavelength ranges of 480 nm<S 490 nm in comparison to the total energy from 320 nm<.lamda..ltoreq.800 nm in the second spectral power distribution can be between about 0.10 and about 0.30, between about 0.10 and about 0.15, between about 0.20 and about 0.25, between about 0.13 and about 0.24, about 0.10, about 0.11, about 0.12, about 0.13, about 0.14, about 0.15, about 0.016, about 0.17, about 0.18, about 0.19, about 0.20, about 0.21, about 0.22, about 0.23, about 0.24, about 0.25, about 0.26, about 0.27, about 0.28, about 0.29, or about 0.30. In some implementations, the percentage of spectral power in the wavelength ranges of 490 nm<S 500 nm in comparison to the total energy from 320 nm<.lamda..ltoreq.800 nm in the second spectral power distribution can be between about 0.25 and about 0.75, between about 0.25 and about 0.40, between about 0.55 and about 0.70, between about 0.30 and about 0.35, about 0.25, about 0.26, about 0.27, about 0.28, about 0.29, about 0.30, about 0.31, about 0.32, about 0.33, about 0.34, about 0.35, about 0.36, about 0.37, about 0.38, about 0.39, about 0.40, about 0.41, about 0.42, about 0.43, about 0.44, about 0.45, about 0.46, about 0.47, about 0.48, about 0.49, about 0.50, about 0.51, about 0.52, about 0.53, about 0.54, about 0.55, about 0.56, about 0.57, about 0.58, about 0.59, about 0.60, about 0.61, about 0.62, about 0.63, about 0.64, about 0.65, about 0.66, about 0.67, about 0.68, about 0.69, about 0.70, about 0.71, about 0.72, about 0.73, about 0.74, or about 0.75.
[0123] In further aspects of the present disclosure, the first and second circadian-stimulating energy characteristics can relate to spectral energy within particular wavelength ranges. In some implementations, spectral energy concentrations within particular wavelength ranges can lead to biological effects by providing photostimulation to intrinsically photosensitive retinal ganglion cells (ipRGCs), which express melanopsin, a photopigment that can respond to light directly, and can be associated with non-image-forming functions such as circadian photoentrainment and pupil-size control in addition to some image-forming functions. ipRGCs are sensitive to light at wavelengths between about 400 nm and about 600 nm, with a peak sensitivity and response to light with wavelengths around 480 nm to 490 nm. In certain implementations, the first circadian-stimulating energy characteristic and the second circadian-stimulating energy characteristic can be the percentage of the spectral power in the first spectral power distribution and the second spectral power distribution, respectively, between a first wavelength value and a second wavelength value, forming a particular wavelength range therein greater than the first wavelength value and less than or equal to the second wavelength value. In some implementations, the first wavelength value can be about 400 nm, about 410 nm, about 420 nm, about 430 nm, about 440 nm, about 450 nm, about 460 nm, about 470 nm, about 480 nm, about 490 nm, about 500 nm, about 510 nm, about 520 nm, about 530 nm, about 540 nm, about 550, about 560 nm, about 570 nm, about 580 nm, about 590 nm, or about 600 nm. In some implementations, the second wavelength value can be about 410 nm, about 420 nm, about 430 nm, about 440 nm, about 450 nm, about 460 nm, about 470 nm, about 480 nm, about 490 nm, about 500 nm, about 510 nm, about 520 nm, about 530 nm, about 540 nm, about 550, about 560 nm, about 570 nm, about 580 nm, about 590 nm, about 600 nm, or about 610 nm. In certain implementations, the first wavelength value can be 440 nm and the second wavelength value can be 490 nm, with the particular wavelength range being 440<.lamda..ltoreq.490 nm, as shown for values for the exemplary first and second lighting channels shown in Table 3, which shows the percent spectral energy in the range 440<.lamda..ltoreq.490 nm in comparison to the total spectral energy in the range 380<.lamda..ltoreq.780 nm. In further implementations, other first and second wavelength values can be selected for the first circadian-stimulating energy characteristic and the second circadian-stimulating energy characteristic of the percentages of the spectral power in the first spectral power distribution and the second spectral power distribution between the first and second wavelength values, including but not limited to wavelength ranges (in nm) from about 400 to about 410, about 410 to about 420, about 420 to about 430, about 430 to about 440, about 440 to about 450, about 450 to about 460, about 460 to about 470, about 470 to about 480, about 480 to about 490, about 490 to about 500, about 500 to about 510, about 510 to about 520, about 520 to about 530, about 530 to about 540, about 540 to about 550, or about 550 to about 560.
[0124] In certain implementations, one or more of the circadian-stimulating energy characteristics of the lighting systems can be EML values of the first, second, and third white light. In some aspects of the present disclosure, the lighting systems can provide a ratio of a first EML value of the first spectral power distribution to a second EML value of the second spectral power distribution. In some implementations, the ratio of the first EML value to the second EML value can be between about 2.0 and about 5.5, between about 3.0 and about 5.0, between about 2.8 and about 3.8, between about 2.6 and about 3.3, between about 4.0 and about 5.5, between about 4.5 and about 5.5, between about 5.5 and about 6.5, between about 6.5 and about 7.5, between about 7.5 and about 8.5, between about 8.5 and about 9.5, between about 2.0 and about 10.0, between about 3.0 and about 10.0, between about 4.0 and about 10.0, between about 5.0 and about 10.0, between about 6.0 and about 10.0, between about 7.0 and about 10.0, between about 8.0 and about 10.0, or between about 9.0 and about 10.0. In further implementations, the ratio of the first EML value to the second EML value can be about 2.0, about 2.1, about 2.2, about 2.3, about 2.4, about 2.5, about 2.6, about 2.7, about 2.8, about 2.9, about 3.0, about 3.1, about 3.2, about 3.3, about 3.4, about 3.5, about 3.6, about 3.7, about 3.8, about 3.9, about 4.0, about 4.1, about 4.2, about 4.3, about 4.4, about 4.5, about 4.6, about 4.7, about 4.8, about 4.9, about 5.0, about 5.1, about 5.2, about 5.3, about 5.4, about 5.5, about 5.6, about 5.7, about 5.8, about 5.9, about 6, about 6.1, about 6.2, about 6.3, about 6.4, about 6.5, about 6.6, about 6.7, about 6.8, about 6.9, about 7, about 7.1, about 7.2, about 7.3, about 7.4, about 7.5, about 7.6, about 7.7, about 7.8, about 7.9, about 8, about 8.1, about 8.2, about 8.3, about 8.4, about 8.5, about 8.6, about 8.7, about 8.8, about 8.9, about 9, about 9.1, about 9.2, about 9.3, about 9.4, about 9.5, about 9.6, about 9.7, about 9.8, about 9.9, or about 10.0.
[0125] In certain implementations, the first spectral power distribution has a first circadian-stimulating energy characteristic, and the second spectral power distribution has a second circadian-stimulating energy characteristic. In some implementations, the first circadian-stimulating energy characteristic can be a first percentage, the first percentage comprising the percentage of the spectral power between 380 nm and 780 nm in the first spectral power distribution between 440 nm and 490 nm. In certain implementations, the second circadian-stimulating energy characteristic can be a second percentage, the second percentage comprising the percentage of the spectral power between 380 nm and 780 nm in the second spectral power distribution between 440 nm and 490 nm. In certain implementations of the lighting systems of the present disclosure, the first percentage can be between about 15% and about 25%, between about 16% and about 22%, about 16%, about 17%, about 18%, about 19%, about 20%, about 21%, about 22%, about 23%, about 24%, or about 25%. In further implementations of the lighting systems of the present disclosure, the second percentage can be between about 0.9% and about 1.05%, between about 0.85% and about 0.95%, between about 0.85% and about 0.90%, between about 0.90% and about 0.95%, about 0.90%, about 0.91%, about 0.92%, about 0.93%, about 0.94%, about 0.95%, about 0.96%, about 0.97%, about 0.98%, about 0.99%, about 1.00%, about 1.01%, about 1.02%, about 1.03%, about 1.04%, or about 1.05%. In some implementations, the lighting systems can have a ratio of the first percentage to the second percentage of between about 13 and about 30, between about 15 and about 25, between about 20 and about 25, between about 20 and about 30, between about 18 and about 22, about 13, about 14, about 15, about 16, about 17, about 18, about 19, about 20, about 21, about 22, about 23, about 24, about 25, about 26, about 27, about 28, about 29, or about 30.
Types of User Interfaces and Control Systems for the Control of the Circadian Lighting
[0126] Lighting systems that may be used in a computer display system and/or circadian display system in accordance with the principles of the present inventions may be controlled over time to effect the person's circadian cycle throughout the day in different ways. The lighting systems may be automatically or manually adjusted. The lighting systems may be adjusted based on sensor data, activity data, social media data, etc.
[0127] In embodiments, as the display systems are installed in the environment of a lighting installation, networking features automatically engage upon powering up one or more the display systems, and the display systems may automatically commission themselves, such as by connecting to an overall control platform and/or to other display systems. Thus, the display systems in an installation may self-commission and self-configure to create a network connection between the display systems in the environment and a remote operator (such as in the cloud). The display systems may configure in a master/slave, ring, mesh, or peer-to-peer network, by which autonomous control features may be engaged in the environment. In embodiments, remote control features may be engaged using the network connection to the platform or other remote operators.
[0128] In embodiments, networked communication can be used among components in a deployed lighting installation that includes display systems. Once installed and commissioned, control of the lighting installation may be handed over to an operator of a platform, such as a building owner, occupant, landlord, tenant, or the like. In embodiments, handoff may include using identity and authentication features, such as using keys, passwords, or the like that allow operation of the lighting installation by permitted users. In embodiments, a remote-control interface of the platform may be used by an operator for remote operation of the lighting installation. The remote-control interface may use a lighting project data structure as a source of knowledge about the properties, configurations, control capabilities, and other elements of a lighting installation, so that the same platform used for the design of the lighting installation may be used to control the lighting installation. The remote-control interface may include operational guidance features, such as guiding users through the operation of a lighting installation.
[0129] In embodiments, an autonomous control system may be provided for a lighting installation that includes display systems of the present disclosure, by which the lighting installation may control various features of the lighting system, such as based on information collected locally in the environment, such as from one or more sensors. For example, the autonomous control system may automatically adjust control parameters for a light source, including but not limited to display systems, to achieve improved adherence to the overall specifications for a lighting installation, may adjust timing variables based on detected usage patterns in a space, may adjust lighting properties based on changes in a space (such as changes in colors paints, carpet and fabrics), and the like.
[0130] Under operation, the lighting installation may include an operational feedback system, configured to collect information about the lighting installation, which may include interfaces for soliciting and receiving user feedback (such as regarding satisfaction with the installation or indicating desired changes) and which may include a lighting installation sensor system, such as including light sensors, motion sensors, temperature sensors, and others to collect information about the actual lighting conditions in the environment, activities of occupants within the environment, and the like. Information collected by the lighting installation sensor system may be relayed to a validation system of the lighting platform, such as for validation that an installation is operating as designed, including by comparison of light properties at various locations in the environment with the specifications and requirements provided in the lighting design environment, such as reflected in the lighting project data structure. In embodiments, the variances from the specifications and requirements may be provided to the autonomous control system and/or the remote-control system, so that adjustments may be made, either autonomously or by a local or remote operator of the lighting installation, to enable adjustments (such as to colors, intensities, color temperatures, beam directions, and other factors), such as to cause the lighting installation to better meet the specifications and requirements. The operational feedback system may also capture feedback that leads to revisiting the lighting design in the lighting design environment, which may induce further iteration, resulting in changes to control parameters for the display systems, as well as automated ordering of additional or substitute display systems, with updated installation and operational guidance.
[0131] In embodiments, remote control may enable field programmable lighting systems, such as for transitional environments like museums (where art objects change regularly), stores (where merchandise shifts) and the like as well as for customizable environments (such as personalizing lighting in a hotel room according to a specification for a guest (which may include having the guest select an aesthetic filter) or personalized lighting for a workstation for an employee in an office setting. Such features may enable the lighting installation to change configurations (such as among different aesthetic filters) for multi-use environments, multi-tenant environments, and the like where lighting conditions may need to change substantially over time.
[0132] In embodiments, a lighting system may include navigation features, such as being associated with beacons, where the lighting system interacts with one or more devices to track users within a space. The display systems and their locations may be associated with a map, such as the map of the lighting space in the design environment. The map may be provided from the lighting design environment to one or more other location or navigation systems, such that locations of display systems may be used as known locations or points of interest within a space.
[0133] In embodiments, the lighting installation may be designed for an operation that is coordinated with one or more external systems, which may serve as inputs to the lighting installation, such as music, video and other entertainment content (such as to coordinate lighting with sound). Inputs may include voice control inputs, which may include systems for assessing tone or mood from vocal patterns, such as to adjust lighting based on the same.
[0134] In embodiments, inputs may also include inputs from wearable devices, such as enabling adjustment of lighting control parameters (autonomously or with remote or local control features) based on physiological factors, such as ones indicating health conditions, emotional states, moods, or the like. Inputs from wearable devices may be used in the operational feedback system, such as to measure reactions to lighting conditions (such as to enable automated adjustment of a lighting installation), as well as to measure impacts on mood, health conditions, energy, wellness factors, and the like.
[0135] In embodiments, the platform may be configured to change settings or parameters for a lighting installation (including but not limited to display systems of the present disclosure, such as by using a custom tuning system) based on a variety of real time data, with a view to having the lighting installation, including display systems included therein, best suit its environment in a dynamic way. In embodiments, data may be obtained that serves as an indicator of the emotional state or the stress level of an environment, and the lighting installation may respond accordingly to that state or stress level. In embodiments, data about the environment may be collected by a wearable device, such as a smartwatch, armband, or the like; for example, data may be collected on acceleration, location, ambient light characteristics, and heart rate, among other possibilities. In embodiments, the data may be provided to the platform for analysis, including using machine learning, such as to observe physiological indicators of stress, mood, or the like under given lighting conditions. The analysis may enable model-based controls (such as where a given mood or state of the users in a room are linked to a set of control parameters appropriate for that state). In embodiments, machine learning may be used; for example, over time, by variation of parameters for lighting objects and fixtures (such as color, color temperature, illumination patterns, lighting distributions, and many others), a machine learning system may, using feedback on outcomes based at least in part on physiological data and other data collected by a wearable device, select and/or promotion lighting installation parameters that improve various measures of stress, mood, satisfaction, or the like. This may occur in real time under control of a machine learning system based on the current conditions of users or the environment. In embodiments, data collected at least in part by a physiological monitor or wearable device may be used as an input to processing logic on a lighting object that changes lighting levels or other parameters to accommodate the `emotional state` of the users in an environment where the lighting object is located. In embodiments, there is memory that retains and manages function with no appreciable drain on the battery.
[0136] In embodiments, inputs may include systems that take data harvested from sensors in the lighting installation environment as well as sensors that reflect information about users, such as one or more of physiological sensors (including wearable devices, such as armbands, wrist bands, chest bands, glasses, clothing, and the like), sensors on various devices used by a user, ambient sensors, and the like. These may include sensing one or more of temperature, pressure, ambient lighting conditions, localized lighting conditions, lighting spectrum characteristics, humidity, UV light, sound, particles, pollutants, gases (e.g., oxygen, carbon dioxide, carbon monoxide and radon), radiation, location of objects or items, motion (e.g., speed, direction and/or acceleration). Where one or more wearable or physiological sensors are used, they may sense one or more of a person's temperature, blood pressure, heart rate, oxygen saturation, activity type, activity level, galvanic skin response, respiratory rate, cholesterol level (including HDL, LDL and triglyceride), hormone or adrenal levels (e.g., Cortisol, thyroid, adrenaline, melatonin, and others), histamine levels, immune system characteristics, blood alcohol levels, drug content, macro and micro nutrients, mood, emotional state, alertness, sleepiness, and the like.
[0137] In embodiments, the platform may connect to or integrate with data sources of information about users, such as including social networks (Facebook.TM., LinkedIn.TM., Twitter.TM., and the like, sources of medical records (23&Me.TM. and the like), productivity, collaboration and/or calendaring software (Google.TM., Outlook.TM., scheduling apps and the like), information about web browsing and/or shopping activity, activity on media streaming services (Netflix.TM., Spotify.TM., YouTube.TM., Pandora.TM. and the like), health record information and other sources of insight about the preferences or characteristics of users of the space of a lighting installation, including psychographic, demographic and other characteristics.
[0138] In embodiments, the platform may use information from sources that indicate patterns, such as patterns involving periods of time (daily patterns, weekly patterns, seasonal patterns, and the like), patterns involving cultural factors or norms (such as indicating usage patterns or preferences in different regions), patterns relating to personality and preferences, patterns relating to social groups (such as family and work group patterns), and the like. In embodiments, the platform may make use of the data harvested from various sources noted above to make recommendations and/or to optimize (such as automatically, under computer control) the design, ordering, fulfillment, deployment and/or operation of a lighting installation, such as based on understanding or prediction of user behavior. This may include recommendation or optimization relating to achieving optimal sleep time and duration, setting optimal mealtimes, satisfying natural light exposure requirements during the day, and maintaining tolerable artificial light exposure levels (such as during night time). In embodiments, the platform may anticipate user needs and optimize the lighting installation to enhance productivity, alertness, emotional well-being, satisfaction, safety and/or sleep. In further embodiments, the platform may control one or more display systems of the present disclosure in accordance with the user needs of the environment based on this information.
[0139] In embodiments, the platform may store a space utilization data structure that indicates, over time, how people use the space of the lighting installation, such as indicating what hallways are more trafficked, and the like. This may inform understanding of a space, such as indicating what is an entry, what is a passage, what is a workspace, and the like, which may be used to suggest changes or updates to a lighting design. In embodiments, sensors may be used to collect and read where people have been in the space, such as using one or more video cameras, IR sensors, microwave sensors. LIDAR, ultrasound or the like. In embodiments, the platform may collect and read what adjustments people have made, such as task lamp activation and other activities that indicate how a lighting fixture is used by an individual in a space. By way of these examples, aggregate usage information may be used to optimize a lighting design and adjust other lighting designs. Based on these factors, a space may be dynamically adjusted, and the lighting model for an installation may be updated to reflect the actual installation.
[0140] In embodiments, control capabilities of the display systems may include dynamic configuration of control parameters, such as providing a dimming curve for a light source, including but not limited to a display system of the present disclosure, that is customized to the preferences of a designer or other user. This may include a selection from one or more modes, such as ones described elsewhere herein that have desired effects on mood or aesthetic factors, that have desired health effects, that meet the functional requirements, or the like.
[0141] In order to truly achieve circadian action, prolonged exposure may be required, however, a melanopic flux may, in many embodiments, need to be at least 10:1 and in further embodiments, may need to be 20:1, 50:1, 100:1, or a greater ratio. It will be appreciated in light of the disclosure that most conventional systems simply adjust from a warm CCT to a cool CCT, which may only provide a 2:1 or 3:1 ratio of melanopic flux, which may not be enough to provide health benefits. In embodiments, the platform may include spectral tuning targets for display systems of the present disclosure that may optimize this ratio based on local installation environments. These targets, along with adjustments intensity of light (e.g., 4:1) may provide a higher ratio, such as a 10:1 ratio or greater, and thus provide greater melanopic flux ratios.
[0142] In a second mode and either in combination with the above mode or not, the platform may support an ability to shift the bias of light in a room. In embodiments, controlled variation of one or more display systems of the present disclosure in a lighting environment can contribute to generating a lighting bias typical of being outside.
[0143] In embodiments, various other programmable modes may be provided, such as display system settings where using different combinations of color light sources to achieve a given mixed color output may be optimized for efficacy, efficiency, color quality, health impact (e.g., circadian action), or to satisfy other requirements. In embodiments, the programmable modes may also include programmable dimming curves, color tuning curves, and the like (such as allowing various control interfaces, such as extra-low voltage (ELV) controllers or voltage-based dimmers to affect fixture colors, such as where a custom tuning curve provides a start point, an end point and a dimming and/or color tuning path in response to a level of dimming). In embodiments, programmable modes may use conventional tuning mechanisms, such as simple interpolation systems (which typically use two or three white color LEDs) are dimmable on a zero to ten-volt analog system, and have a second voltage-based input for adjusting the CCT of a fixture between warm and cool CCTs. The display systems as described herein can provide for tunable ranges of color points at various x, y coordinates on the 1931 CIE chromaticity diagram. Because of the wide range of potential white or non-white colors produced by the display systems, they may be controlled by the platform that may specify a particular x, y coordinate on the CIE diagram. Lighting control protocols like DMX.TM. and Dali 2.0.TM. may achieve this result.
[0144] In embodiments, a programmable color curve for an LED driver may be input, such as through an interface of the platform, or through a desktop software interface, a mobile phone, a tablet app, or the like, that enables a user to define a start and stop point to a color tuning curve and to specify how it will be controlled by a secondary input, such as a voltage-based input (e.g., a 0 to 10-volt input) to the fixture. These may include pre-defined curves, as well as the ability to set start, end, and waypoints to define custom curves. For example, an exemplary color curve can have a starting point around 8000K biased above the black body curve, with the color curve crossing the black body around 2700K, and finishing around 1800K below the black body curve. Similarly, another exemplary curve could be programmed such that the start was 4000K well above the black body, with the end being 4000K well below the black body. By way of these examples, any adjustment would be in hue only, not CCT. Further examples may include a curve that never produces a white color, such as starting in the purple and finishing in orange. In any of these cases, these curves may be programmed into display systems via the interface of the platform, the desktop, mobile phone or tablet. In embodiments, the curves may be designed, saved, and then activated, such as using the secondary (supplemental) 0 to 10-volt input.
[0145] In embodiments, a three-channel warm dim mode may be used, such as that described more fully in U.S. Provisional Patent Application No. 62/712,182 filed Jul. 30, 2018, which is incorporated herein in its entirety for all purposes, for target applications where the "fully on" CCT falls between 3000K and 2500K. By way of these examples, as the fixture dims (via ELV control or in response to the 0 to 10-volt input) the CCT may be gradually decreased to between 2500K and 1800K. In certain embodiments, the hue adjustment may all occur below the black body curve. Alternative embodiments may use a cyan channel as described elsewhere herein, either long-blue-pumped cyan or short-blue-pumped cyan, and a red channel as described elsewhere herein, plus a 4000K white channel as described elsewhere herein to achieve a warm dimming mode that allows for adjustment both above and below the black body curve. In some embodiments of the three-channel warm dim mode, the white channel can have a color point within a 7-step MacAdam ellipse around any point on the black body locus having a correlated color temperature between about 3500K and about 6500K.
[0146] In certain embodiments, the display systems of the present disclosure can include a 4-channel color system as described elsewhere herein and in U.S. Provisional Patent Application No. 62/757,672 filed Nov. 8, 2018, and U.S. Provisional Application No. 62/712,191 filed Jul. 30, 2018, the contents of which are incorporated by reference herein in their entirety as if fully set forth herein, includes 3000K to 1800K CCT white color points within its range, a programmable mode may be included within the driver that adjusts color with the dimming percentage as well. In some aspects, this may be similar to a conventional control mode, except that the color control would not be on the secondary 0 to 10-volt channel, but may be activated through the primary 0 to 10-volt input channel or ELV controller. In embodiments, the "starting" color point may be the one when the fixture was "fully on." In embodiments, the "ending" color point may be the one where the fixture is maximally dimmed. It is thus possible to make full range color change, such as purple to orange, which is slaved to the 0 to 10-volt or ELV dimming signal.
[0147] In embodiments, an optimized mode may be provided. With a 4-channel color system, there are many ways to create a single x-y point on the CIE diagram. In embodiments, the maximally efficient mode may typically be one that uses the colors that have x, y coordinates closest to the target x, y coordinate. But for best color quality, utilizing a fourth channel (and thereby requiring more light from the color in the opposite "corner") may help provide a desired spectral power distribution. For the maximum melatonin suppression (for systems hoping to mimic circadian lighting), a higher cyan channel content may be required for CCTs of 3500K and above and minimizing cyan and blue content below 3500K. It will be appreciated in light of the disclosure that conventional systems either require expert users to understand the color balances necessary to achieve these effects (who then implement the color balances channel-by-channel) or are designed for maximum efficiency with color quality as a byproduct.
[0148] In embodiments, a digital power system is provided herein (including firmware-driven power conversion and LED current control) that controls a multichannel color system, such as a 4-channel color system, and allows for the inclusion of "modes" which may calculate the correct color balance between the various channels to provide optimized outputs. In embodiments, optimization may occur around one or more of efficacy, color quality, circadian effects, and other factors. Other modes are possible, such as optimizing for contrast, particular display requirements. It will be appreciated in light of the disclosure that this is not an exhaustive list but is representative of potential modes that could be engaged through an interface of the platform (or of a mobile, tablet or desktop application) where a color tuning curve may be specified, such that the curve is used to specify an interface between a controller and the Digital PSU in a display system. In embodiments, these modes may account for actual measured colors for each display system and calculate the correct balance of for the chosen modes, such as based on algorithms loaded into the Digital PSU microprocessor.
[0149] In embodiments, machine learning may be used, such as based on various feedback measures, such as relating to mood (stated by the user or measured by one or more sensors), noise levels (such as indicating successful utilization of a space based on a desired level of noise), returns on investment (such as where display systems are intended to promote retail merchandise), reported pain levels, measured health levels, performance levels of users (including fitness, wellness, and educational performance, among others), sleep levels, vitamin D levels, melatonin levels, and many others. In embodiments, the lighting installations including the display systems may be operated or controlled based on external information, such as based on seasonal lighting conditions, weather, climate, collective mood indicators (such as based on stock market data, news feeds, or sentiment indices), analyses of social network data, and the like. This may include controlling a system to reflect, or influence, the mood of occupants.
EXAMPLES
[0150] General Simulation Method for Examples 1-13 and 35.
[0151] Display systems having three, four, five, and six LED-string-driven lighting channels with particular color points were simulated. For each device, LED strings and recipient luminophoric mediums with particular emissions were selected, and then white light rendering capabilities were calculated for a select number of representative points on or near the Planckian locus between about 1800K and 10000K. Ra, R9, R13, R15, LER, Rf, Rg, CLA, CS, EML, BLH factor, CAF, CER, COI, and circadian performance values were calculated at each representative point.
[0152] The calculations were performed with Scilab (Scilab Enterprises, Versailles, France), LightTools (Synopsis, Inc., Mountain View, Calif.), and custom software created using Python (Python Software Foundation, Beaverton, Oreg.). Each LED string was simulated with an LED emission spectrum and excitation and emission spectra of luminophoric medium(s). For luminophoric mediums comprising phosphors, the simulations also included the absorption spectrum and particle size of phosphor particles. The LED strings generating combined emissions within blue, short-blue-pumped cyan, and red color regions were prepared using spectra of a LUXEON Z Color Line royal blue LEDs (product code LXZ1-PR01) of color bin codes 3, 4, 5, or 6, one or more LUXEON Z Color Line blue LEDs (LXZ1-PB01) of color bin code 1 or 2, or one or more LUXEON royal blue LEDs (product code LXML-PR01 and LXML-PR02) of color bins 3, 4, 5, or 6 (Lumileds Holding B.V., Amsterdam, Netherlands). The LED strings generating combined emissions with color points within the long-blue-pumped cyan regions were prepared using spectra of LUXEON Rebel Blue LEDs (LXML-PB01, LXML-PB02) of color bins 1, 2, 3, 4, or 5, which have peak wavelengths ranging from 460 nm to 485 nm, or LUXEON Rebel Cyan LEDs (LXML-PE01) of color bins 1, 2, 3, 4, or 5, which have peak wavelengths raving from 460 nm to 485 nm. Similar LEDs from other manufacturers such as OSRAM GmbH and Cree, Inc. could also be used. The LED strings generating combined emissions with color points within the yellow and violet regions were simulated using spectra of LEDs having peak wavelengths of between about 380 nm and about 420 nm, such as one or more 410 nm peak wavelength violet LEDs, one or more LUXEON Z UV LEDs (product codes LHUV-0380-, LHUV-0385-, LHUV-0390-, LHUV-0395-, LHUV-0400-, LHUV-0405-, LHUV-0410-, LHUV-0415-, LHUV-0420-,) (Lumileds Holding B.V., Amsterdam, Netherlands), one or more LUXEON UV FC LEDs (product codes LxF3-U410) (Lumileds Holding B.V., Amsterdam, Netherlands), one or more LUXEON UV U LEDs (product code LHUV-0415-) (Lumileds Holding B.V., Amsterdam, Netherlands), for example.
[0153] The emission, excitation and absorption curves are available from commercially available phosphor manufacturers such as Mitsubishi Chemical Holdings Corporation (Tokyo, Japan), Intematix Corporation (Fremont, Calif.), EMD Performance Materials of Merck KGaA (Darmstadt, Germany), and PhosphorTech Corporation (Kennesaw, Ga.). The luminophoric mediums used in the LED strings were combinations of one or more of Compositions A, B, and D and one or more of Compositions C, E, and F as described more fully elsewhere herein. Those of skill in the art appreciate that various combinations of LEDs and luminescent blends can be combined to generate combined emissions with desired color points on the 1931 CIE chromaticity diagram and the desired spectral power distributions.
Example 1
[0154] A display system was simulated having four LED strings. A first LED string is driven by a blue LED having peak emission wavelength of approximately 450 nm to approximately 455 nm, utilizes a recipient luminophoric medium, and generates a combined emission of a blue channel having the color point and characteristics of Blue Channel 1 as described above and shown in Tables 3-5. A second LED string is driven by a blue LED having peak emission wavelength of approximately 450 nm to approximately 455 nm, utilizes a recipient luminophoric medium, and generates a combined emission of a red channel having the color point and characteristics of Red Channel 1 as described above and shown in Tables 3-5 and 7-9. A third LED string is driven by a blue LED having peak emission wavelength of approximately 450 nm to approximately 455 nm, utilizes a recipient luminophoric medium, and generates a combined emission of a short-blue-pumped cyan color channel having the color point and characteristics of Short-Blue-Pumped Cyan Channel 1 as described above and shown in Tables 3-5. A fourth LED string is driven by a cyan LED having peak emission wavelength of approximately 505 nm, utilizes a recipient luminophoric medium, and generates a combined emission of a long-blue-pumped cyan channel having the color point and characteristics of Long-Blue-Pumped Cyan Channel 1 as described above and shown in Tables 3-5.
[0155] Tables 16-19 shows light-rendering characteristics of the device for a representative selection of white light color points near the Planckian locus. Table 18 shows data for white light color points generated using only the first, second, and third LED strings in high-CRI mode. Table 16 shows data for white light color points generated using all four LED strings in highest-CRI mode. Table 17 shows data for white light color points generated using only the first, second, and fourth LED strings in high-EML mode. Table 19 show performance comparison between white light color points generated at similar approximate CCT values under high-EML mode and high-CRI mode.
Example 2
[0156] Further simulations were performed to optimize the outputs of the display system of Example 1. Signal strength ratios for the channels were calculated to generate 100 lumen total flux output white light at each CCT point. The relative lumen outputs for each of the channels is shown, along with the light-rendering characteristics, in Tables 20-22.
Example 3
[0157] A display system was simulated having four LED strings. A first LED string is driven by a blue LED having peak emission wavelength of approximately 450 nm to approximately 455 nm, utilizes a recipient luminophoric medium, and generates a combined emission of a blue channel having the color point and characteristics of Blue Channel 1 as described above and shown in Tables 3-5. A second LED string is driven by a blue LED having peak emission wavelength of approximately 450 nm to approximately 455 nm, utilizes a recipient luminophoric medium, and generates a combined emission of a red channel having the color point and characteristics of Red Channel 1 as described above and shown in Tables 3-5 and 7-9. A fifth LED string is driven by a violet LED having peak emission wavelength of about 380 nm, utilizes a recipient luminophoric medium, and generates a combined emission of a yellow color channel having the color point and characteristics of Yellow Channel 1 as described above and shown in Tables 5 and 13-15. A sixth LED string is driven by a violet LED having peak emission wavelength of about 380 nm, utilizes a recipient luminophoric medium, and generates a combined emission of a violet channel having the color point and characteristics of Violet Channel 1 as described above and shown in Tables 5 and 10-12.
[0158] Tables 23-24 shows light-rendering characteristics of the device for a representative selection of white light color points near the Planckian locus. Table 23 shows data for white light color points generated using the first, second, fifth, and sixth LED strings, i.e. the blue, red, yellow, and violet channels, in low-EML mode. Table 24 shows data for white light color points generated using the second, fifth, and sixth LED strings, i.e. the red, yellow, and violet channels, in very-low-EML mode.
Example 4
[0159] A display system was simulated having four LED strings. A first LED string is driven by a blue LED having peak emission wavelength of approximately 450 nm to approximately 455 nm, utilizes a recipient luminophoric medium, and generates a combined emission of a blue channel having the color point and characteristics of Blue Channel 1 as described above and shown in Tables 3-5. A second LED string is driven by a blue LED having peak emission wavelength of approximately 450 nm to approximately 455 nm, utilizes a recipient luminophoric medium, and generates a combined emission of a red channel having the color point and characteristics of Red Channel 1 as described above and shown in Tables 3-5 and 7-9. A fifth LED string is driven by a violet LED having peak emission wavelength of about 400 nm, utilizes a recipient luminophoric medium, and generates a combined emission of a yellow color channel having the color point and characteristics of Yellow Channel 2 as described above and shown in Tables 5 and 13-15. A sixth LED string is driven by a violet LED having peak emission wavelength of about 400 nm, utilizes a recipient luminophoric medium, and generates a combined emission of a violet channel having the color point and characteristics of Violet Channel 2 as described above and shown in Tables 5 and 10-12.
[0160] Tables 25-26 shows light-rendering characteristics of the device for a representative selection of white light color points near the Planckian locus. Table 25 shows data for white light color points generated using the first, second, fifth, and sixth LED strings, i.e. the blue, red, yellow, and violet channels, in low-EML mode. Table 26 shows data for white light color points generated using the second, fifth, and sixth LED strings, i.e. the red, yellow, and violet channels, in very-low-EML mode.
Example 5
[0161] A display system was simulated having four LED strings. A first LED string is driven by a blue LED having peak emission wavelength of approximately 450 nm to approximately 455 nm, utilizes a recipient luminophoric medium, and generates a combined emission of a blue channel having the color point and characteristics of Blue Channel 1 as described above and shown in Tables 3-5. A second LED string is driven by a blue LED having peak emission wavelength of approximately 450 nm to approximately 455 nm, utilizes a recipient luminophoric medium, and generates a combined emission of a red channel having the color point and characteristics of Red Channel 1 as described above and shown in Tables 3-5 and 7-9. A fifth LED string is driven by a violet LED having peak emission wavelength of about 410 nm, utilizes a recipient luminophoric medium, and generates a combined emission of a yellow color channel having the color point and characteristics of Yellow Channel 3 as described above and shown in Tables 5 and 13-15. A sixth LED string is driven by a violet LED having peak emission wavelength of about 410 nm, utilizes a recipient luminophoric medium, and generates a combined emission of a violet channel having the color point and characteristics of Violet Channel 3 as described above and shown in Tables 5 and 10-12.
[0162] Tables 27-28 shows light-rendering characteristics of the device for a representative selection of white light color points near the Planckian locus. Table 27 shows data for white light color points generated using the first, second, fifth, and sixth LED strings, i.e. the blue, red, yellow, and violet channels, in low-EML mode. Table 28 shows data for white light color points generated using the second, fifth, and sixth LED strings, i.e. the red, yellow, and violet channels, in very-low-EML mode.
Example 6
[0163] A display system was simulated having four LED strings. A first LED string is driven by a blue LED having peak emission wavelength of approximately 450 nm to approximately 455 nm, utilizes a recipient luminophoric medium, and generates a combined emission of a blue channel having the color point and characteristics of Blue Channel 1 as described above and shown in Tables 3-5. A second LED string is driven by a blue LED having peak emission wavelength of approximately 450 nm to approximately 455 nm, utilizes a recipient luminophoric medium, and generates a combined emission of a red channel having the color point and characteristics of Red Channel 1 as described above and shown in Tables 3-5 and 7-9. A fifth LED string is driven by a violet LED having peak emission wavelength of about 420 nm, utilizes a recipient luminophoric medium, and generates a combined emission of a yellow color channel having the color point and characteristics of Yellow Channel 4 as described above and shown in Tables 5 and 13-15. A sixth LED string is driven by a violet LED having peak emission wavelength of about 420 nm, utilizes a recipient luminophoric medium, and generates a combined emission of a violet channel having the color point and characteristics of Violet Channel 4 as described above and shown in Tables 5 and 10-12.
[0164] Table 29 shows light-rendering characteristics of the device for a representative selection of white light color points near the Planckian locus. Table 29 shows data for white light color points generated using the second, fifth, and sixth LED strings, i.e. the red, yellow, and violet channels, in very-low-EML mode.
Example 7
[0165] A display system was simulated having six lighting channels. The six lighting channels are a combination of the lighting channels of Example 1 and Example 3: Blue Channel 1, Red Channel 1, Short-Blue-Pumped Cyan Channel 1, Long-Blue-Pumped Cyan Channel 1, Yellow Channel 1, and Violet Channel 1. As shown above with reference to Examples 1 and 3, the device can be operated in various operating modes with different combinations of lighting channels. Tables 30-31 show EML and CS values at various nominal CCT values under different operating modes and the % changes that can be achieved by switching between operating modes at the same nominal CCT.
Example 8
[0166] A display system was simulated having six lighting channels. The six lighting channels are a combination of the lighting channels of Example 1 and Example 4: Blue Channel 1, Red Channel 1, Short-Blue-Pumped Cyan Channel 1, Long-Blue-Pumped Cyan Channel 1, Yellow Channel 2, and Violet Channel 2. As shown above with reference to Examples 1 and 4, the device can be operated in various operating modes with different combinations of lighting channels. Tables 32-33 show EML and CS values at various nominal CCT values under different operating modes and the % changes that can be achieved by switching between operating modes at the same nominal CCT.
Example 9
[0167] A display system was simulated having six lighting channels. The six lighting channels are a combination of the lighting channels of Example 1 and Example 5: Blue Channel 1, Red Channel 1, Short-Blue-Pumped Cyan Channel 1, Long-Blue-Pumped Cyan Channel 1, Yellow Channel 3, and Violet Channel 3. As shown above with reference to Examples 1 and 5, the device can be operated in various operating modes with different combinations of lighting channels. Tables 34-35 show EML and CS values at various nominal CCT values under different operating modes and the % changes that can be achieved by switching between operating modes at the same nominal CCT.
Example 10
[0168] A display system was simulated having six lighting channels. The six lighting channels are a combination of the lighting channels of Example 1 and Example 6: Blue Channel 1, Red Channel 1, Short-Blue-Pumped Cyan Channel 1, Long-Blue-Pumped Cyan Channel 1, Yellow Channel 4, and Violet Channel 4. As shown above with reference to Examples 1 and 6, the device can be operated in various operating modes with different combinations of lighting channels. Tables 36-37 show EML and CS values at various nominal CCT values under different operating modes and the % changes that can be achieved by switching between operating modes at the same nominal CCT.
Example 11
[0169] In some implementations, the display systems of the present disclosure can comprise three lighting channels as described elsewhere herein. In certain implementations, the three lighting channels comprise a red lighting channel, a yellow lighting channel, and a violet lighting channel. The display systems can be operated in a very-low-EML operating mode in which the red lighting channel, the yellow lighting channel, and the violet lighting channel are used. The display systems can further comprise a control system configured to control the relative intensities of light generated in the red lighting channel, the yellow lighting channel, and the violet lighting channel in order to generate white light at a plurality of points near the Planckian locus between about 4000K and about 1400K CCT.
Example 12
[0170] In some implementations, the display systems of the present disclosure can comprise four lighting channels as described elsewhere herein. In certain implementations, the four lighting channels comprise a red lighting channel, a yellow lighting channel, a violet lighting channel, and a blue lighting channel. In some implementations, the display systems can be operated in a very-low-EML operating mode in which the red lighting channel, the yellow lighting channel, and the violet lighting channel are used. In further implementations, the display systems can be operated in a low-EML operating mode in which the blue lighting channel, the red lighting channel, the yellow lighting channel, and the violet lighting channel are used. In certain implementations, the display systems can transition between the low-EML and the very-low-EML operating modes in one or both directions while the display systems are providing white light along a path of color points near the Planckian locus. In further implementations, the display systems can transition between the low-EML and very-low-EML operating modes in one or both directions while the display systems are changing the CCT of the white light along the path of color points near the Planckian locus. In some implementations the low-EML operating mode can be used in generating white light near the Planckian locus with CCT values between about 10000K and about 1800K. In further implementations the very-low-EML operating mode can be used in generating white light near the Planckian locus with CCT values between about 4000K and about 1400K.
Example 13
[0171] In some implementations, the display systems of the present disclosure can comprise five lighting channels as described elsewhere herein. In certain implementations, the five lighting channels comprise a red lighting channel, a yellow lighting channel, a violet lighting channel, a blue lighting channel, and a long-blue-pumped cyan lighting channel. In some implementations, the display systems can be operated in a very-low-EML operating mode in which the red lighting channel, the yellow lighting channel, and the violet lighting channel are used. In further implementations, the display systems can be operated in a low-EML operating mode in which the blue lighting channel, the red lighting channel, the yellow lighting channel, and the violet lighting channel are used. In yet further implementations, the display systems can be operated in a high-EML operating mode in which the blue lighting channel, the red lighting channel, and the long-blue-pumped cyan lighting channel are used. In certain implementations, the display systems can transition among two or more of the low-EML, the very-low-EML, and high-EML operating modes while the display systems are providing white light along a path of color points near the Planckian locus. In further implementations, the display systems can transition among two or more of the low-EML, the very-low-EML, and high-EML operating modes while the display systems are changing the CCT of the white light along the path of color points near the Planckian locus. In some implementations the low-EML operating mode can be used in generating white light near the Planckian locus with CCT values between about 10000K and about 1800K. In further implementations the very-low-EML operating mode can be used in generating white light near the Planckian locus with CCT values between about 4000K and about 1400K. In yet further implementations, the high-EML operating mode can be used in generating white light near the Planckian locus with CCT values between about 10000K and about 1800K.
General Simulation Method for Examples 14-34.
[0172] Exemplary first and second lighting channels, and lighting systems having pairs of first and second lighting channels, were simulated. The simulated lighting systems can be used to provide one or more white light sources for a backlighting system in the display systems of the present disclosure. For each lighting channel, LED strings and recipient luminophoric mediums with particular emissions were selected, and then spectral power distributions and various light rendering characteristics and circadian-stimulating energy characteristics were calculated. Ra, R9, R13, R15, LER, Rf, Rg, CLA, CS, EML, BLH factor, CAF, CER, COI, GAI, GAI15, GAIBB, and circadian-stimulating energy characteristics were calculated at each representative point. Characteristics and aspects of the spectral power distributions are shown in Tables 3-12 and FIGS. 9-16.
[0173] The calculations were performed with Scilab (Scilab Enterprises, Versailles, France), LightTools (Synopsis, Inc., Mountain View, Calif.), and custom software created using Python (Python Software Foundation, Beaverton, Oreg.). Each lighting channel was simulated with an LED emission spectrum and excitation and emission spectra of luminophoric medium(s). The luminophoric mediums can comprise luminescent compositions of phosphors, quantum dots, or combinations thereof, with simulations performed based on absorption/emission spectrums and particle sizes. The exemplary first lighting channels were simulated using spectra of LEDs having peak wavelengths of between about 440 nm and about 510 nm, such as a 450 nm peak wavelength blue LED, one or more LUXEON Z Color Line royal blue LEDs (product code LXZ1-PR01) of color bin codes 3, 4, 5, or 6 (Lumileds Holding B.V., Amsterdam, Netherlands), one or more LUXEON Z Color Line blue LEDs (LXZ1-PB01) of color bin code 1 or 2 (Lumileds Holding B.V., Amsterdam, Netherlands), one or more LUXEON royal blue LEDs (product code LXML-PR01 and LXML-PR02) of color bins 3, 4, 5, or 6 (Lumileds Holding B.V., Amsterdam, Netherlands), one or more LUXEON Rebel Blue LEDs (LXML-PB01, LXML-PB02) of color bins 1, 2, 3, 4, or 5 (Lumileds Holding B.V., Amsterdam, Netherlands), or one or more LUXEON Rebel Cyan LEDs (LXML-PE01) of color bins 1, 2, 3, 4, or 5 (Lumileds Holding B.V., Amsterdam, Netherlands), for example. The exemplary second lighting channels were simulated using spectra of LEDs having peak wavelengths of between about 380 nm and about 420 nm, such as one or more 410 nm peak wavelength violet LEDs, one or more LUXEON Z UV LEDs (product Codes LHUV-0380-, LHUV-0385-, LHUV-0390-, LHUV-0395-, LHUV-0400-, LHUV-0405-, LHUV-0410-, LHUV-0415-, LHUV-0420-,) (Lumileds Holding B.V., Amsterdam, Netherlands), one or more LUXEON UV FC leds (product codes LxF3-U410) (Lumileds Holding B.V., Amsterdam, Netherlands), one or more LUXEON UV U Leds (product code LHUV-0415-) (Lumileds Holding B.V., Amsterdam, Netherlands), For example. Similar leds from other manufacturers such as OSRAM gmbh and Cree, Inc. that provide a saturated output at the desired peak wavelengths could also be used.
[0174] The emission, excitation and absorption curves for phosphors and quantum dots are available from commercial manufacturers such as Mitsubishi Chemical Holdings Corporation (Tokyo, Japan), Intematix Corporation (Fremont, Calif.), EMD Performance Materials of Merck KGaA (Darmstadt, Germany), and PhosphorTech Corporation (Kennesaw, Ga.). The luminophoric mediums used in the first and second lighting channels were simulated as combinations of one or more of luminescent compositions as described more fully elsewhere herein. Those of skill in the art appreciate that various combinations of LEDs and luminescent blends can be combined to generate combined emissions with desired color points on the 1931 CIE chromaticity diagram and the desired spectral power distributions.
Example 14
[0175] A lighting system was simulated having a first lighting channel having the characteristics shown as "4000K Ch1" in Tables 44, 46, 48, 50, 52, 53, and 56 and a second lighting channel having the characteristics shown as "2400K Ch1" in Tables 44, 45, 47, 49, 51, 53, and 56 and in FIG. 8. The values for EML slope and EML ratio for this pair of first and second lighting channels are shown in Tables 54 and 55. The first lighting channel can comprise an LED having a 450 nm peak wavelength and an associated luminophoric medium having one or more phosphors, quantum dots, or a mixture thereof. The second lighting channel can comprise an LED having a 410 nm peak wavelength and an associated luminophoric medium having one or more phosphors, quantum dots, or a mixture thereof.
Example 15
[0176] A lighting system was simulated having a first lighting channel having the characteristics shown as "4000K Ch2" in Tables 44, 46, 48, 50, 52, 53, and 56 and in FIG. 9, and a second lighting channel having the characteristics shown as "2400K Ch1" in Tables 44, 45, 47, 49, 51, 53, and 56 and in FIG. 8. The values for EML slope and EML ratio for this pair of first and second lighting channels are shown in Tables 54 and 55. The first lighting channel can comprise an LED having a 450 nm peak wavelength and an associated luminophoric medium having one or more phosphors, quantum dots, or a mixture thereof. The second lighting channel can comprise an LED having a 410 nm peak wavelength and an associated luminophoric medium having one or more phosphors, quantum dots, or a mixture thereof.
Example 16
[0177] A lighting system was simulated having a first lighting channel having the characteristics shown as "4000K Ch3" in Tables 44, 46, 48, 50, 52, 53, and 56 and in FIG. 10, and a second lighting channel having the characteristics shown as "2400K Ch1" in Tables 44, 45, 47, 49, 51, 53, and 56 and in FIG. 8. The values for EML slope and EML ratio for this pair of first and second lighting channels are shown in Tables 54 and 55. The first lighting channel can comprise an LED having a 450 nm peak wavelength and an associated luminophoric medium having one or more phosphors, quantum dots, or a mixture thereof. The second lighting channel can comprise an LED having a 410 nm peak wavelength and an associated luminophoric medium having one or more phosphors, quantum dots, or a mixture thereof.
Example 17
[0178] A lighting system was simulated having a first lighting channel having the characteristics shown as "4000K Ch4" in Tables 44, 46, 48, 50, 52, 53, and 56 and in FIG. 5, and a second lighting channel having the characteristics shown as "2400K Ch1" in Tables 44, 45, 47, 49, 51, 53, and 56 and in FIG. 8. The values for EML slope and EML ratio for this pair of first and second lighting channels are shown in Tables 54 and 55. The first lighting channel can comprise an LED having a 450 nm peak wavelength and an associated luminophoric medium having one or more phosphors, quantum dots, or a mixture thereof. The second lighting channel can comprise an LED having a 410 nm peak wavelength and an associated luminophoric medium having one or more phosphors, quantum dots, or a mixture thereof.
Example 18
[0179] A lighting system was simulated having a first lighting channel having the characteristics shown as "5000K Ch1" in Tables 44, 46, 48, 50, 52, 53, and 56 and in FIG. 12, and a second lighting channel having the characteristics shown as "2400K Ch1" in Tables 44, 45, 47, 49, 51, 53, and 56 and in FIG. 8. The values for EML slope and EML ratio for this pair of first and second lighting channels are shown in Tables 54 and 55. The first lighting channel can comprise an LED having a 450 nm peak wavelength and an associated luminophoric medium having one or more phosphors, quantum dots, or a mixture thereof. The second lighting channel can comprise an LED having a 410 nm peak wavelength and an associated luminophoric medium having one or more phosphors, quantum dots, or a mixture thereof.
Example 19
[0180] A lighting system was simulated having a first lighting channel having the characteristics shown as "4000K Ch1" in Tables 44, 46, 48, 50, 52, 53, and 56 and a second lighting channel having the characteristics shown as "2400K Ch2" in Tables 44, 45, 47, 49, 51, 53, and 56 and in FIG. 7. The values for EML slope and EML ratio for this pair of first and second lighting channels are shown in Tables 54 and 55. The first lighting channel can comprise an LED having a 450 nm peak wavelength and an associated luminophoric medium having one or more phosphors, quantum dots, or a mixture thereof. The second lighting channel can comprise an LED having a 410 nm peak wavelength and an associated luminophoric medium having one or more phosphors, quantum dots, or a mixture thereof.
Example 20
[0181] A lighting system was simulated having a first lighting channel having the characteristics shown as "4000K Ch2" in Tables 44, 46, 48, 50, 52, 53, and 56 and in FIG. 9, and a second lighting channel having the characteristics shown as "2400K Ch2" in Tables 44, 45, 47, 49, 51, 53, and 56 and in FIG. 7. The values for EML slope and EML ratio for this pair of first and second lighting channels are shown in Tables 54 and 55. The first lighting channel can comprise an LED having a 450 nm peak wavelength and an associated luminophoric medium having one or more phosphors, quantum dots, or a mixture thereof. The second lighting channel can comprise an LED having a 410 nm peak wavelength and an associated luminophoric medium having one or more phosphors, quantum dots, or a mixture thereof.
Example 21
[0182] A lighting system was simulated having a first lighting channel having the characteristics shown as "4000K Ch3" in Tables 44, 46, 48, 50, 52, 53, and 56 and in FIG. 10, and a second lighting channel having the characteristics shown as "2400K Ch2" in Tables 44, 45, 47, 49, 51, 53, and 56 and in FIG. 7. The values for EML slope and EML ratio for this pair of first and second lighting channels are shown in Tables 54 and 55. The first lighting channel can comprise an LED having a 450 nm peak wavelength and an associated luminophoric medium having one or more phosphors, quantum dots, or a mixture thereof. The second lighting channel can comprise an LED having a 410 nm peak wavelength and an associated luminophoric medium having one or more phosphors, quantum dots, or a mixture thereof.
Example 22
[0183] A lighting system was simulated having a first lighting channel having the characteristics shown as "4000K Ch4" in Tables 44, 46, 48, 50, 52, 53, and 56 and in FIG. 5, and a second lighting channel having the characteristics shown as "2400K Ch2" in Tables 44, 45, 47, 49, 51, 53, and 56 and in FIG. 7. The values for EML slope and EML ratio for this pair of first and second lighting channels are shown in Tables 54 and 55. The first lighting channel can comprise an LED having a 450 nm peak wavelength and an associated luminophoric medium having one or more phosphors, quantum dots, or a mixture thereof. The second lighting channel can comprise an LED having a 410 nm peak wavelength and an associated luminophoric medium having one or more phosphors, quantum dots, or a mixture thereof.
Example 23
[0184] A lighting system was simulated having a first lighting channel having the characteristics shown as "5000K Ch1" in Tables 44, 46, 48, 50, 52, 53, and 56 and in FIG. 12, and a second lighting channel having the characteristics shown as "2400K Ch2" in Tables 44, 45, 47, 49, 51, 53, and 56 and in FIG. 7. The values for EML slope and EML ratio for this pair of first and second lighting channels are shown in Tables 54 and 55. The first lighting channel can comprise an LED having a 450 nm peak wavelength and an associated luminophoric medium having one or more phosphors, quantum dots, or a mixture thereof. The second lighting channel can comprise an LED having a 410 nm peak wavelength and an associated luminophoric medium having one or more phosphors, quantum dots, or a mixture thereof.
Example 24
[0185] A lighting system was simulated having a first lighting channel having the characteristics shown as "4000K Ch1" in Tables 44, 46, 48, 50, 52, 53, and 56 and a second lighting channel having the characteristics shown as "2400K Ch3" in Tables 44, 45, 47, 49, 51, 53, and 56 and in FIG. 6. The values for EML slope and EML ratio for this pair of first and second lighting channels are shown in Tables 54 and 55. The first lighting channel can comprise an LED having a 450 nm peak wavelength and an associated luminophoric medium having one or more phosphors, quantum dots, or a mixture thereof. The second lighting channel can comprise an LED having a 410 nm peak wavelength and an associated luminophoric medium having one or more phosphors, quantum dots, or a mixture thereof.
Example 25
[0186] A lighting system was simulated having a first lighting channel having the characteristics shown as "4000K Ch2" in Tables 44, 46, 48, 50, 52, 53, and 56 and in FIG. 9, and a second lighting channel having the characteristics shown as "2400K Ch3" in Tables 44, 45, 47, 49, 51, 53, and 56 and in FIG. 6. The values for EML slope and EML ratio for this pair of first and second lighting channels are shown in Tables 54 and 55. The first lighting channel can comprise an LED having a 450 nm peak wavelength and an associated luminophoric medium having one or more phosphors, quantum dots, or a mixture thereof. The second lighting channel can comprise an LED having a 410 nm peak wavelength and an associated luminophoric medium having one or more phosphors, quantum dots, or a mixture thereof.
Example 26
[0187] A lighting system was simulated having a first lighting channel having the characteristics shown as "4000K Ch3" in Tables 44, 46, 48, 50, 52, 53, and 56 and in FIG. 10, and a second lighting channel having the characteristics shown as "2400K Ch3" in Tables 44, 45, 47, 49, 51, 53, and 56 and in FIG. 6. The values for EML slope and EML ratio for this pair of first and second lighting channels are shown in Tables 54 and 55. The first lighting channel can comprise an LED having a 450 nm peak wavelength and an associated luminophoric medium having one or more phosphors, quantum dots, or a mixture thereof. The second lighting channel can comprise an LED having a 410 nm peak wavelength and an associated luminophoric medium having one or more phosphors, quantum dots, or a mixture thereof.
Example 27
[0188] A lighting system was simulated having a first lighting channel having the characteristics shown as "4000K Ch4" in Tables 44, 46, 48, 50, 52, 53, and 56 and in FIG. 5, and a second lighting channel having the characteristics shown as "2400K Ch3" in Tables 44, 45, 47, 49, 51, 53, and 56 and in FIG. 6. The values for EML slope and EML ratio for this pair of first and second lighting channels are shown in Tables 54 and 55. The first lighting channel can comprise an LED having a 450 nm peak wavelength and an associated luminophoric medium having one or more phosphors, quantum dots, or a mixture thereof. The second lighting channel can comprise an LED having a 410 nm peak wavelength and an associated luminophoric medium having one or more phosphors, quantum dots, or a mixture thereof.
Example 28
[0189] A lighting system was simulated having a first lighting channel having the characteristics shown as "5000K Ch1" in Tables 44, 46, 48, 50, 52, 53, and 56 and in FIG. 12, and a second lighting channel having the characteristics shown as "2400K Ch3" in Tables 44, 45, 47, 49, 51, 53, and 56 and in FIG. 6. The values for EML slope and EML ratio for this pair of first and second lighting channels are shown in Tables 54 and 55. The first lighting channel can comprise an LED having a 450 nm peak wavelength and an associated luminophoric medium having one or more phosphors, quantum dots, or a mixture thereof. The second lighting channel can comprise an LED having a 410 nm peak wavelength and an associated luminophoric medium having one or more phosphors, quantum dots, or a mixture thereof.
Example 29
[0190] A lighting system was simulated having a first lighting channel having the characteristics shown as "4000K Ch1" in Tables 44, 46, 48, 50, 52, 53, and 56 and a second lighting channel having the characteristics shown as "1800K Ch1" in Tables 44, 45, 47, 49, 51, 53, and 56 and in FIG. 11. The values for EML slope and EML ratio for this pair of first and second lighting channels are shown in Tables 54 and 55. The first lighting channel can comprise an LED having a 450 nm peak wavelength and an associated luminophoric medium having one or more phosphors, quantum dots, or a mixture thereof. The second lighting channel can comprise an LED having a 410 nm peak wavelength and an associated luminophoric medium having one or more phosphors, quantum dots, or a mixture thereof.
Example 30
[0191] A lighting system was simulated having a first lighting channel having the characteristics shown as "4000K Ch2" in Tables 44, 46, 48, 50, 52, 53, and 56 and in FIG. 9, and a second lighting channel having the characteristics shown as "1800K Ch1" in Tables 44, 45, 47, 49, 51, 53, and 56 and in FIG. 11. The values for EML slope and EML ratio for this pair of first and second lighting channels are shown in Tables 54 and 55. The first lighting channel can comprise an LED having a 450 nm peak wavelength and an associated luminophoric medium having one or more phosphors, quantum dots, or a mixture thereof. The second lighting channel can comprise an LED having a 410 nm peak wavelength and an associated luminophoric medium having one or more phosphors, quantum dots, or a mixture thereof.
Example 31
[0192] A lighting system was simulated having a first lighting channel having the characteristics shown as "4000K Ch3" in Tables 44, 46, 48, 50, 52, 53, and 56 and in FIG. 10, and a second lighting channel having the characteristics shown as "1800K Ch1" in Tables 44, 45, 47, 49, 51, 53, and 56 and in FIG. 11. The values for EML slope and EML ratio for this pair of first and second lighting channels are shown in Tables 54 and 55. The first lighting channel can comprise an LED having a 450 nm peak wavelength and an associated luminophoric medium having one or more phosphors, quantum dots, or a mixture thereof. The second lighting channel can comprise an LED having a 410 nm peak wavelength and an associated luminophoric medium having one or more phosphors, quantum dots, or a mixture thereof.
Example 32
[0193] A lighting system was simulated having a first lighting channel having the characteristics shown as "4000K Ch4" in Tables 44, 46, 48, 50, 52, 53, and 56 and in FIG. 5, and a second lighting channel having the characteristics shown as "1800K Ch1" in Tables 44, 45, 47, 49, 51, 53, and 56 and in FIG. 11. The values for EML slope and EML ratio for this pair of first and second lighting channels are shown in Tables 54 and 55. The first lighting channel can comprise an LED having a 450 nm peak wavelength and an associated luminophoric medium having one or more phosphors, quantum dots, or a mixture thereof. The second lighting channel can comprise an LED having a 410 nm peak wavelength and an associated luminophoric medium having one or more phosphors, quantum dots, or a mixture thereof.
Example 33
[0194] A lighting system was simulated having a first lighting channel having the characteristics shown as "5000K Ch1" in Tables 44, 46, 48, 50, 52, 53, and 56 and in FIG. 12, and a second lighting channel having the characteristics shown as "1800K Ch1" in Tables 44, 45, 47, 49, 51, 53, and 56 and in FIG. 11. The values for EML slope and EML ratio for this pair of first and second lighting channels are shown in Tables 54 and 55. The first lighting channel can comprise an LED having a 450 nm peak wavelength and an associated luminophoric medium having one or more phosphors, quantum dots, or a mixture thereof. The second lighting channel can comprise an LED having a 410 nm peak wavelength and an associated luminophoric medium having one or more phosphors, quantum dots, or a mixture thereof.
Example 34
[0195] A lighting system was simulated having a first lighting channel having the characteristics shown as "Exemplary 1st channels avg" in Tables 44, 46, 48, 50, 52, 53, and 56, and a second lighting channel having the characteristics shown as "Exemplary 2nd channels avg" in Tables 44, 45, 47, 49, 51, 53, and 56. The first lighting channel has a first color point at (0.3735, 0.3719) ccx, ccy coordinates. The second lighting channel has a second color point at (0.5021, 0.4137) ccx, ccy coordinates. The first lighting channel can comprise an LED having a 450 nm peak wavelength and an associated luminophoric medium having one or more phosphors, quantum dots, or a mixture thereof. The second lighting channel can comprise an LED having a 410 nm peak wavelength and an associated luminophoric medium having one or more phosphors, quantum dots, or a mixture thereof
Example 35
[0196] A display system was simulated having three LED strings for use in a warm-dim operation mode. A first LED string is driven by a blue LED having peak emission wavelength of approximately 450 nm to approximately 455 nm, utilizes a recipient luminophoric medium, and generates a combined emission of a white color point with a 1931 CIE chromaticity diagram (ccx, ccy) coordinates of (0.3818, 0.3797). A second LED string is driven by a blue LED having peak emission wavelength of approximately 450 nm to approximately 455 nm, utilizes a recipient luminophoric medium, and generates a combined emission of a red color point with a 1931 CIE chromaticity diagram color point of (0.5932, 0.3903). A third LED string is driven by a blue LED having peak emission wavelength of approximately 450 nm to approximately 455 nm, utilizes a recipient luminophoric medium, and generates a combined emission of a cyan color point with a 1931 CIE chromaticity diagram color point of (0.373, 0.4978).
[0197] Tables 58 and 59 below shows the spectral power distributions for the red and cyan color points generated by the display system of this Example, with spectral power shown within wavelength ranges in nanometers from 380 nm to 780 nm, with an arbitrary reference wavelength range selected for each color range and normalized to a value of 100.0. Table 60 shows color-rendering and circadian performance characteristics of the device for a representative selection of white light color points near the Planckian locus.
TABLE-US-00007 TABLE 7 320 < 340 < 360 < 380 < 400 < 420 < 440 < 460 < 480 < 500 < 520 < 540 < .lamda. .ltoreq. 340 .lamda. .ltoreq. 360 .lamda. .ltoreq. 380 .lamda. .ltoreq. 400 .lamda. .ltoreq. 420 .lamda. .ltoreq. 440 .lamda. .ltoreq. 460 .lamda. .ltoreq. 480 .lamda. .ltoreq. 500 .lamda. .ltoreq. 520 .lamda. .ltoreq. 540 .lamda. .ltoreq. 560 Red Channel 11 0.0 0.0 0.0 0.6 0.8 0.9 3.1 4.9 2.9 8.5 14.9 17.6 Red Channel 3 0.0 0.0 0.0 0.0 0.1 3.9 14.9 3.4 0.5 0.8 2.0 5.8 Red Channel 4 0.0 0.0 0.0 25.6 21.1 16.7 16.4 15.2 6.0 10.5 16.8 18.2 Red Channel 5 0.0 0.0 0.0 0.7 1.0 12.6 68.4 23.0 5.5 16.7 35.7 43.0 Red Channel 6 0.0 0.0 0.0 0.0 0.1 3.9 14.9 3.4 0.5 0.8 2.0 5.8 Red Channel 7 0.0 0.0 0.0 2.0 15.5 13.4 2.8 0.9 1.0 3.2 5.7 7.8 Red Channel 8 0.0 0.0 0.0 0.3 20.3 17.9 0.2 0.0 0.0 0.1 0.1 0.6 Red Channel 9 0.0 0.0 0.0 0.0 0.0 0.4 4.1 5.8 4.0 7.2 12.7 18.9 Red Channel 10 0.0 0.0 0.0 0.1 0.1 0.7 4.5 4.9 3.5 6.7 11.6 17.6 Red Channel 1 0.0 0.0 0.0 0.0 0.3 1.4 1.3 0.4 0.9 4.2 9.4 15.3 Red Channel 2 0.0 0.0 0.0 0.1 0.4 1.1 3.4 3.6 2.7 5.9 11.0 16.9 Exemplary Red 0.0 0.0 0.0 0.0 0.0 0.4 0.2 0.0 0.0 0.1 0.1 0.6 Channels Minimum Exemplary Red 0.0 0.0 0.0 2.7 5.4 6.6 12.2 6.0 2.5 5.9 11.1 15.2 Channels Average Exemplary Red 0.0 0.0 0.0 25.6 21.1 17.9 68.4 23.0 6.0 16.7 35.7 43.0 Channels Maximum 560 < 580 < 600 620 < 640 < 660 < 680 < 700 < 720 < 740 < 760 < 780 < .lamda. .ltoreq. 580 .lamda. .ltoreq. 600 .lamda. .ltoreq. 620 .lamda. .ltoreq. 640 .lamda. .ltoreq. 660 .lamda. .ltoreq. 680 .lamda. .ltoreq. 700 .lamda. .ltoreq. 720 .lamda. .ltoreq. 740 .lamda. .ltoreq. 760 .lamda. .ltoreq. 780 .lamda. .ltoreq. 800 Red Channel 11 21.8 35.7 63.5 91.4 100.0 83.9 58.3 35.6 20.3 10.8 5.2 0.0 Red Channel 3 11.8 30.2 64.2 94.6 100.0 83.6 58.7 36.3 21.0 11.4 6.0 0.0 Red Channel 4 25.8 93.1 231.0 215.2 100.0 27.6 7.1 2.9 1.9 1.5 1.8 0.0 Red Channel 5 47.5 100.0 478.3 852.3 100.0 12.4 4.5 2.7 1.9 1.5 1.0 0.0 Red Channel 6 11.8 30.2 64.2 94.6 100.0 83.6 58.7 36.3 21.0 11.4 6.0 0.0 Red Channel 7 13.0 28.9 59.4 89.8 100.0 84.5 58.8 36.0 20.5 10.9 5.2 0.0 Red Channel 8 3.2 15.9 46.4 79.8 100.0 94.8 73.4 50.7 32.9 20.2 11.1 0.0 Red Channel 9 29.4 46.9 72.4 95.7 100.0 83.0 57.2 34.7 19.7 10.8 5.7 0.0 Red Channel 10 30.0 48.9 67.9 93.5 100.0 66.0 33.7 16.5 7.6 3.2 1.5 0.0 Red Channel 1 26.4 45.8 66.0 87.0 100.0 72.5 42.0 22.3 11.6 6.1 3.1 0.0 Red Channel 2 28.1 46.8 68.9 92.6 100.0 73.9 44.5 24.7 13.1 6.8 3.5 0.0 Exemplary Red 3.2 15.9 46.4 79.8 100.0 12.4 4.5 2.7 1.9 1.5 1.0 0.0 Channels Minimum Exemplary Red 22.6 47.5 116.5 171.5 100.0 69.6 45.2 27.2 15.6 8.6 4.6 0.0 Channels Average Exemplary Red 47.5 100.0 478.3 852.3 100.0 94.8 73.4 50.7 32.9 20.2 11.1 0.0 Channels Maximum
TABLE-US-00008 TABLE 8 320 < 380 < 420 < 460 < 500 < 540 < 580 < 620 < 660 < 700 < 740 < .lamda. .ltoreq. 380 .lamda. .ltoreq. 420 .lamda. .ltoreq. 460 .lamda. .ltoreq. 500 .lamda. .ltoreq. 540 .lamda. .ltoreq. 580 .lamda. .ltoreq. 620 .lamda. .ltoreq. 660 .lamda. .ltoreq. 700 .lamda. .ltoreq. 740 .lamda. .ltoreq. 780 Red Channel 11 0.0 0.7 2.1 4.1 12.2 20.5 51.8 100.0 74.3 29.3 8.4 Red Channel 3 0.0 0.0 9.6 2.0 1.4 9.0 48.5 100.0 73.1 29.5 9.0 Red Channel 4 0.0 14.8 10.5 6.7 8.7 14.0 102.8 100.0 11.0 1.5 1.1 Red Channel 5 0.0 0.2 8.5 3.0 5.5 9.5 60.7 100.0 1.8 0.5 0.3 Red Channel 6 0.0 0.0 9.6 2.0 1.4 9.0 48.5 100.0 73.1 29.5 9.0 Red Channel 7 0.0 9.2 8.6 1.0 4.6 11.0 46.5 100.0 75.5 29.8 8.5 Red Channel 8 0.0 11.5 10.1 0.1 0.1 2.1 34.6 100.0 93.6 46.5 17.5 Red Channel 9 0.0 0.0 2.3 5.0 10.2 24.7 61.0 100.0 71.7 27.8 8.4 Red Channel 10 0.0 0.1 2.7 4.3 9.5 24.6 60.4 100.0 51.5 12.4 2.4 Red Channel 1 0.0 0.2 1.4 0.7 7.3 22.3 59.8 100.0 61.2 18.1 4.9 Red Channel 2 0.0 0.3 2.3 3.3 8.8 23.4 60.1 100.0 61.5 19.6 5.3 Exemplary Red 0.0 0.0 1.4 0.1 0.1 2.1 34.6 100.0 1.8 0.5 0.3 Channels Minimum Exemplary Red 0.0 3.4 6.2 2.9 6.3 15.5 57.7 100.0 58.9 22.2 6.8 Channels Average Exemplary Red 0.0 14.8 10.5 6.7 12.2 24.7 102.8 100.0 93.6 46.5 17.5 Channels Maximum
TABLE-US-00009 TABLE 9 320 < .lamda. .ltoreq. 400 < .lamda. .ltoreq. 500 < .lamda. .ltoreq. 600 < .lamda. .ltoreq. 700 < .lamda. .ltoreq. 400 500 600 700 780 Red Channel 11 0.2 3.2 24.8 100.0 18.1 Red Channel 3 0.0 5.7 12.6 100.0 18.7 Red Channel 4 4.4 13.0 28.3 100.0 1.4 Red Channel 5 0.1 7.6 16.8 100.0 0.5 Red Channel 6 0.0 5.7 12.6 100.0 18.7 Red Channel 7 0.5 8.6 14.9 100.0 18.5 Red Channel 8 0.1 9.8 5.1 100.0 29.2 Red Channel 9 0.0 3.5 28.2 100.0 17.3 Red Channel 10 0.0 3.8 31.8 100.0 8.0 Red Channel 1 0.0 1.2 27.5 100.0 11.7 Red Channel 2 0.0 2.9 28.6 100.0 12.7 Exemplary Red Channels Minimum 0.0 1.2 5.1 100.0 0.5 Exemplary Red Channels Average 0.5 6.2 20.3 100.0 14.2 Exemplary Red Channels Maximum 4.4 13.0 31.8 100.0 29.2
TABLE-US-00010 TABLE 10 320 < 340 < 360 < 380 < 400 < 420 < 440 < 460 < 480 < 500 < 520 < 540 < .lamda. .ltoreq. 340 .lamda. .ltoreq. 360 .lamda. .ltoreq. 380 .lamda. .ltoreq. 400 .lamda. .ltoreq. 420 .lamda. .ltoreq. 440 .lamda. .ltoreq. 460 .lamda. .ltoreq. 480 .lamda. .ltoreq. 500 .lamda. .ltoreq. 520 .lamda. .ltoreq. 540 .lamda. .ltoreq. 560 Violet Channel 1 0.0 51.7 633.8 545.9 100.0 53.3 53.9 10.5 6.9 22.4 40.4 48.0 Violet Channel 2 0.0 0.3 11.0 116.1 100.0 17.8 2.7 0.5 1.1 4.4 7.9 9.4 Violet Channel 5 0.0 0.3 10.9 115.7 100.0 23.4 10.2 1.9 1.4 4.5 8.2 9.7 Violet Channel 3 0.0 0.0 1.4 29.4 100.0 29.8 4.6 0.8 0.9 3.3 6.0 7.0 Violet Channel 4 0.0 1.0 1.9 10.7 100.0 86.0 15.7 2.7 3.7 13.8 24.8 28.4 Exemplary Violet 0.0 0.0 1.4 10.7 100.0 17.8 2.7 0.5 0.9 3.3 6.0 7.0 Channels Minimum Exemplary Violet 0.0 10.7 131.8 163.6 100.0 42.1 17.4 3.3 2.8 9.7 17.4 20.5 Channels Average Exemplary Violet 0.0 51.7 633.8 545.9 100.0 86.0 53.9 10.5 6.9 22.4 40.4 48.0 Channels Maximum 560 < 580 < 600 < 620 < 640 < 660 < 680 < 700 < 720 < 740 < 760 < 780 < Violet Channel 1 .lamda. .ltoreq. 580 .lamda. .ltoreq. 600 .lamda. .ltoreq. 620 .lamda. .ltoreq. 640 .lamda. .ltoreq. 660 .lamda. .ltoreq. 680 .lamda. .ltoreq. 700 .lamda. .ltoreq. 720 .lamda. .ltoreq. 740 .lamda. .ltoreq. 760 .lamda. .ltoreq. 780 .lamda. .ltoreq. 800 Violet Channel 2 51.7 54.0 51.2 41.8 29.8 19.4 11.6 6.8 3.7 2.0 1.1 0.0 Violet Channel 5 10.0 10.4 9.8 8.0 5.7 3.7 2.2 1.3 0.7 0.4 0.2 0.0 Violet Channel 3 10.6 11.2 10.8 8.9 6.3 4.1 2.5 1.4 0.8 0.4 0.2 0.0 Violet Channel 4 7.3 7.3 6.7 5.4 3.8 2.5 1.5 0.9 0.5 0.3 0.1 0.0 Exemplary Violet 28.0 29.9 32.6 20.3 10.7 6.5 3.9 2.4 1.4 0.8 0.5 0.0 Channels Minimum Exemplary Violet 7.3 7.3 6.7 5.4 3.8 2.5 1.5 0.9 0.5 0.3 0.1 0.0 Channels Average Exemplary Violet 21.5 22.6 22.2 16.9 11.3 7.2 4.3 2.6 1.4 0.8 0.5 0.0 Channels Maximum
TABLE-US-00011 TABLE 11 320 < 380 < 420 < 460 < 500 < 540 < 580 < 620 < 660 < 700 < 740 < .lamda. .ltoreq. 380 .lamda. .ltoreq. 420 .lamda. .ltoreq. 460 .lamda. .ltoreq. 500 .lamda. .ltoreq. 540 .lamda. .ltoreq. 580 .lamda. .ltoreq. 620 .lamda. .ltoreq. 660 .lamda. .ltoreq. 700 .lamda. .ltoreq. 740 .lamda. .ltoreq. 780 Violet Channel 1 106.1 100.0 16.6 2.7 9.7 15.4 16.3 11.1 4.8 1.6 0.5 Violet Channel 2 5.2 100.0 9.5 0.8 5.7 9.0 9.3 6.3 2.7 0.9 0.3 Violet Channel 5 5.2 100.0 15.6 1.5 5.9 9.4 10.2 7.1 3.1 1.0 0.3 Violet Channel 3 1.1 100.0 26.6 1.3 7.1 11.0 10.8 7.1 3.0 1.0 0.3 Violet Channel 4 2.6 100.0 91.9 5.8 34.8 50.9 56.4 28.0 9.4 3.4 1.2 Exemplary Violet 1.1 100.0 9.5 0.8 5.7 9.0 9.3 6.3 2.7 0.9 0.3 Channels Minimum Exemplary Violet 24.1 100.0 32.0 2.4 12.6 19.2 20.6 11.9 4.6 1.6 0.5 Channels Average Exemplary Violet 106.1 100.0 91.9 5.8 34.8 50.9 56.4 28.0 9.4 3.4 1.2 Channels Maximum
TABLE-US-00012 TABLE 12 320 < .lamda. .ltoreq. 400 < .lamda. .ltoreq. 500 < .lamda. .ltoreq. 600 < .lamda. .ltoreq. 700 < .lamda. .ltoreq. 400 500 600 700 780 Violet Channel 1 548.2 100.0 96.4 68.5 6.1 Violet Channel 2 104.3 100.0 34.4 24.0 2.1 Violet Channel 5 92.7 100.0 32.3 23.8 2.1 Violet Channel 3 22.7 100.0 22.7 14.5 1.3 Violet Channel 4 6.5 100.0 59.9 35.6 2.5 Exemplary Violet Channels 6.5 100.0 22.7 14.5 1.3 Minimum Exemplary Violet Channels 154.9 100.0 49.2 33.3 2.8 Average Exemplary Violet Channels 548.2 100.0 96.4 68.5 6.1 Maximum
TABLE-US-00013 TABLE 13 320 < 340 < 360 < 380 < 400 < 420 < 440 < 460 < 480 < 500 < 520 < 540 < .lamda. .ltoreq. 340 .lamda. .ltoreq. 360 .lamda. .ltoreq. 380 .lamda. .ltoreq. 400 .lamda. .ltoreq. 420 .lamda. .ltoreq. 440 .lamda. .ltoreq. 460 .lamda. .ltoreq. 480 .lamda. .ltoreq. 500 .lamda. .ltoreq. 520 .lamda. .ltoreq. 540 .lamda. .ltoreq. 560 Yellow Channel 1 0.0 2.0 24.3 20.9 3.9 2.6 2.8 1.3 14.6 55.3 92.6 100.0 Yellow Channel 2 0.0 0.1 2.3 24.3 20.9 3.7 0.6 1.8 17.7 55.3 89.8 100.0 Yellow Channel 5 0.0 0.1 2.2 23.4 20.3 5.4 3.0 0.9 11.3 48.1 87.3 100.0 Yellow Channel 3 0.0 0.0 0.4 9.2 31.4 9.4 1.4 0.6 11.3 48.2 87.5 100.0 Yellow Channel 6 0.0 0.1 0.6 9.6 32.4 9.7 1.6 0.7 11.3 47.9 87.1 100.0 Yellow Channel 4 0.0 5.0 8.0 7.1 9.4 7.6 3.6 2.2 11.8 48.2 87.2 100.0 Exemplary Yellow 0.0 0.0 0.4 7.1 3.9 2.6 0.6 0.6 11.3 47.9 87.1 100.0 Channels Minimum Exemplary Yellow 0.0 1.2 6.3 15.8 19.7 6.4 2.2 1.3 13.0 50.5 88.6 100.0 Channels Average Exemplary Yellow 0.0 5.0 24.3 24.3 32.4 9.7 3.6 2.2 17.7 55.3 92.6 100.0 Channels Maximum 560 < 580 < 600 < 620 < 640 < 660 < 680 < 700 < 720 < 740 < 760 < 780 < .lamda. .ltoreq. 580 .lamda. .ltoreq. 600 .lamda. .ltoreq. 620 .lamda. .ltoreq. 640 .lamda. .ltoreq. 660 .lamda. .ltoreq. 680 .lamda. .ltoreq. 700 .lamda. .ltoreq. 720 .lamda. .ltoreq. 740 .lamda. .ltoreq. 760 .lamda. .ltoreq. 780 .lamda. .ltoreq. 800 Yellow Channel 1 91.4 77.7 61.5 44.6 30.0 19.6 11.8 7.3 4.1 2.3 1.3 0.0 Yellow Channel 2 94.2 80.8 63.6 45.9 30.7 20.0 12.1 7.5 4.2 2.4 1.5 0.0 Yellow Channel 5 96.7 85.5 69.3 51.0 34.5 22.6 13.7 8.4 4.7 2.7 1.5 0.0 Yellow Channel 3 95.8 83.2 66.2 47.9 32.2 21.0 12.8 7.9 4.5 2.6 1.5 0.0 Yellow Channel 6 97.4 88.6 77.3 64.1 49.6 35.4 22.7 14.0 7.9 4.4 2.4 0.0 Yellow Channel 4 99.9 113.9 134.0 80.5 39.5 23.2 13.9 8.6 5.0 3.0 2.0 0.0 Exemplary Yellow 91.4 77.7 61.5 44.6 30.0 19.6 11.8 7.3 4.1 2.3 1.3 0.0 Channels Minimum Exemplary Yellow 95.9 88.3 78.7 55.7 36.1 23.6 14.5 9.0 5.1 2.9 1.7 0.0 Channels Average Exemplary Yellow 99.9 113.9 134.0 80.5 49.6 35.4 22.7 14.0 7.9 4.4 2.4 0.0 Channels Maximum
TABLE-US-00014 TABLE 14 320 < 380 < 420 < 460 < 500 < 540 < 580 < 620 < 660 < 700 < 740 < .lamda. .ltoreq. 380 .lamda. .ltoreq. 420 .lamda. .ltoreq. 460 .lamda. .ltoreq. 500 .lamda. .ltoreq. 540 .lamda. .ltoreq. 580 .lamda. .ltoreq. 620 .lamda. .ltoreq. 660 .lamda. .ltoreq. 700 .lamda. .ltoreq. 740 .lamda. .ltoreq. 780 Yellow Channel 1 13.7 12.9 2.8 8.3 77.2 100.0 72.7 39.0 16.4 5.9 1.9 Yellow Channel 2 1.2 23.3 2.2 10.1 74.7 100.0 74.4 39.5 16.5 6.0 2.0 Yellow Channel 5 1.2 22.2 4.3 6.2 68.8 100.0 78.7 43.5 18.4 6.7 2.2 Yellow Channel 3 0.2 20.8 5.5 6.1 69.3 100.0 76.3 40.9 17.3 6.3 2.1 Yellow Channel 6 0.3 21.3 5.7 6.0 68.4 100.0 84.1 57.6 29.5 11.1 3.4 Yellow Channel 4 6.5 8.3 5.6 7.0 67.7 100.0 124.1 60.1 18.6 6.8 2.5 Exemplary Yellow 0.2 8.3 2.2 6.0 67.7 100.0 72.7 39.0 16.4 5.9 1.9 Channels Minimum Exemplary Yellow 3.9 18.1 4.4 7.3 71.0 100.0 85.0 46.7 19.4 7.1 2.3 Channels Average Exemplary Yellow 13.7 23.3 5.7 10.1 77.2 100.0 124.1 60.1 29.5 11.1 3.4 Channels Maximum
TABLE-US-00015 TABLE 15 320 < .lamda. .ltoreq. 400 < .lamda. .ltoreq. 500 < .lamda. .ltoreq. 600 < .lamda. .ltoreq. 700 < .lamda. .ltoreq. 400 500 600 700 780 Yellow Channel 1 11.3 6.1 100.0 40.2 3.6 Yellow Channel 2 6.3 10.7 100.0 41.0 3.7 Yellow Channel 5 6.2 9.8 100.0 45.8 4.2 Yellow Channel 3 2.3 13.0 100.0 43.4 4.0 Yellow Channel 6 2.4 13.2 100.0 59.2 6.8 Yellow Channel 4 4.5 7.7 100.0 64.8 4.1 Exemplary Yellow Channels 2.3 6.1 100.0 40.2 3.6 Minimum Exemplary Yellow Channels 5.5 10.1 100.0 49.1 4.4 Average Exemplary Yellow Channels 11.3 13.2 100.0 64.8 6.8 Maximum
TABLE-US-00016 TABLE 16 Simulated Performance Using 4 Channels from Example 1 (highest-CRI mode) ccx ccy CCT duv Ra R9 R13 R15 LER COI 0.280 0.287 10090 -0.41 95.7 82.9 96.7 91.0 253.3 8.9 0.284 0.293 9450 0.56 96.2 88.5 98.0 92.4 256.9 8.7 0.287 0.286 8998 0.06 96.2 85.7 97.4 92.1 257.7 8.2 0.291 0.300 8503 -0.24 96.3 84.2 97.1 92.0 259.0 7.6 0.300 0.310 7506 -0.35 96.4 82.5 96.4 92.0 262.3 6.4 0.306 0.317 7017 0.38 97.0 86.8 97.6 93.5 266.0 6.0 0.314 0.325 6480 0.36 97.3 87.4 97.7 94.0 268.5 5.2 0.322 0.331 5992 -0.56 96.9 84.2 96.7 93.3 269.1 4.2 0.332 0.342 5501 0.4 97.2 86.6 96.7 94.2 271.7 3.2 0.345 0.352 4991 0.31 97.0 87.0 96.7 93.8 273.3 2.0 0.361 0.365 4509 0.8 96.8 86.8 96.2 94.2 274.7 0.9 0.381 0.378 3992 0.42 96.4 85.7 95.5 94.3 274.3 1.0 0.405 0.391 3509 0.1 95.8 85.9 94.8 94.4 271.9 2.7 0.438 0.406 2997 0.58 95.3 89.3 94.3 95.4 267.0 0.460 0.410 2701 -0.07 95.3 92.6 94.3 96.3 260.7 0.487 0.415 2389 -0.06 95.7 98.7 95.0 98.3 252.3 0.517 0.416 2097 0.39 95.7 90.2 96.9 97.8 241.4 0.549 0.409 1808 0.25 95.7 73.3 97.7 91.4 227.4 0.571 0.400 1614 -0.19 91.7 58.7 92.7 85.6 214.4
TABLE-US-00017 TABLE 17 Simulated Performance Using the Blue, Red, and Long-Blue-Pumped Cyan Channels from Example 1 (High-EML mode) ccx ccy CCT duv Ra R9 R13 R15 LER COI CLA CS Rf Rg 0.280 0.288 10124 0.56 95.9 86.9 97.4 91.6 254.2 9.1 2236 0.6190 89 98 0.287 0.296 8993 0.58 95.8 83.3 96.2 91.1 256.6 8.0 2094 0.6130 90 99 0.295 0.305 7999 -0.03 95.2 77.3 94.3 89.9 258.2 6.7 1947 0.6070 90 99 0.306 0.317 7026 0.5 94.3 76.0 93.2 89.7 261.3 5.3 1761 0.5980 89 99 0.314 0.325 6490 0.52 93.4 74.3 92.3 89.3 262.7 4.4 1643 0.5910 89 99 0.322 0.332 6016 0.08 92.5 71.9 91.2 88.5 263.3 3.4 1533 0.5830 89 99 0.332 0.342 5506 0.73 91.7 73.1 90.7 88.9 265.2 2.5 1386 0.5720 88 99 0.345 0.352 5000 0.39 90.1 71.6 89.8 87.9 265.6 1.3 1238 0.5590 86 97 0.361 0.364 4510 0.51 88.8 70.2 88.6 87.5 265.9 0.9 1070 0.5400 83 96 0.381 0.378 4002 0.66 87.3 69.5 87.3 87.2 265.2 2.0 877 0.5110 81 94 0.405 0.392 3507 0.48 85.9 70.1 86.0 87.1 262.6 3.6 1498 0.5810 79 93 0.438 0.407 2998 0.84 84.7 74.5 85.3 88.3 257.7 1292 0.5640 75 89 0.460 0.411 2700 0.23 84.7 79.1 85.5 89.6 252.0 1155 0.5500 73 87 0.482 0.408 2399 -2.21 86.2 86.4 86.3 91.7 242.7 1009 0.5320 77 90 0.508 0.404 2103 -3.59 88.2 97.6 89.2 96.2 232.3 831 0.5030 82 94 0.542 0.398 1794 -3.34 91.2 79.1 96.6 95.0 219.6 590 0.4450 87 99 0.583 0.392 1505 -0.7 88.2 49.0 89.0 81.5 205.5 290 0.3110 80 103 circadian power circadian ccx ccy CCT duv GAI GAI 15 GAI_BB [mW] flux CER CAF EML BLH 0.280 0.288 10124 0.56 106.0 298.4 99.0 0.06 0.03 298.6 1.17 1.324 0.251 0.287 0.296 8993 0.58 105.2 293.1 99.2 0.06 0.03 287.6 1.12 1.284 0.257 0.295 0.305 7999 -0.03 104.5 287.8 99.8 0.07 0.03 274.8 1.06 1.240 0.264 0.306 0.317 7026 0.5 101.7 277.0 99.4 0.07 0.03 259.6 0.99 1.188 0.276 0.314 0.325 6490 0.52 99.8 269.8 99.3 0.08 0.03 249.1 0.95 1.153 0.285 0.322 0.332 6016 0.08 98.0 263.0 99.6 0.08 0.03 238.4 0.90 1.117 0.293 0.332 0.342 5506 0.73 94.0 250.7 98.7 0.09 0.04 225.2 0.85 1.074 0.310 0.345 0.352 5000 0.39 90.1 238.4 98.6 0.10 0.04 209.9 0.79 1.024 0.330 0.361 0.364 4510 0.51 84.2 221.8 97.7 0.11 0.04 192.6 0.72 0.967 0.320 0.381 0.378 4002 0.66 76.0 199.7 96.1 0.09 0.03 171.5 0.65 0.897 0.245 0.405 0.392 3507 0.48 66.0 174.1 94.6 0.08 0.03 148.0 0.56 0.815 0.178 0.438 0.407 2998 0.84 51.4 138.2 90.2 0.06 0.02 119.4 0.46 0.711 0.115 0.460 0.411 2700 0.23 43.3 118.5 90.1 0.05 0.01 101.7 0.40 0.640 0.085 0.482 0.408 2399 -2.21 39.4 109.3 102.3 0.04 0.01 85.0 0.35 0.560 0.066 0.508 0.404 2103 -3.59 33.6 95.4 119.4 0.03 0.01 66.3 0.28 0.462 0.048 0.542 0.398 1794 -3.34 24.2 71.4 142.3 0.02 0.00 43.4 0.20 0.330 0.030 0.583 0.392 1505 -0.7
TABLE-US-00018 TABLE 18 Simulated Performance Using the Blue, Red, and Short-Blue-Pumped Cyan Channels from Example 1 (High-CRI mode) circadian power circadian ccx ccy CCT duv GAI GAI 15 GAI_BB [mW] flux CER CAF EML BLH 0.2795 0.2878 10154.39 0.45 105.7 299.6 99.3 0.1 0.0 297.7 1.2 1.287392 0.242465 0.2835 0.2927 9463.51 0.57 105.1 296.8 99.5 0.1 0.0 291.0 1.1 1.255256 0.243167 0.2868 0.2963 8979.72 0.48 104.8 294.9 99.8 0.1 0.0 285.6 1.1 1.230498 0.243703 0.2904 0.3008 8501.8 0.69 104.0 292.0 99.9 0.1 0.0 279.7 1.1 1.202935 0.244396 0.3006 0.31 7485.85 -0.27 103.4 287.3 101.3 0.1 0.0 263.9 1.0 1.138359 0.245866 0.3064 0.3159 7006.5 -0.29 102.4 283.1 101.7 0.1 0.0 255.1 1.0 1.101543 0.246923 0.3137 0.3232 6489.8 -0.31 100.8 277.6 102.2 0.1 0.0 244.2 0.9 1.057241 0.24832 0.322 0.3308 6006.26 -0.45 99.1 271.4 102.9 0.1 0.0 232.5 0.9 1.01129 0.2499 0.3324 0.3414 5501.95 0.21 95.8 261.3 102.9 0.1 0.0 218.1 0.8 0.954284 0.252421 0.3452 0.3514 4993.84 -0.12 92.5 251.2 104.0 0.1 0.0 201.4 0.7 0.893796 0.25518 0.361 0.3635 4492.22 -0.07 87.6 237.1 104.7 0.1 0.0 182.1 0.7 0.82457 0.259194 0.3806 0.3773 3999.36 0.24 80.7 218.2 105.0 0.1 0.0 159.8 0.6 0.746244 0.265169 0.4044 0.3896 3509.79 -0.28 72.6 196.8 106.8 0.1 0.0 135.5 0.5 0.663096 0.198253 0.4373 0.4046 2997.87 0.16 59.3 162.9 106.3 0.1 0.0 105.4 0.4 0.558039 0.127844 0.4581 0.4081 2705 -0.79 52.4 145.2 110.1 0.0 0.0 89.0 0.3 0.498973 0.097229 0.4858 0.4142 2400.92 -0.13 40.5 114.8 107.3 0.0 0.0 68.7 0.3 0.42121 0.064438 0.5162 0.4156 2104.13 0.3 28.4 82.4 102.9 0.0 0.0 49.3 0.2 0.339504 0.039198 0.5487 0.4058 1789.82 -0.69 19.6 57.8 116.1 0.0 0.0 32.4 0.1 0.252508 0.023439 0.5742 0.399 1593.58 0.05 ccx ccy CCT duv Ra R9 R13 R15 LER COI CLA CS Rf Rg 0.2795 0.2878 10154.39 0.45 95.77 95.05 99.27 93.65 257.2 9.6 2199 0.617 89 98 0.2835 0.2927 9463.51 0.57 95.91 95.56 99.15 94.08 259.63 9.12 2104 0.614 89 99 0.2868 0.2963 8979.72 0.48 96.05 94.99 99.24 94.34 261.19 8.69 2033 0.6110 89 100 0.2904 0.3008 8501.8 0.69 96.11 95.94 99.02 94.76 263.35 8.28 1952 0.6070 90 100 0.3006 0.31 7485.85 -0.27 96.32 91.29 99.44 94.86 266.03 6.95 1774 0.5980 90 101 0.3064 0.3159 7006.5 -0.29 96.33 91.45 99.45 95.26 268.18 6.3 1670 0.5920 91 101 0.3137 0.3232 6489.8 -0.31 96.34 91.81 99.44 95.76 270.59 5.51 1546 0.5840 91 102 0.322 0.3308 6006.26 -0.45 96.33 91.92 99.38 96.16 272.63 4.65 1420 0.5750 92 102 0.3324 0.3414 5501.95 0.21 96.39 95.57 99.13 97.53 276.11 3.73 1260 0.5610 92 102 0.3452 0.3514 4993.84 -0.12 96.8 95.19 98.84 96.57 277.51 2.51 1100 0.5440 92 102 0.361 0.3635 4492.22 -0.07 96.83 94.58 99.18 97.25 278.89 1.16 919 0.5180 93 102 0.3806 0.3773 3999.36 0.24 96.85 94.73 99.44 97.96 279.47 0.46 719 0.4790 94 102 0.4044 0.3896 3509.79 -0.28 96.77 93.51 99.01 97.87 276.46 2.34 522 0.4230 94 103 0.4373 0.4046 2997.87 0.16 96.89 96.02 98.46 98.58 271.21 1020 0.5330 95 103 0.4581 0.4081 2705 -0.79 96.85 97.34 97.5 98.4 263.76 906 0.5160 95 104 0.4858 0.4142 2400.92 -0.13 97.27 96.43 97.97 99.32 255.71 756 0.4880 95 104 0.5162 0.4156 2104.13 0.3 97.2 87.34 99.31 96.46 244.06 601 0.4490 93 102 0.5487 0.4058 1789.82 -0.69 95.09 72.11 97.24 91.09 225.81 444 0.3930 87 104 0.5742 0.399 1593.58 0.05 91.03 56.48 91.54 84.56 213.34 316 0.3270 83 101
TABLE-US-00019 TABLE 19 Comparison of EML Between 3-Channel Operation Modes Red, Blue, and Short- Red, Blue, and Blue-Pumped Cyan Long-Blue-Pumped Cyan Change in EML between (High-CRI mode) (High-EML mode) High-CRI and High-EML modes CCT EML CCT EML at same approximate CCT 10154.39 1.287392 10124.15 1.323599 2.8% 9463.51 1.255256 8979.72 1.230498 8993.02 1.284446 4.4% 8501.8 1.202935 7998.71 1.240274 7485.85 1.138359 7006.5 1.101543 7025.83 1.188225 7.9% 6489.8 1.057241 6490.37 1.153187 9.1% 6006.26 1.01129 6015.98 1.117412 10.5% 5501.95 0.954284 5505.85 1.074033 12.5% 4993.84 0.893796 4999.87 1.023649 14.5% 4492.22 0.82457 4509.8 0.966693 17.2% 3999.36 0.746244 4001.99 0.896774 20.2% 3509.79 0.663096 3507.13 0.815304 23.0% 2997.87 0.558039 2998.02 0.711335 27.5% 2705 0.498973 2700.47 0.639906 28.2% 2400.92 0.42121 2398.75 0.5596 32.9% 2104.13 0.339504 2102.54 0.461974 36.1% 1789.82 0.252508 1794.12 0.330184 30.8% 1593.58 1505.05
TABLE-US-00020 TABLE 20 Simulated Performance Using 4 Channels from Example 1 (Highest-CRI mode) with Relative Signal Strengths Calculated for 100 Lumens Flux Output from the Device Short- Long- Blue- Blue- Pumped Pumped flux Blue Red Cyan Cyan CCT duv total Ra R9 EML 0.72 0.15 0.04 0.08 9997 0.99 100.0073 95.1 96.1 1.306 0.70 0.15 0.06 0.08 9501 0.99 100.0074 95.3 96.3 1.283 0.67 0.16 0.09 0.08 9002 0.99 100.0075 95.5 96.3 1.257 0.65 0.16 0.11 0.08 8501 0.99 100.0075 95.7 96.4 1.229 0.58 0.17 0.16 0.08 7499 0.99 100.0077 96.2 96.4 1.163 0.55 0.18 0.19 0.09 6999 0.99 100.0079 96.5 96.0 1.125 0.51 0.19 0.22 0.09 6499 0.99 100.008 96.8 95.7 1.082 0.46 0.20 0.25 0.09 5998 0.99 100.0082 97.1 94.8 1.035 0.41 0.22 0.27 0.10 5498 0.99 100.0085 97.5 93.7 0.983 0.35 0.24 0.30 0.11 4999 0.99 100.0089 97.7 92.3 0.925 0.30 0.26 0.35 0.09 4499 0.99 100.0091 98.0 92.7 0.848 0.24 0.29 0.38 0.08 3999 0.99 100.0096 97.9 92.2 0.769 0.18 0.34 0.42 0.07 3499 0.99 100.0102 97.7 92.9 0.675 0.11 0.41 0.44 0.04 2999 0.99 100.0111 97.4 95.6 0.567 0.08 0.46 0.43 0.03 2699 0.99 100.0118 97.5 98.8 0.495 0.04 0.54 0.40 0.02 2399 1.00 100.0127 97.7 95.7 0.419 0.02 0.64 0.34 0.01 2100 1.00 100.0141 97.4 86.6 0.337 0.00 0.78 0.19 0.03 1800 0.15 100.0161 95.6 73.0 0.261
TABLE-US-00021 TABLE 21 Simulated Performance Using the Blue, Red, and Long-Blue-Pumped Channels from Example 1 (Highest-EML mode) with Relative Signal Strengths Calculated for 100 Lumens Flux Output from the Device Long- Blue- Pumped flux Blue Red Cyan CCT duv total Ra R9 EML 0.71 0.16 0.13 10468 0.77 99.24986 94.7 97.3 1.300 0.66 0.17 0.17 9001 0.99 100.008 94.9 90.1 1.285 0.59 0.18 0.23 7998 0.99 100.0085 94.5 86.7 1.242 0.51 0.21 0.29 6999 0.99 100.0091 93.8 82.6 1.187 0.46 0.22 0.32 6498 0.99 100.0095 93.1 80.4 1.154 0.41 0.24 0.35 5998 0.99 100.0099 92.3 78.0 1.116 0.36 0.26 0.39 5498 0.99 100.0104 91.3 75.6 1.073 0.29 0.28 0.43 4999 0.99 100.0109 90.2 73.3 1.023 0.23 0.31 0.46 4499 0.99 100.0115 88.8 71.4 0.965 0.18 0.35 0.47 3999 -0.35 100.0122 87.3 68.2 0.897 0.11 0.41 0.48 3499 -1.01 100.013 86.0 68.6 0.816 0.05 0.48 0.47 2999 -1.01 100.014 85.1 73.3 0.715 0.01 0.53 0.45 2700 -1.01 100.0146 85.1 78.7 0.642 0.02 0.61 0.37 2400 -4.00 100.0153 86.5 85.8 0.564 0.01 0.69 0.30 2100 -4.00 100.0161 88.2 97.6 0.462 0.00 0.81 0.19 1800 -3.28 100.0172 91.2 79.3 0.333
TABLE-US-00022 TABLE 22 Simulated Performance Using the Blue, Red, and Short-Blue-Pumped Cyan Channels from Example 1 (High-CRI mode) with Relative Signal Strengths Calculated for 100 Lumens Flux Output from the Device Short- Blue- Pumped flux Blue Red Cyan CCT dux total Ra R9 EML 0.75 0.14 0.11 10144 0.47 100 94.9 98.0 1.287 0.72 0.14 0.14 9458 0.59 100 95.0 98.0 1.255 0.69 0.15 0.16 8976 0.50 100 95.2 98.2 1.230 0.66 0.15 0.19 8498 0.70 100 95.2 97.8 1.203 0.61 0.17 0.23 7481 -0.26 100 96.1 96.5 1.138 0.57 0.17 0.26 7003 -0.28 100 96.3 96.4 1.101 0.53 0.18 0.29 6487 -0.29 100 96.5 96.2 1.057 0.49 0.20 0.32 5989 -0.54 100 96.8 94.9 1.010 0.43 0.21 0.36 5499 0.23 100 96.7 97.3 0.954 0.38 0.23 0.39 4993 -0.12 100 96.8 95.4 0.894 0.32 0.25 0.42 4491 -0.09 100 96.9 94.8 0.825 0.26 0.29 0.45 3999 0.25 100 96.9 95.0 0.746 0.20 0.34 0.46 3509 -0.29 100 96.9 93.8 0.663 0.13 0.40 0.47 2998 0.18 100 97.0 96.3 0.558 0.10 0.46 0.44 2705 -0.79 100 96.9 97.6 0.499 0.06 0.54 0.40 2401 -0.16 100 97.3 96.2 0.421 0.02 0.63 0.34 2104 0.32 100 97.2 87.1 0.340 0.01 0.78 0.21 1790 -0.70 100 95.0 71.9 0.253
TABLE-US-00023 TABLE 23 Violet Blue Red Yellow Channel Channel Channel Channel 1 1 1 1 x y CCT duv Ra 1 0.4863 0.0275 0.0145 0.2808 0.2878 10006.64 -0.32 88.93 1 0.4798 0.0307 0.0275 0.2866 0.2961 9012.09 0.49 88.11 1 0.4410 0.0339 0.0404 0.2947 0.3059 8001.65 0.89 87.29 1 0.3667 0.0371 0.0501 0.3062 0.3176 6993.76 0.67 86.47 1 0.3247 0.0404 0.0533 0.3136 0.3239 6498.08 0.15 86.23 1 0.2892 0.0468 0.0565 0.3220 0.3305 6007.62 -0.62 86.21 1 0.2375 0.0468 0.0630 0.3324 0.3414 5501.83 0.25 84.55 1 0.2118 0.0630 0.0727 0.3448 0.3513 5008.33 -0.03 84.47 1 0.1664 0.0727 0.0759 0.3608 0.3632 4497.73 -0.17 84.23 1 0.0953 0.0727 0.0727 0.3808 0.3780 3999.57 0.49 82.44 1 0.0307 0.0727 0.0598 0.4055 0.3901 3489.48 -0.33 80.86 R9 R13 R15 LER COI GAI 56.99 89.55 90.02 170.08 13.12 101.1 52.29 88.39 88.34 175.4 12.56 99.5 48.58 87.25 86.96 178.35 11.77 97.8 46.21 86.2 85.94 177.6 10.66 95.9 46.62 85.94 85.88 176.16 9.89 94.9 48.62 86.01 86.26 175.26 8.94 94.0 41.19 83.93 83.37 174.38 8.24 90.5 43.2 83.93 83.42 178.14 6.84 88.0 45.18 83.67 83.11 176.16 5.48 83.7 40.62 81.71 80.76 168.6 4.28 76.8 39.01 80.4 79.43 154.51 3.21 69.4 Circadian power Circadian CCT GAI 15 GAI_BB [mW] flux CER CAF EML CLA 10006.64 289.2 96.1 0.046 0.014 234.3 1.128 1.2035 2140 9012.09 283.7 96.0 0.047 0.014 227.9 1.069 1.1519 1987 8001.65 277.5 96.3 0.046 0.013 216.7 0.997 1.0863 1805 6993.76 270.4 97.2 0.042 0.011 199.5 0.913 1.0044 1592 6498.08 266.6 98.2 0.041 0.010 189.1 0.866 0.9583 1477 6007.62 262.6 99.6 0.039 0.009 178.5 0.818 0.9105 1358 5501.83 252.5 99.5 0.037 0.008 164.5 0.751 0.8453 1189 5008.33 244.2 100.9 0.037 0.008 153.2 0.688 0.7870 1034 4497.73 231.7 102.3 0.034 0.007 136.0 0.614 0.7117 850 3999.57 212.4 102.3 0.031 0.005 116.1 0.525 0.6178 634 3489.48 191.0 104.4 0.026 0.004 91.3 0.436 0.5147 426 energy in 440- CS Rf Rg BLH 490/total 0.6150 85 97 0.1520 24.31% 0.6090 85 98 0.1502 23.42% 0.6000 84 97 0.1408 21.93% 0.5870 84 98 0.1231 19.70% 0.5790 84 99 0.1132 18.38% 0.5700 83 100 0.1049 17.06% 0.5540 82 100 0.0927 15.23% 0.5350 82 100 0.0883 13.83% 0.5060 82 100 0.0762 11.69% 0.4580 79 101 0.0604 8.87% 0.3850 74 102 0.0444 5.89%
TABLE-US-00024 TABLE 24 Violet Red Yellow Channel Channel Channel 1 1 1 x y CCT duv Ra 1 0.01 0.0307 0.3798 0.3755 4006.89 -0.39 72.72 1 0.0404 0.0436 0.4048 0.3901 3506.88 -0.13 76.74 1 0.1115 0.0662 0.4373 0.4055 3004.86 0.51 81.38 1 0.1955 0.0824 0.4602 0.4109 2697.63 0.09 84.56 1 0.3603 0.1082 0.4863 0.415 2400.85 0.11 87.56 1 0.7124 0.1373 0.5152 0.4136 2100.63 -0.32 90.1 0.4378 1 0.105 0.5503 0.4097 1800.92 0.49 90.94 0.1276 1 0.0468 0.5739 0.4011 1605.63 0.52 89.19 0 1 0.01 0.5904 0.3926 1472.77 0.48 86.22 R9 R13 R15 LER COI GAI -1.48 70.29 67.32 119.13 7.63 75.0 22.68 75.58 73.83 135.43 4.36 68.6 44.89 81.5 80.46 158.17 3.08 57.6 56.59 85.48 84.52 171.67 4.98 50.0 64.45 88.99 87.52 186.8 7.75 40.4 67.4 91.71 89.07 197.99 11.39 30.5 62.65 92.01 87.32 210.12 16 17.4 53.54 89.58 83.84 209.15 19.91 43.73 85.8 79 204.65 23.1 Circadian power Circadian CCT GAI 15 GAI_BB [mW] flux CER CAF EML 4006.89 209.1 100.7 0.0219 0.0026 91.2 0.510 0.5409 3506.88 188.7 102.6 0.0232 0.0028 83.1 0.429 0.4850 3004.86 157.1 102.3 0.0255 0.0031 71.3 0.338 0.4190 2697.63 136.1 103.7 0.0276 0.0034 62.5 0.287 0.3762 2400.85 110.2 103.1 0.0312 0.0038 52.1 0.233 0.3289 2100.63 83.9 105.3 0.0370 0.0045 40.7 0.181 0.2769 1800.92 47.8 94.0 0.0265 0.0032 26.8 0.121 0.2127 1605.63 1472.77 energy in 440- CLA CS Rf Rg BLH 490/total 614 0.4520 66 99 0.035624 5.32% 414 0.3790 68 101 0.036204 4.64% 788 0.4940 71 103 0.037333 3.72% 699 0.4750 72 105 0.038411 3.10% 601 0.4480 74 105 0.040364 2.42% 499 0.4140 74 106 0.04391 1.75% 374 0.3600 77 103 0.025696 0.98% 290 0.3110 77 100 0.61% 228 0.2660 77 96 0.41%
TABLE-US-00025 TABLE 25 Violet Blue Red Yellow Channel Channel Channel Channel 2 1 1 2 x y CCT duv 1 0.5897 0.0145 0.0533 0.2805 0.2877 10048.55 -0.24 1 0.5669 0.021 0.0662 0.2872 0.2947 9004.53 -0.61 1 0.5089 0.021 0.0824 0.2953 0.3043 8002.62 -0.27 1 0.4927 0.0339 0.1082 0.3064 0.3167 6994.18 0.09 1 0.4637 0.0404 0.1212 0.3134 0.3249 6502.6 0.25 1 0.4249 0.0501 0.1341 0.3221 0.3321 5996.32 0.2 1 0.3893 0.063 0.1535 0.3326 0.3426 5491.51 0.71 1 0.3538 0.0889 0.1696 0.3453 0.3522 4995.38 0.23 1 0.315 0.1244 0.1955 0.3612 0.3649 4495.14 0.53 1 0.2342 0.1598 0.2084 0.3808 0.3783 4001.5 0.64 1 0.1599 0.2278 0.2213 0.406 0.3916 3492.72 0.26 Ra R9 R13 R15 LER COI 84.74 35.51 83.78 83.54 194.76 14.75 84.63 36.9 83.72 83.62 198.26 13.89 83.38 21.18 82.17 81.47 201.36 13.28 82.8 29.98 81.54 80.47 209.16 11.99 82.25 28.43 80.9 79.58 212.19 11.3 81.71 27.74 80.34 78.87 214.8 10.4 80.84 25.11 79.33 77.43 219.33 9.4 81.06 29.17 79.63 77.95 22.48 7.97 80.98 32.3 79.74 78.15 227.7 6.4 80.59 34.94 79.6 78.1 228.56 4.76 81.11 41.82 80.74 79.55 228.66 2.93 Circadian power Circadian CCT GAI GAI 15 GAI_BB [mW] flux CER CAF 10048.55 99.4 286.8 95.3 0.06561 0.01832 227.6 1.15226 9004.53 99.0 284.0 96.1 0.06523 0.01785 220.1 1.09461 8002.62 97.2 277.5 96.2 0.06317 0.01659 209.1 1.02377 6994.18 95.1 269.6 96.9 0.06389 0.01635 198.6 0.93634 6502.6 93.6 264.4 97.3 0.06322 0.01576 190.8 0.88706 5996.32 91.9 258.5 98.0 0.06209 0.01496 181.2 0.83216 5491.51 89.1 249.5 98.3 0.06152 0.01428 170.6 0.76736 4995.38 86.7 241.3 99.8 0.06092 0.01360 158.8 0.70408 4495.14 82.3 227.8 100.6 0.06079 0.01292 144.7 0.62725 4001.5 76.5 210.3 101.2 0.05795 0.01128 126.3 0.54556 3492.72 69.0 187.7 102.4 0.05580 0.00982 106.1 0.45814 energy in 440- EML CLA CS Rf Rg BLH 490/total 1.16343 2214 0.6180 82 98 0.2269 20.57% 1.11189 2067 0.6120 82 98 0.2212 19.63% 1.04507 1888 0.6040 80 98 0.2072 18.14% 0.97088 1666 0.5920 80 98 0.2030 16.89% 0.92605 1542 0.5840 79 98 0.1961 15.91% 0.87477 1404 0.5740 78 99 0.1871 14.71% 0.81655 1242 0.5590 77 99 0.1788 13.41% 0.75818 1085 0.5420 77 99 0.1707 12.05% 0.68922 895 0.5140 77 99 0.1621 10.45% 0.60853 697 0.4740 75 100 0.1442 8.27% 0.52239 487 0.4100 72 101 0.1282 6.06%
TABLE-US-00026 TABLE 26 Violet Red Yellow Channel Channel Channel 2 1 2 x y CCT duv Ra 1 0.2052 0.1664 0.4371 0.4039 2996.5 -0.07 77.97 1 0.3538 0.1986 0.4592 0.4097 2702.82 -0.25 81.29 1 0.6704 0.2536 0.4861 0.4144 2399.16 -0.08 84.77 0.6898 1 0.2375 0.5162 0.4152 2101.05 0.18 87.89 0.2633 1 0.1147 0.5494 0.4075 1795.06 -0.17 89.46 0 1 0.0145 0.5884 0.3941 1490.7 0.58 86.53 R9 R13 R15 LER COI 37.32 78.11 76.47 209.43 3.24 49.05 82.14 80.83 217.13 4.6 58.13 86.1 84.59 224.1 7.33 62.54 89.28 86.86 226.74 10.95 59.71 90.5 86.24 219.6 15.9 44.85 86.19 79.53 206.45 22.61 Circadian power Circadian CCT GAI GAI 15 GAI_BB [mW] flux CER CAF 2996.5 58.5 151.8 99.2 0.04468 0.00592 78.2 0.36760 2702.82 51.0 130.9 99.3 0.04816 0.00634 68.2 0.31019 2399.16 40.8 104.2 97.5 0.05457 0.00709 55.9 0.24677 2101.05 29.4 75.0 94.0 0.04689 0.00596 42.1 0.18439 1795.06 19.0 48.6 96.7 0.02750 0.00337 28.3 0.12835 1490.7 energy in 440-490/ EML CLA CS Rf Rg BLH total 0.39920 283 0.3060 58 102 0.0914 2.27% 0.36006 686 0.4710 59 103 0.0931 1.94% 0.31417 586 0.4440 61 103 0.0965 1.54% 0.26370 480 0.4070 64 104 0.0723 1.12% 0.20692 369 0.3570 66 104 0.0354 0.77% 234 0.2710 77 96 0.42%
TABLE-US-00027 TABLE 27 Violet Blue Red Channel Channel Channel Yellow 3 1 1 Channel 3 x y CCT duv Ra 1 0.6866 0 0.0953 0.2803 0.2888 10001.93 0.51 81.58 1 0.6575 0.0112 0.1082 0.2871 0.295 9005.05 -0.41 81.96 1 0.6478 0.0178 0.1341 0.2952 0.3045 8002.58 -0.17 81.67 1 0.609 0.0339 0.1598 0.3063 0.315 7019.98 -0.75 81.69 1 0.609 0.0371 0.1922 3133 0.3244 6503.68 0.55 80.8 1 0.5606 0.0533 0.2052 0.3219 0.3313 6009.48 -0.15 80.8 1 0.5283 0.0792 0.2278 0.3326 0.3399 5491.1 -0.64 80.89 1 0.4507 0.0985 0.2439 0.3447 0.3496 5008.1 -0.83 80.11 1 0.3731 0.1308 0.2666 0.3603 0.3616 4503.83 -0.78 80.05 1 0.3053 0.1922 0.3021 0.3804 0.3756 3993.71 -0.48 80.14 1 0.1955 0.2666 0.3212 0.405 0.3901 3501.05 -0.19 79.95 1 0.1082 0.4507 0.3731 0.4379 0.406 2998.46 0.63 81.09 R9 R13 R15 LER COI 24.85 80.47 78.99 215.18 15.35 30.63 81.18 80.21 217.66 14.27 30.4 80.86 79.7 223.79 13.26 34.05 81.11 80.14 228.65 11.8 28.66 79.85 78.19 235.52 11.19 31.77 80.09 78.64 237.07 10.13 34.88 80.39 79.1 240.29 8.83 33.91 79.63 78.13 241.98 7.68 37.17 79.68 78.43 244.41 6.23 41.23 80.15 78.96 247.89 4.43 44.73 80.49 79.23 247.8 2.82 51.35 82.25 80.98 248.85 2.82 Circadian GAI power Circadian CCT GAI GAI 15 BB [mW] flux CER CAF EML 10001.93 98.5 286.4 95.2 0.0717 0.0223 249.5 1.1560 1.1337 9005.05 98.9 285.5 96.6 0.0710 0.0217 240.9 1.1032 1.0860 8002.58 97.7 280.0 97.1 0.0718 0.0215 231.7 1.0321 1.0280 7019.98 96.7 274.6 98.6 0.0714 0.0208 218.5 0.9525 0.9580 6503.68 94.1 266.3 98.0 0.0729 0.0208 211.1 0.8933 0.9122 6009.48 93.3 262.2 99.4 0.0714 0.0198 200.8 0.8443 0.8655 5491.1 91.6 255.6 100.8 0.0712 0.0193 189.2 0.7848 0.8128 5008.1 89.0 246.4 101.8 0.0685 0.0177 175.3 0.7219 0.7515 4503.83 84.9 233.1 102.8 0.0663 0.0162 158.7 0.6472 0.6808 3993.71 78.9 214.3 103.3 0.0655 0.0149 139.6 0.5613 0.6032 3501.05 70.8 188.9 102.8 0.0621 0.0128 117.2 0.4712 0.5148 2998.46 58.4 151.3 98.8 0.0624 0.0115 91.6 0.3666 0.4210 energy in 440- 490/ CLA CS Rf Rg BLH total 2207 0.6170 78 98 0.296518 20.4% 2074 0.6120 78 99 0.289375 19.3% 1894 0.6040 78 99 0.286203 18.3% 1694 0.5940 77 100 0.276619 16.8% 1544 0.5840 76 99 0.275549 16.0% 1422 0.5750 75 100 0.264517 14.8% 1274 0.5620 75 101 0.256951 13.5% 1119 0.5460 74 100 0.239709 11.8% 936 0.5210 73 101 0.222675 9.8% 726 0.4810 71 102 0.208066 7.8% 509 0.4180 67 102 0.185032 5.3% 801 0.4970 63 103 0.168008 3.1%
TABLE-US-00028 TABLE 28 Violet Red Yellow Channel Channel Channel 3 1 3 x y CCT duv Ra 1 0.2892 0.2795 0.4383 0.4089 2991.9 0.55 77.14 1 0.5153 0.3376 0.4608 0.4121 2698.81 0.49 80.67 1 1 0.4313 0.4874 0.4164 2398.27 0.55 84.41 0.4701 1 0.2633 0.5163 0.4156 2103.15 0.32 87.78 0.1664 1 0.1276 0.5494 0.4087 1801.77 0.14 89.57 0 1 0.0113 0.5893 0.3932 1481.65 0.48 86.32 R9 R13 R15 LER COI 41.67 78.4 76.41 238.03 3 52.45 82.44 80.85 241.24 4.57 60.65 86.4 84.74 241.7 7.35 64.36 89.6 87.19 236.56 10.96 60.8 90.73 86.57 224.99 15.78 44.22 85.94 79.25 205.59 22.85 Circadian GAI GAI power Circadian CCT GAI 15 BB [mW] flux CER CAF EML 2991.9 58.3 144.4 94.5 0.05113 0.00853 88.24 0.37 0.3906 2698.81 50.2 122.2 93.0 0.05643 0.00916 74.82 0.31 0.3524 2398.27 40.0 96.1 90.0 0.06099 0.00950 59.56 0.25 0.3088 2103.15 29.5 70.5 88.2 0.04078 0.00601 44.32 0.19 0.2618 1801.77 18.5 44.7 87.8 0.02498 0.00338 28.98 0.13 0.2064 1481.65 energy in 440- 490/ CLA CS Rf Rg BLH total 271 0.2980 53 102 0.142907 1.3% 670 0.4670 55 104 0.145337 1.2% 574 0.4400 57 103 0.139122 0.9% 476 0.4060 59 104 0.079144 0.7% 367 0.3560 63 103 0.037527 0.6% 231 0.2680 76 96 0.4%
TABLE-US-00029 TABLE 29 Red Yellow Violet Channel Channel Channel 4 1 4 x y CCT duv Ra R9 1 0.0113 0.454 0.4049 0.3909 3509.71 0.17 70.47 -30.68 1 0.2827 0.6123 0.4371 0.4039 2996.02 -0.08 75.95 0.28 1 0.6155 0.7318 0.4588 0.4091 2702.91 -0.47 79.45 17.36 1 1 0.9192 0.475 0.415 2534.54 0.56 81.4 24.99 0.7221 1 0.7124 0.4863 0.4149 2399.5 0.07 83.09 32.05 0.3343 1 0.399 0.5143 0.413 2104.82 -0.53 86.42 43.99 0.14 1 0.2601 0.5386 0.4128 1903.52 0.5 88.01 47.93 0.0889 1 0.1922 0.5503 0.4097 1800.78 0.49 88.42 48.88 0.0436 1 0.1341 0.5629 0.4065 1700.09 0.75 88.41 48.52 0.0404 1 0.0727 0.5723 0.3987 1603.05 -0.23 87.82 47.4 R13 R15 LER COI GAI 71.94 61.99 302.33 8.76 67.73522 78.09 70.25 296.34 5.74 58.16243 81.9 75.09 287.92 5.74 51.1852 83.75 77.16 284.63 6.43 43.86021 85.51 79.26 277.26 7.59 40.40926 88.69 82.68 258.79 11.04 31.31714 89.69 83.3 246.03 13.97 21.13827 89.79 83.17 237.3 15.78 17.44622 89.33 82.48 228.6 17.73 88.45 81.62 217.65 19.94 Circadian GAI power Circadian CCT 15 GAI BB [mW] flux CER CAF EML CLA 3509.71 176.4 95.8 0.0625 0.0139 134.9 0.4407 0.4559 429 2996.02 148.4 97.0 0.0726 0.0152 105.0 0.3502 0.3966 754 2702.91 129.3 98.1 0.0647 0.0129 86.8 0.2984 0.3591 674 2534.54 110.5 93.4 0.0572 0.0108 74.0 0.2575 0.3318 613 2399.5 101.5 95.0 0.0525 0.0097 66.0 0.2360 0.3130 575 2104.82 78.6 98.1 0.0401 0.0068 48.4 0.1856 0.2667 483 1903.52 53.5 88.0 0.0284 0.0043 34.5 0.1392 0.2263 401 1800.78 44.3 87.1 0.0237 0.0034 28.8 0.1208 0.2061 363 1700.09 321 1603.05 292 energy in 440- 490/ CS Rf Rg BLH total 0.3860 56 99 0.2220 3.15% 0.4870 58 102 0.2268 2.43% 0.4680 60 104 0.1838 2.00% 0.4520 62 104 0.1452 1.70% 0.4410 62 104 0.1262 1.52% 0.4080 64 105 0.0821 1.14% 0.3730 68 103 0.0441 0.83% 0.3540 69 102 0.0324 0.71% 0.3300 72 99 0.59% 0.3120 69 104 0.55%
TABLE-US-00030 TABLE 30 High-CRI mode High-EML mode Low-EML mode Very-Low-EML mode Circadian Circadian Circadian Circadian Nominal Stimulus Stimulus Stimulus Stimulus CCT EML (CS) EML (CS) EML (CS) EML (CS) 10000 1.287392 0.617 1.323599 0.6190 1.203532 0.6150 9500 1.2552564 0.614 9000 1.230498 0.6110 1.284446 0.6130 1.151925 0.6090 8500 1.202935 0.6070 8000 1.240274 0.6070 1.08629 0.6000 7500 1.1383591 0.5980 7000 1.1015431 0.5920 1.188225 0.5980 1.004381 0.5870 6500 1.0572409 0.5840 1.153187 0.5910 0.958281 0.5790 6000 1.0112902 0.5750 1.117412 0.5830 0.910548 0.5700 5500 0.9542838 0.5610 1.074033 0.5720 0.845296 0.5540 5000 0.8937964 0.5440 1.023649 0.5590 0.786954 0.5350 4500 0.8245702 0.5180 0.966693 0.5400 0.711691 0.5060 4000 0.7462442 0.4790 0.896774 0.5110 0.540872 0.452 3500 0.6630957 0.4230 0.815304 0.5810 0.48499 0.3790 3000 0.5580387 0.5330 0.711335 0.5640 0.418977 0.4940 2700 0.4989732 0.5160 0.639906 0.5500 0.376181 0.4750 2500 0.44713093 0.497333 0.586369 0.538 0.344663 0.457 2400 0.4212098 0.4880 0.5596 0.5320 0.328904 0.4480 2100 0.339504 0.4490 0.461974 0.5030 0.276946 0.4140 1900 0.2815066 0.411667 0.374114 0.464333 0.234146 0.378 1800 0.2525079 0.3930 0.330184 0.4450 0.212746 0.3600 1700 1600 0.3270
TABLE-US-00031 TABLE 31 EML % changes CS % changes High-CRI mode to High-CRI mode to High-EML mode Low-EML mode High-EML mode Low-EML mode Nominal to Low-EML and Very-Low- High-CRI mode to to Low-EML and Very-Low- High-CRI mode to CCT mode EML mode High-EML mode mode EML mode High-EML mode 10000 10.0% 7.0% 2.8% 1% 0% 0% 9500 9000 11.5% 6.8% 4.4% 1% 0% 0% 8500 8000 14.2% 1% 7500 7000 18.3% 9.7% 7.9% 2% 1% 1% 6500 20.3% 10.3% 9.1% 2% 1% 1% 6000 22.7% 11.1% 10.5% 2% 1% 1% 5500 27.1% 12.9% 12.5% 3% 1% 2% 5000 30.1% 13.6% 14.5% 4% 2% 3% 4500 35.8% 15.9% 17.2% 7% 2% 4% 4000 65.8% 38.0% 20.2% 13% 6% 7% 3500 68.1% 36.7% 23.0% 53% 12% 37% 3000 69.8% 33.2% 27.5% 14% 8% 6% 2700 70.1% 32.6% 28.2% 16% 9% 7% 2500 70.1% 29.7% 31.1% 18% 9% 8% 2400 70.1% 28.1% 32.9% 19% 9% 9% 2100 66.8% 22.6% 36.1% 21% 8% 12% 1900 59.8% 20.2% 32.9% 23% 9% 13% 1800 55.2% 18.7% 30.8% 24% 9% 13% 1700 1600
TABLE-US-00032 TABLE 32 High-CRI mode High-EML mode Low-EML mode Very-Low-EML mode Nominal Circadian Circadian Circadian Circadian CCT EML Stimulus (CS) EML Stimulus (CS) EML Stimulus (CS) EML Stimulus (CS) 10000 1.28739 0.6170 1.32360 0.6190 1.16343 0.6180 9500 1.25526 0.6140 9000 1.23050 0.6110 1.28445 0.6130 1.11189 0.6120 8500 1.20294 0.6070 8000 1.24027 0.6070 1.04507 0.6040 7500 1.13836 0.5980 7000 1.10154 0.5920 1.18823 0.5980 0.97088 0.5920 6500 1.05724 0.5840 1.15319 0.5910 0.92605 0.5840 6000 1.01129 0.5750 1.11741 0.5830 0.87477 0.5740 5500 0.95428 0.5610 1.07403 0.5720 0.81655 0.5590 5000 0.89380 0.5440 1.02365 0.5590 0.75818 0.5420 4500 0.82457 0.5180 0.96669 0.5400 0.68922 0.5140 4000 0.74624 0.4790 0.89677 0.5110 0.60853 0.4740 3500 0.66310 0.4230 0.81530 0.5810 0.52239 0.4100 3000 0.55804 0.5330 0.71133 0.5640 0.39920 0.3060 2700 0.49897 0.5160 0.63991 0.5500 0.36006 0.4710 2500 0.44713 0.4973 0.58637 0.5380 0.32947 0.4530 2400 0.42121 0.4880 0.55960 0.5320 0.31417 0.4440 2100 0.33950 0.4490 0.46197 0.5030 0.26370 0.4070 1900 0.28151 0.4117 0.37411 0.4643 0.22585 0.3737 1800 0.25251 0.3930 0.33018 0.4450 0.20692 0.3570 1700 1600 0.3270 0.3110 0.2710
TABLE-US-00033 TABLE 33 EML % changes CS % changes High-CRI mode to High-CRI mode to High-EML mode Low-EML mode High-EML mode Low-EML mode Nominal to Low-EML and Very-Low- High-CRI mode to to Low-EML and Very-Low- High-CRI mode to CCT mode EML mode High-EML mode mode EML mode High-EML mode 10000 14% 11% 3% 0% 0% 0% 9500 9000 16% 11% 4% 0% 0% 0% 8500 8000 19% 0% 7500 7000 22% 13% 8% 1% 0% 1% 6500 25% 14% 9% 1% 0% 1% 6000 28% 16% 10% 2% 0% 1% 5500 32% 17% 13% 2% 0% 2% 5000 35% 18% 15% 3% 0% 3% 4500 40% 20% 17% 5% 1% 4% 4000 47% 23% 20% 8% 1% 7% 3500 56% 27% 23% 42% 3% 37% 3000 78% 40% 27% 84% 74% 6% 2700 78% 39% 28% 17% 10% 7% 2500 78% 36% 31% 19% 10% 8% 2400 78% 34% 33% 20% 10% 9% 2100 75% 29% 36% 24% 10% 12% 1900 66% 25% 33% 24% 10% 13% 1800 60% 22% 31% 25% 10% 13% 1700 1600 15% 21% -5%
TABLE-US-00034 TABLE 34 High-CRI mode High-EML mode Low-EML mode Very-Low-EML mode Circadian Circadian Circadian Circadian Nominal Stimulus Stimulus Stimulus Stimulus CCT EML (CS) EML (CS) EML (CS) EML (CS) 10000 1.2874 0.617 1.3236 0.619 1.1337 0.617 9500 1.2553 0.614 9000 1.2305 0.611 1.2844 0.613 1.0860 0.612 8500 1.2029 0.607 8000 1.2403 0.607 1.0280 0.604 7500 1.1384 0.598 7000 1.1015 0.592 1.1882 0.598 0.9580 0.594 6500 1.0572 0.584 1.1532 0.591 0.9122 0.584 6000 1.0113 0.575 1.1174 0.583 0.8655 0.575 5500 0.9543 0.561 1.0740 0.572 0.8128 0.562 5000 0.8938 0.544 1.0236 0.559 0.7515 0.546 4500 0.8246 0.518 0.9667 0.540 0.6808 0.521 4000 0.7462 0.479 0.8968 0.511 0.6032 0.481 3500 0.6631 0.423 0.8153 0.581 0.5148 0.418 3000 0.5580 0.533 0.7113 0.564 0.3906 0.497 2700 0.4990 0.516 0.6399 0.550 0.3524 0.467 2500 0.4471 0.497 0.5864 0.538 0.3234 0.449 2400 0.4212 0.488 0.5596 0.532 0.3088 0.440 2100 0.3395 0.449 0.4620 0.503 0.2618 0.406 1900 0.2815 0.412 0.3741 0.464 0.2249 0.373 1800 0.2525 0.393 0.3302 0.445 0.2064 0.356 1700 1600 0.327 0.268
TABLE-US-00035 TABLE 35 EML % changes CS % changes High-CRI mode to High-CRI mode to Low-EML mode Low-EML mode Nominal High-EML mode to and Very-Low- High-CRI mode to High-EML mode to and Very-Low- High-CRI mode to CCT Low-EML mode EML mode High-EML mode Low-EML mode EML mode High-EML mode 10000 16.7% 13.6% 2.8% 0.3% 9500 9000 18.3% 13.3% 4.4% 0.3% 8500 8000 20.6% 7500 7000 24.0% 15.0% 7.9% 1% -0.34% 1.0% 6500 26.4% 15.9% 9.1% 1% 0.00% 1.2% 6000 29.1% 16.8% 10.5% 1% 0.00% 1.4% 5500 32.1% 17.4% 12.5% 2% -0.18% 2% 5000 36.2% 18.9% 14.5% 2% -0.37% 3% 4500 42.0% 21.1% 17.2% 4% -0.58% 4% 4000 48.7% 23.7% 20.2% 6% -0.42% 7% 3500 58.4% 28.8% 23.0% 39% 1.20% 37% 3000 82.1% 42.9% 27.5% 13% 7% 6% 2700 81.6% 41.6% 28.2% 18% 10% 7% 2500 81.3% 38.3% 31.1% 20% 11% 8% 2400 81.2% 36.4% 32.9% 21% 11% 9% 2100 76.5% 29.7% 36.1% 24% 11% 12% 1900 66.4% 25.2% 32.9% 25% 10% 13% 1800 60.0% 22.3% 30.8% 25% 10% 13% 1700 1600 22%
TABLE-US-00036 TABLE 36 High-CRI mode High-EML mode Very-Low-EML mode Nominal Circadian Stimulus Circadian Circadian CCT EML (CS) EML Stimulus (CS) EML Stimulus (CS) 10000 1.2874 0.6170 1.3236 0.6190 9500 1.2553 0.6140 9000 1.2305 0.6110 1.2844 0.6130 8500 1.2029 0.6070 8000 1.2403 0.6070 7500 1.1384 0.5980 7000 1.1015 0.5920 1.1882 0.5980 6500 1.0572 0.5840 1.1532 0.5910 6000 1.0113 0.5750 1.1174 0.5830 5500 0.9543 0.5610 1.0740 0.5720 5000 0.8938 0.5440 1.0236 0.5590 4500 0.8246 0.5180 0.9667 0.5400 4000 0.7462 0.4790 0.8968 0.5110 3500 0.6631 0.4230 0.8153 0.5810 0.4559 0.3860 3000 0.5580 0.5330 0.7113 0.5640 0.3966 0.4870 2700 0.4990 0.5160 0.6399 0.5500 0.3591 0.4680 2500 0.4471 0.4973 0.5864 0.5380 0.3284 0.4500 2400 0.4212 0.4880 0.5596 0.5320 0.3130 0.4410 2100 0.3395 0.4490 0.4620 0.5030 0.2667 0.4080 1900 0.2815 0.4117 0.3741 0.4643 0.2263 0.3720 1800 0.2525 0.3930 0.3302 0.4450 0.2061 0.3540 1600 0.3270
TABLE-US-00037 TABLE 37 EML % changes CS % changes High-CRI mode to High-CRI mode to Low-EML mode Low-EML mode Nominal High-EML mode to and Very-Low- High-CRI mode to High-EML mode to and Very-Low- High-CRI mode to CCT Low-EML mode EML mode High-EML mode Low-EML mode EML mode High-EML mode 3500 78.8% 45.4% 23.0% 51% 10% 37% 3000 79.3% 40.7% 27.5% 16% 9% 6% 2700 78.2% 38.9% 28.2% 18% 10% 7% 2500 78.6% 36.2% 31.1% 20% 11% 8% 2400 78.8% 34.6% 32.9% 21% 11% 9% 2100 73.2% 27.3% 36.1% 23% 10% 12% 1900 65.3% 24.4% 32.9% 25% 11% 13% 1800 60.2% 22.5% 30.8% 26% 11% 13%
TABLE-US-00038 TABLE 38 Violet Peak (Vp) Violet Valley (Vv) Green Peak (Gp) Red Valley (Rv) 380 < .lamda. .ltoreq. 460 450 < .lamda. .ltoreq. 510 500 < .lamda. .ltoreq. 650 650 < .lamda. .ltoreq. 780 .lamda. Vp .lamda. Vv .lamda. Gp .lamda. Rv Violet Channel 1 380 1 486 0.00485 596 0.05521 751 0.00218 Violet Channel 2 400 1 476 0.00185 592 0.05795 751 0.00227 Violet Channel 5 400 1 482 0.00525 596 0.06319 751 0.00252 Violet Channel 3 410 1 477 0.00368 578 0.06123 751 0.00232 Violet Channel 4 420 1 477 0.01032 608 0.22266 749 0.00519 Exemplary Violet 380 1 476 0.00185 578 0.05521 749 0.00218 Channels Minimum Exemplary Violet 402 1 480 0.00519 594 0.09205 751 0.00290 Channels Average Exemplary Violet 420 1 486 0.01032 608 0.22266 751 0.00519 Channels Maximum
TABLE-US-00039 TABLE 39 Ratio Vp/Vv Vp/Gp Vp/Rv Gp/Vv Gp/Rv Violet Channel 1 206.3 18.1 458.5 11.4 25.3 Violet Channel 2 540.0 17.3 440.3 31.3 25.5 Violet Channel 5 190.4 15.8 397.0 12.0 25.1 Violet Channel 3 272.0 16.3 431.8 16.7 26.4 Violet Channel 4 96.9 4.5 192.6 21.6 42.9 Exemplary Violet 96.9 4.5 192.6 11.4 25.1 Channels Minimum Exemplary Violet 261.1 14.4 384.0 18.6 29.0 Channels Average Exemplary Violet 540.0 18.1 458.5 31.3 42.9 Channels Maximum
TABLE-US-00040 TABLE 40 Violet Peak Violet Valley Green Peak 330 < .lamda. .ltoreq. 430 420 < .lamda. .ltoreq. 510 500 < .lamda. .ltoreq. 780 .lamda. Vp .lamda. Vv .lamda. Gp Yellow Channel 1 380 0.37195 470 0.00534 548 1 Yellow Channel 2 400 0.37612 458 0.00275 549 1 Yellow Channel 5 400 0.36297 476 0.00317 561 1 Yellow Channel 3 410 0.37839 476 0.00139 547 1 Yellow Channel 6 410 0.38876 476 0.00223 561 1 Yellow Channel 4 419 0.07831 476 0.01036 608 1 Exemplary Yellow 380 0.07831 458 0.00139 547 1 Channels Minimum Exemplary Yellow 403 0.32608 472 0.00421 562 1 Channels Average Exemplary Yellow 419 0.38876 476 0.01036 608 1 Channels Maximum
TABLE-US-00041 TABLE 41 Ratio Vp/Vv Vp/Gp Gp/Vv Yellow Channel 1 69.7 0.372 187.3 Yellow Channel 2 136.9 0.376 364.0 Yellow Channel 5 114.4 0.363 315.3 Yellow Channel 3 273.2 0.378 722.0 Yellow Channel 6 174.3 0.389 448.2 Yellow Channel 4 7.6 0.078 96.5 Exemplary Yellow 7.559 0.078 96.525 Channels Minimum Exemplary Yellow 129.336 0.326 355.556 Channels Average Exemplary Yellow 273.202 0.389 722.022 Channels Maximum
TABLE-US-00042 TABLE 42 Blue Peak Blue Valley Red Peak 380 < .lamda. .ltoreq. 460 450 < .lamda. .ltoreq. 510 500 < .lamda. .ltoreq. 780 .lamda. Bp .lamda. Bv .lamda. Rp Red Channel 11 461 0.05898 488 0.02327 649 1 Red Channel 3 449 0.18404 497 0.00309 640 1 Red Channel 4 461 0.07759 495 0.01753 618 1 Red Channel 5 453 0.07508 494 0.00374 628 1 Red Channel 6 449 0.18404 497 0.00309 640 1 Red Channel 9 461 0.07737 489 0.03589 645 1 Red Channel 10 461 0.06982 489 0.02971 645 1 Red Channel 1 445 0.01599 477 0.00353 649 1 Red Channel 12 445 0.01217 477 0.00203 649 1 Red Channel 13 451 0.06050 479 0.01130 651 1 Red Channel 14 449 0.06020 485 0.00612 653 1 Red Channel 15 445 0.02174 477 0.00326 649 1 Red Channel 16 450 0.03756 483 0.00388 643 1 Red Channel 17 450 0.03508 485 0.00425 641 1 Exemplary Red 445 0.01217 477 0.00203 618 1 Channels Minimum Exemplary Red 452 0.06930 487 0.01076 643 1 Channels Average Exemplary Red 461 0.18404 497 0.03589 653 1 Channels Maximum
TABLE-US-00043 TABLE 43 Ratios Bp/Bv Bp/Rp Rp/Bv Red Channel 11 2.5 0.059 43.0 Red Channel 3 59.5 0.184 323.3 Red Channel 4 4.4 0.078 57.1 Red Channel 5 20.1 0.075 267.7 Red Channel 6 59.5 0.184 323.3 Red Channel 9 2.2 0.077 27.9 Red Channel 10 2.4 0.070 33.7 Red Channel 1 4.5 0.016 283.3 Red Channel 12 6.0 0.012 493.0 Red Channel 13 5.4 0.061 88.5 Red Channel 14 9.8 0.060 163.4 Red Channel 15 6.7 0.022 306.3 Red Channel 16 9.7 0.038 257.7 Red Channel 17 8.3 0.035 235.5 Exemplary Red 2.156 0.012 27.864 Channels Minimum Exemplary Red 14.349 0.069 207.398 Channels Average Exemplary Red 59.501 0.184 492.975 Channels Maximum
TABLE-US-00044 TABLE 44 x y CCT duv Ra R9 R13 R15 LER 2400K Ch1 0.4872 0.4166 2401.7 0.62 76.39 50.16 81.3 61.64 312.32 2400K Ch2 0.4858 0.4148 2404.69 0.07 86.38 92.09 95.28 89.70 282.76 2400K Ch3 0.4852 0.4137 2403.72 -0.29 80.60 35.83 84.04 81.58 282.07 1800K Ch1 0.5503 0.4097 1801 0.49 90.94 62.65 92.01 87.32 210.12 4000K Ch1 0.3807 0.3772 3995.74 0.16 91.18 58.05 90.71 86.30 292.50 4000K Ch2 0.3803 0.3766 4003.12 -0.02 88.67 96.86 89.72 94.57 274.59 4000K Ch3 0.3814 0.3758 3967.48 -0.7 86.26 70.93 95.39 93.30 283.64 4000K Ch4 0.3804 0.3782 4012.69 0.72 82.45 79.82 91.17 92.69 280.02 5000K Ch1 0.3449 0.3516 5007 0.08 83.73 56.73 82.41 82.71 257.55 COI GAI GAI 15 GAI_BB 2400K Ch1 10.53 36.61 89.03 83.17 2400K Ch2 9.68 44.51 102.45 95.46 2400K Ch3 7.79 41.87 100.73 93.95 1800K Ch1 16.00 17.37 47.81 94.05 4000K Ch1 82.78 219.40 105.73 4000K Ch2 1.2 76.69 200.10 96.28 4000K Ch3 3.07 71.86 189.40 91.81 4000K Ch4 2.4 69.51 182.68 87.72 5000K Ch1 0.81 90.61 234.15 96.76 CER (Circadian CAF Circadian Circadian power per (Circadian Light (CLA) Circadian power Circadian flux) action [Circadian Stimulus [mW] flux [mW/lm] factor EML lux] (CS) Rf 2400K Ch1 0.0463 0.0074 77.736 0.2481 0.30848 575 0.440 51 2400K Ch2 0.0294 0.0047 75.434 0.2661 0.34238 631 0.457 56 2400K Ch3 0.0442 0.0065 69.309 0.2453 0.28563 540 0.429 51 1800K Ch1 0.0265 0.0032 26.837 0.1209 0.21275 374 0.360 77 4000K Ch1 0.0725 0.0241 174.436 0.5949 0.79451 767 0.490 91 4000K Ch2 0.1042 0.0367 178.778 0.6494 0.88924 875 0.511 85 4000K Ch3 0.0930 0.0331 184.994 0.6516 0.89470 896 0.514 80 4000K Ch4 0.0847 0.0307 188.638 0.6729 0.94619 938 0.521 74 5000K Ch1 0.0916 0.0355 215.982 0.8368 1.10190 1325 0.567 81 Energy in 440 < .lamda. .ltoreq. 490 nm/ total energy 380 < .lamda. .ltoreq. Rg BLH 780 nm 2400K Ch1 97 0.10961 1.04% 2400K Ch2 109 0.06700 0.99% 2400K Ch3 103 0.10573 0.92% 1800K Ch1 103 0.02570 0.98% 4000K Ch1 102 0.20390 15.87% 4000K Ch2 96 0.28816 15.97% 4000K Ch3 91 0.25199 18.10% 4000K Ch4 87 0.22073 18.56% 5000K Ch1 97 0.28801 21.00%
TABLE-US-00045 TABLE 45 320 < .lamda. .ltoreq. 400 < .lamda. .ltoreq. 500 < .lamda. .ltoreq. 600 < .lamda. .ltoreq. 700 < .lamda. .ltoreq. 400 500 600 700 780 2400K Ch3 9.92 44.53 83.33 100.00 7.55 2400K Ch2 8.59 39.69 75.82 100.00 3.09 2400K Ch1 11.11 51.02 105.53 100.00 4.41 1800K Ch1 7.61 4.42 39.66 100.00 11.52 Exemplary 7.61 4.42 39.66 100.00 3.09 2.sup.nd channels min Exemplary 9.31 34.92 76.09 100.00 6.64 2.sup.nd channels avg Exemplary 11.11 51.02 105.53 100.00 11.52 2.sup.nd channels max
TABLE-US-00046 TABLE 46 320 < .lamda. .ltoreq. 400 < .lamda. .ltoreq. 500 < .lamda. .ltoreq. 600 < .lamda. .ltoreq. 700 < .lamda. .ltoreq. 400 500 600 700 780 4000K Ch4 0.29 67.46 100.00 96.08 9.60 4000K Ch2 0.43 62.49 100.00 99.55 12.19 4000K Ch3 0.24 64.82 100.00 93.88 9.61 5000K Ch1 0.05 84.60 100.00 99.73 10.20 Exemplary 0.05 62.49 100.00 93.88 9.60 1.sup.st channels min Exemplary 0.25 69.84 100.00 97.31 10.40 1.sup.st channels avg Exemplary 0.43 84.60 100.00 99.73 12.19 1.sup.st channels max
TABLE-US-00047 TABLE 47 320 < .lamda. .ltoreq. 380 < .lamda. .ltoreq. 420 < .lamda. .ltoreq. 460 < .lamda. .ltoreq. 500 < .lamda. .ltoreq. 540 < .lamda. .ltoreq. 580 < .lamda. .ltoreq. 620 < .lamda. .ltoreq. 660 < .lamda. .ltoreq. 700 < .lamda. .ltoreq. 740 < .lamda. .ltoreq. 380 420 460 500 540 580 620 660 700 740 780 2400K Ch3 0.87 75.85 20.20 2.50 36.53 75.23 99.16 100.00 23.78 10.04 3.74 2400K Ch2 0.61 53.09 14.11 3.40 35.58 51.81 62.20 100.00 9.75 3.44 1.12 2400K Ch1 1.37 120.36 31.99 6.89 72.41 110.44 227.23 100.00 21.24 7.89 3.50 1800K Ch1 1.23 16.50 4.14 1.92 16.29 33.63 66.28 100.00 60.07 17.91 4.88 Exemplary 2.sup.nd 0.61 16.50 4.14 1.92 16.29 33.63 62.20 100.00 9.75 3.44 1.12 channels min Exemplary 2.sup.nd 1.02 66.45 17.61 3.68 40.20 67.78 113.72 100.00 28.71 9.82 3.31 channels avg Exemplary 2.sup.nd 1.37 120.36 31.99 6.89 72.41 110.44 227.23 100.00 60.07 17.91 4.88 channels max
TABLE-US-00048 TABLE 48 320 < .lamda. .ltoreq. 380 < .lamda. .ltoreq. 420 < .lamda. .ltoreq. 460 < .lamda. .ltoreq. 500 < .lamda. .ltoreq. 540 < .lamda. .ltoreq. 580 < .lamda. .ltoreq. 620 < .lamda. .ltoreq. 660 < .lamda. .ltoreq. 700 < .lamda. .ltoreq. 740 < .lamda. .ltoreq. 380 420 460 500 540 580 620 660 700 740 780 4000K Ch4 0.39 0.59 30.88 98.73 67.12 76.66 100.00 84.15 50.00 13.89 4.63 4000K Ch2 0.54 1.99 44.28 79.86 78.17 75.94 100.00 95.38 52.20 18.93 5.61 4000K Ch3 0.29 0.70 37.77 87.23 65.19 79.15 100.00 82.62 48.47 13.93 4.68 5000K Ch1 0.01 1.49 66.19 129.05 96.22 88.49 100.00 115.83 63.66 18.66 5.03 Exemplary 1.sup.st 0.01 0.59 30.88 79.86 65.19 75.94 100.00 82.62 48.47 13.89 4.63 channels min Exemplary 1.sup.st 0.31 1.19 44.78 98.72 76.68 80.06 100.00 94.49 53.58 16.35 4.99 channels avg Exemplary 1.sup.st 0.54 1.99 66.19 129.05 96.22 88.49 100.00 115.83 63.66 18.93 5.61 channels max
TABLE-US-00049 TABLE 49 320 < .lamda. .ltoreq. 340 < .lamda. .ltoreq. 360 < .lamda. .ltoreq. 380 < .lamda. .ltoreq. 400 < .lamda. .ltoreq. 420 < .lamda. .ltoreq. 440 < .lamda. .ltoreq. 460 < .lamda. .ltoreq. 480 < .lamda. .ltoreq. 340 360 380 400 420 440 460 480 500 2400K Ch3 0.00 0.02 1.13 22.91 77.86 23.21 3.62 0.62 2.70 2400K Ch2 0.00 0.02 0.72 14.60 49.67 14.79 2.29 0.48 3.64 2400K Ch1 0.00 0.04 1.83 37.29 126.84 37.77 5.84 1.20 8.20 1800K Ch1 0.00 0.00 2.61 29.27 5.68 4.41 4.36 1.12 2.94 Exemplary 2.sup.nd 0.00 0.00 0.72 14.60 5.68 4.41 2.29 0.48 2.70 channels min Exemplary 2.sup.nd 0.00 0.02 1.57 26.02 65.01 20.05 4.03 0.86 4.37 channels avg Exemplary 2.sup.nd 0.00 0.04 2.61 37.29 126.84 37.77 5.84 1.20 8.20 channels max 500 < .lamda. .ltoreq. 520 < .lamda. .ltoreq. 540 < .lamda. .ltoreq. 520 540 560 2400K Ch3 13.97 34.57 48.20 2400K Ch2 15.31 27.77 31.81 2400K Ch1 35.22 63.53 73.06 1800K Ch1 11.91 22.59 30.12 Exemplary 2.sup.nd 11.91 22.59 30.12 channels min Exemplary 2.sup.nd 19.10 37.11 45.80 channels avg Exemplary 2.sup.nd 35.22 63.53 73.06 channels max 560 < .lamda. .ltoreq. 580 < .lamda. .ltoreq. 600 < .lamda. .ltoreq. 620 < .lamda. .ltoreq. 640 < .lamda. .ltoreq. 660 < .lamda. .ltoreq. 680 < .lamda. .ltoreq. 700 < .lamda. .ltoreq. 720 < .lamda. .ltoreq. 580 600 620 640 660 680 700 720 740 2400K Ch3 51.74 53.62 78.10 100.00 32.85 18.99 12.60 8.19 5.15 2400K Ch2 30.90 29.60 45.70 100.00 21.06 7.47 4.33 2.66 1.50 2400K Ch1 77.56 122.68 187.19 100.00 36.37 18.26 10.70 6.70 4.06 1800K Ch1 41.10 60.43 79.94 100.00 111.79 80.54 46.67 24.94 12.99 Exemplary 2.sup.nd 30.90 29.60 45.70 100.00 21.06 7.47 4.33 2.66 1.50 channels min Exemplary 2.sup.nd 50.33 66.58 97.73 100.00 50.52 31.32 18.58 10.62 5.93 channels avg Exemplary 2.sup.nd 77.56 122.68 187.19 100.00 111.79 80.54 46.67 24.94 12.99 channels max 740 < .lamda. .ltoreq. 760 < .lamda. .ltoreq. 780 < .lamda. .ltoreq. 760 780 800 2400K Ch3 3.09 1.87 0.00 2400K Ch2 0.86 0.50 0.00 2400K Ch1 2.73 2.05 0.00 1800K Ch1 6.82 3.52 0.00 Exemplary 2.sup.nd 0.86 0.50 0.00 channels min Exemplary 2.sup.nd 3.38 1.99 0.00 channels avg Exemplary 2.sup.nd 6.82 3.52 0.00 channels max
TABLE-US-00050 TABLE 50 320 < .lamda. .ltoreq. 340 < .lamda. .ltoreq. 360 < .lamda. .ltoreq. 380 < .lamda. .ltoreq. 400 < .lamda. .ltoreq. 420 < .lamda. .ltoreq. 440 < .lamda. .ltoreq. 460 < .lamda. .ltoreq. 480 < .lamda. .ltoreq. 340 360 380 400 420 440 460 480 500 4000K Ch4 0.00 0.27 0.38 0.30 0.69 5.32 46.45 65.52 100.00 4000K Ch2 0.00 0.42 0.66 0.65 3.29 22.60 65.24 58.44 100.00 4000K Ch3 0.00 0.21 0.33 0.33 0.98 10.07 60.41 62.79 100.00 5000K Ch1 0.00 0.00 0.01 0.14 1.81 22.85 63.41 68.18 100.00 Exemplary 1.sup.st 0.00 0.00 0.01 0.14 0.69 5.32 46.45 58.44 100.00 channels min Exemplary 1.sup.st 0.00 0.23 0.34 0.35 1.69 15.21 58.88 63.73 100.00 channels avg Exemplary 1.sup.st 0.00 0.42 0.66 0.65 3.29 22.85 65.24 68.18 100.00 channels max 500 < .lamda. .ltoreq. 520 < .lamda. .ltoreq. 540 < .lamda. .ltoreq. 520 540 560 4000K Ch4 61.95 50.58 58.48 4000K Ch2 82.69 72.40 71.27 4000K Ch3 64.55 57.10 67.65 5000K Ch1 67.44 57.95 57.60 Exemplary 1.sup.st 61.95 50.58 57.60 channels min Exemplary 1.sup.st 69.16 59.51 63.75 channels avg Exemplary 1.sup.st 82.69 72.40 71.27 channels max 560 < .lamda. .ltoreq. 580 < .lamda. .ltoreq. 600 < .lamda. .ltoreq. 620 < .lamda. .ltoreq. 640 < .lamda. .ltoreq. 660 < .lamda. .ltoreq. 680 < .lamda. .ltoreq. 700 < .lamda. .ltoreq. 720 < .lamda. .ltoreq. 580 600 620 640 660 680 700 720 740 4000K Ch4 70.03 82.09 85.56 75.93 65.14 58.42 25.41 14.66 8.62 4000K Ch2 79.40 93.63 104.78 102.56 86.67 63.02 40.55 23.98 13.58 4000K Ch3 80.05 92.00 94.61 83.41 70.77 62.40 28.04 16.34 9.66 5000K Ch1 57.72 62.16 68.16 75.24 75.70 52.76 30.19 15.99 8.33 Exemplary 1.sup.st 57.72 62.16 68.16 75.24 65.14 52.76 25.41 14.66 8.33 channels min Exemplary 1.sup.st 71.80 82.47 88.28 84.29 74.57 59.15 31.05 17.74 10.05 channels avg Exemplary 1.sup.st 80.05 93.63 104.78 102.56 86.67 63.02 40.55 23.98 13.58 channels max 740 < .lamda. .ltoreq. 760 < .lamda. .ltoreq. 780 < .lamda. .ltoreq. 760 780 800 4000K Ch4 4.90 2.85 0.00 4000K Ch2 7.34 3.79 0.00 4000K Ch3 5.52 3.22 0.00 5000K Ch1 4.35 2.21 0.00 Exemplary 1.sup.st 4.35 2.21 0.00 channels min Exemplary 1.sup.st 5.53 3.02 0.00 channels avg Exemplary 1.sup.st 7.34 3.79 0.00 channels max
TABLE-US-00051 TABLE 51 320 < .lamda. .ltoreq. 330 < .lamda. .ltoreq. 340 < .lamda. .ltoreq. 350 < .lamda. .ltoreq. 360 < .lamda. .ltoreq. 270 < .lamda. .ltoreq. 380 < .lamda. .ltoreq. 390 < .lamda. .ltoreq. 400 < .lamda. .ltoreq. 330 340 350 360 370 380 390 400 410 2400K Ch3 0.00 0.00 0.00 0.04 0.26 1.62 7.91 30.16 70.32 2400K Ch2 0.00 0.00 0.00 0.03 0.18 1.16 5.65 21.61 50.41 2400K Ch1 0.00 0.00 0.00 0.06 0.40 2.52 12.31 47.07 109.79 1800K Ch1 0.00 0.00 0.00 0.00 0.00 5.56 42.52 19.80 8.19 Exemplary 2.sup.nd 0.00 0.00 0.00 0.00 0.00 1.16 5.65 19.80 8.19 channels min Exemplary 2.sup.nd 0.00 0.00 0.00 0.03 0.21 2.71 17.09 29.66 59.67 channels avg Exemplary 2.sup.nd 0.00 0.00 0.00 0.06 0.40 5.56 42.52 47.07 109.79 channels max 410 < .lamda. .ltoreq. 420 < .lamda. .ltoreq. 430 < .lamda. .ltoreq. 420 430 440 2400K Ch3 59.07 27.46 11.12 2400K Ch2 42.34 19.67 7.95 2400K Ch1 92.21 42.85 17.31 1800K Ch1 3.91 3.64 5.74 Exemplary 2.sup.nd 3.91 3.64 5.74 channels min Exemplary 2.sup.nd 49.38 23.40 10.53 channels avg Exemplary 2.sup.nd 92.21 42.85 17.31 channels max 440 < .lamda. .ltoreq. 450 < .lamda. .ltoreq. 460 < .lamda. .ltoreq. 470 < .lamda. .ltoreq. 480 < .lamda. .ltoreq. 490 < .lamda. .ltoreq. 500 < .lamda. .ltoreq. 510 < .lamda. .ltoreq. 520 < .lamda. .ltoreq. 450 460 470 480 490 500 510 520 530 2400K Ch3 4.33 1.69 0.71 0.33 1.29 3.19 7.91 15.30 24.51 2400K Ch2 3.08 1.19 0.48 0.42 1.82 4.97 10.78 17.80 24.02 2400K Ch1 6.72 2.59 1.05 0.86 3.52 9.54 21.15 34.93 46.87 1800K Ch1 6.09 3.19 1.41 0.98 1.87 4.39 9.47 15.90 21.83 Exemplary 2.sup.nd 3.08 1.19 0.48 0.33 1.29 3.19 7.91 15.30 21.83 channels min Exemplary 2.sup.nd 5.05 2.16 0.91 0.65 2.13 5.52 12.33 20.98 29.31 channels avg Exemplary 2.sup.nd 6.72 3.19 1.41 0.98 3.52 9.54 21.15 34.93 46.87 channels max 530 < .lamda. .ltoreq. 540 < .lamda. .ltoreq. 550 < .lamda. .ltoreq. 540 550 560 2400K Ch3 32.93 38.51 41.59 2400K Ch2 27.83 29.59 29.81 2400K Ch1 54.30 57.64 58.70 1800K Ch1 26.26 30.08 34.05 Exemplary 2.sup.nd 26.26 29.59 29.81 channels min Exemplary 2.sup.nd 35.33 38.95 41.04 channels avg Exemplary 2.sup.nd 54.30 57.64 58.70 channels max 560 < .lamda. .ltoreq. 570 < .lamda. .ltoreq. 580 < .lamda. .ltoreq. 590 < .lamda. .ltoreq. 600 < .lamda. .ltoreq. 610 < .lamda. .ltoreq. 620 < .lamda. .ltoreq. 630 < .lamda. .ltoreq. 640 < .lamda. .ltoreq. 570 580 590 600 610 620 630 640 650 2400K Ch3 42.83 43.16 43.36 45.76 54.76 75.03 100.00 66.18 32.55 2400K Ch2 29.31 28.39 27.39 27.87 32.98 52.35 100.00 86.71 27.42 2400K Ch1 59.43 64.08 79.86 115.51 152.93 145.17 100.00 59.25 35.20 1800K Ch1 39.62 47.89 58.66 70.02 80.33 89.88 100.00 112.92 122.48 Exemplary 2.sup.nd 29.31 28.39 27.39 27.87 32.98 52.35 100.00 59.25 27.42 channels min Exemplary 2.sup.nd 42.80 45.88 52.32 64.79 80.25 90.61 100.00 81.26 54.41 channels avg Exemplary 2.sup.nd 59.43 64.08 79.86 115.51 152.93 145.17 100.00 112.92 122.48 channels max 650 < .lamda. .ltoreq. 660 < .lamda. .ltoreq. 670 < .lamda. .ltoreq. 660 670 680 2400K Ch3 22.04 17.39 14.17 2400K Ch2 11.91 7.93 6.02 2400K Ch1 22.72 16.72 12.37 1800K Ch1 115.54 96.01 75.48 Exemplary 2.sup.nd 11.91 7.93 6.02 channels min Exemplary 2.sup.nd 43.05 34.51 27.01 channels avg Exemplary 2.sup.nd 115.54 96.01 75.48 channels max 680 < .lamda. .ltoreq. 690 < .lamda. .ltoreq. 700 < .lamda. .ltoreq. 710 < .lamda. .ltoreq. 720 < .lamda. .ltoreq. 730 < .lamda. .ltoreq. 740 < .lamda. .ltoreq. 750 < .lamda. .ltoreq. 760 < .lamda. .ltoreq. 690 700 710 720 730 740 750 760 770 2400K Ch3 11.56 9.37 7.53 6.08 4.81 3.75 2.94 2.20 1.81 2400K Ch2 4.55 3.54 2.81 2.16 1.65 1.15 0.87 0.74 0.57 2400K Ch1 9.41 7.63 5.86 4.81 3.55 2.92 2.37 1.97 2.06 1800K Ch1 57.09 42.29 30.76 22.34 16.16 11.50 8.40 6.13 4.49 Exemplary 2.sup.nd 4.55 3.54 2.81 2.16 1.65 1.15 0.87 0.74 0.57 channels min Exemplary 2.sup.nd 20.65 15.71 11.74 8.85 6.54 4.83 3.64 2.76 2.23 channels avg Exemplary 2.sup.nd 57.09 42.29 30.76 22.34 16.16 11.50 8.40 6.13 4.49 channels max 770 < .lamda. .ltoreq. 780 < .lamda. .ltoreq. 790 < .lamda. .ltoreq. 780 790 800 2400K Ch3 1.30 0.00 0.00 2400K Ch2 0.37 0.00 0.00 2400K Ch1 1.20 0.00 0.00 1800K Ch1 3.01 0.00 0.00 Exemplary 2.sup.nd 0.37 0.00 0.00 channels min Exemplary 2.sup.nd 1.47 0.00 0.00 channels avg Exemplary 2.sup.nd 3.01 0.00 0.00 channels max
TABLE-US-00052 TABLE 52 320 < .lamda. .ltoreq. 330 < .lamda. .ltoreq. 340 < .lamda. .ltoreq. 350 < .lamda. .ltoreq. 360 < .lamda. .ltoreq. 370 < .lamda. .ltoreq. 380 < .lamda. .ltoreq. 390 < .lamda. .ltoreq. 400 < .lamda. .ltoreq. 330 340 350 360 370 380 390 400 410 4000K Ch4 0.00 0.00 0.05 0.48 0.41 0.33 0.28 0.31 0.46 4000K Ch2 0.00 0.00 0.08 0.78 0.70 0.63 0.60 0.71 1.61 4000K Ch3 0.00 0.00 0.04 0.37 0.34 0.30 0.29 0.35 0.58 5000K Ch1 0.00 0.00 0.00 0.00 0.00 0.02 0.17 0.15 0.35 Exemplary 1.sup.st 0.00 0.00 0.00 0.00 0.00 0.02 0.17 0.15 0.35 channels min Exemplary 1.sup.st 0.00 0.00 0.04 0.41 0.36 0.32 0.34 0.38 0.75 channels avg Exemplary 1.sup.st 0.00 0.00 0.08 0.78 0.70 0.63 0.60 0.71 1.61 channels max 410 < .lamda. .ltoreq. 420 < .lamda. .ltoreq. 430 < .lamda. .ltoreq. 420 430 440 4000K Ch4 0.90 2.35 8.04 4000K Ch2 5.09 13.75 32.22 4000K Ch3 1.35 4.22 15.53 5000K Ch1 1.50 6.59 25.07 Exemplary 1.sup.st 0.90 2.35 8.04 channels min Exemplary 1.sup.st 2.21 6.73 20.22 channels avg Exemplary 1.sup.st 5.09 13.75 32.22 channels max 440 < .lamda. .ltoreq. 450 < .lamda. .ltoreq. 460 < .lamda. .ltoreq. 470 < .lamda. .ltoreq. 480 < .lamda. .ltoreq. 490 < .lamda. .ltoreq. 500 < .lamda. .ltoreq. 510 < .lamda. .ltoreq. 520 < .lamda. .ltoreq. 450 460 470 480 490 500 510 520 530 4000K Ch4 29.43 61.23 58.55 69.32 100.00 95.19 68.51 52.40 48.14 4000K Ch2 63.32 69.39 51.86 67.01 100.00 103.41 88.51 79.68 74.88 4000K Ch3 49.12 69.39 55.36 67.81 100.00 96.18 70.57 56.06 53.84 5000K Ch1 83.73 95.32 87.91 118.29 100.00 89.11 79.33 76.46 75.98 Exemplary 1.sup.st 29.43 61.23 51.86 67.01 100.00 89.11 68.51 52.40 48.14 channels min Exemplary 1.sup.st 56.40 73.83 63.42 80.61 100.00 95.97 76.73 66.15 63.21 channels avg Exemplary 1.sup.st 83.73 95.32 87.91 118.29 100.00 103.41 88.51 79.68 75.98 channels max 530 < .lamda. .ltoreq. 540 < .lamda. .ltoreq. 550 < .lamda. .ltoreq. 540 550 560 4000K Ch4 50.59 54.63 59.52 4000K Ch2 72.39 71.61 73.35 4000K Ch3 58.18 63.52 69.19 5000K Ch1 76.69 76.73 75.98 Exemplary 1.sup.st 50.59 54.63 59.52 channels min Exemplary 1.sup.st 64.46 66.62 69.51 channels avg Exemplary 1.sup.st 76.69 76.73 75.98 channels max 560 < .lamda. .ltoreq. 570 < .lamda. .ltoreq. 580 < .lamda. .ltoreq. 590 < .lamda. .ltoreq. 600 < .lamda. .ltoreq. 610 < .lamda. .ltoreq. 620 < .lamda. .ltoreq. 630 < .lamda. .ltoreq. 640 < .lamda. .ltoreq. 570 580 590 600 610 620 630 640 650 4000K Ch4 65.20 71.49 77.71 82.52 84.37 82.62 77.44 70.77 64.70 4000K Ch2 77.63 83.86 91.48 98.97 105.06 108.06 106.77 101.86 93.61 4000K Ch3 75.29 81.76 87.93 92.55 94.00 91.61 85.60 78.02 71.00 5000K Ch1 74.89 75.31 77.41 79.89 82.43 84.24 87.47 94.30 100.45 Exemplary 1.sup.st 65.20 71.49 77.41 79.89 82.43 82.62 77.44 70.77 64.70 channels min Exemplary 1.sup.st 73.25 78.10 83.63 88.48 91.47 91.63 89.32 86.24 82.44 channels avg Exemplary 1.sup.st 77.63 83.86 91.48 98.97 105.06 108.06 106.77 101.86 100.45 channels max 650 < .lamda. .ltoreq. 660 < .lamda. .ltoreq. 670 < .lamda. .ltoreq. 660 670 680 4000K Ch4 62.44 66.81 47.21 4000K Ch2 82.68 70.31 57.88 4000K Ch3 67.84 71.44 50.98 5000K Ch1 94.12 77.38 60.02 Exemplary 1.sup.st 62.44 66.81 47.21 channels min Exemplary 1.sup.st 76.77 71.48 54.02 channels avg Exemplary 1.sup.st 94.12 77.38 60.02 channels max 680 < .lamda. .ltoreq. 690 < .lamda. .ltoreq. 700 < .lamda. .ltoreq. 710 < .lamda. .ltoreq. 720 < .lamda. .ltoreq. 730 < .lamda. .ltoreq. 740 < .lamda. .ltoreq. 750 < .lamda. .ltoreq. 760 < .lamda. .ltoreq. 690 700 710 720 730 740 750 760 770 4000K Ch4 28.56 21.04 16.09 12.52 9.54 7.29 5.50 4.07 3.17 4000K Ch2 46.42 36.07 27.73 21.05 15.78 11.85 8.63 6.29 4.50 4000K Ch3 31.57 23.45 18.00 14.05 10.74 8.22 6.22 4.61 3.61 5000K Ch1 45.22 33.23 24.15 17.38 12.51 8.98 6.52 4.67 3.43 Exemplary 1.sup.st 28.56 21.04 16.09 12.52 9.54 7.29 5.50 4.07 3.17 channels min Exemplary 1.sup.st 37.94 28.44 21.49 16.25 12.14 9.08 6.72 4.91 3.68 channels avg Exemplary 1.sup.st 46.42 36.07 27.73 21.05 15.78 11.85 8.63 6.29 4.50 channels max 770 < .lamda. .ltoreq. 780 < .lamda. .ltoreq. 790 < .lamda. .ltoreq. 780 790 800 4000K Ch4 2.40 0.00 0.00 4000K Ch2 3.21 0.00 0.00 4000K Ch3 2.72 0.00 0.00 5000K Ch1 2.24 0.00 0.00 Exemplary 1.sup.st 2.24 0.00 0.00 channels min Exemplary 1.sup.st 2.64 0.00 0.00 channels avg Exemplary 1.sup.st 3.21 0.00 0.00 channels max
TABLE-US-00053 TABLE 53 400 < .lamda. .ltoreq. 470 < .lamda. .ltoreq. 530 < .lamda. .ltoreq. 600 < .lamda. .ltoreq. 630 < .lamda. .ltoreq. 470 nm 510 nm 570 nm 630 nm 780 nm 2400K Ch3 14.063 1.000 12.431 18.374 16.714 2400K Ch2 7.136 1.000 6.611 10.443 9.461 2400K Ch1 7.971 1.000 6.693 11.715 5.576 1800K Ch1 1.990 1.000 7.873 16.512 43.711 Exemplary 2.sup.nd 1.990 1.000 6.611 10.443 5.576 channels min Exemplary 2.sup.nd 7.790 1.000 8.402 14.261 18.866 channels avg Exemplary 2.sup.nd 14.063 1.000 12.431 18.374 43.711 channels max 4000K Ch4 0.475 1.000 0.693 0.746 1.268 4000K Ch2 0.652 1.000 0.830 0.906 1.643 4000K Ch3 0.575 1.000 0.799 0.825 1.385 5000K Ch1 0.634 1.000 0.652 0.596 1.493 Exemplary 1.sup.st 0.475 1.000 0.652 0.596 1.268 channels min Exemplary 1.sup.st 0.584 1.000 0.744 0.769 1.447 channels avg Exemplary 1.sup.st 0.652 1.000 0.830 0.906 1.643 channels max
TABLE-US-00054 TABLE 54 EML Slope vs. CCT (per 1000K) for Pairings of Exemplary First/Second Lighting Channels 4000K Ch 1 4000K Ch2 4000K Ch3 4000K Ch4 5000K Ch1 2400K Ch1 0.305 0.363 0.374 0.396 0.305 2400K Ch2 0.284 0.342 0.353 0.375 0.292 2400K Ch3 0.320 0.377 0.389 0.411 0.314 1800K Ch1 0.265 0.307 0.315 0.332 0.277
TABLE-US-00055 TABLE 55 EML Ratio of First Lighting Channel to Second Lighting Channel for Pairings of Exemplary First/Second Lighting Channels 4000K Ch1 4000K Ch2 4000K Ch3 4000K Ch4 5000K Ch1 2400K Ch1 2.6 2.9 2.9 3.1 3.6 2400K Ch2 2.3 2.6 2.6 2.8 3.2 2400K Ch3 2.8 3.1 3.1 3.3 3.9 1800K Ch1 3.7 4.2 4.2 4.4 5.2
TABLE-US-00056 TABLE 56 % Spectral Energy in Wavelength Range vs. Total Energy 320 nm to 800 nm 400 < .lamda. .ltoreq. 410 < .lamda. .ltoreq. 420 < .lamda. .ltoreq. 430 < .lamda. .ltoreq. 440 < .lamda. .ltoreq. 450 < .lamda. .ltoreq. 460 < .lamda. .ltoreq. 470 < .lamda. .ltoreq. 480 < .lamda. .ltoreq. 410 420 430 440 450 460 470 480 490 2400K Ch3 7.11 5.97 2.78 1.12 0.44 0.17 0.071 0.033 0.13 2400K Ch2 6.65 5.59 2.60 1.05 0.41 0.16 0.064 0.056 0.24 2400K Ch1 7.19 6.04 2.81 1.13 0.44 0.17 0.069 0.056 0.23 1800K Ch1 0.56 0.27 0.25 0.39 0.42 0.22 0.097 0.067 0.13 Exemplary 2.sup.nd 0.56 0.27 0.25 0.39 0.41 0.16 0.064 0.033 0.13 channels min Exemplary 2.sup.nd 5.38 4.47 2.11 0.93 0.43 0.18 0.075 0.053 0.18 channels avg Exemplary 2.sup.nd 7.19 6.04 2.81 1.13 0.44 0.22 0.097 0.067 0.24 channels max 4000K Ch4 0.03 0.05 0.14 0.47 1.71 3.55 3.40 4.02 5.80 4000K Ch2 0.07 0.23 0.62 1.44 2.84 3.11 2.32 3.00 4.48 4000K Ch3 0.03 0.07 0.22 0.82 2.58 3.64 2.91 3.56 5.25 5000K Ch1 0.02 0.07 0.30 1.13 3.78 4.30 3.97 5.34 4.51 Exemplary 1.sup.st 0.02 0.05 0.14 0.47 1.71 3.11 2.32 3.00 4.48 channels min Exemplary 1.sup.st 0.04 0.10 0.32 0.96 2.73 3.65 3.15 3.98 5.01 channels avg Exemplary l.sup.st 0.07 0.23 0.62 1.44 3.78 4.30 3.97 5.34 5.80 channels max % Spectral Energy in Wavelength Range vs. Total Energy 320 nm to 800 nm 490 < .lamda. .ltoreq. 500 < .lamda. .ltoreq. 510 < .lamda. .ltoreq. 500 510 520 2400K Ch3 0.32 0.80 1.55 2400K Ch2 0.66 1.42 2.35 2400K Ch1 0.62 1.38 2.29 1800K Ch1 0.30 0.65 1.09 Exemplary 2.sup.nd 0.30 0.65 1.09 channels min Exemplary 2.sup.nd 0.48 1.06 1.82 channels avg Exemplary 2.sup.nd 0.66 1.42 2.35 channels max 4000K Ch4 5.52 3.97 3.04 4000K Ch2 4.63 3.97 3.57 4000K Ch3 5.05 3.71 2.94 5000K Ch1 4.02 3.58 3.45 Exemplary 1.sup.st 4.02 3.58 2.94 channels min Exemplary 1.sup.st 4.81 3.81 3.25 channels avg Exemplary l.sup.st 5.52 3.97 3.57 channels max
TABLE-US-00057 TABLE 57 ANSI Nominal CCT Center Tolerance Boundaries Boundary CCT duv dCCT dduv Center 1 2 3 4 2200 2238 -0.0942 .+-.102 .+-.5.3 Cx 0.5018 0.4838 0.5046 0.5262 0.5025 Cy 0.4153 0.3977 0.4007 0.4381 0.4348 2500 2470 -0.3065 .+-.109 .+-.5.7 Cx 0.4792 0.4593 0.4838 0.5025 0.4813 Cy 0.4131 0.3944 0.3977 0.4348 0.4319 2700 2725 -0.0837 .+-.145 .+-.6.0 Cx 0.4578 0.4813 0.4562 0.4373 0.4593 Cy 0.4101 0.4319 0.4260 0.3893 0.3944 3000 3045 -0.0773 .+-.175 .+-.6.0 Cx 0.4338 0.4562 0.4299 0.4147 0.4373 Cy 0.403 0.4260 0.4165 0.3814 0.3893 3500 3464 -0.0698 .+-.245 .+-.6.0 Cx 0.4073 0.4299 0.3996 0.3889 0.4147 Cy 0.3917 0.4165 0.4015 0.369 0.3814 4000 3985 0.9845 .+-.275 .+-.6.0 Cx 0.3818 0.4006 0.3736 0.3670 0.3898 Cy 0.3797 0.4044 0.3874 0.3578 0.3716 5000 5027 2.0112 .+-.283 .+-.6.0 Cx 0.3447 0.3551 0.3376 0.3366 0.3515 Cy 0.3553 0.376 0.3616 0.3369 0.3487 5700 5666 2.0235 .+-.355 .+-.6.0 Cx 0.3287 0.3376 0.3207 0.3222 0.3366 Cy 0.3417 0.3616 0.3462 0.3243 0.3369 6500 6532 2.9989 .+-.510 .+-.6.0 Cx 0.3123 0.3205 0.3028 0.3068 0.3221 Cy 0.3282 0.3481 0.3304 0.3113 0.3261
TABLE-US-00058 TABLE 58 380 < .lamda. .ltoreq. 420 < .lamda. .ltoreq. 460 < .lamda. .ltoreq. 500 < .lamda. .ltoreq. 540 < .lamda. .ltoreq. 580 < .lamda. .ltoreq. 620 < .lamda. .ltoreq. 660 < .lamda. .ltoreq. 700 < .lamda. .ltoreq. 740 < .lamda. .ltoreq. 420 460 500 540 580 620 660 700 740 780 Red 0.2 1.4 0.7 7.3 22.3 59.8 100.0 61.2 18.1 4.9 Cyan 0.7 15.9 33.5 98.2 100.0 68.6 47.1 22.1 6.3 1.7
TABLE-US-00059 TABLE 59 380 < .lamda. .ltoreq. 400 < .lamda. .ltoreq. 420 < .lamda. .ltoreq. 440 < .lamda. .ltoreq. 460 < .lamda. .ltoreq. 480 < .lamda. .ltoreq. 500 < .lamda. .ltoreq. 520 < .lamda. .ltoreq. 540 < .lamda. .ltoreq. 560 < .lamda. .ltoreq. 580 < .lamda. .ltoreq. 400 420 440 460 480 500 520 540 560 580 600 Red 0.0 0.3 1.4 1.3 0.4 0.9 4.2 9.4 15.3 26.4 45.8 Cyan 0.2 1.2 8.1 22.2 17.5 46.3 88.2 98.5 100.0 90.2 73.4 600 < .lamda. .ltoreq. 620 < .lamda. .ltoreq. 640 < .lamda. .ltoreq. 660 < .lamda. .ltoreq. 680 < .lamda. .ltoreq. 700 < .lamda. .ltoreq. 720 < .lamda. .ltoreq. 740 < .lamda. .ltoreq. 760 < .lamda. .ltoreq. 780 < .lamda. .ltoreq. 620 640 660 680 700 720 740 760 780 800 Red 66.0 87.0 100.0 72.5 42.0 22.3 11.6 6.1 3.1 0.0 Cyan 57.0 48.1 41.4 27.0 15.1 7.9 4.0 2.1 1.0 0.0
TABLE-US-00060 TABLE 60 White Cyan Red Channel Channel Channel Relative Relative Relative CCT duv Intensity Intensity Intensity Ra R9 ccx ccy Rf Rg COI R13 R15 LER CLA CS 3200 0.53 0.57 0.22 0.21 89.9 59.6 0.424 0.4005 88 102 2.42 90.1 87.3 296.5 1007 0.531 3102 0.31 0.52 0.24 0.24 90.8 63.8 0.4303 0.4024 89 102 2.82 91.2 88.6 292.8 977 0.527 3001 -0.04 0.47 0.26 0.27 91.7 67.7 0.4368 0.4039 89 102 3.42 92.2 89.9 288.9 946 0.522 2903 0.39 0.42 0.28 0.30 92.6 71.7 0.4446 0.4075 90 102 93.3 91.0 285.3 909 0.516 2801 0.31 0.37 0.30 0.33 93.5 75.1 0.4522 0.4095 91 103 94.3 92.1 281.1 873 0.510 2702 0.68 0.32 0.31 0.37 94.4 78.4 0.4609 0.4126 91 103 95.3 93.0 276.9 833 0.503 2599 -0.1 0.27 0.32 0.41 95.0 80.1 0.4681 0.412 91 104 96.2 93.8 272.0 801 0.497 2509 0.66 0.23 0.33 0.44 95.7 82.5 0.4774 0.4156 92 103 97.0 94.4 268.1 758 0.488 2403 0.46 0.18 0.33 0.48 96.3 83.5 0.4867 0.4161 92 103 97.7 94.9 262.9 717 0.479 2296 -0.09 0.14 0.33 0.52 96.6 83.4 0.4959 0.4149 92 104 98.3 95.0 257.2 677 0.469 2203 -0.18 0.11 0.33 0.57 96.7 82.9 0.5049 0.4146 91 104 98.6 94.9 252.1 636 0.459 2099 0.19 0.07 0.32 0.61 96.8 81.9 0.5165 0.4152 92 103 98.7 94.5 246.4 585 0.444 2010 -0.28 0.04 0.30 0.66 96.4 79.4 0.525 0.4126 90 104 98.5 93.8 241.0 547 0.431 1902 -0.37 0.01 0.27 0.72 95.8 75.6 0.5366 0.4101 89 103 97.7 92.4 234.3 494 0.413 1797 -0.12 0.00 0.23 0.77 94.9 70.8 0.5493 0.4078 88 102 96.5 90.5 227.6 436 0.389
[0198] Those of ordinary skill in the art will appreciate that a variety of materials can be used in the manufacturing of the components in the devices and systems disclosed herein. Any suitable structure and/or material can be used for the various features described herein, and a skilled artisan will be able to select an appropriate structures and materials based on various considerations, including the intended use of the systems disclosed herein, the intended arena within which they will be used, and the equipment and/or accessories with which they are intended to be used, among other considerations. Conventional polymeric, metal-polymer composites, ceramics, and metal materials are suitable for use in the various components. Materials hereinafter discovered and/or developed that are determined to be suitable for use in the features and elements described herein would also be considered acceptable.
[0199] When ranges are used herein for physical properties, such as molecular weight, or chemical properties, such as chemical formulae, all combinations, and subcombinations of ranges for specific exemplar therein are intended to be included.
[0200] The disclosures of each patent, patent application, and publication cited or described in this document are hereby incorporated herein by reference, in its entirety.
[0201] Those of ordinary skill in the art will appreciate that numerous changes and modifications can be made to the exemplars of the disclosure and that such changes and modifications can be made without departing from the spirit of the disclosure. It is, therefore, intended that the appended claims cover all such equivalent variations as fall within the true spirit and scope of the disclosure.
* * * * *
D00000
D00001
D00002
D00003
D00004
D00005
D00006
D00007
D00008
D00009
D00010
D00011
D00012
D00013
D00014
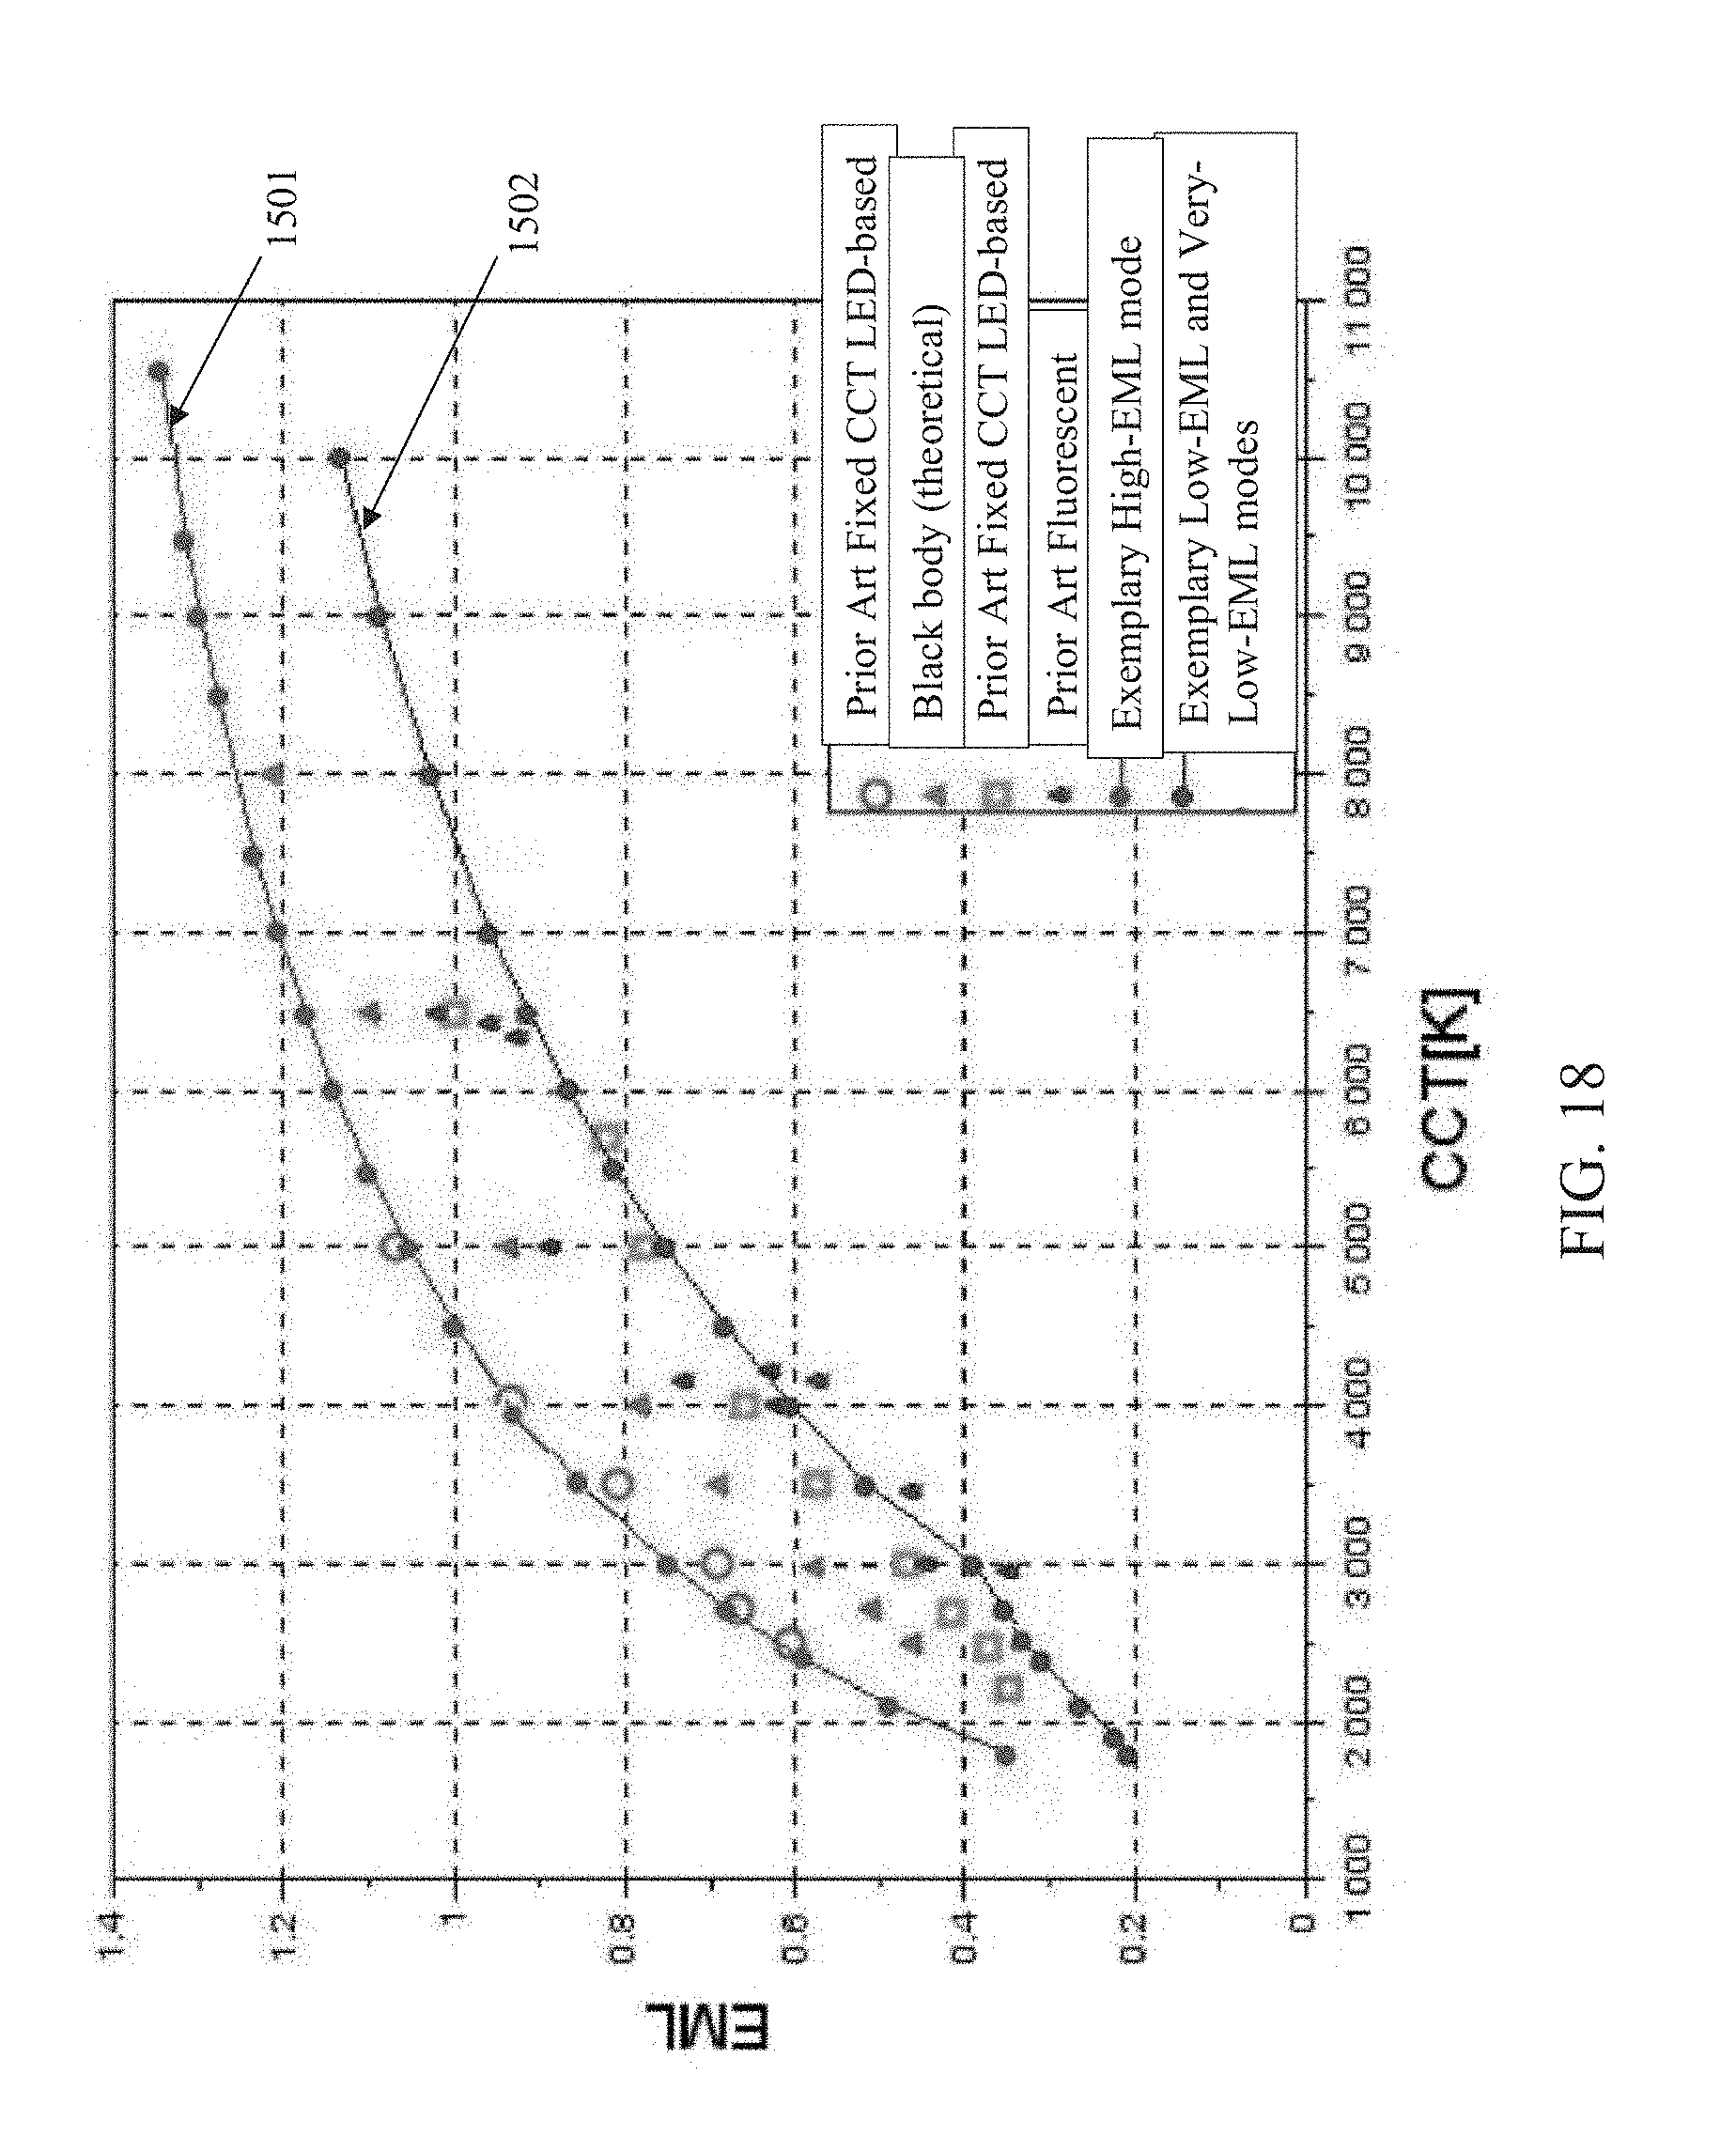
D00015

D00016
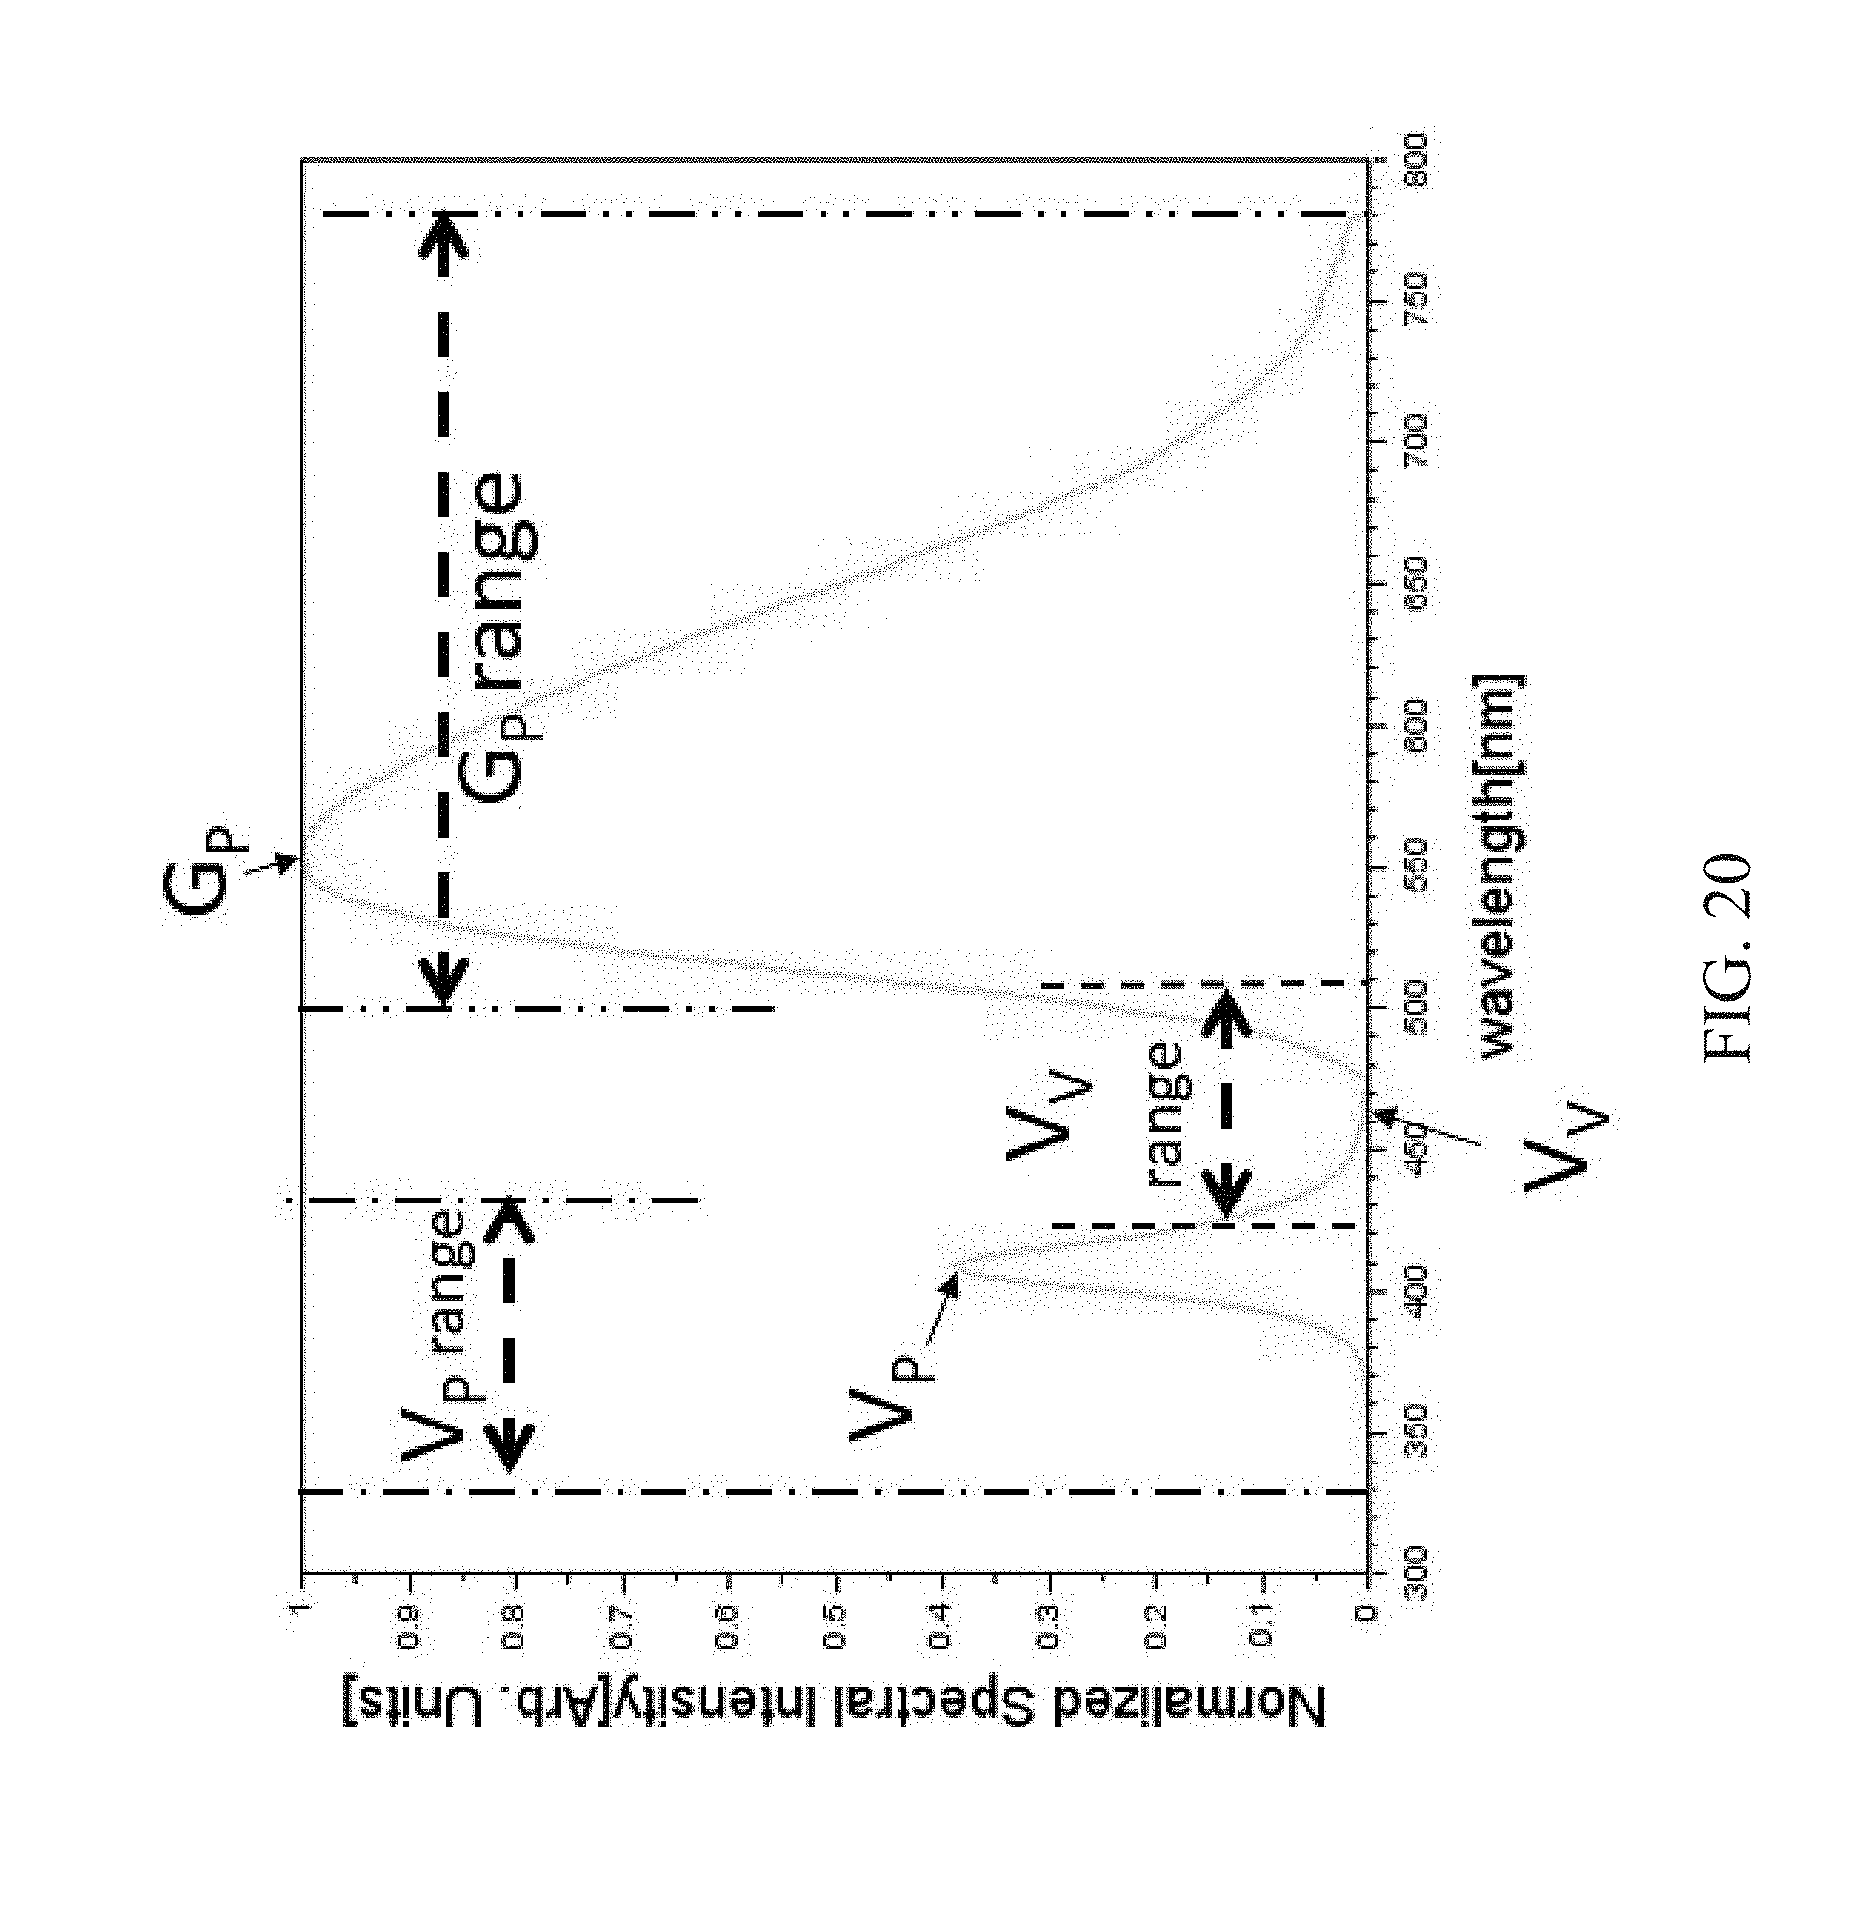
D00017

D00018
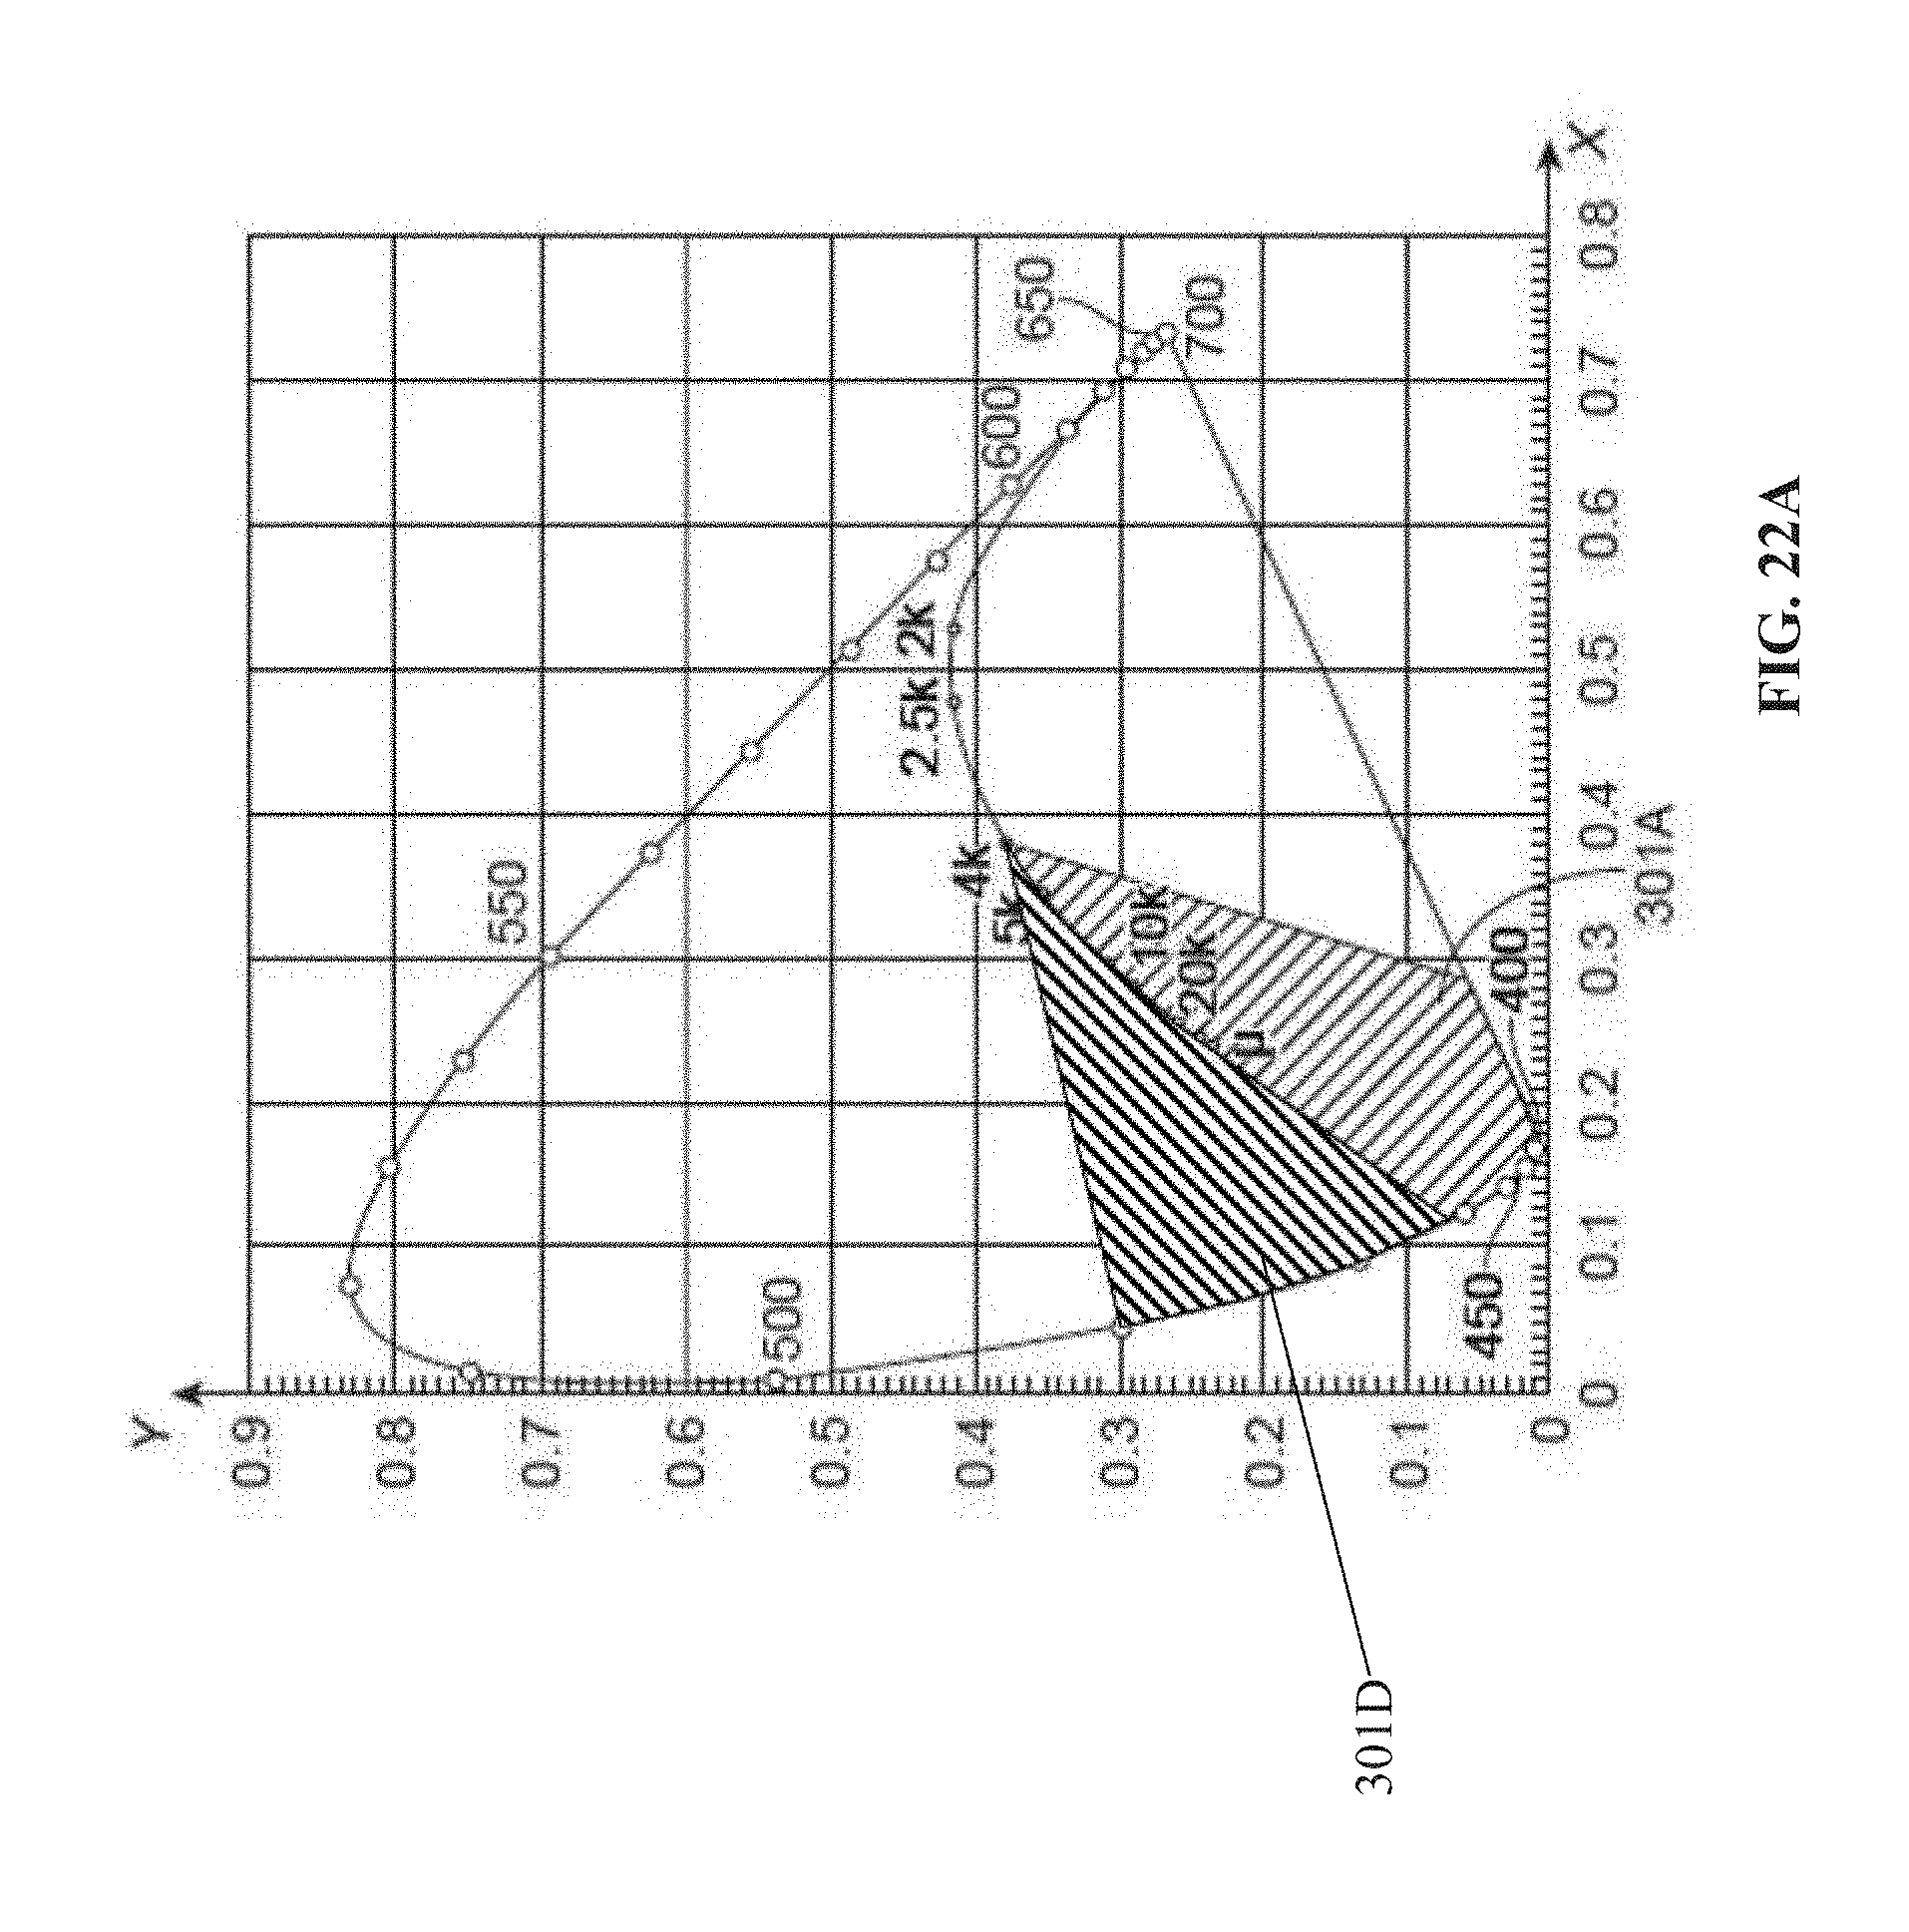
D00019
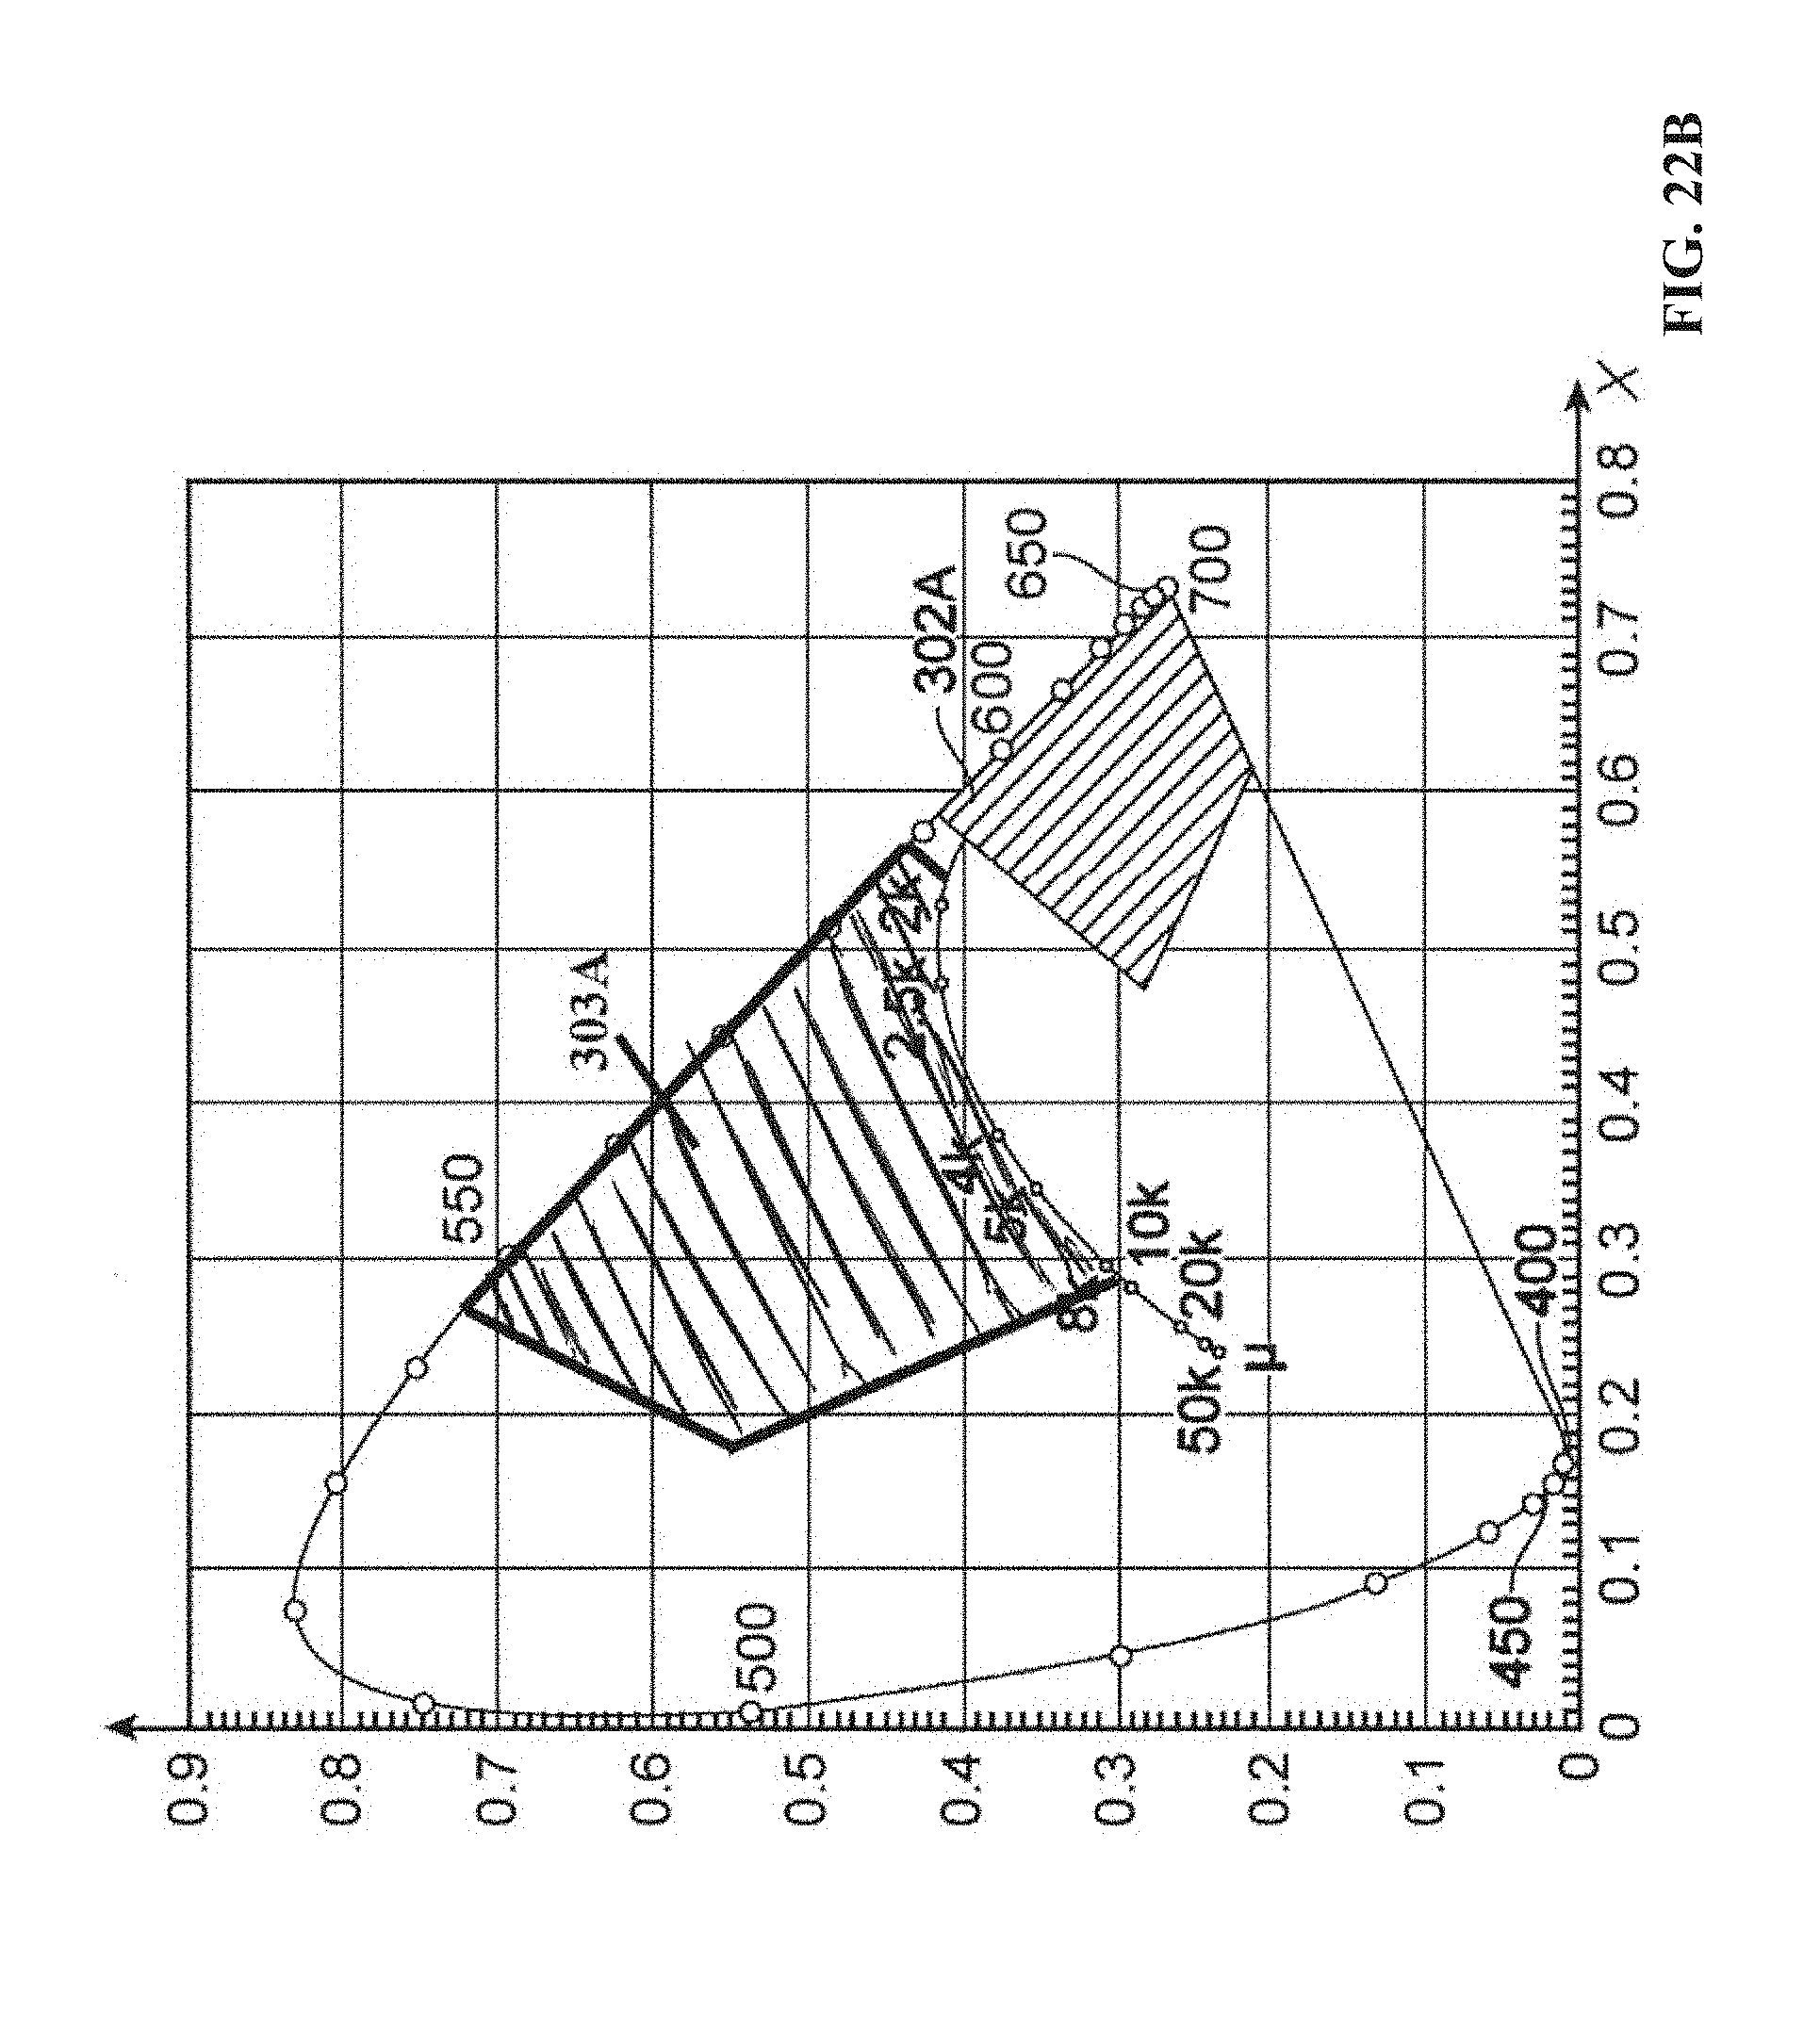
D00020
D00021
D00022
D00023
D00024
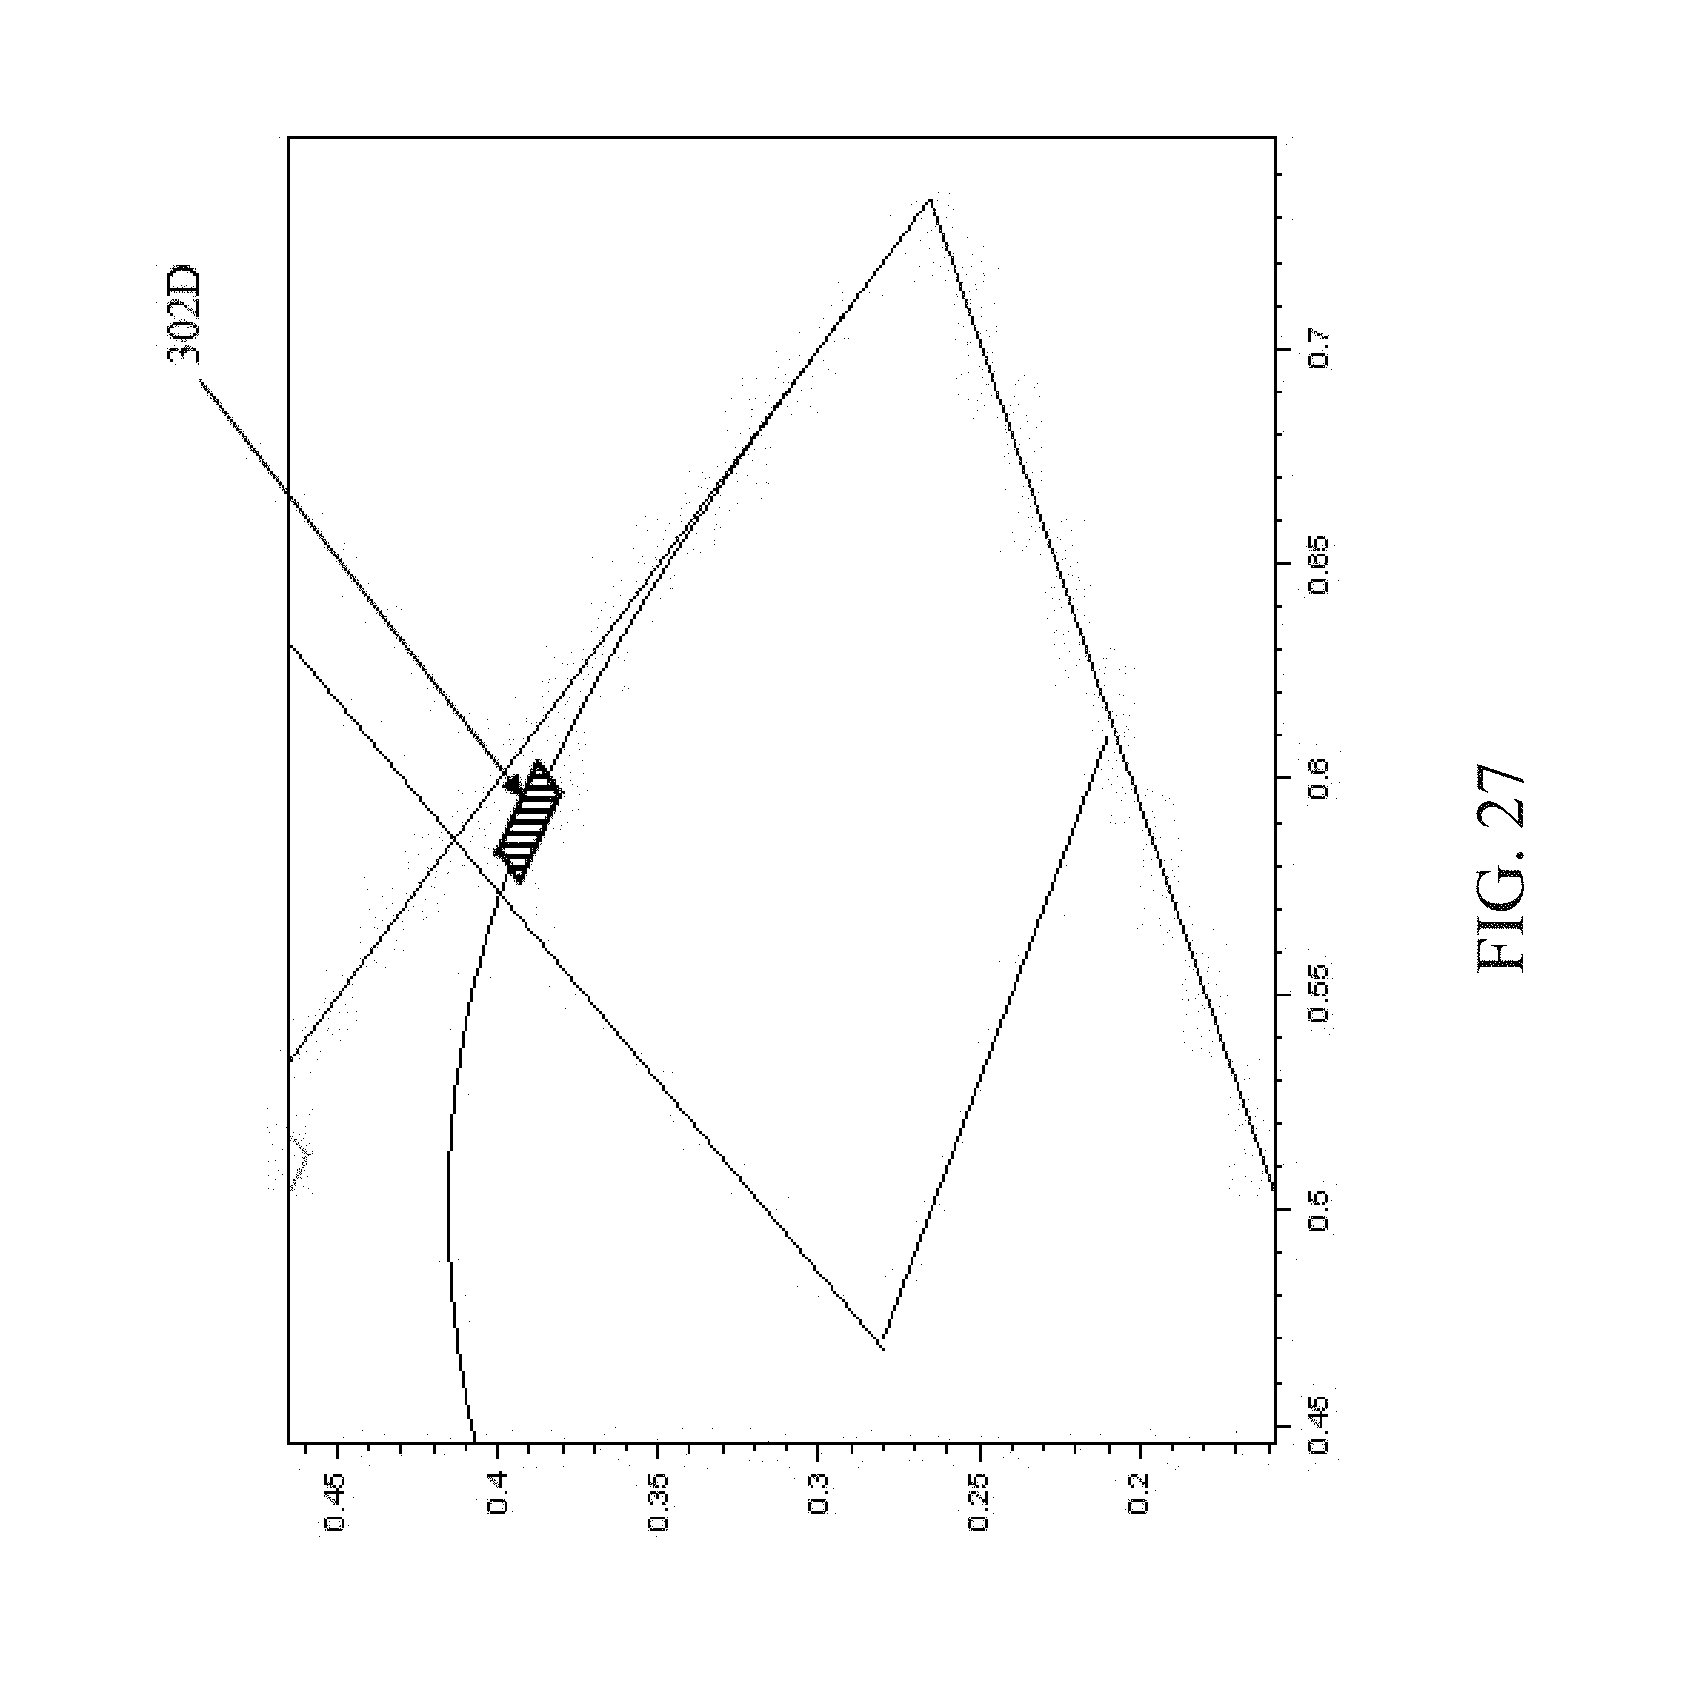
D00025
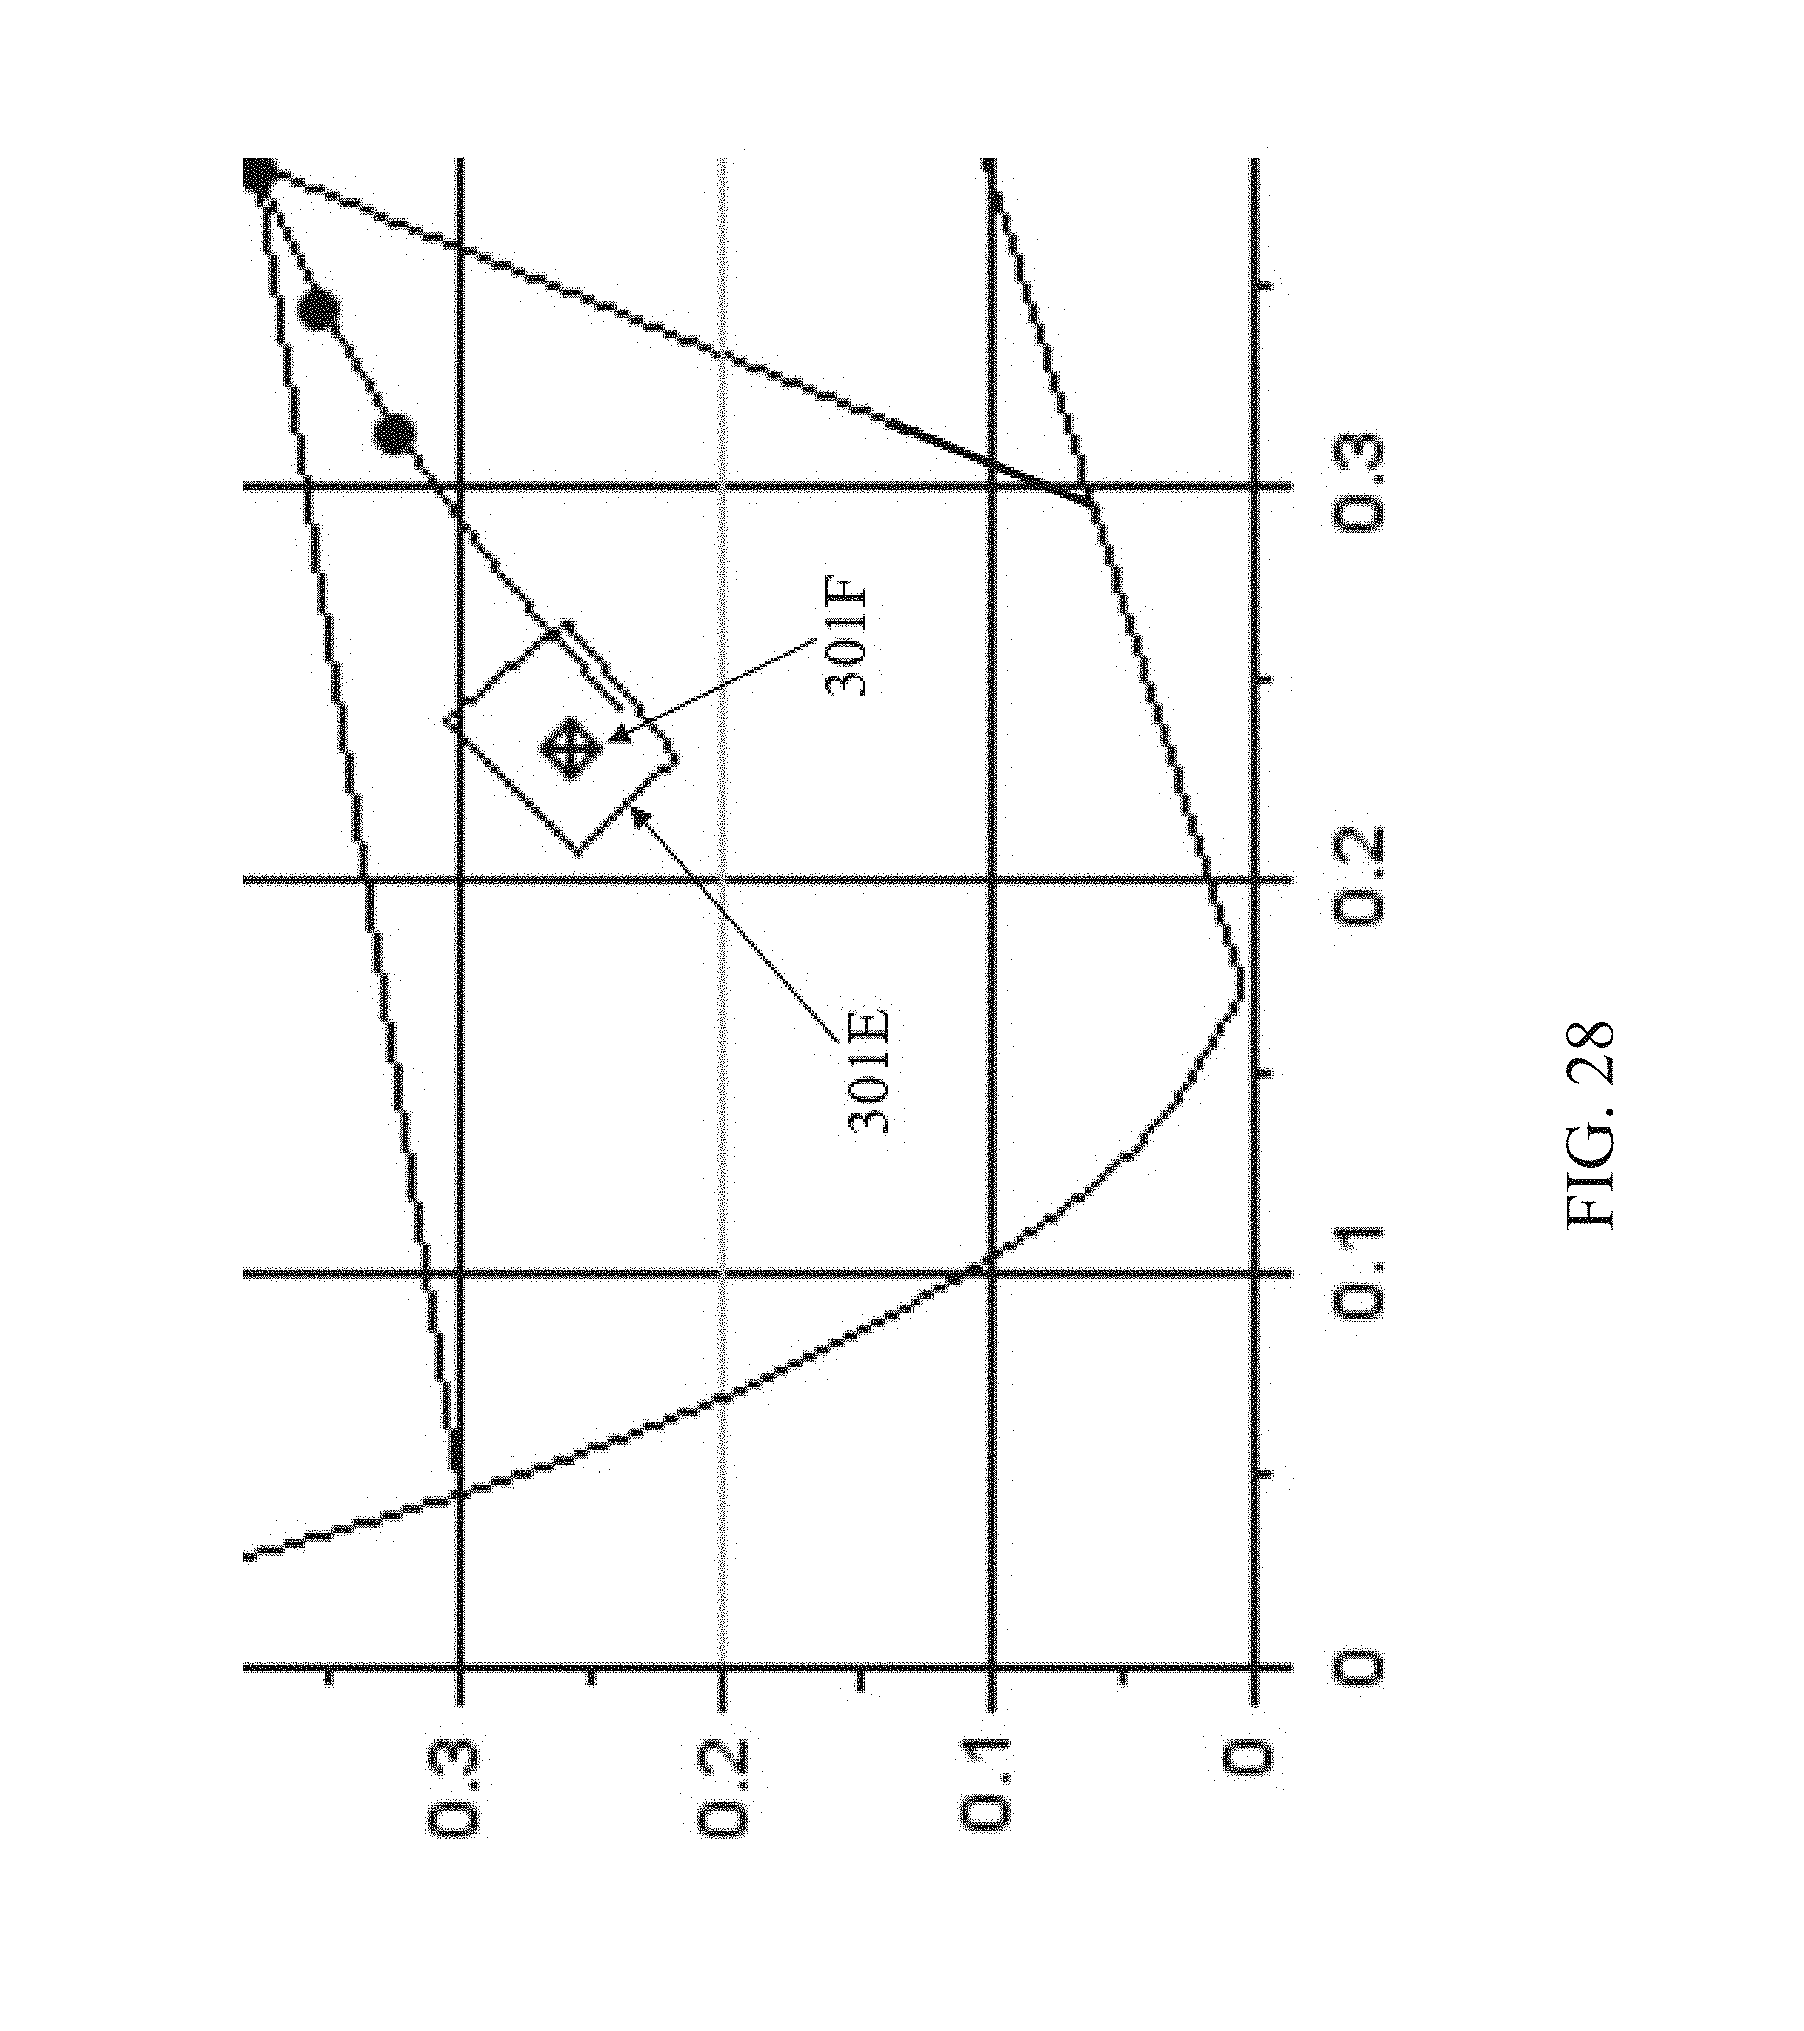


XML
uspto.report is an independent third-party trademark research tool that is not affiliated, endorsed, or sponsored by the United States Patent and Trademark Office (USPTO) or any other governmental organization. The information provided by uspto.report is based on publicly available data at the time of writing and is intended for informational purposes only.
While we strive to provide accurate and up-to-date information, we do not guarantee the accuracy, completeness, reliability, or suitability of the information displayed on this site. The use of this site is at your own risk. Any reliance you place on such information is therefore strictly at your own risk.
All official trademark data, including owner information, should be verified by visiting the official USPTO website at www.uspto.gov. This site is not intended to replace professional legal advice and should not be used as a substitute for consulting with a legal professional who is knowledgeable about trademark law.