Raptor Automated Condition Monitoring
Rich; Michael David ; et al.
U.S. patent application number 16/277038 was filed with the patent office on 2019-08-15 for raptor automated condition monitoring. This patent application is currently assigned to Online Development, Inc.. The applicant listed for this patent is Michael David Rich, Keith Allen Walton. Invention is credited to Michael David Rich, Keith Allen Walton.
| Application Number | 20190250585 16/277038 |
| Document ID | / |
| Family ID | 67541625 |
| Filed Date | 2019-08-15 |

| United States Patent Application | 20190250585 |
| Kind Code | A1 |
| Rich; Michael David ; et al. | August 15, 2019 |
RAPTOR AUTOMATED CONDITION MONITORING
Abstract
A method for automated condition monitoring whereby techniques of automated vibration analysis and signal processing are combined with deep learning/machine learning techniques for an enhanced system of automated anomaly detection, problem classification, and problem regression. The method may be implemented in software, firmware or hardware to run autonomously. Machines monitored and analyzed according to the disclosed method are typically found in industrial plants or commercial applications, but the disclosed invention may be applied to any rotating equipment such as motors, fans, pumps, compressors, and etc., in any environment where they are functioning.
| Inventors: | Rich; Michael David; (Clinton, TN) ; Walton; Keith Allen; (Abingdon, VA) | ||||||||||
| Applicant: |
|
||||||||||
|---|---|---|---|---|---|---|---|---|---|---|---|
| Assignee: | Online Development, Inc. Knoxville TN |
||||||||||
| Family ID: | 67541625 | ||||||||||
| Appl. No.: | 16/277038 | ||||||||||
| Filed: | February 15, 2019 |
Related U.S. Patent Documents
| Application Number | Filing Date | Patent Number | ||
|---|---|---|---|---|
| 62631054 | Feb 15, 2018 | |||
| Current U.S. Class: | 1/1 |
| Current CPC Class: | G05B 19/4065 20130101; G05B 2219/37256 20130101; G05B 2219/34048 20130101; B23Q 17/12 20130101; G05B 2219/37434 20130101; G06N 20/00 20190101; G05B 2219/37351 20130101; B23Q 17/0971 20130101 |
| International Class: | G05B 19/4065 20060101 G05B019/4065; B23Q 17/09 20060101 B23Q017/09; G06N 20/00 20060101 G06N020/00 |
Claims
1. A method for determining wear conditions in a machine that produces vibration of in mechanical parts, said method comprising the steps of: Monitoring said machine to collect and store data representing waveform and spectrum in mechanical vibrations of the said machine; Determining at least one synchronous harmonic family within said data that is collected and stored, wherein said synchronous harmonic family represents a fundamental frequency and integral multiples of said fundamental frequency; Determining at least one non-synchronous harmonic family within said data that is collected and stored, wherein said non-synchronous harmonic family represents a signals that repeat at frequencies that are not integral multiples of said fundamental frequency; Associating the non-synchronous harmonic family data with specific mechanical components of said machine; Identifying waveform sidebands and spectrum sidebands that correspond to each member of said synchronous harmonic family or each member of said non-harmonic family or families, wherein said sidebands are identified according to either amplitude modulation or frequency modulation or both amplitude and frequency modulation in comparison to the member signal of said synchronous or non-synchronous harmonic family; and Identifying trends in the members of said synchronous harmonic families, the members of said non-synchronous harmonic families, and/or the sidebands of said members of said synchronous harmonic families or the sidebands of said member of said non-synchronous harmonic families that correspond to abnormal wear of said machine components or abnormal operation of said machine.
2. The method of claim 1 wherein said step of identifying trends includes comparing the amplitude of the members of said non-synchronous harmonic families, and/or the sidebands of said members of said synchronous harmonic families or the sidebands of said member of said non-synchronous harmonic families to the progression of mechanical wear in said machine components or in said machine.
3. The method of claim 1 wherein said step of identifying trends includes comparing the frequency of the members of said non-synchronous harmonic families, and/or the sidebands of said members of said synchronous harmonic families or the sidebands of said member of said non-synchronous harmonic families to the progression of mechanical wear in said machine components or in said machine.
4. The method of claim 1 wherein said step of identifying trends includes comparing two or more members of said synchronous harmonic family to the progression of mechanical wear of said machine components or in said machine.
5. The method of claim 1 wherein said step of identifying trends includes comparing two or more members of said non-synchronous harmonic family to the progression of mechanical wear of said machine components or in said machine.
6. The method of claim 1 wherein said step of identifying trends includes comparing two or more sidebands of members of said synchronous harmonic family to the progression of mechanical wear of said machine components or in said machine.
7. The method of claim 1 wherein said step of identifying trends includes comparing two or more sidebands of members of said non-synchronous harmonic family to the progression of mechanical wear of said machine components or in said machine.
8. The method of claim 1 wherein said step of identifying trends includes comparing two or more sidebands of members of two or more non-synchronous harmonic families to the progression of mechanical wear of said machine components or in said machine.
9. The method of claim 1 wherein said synchronous harmonic family is identified according to the total energy corresponding to the members of said synchronous harmonic family.
10. The method of claim 1 wherein said non-synchronous harmonic family is identified according to the total energy corresponding to the members of said non-synchronous harmonic family.
Description
BACKGROUND OF THE INVENTION
Field of the Invention
[0001] The presently disclosed invention relates to automated methods for monitoring the performance of machines by first determining a machine's current running state, and then using that state for comparison to on-going running conditions.
Description of the Prior Art
[0002] Signal processing, vibration analysis, and rule-based automated condition monitoring systems have existed for many years. At times, these systems can be effective in monitoring and classifying machine problems, but they suffer from a difficult and laborious setup, a lack of rules sufficient to cover various running conditions, and are not effectively generalized for application to a broad variety of machine processes or machine types.
[0003] In recent years, machine learning has been applied to machinery condition monitoring, particularly for purposes of anomaly detection. However, deep learning for machine problem classification has required very significant quantities of data to solve a particular problem type. The body of data quantitatively sufficient to train such systems (e.g. data from misaligned machinery) is rarely available for the machines that are being monitored and the problems that are being classified. Also, such prior systems lack specific vibration analysis techniques or recognition of subtleties of digitally processed signals to enable them to rapidly and reliably anticipate conditions that evidence abnormal machine wear or impending machine failure.
SUMMARY OF THE INVENTION
[0004] In accordance with the presently disclosed invention, vibration analysis is applied in combination with deep learning/machine learning and pre-classifying selected data. In this way, less data is required to train the deep learning/machine learning software for classifying abnormal mechanical functions and problems. Accordingly, such conditions can be identified sooner and with greater specificity. Through the combination of deep learning/machine learning with vibration analysis and with condition monitoring, automated analysis (anomaly detection, problem classification, and problem regression) can be accomplished more accurately and with fewer false alarms to afford decreased machinery downtime and lower overall maintenance cost.
BRIEF DESCRIPTION OF THE DRAWING
[0005] The patent or application file contains at least one drawing executed in color. Copies of this patent or patent application publication with color drawing(s) will be provided by the Office upon request and payment of the necessary fee.
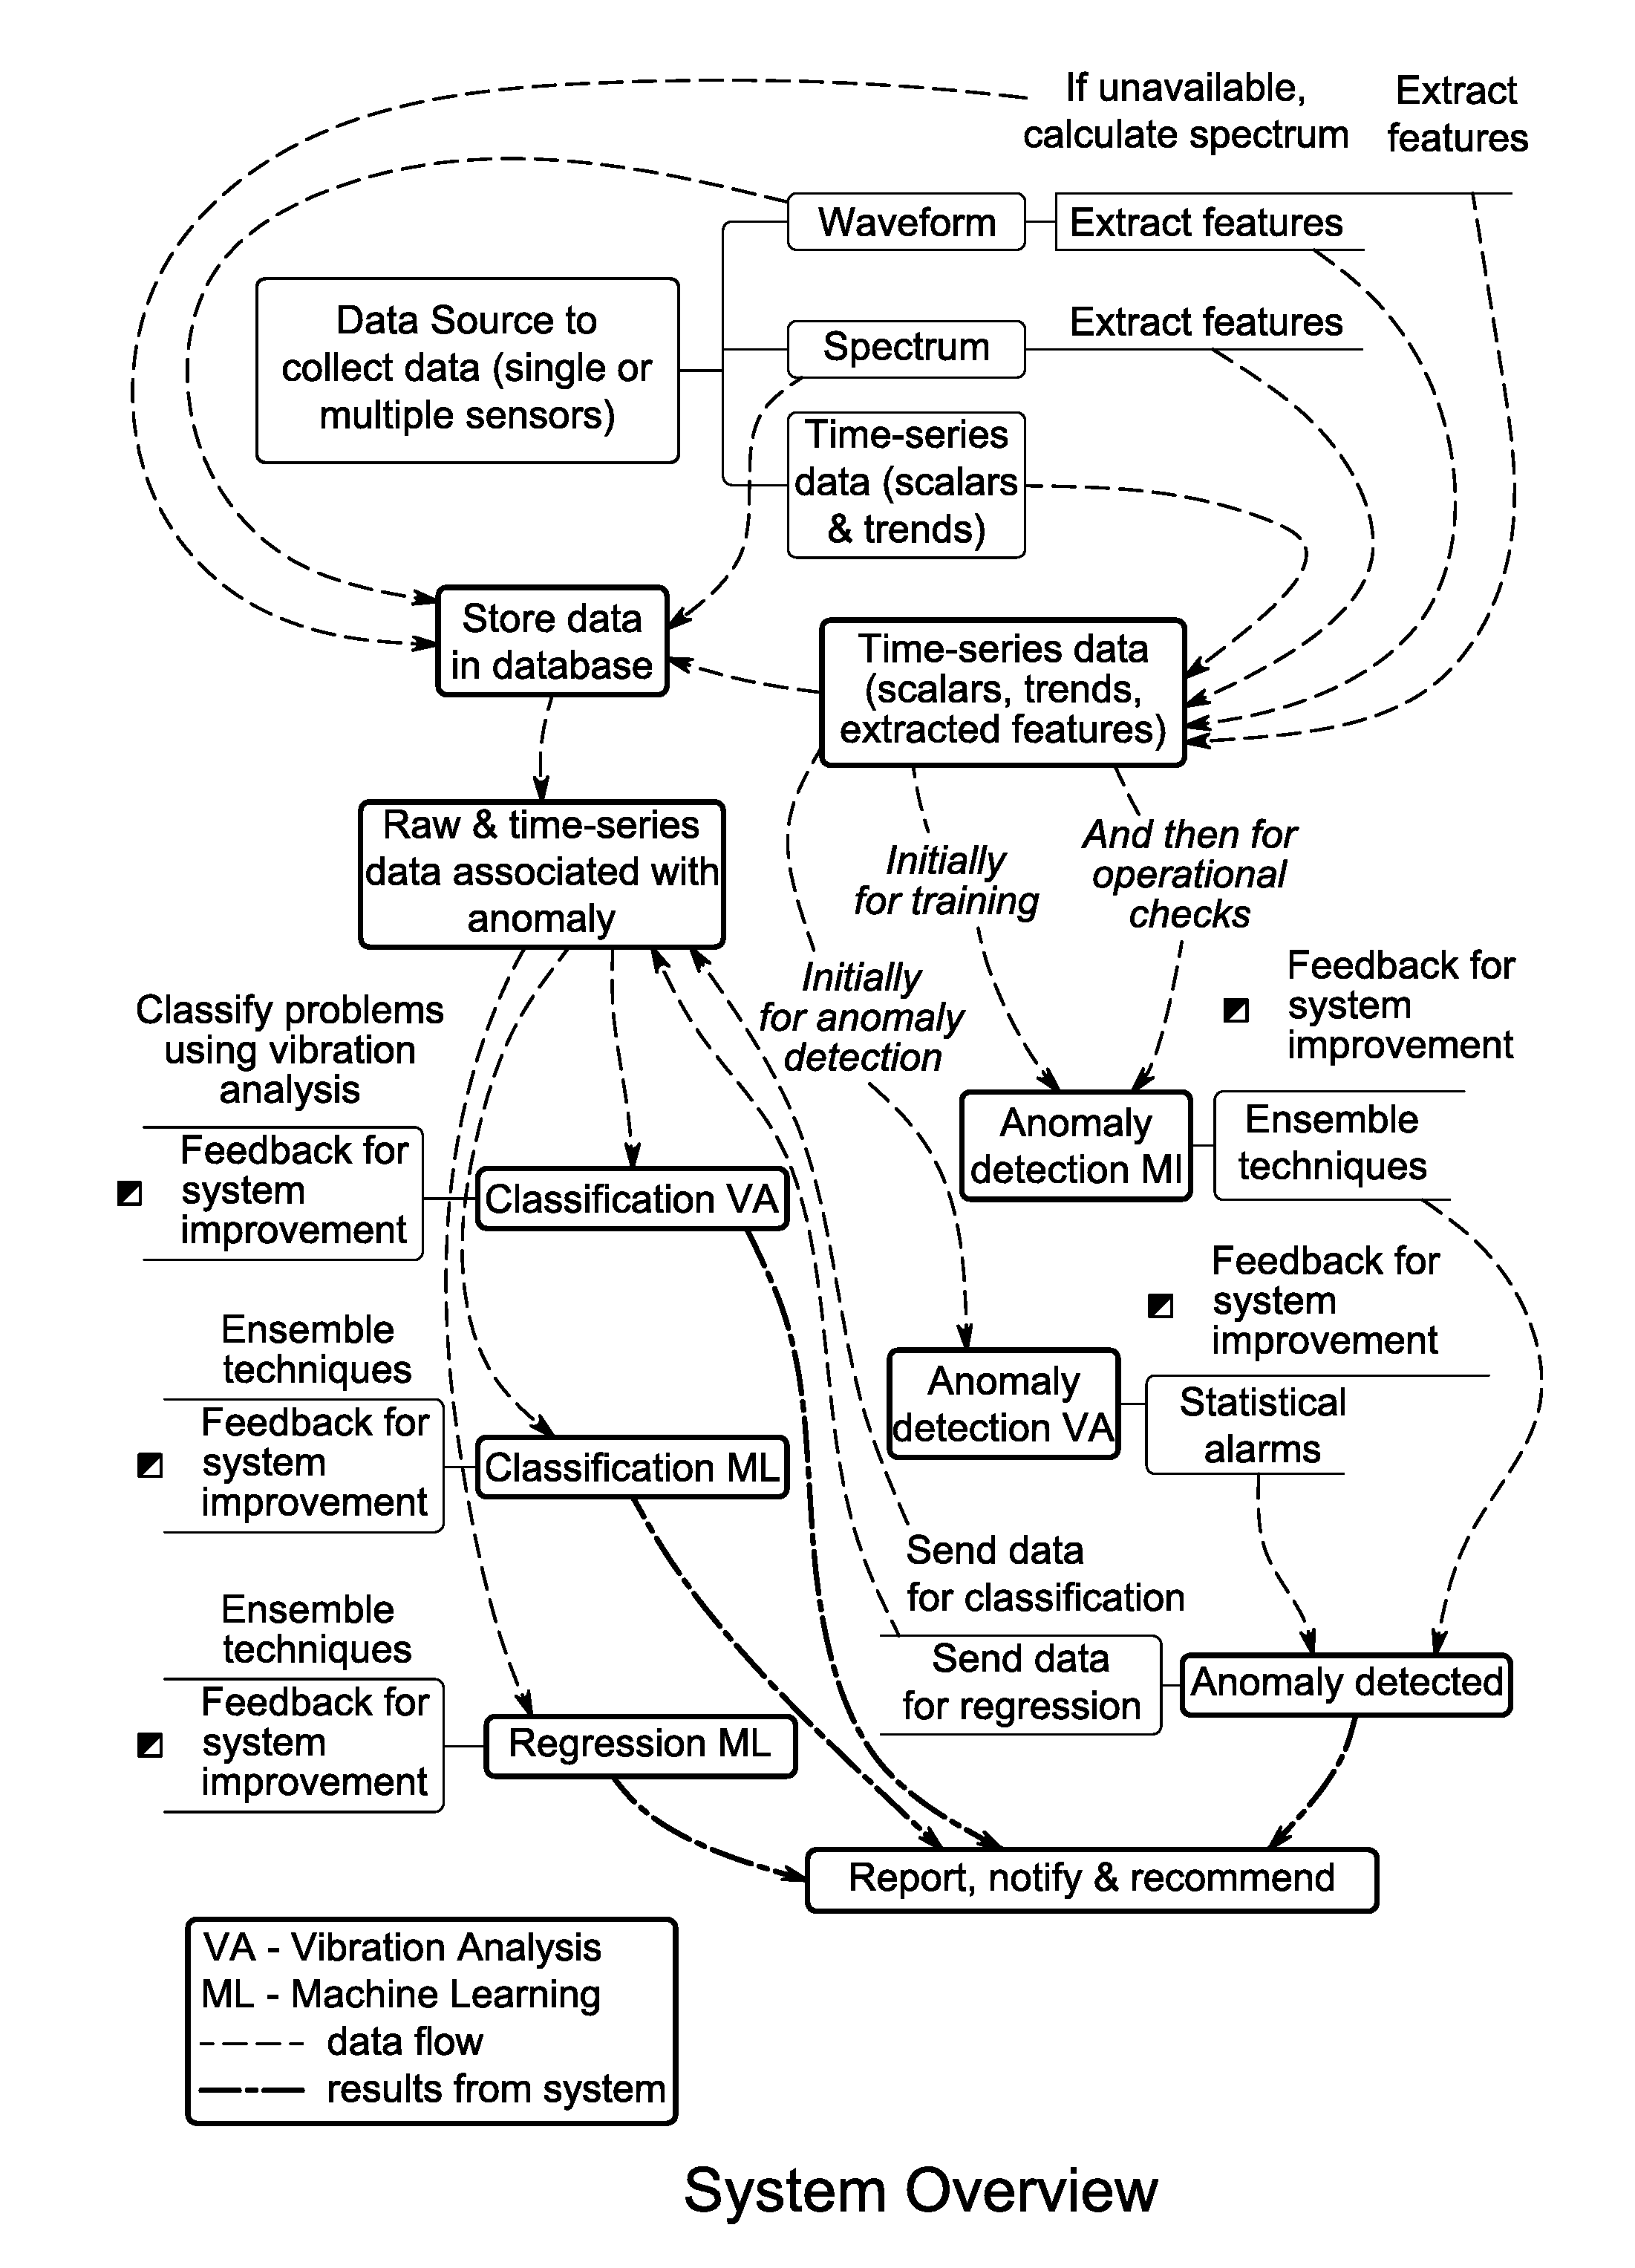
[0006] The drawing (FIG. 1) illustrates the disclosed method and system wherein data flows from the data source and through the various steps and mechanisms for characterization, analysis, classification and detection. "VA" refers to vibration analysis techniques. "ML" refers to machine learning/deep learning techniques. The red lines indicate data flow through the system. The blue lines indicate the results, or the information produced by the system in the form of notifications, recommended actions, and status reports.
DESCRIPTION OF A PRESENTLY PREFERRED EMBODIMENT
[0007] As used herein, the following terms have the corresponding meanings:
[0008] Automated Predictive Maintenance--computer software and algorithms used to automatically determine a machine's health-state based on data collected from the machine in the form of spectra, waveforms, and scalar data
[0009] Automated Vibration Analysis--the analysis of vibration data by software algorithms using signal processing techniques with the aim of reducing equipment downtime and maintenance cost, and in some cases to prevent machine failures by recommending corrective actions (e.g. balance or align a machine; adjust bearing lubrication)
[0010] Digital Signal Processing--the analysis of vibration signals in the time and frequency domains by digitizing data and then interpreting it
[0011] Machine Condition Monitoring--determining and monitoring the condition of a machine based on data acquired about the machine's current operating state
[0012] Automated Anomaly Detection--determining if a problem exists in a machine by comparing its current state to an acceptable state
[0013] Automated Problem Classification--determining the underlying cause of a problem encountered based on the characteristics of the data collected on the machine
[0014] Automated Problem Regression--determining the severity of a problem based on both acceptable level comparison and the rate of change
[0015] Machine Learning--a field of computer science whereby the algorithms used determine the rules to evaluate the data based on the data itself; the rules of evaluation are automatically generated based on the data analyzed;
[0016] Deep Learning--a subfield of machine learning
[0017] Time-Series Data--a series of data points indexed in time order
[0018] Extracted Features--pulling key components from spectra and waveforms to characterize the information contained within the signal being represented
[0019] Scalar--single point data representing some characteristic of the machine (e.g. speed or overall energy)
[0020] Trend--a group of related scalar values in a time-series
[0021] Data Source--a device connected to accelerometers, proximity probes, or another system to collect signals representative of the vibration in a mechanical system
[0022] Waveform--a representation of a signal's amplitude over time (e.g. amplitude in g's over time in seconds)
[0023] Spectrum--a representation of a signal's amplitude over frequency after the transformation of a waveform using a Fast Fourier Transform
[0024] Ensemble Techniques--the use of multiple deep learning/machine learning techniques and the combining of the results for a better outcome, as some deep learning/machine learning methods do better at certain tasks.
[0025] As illustrated in the Figure, time-series data (scalar and trends), along with spectra and waveforms are collected from a data source on a periodic basis. The period is initially set by a user, but may be adjusted by the system subject to predetermined operational rules. The time-series data may be stored in its raw form. These scalar or trend values may represent primarily vibration or angular speed, but may also represent environmental values such as temperature, humidity or other values. Also, the scalar or trend values may represent subjective data that is entered by a machine operator such as current load and current perceived operating state.
[0026] In accordance with the disclosed invention, waveforms are captured and programmatically characterized by extracting key features by means of vibration analysis and signal processing techniques and converting such features into time-series data. Such features may contain information in the waveform that is pertinent for determining machine state and classifying problems abnormal function of the machine. Examples of such extracted features may include Overall Energy, Crest Factor, Periodicity, G-Swing, as well as other key factors. This process may be executed by software operating autonomously. If a spectrum is unavailable from the data source, it may be calculated from this waveform.
[0027] The spectrum may be programmatically characterized by extracting key features from it using vibration analysis and signal processing techniques and converting said features into time-series data. These features should contain the pertinent data from the spectrum to determine machine state and possibly classify any problems evident in the data. Examples of extracted features might include Overall Energy, number of peaks exceeding a threshold, number of sidebands, frequency of largest peaks, and other factors. This extraction/characterization process may be carried out by software operating autonomously.
[0028] Store these extracted features as time-series data along with the time-series data collected directly from the data source. Raw inputs to the system may be stored before such time-series data is collected and stored.
[0029] Combine the extracted features and the time-series data to determine statistically valid alarms for alert and alarm state detection, and to look for correlating data. Once the alarms and alert values are established, data may also be collected on an exception basis (e.g. when an alarm is exceeded) in addition to the time-series data above. However, once collected, the data may be characterized and processed in the same way.
[0030] Feed the same data to several deep learning/machine learning methods, particularly relating data of the same type across a bearing location, across multiple bearing locations, across a machine, and across machine couplings. Deep learning/machine learning techniques add exceptional value for these complex classification tasks, and clustering the data into directionality, machine end, and frequency components (typical vibration analysis techniques) will further enhance automated analysis.
[0031] Initially, this extracted data may be used to train the deep learning/machine learning steps and for determining steady-state running condition of the machine that is being monitored. Once the system is trained, subsequent data may be used for anomaly detection, classification, and regression analysis, and also may be fed back into the system for enhanced training.
[0032] Because of the features extracted from the raw data, some machine classification can be done using vibration analysis techniques without the extensive data needed to train the machine learning algorithms to classify problems. As monitoring continues, the data needed can be gathered and "pre-classified." The pre-classified data may be used to train additional deep learning/machine learning algorithms for improved classification as "problem-classified data" is gathered.
[0033] In a particular example of a preferred embodiment, data representing synchronous harmonic families is collected. Each spectrum includes only one synchronous harmonic family. The synchronous harmonic family represents selected integral orders of rotational speed are stored in respective data bins. (e.g. if x is a fundamental rotational speed, 1x, 2x, 3x, nx represent the synchronous harmonic family of x for integral values from 1 to n). That data is then collected and the total energy represented by the bin values is calculated. Frequency data that represents energy outside the collected bin data is not used. Only frequency data from the bins and representing integer multiples of the fundamental rotational speed is used.
[0034] The bin data also includes data that represents repeating frequencies that are not integral multiples of the fundamental rotational speed. This frequency data is referred to as non-synchronous harmonic families. The frequency spectrum may include more than one non-synchronous harmonic family. The total energy that is represented by each individual non-synchronous harmonic family and ignoring all other energy in the spectrum is also calculated.
[0035] The non-synchronous harmonic family information is used to determine certain bearing information. In an example of a preferred embodiment, the non-synchronous harmonic family data is used to determine the number of elements that are associated with each bearing (e.g. an inner race, an outer race, and roller or ball elements). Based on that data, the angular frequency of the cage and the spin frequency of the roller or ball elements is also determined.
[0036] After the synchronous and non-synchronous harmonic families are identified, sidebands that correspond respectively to one of the synchronous families or one of the non- synchronous families are identified. Such sidebands are identified according to either amplitude modulation or frequency modulation of the dominant family signal. It has been found that such sideband frequencies are associated with abnormalities in rotating machinery such as bearings or gearboxes. Such sidebands can also be catalogued to serve as useful predictor of other machine malfunctions.
[0037] From the frequency information, the number of waveform periods that are represented in the data sample are determined. From that data, factors that express the peakedness and variance in the signal are determined.
* * * * *
D00000
D00001
XML
uspto.report is an independent third-party trademark research tool that is not affiliated, endorsed, or sponsored by the United States Patent and Trademark Office (USPTO) or any other governmental organization. The information provided by uspto.report is based on publicly available data at the time of writing and is intended for informational purposes only.
While we strive to provide accurate and up-to-date information, we do not guarantee the accuracy, completeness, reliability, or suitability of the information displayed on this site. The use of this site is at your own risk. Any reliance you place on such information is therefore strictly at your own risk.
All official trademark data, including owner information, should be verified by visiting the official USPTO website at www.uspto.gov. This site is not intended to replace professional legal advice and should not be used as a substitute for consulting with a legal professional who is knowledgeable about trademark law.