Sample Processing Improvements For Quantitative Microscopy
Fine; Alan Marc ; et al.
U.S. patent application number 16/367791 was filed with the patent office on 2019-08-08 for sample processing improvements for quantitative microscopy. The applicant listed for this patent is Alentic Microscience Inc.. Invention is credited to Alan Marc Fine, Hershel Macaulay.
| Application Number | 20190242794 16/367791 |
| Document ID | / |
| Family ID | 56163796 |
| Filed Date | 2019-08-08 |


View All Diagrams
| United States Patent Application | 20190242794 |
| Kind Code | A1 |
| Fine; Alan Marc ; et al. | August 8, 2019 |
SAMPLE PROCESSING IMPROVEMENTS FOR QUANTITATIVE MICROSCOPY
Abstract
Among other things, a diluted sample is generated based on mixing a small sample of blood with a one or more diluents. A thin film of the diluted sample is formed on the surface of a contact optical microscopy sensor. Red blood cells within a portion of the thin film of the diluted sample are illuminated using light of a predetermined wavelength. One or more images of the diluted sample are acquired based on illuminating the red blood cells within the portion of the thin film of the diluted sample. The acquired one or more images of the diluted sample are then processed. The mean corpuscular hemoglobin in the red blood cells within the portion of the thin film of the diluted sample is determined based on processing the acquired images of the diluted sample.
| Inventors: | Fine; Alan Marc; (Prospect, CA) ; Macaulay; Hershel; (Bedford, CA) | ||||||||||
| Applicant: |
|
||||||||||
|---|---|---|---|---|---|---|---|---|---|---|---|
| Family ID: | 56163796 | ||||||||||
| Appl. No.: | 16/367791 | ||||||||||
| Filed: | March 28, 2019 |
Related U.S. Patent Documents
| Application Number | Filing Date | Patent Number | ||
|---|---|---|---|---|
| 15066065 | Mar 10, 2016 | |||
| 16367791 | ||||
| 14314743 | Jun 25, 2014 | 9518920 | ||
| 15066065 | ||||
| 14173500 | Feb 5, 2014 | |||
| 15066065 | ||||
| 62131164 | Mar 10, 2015 | |||
| 61839735 | Jun 26, 2013 | |||
| Current U.S. Class: | 1/1 |
| Current CPC Class: | G01N 33/49 20130101; G02B 21/365 20130101; G01N 1/2813 20130101; G01N 2001/386 20130101; G01N 2201/068 20130101; G01N 21/31 20130101; G01N 1/38 20130101; G01N 2201/12 20130101; G02B 21/0008 20130101 |
| International Class: | G01N 1/28 20060101 G01N001/28; G01N 33/49 20060101 G01N033/49; G02B 21/36 20060101 G02B021/36; G02B 21/00 20060101 G02B021/00; G01N 1/38 20060101 G01N001/38; G01N 21/31 20060101 G01N021/31 |
Claims
1. A method comprising: generating a diluted sample, the generating comprising mixing a small sample of blood with one or more diluents; forming a thin film of the diluted sample on a surface of a contact optical microscopy sensor; illuminating red blood cells within a portion of the thin film of the diluted sample using light of a predetermined wavelength; acquiring one or more images of the diluted sample based on the illuminating of the red blood cells within the portion of the thin film of the diluted sample; processing the acquired one or more images of the diluted sample; and determining the mean corpuscular hemoglobin in the red blood cells within the portion of the thin film of the diluted sample based on the processing of the acquired images of the diluted sample.
2. The method of claim 1, wherein forming a thin film comprises forming a thin film between a transparent chamber lid and the surface of the contact optical microscopy sensor.
3. The method of claim 2, wherein forming a thin film between the lid and the surface of the contact optical microscopy sensor comprises: placing the diluted sample on the surface of the contact optical microscopy sensor; and lowering the transparent chamber lid to a predetermined height determined by a spacer.
4. The method of claim 3, wherein the magnitude of the predetermined height is configured such that lowering of the transparent chamber lid onto the surface of the contact optical microscopy sensor (i) constrains the red blood cells to lie within a broadest dimension of the red blood cells parallel to the surface of the contact optical microscopy sensor, and (ii) does not result in structural damage to the red blood cells.
5. The method of claim 1, wherein the one or more images of the diluted sample that are acquired include image features of at least one hundred red blood cells.
6. The method of claim 1, wherein the predetermined wavelength comprises a wavelength that corresponds to a wavelength within the absorbance band of a form of hemoglobin with the highest extinction coefficient of that form of hemoglobin.
7. The method of claim 1, wherein processing the acquired images of the diluted sample comprises: estimating a background pixel value for each pixel within each of the respective acquired images; segmenting one or more regions within the respective acquired images that each contain exactly one red blood cell; and calculating the mean corpuscular hemoglobin based on the one or more segmented regions within the respective acquired images.
8. The method of claim 1, wherein the generated diluted sample: has an isotonicity that is substantially equal to an isotonicity of red blood cells; has coagulation properties such that the generated diluted sample is less likely to coagulate compared to coagulation properties of red blood cells; and maintains a predetermined pH level of the generated diluted sample.
9. The method of claim 1, wherein the acquired one or more images include at least a statistically significant number of the red blood cells in the diluted sample.
10. The method of claim 1, wherein at least one of the one or more diluents comprises a nitrite.
11. The method of claim 1, wherein generating a diluted sample comprises generating a diluted sample based on mixing the sample of blood with a diluent such that the mixing results in sphering of the red blood cells within the diluted sample.
12. A method comprising: forming a thin film of a fluid sample on a surface of a contact optical microscopy sensor, the fluid sample comprising particulate matter that includes an analyte to be measured, the analyte having a distinctive absorption spectrum; illuminating at least a portion of the thin film of the fluid sample using light of a predetermined wavelength; acquiring one or more images of the fluid sample based on the illuminating of at least a portion of the thin film of the fluid sample using the light of a predetermined; wavelength; processing the acquired one or more images of the fluid sample; and determining a mean amount of the analyte based on the processing of the one or more images of the fluid sample.
13. The method of claim 12, wherein forming a thin film comprises forming a thin film between a transparent chamber lid and the surface of the contact optical microscopy sensor.
14. The method of claim 13, wherein forming a thin film between the lid and the surface of the contact optical microscopy sensor comprises: placing the fluid sample on the surface of the contact optical microscopy sensor and lowering the transparent chamber lid to a predetermined height determined by a spacer.
15. The method of claim 14, wherein the magnitude of the predetermined height is configured such that lowering of the transparent chamber lid onto the surface of the contact optical microscopy sensor (i) constrains the particulate matter of the sample fluid to lie within a broadest dimension of the particular matter to the surface of the contact optical microscopy sensor, and (ii) does not result in structural damage to the particulate matter of the sample fluid.
16. The method of claim 12, wherein processing the one or more acquired images comprises: estimating a background pixel value for each pixel within each of the respective one or more acquired images; segmenting one or more regions within the respective acquired images that each contain exactly one particle; and calculating the mean amount of the analyte based on the segmented one or more regions within the respective acquired images.
17. The method of claim 13, wherein forming a thin film comprises: placing the fluid sample on the surface of the contact optical microscopy sensor; and enabling the thin film of the fluid sample formed on a surface of a contact optical microscopy sensor to settle.
Description
PRIORITY CLAIMS AND RELATED APPLICATIONS
[0001] This application is a continuation and claims priority to U.S. patent application Ser. No. 15/066,065, filed Mar. 10, 2016, which is entitled to the benefit of the filing date of U.S. patent application 62/131,164, filed Mar. 10, 2015 and is a continuation-in-part of U.S. patent application Ser. No. 14/173,500, filed Feb. 5, 2014, and is entitled to the benefit of the filing date of U.S. provisional patent application 61/761,467, filed Feb. 6, 2013, and of U.S. provisional patent application 61/785,762, filed Mar. 14, 2013. This application is also a continuation-in-part of U.S. patent application Ser. No. 14/314,743, filed Jun. 25, 2014 (issued as U.S. Pat. No. 9,518,920 on Dec. 13, 2016), and is entitled to the benefit of the filing date of U.S. patent application 61/839,735, filed Jun. 26, 2013. Each of the patent applications identified above is incorporated here by reference in its entirety.
[0002] This application is also related to U.S. patent application Ser. No. 14/698,532, filed on Apr. 28, 2015, which claims the benefit of U.S. patent application Ser. No. 12/913,639 filed on Oct. 27, 2010 (now issued as U.S. Pat. No. 9,041,790 on May 26, 2015), which claims the benefit of U.S. provisional patent application 61/255,781, filed on Oct. 28, 2009 and is also related to U.S. patent application Ser. No. 14/710,046, filed on May 12, 2015, which claims benefit to U.S. patent application Ser. No. 13/095,175 filed on Apr. 27, 2011 (now issued as U.S. Pat. No. 9,075,225 on Jul. 7, 2015), which claims the benefit of Ser. No. 12/913,639, filed on Oct. 27, 2010 (now issued as U.S. Pat. No. 9,041,790 on May 26, 2015), which claims the benefit of U.S. provisional patent application 61/255,781, filed on Oct. 28, 2009. Each of the patent applications identified above is incorporated here by reference in its entirety.
FIELD
[0003] This specification generally describes technology related to sample processing for quantitative microscopy.
BACKGROUND
[0004] Complete blood count (CBC) and other diagnostic tests that measure hemoglobin (Hb) content of blood typically measure Hb via a spectroscopic system or a subsystem after lysing red blood cells (RBCs).
SUMMARY
[0005] Traditional techniques that measure Hb content of blood often add bulk and complexity to the measurement processing, creating a number of disadvantages that are salient for point-of-care (POC) diagnostic devices. For instance, such techniques often require significant sample preparation, which is often inaccessible in resource-limited regions where POC diagnostic devices are often used.
[0006] In general, in an aspect, a method for computing mean corpuscular hemoglobin can include: generating a diluted sample based on mixing a small sample of blood with one or more diluents; forming a thin film of the diluted sample on a surface of a contact optical microscopy sensor; illuminating red blood cells within a portion of the thin film of the diluted sample using light of a predetermined wavelength; acquiring one or more images of the diluted sample based on illuminating the red blood cells within the portion of the thin film of the diluted sample; processing the acquired one or more images of the diluted sample; and determining a value of mean corpuscular hemoglobin in the red blood cells within the portion of the thin film of the diluted sample based on processing the acquired images of the diluted sample.
[0007] One or more implementations may include the following optional features. For example, in some implementations, forming a thin film includes forming a thin film between a transparent chamber lid and the surface of the contact optical microscopy sensor.
[0008] In some implementations, forming a thin film between the lid and the contact optical microscopy sensor includes: placing the diluted sample on a surface of the contact optical microscopy sensor; and lowering the transparent chamber lid to a predetermined height determined by a spacer.
[0009] In some implementations, the size of the predetermined height is configured such that lowering of the transparent chamber lid onto the surface of the contact optical microscopy sensor (i) constrains the red blood cells to lie within a broadest dimension of the red blood cells parallel to the surface of the contact optical microscopy sensor, and (ii) does not result in structural damage to the red blood cells.
[0010] In some implementations, the one or more images of the diluted sample that are acquired include image features of at least one hundred red blood cells.
[0011] In some implementations, the predetermined wavelength comprises a wavelength that corresponds to a wavelength within the absorbance band of a form of hemoglobin with the highest extinction coefficient of that form of hemoglobin.
[0012] In some implementations, processing the acquired images of the diluted sample includes: estimating a background pixel value for each pixel within the respective acquired images; segmenting one or more regions within the respective acquired images that each contain exactly one red blood cell; and calculating the mean corpuscular hemoglobin based on the segmented one or more regions within the respective acquired images.
[0013] In some implementations, the generated diluted sample: has an isotonicity that is substantially equal to an isotonicity of red blood cells; has coagulation properties such that the generated diluted sample is less likely to coagulate compared to coagulation properties of red blood cells; and maintains a predetermined pH level of the generated diluted sample.
[0014] In some implementations, the acquired one or more images include at least a statistically significant number of the red blood cells in the diluted sample.
[0015] In some implementations, at least one of the one or more diluents comprises a nitrite.
[0016] In some implementations, generating a diluted sample comprises generating a diluted sample based on mixing the sample of blood with a diluent such that the mixing results in sphering of the red blood cells within the diluted sample.
[0017] In general, in an aspect, a method for computing a mean amount of a measured analyte within a fluid sample can include: forming a thin film of a fluid sample on a surface of a contact optical microscopy sensor, the fluid sample comprising particulate matter that includes an analyte to be measured, the analyte having a distinctive absorption spectrum; illuminating at least a portion of the thin film of the fluid sample using white light of a predetermined wavelength; acquiring one or more images of the fluid sample based on illuminating at least a portion of the thin film of the fluid sample using white light of a predetermined; wavelength; processing the acquired one or more images of the fluid sample; and determining a value of a mean amount of the analyte based on processing the one or more images of the fluid sample.
[0018] In some implementations, forming a thin film includes forming a thin film between a transparent chamber lid and the contact optical microscopy sensor.
[0019] In some implementations, forming a thin film between the lid and the surface of the contact optical microscopy sensor includes: placing the fluid sample on a surface of the contact optical microscopy sensor and lowering the transparent chamber lid to a predetermined height determined by a spacer.
[0020] In some implementations, the size of the predetermined height is configured such that lowering of the transparent chamber lid onto the surface of the contact optical microscopy sensor (i) constrains the particulate matter of the sample fluid to lie within a broadest dimension of the particular matter to the surface of the contact optical microscopy sensor, and (ii) does not result in structural damage to the particulate matter of the sample fluid.
[0021] In some implementations, processing the one or more acquired images includes: estimating a background pixel value for each pixel within the respective one or more acquired images; segmenting one or more regions within the respective acquired images that each contain exactly one particle; and calculating the mean amount of the analyte based on the segmented one or more regions within the respective acquired images.
[0022] In some implementations, forming a thin film includes: placing the fluid sample on the surface of the contact optical microscopy sensor; and enabling the thin film of the fluid sample formed on a surface of a contact optical microscopy sensor to settle.
[0023] These, and other aspects, features, implementations, and advantages may be expressed as methods, apparatus, systems, components, compositions, software products, methods of doing business, and in other ways.
[0024] These and other aspects, features, implementations, and advantages will become apparent from the following description and from the claims.
BRIEF DESCRIPTION OF THE DRAWINGS
[0025] FIG. 1 is graph of hemoglobin absorption spectra.
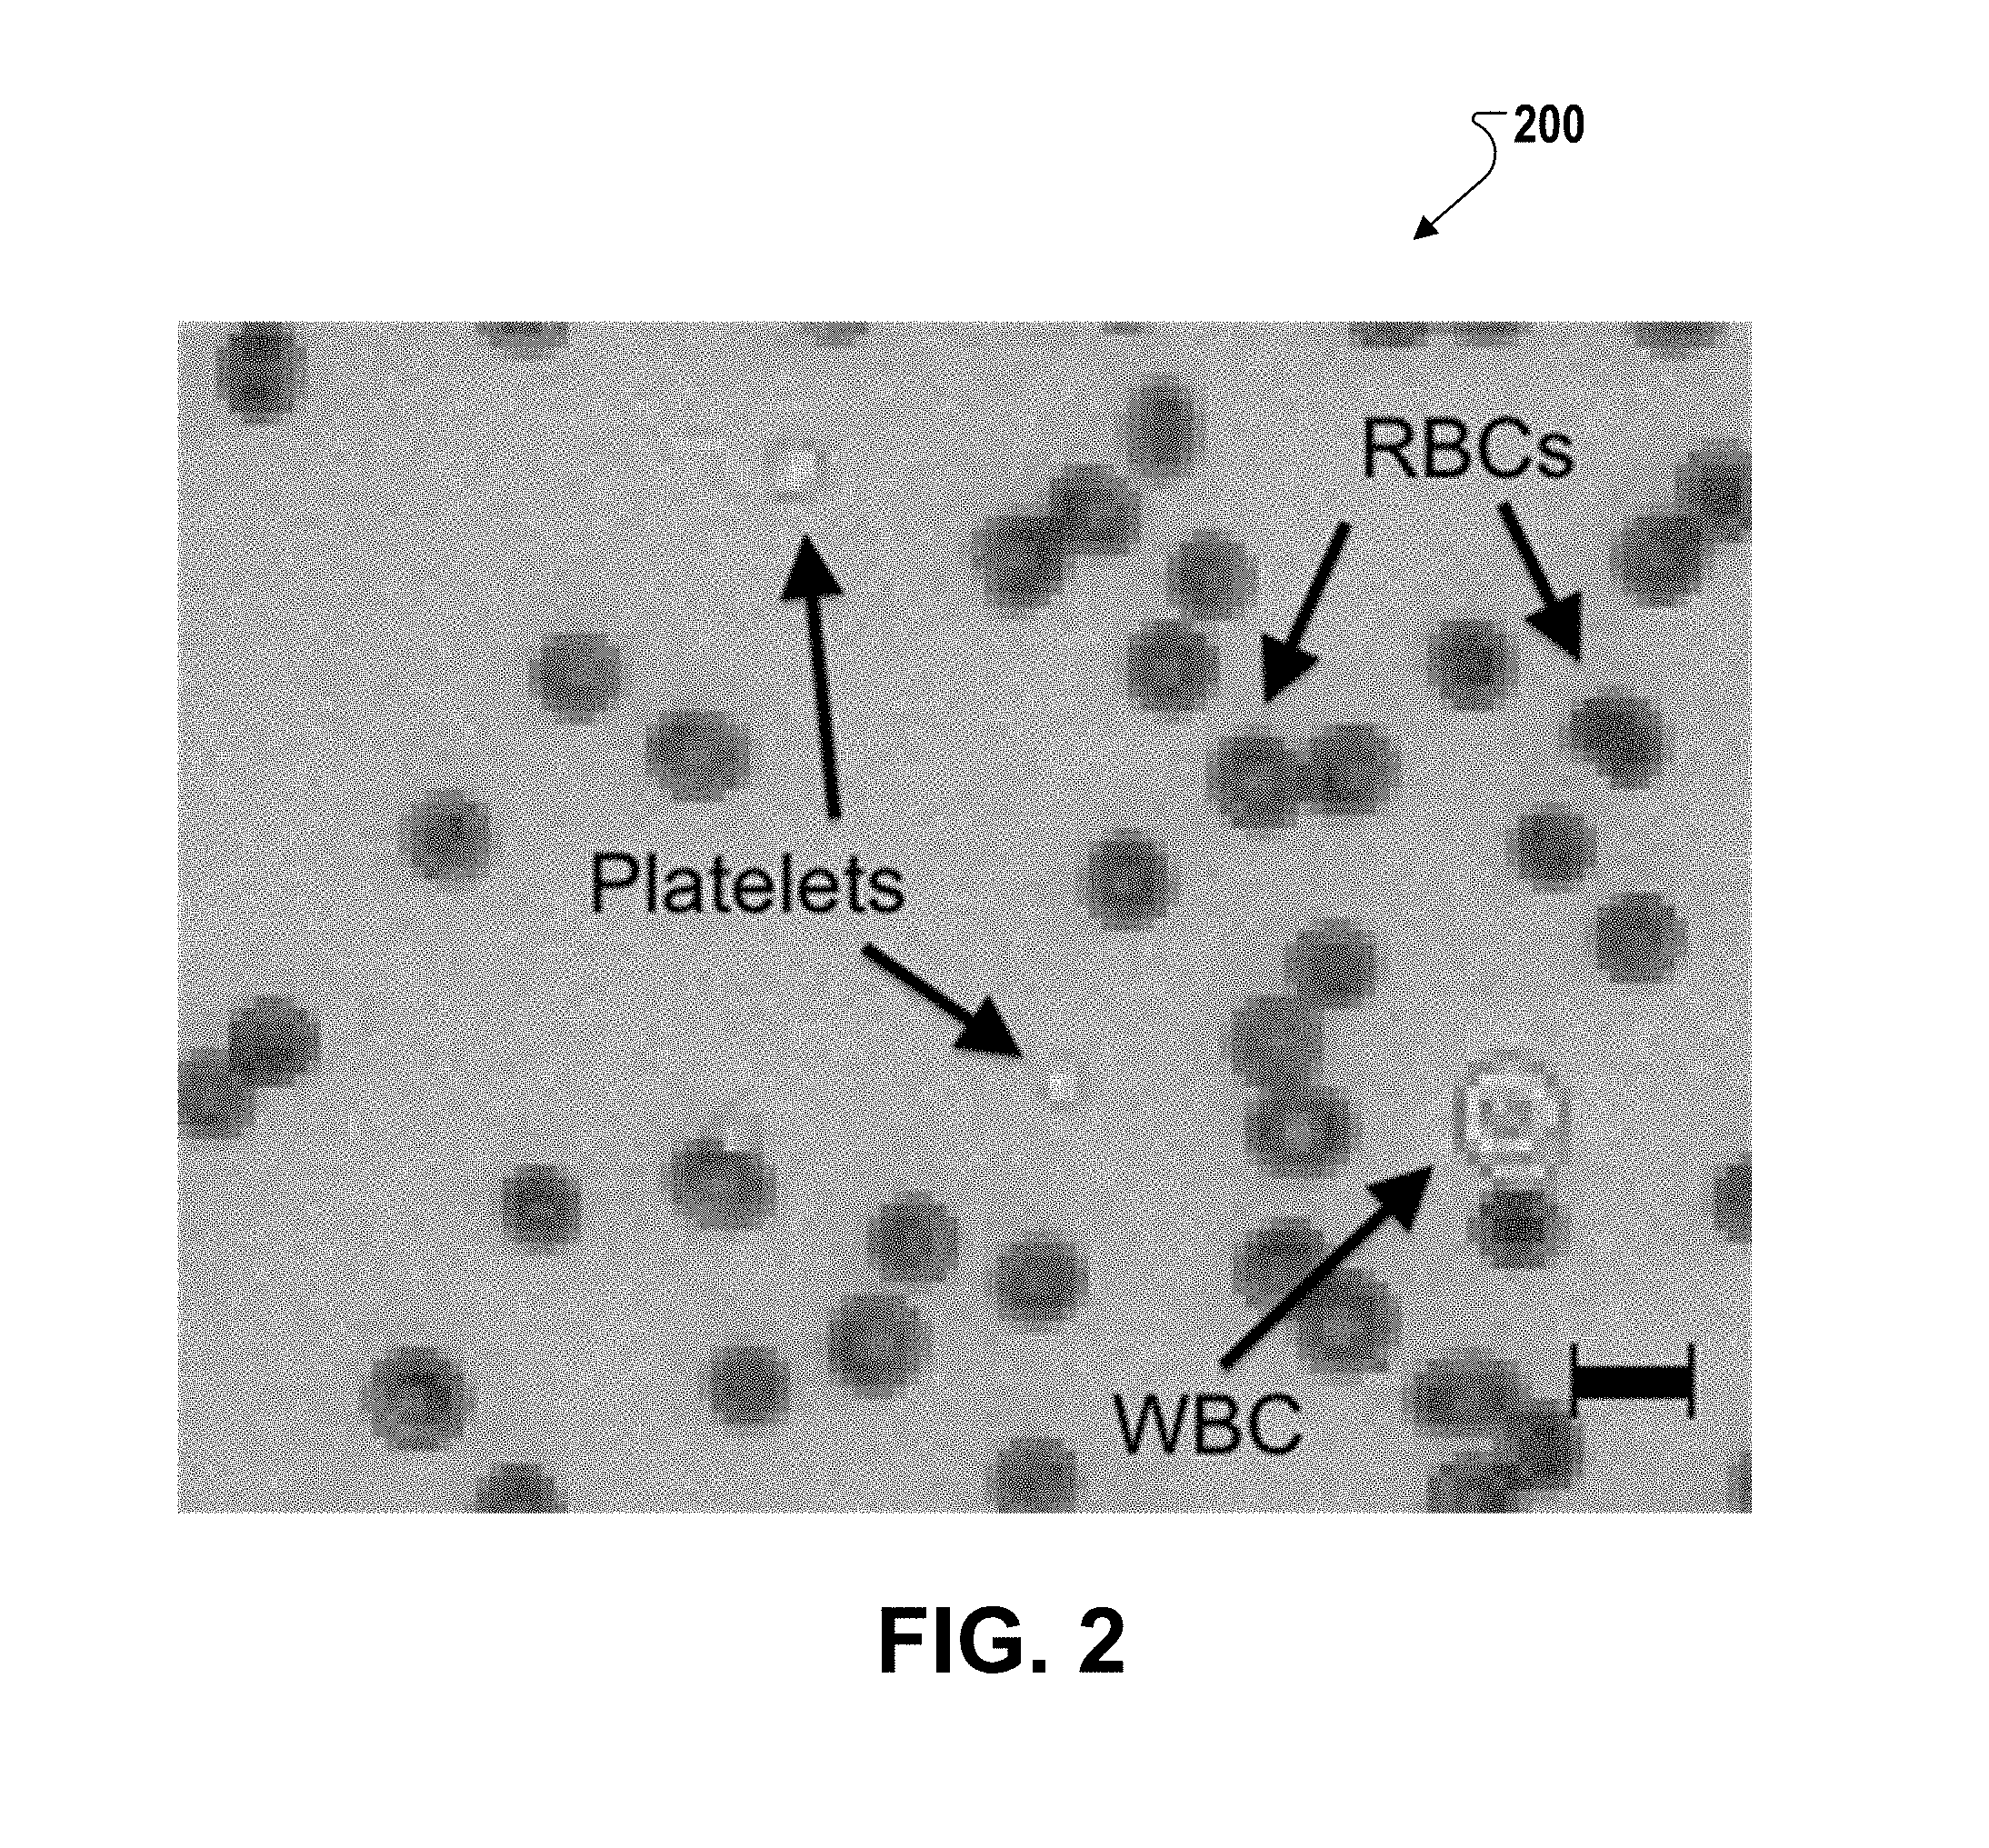
[0026] FIG. 2 is a contact optical microscopy image of a blood cell.
[0027] In the drawings, like reference numbers represent corresponding parts throughout.
DETAILED DESCRIPTION
[0028] In some examples, the bulk and complexity of the conventional CBC process can be overcome with the use of contact optical microscopy (COM)-based microspectrometry. In some instances, such techniques can also be implemented with optical lens microscopes. In COM-based microspectrometry, molecules in individual pixels and regions in a microscopic image are quantified using optical absorption measurements. COM-based microspectrometry permits measurement of the Hb content of individual RBCs within an image. This can then be averaged over a plurality of imaged RBCs to estimate the mean corpuscular hemoglobin (MCH). The estimation of MCH, along with mean corpuscular volume (MCV) and red blood cell concentration (RBC), both of which can be determined from the microscopy image, mean corpuscular hemoglobin concentration (MCHC) and concentration of hemoglobin in blood (Hgb), additional elements of the CBC, can then be derived.
[0029] To calculate the MCH from a COM image, microspectrometry must be used to initially quantify Hb content. Microspectrometry within lens-based microscopy has existed for many decades and has been performed previously on RBCs. In 1960, Sondhaus & Thorell published a study in which the Hb absorbance spectra from sub-areas of RBCs were examined, exploring the correlation of RBC maturity and Hb and free-iron content [C. A. Sondhaus and B. Thorell, "Microspectrophotometric Determination of Nonheme Iron in Maturing Erythroblasts and its Relationship to the Endocellular Hemoglobin Formation," Blood, vol. 16, no. 3, pp. 1285-97, 1960]. Tsujita et al. measured the change of the absorbance spectrum within RBCs depending the presence of nitric oxide [K. Tsujita, T. Shiraishi, and K. Kakinuma, "Microspectrophotometry of nitric oxide-dependent changes in hemoglobin in single red blood cells incubated with stimulated macrophages," J. Biochem., vol. 122, no. 2, pp. 264-70, August 1997]. Meletis et al. attempted to measure MCH using lens-based transmission microspectrometry [J. Meletis, X. Yataganas, G. Eliopoulos, J. Panourgais, D. Loukopoulos, and P. Fessas, "Hemoglobin Content of Single Erythrocytes from Fetuses with Parents Having Heterozyhous -Thalassemia," Acta Haematol., vol. 73, pp. 16-21, 1985]. Blood was spread on a glass slide, and 50-100 RBCs in each sample were measured by illuminating them with 415 nm light, dividing the full area of each RBC into 0.5 .mu.m pixels, and measuring absorbance at each pixel. This process was slow (60-90 minutes per test), and results, though well correlated with those obtained using ordinary instruments based on spectroscopy of lysed blood (R.sup.2=0.87) were unacceptably variable (coefficient of variation, CV=28%).
[0030] Some of this variability is due to the small number of RBC within a standard high magnification field of view. COM, however, yields high magnification over a very large field of view that can include large numbers of RBCs. In addition, lens-based microspectrometry for quantification of absorbing molecules is also sensitive to focal plane alignment relative to the RBCs, since light transmitting through Hb that is outside the focal plane may not be collected. Thus, for example, the depth of focus of the objective lens used by Meletis et al. was <0.5 .mu.m, which is much thinner than an RBC (typically 1.1 .mu.m thick at the center and 2.6 .mu.m thick at the torus-shaped outer band [K. G. Engstrom and E. Lofvenberg, "Treatment of Myeloproliferative Disorders With Hydroxyurea: Effects on Red Blood Cell Geometry and Deformability," Blood, vol. 91, no. 10, pp. 3986-3991, 1998]), meaning parts of every RBC measured were out of focus, so that part of the Hb signal can be blurred outside the cell borders and lost. COM, on the other hand, has no focal plane--COM produces very little blurring of objects less than a few microns from the imaging surface--so can outperform standard microspectrometry for MCH measurement.
[0031] Standard optical spectrometry measures the quantity of a light-absorbing analyte dispersed in a solution using Beer's law:
I I 0 = 10 ( - C l ) ( 1 ) ##EQU00001##
[0032] where I.sub.0 is the incident light intensity, I is the transmitted light intensity, .di-elect cons. is the extinction coefficient (molar absorptivity) of the absorber (Hb in this case) at the incident wavelength, C is the molar concentration of the absorber in the solution, and 0 is the path length through the solution. Extinction is caused by light either being scattered or lost to true absorption, where the energy is converted to another form. Microspectrometry relies on Beer's law, but applies it to images of microscale objects to calculate the absorber's concentration within that object.
[0033] The following derivation of the relationship between MCH and Beer's law depends on the following simplifying assumptions: [0034] 1. The cell in question causes no reflection, refraction, or scattering. [0035] 2. Only one Hb form is present, meaning E is known. [0036] 3. There is uniform [Hb] concentration inside the RBC and negligible [Hb] outside the RBC. [0037] 4. Within a given pixel, the RBC thickness, , is uniform.
[0038] The validity of these assumptions is addressed below.
[0039] For each pixel covered by an RBC, the following two equations are defined:
C = [ Hb ] = Hb p V ( 2 ) V = d 2 * l ( 3 ) ##EQU00002##
[0040] where Hb.sub.p is the number of moles of Hb in the column above the pixel, V is the volume of the RBC portion directly above the pixel, and d is the pixel side-length. The 2.sup.nd equation assumes that l is constant over the entire pixel. These two definitions are substituted into Beer's law to yield:
I p I 0 , p = 10 ( - ( Hb p d 2 l ) l ) ( 4 ) ##EQU00003##
[0041] where I.sub.p is the measured intensity of the pixel and I.sub.0,p is the estimated background intensity, i.e., the intensity expected if no RBC was present. The above equation is not sensitive to , which is useful because path length is not known. The [Hb] term has also been eliminated, which too is not directly measureable in a COM image. Equation (4) is rearranged, yielding
log I p I 0 , p = - Hb p d 2 ( 5 ) ##EQU00004##
[0042] Converting moles of Hb to mass of Hb via a simple unit conversion, m.sub.Hb,p=M.sub.Hb*Hb.sub.p, where M.sub.Hb is the molar mass, and solving for m.sub.Hb,p yields the mass of Hb above the pixel.
m Hb , p = M Hb d 2 log ( I 0 , p I p ) ( 6 ) ##EQU00005##
[0043] This is summed over all the pixels in the RBC, yielding
m Hb , RBC = p = 1 P M Hb d 2 log ( I 0 , p I p ) ( 7 ) ##EQU00006##
[0044] where P is the total number of pixels covered by the RBC. Once m.sub.Hb,RBC is calculated for N RBCs in the image, the mean is taken to yield the MCH:
MCH = M Hb d 2 N n = 1 N p = 1 P n log ( I 0 , np I np ) ( 8 ) ##EQU00007##
[0045] In the MCH equation above, M.sub.Hb, d, and E are known constants. I.sub.np, I.sub.0,np, P.sub.n, and N and are outputs from computer vision described below.
[0046] To increase the signal-to-noise ratio of the intensity measurements, it is preferable to illuminate Hb at a wavelength where its extinction coefficient is as high as possible. This gives maximum separation of I and I.sub.0, maximizing signal. The absorbance maxima for Hb occur in the violet region of the visible spectrum (400-430 nm).
[0047] As depicted in FIG. 1, different varieties of Hb have different absorption spectra and maxima. Oxygenated hemoglobin (oxy-Hb) and deoxygenated hemoglobin (deoxy-Hb) both exist in blood. The blood oxygenation of Hb, i.e., the percentage of Hb in oxy-Hb form, can vary in the human body from 60% (venous blood) to .about.100% (arterial blood). The vast majority of the remaining Hb exists in deoxy-Hb form, except in cases of blood poisoning. The MCH.sub.COM could depend on the oxygenation percentage and thus differ from the true MCH.
[0048] Though oxy- and deoxy-Hb have different absorbance profiles, it was suspected that in a real POC test, the vast majority of the Hb would be oxygenated while the blood droplet waited on a finger. If it is assumed that Hb is fully oxygenated, then .di-elect cons..sub.oxy-Hb has a maximum value of 5.243*10.sup.5 cm.sup.-1M.sup.-1, occurring at 415 nm. Substituting this value into Equation (8), as well as M.sub.Hb=64 500 g/mol [S. Prahl, "Optical Absorption of Hemoglobin," Oregon Medical Laser Center, 1999. [Online]. Available: http://omlc.org/spectra/hemoglobin/. [Accessed: 15 Feb. 2013].] and d=1.1 .mu.m (the pixel size of the COM sensor used in this research) yields:
MCH = 1.49 N n = 1 N p = 1 P n log ( I 0 , np I np ) ( 9 ) ##EQU00008##
[0049] Note that the illumination wavelength distribution can alter this coefficient. LEDs commonly have full-width-half-maxima of 5 nm and 10 nm, whereas the extinction peaks have full-width-half-maxima of .about.20 nm. As a result, using the extinction maximum is a reasonable approximation, even if the LED wavelength peak is off by 2 nm or so. Apart from improving the absorbance signal, a second advantage of selecting the extinction maximum is that the signal is less sensitive to small deviations in LED wavelength, since the slope at the peak is 0 (though the drop-off away from the peak is steep, so this effect is limited). A sample COM image obtained using 415 nm illumination is depicted in FIG. 2.
[0050] As depicted in FIG. 2, violet illumination results in good contrast for RBCs in comparison to platelets and WBCs. Contrast also aids in machine-based RBC segmentation and counting, since RBCs are easily distinguished from other objects in the image.
[0051] It is assumed in the above analysis that all Hb is converted to oxy-Hb. If this is not the case, the MCH correlation is likely to be poor. However, there are different ways to address this potential problem.
[0052] One solution is to illuminate the blood at the maximum oxy/deoxy-Hb isosbestic point, 422 nm. Isosbestic points are wavelengths where both forms of Hb have equal absorbance. However, LEDs are not easily found at this wavelength. To predict the effect of off-isosbestic illumination, the ratio of measured milt, to true milt, can be calculated, where the measured milt, is calculated under the assumption of full oxygenation. The m.sub.Hb,measured is inversely proportional to .di-elect cons..sub.Hb, as seen in Equation (6), meaning that the mass measurement of any deoxy Hb will be off by a factor of .di-elect cons..sub.deoxy-Hb/.di-elect cons..sub.oxy-Hb, the ratio of true extinction to presumed extinction. To calculate the mass ratio, the mass fractions of oxy-Hb and deoxy-Hb should be added together but with the deoxy-Hb fraction multiplied by the ratio of the extinction coefficients:
m Hb , measured m Hb , true = f + deoxy - Hb oxy - Hb ( 1 - f ) ( 10 ) ##EQU00009##
[0053] where f is the oxy-Hb fraction, set to 0.6 in the worst case. Converting the mass ratio to a percent difference is straightforward, and the result is obtained that if the illumination is even 1 nm off the isosbestic point in either direction, the resulting Hb mass measurement will off be up to 4%. This is due to the sharply opposing slopes of the oxy/deoxy-Hb absorbance. A wavelength tolerance of <1 nm may be achievable with appropriate illumination sources and optical filters, but a simpler solution is available, as described below.
[0054] There are other isosbestic points with less severe differences in slopes, such as 390 nm, but these have much lower absorbance, reducing RBC contrast. They may be useful, but would be more difficult from a computer-vision perspective.
[0055] Another possibility is to chemically convert both oxy-Hb and deoxy-Hb to a third, single form. StP instruments typically convert all Hb to carboxyhemoglobin (CO-Hb) or methemoglobin (met-Hb) after lysing the RBCs. For Hb microspectrometry, Hb needs to be converted within the cell, without damaging the membrane, during a reasonably short incubation time. Fortunately, sodium nitrite (NaNO.sub.2) is a suitable conversion agent. Sodium nitrite can pass through the RBC membrane, and it converts both oxy- and deoxy-Hb to met-Hb. Met-Hb is hemoglobin whose iron ions have an oxidation state of 3+, instead of the normal 2+. Oxygen does not bind to met-Hb. Met-Hb has an absorbance maximum at 405 nm with a 10-20% higher extinction coefficient compared to oxy-Hb [C. Donadee, N. J. H. Raat, T. Kanias, J. Tejero, J. S. Lee, E. E. Kelley, X. Zhao, C. Liu, H. Reynolds, I. Azarov, S. Frizzell, E. M. Meyer, A. D. Donnenberg, L. Qu, D. Triulzi, D. B. Kim-Shapiro, and M. T. Gladwin, "Nitric oxide scavenging by red blood cell microparticles and cell-free hemoglobin as a mechanism for the red cell storage lesion," Circulation, vol. 124, no. 4, pp. 465-76, July 2011]. Assuming the maximum extinction coefficient for met-Hb is 15% higher than that of oxyHb, the MCH equation becomes:
MCH = 1.28 N n = 1 N p = 1 P n log ( I 0 , np I np ) ( 11 ) ##EQU00010##
[0056] Blood and Power [30] showed that conversion of both oxy-Hb and deoxy-Hb to met-Hb in live RBCs is also relatively rapid, particularly when both oxy-Hb and deoxy-Hb species exist in the blood: maximum [met-Hb] was reached after 20 minutes with an initial 1:12 nitrite:heme ratio (heme being the oxygen binding subunit of Hb, of which there are four per molecule), and was followed by [metHb] decreasing slowly due to methemoglobin reductase activity and reaction with nitric oxide, the byproduct of methemylation of deoxy-Hb [A. B. Blood and G. G. Power, "In vitro and in vivo kinetic handling of nitrite in blood: effects of varying hemoglobin oxygen saturation," Am. J. Physiol. Heart Circ. Physiol., vol. 293, pp. H1508-17, September 2007].
[0057] At normal venous blood oxygenation of 60%, the worst-case scenario for capillary blood, approximately 100% conversion to met-Hb is achieved after 60 seconds (using purified Hb) [R. Grubina, Z. Huang, S. Shiva, M. S. Joshi, I. Azarov, S. Basu, L. a Ringwood, A. Jiang, N. Hogg, D. B. Kim-Shapiro, and M. T. Gladwin, "Concerted nitric oxide formation and release from the simultaneous reactions of nitrite with deoxy- and oxyhemoglobin," J. Biol. Chem., vol. 282, no. 17, pp. 12916-27, April 2007]. Therefore, conversion efficiency and rate is not likely to be an issue.
[0058] Methemylation is therefore seen as a viable option for improving the reliability of COM-based microspectrometry. Using nitrite in large excess is posited to rapidly convert all of the Hb within cells and hold it at the maximum concentration longer than required for a COM experiment.
[0059] In order to obtain consistently precise estimates of the MCH, it must be ensured that a sufficient number of countable RBCs are present in any COM image.
[0060] The standard error of the mean of measurements drawn from a Gaussian distribution is
e=.sigma. {square root over (N)} (12)
[0061] where .sigma. is the standard deviation and N is the number of measurements. Assuming that m.sub.Hb,RBC follows a Gaussian distribution between RBCs, this equation can be applied to the MCH measurement, where N is the number of RBCs sampled for the calculation of the MCH. Thus, "CV.sub.MCH,sampling", the CV of e.sub.MCH, is given by:
CV MCH , sampling = e MCH MCH * 100 = .sigma. mHb , RBC MCH N * 100 = CV mHb , RBC N ( 13 ) ##EQU00011##
[0062] where .sigma..sub.mHb,RBC is the standard deviation of the m.sub.Hb,RBC measurements (MCH is the mean of these measurements). Solving for N yields:
N = ( CV mHb , RBC CV MCH , sampling ) 2 ( 14 ) ##EQU00012##
[0063] Assuming a worst-case CV.sub.mHb,RBc of 50% (which would be highly clinically abnormal), to achieve an ideal value of CV.sub.MCH,sampling<1%, making it essentially negligible with respect to a target CV.sub.MCH of 5%, at least 2000 RBCs need to be sampled, as calculated by substituting these two values into Equation (14).
[0064] At roughly 50 pixels per RBC and 8 million pixels in the field-of-view of an 8 megapixel sensor with 1.1 .mu.m pixel pitch, well over 10 000 RBCs can be included the field of view while still leaving most of the area as background (which allows for more straightforward calculation of I.sub.0).
[0065] Beer's law relies on several assumptions that do not necessarily hold true in Hb microspectrometry. This can lead to an overall bias, cell-to-cell variation, or person-to-person variation in MCH calculations, the latter because blood from different persons can have different characteristics. Bias is correctable, and the number of RBCs counted is so large that the error of the estimate of the mean m.sub.Hb,RBC will be small, as described above. Person-to-person variation is therefore of the most concern, as this would weaken the correlation between MCH measured by
[0066] COM and by current standard-of-practice (StP)
[0067] Beer's law assumes that there are no scattering or absorption events caused by materials in the blood film other than Hb itself. However, material inside or outside the RBC may also scatter or absorb. These events may lead to underestimation of the MCH, the effect is likely small, as Hb has much higher absorbance than any other blood/diluent component at the wavelengths in question [A. Airinei and A. Sadoveanu, "Spectrophotometric Analysis of the Blood Plasma," Rom. J. Biophys., vol. 16, no. 3, pp. 215-20,2006][M. De, S. Rana, H. Akpinar, 0. R. Miranda, R. R. Arvizo, U. H. F. Bunz, and V. M. Rotello, "Sensing of proteins in human serum using conjugates of nanoparticles and green fluorescent protein," Nat. Chem., vol. 1, no. September, pp. 461-5, 2009].
[0068] Reference physiological "free" [Hb] (Hb concentration in the plasma) is as high as 5 .mu.M [N. Na, J. Ouyang, Y. E. C. Taes, and J. R. Delanghe, "Serum free hemoglobin concentrations in healthy individuals are related to haptoglobin type," Clin. Chem., vol. 51, no. 9, pp. 1754-5, September 2005], while reference MCHC values are as low as 5000 .mu.M [N. Beck, Diagnostic Hematology. London: Springer London, 2009], three orders of magnitude higher than the image background. Thus free plasma is normally negligible in the MCH calculation. The assumption of negligible [Hb] outside RBCs may be false if significant hemolysis is present. Free [Hb] can rise to 10 .mu.M during severe sepsis [M. Adamzik, T. Hamburger, F. Petrat, J. Peters, H. de Groot, and M. Hartmann, "Free hemoglobin concentration in severe sepsis: methods of measurement and prediction of outcome," Crit. Care, vol. 16, no. 4, July 2012] or 25 .mu.M during a sickle cell anemia crisis [D. J. Schaer, P. W. Buehler, A. I. Alayash, J. D. Belcher, and G. M. Vercellotti, "Hemolysis and free hemoglobin revisited: exploring hemoglobin and hemin scavengers as a novel class of therapeutic proteins," Blood, vol. 121, no. 8, pp. 1276-84, February 2013]. This, however, is still at least two orders of magnitude smaller than the lowest levels of MCHC, so it is still negligible.
[0069] The general method for measuring the MCH on a drop blood using COM is as follows: [0070] 1. A drop of blood is mixed and incubated briefly with an appropriate diluent. [0071] 2. The blood mixture is injected into the specimen chamber, forming a thin film between the COM sensor and a transparent chamber lid. [0072] 3. Multiple images are acquired while light of a specific wavelength is transmitted through the chamber lid to illuminate the cells. [0073] 4. The images are processed and analyzed by a computer-vision algorithm to extract the MCH. [0074] 5. The specimen chamber is cleaned.
[0075] To test the central hypothesis, several blood samples from different individuals were tested on both a single COM device and an StP machine. The data were compared using regression analysis to determine suitable correlation parameters, the coefficient of determination (R2), and the CV of the residuals.
[0076] Two diluents were prepared for the experiments, to be mixed with blood at a 3:1 diluent:blood ratio. Diluent N, which included NaNO2, contained the following components dissolved in distilled water:
[0077] 1. 112.3 mM NaNO2
[0078] 2. 6.5 mM Brilliant Cresyl Blue stain (Sigma, 860867)
[0079] 3. 21.3 mM Disodium EDTA (EM Science, EX0539-1)
[0080] 4. 5.87 mM HEPES (Sigma, H4034)
[0081] 5. 5.57 mM KCl
[0082] 6. 7.36 mM NaCl
[0083] Diluent xN, which excluded NaNO2, contained the following components dissolved in distilled water:
[0084] 1. 6.5 mM Brilliant Cresyl Blue stain (1% w/w)
[0085] 2. 21.3 mM Disodium dihydrate EDTA
[0086] 3. 5.87 mM HEPES
[0087] 4. 5.57 mM KCl
[0088] 5. 118.6 mM NaCl
[0089] The key component of Diluent N diluent was NaNO2, used to convert oxy-Hb and deoxy-Hb to met-Hb. Diluents N and xN were identical except for the replacement in Diluent xN of NaNO2 with a molar equivalent of NaCl. The Brilliant Cresyl Blue stain was included for experiments that are beyond the scope of this research. The diluent was designed to fulfill several functions to ensure that the cells maintained their health and form: [0090] 1. Isotonicity, to maintain cell shape and health, was achieved using appropriate concentrations of NaCl, KCl, and NaNO2 in the diluents. [0091] 2. Anticoagulation prevents blood cells from aggregating irreversibly, which makes counting them difficult. Ethylenediaminetetraacetic acid (EDTA) was included as an anticoagulant. [0092] 3. The diluent was buffered at physiological pH (.about.7.4) using the HEPES buffer.
[0093] In some cases the diluent is chosen to achieve sphering of the red blood cells. It may be advantageous if the spacer (chamber height) is small enough (<3 .mu.m) so that the resulting spherical red blood cells are compressed into a more-or-less cylindrical shape by the lowered chamber-lid, to provide an approximately uniform path length for the collimated light and to simplify the determination of cell volume. The sphering agent can comprise inclusion of a surfactant such as sodium dodecyl sulfonate or hexadecyl trimethyl ammonium chloride. (See US patent application publication 2009/0258338).
[0094] Diluents were used to dilute a small blood sample at a 3:1 diluent:blood ratio. A thin film of this mixture was then formed by placing a drop between a glass slide and a glass coverslip. This film was examined using transmission microscopy to ensure that the cells were not damaged by the diluent. Cells using diluents N and xN diluents appeared very similar to cells in blood diluted using other formulations that met the requirements described above. In an acceptable diluent formulation, RBCs appear quite circular, with few having bulges or wrinkles. Also, almost all RBCs have light centers surrounded by a darker band. This indicates biconcavity, since the thinner cell center absorbs less light. Further, lack of coagulation is indicated by the individual cells appearing fairly evenly distributed and without stacking.
[0095] The COM sensor used was an Omnivision OV8850, with 1.1 .mu.m square pixels. Bayer color filters were removed by reactive-ion etching.
[0096] A transparent chamber lid was used to form the thin blood film on the COM sensor. A drop of blood:diluent mixture was placed on the sensor, and the chamber lid was gently lowered onto the sensor surface to a height of .about.3.5 .mu.m, with the height set using a spacer. This forced most of the blood mixture out the sides, leaving a small film of fluid remaining in the gap to be imaged.
[0097] The chamber height was not measured precisely. However, typical RBC have a maximum thickness of 2.6 .mu.m, so even if the chamber height varied by 20%, the chamber lid should not squash any RBCs. This height should cause the RBCs to lie flat though, as they have typical diameters 7.5 .mu.m [Y. Park, C. a Best, T. Auth, N. S. Gov, S. a Safran, G. Popescu, S. Suresh, and M. S. Feld, "Metabolic remodeling of the human red blood cell membrane," PNAS, vol. 107, no. 4, pp. 1289-94, January 2010]. When the chamber lid was well seated, RBC stacking (rouleaux) was not observed.
[0098] The illuminator for the blood images consisted of two LEDs: a 405 nm LED (Mouser Electronics, 749-UV3TZ-405-15), a 415 nm LED (Lumex, SSL-LXT046UV3C).
[0099] Experiment 1: Using Diluent N (nitrite-included) and 405 nm light, blood samples from 15 different individuals were each tested once on the StP. These 15 samples were tested between two and four times each using COM.
[0100] Experiment 2: The final six samples used in Experiment 1 were also tested using COM and Diluent xN (nitrite-free) with 415 nm illumination, with between one and four COM tests per sample. For these six samples, the Experiment 2 tests were performed prior to the Experiment 1 tests because the former are likely to be more sensitive to oxygen contamination.
[0101] For the MCH calculations, all images were processed identically. Four violet images were averaged together to reduce noise, and the 20-frame averaged 6 ms-exposure darkframe was subtracted, yielding a single master image. The computer-vision algorithm consisted of three steps:
[0102] 1. Estimate the background value for every pixel in the image
[0103] 2. Segment regions containing exactly one RBC (image segmentation)
[0104] 3. Calculate the MCH using Equation (8)
[0105] In each RBC segmentation, the background level calculated for each pixel was assigned to I0,np in Equation (8). For the image segmentation of step 2, a COM image was first thresholded to produce a binary mask. Objects greater than 1.5.times. or less than 0.5.times. the mean RBC size were eliminated. This eliminated the vast majority of noise, artifacts, RBC clusters, and occasional pixels from non-RBC objects. The remaining objects became the RBC segmentations for the MCH calculation. Step 3 took the intensity values for the pixels in each RBC segmentation and scanned over them, applying the MCH equations described above. Equation (11) was used with Diluent N, and Equation (9) was used for Diluent xN.
[0106] Data acquisition and analysis in comparison with StP showed that the results of the Diluent xN tests and the corresponding Diluent N tests were somewhat similar. Both met the CVMCH, target requirement, with similar CVMCH's of 2.27% and 3.38% respectively. For these subjects, the correlation between COM and StP measurements was very strong for both Diluent N and xN, with R2 values of 0.96 and 0.98 respectively.
[0107] Variation in MCHCOM measurements depends on several factors, one of which is RBC shape, presumably due to violations of the Beer's law assumptions discussed above. Thus measurements of MCH, as well as of MCV, can be improved by converting the RBCs from dicoid to spherical shape [Kim Y R, Ornstein L: Isovolumetric sphering of erythrocytes for more accurate and precise cell volume measurement by flow cytometry. Cytometry 4:419, 1983] and various US patents [e.g., Fan et al., 1997 U.S. Pat. No. 5,633,167 and patents cited therein]. If the chamber (i.e., spacer) height is less than the diameter of the sphered RBCs, they will be compressed into cylinders of uniform thickness.
[0108] Other implementations are within the scope of the following claims. For example, the described approach is not restricted to measurements of hemoglobin in red blood cells, but can be used to measure any substance that has a distinctive absorbance spectrum, in any cell or particle (so, for example in principle, for monitoring production of biopharmaceutical compounds by genetically engineered yeast cells).
* * * * *
References
D00001
D00002


P00001

XML
uspto.report is an independent third-party trademark research tool that is not affiliated, endorsed, or sponsored by the United States Patent and Trademark Office (USPTO) or any other governmental organization. The information provided by uspto.report is based on publicly available data at the time of writing and is intended for informational purposes only.
While we strive to provide accurate and up-to-date information, we do not guarantee the accuracy, completeness, reliability, or suitability of the information displayed on this site. The use of this site is at your own risk. Any reliance you place on such information is therefore strictly at your own risk.
All official trademark data, including owner information, should be verified by visiting the official USPTO website at www.uspto.gov. This site is not intended to replace professional legal advice and should not be used as a substitute for consulting with a legal professional who is knowledgeable about trademark law.