Cluster Classification And Prognosis Prediction System Based On Biological Characteristics Of Gastric Cancer
HUH; Yong Min
U.S. patent application number 16/341931 was filed with the patent office on 2019-08-08 for cluster classification and prognosis prediction system based on biological characteristics of gastric cancer. This patent application is currently assigned to Novomics Co., Ltd.. The applicant listed for this patent is Novomics Co., Ltd.. Invention is credited to Yong Min HUH.
| Application Number | 20190241972 16/341931 |
| Document ID | / |
| Family ID | 63919903 |
| Filed Date | 2019-08-08 |


View All Diagrams
| United States Patent Application | 20190241972 |
| Kind Code | A1 |
| HUH; Yong Min | August 8, 2019 |
CLUSTER CLASSIFICATION AND PROGNOSIS PREDICTION SYSTEM BASED ON BIOLOGICAL CHARACTERISTICS OF GASTRIC CANCER
Abstract
The present invention relates to a group classification and prognosis prediction system based on the biological characteristics of gastric cancer, and an algorithm capable of predicting the prognosis of advanced gastric cancer in terms of overall survival by using a quantified value of an mRNA expression level of a target gene group has been developed and this may be used as auxiliary information for determining a treatment method of a gastric cancer patient.
| Inventors: | HUH; Yong Min; (Seoul, KR) | ||||||||||
| Applicant: |
|
||||||||||
|---|---|---|---|---|---|---|---|---|---|---|---|
| Assignee: | Novomics Co., Ltd. Seoul KR |
||||||||||
| Family ID: | 63919903 | ||||||||||
| Appl. No.: | 16/341931 | ||||||||||
| Filed: | April 24, 2018 | ||||||||||
| PCT Filed: | April 24, 2018 | ||||||||||
| PCT NO: | PCT/KR2018/004732 | ||||||||||
| 371 Date: | April 15, 2019 |
| Current U.S. Class: | 1/1 |
| Current CPC Class: | G16B 5/20 20190201; G16B 25/10 20190201; G16B 40/20 20190201; G16B 20/00 20190201; C12Q 2600/158 20130101; G16B 5/00 20190201; G16B 40/00 20190201; G16B 40/30 20190201; C12Q 2600/118 20130101; C12Q 1/6886 20130101 |
| International Class: | C12Q 1/6886 20060101 C12Q001/6886; G16B 5/20 20060101 G16B005/20; G16B 40/00 20060101 G16B040/00 |
Foreign Application Data
| Date | Code | Application Number |
|---|---|---|
| Apr 24, 2017 | KR | 10-2017-0052365 |
Claims
1. A composition for predicting a prognosis of stage II and III advanced gastric cancer, the composition comprising: an agent for measuring an mRNA expression level of a target gene group including TFF1, TFF2, VSIG1, CNN1, NEXN, SCRG1, SORBS1, SPARCL1, AURKA, BUB1, CDC20, CEP55, PTTG1, UBE2C, CD8A, GBP1, GBP5, GZMB, NKG7, WARS, ANTXR1, SFRP4, VCAN, CDH17, CDX1, and MYO1A; and an agent for measuring an mRNA expression level of a reference gene group including ACTB, ATP5E, GPX1, UBB, and HPRT1.
2. The composition of claim 1, wherein the agent for measuring an mRNA expression level of the target gene group or the reference gene group comprises an oligonucleotide having a sequence complementary to the mRNA.
3. The composition of claim 1, wherein the agent for measuring an mRNA expression level of the target gene group or the reference gene group comprises a primer set listed in SEQ ID NOS: 1 to 62; or a probe listed in SEQ ID NOS: 63 to 93.
4. The composition of claim 1, wherein the composition is to predict a prognosis of stage II and III advanced gastric cancer in terms of overall survival.
5. A kit for predicting a prognosis of stage II and III advanced gastric cancer, the kit comprising the composition of claim 1.
6. The kit of claim 5, wherein the kit comprises a quantitative real-time polymerase chain reaction (qPCR) kit.
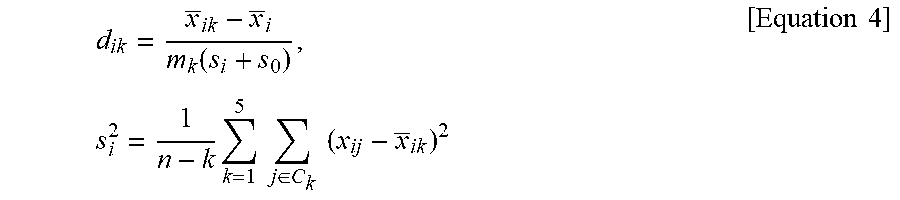
7. A method of providing information for predicting a prognosis of stage II and III gastric cancer, the method comprising: in a sufficiently statistically significant number of reference samples and biological samples obtained from stage II and III advanced gastric cancer patients, measuring mRNA expression levels of a target gene group and a reference gene group, the target gene group including: a gastric signature consisting of TFF1, TFF2, and VSIG1; a mesenchymal signature consisting of CNN1, NEXN, SCRG1, SORBS1, and SPARCL1; a proliferative signature consisting of AURKA, BUB1, CDC20, CEP55, PTTG1, and UBE2C; an immune signature consisting of CD8A, GBP1, GBPS, GZMB, NKG7, and WARS; a stem-like signature consisting of ANTXR1, SFRP4, and VCAN; and an intestinal signature consisting of CDH17, CDX1, and MYO1A, and the reference gene group including ACTB, ATP5E, GPX1, UBB, and HPRT1; calculating .DELTA.Cq values of the target gene groups of the reference samples and the biological samples according to Equation 1 below and inputting the values to a computer program; and performing non-negative matrix factorization (NMF) and NMF-based clustering on the values input to the computer program to be classified into a plurality of clusters, calculating a score value (SV) by applying a score (d'.sub.ik) of a target gene group in each cluster to Equation 2 below, classifying the clusters into an intestinal molecular subtype, an inflammatory molecular subtype, a mesenchymal molecular subtype, a mixed-stromal molecular subtype, and a gastric molecular subtype, and predicting a prognosis of a molecular subtype to which the biological samples belong by analyzing the prognosis in terms of overall survival, wherein the molecular subtypes of gastric cancer are classified such that a cluster in which the SV of the gastric signature is a maximum value is determined as a gastric molecular subtype; among clusters except for the cluster determined as the gastric molecular subtype, a cluster in which the SV of the mesenchymal signature is a maximum value and the SV of the proliferative signature is a minimum value is determined as a mesenchymal molecular subtype; among clusters except for the cluster determined as the gastric molecular subtype and the cluster determined as the mesenchymal molecular subtype, a cluster in which the SV of the immune signature is a maximum value and the SV of the intestinal signature is a minimum value is determined as an inflammatory molecular subtype; among clusters except for the cluster determined as the gastric molecular subtype, the cluster determined as the mesenchymal molecular subtype, and the cluster determined as the inflammatory molecular subtype, a cluster in which the SV of the stem-like signature is a maximum value is determined as a mixed-stromal molecular subtype; and a last remaining cluster is determined as an intestinal molecular subtype, and a prognosis of gastric cancer is predicted, in terms of overall survival, such that the inflammatory molecular subtype is predicted as a good prognosis group; the intestinal molecular subtype and the gastric molecular subtype are predicted as intermediate prognosis group; and the mixed-stromal molecular subtype and the mesenchymal molecular subtype are predicted as bad prognosis group: [Equation 1] .DELTA.Cq=(Cq value of target gene)-(Cq mean of reference gene group) wherein the Cq mean of reference gene group denotes a mean of Cq values of the reference gene group including ACTB, ATP5E, GPX1, UBB, and HPRT1, SV ( Score Value ) = 1 t i .di-elect cons. SN .theta. d ik ' [ Equation 2 ] ##EQU00025## wherein SV is an expression mean of each signature in the clusters obtained from NMF-based clustering, t is the number of genes (i) belonging to each signature, SN.sub..theta.is signature (.theta.=6), k denotes the number of clusters, which is an integer of 2 to 7, and d'.sub.ik a score based on a distance between the median of total gene and a mean of each cluster and is obtained according to Equation 3 below: [Equation 3] d'.sub.ik=sign (d.sub.ik)(|d.sub.ik|-.DELTA.).sub.+ wherein a critical value (.DELTA.) is set at 0.1 so that genes with no specificity according to molecular subtype are converged to 0, sign(d.sub.ik) denotes a sign of d.sub.ik, and d.sub.ik is obtained according to Equation 4 below: d ik = x _ ik - x _ i m k ( s i + s 0 ) , [ Equation 4 ] s i 2 = 1 n - k k = 1 5 j .di-elect cons. C k ( x ij - x _ ik ) 2 ##EQU00026## wherein x _ ik = j .di-elect cons. C k x ij n k ##EQU00027## is an expression mean of the (ith) gene in molecular subtype (k), x _ i = j = 1 n x ij n ##EQU00028## is a total mean of the same (ith) gene, m.sub.k denotes a degree of freedom ( m k = 1 n k + 1 n ) ##EQU00029## for correcting a standard error of denotes a X.sub.ik-X.sub.i, S.sub.i denotes a standard deviation of the entire sample of the (i) gene belonging to molecular subtype (k), and S.sub.0 denotes a median of S.sub.i.
8. The method of claim 7, wherein the number of samples sufficient to exhibit a statistical significance ranged from 300 to 10,000.
9. The method of claim 7, wherein the biological sample is selected from the group consisting of fresh tumor tissue, fresh-frozen tumor tissue, formalin-fixed paraffin-embedded tumor tissue, a fine needle aspirate, ascites, a tube washing solution, and a pleural fluid.
10. The method of claim 7, wherein the measuring of an mRNA expression level of the target gene group or the reference gene group is performed by quantitative real-time polymerase chain reaction (qPCR).
11. A method of predicting a prognosis of stage II and III gastric cancer, the method comprising: in a sufficiently statistically significant number of reference samples and biological samples obtained from stage II and III advanced gastric cancer patients, measuring mRNA expression levels of a target gene group and a reference gene group, the target gene group including: a gastric signature consisting of TFF1, TFF2, and VSIG1; a mesenchymal signature consisting of CNN1, NEXN, SCRG1, SORBS1, and SPARCL1; a proliferative signature consisting of AURKA, BUB1, CDC20, CEP55, PTTG1, and UBE2C; an immune signature consisting of CD8A, GBP1, GBP5, GZMB, NKG7, and WARS; a stem-like signature consisting of ANTXR1, SFRP4, and VCAN; and an intestinal signature consisting of CDH17, CDX1, and MYO1A, and the reference gene group including ACTB, ATP5E, GPX1, UBB, and HPRT1; calculating .DELTA.Cq values of the target gene groups of the reference samples and the biological samples according to Equation 1 below and inputting the .DELTA.Cq values to a computer program; and performing non-negative matrix factorization (NMF) and NMF-based clustering on the values input to the computer program to be classified into a plurality of clusters, calculating a score value (SV) by applying a score (d'.sub.ik) of a target gene group in each cluster to Equation 2 below, classifying the clusters into an intestinal molecular subtype, an inflammatory molecular subtype, a mesenchymal molecular subtype, a mixed-stromal molecular subtype, and a gastric molecular subtype, and predicting a prognosis of a molecular subtype to which the biological samples belong by analyzing the prognosis in terms of overall survival, wherein the molecular subtypes of gastric cancer are classified such that a cluster in which the SV of the gastric signature is a maximum value is determined as a gastric molecular subtype; among clusters except for the cluster determined as the gastric molecular subtype, a cluster in which the SV of the mesenchymal signature is a maximum value and the SV of the proliferative signature is a minimum value is determined as a mesenchymal molecular subtype; among clusters except for the cluster determined as the gastric molecular subtype and the cluster determined as the mesenchymal molecular subtype, a cluster in which the SV of the immune signature is a maximum value and the SV of the intestinal signature is a minimum value is determined as an inflammatory molecular subtype; among clusters except for the cluster determined as the gastric molecular subtype, the cluster determined as the mesenchymal molecular subtype, and the cluster determined as the inflammatory molecular subtype, a cluster in which the SV of the stem-like signature is a maximum value is determined as a mixed-stromal molecular subtype; and a last remaining cluster is determined as an intestinal molecular subtype, and a prognosis of gastric cancer is predicted, in terms of overall survival, such that the inflammatory molecular subtype is predicted as a good prognosis group; the intestinal molecular subtype and the gastric molecular subtype are predicted as intermediate prognosis group; and the mixed-stromal molecular subtype and the mesenchymal molecular subtype are predicted as bad prognosis group: [Equation 1] .DELTA.Cq=(Cq value of target gene)-(Cq mean of reference gene group) wherein the Cq mean of reference gene group denotes a mean of Cq values of the reference gene group including ACTB, ATP5E, GPX1, UBB, and HPRT1, SV ( Score Value ) = 1 t i .di-elect cons. SN .theta. d ik ' [ Equation 2 ] ##EQU00030## wherein SV is an expression mean of each signature in the clusters obtained from NMF-based clustering, t is the number of genes (i) belonging to each signature, SN.sub..theta.is signature (.theta.=6), k denotes the number of clusters, which is an integer of 2 to 7, and d'.sub.ik denotes a score based on a distance between a median of total gene and a mean of each cluster and is obtained according to Equation 3 below: [Equation 3] d'.sub.ik=sign(d.sub.ik)(|d.sub.ik|-.DELTA.).sub.+ wherein a critical value (.DELTA.) is set at 0.1 so that genes with no specificity according to molecular subtype are converged to 0, sign(d.sub.ik) denotes a sign of d.sub.ik, and d.sub.ik is obtained according to Equation 4 below: d ik = x _ ik - x _ i m k ( s i + s 0 ) , [ Equation 4 ] s i 2 = 1 n - k k = 1 5 j .di-elect cons. C k ( x ij - x _ ik ) 2 ##EQU00031## wherein x _ ik = j .di-elect cons. C k x ij n k ##EQU00032## is an expression mean of the (ith) gene in molecular subtype (k), x _ i = j = 1 n x ij n ##EQU00033## is a total mean of the same (ith) gene, m.sub.k denotes a degree of freedom ( m k = 1 n k + 1 n ) ##EQU00034## for correcting a standard error of X.sub.ik-X.sub.i, S.sub.i denotes a standard deviation of the entire sample of the (i) gene belonging to molecular subtype (k), and S.sub.0 denotes a median of S.sub.i.
12. The method of claim 11, wherein the number of samples sufficient to exhibit a statistical significance ranges from 300 to 10,000.
13. The method of claim 11, wherein the biological sample is selected from the group consisting of fresh tumor tissue, fresh-frozen tumor tissue, formalin-fixed paraffin-embedded tumor tissue, a fine needle aspirate, ascites, a tube washing solution, and a pleural fluid.
14. The method of claim 11, wherein the measuring of an mRNA expression level of the target gene group or the reference gene group is performed by quantitative real-time polymerase chain reaction (qPCR).
Description
BACKGROUND
1. Field of the Invention
[0001] The present invention relates to a group classification and prognosis prediction system based on biological characteristics of gastric cancer.
2. Discussion of Related Art
[0002] Globally, gastric cancer is the third highest cause of cancer-related mortality and is the most common cancer particularly in Korea except for thyroid cancer, which is known to have a relatively good prognosis. In Korea, the survival rate of patients with gastric cancer has been increased due to early detection through national health examination, surgery standardization, and the discovery of anti-cancer therapeutic agents or the like, but despite the currently standardized treatment, about a half of patients with stage II and III advanced gastric cancer experience recurrence.
[0003] Cancer has been recognized as genomic disorder, and efforts have been made to classify cancer according to molecular and biological characteristics in line with the development of genetic testing technologies, such as next generation sequencing (NGS), instead of classifying cancer according to existing anatomical and pathological phenotypes. It has recently been reported in the Cancer Genome Atlas (TCGA) project that gastric cancer can be largely classified into four types according to various molecular characteristics thereof. This indicates that, even with the same clinical stage in an anatomical sense, prognoses and the degree of chemotherapy benefit may differ according to molecular and biological characteristics.
[0004] According to recently reported TCGA project results of 295 gastric cancer patients, gastric cancer is classified as four types: {circle around (1)} Epstein-Barr virus positive (EBV positive); {circle around (2)} microsatellite instability-high (MSI-H); {circle around (3)} chromosomal instability (CIN); and {circle around (4)}P0 genomically stable (GS). Through this massive cancer genome sequencing, it can be seen that gastric cancer is divided into heterogeneous subgroups that are molecular-genetically distinguished, rather than having one cancer type. Thus, it suggests that to realize the personalized treatment of gastric cancer, it is necessary to identify subtypes based on molecular-genetic and pathological characteristics, discover corresponding target genes, and apply treatment accordingly. In addition, according to gastric cancer research results, it is reported that the prognosis of gastric cancer can be classified according to the subtype of gastric cancer.
[0005] If the prognosis of patients after chemotherapy treatment following gastric cancer surgery can be predicted, it will be a ground data capable of establishing a treatment strategy suitable for each prognosis. Currently, in standardized treatment practices, postoperative adjuvant chemotherapy treatment is used in all patients with stage II and III advanced gastric cancer. This, however, may be an undertreatment in groups with bad prognoses. Therefore, it may have a clinical significance for patient groups with poor prognoses if it were possible to develop strategies for other additional treatment methods in addition to the current standard treatment.
[0006] Since 2010, it has been discovered that in the case of stage II and III advanced gastric cancer, adjuvant chemotherapy treatment after standardized D2 gastrectomy increases the survival rate of gastric cancer patients, and currently, this corresponds to standard therapy. Traditionally, gastric cancer has been classified according to anatomic and pathologic phenotypes thereof, and cases of stage II or higher according to TNM stage classification receive chemotherapy treatments, but currently, there is no other method of predicting a prognosis according to chemotherapy treatment than TNM stage classification.
SUMMARY OF THE INVENTION
[0007] An object of the present invention is to provide a composition for predicting the prognosis of advanced gastric cancer, the composition based on a quantified value of an mRNA expression level of a target gene group, through which the postoperative prognosis of a patient with advanced gastric cancer (Stage II and III: based on AJCC 6.sup.th Edition) is predictable.
[0008] Another object of the present invention is to provide a method of providing information for predicting a prognosis in terms of the survival rate of patients, the method based on a quantified value of an mRNA expression level of a target gene group, through which the postoperative prognosis of an advanced gastric cancer patient is predictable.
[0009] Still another object of the present invention is to provide a method of predicting a prognosis in terms of the survival rate of patients, the method based on a quantified value of an mRNA expression level of a target gene group, through which the postoperative prognosis of an advanced gastric cancer patient is predictable.
[0010] According to an aspect of the present invention, provided is a composition for predicting a prognosis of stage II and III advanced gastric cancer, the composition including: an agent for measuring an mRNA expression level of a target gene group including TFF1, TFF2, VSIG1, CNN1, NEXN, SCRG1, SORBS1, SPARCL1, AURKA, BUB1, CDC20, CEP55, PTTG1, UBE2C, CD8A, GBP1, GBP5, GZMB, NKG7, WARS, ANTXR1, SFRP4, VCAN, CDH17, CDX1, and MYO1A; and an agent for measuring an mRNA expression level of a reference gene group including ACTB, ATP5E, GPX1, UBB, and HPRT1.
[0011] The present invention also provides a kit for predicting a prognosis of stage II and III advanced gastric cancer, the kit including the above-described composition.
[0012] The present invention also provides a method of providing information for predicting a prognosis of stage II and III gastric cancer or a method of predicting a prognosis of stage II and III gastric cancer, each of the methods including: [0013] in a sufficiently statistically significant number of reference samples and biological samples obtained from stage II and III advanced gastric cancer patients, [0014] measuring mRNA expression levels of a target gene group and a reference gene group, the target gene group including: a gastric signature consisting of TFF1, TFF2, and VSIG1; a mesenchymal signature consisting of CNN1, NEXN, SCRG1, SORBS1, and SPARCL1; a proliferative signature consisting of AURKA, BUB1, CDC20, CEP55, PTTG1, and UBE2C; an immune signature consisting of CD8A, GBP1, GBP5, GZMB, NKG7, and WARS; a stem-like signature consisting of ANTXR1, SFRP4, and VCAN; and an intestinal signature consisting of CDH17, CDX1, and MYO1A, and the reference gene group including ACTB, ATP5E, GPX1, UBB, and HPRT1; [0015] calculating .DELTA.Cq values of the target gene groups of the reference samples and the biological samples according to Equation 1 below and inputting the values to a computer program; and [0016] performing non-negative matrix factorization (NMF) and NMF-based clustering on the values input to the computer program to be classified into a plurality of clusters, calculating a score value (SV) by applying a score (d'.sub.ik) of the target gene group in each cluster to Equation 2 below, classifying the clusters into an intestinal molecular subtype, an inflammatory molecular subtype, a mesenchymal molecular subtype, a mixed-stromal molecular subtype, and a gastric molecular subtype, and predicting a prognosis of the molecular subtype to which the biological sample belongs by analyzing the prognosis in terms of overall survival, [0017] wherein the molecular subtypes of gastric cancer are classified such that a cluster in which the SV of the gastric signature is a maximum value is determined as a gastric molecular subtype; among clusters except for the cluster determined as the gastric molecular subtype, a cluster in which the SV of the mesenchymal signature is a maximum value and the SV of the proliferative signature is a minimum value is determined as a mesenchymal molecular subtype; among clusters except for the cluster determined as the gastric molecular subtype and the cluster determined as the mesenchymal molecular subtype, a cluster in which the SV of the immune signature is a maximum value and the SV of the intestinal signature is a minimum value is determined as an inflammatory molecular subtype; among clusters except for the cluster determined as the gastric molecular subtype, the cluster determined as the mesenchymal molecular subtype, and the cluster determined as the inflammatory molecular subtype, a cluster in which the SV of the stem-like signature is a maximum value is determined as a mixed-stromal molecular subtype; and a last remaining cluster is determined as an intestinal molecular subtype, and [0018] a prognosis of gastric cancer is predicted, in terms of overall survival, such that one classified as the inflammatory molecular subtype is predicted as a good prognosis group; those classified as the intestinal molecular subtype and the gastric molecular subtype are predicted as intermediate prognosis group; and those classified as the mixed-stromal molecular subtype and the mesenchymal molecular subtype are predicted as bad prognosis group:
[0018] [Equation 1]
.DELTA.Cq=(Cq value of target gene)-(Cq mean of reference gene group)
wherein the Cq mean of the reference gene group denotes a mean of Cq values of the reference gene group including ACTB, ATP5E, GPX1, UBB, and HPRT1,
SV ( Score Value ) = 1 t i .di-elect cons. SN .theta. d ik ' [ Equation 2 ] ##EQU00001## [0019] wherein SV is an expression mean of each signature in the clusters obtained from
[0020] NMF-based clustering, t is the number of genes (i) belonging to each signature, SN.sub..theta.is signature (.theta.=6), k denotes the number of clusters, which is an integer of 2 to 7, and d'.sub.ik denotes a score based on a distance between the median of total gene and a mean of each cluster and is obtained according to Equation 3 below:
[Equation 3]
d'.sub.ik=sign(d.sub.ik)(|d.sub.ik|-.DELTA.).sub.+ [0021] wherein a critical value (.DELTA.) is set at 0.1 so that genes with no specificity according to molecular subtype are converged to 0, sign (d.sub.ik) denotes a sign of d.sub.ik, and d.sub.ik is obtained according to Equation 4 below:
[0021] d ik = x _ ik - x _ i m k ( s i + s 0 ) , s i 2 = 1 n - k k = 1 5 j .di-elect cons. C k ( x ij - x _ ik ) 2 [ Equation 4 ] ##EQU00002## [0022] wherein
[0022] x _ ik = j .di-elect cons. C k x ij n k ##EQU00003##
is an expression mean of the (ith) gene in molecular subtype (k),
x _ i = j = 1 n x ij n ##EQU00004##
is a total mean of the same (ith) gene, m.sub.k denotes a degree of freedom
( m k = 1 n k + 1 n ) ##EQU00005##
for correcting a standard error of X.sub.ik-X.sub.i S.sub.i denotes a standard deviation of the entire sample of the (i) gene belonging to molecular subtype (k), and S.sub.0 denotes a median of S.sub.i.
[0023] According to the present invention, an algorithm capable of predicting the prognosis of advanced gastric cancer in terms of overall survival by using a quantified value of an mRNA expression level of a target gene group, through which the prognosis is predictable, has been developed and this can be used as auxiliary information for determining a treatment method of a gastric cancer patient.
BRIEF DESCRIPTION OF THE DRAWINGS
[0024] The above and other objects, features and advantages of the present invention will become more apparent to those of ordinary skill in the art by describing in detail exemplary embodiments thereof with reference to the attached drawings, in which:
[0025] FIG. 1 is a flowchart of the experimental analysis of the present invention, wherein process I is a process of identifying gastric cancer (GC) molecular subtypes, a classifier, and GC signatures, as a series of analysis results (NMF, non-negative matrix factorization; SAM, significance analysis of microarrays; PAM, prediction analysis of microarrays; GSEA, gene-set enrichment analysis; WGCNA, weighted gene co-expression network analysis), and process II is a process of identifying GC signatures and molecular subtypes for maximizing clinical efficiency through the construction of a series of probes for profiling the expression of GC signatures, miniClassifier-26, in patient samples.
[0026] FIG. 2 illustrates NMF consensus clustering results obtained using Classifier-PAM932, wherein (a) illustrates a heatmap (GSE13861p) of the Training set I characterized by the Molecular Signatures Database (MSigDB) and gene sets (digestion, spasmolytic polypeptide-expressing metaplasia (SPEM), intestinal metaplasia (IM), immune system, stroma, epithelial-mesenchymal transition (EMT), and cell cycle) analyzed in previous studies, which is the result of verifying NMF consensus clustering using independent test set I and Classifier-PAM932 (GST, gastric subtype; INF, inflammatory; MSC, mesenchymal; INT, intestinal; MXD, mixed-stromal molecular subtypes), and (b), (c), and (d) illustrate heatmaps of GSE62254 (Asian Cancer Research Group, ACRG), TCGA, and GSE15459 (Singapore), respectively, and the previously obtained subtype information is co-provided above each heat map.
[0027] FIG. 3 illustrates NMF clustering, wherein samples were designated using (a) consensus maps with cluster numbers (k) 2 to 7 and the following dispersion cut-offs, (b) Cophenetic correlation coefficients, and (c) silhouette widths, at SD=0.8, SD=0.9, and SD=1.0.
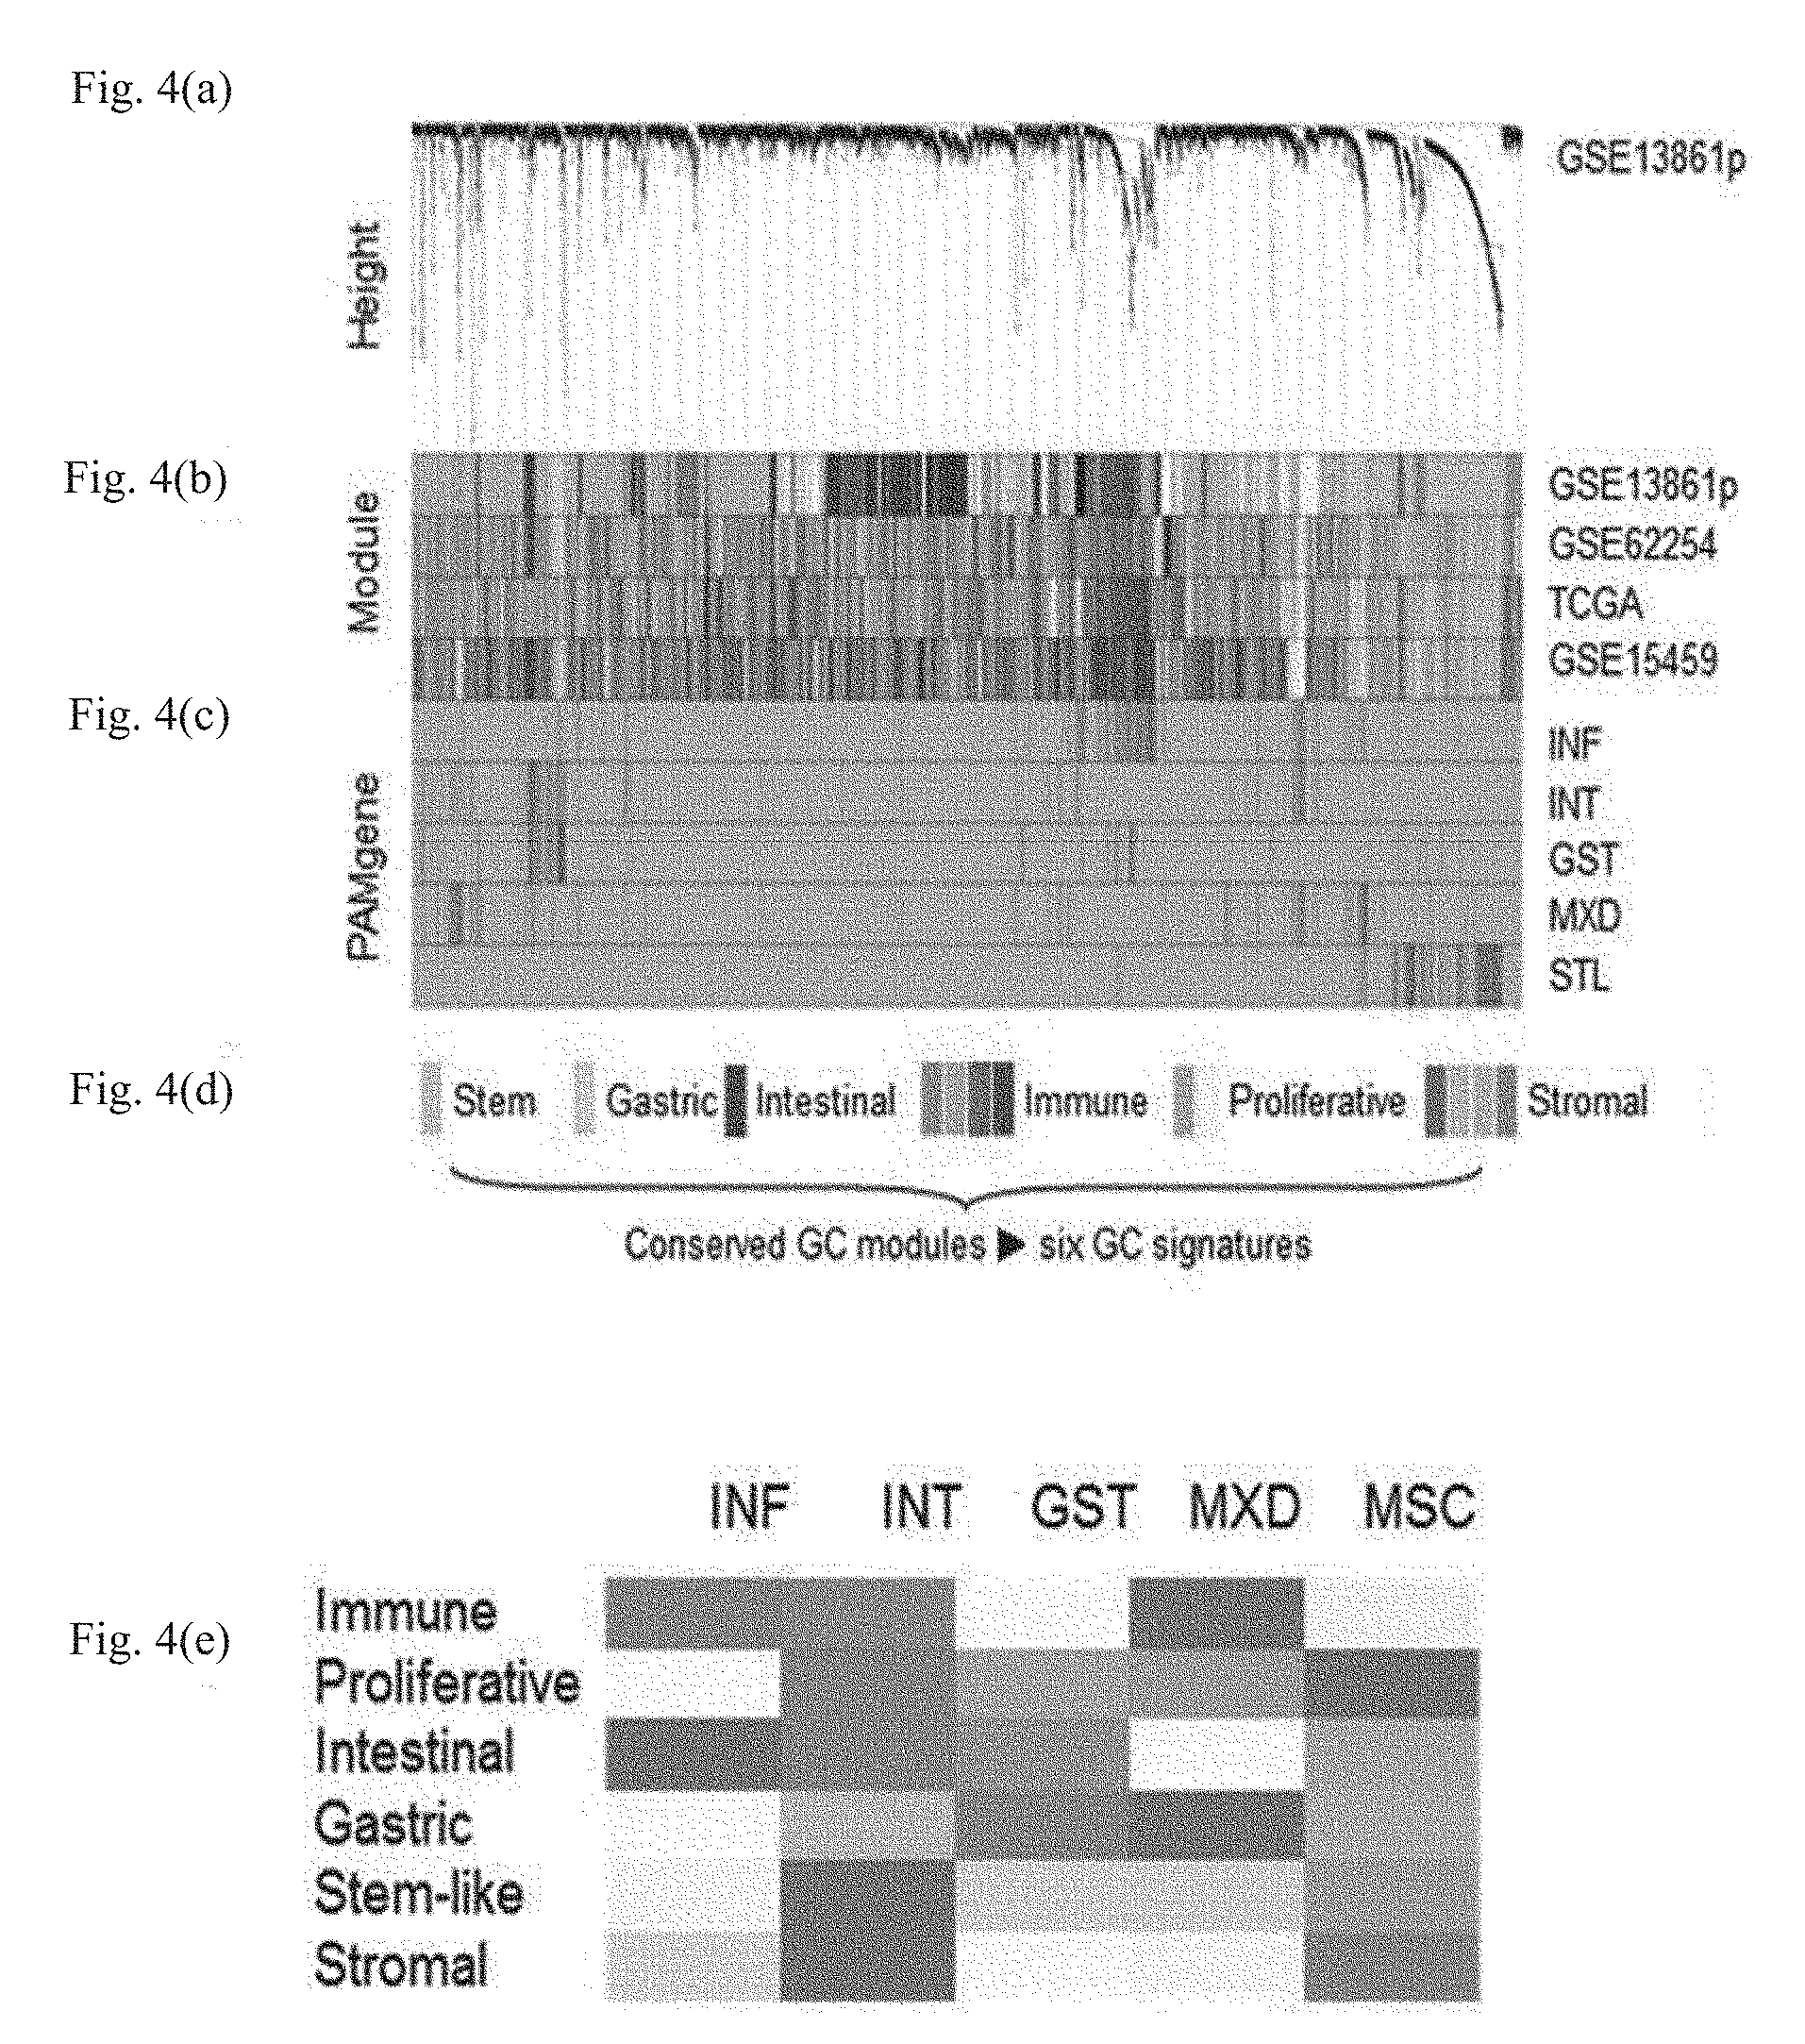
[0028] FIG. 4 illustrates subtype-defining gastric cancer signatures discovered by WGCNA analysis, wherein (a) illustrates a dendrogram of GSE13861p, (b) illustrates a module detected in GSE13861p and the corresponding module maps of GSE62254, TCGA, and GSE15459, in which when a module of each of a plurality of cohorts, which are an independent test set, shared common genes with the module of GSE13861p, the color of the module was one-to-one adjusted for visual convenience, (c) illustrates mapping results of the top 25% high-scoring PAMgenes of each subtype in a training set, and (d) illustrates six GC signatures represented by a combination of conserved modules in GC, and (e) illustrates the correlation between GC subtypes and six GC signatures as analyzed using Spearman's correlation, in which red represents modules positively correlated with corresponding subtype, and blue represents modules negatively correlated with corresponding subtype.
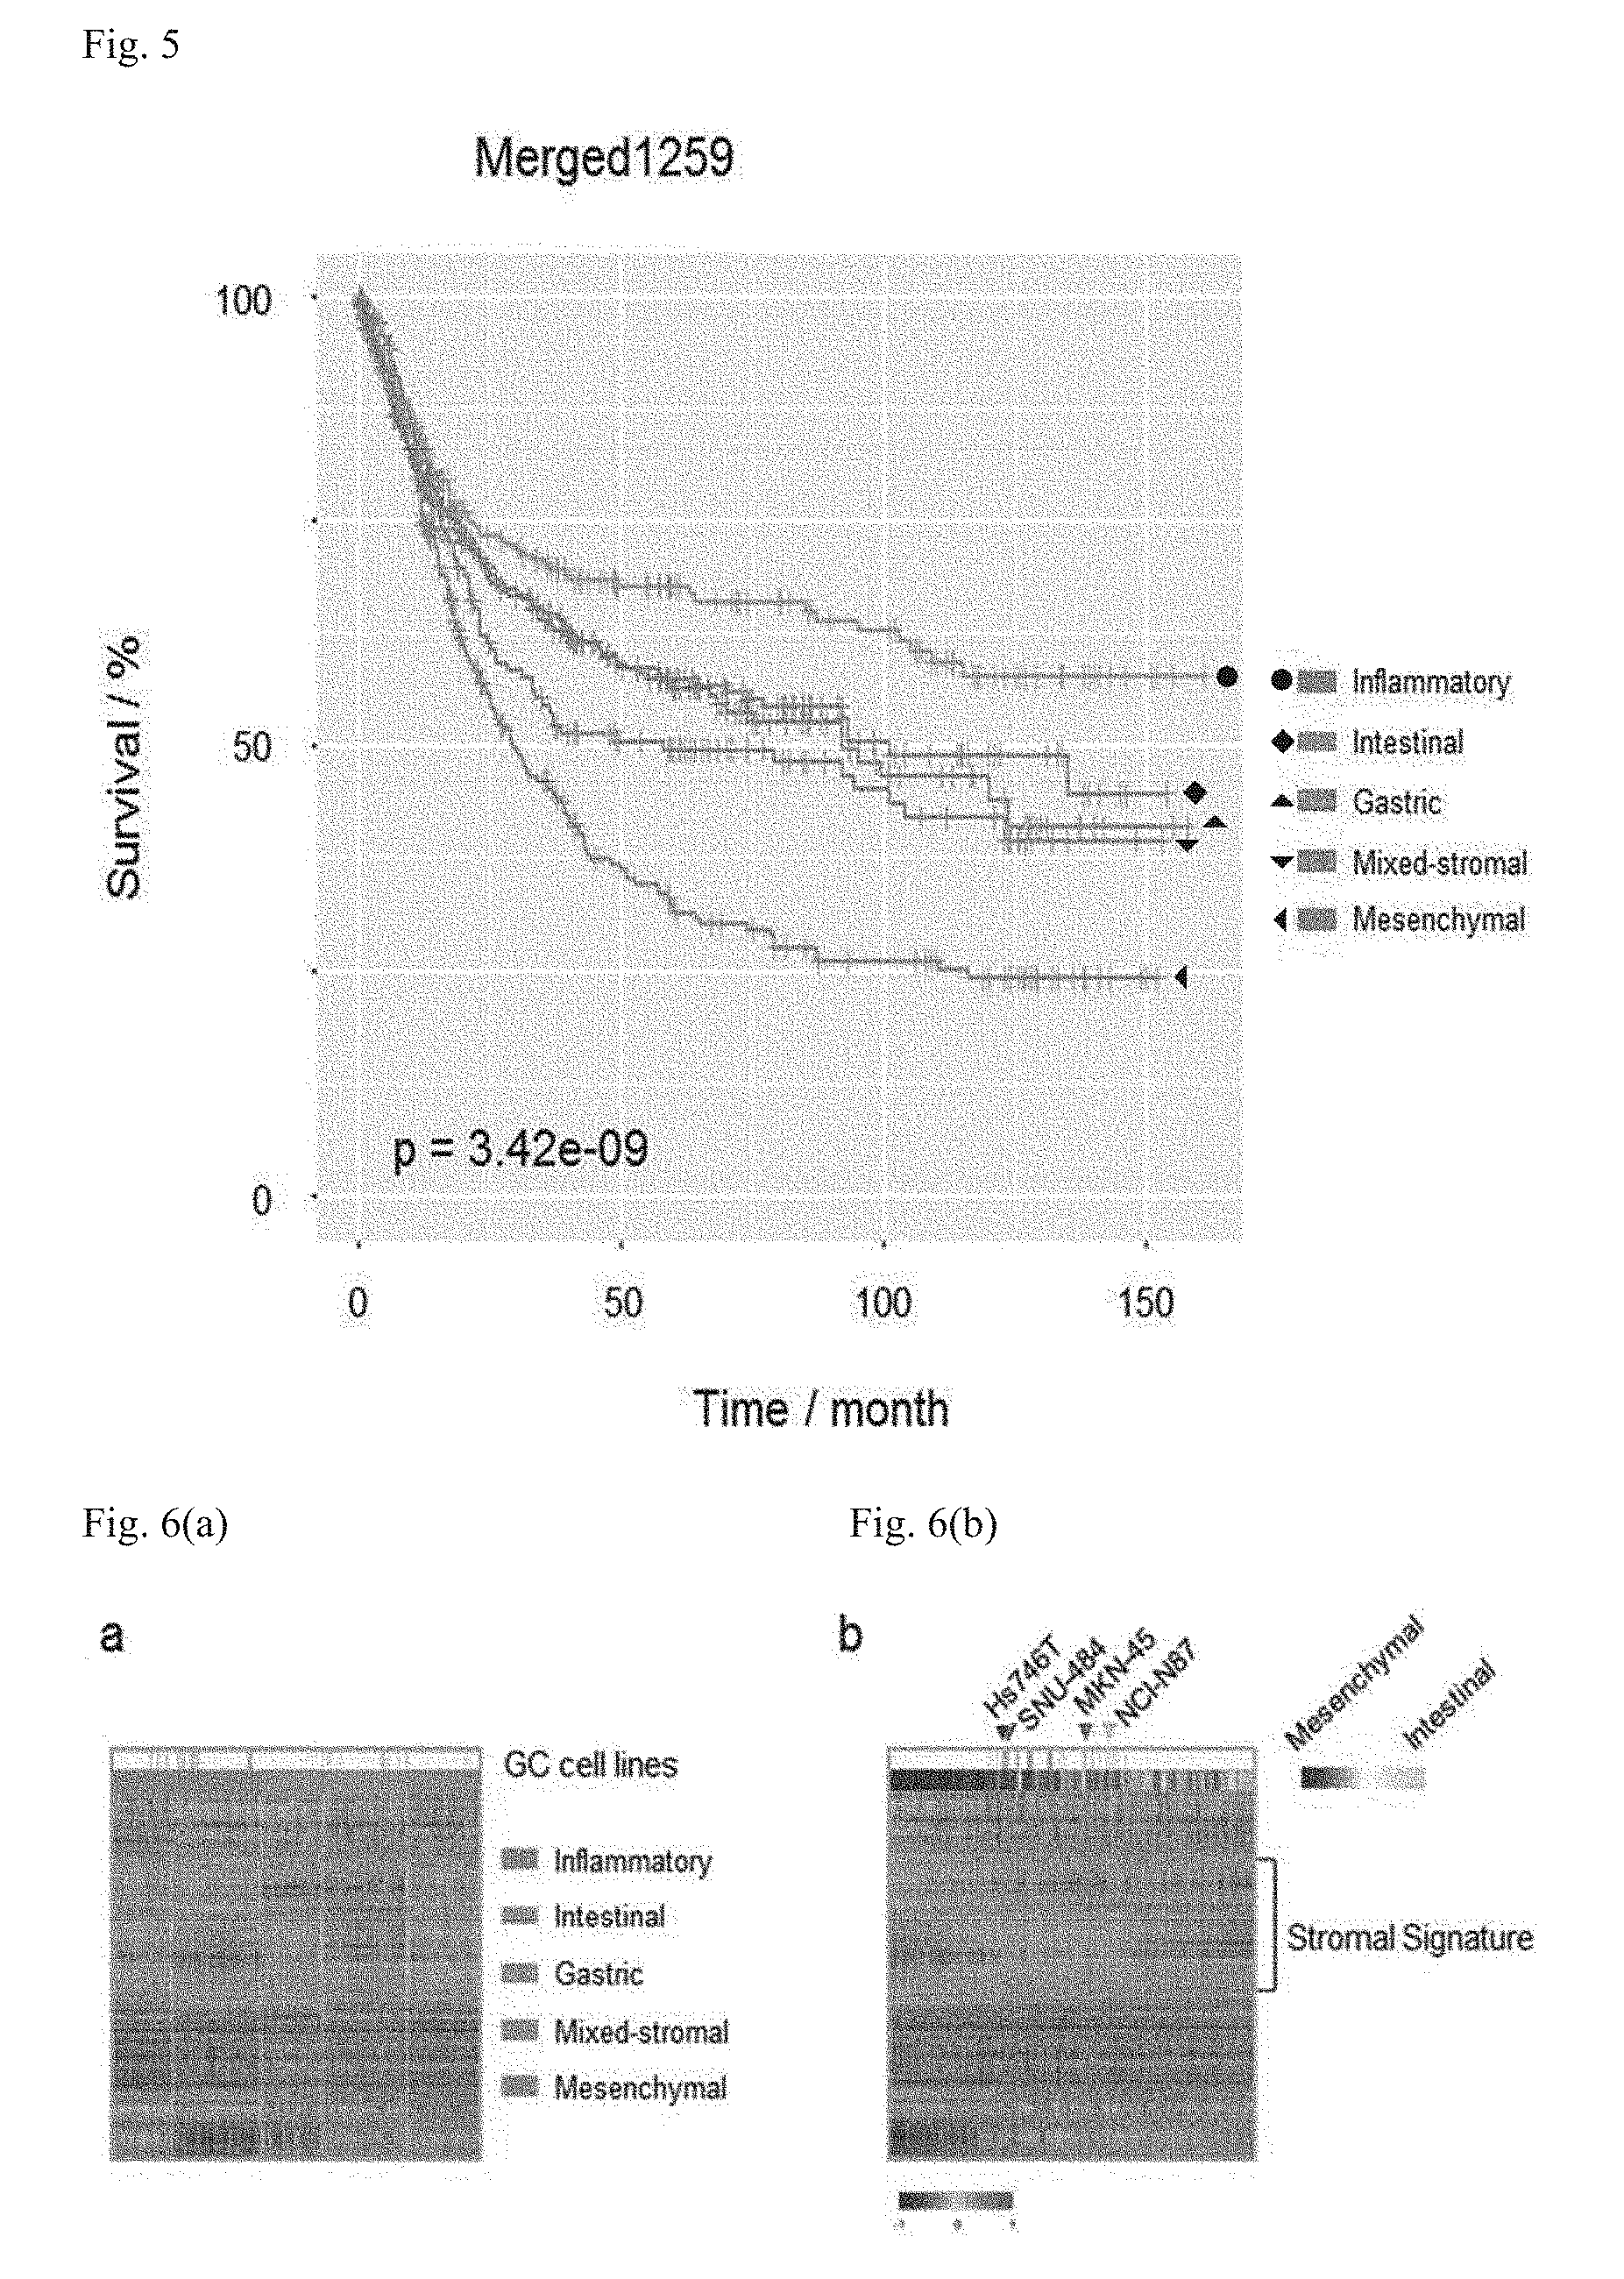
[0029] FIG. 5 illustrates an overall survival (OS) rate according to five subtypes by using Merged1259 (GSE13861p, GSE62254 (ACRG), TCGA, and GSE15459 (Singapore)), which is the training set of process II (likelihood ratio test; p=3.42e-09), and illustrates overall survival curves of 1198 samples, except for 61 samples with no clinical information, among Merged1259 cohort samples, wherein the five-year survival rate of each molecular subtype is 76.1% for INF (95% confidence interval, 67.7-85.7), 65.1% for INT (95% confidence interval: 56.2-75.4), 64.6% for GST (95% confidence interval: 55.0-75.9), 51.3% for MXD (95% confidence interval: 42.1-62.4), and 46.3% for MSC (95% confidence interval: 38.0-56.5).
[0030] FIG. 6 illustrates gastric cancer stromal signatures (n=26) investigated using cancer cell lines, wherein (a) is a heatmap showing GC subtypes in a training set combined with cancer cell line data, and (b) is a heatmap arranged with a stromal module eigengene in which Hs746, SNU-484 (MSC), MKN-45, and NCI-N87 (INT) cell lines are represented by arrowheads.
[0031] FIG. 7 compares MSC and INT types of GC lines by (a) in vitro scratch wound-healing assay, (b) invasion assay, (c) in vitro tumor spheroid formation assay (scale bars, 100 .mu.m), and (d) in vivo orthotopic tumorigenesis (n=3), in which the diffused growth of Hs746T and SNU-48 tumors and the confinement of MKN-45 and NCI-N87 tumors are bordered by white dotted lines in MRI images (axial section), images in the black-dotted box depict the orthotopic model construction, and suppression of the stromal behavior of Hs746T cells by treatment with a TGF-.beta. inhibitor (LY2157299 (LY)) was observed through in vitro scratch wound-healing assay (e), invasion assay (f), and in vitro tumor spheroid formation assay (g), and illustrates in vivo drug-resistance assay results measuring the tumor growth of Hs746t tumors (h) and NCI-N87 tumors (i) in a xenograft mouse model (n=8) under the co-administration of a TGF-.beta. inhibitor during combination drug therapy (oxaliplatin and fluorouracil) (P<0.05).
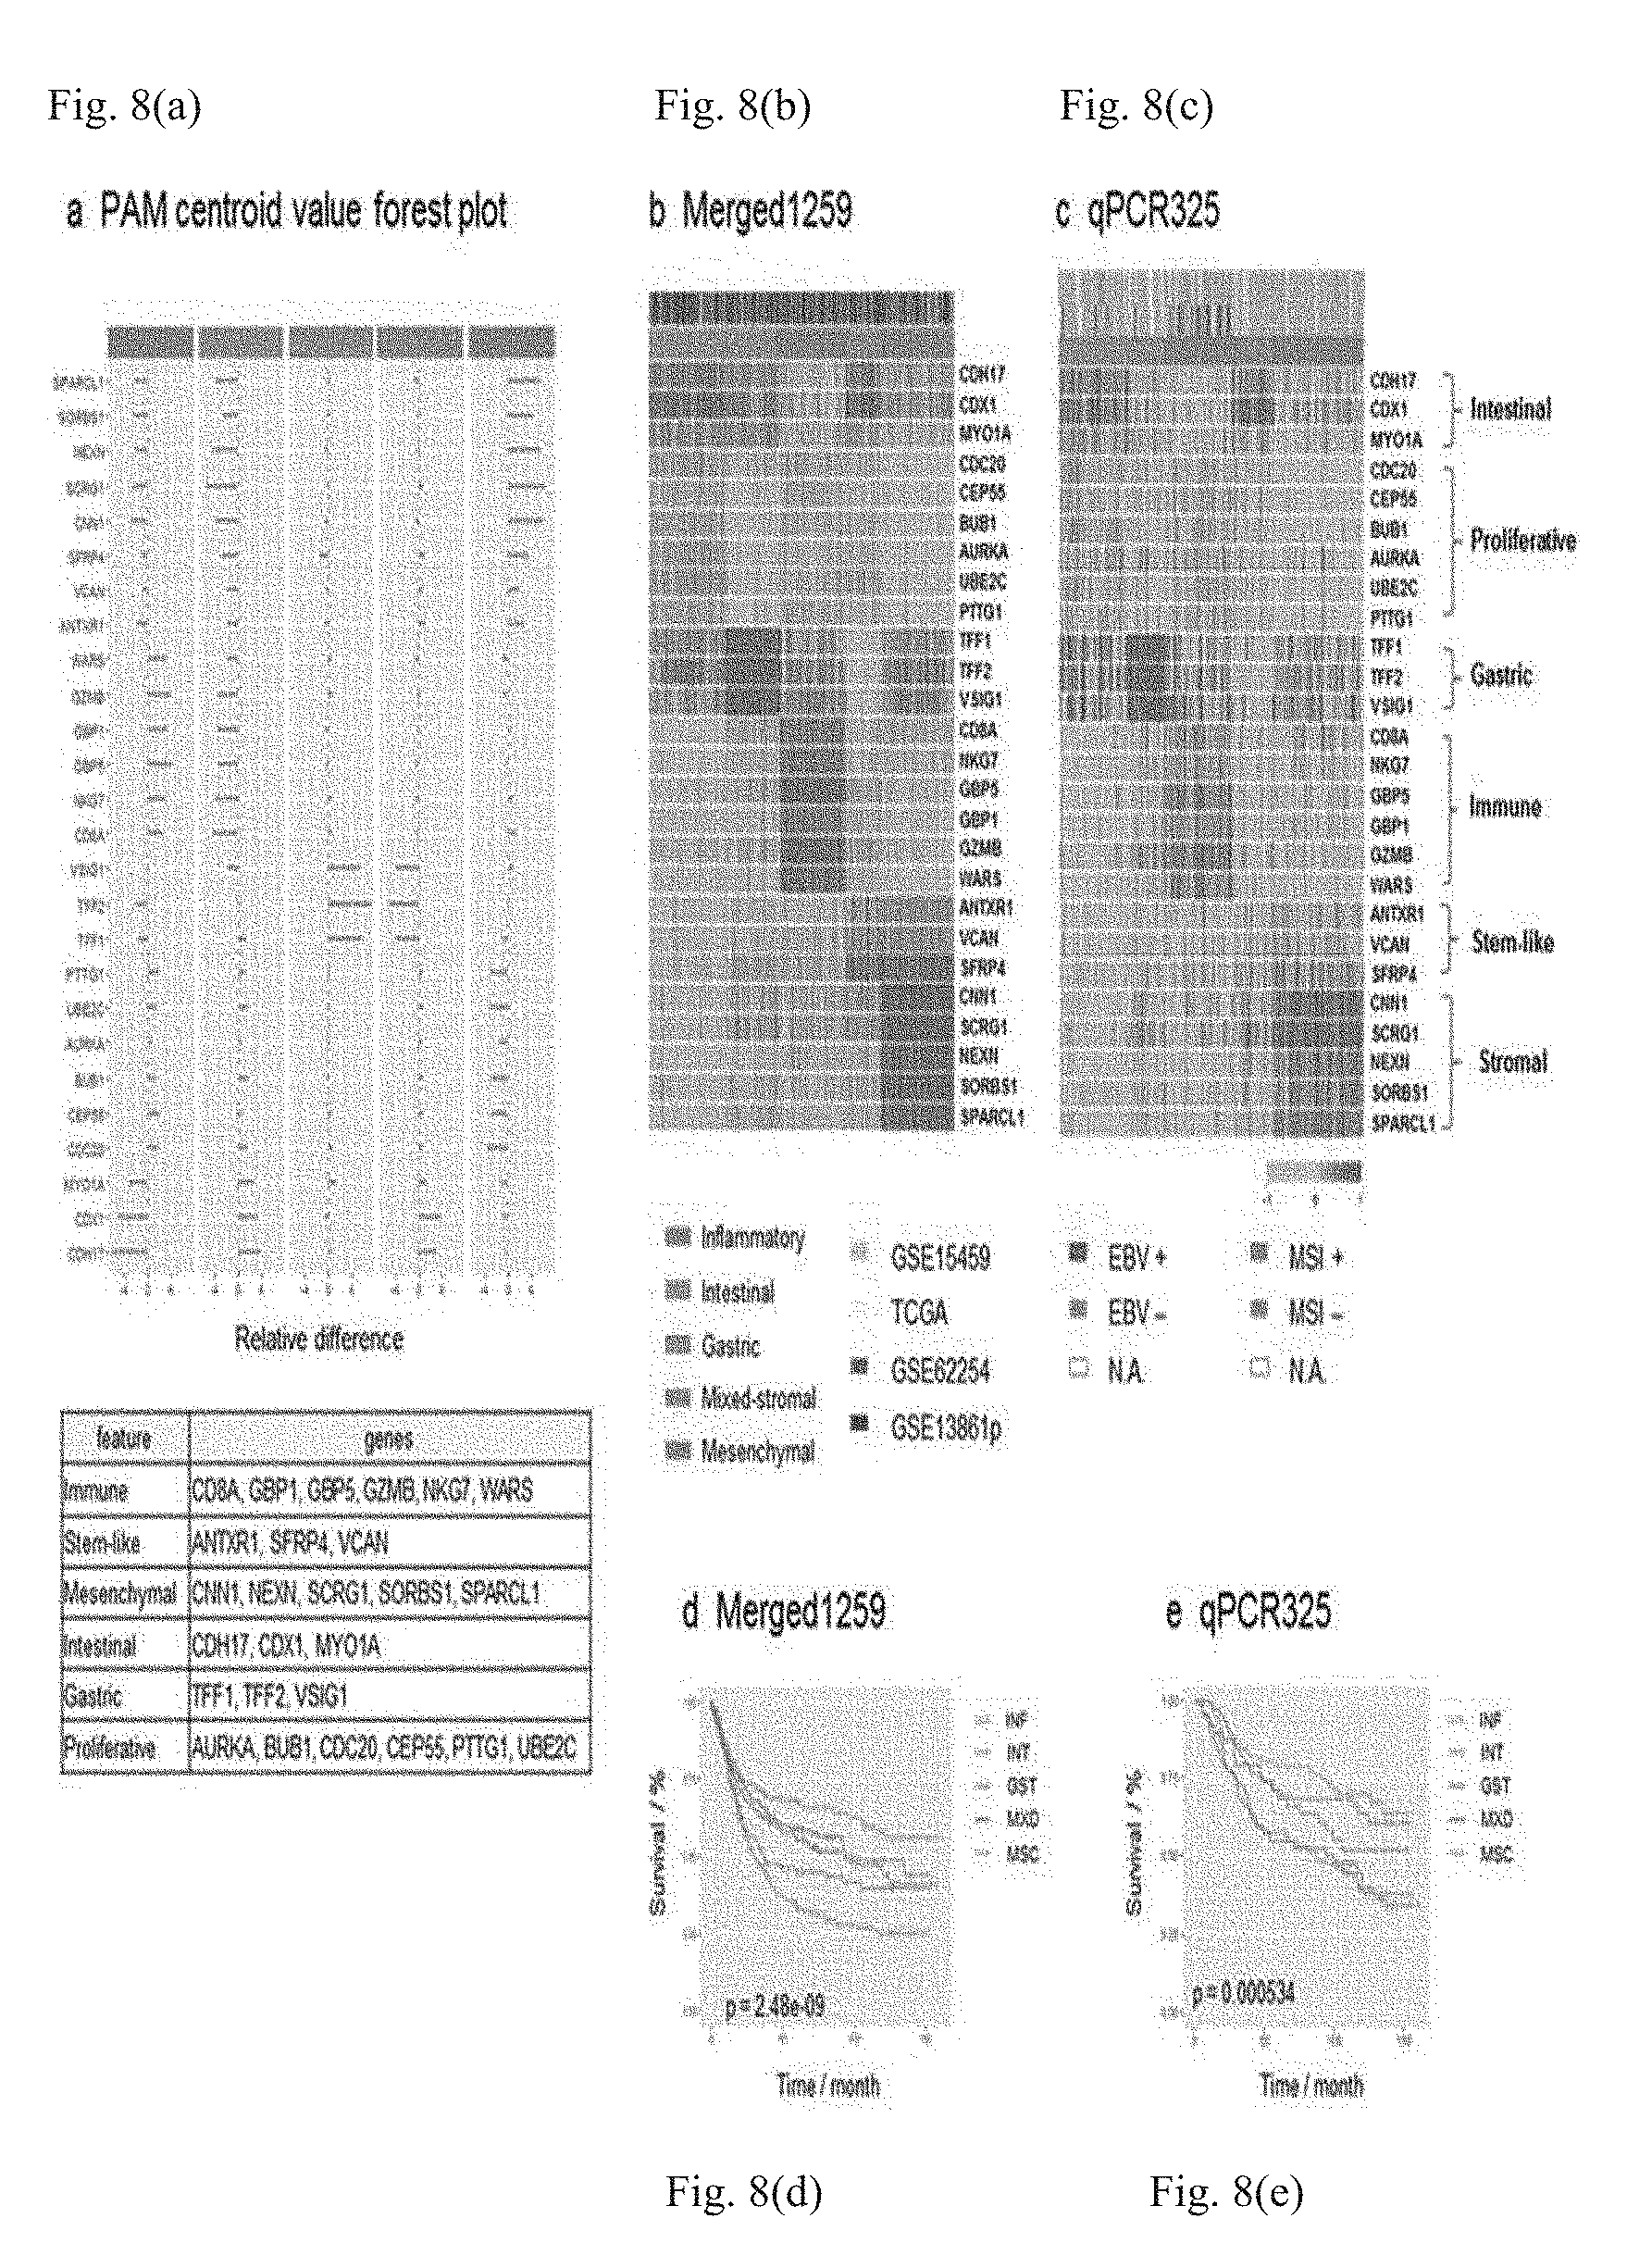
[0032] FIG. 8 illustrates five molecular subtypes classified by miniClassifier26 in GC, wherein (a) illustrates relative differences of 26 representative genes for the five molecular subtypes in PAM, (b) is a heatmap (merged using the ComBat method, N=1259; GSE13861p, GSE15459, TCGA, and GSE62254) of NMF-based clustering (26 genes) for GC microarray data, (c) is a heatmap of NMF-based clustering (26 genes) for GC qPCR data, (d) and (e) illustrate overall survival (OS) rates of the 5 molecular subtypes clustered in (b) and (c), (d) illustrates an OS curve of 1198 samples, except for 61 samples with no clinical information, among Merged1259 cohort samples, in which the five-year survival rate of each molecular subtype is 67.3% for INF (95% confidence interval: 61.3-73.9%), 58.8% for INT (95% confidence interval: 52.9-65.4%), 55.3% for GST (95% confidence interval: 48.2-63.4%), 45.0% for MXD (95% confidence interval: 36.5-55.4%), and 33.0% for MSC (95% confidence interval: 27.3-40.0%), and (e) is a five-year OS curve of a group classified as 26 genes from qPCR measurement results of qPCR325 cohorts, in which the five-year survival rate of each molecular subtype is 78.5% for INF (95% confidence interval: 69.4-88.8%), 70.7% for INT (95% confidence interval: 61.1-81.8%), 68.4% for GST (95% confidence interval: 55.1-84.9%), 54.6% for MXD (95% confidence interval: 41.7-71.4%), and 57.5% for MSC (95% confidence interval: 48.4-68.2%).
[0033] FIG. 9 is a detailed flowchart illustrating the selection and analysis of 26 genes with stability (miniClassifier-26) from microarray data and qPCR data of fresh-frozen tissue and qPCR data of formalin fixed paraffin-embedded samples.
[0034] FIG. 10 illustrates a method of naming five clusters, which were obtained through NMF clustering, subtypes.
DETAILED DESCRIPTION OF EXEMPLARY EMBODIMENTS
[0035] Hereinafter, the configuration of the present invention will be described in detail.
[0036] The present invention relates to a composition for predicting the prognosis of stage II and III advanced gastric cancer, the composition including: [0037] an agent for measuring an mRNA expression level of a target gene group including TFF1, TFF2, VSIG1, CNN1, NEXN, SCRG1, SORBS1, SPARCL1, AURKA, BUB1, CDC20, CEP55, PTTG1, UBE2C, CD8A, GBP1, GBP5, GZMB, NKG7, WARS, ANTXR1, SFRP4, VCAN, CDH17, CDX1, and MYO1A; and [0038] an agent for measuring an mRNA expression level of a reference gene group including ACTB, ATP5E, GPX1, UBB, and HPRT1.
[0039] The composition for predicting the prognosis of stage II and III gastric cancer of the present invention may be used for predicting the prognosis of a patient with advanced gastric cancer in terms of a survival rate by measuring the mRNA expression level of the target gene group.
[0040] As used herein, the term "advanced gastric cancer" refers to gastric cancer corresponding to stage II to stage III based on the AJCC 6.sup.th edition.
[0041] As used herein, the term "target gene" or "marker gene" is used interchangeably in the specification and refers to a marker capable of distinguishing between normal and pathological conditions, predicting the five-year survival rate after treatment, or making objective predictions on therapeutic responses. In the present invention, the target gene or the marker gene is a gene suitable for use in predicting the prognosis of advanced gastric cancer and a gene exhibiting a varying mRNA expression level which increases or decreases depending on the prognosis. According to one embodiment of the present invention, by securing a statistical significance for gastric cancer with heterogeneity from the microarray data and qPCR data of fresh-frozen tissue and the qPCR data of paraffin-embedded sample specimens, 26 types of genes, i.e., TFF1, TFF2, VSIG1, CNN1, NEXN, SCRG1, SORBS1, SPARCL1, AURKA, BUB1, CDC20, CEP55, PTTG1, UBE2C, CD8A, GBP1, GBP5, GZMB, NKG7, WARS, ANTXR1, SFRP4, VCAN, CDH17, CDX1, and MYO1A, which can be classified into five molecular subtypes, i.e., an intestinal molecular subtype, an inflammatory molecular subtype, a mesenchymal molecular subtype, a mixed-stromal molecular subtype, and a gastric molecular subtype, were selected.
[0042] As used herein, the term "reference gene" refers to a gene which is expressed stably at all times. That is, the reference gene as a gene constantly expressed in any tissue is used to examine an expression amount of a marker gene by comparing an expression amount of the reference gene with the expression amount of the marker gene. That is, since there is a qualitative difference and variations according to storage institute for each sample, it is difficult to identify a biological variation based on a measured gene expression amount. Thus, a gene expression level (.DELTA.Cq) between samples is determined through normalization. As a general normalization method, a method using Quantile, a global normalization method, a method using a reference gene, or the like may be used, but the present invention uses normalization using a reference gene. In addition, since the use of a single gene as a reference gene has low accuracy, a reference gene suitable for tissue characteristics may be selected by selecting a plurality of genes and examining a variation. In the present invention, genes that are disclosed in references related to gastric cancer or used in existing, currently available products are selected, and the suitability of the selected genes is evaluated, and a suitable selected gene is used as a reference gene. According to one embodiment of the present invention, with respect to 21 reference genes disclosed in references, the tissue of cancer such as esophageal cancer, pancreatic cancer, gastric cancer, colon cancer, or the like was compared with normal tissue, and a gene having the smallest variation according to qPCR was selected as a reference gene. Next, ACTB, ATP5E, GPX1, UBB, and HPRT1 were selected as reference genes used in commercially available products and subjected to qPCR, and finally, a gene group consisting of ACTB, ATP5E, GPX1, UBB, and HPRT1 was used as a reference gene used to predict the prognosis of advanced gastric cancer or the possibility of responding to an anticancer agent.
[0043] As used herein, the expression "measuring an mRNA expression level" refers to a process of identifying mRNA expression levels of prognostic marker genes in a biological sample to predict the prognosis of advanced gastric cancer and means measurement of the amount of mRNA. For example, the measuring process may be performed by quantitative real-time polymerase chain reaction (qPCR), but the present invention is not limited thereto.
[0044] In the composition according to the present invention, an agent for measuring an mRNA expression level of a prognostic marker gene includes a primer, probe, or antisense nucleotide that specifically binds to mRNA of the prognostic marker gene. Information of prognostic marker genes according to the present invention are known in GenBank, UniProt, and the like, and thus a primer, probe, or antisense nucleotide that specifically binds to mRNA of a gene may be easily designed by one of ordinary skill in the art based on this information.
[0045] As used herein, the term "primer" refers to a fragment that recognizes a target gene sequence, and includes a pair of forward and reverse primers, but is preferably a pair of primers that provide analysis results with specificity and sensitivity. In the case of a primer, the nucleic acid sequence of which is inconsistent with a non-target sequence present in a sample and thus amplifies only a target gene sequence containing a complementary primer binding site and does not cause non-specific amplification, high specificity may be imparted. According to one embodiment of the present invention, primer sets listed in SEQ ID NOS: 1 to 62 may be used. Primer sets of each of the target gene group and the reference gene group are listed in Tables 1 and 2 below.
[0046] As used herein, the term "probe" refers to a substance capable of specifically binding to a target material to be detected in a sample and specifically identifying the presence of a target material in a sample through the binding. The type of probe may be any material commonly used in the art without limitation, but preferably, it may be peptide nucleic acid (PNA), locked nucleic acid (LNA), a peptide, a polypeptide, a protein, RNA, or DNA. More particularly, the probe, which is a biomaterial, includes a material derived from a living organism, an analogue thereof, or a material produced in vitro, and examples of the probe include an enzyme, a protein, an antibody, a microorganism, an animal or plant cell and organ, a neuron, DNA, and RNA, examples of DNA include cDNA, genomic DNA, and an oligonucleotide, and examples of RNA include genomic RNA, mRNA, and an oligonucleotide, and examples of the protein include an antibody, an antigen, an enzyme, a peptide, and the like. According to one embodiment of the present invention, probes set forth in SEQ ID NOS: 63 to 93 may be used. Preferably, the probe may be fluorescently labeled. Probes of each of the target gene group and the reference gene group are listed in Tables 1 and 2 below.
[0047] As used herein, the term "antisense" refers to an oligomer with a sequence of nucleotide bases and a backbone between sub-units that allow the antisense oligomer to hybridize with a target sequence in RNA by Watson-Crick base pairing, to form a RNA:oligomer heterodimer within the target sequence, typically with mRNA. The oligomer may have exact sequence complementarity or near-complementarity to the target sequence.
[0048] As used herein, the term "predicting the prognosis" is intended to include determining the susceptibility of a subject to a particular disease or disorder, determining the prognosis (e.g., identifying a pre-metastatic or metastatic cancerous condition, determining the stage of cancer, or determining the response of cancer to treatment) of a subject with a particular disease or disorder, or therametrics (e.g., monitoring the condition of an object of treatment to provide information about therapeutic efficacy). The present invention aims to predict the postoperative prognosis of gastric cancer patients in terms of overall survival.
[0049] According to one embodiment of the present invention, the target gene is selected as follows. First, highly interconnected five subtypes with distinct molecular characteristics are determined by performing consensus-based NMF on advanced gastric cancer tissue, and subtype-specific gene groups are selected.
[0050] The NMF (nonnegative matrix factorization), which is a dimension reduction method, is a method of grouping samples with a similar high expression pattern together as one subtype.
[0051] To determine the molecular subtypes of gastric cancer, one matrix is factorized into two non-negative matrices using a dimension reduction method, thereby isolating common bases through an NMF algorithm. When an actual information group is V and matrices to be separated are W and H, the condition, V=WH, is satisfied, and in this case, W denotes a base matrix and H denotes an encoding matrix. V is a sum of the bases of W, and V is a matrix with a size of (n.times.m), W is a matrix with a size of (n.times.r), and H is a matrix with a size of (r.times.m). Since high-order data matrices are decomposed into low-order coefficient matrices and a base matrix, and each matrix has sparse characteristics, part-based representation is possible. Through this algorithm, gastric cancer may be grouped according to similarity for use in the classification of gastric cancer subtypes.
[0052] Clusters suitable for gastric cancer subtypes are selected based on a consensus map and a cophenetic graph, by using the NMF package of the R program. Consensus clustering of k (the number of clusters) in each of the standard deviations (SD=0.8, 0.9, and 1.0) is confirmed to finally select the number of gastric cancer subtypes (see FIG. 3). According to one embodiment of the present invention, k was set at 5.
[0053] As a result of acquiring the characteristics of each subtype from a biological gene set to identify molecular heterogeneity, gastric cancer is classified into five subtypes, i.e., an intestinal molecular subtype, an inflammatory molecular subtype, a mesenchymal molecular subtype, a mixed-stromal molecular subtype, and a gastric molecular subtype.
[0054] As a result of conducting survival analysis for the five molecular subtypes using a Cox proportional hazard model, the inflammatory molecular subtype exhibits a good prognosis, the intestinal and gastric molecular subtypes exhibit an intermediate prognosis, and the mixed-stromal and mesenchymal molecular subtypes exhibit a poor prognosis, all in terms of overall survival.
[0055] Meanwhile, to analyze the biological characteristics of gastric cancer, weighted correlation network analysis (WGCNA) is used. The WGCNA is an analytical technique for clustering genes based on an interconnection in expression between genes exhibiting similar expression patterns, in which modules (clusters of highly interconnected genes) are searched for through WGCNA, and signatures, on which gastric cancer characteristics are reflected, are selected according to the nature of the modules and a correlation between the modules. According to one embodiment of the present invention, six signatures stably conserved in gastric cancer, i.e., a gastric signature consisting of TFF1, TFF2, and VSIG1; a mesenchymal signature consisting of CNN1, NEXN, SCRG1, SORBS1, and SPARCL1; a proliferative signature consisting of AURKA, BUB1, CDC20, CEP55, PTTG1, and UBE2C; an immune signature consisting of CD8A, GBP1, GBP5, GZMB, NKG7, and WARS; a stem-like signature consisting of ANTXR1, SFRP4, and VCAN; and an intestinal signature consisting of CDH17, CDX1, and MYO1A, were identified.
[0056] The correlation between representative genes of the six signatures and the five gastric cancer molecular subtypes was confirmed by comparative analysis by Spearman correlation. Through this, commonly conserved genes were selected, and then 26 genes, i.e., TFF1, TFF2, VSIG1, CNN1, NEXN, SCRG1, SORBS1, SPARCL1, AURKA, BUB1, CDC20, CEP55, PTTG1, UBE2C, CD8A, GBP1, GBP5, GZMB, NKG7, WARS, ANTXR1, SFRP4, VCAN, CDH17, CDX1, and MYO1A, exhibiting stable expression results for each sampling method (fresh-frozen, FFPE) and each expression measurement platform (microarray, qPCR), were selected.
[0057] The selected 26 genes are denoted as a target gene group, and an expression mean of each signature corresponding to each target gene group is calculated using a score (d'.sub.ik)of each target gene, and the result is used to identify molecular subtypes.
[0058] When the molecular subtypes of gastric cancer are determined as above, a prognosis is predicted based on a survival curve of each molecular subtype. For example, the molecular subtypes are classified into a good prognosis group, an intermediate prognosis group, and a bad prognosis group, all in terms of overall survival. In particular, in terms of overall survival, the inflammatory molecular subtype is predicted as a good prognosis group, the intestinal and gastric molecular subtypes are predicted as intermediate prognosis group, and the mixed-stromal and mesenchymal molecular subtypes are predicted as bad prognosis group.
[0059] The composition for predicting the prognosis of stage II and III gastric cancer of the present invention may further include a pharmaceutically acceptable carrier.
[0060] The pharmaceutically acceptable carrier includes carriers and vehicles commonly used in the medical field, and examples thereof include, but are not limited to, ion exchange resins, alumina, aluminum stearate, lecithin, serum proteins (e.g., human serum albumin), buffer substances (e.g., various phosphates, glycine, sorbic acid, potassium sorbate, and partial glyceride mixtures of saturated vegetable fatty acids), water, salts or electrolytes (e.g., protamine sulfate, disodium hydrogen phosphate, potassium hydrogen phosphate, sodium chloride, and zinc salts), colloidal silica, magnesium trisilicate, polyvinyl pyrrolidone, cellulose-based substrates, polyethylene glycol, sodium carboxymethylcellulose, polyarylate, waxes, polyethylene glycol, and wool fat.
[0061] In addition, the composition of the present invention may further include, in addition to the above-described components, a lubricant, a wetting agent, an emulsifying agent, a suspension agent, a preservative, or the like.
[0062] The present invention also provides a kit for predicting the prognosis of stage II and III gastric cancer, which includes a composition for predicting the prognosis of stage II and III gastric cancer.
[0063] For example, the kit may be a quantitative real-time polymerase chain reaction (qPCR) kit or the like.
[0064] The kit for predicting the prognosis of stage II and III gastric cancer may further include one or more types of other differently formulated compositions, solutions or devices suitable for an assay method. Preferably, the kit further includes an essential element needed for qPCR. The qPCR kit includes a primer pair specific to a gene encoding a marker protein. Primers are nucleotides having a sequence specific to a nucleic acid sequence of the gene and may have a length of about 7 bp to about 50 bp, more preferably, about 10 bp to about 30 bp. In addition, the qPCR kit may include primers specific to a nucleic acid sequence of a control gene. In addition, the qPCR kit may include a test tube or other appropriate container, a reaction buffer (of various pH and magnesium concentrations), deoxynucleotides (dNTPs), enzymes such as Taq-polymerase and reverse transcriptase, a DNase inhibitor, an RNase inhibitor, DEPC-water, sterilized water, and the like.
[0065] In addition, the kit for predicting the prognosis of stage II and III gastric cancer of the present invention may include an essential element needed for performing DNA chip. A DNA chip kit may include a substrate to which a gene or cDNA or an oligonucleotide that corresponds to a fragment of the gene is attached, and a reagent, agent, enzyme, or the like for producing a fluorescent labeling probe. In addition, the substrate may include a control gene or cDNA or an oligonucleotide that corresponds to a fragment of the gene.
[0066] The present invention also provides a method of providing information for predicting the prognosis of stage II and III gastric cancer or a method of predicting the prognosis of stage II and III gastric cancer, each of the methods including: [0067] in a sufficiently statistically significant number of reference samples and biological samples obtained from stage II and III advanced gastric cancer patients, [0068] measuring mRNA expression levels of a target gene group including: a gastric signature consisting of TFF1, TFF2, and VSIG1; a mesenchymal signature consisting of CNN1, NEXN, SCRG1, SORBS1, and SPARCL1; a proliferative signature consisting of AURKA, BUB1, CDC20, CEP55, PTTG1, and UBE2C; an immune signature consisting of CD8A, GBP1, GBP5, GZMB, NKG7, and WARS; a stem-like signature consisting of ANTXR1, SFRP4, and VCAN; and an intestinal signature consisting of CDH17, CDX1, and MYO1A, and a reference gene group including ACTB, ATP5E, GPX1, UBB, and HPRT1; [0069] calculating .DELTA.Cq values of the target gene groups of the reference samples and the biological samples according to Equation 1 below and inputting the values to a computer program; and [0070] performing non-negative matrix factorization (NMF) and NMF-based clustering on the values input to the computer program to be classified into a plurality of clusters, calculating a score value (SV) by applying the score (d'.sub.ik) of the target gene group in each cluster to Equation 2 below, classifying the clusters into an intestinal molecular subtype, an inflammatory molecular subtype, a mesenchymal molecular subtype, a mixed-stromal molecular subtype, and a gastric molecular subtype, and predicting a prognosis of the molecular subtype to which the biological sample belongs by analyzing the prognosis in terms of overall survival, [0071] wherein the molecular subtypes of gastric cancer are classified such that a cluster in which the SV of the gastric signature is a maximum value is determined as a gastric molecular subtype; among clusters except for the cluster determined as the gastric molecular subtype, a cluster in which the SV of the mesenchymal signature is a maximum value and the SV of the proliferative signature is a minimum value is determined as a mesenchymal molecular subtype; among clusters except for the cluster determined as the gastric molecular subtype and the cluster determined as the mesenchymal molecular subtype, a cluster in which the SV of the immune signature is a maximum value and the SV of the intestinal signature is a minimum value is determined as an inflammatory molecular subtype; among clusters except for the cluster determined as the gastric molecular subtype, the cluster determined as the mesenchymal molecular subtype, and the cluster determined as the inflammatory molecular subtype, a cluster in which the SV of the stem-like signature is a maximum value is determined as a mixed-stromal molecular subtype; and the last remaining cluster is determined as an intestinal molecular subtype, and [0072] a prognosis of gastric cancer is predicted, in terms of overall survival, such that one classified as the inflammatory molecular subtype is predicted as a good prognosis group; those classified as the intestinal molecular subtype and the gastric molecular subtype are predicted as intermediate prognosis group; and those classified as the mixed-stromal molecular subtype and the mesenchymal molecular subtype are predicted as bad prognosis group:
[0072] [Equation 1]
.DELTA.Cq=(Cq value of target gene)-(Cq mean of reference gene group) [0073] wherein the Cq mean of the reference gene group denotes a mean of Cq values of the reference gene group including ACTB, ATP5E, GPX1, UBB, and HPRT1,
[0073] SV ( Score Value ) = 1 t i .di-elect cons. SN .theta. d ik ' [ Equation 2 ] ##EQU00006## [0074] wherein SV is an expression mean of each signature in the clusters obtained from NMF-based clustering, t is the number of genes (i) belonging to each signature, SN.sub..theta.is signature (.theta.=6), k denotes the number of clusters, which is an integer of 2 to 7, and d'.sub.ik denotes a score based on a distance between a total mean of each gene and a mean of each cluster and is obtained according to Equation 3 below:
[0074] [Equation 3]
d'.sub.ik=sign(d.sub.ik)(|d.sub.ik|-.DELTA.).sub.+ [0075] wherein a critical value (.DELTA.) is set at 0.1 so that genes with no specificity according to molecular subtype are converged to 0, sign(d.sub.ik) denotes a sign of d.sub.ik, and d.sub.ik is obtained according to Equation 4 below:
[0075] d ik = x _ ik - x _ i m k ( s i + s 0 ) , s i 2 = 1 n - k k = 1 5 j .di-elect cons. C k ( x ij - x _ ik ) 2 [ Equation 4 ] ##EQU00007## [0076] wherein
[0076] x _ ik = j .di-elect cons. C k x ij n k ##EQU00008##
is an expression mean of the (ith) gene in molecular subtype (k),
x _ i = j = 1 n x ij n ##EQU00009##
is a total mean of the same (ith) gene, m.sub.k denotes a degree of freedom
( m k = 1 n k + 1 n ) ##EQU00010##
for correcting a standard error of X.sub.ik-X.sub.i S.sub.i denotes a standard deviation of the entire sample of the (i) gene belonging to molecular subtype (k), and S.sub.0 denotes a median of S.sub.i.
[0077] The method of providing information for predicting the prognosis of stage II and III gastric cancer, according to the present invention, will be described step by step in detail as follows.
[0078] The first process is a process of measuring an mRNA expression level of a target gene group in a certain number of reference samples obtained from stage II and III gastric tumors, measuring an mRNA expression level of a target gene group of a biological sample obtained from stage II and III gastric tumors, and inputting values corresponding to the mRNA expression levels of the target gene groups of the reference samples and the biological sample to a computer program.
[0079] The certain number, i.e., the number of reference samples sufficient to exhibit a statistical significance, refers to the number of samples satisfying p<0.01 when non-negative matrix factorization (NMF) is performed on the mRNA expression level of the target gene group.
[0080] In addition, the number of reference samples must be a number sufficient to exhibit a gene expression pattern differentiated according to NMF-based clustering and to be classified into a plurality of clusters.
[0081] The number of reference samples which satisfies these conditions may range from, preferably, 300 to 10,000.
[0082] Preferably, the mRNA expression level of the target gene group is measured by qPCR, and the mRNA expression level measured by qPCR is determined as .DELTA.Cq. The Cq value refers to the number of cycles at which amplification starts to remarkably increase during PCR processes performed at 95.degree. C. for 10 minutes (initial denaturation); 40 times to 45 times at 95.degree. C. for 10 seconds (denaturation); at 60.degree. C. for 5 seconds (annealing); and then at 72.degree. C. for 25 seconds (elongation).
[0083] The .DELTA.Cq value is calculated using a Cq mean of each of the target gene group and the reference gene group according to Equation 1 below:
[Equation 1]
.DELTA.Cq=(Cq value of target gene)-(Cq mean of reference gene group) [0084] wherein the Cq mean of the reference gene group denotes a mean of Cq values of the reference gene group including ACTB, ATP5E, GPX1, UBB, and HPRT1.
[0085] Thus, the .DELTA.Cq value is the value corresponding to the mRNA expression level of the target gene group, which is input to a computer program.
[0086] The second process is a process of performing NMF and NMF-based clustering on the .DELTA.Cq values of the target gene groups of the reference samples and the biological samples, which are input to a computer program, for classification into a plurality of clusters, calculating a score value (SV) by applying the score (d'.sub.ik) of the target gene group in each cluster to Equation 2 below, classifying the clusters into an intestinal molecular subtype, an inflammatory molecular subtype, a mesenchymal molecular subtype, a mixed-stromal molecular subtype, and a gastric molecular subtype according to SV, and predicting a prognosis of the molecular subtype to which the biological sample belongs by analyzing the prognosis in terms of overall survival.
SV ( Score Value ) = 1 t i .di-elect cons. SN .theta. d ik ' [ Equation 2 ] ##EQU00011## [0087] wherein SV is an expression mean of each signature in the clusters obtained from NMF-based clustering, t is the number of genes (i) belonging to each signature, SN.sub..theta.is signature (.theta.=6), k denotes the number of clusters, which is an integer of 2 to 7, and d'.sub.ik denotes a score based on a distance between a total mean of each gene and a mean of each cluster.
[0088] According to the present invention, k is preferably 5. That is, when k=5, it means five clusters obtained through NMF-based clustering.
[0089] According to the present invention, k is preferably 5. That is, when k=5, it means five clusters obtained through NMF-based clustering.
[0090] The score (d'.sub.ik) is a score based on a distance between a total mean of each gene and a mean of each cluster, i.e., a t-statistic value of the same gene type (i), is normalized by applying a weight with respect to the expression amounts of sample genes belonging to the same molecular subtype, and is obtained by Equation 3 below using a statistical method commonly used in linear discriminant analysis (LDA):
[Equation 3]
d'.sub.ik=sign(d.sub.ik)(|d.sub.ik|-.DELTA.).sub.+ [0091] wherein a critical value (.DELTA.) is set at 0.1 so that genes with no specificity according to molecular subtype are converged to 0, sign(d.sub.ik) denotes a sign of d.sub.ik, and d.sub.ik is obtained according to Equation 4 below:
[0091] d ik = x _ ik - x _ i m k ( s i + s 0 ) , s i 2 = 1 n - k k = 1 5 j .di-elect cons. C k ( x ij - x _ ik ) 2 [ Equation 4 ] ##EQU00012## [0092] wherein
[0092] x _ ik = j .di-elect cons. C k x ij n k ##EQU00013##
is an expression mean of the (ith) gene in molecular subtype (k),
x _ i = j = 1 n x ij n ##EQU00014##
is a total mean of the same (ith) gene, m.sub.k denotes a degree of freedom
( m k = 1 n k + 1 n ) ##EQU00015##
for correcting a standard error of X.sub.ik-X.sub.i S.sub.i denotes a standard deviation of the entire sample of the (i) gene belonging to molecular subtype (k), and S.sub.0 denotes a median of S.sub.i.
[0093] In the score (d'.sub.ik), positive numbers denote high gene expression, negative numbers denote low gene expression, and 0 denotes no change in gene expression. Thus, the more positive the score, the higher the gene expression, and the more negative the score, the lower the gene expression.
[0094] The molecular subtypes of gastric cancer are classified such that a cluster in which the SV of the gastric signature is a maximum value is determined as a gastric molecular subtype; among clusters except for the cluster determined as the gastric molecular subtype, a cluster in which the SV of the mesenchymal signature is a maximum value and the SV of the proliferative signature is a minimum value is determined as a mesenchymal molecular subtype; among clusters except for the cluster determined as the gastric molecular subtype and the cluster determined as the mesenchymal molecular subtype, a cluster in which the SV of the immune signature is a maximum value and the SV of the intestinal signature is a minimum value is determined as an inflammatory molecular subtype; among clusters except for the cluster determined as the gastric molecular subtype, the cluster determined as the mesenchymal molecular subtype, and the cluster determined as the inflammatory molecular subtype, a cluster in which the SV of the stem-like signature is a maximum value is determined as a mixed-stromal molecular subtype; and the last remaining cluster is determined as an intestinal molecular subtype.
[0095] A prognosis for each classified molecular subtype is predicted in terms of overall survival based on a survival curve of the molecular subtype.
[0096] The molecular subtypes of gastric cancer exhibit differentiated prognostic patterns as observed in the survival curves, and in terms of overall survival, the inflammatory molecular subtype may be predicted as a good prognosis group, the intestinal and gastric molecular subtypes may be predicted as intermediate prognosis group, and the mixed-stromal and mesenchymal molecular subtypes may be predicted as bad prognosis group.
[0097] Thus, by determining a molecular subtype to which the biological sample belongs and examining a survival curve of the molecular subtype, a prognosis may be predicted.
[0098] The biological sample may be fresh tumor tissue, fresh-frozen tumor tissue, formalin fixed paraffin-embedded tumor tissue, a fine needle aspirate, ascites, a tube washing solution, a pleural fluid, or the like, and is preferably formalin-fixed paraffin-embedded tumor tissue.
[0099] In addition, the measuring of the mRNA expression level of the target gene group may be performed by qPCR. [0100] Advantages and features of the present invention, and methods of achieving the same will become apparent with reference to the following examples. The present invention may, however, be embodied in many different forms and should not be construed as being limited to the examples set forth herein. Rather, these examples are provided so that this invention will be thorough and complete, and will fully convey the scope of the invention to those of ordinary skill in the art to which the present invention pertains, and the present invention is defined merely by the scope of the appended claims.
EXAMPLES
Patients and Samples
[0101] Fresh-frozen tumor specimens and clinical data of gastric cancer patients who underwent gastric cancer resection during primary treatment at Yonsei University Severance Hospital (YUSH) from 2000 to 2010 were acquired. All samples were collected after obtaining written consent from the patients, and the study was approved by the Institutional Review Committee of YUSH. The samples were annotated but were separated from patient-identifiable information. Clinical data was obtained retrospectively. Overall survival (OS) was defined with respect to the time from surgery to death, and recurrence-free survival was defined with respect to the time from surgery to the first recurrence. Data was censored when a patient was alive without recurrence at the time of the last contact.
[0102] Gene expression profiles of 497 samples of surgically removed frozen GC tumor tissue were obtained using the HumanHT-12 v3.0 Expression BeadChip array (Illumina) with 48,803 gene characteristics (GSE13861p). Briefly, total RNA was extracted from fresh-frozen tissue using a RecoverAll.TM. total nucleic acid isolation kit (Ambion) or a mirVana RNA isolation labeling kit (Ambion). RNA concentration and purity were measured at 260 nm and 280 nm (A.sub.260:A.sub.280=1.8) using a NanoDrop 2000 (Thermo Fischer Scientific). The integrity of the RNA was evaluated using an RNA Nano 6000 chip (Agilent) (RIN>7). 500 ng of total RNA was labeled in accordance with the manufacturer's protocols using a TotalPrep.TM. RNA amplification kit (Illumina), and then gene expression levels were measured using the BeadChip array platform. (Training Sets and Test Sets for GC Learning)
[0103] The Training set I for finding GC molecular subtypes consisted of GSE13861p (n=497, Illumina HumanHT-12 v3.0 Expression BeadChip array). The Test set I for confirming the GC molecular subtypes consisted of data sets of GSE15459 (n=200, Affymetrix Human Genome U133plus 2.0 Array), TCGA (n=262, Illumina HiSeq2000), and GSE62254 (n=300, Affymetrix Human Genome U133plus 2.0 Array).
[0104] To select the final miniClassifier-26 (26 genes), the Training set II consisted of Merged1259 (n=1259) obtained by combining GSE13861p (n=497), GSE15459 (n=200), TCGA (n=262), and GSE62254 (n=300) using the ComBat method, and qPCR-based, measurable 26 genes were identified by the Test set II consisting of qPCR325 (n=325). To obtain qPCR325, total RNA was extracted using the MasterPure.TM. Complete DNA and RNA Purification Kit (Epicentre). cDNA was produced using M-MLV Reverse Transcriptase (Life Technologies). The concentration of cDNA was determined using NanoDrop 2000. qPCR was performed using the SensiFAST Probe Lo-ROX Kit (Bioline), 5'FAM/3'BHQ-1 Probe (Biosearch Technologies), gene-specific primers, and ViiA.TM. 7 Real-Time PCR System (Applied Biosystems), and 5 ng of total cDNA.
Data Processing
[0105] Data pre-processing: Microarray data sets were mainly processed in the R language environment. Normalization was performed by Between-Array Normalization (quantile) in the "Linear Models for Microarray Data (limma)" for data sets from the Illumina BeadChip array platform. GSE 15459 and GSE62254 were normalized using the R "affy" package including Robust Multi-array Average normalization. qPCR data sets were normalized by internal standards. For gene filtering, platform-derived probe validity and variance in gene expression should be considered. In the case of the training sets, data sets were adjusted by batch adjustment and then combined with the method "Combatting Batch Effects When Combining Batches of Gene Expression Microarray Data (ComBat)".
[0106] NMF-based classification: The ComBat-merged data was classified using the package "Algorithm and Framework for Nonnegative Matrix Factorization (NMF)". The number of clusters (k) was set from 2 to 7. The Brunet method was used as an updating algorithm for iterative approximation. Before characterizing NMF-derived clusters, outlier samples were excluded from each cluster by using the "Silhouette" R package. To define genes representing each NMF cluster, SAM and PAM were performed using the Bioconductor packages "siggenes" and "pamr," respectively.
[0107] WGCNA analysis: The WGCNA was performed with respect to 497 GC samples, using the R "wgcna" package. For network construction, weighted network adjacency was defined by co-expression similarity with a power of 6. To avoid choosing an arbitrary cut-off, the "soft-thresholding procedure" provided by WGCNA was used. Dynamic hybridization from the R "dynamicTreeCut" package was applied as a module-detection method. To evaluate whether each module was associated with survival and clinicopathological variables, various module characteristics such as connectivity, module significance, and module eigengene were utilized.
[0108] Gene set enrichment analysis (GSEA): The GSEA was performed using the R "GSEABase" package. A priori-defined sets of genes were available from Molecular Signatures Database (MSigDB; www.broadinstitute.org/msigdb). Enrichment analysis was performed using gene ontology from the Gene Ontology Consortium (http://geneontology.org).
[0109] Survival analysis: The survival analysis was performed using the Cox proportional hazard model and meta-analysis of HR in the R "survival" and "meta" packages, respectively.
[0110] Hierarchical clustering and illustration of gene expression profiles: The gene clustering of microarray data sets was performed using Gene Cluster 3.0. Hierarchical clustering results were graphically visualized using the R "gplots" package.
Statistical Analysis
[0111] The hypergeometric test/Fisher's exact test, Pearson's correlation, Spearman's correlation, and the Wilcoxon rank-sum test were performed as statistical tests.
Primary Cell-Specific Gene Expression Profiling
[0112] Primary cell culture: Primary tissue was rinsed with Dulbecco's phosphate-buffered saline (Welgene LB00-02) containing 2% antibiotics (Welgene LS203-01) and minced with a sterile blade. After 0.2-.mu.m syringe filtration, the minced tissue was incubated with .alpha.-MEM (Gibco A10490) and 150 U/ml Collagenase II (Thermo Fisher Scientific) at 37.degree. C. in a humidified atmosphere with 5% CO.sub.2 for 24 hours. The cultured tissue was centrifuged at 200.times.g for 5 minutes and then transferred to a fresh medium. The harvested cells were cultured at 37.degree. C. under a 5% CO.sub.2 atmosphere for 2 days to 3 days.
[0113] Total RNA sequencing using Illumina HiSeq 2500 sequencing system: RNA purity was determined by analyzing 1 .mu.l of a total RNA extract on a NanoDrop8000 spectrophotometer. Total RNA integrity was verified using an Agilent Technologies 2100 Bioanalyzer with an RNA integrity number (RIN) value and the percentage of RNA fragments>200 nt fragment distribution value (DV200). Total RNA sequencing library was prepared in accordance with the manufacturer's instructions (Illumina TruSeq RNA Access Library kit). Subsequently, 100 ng of total RNA was fragmented into small pieces using divalent cations at a high temperature. cDNA was generated from the cleaved RNA fragments using random priming during first and second strand synthesis, and sequencing adapters were ligated to the resulting double-stranded cDNA fragments. The coding regions of the transcriptome were captured from this library using sequence-specific probes to generate the final library. The quality of the amplified libraries was verified by capillary electrophoresis (Bioanalyzer, Agilent). qPCR was performed using the SYBR Green PCR Master Mix (Applied Biosystems), and then libraries index tagged in equimolar amounts were combined in a pool. Cluster generation was realized in the flow cell on the cBot automated cluster generation system (Illumina) Subsequently, the flow cell was loaded onto a HiSeq 2500 sequencing system (Illumina) and sequence analysis was performed using a read length of 2.times.100 bp.
In Vitro and In Vivo Experimental Validation
[0114] Cell lines: Human gastric cancer cell lines SNU-1, SNU-5, SNU-16, SNU-216, SNU-484, SNU-520, SNU-601, SNU-620, SNU-638, SNU-668, SNU-719, MKN-1, MKN-45, MKN-74, KATOIII, NCI-N87, and Hs746T were purchased from the Korean Cell Line Bank (Seoul, Korea); and YCC-1, YCC-2, YCC-3, YCC-6, YCC-7, YCC-9, YCC-10, YCC-11, and YCC-16 were purchased from the Yonsei Cancer Research Institute (Seoul, Korea). SNU-1, SNU-5, SNU-16, SNU-216, SNU-484, SNU-520, SNU-601, SNU-620, SNU-638, SNU-668, SNU-719, MKN- 28, MKN-45, MKN-74, KATOIII, and NCI-N87 were grown in RPMI 1640 (Welgene, Daegu, Korea); Hs746T was grown in Dulbecco's modified Eagle's medium (DMEM; Welgene, Daegu, Korea); and YCC-1, YCC-2, YCC-3, YCC-6, YCC-7, YCC-9, YCC-10, YCC-11, and YCC-16 were grown in Minimum essential media Eagle (MEM; Welgene, Daegu, Korea). All cells were cultured at 37.degree. C. in a complete medium supplemented with 10% FBS (Gibco) and 1% antibiotic-antimicrobial solution (containing 10,000 units of penicillin, 10 mg of streptomycin, and 25 .mu.g of amphotericin B/mL, Sigma-Aldrich) in a 5% CO.sub.2-containing humidified atmosphere. All cells were confirmed negative for mycoplasma by e-Myco.TM. and Mycoplasma PCR Detection Kit (iNtRON Biotechnology, Seongnam, Korea).
[0115] Invasion assay: For the assay, 2.times.10.sup.4 HUVEC cells were placed in a culture medium (M199) in a fibronectin-coated transwell, followed by coating the bottom of the transwell with 0.2% gelatin and cell culture for 48 hours until monolayer formation. Thereafter, 1.times.10.sup.5/50 .mu.l Hs746T and NCI-N87 cells containing FBS-free CellTracker.TM. (Molecular Probes, C2925) were separately added to the transwell. A culture medium containing 10% FBS was added to the lower chamber. After incubation for 48 hours, upper cells of the membrane were removed using a cotton swab. Cells on the lower membrane were lysed in 200 .mu.l of a lysis buffer at room temperature for 2 hours to 3 hours. Fluorescence was measured with Ex/Em 492/517. To examine the effect of a TGF-.beta. inhibitor on cell invasion ability, 50 .mu.M of LY2157299 (AdooQ, California, USA) was administered.
[0116] Migration assay: Hs746T and NCI-N87 cells were grown into monolayers in a culture medium containing 10% FBS and 1% antibiotics. When confluency reached 70%, the cell monolayers were scratched with a 100-.mu.l pipette tip. After 72 hours, the wound width was measured and normalized by the wound width measured immediately after scratching. LY2157299 (50 .mu.M) was administered to evaluate the effect of the TGF-.beta. inhibitor on cell migration.
[0117] Tumor spheroid formation assay: Ten cells were cultured in 50 .mu.l of DMEM/F12 (Gibco) supplemented with bFGF, EGF, B27, 10% FBS, and 1% antibiotics in a 96-well plate. After 30 days of cell culture, the number of tumor spheroids in each well was counted. In addition, LY2157299 (50 .mu.M) was administered to examine the effect of the TGF-.beta. inhibitor on tumor sphere formation.
[0118] In vivo tumorigenesis in orthotopic mouse model: All animal experiments were conducted with the approval of the Association for Assessment and Accreditation of Laboratory Animal Care (AAALAC) International. To establish an orthotopic xenograft mouse model, the skin and the peritoneum of each of BALB/c nude mice (male) were incised along the upper midline by approximately 5 mm for about 1 hour, and 1.times.10.sup.7 GC cells (Hs746T and NCI-N87) were transplanted into the exteriorized gastric wall of each mouse. The stomach was returned to the peritoneum and the abdominal wall was closed with one layer of wound suture. To observe tumor growth in the model, the presence and size of cancer were monitored using a 9.4 T animal magnetic resonance imaging (MRI) instrument equipped with a Bruker animal coil (RF SUC 400 1H M-BR-LIN ROAD, Bruker Medical Systems) (MRI measurement conditions: Echo=1, TR=2300 ms, TE=22.0 ms, FA=180 deg, TA=Oh4 m 54 s 400 ms, NEX=2, and FOV=4.00 cm).
[0119] Drug response in xenograft mouse model: To establish a xenograft mouse model, 1.times.10.sup.7 GC cells (Hs746T and NCI-N87) were transplanted into the proximal femoral region of each of BALB/c nude mice (male). When the tumor volume increased to 400 mm.sup.3, tumor-bearing mice were randomized into three different treatment groups (PBS control, Oxal+5FU/PBS-treated group, and Oxal+SFU/LY2157299 (TBF-.beta. inhibitor)-treated group, n=8 per group). Oxalipatin (60 .mu.g per single dose) and Fluorourasil (1 mg per single dose) were mixed and the resulting mixture was intraperitoneally injected into each mouse three times a week. LY2157299 (1.5 mg/mouse) was administered twice a week to an intra-tumor injection model. The size of the transplanted tumor was examined three times per week and calculated by (4/3).times..pi..times.(minor axis/2).sup.2.times.(major axis/2) mm.sup.3.
[0120] Heterogeneity testing of miniClassifier-26 for qPCR analysis: To examine the possibility of spatial heterogeneity affecting the procedure of the present invention for preparing tissue samples from an FFPE specimen, three tissue samples were obtained from a single FFPE specimen for RNA extraction. After cDNA was prepared, qPCR was performed three times and an average of each of the three samples derived from the single tumor specimen was obtained. The heterogeneity across the three samples was determined by evaluating the coefficient of variance for each gene.
Tissue Microarray Construction
[0121] Two representative 3-mm-diameter tumor tissue cores in each formalin-fixed paraffin-embedded primary tumor were assembled into tissue microarray (TMA) blocks. Each TMA block contained 14 tumors and one normal gastric mucosal tissue core as markers and internal controls. Subsequently, for immunohistochemistry (IHC) analysis, 4-.mu.m-thick sections were prepared from each TMA block.
Immunohistochemistry (IHC)
[0122] The IHC was performed as described above using a Ventana XT system (Ventana Corporation) with antibodies for MutL homolog 1 (MLH1, ready to use, Roche, Basel, Switzerland), MutS protein homolog 2 (MSH2, ready to use, clone G219-1129). In the case of MLH1 and MSH2, the absence of nuclear staining in tumor cells was defined as loss of expression, and normal expression was defined as the presence of nuclear expression in tumor cells. All IHC results were evaluated without knowledge of clinical pathological characteristics.
Epstein-Ban Virus-Encoded RNA In-situ Hybridization (EBER ISH)
[0123] The EBER ISH was performed using a Ventana Bench Mark system (ISH iView kit, Ventana Corporation, AZ, USA). Formalin-fixed paraffin-embedded tissue sections were deparaffinized with EZ Prep buffer (Ventana Corporation) and digested with protease I for 4 minutes. Subsequently, probes for EBER were denatured at 85.degree. C. for 10 minutes and then hybridized at 37.degree. C. for 1 hour. After hybridization, the tissue was washed with 2.times.SSC buffer at 57.degree. C. Subsequently, incubation with an anti-fluorescein monoclonal antibody was performed for 20 minutes, and then an Alkaline Blue detection kit (Ventana Corporation) was used in accordance with the manufacturer's protocol. Slides were counterstained with Nuclear Fast Red for 10 minutes.
TABLE-US-00001 TABLE 1 List for target gene group and reference gene group, primer sets and probes Gene Primer Accession Product Primer/Probe sequence No. name No. No. size start stop (SEQ ID NO.)(5'-3') 1 TFF1 N643-2 NM_003225 75 196 270 Forward aaataagggctgc primer tgtttcg (SEQ ID NO: 1) Reverse gggacgtcgatgg primer tattagg (SEQ ID NO: 2) Probe acgacaccgttcg tggggtc (SEQ ID NO: 63) 2 TFF2 N644-2 NM_005423 67 357 423 Forward ccctcccaaagca primer agagtc (SEQ ID NO: 3) Reverse gggtagccacagt primer ttcttcg (SEQ ID NO: 4) Probe tcagtgcgtcatgg aggtctca (SEQ ID NO: 64) 3 VSIG1 N649-1 NM_001170553 64 812 875 Forward catcgtgccagtg primer aaagaaa (SEQ ID NO: 5) Reverse tgtcagatttccaat primer gaccaa (SEQ ID NO: 6) Probe tcaacccaaccac cgggatt (SEQ ID NO: 65) 4 CNN1 N185-5 NM_001299.4 68 526 593 Forward agtccaccctcctg primer gcttt (SEQ ID NO: 7) Reverse cttcactcccacgt primer tcacctt (SEQ ID NO: 8) Probe cctttcgtct tcgccatgct gg (SEQ ID NO: 66) 5 NEXN N797-3 NM_144573.3 66 1152 1217 Forward gcggcaaatggta primer aatgaag (SEQ ID NO: 9) Reverse gggcggtacccttt primer aaaaat (SEQ ID NO: 10) Probe tgaggaaaaccaa gacacagcaaa (SEQ ID NO: 67) 6 SCRG1 N710-2 NM_007281.2 72 338 409 Forward cccagtgagtgtg primer agcattt (SEQ ID NO: 11) Reverse gcttttggcccttttt primer cttc (SEQ ID NO: 12) Probe tggtcttggcaga ggatgcttc (SEQ ID NO: 68) 7 SORBS1 N835-3 NM_015385.3 75 263 337 Forward gctgtgatgaatg primer gcttgg (SEQ ID NO: 13) Reverse cccagtgcagattt primer ttgtagg (SEQ ID NO: 14) Probe ttgtcttgcccattg ctgcc (SEQ ID NO: 69) 8 SPARCL1 N454-3 NM_004684.2 69 401 469 Forward cattccaaaccaa primer ctgctga (SEQ ID NO: 15) Reverse agcttcagcccata primer aactgg (SEQ ID NO: 16) Probe cggtagcacctga caacactgc (SEQ ID NO: 70) 9 AURKA N471-2 NM_198434.1 69 1074 1142 Forward gcagattttgggtg primer gtcagt (SEQ ID NO: 17) Reverse gtagtccagggtg primer ccacaga (SEQ ID NO: 18) Probe ctccatcttccagg aggacca (SEQ ID NO: 71) 10 BUB1 N245-1 NM_004336.2 75 1776 1850 Forward ccttcaaaaccaa primer aggagga (SEQ ID NO: 19) Reverse gcagcgaataccc primer cataca (SEQ ID NO: 20) Probe ccaaaaactc ttcagcatga ggca (SEQ ID NO: 72) 11 CDC20 N504-3 NM_001255 71 607 677 Forward cttccctgccagac primer cgtat (SEQ ID NO: 21) Reverse ccaatccacaagg primer ttcaggt (SEQ ID NO: 22) Probe cctggatgcgcct gaaatcc (SEQ ID NO: 73) 12 CEP55 N731-2 NM_018131.4 74 438 511 Forward caagtgggaaag primer gaaagctg (SEQ ID NO: 23) Reverse ctcagcctcaagg primer actcgaa (SEQ ID NO: 24) Probe ttttctccaaaagtc tgtgtctctc (SEQ ID NO: 74) 13 PTTG1 N813-2 NM_004219.3 67 166 232 Forward ctgaagctggggt primer ctgga (SEQ ID NO: 25) Reverse aacgtggtgttgaa primer acttgaga (SEQ ID NO: 26) Probe ccttcaatcaaagc cttagatggga (SEQ ID NO: 75) 14 UBE2C N716-3 NM_181802.1 73 1021 1093 Forward ccctgctatcaccc primer caac (SEQ ID NO: 27) Reverse gggcagaccactt primer ttccttc (SEQ ID NO: 28) Probe cacccagggtaac atatgcctgg (SEQ ID NO: 76) 15 CD8A N205-5 NM_171827.3 70 1745 1814 Forward cagagctacccgc primer agagttc (SEQ ID NO: 29) Reverse aagaggttgagat primer ggcatgg (SEQ ID NO: 30) Probe tgcctccagct ctctcagcat ga (SEQ ID NO: 77)
TABLE-US-00002 TABLE 2 Gene Primer Accession Product Primer/Probe sequence No. name No. No. size start stop (SEQ ID NO.) 16 GBP1 N699-3 NM_002053 73 163 235 Forward tagaagccagtg primer ctcgtgaa (SEQ ID NO: 31) Reverse gatctctgatgcc primer atgtcca (SEQ ID NO: 32) Probe agaaaaagaac agacaagggaa cagcc (SEQ ID NO: 78 17 GBPS N700-1 NM_052942 69 835 903 Forward ggcctgggagat primer gtagagaa (SEQ ID NO: 33) Reverse cagtaagagtgc primer cagtgcaaa (SEQ ID NO: 34) Probe tctggatatcattc ttgttgtcagcc (SEQ ID NO: 79) 18 GZMB N464-1 NM_004131.3 65 213 277 Forward cggtggcttcctg primer atacaag (SEQ ID NO: 35) Reverse ttatggagcttcc primer ccaacag (SEQ ID NO: 36) Probe cgacttcgtgctg acagctgc (SEQ ID NO: 80) 19 NKG7 N705-2 NM_005601.3 66 641 706 Forward gtccccgtcctg primer gctatg (SEQ ID NO: 37) Reverse aacgctcaaaac primer tcatcttgc (SEQ ID NO: 38) Probe cgctcttgccttct gctcaca (SEQ ID NO: 81) 20 WARS N717-3 NM_173701.1 73 408 480 Forward ttgtggacccatg primer gacagta (SEQ ID NO: 39) Reverse ccaaaccgaaca primer atgagctt (SEQ ID NO: 40) Probe tgccttttgcactg cttgtctg (SEQ ID NO: 82) 21 ANTXR1 N722-2 NM_053034.2 67 558 624 Forward cagttggctcac primer aaattcatc (SEQ ID NO: 41) Reverse ttcctcgggtgga primer gaaaac (SEQ ID NO: 42) Probe aaaggacattctc aactgtgggc (SEQ ID NO: 83) 22 SFRP4 N187-3 NM_003014.2 64 1298 1361 Forward ggagacttccga primer cttccttaca (SEQ ID NO: 43) Reverse tggccttacatag primer gctgtcc (SEQ ID NO: 44) Probe aggcaatgcc cagcctcatc (SEQ ID NO: 84) 23 VCAN N595-3 NM_001126336 74 1830 1903 Forward tttgagcatgactt primer ccgttg (SEQ ID NO: 45) Reverse ctgtctggctggt primer tgggtct (SEQ ID NO: 46) Probe tggcagcacact gcaatacga (SEQ ID NO: 85) 24 CDH17 N729-3 NM_004063.3 68 1882 1949 Forward gcaatgtgactg primer ccaaggat (SEQ ID NO: 47) Reverse acctcttgtgtctc primer ccctca (SEQ ID NO: 48) Probe ccagaaggtctg gacataagc (SEQ ID NO: 86) 25 CDX1 N730-2 NM 001804.2 67 1319 1385 Forward agggaggaacg primer tggtcaact (SEQ ID NO: 49) Reverse tatgatgggggc primer aggtagaa (SEQ ID NO: 50) Probe tgcctcttcctgc agcctca (SEQ ID NO: 87) 26 MYO1A N793-3 NM_005379.3 71 1034 1374 Forward ccgcctctttgac primer tggatag (SEQ ID NO: 51) Reverse ccttcttcttttccc primer cgatg (SEQ ID NO: 52) Probe cccaccttgatgc tctcattgattc (SEQ ID NO: 88) 27 ACTB N037 NM_001101 72 278 349 Forward tcaccctgaagta primer ccccatc (SEQ ID NO: 53) Reverse tgtggtgccagat primer tttctcc (SEQ ID NO: 54) Probe cggcatcgtcac caactggg (SEQ ID NO: 89) 28 ATP5E N041 NM_006886 74 117 189 Forward atggtggcctact primer ggagaca (SEQ ID NO: 55) Reverse Ctctcactgctttt primer gcacaga (SEQ ID NO: 56) Probe tggactcagcta catccgatactcc ca (SEQ ID NO: 90) 29 GPX1 N201-5 NM_000581.2 71 308 378 Forward cccgtgcaacca primer gtttgg (SEQ ID NO: 57) Reverse ggacgtacttga primer gggaattcaga (SEQ ID NO: 58) Probe ctcttcgttcttgg cgttct cctgatg (SEQ ID NO: 91) 30 UBB N203-5 NM_018955.2 78 61 138 Forward tgggtgagcttgt primer ttgtgtc (SEQ ID NO: 59) Reverse tttgacctgttagc primer ggatacc (SEQ ID NO: 60) Probe caccaaccacgt ccacccac (SEQ ID NO: 92) 31 HPRT1 N049-2 NM_000194.1 67 531 597 Forward tggtcaggcagt primer ataatccaa (SEQ ID NO: 61) Reverse cttcgtggggtcc primer ttttcac (SEQ ID NO: 62) Probe tgcaagcttgc gaccttgacc (SEQ ID NO: 93)
Example 1 Classification of Advanced Gastric Cancer into Five Types
[0124] An experimental flowchart of the present invention is provided in FIG. 1. The inventors of the present invention identified five GC molecular subtypes based on consensus-based NMF. The inventors of the present invention investigated gene expression profiles of gastrectomy samples (n=497) from patients with GC (GSE13861p Training set I; HumanHT-12 v3.0 Array (Illumina)). The classification of GC for the five molecular subtypes showed high consensus, and heatmaps showed a distinct gene expression pattern (see FIGS. 2A and 3). The inventors of the present invention identified 932 subtype-specific genes (Classifier-PAM932) using a prediction analysis of microarrays (PAM; overall error rate=0.10) following significance analysis of microarrays (SAM, false discovery rate (FDR)=0). Classifier-PAM932 was used to stably identify subtypes in independent gene expression data sets (Test set I) of GC patients.
Example 2 Identification of Six Molecular Signatures Describing GC Subtypes
[0125] To extend the denotation of a priori-defined gene sets, additional unsupervised gene-wise clustering was performed. In GSE13861p, the WGCNA detected 32 gene modules (clusters of highly interconnected genes) (see FIGS. 4A and 4B). Overall, it was observed that (i) several modules were significantly conserved across cohorts (hypergeometric test; P<0.01) (see FIG. 4B), (ii) the conserved modules were due to a relative difference in PAM analysis of the top 25% of PAMgenes (see FIG. 4C), and (iii) these associations were significantly relevant to GC biology (see FIG. 4D). Six GC signatures were remarkably associated with five GC subtypes, based on the conserved modules. The inventors of the present invention re-extracted genes of the GC signatures and showed that a particular combination of the GC signatures could be translated to five NMF-derived subtypes using Spearman's correlation (see FIG. 4E). Annotation of the five subtypes by the inventors of the present invention is more biologically relevant by the characterization of subtypes based on the network analysis.
Example 3 Clinical Characterization of Five GC Subtypes
[0126] The relationship between GC subtypes and clinicopathological information (age, sex, tumor location, AJCC stage (6.sup.th), WHO classification, and Lauren type) was examined. For the survival analysis of five subtypes, a significant association between subtypes and overall survival was examined (P=3.42e-09, see FIG. 5). The five-year survival rate of each subtype was determined: 76.1% for INF (95% confidence interval: 67.7-85.7), 65.1% for INT (95% confidence interval: 56.2-75.4), 64.6% for GST (95% confidence interval: 55.0-75.9), 51.3% for MXD (95% confidence interval: 42.1-62.4), and 46.3% for MSC (95% confidence interval: 38.0-56.5). The INF subtype was associated with a significantly lower risk of death than the MXD and MSC subtypes in the Training set I.
[0127] Finally, similarities and differences of the classification were compared with the GC subtypings reported by the Asian Cancer Research Group (ACRG) (GSE62254), the Cancer Genome Atlas (TCGA), and the Singapore Research Group (GSE15459): that is, i) the MSC subtype showing the worst clinical outcome was a consensus subtype across the four classification systems including the ACRG EMT subtype, the TCGA GS subtype, and the Singapore research group invasive subtype; and ii) in the INF subtype with the best clinical outcome, most Epstein-Ban virus (EBV)-positive patients and a partial high-microsatellite instability (MSI) group identified by TCGA and ACRG were included. Otherwise, the GST and INT subtypes were partially described by the Singapore research group. The MXD subtype was associated with structural chromosomal instability by TCGA. Subtype matching tended to be pathologically ambiguous in non-MSC and non-INF GC population, probably because TCGA and ACRG used somatic copy number and the degree of TP53 activity as classifiers.
Example 4 Preclinical Therapeutic Response of MSC Subtype Compared to INT Subtype
[0128] In the module stromal analysis, the stromal signature was significantly associated with the diffuse type, as well as with recurrence, in Lauren classification. This prompted the verification of mesenchymal and stem-like behaviors of the MSC subtype using GC cell lines. Furthermore, as recent evidences have shown that the acquisition of EMT-associated drug resistance leads to poor prognosis in various types of cancer, the preclinical therapeutic response of the MSC subtype was evaluated. GC cell lines (n=26) were classified into five subtypes after merging the gene expression data on cell lines with data on patient GC tumor samples (distance-weighted discrimination method) (see FIG. 6A). By ranking with stromal module eigengene, the Hs746T and SNU484 GC cell lines were selected as model cell lines from the MSC-subtyped cell lines. NCI-N87 and MKN-45 cells, assigned to the INT subtype, were used as a control with no stromal signature (see FIG. 6B). In in vitro invasion and wound-healing assays, Hs746T and SNU484 cells exhibited greater invasive performance and mobility than NCI-N87 and MKN-45 cells (see FIGS. 7A and 7B). According to the result of 3D spheroid formation assay, the Hs746T and SNU484 cells exhibited stem-like characteristics (see FIG. 7C). T2-weighted axial magnetic resonance images of an in vivo orthotopic tumor model revealed that, while the NCI-N87 and MKN-45 cells formed confined tumors, Hs746T and SNU484 tumors diffused along the gastric wall (see FIG. 7E, white dotted line). In addition, the effect of a TGF-.beta. inhibitor (LY2157299) on the stromal characteristics of Hs746T compared to the NCI-N87 cells was observed. Treatment with a TGF-.beta. inhibitor delayed the wound-healing, invasion, and 3D spheroid formation abilities of Hs746T cells in vitro (see FIGS. 7E to 7G). To confirm EMT-involved drug resistance, the TGF-.beta. inhibitor and chemotherapy combination (oxaliplatin+5-FU) were co-administered to an in vivo xenograft mouse model established using Hs746T cells. Although the oxaliplatin+5-FU treatment was only marginally effective against tumor growth in the Hs746T model, the co-administration of TGF-.beta. inhibitor and oxaliplatin+5-FU significantly reduced the drug resistance and volume of tumors in Hs746T (see FIG. 7H). On the other hand, the chemotherapy combination alone reduced tumor growth in non-stromal NCI-N87 tumors without the aid of the TGF-.beta. inhibitor (see FIG. 7I).
Example 5 GC miniClassifier-26 as qPCR Probe Set for Clinical Application
[0129] Classifier-PAM932 was refined into miniClassifier-26 as a qPCR probe set to establish a robust and clinically utilizable classification system (see FIG. 8) (FIG. 9 is a flowchart illustrating the selection and analysis of miniClassifier-26). For classifier selection, the degree of representativeness of GC stability was considered. The inventors of the present invention classified miniClassifier subsets according to the six GC signatures, i.e., gastric signature, mesenchymal signature, proliferative signature, immune signature, and intestinal signature, and selected candidate genes in the subtype-specific and cohort-conserved modules. The candidates were additionally filtered by i) subtype discriminant scores (PAM analysis) and ii) intramodular connectivity (WGCNA analysis). Probe stability was evaluated based on a platform (microarray and qPCR) and the independency of a sampling method (fresh-frozen and FFPE specimens). Finally, a miniClassifier-26 qPCR probe set was obtained by reducing genes by a priori biological knowledge in cancer biology. In addition, it was confirmed that the selected miniClassifier-26 probe set was not affected by the possible spatial heterogeneity of the FFPE specimens (coefficient of variance: 5%).
[0130] A miniClassifier-26 probe set was established using the Training set II (n=1259, Merged1259, obtained on multiple platforms from fresh-frozen samples) (see FIG. 8). The GC subtypes classified using the miniClassifier-26 probe set were highly associated with prognosis in survival analysis (LR test, P=2.48e-09) (see FIG. 8D). Similar to subtypes classified by Classifier-PAM932, the INF subtype exhibited the best prognosis (the five-year survival rate of 67.3%, 95% CI: 61.3-73.9%), and the MXD subtype (the five-year survival rate of 45.0%, 95% CI: 36.5-55.4%) and the MSC subtype (the five-year survival rate of 33.0%, 95% CI: 27.3-40.0%) exhibited the worst prognosis. The consistency of trends in the survival curves of the GC subtypes (see FIG. 8D) was confirmed also in qPCR325 test sets (see FIG. 8E, P=0.000534). The five-year survival rate of the INF subtype with the best prognosis was 78.5% (95% CI: 69.4-88.8%), and the five-year survival rates of the MXD and MSC subtypes with the worst prognosis were 54.6% (95% CI: 41.7-71.4%) and 57.5% (95% CI: 48.4-68.2%), respectively.
[0131] The five confirmed gastric cancer molecular subtypes were identified in personal and well-known data sets (GSE13861p, GSE15459, TCGA, and SGE62254).
[0132] As illustrated in FIG. 8, the inflammatory molecular subtype is associated with immune signature, the intestinal molecular subtype is associated with the high expression of intestinal epithelial differentiation genes, and the gastric molecular subtype is associated with the high expression of gastric mucosa-specific genes. The mixed-stromal molecular subtype exhibits heterogeneous transit-amplifying characteristics, and the mesenchymal molecular subtype is associated with EMT and mesenchymal characteristics.
[0133] Table 3 describes the target gene expression patterns of FIG. 8A in terms of scores) (d'.sub.ik). In the scores (d'.sub.ik) as provided in Table 3, positive numbers denote high gene expression, negative numbers denote low gene expression, and 0 denotes no change in gene expression. Thus, the more positive the score, the higher the gene expression, and the more negative the score, the lower the gene expression.
[0134] Score values (SVs) are calculated by applying the scores (d'.sub.ik) to Equation 2 below, and GC may be classified into an intestinal molecular subtype, an inflammatory molecular subtype, a mesenchymal molecular subtype, a mixed-stromal molecular subtype, and a gastric molecular subtype according to the SVs:
SV ( Score Value ) = 1 t i .di-elect cons. SN .theta. d ik ' [ Equation 2 ] ##EQU00016##
[0135] wherein SV is an expression mean of each signature in the clusters obtained from NMF-based clustering, t is the number of genes (i) belonging to each signature, SN.sub..theta.is signature (.theta.=6), k denotes the number of clusters, which is an integer of 2 to 7, and d'.sub.ik denotes a score based on a distance between the median of total gene and a mean of each cluster.
[0136] FIG. 10 illustrates a method of naming five clusters subtypes, wherein a cluster in which the SV of the gastric signature is a maximum value is determined as a gastric molecular subtype; among the remaining four clusters, a cluster in which the SV of the mesenchymal signature is a maximum value and the SV of the proliferative signature is a minimum value is determined as a mesenchymal molecular subtype; among the remaining three clusters, a cluster in which the SV of the immune signature is a maximum value and the SV of the intestinal signature is a minimum value is determined as an inflammatory molecular subtype; among the remaining two clusters, a cluster in which the SV of the stem-like signature is a maximum value is determined as a mixed-stromal molecular subtype; and the last remaining cluster is determined as an intestinal molecular subtype.
[0137] The score (d'.sub.ik) provided in Table 3 may be corrected using a critical value for t-statistics of the (ith) gene, and the d'.sub.ik values may be calculated according to Equations 3 and 4 below to establish molecular subtyping standards:
[Equation 3]
d'.sub.ik=(.sub.ik)(|d.sub.ik|-.DELTA.).sub.+ [0138] wherein most mean values
[0138] ( x _ ik = j .di-elect cons. C k x ij n k ) ##EQU00017##
of the (ith) gene in molecular
[0139] subtype (k) are noises and may approximate to a total mean
( x _ i = j = 1 n x ij n ) ##EQU00018##
of the same gene types (i), and thus correction is made using a critical value (.DELTA.) so that genes whose d.sub.ik values converge to 0 can be excluded. Accordingly, a reliable mean of the (ith) gene belonging to molecular subtype (k) may be calculated. The d.sub.ik value of Equation 3 may be calculated by
[0140] Equation 4 below:
d ik = x _ ik - x _ i m k ( s i + s 0 ) , s i 2 = 1 n - k k = 1 5 j .di-elect cons. C k ( x ij - x _ ik ) 2 [ Equation 4 ] ##EQU00019## [0141] wherein
[0141] x _ ik = j .di-elect cons. C k x ij n k ##EQU00020##
is an expression mean of the (ith) gene in molecular subtype (k),
x _ i = j = 1 n x ij n ##EQU00021##
is a total mean of the same (ith) gene, m.sub.k denotes a degree of freedom
( m k = 1 n k + 1 n ) ##EQU00022##
for correcting a standard error of X.sub.ik-X.sub.i, S.sub.i denotes a standard deviation of the entire sample of the (i) gene belonging to molecular subtype (k), S.sub.0 and denotes a median of S.sub.i.
[0142] Table 3 is a molecular subtype classification reference table, wherein red color denotes maximum values and blue color denotes minimum values, and this table was made based on the d'.sub.ik calculated according to Equations 3 and 4 from the scores (d'.sub.ik) of 26 target genes from 325 samples.
[0143] To confirm the molecular subtype of a test sample, the values calculated by Equations 3 and 4 above for the expression values of the target gene group of the test sample may be applied to Equation 5 below and the molecular subtype classification reference table may be used for the score (d'.sub.ik) of Table 3, thereby determining the molecular subtype (k) of a test sample (X*):
.delta. k ( x * ) = i = 1 p ( x i * - x _ ik ' ) 2 ( s 1 - s 0 ) - 2 log .pi. k , min k .delta. k ( x * ) [ Equation 5 ] ##EQU00023##
k = 1 K .pi. k = 1 , .pi. k = 1 K ; ##EQU00024##
.pi..sub.k is prior probability of molecular subtype (k)
[0144] wherein the test sample (X.sub.i*)refers to a value obtained by median-centering the Cq values of 26 target genes with the Cq values of 26 target genes of test set II of 325 samples, .delta..sub.k)(X*) is a discriminant score for the molecular subtype "k" of the test sample (X*) wherein classification is performed by selecting a molecular subtype (k) of the test sample which has the smallest discriminant score. Table 4 shows a consistency rate and error rate of the determination of molecular subtypes for 325 samples in accordance with .delta..sub.k(X*)
TABLE-US-00003 TABLE 4 Consistency rate and error rate of NMF and discriminant score according to molecular subtype, n = 325 NMF Discriminant Mixed- Error score Intestinal Inflammatory Mesenchymal stromal Gastric rate (%) Intestinal 38 0 0 0 0 0% Inflammatory 0 46 0 0 0 0% Mesenchymal 0 3 84 0 2 5.60% Mixed-stromal 31 20 13 44 1 59.60% Gastric 6 2 0 0 35 19.60% Total Error rate 16.96%
[0145] The present invention can be applied to the field of gastric cancer prognosis prediction.
Sequence CWU 1
1
93120DNAArtificial SequenceTFF1 forward primer 1aaataagggc
tgctgtttcg 20220DNAArtificial SequenceTFF1 reverse primer
2gggacgtcga tggtattagg 20319DNAArtificial SequenceTFF2 forward
primer 3ccctcccaaa gcaagagtc 19420DNAArtificial SequenceTFF2
reverse primer 4gggtagccac agtttcttcg 20520DNAArtificial
SequenceVSIG1 forward primer 5catcgtgcca gtgaaagaaa
20621DNAArtificial SequenceVSIG1 reverse primer 6tgtcagattt
ccaatgacca a 21719DNAArtificial SequenceCNN1 forward primer
7agtccaccct cctggcttt 19821DNAArtificial SequenceCNN1 reverse
primer 8cttcactccc acgttcacct t 21920DNAArtificial SequenceNEXN
forward primer 9gcggcaaatg gtaaatgaag 201020DNAArtificial
SequenceNEXN reverse primer 10gggcggtacc ctttaaaaat
201120DNAArtificial SequenceSCRG1 forward primer 11cccagtgagt
gtgagcattt 201220DNAArtificial SequenceSCRG1 reverse primer
12gcttttggcc ctttttcttc 201319DNAArtificial SequenceSORBS1 forward
primer 13gctgtgatga atggcttgg 191421DNAArtificial SequenceSORBS1
reverse primer 14cccagtgcag atttttgtag g 211520DNAArtificial
SequenceSPARCL1 forward primer 15cattccaaac caactgctga
201620DNAArtificial SequenceSPARCL1 reverse primer 16agcttcagcc
cataaactgg 201720DNAArtificial SequenceAURKA forward primer
17gcagattttg ggtggtcagt 201820DNAArtificial SequenceAURKA reverse
primer 18gtagtccagg gtgccacaga 201920DNAArtificial SequenceBUB1
forward primer 19ccttcaaaac caaaggagga 202019DNAArtificial
SequenceBUB1 reverse primer 20gcagcgaata ccccataca
192119DNAArtificial SequenceCDC20 forward primer 21cttccctgcc
agaccgtat 192220DNAArtificial SequenceCDC20 reverse primer
22ccaatccaca aggttcaggt 202320DNAArtificial SequenceCEP55 forward
primer 23caagtgggaa aggaaagctg 202420DNAArtificial SequenceCEP55
reverse primer 24ctcagcctca aggactcgaa 202518DNAArtificial
SequencePTTG1 forward primer 25ctgaagctgg ggtctgga
182622DNAArtificial SequencePTTG1 reverse primer 26aacgtggtgt
tgaaacttga ga 222718DNAArtificial SequenceUBE2C forward primer
27ccctgctatc accccaac 182820DNAArtificial SequenceUBE2C reverse
primer 28gggcagacca cttttccttc 202920DNAArtificial SequenceCD8A
forward primer 29cagagctacc cgcagagttc 203020DNAArtificial
SequenceCD8A reverse primer 30aagaggttga gatggcatgg
203120DNAArtificial SequenceGBP1 forward primer 31tagaagccag
tgctcgtgaa 203220DNAArtificial SequenceGBP1 reverse primer
32gatctctgat gccatgtcca 203320DNAArtificial SequenceGBP5 forward
primer 33ggcctgggag atgtagagaa 203421DNAArtificial SequenceGBP5
reverse primer 34cagtaagagt gccagtgcaa a 213520DNAArtificial
SequenceGZMB forward primer 35cggtggcttc ctgatacaag
203620DNAArtificial SequenceGZMB reverse primer 36ttatggagct
tccccaacag 203718DNAArtificial SequenceNKG7 forward primer
37gtccccgtcc tggctatg 183821DNAArtificial SequenceNKG7 reverse
primer 38aacgctcaaa actcatcttg c 213920DNAArtificial SequenceWARS
forward primer 39ttgtggaccc atggacagta 204020DNAArtificial
SequenceWARS reverse primer 40ccaaaccgaa caatgagctt
204121DNAArtificial SequenceANTXR1 forward primer 41cagttggctc
acaaattcat c 214219DNAArtificial SequenceANTXR1 reverse primer
42ttcctcgggt ggagaaaac 194322DNAArtificial SequenceSFRP4 forward
primer 43ggagacttcc gacttcctta ca 224420DNAArtificial SequenceSFRP4
reverse primer 44tggccttaca taggctgtcc 204520DNAArtificial
SequenceVCAN forward primer 45tttgagcatg acttccgttg
204620DNAArtificial SequenceVCAN reverse primer 46ctgtctggct
ggttgggtct 204720DNAArtificial SequenceCDH17 forward primer
47gcaatgtgac tgccaaggat 204820DNAArtificial SequenceCDH17 reverse
primer 48acctcttgtg tctcccctca 204920DNAArtificial SequenceCDX1
forward primer 49agggaggaac gtggtcaact 205020DNAArtificial
SequenceCDX1 reverse primer 50tatgatgggg gcaggtagaa
205120DNAArtificial SequenceMYO1A forward primer 51ccgcctcttt
gactggatag 205220DNAArtificial SequenceMYO1A reverse primer
52ccttcttctt ttccccgatg 205320DNAArtificial SequenceACTB forward
primer 53tcaccctgaa gtaccccatc 205420DNAArtificial SequenceACTB
reverse primer 54tgtggtgcca gattttctcc 205520DNAArtificial
SequenceATP5E forward primer 55atggtggcct actggagaca
205621DNAArtificial SequenceATP5E reverse primer 56ctctcactgc
ttttgcacag a 215718DNAArtificial SequenceGPX1 forward primer
57cccgtgcaac cagtttgg 185823DNAArtificial SequenceGPX1 reverse
primer 58ggacgtactt gagggaattc aga 235920DNAArtificial SequenceUBB
forward primer 59tgggtgagct tgtttgtgtc 206021DNAArtificial
SequenceUBB reverse primer 60tttgacctgt tagcggatac c
216121DNAArtificial SequenceHPRT1 forward primer 61tggtcaggca
gtataatcca a 216220DNAArtificial SequenceHPRT1 reverse primer
62cttcgtgggg tccttttcac 206320DNAArtificial SequenceTFF1 probe
63acgacaccgt tcgtggggtc 206422DNAArtificial SequenceTFF2 probe
64tcagtgcgtc atggaggtct ca 226520DNAArtificial SequenceVSIG1 probe
65tcaacccaac caccgggatt 206622DNAArtificial SequenceCNN1 probe
66cctttcgtct tcgccatgct gg 226724DNAArtificial SequenceNEXN probe
67tgaggaaaac caagacacag caaa 246822DNAArtificial SequenceSCRG1
probe 68tggtcttggc agaggatgct tc 226920DNAArtificial SequenceSORBS1
probe 69ttgtcttgcc cattgctgcc 207022DNAArtificial SequenceSPARCL1
probe 70cggtagcacc tgacaacact gc 227121DNAArtificial SequenceAURKA
probe 71ctccatcttc caggaggacc a 217224DNAArtificial SequenceBUB1
probe 72ccaaaaactc ttcagcatga ggca 247320DNAArtificial
SequenceCDC20 probe 73cctggatgcg cctgaaatcc 207425DNAArtificial
SequenceCEP55 probe 74ttttctccaa aagtctgtgt ctctc
257525DNAArtificial SequencePTTG1 probe 75ccttcaatca aagccttaga
tggga 257623DNAArtificial SequenceUBE2C probe 76cacccagggt
aacatatgcc tgg 237723DNAArtificial SequenceCD8A probe 77tgcctccagc
tctctcagca tga 237827DNAArtificial SequenceGBP1 probe 78agaaaaagaa
cagacaaggg aacagcc 277926DNAArtificial SequenceGBP5 probe
79tctggatatc attcttgttg tcagcc 268021DNAArtificial SequenceGZMB
probe 80cgacttcgtg ctgacagctg c 218121DNAArtificial SequenceNKG7
probe 81cgctcttgcc ttctgctcac a 218222DNAArtificial SequenceWARS
probe 82tgccttttgc actgcttgtc tg 228323DNAArtificial SequenceANTXR1
probe 83aaaggacatt ctcaactgtg ggc 238420DNAArtificial SequenceSFRP4
probe 84aggcaatgcc cagcctcatc 208521DNAArtificial SequenceVCAN
probe 85tggcagcaca ctgcaatacg a 218621DNAArtificial SequenceCDH17
probe 86ccagaaggtc tggacataag c 218720DNAArtificial SequenceCDX1
probe 87tgcctcttcc tgcagcctca 208825DNAArtificial SequenceMYO1A
probe 88cccaccttga tgctctcatt gattc 258920DNAArtificial
SequenceACTB probe 89cggcatcgtc accaactggg 209027DNAArtificial
SequenceATP5E probe 90tggactcagc tacatccgat actccca
279127DNAArtificial SequenceGPX1 probe 91ctcttcgttc ttggcgttct
cctgatg 279220DNAArtificial SequenceUBB probe 92caccaaccac
gtccacccac 209321DNAArtificial SequenceHPRT1 probe 93tgcaagcttg
cgaccttgac c 21
References
D00001
D00002
D00003
D00004
D00005
D00006
D00007
D00008
D00009


P00001
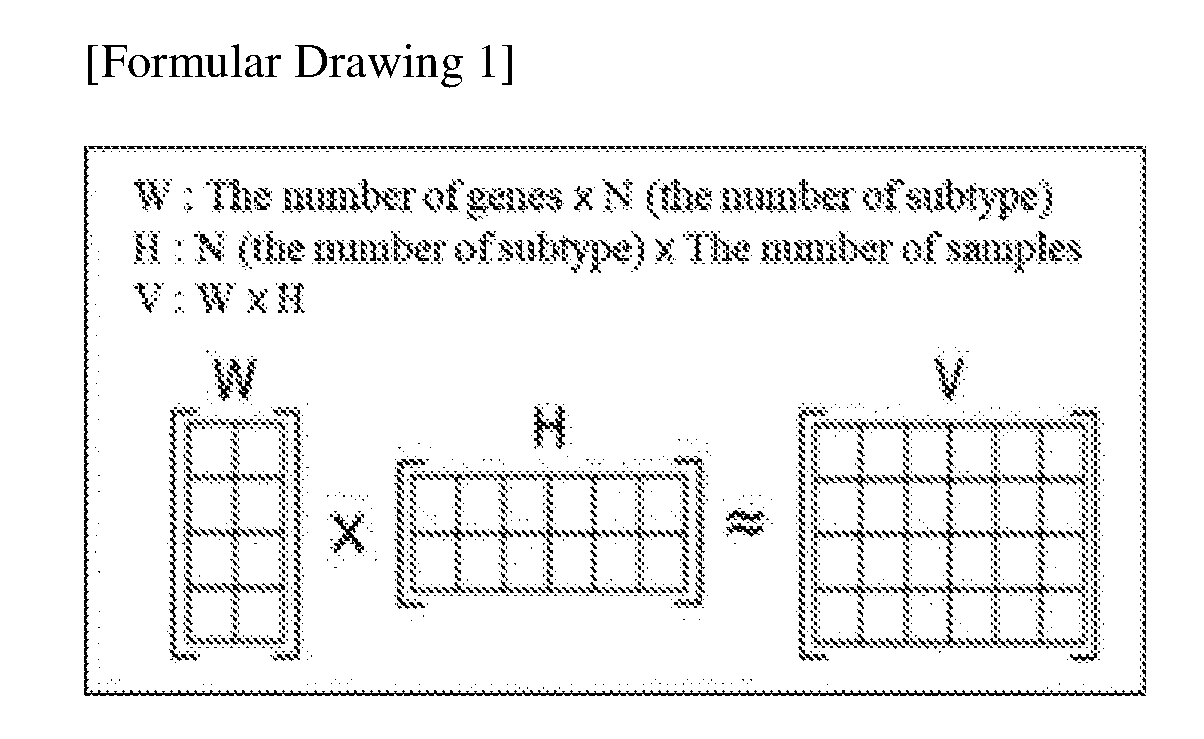
P00002

P00003
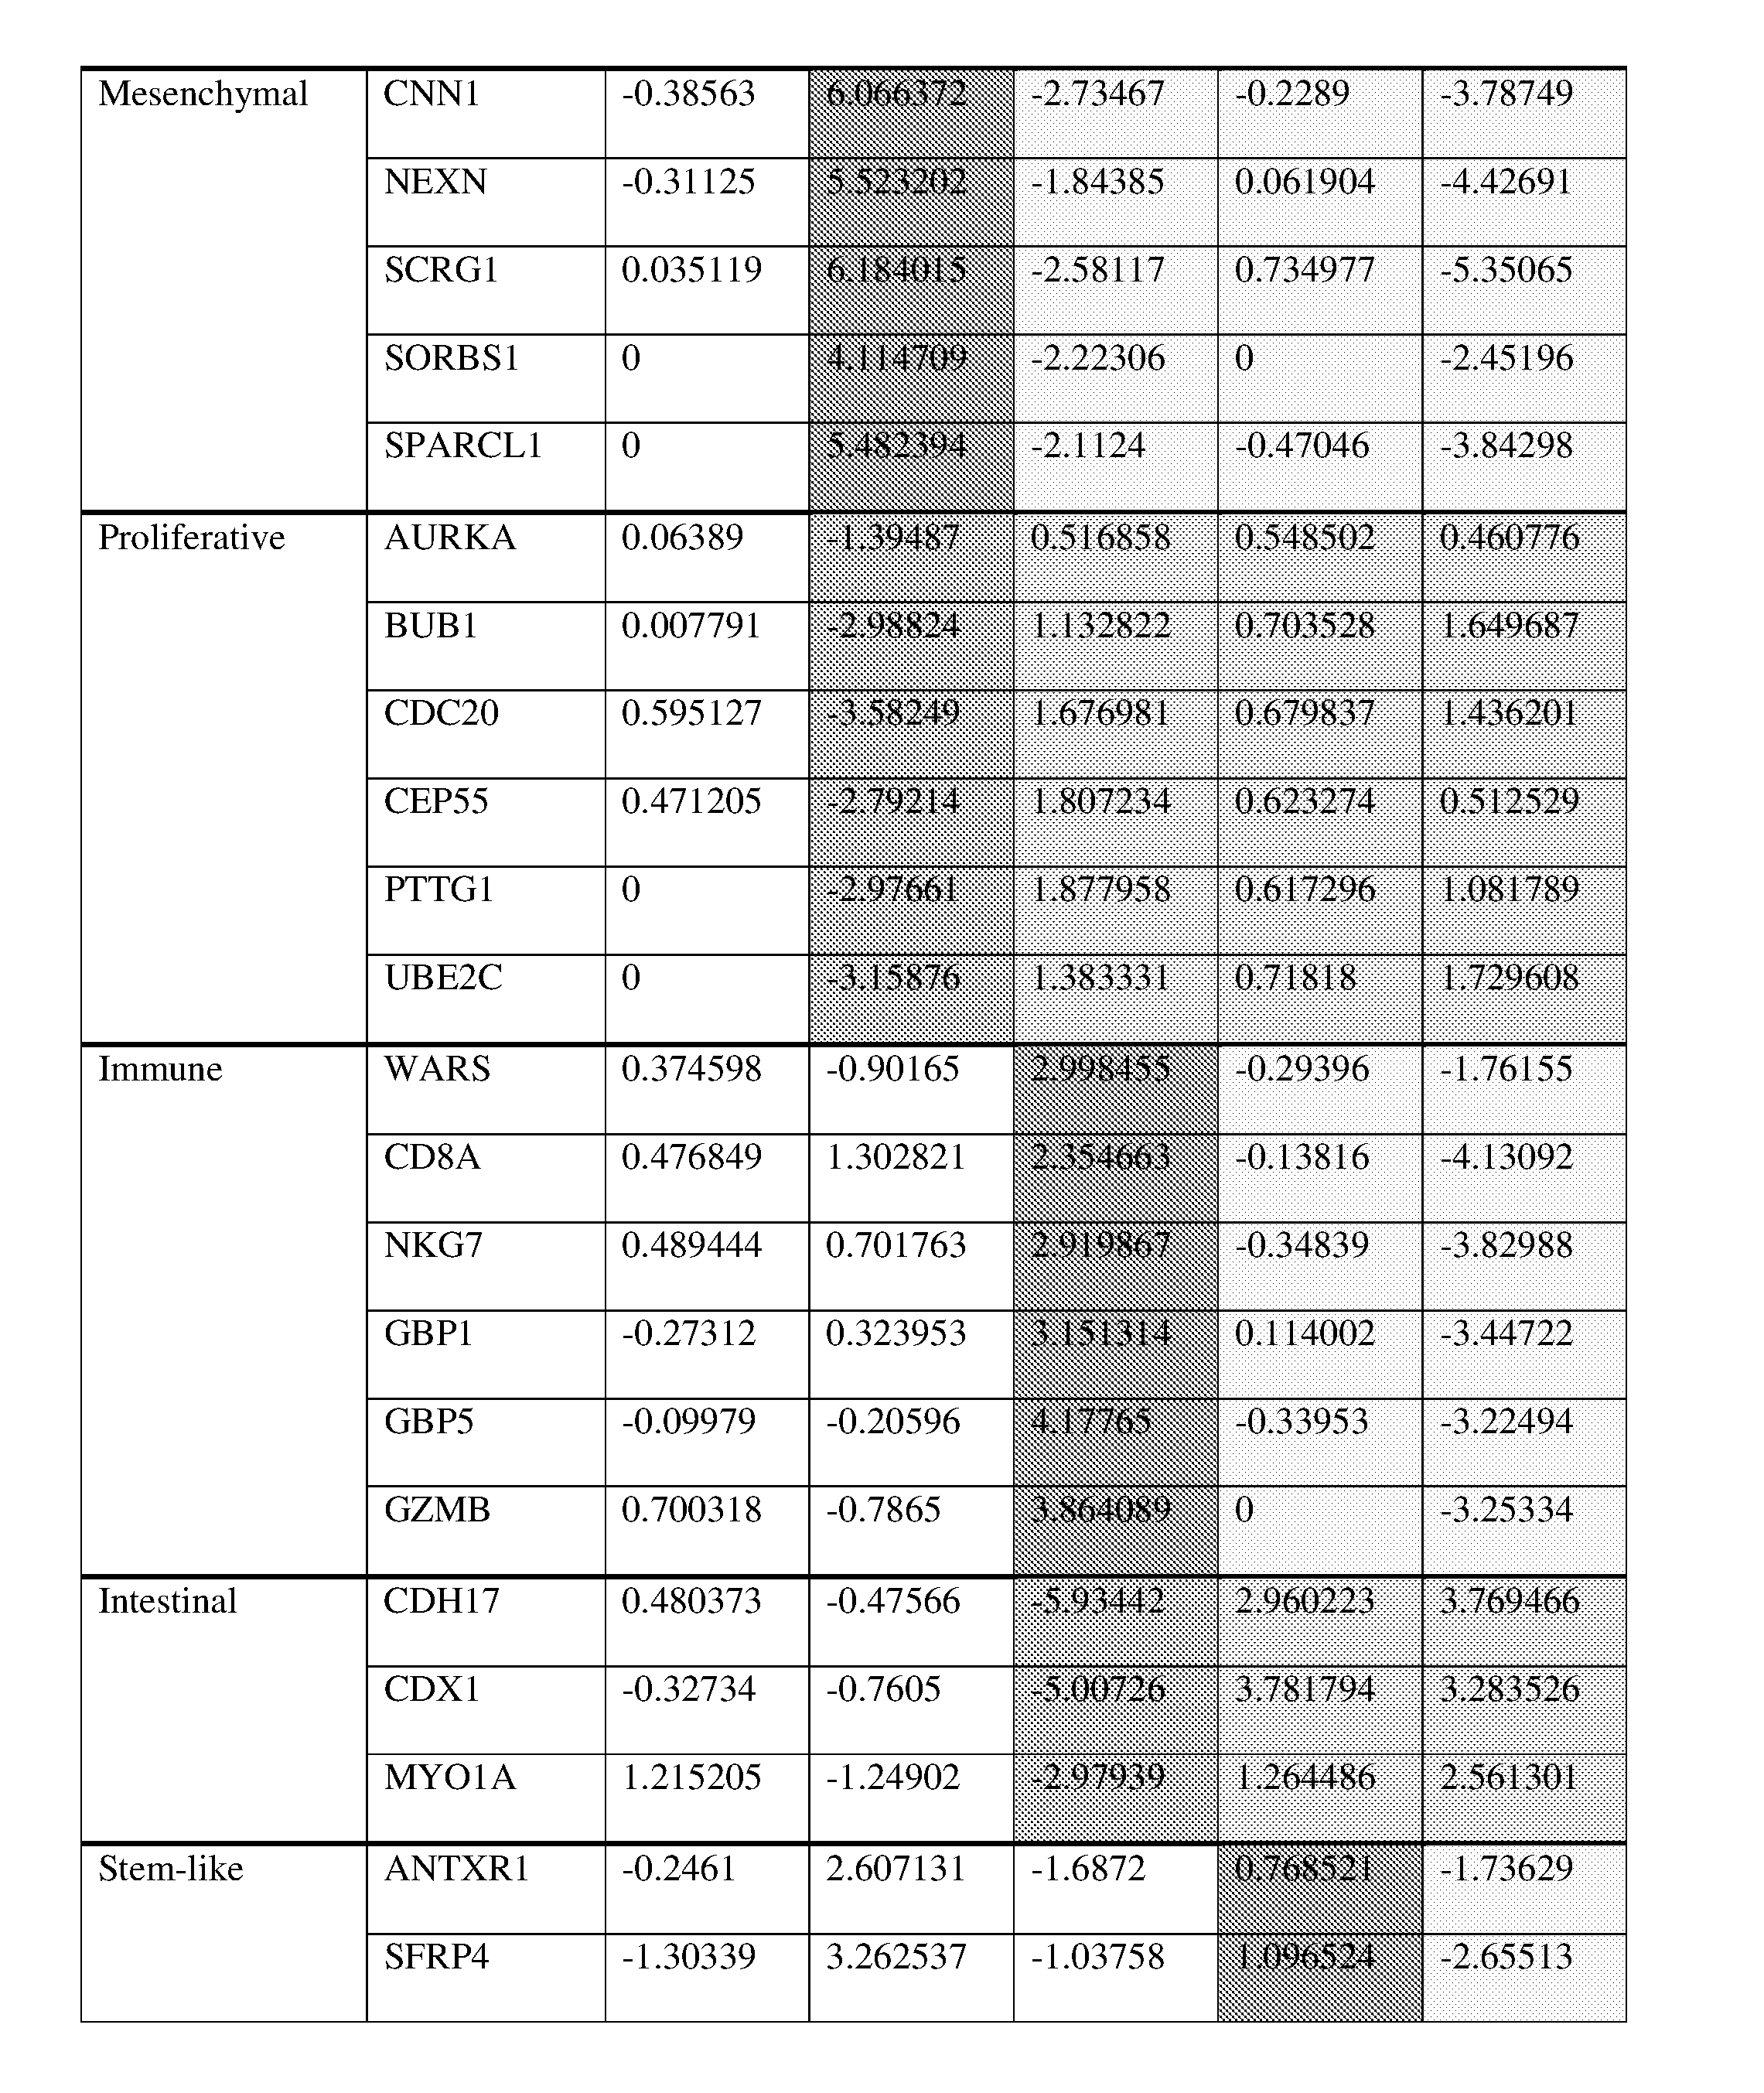
P00004

S00001
XML
uspto.report is an independent third-party trademark research tool that is not affiliated, endorsed, or sponsored by the United States Patent and Trademark Office (USPTO) or any other governmental organization. The information provided by uspto.report is based on publicly available data at the time of writing and is intended for informational purposes only.
While we strive to provide accurate and up-to-date information, we do not guarantee the accuracy, completeness, reliability, or suitability of the information displayed on this site. The use of this site is at your own risk. Any reliance you place on such information is therefore strictly at your own risk.
All official trademark data, including owner information, should be verified by visiting the official USPTO website at www.uspto.gov. This site is not intended to replace professional legal advice and should not be used as a substitute for consulting with a legal professional who is knowledgeable about trademark law.