Methods For Fluorescence Imaging Microscopy
Stamatoyannopoulos; John ; et al.
U.S. patent application number 16/319099 was filed with the patent office on 2019-08-01 for methods for fluorescence imaging microscopy. The applicant listed for this patent is ALTIUS INSTITUTE FOR BIOMEDICAL SCIENCES, UNIVERSITY OF WASHINGTON. Invention is credited to Shreeram AKILESH, John Stamatoyannopoulos.
| Application Number | 20190234874 16/319099 |
| Document ID | / |
| Family ID | 60992821 |
| Filed Date | 2019-08-01 |


View All Diagrams
| United States Patent Application | 20190234874 |
| Kind Code | A1 |
| Stamatoyannopoulos; John ; et al. | August 1, 2019 |
METHODS FOR FLUORESCENCE IMAGING MICROSCOPY
Abstract
Disclosed herein are methods of detecting a regulatory element, determining the localization of a regulatory element, and/or measuring the activity of a regulatory element.
| Inventors: | Stamatoyannopoulos; John; (Seattle, WA) ; AKILESH; Shreeram; (Seattle, WA) | ||||||||||
| Applicant: |
|
||||||||||
|---|---|---|---|---|---|---|---|---|---|---|---|
| Family ID: | 60992821 | ||||||||||
| Appl. No.: | 16/319099 | ||||||||||
| Filed: | July 19, 2017 | ||||||||||
| PCT Filed: | July 19, 2017 | ||||||||||
| PCT NO: | PCT/US17/42896 | ||||||||||
| 371 Date: | January 18, 2019 |
Related U.S. Patent Documents
| Application Number | Filing Date | Patent Number | ||
|---|---|---|---|---|
| 62364245 | Jul 19, 2016 | |||
| Current U.S. Class: | 1/1 |
| Current CPC Class: | C12P 19/34 20130101; G01N 33/56966 20130101; G01N 21/6458 20130101; A01N 1/0221 20130101; C12Q 1/6837 20130101; C40B 40/06 20130101; C12N 5/0634 20130101; C40B 30/04 20130101; C12Q 1/6841 20130101; G01N 33/582 20130101; G01N 2015/0038 20130101; G01N 21/64 20130101; C12Q 1/6841 20130101; G01N 33/574 20130101; G01N 1/30 20130101; G01N 21/78 20130101; C12N 5/0694 20130101; C12Q 2521/301 20130101; C12Q 2563/107 20130101 |
| International Class: | G01N 21/64 20060101 G01N021/64; G01N 21/78 20060101 G01N021/78; C12P 19/34 20060101 C12P019/34; A01N 1/02 20060101 A01N001/02; C12N 5/09 20060101 C12N005/09; C12N 5/078 20060101 C12N005/078; G01N 1/30 20060101 G01N001/30 |
Goverment Interests
STATEMENT AS TO FEDERALLY SPONSORED RESEARCH
[0002] This invention was made with the support of the United States government under Grant number RM1-HG007743-02 by the Center for Photogenomics.
Claims
1-102. (canceled)
103: An imaging-based method for detecting a regulatory element, the method comprising: contacting a cell sample with a detection agent; binding the detection agent to the regulatory element; and analysing a detection profile from the detection agent to determine the presence or absence of the regulatory element.
104: The method of claim 103, wherein the detection agent comprises a set of fluorescently labeled probes between 20 nucleotides to 60 nucleotides in length.
105: The method of claim 103, wherein the regulatory element is an activated DNaseI hypersensitive site (DHS).
106: The method of claim 103, further comprising: incubating the cell sample with a set of fluorescently labeled probes, wherein each probe hybridizes to a DNaseI hypersensitive site (DHS); measuring a fluorescent signature of the set of fluorescently labeled probes; based on the fluorescent signature, determining a DHS profile; and comparing the DHS profile to a control, wherein a correlation with the control indicates the activity level of the regulatory element in the cell sample.
107: The method of claim 103, further comprising: incubating the cell sample with a set of non-labeled probes; and incubating the cell sample with a set of fluorescently labeled probes, wherein each of the fluorescently labeled probes in the set of fluorescently labeled probes interacts with a non-labeled probe within the set of non-labeled probes, thereby generating a set of fluorescently labeled probes.
108: The method of claim 104 comprising an additional set of fluorescently-labeled probes.
109: The method of claim 108, wherein the combination of fluorescent moieties in each of set of fluorescently labeled probes are different, and wherein each set of fluorescently labeled probes comprises a spectrally distinct bar code.
110: A method for generating a chromatin map, comprising: contacting a cell sample with a set of detection agents; binding the set of detection agents to one or more regulatory elements; and analysing a detection profile from the set of detection agents to generate a chromatin map.
111: The method of claim 110, further comprising generating a 3-dimensional map from the detection profile.
112: The method of claim 110, further comprising generating a chromatin map for a cell type, wherein each cell type comprises a different chromatin pattern.
113: The method of claim 112, further comprising determining at least one unique marker within the chromatin map that is associated with a specific cell type.
114: The method of claim 110, wherein the chromatin map allows for determination of genomic activity or chromatin compaction.
115: The method of claim 110, wherein the set of detection agents is a set of fluorescently labeled probes.
116: A method of measuring the activity of a target regulatory element, the method comprising: contacting a cell sample with a first set and a second set of detection agents, wherein the first set of detection agents interact with a target regulatory element within the cell, and the second set of detection agents interact with at least one product of the target regulatory element; and analysing a fluorescent profile from the first set and the second set of detection agents, wherein the presence or the absence of the at least one product indicates the activity of the target regulatory element.
117: The method of claim 116, wherein the first set and the second set of detection agents are a first set and a second set of fluorescently labeled probes.
118: The method of claim 116, wherein the target regulatory element is a DNaseI hypersensitive site (DHS).
119: The method of claim 117, wherein a fluorescent moiety of the first set of fluorescently labeled probes and a fluorescent moiety of the second set of fluorescently labeled probes are different.
120: The method of claim 116, further comprising incubating the cell sample with a set of non-labeled nucleic acid probes and a set of non-labeled antibody-oligonucleotide probes.
121: The method of claim 120, further comprising incubating the cell sample with a first set of fluorescently labeled oligonucleotides, wherein each of the fluorescently labeled oligonucleotides in the first set of fluorescently labeled oligonucleotides hybridizes to a non-labeled nucleic acid probe within the set of non-labeled nucleic acid probes, thereby generating the first set of fluorescently labeled probes.
122: The method of claim 121, further comprising incubating the cell sample with a second set of fluorescently labeled oligonucleotides, wherein each of the fluorescently labeled oligonucleotides in the second set of fluorescently labeled oligonucleotides hybridizes to a non-labeled antibody-oligonucleotide probe within the set of non-labeled antibody-oligonucleotide probes, thereby generating the second set of fluorescently labeled probes.
Description
CROSS-REFERENCE
[0001] This application claims the benefit of U.S. Provisional Application No. 62/364,245, filed Jul. 19, 2016, which application is incorporated herein by reference in its entirety for all purposes.
BACKGROUND OF THE INVENTION
[0003] Imaging techniques such as fluorescence in situ hybridization (FISH) allows for visualization of DNA or RNA regions, and/or assessment of gene expression, chromosome position, and/or protein localization. In some instances, these imaging methods are limited by small field of view and/or limited resolution. As such, data acquisition from large number of cells requires multiple fields of view and thereby presents challenges in obtaining high throughput and high resolution imaging data.
SUMMARY OF THE INVENTION
[0004] In some aspects, a method of detecting a regulatory element in situ is provided to determine the presence, absence or activity of the regulatory element. In other aspects, a method of detecting different types of regulatory elements simultaneously is provided utilizing a heterogeneous set of detection agents, and translating the molecular information from the different types of regulatory elements to determine the activity state of a cell. In additional aspects, methods of determining the localization of a regulatory element and methods of measuring the activity of a regulatory element are provided.
[0005] In certain aspects, provided herein is an imaging-based method of detecting a regulatory element, the method comprising (a) contacting a cell sample with a detection agent; (b) binding the detection agent to the regulatory element; and (c) analyzing a detection profile from the detection agent to determine the presence or absence of the regulatory element. The analyzing the detection profile from the detection agent can further determine an activity of the regulatory element. The detection agent can comprise a set of fluorescently labeled probes between about 20 nucleotides to about 60 nucleotides in length. The method can further comprise hybridizing the set of fluorescently labeled probes to the regulatory element. The regulatory element can comprise DNA, RNA, polypeptides, or a combination thereof. The regulatory element can be DNA. The regulatory element can be RNA. The RNA can be an enhancer RNA (eRNA). The eRNA can be between about 50 base pairs to about 3 kilobase pairs. The eRNA can be at least 200 base pairs in length. The presence of an eRNA can correlate to an activated regulatory element. The regulatory element can be an activated DNaseI hypersensitive site (DHS). The method can further comprise (a) incubating a cell sample with a set of fluorescently labeled probes, wherein each probe hybridizes to a DNaseI hypersensitive site (DHS); (b) measuring a fluorescent signature of the set of fluorescently labeled probes; (c) based on the fluorescent signature, determining a DHS profile; and (d) comparing the DHS profile to a control, wherein a correlation with the control indicates the activity level of the regulatory element in the cell sample. The regulatory element can be a polypeptide. The polypeptide can comprise a transcription factor protein, a DNA-binding protein, a RNA-binding protein, or a gene product. The regulatory element can comprise chromatin. The method can further comprise generating a chromatin profile. The chromatin profile can comprise DNA density pattern and activated DHS. The method can further comprise (a) incubating a cell sample with a set of fluorescently labeled probes specific to target sites on a chromatin in the presence of an exogenous agent or condition; (b) measuring a fluorescent signature of the set of fluorescently labeled probes; (c) based on the fluorescent signature, generating a fluorescent profile of the chromatin; and (d) comparing the fluorescent profile of step c) with a second fluorescent profile of a chromatin obtained from an equivalent sample incubated with an equivalent set of fluorescently labeled probes in the absence of the exogenous agent or condition, wherein a difference between the two sets of fluorescent profiles indicates a change in the chromatin density induced by the exogenous agent or condition. The exogenous agent or condition can comprise a drug or a small molecule. The exogenous agent or condition can comprise an environmental factor. The environmental factor can comprise a change in temperature, pH, nutrient, or a combination thereof. The detection profile can comprise signal intensity of the detection agent, the location of the detection agent, and/or signal size of the detection agent. The method can further comprise (a) incubating the cell sample with a set of non-labeled probes; and (b) incubating the cell sample with a set of fluorescently-labeled probes prior to the hybridizing step, wherein each of the fluorescently-labeled probe in the set of fluorescently-labeled probe interact with a non-labeled probe within the set of non-labeled probes, thereby generating the set of fluorescently-labeled probes. The fluorescently-labeled probe can comprise a fluorescently-labeled oligonucleotide or a fluorescently-labeled protein. Each fluorescently-labeled oligonucleotide within the set of fluorescently-labeled oligonucleotides can further comprise a spectrally distinct bar code. The combination of fluorophores within the set of fluorescently-labeled oligonucleotides can further comprise a spectrally distinct bar code. The set of fluorescently labeled probes can comprise at least 4, 5, 6, 7, 8, 9, 10, 11, 12, 13, 14, 15, 18, 20, 30, 40, 50, 60, or more probes. Each of the fluorescently labeled probes can be independently labeled with a fluorescent moiety. Each fluorescent moiety within the set of fluorescently labeled probes can be the same. The method can further comprise an additional set of fluorescently labeled probes. The combination of fluorescent moieties in each set of fluorescently labeled probes can be different, wherein each set of the fluorescently labeled probe comprise a spectrally distinct bar code. The detection profile can be obtain from a synthetic aperture optics (SAO) instrumentation. The analyzing further can comprise utilizing a SAO method. The fluorescent moiety can comprise Cy3, Cy5, Cy5.5, Cy7, Q570, Alexa488, Alexa555, Alexa594, Alexa647, Alexa680, Alexa 750, Alexa 790, Atto488, Atto532, Atto647N, TexasRed, CF610, Propidium iodide, Q670, IRDye700, IRDye800, Indocyanine green, Pacific Blue dye, Pacific Green dye, or Pacific Orange dye. The fluorescent moiety can comprise a quantum dot. The quantum dot can comprise QDot525, QDot 545, QDot 565, QDot 585, QDot 605, or QDot 655. The fluorescently labeled probe can comprise at least one unnatural base. The unnatural base can comprise 2'-O-methyl, 2'-O-methoxyethyl (2'-O-MOE), 2'-O-aminopropyl, 2'-deoxy, T-deoxy-2'-fluoro, 2'-O-aminopropyl (2'-O-AP), 2'-O-dimethylaminoethyl (2'-O-DMAOE), 2'-O-dimethylaminopropyl (2'-O-DMAP), T-O-dimethylaminoethyloxyethyl (2'-O-DMAEOE), or 2'-O--N-methylacetamido (2'-O-NMA) modified, locked nucleic acid (LNA), ethylene nucleic acid (ENA), peptide nucleic acid (PNA), 1', 5'-anhydrohexitol nucleic acids (HNA), morpholino, methylphosphonate nucleotides, thiolphosphonate nucleotides, or 2'-fluoro N3-P5'-phosphoramidites. The fluorescently labeled probe can comprise DNA probe, RNA probe, protein probe, or a combination thereof. The fluorescently labeled probe can comprise a locked nucleic acid probe, a peptide nucleic acid (PNA) probe, an oligonucleotide, an oligopaint, an ECHO probe, a molecular beacon probe, a toe-hold probe, a TALE probe, a ZFN probe, or a CRISPR probe. The fluorescently labeled probe can further be crosslinked to the regulatory element. The fluorescently labeled probe can further comprise at least one conjugating moiety. The conjugating moiety can be attached at the 5' terminus, 3' terminus, or at an internal site. The conjugating moiety can comprise a hapten group. The hapten group can be a biotin. The conjugating moiety can be a conjugating functional group. The conjugating functional group can be an azido group or an alkyne group. The fluorescently labeled probe can be designed based on Primer3 algorithm. The fluorescently labeled probe can be further optimized to reduce off-target binding activity. The cell sample can be further treated after incubation with the fluorescently labeled probe. The cell sample can be fixed. The fixation condition can comprise alcohol-based or formaldehyde-based fixatives. The cell sample can be denatured. The denaturing agent can comprise formamide or ethylene carbonate. The cell sample can be cryopreserved. The cell sample can be a fresh cell sample. The cell sample can comprise cells obtained from blood, urine, stool, saliva, lymph fluid, cerebrospinal fluid, synovial fluid, cystic fluid, ascites, pleural effusion, amniotic fluid, chorionic villus sample, vaginal fluid, interstitial fluid, buccal swab sample, sputum, bronchial lavage, Pap smear sample, or ocular fluid. The cell sample can comprise cells obtained from a blood sample, an aspirate sample, or a smear sample. The cell sample can be a circulating tumor cell sample. The circulating tumor cell sample can comprise lymphoma cells, fetal cells, apoptotic cells, epithelia cells, endothelial cells, stem cells, progenitor cells, mesenchymal cells, osteoblast cells, osteocytes, hematopoietic stem cells, foam cells, adipose cells, transcervical cells, circulating cardiocytes, circulating fibrocytes, circulating cancer stem cells, circulating myocytes, circulating cells from kidney, circulating cells from gastrointestinal tract, circulating cells from lung, circulating cells from reproductive organs, circulating cells from central nervous system, circulating hepatic cells, circulating cells from spleen, circulating cells from thymus, circulating cells from thyroid, circulating cells from an endocrine gland, circulating cells from parathyroid, circulating cells from pituitary, circulating cells from adrenal gland, circulating cells from islets of Langerhans, circulating cells from pancreas, circulating cells from hypothalamus, circulating cells from prostate tissues, circulating cells from breast tissues, circulating cells from circulating retinal cells, circulating ophthalmic cells, circulating auditory cells, circulating epidermal cells, circulating cells from the urinary tract, or combinations thereof. The cell sample can be a peripheral blood mononuclear cell sample. The cell sample can comprise cells obtained from a biopsy sample. The cell sample can be a cancerous cell sample.
[0006] In certain aspects, provided herein is a method of generating a chromatin map, comprising (a) contacting a cell sample with a set of detection agents; (b) binding the set of detection agents to one or more regulatory elements; and (c) analyzing a detection profile from the set of detection agents to generate a chromatin map. The method can further comprise generating a 3-dimensional map from the detection profile. The method can further comprise generating a chromatin map for a cell type, wherein each cell type comprises a different chromatin pattern. The method can further comprise determining at least one unique marker within the chromatin map that is associated with a specific cell type. The at least one unique marker can comprise a genomic sequence, a DHS, or a combination thereof. The chromatin map can allow for determination of genomic activity or chromatin compaction. The cell can comprise an epithelia cell, a connective tissue cell, a muscle cell, a nerve cell, a hormone-secreting cell, a blood cell, an immune system cell, or a stem cell. The cell can comprise a cancerous cell. The set of detection agent can be a set of fluorescently labeled probes. The fluorescent moiety can comprise Cy3, Cy5, Cy5.5, Cy7, Q570, Alexa488, Alexa555, Alexa594, Alexa647, Alexa680, Alexa 750, Alexa 790, Atto488, Atto532, Atto647N, TexasRed, CF610, Propidium iodide, Q670, IRDye700, IRDye800, Indocyanine green, Pacific Blue dye, Pacific Green dye, or Pacific Orange dye. The fluorescent moiety can comprise a quantum dot. The quantum dot can comprise QDot525, QDot 545, QDot 565, QDot 585, QDot 605, or QDot 655. The fluorescently labeled probe can comprise at least one unnatural base. The unnatural base can comprise 2'-O-methyl, 2'-O-methoxyethyl (2'-O-MOE), 2'-O-aminopropyl, 2'-deoxy, T-deoxy-2'-fluoro, 2'-O-aminopropyl (2'-O-AP), 2'-O-dimethylaminoethyl (2'-O-DMAOE), 2'-O-dimethylaminopropyl (2'-O-DMAP), T-O-dimethylaminoethyloxyethyl (2'-O-DMAEOE), or 2'-O--N-methylacetamido (2'-O-NMA) modified, locked nucleic acid (LNA), ethylene nucleic acid (ENA), peptide nucleic acid (PNA), 1', 5'-anhydrohexitol nucleic acids (HNA), morpholino, methylphosphonate nucleotides, thiolphosphonate nucleotides, or 2'-fluoro N3-P5'-phosphoramidites. The fluorescently labeled probe can comprise DNA probe, RNA probe, protein probe, or a combination thereof. The fluorescently labeled probe can comprise a locked nucleic acid probe, a peptide nucleic acid (PNA) probe, an oligonucleotide, an oligopaint, an ECHO probe, a molecular beacon probe, a toe-hold probe, a TALE probe, a ZFN probe, or a CRISPR probe. The fluorescently labeled probe can further be crosslinked to the regulatory element. The fluorescently labeled probe can further comprise at least one conjugating moiety. The conjugating moiety can be attached at the 5' terminus, 3' terminus, or at an internal site. The conjugating moiety can comprise a hapten group. The hapten group can be a biotin. The conjugating moiety can be a conjugating functional group. The conjugating functional group can be an azido group or an alkyne group. The fluorescently labeled probe can be designed based on Primer3 algorithm. The fluorescently labeled probe can be further optimized to reduce off-target binding activity. The cell sample can be further treated after incubation with the fluorescently labeled probe. The cell sample can be fixed. The fixation condition can comprise alcohol-based or formaldehyde-based fixatives. The cell sample can be denatured. The denaturing agent can comprise formamide or ethylene carbonate. The cell sample can be cryopreserved. The cell sample can be a fresh cell sample. The cell sample can comprise cells obtained from blood, urine, stool, saliva, lymph fluid, cerebrospinal fluid, synovial fluid, cystic fluid, ascites, pleural effusion, amniotic fluid, chorionic villus sample, vaginal fluid, interstitial fluid, buccal swab sample, sputum, bronchial lavage, Pap smear sample, or ocular fluid. The cell sample can comprise cells obtained from a blood sample, an aspirate sample, or a smear sample. The cell sample can be a circulating tumor cell sample. The circulating tumor cell sample can comprise lymphoma cells, fetal cells, apoptotic cells, epithelia cells, endothelial cells, stem cells, progenitor cells, mesenchymal cells, osteoblast cells, osteocytes, hematopoietic stem cells, foam cells, adipose cells, transcervical cells, circulating cardiocytes, circulating fibrocytes, circulating cancer stem cells, circulating myocytes, circulating cells from kidney, circulating cells from gastrointestinal tract, circulating cells from lung, circulating cells from reproductive organs, circulating cells from central nervous system, circulating hepatic cells, circulating cells from spleen, circulating cells from thymus, circulating cells from thyroid, circulating cells from an endocrine gland, circulating cells from parathyroid, circulating cells from pituitary, circulating cells from adrenal gland, circulating cells from islets of Langerhans, circulating cells from pancreas, circulating cells from hypothalamus, circulating cells from prostate tissues, circulating cells from breast tissues, circulating cells from circulating retinal cells, circulating ophthalmic cells, circulating auditory cells, circulating epidermal cells, circulating cells from the urinary tract, or combinations thereof. The cell sample can be a peripheral blood mononuclear cell sample. The cell sample can comprise cells obtained from a biopsy sample. The cell sample can be a cancerous cell sample.
[0007] In certain aspects, provided herein is a method of measuring the activity of a target regulatory element, the method comprising (a) contacting a cell sample with a first set and a second set of detection agents, wherein the first set of detection agents interact with a target regulatory element within the cell, and the second set of detection agents interact with at least one product of the target regulatory element; and (b) analyzing a fluorescent profile from the first set and the second set of detection agents, wherein the presence or the absence of the at least one product indicates the activity of the target regulatory element. The first set and second set of detection agents can be a first set and a second set of fluorescently labeled probes. The method can further comprise hybridizing the first set of fluorescently labeled probes to the target regulatory element. The method can further comprises hybridizing the second set of fluorescently labeled probes to the at least one product of the target regulatory element. The target regulatory element can be DNA, RNA, a polypeptide, or a combination thereof. The target regulatory element can be DNA. The target regulatory element can be a DNaseI hypersensitive site (DHS). The at least one product can be RNA, a polypeptide, or a combination thereof. The at least one product can be RNA. The RNA can be an enhancer RNA (eRNA). The presence of an eRNA can correlate with target gene transcription. The at least one product can be a polypeptide. The fluorescent moiety of the first set of fluorescently labeled probes and the fluorescent moiety of the second set of fluorescently labeled probes can be different. The method can further comprise incubating the cell sample with a set of non-labeled nucleic acid probes and a set of non-labeled antibody-oligonucleotide probes. The method can further comprise incubating the cell sample with a first set of fluorescently-labeled oligonucleotides, wherein each of the fluorescently-labeled oligonucleotide in the first set of fluorescently-labeled oligonucleotides hybridizes to a non-labeled nucleic acid probe within the set of non-labeled nucleic acid probes, thereby generating the first set of fluorescently labeled probes. The method can further comprise incubating the cell sample with a second set of fluorescently-labeled oligonucleotides, wherein each of the fluorescently-labeled oligonucleotide in the second set of fluorescently-labeled oligonucleotides hybridizes to a non-labeled antibody-oligonucleotide probe within the set of non-labeled antibody-oligonucleotide probes, thereby generating the second set of fluorescently labeled probes. The fluorescent moiety can comprise Cy3, Cy5, Cy5.5, Cy7, Q570, Alexa488, Alexa555, Alexa594, Alexa647, Alexa680, Alexa 750, Alexa 790, Atto488, Atto532, Atto647N, TexasRed, CF610, Propidium iodide, Q670, IRDye700, IRDye800, Indocyanine green, Pacific Blue dye, Pacific Green dye, or Pacific Orange dye. The fluorescent moiety can comprise a quantum dot. The quantum dot can comprise QDot525, QDot 545, QDot 565, QDot 585, QDot 605, or QDot 655. The fluorescently labeled probe can comprise at least one unnatural base. The unnatural base can comprise 2'-O-methyl, 2'-O-methoxyethyl (2'-O-MOE), 2'-O-aminopropyl, 2'-deoxy, T-deoxy-2'-fluoro, 2'-O-aminopropyl (2'-O-AP), 2'-O-dimethylaminoethyl (2'-O-DMAOE), 2'-O-dimethylaminopropyl (2'-O-DMAP), T-O-dimethylaminoethyloxyethyl (2'-O-DMAEOE), or 2'-O--N-methylacetamido (2'-O-NMA) modified, locked nucleic acid (LNA), ethylene nucleic acid (ENA), peptide nucleic acid (PNA), 1', 5'-anhydrohexitol nucleic acids (HNA), morpholino, methylphosphonate nucleotides, thiolphosphonate nucleotides, or 2'-fluoro N3-P5'-phosphoramidites. The fluorescently labeled probe can comprise DNA probe, RNA probe, protein probe, or a combination thereof. The fluorescently labeled probe can comprise a locked nucleic acid probe, a peptide nucleic acid (PNA) probe, an oligonucleotide, an oligopaint, an ECHO probe, a molecular beacon probe, a toe-hold probe, a TALE probe, a ZFN probe, or a CRISPR probe. The fluorescently labeled probe can further be crosslinked to the regulatory element. The fluorescently labeled probe can further comprise at least one conjugating moiety. The conjugating moiety can be attached at the 5' terminus, 3' terminus, or at an internal site. The conjugating moiety can comprise a hapten group. The hapten group can be a biotin. The conjugating moiety can be a conjugating functional group. The conjugating functional group can be an azido group or an alkyne group. The fluorescently labeled probe can be designed based on Primer3 algorithm. The fluorescently labeled probe can be further optimized to reduce off-target binding activity. The cell sample can be further treated after incubation with the fluorescently labeled probe. The cell sample can be fixed. The fixation condition can comprise alcohol-based or formaldehyde-based fixatives. The cell sample can be denatured. The denaturing agent can comprise formamide or ethylene carbonate. The cell sample can be cryopreserved. The cell sample can be a fresh cell sample. The cell sample can comprise cells obtained from blood, urine, stool, saliva, lymph fluid, cerebrospinal fluid, synovial fluid, cystic fluid, ascites, pleural effusion, amniotic fluid, chorionic villus sample, vaginal fluid, interstitial fluid, buccal swab sample, sputum, bronchial lavage, Pap smear sample, or ocular fluid. The cell sample can comprise cells obtained from a blood sample, an aspirate sample, or a smear sample. The cell sample can be a circulating tumor cell sample. The circulating tumor cell sample can comprise lymphoma cells, fetal cells, apoptotic cells, epithelia cells, endothelial cells, stem cells, progenitor cells, mesenchymal cells, osteoblast cells, osteocytes, hematopoietic stem cells, foam cells, adipose cells, transcervical cells, circulating cardiocytes, circulating fibrocytes, circulating cancer stem cells, circulating myocytes, circulating cells from kidney, circulating cells from gastrointestinal tract, circulating cells from lung, circulating cells from reproductive organs, circulating cells from central nervous system, circulating hepatic cells, circulating cells from spleen, circulating cells from thymus, circulating cells from thyroid, circulating cells from an endocrine gland, circulating cells from parathyroid, circulating cells from pituitary, circulating cells from adrenal gland, circulating cells from islets of Langerhans, circulating cells from pancreas, circulating cells from hypothalamus, circulating cells from prostate tissues, circulating cells from breast tissues, circulating cells from circulating retinal cells, circulating ophthalmic cells, circulating auditory cells, circulating epidermal cells, circulating cells from the urinary tract, or combinations thereof. The cell sample can be a peripheral blood mononuclear cell sample. The cell sample can comprise cells obtained from a biopsy sample. The cell sample can be a cancerous cell sample.
[0008] In certain aspects, provided herein is a method of site specific labeling of a cell sample for visualization, the method comprising: a) incubating a plurality of cells on a coverslip with a crosslinking agent to fix the plurality of cells on the coverslip; b) contacting the fixed cells with a permeabilizing agent to enable permealization of the fixed cells; c) contacting the treated cells of step b) with an endonuclease for a first time sufficient to generate site specific DNA cut sites; d) incubating the plurality of cells of step c) with a solution comprising terminal deoxynucleotide transferase (TdT) and 5-Ethynyl-2'-deoxyuridine 5'-triphosphate (5-EdUTP) for a second time sufficient to generate a plurality of 5-EdUTP labeled DNA; and e) derivatizing the plurality of 5-EdUTP labeled DNA with an azide tagged fluorophore for visualization. The endonuclease can be DNase I. The first time sufficient to generate the site specific DNA cut sites can be at least 1 minute, 2 minutes, 3 minutes, 4 minutes, 5 minutes, 10 minutes, 15 minutes, 20 minutes, 30 minutes, or more. The second time sufficient to generate a plurality of 5-EdUTP labeled DNA can be at least 5 minutes, 10 minutes, 15 minutes, 20 minutes, 30 minutes, 40 minutes, 50 minutes, 1 hour, 1.5 hour, 2 hours, or more. The crosslinking agent can be formaldehyde. The permeabilizing agent can be NP-40. The method can further comprise a washing step after each of step a), step b), step c), step d) and step e). The method can further comprise coating the coverslip with cells prior to step a). The cells can be obtained from a cancer sample. The cells can be obtained from a tissue sample, a blood sample, an aspirate sample, or a smear sample. The cells can be A549. The fluorophore can comprise Cy3, Cy5, Cy5.5, Cy7, Q570, Alexa488, Alexa555, Alexa594, Alexa647, Alexa680, Alexa 750, Alexa 790, Atto488, Atto532, Atto647N, TexasRed, CF610, Propidium iodide, Q670, IRDye700, IRDye800, Indocyanine green, Pacific Blue dye, Pacific Green dye, or Pacific Orange dye. The coverslip can be incubated at 37.degree. C.
BRIEF DESCRIPTION OF THE DRAWINGS
[0009] Various aspects of the invention are set forth with particularity in the appended claims. A better understanding of the features and advantages of the present invention will be obtained by reference to the following detailed description that sets forth illustrative embodiments, in which the principles of the invention are utilized, and the accompanying drawings of which:
[0010] FIG. 1 represents a conceptual illustration of methods described herein.
[0011] FIG. 2 illustrates a conceptual schematic of an exemplary computer server to be used for processing a method described herein.
[0012] FIG. 3A shows a two color SPDM image (experimental) of chromatin (blue) with DNA sensitive element sites (red), showing anti-colocalization of the DNA sensitive element sites with chromatin. Scale bars: 1000 nm, inserts: 100 nm. The bottom right panel shows chromatin (blue), the middle right panel shows DNA sensitive element sites (red), and the top right panel shows the overlay and the anti-colocalization of the DNA sensitive element with chromatin. FIG. 3B is the inset of FIG. 3A.
[0013] FIG. 4A and FIG. 4B illustrate the localization precision and nearest neighbor distances for DNA and DNase sensitive elements.
[0014] FIG. 5A and FIG. 5B illustrate multi-omics imaging via encoding of molecular information with ssDNA tags. FIG. 5A shows a schematic of simultaneous labeling and multiplexed imaging of mRNA and protein targets with multicolor QDots via DNA encoding. In general, each molecular target is encoded by target-specific ssDNA-tagged affinity molecule (e.g., an antibody, aptamer, oligonucleotide, etc.). The resulting array of target-bound ssDNA tags can be sequentially or simultaneously labeled by complementary imaging probes, enabling multiplexed imaging of all targets of interest (e.g., via fluorescence microscopy with hyperspectral imaging, HSI). FIG. 5B shows an exemplary multiplexed labeling of GAPDH and HSP90-alpha mRNA and corresponding proteins with QDots. DNA encoding methodology enables ssDNA tagging of mRNA targets via in situ hybridization and protein targets via immunorecognition by antibody-ssDNA bioconjugates. All ssDNA tags were simultaneously converted into distinctive optical signals by hybridization with complementary QDot-ssDNA' probes. Fluorescence microscopy with hyperspectral imaging (HIS) was employed for cell imaging and 4 individual QDot channels were unmixed. Individual grayscale channels were false-colored and merged into a composite 4-color image. Scale bar, 50 .mu.m.
[0015] FIG. 6 shows a workflow for target encoding and labeling via in situ hybridization, immunorecognition, and multi-omics procedures. DNA encoding methodology allows for labeling of different types of targets (mRNA and proteins in this proof-of-concept study) under conditions optimized for selective target binding in separate steps. As a result, all targets are converted into a uniform array of intermediate ssDNA tags, which are then simultaneously labeled by complementary QDot-ssDNA' probes for multiplexed imaging.
[0016] FIG. 7A and FIG. 7B illustrate a schematic and characterization of QDot-ssDNA probe preparation. FIG. 7A shows amine crosslinking by a homobifunctional reagent BS3 used for covalent conjugation of 5' amine-terminated ssDNA oligonucleotides and PEG-coated amine-functionalized QDots. ssDNA is activated by an excess BS3, purified by desalting, and reacted with QDots overnight. QDot-ssDNA probes are purified from excess unbound ssDNA by ultrafiltration. Agarose gel electrophoresis in FIG. 7B shows an increase in QDot gel motility upon conjugation of negatively-charged ssDNA oligonucleotides, confirming successful preparation of QDot-ssDNA probes.
[0017] FIG. 8A and FIG. 8B show a schematic and characterization of antibody-ssDNA bioconjugate preparation via maleimide-mediated crosslinking. FIG. 8A shows rabbit anti-mouse IgG is partially reduced by treatment with TCEP to expose sulfhydryl groups for ssDNA conjugation. At the same time, 5' amine-terminated ssDNA oligonucleotides are activated by sulfo-SMCC. Mixing and a 4-hour incubation of activated ssDNA with reduced IgG yields 1/2IgG-ssDNA bioconjugates. PAGE analysis of bioconjugation products in FIG. 8B confirmed formation of primarily 1/2IgG with one ssDNA along with smaller fractions of 1/2IgG conjugated to two and three ssDNA tags.
[0018] FIG. 9 illustrates evaluation of a 6-color QDot panel for protein labeling via DNA encoding. FIG. 9A shows specific staining of .beta.-tubulin via incubation with mouse anti-.beta.-tubulin primary antibody and ssDNA-conjugated rabbit anti-mouse secondary antibody followed by immuno-labeling with anti-rabbit QDot655-2'Ab probes preserved functionality of 2'Ab-ssDNA bioconjugates. Consistent .beta.-tubulin staining achieved via hybridization with complementary QDot-ssDNA probes in FIG. 9B confirmed successful preparation of a functional 6-color QDot-ssDNA panel. A lack of non-specific binding in FIG. 9C by QDot-ssDNA probes in control experiments that skipped incubation with primary and secondary antibodies corroborates the utility of such probes for highly specific target labeling via DNA encoding. True-color images for target staining (FIG. 9B) vs. control (FIG. 9C) were obtained at consistent exposure time for each QDot color. Scale bar, 50 .mu.m.
[0019] FIG. 10A, FIG. 10B, and FIG. 10C show a schematic and characterization of antibody-ssDNA bioconjugate preparation using the Thunder-Link oligo conjugation system. A 2-step amine crosslinking strategy as illustrated in FIG. 10A was employed for preparation of covalent antibody-ssDNA bioconjugates with intact IgG. Antibody and 5' amine-terminated ssDNA were simultaneously activated by respective activation reagents, purified via desalting, and reacted overnight, producing IgG with varying number of attached ssDNA tags. The reducing PAGE analysis of FIG. 10B highlights the presence of multiple higher-MW bands corresponding to heavy and light chains conjugated to varying number of ssDNA tags. In the four reaction conditions performed with goat anti-rabbit secondary antibodies, the relative volume ratios of activated IgG to ssDNA were 1) 50+50, 2) 50+30, 3) 50+20, and 4) 50+10. As expected, increasing amount of ssDNA in the reaction leads to more ssDNA tags being conjugated to each IgG molecule. In FIG. 10C, the staining of Lamin A via incubation with rabbit anti-Lamin A primary antibody and goat anti-rabbit 2'Ab-ssDNA bioconjugates followed by labeling with QDot605-ssDNA' probes confirmed the preserved specificity of ssDNA-tagged antibodies and successful antibody-ssDNA bioconjugation. At the same time, increasing non-specific binding by 2'Ab-ssDNA bioconjugates was observed with increasing number of ssDNA tags per IgG in a control experiment in which incubation with primary antibody was skipped. Thus, a volume ratio of Ab:ssDNA=2:1 in Thunder-Link reaction is considered optimal. All true-color images were obtained at consistent exposure for direct comparison of staining intensity. Scale bar, 250 .mu.m.
[0020] FIG. 11A, FIG. 11B, FIG. 11C, FIG. 11D, and FIG. 11E show multiplexed protein labeling via DNA encoding with a panel of 1' antibody-ssDNA bioconjugates. Primary antibodies against HSP90-alpha, GAPDH, Lamin A, and .beta.-tubulin were conjugated to ssDNA tags using Thunder-Link oligo conjugation system. Reducing PAGE shows consistent formation of IgG-ssDNA bioconjugates for all antibodies (FIG. 11A). Conventional 2-step immunofluorescence with unmodified antibodies and QDot565-2'Ab probes shows characteristic staining pattern for the 4 proteins of interest (FIG. 11B). Protein labeling in FIG. 11C with 1'Ab-ssDNA bioconjugates and QDot565-2'Ab probes yielded staining patterns consistent with the unmodified antibodies of FIG. 11B, confirming the preservation of antigen-binding functionality of 1'Ab-ssDNA. Single-color staining with 1'Ab-ssDNA bioconjugates and complementary QDot-ssDNA' probes further corroborates successful ssDNA conjugation and preparation of an antibody-ssDNA panel suitable for protein labeling via DNA encoding (FIG. 11D). Multiplexed staining via DNA encoding yielded consistent staining patterns for all four proteins in respective spectral channels of the same hyperspectral image (HSI) (FIG. 11E). Individual grayscale channels were false-colored for clarity. Scale bar, 50 .mu.m.
[0021] FIG. 12 shows characterization of mRNA labeling intensity and specificity via DNA encoding. GAPDH mRNA was labeled via indirect FISH procedure with 41nt FISH probe set (see Table 2) followed by staining with QDot605-ssDNA probes (left panels) or AlexaFluor555-labeled streptavidin-ssDNA probes (right panels). Consistent characteristic punctuate staining pattern was observed with both complementary imaging probes (top row). At the same time, non-complementary probes (bottom row) failed to hybridize to mRNA in situ hybridization (ISH) probes, confirming staining specificity of the DNA encoding methodology. "Match" and "mismatch" true-color images were obtained at consistent exposure for direct comparison of staining intensity. Scale bar, 50 .mu.m.
[0022] FIG. 13A, FIG. 13B, FIG. 13C, and FIG. 13D illustrates the effect of a dsDNA spacer in an in situ hybridization (ISH) probe on mRNA labeling intensity. Physical separation of mRNA-recognition and QDot-binding portions of 41nt ssDNA ISH probes with a 16 bp dsDNA spacer prevents formation of secondary structures, promotes hybridization to target mRNA, and reduces steric hindrance to QDot binding. As a result, a substantial increase in mRNA staining intensity was realized with such probes (FIG. 13A) in comparison to 41nt ssDNA FISH probes (FIG. 13B). At the same time, longer 60nt ssDNA probes without pre-hybridized dsDNA spacers experienced greater degree of secondary structure formation, which interfered with mRNA and QDot binding and failed to produce robust mRNA staining (FIG. 13C) above non-specific QDot binding levels (FIG. 13D). All images were obtained with HSI and normalized for direct comparison of signal intensity. Scale bar, 50 .mu.m.
[0023] FIG. 14 shows multi-omics QDot staining via DNA encoding. Protein and mRNA targets were encoded with ssDNA tags in separate steps, each using conditions optimal for binding of a specific target type. Consequently, DNA sequence code was converted into an optical signal by hybridization with complementary QDot-ssDNA probes. Specifically, GAPDH mRNA was labeled with a 41nt in situ hybridization (ISH) probe set followed by labeling of .beta.-tubulin with Ab-ssDNA bioconjugates. Finally, both ssDNA tags were simultaneously hybridized with respective QDot-ssDNA' probes. Clear microtubule staining pattern of .beta.-tubulin (false-colored green) and punctuate pattern of GAPDH mRNA (false-colored red) were observed in dual-labeled specimen (top row), whereas only .beta.-tubulin staining was present in a control specimen that was not hybridized with GAPDH FISH probe set (bottom row). Nuclei were counter-stained with DAPI (false-colored blue). Scale bar, 100 .mu.m.
[0024] FIG. 15 illustrates the heterogeneity in GAPDH RNAi following forward transfection with siRNA. Cells were seeded into a 24-well plate, allowed to attach, grown overnight, and then transfected with GAPDH siRNA (or non-targeting control siRNA) for 24 hrs. GAPDH mRNA was encoded via in situ hybridization (ISH) with mRNA ISH probes and then labeled with QDot605-ssDNA' probes. Imaging of different areas within the well highlights heterogeneity in GAPDH knock-down, likely resulting from heterogeneity in cell transfection with siRNA. Specifically, complete GAPDH mRNA degradation was observed throughout cells in the well center (top right panel), whereas cells at the crowded well edge still expressed regular levels of GAPDH mRNA (bottom right panel) consistent with GAPDH expression in cells transfected with control siRNA (left panels). Substantial number of non-transfected cells might explain an average silencing efficiency of 78% as determined by RT-PCR. Insets: control experiments showed lack of QDot non-specific binding in the absence of complementary ssDNA probes. All images were obtained with true-color camera at the same exposure time for direct comparison of signal intensity. Scale bar, 250 .mu.m.
[0025] FIG. 16 illustrates the heterogeneity in GAPDH RNAi following reverse transfection with siRNA. Cells were mixed with GAPDH siRNA (or non-targeting control siRNA) in suspension and then seeded to 24-well plate for transfection and growth for 24 hrs. GAPDH mRNA was encoded via in situ hybridization (ISH) with mRNA ISH probes and then labeled with QDot605-ssDNA' probes. As evident from imaging of different areas within the well, reverse transfection achieved a more uniform transfection and GAPDH knock-down compared to forward transfection (see FIG. 12). Complete GAPDH mRNA degradation was observed throughout majority of cells, with only occasional colonies with full GAPDH expression forming from non-transfected cells, which is consistent with an improved average silencing efficiency of 95% as determined by RT-PCR. Insets: control experiments showed lack of QDot non-specific binding in the absence of complementary ssDNA probes. All images were obtained with true-color camera at the same exposure time for direct comparison of signal intensity. Scale bar, 250 .mu.m.
[0026] FIG. 17 shows the comparison of RNAi effect on GAPDH mRNA expression following forward vs. reverse transfection with siRNA. Both transfection methods had no effect on GAPDH expression when non-targeting control siRNA was used (left panels) and yielded efficient GAPDH knock-down with GAPDH-targeting siRNA (middle panels), as evident from the lack of mRNA staining above non-specific QDot background (right panels). At the same time, small fraction of cells failed to get transfected and, as a result, expressed normal levels of GAPDH mRNA consistent with control experiments. This observation corroborates an all-on/all-off effect of RNAi regardless of the transfection method used. All images were obtained with hyperspectral imaging (HIS) and were normalized for direct comparison of signal intensity. Scale bar, 50 .mu.m.
[0027] FIG. 18 shows assessment of heterogeneity in cell transfection with siRNA. Dual-labeling of GAPDH and HSP90-alpha mRNA with QDots enables direct visualization of siRNA transfection effect at a single-cell level. Cells were either grown under regular culture conditions (FIG. 18A, FIG. 18B, and FIG. 18C), transfected with control non-targeting siRNA (FIG. 18D, FIG. 18E, and FIG. 18F), or transfected with GAPDH-targeting siRNA (FIG. 18G, FIG. 18H, and FIG. 18I). After a 24-hour treatment with GAPDH siRNA, the majority of cells had completely degraded GAPDH mRNA, as evident from the lack of GAPDH mRNA staining (FIG. 18G). At the same time, HSP90-alpha mRNA not targeted by RNAi machinery remained unperturbed (FIG. 18H). Interestingly, a single cell in the field of view failed to transfect with GAPDH siRNA (FIG. 18G, FIG. 18H, and FIG. 18I), expressing regular levels of GAPDH mRNA consistent with cells treated with control siRNA (FIG. 18D, FIG. 18E, and FIG. 18F) and reference cells not transfected with siRNA (FIG. 18A, FIG. 18B, and FIG. 18C), suggesting an all-on/all-off effect of RNAi. Dual-color images were obtained with hyperspectral imaging (HIS) and were unmixed in QDot channels. Panels for individual channels (FIG. 18A, FIG. 18B, FIG. 18D, FIG. 18E, FIG. 18G, and FIG. 18H) were normalized for direct comparison of signal intensity. In merged 2-color images (FIG. 18C, FIG. 18F, and FIG. 18I) The GAPDH channel was false-colored green and the HSP90-alpha channel was false-colored red. Scale bar, 50 .mu.m.
[0028] FIG. 19 shows assessment of GAPDH RNAi heterogeneity at mRNA and protein levels with multi-omics imaging. Dual labeling of GAPDH mRNA and protein 24 hrs post-transfection with GAPDH-targeting siRNA highlights heterogeneity in mRNA expression levels (bottom left panel) along with the lack of RNAi effect on the protein level (bottom middle panel) at this time point. Transfection with non-targeting control siRNA (top row) failed to affect GAPDH expression, yielding uniform mRNA and protein staining throughout all cells. Dual-color images were obtained with hyperspectral imaging (HSI), and individual channels were normalized for direct comparison of signal intensity. The GAPDH mRNA channel was false-colored red and the GAPDH protein channel was false-colored green in a composite 2-color image. Scale bar, 50 .mu.m.
[0029] FIG. 20A and FIG. 20B show assessment of disparity in RNAi kinetics at mRNA and protein levels. HeLa cells were transfected with GAPDH siRNA for 24 hours (FIG. 20A) and 48 hours (FIG. 20B). GAPDH and HSP90-alpha mRNA, along with corresponding proteins, were simultaneously assessed with QDot-based multi-omics imaging methodology. Consistent with mRNA-only analysis, multi-omics imaging highlights complete and selective degradation of GAPDH mRNA 24 hours post-transfection, whereas GAPDH protein level remained nearly unperturbed (FIG. 20A). Lagging mRNA knock-down 48 hours post-transfection selective degradation of GAPDH protein was observed (FIG. 20B). All grayscale images were normalized to HSP90 protein channel for direct comparison of staining intensities. In a merged 4-color image the GAPDH protein channel was false-colored yellow, the HSP90-alpha protein channel was false-colored blue, the GAPDH mRNA channel was false-colored green, and the HSP90-alpha mRNA channel was false-colored red. Scale bar, 50 .mu.m.
[0030] FIG. 21A and FIG. 21B show multi-omics evaluation of GAPDH and HSP90-alpha expression at mRNA and protein levels under regular cell culture conditions. To provide a reference of normal GAPDH and HSP90 expression levels to RNAi experiments, cells were grown under regular cell culture conditions for 24 hrs (FIG. 21A) and 48 hrs (FIG. 21B). All targets of interest were labeled via a 2+2 encoding procedure to produce a 4-plex staining. Consistent with expected fast growth of HeLa cells, cell density increased with time. However, GAPDH and HSP90 expression remained constant through 48 hrs of incubation, as evident from consistent intensity of mRNA and protein labeling. Multiplex images were obtained with hyperspectral imaging (HIS), and individual channelsw were normalized for direct comparison of signal intensity. The GAPDH mRNA channel was false-colored green, the HSP90 mRNA channel was false-colored red, the GAPDH protein channel was false-colored yellow, and the HSP90 protein channel was false-colored blue in a composite 4-color image. Scale bar, 50 .mu.m.
[0031] FIG. 22A and FIG. 22B show multi-omics evaluation of GAPDH and HSP90-alpha expression at mRNA and protein levels following transfection with a control (non-targeting) siRNA. To assess an effect of transfection on molecular expression profiles in reference to GAPDH RNAi experiments, cells were reverse transfected with non-targeting control siRNA for (FIG. 22A) 24 hrs and (FIG. 22B) 48 hrs. All targets of interest were labeled via a 2+2 encoding procedure to produce a 4-plex staining. Consistent with expected lack of RNAi with control siRNA, GAPDH and HSP90 expression remained constant through 48 hrs of incubation, as evident from consistent intensity of mRNA and protein labeling. Multiplex images were obtained with hyperspectral imaging (HSI), and individual channels were normalized for direct comparison of signal intensity. The GAPDH mRNA channel was false-colored green, the HSP90 mRNA channel was false-colored, the GAPDH protein channel was false-colored yellow, and the HSP90 protein channel was false-colored blue in a composite 4-color image. Scale bar, 50 .mu.m.
[0032] FIG. 23A and FIG. 23B show direct visualization of the effect and kinetics of GAPDH RNAi via single-plex labeling of individual protein and mRNA targets. To eliminate any potential effect of multi-omics labeling methodology and artifacts of hyperspectral (HSI) analysis, the GAPDH RNAi sample along with a reference sample and a control sample were performed on separate specimens in parallel (different wells of the same 24-well plate), followed by a single-plex labeling of individual targets and direct true-color imaging under consistent imaging conditions. Cells were reverse transfected for 24 hrs (FIG. 23A) and 48 hrs (FIG. 23B) prior to fixation and staining. Consistent with multi-omics analysis, single-plex imaging confirmed efficient and specific degradation of GAPDH mRNA within 24 hrs post-transfection, whereas the RNAi effect on GAPDH protein level can be observed only 48 hrs post-transfection. Scale bar, 50 .mu.m.
[0033] FIG. 24 shows the labeling of DNaseI cut sites in a cell's nucleus using a terminal deoxynucleotidyl transferase dUTP nick end labeling (TUNEL) assay.
DETAILED DESCRIPTION OF THE INVENTION
[0034] Cellular activation and extinction patterns can encode information on cell identity, maturation state, cellular memory, and disease state. Tissues are composites of cells which can have one or more morphologically distinct cell types. In some instances, all of the cells in a tissue are processed simultaneously, yielding compounded information with limited sensitivity for cellular activities and/or rare cell types. Alternative approaches employ disaggregation and sorting of tissue components but in the process can destroy cellular architecture and potentially introduce artifacts such as biological stressors and perturbations.
[0035] Described herein are methods of detecting a cellular regulatory element in situ utilizing a super-resolution microscopy technique to determine the presence, absence, and/or activity of a regulatory element. Also described herein are methods of detecting different types of regulatory elements simultaneously utilizing a heterogeneous set of detection agents, and translating the molecular information from the different types of regulatory elements to determine the activity state of a cell. The activity state of a cell may correlate to a localization, expression level, and/or interaction state of a regulatory element. One or more of the methods described herein may further interpolate 2-dimensional images to generate 3-dimensional maps which enable detection of localization, interaction states, and activity of one or more regulatory elements. Intrinsic properties such as size, intensity, and location of a detection agent further may enable detection of a regulatory element. Described herein are methods of determining the localization of a regulatory element and measuring the activity of a regulatory element. The methods provided herein may avoid the introduction of artifacts such as biological stressors and perturbations or destroys cellular architecture. Exemplary properties associated with the methods described herein are illustrated in FIG. 1.
[0036] One or more methods described herein may detect different types of regulatory elements, distinguish between different types of regulatory elements, and/or generate a map of a regulatory element (e.g., chromatin). For example, a regulatory element may be labeled by one or more different types of detection agents. The one or more different types of detection agents may include DNA detection agents, RNA detection agents, protein detection agents, or combinations thereof. The detection agent may comprise a probe portion, which may interact (e.g., hybridize) to a target site within the regulatory element, and optionally comprise a detectable moiety. The detectable moiety may include a fluorophore, such as a fluorescent dye or a quantum dot. The detection agent may be an unlabeled probe which can be further conjugated to an additional labeled probe. Upon labeling, the regulatory element may be detected by stochastic or deterministic super-resolution microscopy method. The stochastic super-resolution microscopy method may be a synthetic aperture optics (SAO) method. The SAO method may generate a detection profile, which can encompass fluorescent signal intensity, size, shape, or localization of the detection agent. Based on the detection profile, the activity state, the localization, expression level, and/or interaction state of the regulatory element may be determined. A map based on the detection profile of the regulatory element may also be generated, and may be correlated to cell type identification (e.g., cancerous cell identification). The regulatory element may be further analyzed in the presence of an exogenous agent or condition, such as a small molecule fragment or a drug, or under an environment such as a change in temperature, pH, nutrient, or a combination thereof. The perturbation of the activity state of the regulatory element in the presence of the exogenous agent or condition may be measured. A report may further be generated and provided to a user, such as a laboratory clinician or health care provider.
Types of Regulatory Elements
[0037] A regulatory element may be DNA, RNA, a polypeptide, or a combination thereof. A regulatory element may be DNA. A regulatory element may be RNA. A regulatory element may be a polypeptide. A regulatory element may be any combination of DNA, RNA, and/or polypeptide (e.g., protein-protein complexes, protein-DNA/RNA complexes, and the like).
[0038] A regulatory element may be DNA. A regulatory element may be a single-stranded DNA regulatory element, a double-stranded DNA regulatory element, or a combination thereof. The DNA regulatory element may be single-stranded. The DNA regulatory element may be double-stranded. The DNA regulatory element may encompass a DNA fragment. The DNA regulatory element may encompass a gene. The DNA regulatory element may encompass a chromosome. The DNA regulatory element may include endogenous DNA regulatory elements (e.g., endogenous genes). The DNA regulatory element may include artificial DNA regulatory elements (e.g., foreign genes introduced into a cell).
[0039] A regulatory element may be RNA. A regulatory element may be a single-stranded RNA regulatory element, a double-stranded RNA regulatory element, or a combination thereof. The RNA regulatory element may be single-stranded. The RNA regulatory element may be double-stranded. The RNA regulatory element may include endogenous RNA regulatory elements. The RNA regulatory element may include artificial RNA regulatory elements. The RNA regulatory element may include microRNA (miRNA), transfer RNA (tRNA), ribosomal RNA (rRNA), messenger RNA (mRNA), pre-mRNA, transfer-messenger RNA (tmRNA), heterogeneous nuclear RNA (hnRNA), short interfering RNA (siRNA), or short hairpin RNA (shRNA). The RNA regulatory element may be a RNA fragment. The RNA regulatory element may be an anti-sense RNA.
[0040] An RNA regulatory element may be an enhancer RNA (eRNA). An enhancer RNA may be a non-coding RNA molecule transcribed from an enhancer region of a DNA molecule, and may be from about 50 base-pairs (bp) in length to about 3 kilo base pairs in length (e.g., about 100 bp in length, about 200 bp in length, about 500 bp in length, about 1 kb in length, about 1.5 kb in length, about 2 kb in length, or about 2.5 kb in length). An enhancer RNA may be a 1D eRNA or an eRNA that may be unidirectionally transcribed. An enhancer RNA may also be a 2D eRNA or an eRNA that may be bidirectionally transcribed. An eRNA may be polyadenylated. Alternatively, an eRNA may be non-polyadenylated.
[0041] A regulatory element may be a DNaseI hypersensitive site (DHS). DHS may be a region of chromatin unoccupied by transcription factors and which is sensitive to cleavage by the DNase I enzyme. The presence of DHS regions within a chromatin may demarcate transcription factory occupancy at a nucleotide resolution. The presence of DHS regions may further correlate with activation of cis-regulatory elements, such as an enhancer, promoter, silencer, insulator, or locus control region. DHS variation may be correlated to variation in gene expression in healthy or diseased cells (e.g., cancerous cells) and/or correlated to phenotypic traits.
[0042] A DHS pattern may encode memory of prior cell fate decisions and exposures. For example, upon differentiation, a DHS pattern of a progeny may encode transcription factor occupancy of its parent. Further, a DHS pattern of a cell may encode an environmentally-induced transcription factor occupancy from an earlier time point.
[0043] A DHS pattern may encode cellular maturity. An embryonic stem cell may encode a set of DHSs that may be transmitted combinatorially to a differentiated progeny, and this set of DHSs may be decreased with each cycle of differentiation. As such, the set of DHSs may be correlated with time, thereby allowing a DHS pattern to be correlated with cellular maturity.
[0044] A DHS pattern may also encode splicing patterns. Protein coding exons may be occupied by transcription factors, which may further be correlated with codon usage patterns and amino acid choice on evolutionary time scales and human fitness. A transcription factory occupancy may further modulate alternative splicing patterns, for example, by imposing sequence constraints at a splice junction. As such, a DHS pattern may encode transcription factor occupancy of one or more exons of interest and may provide additional information on alternative splicing patterns.
[0045] A DHS pattern may encode a cell type. For example, within each cell type, about 100,000 to about 250,000 DHSs may be detected. About 5% of the detected DHSs may be located within a transcription start site and the remaining DHSs may be detected at a distal site from the transcription start site. Each cell type may contain a distinct DHS pattern at the distal site and mapping the DHS pattern at the distal site may allow identification of a cell type. An overlap may further be present within two DHS patterns from two different cell types, for example, an overlap of a set of detected DHSs within the two DHS patterns. An overlap may be less than about 70%, less than about 65%, less than about 60%, less than about 55%, less than about 50%, less than about 45%, less than about 40%, less than about 35%, less than about 30%, less than about 25%, less than about 20%, less than about 15%, less than about 10%, less than about 9%, less than about 8%, less than about 7%, less than about 6%, less than about 5%, less than about 4%, less than about 3%, less than about 2%, or less than about 1% of the detected DHSs. The presence of an overlap may not affect the identification of a cell type.
[0046] A regulatory element may be a polypeptide. The polypeptide may be a protein or a polypeptide fragment. For example, a regulatory element may be a transcription factor, DNA-binding protein or functional fragment, RNA-binding protein or functional fragment, protein involved in chemical modification (e.g., involved in histone modification), or gene product. A regulatory element may be a transcription factor. A regulatory element may be a DNA or RNA-binding protein or functional fragment. A regulatory element may be a product of a gene transcript. A regulatory element may be a chromatin.
Methods of Detecting a Regulatory Element
[0047] Described herein is a method of detecting a regulatory element. The detection may encompass identification of the regulatory element, determining the presence or absence of the regulatory element, and/or determining the activity of the regulatory element. A method of detecting a regulatory element may include contacting a cell sample with a detection agent, binding the detection agent to the regulatory element, and analyzing a detection profile from the detection agent to determine the presence, absence, or activity of the regulatory element.
[0048] The method may involve utilizing one or more intrinsic properties associated with a detection agent to aid in detection of the regulatory element. The intrinsic properties may encompass the size of the detection agent, the intensity of the signal, and the location of the detection agent. The size of the detection agent may include the length of the probe and/or the size of the detectable moiety (e.g., the size of a fluorescent dye molecule) may modulate the specificity of interaction with a regulatory element. The intensity of the signal from the detection agent may correlate to the sensitivity of detection. For example, a detection agent with a molar extinction coefficient of about 0.5-5.times.10.sup.6 M.sup.-1cm.sup.-1 may have a higher intensity signal relative to a detection agent with a molar extinction coefficient outside of the 0.5-5.times.10.sup.6 M.sup.-1cm.sup.-1 range and may have lower attenuation due to scattering and absorption. Further, a detection agent with a longer excited state lifetime and a large Stoke shift (measured by the distance between the excitation and emission peaks) may further improve the sensitivity of detection. The location of the detection agent may, for example, provide the activity state of a regulatory element. A combination of intrinsic properties of the detection agent may be used to detect a regulatory element of interest.
[0049] A detection agent may comprise a detectable moiety that is capable of generating a light, and a probe portion that is capable of hybridizing to a target site on a regulatory element. As described herein, a detection agent may include a DNA probe portion, an RNA probe portion, a polypeptide probe portion, or a combination thereof. Sometimes, a DNA or RNA probe portion may be between about 10 and about 100 nucleotides in length, between about 15 and about 100 nucleotides in length, between about 20 and about 100 nucleotides in length, between about 20 and about 80 nucleotides in length, between about 20 and about 60 nucleotides in length, between about 25 and about 55 nucleotides in length, between about 30 and about 50 nucleotides in length, between about 15 and about 80 nucleotides in length, between about 15 and about 60 nucleotides in length, between about 20 and about 40 nucleotides in length, or between about 20 and about 30 nucleotides in length. Sometimes, a DNA or RNA probe portion can be about 10, about 15, about 20, about 21, about 22, about 23, about 24, about 25, about 26, about 27, about 28, about 29, about 30, about 31, about 32, about 33, about 34, about 35, about 36, about 37, about 38, about 39, about 40, about 45, about 50, about 55, about 60, about 65, about 70, about 80, about 90, about 100, or more nucleotides in length. A DNA or RNA probe portion may be a TALEN probe, ZFN probe, or a CRISPR probe. A DNA or RNA probe portion may be a padlock probe. A polypeptide probe may comprise a DNA-binding protein, a RNA-binding protein, a protein involved in the transcription/translation process, a protein that detects the transcription/translation process, a protein that can detect an open or relaxed portion of a chromatin, or a protein interacting partner of a product of a regulatory element (e.g., an antibody or binding fragment thereof).
[0050] A detection agent may comprise a DNA or RNA probe portion which can be between about 10 and about 100 nucleotides in length, between about 15 and about 100 nucleotides in length, between about 20 and about 100 nucleotides in length, between about 20 and about 80 nucleotides in length, between about 20 and about 60 nucleotides in length, between about 25 and about 55 nucleotides in length, between about 30 and about 50 nucleotides in length, between about 15 and about 80 nucleotides in length, between about 15 and about 60 nucleotides in length, between about 20 and about 40 nucleotides in length, or between about 20 and about 30 nucleotides in length. A detection agent may comprise a DNA or RNA probe portion which may be about 10, about 15, about 20, about 21, about 22, about 23, about 24, about 25, about 26, about 27, about 28, about 29, about 30, about 31, about 32, about 33, about 34, about 35, about 36, about 37, about 38, about 39, about 40, about 45, about 50, about 55, about 60, about 65, about 70, about 80, about 90, about 100, or more nucleotides in length.
[0051] A detection agent may comprise a DNA or RNA probe selected from a TALEN probe, a ZFN probe, or a CRISPR probe.
[0052] A set of detection agents may be used to detect a regulatory element. The set of detection agents may comprise about 2, about 3, about 4, about 5, about 6, about 7, about 8, about 9, about 10, about 11, about 12, about 13, about 14, about 15, about 16, about 17, about 18, about 19, about 20, about 25, about 30, about 35, about 40, about 45, about 50, or more detection agents. Each of the detection agents within the set of detection agents may recognize and interact with a distinct region of a regulatory element. Sometimes, about 1, about 2, about 3, about 4, about 5, about 6, about 7, about 8, about 9, about 10, about 11, about 12, about 13, about 14, about 15, about 16, about 17, about 18, about 19, about 20, or more detection agents may be used for detection of a regulatory element. About 1 or more detection agents may be used for detection of a regulatory element. About 2 or more detection agents may be used for detection of a regulatory element. About 3 or more detection agents may be used for detection of a regulatory element. About 4 or more detection agents may be used for detection of a regulatory element. About 5 or more detection agents as used for detection of a regulatory element. About 6 or more detection agents may be used for detection of a regulatory element. About 7 or more detection agents may be used for detection of a regulatory element. About 8 or more detection agents may be used for detection of a regulatory element. About 9 or more detection agents may be used for detection of a regulatory element. About 10 or more detection agents may be used for detection of a regulatory element. About 11 or more detection agents may be used for detection of a regulatory element. About 12 or more detection agents may be used for detection of a regulatory element. About 13 or more detection agents may be used for detection of a regulatory element. About 14 or more detection agents may be used for detection of a regulatory element. About 15 or more detection agents may be used for detection of a regulatory element. About 20 or more detection agents may be used for detection of a regulatory element.
[0053] A detection agent may comprise a polypeptide probe selected from a DNA-binding protein, a RNA-binding protein, a protein involved in the transcription/translation process, a protein that detects the transcription/translation process, a protein that can detect an open or relaxed portion of a chromatin, or a protein interacting partner of a product of a regulatory element (e.g., an antibody or binding fragment thereof).
[0054] A detectable moiety that is capable of generating a light may be directly conjugated or bound to a probe portion. A detectable moiety may be indirectly conjugated or bound to a probe portion by a conjugating moiety. As described herein, a detectable moiety may be a small molecule (e.g., a dye) which may be directly conjugated or bound to a probe portion. A detectable moiety may be a fluorescently labeled protein or molecule which may be attached to a conjugating moiety (e.g., a hapten group, an azido group, an alkyne group) of a probe.
[0055] A profile or a detection profile or signature may include the signal intensity, signal location, or size of the signal of the detection agent. The profile or the detection profile may comprise about 100 image frames, about 500 frames, about 1000 frames, about 2000 frames, about 5000 frames, about 10,000 frames, about 20,000 frames, about 30,000 frames, about 40,000 frames, about 50,000 frames, or more frames. Analysis of the profile or the detection profile may determine the activity of the regulatory element. The degree of activation may also be determined from the analysis of the profile or detection profile. Analysis of the profile or the detection profile may further determine the optical isolation and localization of the detection agents, which may correlate to the localization of the regulatory element.
[0056] In additional cases, a detection agent can comprise a polypeptide probe selected from a DNA-binding protein, a RNA-binding protein, a protein involved in the transcription/translation process or detects the transcription/translation process, a protein that can detect an open or relaxed portion of a chromatin, or a protein interacting partner of a product of a regulatory element (e.g., an antibody or binding fragment thereof).
[0057] Sometimes, a detectable moiety that is capable of generating a light is directly conjugated or bound to a probe portion. Other times, a detectable moiety is indirectly conjugated or bound to a probe portion by a conjugating moiety. As described elsewhere herein, a detectable moiety can be a small molecule (e.g., a dye) which can be directly conjugated or bound to a probe portion. Alternatively, a detectable moiety can be a fluorescently labeled protein or molecule which can be attached to a conjugating moiety (e.g., a hapten group, an azido group, an alkyne group) of a probe.
[0058] In some instances, a profile or a detection profile or signature can include the signal intensity, signal location, or size of the signal of the detection agent. Sometimes, the profile or the detection profile can comprise about 100 frames, 500 frames, 1000 frames, 2000 frames, 5000 frames, 10,000 frames, 20,000 frames, 30,000 frames, 40,000 frames, 50,000 frames or more images. Analysis of the profile or the detection profile can determine the activity of the regulatory element. In some cases, the degree of activation can also be determined from the analysis of the profile or detection profile. In additional cases, analysis of the profile or the detection profile can further determine the optical isolation and localization of the detection agents, which can correlate to the localization of the regulatory element.
Detection of DNA and/or RNA Regulatory Elements
[0059] A regulatory element may be DNA. Described herein is a method of detecting a DNA regulatory element, which may include contacting a cell sample with a detection agent, binding the detection agent to the DNA regulatory element, and analyzing a profile from the detection agent to determine the presence, absence, or activity of the DNA regulatory element.
[0060] A regulatory element may be RNA. Described herein is a method of detecting a RNA regulatory element, which may include contacting a cell sample with a detection agent, binding the detection agent to the RNA regulatory element, and analyzing a profile from the detection agent to determine the presence, absence, or activity of the RNA regulatory element.
[0061] A regulatory element may be an enhancer RNA (eRNA). The presence of an eRNA may correlate to an activated regulatory element. For example, the production of an eRNA may correlate to the transcription of a target gene. As such, the detection of an eRNA element may indicate that a target gene downstream of the eRNA element may be activated.
[0062] Provided herein is a method of detecting an eRNA regulatory element, which may include contacting a cell sample with a detection agent, binding the detection agent to the eRNA regulatory element, and analyzing a profile from the detection agent to determine the presence, absence, or activity of the eRNA regulatory element. Described herein is an in situ method of detecting an activated regulatory DNA site, which may include incubating a sample with a set of detection agents (e.g., fluorescently-labeled probes), hybridizing the set of detection agents to at least one enhancer RNA (eRNA), and analyzing a profile (e.g., a fluorescent profile) from the set of detection agents to determine the presence of an eRNA, in which the presence of eRNA correlates to an activated regulatory DNA site.
Detection of a DNaseI Hypersensitive Site, Generation of a DNaseI Hypersensitive Site Map, and Determination of a Cell Type Based on a DNaseI Hypersensitive Site Profile
[0063] A regulatory element may be a DNaseI hypersensitive site (DHS). A DNaseI hypersensitive site may be an inactivated DNaseI hypersensitive site. A DNaseI hypersensitive site may be an activated DNaseI hypersensitive site. Described herein is a method of detecting a DHS, which may include contacting a cell sample with a detection agent, binding the detection agent to the DHS, and analyzing a profile from the detection agent to determine the presence, absence, or activity of the DHS.
[0064] The DHS may be an active DHS and may further contain a single stranded DNA region. The single stranded DNA region may be detected by S1 nuclease. A method of detecting a DHS may further be extended to detect the presence of a single stranded DNA region within a DHS. Such a method, for example, may comprise contacting a cell sample with a detection agent, binding the detection agent to a single stranded region of a DHS, and analyzing a profile from the detection agent to determine the presence or absence of the single stranded region within a DHS.
[0065] Also described herein is a method of determining the activity level of a regulatory element, which may include incubating a cell sample with a set of detection agents (e.g., fluorescently labeled probes), in which each detection agent hybridizes to a DHS, measuring a signature (e.g., a fluorescent signature) from the set of detection agents, and based on the signature, determining a DHS profile, and comparing the DHS profile with a control, in which a correlation with the control indicates the activity level of the regulatory element in the cell sample. The signature (e.g., the fluorescent signature) may further correlate to a signal intensity (or a peak height). A set of signal intensities may be compiled into a DHS profile and compared with a control to generate a second DHS profile which comprises a set of relative signal intensities (or relative peak heights). The set of relative signal intensities may correlate to the activity level of a regulatory element.
[0066] Also described herein is a method of generating a DHS map, which may provide information on cell-to-cell variation in gene expression, memory of early developmental fate decisions which establish lineage hierarchies, quantitation of embryonic stem cell DHS sites which decreases with cell passage, and presence of oncogenic elements.
[0067] The location of a set of DHS sites may be correlated to a cell type. For example, the location of about 1, about 5, about 10, about 15, about 20, about 25, about 30, about 35, about 40, about 45, about 50, about 55, about 60, or more DHS sites may be correlated to a cell type. The location of about 1, about 5, about 10, about 15, about 20, about 25, about 30, about 35, about 40, about 45, about 50, about 55, about 60, or more DHS may be used to determine a cell type. The cell may be a normal cell or a cancerous cell. DHS variation may be used to determine the presence of cancerous cells in a sample. A method of determining a cell type (e.g., a cancerous cell) may include incubating a cell sample with a set of detection agents (e.g., fluorescently labeled probes), in which each detection agent hybridizes to a DHS, measuring a signature (e.g., a fluorescent signature) from the set of detection agents, and based on the signature, determining a DHS profile, and comparing the DHS profile with a control, in which a correlation with the control indicates the cell type of the sample.
[0068] A DHS site may be visualized through a terminal deoxynucleotidyl transferase (TdT) dUTP Nick-End labeling (TUNEL) assay. A TUNEL assay may utilize a terminal deoxynucleotidyl transferase (TdT) which may catalyze the addition of a dUTP at the site of a nick or strand break. A fluorescent moiety may further be conjugated to dUTP. A TUNEL assay may be utilized for visualization of a plurality of DHSs present in a cell. A TUNEL assay may be an assay as described in EXAMPLE 2.
[0069] The sequence of a DHS site may be detected in situ, by utilizing an in situ sequencing methodology. For example, the two ends of a padlock probe may be hybridized to a target regulatory element sequence and the two ends may be further ligated together by a ligase (e.g., T4 ligase) when bound to the target sequence. An amplification (e.g., a rolling circle amplification or RCA) may be performed utilizing a polymerase (e.g., .phi.29 polymerase), which may result in a single stranded DNA comprising at least about 1, at least about 2, at least about 3, at least about 4, at least about 5, at least about 6, at least about 7, at least about 8, at least about 9, at least about 10, or more tandem copies of the target sequence. The amplified product at least about be sequenced by ligation in situ using partition sequencing compatible primers and labeled probes (e.g., fluorescently labeled probes). For example, each target sequence within the amplified product may bind to a primer and probe set resulting in a bright spot detectable by, e.g., an immunofluorescence microscopy. The labeled probe (e.g., the fluorescent label on the probe) may identify the nucleotide at the ligation site, thereby allowing the color detected to define the nucleotide at the respective ligation position. Sometimes, at least 1, at least 2, at least 3, at least 4, at least 5, at least 6, at least 7, at least 8, at least 9, at least 10, at least 15, at least 20, or more rounds of ligation and detection may occur for detection of a DHS site.
[0070] A control as used herein may refer to a DHS profile generated from a regulatory element those activity level is known. A control may also refer to a DHS profile generated from an inactivated regulatory element. A control may further refer to a DHS profile generated from an activated or inactivated regulatory element from a specific cell type. For example, the cell type may be an epithelial cell, connective tissue cell, muscle cell, or nerve cell type. The cell may be a cell derived from heart, lung, kidney, stomach, intestines, liver, pancreas, brain, esophagus, and the like. The cell type may be a hormone-secreting cell, such as a pituitary cell, a gut and respiratory tract cell, thyroid gland cell, adrenal gland cell, Leydig cell of testes, Theca interna cell of ovarian follicle, Juxtaglomerular cell, Macula densa cell, Peripolar cell, or Mesangial cell type. The cell may be a blood cell or a blood progenitor cell. The cell may be an immune system cell, e.g., monocytes, dendritic cell, neutrophile granulocyte, eosinophil granulocyte, basophil granulocyte, hybridoma cell, mast cell, helper T cell, suppressor T cell, cytotoxic T cell, Natural Killer T cell, B cell, or natural killer cell.
Detection and Mapping of a Chromatin
[0071] A regulatory element may also be a chromatin. Provided herein is a method of detecting a chromatin, which may include contacting a cell sample with a detection agent, binding the detection agent to the chromatin, and analyzing a profile from the detection agent to determine the activity state of the chromatin. The activity level of a chromatin may be determined based on the presence or activity level of a nucleic acid of interest or the presence or absence of a chromatin associated protein. The activity level of a chromatin may be determined based on DHS locations. The one or more DHS locations on a chromatin may be used to map chromatin activity state. For example, one or more DHSs may be localized in a region and the surrounding chromatin may be decompacted and readily visualized relative to an inactive chromatin state when a DHS is not present. The one or more DHSs within a localized region may further form a localized DHS set and a plurality of localized DHS sets may further provide a global map or pattern of chromatin activity (e.g., an activity pattern).
[0072] Also included herein is a method of generating a chromatin map based on the pattern of DNaseI hypersensitive sites, RNA regulatory elements (e.g., eRNA), chromatin associated proteins or gene products, or a combination thereof. The method of generating a chromatin map may be based on the pattern of DNaseI hypersensitive sites. The method may comprise generating a 3-dimensional map from a detection profile (or a 2-dimensional detection profile). A chromatin map may provide information on the compaction of chromatin, the spatial structure, spacing of regulatory elements, and localization of the regulatory elements to globally map chromatin structure and accessibility.
[0073] A chromatin map for a cell type may also be generated, in which each cell type comprises a different chromatin pattern. Each cell type may be associated with at least one unique marker. The at least one unique marker (or fiduciary marker) may be a genomic sequence. The at least one unique marker (or fiduciary marker) may be DHS. A cell type may comprise about 5, about 10, about 15, about 20, about 25, about 30, about 35, about 40, about 45, about 50, about 60, or more unique markers (or fiduciary markers). The cell type may be an epithelia cell, a connective tissue cell, a muscle cell, a nerve cell, a hormone-secreting cell, a blood cell, an immune system cell, or a stem cell type. The cell type may be a cancerous cell type.
[0074] A chromatin profile (e.g., based on DHSs) in the presence of an exogenous agent or condition may also be generated. The method may comprise incubating a cell sample with a set of fluorescently labeled probes specific to target sites (e.g., target DHSs) on a chromatin in the presence of an exogenous agent or condition; measuring a fluorescent signature of the set of fluorescently labeled probes; based on the fluorescent signature, generating a fluorescent profile of the chromatin; and comparing the fluorescent profile with a second fluorescent profile of a chromatin obtained from an equivalent sample incubated with an equivalent set of fluorescently labeled probes in the absence of the exogenous agent or condition, wherein a difference between the two sets of fluorescent profiles indicates a change in the chromatin density (e.g., changes in the presences or activation of DHSs) induced by the exogenous agent or condition. The exogenous agent or condition may comprise a small molecule or a drug. The exogenous agent may be a small molecule, such as a steroid. The exogenous agent or condition may comprise an environmental factor, such as a change in pH, temperature, nutrient, or a combination thereof.
Methods of Determining the Localization of a Regulatory Element
[0075] Also described herein is a method for determining the localization of a regulatory element. The localization of a regulatory element may provide an activity state of the regulatory element. The localization of a regulatory element may also provide an interaction state with at least one additional regulatory element. For example, the localization of a first regulatory element with respect to a second regulatory element may provide spatial coordinate and distance information between the two regulatory elements, and v further provide information regarding whether the two regulatory elements can interact with each other. The activity state of a regulatory element may include, for example, a transcription or translation initiation event, a translocation event, or an interaction event with one or more additional regulatory elements. The regulatory element may comprise DNA, RNA, polypeptides, or a combination thereof. The regulatory element may be DNA. The regulatory element may be RNA. The regulatory element may be an enhancer RNA (eRNA). The regulatory element may be a DNaseI hypersensitive site (DHS). The DHS may be an inactive DHS or an active DHS. The regulatory element may be a polypeptide. The regulatory element may be chromatin.
[0076] A detection agent may comprise a detectable moiety that is capable of generating a light, and a probe portion that is capable of hybridizing to a target site on a regulatory element. Each detection agent within the first set of detection agents may have the same or a different detectable moiety. Each detection agent within the first set of detection agents may have the same detectable moiety. A detectable moiety may comprise a small molecule (e.g., a fluorescent dye). A detectable moiety may comprise a fluorescently labeled polypeptide, a fluorescently labeled nucleic acid probe, and/or a fluorescently labeled polypeptide complex.
[0077] The concentration of the detection agents may be from about 5 nM to about 1 .mu.M. The concentration of the detection agent can be from about 5 nM to about 900 nM, from about 10 nM to about 800 nM, from about 15 nM to about 700 nM, from about 20 nM to about 500 nM, from about 10 nM to about 500 nM, from about 10 nM to about 400 nM, from about 10 nM to about 300 nM, from about 10 nM to about 200 nM, from about 10 nM to about 100 nM, from about 50 nM to about 500 nM, from about 50 nM to about 400 nM, from about 50 nM to about 300 nM, from about 50 nM to about 200 nM, from about 100 nM to about 500 nM, from about 100 nM to about 300 nM, or from about 100 nM to about 200 nM. The concentration of the detection agents can be about 10 nM, about 15 nM, about 20 nM, about 30 nM, about 40 nM, about 50 nM, about 60 nM, about 70 nM, about 80 nM, about 90 nM, about 100 nM, about 150 nM, about 200 nM, about 250 nM, about 300 nM, about 400 nM, about 500 nM, about 600 nM, about 700 nM, about 800 nM, about 900 nM, or more.
[0078] The burst of lights from the set of detection agents may generate a detection profile. The detection profile may comprise about 100 image frames, about 500 frames, about 1000 frames, about 2000 frames, about 5000 frames, about 10,000 frames, about 20,000 frames, about 30,000 frames, about 40,000 frames, about 50,000 frames, or more. The detection profile may also include the signal intensity, signal location, or size of the signal. Analysis of the detection profile may determine the optical isolation and localization of the detection agents, which can correlate to the localization of the regulatory element.
[0079] The detection profile may comprise a chromatic aberration correction. The detection profile can comprise less than 5%, less than 4%, less than 3%, less than 2%, less than 1%, less than 0.5%, less than 0.1%, or 0% chromatic aberration. The detection profile may comprise less than 5% chromatic aberration. The detection profile may comprise less than 4% chromatic aberration. The detection profile may comprise less than 3% chromatic aberration. The detection profile may comprise less than 2% chromatic aberration. The detection profile may comprise less than 1% chromatic aberration. The detection profile may comprise less than 0.5% chromatic aberration. The detection profile may comprise less than 0.1% chromatic aberration. The detection profile may comprise 0% chromatic aberration.
[0080] More than one regulatory element can be detected at the same time. At least 2, at least 3, at least 4, at least 5, at least 6, at least 7, at least 8, at least 9, at least 10, at least 15, at least 20, or more regulatory elements may be detected at the same time. Each of the regulatory elements may be detected by a set of detection agents. The detectable moiety between the different set of detection agents may be the same. For example, two different sets of detection agents may be used to detect two different regulatory elements and the detectable moieties from the two sets of detection agents may be the same. As such, at least 2, at least 3, at least 4, at least 5, at least 6, at least 7, at least 8, at least 9, at least 10, at least 15, at least 20, or more regulatory elements may be detected at the same time at the same wavelength. Sometimes, the detectable moiety between the different set of detection agents may also be different. For example, two different sets of detection agents may be used to detect two different regulatory elements and the detectable moiety from one set of detection agents may be detected at a different wavelength from the detectable moiety of the second set of detection agents. As such, at least 2, at least 3, at least 4, at least 5, at least 6, at least 7, at least 8, at least 9, at least 10, at least 15, at least 20, or more regulatory elements may be detected at the same time in which each of the regulatory elements can be detected at a different wavelength. The regulatory element may comprise DNA, RNA, polypeptides, or a combination thereof.
Methods of Measuring the Activity of a Regulatory Element
[0081] Also described herein is a method of measuring the activity of a target regulatory element. The method may include detection of a regulatory element and one or more products of the regulatory element. One or more products of the regulatory element may also include intermediate products or elements. The method may comprise contacting a cell sample with a first set and a second set of detection agents, in which the first set of detection agents interact with a target regulatory element within the cell and the second set of detection agents interact with at least one product of the target regulatory element, and analyzing a detection profile from the first set and the second set of detection agents, in which the presence or the absence of the at least one product indicates the activity of the target regulatory element.
[0082] As discussed herein, a detection agent may comprise a detectable moiety that is capable of generating a light, and a probe portion that is capable of hybridizing to a target site on a regulatory element. Each detection agent within the first set of detection agents may have the same or a different detectable moiety. Each detection agent within the first set of detection agents can have the same detectable moiety. A detectable moiety may comprise a small molecule (e.g., a fluorescent dye). A detectable moiety may comprise a fluorescently labeled polypeptide, a fluorescently labeled nucleic acid probe, and/or a fluorescently labeled polypeptide complex.
[0083] The regulatory element may comprise DNA, RNA, polypeptides, or a combination thereof. The regulatory element may be DNA. The regulatory element may be RNA. The regulatory element may be an enhancer RNA (eRNA). The presence of an eRNA may correlate with target gene transcription that is downstream of eRNA. The regulatory element may be a DNaseI hypersensitive site (DHS). The DHS may be an activated DHS. The pattern of the DHS on a chromatin may correlate to the activity of the chromatin. The regulatory element may be a polypeptide, e.g., a transcription factor, a DNA or RNA-binding protein or binding fragment thereof, or a polypeptide that is involved in chemical modification. The regulatory element may be chromatin.
Detection Agents
[0084] Detection agents described herein may include a probe portion. The probe portion may include a probe, or a combination of probes. The probe portion may comprise a nucleic acid molecule, a polypeptide, or a combination thereof. The detection agents may further include a detectable moiety. The detectable moiety may comprise a fluorophore. A fluorophore may be a molecule that can absorb light at a first wavelength and transmit or emit light at a second wavelength. A fluorophore may be a small molecule (e.g., a dye) or a fluorescent polypeptide. A detectable moiety may be a fluorescent small molecule (e.g., a dye). A detectable moiety may not contain a fluorescent polypeptide.
Probes
[0085] As described herein, a probe portion may comprise a probe or a combination of probes. A probe may be a nucleic acid probe, a polypeptide probe, or a combination thereof A probe portion may be an unconjugated probe that does not contain a detectable moiety. A probe portion may be a conjugated probe which comprises a single probe with a detectable moiety, or two or more probes in which at least one probe may be an unconjugated probe bound to at least a second probe which comprises a detectable moiety.
[0086] A probe may be a nucleic acid probe. The nucleic acid probe may be a DNA probe, a RNA probe, or a combination thereof. The nucleic acid probe may be a DNA probe. The nucleic acid probe may be a RNA probe. The nucleic acid probe may be a double stranded nucleic acid probe, a single stranded nucleic acid probe, or may contain single-stranded and/or double stranded portions. The nucleic acid probe may further comprise overhangs on one or both termini, may further comprises blunt ends on one or both termini, or may further form a hairpin.
[0087] The nucleic acid probe may be at least 10, at least 15, at least 20, at least 21, at least 22, at least 23, at least 24, at least 25, at least 26, at least 27, at least 28, at least 29, at least 30, at least 31, at least 32, at least 33, at least 34, at least 35, at least 36, at least 37, at least 38, at least 39, at least 40, at least 45, at least 50, at least 55, at least 60, at least 65, at least 70, at least 80, at least 90, at least 100, or more nucleotides in length. The nucleic acid probe may be about 10, about 15, about 20, about 21, about 22, about 23, about 24, about 25, about 26, about 27, about 28, about 29, about 30, about 31, about 32, about 33, about 34, about 35, about 36, about 37, about 38, about 39, about 40, about 45, about 50, about 55, about 60, about 65, about 70, about 80, about 90, or about about 100 nucleotides in length. The nucleic acid probe may be about 20 nucleotides in length. The nucleic acid probe may be about 21 nucleotides in length. The nucleic acid probe may be about 22 nucleotides in length. The nucleic acid probe may be about 23 nucleotides in length. The nucleic acid probe may be about 24 nucleotides in length. The nucleic acid probe may be about 25 nucleotides in length. The nucleic acid probe may be about 26 nucleotides in length. The nucleic acid probe may be about 27 nucleotides in length. The nucleic acid probe may be about 28 nucleotides in length. The nucleic acid probe may be about 29 nucleotides in length. The nucleic acid probe may be about 30 nucleotides in length. The nucleic acid probe may be about 31 nucleotides in length. The nucleic acid probe may be about 32 nucleotides in length. The nucleic acid probe may be about 33 nucleotides in length. The nucleic acid probe may be about 34 nucleotides in length. The nucleic acid probe may be about 35 nucleotides in length. The nucleic acid probe may be about 36 nucleotides in length. The nucleic acid probe may be about 37 nucleotides in length. The nucleic acid probe may be about 38 nucleotides in length. The nucleic acid probe may be about 39 nucleotides in length. The nucleic acid probe may be about 40 nucleotides in length. The nucleic acid probe may be about 45 nucleotides in length. The nucleic acid probe may be about 50 nucleotides in length. The nucleic acid probe may be about 55 nucleotides in length. The nucleic acid probe may be about 60 nucleotides in length.
[0088] A nucleic acid probe may be a non-labeled probe, or a probe that does not contain a detectable moiety. A non-labeled probe may further interact with a labeled probe (e.g., a labeled nucleic acid probe). A non-labeled probe may hybridize with a labeled nucleic acid probe. A non-labeled probe may also interact with a labeled polypeptide probe. The labeled polypeptide probe may be a protein that recognizes a sequence within the non-labeled probe. A labeled probe may include a nucleic acid portion and a polypeptide tag portion and the polypeptide tag portion can further interact with a molecule comprising a detectable moiety. For example, a non-labeled probe may be a nucleic acid probe comprising a streptavidin which may interact with a biotinylated molecule comprising a detectable moiety.
[0089] A nucleic acid probe may have about 95%, about 96%, about 97%, about 98%, about 99%, or about 100% sequence specificity or sequence complementarity to a target site of a regulatory element. The hybridization may be a high stringent hybridization condition.
[0090] A nucleic acid probe may hybridize with a genomic sequence that is present in low or single copy numbers (e.g., genomic sequences that are not repetitive elements). As used herein, repetitive element refers to a DNA sequence that is present in many identical or similar copies in the genome. Repetitive elements are not intended to refer to a DNA sequence that is present on each copy of the same chromosome (e.g., a DNA sequence that is present only once, but is found on both copies of chromosome 11, would not be considered a repetitive element, and would be considered a sequence that is present in the genuine as one copy). The genome may consist of three broad sequence components: single copy or at least very low copy number DNA (approximately 60% of the human genome); moderately repetitive elements (approximately 30% of the human genome); and highly repetitive elements (approximately 10% of the human genome). For a review, see Human Molecular Genetics, Chapter 7 (1999), John Wiley & Sons, Inc.
[0091] A nucleic acid probe may have reduced off-target interaction. For example, "off-target" or "off-target interaction" may refer to an instance in which a nucleic acid probe against a given target hybridizes or interact with another target site (e.g., a different DNA sequence, RNA sequence, or a cellular protein or other moiety).
[0092] A nucleic acid probe may further be cross-linked to a target site of a regulatory element. For example, the nucleic acid probe may be cross-linked by a photo-crosslinking means such as UV or by a chemical cross-linking means such as by formaldehyde, or through a reactive group within the nucleic acid probe. Reactive group can include sulfhydryl-reactive linkers such as bismaleimidohexane (BMH), and the like.
[0093] A nucleic acid probe may include natural or unnatural nucleotide analogues or bases or a combination thereof. The unnatural nucleotide analogues or bases may comprise modifications at one or more of ribose moiety, phosphate moiety, nucleoside moiety, or a combination thereof. The unnatural nucleotide analogues or bases may comprise 2'-O-methyl, 2'-O-methoxyethyl (2'-O-MOE), 2'-O-aminopropyl, 2'-deoxy, T-deoxy-2'-fluoro, 2'-O-aminopropyl (2'-O-AP), 2'-O-dimethylaminoethyl (2'-O-DMAOE), 2'-O-dimethylaminopropyl (2'-O-DMAP), T-O-dimethylaminoethyloxyethyl (2'-O-DMAEOE), or 2'-O--N-methylacetamido (2'-O-NMA) modified, locked nucleic acid (LNA), ethylene nucleic acid (ENA), peptide nucleic acid (PNA), 5'-anhydrohexitol nucleic acids (HNA), morpholino, methylphosphonate nucleotides, thiolphosphonate nucleotides, or 2'-fluoro N3-P5'-phosphoramidites. The nucleic acid probes may further comprise one or more abasic sites. The abasic site may further be functionalized with a detectable moiety.
[0094] A nucleic acid probe may be a locked nucleic acid probe (e.g., a labeled locked nucleic acid probe), a labeled or unlabeled peptide nucleic acid (PNA) probe, a labeled or unlabeled oligonucleotide, an oligopaint, an ECHO probe, a molecular beacon probe, a padlock (or molecular inversion probe), a labeled or unlabeled toe-hold probe, a labeled TALE probe, a labeled ZFN probe, or a labeled CRISPR probe.
[0095] A nucleic acid probe may be a labeled or unlabeled locked nucleic acid probe or a labeled or unlabeled peptide nucleic acid probe. Locked nucleic acid probes and peptide nucleic acid probes are known to those of skill in the art and are described in Briones et al., Anal Bioanal Chem (2012) 402:3071-3089.
[0096] A nucleic acid probe may be a padlock (or molecular inversion probe). A padlock probe may be hybridized to a target regulatory element sequence in which the two ends may correspond to the target sequence. A padlock probe may be as described herein, which may be ligated together by a ligase (e.g., T4 ligase) when bound to the target sequence. An amplification (e.g., a rolling circle amplification or RCA) may be performed utilizing for example .PHI.29 polymerase, which may result in a single stranded DNA comprising multiple tandem copies of the target sequence.
[0097] A nucleic acid probe may be an oligopaint as described in U.S. Publication No. 2010/0304994; and in Beliveau, et al., "Versatile design and synthesis platform for visualizing genomes with oligopaint FISH probes," PNAS 109(52): 21301-21306 (2012). Oligopaint may refer to detectably labeled polynucleotides that have sequences complementary to an oligonucleotide sequence, e.g., a portion of a DNA sequence e.g., a particular chromosome or sub-chromosomal region of a particular chromosome. Oligopaints may be generated from synthetic probes and arrays that are, optionally, computationally patterned (rather than using natural DNA sequences and/or chromosomes as a template).
[0098] A nucleic acid probe may be a labeled or unlabeled toe-hold probe. Toe-hold probes are known to those of skill in the art as described in Zhang et al., Optimizing the Specificity of Nucleic Acid Hybridization, Nature Chemistry 4: 208-214 (2012).
[0099] A nucleic acid probe may be a molecular beacon. Molecular beacons may be hairpin shaped molecules with an internally quenched fluorophore whose fluorescence is restored when they bind to a target nucleic acid sequence. Molecular beacons are known to those of skill in the art as described in Guo et al., Anal. Bioanal. Chem. (2012) 402:3115-3125.
[0100] A nucleic acid probe may be an ECHO probe. ECHO probes may be sequence-specific, hybridization-sensitive. quencher-free fluorescent probes for RNA detection, which may be designed using the concept of fluorescence quenching caused by intramolecular excitonic interaction of fluorescent dyes. ECHO probes are known to those of skill in the art as described in Kubota et al., PLoS ONE. Vol. 5, Issue 9. e13003 (2010); or Okamoto, Chem. Soc. Rev., 2011, 40, 5815-5828. Wang et al., RNA (2012). 18:166-175.
[0101] A nucleic acid probe may be a CRISPR probe. The CRISPR system may use a Cas9 protein to recognize DNA sequences, in which the target specificity can be solely determined by a small guide (sg) RNA and a protospacer adjacent motif (PAM). Upon binding to target DNA, the Cas9-sgRNA complex may generate a DNA double-stranded break. In instances such as for imaging, a Cas9 protein may be replaced with an endonuclease-deactivated Cas9 (dCas9) protein. For example, for imaging a cell, e.g., by fluorescence in situ hybridization, may be achieved by synthesizing a dCas9 within the cell, synthesizing RNA within the cell to bind genomic DNA and to complex with the dCas9 forming a dCas9/RNA complex, labeling the dCas9/RNA complex, and imaging the labeled dCas9/RNA complex within the live cell bound to genomic DNA. The endonuclease-deactivated Cas9 may be synthesized in vivo by using an integrated construct, a transiently transfected construct, by injection into the cell of a syncitia of nuclei or via electroporation into cells and/or nuclei.
[0102] A nucleic acid probe may comprise an endonuclease-deactivated Cas9 (dCas9) protein as described in Chen et al., "Dynamic imaging of genomic loci in living human cells by an optimized CRISPR/Cas system." Cell 155(7): 1479-1491 (2013); or Ma et al., "Multicolor CRISPR labeling of chromosomal loci in human cells." PNAS 112(10): 3002-3007 (2015). The dCas9 protein may be further labeled with a detectable moiety.
[0103] The RNA of the Cas9/RNA complex may be synthesized in vivo by using an integrated construct, a transiently transfected construct, by injection into the cell of a syncitia of nuclei or via electroporation into cells and/or nuclei. The Cas9/RNA complex may be labeled by making a fusion protein that includes Cas9 and a reporter, by injection of RNA that has been attached to a reporter into the cell or by a syncitia of nuclei including RNA that has been attached to a reporter, by electroporation into cells or nuclei or by indirect labeling of the RNA by hybridization with a labeled secondary oligonucleotide. The label may be a conditional reporter, based on the binding of Cas9/RNA to the target nucleic acid. The label may be quenched and may then be activated upon the Cas9/RNA complex binding to the target nucleic acid.
[0104] A nucleic acid probe may be a TALEN probe. Transcription Activator-Like Effector Nucleases (TALEN) are engineered restriction enzymes generated by fusing the TAL effector DNA binding domain to a FokI DNA cleavage domain. A FokI DNA cleavage domain may comprise an endonuclease-deactivated FokI domain. A nucleic acid probe may be a TALEN probe comprising an endonuclease-deactivated FokI domain.
[0105] A nucleic acid probe may be a zinc-finger nuclease (ZFN) probe. Similar to TALEN, a zinc-finger nuclease may be an engineered restriction enzyme generated by fusing a zinc finger DNA-binding domain to a zinc finger nuclease. A zinc finger nuclease may comprise an endonuclease-deactivated zinc finger nuclease. A nucleic acid probe may be a ZFN probe comprising an endonuclease-deactivated zinc finger nuclease.
[0106] A probe disclosed herein may be a polypeptide probe. A polypeptide probe may include a protein or a binding fragment thereof that interacts with a target site (e.g., a nucleic acid target site or a protein target) of interest. A polypeptide probe may comprise a DNA-binding protein, a RNA-binding protein, a protein involved in the transcription/translation process or detects the transcription/translation process, a protein that can detect an open or relaxed portion of a chromatin, or a protein interacting partner of a product of a regulatory element.
[0107] A polypeptide probe may be a DNA-binding protein. The DNA-binding protein may be a transcription factor that modulates the transcription process, polymerases, or histones. A DNA-binding protein may comprise a zinc finger domain, a helix-turn-helix domain, a leucine zipper domain (e.g., a basic leucine zipper domain), a high mobility group box (HMG-box) domain, and the like. In some instances, the DNA-binding protein interacts with a nucleic acid region in a sequence specific manner. The DNA-binding protein may interact with a nucleic acid region in a sequence non-specific manner. The DNA-binding protein may interact with single-stranded DNA. The DNA-binding protein may interact with double-stranded DNA. The DNA-binding protein probe may further comprise a detectable moiety.
[0108] A polypeptide probe may be a RNA-binding protein. The RNA-binding protein may participate in forming ribunucleoprotein complexes. The RNA-binding protein may modulate post-transcription such as in splicing, polyadenylation, mRNA stabilization, mRNA localization, or in translation. A RNA-binding protein may comprise a RNA recognition motif (RRM), dsRNA binding domain, zinc finger domain, K-Homology domain (KH domain), and the like. The RNA-binding protein may interact with single-stranded RNA. The RNA-binding protein may interact with double-stranded RNA. The RNA-binding protein probe may further comprise a detectable moiety.
[0109] A polypeptide probe may be a protein that can detect an open or relaxed portion of a chromatin. The polypeptide probe may be a modified enzyme that lacks cleavage activity. The modified enzyme may be an enzyme that recognizes double-stranded or single-stranded DNA or RNA. Examples of modified enzymes may include oxidoreductases, transferases, hydrolases, lyases, isomerases, or ligases. A modified enzyme may be an endonuclease (e.g., a deactivated restriction endonuclease such as the TALEN or CRISPR probes described herein).
[0110] A polypeptide probe may be an antibody or binding fragment thereof. The antibody or binding fragment thereof may be a protein interacting partner of a product of a regulatory element. The antibody or binding fragment thereof may comprise a humanized antibody or binding fragment thereof, murine antibody or binding fragment thereof, chimeric antibody or binding fragment thereof, monoclonal antibody or binding fragment thereof, monovalent Fab', divalent Fab2, F(ab)'3 fragments, single-chain variable fragment (scFv), bis-scFv, (scFv)2, diabody, minibody, nanobody, triabody, tetrabody, disulfide stabilized Fv protein (dsFv), single-domain antibody (sdAb), Ig NAR, camelid antibody or binding fragment thereof, or a chemically modified derivative thereof. The antibody or binding fragment thereof may further comprise a detectable moiety.
Detectable Moiety
[0111] A detectable moiety may be a small molecule (e.g., a dye) or a macromolecule. A macromolecule may include polypeptides (e.g., proteins and/or protein fragments), nucleic acids, carbohydrates, lipids, macrocyles, polyphenols, and/or endogenous macromolecule complexes. A detectable moiety may be a small molecule. A detectable moiety may be a macromolecule.
[0112] A detectable moiety may include a moiety that is detectable by a colorimetric method or a fluorescent method. For example, a colorimetric method may be an assay which utilizes reagents that undergo a measurable color change in the presence of an analyte (e.g., an enzyme, an antibody, a compound, a hormone). Exemplary colorimetric methods may include enzyme-mediated detection method such as tyramide signal amplification (TSA) which utilizes horseradish peroxidase (HRP) to generate a signal when digested by tyramide substrate and 3,3',5,5'-Tetramethylbenzidine (TMB) which generates a blue color upon oxidation to 3,3'5,5'-tetramethylbenzidine diamine in the presence of a peroxidase enzyme such as HRP. A detectable moiety described herein may include a moiety that is detectable by a colorimetric method.
[0113] A detectable moiety may also include a moiety that is detectable by a fluorescent method. The detectable moiety may be a fluorescent moiety. A fluorescent moiety may be a small molecule (e.g., a dye) or a fluorescently labeled macromolecule. A fluorescently labeled macromolecule may include a fluorescently labeled polypeptide (e.g., a labeled protein and/or a protein fragment), a fluorescently labeled nucleic acid molecule, a fluorescently labeled carbohydrate, a fluorescently labeled lipid, a fluorescently labeled macrocyle, a fluorescently labeled polyphenol, and/or a fluorescently labeled endogenous macromolecule complex (e.g., a primary antibody-secondary antibody complex).
[0114] A fluorescent small molecule may comprise rhodamine, rhodol, fluorescein, thiofluorescein, aminofluorescein, carboxyfluorescein, chlorofluorescein, methylfluorescein, sulfofluorescein, aminorhodol, carboxyrhodol, chlororhodol, methylrhodol, sulforhodol; aminorhodamine, carboxyrhodamine, chlororhodamine, methylrhodamine, sulforhodamine, thiorhodamine, cyanine, indocarbocyanine, oxacarbocyanine, thiacarbocyanine, merocyanine, cyanine 2, cyanine 3, cyanine 3.5, cyanine 5, cyanine 5.5, cyanine 7, oxadiazole derivatives, pyridyloxazole, nitrobenzoxadiazole, benzoxadiazole, pyren derivatives, cascade blue, oxazine derivatives, Nile red, Nile blue, cresyl violet, oxazine 170, acridine derivatives, proflavin, acridine orange, acridine yellow, arylmethine derivatives, auramine, crystal violet, malachite green, tetrapyrrole derivatives, porphin, phtalocyanine, bilirubin 1-dimethylaminonaphthyl-5-sulfonate, 1-anilino-8-naphthalene sulfonate, 2-p-touidinyl-6-naphthalene sulfonate, 3-phenyl-7-isocyanatocoumarin, N-(p-(2-benzoxazolyl)phenyl)maleimide, stilbenes, pyrenes, 6-FAM (Fluorescein), 6-FAM (NHS Ester), 5(6)-FAM, 5-FAM, Fluorescein dT, 5-TAMRA-cadavarine, 2-aminoacridone, HEX, JOE (NHS Ester), MAX, TET, ROX, TAMRA, TARMA.TM. (NHS Ester), TEX 615, ATTO.TM. 488, ATTO.TM. 532, ATTO.TM. 550, ATTO.TM. 565, ATTO.TM. Rho101, ATTO.TM. 590, ATTO.TM. 633, ATTO.TM. 647N, TYE.TM. 563, TYE.TM. 665, or TYE.TM. 705.
[0115] A fluorescent moiety may comprise Cy3, Cy5, Cy5.5, Cy7, Q570, Alexa488, Alexa555, Alexa594, Alexa647, Alexa680, Alexa 750, Alexa 790, Atto488, Atto532, Atto647N, TexasRed, CF610, Propidium iodide, Q670, IRDye700, IRDye800, Indocyanine green, Pacific Blue dye, Pacific Green dye, or Pacific Orange dye.
[0116] In some instances, a fluorescent moiety may comprise a quantum dot (QD). Quantum dots can be a nanoscale seminconducting photoluminescent material, for example, as described in Alivisatos A. P., "Semiconductor clusters, nanocrystals, and quantum dots," Science 271(5251): 933-937 (1996).
[0117] Exemplary QDs may include, but are not limited to, CdS quantum dots, CdSe quantum dots, CdSe.RTM.CdS core/shell quantum dots, CdSe.RTM.ZnS core/shell quantum dots, CdTe quantum dots, PbS quantum dots, and/or PbSe quantum dots. As used herein, CdSe.RTM.ZnS may mean that a ZnS shell is coated on a CdSe core surface (e.g., "core-shell" quantum dots). The shell materials of core-shell QDs may have a higher bandgap and passivate the core QDs surfaces, resulting in higher quantum yield and higher stability and wider applications than core QDs.
[0118] QDs may absorb a wide spectrum of light, and may be physically tuned with emission bandwidths in various wavelengths. See, e.g., Badolato, et al., Science 208:1158-61 (2005). For example, the emission bandwidth may be in the visible spectrum (e.g., from about 350 nm to about 750 nm), the visible-infrared spectrum (e.g., from about 0.1 .mu.m to about 0.7 .mu.m), or in the near-infrared spectrum (e.g., from about 0.7 .mu.m to about 2.5 .mu.m). QDs that emit energy in the visible range may include, but are not limited to, CdS, CdSe, CdTe, ZnSe, ZnTe, GaP, and GaAs. QDs that emit energy in the blue to near-ultraviolet range may include, but are not limited to, ZnS and GaN. QDs that emit energy in the near-infrared range may include, but are not limited to, InP, InAs, InSb, PbS, and PbSe.
[0119] The radius of a QD may be modulated to manipulate the emission bandwidth. For example, a radius of between about 5 nm and about 6 nm QD may emit wavelengths resulting in emission colors such as orange or red. A radius of between about 2 nm and about 3 nm may emit wavelengths resulting in emission colors such as blue or green.
[0120] The QD may further form a QD microstructure, which may encompass one or more layers of QD. For example, each quantum dot containing layer may comprise a single type of quantum dot of a specific emission color. For example, each layer may be made of any material suitable for use that (a) allows excitation light to reach the quantum dot and allows fluorescence generated from the quantum dot to pass through the layer(s) for detection and (b) may be combined with a quantum dot to form a layer. Examples of materials that may n be used to form layers containing quantum dots may include, but are not limited to, inorganic, organic, or polymeric material, each with or without biodegradable properties, and combinations thereof. The layers may comprise silica-based compounds or polymers. Exemplary silica-based layers may include, but are not limited to, those comprising tetramethoxy silane or tetraethylorthosilicate. Exemplary polymer layers may include, but are not limited to, those comprising polystyrene, poly (methyl methacrylate), polyhydroxyalkanoate, polylactide, or co-polymers thereof.
[0121] The quantum dot may further comprise a spacer layer which serves as a barrier to prevent interactions between different QD layers, and may be made of any material suitable for use that (a) allows excitation light to reach the quantum dots in the quantum dot containing layer(s) below it and allows fluorescence generated from those quantum dots to pass through it and (b) can segregate the quantum dots in one layer from those in other layers. Examples of materials that may be used to form spacer layers are the same as for the quantum dot containing layers.
[0122] The materials used for the quantum dot containing and spacer layers may be the same or different. The same material may be used in the quantum dot containing layers and the spacer layers.
[0123] The quantum dot containing layers and the spacer layers within a given QD molecule may be any thickness and can be varied. For example, thicker QD-containing layers may allow for the loading of increased QDs in the shell, resulting in greater fluorescence intensity for that layer than for a thinner layer containing the same concentration of QDs. Thus, varying layer thickness may facilitate preparing QD-containing layer of various intensities, thereby generating spectrally distinct QD bar codes. The QD-containing layers may be between 5 nm and 500 nm thick; between 10 nm and 500 nm thick; between 5 nm and 100 nm thick, or between 10 nm and 100 nm thick. Those of skill in the art will understand that other methods for varying intensity also exist, for example, modifying concentrations of the same QD in one microstructure with a first unique barcode compared to a second QD microstructure with a different fluorescent barcode. The ability to vary the intensities for the same QD color may allow for an increased number of distinct and distinguishable microstructures (e.g., spectrally distinct barcodes). The spacer layers may be greater than 10 nm thick, up to approximately 5 .mu.m thick, 10 nm to 500 nm thick, or 10 nm to 100 nm thick.
[0124] The quantum dot-containing and spacer layers may be arranged in any order. Examples may include, but are not-limited to, alternating QD-containing layers and spacer layers, or quantum dot containing layers separated by more than one spacer layer. Thus, a "spacer layer" may comprise a single layer, or may comprise two or more such spacer layers.
[0125] The QD microstructure may comprise any number of quantum dot containing layers suitable for use with the microstructure. For example, a microstructure described herein may comprise 2, 3, 4, 5, 6, 7, 8, 9, 10, or more quantum dot-containing layers and an appropriate number of spacer layers based on the number of quantum dot-containing layers. Further, the number of quantum dot containing layers in a given microstructure may range from 1 to "m," where "m" is the number of quantum dots that may be used.
[0126] A defined intensity level may refer to a known amount of quantum dots in each quantum dot containing layer, resulting in a known amount of fluorescent intensity generated from the QD containing layer upon appropriate stimulation. Since each QD containing layer has a defined intensity level, each microstructure may possess a defined ratio of fluorescence intensities generated from the various QD-containing layers upon stimulation. This defined ratio is referred to herein as a barcode. Thus, each type of microstructure with the same QD layers may possess a similar barcode that may be distinguished from microstructures with different QD layers.
[0127] Thus, each quantum dot containing layer may comprise a single type of quantum dot of a specific emission color and the layer is produced to possess a defined intensity level, based on the concentration of the QD in the layer. By varying the intensity levels of QDs ("n") in different microstructures and using a variety of different quantum dots ("m"), the number of different unique barcodes (and thus the number of different unique microstructure populations that can be produced) may be approximated by the equation, (n.sup.m-1) unique codes. This may provide the ability to generate a large number of different populations of microstructures each with its own unique barcode.
[0128] A set of QD-labeled probes may further generate a spectrally distinct barcode. For example, each probe with the set of QD-labeled probes may comprise a QD with a distinct excitation wavelength and the combination of the set can generate a distinct barcode. A set of spectrally distinct QD-labeled probes may be utilized to detect a regulatory element. As such, when detecting two or more regulatory elements, each regulatory element may be spectrally barcoded.
[0129] A quantum dot provided herein may include QDot525, QDot 545, QDot 565, QDot 585, QDot 605, or QDot 655. A probe described herein may comprise a quantum dot. A probe described herein may comprise QDot525, QDot 545, QDot 565, QDot 585, QDot 605, or QDot 655. A probe described herein may comprise QDot525. A probe described herein may comprise QDot 545. A probe described herein may comprise QDot 565. A probe described herein may comprise QDot 585. A probe described herein may comprise QDot 605. A probe described herein may comprise QDot 655.
[0130] A quantum dot may comprise a quantum dot as described in Han et al., "Quantum-dot-tagged microbeads for multiplexed optical coding of biomolecules," Nat. Biotechnol. 19:631-635 (2001); Gao X., "QD barcodes for biosensing and detection," Conf Proc IEEE Eng Med Biol Soc 2009: 6372-6373 (2009); and Zrazhevskiy, et al., "Multicolor multicycle molecular profiling with quantum dots for single-cell analysis," Nat Protoc 8:1852-1869 (2013).
[0131] A QD may further comprise a functional group or attachment moiety. One example of such a QD that has a functional group or attachment moiety is a QD with a carboxylic acid terminated surface, such as those commercially available though, for example, Quantum Dot, Inc., Hayward, Calif.
Conjugating Moiety
[0132] The probe may include a conjugating moiety. The conjugation moiety may be attached at the 5' terminus, the 3' terminus, or at an internal site. The conjugating moiety may be a nucleotide analog, e.g., bromodeoxyuridine. The conjugating moiety may be a conjugating functional group. The conjugating functional group may be an azido group or an alkyne group. The probe may further be derivatived through a chemical reaction such as click chemistry. The click chemistry may be a copper(I)-catalyzed [3+2]-Huisgen 1,3-dipolar cyclo-addition of alkynes and azides leading to 1,2,3-triazoles. The click chemistry may be a copper free variant of the above reaction.
[0133] The conjugating moiety may comprise a hapten group. A hapten group may include digoxigenin, 2,4-dinitrophenyl, biotin, avidin, or are selected from azoles, nitroaryl compounds, benzofurazans, triterpenes, ureas, thioureas, rotenones, oxazoles, thiazoles, coumarins, cyclolignans, heterobiaryl compounds, azoaryl compounds or benzodiazepines. A hapten group may include biotin.
[0134] The probe comprising the conjugating moiety may further be linked to a second probe (e.g., a nucleic acid probe or a polypeptide probe), a fluorescent moiety (e.g., a dye such as a quantum dot), a target regulatory element, or a conjugating partner such as a polymer (e.g., PEG), a macromolecule (e.g., a carbohydrate, a lipid, a polypeptide), and the like.
Samples
[0135] A sample described herein may be a fresh sample or a fixed sample. The sample can be a fresh sample. The sample can be a fixed sample. The sample may be subjected to a denaturing condition. The sample may be cryopreserved.
[0136] The sample may be a cell sample. The cell sample may be obtained from the cells of an animal. The animal cell may include a cell from a marine invertebrate, fish, insects, amphibian, reptile, or mammal. The mammalian cell may be obtained from a primate, ape, equine, bovine, porcine, canine, feline, or rodent. The mammal may be a primate, ape, dog, cat, rabbit, ferret, or the like. The rodent may be a mouse, rat, hamster, gerbil, hamster, chinchilla, or guinea pig. The bird cell may be from a canary, parakeet, or parrot. The reptile cell may be from a turtle, lizard, or snake. The fish cell may be from a tropical fish. For example, the fish cell may be from a zebrafish (e.g., Danino rerio). The worm cell may be from a nematode (e.g., C. elegans). The amphibian cell may be from a frog. The arthropod cell may be from a tarantula or hermit crab.
[0137] The cell sample may be obtained from a mammalian cell. The mammalian cell may be an epithelial cell, connective tissue cell, hormone secreting cell, a nerve cell, a skeletal muscle cell, a blood cell, an immune system cell, or a stem cell.
[0138] Exemplary mammalian cells may include, but are not limited to, 293A cell line, 293FT cell line, 293F cells, 293H cells, HEK 293 cells, CHO DG44 cells, CHO-S cells, CHO-K1 cells, Expi293F.TM. cells, Flp-In.TM. T-REx.TM. 293 cell line, Flp-In.TM.-293 cell line, Flp-In.TM.-3T3 cell line, Flp-In.TM.-BHK cell line, Flp-In.TM.-CHO cell line, Flp-In.TM.-CV-1 cell line, Flp-In.TM.-Jurkat cell line, FreeStyle.TM. 293-F cells, FreeStyle.TM. CHO-S cells, GripTite.TM. 293 MSR cell line, GS-CHO cell line, HepaRG.TM. cells, T-REx.TM. Jurkat cell line, Per.C6 cells, T-REx.TM.-293 cell line, T-REx.TM.-CHO cell line, T-REx.TM.-HeLa cell line, NC-HIMT cell line, and PC12 cell line.
[0139] The cell sample may be obtained from cells of a primate. The primate may be a human, or a non-human primate. The cell sample may be obtained from a human. For example, the cell sample may comprise cells obtained from blood, urine, stool, saliva, lymph fluid, cerebrospinal fluid, synovial fluid, cystic fluid, ascites, pleural effusion, amniotic fluid, chorionic villus sample, vaginal fluid, interstitial fluid, buccal swab sample, sputum, bronchial lavage, Pap smear sample, or ocular fluid. The cell sample may comprise cells obtained from a blood sample, an aspirate sample, or a smear sample.
[0140] The cell sample may be a circulating tumor cell sample. A circulating tumor cell sample may comprise lymphoma cells, fetal cells, apoptotic cells, epithelia cells, endothelial cells, stem cells, progenitor cells, mesenchymal cells, osteoblast cells, osteocytes, hematopoietic stem cells, foam cells, adipose cells, transcervical cells, circulating cardiocytes, circulating fibrocytes, circulating cancer stem cells, circulating myocytes, circulating cells from kidney, circulating cells from gastrointestinal tract, circulating cells from lung, circulating cells from reproductive organs, circulating cells from central nervous system, circulating hepatic cells, circulating cells from spleen, circulating cells from thymus, circulating cells from thyroid, circulating cells from an endocrine gland, circulating cells from parathyroid, circulating cells from pituitary, circulating cells from adrenal gland, circulating cells from islets of Langerhans, circulating cells from pancreas, circulating cells from hypothalamus, circulating cells from prostate tissues, circulating cells from breast tissues, circulating cells from circulating retinal cells, circulating ophthalmic cells, circulating auditory cells, circulating epidermal cells, circulating cells from the urinary tract, or combinations thereof.
[0141] A cell sample may be a peripheral blood mononuclear cell sample.
[0142] A cell sample may comprise cancerous cells. Cancer may be a solid tumor or a hematologic malignancy. The cancerous cell sample may comprise cells obtained from a solid tumor. The solid tumor may include a sarcoma or a carcinoma. Exemplary sarcoma cell sample may include, but are not limited to, cell sample obtained from alveolar rhabdomyosarcoma, alveolar soft part sarcoma, ameloblastoma, angiosarcoma, chondrosarcoma, chordoma, clear cell sarcoma of soft tissue, dedifferentiated liposarcoma, desmoid, desmoplastic small round cell tumor, embryonal rhabdomyosarcoma, epithelioid fibrosarcoma, epithelioid hemangioendothelioma, epithelioid sarcoma, esthesioneuroblastoma, Ewing sarcoma, extrarenal rhabdoid tumor, extraskeletal myxoid chondrosarcoma, extraskeletal osteosarcoma, fibrosarcoma, giant cell tumor, hemangiopericytoma, infantile fibrosarcoma, inflammatory myofibroblastic tumor, Kaposi sarcoma, leiomyosarcoma of bone, liposarcoma, liposarcoma of bone, malignant fibrous histiocytoma (MFH), malignant fibrous histiocytoma (MFH) of bone, malignant mesenchymoma, malignant peripheral nerve sheath tumor, mesenchymal chondrosarcoma, myxofibrosarcoma, myxoid liposarcoma, myxoinflammatory fibroblastic sarcoma, neoplasms with perivascular epitheioid cell differentiation, osteosarcoma, parosteal osteosarcoma, neoplasm with perivascular epitheioid cell differentiation, periosteal osteosarcoma, pleomorphic liposarcoma, pleomorphic rhabdomyosarcoma, PNET/extraskeletal Ewing tumor, rhabdomyosarcoma, round cell liposarcoma, small cell osteosarcoma, solitary fibrous tumor, synovial sarcoma, or telangiectatic osteosarcoma.
[0143] Exemplary carcinoma cell sample may include, but are not limited to, cell sample obtained from anal cancer, appendix cancer, bile duct cancer (i.e., cholangiocarcinoma), bladder cancer, brain tumor, breast cancer, cervical cancer, colon cancer, cancer of Unknown Primary (CUP), esophageal cancer, eye cancer, fallopian tube cancer, gastroenterological cancer, kidney cancer, liver cancer, lung cancer, medulloblastoma, melanoma, oral cancer, ovarian cancer, pancreatic cancer, parathyroid disease, penile cancer, pituitary tumor, prostate cancer, rectal cancer, skin cancer, stomach cancer, testicular cancer, throat cancer, thyroid cancer, uterine cancer, vaginal cancer or vulvar cancer.
[0144] The cancerous cell sample may comprise cells obtained from a hematologic malignancy. A hematologic malignancy may comprise a leukemia, a lymphoma, a myeloma, a non-Hodgkin's lymphoma, or a Hodgkin's lymphoma. The hematologic malignancy may be a T-cell based hematologic malignancy. The hematologic malignancy may be a B-cell based hematologic malignancy. Exemplary B-cell based hematologic malignancies may can include, but are not limited to, chronic lymphocytic leukemia (CLL), small lymphocytic lymphoma (SLL), high risk CLL, a non-CLUSLL lymphoma, prolymphocytic leukemia (PLL), follicular lymphoma (FL), diffuse large B-cell lymphoma (DLBCL), mantle cell lymphoma (MCL), Waldenstrom's macroglobulinemia, multiple myeloma, extranodal marginal zone B cell lymphoma, nodal marginal zone B cell lymphoma, Burkitt's lymphoma, non-Burkitt high grade B cell lymphoma, primary mediastinal B-cell lymphoma (PMBL), immunoblastic large cell lymphoma, precursor B-lymphoblastic lymphoma, B cell prolymphocytic leukemia, lymphoplasmacytic lymphoma, splenic marginal zone lymphoma, plasma cell myeloma, plasmacytoma, mediastinal (thymic) large B cell lymphoma, intravascular large B cell lymphoma, primary effusion lymphoma, or lymphomatoid granulomatosis. Exemplary T-cell based hematologic malignancies may include, but are not limited to, peripheral T-cell lymphoma not otherwise specified (PTCL-NOS), anaplastic large cell lymphoma, angioimmunoblastic lymphoma, cutaneous T-cell lymphoma, adult T-cell leukemia/lymphoma (ATLL), blastic NK-cell lymphoma, enteropathy-type T-cell lymphoma, hematosplenic gamma-delta T-cell lymphoma, lymphoblastic lymphoma, nasal NK/T-cell lymphomas, or treatment-related T-cell lymphomas.
[0145] A cell sample described herein may include a tumor cell line sample. Exemplary tumor cell line sample may include, but are not limited to, cell samples from tumor cell lines: 600MPE, AU565, BT-20, BT-474, BT-483, BT-549, Evsa-T, Hs578T, MCF-7, MDA-MB-231, SkBr3, T-47D, HeLa, DU145, PC3, LNCaP, A549, H1299, NCI-H460, A2780, SKOV-3/Luc, Neuro2a, RKO, RKO-AS45-1, HT-29, SW1417, SW948, DLD-1, SW480, Capan-1, MC/9, B72.3, B25.2, B6.2, B38.1, DMS 153, SU.86.86, SNU-182, SNU-423, SNU-449, SNU-475, SNU-387, Hs 817.T, LMH, LMH/2A, SNU-398, PLHC-1, HepG2/SF, OCI-Ly1, OCI-Ly2, OCI-Ly3, OCI-Ly4, OCI-Ly6, OCI-Ly7, OCI-Ly10, OCI-Ly18, OCI-Ly19, U2932, DB, HBL-1, RIVA, SUDHL2, TMD8, MEC1, MEC2, 8E5, CCRF-CEM, MOLT-3, TALL-104, AML-193, THP-1, BDCM, HL-60, Jurkat, RPMI 8226, MOLT-4, RS4, K-562, KASUMI-1, Daudi, GA-10, Raji, JeKo-1, NK-92, and Mino.
[0146] A cell sample may comprise cells obtained from a biopsy sample.
[0147] The cell samples (e.g., a biopsy sample) may be obtained from an individual by any suitable means of obtaining the sample using well-known and routine clinical methods. Procedures for obtaining tissue samples from an individual are well known. For example, procedures for drawing and processing tissue sample such as from a needle aspiration biopsy are well-known and is employed to obtain a sample for use in the methods provided. Typically, for collection of such a tissue sample, a thin hollow needle is inserted into a mass such as a tumor mass for sampling of cells that, after being stained, will be examined under a microscope.
Imaging Instrumentation
[0148] One or more far-field fluorescence techniques may be utilized for the detection, localization, activity determination, and mapping of one or more regulatory elements described herein. A microscopy method may be a high magnification oil immersion microscopy method. In such method, the wide-field and confocal fluorescent microscopes may achieve sub-cellular resolution. A microscopy method may utilize a super-resolution microscopy, which allows images to be taken with a higher resolution than the diffraction limit. A super-resolution microscopy method may include deterministic super-resolution, which utilizes a fluorophore's nonlinear response to excitation to enhance resolution. Exemplary deterministic super-resolution may include stimulated emission depletion (STED), ground state depletion (GSD), reversible saturable optical linear fluorescence transitions (RESOLFT), and saturated structured illumination microscopy (SSIM). A super-resolution microscopy method may also include stochastic super-resolution, which utilizes a complex temporal behavior of a fluorophore, to enhance resolution. Exemplary stochastic super-resolution method may include Super-resolution optical fluctuation imaging (SOFI), all single-molecular localization method (SMLM) such as spectral precision determination microscopy (SPDM), SPDMphymod, photo-activated localization microscopy (PALM), FPALM, stochastic optical reconstruction microscopy (STORM), and dSTROM.
[0149] A microscopy method may be a single-molecular localization method (SMLM). A microscopy method may be a spectral precision determination microscopy (SPDM) method. A SPDM method may rely on stochastic burst or blinking of fluorophores and subsequent temporal integration of signals to achieve lateral resolution at, for example, between about 10 nm and about 100 nm.
[0150] A microscopy method may be a spatially modulated illumination (SMI) method. A SMI method may utilize phased lasers and interference patterns to illuminate specimens and increase resolution by measuring the signal in fringes of the resulting Moire patterns.
[0151] A microscopy method may be a synthetic aperture optics (SAO) method. A SAO method may utilize a low magnification, low numerical aperture (NA) lens to achieve large field of view and depth of field, without sacrificing spatial resolution. For example, an SAO method may comprise illuminating the detection agent-labeled target (e.g., a regulatory element) with a predetermined number (N) of selective excitation patterns, where the number (N) of selective excitation patterns is determined based upon the detection agent's physical characteristics corresponding to spatial frequency content (e.g., the size, shape, and/or spacing of the detection agents on the imaging target) from the illuminated target, optically imaging the illuminated target at a resolution insufficient to resolve the objects on the target, and processing optical images of the illuminated target using information on the selective excitation patterns to obtain a final image of the illuminated target at a resolution sufficient to resolve the objects on the target. The number (N) of selective excitation patterns may correspond to the number of k-space sampling points in a k-space sampling space in a frequency domain, with the extent of the k-space sampling space being substantially proportional to an inverse of a minimum distance (.DELTA.x) between the objects that is to be resolved by SAO, and with the inverse of the k-space sampling interval between the k-space sampling points being less than a width (w) of a detected area captured by a pixel of a system for said optical imaging. The number (N) may include a function of various parameters of the imaging system (e.g., magnification (Mag) of the objective lens, numerical aperture (NA) of the objective lens, wavelength .lamda..sub.E of the light emitted from the imaging target, and/or effective pixel size p of the pixel sensitive area of the CCD, etc.).
[0152] A SAO method may analyze a set of detection agent profiles from at least 100, at least 200, at least 250, at least 500, at least 1000, or more cells imaged simultaneously within one field of view utilizing an imaging instrument. The one field of view can be a single wide field of view allowing image capture of greater than 100, greater than 200, greater than 250, greater than 500, greater than 1000, or more cells. The single wide field of view may have about 0.70 mm by about 0.70 mm field of view. The SAO imaging instrument may enable a resolution of about 0.25 .mu.m with a 20.times./0.45NA lens. The SAO imaging instrument may enable a depth of field of about 2.72 .mu.m with a 20.times./0.45NA lens. The imaging instrument may enable a working distance of about 7 mm with a 20.times./0.45NA lens. The imaging instrument may enable a z-stack of 1 with a 20.times./0.45NA lens. The SAO method may further integrate and interpolate 3-dimensional images from 2-dimensional images.
[0153] The SAO imaging instrument may be an SAO instrument as described in U.S. Publication No. 2011/0228073 (Lightspeed Genomics, Inc).
Digital Processing Device
[0154] The systems, apparatus, and methods described herein can include a digital processing device, or use of the same. The digital processing device can include one or more hardware central processing units (CPU) that carry out the device's functions. The digital processing device can further comprise an operating system configured to perform executable instructions. In some instances, the digital processing device is optionally connected to a computer network, is optionally connected to the Internet such that it accesses the World Wide Web, or is optionally connected to a cloud computing infrastructure. In other instances, the digital processing device is optionally connected to an intranet. In other instances, the digital processing device is optionally connected to a data storage device.
[0155] In accordance with the description herein, suitable digital processing devices can include, by way of non-limiting examples, server computers, desktop computers, laptop computers, notebook computers, sub-notebook computers, netbook computers, netpad computers, set-top computers, media streaming devices, handheld computers, Internet appliances, mobile smartphones, tablet computers, personal digital assistants, video game consoles, and vehicles. Those of skill in the art will recognize that many smartphones are suitable for use in the system described herein. Those of skill in the art will also recognize that select televisions, video players, and digital music players with optional computer network connectivity are suitable for use in the system described herein. Suitable tablet computers can include those with booklet, slate, and convertible configurations, known to those of skill in the art.
[0156] The digital processing device can include an operating system configured to perform executable instructions. The operating system can be, for example, software, including programs and data, which can manage the device's hardware and provides services for execution of applications. Those of skill in the art will recognize that suitable server operating systems can include, by way of non-limiting examples, FreeBSD, OpenBSD, NetBSD.RTM., Linux, Apple.RTM. Mac OS X Server.RTM., Oracle.RTM. Solaris.RTM., Windows Server.RTM., and Novell.RTM. NetWare.RTM.. Those of skill in the art will recognize that suitable personal computer operating systems include, by way of non-limiting examples, Microsoft.RTM. Windows.RTM., Apple.RTM. Mac OS X.RTM., UNIX.RTM., and UNIX-like operating systems such as GNU/Linux.RTM.. In some cases, the operating system is provided by cloud computing. Those of skill in the art will also recognize that suitable mobile smart phone operating systems include, by way of non-limiting examples, Nokia.RTM. Symbian.RTM. OS, Apple.RTM. iOS.RTM., Research In Motion.RTM. BlackBerry OS.RTM., Google.RTM. Android.RTM., Microsoft.RTM. Windows Phone.RTM. OS, Microsoft.RTM. Windows Mobile.RTM. OS, Linux.RTM., and Palm.RTM. WebOS.RTM.. Those of skill in the art will also recognize that suitable media streaming device operating systems include, by way of non-limiting examples, Apple TV.RTM., Roku.RTM., Boxee.RTM., Google TV.RTM., Google Chromecast.RTM., Amazon Fire.RTM., and Samsung.RTM. HomeSync.RTM.. Those of skill in the art will also recognize that suitable video game console operating systems include, by way of non-limiting examples, Sony PS3.RTM., Sony PS4.RTM., Microsoft.RTM. Xbox 360.RTM., Microsoft Xbox One, Nintendo.RTM. Wii.RTM., Nintendo.RTM. Wii U.RTM., and Ouya.RTM..
[0157] In some instances, the device can include a storage and/or memory device. The storage and/or memory device can be one or more physical apparatuses used to store data or programs on a temporary or permanent basis. In some instances, the device is volatile memory and requires power to maintain stored information. In other instances, the device is non-volatile memory and retains stored information when the digital processing device is not powered. In still other instances, the non-volatile memory comprises flash memory. The non-volatile memory can comprise dynamic random-access memory (DRAM). The non-volatile memory can comprise ferroelectric random access memory (FRAM). The non-volatile memory can comprise phase-change random access memory (PRAM). The device can be a storage device including, by way of non-limiting examples, CD-ROMs, DVDs, flash memory devices, magnetic disk drives, magnetic tapes drives, optical disk drives, and cloud computing based storage. The storage and/or memory device can also be a combination of devices such as those disclosed herein.
[0158] The digital processing device can include a display to send visual information to a user. The display can be a cathode ray tube (CRT). The display can be a liquid crystal display (LCD). Alternatively, the display can be a thin film transistor liquid crystal display (TFT-LCD). The display can further be an organic light emitting diode (OLED) display. In various cases, on OLED display is a passive-matrix OLED (PMOLED) or active-matrix OLED (AMOLED) display. The display can be a plasma display. The display can be a video projector. The display can be a combination of devices such as those disclosed herein.
[0159] The digital processing device can also include an input device to receive information from a user. For example, the input device can be a keyboard. The input device can be a pointing device including, by way of non-limiting examples, a mouse, trackball, track pad, joystick, game controller, or stylus. The input device can be a touch screen or a multi-touch screen. The input device can be a microphone to capture voice or other sound input. The input device can be a video camera or other sensor to capture motion or visual input. Alternatively, the input device can be a Kinect.TM., Leap Motion.TM., or the like. In further aspects, the input device can be a combination of devices such as those disclosed herein.
Non-Transitory Computer Readable Storage Medium
[0160] In some instances, the systems, apparatus, and methods disclosed herein can include one or more non-transitory computer readable storage media encoded with a program including instructions executable by the operating system of an optionally networked digital processing device. In further instances, a computer readable storage medium is a tangible component of a digital processing device. In still further instances, a computer readable storage medium is optionally removable from a digital processing device. A computer readable storage medium can include, by way of non-limiting examples, CD-ROMs, DVDs, flash memory devices, solid state memory, magnetic disk drives, magnetic tape drives, optical disk drives, cloud computing systems and services, and the like. In some cases, the program and instructions are permanently, substantially permanently, semi-permanently, or non-transitorily encoded on the media.
Computer Program
[0161] The systems, apparatus, and methods disclosed herein can include at least one computer program, or use of the same. A computer program includes a sequence of instructions, executable in the digital processing device's CPU, written to perform a specified task. In some embodiments, computer readable instructions are implemented as program modules, such as functions, objects, Application Programming Interfaces (APIs), data structures, and the like, that perform particular tasks or implement particular abstract data types. In light of the disclosure provided herein, those of skill in the art will recognize that a computer program, in certain embodiments, is written in various versions of various languages.
[0162] The functionality of the computer readable instructions can be combined or distributed as desired in various environments. A computer program can comprise one sequence of instructions. A computer program can comprise a plurality of sequences of instructions. In some instances, a computer program is provided from one location. In other instances, a computer program is provided from a plurality of locations. In additional cases, a computer program includes one or more software modules. Sometimes, a computer program can include, in part or in whole, one or more web applications, one or more mobile applications, one or more standalone applications, one or more web browser plug-ins, extensions, add-ins, or add-ons, or combinations thereof.
Web Application
[0163] A computer program can include a web application. In light of the disclosure provided herein, those of skill in the art will recognize that a web application, in various aspects, utilizes one or more software frameworks and one or more database systems. In some cases, a web application is created upon a software framework such as Microsoft.RTM. .NET or Ruby on Rails (RoR). In some cases, a web application utilizes one or more database systems including, by way of non-limiting examples, relational, non-relational, object oriented, associative, and XML database systems. Sometimes, suitable relational database systems can include, by way of non-limiting examples, Microsoft.RTM. SQL Server, mySQL.TM., and Oracle.RTM.. Those of skill in the art will also recognize that a web application, in various instances, is written in one or more versions of one or more languages. A web application can be written in one or more markup languages, presentation definition languages, client-side scripting languages, server-side coding languages, database query languages, or combinations thereof. A web application can be written to some extent in a markup language such as Hypertext Markup Language (HTML), Extensible Hypertext Markup Language (XHTML), or eXtensible Markup Language (XML). In some embodiments, a web application is written to some extent in a presentation definition language such as Cascading Style Sheets (CSS). A web application can be written to some extent in a client-side scripting language such as Asynchronous Javascript and XML (AJAX), Flash.RTM. Actionscript, Javascript, or Silverlight.RTM.. A web application can be written to some extent in a server-side coding language such as Active Server Pages (ASP), ColdFusion.RTM., Perl Java.TM., JavaServer Pages (JSP), Hypertext Preprocessor (PHP), Python.TM., Ruby, Tcl, Smalltalk, WebDNA.RTM., or Groovy. Sometimes, a web application can be written to some extent in a database query language such as Structured Query Language (SQL). Other times, a web application can integrate enterprise server products such as IBM.RTM. Lotus Domino.RTM.. In some instances, a web application includes a media player element. In various further instances, a media player element utilizes one or more of many suitable multimedia technologies including, by way of non-limiting examples, Adobe.RTM. Flash.RTM., HTML 5, Apple.RTM. QuickTime.RTM., Microsoft.RTM. Silverlight.RTM., Java.TM., and Unity.RTM..
Mobile Application
[0164] A computer program can include a mobile application provided to a mobile digital processing device. In some cases, the mobile application is provided to a mobile digital processing device at the time it is manufactured. In other cases, the mobile application is provided to a mobile digital processing device via the computer network described herein.
[0165] In view of the disclosure provided herein, a mobile application is created by techniques known to those of skill in the art using hardware, languages, and development environments known to the art. Those of skill in the art will recognize that mobile applications are written in several languages. Suitable programming languages include, by way of non-limiting examples, C, C++, C#, Objective-C, Java.TM., Javascript, Pascal, Object Pascal, Python.TM., Ruby, VB.NET, WML, and XHTML/HTML with or without CSS, or combinations thereof.
[0166] Suitable mobile application development environments are available from several sources. Commercially available development environments include, by way of non-limiting examples, AirplaySDK, alcheMo, Appcelerator.RTM., Celsius, Bedrock, Flash Lite, .NET Compact Framework, Rhomobile, and WorkLight Mobile Platform. Other development environments are available without cost including, by way of non-limiting examples, Lazarus, MobiFlex, MoSync, and Phonegap. Also, mobile device manufacturers distribute software developer kits including, by way of non-limiting examples, iPhone and iPad (iOS) SDK, Android.TM. SDK, BlackBerry.RTM. SDK, BREW SDK, Palm.RTM. OS SDK, Symbian SDK, webOS SDK, and Windows.RTM. Mobile SDK.
[0167] Those of skill in the art will recognize that several commercial forums are available for distribution of mobile applications including, by way of non-limiting examples, Apple.RTM. App Store, Android.TM. Market, BlackBerry App World, App Store for Palm devices, App Catalog for webOS, Windows.RTM. Marketplace for Mobile, Ovi Store for Nokia.RTM. devices, Samsung.RTM. Apps, and Nintendo.RTM. DSi Shop.
Standalone Application
[0168] A computer program can include a standalone application, which is a program that is run as an independent computer process, not an add-on to an existing process, e.g., not a plug-in. Those of skill in the art will recognize that standalone applications are often compiled. A compiler is a computer program(s) that transforms source code written in a programming language into binary object code such as assembly language or machine code. Suitable compiled programming languages include, by way of non-limiting examples, C, C++, Objective-C, COBOL, Delphi, Eiffel, Java.TM., Lisp, Python.TM., Visual Basic, and VB .NET, or combinations thereof. Compilation is often performed, at least in part, to create an executable program. A computer program can include one or more executable complied applications.
Web Browser Plug-in
[0169] The computer program can include a web browser plug-in. In computing, a plug-in is one or more software components that add specific functionality to a larger software application. Makers of software applications support plug-ins to enable third-party developers to create abilities which extend an application, to support easily adding new features, and to reduce the size of an application. When supported, plug-ins enable customizing the functionality of a software application. For example, plug-ins are commonly used in web browsers to play video, generate interactivity, scan for viruses, and display particular file types. Those of skill in the art will be familiar with several web browser plug-ins including, Adobe.RTM. Flash.RTM. Player, Microsoft.RTM. Silverlight.RTM., and Apple.RTM. QuickTime.RTM.. In some embodiments, the toolbar comprises one or more web browser extensions, add-ins, or add-ons. In some embodiments, the toolbar comprises one or more explorer bars, tool bands, or desk bands.
[0170] In view of the disclosure provided herein, those of skill in the art will recognize that several plug-in frameworks are available that enable development of plug-ins in various programming languages, including, by way of non-limiting examples, C++, Delphi, Java.TM., PHP, Python.TM., and VB .NET, or combinations thereof.
[0171] Web browsers (also called Internet browsers) can be software applications, designed for use with network-connected digital processing devices, for retrieving, presenting, and traversing information resources on the World Wide Web. Suitable web browsers include, by way of non-limiting examples, Microsoft.RTM. Internet Explorer.RTM., Mozilla.RTM. Firefox.RTM., Google.RTM. Chrome, Apple.RTM. Safari.RTM., Opera Software.RTM. Opera.RTM., and KDE Konqueror. In some embodiments, the web browser is a mobile web browser. Mobile web browsers (also called mircrobrowsers, mini-browsers, and wireless browsers) are designed for use on mobile digital processing devices including, by way of non-limiting examples, handheld computers, tablet computers, netbook computers, subnotebook computers, smartphones, music players, personal digital assistants (PDAs), and handheld video game systems. Suitable mobile web browsers include, by way of non-limiting examples, Google.RTM. Android.RTM. browser, RIM BlackBerry.RTM. Browser, Apple.RTM. Safari.RTM., Palm.RTM. Blazer, Palm.RTM. WebOS.RTM. Browser, Mozilla.RTM. Firefox.RTM. for mobile, Microsoft.RTM. Internet Explorer.RTM. Mobile, Amazon.RTM. Kindle.RTM. Basic Web, Nokia.RTM. Browser, Opera Software.RTM. Opera.RTM. Mobile, and Sony.RTM. PSP.TM. browser.
Software Modules
[0172] The systems and methods disclosed herein can include software, server, and/or database modules, or use of the same. In view of the disclosure provided herein, software modules can be created by techniques known to those of skill in the art using machines, software, and languages known to the art. The software modules disclosed herein can be implemented in a multitude of ways. A software module can comprise a file, a section of code, a programming object, a programming structure, or combinations thereof. A software module can comprise a plurality of files, a plurality of sections of code, a plurality of programming objects, a plurality of programming structures, or combinations thereof. In various aspects, the one or more software modules comprise, by way of non-limiting examples, a web application, a mobile application, and a standalone application. In some instances, software modules are in one computer program or application. In other instances, software modules are in more than one computer program or application. In some cases, software modules are hosted on one machine. In other cases, software modules are hosted on more than one machine. Sometimes, software modules can be hosted on cloud computing platforms. Other times, software modules can be hosted on one or more machines in one location. In additional cases, software modules are hosted on one or more machines in more than one location.
Databases
[0173] The methods, apparatus, and systems disclosed herein can include one or more databases, or use of the same. In view of the disclosure provided herein, those of skill in the art will recognize that many databases are suitable for storage and retrieval of analytical information described elsewhere herein. In various aspects described herein, suitable databases can include, by way of non-limiting examples, relational databases, non-relational databases, object oriented databases, object databases, entity-relationship model databases, associative databases, and XML databases. A database can be internet-based. A database can be web-based. A database can be cloud computing-based. Alternatively, a database can be based on one or more local computer storage devices.
Services
[0174] Methods and systems described herein can further be performed as a service. For example, a service provider can obtain a sample that a customer wishes to analyze. The service provider can then encodes the sample to be analyzed by any of the methods described herein, performs the analysis and provides a report to the customer. The customer can also perform the analysis and provides the results to the service provider for decoding. In some instances, the service provider then provides the decoded results to the customer. In other instances, the customer can received encoded analysis of the samples from the provider and decodes the results by interacting with softwares installed locally (at the customer's location) or remotely (e.g., on a server reachable through a network). Sometimes, the softwares can generate a report and transmit the report to the costumer. Exemplary customers include clinical laboratories, hospitals, industrial manufacturers, and the like. Sometimes, a customer or party can be any suitable customer or party with a need or desire to use the methods provided herein.
Server
[0175] The methods provided herein can be processed on a server or a computer server (FIG. 2). The server 401 can include a central processing unit (CPU, also "processor") 405 which can be a single core processor, a multi core processor, or plurality of processors for parallel processing. A processor used as part of a control assembly can be a microprocessor. The server 401 can also include memory 410 (e.g., random access memory, read-only memory, flash memory); electronic storage unit 415 (e.g., hard disk); communications interface 420 (e.g., network adaptor) for communicating with one or more other systems; and peripheral devices 425 which includes cache, other memory, data storage, and/or electronic display adaptors. The memory 410, storage unit 415, interface 420, and peripheral devices 425 can be in communication with the processor 405 through a communications bus (solid lines), such as a motherboard. The storage unit 415 can be a data storage unit for storing data. The server 401 can be operatively coupled to a computer network ("network") 430 with the aid of the communications interface 420. A processor with the aid of additional hardware can also be operatively coupled to a network. The network 430 can be the Internet, an intranet and/or an extranet, an intranet and/or extranet that is in communication with the Internet, a telecommunication or data network. The network 430 with the aid of the server 401, can implement a peer-to-peer network, which can enable devices coupled to the server 401 to behave as a client or a server. The server can be capable of transmitting and receiving computer-readable instructions (e.g., device/system operation protocols or parameters) or data (e.g., sensor measurements, raw data obtained from detecting metabolites, analysis of raw data obtained from detecting metabolites, interpretation of raw data obtained from detecting metabolites, etc.) via electronic signals transported through the network 430. Moreover, a network can be used, for example, to transmit or receive data across an international border.
[0176] The server 401 can be in communication with one or more output devices 435 such as a display or printer, and/or with one or more input devices 440 such as, for example, a keyboard, mouse, or joystick. The display can be a touch screen display, in which case it functions as both a display device and an input device. Different and/or additional input devices can be present such an enunciator, a speaker, or a microphone. The server can use any one of a variety of operating systems, such as for example, any one of several versions of Windows.RTM., or of MacOS.RTM., or of Unix.RTM., or of Linux.RTM..
[0177] The storage unit 415 can store files or data associated with the operation of a device, systems or methods described herein.
[0178] The server can communicate with one or more remote computer systems through the network 430. The one or more remote computer systems can include, for example, personal computers, laptops, tablets, telephones, Smart phones, or personal digital assistants.
[0179] A control assembly can include a single server 401. In other situations, the system can include multiple servers in communication with one another through an intranet, extranet and/or the Internet.
[0180] The server 401 can be adapted to store device operation parameters, protocols, methods described herein, and other information of potential relevance. Such information can be stored on the storage unit 415 or the server 401 and such data is transmitted through a network.
[0181] Unless defined otherwise, all technical and scientific terms used herein have the same meaning as is commonly understood by one of skill in the art to which the claimed subject matter belongs. It is to be understood that the foregoing general description and the following detailed description are exemplary and explanatory only and are not restrictive of any subject matter claimed. In this application, the use of the singular includes the plural unless specifically stated otherwise. It must be noted that, as used in the specification and the appended claims, the singular forms "a," "an" and "the" include plural referents unless the context clearly dictates otherwise. In this application, the use of "or" means "and/or" unless stated otherwise. Furthermore, use of the term "including" as well as other forms, such as "include", "includes," and "included," is not limiting.
[0182] As used herein, ranges and amounts can be expressed as "about" a particular value or range. About also includes the exact amount. Hence "about 5 .mu.L" means "about 5 .mu.L" and also "5 .mu.L." Generally, the term "about" includes an amount that would be expected to be within experimental error.
[0183] The section headings used herein are for organizational purposes only and are not to be construed as limiting the subject matter described.
EXAMPLES
[0184] These examples are provided for illustrative purposes only and not to limit the scope of the claims provided herein.
Example 1
DNase Treatment and TUNEL Assay
[0185] A TUNEL assay as described below may be used to label DNaseI cut sites on a global cell. For example, all of the DNaseI cut sites within a cell's nucleus may be labeled.
[0186] Cells were prepared for a 2-color SPDM for DNA density and DNase I sensitivity (TUNEL) assay.
[0187] An adherent cell line, A549 (lung adenocarcinoma), was used for these experiments. They were plated overnight on uncoated 18 mm (#1 thickness) coverslips. Cells were deliberately plated sparsely to be .about.20% confluent on the day of the assay.
[0188] For all coverslips, cells were fixed with 4% formaldehyde in PBS for 10 minutes at room temperature, and then equilibrated in buffer A at room temperature for 15 minutes. The cells were permeabilized with 0.1% NP-40 in buffer A for 10 minutes at room temperature.
[0189] The DNaseI assay was performed with 80 U/ml DNaseI for 3 minutes at 37.degree. C. Cells were then post fixed in 4% formaldehyde in buffer A for 10 minutes at room temperature. The coverslips were permeabilized for 20 minutes with buffer A with 0.25% TX-100, and washed twice with distilled water and were equilibrated with 100 .mu.l of TdT reaction buffer for 10 minutes at room temperature. The terminal deoxynucleotide transferase (TdT) reaction with EdUTP-alkyne (100 .mu.l per coverslip) was performed for 1 hour at 37.degree. C. At the end of the TdT reaction, the coverslips were washed twice with 3% BSA/PBS. The ClickIT reaction was then performed for 2 coverslips to add Alexafluor647 to incorporated EdUTP-alkyne. This reaction was performed for 30 minutes at room temperature, in the dark. The other coverslips were kept in 3% BSA/PBS at room temperature. The coverslips were washed once with 3% BSA/PBS before being stained with Vybrant Violet staining and imaged by a SMLM method.
[0190] FIG. 3A shows a two color SPDM image (experimental) of chromatin (blue) with a DNA sensitive element (red), showing anti-colocalization of the DNA sensitive element with chromatin. Scale bars: 1000 nm, inserts: 100 nm. FIG. 3B is the inset of FIG. 3A.
[0191] FIG. 4A and FIG. 4B illustrate the localization precision and nearest neighbor distances for DNA and DNase sensitive elements.
Example 2
DNA Encoding of Molecular Targets on a Multi-Omics Imaging Platform
[0192] Integration of imaging data across different molecular target types may provide in-depth insights into cell physiology and pathology. A multi-omics imaging platform is utilized which enables simultaneous visualization of multiple molecular targets irrespective of target type and imaging probes used. The multi-omics imaging platform comprises (i) decoupling of target binding and labeling steps, (ii) translation of heterogeneous molecular information into an intermediate standardized molecular code amenable to read-out via imaging probes, and (iii) employing encoding capacity and self-assembly capabilities of DNA bonding. Specifically, molecular targets of interest are first encoded with unique ssDNA tags via binding by ssDNA-conjugated target-recognition moieties under optimized conditions favoring specific target binding. Individual ssDNA tags are then converted into detectable signals via sequence-specific hybridization with complementary ssDNA'-conjugated imaging probes under probe-optimized conditions. As such, molecular target uniqueness, localization, abundance, and specimen morphology information are preserved through all steps of labeling procedure, producing comprehensive molecular signatures of a physiological or pathological process.
Methods
[0193] Oligonucleotide Probe Design.
[0194] Sequences for 6 ssDNA/ssDNA' encoding pairs were selected from a random pool. Selection criteria were: continuous 16 bp complementarity, balanced nucleotide composition, lack of stable secondary structures at room temperature, lack of substantial cross-hybridization between mismatch pairs. See TABLE 1 for a complete list of ssDNA/ssDNA' encoding pairs.
[0195] Sequences for human GAPDH mRNA (NM_002046.5) and HSP90-alpha mRNA (NM_001271969.1) were obtained from NCBI. Sets of mRNA in situ hybridization (ISH) probes were designed using Stellaris RNA FISH Probe Designer (Biosearch Technologies). Probe sets contained 36 unique probes for GAPDH mRNA and 48 probes for HSP90-alpha mRNA. Each probe featured 5' terminal 20nt-long region complementary to mRNA, a spacer (either AAAAA for smaller 41nt probes or AAAA-dsSpacer-AAAA for longer 60nt probes), and a 16nt-long QDot binding tag. The ISH probe strand of the dsSpacer was 5'-TTCCCAAGCGTCATCT-3' (SEQ ID NO: 6), pre-hybridized with a complementary 5'-AGATGACGCTTGGGAA-3' ssDNA (SEQ ID NO: 98) at a 1:1 molar ratio to form a 16 bp dsDNA spacer prior to specimen labeling. See TABLE 2 and TABLE 3 for a complete list of ISH probes. All oligonucleotides were purchased from IDT DNA.
[0196] Antibody-ssDNA Conjugation.
[0197] Purified primary and secondary antibodies in PBS were purchased from Sigma-Aldrich. Amine-terminated HPLC purified ssDNA tags were purchased from IDT DNA (see TABLE 1, Tag IDs 1B-6B). Covalent antibody-ssDNA bioconjugation was achieved either a) via maleimide-mediated amine-sulfhydryl crosslinking or b) using Thunder-Link oligo conjugation system (Innova Biosciences).
[0198] For maleimide-mediated crosslinking, IgG was partially reduced by TCEP to expose free sulfhydryl groups, while 5' amine-terminated ssDNA oligonucleotides were activated by sulfo-SMCC (Thermo Scientific). IgG was diluted to 1 mg/mL in 100 .mu.L PBS with 10 mM EDTA, mixed with 0.5 mM TCEP, and incubated for 30 min at 37.degree. C. At the same time, ssDNA was diluted to 40 .mu.M in 100 .mu.L PBS, mixed with 10 mM sulfo-SMCC, and incubated for 30 min at RT. Reduced IgG and activated ssDNA were then purified by 3 rounds of desalting in Zeba desalting spin columns (Thermo Scientific) pre-washed with PBS/10 mM EDTA, mixed, and reacted for 4 hrs at room temperature (RT). Finally, unreacted sulfhydryl groups were capped by addition of 1 mM sulfo-SMCC pre-quenched by excess glycine. Antibody-ssDNA bioconjugates were purified by ultrafiltration for at least 6 times with Amicon Ultra 50 KDa MWCO centrifugal filter (Millipore) and stored in PBS solution at 4.degree. C.
[0199] For antibody-ssDNA conjugation with Thunder-Link oligo conjugation system, IgG was diluted to 1 mg/mL in 100 .mu.L PBS, activated by the Antibody Activation Reagent for 1 Hr at RT, and purified using desalting column. At the same time, 5' amine-terminated ssDNA oligonucleotides were diluted to 80 .mu.M in 100 .mu.L PBS, activated by the Oligo Activation Reagent for 1 Hr at RT, and desalted. Activated IgG and ssDNA were mixed at a volume ratio of 2:1 (200 .mu.L IgG+100 .mu.L ssDNA+100 .mu.L wash buffer), reacted overnight at RT, and stored at 4.degree. C. For optimization studies, following IgG:ssDNA volume ratios were tested: 50+50, 50+30, 50+20, and 50+10.
[0200] QDot-ssDNA Conjugation.
[0201] Amine-functionalized PEG-coated QDots (Qdot ITK amino (PEG) quantum dots, Invitrogen) with emission peaks centered at 525, 545, 565, 585, 605, and 655 nm were used for the preparation of QDot-ssDNA probes. Amine-terminated HPLC purified 16nt-long ssDNA tags were purchased from IDT DNA (see TABLE 1, Tag IDs 1A-6A). Oligonucleotides were activated with bifunctional cross-linker BS3 (Bis[sulfosuccinimidyl] suberate, Thermo Scientific), followed by covalent conjugation with QDots. 100 .mu.L 40 .mu.M ssDNA solution in PBS was mixed with 500 molar excess of BS3 and incubated for 30 minutes at room temperature. Excess crosslinker was removed by 3 rounds of desalting in Zeba desalting spin columns (Thermo Scientific) pre-washed with PBS. Activated ssDNA was then mixed with 25 .mu.L 8 .mu.M stock QDot solution. The reaction was incubated overnight at room temperature and purified by ultrafiltration for at least 6 times with Amicon Ultra 100 KDa MWCO centrifugal filter (Millipore). Purified QDot-ssDNA probes were stored in PBS solution at 4.degree. C.
[0202] Agarose gel electrophoresis was used for characterization of QDot-ssDNA probes. Procedure was performed on a 2% agarose gel in 1.times.TBE at 90V for 2 hrs.
[0203] Cell Culture and Processing.
[0204] Human cervical cancer cell line HeLa (ATCC) was used as a model specimen for evaluation of the multi-omics imaging via DNA encoding. Cells were grown in glass-bottom 24-well plates (Greiner Bio-One) in a humidified atmosphere at 37.degree. C. with 5% CO.sub.2 to a density of 80-90% using MEM culture medium with L-glutamine (Gibco) supplemented with 10% fetal bovine serum (Gibco). Prior to labeling, cells were rinsed with PBS, fixed with 4% formaldehyde in PBS for 5 min at room temperature followed by 15 min at 4.degree. C., permeabilized with ice-cold 0.5% TritonX-100 (Thermo Scientific) in PBS for 15 min at 4.degree. C., and washed with PBS. For mRNA imaging, cells were immediately processed for in situ hybridization to minimize degradation of mRNA prior to labeling. For protein imaging only, fixed cells could be stored in PBS with 0.03% sodium azide at 4.degree. C. for several days.
[0205] Encoding Via Immunorecognition.
[0206] Encoding of protein targets in formalin-fixed cells was performed via incubation with antibody-ssDNA bioconjugates. Prior to labeling, cells were blocked by 2% BSA (from 10% BSA/PBS solution, Thermo Scientific), 0.5% Western blot blocking reagent (from 10% solution, Roche), 0.1% low MW dextran sulfate (9-20 kDa MW, Sigma-Aldrich), 0.1 mg/mL shredded salmon sperm DNA (Invitrogen), and 1.times.PBS for 30 min at RT. Antibodies were used at a final concentration of 5 .mu.g/mL diluted in 2% BSA, 0.1% dextran sulfate, 0.1 mg/mL shredded salmon sperm DNA, and 1.times.PBS and incubated with cells for 1-2 hrs at RT. Following labeling, cells were washed with PBS.
[0207] For reference studies, cell labeling with unmodified antibodies was performed in a similar fashion.
[0208] Encoding Via In Situ Hybridization (ISH).
[0209] Encoding of mRNA targets was performed via hybridization with ssDNA-tagged mRNA ISH probes. Cells were equilibrated with 10% formamide (Thermo Scientific), 2 mM RVC (New England BioLabs), 2.times.SSC (Invitrogen) buffer for 30 min at RT and then incubated with 400 .mu.L/well 250 nM mix of mRNA ISH probes in 1% dextran sulfate (>500 kDa MW, Sigma-Aldrich), 1 mg/mL tRNA (from E. coli, Roche), 10% formamide, 2 mM RVC, 2.times.SSC hybridization buffer for 4 Hrs (or overnight) at 37.degree. C. Following hybridization, cells were washed with warm 10% formamide, 2.times.SSC buffer for 30 min at 37.degree. C., two changes of 1.times.PBS for 10 min at RT, and blocked by 2% BSA, 0.5% Western blot blocking reagent, 0.1% low MW dextran sulfate, 0.1 mg/mL shredded salmon sperm DNA, 1.times.PBS for 30 min at RT.
[0210] Encoding for Multi-Omics Studies.
[0211] Encoding of protein and mRNA targets on the same specimen was performed by combining immunorecognition and in situ hybridization procedures. First, cells were hybridized with ssDNA-tagged mRNA ISH probes as described above. Following hybridization and washing, cells were blocked, incubated with antibody-ssDNA bioconjugates for 1-2 Hrs at RT, and washed with PBS.
[0212] Specimen Labeling with QDot Probes.
[0213] Following encoding of targets with ssDNA tags, cells were simultaneously labeled with complementary QDot-ssDNA' probes. QDots were used at a final concentration of 5 nM in 2% BSA, 0.1% low MW dextran sulfate, 0.1 mg/mL shredded salmon sperm DNA, 1.times.PBS and incubated with cells for 2-4 Hrs at RT. Following staining cells were washed with PBS. Optionally, nuclei could be counter-stained by a 5-min incubation with DAPI.
[0214] For reference immunofluorescence studies, cell staining with QDots functionalized with secondary Ab fragments (Qdot goat F(ab')2 anti-mouse or anti-rabbit IgG conjugates (H+L), Invitrogen) was performed in a similar fashion.
[0215] RNAi.
[0216] Knock-down of GAPDH expression was done via cell transfection with GAPDH siRNA (Ambion). For forward transfection, cells were grown in a glass-bottom 24-well plate overnight and then treated with 500 .mu.l/well culture medium containing 25 nM GAPDH siRNA and 0.5 .mu.l/well DharmaFECT-2 transfection reagent (Dharmacon) for 24 hrs. For reverse transfection, cells were grown in a 10 cm TC-treated dish, trypsinized, mixed in suspension with culture medium containing 25 nM GAPDH siRNA and 0.5 .mu.l/well DharmaFECT-2 transfection reagent, seeded into a glass-bottom 24-well plate at 500 .mu.l/well cell suspension, and incubated for 24 hrs or 48 hrs. Following transfection, cells were processed for staining. Triplicate samples were also prepared for RT-PCR analysis.
[0217] Rt-PCR Analysis.
[0218] Total RNA was isolated from cell pellets using TRIzol reagent (Invitrogen) according to the manufacturer's protocol. Two hundred nanograms of RNA was converted to cDNA using random hexamer primer and MultiScribe Reverse Transcriptase Reagent (Applied Biosystems). One hundred nanograms of cDNA was amplified by the Real-Time PCR using SensiFAST.TM. Real-Time PCR Kits (Bioline, UK) on Chromo4 Real-Time PCR detection system (Bio-Rad). The primers used for GAPDH amplification were 5'-TCGCTCTCTGCTCCTCCTGTTC-3' (forward primer; SEQ ID NO: 99) and 5'-CGCCCAATACGACCAAATCC-3' (reverse primer; SEQ ID NO: 100). Cyclophilin A (PPIA) was used as an internal control, and the primers were 5'-GTCAACCCCACCGTGTTCTTC-3' (forward primer; SEQ ID NO: 101) and 5'-TTTCTGCTGTCTTTGGGACCTTG-3' (reverse primer SEQ ID NO: 102). To confirm the PCR specificity, PCR products were subjected to a melting-curve analysis. The comparative threshold (C.sub.t) method was used to calculate the relative mRNA amount of the treated sample in comparison to control samples. Mean value from triplicate samples was reported.
[0219] Imaging and Signal Analysis.
[0220] IX-71 inverted fluorescence microscope (Olympus) equipped with a true-color CCD (QColor5, Olympus) and a hyperspectral imaging camera (Nuance, 420-720 nm spectral range, CRI, now PerkinElmer) was used for cell imaging. Low-magnification images were obtained with .times.20 dry objective (NA 0.75, Olympus) and high-magnification with .times.40 (NA 1.30, Olympus) and .times.100 (NA 1.40, Olympus) oil-immersion objectives. Wide UV filter cube (330-385 nm band-pass excitation, 420 nm long-pass emission, Olympus) was used for imaging of all QDot probes, while Rhodamine LP cube (530-560 nm band-pass excitation, 572 nm long-pass emission, Chroma) was used for Alexa Fluor 555 detection. All images were acquired with cells attached to the coverslip bottom of the well and immersed in PBS without use of anti-fading reagents.
[0221] Nuance image analysis software was used to unmix the obtained multispectral images based on the reference spectra of each QDot component along with an extra channel for background fluorescence. In a false-color composite image, brightness and contrast of each channel was automatically adjusted for best visual representation and clear depiction of relative target distribution, unless noted otherwise. For direct comparison of QDot staining intensity individual QDot channels were normalized.
[0222] DNA Encoding for Multi-Omic Imaging Studies.
[0223] To demonstrate the DNA encoding for multi-omics imaging studies concurrent analysis of single-cell molecular expression profiles at mRNA and protein levels were performed. Fluorescent quantum dot probes (QDots) in combination with fluorescence microscopy and hyperspectral imaging (HSI) were employed for simultaneous visualization of all ssDNA tags following separate encoding of mRNA and protein targets (FIG. 5A). For example, GAPDH and HSP90-alpha mRNA molecules and their respective product proteins can be readily labeled by 4-color QDots to highlight relative intracellular distribution and abundance of the two target types at a single-cell level (FIG. 5B). Unlike direct labeling procedures performed at a single incubation condition fixed for all targets and probes, DNA encoding enables tuning of conditions to favor recognition of individual target types and hybridization with detection probes in separate steps, offering great flexibility in choice of specimens, targets, and imaging systems (FIG. 6).
[0224] QDot-Based Multi-Omics Imaging Platform.
[0225] To implement and systematically characterize the model QDot-based multi-omics imaging platform, a set of 6 unique 16 bp ssDNA/ssDNA' linkers was developed for encoding of up to 6 different molecular targets (TABLE 1) along with a library of complementary 6-color QDot-ssDNA probes (FIG. 7A and FIG. 7B) and a control set of 6 secondary antibody-ssDNA (2'Ab-ssDNA) bioconjugates (FIG. 8A and FIG. 8B). Indirect labeling of .beta.-tubulin in HeLa cells via a 3-step procedure involving incubation with unmodified primary antibodies, 2'Ab-ssDNA bioconjugates, and complementary QDot-ssDNA' probes demonstrated preserved antigen-recognition functionality of ssDNA-modified antibodies and high specificity of QDot staining via DNA hybridization (FIG. 9).
[0226] Mutiplex Protein Immuno-Labeling.
[0227] Multiplexed protein immuno-labeling was realized through preparation of a library of primary antibody-ssDNA (1'Ab-ssDNA) bioconjugates (FIG. 10A, FIG. 10B, and FIG. 10C; and FIG. 11A, FIG. 11B, FIG. 11C, FIG. 11D, and FIG. 11E). Characterization of such bioconjugates with PAGE and cell staining confirmed preserved stability and antigen-binding functionality of antibodies, specificity of target staining with QDots in a 2-step procedure, and consistent target identification with different QDot colors in a multiplexed imaging format (FIG. 11A, FIG. 11B, FIG. 11C, FIG. 11D, and FIG. 11E). Nuclear envelope protein Lamin A, microtubule .beta.-tubulin, and cytoplasmic proteins HSP90-alpha and GAPDH were labeled as model target molecules with distinct characteristic intracellular localization.
[0228] Labeling of model GAPDH and HSP90-alpha mRNA molecules via an indirect in situ hybridization (ISH) procedure was done with modified mRNA ISH oligonucleotide probes featuring 5' 20nt mRNA-recognition portion and a 3' 16nt QDot-binding tag separated by a single-stranded AAAAA spacer (TABLE 2 and TABLE 3). Hybridization of oligonucleotide probes under optimized ISH conditions yielded labeling of each mRNA molecule with multiple ssDNA tags (up to 36 for GAPDH and 48 for HSP90-alpha), producing distinct spots upon staining with complementary QDot-ssDNA probes consistent with results achieved with conventional mRNA ISH protocols (FIG. 12). In some instances, non-complementary QDot-ssDNA probes failed to hybridize to exposed ssDNA tags, producing minimal non-specific staining background. To explore effects of potential secondary structure formation in 41nt ssDNA oligonucleotides as well as steric hindrance experienced by QDots approaching tightly spaced ssDNA tags, an alternative mRNA ISH probe set was designed with each probe containing a 16 bp dsDNA spacer between 5' mRNA-recognition and 3' QDot-binding portions. Indeed, physical separation of functional ssDNA portions improved mRNA staining intensity in comparison to linear 41nt ssDNA oligonucleotides (FIG. 13A, FIG. 13B, FIG. 13C, and FIG. 13D), offering one strategy for enhancing per-spot signal intensity and improving signal-to-noise ratio.
[0229] Separation of target-recognition and QDot-labeling events via an intermediate DNA encoding enabled straightforward implementation of a model multi-omics imaging protocol, with both mRNA and protein targets being robustly labeled by respective QDot probes and accurately identified through hyperspectral imaging and analysis (FIG. 14), corroborating broad applicability of the DNA encoding strategy for simultaneous detection and imaging of various types of targets within the same specimen.
[0230] Multi-omics imaging platform was then applied to study gene knock-down via RNAi at a single-cell level. HeLa cells were transfected with GAPDH-targeting siRNA (as well as non-targeting siRNA for control) for 24 hrs, and GAPDH mRNA abundance was assessed with RT-PCR and QDot-based imaging. In some cases, bulk GAPDH mRNA measurement by RT-PCR indicated silencing efficiency of 78% with forward transfection and 95% with reverse transfection. At the same time, imaging revealed heterogeneity in RNAi, likely resulting from heterogeneous cell transfection with siRNA throughout different regions of cell culture. For example, forward transfection failed to achieve efficient GAPDH mRNA degradation in dense cell populations, yielding areas of completely silenced cells along with patches of cells with normal GAPDH mRNA expression levels (FIG. 15). In contrast, reverse transfection achieved a more uniform cell transfection in suspension, producing a greater proportion of silenced cells with only a few wild-type clones (FIG. 16). Direct comparison of mRNA imaging results obtained from forward vs. reverse transfection further corroborated complete mRNA degradation upon successful transfection with either method along with unperturbed GAPDH mRNA levels in non-transfected cells (FIG. 17), suggesting an all-on/all-off mode of GAPDH RNAi and attributing incomplete silencing observed with bulk RT-PCR analysis to heterogeneity in siRNA transfection.
[0231] Selectivity of GAPDH RNAi was confirmed by performing dual-target imaging of GAPDH mRNA and HSP90-alpha mRNA. Target-selective siRNA should trigger degradation of only its complementary target mRNA, having no immediate effect on non-targeted mRNA molecules. This was indeed observed with GAPDH RNAi studies (FIG. 18). Indirect dual-target ISH produced robust staining of both mRNA species in reference HeLa cells grown in culture medium. Similarly, cell transfection with non-targeting control siRNA failed to produce any effect on mRNA expression. Transfection with GAPDH-targeting siRNA, however, triggered rapid degradation of GAPDH mRNA within 24 hrs post-transfection, while leaving non-targeted HSP90-alpha mRNA intact. A single non-transfected cell within the field of view features intact expression of both GAPDH and HSP90 mRNA, consistent with discussion above.
[0232] Imaging of mRNA unambiguously demonstrated heterogeneity in RNAi stemming from incomplete cell transfection with siRNA. However, such heterogeneity could not be detected at the protein level, as GAPDH protein remained unperturbed 24 Hrs post-transfection in both transfected and non-transfected cells, as was evident from dual labeling of GAPDH mRNA and protein (FIG. 19). To further investigate the disparity between RNAi effect at mRNA and protein levels, HeLa cells were reverse transfected with GAPDH-targeting siRNA for 24 and 48 Hrs and processed for multiplexed imaging of GAPDH and HSP90-alpha mRNA and their respective protein products. Consistent with studies discussed earlier, 24 Hrs post-transfection a complete degradation of GAPDH mRNA was observed, whereas GAPDH protein level remained unperturbed (FIG. 20A). In contrast, 48 hrs post-transfection a substantial reduction of GAPDH protein level could be observed, with GAPDH mRNA remaining below the detection limit (FIG. 20B). HSP90 mRNA and protein levels remained unperturbed through 48 hours, confirming selectivity of GAPDH silencing. Further, all molecular targets exhibited consistent unperturbed levels in reference non-transfected cells (FIG. 21A and FIG. 21B) and cells transfected with non-targeting siRNA (FIG. 22A and FIG. 22B) throughout the study, corroborating that the observed GAPDH knock-down indeed resulted from RNAi mechanism. Multiplexed analysis was fully confirmed by a series of single-plex studies to mitigate any artifacts that could potentially be introduced from the multi-omics labeling methodology, HSI, and image analysis (FIG. 23A and FIG. 23B).
[0233] In some cases, delay in RNAi effect at the protein level is present, as proteins are typically degraded and cleared slower in comparison to siRNA-mediated mRNA degradation. In other cases, heterogeneity in cell transfection can modulate assessing RNAi efficiency with bulk RT-PCR measurement and downstream phenotypic and molecular signaling analysis. Non-transfected cells might gain growth advantage and achieve substantial clonal expansion during the time it takes for higher-level manifestations of RNAi to occur, thus distorting observed RNAi effect at a population level. Imaging-based analysis at a single-cell level can by-pass this ambiguity and can offer a more accurate insight into molecular processes.
TABLE-US-00001 TABLE 1 List of ssDNA/ssDNA' tag pairs for encoding of molecular targets Tag ID Sequence* SEQ ID NO: QDot-coupled 1A 5'-/5AmMC6/iSp18/CGTCGCACCAAGAAAT-3' 1 2A 5'-/5AmMC6/iSp18/TAGACTTGCCATACGT-3' 2 3A 5'-/5AmMC6/iSp18/AATTCTTGAGACCAGG-3' 3 4A 5'-/5AmMC6/iSp18/ATCTGCCCAAACTCCA-3' 4 5A 5'-/5AmMC6/iSp18/TTCCCAAGCGTCATCT-3' 5 6A 5'-/5AmMC6/iSp18/TCTATCGGACGCTGTA-3' 6 IgG-coupled 1B 5'-/5AmMC6/AAAAAAAAAAATTTCTTGGTGCGACG-3' 7 2B 5'-/5AmMC6/AAAAAAAAAAACGTATGGCAAGTCTA-3' 8 3B 5'-/5AmMC6/AAAAAAAAAACCTGGTCTCAAGAATT-3' 9 4B 5'-/5AmMC6/AAAAAAAAAATGGAGTTTGGGCAGAT-3' 10 5B 5'-/5AmMC6/AAAAAAAAAAAGATGACGCTTGGGAA-3' 11 6B 5'-/5AmMC6/AAAAAAAAAATACAGCGTCCGATAGA-3' 12 *all ssDNA tags have 5' terminal amino group (/5AmMC6/) for bioconjunction separated from the pairing sequence by either a hexa-ethyleneglycol spacer (/iSp18/) for QDot-coupled tags or 10A oligonucleotide spacer (AAAAAAAAAA; SEQ ID NO: 97) for IgG-coupled tags.
TABLE-US-00002 TABLE 2 Sequences of GAPDH mRNA ISH probes (with 2B encoding tag) # mRNA-recognition region encoding tag 2B SEQ ID NO: 1 5'-ATTTATAGAAACCGGGGGCG ACGTATGGCAAGTCTA-3' 13 2 5'-CGAACAGGAGGAGCAGAGAG ACGTATGGCAAGTCTA-3' 14 3 5'-GCTGGCGACGCAAAAGAAGA ACGTATGGCAAGTCTA-3' 15 4 5'-CATGGTGTCTGAGCGATGTG ACGTATGGCAAGTCTA-3' 16 5 5'-TACGACCAAATCCGTTGACT ACGTATGGCAAGTCTA-3' 17 6 5'-CAGAGTTAAAAGCAGCCCTG ACGTATGGCAAGTCTA-3' 18 7 5'-GGGTCATTGATGGCAACAAT ACGTATGGCAAGTCTA-3' 19 8 5'-AACCATGTAGTTGAGGTCAA ACGTATGGCAAGTCTA-3' 20 9 5'-GGGTGGAATCATATTGGAAC ACGTATGGCAAGTCTA-3' 21 10 5'-TTGACGGTGCCATGGAATTT ACGTATGGCAAGTCTA-3' 22 11 5'-CATTGATGACAAGCTTCCCG ACGTATGGCAAGTCTA-3' 23 12 5'-TCCTGGAAGATGGTGATGGG ACGTATGGCAAGTCTA-3' 24 13 5'-CCACTTGATTTTGGAGGGAT ACGTATGGCAAGTCTA-3' 25 14 5'-GGACTCCACGACGTACTCAG ACGTATGGCAAGTCTA-3' 26 15 5'-TTCTCCATGGTGGTGAAGAC ACGTATGGCAAGTCTA-3' 27 16 5'-AGAGATGATGACCCTTTTGG ACGTATGGCAAGTCTA-3' 28 17 5'-GACGAACATGGGGGCATCAG ACGTATGGCAAGTCTA-3' 29 18 5'-CATACTTCTCATGGTTCACA ACGTATGGCAAGTCTA-3' 30 19 5'-ATTGCTGATGATCTTGAGGC ACGTATGGCAAGTCTA-3' 31 20 5'-CTAAGCAGTTGGTGGTGCAG ACGTATGGCAAGTCTA-3' 32 21 5'-CCACGATACCAAAGTTGTC AACGTATGGCAAGTCTA-3' 33 22 5'-TCTTCTGGGTGGCAGTGATG ACGTATGGCAAGTCTA-3' 34 23 5'-TAGAGGCAGGGATGATGTTC ACGTATGGCAAGTCTA-3' 35 24 5'-TCAGCTCAGGGATGACCTTG ACGTATGGCAAGTCTA-3' 36 25 5'-CACTGACACGTTGGCAGTGG ACGTATGGCAAGTCTA-3' 37 26 5'-CAGGTTTTTCTAGACGGCAG ACGTATGGCAAGTCTA-3' 38 27 5'-CACCTTCTTGATGTCATCAT ACGTATGGCAAGTCTA-3' 39 28 5'-GCTGTTGAAGTCAGAGGAGA ACGTATGGCAAGTCTA-3' 40 29 5'-CGTCAAAGGTGGAGGAGTGG ACGTATGGCAAGTCTA-3' 41 30 5'-AGTGGTCGTTGAGGGCAATG ACGTATGGCAAGTCTA-3' 42 31 5'-TCATACCAGGAAATGAGCTT ACGTATGGCAAGTCTA-3' 43 32 5'-CCTGTTGCTGTAGCCAAATT ACGTATGGCAAGTCTA-3' 44 33 5'-TGAGGAGGGGAGATTCAGTG ACGTATGGCAAGTCTA-3' 45 34 5'-CTCTTCAAGGGGTCTACATG ACGTATGGCAAGTCTA-3' 46 35 5'-TACATGACAAGGTGCGGCTC ACGTATGGCAAGTCTA-3' 47 36 5'-TGAGCACAGGGTACTTTATT ACGTATGGCAAGTCTA-3' 48 Note: mRNA-recognition region and encoding tag are separated by a spacer (bolded and italicized). Shorter 41nt mRNA ISH probe contain -AAAAA- single strand spacer. Longer 60nt mRNA ISH probes contain pre-hybridized 16 bp double-stranded spacer flanked by -AAAA- single-stranded linkers.
TABLE-US-00003 TABLE 3 Sequences of HSP90-alpha mRNA ISH probes (with 4B encoding tag) # mRNA-recognition region encoding tag 4B SEQ ID NO: 1 5'-AGGAGTATGATTGTCAACCC TGGAGTTTGGGCAGAT-3' 49 2 5'-CCTATATAAGGCGAAGCAC ATGGAGTTTGGGCAGAT-3' 50 3 5'-GAGTGACTCGAGAGAGCTAC TGGAGTTTGGGCAGAT-3' 51 4 5'-ATAGTGAGCAACGTAGGCTT TGGAGTTTGGGCAGAT-3' 52 5 5'-GGACATGAGTTGGGCAATTT TGGAGTTTGGGCAGAT-3' 53 6 5'-GAGATCAACTCCCGAAGGAA TGGAGTTTGGGCAGAT-3' 54 7 5'-AATCTTGTCCAAGGCATCAG TGGAGTTTGGGCAGAT-3' 55 8 5'-AACTTCGAAGGGTCTGTCAG TGGAGTTTGGGCAGAT-3' 56 9 5'-GGTTGGGGATGATGTCAATT TGGAGTTTGGGCAGAT-3' 57 10 5'-TACCAAAGTCAGGGTACGTT TGGAGTTTGGGCAGAT-3' 58 11 5'-TGAGATCAGCTTTGGTCATG TGGAGTTTGGGCAGAT-3' 59 12 5'-TTGGCAATGGTTCCCAAATT TGGAGTTTGGGCAGAT-3' 60 13 5'-CTGAAGAGCCTCCATGAATG TGGAGTTTGGGCAGAT-3' 61 14 5'-CCACCAAGTAGGCAGAATAA TGGAGTTTGGGCAGAT-3' 62 15 5'-TGCTTTGTGATCACAACCAC TGGAGTTTGGGCAGAT-3' 63 16 5'-CAGAAGACTCCCAAGCATAC TGGAGTTTGGGCAGAT-3' 64 17 5'-AGCACGCACAGTGAAGGAAC TGGAGTTTGGGCAGAT-3' 65 18 5'-TCTAGGTACTCTGTCTGATC TGGAGTTTGGGCAGAT-3' 66 19 5'-TAAAGGGTGATGGGATAGCC TGGAGTTTGGGCAGAT-3' 67 20 5'-TGTTTAGTTCTTCCTGATCA TGGAGTTTGGGCAGAT-3' 68 21 5'-AGGGTTTCTGGTCCAAATAG TGGAGTTTGGGCAGAT-3' 69 22 5'-TCATTAGTGAGGCTCTTGTA TGGAGTTTGGGCAGAT-3' 70 23 5'-AAAGTGCTTGACTGCCAAGT TGGAGTTTGGGCAGAT-3' 71 24 5'-TGAATTCCAACTGACCTTCT TGGAGTTTGGGCAGAT-3' 72 25 5'-GAGCCCGACGAGGAATAAAT TGGAGTTTGGGCAGAT-3' 73 26 5'-TGAACACACGGCGGACATAG TGGAGTTTGGGCAGAT-3' 74 27 5'-ATCAACTCATCACAGCTGTC TGGAGTTTGGGCAGAT-3' 75 28 5'-AAGATTTTGCTCTGCTGGAG TGGAGTTTGGGCAGAT-3' 76 29 5'-AGAGAAGAGCTCAAGGCACT TGGAGTTTGGGCAGAT-3' 77 30 5'-GTGGATTCCAAGCTTGAGAT TGGAGTTTGGGCAGAT-3' 78 31 5'-AGACTGGGAGGTATGATAGC TGGAGTTTGGGCAGAT-3' 79 32 5'-CTCTGACAGAGATGTCATCT TGGAGTTTGGGCAGAT-3' 80 33 5'-TAGATGGACTTCTGTGTCTC TGGAGTTTGGGCAGAT-3' 81 34 5'-GCTCCACAAAAGCTGAGTTG TGGAGTTTGGGCAGAT-3' 82 35 5'-CATATATACCACCTCGAAGC TGGAGTTTGGGCAGAT-3' 83 36 5'-ACACAGTACTCGTCAATGGG TGGAGTTTGGGCAGAT-3' 84 37 5'-TTCCCATCAAATTCCTTGAG TGGAGTTTGGGCAGAT-3' 85 38 5'-GAGATTGTCACCTTCTCAAC TGGAGTTTGGGCAGAT-3' 86 39 5'-TGCAGCAAGGTGAAGACACA TGGAGTTTGGGCAGAT-3' 87 40 5'-GCTTTTTGGCCATCATATAG TGGAGTTTGGGCAGAT-3' 88 41 5'-AACTGCCTTATCATTCTTGT TGGAGTTTGGGCAGAT-3' 89 42 5'-ATCCTCAAGGGAAAAGCCAG TGGAGTTTGGGCAGAT-3' 90 43 5'-TGATCATGCGATAGATGCGG TGGAGTTTGGGCAGAT-3' 91 44 5'-CATCAGGAACTGCAGCATTG TGGAGTTTGGGCAGAT-3' 92 45 5'-CAAGGGCACAAGTTTTCCAA TGGAGTTTGGGCAGAT-3' 93 46 5'-TACTGCCTTCAACACAAGGA TGGAGTTTGGGCAGAT-3' 94 47 5'-AGAGTAGAGAGGGAATGGGG TGGAGTTTGGGCAGAT-3' 95 48 5'-TACACAACATCCAATCCTGC TGGAGTTTGGGCAGAT-3' 96 Note: mRNA-recognition portion and encoding tag are separated by a spacer (bolded and italicized). Shorter 41nt mRNA ISH probes contain -AAAAA- single stranded spacer. Longer 60nt mRNA ISH probes contain pre-hybridized 16 bp double-stranded spacer flanked by -AAAA- single-stranded linkers.
Example 3
Global In Situ Visualization of the DNaseI Hypersensitivity Site (DHS) Compartment of a Cell
[0234] This example shows the global in situ visualization of the DNaseI Hypersensitivity Site (DHS) compartment of a cell, which allows for identification of nuclear compartments where regulatory DNA activation occurs. As shown in the graphic on the left side of FIG. 24, K562 cells were fixed with Paxgene reagent, treated with DNaseI, DNaseI-induced nicks were labeled using terminal transferase (TdT) and ethynyl-dUTP (EdUTP) (TUNEL assay), Alexafluor-488 (AF488) was conjugated to the EdUTP via copper click chemistry, and then SPDM imaging was performed. FIG. 24 shows multiple images of this. The top left image is of the raw signal data. The local density map image (top middle) shows a ring of condensation at the nuclear lamina, which is simlar to findings reported by the Weintraub lab 30 years ago (Weintraub, Cell (1985) 43:471-482); see FIG. 24 top right reproduced image). Approximately 18.4% of the localized points are within the ring density at the nuclear lamina, as shown the calculations in the lower right box, in which the image data calculation was based off the the image on the lower left of FIG. 24. The image data calculation is similar to the proportion of K562 DHS within lamina-associated domains (LADS). These findings indicate labeling of DNaseI cut sites in a cell's nucleus using a TUNEL assay may be used for better understanding of the nuclear localization of regulatory DNA activation.
[0235] The examples and embodiments described herein are for illustrative purposes only and various modifications or changes suggested to persons skilled in the art are to be included within the spirit and purview of this application and scope of the appended claims.
* * * * *
D00000
D00001
D00002
D00003
D00004
D00005
D00006
D00007
D00008
D00009
D00010
D00011
D00012

D00013

D00014

D00015
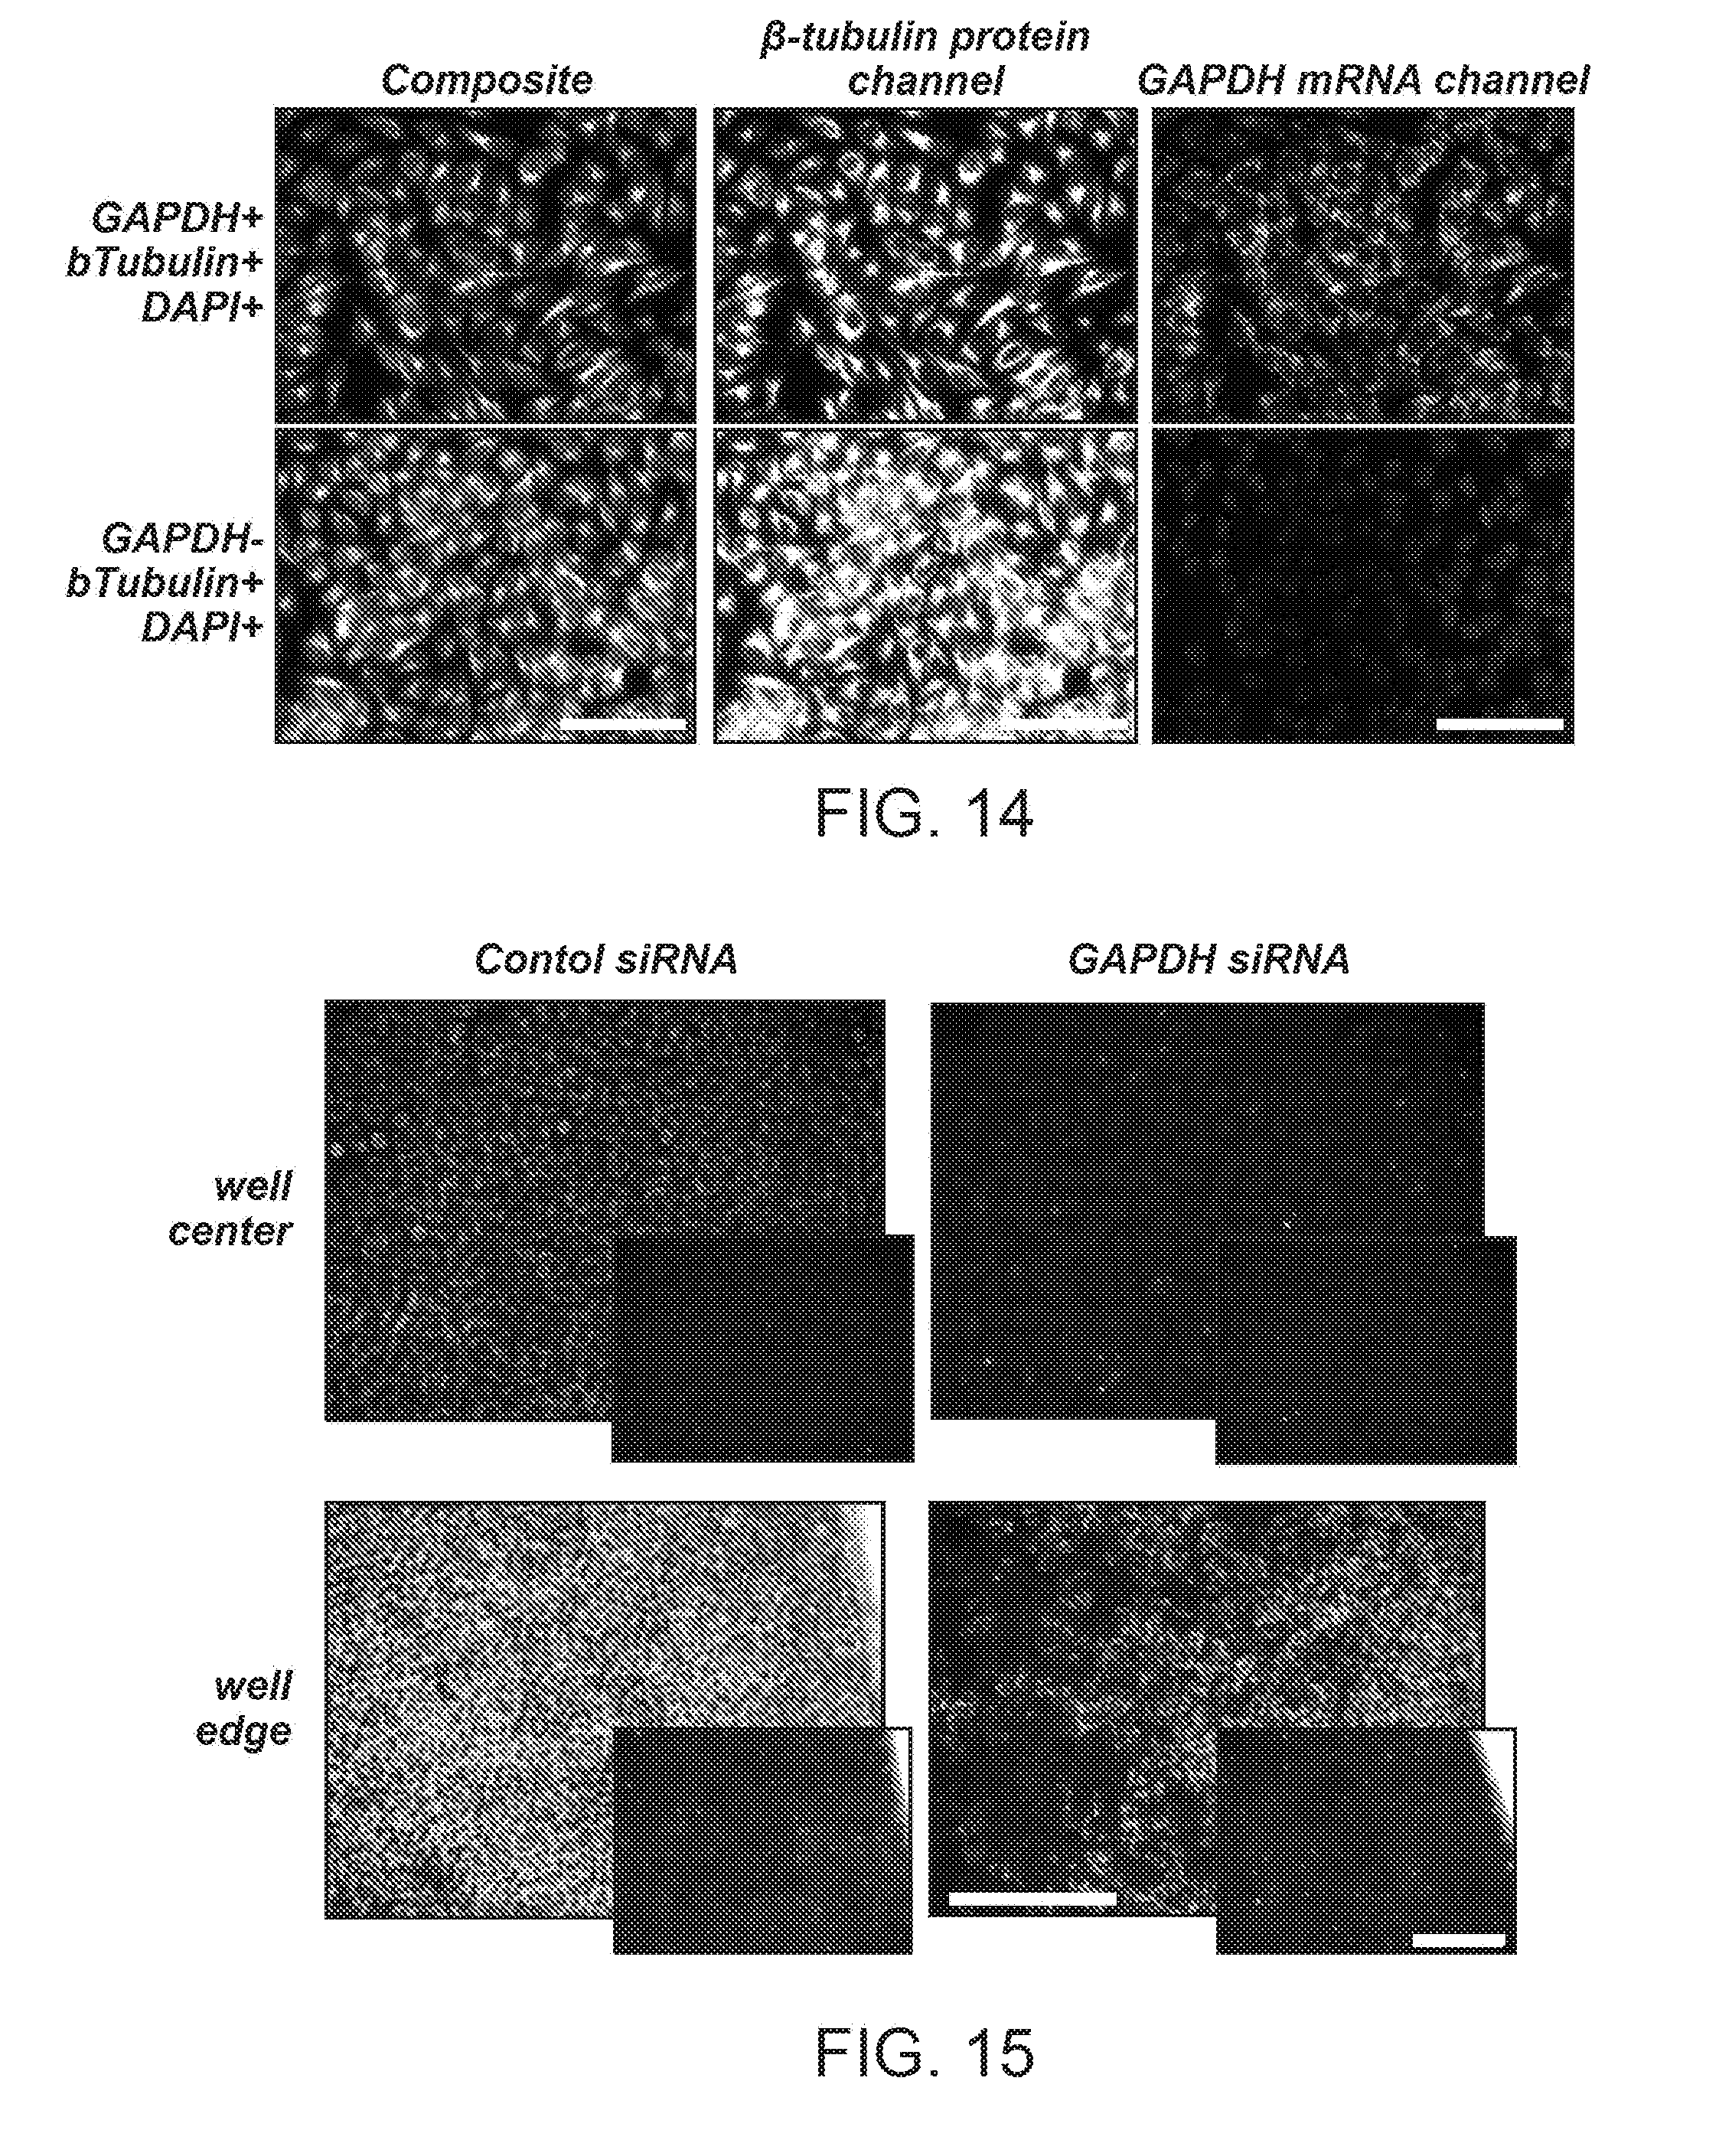
D00016

D00017

D00018

D00019

D00020

D00021

D00022

D00023

P00001

P00002

XML
uspto.report is an independent third-party trademark research tool that is not affiliated, endorsed, or sponsored by the United States Patent and Trademark Office (USPTO) or any other governmental organization. The information provided by uspto.report is based on publicly available data at the time of writing and is intended for informational purposes only.
While we strive to provide accurate and up-to-date information, we do not guarantee the accuracy, completeness, reliability, or suitability of the information displayed on this site. The use of this site is at your own risk. Any reliance you place on such information is therefore strictly at your own risk.
All official trademark data, including owner information, should be verified by visiting the official USPTO website at www.uspto.gov. This site is not intended to replace professional legal advice and should not be used as a substitute for consulting with a legal professional who is knowledgeable about trademark law.