Analysis Of Controlled And Automatic Attention For Introduction Of Stimulus Material
Knight; Robert T. ; et al.
U.S. patent application number 16/360282 was filed with the patent office on 2019-07-18 for analysis of controlled and automatic attention for introduction of stimulus material. The applicant listed for this patent is The Nielsen Company (US), LLC. Invention is credited to Ramachandran Gurumoorthy, Robert T. Knight, Anantha Pradeep.
| Application Number | 20190220888 16/360282 |
| Document ID | / |
| Family ID | 43926149 |
| Filed Date | 2019-07-18 |


| United States Patent Application | 20190220888 |
| Kind Code | A1 |
| Knight; Robert T. ; et al. | July 18, 2019 |
ANALYSIS OF CONTROLLED AND AUTOMATIC ATTENTION FOR INTRODUCTION OF STIMULUS MATERIAL
Abstract
An example system disclosed herein includes an analyzer to determine a first priming characteristic of media at a first location based on first neuro-response data and determine a second priming characteristic of the media at the second location based on second neuro-response data. The example system includes a selector to select a third location in the media after the first location or a fourth location in the media after the second location as a candidate location for introduction of advertising material based on the first priming characteristic and the second priming characteristic. The selector is to select the third location when the first priming characteristic indicates increased receptivity to the advertising material at the first location relative to the second priming characteristic and select the fourth location when the second priming characteristic indicates increased receptivity to the advertising material at the second location relative to the first priming characteristic.
| Inventors: | Knight; Robert T.; (Berkeley, CA) ; Gurumoorthy; Ramachandran; (Berkeley, CA) ; Pradeep; Anantha; (Berkeley, CA) | ||||||||||
| Applicant: |
|
||||||||||
|---|---|---|---|---|---|---|---|---|---|---|---|
| Family ID: | 43926149 | ||||||||||
| Appl. No.: | 16/360282 | ||||||||||
| Filed: | March 21, 2019 |
Related U.S. Patent Documents
| Application Number | Filing Date | Patent Number | ||
|---|---|---|---|---|
| 16037666 | Jul 17, 2018 | 10269036 | ||
| 16360282 | ||||
| 15299752 | Oct 21, 2016 | 10068248 | ||
| 16037666 | ||||
| 12608660 | Oct 29, 2009 | 9560984 | ||
| 15299752 | ||||
| Current U.S. Class: | 1/1 |
| Current CPC Class: | G06Q 30/0244 20130101; A61B 5/0484 20130101; A61B 5/163 20170801; A61B 5/16 20130101; G06Q 30/0269 20130101 |
| International Class: | G06Q 30/02 20060101 G06Q030/02; A61B 5/0484 20060101 A61B005/0484; A61B 5/16 20060101 A61B005/16 |
Claims
1. A system comprising: an analyzer to: determine a first attention level of a user exposed to source material based on first neuro-response data, the first neuro-response data gathered from the user while the user is exposed to the source material at a first time; determine a second attention level of the user exposed to a first stimulus at a first location in the source material based on second neuro-response data, the second neuro-response data gathered from the user while the user is exposed to the first stimulus at the first location at a second time; determine a third attention level of the user exposed to a second stimulus at a second location in the source material based on third neuro-response data, the third neuro-response data gathered from the user while the user is exposed to the second stimulus at the second location at a third time, the second location different from the first location; determine a first change between the first attention level and the second attention level; and determine a second change between the first attention level and the third attention level; and a selector to select at least one of the first location or the second location as a candidate location for introduction of advertising material based on the first change and the second change, the selector to select the first location when the first change indicates increased attention to the first stimulus relative to the source material and the selector to select the second location when the second change indicates increased attention to the second stimulus relative to the source material.
2. The system of claim 1, wherein the first attention level is a controlled attention level of the user for the source material at the first time and the second attention level is a controlled attention level of the user at the first location in the source material.
3. The system of claim 1, wherein the third attention level is an automatic attention level of the user at the second location in the source material.
4. The system of claim 1, wherein the analyzer is to determine the first change based on first event-related potential data in the first neuro-response data and second event-related potential in the second neuro-response data.
5. The system of claim 1, wherein the first location is a first spatial location in the source material and the second location is a second spatial location in the source material, the second spatial location proximate to the first spatial location.
6. The system of claim 1, wherein the first location is a first temporal location in the source material and the second location is a second temporal location in the source material, the second temporal location proximate to the first temporal location in time.
7. The system of claim 1, wherein the selector is to select the second location as the candidate location and the analyzer is to: determine a fourth attention level of the user exposed to a third stimulus at a third location in the source material based on fourth neuro-response data, the fourth neuro-response data gathered from the user while the user is exposed to the third stimulus at the third location at a fourth time, the third location different from the first location; determine a third change between the second attention level and the fourth attention level; and one of maintain or modify the selection of the second location as the candidate location based on the third change.
8. The system of claim 1, wherein the analyzer is to perform a comparison of the first change and the second change and the selector is to select one of the first location or the second location based on the comparison.
9. A tangible machine readable storage device or storage disc comprising instruction that, when executed by at least one processor, cause the at least one processor to: determine a first attention level of a user exposed to source material based on first neuro-response data, the first neuro-response data gathered from the user while the user is exposed to the source material at a first time; determine a second attention level of the user exposed to a first stimulus at a first location in the source material based on second neuro-response data, the second neuro-response data gathered from the user while the user is exposed to the first stimulus at the first location at a second time; determine a third attention level of the user exposed to a second stimulus at a second location in the source material based on third neuro-response data, the third neuro-response data gathered from the user while the user is exposed to the second stimulus at the second location at a third time, the second location different from the first location; determine a first change between the first attention level and the second attention level; determine a second change between the first attention level and the third attention level; and select at least one of the first location or the second location as a candidate location for introduction of advertising material based on the first change and the second change, the instructions to cause the at least one processor to select the first location when the first change indicates increased attention to the first stimulus relative to the source material and to select the second location when the second change indicates increased attention to the second stimulus relative to the source material.
10. The storage device or storage disc of claim 9, wherein the first attention level is a controlled attention level of the user for the source material at the first time and the second attention level is a controlled attention level of the user at the first location in the source material.
11. The storage device or storage disc of claim 9, wherein the third attention level is an automatic attention level of the user at the second location in the source material.
12. The storage device or storage disc of claim 9, wherein the instructions, when executed, further cause the at least one processor to determine the first change based on first event-related potential data in the first neuro-response data and second event-related potential in the second neuro-response data.
13. The storage device or storage disc of claim 9, wherein the first location is a first spatial location in the source material and the second location is a second spatial location in the source material, the second spatial location proximate to the first spatial location.
14. The storage device or storage disc of claim 9, wherein the first location is a first temporal location in the source material and the second location is a second temporal location in the source material, the second temporal location proximate to the first temporal location in time.
15. The storage device or storage disc of claim 9, wherein the second location is the candidate location and the instructions, when executed, further cause the at least one processor: determine a fourth attention level of the user exposed to a third stimulus at a third location in the source material based on fourth neuro-response data, the fourth neuro-response data gathered from the user while the user is exposed to the third stimulus at the third location at a fourth time, the third location different from the first location; determine a third change between the second attention level and the fourth attention level; and one of maintain or modify the selection of the second location as the candidate location based on the third change.
16. The storage device or storage disc of claim 9, wherein the instructions, when executed, further cause the at least one processor to perform a comparison of the first change and the second change and select one of the first location or the second location based on the comparison.
17. A system comprising: means for measuring neuro-response data from a subject exposed to source material, the means for measuring to obtain: first neuro-response data from the user while the user is exposed to the source material at a first time; second neuro-response data from the user while the user is exposed to the first stimulus at the first location at a second time; and third neuro-response data gathered from the user while the user is exposed to the second stimulus at the second location at a third time, the second location different from the first location; means for analyzing to: determine a first attention level of the use based on the first neuro-response data; determine a second attention level of the user based on the second neuro-response data; determine a third attention level of the user based on the third neuro-response data; determine a first change between the first attention level and the second attention level; and determine a second change between the first attention level and the third attention level; and means for selecting a candidate location in the source material for introduction of advertising material, the means for selecting to: select at least one of the first location or the second location as a candidate location for introduction of advertising material based on the first change and the second change, the means for selecting to select the first location when the first change indicates increased attention to the first stimulus relative to the source material and to select the second location when the second change indicates increased attention to the second stimulus relative to the source material.
18. The system of claim 17, wherein the first attention level is a controlled attention level of the user for the source material at the first time and the second attention level is a controlled attention level of the user at the first location in the source material.
19. The system of claim 17, wherein the third attention level is an automatic attention level of the user at the second location in the source material.
20. The system of claim 17, wherein the means for analyzing is to determine the first change based on first event-related potential data in the first neuro-response data and second event-related potential in the second neuro-response data.
Description
RELATED APPLICATIONS
[0001] This patent arises from a continuation of U.S. application Ser. No. 16/037,666, titled "Analysis of Controlled and Automatic Attention for Introduction of Stimulus Material," and filed on Jul. 17, 2018. U.S. application Ser. No. 16/037,666 is a continuation of U.S. application Ser. No. 15/299,752, titled "Analysis of Controlled and Automatic Attention for Introduction of Stimulus Material," and filed on Oct. 21, 2016. U.S. application Ser. No. 15/299,752 is a continuation of U.S. application Ser. No. 12/608,660, now U.S. Pat. No. 9,560,984, titled "Analysis of Controlled and Automatic Attention for Introduction of Stimulus Material," and filed on Oct. 29, 2009. U.S. application Ser. No. 16/037,666, U.S. application Ser. No. 15/299,752, and U.S. application Ser. No. 12/608,660 are incorporated herein by this reference in their entireties.
[0002] This patent is related to U.S. patent application Ser. No. 12/056,190; U.S. patent application Ser. No. 12/056,211; U.S. patent application Ser. No. 12/056,221; U.S. patent application Ser. No. 12/056,225; U.S. patent application Ser. No. 12/113,863; U.S. patent application Ser. No. 12/113,870; U.S. patent application Ser. No. 12/122,240; U.S. patent application Ser. No. 12/122,253; U.S. patent application Ser. No. 12/122,262; U.S. patent application Ser. No. 12/135,066; U.S. patent application Ser. No. 12/135,074; U.S. patent application Ser. No. 12/182,851; U.S. patent application Ser. No. 12/182,874; U.S. patent application Ser. No. 12/199,557; U.S. patent application Ser. No. 12/199,583; U.S. patent application Ser. No. 12/199,596; U.S. patent application Ser. No. 12/200,813; U.S. patent application Ser. No. 12/234,372; U.S. patent application Ser. No. 12/135,069; U.S. patent application Ser. No. 12/234,388; U.S. patent application Ser. No. 12/544,921; U.S. patent application Ser. No. 12/544,958; U.S. patent application Ser. No. 12/546,586; U.S. patent application Ser. No. 12/410,380; U.S. patent application Ser. No. 12/410,372; U.S. patent application Ser. No. 12/413,297; U.S. patent application Ser. No. 12/545,455; U.S. patent application Ser. No. 12/544,934; U.S. patent application Ser. No. 12/608,685; U.S. patent application Ser. No. 13/444,149; U.S. patent application Ser. No. 12/608,696; U.S. patent application Ser. No. 12/731,868; U.S. patent application Ser. No. 13/045,457; U.S. patent application Ser. No. 12/778,810; U.S. patent application Ser. No. 12/778,828; U.S. patent application Ser. No. 13/104,821; U.S. patent application Ser. No. 13/104,840; U.S. patent application Ser. No. 12/846,242; U.S. patent application Ser. No. 12/853,197; U.S. patent application Ser. No. 12/884,034; U.S. patent application Ser. No. 12/868,531; U.S. patent application Ser. No. 12/913,102; U.S. patent application Ser. No. 12/853,213; U.S. patent application Ser. No. 13/105,774; U.S. patent application Ser. No. 13/569,711; U.S. patent application Ser. No. 13/708,525; U.S. patent application Ser. No. 13/708,344; U.S. patent application Ser. No. 13/730,511; U.S. patent application Ser. No. 13/730,550; U.S. patent application Ser. No. 13/730,541; U.S. patent application Ser. No. 13/730,564; U.S. patent application Ser. No. 13/965,805; U.S. patent application Ser. No. 13/945,357; and U.S. patent application Ser. No. 14/177,698.
FIELD OF THE DISCLOSURE
[0003] The present disclosure relates to analysis of controlled and automatic attention.
BACKGROUND
[0004] Conventional systems for placing stimulus material such as a media clip, product, brand image, message, purchase offer, product offer, etc., are limited. Some placement systems are based on demographic information, statistical data, and survey based response collection. However, conventional systems are subject to semantic, syntactic, metaphorical, cultural, and interpretive errors.
[0005] Consequently, it is desirable to provide improved methods and apparatus for introducing stimulus material.
BRIEF DESCRIPTION OF THE DRAWINGS
[0006] The disclosure may best be understood by reference to the following description taken in conjunction with the accompanying drawings, which illustrate particular examples.
[0007] FIG. 1 illustrates one example of a system for neuro-response analysis.
[0008] FIG. 2 illustrates examples of stimulus attributes that can be included in a stimulus attributes repository.
[0009] FIG. 3 illustrates examples of data models that can be used with a stimulus and response repository.
[0010] FIG. 4 illustrates one example of a query that can be used with a stimulus location selection system.
[0011] FIG. 5 illustrates one example of a report generated using the automatic and controlled attention analysis system.
[0012] FIG. 6 illustrates one example of a technique for performing automatic and controlled attention location assessment.
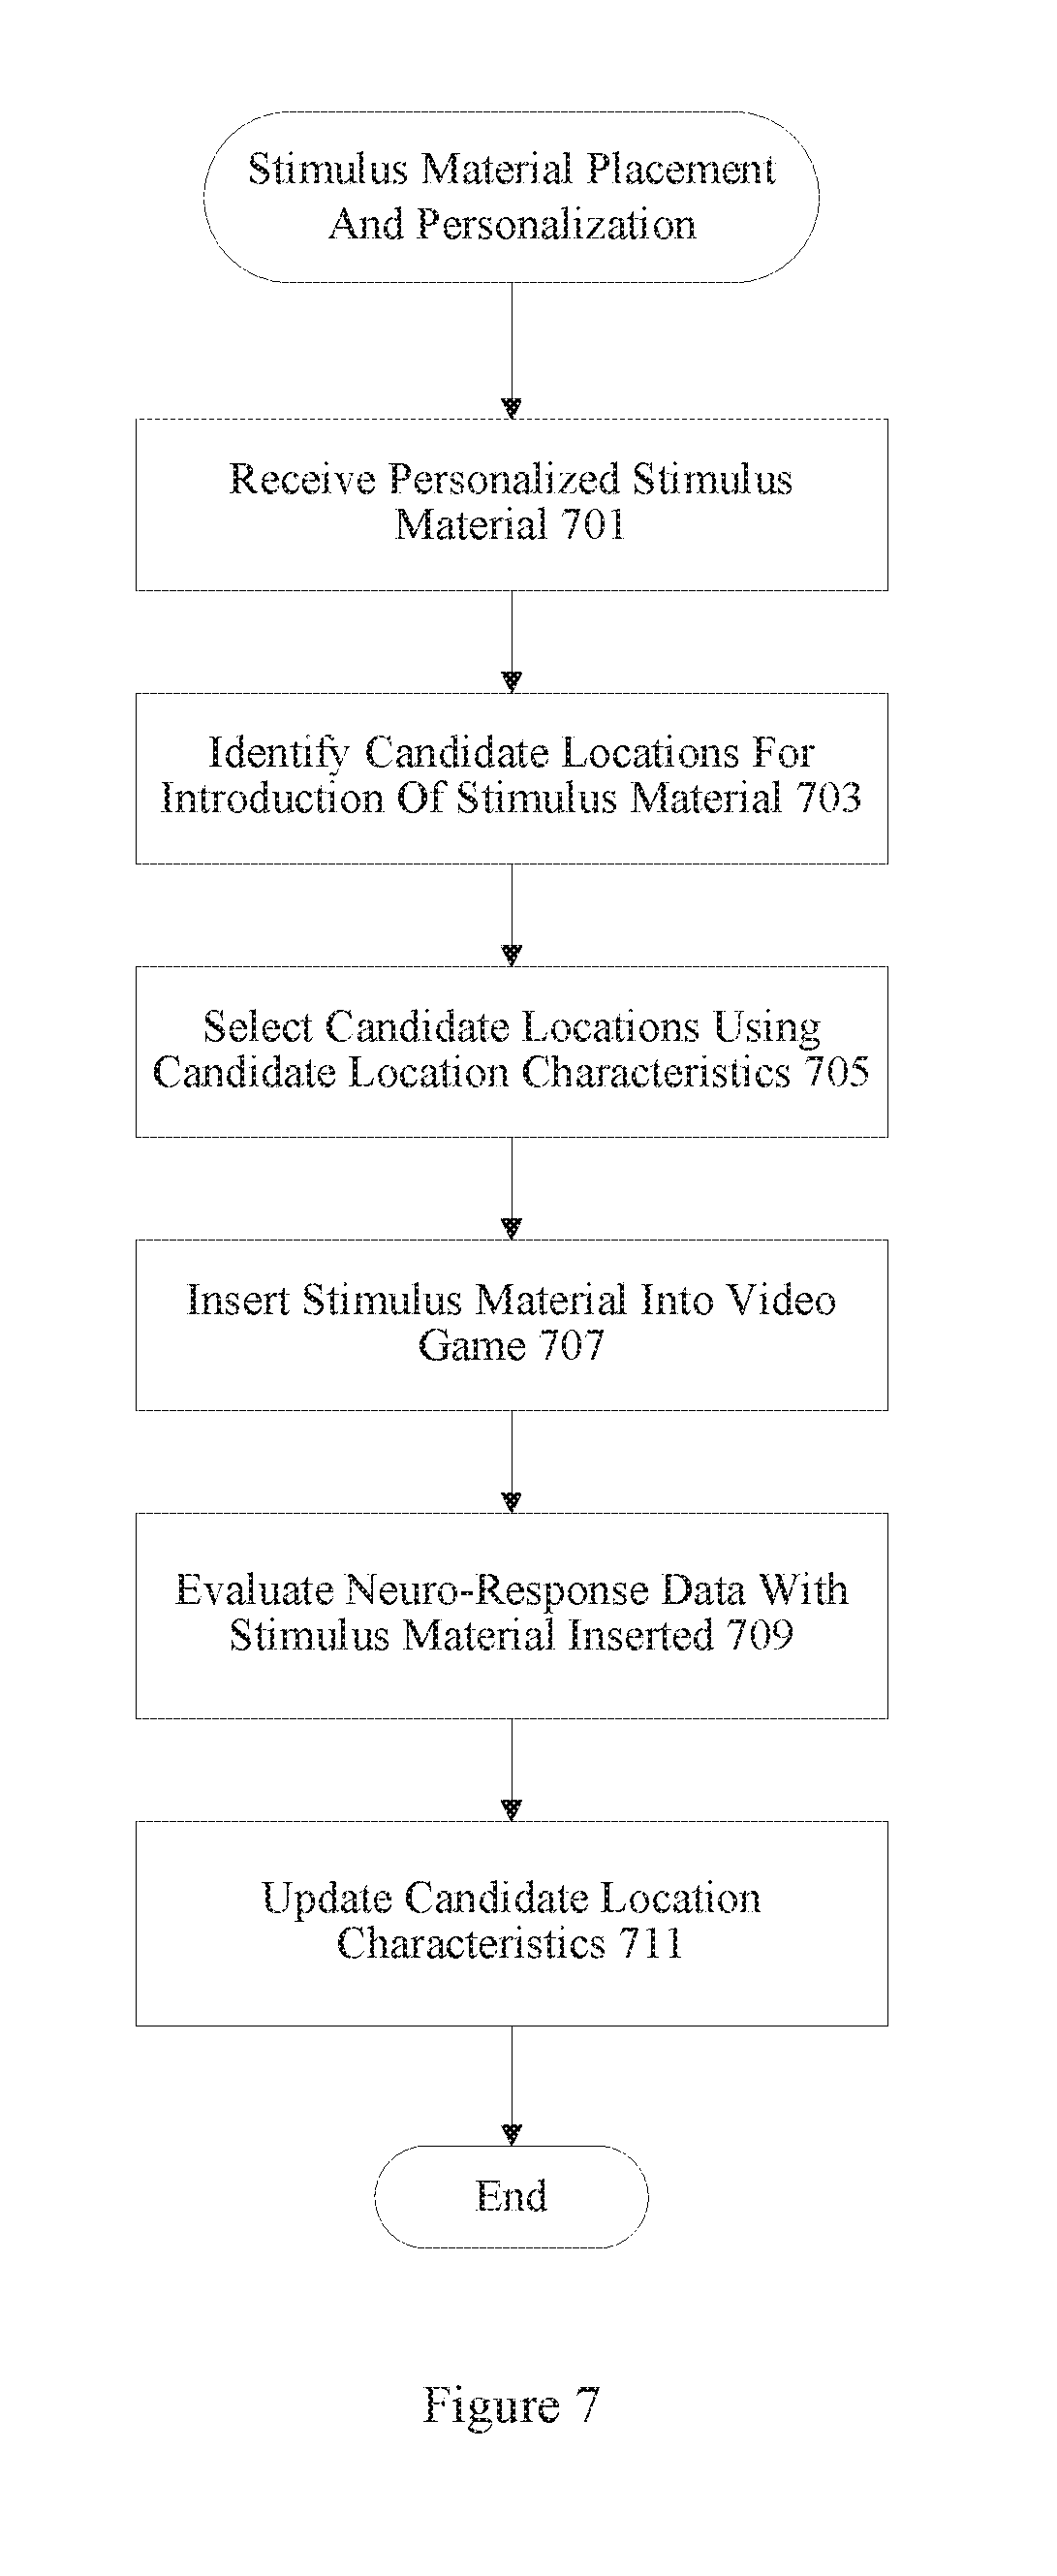
[0013] FIG. 7 illustrates one example of technique for introducing additional stimulus materials.
[0014] FIG. 8 provides one example of a system that can be used to implement one or more mechanisms.
DETAILED DESCRIPTION
[0015] Reference will now be made in detail to some specific examples of the disclosure including the best modes contemplated by the inventors for carrying out the disclosure. Examples are illustrated in the accompanying drawings. While the disclosure is described in conjunction with these specific examples, it will be understood that it is not intended to limit the disclosure to the described examples. On the contrary, it is intended to cover alternatives, modifications, and equivalents as may be included within the spirit and scope of the disclosure as defined by the appended claims.
[0016] For example, the techniques and mechanisms of the present disclosure will be described in the context of particular types of data such as central nervous system, autonomic nervous system, and effector data. However, it should be noted that the techniques and mechanisms of the present disclosure apply to a variety of different types of data. It should be noted that various mechanisms and techniques can be applied to any type of stimuli. In the following description, numerous specific details are set forth in order to provide a thorough understanding of the present disclosure. Particular examples may be implemented without some or all of these specific details. In other instances, well known process operations have not been described in detail in order not to unnecessarily obscure the present disclosure.
[0017] Various techniques and mechanisms of the present disclosure will sometimes be described in singular form for clarity. However, it should be noted that some examples include multiple iterations of a technique or multiple instantiations of a mechanism unless noted otherwise. For example, a system uses a processor in a variety of contexts. However, it will be appreciated that a system can use multiple processors while remaining within the scope of the present disclosure unless otherwise noted. Furthermore, the techniques and mechanisms of the present disclosure will sometimes describe a connection between two entities. It should be noted that a connection between two entities does not necessarily mean a direct, unimpeded connection, as a variety of other entities may reside between the two entities. For example, a processor may be connected to memory, but it will be appreciated that a variety of bridges and controllers may reside between the processor and memory. Consequently, a connection does not necessarily mean a direct, unimpeded connection unless otherwise noted.
Overview
[0018] A system analyzes neuro-response measurements including regional electroencephalography (EEG) measurements from subjects exposed to stimulus materials to determine locations in stimulus materials eliciting controlled attention and automatic attention. Additional stimulus materials are inserted into locations having salient attention attributes. In some examples, a challenging task is used to direct controlled attention onto a location and additional stimulus material is subtly presented in the location to benefit from automatic attention and salient attention measurements.
Examples
[0019] Conventional placement systems such as product placement systems often rely on demographic information, statistical information, and survey based response collection to determine optimal locations to place stimulus material, such as a new product, a brand image, a video clip, sound files, etc. One problem with conventional stimulus placement systems is that conventional stimulus placement systems do not accurately measure the responses to components of the experience. They are also prone to semantic, syntactic, metaphorical, cultural, and interpretive errors thereby preventing the accurate and repeatable selection of stimulus placement locations.
[0020] Conventional systems do not use neuro-response measurements in evaluating spatial and temporal locations for personalized stimulus placement. The techniques and mechanisms of the present disclosure use neuro-response measurements such as central nervous system, autonomic nervous system, and effector measurements to improve stimulus location selection and stimulus personalization in video games. Some examples of central nervous system measurement mechanisms include Functional Magnetic Resonance Imaging (fMRI), Electroencephalography (EEG), and optical imaging. fMRI measures blood oxygenation in the brain that correlates with increased neural activity. However, current implementations of fMRI have poor temporal resolution of few seconds. EEG measures electrical activity associated with post synaptic currents occurring in the milliseconds range. Subcranial EEG can measure electrical activity with the most accuracy, as the bone and dermal layers weaken transmission of a wide range of frequencies. Nonetheless, surface EEG provides a wealth of electrophysiological information if analyzed properly. Even portable EEG with dry electrodes provides a large amount of neuro-response information.
[0021] Autonomic nervous system measurement mechanisms include Galvanic Skin Response (GSR), Electrocardiograms (EKG), pupillary dilation, etc. Effector measurement mechanisms include Electrooculography (EOG), eye tracking, facial emotion encoding, reaction time etc.
[0022] Many types of stimulus material may be placed into media. In some examples, brand images or messages are introduced into a movie or game. Text advertisements may be placed onto a prop in a video game scene or audio clips may be added to a music file. In some examples, a button to allow a player to purchase an item is provided in a neurologically salient location. Any type of stimulus material may be added to media materials such as movies, programs, texts, offers, games, etc.
[0023] However, stimulus material may often go unnoticed or may be ignored all together. Conventional mechanisms for eliciting user attention for stimulus materials in media materials are limited. According to various examples, a controlled and automatic attention analysis system analyzes media materials such as video games and video game scenes to determine candidate locations for introducing stimulus material. Each candidate location may be tagged with characteristics such as high retention placement, high attention location, good priming characteristics, etc. According to various examples, candidate locations are neurologically salient locations. When personalized stimulus is received, one of the candidate locations can be selected for placing the personalized stimulus material. Attention includes controlled attention and automatic attention. Regional EEG, particularly measurements in the frontal cortex, can be used to identify attention. If a search or task is difficult, the frontal cortex becomes involved. Saliency of attention can also be analyzed using EEG and/or other neuro-response mechanisms.
[0024] According to various examples, stimulus material is an advertisement or purchase offer tailored to a particular viewer. A controlled and automatic attention analysis mechanism may incorporate relationship assessments using brain regional coherence measures of segments of the stimuli relevant to the entity/relationship, segment effectiveness measures synthesizing the attention, emotional engagement and memory retention estimates based on the neuro-physiological measures including time-frequency analysis of EEG measurements, and differential saccade related neural signatures during segments where coupling/relationship patterns are emerging in comparison to segments with non-coupled interactions. In particular examples, specific event related potential (ERP) analyses and/or event related power spectral perturbations (ERPSPs) are evaluated for different regions of the brain both before a subject is exposed to media materials to evaluate controlled and automatic attention and determine locations for introduction of stimulus materials. In particular examples, a task is used to direct a user's controlled attention toward a particular object and stimulus material is introduced at or near the particular object to elicit automatic attention.
[0025] Pre-stimulus and post-stimulus differential as well as target and distracter differential measurements of ERP time domain components at multiple regions of the brain are determined (DERP). Event related time-frequency analysis of the differential response to assess the attention, emotion and memory retention (DERPSPs) across multiple frequency bands including but not limited to theta, alpha, beta, gamma and high gamma is performed. In particular examples, single trial and/or averaged DERP and/or DERPSPs can be used to enhance selection of stimulus locations.
[0026] FIG. 1 illustrates one example of a system for performing controlled and automatic attention analysis system using neuro-response data. According to various examples, the stimulus location selection and personalization system includes a stimulus presentation device 101. In particular examples, the stimulus presentation device 101 is merely a display, monitor, screen, etc., that displays scenes of a video game to a user. Video games may include action, strategy, puzzle, simulation, role-playing, and other computer games. The stimulus presentation device 101 may also include one or more controllers used to control and interact with aspects of the video game. Controllers may include keyboards, steering wheels, motion controllers, touchpads, joysticks, control pads, etc.
[0027] According to various examples, the subjects 103 are connected to data collection devices 105. The data collection devices 105 may include a variety of neuro-response measurement mechanisms including neurological and neurophysiological measurements systems such as EEG, EOG, GSR, EKG, pupillary dilation, eye tracking, facial emotion encoding, and reaction time devices, etc. According to various examples, neuro-response data includes central nervous system, autonomic nervous system, and effector data. In particular examples, the data collection devices 105 include EEG 111, EOG 113, and GSR 115. In some instances, only a single data collection device is used. Data collection may proceed with or without human supervision.
[0028] The data collection device 105 collects neuro-response data from multiple sources. This includes a combination of devices such as central nervous system sources (EEG), autonomic nervous system sources (GSR, EKG, pupillary dilation), and effector sources (EOG, eye tracking, facial emotion encoding, reaction time). In particular examples, data collected is digitally sampled and stored for later analysis. In particular examples, the data collected could be analyzed in real-time. According to particular examples, the digital sampling rates are adaptively chosen based on the neurophysiological and neurological data being measured.
[0029] In one particular examples, the stimulus location selection system includes EEG 111 measurements made using scalp level electrodes, EOG 113 measurements made using shielded electrodes to track eye data, GSR 115 measurements performed using a differential measurement system, a facial muscular measurement through shielded electrodes placed at specific locations on the face, and a facial affect graphic and video analyzer adaptively derived for each individual.
[0030] In particular examples, the data collection devices are clock synchronized with a stimulus presentation device 101. In particular examples, the data collection devices 105 also include a condition evaluation subsystem that provides auto triggers, alerts and status monitoring and visualization components that continuously monitor the status of the subject, data being collected, and the data collection instruments. The condition evaluation subsystem may also present visual alerts and automatically trigger remedial actions. According to various examples, the data collection devices include mechanisms for not only monitoring subject neuro-response to stimulus materials, but also include mechanisms for identifying and monitoring the stimulus materials. For example, data collection devices 105 may be synchronized with a set-top box to monitor channel changes. In other examples, data collection devices 105 may be directionally synchronized to monitor when a subject is no longer paying attention to stimulus material. In still other examples, the data collection devices 105 may receive and store stimulus material generally being viewed by the subject, whether the stimulus is a program, a commercial, printed material, an experience, or a scene outside a window. The data collected allows analysis of neuro-response information and correlation of the information to actual stimulus material and not mere subject distractions.
[0031] According to various examples, the stimulus location selection system also includes a data cleanser device 121. In particular examples, the data cleanser device 121 filters the collected data to remove noise, artifacts, and other irrelevant data using fixed and adaptive filtering, weighted averaging, advanced component extraction (like PCA, ICA), vector and component separation methods, etc. This device cleanses the data by removing both exogenous noise (where the source is outside the physiology of the subject, e.g. a phone ringing while a subject is viewing a video) and endogenous artifacts (where the source could be neurophysiological, e.g. muscle movements, eye blinks, etc.).
[0032] The artifact removal subsystem includes mechanisms to selectively isolate and review the response data and identify epochs with time domain and/or frequency domain attributes that correspond to artifacts such as line frequency, eye blinks, and muscle movements. The artifact removal subsystem then cleanses the artifacts by either omitting these epochs, or by replacing these epoch data with an estimate based on the other clean data (for example, an EEG nearest neighbor weighted averaging approach).
[0033] According to various examples, the data cleanser device 121 is implemented using hardware, firmware, and/or software. It should be noted that although a data cleanser device 121 is shown located after a data collection device 105 and before data analyzer 181, the data cleanser device 121 like other components may have a location and functionality that varies based on system implementation. For example, some systems may not use any automated data cleanser device whatsoever while in other systems, data cleanser devices may be integrated into individual data collection devices.
[0034] According to various examples, an optional stimulus attributes repository 131 provides information on the stimulus material being presented to the multiple subjects. According to various examples, stimulus attributes include properties of the stimulus materials as well as purposes, presentation attributes, report generation attributes, etc. In particular examples, stimulus attributes include time span, channel, rating, media, type, etc. Stimulus attributes may also include positions of entities in various frames, components, events, object relationships, locations of objects and duration of display. Purpose attributes include aspiration and objects of the stimulus including excitement, memory retention, associations, etc. Presentation attributes include audio, video, imagery, and messages needed for enhancement or avoidance. Other attributes may or may not also be included in the stimulus attributes repository or some other repository.
[0035] The data cleanser device 121 and the stimulus attributes repository 131 pass data to the data analyzer 181. The data analyzer 181 uses a variety of mechanisms to analyze underlying data in the system to place stimulus. According to various examples, the data analyzer customizes and extracts the independent neurological and neuro-physiological parameters for each individual in each modality, and blends the estimates within a modality as well as across modalities to elicit an enhanced response to the presented stimulus material. In particular examples, the data analyzer 181 aggregates the response measures across subjects in a dataset.
[0036] According to various examples, neurological and neuro-physiological signatures are measured using time domain analyses and frequency domain analyses. Such analyses use parameters that are common across individuals as well as parameters that are unique to each individual. The analyses could also include statistical parameter extraction and fuzzy logic based attribute estimation from both the time and frequency components of the synthesized response.
[0037] In some examples, statistical parameters used in a blended effectiveness estimate include evaluations of skew, peaks, first and second moments, population distribution, as well as fuzzy estimates of attention, emotional engagement and memory retention responses.
[0038] According to various examples, the data analyzer 181 may include an intra-modality response synthesizer and a cross-modality response synthesizer. In particular examples, the intra-modality response synthesizer is configured to customize and extract the independent neurological and neurophysiological parameters for each individual in each modality and blend the estimates within a modality analytically to elicit an enhanced response to the presented stimuli. In particular embodiments, the intra-modality response synthesizer also aggregates data from different subjects in a dataset.
[0039] According to various examples, the cross-modality response synthesizer or fusion device blends different intra-modality responses, including raw signals and signals output. The combination of signals enhances the measures of effectiveness within a modality. The cross-modality response fusion device can also aggregate data from different subjects in a dataset.
[0040] According to various examples, the data analyzer 181 also includes a composite enhanced effectiveness estimator (CEEE) that combines the enhanced responses and estimates from each modality to provide a blended estimate of the effectiveness. In particular examples, blended estimates are provided for each exposure of a subject to stimulus materials. The blended estimates are evaluated over time to assess stimulus location characteristics. According to various examples, numerical values are assigned to each blended estimate. The numerical values may correspond to the intensity of neuro-response measurements, the significance of peaks, the change between peaks, etc. Higher numerical values may correspond to higher significance in neuro-response intensity. Lower numerical values may correspond to lower significance or even insignificant neuro-response activity. In other examples, multiple values are assigned to each blended estimate. In still other examples, blended estimates of neuro-response significance are graphically represented to show changes after repeated exposure.
[0041] According to various examples, the data analyzer 181 provides analyzed and enhanced response data to a data communication device 183. It should be noted that in particular instances, a data communication device 183 is not necessary. According to various examples, the data communication device 183 provides raw and/or analyzed data and insights. In particular examples, the data communication device 183 may include mechanisms for the compression and encryption of data for secure storage and communication.
[0042] According to various examples, the data communication device 183 transmits data using protocols such as the File Transfer Protocol (FTP), Hypertext Transfer Protocol (HTTP) along with a variety of conventional, bus, wired network, wireless network, satellite, and proprietary communication protocols. The data transmitted can include the data in its entirety, excerpts of data, converted data, and/or elicited response measures. According to various examples, the data communication device is a set top box, wireless device, computer system, etc. that transmits data obtained from a data collection device to a response integration system. In particular examples, the data communication device may transmit data even before data cleansing or data analysis. In other examples, the data communication device may transmit data after data cleansing and analysis.
[0043] In particular examples, the data communication device 183 sends data to a response integration system 185. According to various examples, the response integration system 185 assesses and extracts controlled and automatic attention characteristics. In particular examples, the response integration system 185 determines entity positions in various stimulus segments and matches position information with eye tracking paths while correlating saccades with neural assessments of attention, memory retention, and emotional engagement. In particular examples, the response integration system 185 also collects and integrates user behavioral and survey responses with the analyzed response data to more effectively select stimulus locations.
[0044] A variety of data can be stored for later analysis, management, manipulation, and retrieval. In particular examples, the repository could be used for tracking stimulus attributes and presentation attributes, audience responses and optionally could also be used to integrate audience measurement information.
[0045] As with a variety of the components in the system, the response integration system can be co-located with the rest of the system and the user, or could be implemented in a remote location. It could also be optionally separated into an assessment repository system that could be centralized or distributed at the provider or providers of the stimulus material. In other examples, the response integration system is housed at the facilities of a third party service provider accessible by stimulus material providers and/or users. A stimulus placement system 187 identifies temporal and spatial locations along with personalized material for introduction into the stimulus material. The personalized stimulus material introduced into a video game can be reintroduced to check the effectiveness of the placements.
[0046] FIG. 2 illustrates examples of data models that may be provided with a stimulus attributes repository. According to various examples, a stimulus attributes data model 201 includes a video game 203, rating 205, time span 207, audience 209, and demographic information 211. A stimulus purpose data model 213 may include intents 215 and objectives 217. According to various examples, stimulus attributes data model 201 also includes candidate location information 219 about various temporal, spatial, activity, and event components in an experience that may hold stimulus material. For example, a video game may show a blank wall included on some scenes that can be used to display an advertisement. The temporal and spatial characteristics of the blank wall may be provided in candidate location information 219.
[0047] According to various examples, another stimulus attributes data model 221 includes creation attributes 223, ownership attributes 225, broadcast attributes 227, and statistical, demographic and/or survey based identifiers 229 for automatically integrating the neuro-physiological and neuro-behavioral response with other attributes and meta-information associated with the stimulus.
[0048] FIG. 3 illustrates examples of data models that can be used for storage of information associated with selection of locations for the introduction of stimulus material. According to various examples, a dataset data model 301 includes an experiment name 303 and/or identifier, client attributes 305, a subject pool 307, logistics information 309 such as the location, date, and time of testing, and stimulus material 311 including stimulus material attributes.
[0049] In particular examples, a subject attribute data model 315 includes a subject name 317 and/or identifier, contact information 321, and demographic attributes 319 that may be useful for review of neurological and neuro-physiological data. Some examples of pertinent demographic attributes include marriage status, employment status, occupation, household income, household size and composition, ethnicity, geographic location, sex, race. Other fields that may be included in data model 315 include shopping preferences, entertainment preferences, and financial preferences. Shopping preferences include favorite stores, shopping frequency, categories shopped, favorite brands. Entertainment preferences include network/cable/satellite access capabilities, favorite shows, favorite genres, and favorite actors. Financial preferences include favorite insurance companies, preferred investment practices, banking preferences, and favorite online financial instruments. A variety of subject attributes may be included in a subject attributes data model 315 and data models may be preset or custom generated to suit particular purposes.
[0050] According to various examples, data models for neuro-feedback association 325 identify experimental protocols 327, modalities included 329 such as EEG, EOG, GSR, surveys conducted, and experiment design parameters 333 such as segments and segment attributes. Other fields may include experiment presentation scripts, segment length, segment details like stimulus material used, inter-subject variations, intra-subject variations, instructions, presentation order, survey questions used, etc. Other data models may include a data collection data model 337. According to various examples, the data collection data model 337 includes recording attributes 339 such as station and location identifiers, the data and time of recording, and operator details. In particular examples, equipment attributes 341 include an amplifier identifier and a sensor identifier.
[0051] Modalities recorded 343 may include modality specific attributes like EEG cap layout, active channels, sampling frequency, and filters used. EOG specific attributes include the number and type of sensors used, location of sensors applied, etc. Eye tracking specific attributes include the type of tracker used, data recording frequency, data being recorded, recording format, etc. According to various examples, data storage attributes 345 include file storage conventions (format, naming convention, dating convention), storage location, archival attributes, expiry attributes, etc.
[0052] A preset query data model 349 includes a query name 351 and/or identifier, an accessed data collection 353 such as data segments involved (models, databases/cubes, tables, etc.), access security attributes 355 included who has what type of access, and refresh attributes 357 such as the expiry of the query, refresh frequency, etc. Other fields such as push-pull preferences can also be included to identify an auto push reporting driver or a user driven report retrieval system.
[0053] FIG. 4 illustrates examples of queries that can be performed to obtain data associated with stimulus location selection and analysis of controlled and automatic attention. For example, users may query to determine what types of consumers respond most to a particular experience or component of an experience. According to various examples, queries are defined from general or customized scripting languages and constructs, visual mechanisms, a library of preset queries, diagnostic querying including drill-down diagnostics, and eliciting what if scenarios. According to various examples, subject attributes queries 415 may be configured to obtain data from a neuro-informatics repository using a location 417 or geographic information, session information 421 such as testing times and dates, and demographic attributes 419. Demographics attributes include household income, household size and status, education level, age of kids, etc.
[0054] Other queries may retrieve stimulus material based on shopping preferences of subject participants, countenance, physiological assessment, completion status. For example, a user may query for data associated with product categories, products shopped, shops frequented, subject eye correction status, color blindness, subject state, signal strength of measured responses, alpha frequency band ringers, muscle movement assessments, segments completed, etc. Experimental design based queries 425 may obtain data from a neuro-informatics repository based on experiment protocols 427, product category 429, surveys included 431, and stimulus provided 433. Other fields that may be used include the number of protocol repetitions used, combination of protocols used, and usage configuration of surveys.
[0055] Client and industry based queries may obtain data based on the types of industries included in testing, specific categories tested, client companies involved, and brands being tested. Response assessment based queries 437 may include attention scores 439, emotion scores, 441, retention scores 443, and effectiveness scores 445. Such queries may obtain materials that elicited particular scores.
[0056] Response measure profile based queries may use mean measure thresholds, variance measures, number of peaks detected, etc. Group response queries may include group statistics like mean, variance, kurtosis, p-value, etc., group size, and outlier assessment measures. Still other queries may involve testing attributes like test location, time period, test repetition count, test station, and test operator fields. A variety of types and combinations of types of queries can be used to efficiently extract data.
[0057] FIG. 5 illustrates examples of reports that can be generated. According to various examples, client assessment summary reports 501 include effectiveness measures 503, component assessment measures 505, and stimulus location effectiveness measures 507. Effectiveness assessment measures include composite assessment measure(s), industry/category/client specific placement (percentile, ranking, etc.), actionable grouping assessment such as removing material, modifying segments, or fine tuning specific elements, etc., and the evolution of the effectiveness profile over time. In particular examples, component assessment reports include component assessment measures like attention, emotional engagement scores, percentile placement, ranking, etc. Component profile measures include time based evolution of the component measures and profile statistical assessments. According to various examples, reports include the number of times material is assessed, attributes of the multiple presentations used, evolution of the response assessment measures over the multiple presentations, and usage recommendations.
[0058] According to various examples, client cumulative reports 511 include media grouped reporting 513 of all stimulus assessed, campaign grouped reporting 515 of stimulus assessed, and time/location grouped reporting 517 of stimulus assessed. According to various examples, industry cumulative and syndicated reports 521 include aggregate assessment responses measures 523, top performer lists 525, bottom performer lists 527, outliers 529, and trend reporting 531. In particular examples, tracking and reporting includes specific products, categories, companies, brands.
[0059] FIG. 6 illustrates one example of stimulus location selection using analysis of controlled and automatic attention. At 601, stimulus material is provided to multiple subjects in multiple geographic markets. According to various examples, stimulus is a video game. At 603, subject responses are collected using a variety of modalities, such as EEG, ERP, EOG, GSR, etc. In some examples, verbal and written responses can also be collected and correlated with neurological and neurophysiological responses. In other examples, data is collected using a single modality. At 605, data is passed through a data cleanser to remove noise and artifacts that may make data more difficult to interpret. According to various examples, the data cleanser removes EEG electrical activity associated with blinking and other endogenous/exogenous artifacts.
[0060] According to various examples, data analysis is performed. Data analysis may include intra-modality response synthesis and cross-modality response synthesis to enhance effectiveness measures. It should be noted that in some particular instances, one type of synthesis may be performed without performing other types of synthesis. For example, cross-modality response synthesis may be performed with or without intra-modality synthesis.
[0061] A variety of mechanisms can be used to perform data analysis. In particular examples, a stimulus attributes repository is accessed to obtain attributes and characteristics of the stimulus materials, along with purposes, intents, objectives, etc. In particular examples, EEG response data is synthesized to provide an enhanced assessment of effectiveness. According to various examples, EEG measures electrical activity resulting from thousands of simultaneous neural processes associated with different portions of the brain. EEG data can be classified in various bands. According to various examples, brainwave frequencies include delta, theta, alpha, beta, and gamma frequency ranges. Delta waves are classified as those less than 4 Hz and are prominent during deep sleep. Theta waves have frequencies between 3.5 to 7.5 Hz and are associated with memories, attention, emotions, and sensations. Theta waves are typically prominent during states of internal focus.
[0062] Alpha frequencies reside between 7.5 and 13 Hz and typically peak around 10 Hz. Alpha waves are prominent during states of relaxation. Beta waves have a frequency range between 14 and 30 Hz. Beta waves are prominent during states of motor control, long range synchronization between brain areas, analytical problem solving, judgment, and decision making. Gamma waves occur between 30 and 60 Hz and are involved in binding of different populations of neurons together into a network for the purpose of carrying out a certain cognitive or motor function, as well as in attention and memory. Because the skull and dermal layers attenuate waves in this frequency range, brain waves above 75-80 Hz are difficult to detect and are often not used for stimuli response assessment.
[0063] However, the techniques and mechanisms of the present disclosure recognize that analyzing high gamma band (kappa-band: Above 60 Hz) measurements, in addition to theta, alpha, beta, and low gamma band measurements, enhances neurological attention, emotional engagement and retention component estimates. In particular examples, EEG measurements including difficult to detect high gamma or kappa band measurements are obtained, enhanced, and evaluated. Subject and task specific signature sub-bands in the theta, alpha, beta, gamma and kappa bands are identified to provide enhanced response estimates. According to various examples, high gamma waves (kappa-band) above 80 Hz (typically detectable with sub-cranial EEG and/or magnetoencephalograophy) can be used in inverse model-based enhancement of the frequency responses to the stimuli.
[0064] Various examples of the present disclosure recognize that particular sub-bands within each frequency range have particular prominence during certain activities. A subset of the frequencies in a particular band is referred to herein as a sub-band. For example, a sub-band may include the 40-45 Hz range within the gamma band. In particular examples, multiple sub-bands within the different bands are selected while remaining frequencies are band pass filtered. In particular examples, multiple sub-band responses may be enhanced, while the remaining frequency responses may be attenuated.
[0065] An information theory based band-weighting model is used for adaptive extraction of selective dataset specific, subject specific, task specific bands to enhance the effectiveness measure. Adaptive extraction may be performed using fuzzy scaling. Stimuli can be presented and enhanced measurements determined multiple times to determine the variation profiles across multiple presentations. Determining various profiles provides an enhanced assessment of the primary responses as well as the longevity (wear-out) of the marketing and entertainment stimuli. The synchronous response of multiple individuals to stimuli presented in concert is measured to determine an enhanced across subject synchrony measure of effectiveness. According to various examples, the synchronous response may be determined for multiple subjects residing in separate locations or for multiple subjects residing in the same location.
[0066] Although a variety of synthesis mechanisms are described, it should be recognized that any number of mechanisms can be applied--in sequence or in parallel with or without interaction between the mechanisms.
[0067] Although intra-modality synthesis mechanisms provide enhanced significance data, additional cross-modality synthesis mechanisms can also be applied. A variety of mechanisms such as EEG, Eye Tracking, GSR, EOG, and facial emotion encoding are connected to a cross-modality synthesis mechanism. Other mechanisms as well as variations and enhancements on existing mechanisms may also be included. According to various examples, data from a specific modality can be enhanced using data from one or more other modalities. In particular examples, EEG typically makes frequency measurements in different bands like alpha, beta and gamma to provide estimates of significance. However, the techniques of the present disclosure recognize that significance measures can be enhanced further using information from other modalities.
[0068] For example, facial emotion encoding measures can be used to enhance the valence of the EEG emotional engagement measure. EOG and eye tracking saccadic measures of object entities can be used to enhance the EEG estimates of significance including but not limited to attention, emotional engagement, and memory retention. According to various examples, a cross-modality synthesis mechanism performs time and phase shifting of data to allow data from different modalities to align. In some examples, it is recognized that an EEG response will often occur hundreds of milliseconds before a facial emotion measurement changes. Correlations can be drawn and time and phase shifts made on an individual as well as a group basis. In other examples, saccadic eye movements may be determined as occurring before and after particular EEG responses. According to various examples, time corrected GSR measures are used to scale and enhance the EEG estimates of significance including attention, emotional engagement and memory retention measures.
[0069] Evidence of the occurrence or non-occurrence of specific time domain difference event-related potential components (like the DERP) in specific regions correlates with subject responsiveness to specific stimulus. According to various examples, ERP measures are enhanced using EEG time-frequency measures (ERPSP) in response to the presentation of the marketing and entertainment stimuli. Specific portions are extracted and isolated to identify ERP, DERP and ERPSP analyses to perform. In particular examples, an EEG frequency estimation of attention, emotion and memory retention (ERPSP) is used as a co-factor in enhancing the ERP, DERP and time-domain response analysis.
[0070] EOG measures saccades to determine the presence of attention to specific objects of stimulus. Eye tracking measures the subject's gaze path, location and dwell on specific objects of stimulus. According to various examples, EOG and eye tracking is enhanced by measuring the presence of lambda waves (a neurophysiological index of saccade effectiveness) in the ongoing EEG in the occipital and extra striate regions, triggered by the slope of saccade-onset to estimate the significance of the EOG and eye tracking measures. In particular examples, specific EEG signatures of activity such as slow potential shifts and measures of coherence in time-frequency responses at the Frontal Eye Field (FEF) regions that preceded saccade-onset are measured to enhance the effectiveness of the saccadic activity data.
[0071] GSR typically measures the change in general arousal in response to stimulus presented. According to various examples, GSR is enhanced by correlating EEG/ERP responses and the GSR measurement to get an enhanced estimate of subject engagement. The GSR latency baselines are used in constructing a time-corrected GSR response to the stimulus. The time-corrected GSR response is co-factored with the EEG measures to enhance GSR significance measures.
[0072] According to various examples, facial emotion encoding uses templates generated by measuring facial muscle positions and movements of individuals expressing various emotions prior to the testing session. These individual specific facial emotion encoding templates are matched with the individual responses to identify subject emotional response. In particular examples, these facial emotion encoding measurements are enhanced by evaluating inter-hemispherical asymmetries in EEG responses in specific frequency bands and measuring frequency band interactions. The techniques of the present disclosure recognize that not only are particular frequency bands significant in EEG responses, but particular frequency bands used for communication between particular areas of the brain are significant. Consequently, these EEG responses enhance the EMG, graphic and video based facial emotion identification.
[0073] According to various examples, post-stimulus versus pre-stimulus differential measurements of ERP time domain components in multiple regions of the brain (DERP) are measured at 607. The differential measures give a mechanism for eliciting responses attributable to the stimulus. For example the messaging response attributable to an ad or the brand response attributable to multiple brands is determined using pre-experience and post-experience estimates
[0074] At 609, target versus distracter stimulus differential responses are determined for different regions of the brain (DERP). At 613, event related time-frequency analysis of the differential response (DERPSPs) are used to assess the attention, emotion and memory retention measures across multiple frequency bands. According to various examples, the multiple frequency bands include theta, alpha, beta, gamma and high gamma or kappa.
[0075] At 615, locations having high controlled and/or automatic attention saliency are identified. According to various examples, candidate locations may include areas immediately following a sequence of salient controlled attention. Candidate locations may include locations where a user has high anticipation or is in a state of high awareness. Alternatively, locations where a user is sufficiently primed may be selected for particular messages and placements. In other examples, neuro-response lulls in source material are identified.
[0076] Locations having little change in relation to neighboring locations may also be selected. In still other examples, locations are manually selected. At 617, stimulus material is received. According to various examples, stimulus material may include presentations, messages, banners, videos, audio, etc. In particular examples, a controlled and automatic attention analysis system determines neurologically effective locations to place the message.
[0077] For example, the message may be placed where a user will be directing maximum attention. In one example, the message may be shown when a hero is about to enter a room for a final confrontation. At 623, multiple trials are performed with stimulus material introduced in different spatial and temporal locations to assess the impact of introduction at each of the different spatial and temporal locations.
[0078] For example, introduction of new products at location A on a billboard in a video game scene may lead to more significant neuro-response activity for the billboard in general. Introduction of an image onto a video stream may lead to greater emotional engagement and memory retention. In other examples, increased neuro-response activity for introduced material may detract from neuro-response activity for other portions of source material. For examples, a salient image on one part of a billboard may lead to reduced dwell times for other portions of a billboard. According to various examples, aggregated neuro-response measurements are identified to determine optimal locations for introduction of stimulus material.
[0079] At 625, processed data is provided to a data communication device for transmission over a network such as a wireless, wireline, satellite, or other type of communication network capable of transmitting data. Data is provided to response integration system at 627. According to various examples, the data communication device transmits data using protocols such as the File Transfer Protocol (FTP), Hypertext Transfer Protocol (HTTP) along with a variety of conventional, bus, wired network, wireless network, satellite, and proprietary communication protocols. The data transmitted can include the data in its entirety, excerpts of data, converted data, and/or elicited response measures. According to various examples, data is sent using a telecommunications, wireless, Internet, satellite, or any other communication mechanisms that is capable of conveying information from multiple subject locations for data integration and analysis. The mechanism may be integrated in a set top box, computer system, receiver, mobile device, etc.
[0080] In particular examples, the data communication device sends data to the response integration system 627. According to various examples, the response integration system 627 combines the analyzed responses to the experience/stimuli, with information on the available stimuli and its attributes. A variety of responses including user behavioral and survey responses are also collected an integrated. At 629, one or more locations in the video game are selected for the introduction of personalized stimulus material.
[0081] According to various examples, the response integration system combines analyzed and enhanced responses to the stimulus material while using information about stimulus material attributes such as the location, movement, acceleration, and spatial relationships of various entities and objects. In particular examples, the response integration system also collects and integrates user behavioral and survey responses with the analyzed and enhanced response data to more effectively assess stimulus location characteristics.
[0082] According to various examples, the stimulus location selection system provides data to a repository for the collection and storage of demographic, statistical and/or survey based responses to different entertainment, marketing, advertising and other audio/visual/tactile/olfactory material. If this information is stored externally, this system could include a mechanism for the push and/or pull integration of the data--including but not limited to querying, extracting, recording, modifying, and/or updating. This system integrates the requirements for the presented material, the assessed neuro-physiological and neuro-behavioral response measures, and the additional stimulus attributes such as demography/statistical/survey based responses into a synthesized measure for the selection of stimulus locations.
[0083] According to various examples, the repository stores information for temporal, spatial, activity, and event based components of stimulus material. For example, neuro-response data, statistical data, survey based response data, and demographic data may be aggregated and stored and associated with a particular component in a video stream.
[0084] FIG. 7 illustrates an example of a technique for controlled and automatic attention analysis. According to various examples, additional stimulus material is received at 701. In particular examples, stimulus material may be video, audio, text, banners, messages, product offers, purchase offers, etc. At 703, candidate locations for introduction of stimulus material are identified. Candidate locations may be predetermined and provided with the media material such as the movie or video game itself. In particular examples, candidate locations are selected using neuro-response data to determine effective candidate locations for insertion of stimulus material. According to particular examples, candidate locations are locations having high controlled and/or automatic attention metrics. In other examples, candidate locations are neurologically salient locations for the introduction of advertisements, messages, purchase icons, media, offers, etc. In some examples, both personalized and non-personalized stimulus material may be inserted.
[0085] According to various examples, candidate locations are selected based on candidate location characteristics 705. For example, candidate location characteristics may indicate that some locations have particularly good memory and retention characteristics. In other examples, candidate location characteristics may indicate that a particular sport has good attention attributes. According to various examples, particular locations may indicate good priming for particular types of material, such as a category of ads or a type of message. According to various examples, particular events may also trigger stimulus material insertion. For example, if a player moves into first place into a racing game, a message or other stimulus material may be shown to the user. Stimulus material placement in video games may be spatial and temporal location driven or event driven. At 707, stimulus material is inserted into the video game. At 709, neuro-response data is evaluated with stimulus material inserted. In some examples, EEG data may be available. However, in other examples, little or no neuro-response data may be available. Only user activity or user facial expressions or user feedback may be available.
[0086] At 711, characteristics associated with candidate locations are updated based on user feedback. The location and placement assessment system can further include an adaptive learning component that refines profiles and tracks variations responses to particular stimuli or series of stimuli over time.
[0087] According to various examples, various mechanisms such as the data collection mechanisms, the intra-modality synthesis mechanisms, cross-modality synthesis mechanisms, etc. are implemented on multiple devices. However, it is also possible that the various mechanisms be implemented in hardware, firmware, and/or software in a single system. FIG. 8 provides one example of a system that can be used to implement one or more mechanisms. For example, the system shown in FIG. 8 may be used to implement a stimulus location selection system.
[0088] According to particular examples, a system 800 suitable for implementing particular examples of the present disclosure includes a processor 801, a memory 803, an interface 811, and a bus 815 (e.g., a PCI bus). When acting under the control of appropriate software or firmware, the processor 801 is responsible for such tasks such as pattern generation. Various specially configured devices can also be used in place of a processor 801 or in addition to processor 801. The complete implementation can also be done in custom hardware. The interface 811 is typically configured to send and receive data packets or data segments over a network. Particular examples of interfaces the device supports include host bus adapter (HBA) interfaces, Ethernet interfaces, frame relay interfaces, cable interfaces, DSL interfaces, token ring interfaces, and the like.
[0089] In addition, various high-speed interfaces may be provided such as fast Ethernet interfaces, Gigabit Ethernet interfaces, ATM interfaces, HS SI interfaces, POS interfaces, FDDI interfaces and the like. Generally, these interfaces may include ports appropriate for communication with the appropriate media. In some cases, they may also include an independent processor and, in some instances, volatile RAM. The independent processors may control such communications intensive tasks as data synthesis.
[0090] According to particular examples, the system 800 uses memory 803 to store data, algorithms and program instructions. The program instructions may control the operation of an operating system and/or one or more applications, for example. The memory or memories may also be configured to store received data and process received data.
[0091] Because such information and program instructions may be employed to implement the systems/methods described herein, the present disclosure relates to tangible, machine readable media that include program instructions, state information, etc. for performing various operations described herein. Examples of machine-readable media include, but are not limited to, magnetic media such as hard disks, floppy disks, and magnetic tape; optical media such as CD-ROM disks and DVDs; magneto-optical media such as optical disks; and hardware devices that are specially configured to store and perform program instructions, such as read-only memory devices (ROM) and random access memory (RAM). Examples of program instructions include both machine code, such as produced by a compiler, and files containing higher level code that may be executed by the computer using an interpreter.
[0092] Although the foregoing disclosure has been described in some detail for purposes of clarity of understanding, it will be apparent that certain changes and modifications may be practiced within the scope of the appended claims. Therefore, the present embodiments are to be considered as illustrative and not restrictive and the disclosure is not to be limited to the details given herein, but may be modified within the scope and equivalents of the appended claims.
* * * * *
D00000
D00001
D00002
D00003
D00004
D00005
D00006
D00007
D00008
XML
uspto.report is an independent third-party trademark research tool that is not affiliated, endorsed, or sponsored by the United States Patent and Trademark Office (USPTO) or any other governmental organization. The information provided by uspto.report is based on publicly available data at the time of writing and is intended for informational purposes only.
While we strive to provide accurate and up-to-date information, we do not guarantee the accuracy, completeness, reliability, or suitability of the information displayed on this site. The use of this site is at your own risk. Any reliance you place on such information is therefore strictly at your own risk.
All official trademark data, including owner information, should be verified by visiting the official USPTO website at www.uspto.gov. This site is not intended to replace professional legal advice and should not be used as a substitute for consulting with a legal professional who is knowledgeable about trademark law.