Method And Device For Transmitting Signal By Switching Phase In Mobile Communication System
SHIM; Seijoon ; et al.
U.S. patent application number 16/325633 was filed with the patent office on 2019-07-11 for method and device for transmitting signal by switching phase in mobile communication system. The applicant listed for this patent is Samsung Electronics Co., Ltd.. Invention is credited to Chanho CHOI, Chongdon KIM, Seijoon SHIM, Hayoung YANG.
| Application Number | 20190215204 16/325633 |
| Document ID | / |
| Family ID | 61196883 |
| Filed Date | 2019-07-11 |


View All Diagrams
| United States Patent Application | 20190215204 |
| Kind Code | A1 |
| SHIM; Seijoon ; et al. | July 11, 2019 |
METHOD AND DEVICE FOR TRANSMITTING SIGNAL BY SWITCHING PHASE IN MOBILE COMMUNICATION SYSTEM
Abstract
Disclosed are a method and a device for differently applying phase rotations for each antenna by dividing a frequency band in order to solve a problem in which reception performance deteriorates in a specific subcarrier when the correlation between antennas is high. According to the present invention, a method by which a transmitter transmits a signal comprises the steps of: estimating the transmission correlation between respective transmission paths; calculating a phase rotation value to be applied to a transmission signal on the basis of the estimated transmission correlation; applying a phase rotation in accordance with the phase rotation value to the transmission signal; and transmitting the transmission signal.
| Inventors: | SHIM; Seijoon; (Seoul, KR) ; YANG; Hayoung; (Yongin-si, KR) ; KIM; Chongdon; (Seongnam-si, KR) ; CHOI; Chanho; (Hwaseong-si, KR) | ||||||||||
| Applicant: |
|
||||||||||
|---|---|---|---|---|---|---|---|---|---|---|---|
| Family ID: | 61196883 | ||||||||||
| Appl. No.: | 16/325633 | ||||||||||
| Filed: | August 18, 2017 | ||||||||||
| PCT Filed: | August 18, 2017 | ||||||||||
| PCT NO: | PCT/KR2017/009000 | ||||||||||
| 371 Date: | February 14, 2019 |
| Current U.S. Class: | 1/1 |
| Current CPC Class: | H04L 5/0048 20130101; H04L 27/2626 20130101; H04L 27/2003 20130101; H04B 7/0671 20130101; H04B 7/0682 20130101; H04L 27/2675 20130101; H04B 17/309 20150115; H04B 17/12 20150115; H04L 25/02 20130101; H04L 5/14 20130101; H04L 27/2657 20130101; H04L 5/006 20130101; H04L 5/001 20130101; H04L 27/26 20130101; H04L 5/0057 20130101; H04L 5/0023 20130101 |
| International Class: | H04L 27/20 20060101 H04L027/20; H04L 27/26 20060101 H04L027/26; H04L 5/00 20060101 H04L005/00; H04L 5/14 20060101 H04L005/14 |
Foreign Application Data
| Date | Code | Application Number |
|---|---|---|
| Aug 18, 2016 | KR | 10-2016-0104789 |
Claims
1. A signal transmission method of a transmitter, the method comprising: estimating a transmit correlation between transmission paths; calculating phase rotation values to be applied to a transmission signal based on the estimated transmit correlation; applying phase rotation to the transmission signal according to the phase rotation values; and transmitting the transmission signal.
2. The method of claim 1, wherein the phase rotation values are calculated by a small unit constituting a frequency band based on channel state.
3. The method of claim 1, further comprising receiving, if a time division duplex (TDD) system is applied, a sounding reference signal (SRS), wherein the phase rotation values are calculated based on channel state information estimated based on the SRS.
4. The method of claim 1, further comprising receiving, if a frequency division duplex (FDD) system is applied, channel state information transmitted by a receiver, wherein the phase rotation values are calculated based on the channel state information.
5. The method of claim 4, further comprising transmitting a reference signal (RS) to which one of predetermined phase rotation values pair sets is applied to the receiver, wherein the channel state information is estimated based on the RS.
6. The method of claim 1, wherein the phase rotation values are calculated by an equation: ( , ) = arg max ( .PHI. l , 0 , .PHI. l , 1 ) k .di-elect cons. { subcarrier index } ( 1 + .alpha. cos ( .PHI. l , 0 + .PHI. l , 1 2 k - .PHI. .alpha. ) cos ( .PHI. l , 0 + .PHI. l , 1 2 k ) ) , ##EQU00012## where and denote the phase rotation values, .alpha. denotes the transmit correlation, .phi..sub..alpha. denotes a phase angle of .alpha., and l denotes an index of a small unit constituting a frequency band.
7. The method of claim 1, wherein the phase rotation values are determined according to a phase rotation values set predetermined based on the estimated transmit correlation.
8. A transmitter for transmitting a signal, the transmitter comprising: a transceiver configured to transmit and receive signals to and from a receiver; and a controller configured to control to estimate a transmit correlation between transmission paths, calculate phase rotation values to be applied to a transmission signal based on the estimated transmit correlation, apply phase rotation to the transmission signal according to the phase rotation values, and transmit the transmission signal.
9. The transmitter of claim 9, wherein the phase rotation values are calculated by a small unit constituting a frequency band based on channel state.
10. The transmitter of claim 8, wherein the controller is configured to control to receive, if a time division duplex (TDD) system is applied, a sounding reference signal (SRS), wherein the phase rotation values are calculated based on channel state information estimated based on the SRS.
11. The transmitter of claim 8, wherein the controller is configured to control to receive, if a frequency division duplex (FDD) system is applied, channel state information transmitted by a receiver, wherein the phase rotation values are calculated based on the channel state information.
12. The transmitter of claim 9, wherein the controller is configured to control to transmit a reference signal (RS) to which one of predetermined phase rotation values pair sets is applied to the receiver, wherein the channel state information is estimated based on the RS.
13. The transmitter of claim 8, wherein the phase rotation values are calculated by an equation: ( , ) = arg max ( .PHI. l , 0 , .PHI. l , 1 ) k .di-elect cons. { subcarrier index } ( 1 + .alpha. cos ( .PHI. l , 0 + .PHI. l , 1 2 k - .PHI. .alpha. ) cos ( .PHI. l , 0 + .PHI. l , 1 2 k ) ) , ##EQU00013## where and denote the phase rotation values, .alpha. denotes the transmit correlation, .phi..sub..alpha. denotes a phase angle of .alpha., and l denotes an index of a small unit constituting a frequency band.
14. The transmitter of claim 8, wherein the phase rotation values are determined according to a phase rotation values set predetermined based on the estimated transmit correlation.
Description
CROSS-REFERENCE TO RELATED APPLICATION(S)
[0001] This application is a U.S. National Stage application under 35 U.S.C. .sctn. 371 of an International application number PCT/KR2017/009000, filed on Aug. 18, 2017 which is based claimed priority of a Korean patent application No. 10-2016-0104789, filed on Aug. 18, 2016, in the Korean Intellectual Property Office the disclosure of which is incorporated herein by reference in its entirety.
TECHNICAL FIELD
[0002] The present invention relates to a phase switching-based signal transmission method and device and, in particular, to a method and device for transmitting a signal by switching between frequency band-specific phases.
BACKGROUND ART
[0003] Recently, discussions are underway to employ a frequency utilization improvement technology such as carrier aggregation, a new service provision technology such as machine type communication (MTC), and a spectral efficiency enhancement technology as new standard technologies for the long term evolution (LTE) standard developed by the 3rd generation partnership project (3GPP). Among them, the spectral efficiency enhancement technology is mainly represented by a multiple-input multiple output (MIMO) technology, and various MIMO schemes are adopted in the LTE standard. More recently, the LTE release 12 (Rel-12) standard specifies a method for improving the spectral efficiency by adding a feedback mode including a subband channel quality indicator (hereinafter, referred to as subband CQI) and a subband precoding matrix index (hereinafter, referred to as PMI). Meanwhile, recent topics for the 5G communication standard under discussion include the introduction of millimeter wave (mmWave) communication, which requires a method for measuring correlations antennas to reduce the effect of channel selectivity so as to transmit data efficiently using the mmWave; studies are being conducted for reflecting the measurement results to operations of a base station.
[0004] In separation from the supportability in the standard, it may be possible to consider a method for implementing the base station to improve the spectral efficiency, and a cyclic delay diversity (CDD) is a representative one of such methods. The CDD is named in the sense that a frequency-domain phase on a subcarrier changes at a predetermined time-domain delay, and this technology similar to the virtual antenna mapping (VAM) defined for the wideband code division multiple access (WCDMA) as one of the 3rd generation (3D) communication standards.
[0005] For the legacy CDD or VAM technology, researches have been conducted on a method for mapping antennas according to the predetermined delay or phase. Although a technology for achieving a long delay diversity between transmit antenna paths is employed under the name of large delay CDD or transmission mode 3 in the LTE standard, this technology is also limited in that a predetermined delay is applied to OFDM subcarriers.
DISCLOSURE OF INVENTION
Technical Problem
[0006] However, a high correlation between the antennas is likely to cause frequency nulling on a specific subcarrier, resulting in degradation of a signal reception performance. In order to solve this problem, there is a need of a method for applying phase switching per antenna by dividing the frequency band.
Solution to Problem
[0007] In accordance with an aspect of the present invention, a signal transmission method of a transmitter includes estimating a transmit correlation between transmission paths, calculating phase rotation values to be applied to a transmission signal based on the estimated transmit correlation, applying phase rotation to the transmission signal according to the phase rotation values, and transmitting the transmission signal.
[0008] Preferably, the phase rotation values are calculated by a small unit constituting a frequency band based on channel state; preferably, the method further includes receiving, if a time division duplex (TDD) system is applied, a sounding reference signal (SRS), the phase rotation values being calculated based on channel state information estimated based on the SRS; preferably, the method further includes receiving, if a frequency division duplex (FDD) system is applied, channel state information transmitted by a receiver, the phase rotation values being calculated based on the channel state information.
[0009] In accordance with another aspect of the present invention, a transmitter for transmitting a signal includes a transceiver configured to transmit and receive signals to and from a receiver and a controller configured to control to estimate a transmit correlation between transmission paths, calculate phase rotation values to be applied to a transmission signal based on the estimated transmit correlation, apply phase rotation to the transmission signal according to the phase rotation values, and transmit the transmission signal.
[0010] Preferably, the phase rotation values are calculated by a small unit constituting a frequency band based on channel state; preferably, the controller is configured to control to receive, if a time division duplex (TDD) system is applied, a sounding reference signal (SRS), the phase rotation values being calculated based on channel state information estimated based on the SRS; preferably, the controller is configured to control to receive, if a frequency division duplex (FDD) system is applied, channel state information transmitted by a receiver, the phase rotation values being calculated based on the channel state information.
Advantageous Effects of Invention
[0011] The signal transmission method of the present invention is advantageous in terms of improving a signal transmission efficiency by applying a different phase rotation to each resource block.
BRIEF DESCRIPTION OF DRAWINGS
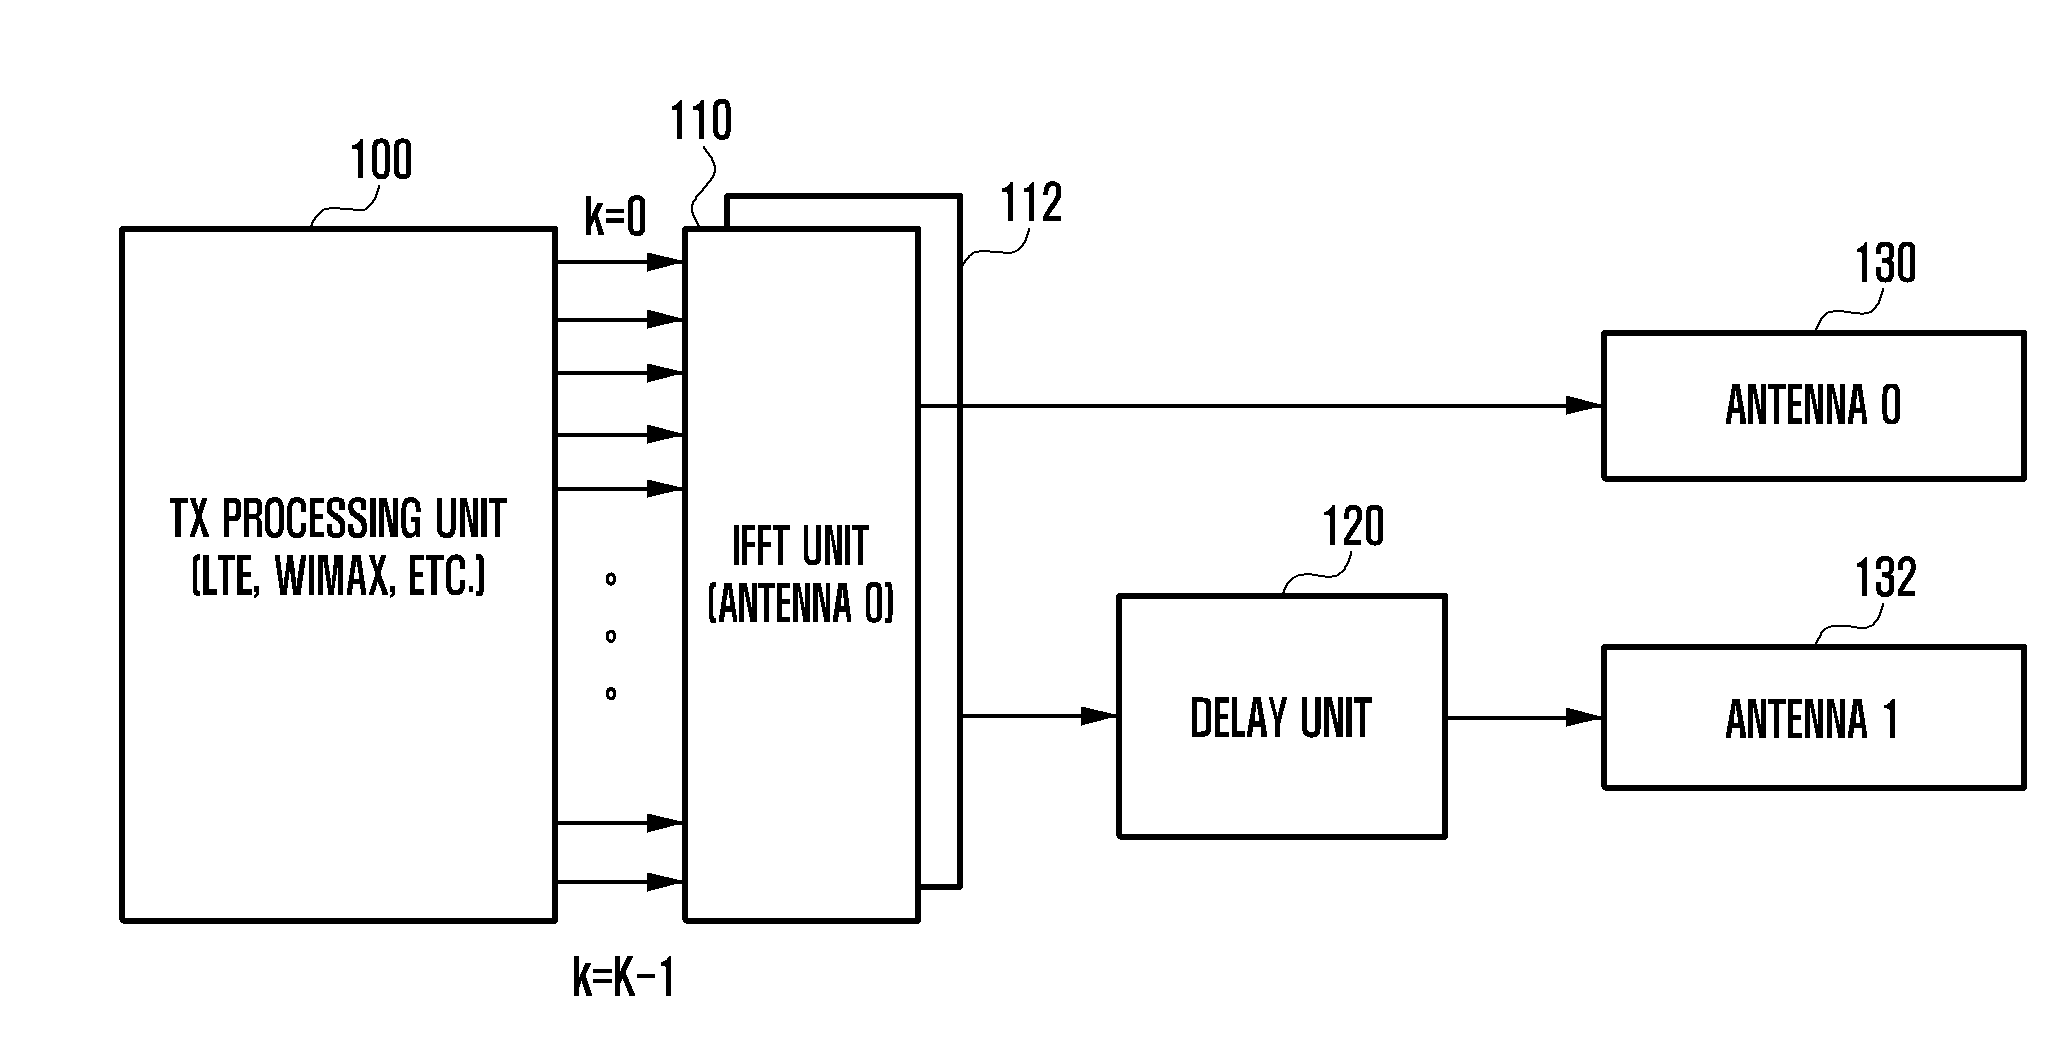
[0012] FIG. 1A is a diagram illustrating a device configured to implement a CDD technology;
[0013] FIG. 1B is a diagram illustrating a device configured to implement a VAM technology;
[0014] FIG. 2 is a diagram for explaining time-varying channels experienced by signals transmitted via different antennas;
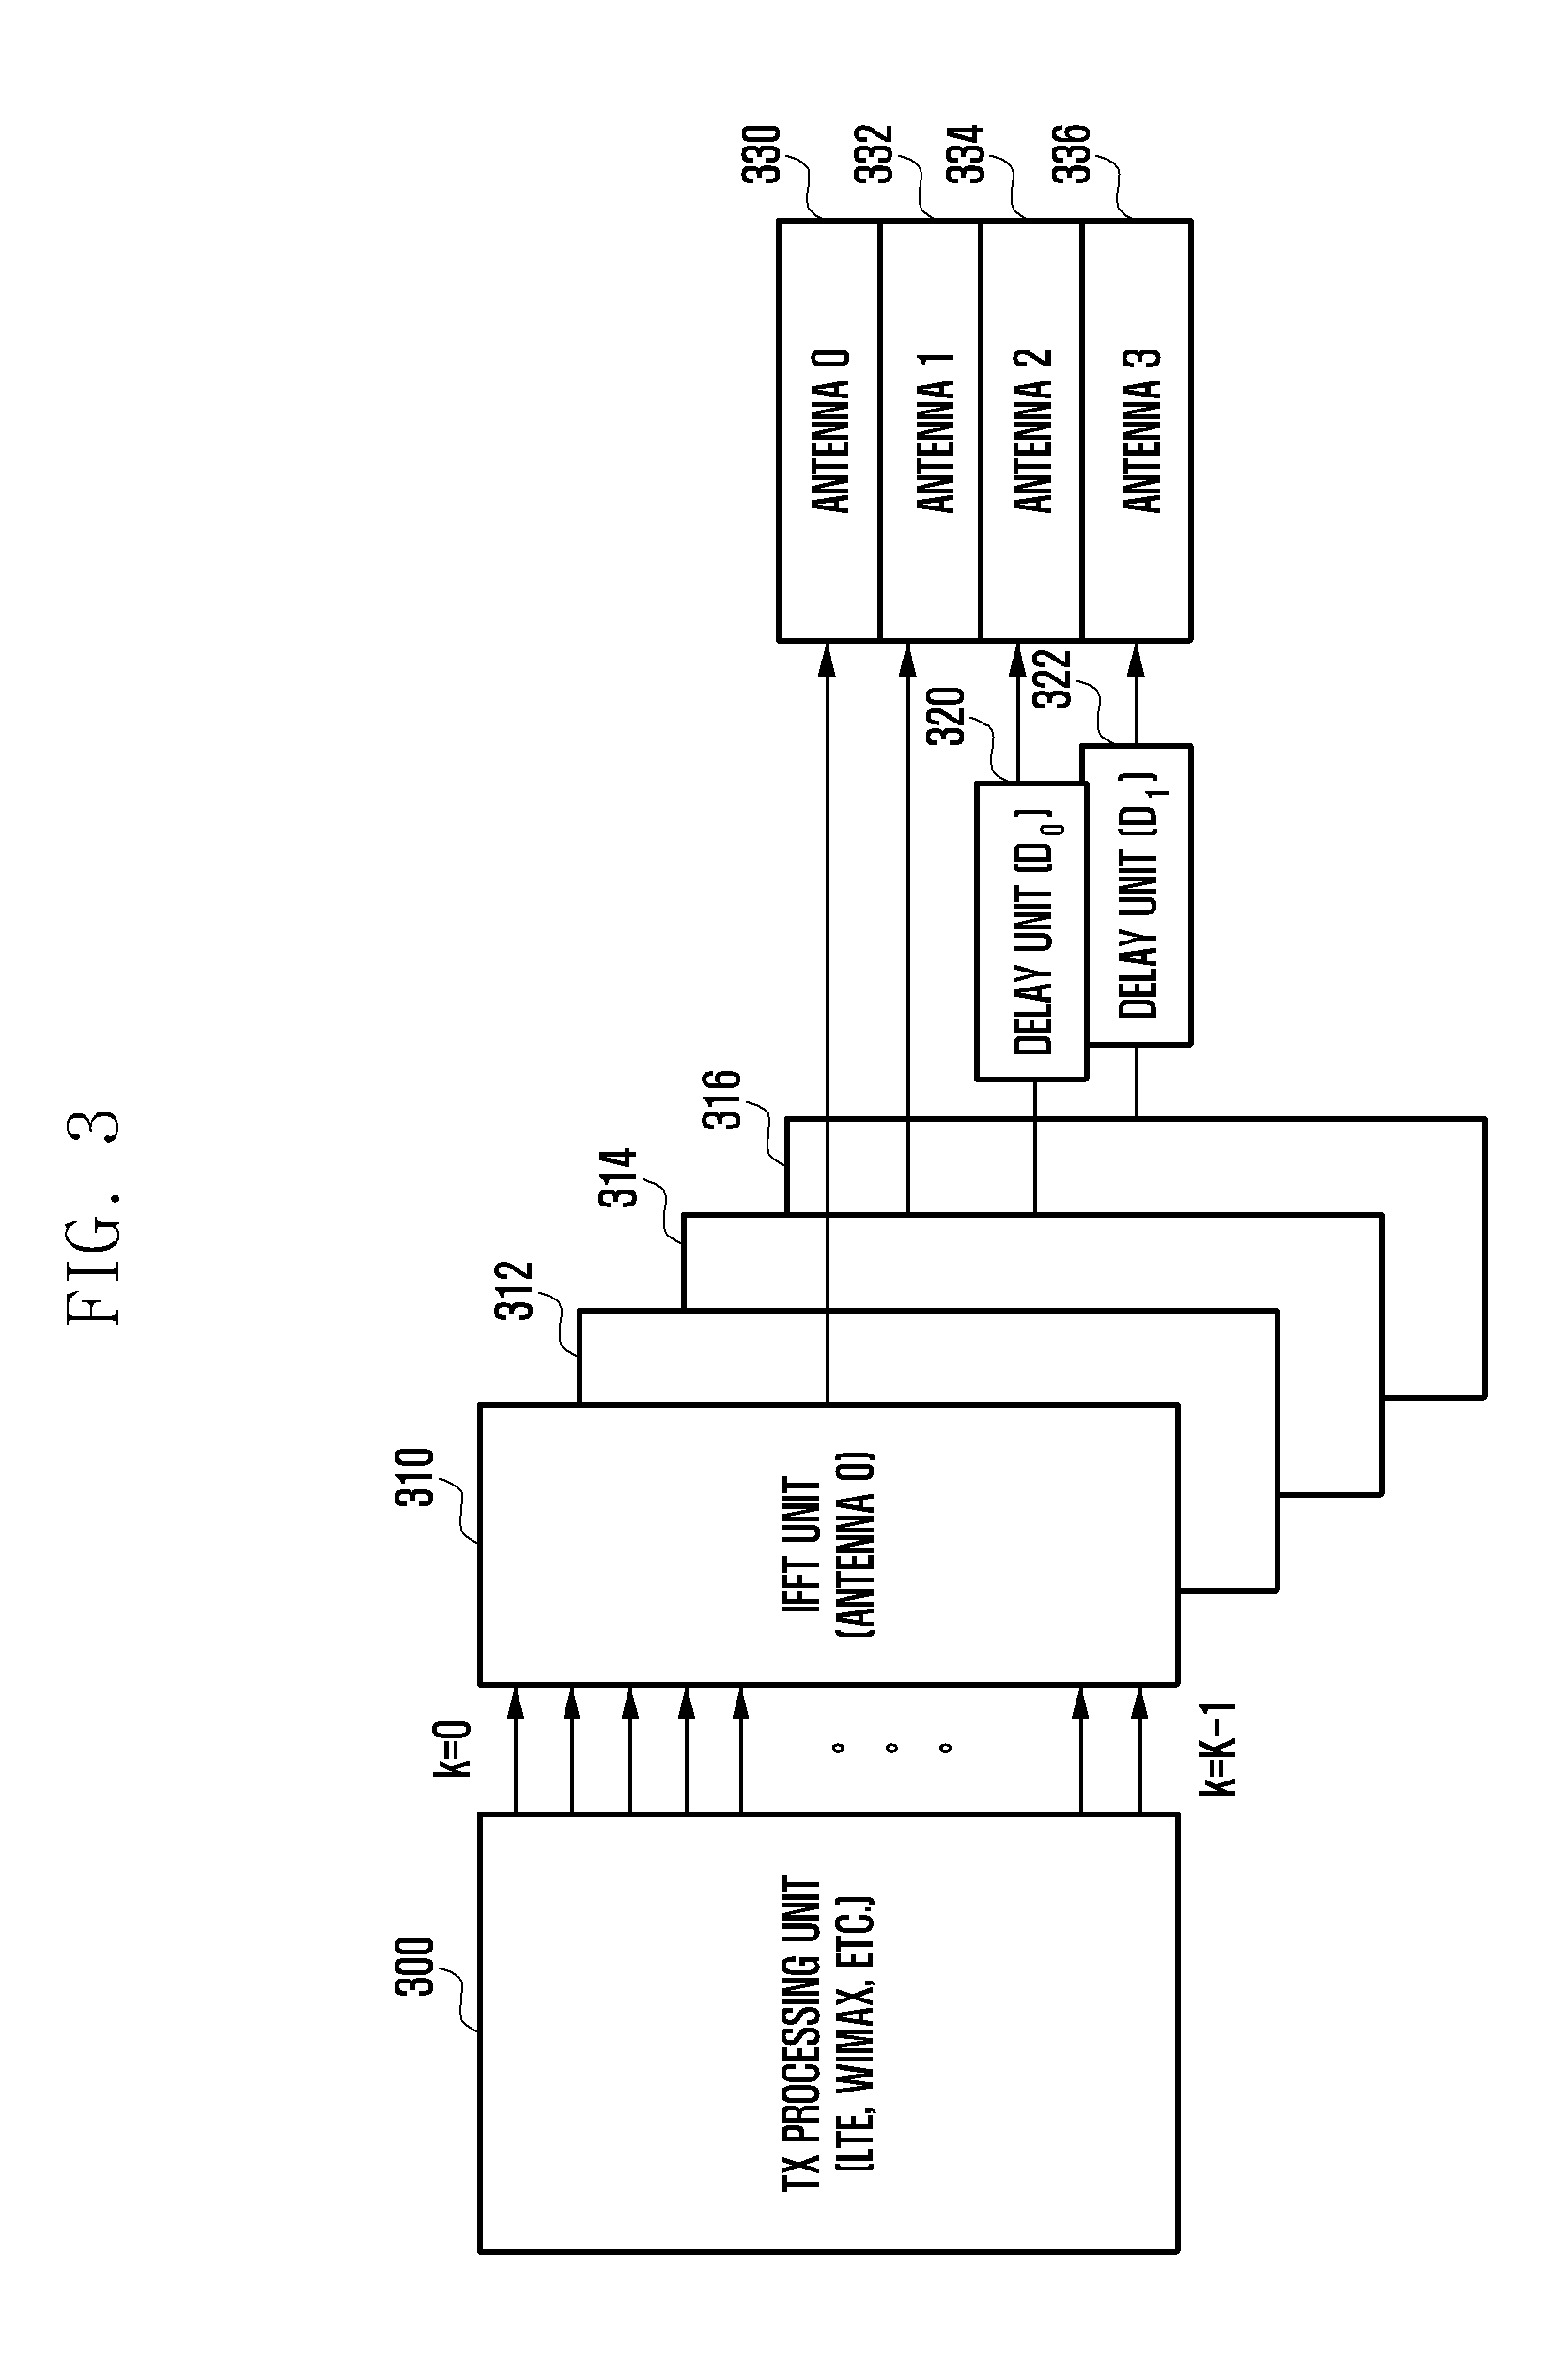
[0015] FIG. 3 is a block diagram illustrating an OFDM transmission/reception system with 4 antennas;
[0016] FIG. 4 is a diagram illustrating frequency responses represented by Equation 8 in accordance with a specific CDD value under an assumption of a transmit channel correlation .alpha.=1;
[0017] FIG. 5 is a diagram illustrating a configuration of a BS-PSAM system according to an embodiment of the present invention;
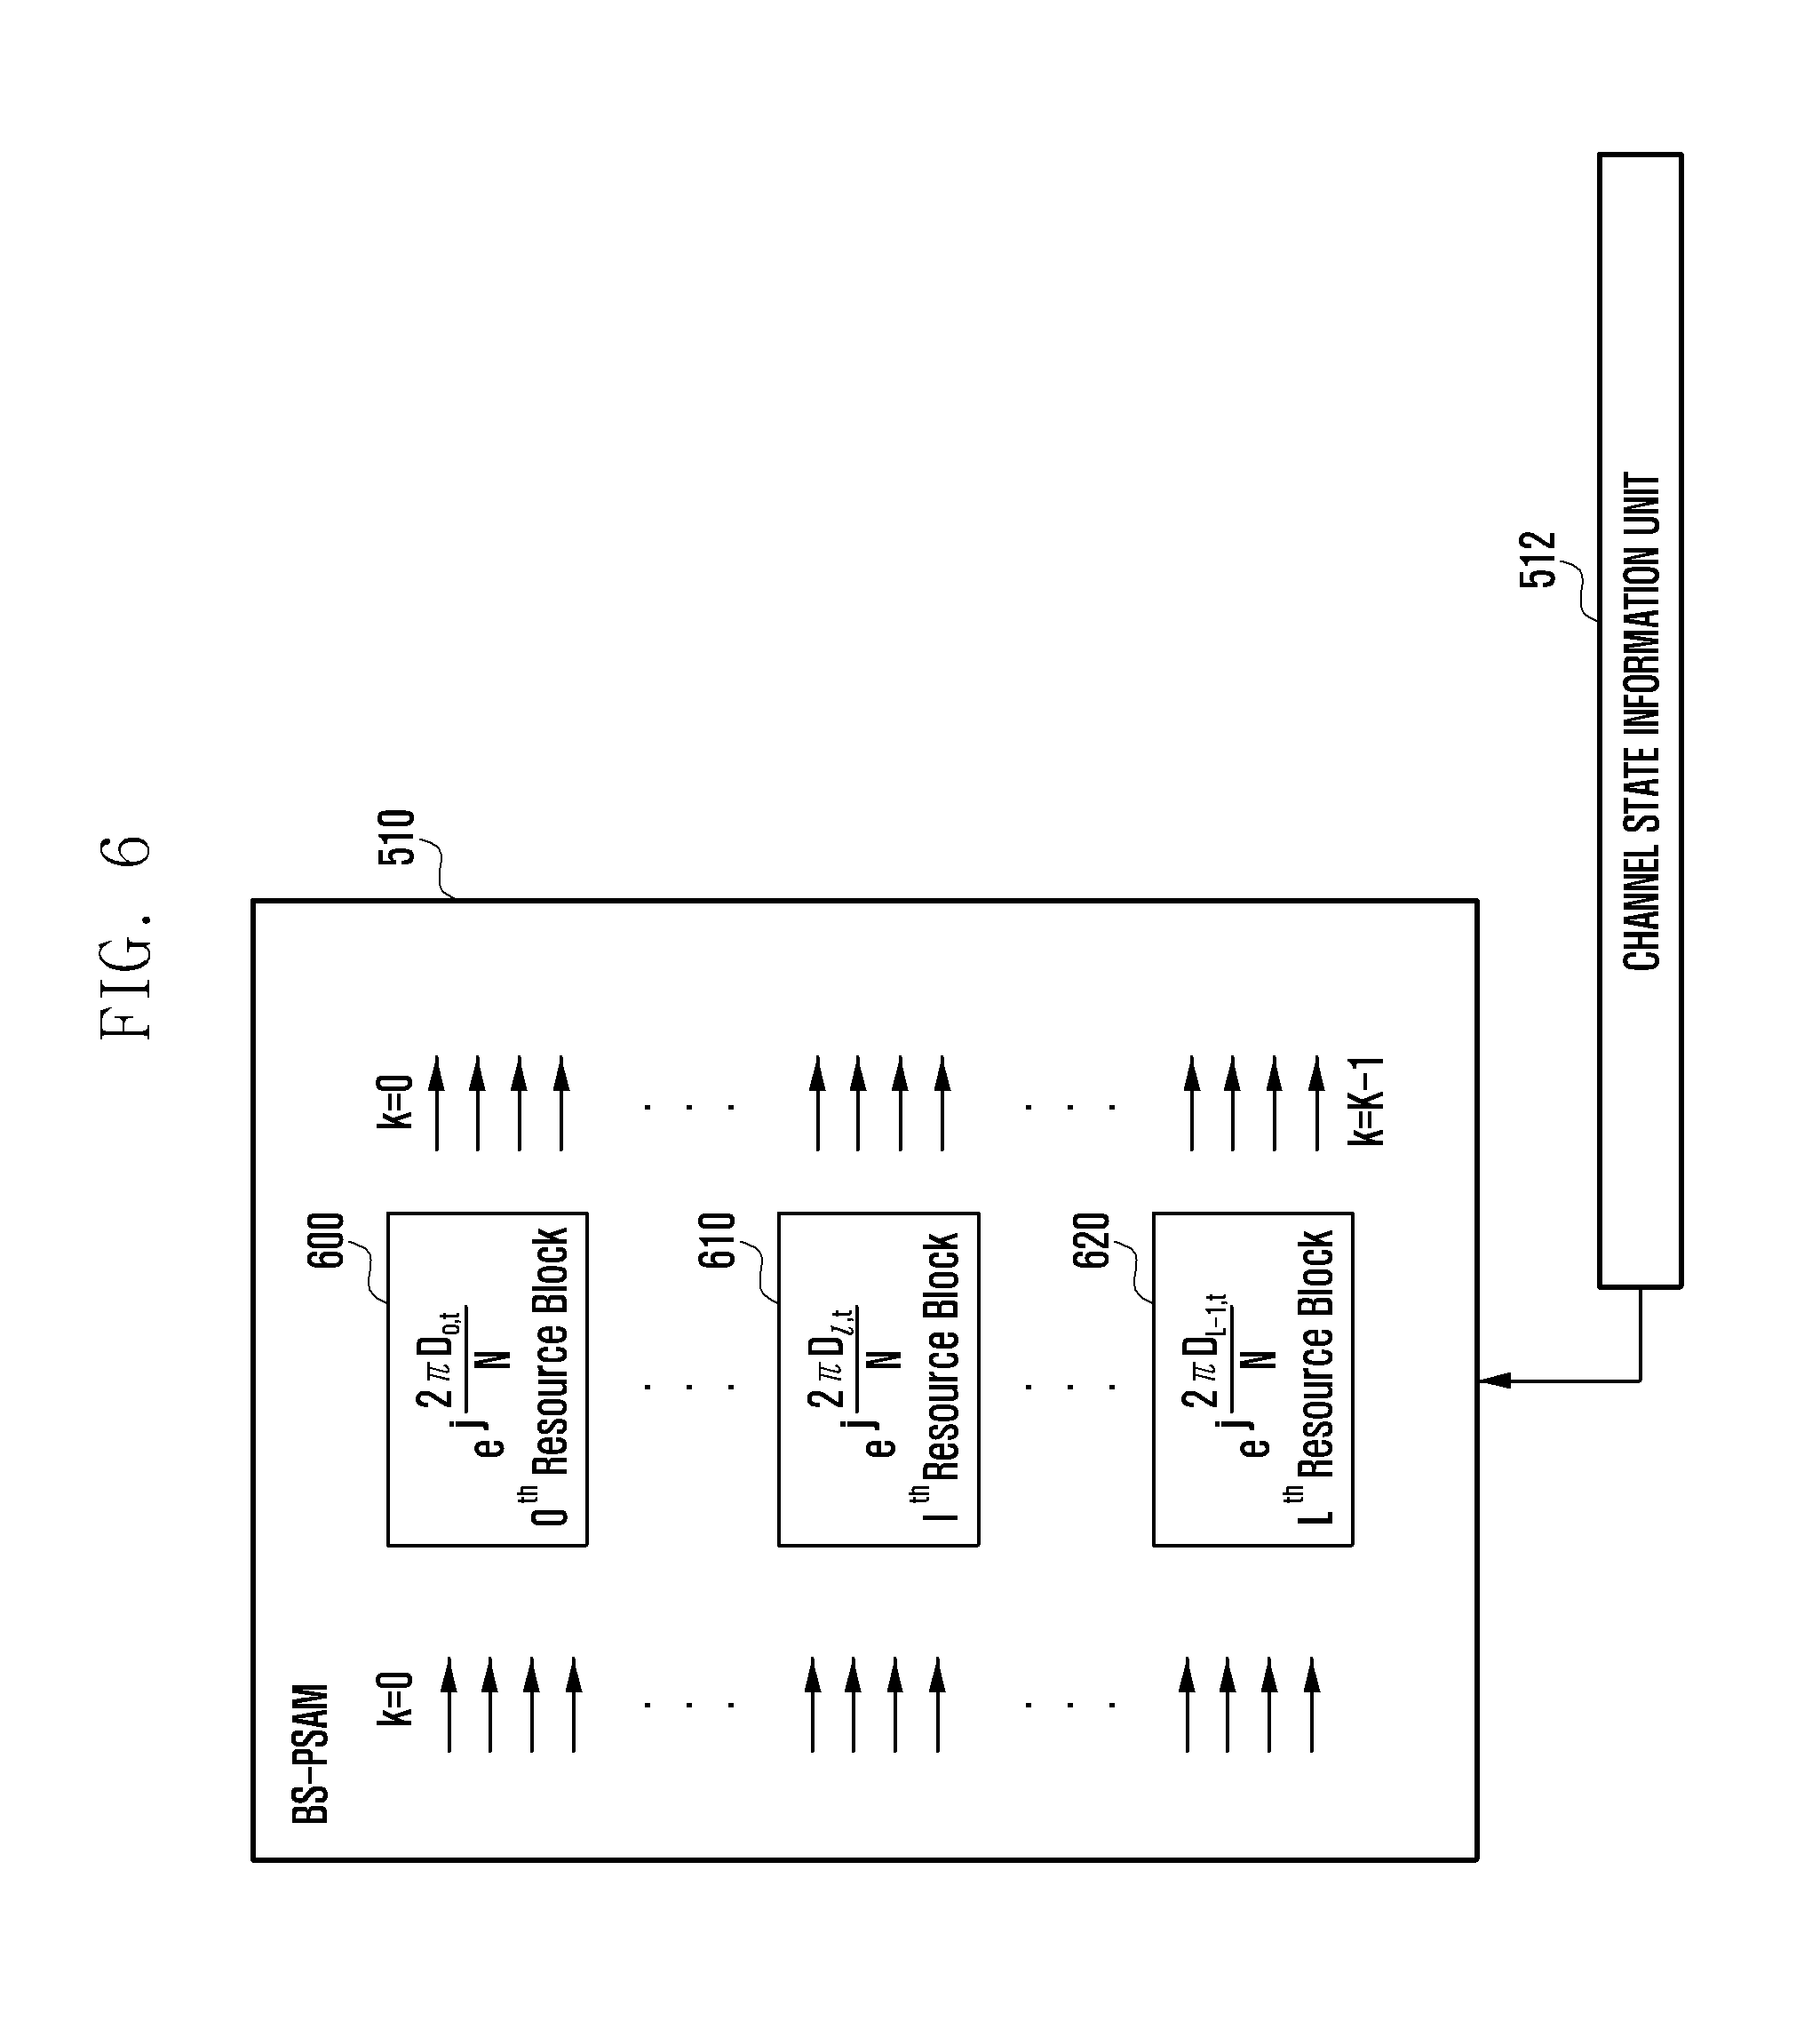
[0018] FIG. 6 is a diagram for explaining functions of a BS-PSAM unit according to an embodiment of the present invention;
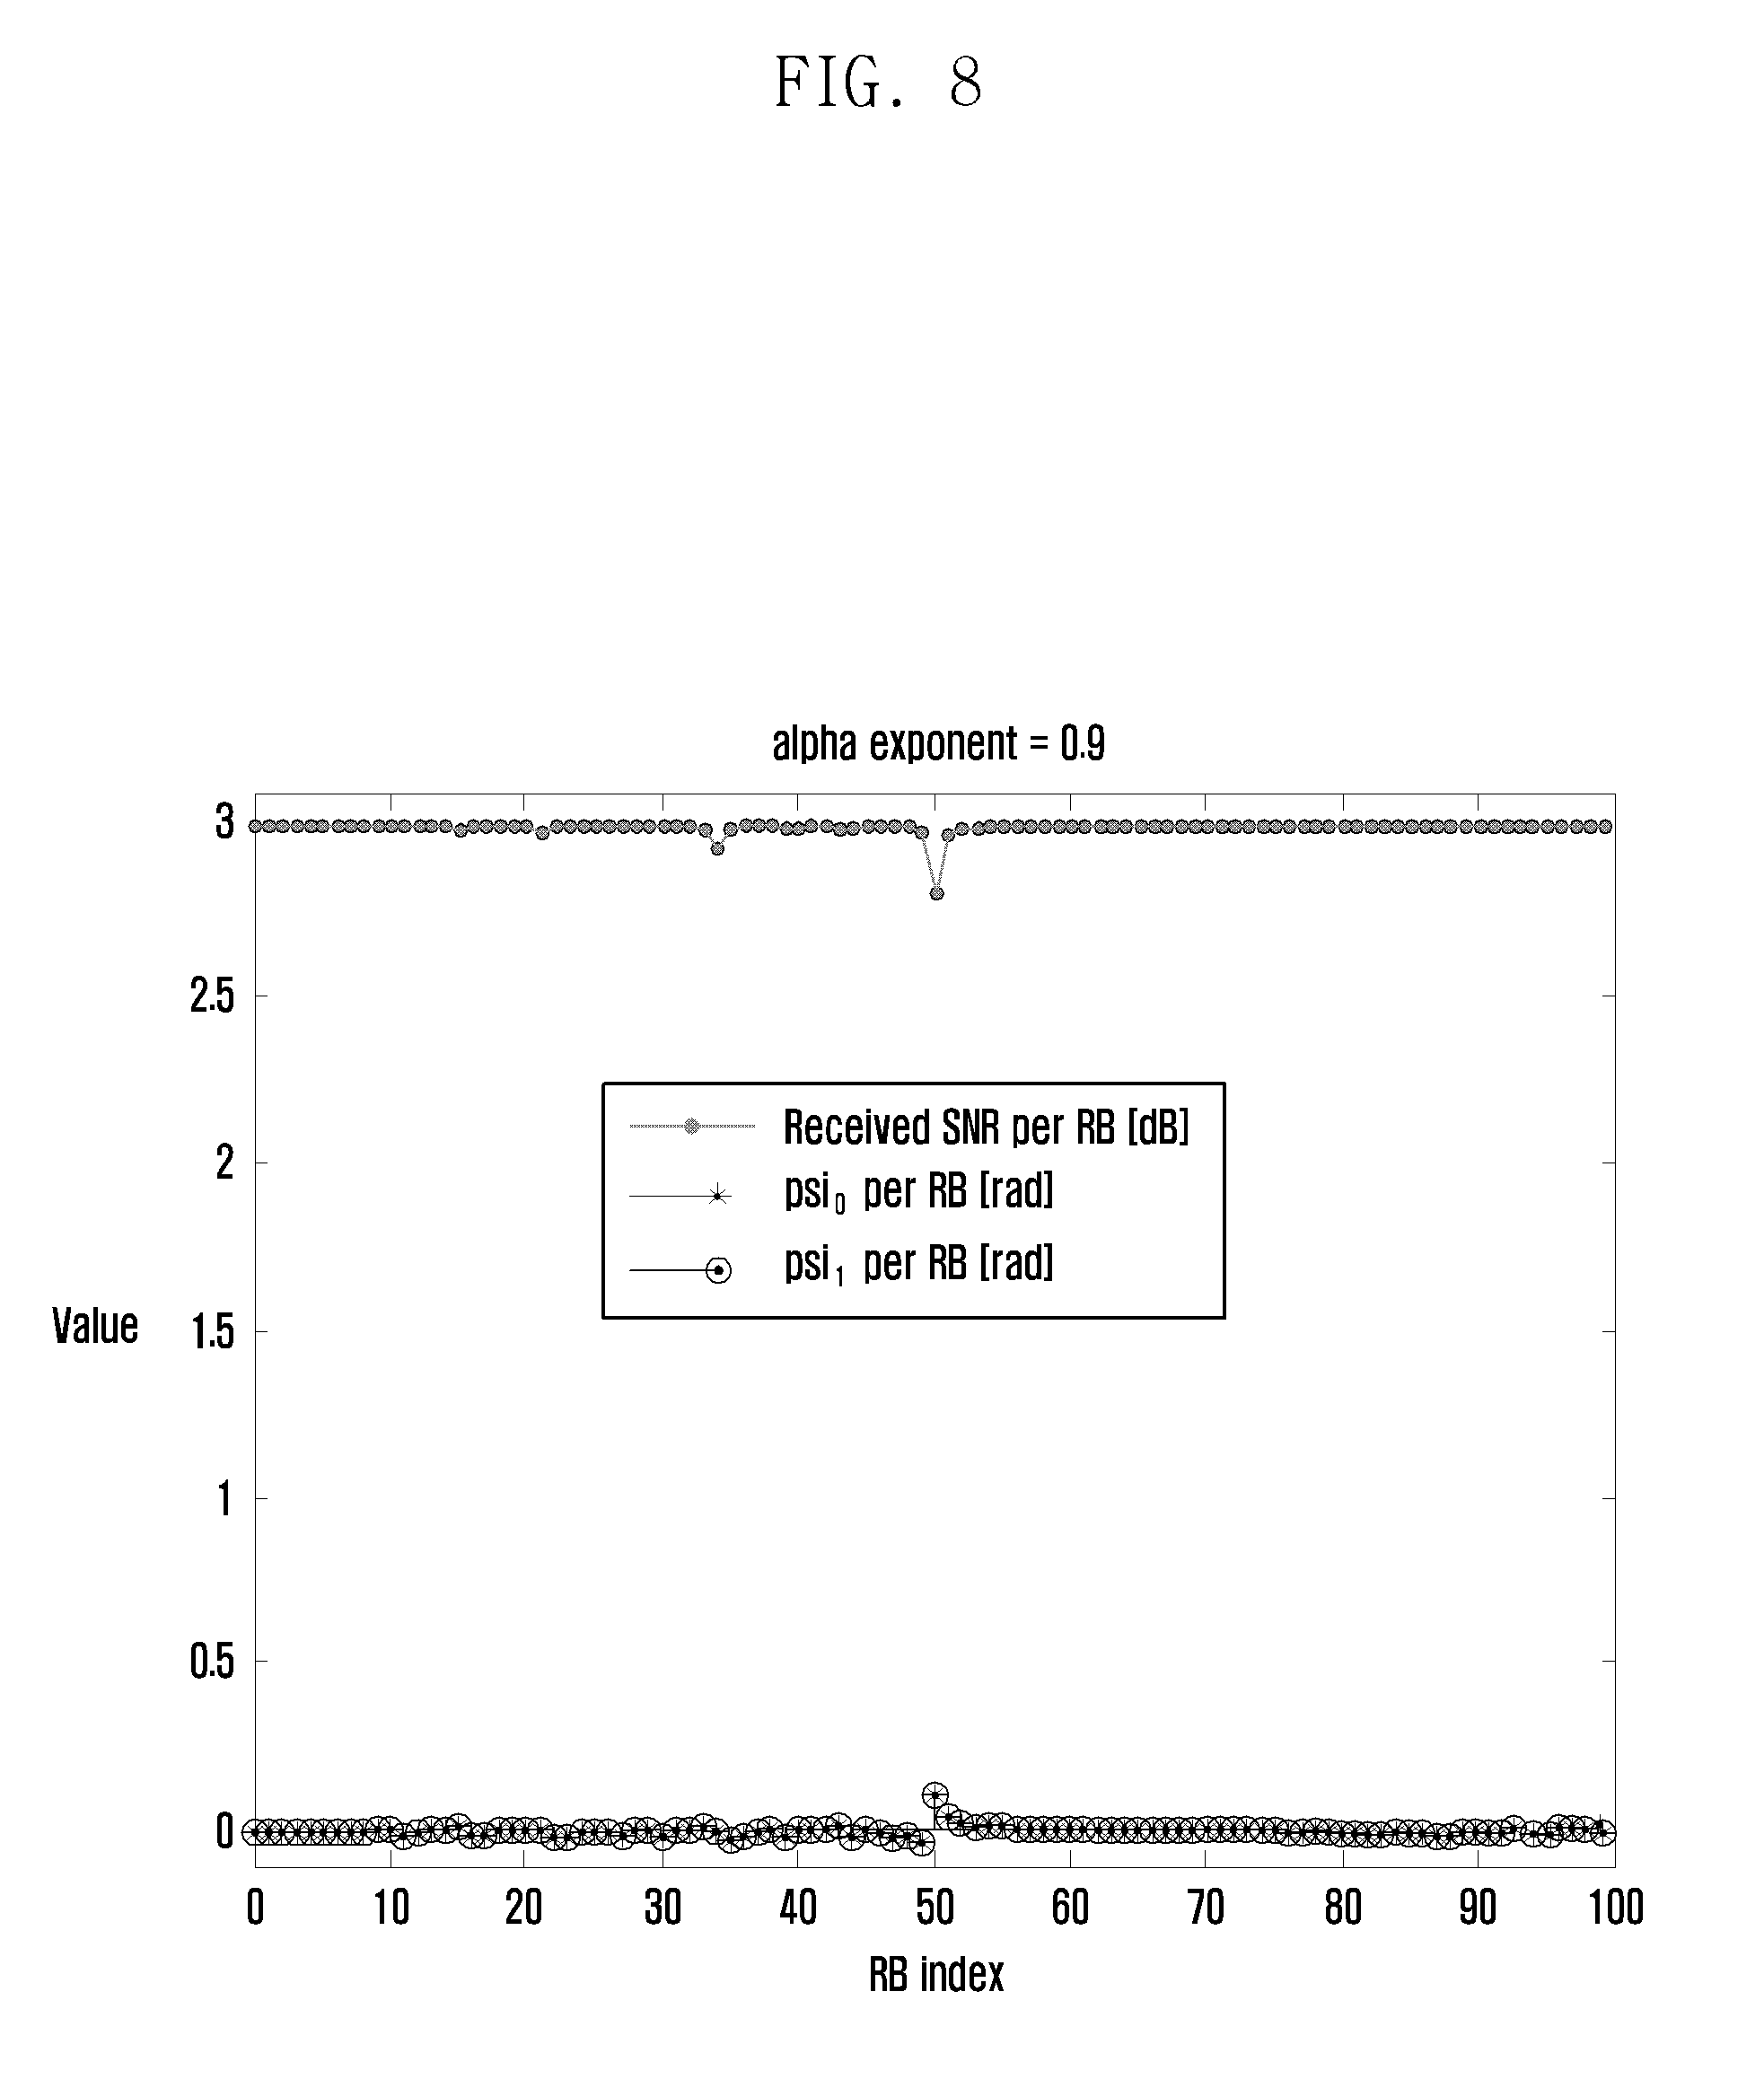
[0019] FIGS. 7 and 8 are diagrams for explaining reception SNRs for a case where the proposed BS-PSAM technology is applied along with .phi..sub..alpha. value of 0 and 0.9, respectively according to an embodiment of the present invention;
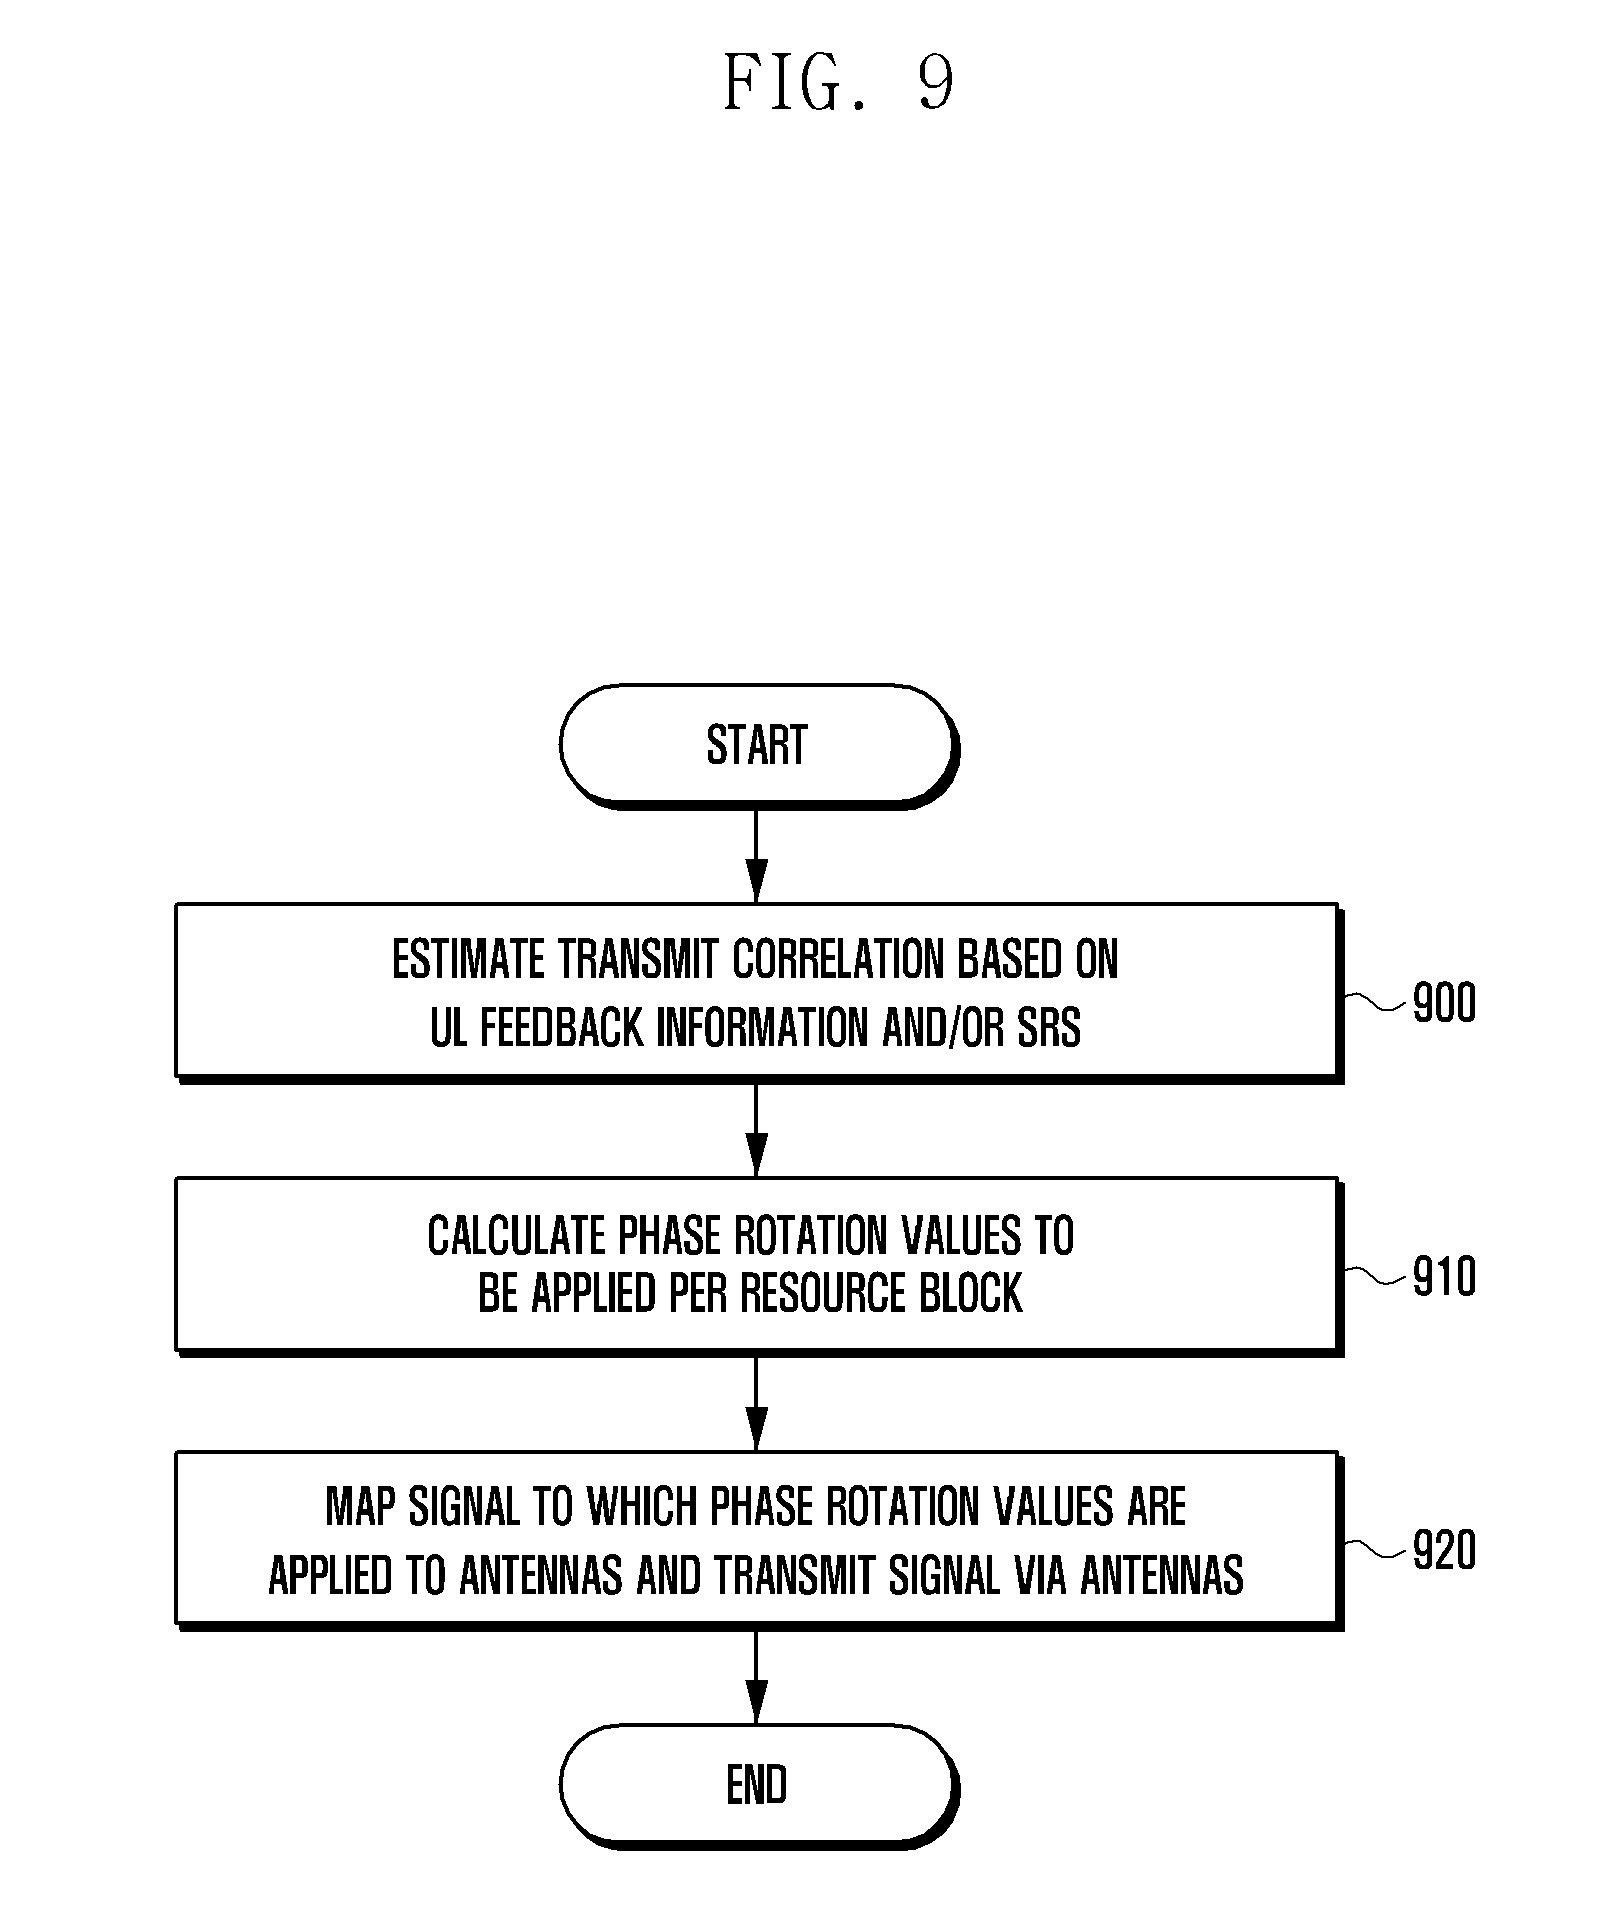
[0020] FIG. 9 is a flowchart illustrating an operation of a transmitter according to an embodiment of the present invention. Here, the transmitter may be a base station; and
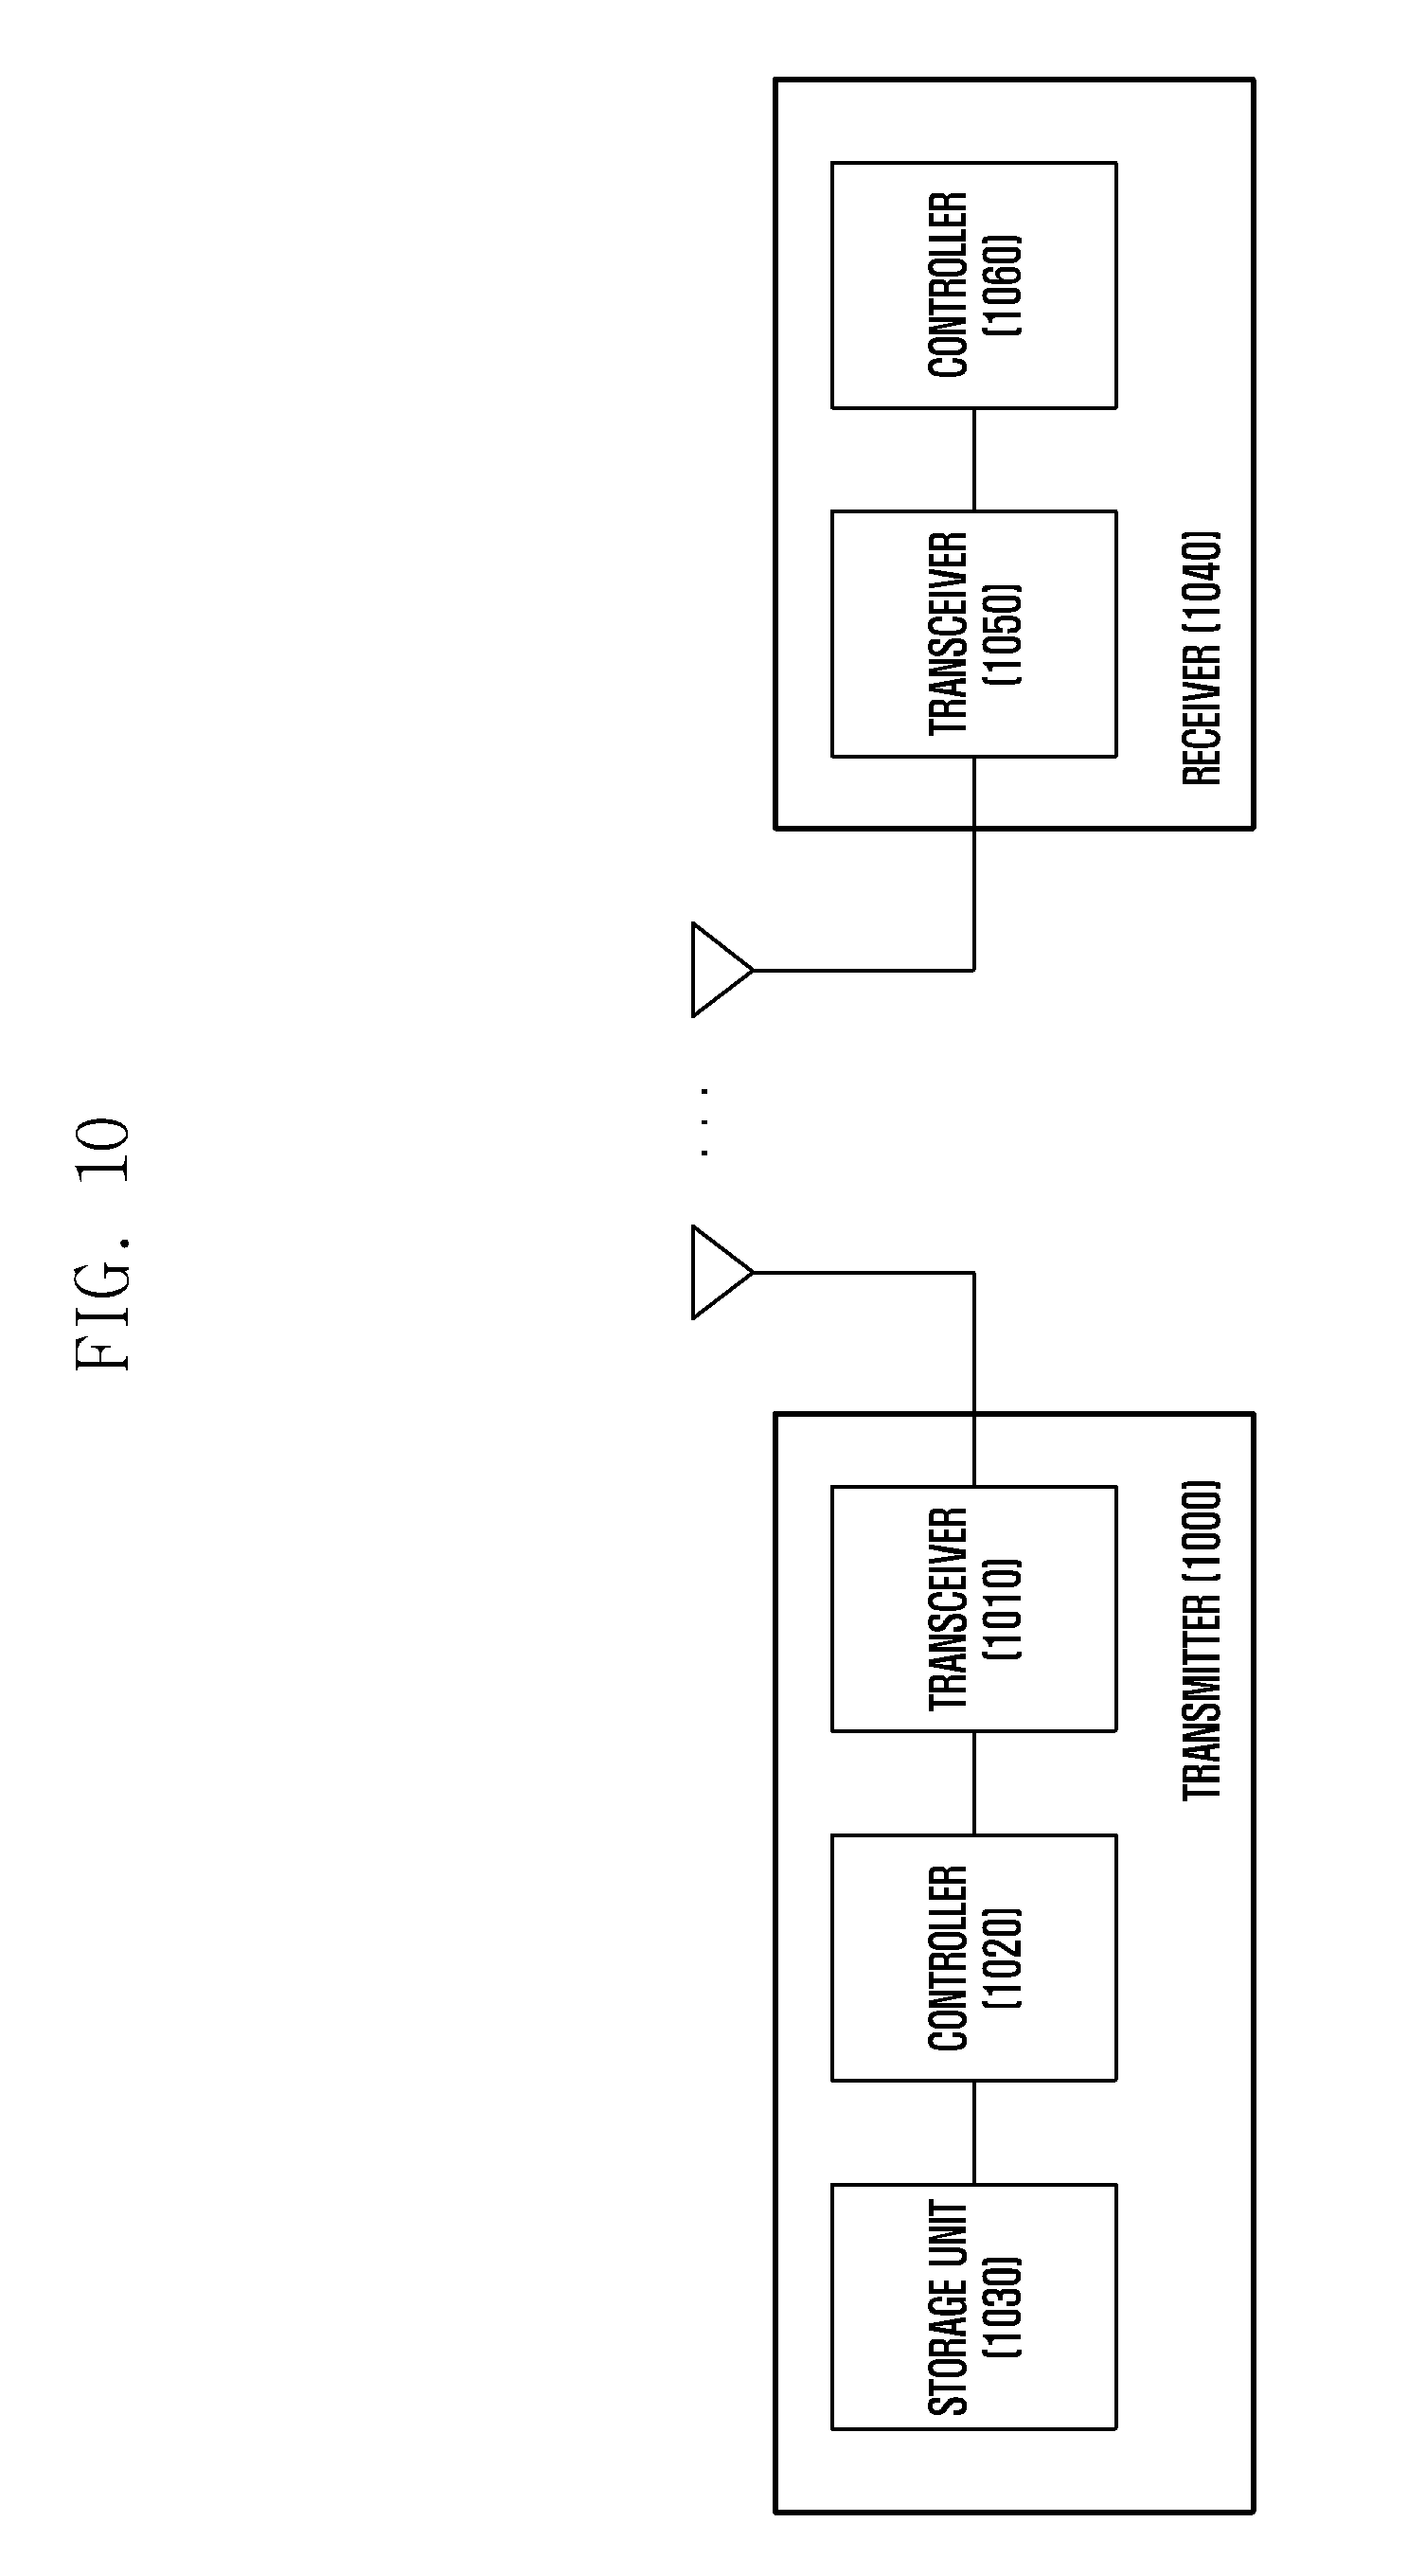
[0021] FIG. 10 is a diagram illustrating a transmitter and a receiver according to an embodiment of the present invention.
MODE FOR THE INVENTION
[0022] Exemplary embodiments of the present invention are described in detail with reference to the accompanying drawings. Detailed description of well-known functions and structures incorporated herein may be omitted to avoid obscuring the subject matter of the present invention. Further, the following terms are defined in consideration of the functionality in the present invention, and may vary according to the intention of a user or an operator, usage, etc. Therefore, the definition should be made on the basis of the overall content of the present specification.
[0023] It will be understood by those skilled in the art that the present invention embodied in various embodiments can be applied even to other communication systems having a similar technical background and channel format, with a slight modification, without departing from the spirit and scope of the present invention.
[0024] Advantages and features of the present invention and methods of accomplishing the same may be understood more readily by reference to the following detailed description of exemplary embodiments and the accompanying drawings. The present invention may, however, be embodied in many different forms and should not be construed as being limited to the exemplary embodiments set forth herein. Rather, these exemplary embodiments are provided so that this invention will be thorough and complete and will fully convey the concept of the invention to those skilled in the art, and the present invention will only be defined by the appended claims. Like reference numerals refer to like elements throughout the specification.
[0025] It will be understood that each block of the flowcharts and/or block diagrams, and combinations of blocks in the flowcharts and/or block diagrams, can be implemented by computer program instructions. These computer program instructions may be provided to a processor of a general-purpose computer, special purpose computer, or other programmable data processing apparatus, such that the instructions that are executed via the processor of the computer or other programmable data processing apparatus create means for implementing the functions/acts specified in the flowcharts and/or block diagrams. These computer program instructions may also be stored in a non-transitory computer-readable memory that can direct a computer or other programmable data processing apparatus to function in a particular manner, such that the instructions stored in the non-transitory computer-readable memory produce articles of manufacture embedding instruction means that implement the function/act specified in the flowcharts and/or block diagrams. The computer program instructions may also be loaded onto a computer or other programmable data processing apparatus to cause a series of operational steps to be performed on the computer or other programmable apparatus to produce a computer implemented process such that the instructions that are executed on the computer or other programmable apparatus provide steps for implementing the functions/acts specified in the flowcharts and/or block diagrams.
[0026] Furthermore, the respective block diagrams may illustrate parts of modules, segments, or codes including at least one or more executable instructions for performing specific logic function(s). Moreover, it should be noted that the functions of the blocks may be performed in a different order in several modifications. For example, two successive blocks may be performed substantially at the same time, or may be performed in reverse order according to their functions.
[0027] According to various embodiments of the present invention, the term "module", means, but is not limited to, a software or hardware component, such as a Field Programmable Gate Array (FPGA) or Application Specific Integrated Circuit (ASIC), which performs certain tasks. A module may advantageously be configured to reside on the addressable storage medium and configured to be executed on one or more processors. Thus, a module may include, by way of example, components, such as software components, object-oriented software components, class components and task components, processes, functions, attributes, procedures, subroutines, segments of program code, drivers, firmware, microcode, circuitry, data, databases, data structures, tables, arrays, and variables. The functionalities of the components and modules may be combined into fewer components and modules or further separated into more components and modules. In addition, the components and modules may be implemented such that they execute one or more CPUs in a device or a secure multimedia card.
[0028] FIG. 1A is a diagram illustrating a device configured to implement a CDD technology.
[0029] In reference to FIG. 1A, an OFDM-based device configured to implement the CDD technology includes a TX processing unit 100, inverse fast Fourier transform (IFFT) units 100 and 112, a delay unit 120, and antennas 130 and 132. In the drawing, k denotes a subcarrier index, the Tx processing unit processes signals on K subcarriers and outputs the processed signals to the IFFT units, the IFFT unit 110 for antenna 0 performs IFFT on the input signals and maps the IFFT'ed signal to antenna 0 130, and the IFFT unit 112 for antenna 1 performs IFFT on the input signals, delays the IFFT'ed signal via the delay unit 120, and maps the delayed signal to antenna 1 132.
[0030] FIG. 1B is a diagram illustrating a device configured to implement a VAM technology.
[0031] In reference to FIG. 1B, a CDMA-based device configured to implement the VAM technology includes a TX processing unit 150, a cyclic shift unit 160, and antennas 170 and 172. After being processed by the TX processing unit, the signal mapped to antenna 0 170 is transferred to the antenna 0 with no phase rotation, and the signal mapped to antenna 1 171 is transferred to the antenna 1 after being phase-rotated.
[0032] As described above, the CDD and VAM are technologies for mapping a signal to the antenna after delaying the signal in time or rotating the signal in phase. That is, both the CDD and VAM are technologies for performing antenna mapping after shifting the phase of a signal (in OFDM systems such as LTE, the signal shifted in phase in the frequency domain as a result of being delayed in time in the time domain) such that the signals transmitted via different antennas experience different channel phases.
[0033] FIG. 2 is a diagram for explaining time-varying channels experienced by signals transmitted via different antennas.
[0034] In reference to FIG. 2, as time 200 goes by, the signals transmitted via antenna 0 220 and antenna 2 230 vary in channel propagation 210. Because the transmission channels differ between antennas, a receiver may achieve transmit diversity gain for the antennas.
[0035] As described above, the CDD and VAM are technologies for achieving a channel diversity in accordance with channel variation between antennas, even the multi-subcarrier technology such as OFDMA has evolved in a way of applying a predetermined phase rotation to all subcarriers.
[0036] In the case of allocating multiple subbands produced by grouping a plurality of subcarriers in an OFDMA-based system such as LTE, it may be possible to use the characteristic in that each user experiences a different channel In particular, considering that the studies are being conducted on a feedback mode for transmitting per-subband CQIs and per-subband PMI to improve resource utilization efficiency through per-subband resource management in the LTE Rel-12, it is necessary to develop an algorithm for applying a phase dynamically per subband.
[0037] FIG. 3 is a block diagram illustrating an OFDM transmission/reception system with 4 antennas.
[0038] In reference to FIG. 3, the OFDM transmission/reception system includes a Tx processing unit 300, IFFT units 310, 312, 314, and 316, delay units 320 and 322, and antennas 330, 332, 334, and 336. The TX processing unit processes signals on K subcarriers, and the IFFT unit 310 for antenna 0 330, the IFFT unit 312 for antenna 1 312, the IFFT unit 314 for antenna 3 334, and the IFFT unit 316 for antenna 3 336 perform IFFT on the signals to be mapped to the respective antennas. Here, the signals to be mapped to the antennas 2 and 3 are delayed by the delay units 320 and 322 with D0 and D1, respectively. This system may be understood as an OFDM system with 4 transmit antennas and 2 receive antennas by applying CDD to two transmit antennas.
[0039] A signal y.sub.k received by a receiver of the system depicted in FIG. 3 is defined as Equation 1.
y.sub.k=H.sub.kD.sub.kTx.sub.k+n.sub.k (1)
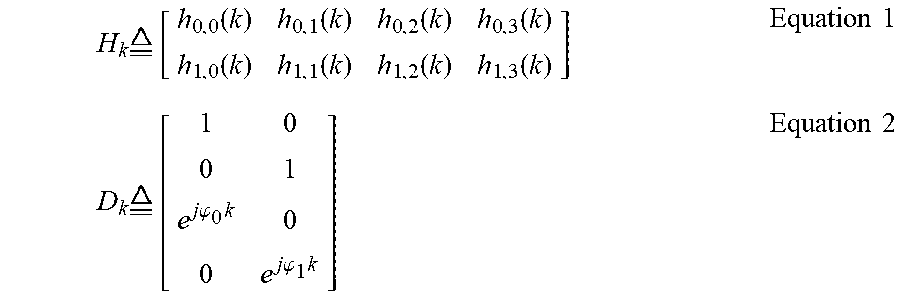
[0040] Here, H.sub.k denotes a channel matrix corresponding to the k.sup.th subcarrier, D.sub.k denotes a kt.sup.th subcarrier response matrix in accordance with a delay diversity, T denotes a transmit precoding matrix, x.sub.k denotes a transmit vector, and n.sub.k denotes a noise vector. Here, H.sub.k and D.sub.k may be defined as Equation 2.
H k [ h 0 , 0 ( k ) h 0 , 1 ( k ) h 0 , 2 ( k ) h 0 , 3 ( k ) h 1 , 0 ( k ) h 1 , 1 ( k ) h 1 , 2 ( k ) h 1 , 3 ( k ) ] Equation 1 D k [ 1 0 0 1 e j .PHI. 0 k 0 0 e j .PHI. 1 k ] Equation 2 ##EQU00001##
[0041] Here,
.PHI. 0 = 2 .pi. D 0 N , .PHI. 1 = 2 .pi. D 1 N , ##EQU00002##
and D.sub.0 and D.sub.1 denote delay values corresponding to respective CDD paths, and N denotes the FFT size of the OFDM system. Accordingly, the CDD delay-based receive channel H.sub.k,eff may be calculated by Equation 3.
H k , eff = H k D k = [ h 0 , 0 ( k ) + h 0 , 2 ( k ) e j .PHI. 0 k h 0 , 1 ( k ) + h 0 , 3 ( k ) e j .PHI. 1 k h 1 , 0 ( k ) + h 1 , 2 ( k ) e j .PHI. 0 k h 1 , 1 ( k ) + h 1 , 3 ( k ) e j .PHI. 1 k ] Equation 3 ##EQU00003##
[0042] In order to observe the effect of the delay diversity, a channel correlation matrix affecting the system throughput may be calculated by Equation 4.
R = E { H k , eff H k , eff H } = H k , eff H } = E { [ h 0 , 0 ( k ) + h 0 , 2 ( k ) e j .PHI. 0 k h 0 , 1 ( k ) + h 0 , 3 ( k ) e j .PHI. 1 k h 1 , 0 ( k ) + h 1 , 2 ( k ) e j .PHI. 0 k h 1 , 1 ( k ) + h 1 , 3 ( k ) e j .PHI. 1 k ] [ h 0 , 0 * ( k ) + h 0 , 2 * ( k ) e - j .PHI. 0 k h 1 , 0 * ( k ) * + h 1 , 2 * ( k ) * e - j .PHI. 0 k h 0 , 1 * ( k ) + h 0 , 3 * ( k ) e - j .PHI. 1 k h 1 , 1 * ( k ) + h 1 , 3 * ( k ) e - j .PHI. 1 k ] } Equation 4 ##EQU00004##
[0043] Here,
R [ r 0 , 0 r 0 , 1 r 1 , 0 r 1 , 1 ] , ##EQU00005##
and per-path correlations of the respective channel matrix values are defined as Equation 5.
E{h.sub.r,0(k)h.sub.r,2*(k)}=E{h.sub.r,1(k)h.sub.r,3*(k)}=.alpha.
E{h.sub.r,2(k)h.sub.4,0*(k)}=E{h.sub.r,3(k)h.sub.r,1*(k)}=.alpha.*
E{h.sub.0,t(k)h.sub.1,t*}=.beta.
E{h.sub.1,t(k)h.sub.0,t*}=.beta.* (5)
[0044] Here, .alpha. and .beta. may respectively denote a transmission path correlation (hereinafter, referred to as transmit correlation) and a receive path correlation (hereinafter, referred as receive correlation), and a is expressed in the form of a complex number of .alpha. .parallel..alpha..parallel.(cos .phi..sub..alpha.+j sin .phi..sub..alpha.). Using the transmit and receive correlations defined as above, the elements of the matrix R are respectively calculated by Equations 6 and 7.
r 0 , 0 = E { ( h 0 , 0 ( k ) + h 0 , 2 ( k ) e j .PHI. 0 k ) ( h 0 , 0 * ( k ) + h 0 , 2 * ( k ) e - j .PHI. 0 k ) + ( h 0 , 1 ( k ) + h 0 , 3 ( k ) e j .PHI. 1 k ) ( h 0 , 1 * ( k ) + h 0 , 3 * ( k ) e - j .PHI. 1 k ) } = E { h 0 , 0 ( k ) 2 } + E { h 0 , 1 ( k ) 2 } + E { h 0 , 2 ( k ) 2 } + E { h 0 , 3 ( k ) 2 } + E { h 0 , 2 ( k ) h 0 , 0 * ( k ) e j .PHI. 0 k } + E { h 0 , 0 ( k ) h 0 , 2 * ( k ) e - j .PHI. 0 k } + E { h 0 , 3 ( k ) h 0 , 1 * ( k ) e j .PHI. 1 k } + E { h 0 , 1 ( k ) h 0 , 3 * ( k ) e - j .PHI. 1 k } Equation 6 = 4 + .alpha. * e j .PHI. 0 k + .alpha. e - j .PHI. 0 k + .alpha. * e j .PHI. 1 k + .alpha. e - j .PHI. 1 k = 4 + 2 Re { .alpha. * e j .PHI. 0 k } + 2 Re { .alpha. * e j .PHI. 1 k } = 4 + 2 .alpha. cos ( .PHI. 0 k - .PHI. .alpha. ) + 2 .alpha. cos ( .PHI. 1 k - .PHI. .alpha. ) = 4 ( 1 + .alpha. cos ( .PHI. 0 + .PHI. 1 2 k - .PHI. .alpha. ) cos ( .PHI. 0 - .PHI. 1 2 k ) ) Equation 1 r 0 , 1 = E { h 0 , 0 ( k ) h 1 , 0 * } + E { h 0 , 2 ( k ) h 1 , 2 * } + E { h 0 , 1 ( k ) h 1 , 1 * } + E { h 0 , 3 ( k ) h 1 , 3 * } + E { h 0 , 2 ( k ) h 1 , 0 * ( k ) e j .PHI. 0 k } + { h 0 , 0 ( k ) h 1 , 2 * ( k ) e - j .PHI. 0 k } + E { h 0 , 3 ( k ) h 1 , 1 * ( k ) e j .PHI. 1 k } + E { h 0 , 1 ( k ) h 1 , 3 * ( k ) e - j .PHI. 1 k } Equation 7 = .beta. + .beta. + .beta. + .beta. + .beta. .alpha. * e j .PHI. 0 k + .beta. .alpha. e - j .PHI. 0 k + .beta. .alpha. * e j .PHI. 1 k + .beta. .alpha. e - j .PHI. 1 k = 4 .beta. ( 1 + .alpha. cos ( .PHI. 0 + .PHI. 1 2 k - .PHI. .alpha. ) cos ( .PHI. 0 - .PHI. 1 2 k ) ) Equation 2 ##EQU00006##
[0045] Because, r.sub.1,1=r.sub.0,0, r.sub.1,0=r*.sub.0,1 the final matrix R is derived as Equation 8.
Equation 8 R = 4 ( 1 + .alpha. cos ( .PHI. 0 + .PHI. 1 2 k - .PHI. .alpha. ) cos ( .PHI. 0 - .PHI. 1 2 k ) ) [ 1 .beta. .beta. * 1 ] Equation 3 ##EQU00007##
[0046] Using Equation 8, it is possible to observe that the matrix R is mainly affected by harmonic components caused by path delays and the transmit correlation. In the case of independent and identically distributed (i.i.d.) channels having the transmit and receive correlations values are 1, i.e., .alpha.=0 and .beta.=0, the receiver may achieve a path diversity without performance degradation effect caused by CDD, but there is likely to be subcarriers on which diversity performance is degraded by the component of
1 + .alpha. cos ( .PHI. 0 + .PHI. 1 2 k - .PHI. .alpha. ) cos ( .PHI. 0 - .PHI. 1 2 k ) ##EQU00008##
as the channel correlation increases.
[0047] FIG. 4 is a diagram illustrating frequency responses represented by Equation 8 in accordance with a specific CDD value under an assumption of a transmit channel correlation .alpha.=1.
[0048] From FIG. 4, it is observed that the impact to the per-frequency signal varies according to the path-specific delay value. In the case of using a fixed delay, although it is advantageous that the delay harmonic components of the CDD drop a specific subcarrier response below 1 so as to obtain diversity gain from frequency selectivity, a high correlation between the antennas is likely to cause frequency nulling on a specific subcarrier, which is likely to degrade the signal reception performance.
[0049] The present invention proposes a band selective phase switching antenna mapping (BS-PSAM) as an algorithm for shifting the phase of a signal to be mapped to different antennas in order to transmit the signal in different subbands of a frequency band, which has not been considered until now in the legacy CDD and VAM algorithms. The BS-PSAM is a method for achieving both the frequency selective diversity and signal-to-noise-ratio (SNR) gains simultaneously by applying a frequency domain phase switching mapping per antenna in consideration of the subband selective channel condition.
[0050] FIG. 5 is a diagram illustrating a configuration of a BS-PSAM system according to an embodiment of the present invention. FIG. 5 depicts a case where the BS-PSAM system is employed at a base station in order to apply the corresponding technology to downlink signals being transmitted from the base station to a terminal.
[0051] In reference to FIG. 5, the BS-PSAM system includes a TX processing unit 500, a BS-PSAM unit 510, IFFT units 520, 522, 524, and 526, a channel state information unit 512, and antennas 530, 532, and 536. The TX processing unit processes signals on K subcarriers and outputs the processed signals to the BS-PSAM unit, and the BS-PSASM unit receives uplink feedback information and/or sounding reference signal (SRS) transmitted by the terminal or uplink channel state information calculated based on the SRS from the channel state information unit and applies CDD by resource block scheduled per UE. The IFFT unit performs IFFT on the CDD-applied signals, and the signals mapped to the respective antennas are transmitted to the terminal.
[0052] FIG. 6 is a diagram for explaining functions of a BS-PSAM unit according to an embodiment of the present invention.
[0053] In FIG. 6, t denotes the t.sup.th transmit antenna, l denotes the l.sup.th resource block. Here, the delay phase corresponding to the t.sup.th transmit antenna and the l.sup.th resource block may be expressed as Formula 9.
e j 2 .pi. D l , t N Formula 9 ##EQU00009##
[0054] In Formula 9, N denotes the FFT size, and t denotes the CDD delay value. The BS-PSAM unit 510 applies a different delay value of formula 9 per resource block. That is, unlike the legacy configuration of applying predetermined delay values in the time domain or predetermined phase rotation values in the frequency domain, the CDD is applied in unit of scheduled resource blocks for a terminal to reflect the frequency-selective characteristic, thereby making it possible to change the phase in unit of minimum resource block and map the signals to the antennas. The BS-PSAM unit determines the delay value based on the channel state information from the channel state information unit and/or information related thereto.
[0055] Hereinafter, a description is made of the method for determining a delay value to be applied per resource block.
[0056] First, an algorithm for finding the frequency selective phase rotation values .phi..sub.l,0 and .phi..sub.l,1 (or delay values D.sub.0 and D.sub.1) that maximize the reception SNR per resource block based on Equation 8 is applied. This may be expressed as Equation 10.
Equation 4 ( , ) = arg max ( .PHI. l , 0 , .PHI. l , 1 ) k .di-elect cons. { subcarrier index } ( 1 + .alpha. cos ( .PHI. l , 0 + .PHI. l , 1 2 k - .PHI. .alpha. ) cos ( .PHI. l , 0 + .PHI. l , 1 2 k ) ) Equation 10 ##EQU00010##
[0057] In Equation 10, .phi..sub.l,0 and .phi..sub.l,1 denote per-antenna phase rotation values corresponding to the i.sup.th resource block.
[0058] From Equation 10, it is observed that the transmit correlation value a should be estimated for fining a pair of the phase rotation values (, ) maximizing the per-resource block reception SNR. Here, the transmit correlation value a means a correlations between signal transmission paths when the receive antenna is fixed. Accordingly, it is necessary to propose a method for estimating the transmit correlation value a in the present invention. The present invention proposes transmit correlation estimation methods for use in a time division duplex (TDD) system and a frequency division duplex (FDD) method as follows.
[0059] In the TDD system, it may be possible to consider a method for a base station modem to estimate the transmit correlation autonomously based on an SRS or a reference signal being transmitted along with a data channel in uplink, exploiting reciprocity between uplink (UL) and downlink (DL) channels. In the FDD system, however, it is necessary to depend on the CQI information transmitted by a terminal because there is no reciprocity between the UL and DL channels. In this case, the CQI information has to include the correlation value a estimated based on a pilot signal transmitted by the base station, which applies neither per-resource block nor per-antenna phase shift to the pilot signal. For example, a discussion is underway on a pilot pattern in order for a terminal to measure an antenna correlation and report a measurement result for data transmission in a millimeter wave spectrum in the 5G system.
[0060] It may also be possible to exploit a subband CQI feedback method in use for the legacy LTE FDD system with no modification from the standard technology. The base station may store information on a few pairs of .phi..sub..alpha. values (phase rotation per transmission path correlation) and select one pair among the (, ) t.di-elect cons.{0, . . . , T-1} pairs predetermined for respective subframes to transmit a signal with the selected pair. The signal to which the pair is applied may be a downlink reference signal. The terminal estimates the subband CQI based on based on the signals to which the (, )t pair has been applied and feeds back the subband CQI to the base station so as to select the (, )t pair corresponding to the highest subband CQI. This may be expressed by Equation 11.
Equation 5 ( , ) t ~ = arg max t k .di-elect cons. { subcarrier index } ( 1 + .alpha. cos ( .PHI. l , 0 , t + .PHI. l , 1 , t 2 k - .PHI. .alpha. , t ) cos ( .PHI. l , 0 , t + .PHI. l , 1 , t 2 k ) ) Equation 11 ##EQU00011##
[0061] Second, it may be possible to consider a method for finding per-resource block phase rotation values based on the estimated transmit correlation value a using tables (, ) tables associated with predetermined .phi..sub..alpha. values like Tables 14 to 1-10 or Tables 1-1 to 1-10. Tables 1-1 to 1-10 are listing the (, ) values for .phi..sub..alpha.=0, and Tables 2-1 to 2-10 are list the (, ) values for .phi..sub..alpha.=0.1. It may be possible to derive (, ) tables containing various .phi..sub..alpha. values from Equation 10.
TABLE-US-00001 TABLE 1-1 RB index average SNR 0 -0.004295 -0.004295 1.99908265 1 0.0042951 0.0042951 1.999825663 2 0.0042951 0.0042951 1.997913174 3 -0.016874 -0.016874 1.998304077 4 0.0125786 0.0125786 1.998363518 5 -0.008283 -0.008283 1.9991622 6 0.0082835 0.0082835 1.997136011 7 0.0122718 0.0122718 1.998933659 8 0.0202485 0.0202485 1.996728504 9 -0.003988 -0.003988 1.998372471 10 -0.003988 -0.003988 1.999876978
TABLE-US-00002 TABLE 1-2 RB index average SNR 11 0.0039884 0.0039884 1.999091604 12 -0.019635 -0.019635 1.996502664 13 0.0156466 0.0156466 1.997270554 14 -0.011658 -0.011658 1.997717521 15 -0.00767 -0.00767 1.99894363 16 -0.00767 -0.00767 1.998167664 17 -0.011351 -0.011351 1.998637299 18 -0.015033 -0.015033 1.998037906 19 -0.018715 -0.018715 1.996533485 20 0.0036816 0.0036816 1.998744714
TABLE-US-00003 TABLE 1-3 RB index average SNR 21 -0.003682 -0.003682 1.99991002 22 -0.003682 -0.003682 1.999124066 23 -0.021783 -0.021783 1.99683223 24 -0.014419 -0.014419 1.998534571 25 -0.010738 -0.010738 1.999098863 26 -0.017794 -0.017794 1.998114407 27 0.0070563 0.0070563 1.999420783 28 -0.007056 -0.007056 1.997850128 29 -0.010431 -0.010431 1.997672276 30 0.0104311 0.0104311 1.997096989
TABLE-US-00004 TABLE 1-4 RB index average SNR 31 0.0171806 0.0171806 1.996852672 32 0.0033748 0.0033748 1.996566684 33 0.0033748 0.0033748 1.999068256 34 0.0033748 0.0033748 1.999931566 35 -0.003375 -0.003375 1.999155197 36 -0.003375 -0.003375 1.996740423 37 0.016567 0.016567 1.998166934 38 0.0131922 0.0131922 1.997293343 39 0.0098175 0.0098175 1.99931745 40 -0.01626 -0.01626 1.998157559
TABLE-US-00005 TABLE 1-5 RB index average SNR 41 -0.006443 -0.006443 1.999238939 42 0.0064427 0.0064427 1.998729232 43 0.0159534 0.0159534 1.998475012 44 -0.009511 -0.009511 1.999452564 45 -0.012579 -0.012579 1.997422592 46 -0.015647 -0.015647 1.997870934 47 -0.021783 -0.021783 1.99652743 48 -0.003068 -0.003068 1.998333747 49 -0.003068 -0.003068 1.9997451 50 0.0003068 0.0003068 1.999997451
TABLE-US-00006 TABLE 1-6 RB index average SNR 51 0.0003068 0.0003068 1.999983332 52 0.0003068 0.0003068 1.99995566 53 0.0003068 0.0003068 1.999914435 54 0.0003068 0.0003068 1.999859657 55 0.0003068 0.0003068 1.999791327 56 0.0003068 0.0003068 1.999709446 57 0.0003068 0.0003068 1.999614015 58 0.0003068 0.0003068 1.999505036 59 0.0003068 0.0003068 1.999382509 60 0.0003068 0.0003068 1.999246437
TABLE-US-00007 TABLE 1-7 RB index average SNR 61 0.0003068 0.0003068 1.999096822 62 0.0003068 0.0003068 1.998933664 63 0.0003068 0.0003068 1.998756968 64 0.0003068 0.0003068 1.998566734 65 0.0003068 0.0003068 1.998362966 66 0.0003068 0.0003068 1.998145667 67 0.0003068 0.0003068 1.997914839 68 0.0003068 0.0003068 1.997670485 69 0.0003068 0.0003068 1.997412609 70 0.0003068 0.0003068 1.997141214
TABLE-US-00008 TABLE 1-8 RB index average SNR 71 0.0003068 0.0003068 1.996856304 72 0.0003068 0.0003068 1.996557883 73 0.0003068 0.0003068 1.996245955 74 -0.021476 -0.021476 1.996398992 75 0.0205553 0.0205553 1.997339761 76 -0.019635 -0.019635 1.997271747 77 -0.019021 -0.019021 1.997839901 78 0.0184078 0.0184078 1.997752124 79 -0.017794 -0.017794 1.997806279 80 -0.017181 -0.017181 1.998151233
TABLE-US-00009 TABLE 1-9 RB index average SNR 81 -0.016567 -0.016567 1.998286458 82 -0.015953 -0.015953 1.997061872 83 0.0156466 0.0156466 1.998435909 84 -0.015033 -0.015033 1.997304029 85 0.0147262 0.0147262 1.998705355 86 0.0144194 0.0144194 1.997973442 87 -0.013806 -0.013806 1.996841393 88 -0.013499 -0.013499 1.998120222 89 -0.013192 -0.013192 1.998688241 90 -0.012885 -0.012885 1.998907147
TABLE-US-00010 TABLE 1-10 RB index average SNR 91 0.0125786 0.0125786 1.998976548 92 -0.012272 -0.012272 1.998933659 93 -0.011965 -0.011965 1.998653225 94 -0.011658 -0.011658 1.997847622 95 -0.02301 -0.02301 1.996812857 96 0.0113515 0.0113515 1.997632067 97 -0.011045 -0.011045 1.999115135 98 -0.010738 -0.010738 1.998910764 99 0.0211689 0.0211689 1.997160253
TABLE-US-00011 TABLE 2-1 RB index average SNR 0 0.0006136 0.0006136 1.9999646 1 0.0006136 0.0006136 1.9999975 2 0.0006136 0.0006136 1.9999761 3 0.0006136 0.0006136 1.9999005 4 0.0006136 0.0006136 1.9997707 5 0.0006136 0.0006136 1.9995867 6 0.0006136 0.0006136 1.9993486 7 0.0006136 0.0006136 1.9990562 8 0.0006136 0.0006136 1.9987097 9 0.0046019 0.0046019 1.99987
TABLE-US-00012 TABLE 2-2 RB index average SNR 11 -0.007363 -0.007363 1.9996463 12 -0.003375 -0.003375 1.9999002 13 0.0122718 0.0122718 1.999101 14 0.0082835 0.0082835 1.9989901 15 0.0159534 0.0159534 1.9981166 16 -0.014726 -0.014726 1.9987081 17 -0.007056 -0.007056 1.9992694 18 0.0042951 0.0042951 1.9998127 19 0.0042951 0.0042951 1.9991257 20 0.0116583 0.0116583 1.9991705
TABLE-US-00013 TABLE 2-3 RB index average SNR 21 0.0116583 0.0116583 1.9902869 22 -0.014113 -0.014113 1.9987976 23 -0.00675 -0.00675 1.9997047 24 -0.003068 -0.003068 1.9991308 25 -0.003068 -0.003068 1.9999377 26 -0.003068 -0.003068 1.9993895 27 -0.010124 -0.010124 1.9983165 28 0.0110447 0.0110447 1.9991629 29 0.0039884 0.0039884 1.9999036 30 -0.006443 -0.006443 1.9995996
TABLE-US-00014 TABLE 2-4 RB index average SNR 31 0.0073631 0.0073631 1.9993642 32 0.0107379 0.0107379 1.9991379 33 0.0174874 0.0174874 1.9978155 34 0.0073631 0.0073631 1.9710113 35 -0.019635 -0.019635 1.9976198 36 -0.009511 -0.009511 1.9993139 37 -0.006136 -0.006136 1.9995007 38 0.0070563 0.0070563 1.999674 39 -0.012579 -0.012579 1.9970831 40 0.0036816 0.0036816 1.9978141
TABLE-US-00015 TABLE 2-5 RB index average SNR 41 0.0036816 0.0036816 1.9997046 42 0.0036816 0.0036816 1.9996442 43 0.0131922 0.0131922 1.997683 44 -0.012272 -0.012272 1.9955867 45 0.0067495 0.0067495 1.9996658 46 -0.005829 -0.005829 1.999511 47 -0.008897 -0.008897 1.9995284 48 -0.015033 -0.015033 1.9986334 49 -0.033441 -0.033441 1.9918851 50 0.1076855 0.1076855 1.913719
TABLE-US-00016 TABLE 2-6 RB index average SNR 51 0.0469398 0.0469398 1.9864297 52 0.0291456 0.0291456 1.9948854 53 0.0211689 0.0211689 1.997332 54 0.016567 0.016567 1.9983612 55 0.013499 0.013499 1.9989119 56 0.0113515 0.0113515 1.9991927 57 0.0098175 0.0098175 1.9993595 58 0.0088971 0.0088971 1.999457 59 0.0079767 0.0079767 1.9995321 60 0.0070563 0.0070563 1.9996762
TABLE-US-00017 TABLE 2-7 RB index average SNR 61 0.0064427 0.0064427 1.9997232 62 0.0058291 0.0058291 1.9995396 63 0.0055223 0.0055223 1.9998149 64 0.0052155 0.0052155 1.9997868 65 0.0049087 0.0049087 1.9997366 66 0.0046019 0.0046019 1.9997829 67 0.0042951 0.0042951 1.9998816 68 0.0039884 0.0039884 1.999826 69 0.0039884 0.0039884 1.9992834 70 0.0036816 0.0036816 1.9998911
TABLE-US-00018 TABLE 2-8 RB index average SNR 71 0.0033748 0.0033748 1.9995506 72 0.0033748 0.0033748 1.9998493 73 0.003068 0.003068 1.9993895 74 0.003068 0.003068 1.9999377 75 0.003068 0.003068 1.9991308 76 0.0027612 0.0027612 1.9997431 77 0.0027612 0.0027612 1.9998756 78 0.0027612 0.0027612 1.9989106 79 0.0024544 0.0024544 1.9995164 80 0.0024544 0.0024544 1.999964
TABLE-US-00019 TABLE 2-9 RB index average SNR 81 0.0024544 0.0024544 1.9995443 82 -0.013806 -0.013806 1.9988328 83 0.0021476 0.0021476 1.9993389 84 0.0021476 0.0021476 1.9999242 85 0.0021476 0.0021476 1.9998455 86 0.0021476 0.0021476 1.9991028 87 -0.011965 -0.011965 1.9991222 88 -0.011658 -0.011658 1.9991521 89 0.0018408 0.0018408 1.9996274 90 0.0018408 0.0018408 1.9999699
TABLE-US-00020 TABLE 2-10 RB index average SNR 91 0.0018408 0.0018408 1.9998245 92 0.0018408 0.0018408 1.9991912 93 0.0138058 0.0138058 1.9984044 94 -0.010124 -0.010124 1.9989909 95 -0.009817 -0.009817 1.9992651 96 0.001534 0.001534 1.9990499 97 0.001534 0.001534 1.9996769 98 0.001534 0.001534 1.9999651 99 0.001534 0.001534 1.9999146
[0062] FIGS. 7 and 8 are diagrams for explaining reception SNRs for a case where the proposed BS-PSAM technology is applied along with .phi..sub..alpha. value of 0 and 0.9, respectively according to an embodiment of the present invention.
[0063] From FIGS. 7 and 8, it is observed that a reception gain close to the logical reception SNR of 3 dB achievable with extension from 2T to 4T may be obtained by applying the (, ) table proposed in the present invention when the phase .phi..sub..alpha. is known by estimating the correlation value a of the transmission path.
[0064] FIG. 9 is a flowchart illustrating an operation of a transmitter according to an embodiment of the present invention. Here, the transmitter may be a base station.
[0065] In reference to FIG. 9, the base station may estimate a transmit correlation based on uplink feedback information or SRS at step 900. Here, the uplink feedback information may be a subband CQI. At step 910, the base station calculates phase rotation values to be applied to a signal per resource block (or small unit of frequency band that corresponds to a resource block) using one of two methods proposed in the present invention based on a transmit correlation. At step 920, the base station maps the signal to which the calculated per-resource block phase rotation values have been applied to antennas and transmits the mapped signal.
[0066] FIG. 10 is a diagram illustrating a transmitter and a receiver according to an embodiment of the present invention. The transmitter may be a base station, and the receiver may be a terminal.
[0067] In reference to FIG. 10, the transmitter 1000 may include a transceiver 1010, a controller 1020, and a storage unit 1030, and the receiver 1040 may include a transceiver 1050 and a controller 1060. Here, the storage unit of the transmitter may store (, ) tables listing frequency selective phase rotation values pre-calculated based on the transmit correlation according to the second method proposed in the present invention. The controller may estimate the transmit correlation based on uplink feedback information, SRS, reference signal received by the transceiver, calculate (, ) values maximizing the reception SNR based on the estimated transmit correlation according to the first method proposed in the present invention. Afterward, it may be possible to control the transceiver to transmit a signal by applying the (, ) value calculated per resource block. It may also be possible to control the transceiver to transmit the signal by applying the (, ) value pre-configured based on the calculated transmit correlation according to the second method. The transceiver may map the signal to which the (, ) value determined per resource block in a frequency-selective manner to the antenna and transmits the mapped signal. The transceiver may transmit the SRS to the terminal and the signal to the terminal according to a predetermined (, ) pair and receive uplink feedback information from the terminal. The transceiver may include the function blocks of FIGS. 5 and 6, or the controller may perform corresponding functions.
[0068] The transceiver of the transmitter may receive various signals transmitted by the base station and transmit uplink feedback information to the base station. The controller of the receiver may receive and decode a phase-rotated signal based on the reference signal transmitted by the base station.
* * * * *
D00000
D00001
D00002
D00003
D00004
D00005
D00006
D00007
D00008
D00009
D00010
D00011


P00001

P00002

P00003

P00004

P00005

P00006

P00007

P00008

P00009

P00010

P00011

P00012

P00013

P00014

P00015

P00016

P00017

P00018

P00019

P00020

P00021

P00022

P00023

P00024

P00025

P00026

P00027

P00028

P00029

P00030

P00031

P00032

P00033

P00034

P00035

P00036

P00037

P00038

P00039

P00040

P00041

P00042

XML
uspto.report is an independent third-party trademark research tool that is not affiliated, endorsed, or sponsored by the United States Patent and Trademark Office (USPTO) or any other governmental organization. The information provided by uspto.report is based on publicly available data at the time of writing and is intended for informational purposes only.
While we strive to provide accurate and up-to-date information, we do not guarantee the accuracy, completeness, reliability, or suitability of the information displayed on this site. The use of this site is at your own risk. Any reliance you place on such information is therefore strictly at your own risk.
All official trademark data, including owner information, should be verified by visiting the official USPTO website at www.uspto.gov. This site is not intended to replace professional legal advice and should not be used as a substitute for consulting with a legal professional who is knowledgeable about trademark law.