Three-dimensional Shape, Displacement, And Strain Measurement Device And Method Using Periodic Pattern, And Program Therefor
WANG; Qinghua ; et al.
U.S. patent application number 16/328309 was filed with the patent office on 2019-07-11 for three-dimensional shape, displacement, and strain measurement device and method using periodic pattern, and program therefor. The applicant listed for this patent is NATIONAL INSTITUTE OF ADVANCED INDUSTRIAL SCIENCE AND TECHNOLOGY. Invention is credited to Shien RI, Hiroshi TSUDA, Qinghua WANG.
| Application Number | 20190212130 16/328309 |
| Document ID | / |
| Family ID | 61760268 |
| Filed Date | 2019-07-11 |


View All Diagrams
| United States Patent Application | 20190212130 |
| Kind Code | A1 |
| WANG; Qinghua ; et al. | July 11, 2019 |
THREE-DIMENSIONAL SHAPE, DISPLACEMENT, AND STRAIN MEASUREMENT DEVICE AND METHOD USING PERIODIC PATTERN, AND PROGRAM THEREFOR
Abstract
In a conventional moire method, achieving both measurement accuracy and dynamic measurement and balancing field of view and measurement accuracy have been difficult. The present invention makes it possible to handle conventional moire fringes as a grating for generating phase-shifted second-order moire fringes, use a spatial phase shift method algorithm to accurately analyze the phases of the second-order moire fringes before and after deformation, and determine shape from the phase differences between gratings projected onto the surface of an object of measurement and a reference surface and determine deformation and strain from the phase differences between the second-order moire fringes, before and after deformation, of a repeating pattern on the object surface or a produced grating. As a result, it is possible to measure the three-dimensional shape and deformation distribution of an object accurately and with a wide field of view or dynamically and with a high degree of accuracy.
| Inventors: | WANG; Qinghua; (Tsukuba-shi, JP) ; RI; Shien; (Tsukuba-shi, JP) ; TSUDA; Hiroshi; (Tsukuba-shi, JP) | ||||||||||
| Applicant: |
|
||||||||||
|---|---|---|---|---|---|---|---|---|---|---|---|
| Family ID: | 61760268 | ||||||||||
| Appl. No.: | 16/328309 | ||||||||||
| Filed: | June 1, 2017 | ||||||||||
| PCT Filed: | June 1, 2017 | ||||||||||
| PCT NO: | PCT/JP2017/020435 | ||||||||||
| 371 Date: | February 26, 2019 |
| Current U.S. Class: | 1/1 |
| Current CPC Class: | G01B 11/25 20130101; G01N 21/45 20130101; G01N 2021/8829 20130101; G01B 11/16 20130101; G01J 2009/0234 20130101; G06T 7/521 20170101; G01B 11/165 20130101; G01B 11/254 20130101; G01N 2021/456 20130101; G01L 1/24 20130101; G01B 11/161 20130101; G01J 9/02 20130101 |
| International Class: | G01B 11/16 20060101 G01B011/16; G01J 9/02 20060101 G01J009/02; G01B 11/25 20060101 G01B011/25 |
Foreign Application Data
| Date | Code | Application Number |
|---|---|---|
| Sep 27, 2016 | JP | 2016-188217 |
Claims
1-7. (canceled)
8. A method for measuring a displacement distribution: comprising a first step for obtaining a first moire fringe by first down-sampling and intensity interpolation to a grating image in a predetermined direction, the grating image displaying a lattice on a specimen; a second step for generating a second moire fringe by second down-sampling and intensity interpolation to the first moire fringe in the predetermined direction; and a third step for calculating the displacement distribution in the predetermined direction or a depth direction based on a phase difference distribution of the second moire fringe before and after deformation.
9. The method according to claim 8, wherein the first step comprises a step of generating T frames of the first moire fringes with phases shifted by t times of a reciprocal of T, t denoting an integer greater than or equal to 0 and less than or equal to T-1, T denoting a first down-sampling pitch for the first down-sampling; and the second step comprises a step of generating T.sup.(2) frames of the second moire fringe with phases shifted by k times of a reciprocal of T.sup.(2), k denoting an integer greater than or equal to 0 and less than or equal to T.sup.(2)-1, T.sup.(2) denoting a second down-sampling pitch for the second down-sampling; and a step of generating the phase distribution of the second moire fringe by performing Fourier transform of the TT.sup.(2) frames of the second moire fringe.
10. The method according to claim 8, further comprising a fourth step of adjusting the pitch of the first moire fringe by multiplying the phase of the first moire fringe by an adjustment factor N, N denoting an integer greater than or equal to 2; wherein the first moire fringe with the adjusted phase is applied to the second step.
11. The method according to claim 8, wherein the first step is characterized by scanning the grating image with a predetermined first down-sampling pitch to record the first moire fringe.
12. The method according to claim 8, further comprising a fourth step of calculating a strain distribution by differentiating the displacement distribution in the predetermined direction; wherein the grating is imparted on the surface of the specimen.
13. The method according to claim 8, wherein the phase difference distribution is a difference between the phase distribution of the second moire fringe derived from the grating on a reference surface and the phase distribution of the second moire fringe derived from the grating on the specimen, the grating projected by a projecting device; and the third step comprises a step of calculating the displacement distribution in the depth direction based on the phase difference distribution and a conversing factor regarding a relation between a distance in the depth direction and the phase difference, the displacement distribution being a shape of the specimen.
14. An apparatus for measuring a displacement distribution: comprising storage circuitry configured to obtain a first moire fringe by first down-sampling and intensity interpolation to a grating image in a predetermined direction, the grating image displaying a lattice on a specimen; generation circuitry configured to generate a second moire fringe by second down-sampling and intensity interpolation to the first moire fringe in the predetermined direction; and arithmetic operation circuitry configured to calculate the displacement distribution in the predetermined direction or a depth direction based on a phase difference distribution of the second moire fringe before and after deformation.
15. A computer program product stored in a non-transitory computer-readable medium that is programmed for measuring a displacement distribution to perform: a first step of obtaining a first moire fringe by first down-sampling and intensity interpolation to a grating image in a predetermined direction, the grating image displaying a lattice on a specimen; a second step of generating a second moire fringe by second down-sampling and intensity interpolation to the first moire fringe in the predetermined direction; and a third step of calculating the displacement distribution in the predetermined direction or a depth direction based on a phase difference distribution of the second moire fringe before and after deformation.
Description
TECHNICAL FIELD
[0001] An object of the present invention is to develop 2nd-order moire technology and a program therefor in order to measure a three-dimensional shape, a displacement distribution or a strain distribution of a specimen with high accuracy and a wide field of view. It belongs to the fields of non-destructive measurement, experimental mechanics and optical technology.
BACKGROUND ART
[0002] Measurement of the shape and deformation of an object is extremely important for evaluating mechanical properties, structural instability, crack propagation, and residual stress. With miniaturization and integration of products, measurement of deformation at millimeter, micron, and nanoscale levels has attracted much attention in the field of materials science.
[0003] Techniques generally used for measurement of the three-dimensional shape and measurement of minute deformation of an object at present include the digital image correlation (DIC) method, electronic speckle pattern interferometry (ESPI), geometric phase analysis (GPA), the phase analysis methods (for example, Fourier transformation, the phase shifting method, the spatiotemporal phase shifting method, and the like), and the moire methods, and the like as optical full-field measurement methods.
[0004] Although DIC has high measurement accuracy, it is disadvantageous in that the deformation measurement is easily influenced by the disturbance of noise. ESPI is significantly sensitive to vibration. Since the specimen grating should be directly observed in GPA, the field of view is narrower than that in the scanning moire method. The Fourier transformation method is another method for analyzing small-scale deformation in a plane, but the field of view is also narrower because the specimen grating to be used should be observed (the width of the field of view is usually less than 100 times the pitch of a grating).
[0005] The moire methods are effective for performing non-destructive measurement of the deformation distribution from changes in moire fringes before and after deformation. Among various moire methods, the microscope moire method, the CCD or CMOS moire method (hereinafter, referred to as the CCD moire method), moire interferometry, the sampling moire method, the digital moire method, and the overlapped (geometric) moire method have attracted much attention and are applied to deformation measurement of various materials and structures.
[0006] The microscope moire method and moire interferometry are suitable for measurement of micron/nanoscale deformation using a microscope. The CCD moire method, the sampling moire method, the digital moire method, and the overlapped moire method can be used to measure nanoscale to meter scale deformation in the case in which a grating image can be acquired.
[0007] The moire methods have been applied to measurement of strains of materials such as metals, polymer, and composite materials and deformation of structures such as bridges and buildings. In addition, it is possible to drastically improve measurement accuracy of deformation measurement by analyzing the phase of moire fringes from a grating image.
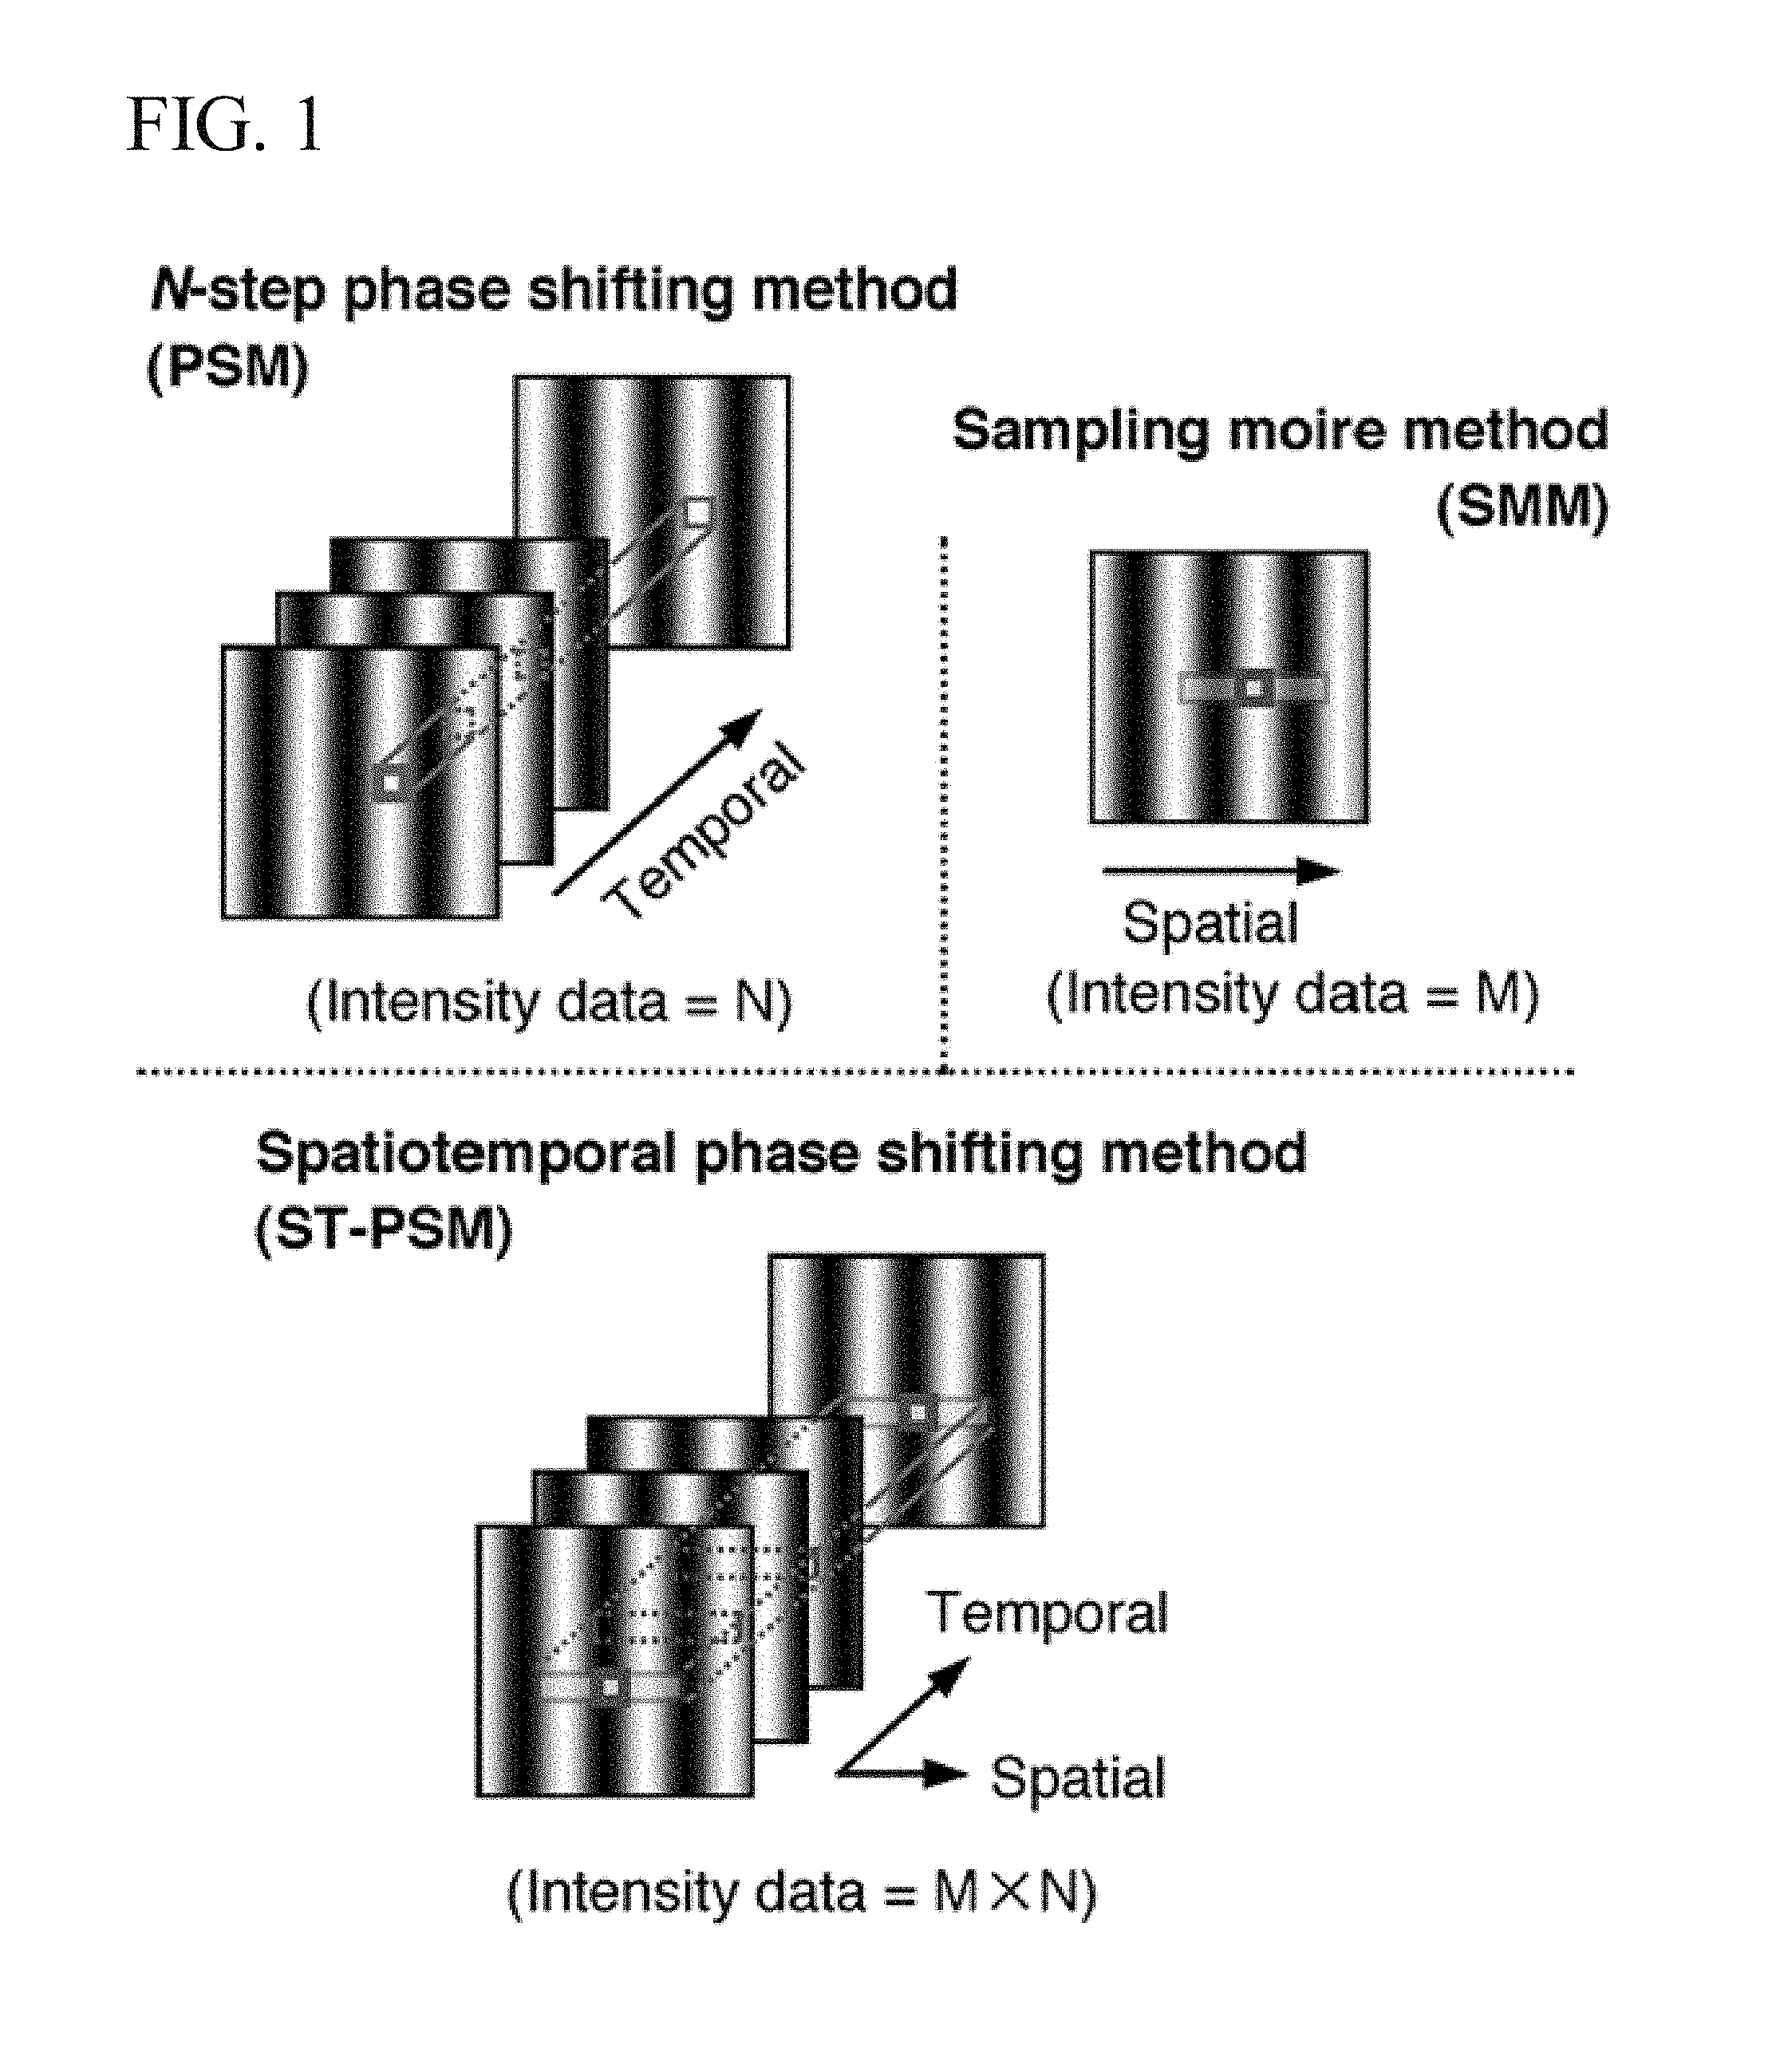
[0008] Phase analysis of a fringe grating (fringes or a grating, hereinafter, simply referred to as fringes) image include a phase shifting method for analyzing a phase using a plurality of phase-shifted fringe images as shown in FIG. 1, the sampling moire method for analyzing a phase using only one fringe image, and the spatiotemporal phase shifting method in which a phase shifting method and the sampling moire method are combined.
[0009] In the phase shifting method and the spatiotemporal phase shifting method, it is necessary to capture a plurality of fringe images, and thus the methods cannot be applied to dynamic measurement. The sampling moire method can analyze a phase from one fringe image and can be applied to dynamic measurement, but there is a problem in that it is impossible to perform high-accuracy measurement in an environment with much noise. A high-accuracy three-dimensional shape and deformation measurement method performed by capturing one fringe image is desired.
CITATION LIST
Patent Literature
[0010] [Patent Literature 1]
[0011] Japanese Patent No. 5818218: Method and device for analyzing a phase distribution of a fringe image using high-dimensional intensity information, and program for the same; Shien Ri [0012] [Patent Literature 2]
[0013] PCT International Publication No. WO/2015/008404: Method and device for measuring displacement distribution using regular pattern, and program for such method and device; Shien Ri and Hiroshi Tsuda [0014] [Patent Literature 3]
[0015] Japanese Patent Application No. 2016-028169 (2016.2.17): Method and device for measuring high-speed displacement and strain distribution using moire method; Qinghua Wang, Shien Ri, and Takashi Tokizaki
Non-Patent Literature
[0016] [Non-Patent Literature 1]
[0017] Qinghua Wang, Hiroshi Tsuda and Huimin Xie, Developments and Applications of Moire Techniques for Deformation Measurement, Structure Characterization and Shape Analysis, Vol. 8, No. 3, pp. 188-207 (2015)
SUMMARY OF INVENTION
Technical Problem
[0018] In the traditional moire methods including the microscope moire method, the CCD moire method, moire interferometry, the sampling moire method, the digital moire method, and the overlapped moire method, it is difficult to balance the field of view and measurement accuracy.
[0019] In the microscope moire method, the CCD moire method, moire interferometry, the digital moire method, and the overlapped moire method, the fringe centering technique is usually adopted for deformation measurement. Since only the center lines of the moire fringes are used for calculation of the deformation distribution, the measurement accuracy of deformation is not high.
[0020] In the case in which the spatiotemporal phase shifting method disclosed in Patent Literature 1 is used, it is possible to improve measurement accuracy in the microscope and the CCD moire method. However, the operation of recording a plurality of phase-shifted moire fringes and grating images is time consuming and is not suitable for dynamic measurement easily influenced by vibration.
[0021] In the sampling moire method, measurement accuracy can be improved using the spatial phase shifting method, but it is not possible to realize both high accuracy and a wide field of view at the same time. A specimen having a larger grating pitch imparts high measurement accuracy, but has a decreased field of view. A specimen having a smaller grating pitch (less than 3 pixels) can be set to have a wide field of view, but the spatial phase shifting method for calculating deformation cannot be executed.
[0022] The aim is to achieve high measurement accuracy of deformation and a wide field of view (FIG. 2) or high accuracy and dynamic measurement at the same time.
Solution to Problem
[0023] The present invention proposes a 2nd-order moire method as an innovative deformation measurement technique for achieving a wide field of view and high accuracy or high accuracy and dynamic measurement at the same time.
[0024] A core idea is to treat the recorded or generated traditional moire fringes as a grating for generating a phase-shifted 2nd-order moire fringe pattern. The phase of the 2nd-order moire fringes can be calculated more accurately using an algorithm such as the spatial phase shifting method or the spatiotemporal phase shifting method.
[0025] It is possible to determine the shape and out-of-plane displacement distribution from the phase difference between gratings projected on the surface of a measurement target and a reference surface, or determine the displacement and strain distributions from the phase difference between 2nd-order moire fringes before and after a grating attached to the surface of an object is deformed.
[0026] As a result, it is possible to measure the three-dimensional shape and out-of-plane displacement distribution, or the in-plane displacement and strain distributions of the object accurately with a wide field of view or dynamically with high accuracy.
[0027] Formation of 2nd-Order Moire Fringes
[0028] Scanning lines of a microscope, the pixel array of a camera, a virtual grating (down-sampling pixel array), or a digital grating can be used as the reference grating.
[0029] When there is a slight mismatch or misalignment between the specimen grating and the reference grating, traditional moire fringes will appear from interference between the specimen grating and the reference grating (FIG. 3(a)).
[0030] Traditional moire fringes include microscope moire fringes, CCD moire fringes, sampling moire fringes, and digital moire fringes.
[0031] These traditional moire fringes are treated as gratings.
[0032] When down-sampling processing is performed with a pitch T.sup.(2) close to an interval P.sub.m of the traditional moire fringes and intensity interpolation is performed on each of down-sampling images by shifting the starting point of down-sampling by one pixel for each of (T.sup.(2)-1) times, it is possible to obtain phase-shifted 2nd-order moire fringes with a T.sup.(2) step as shown in FIG. 3(b).
[0033] There are three methods of generating 2nd-order moire fringes and three methods of calculating a phase distribution thereof.
[0034] Calculation Principle 1 of Phase Distribution of 2nd-Order Moire Fringes (Case in which Moire Fringes are Treated as Grating)
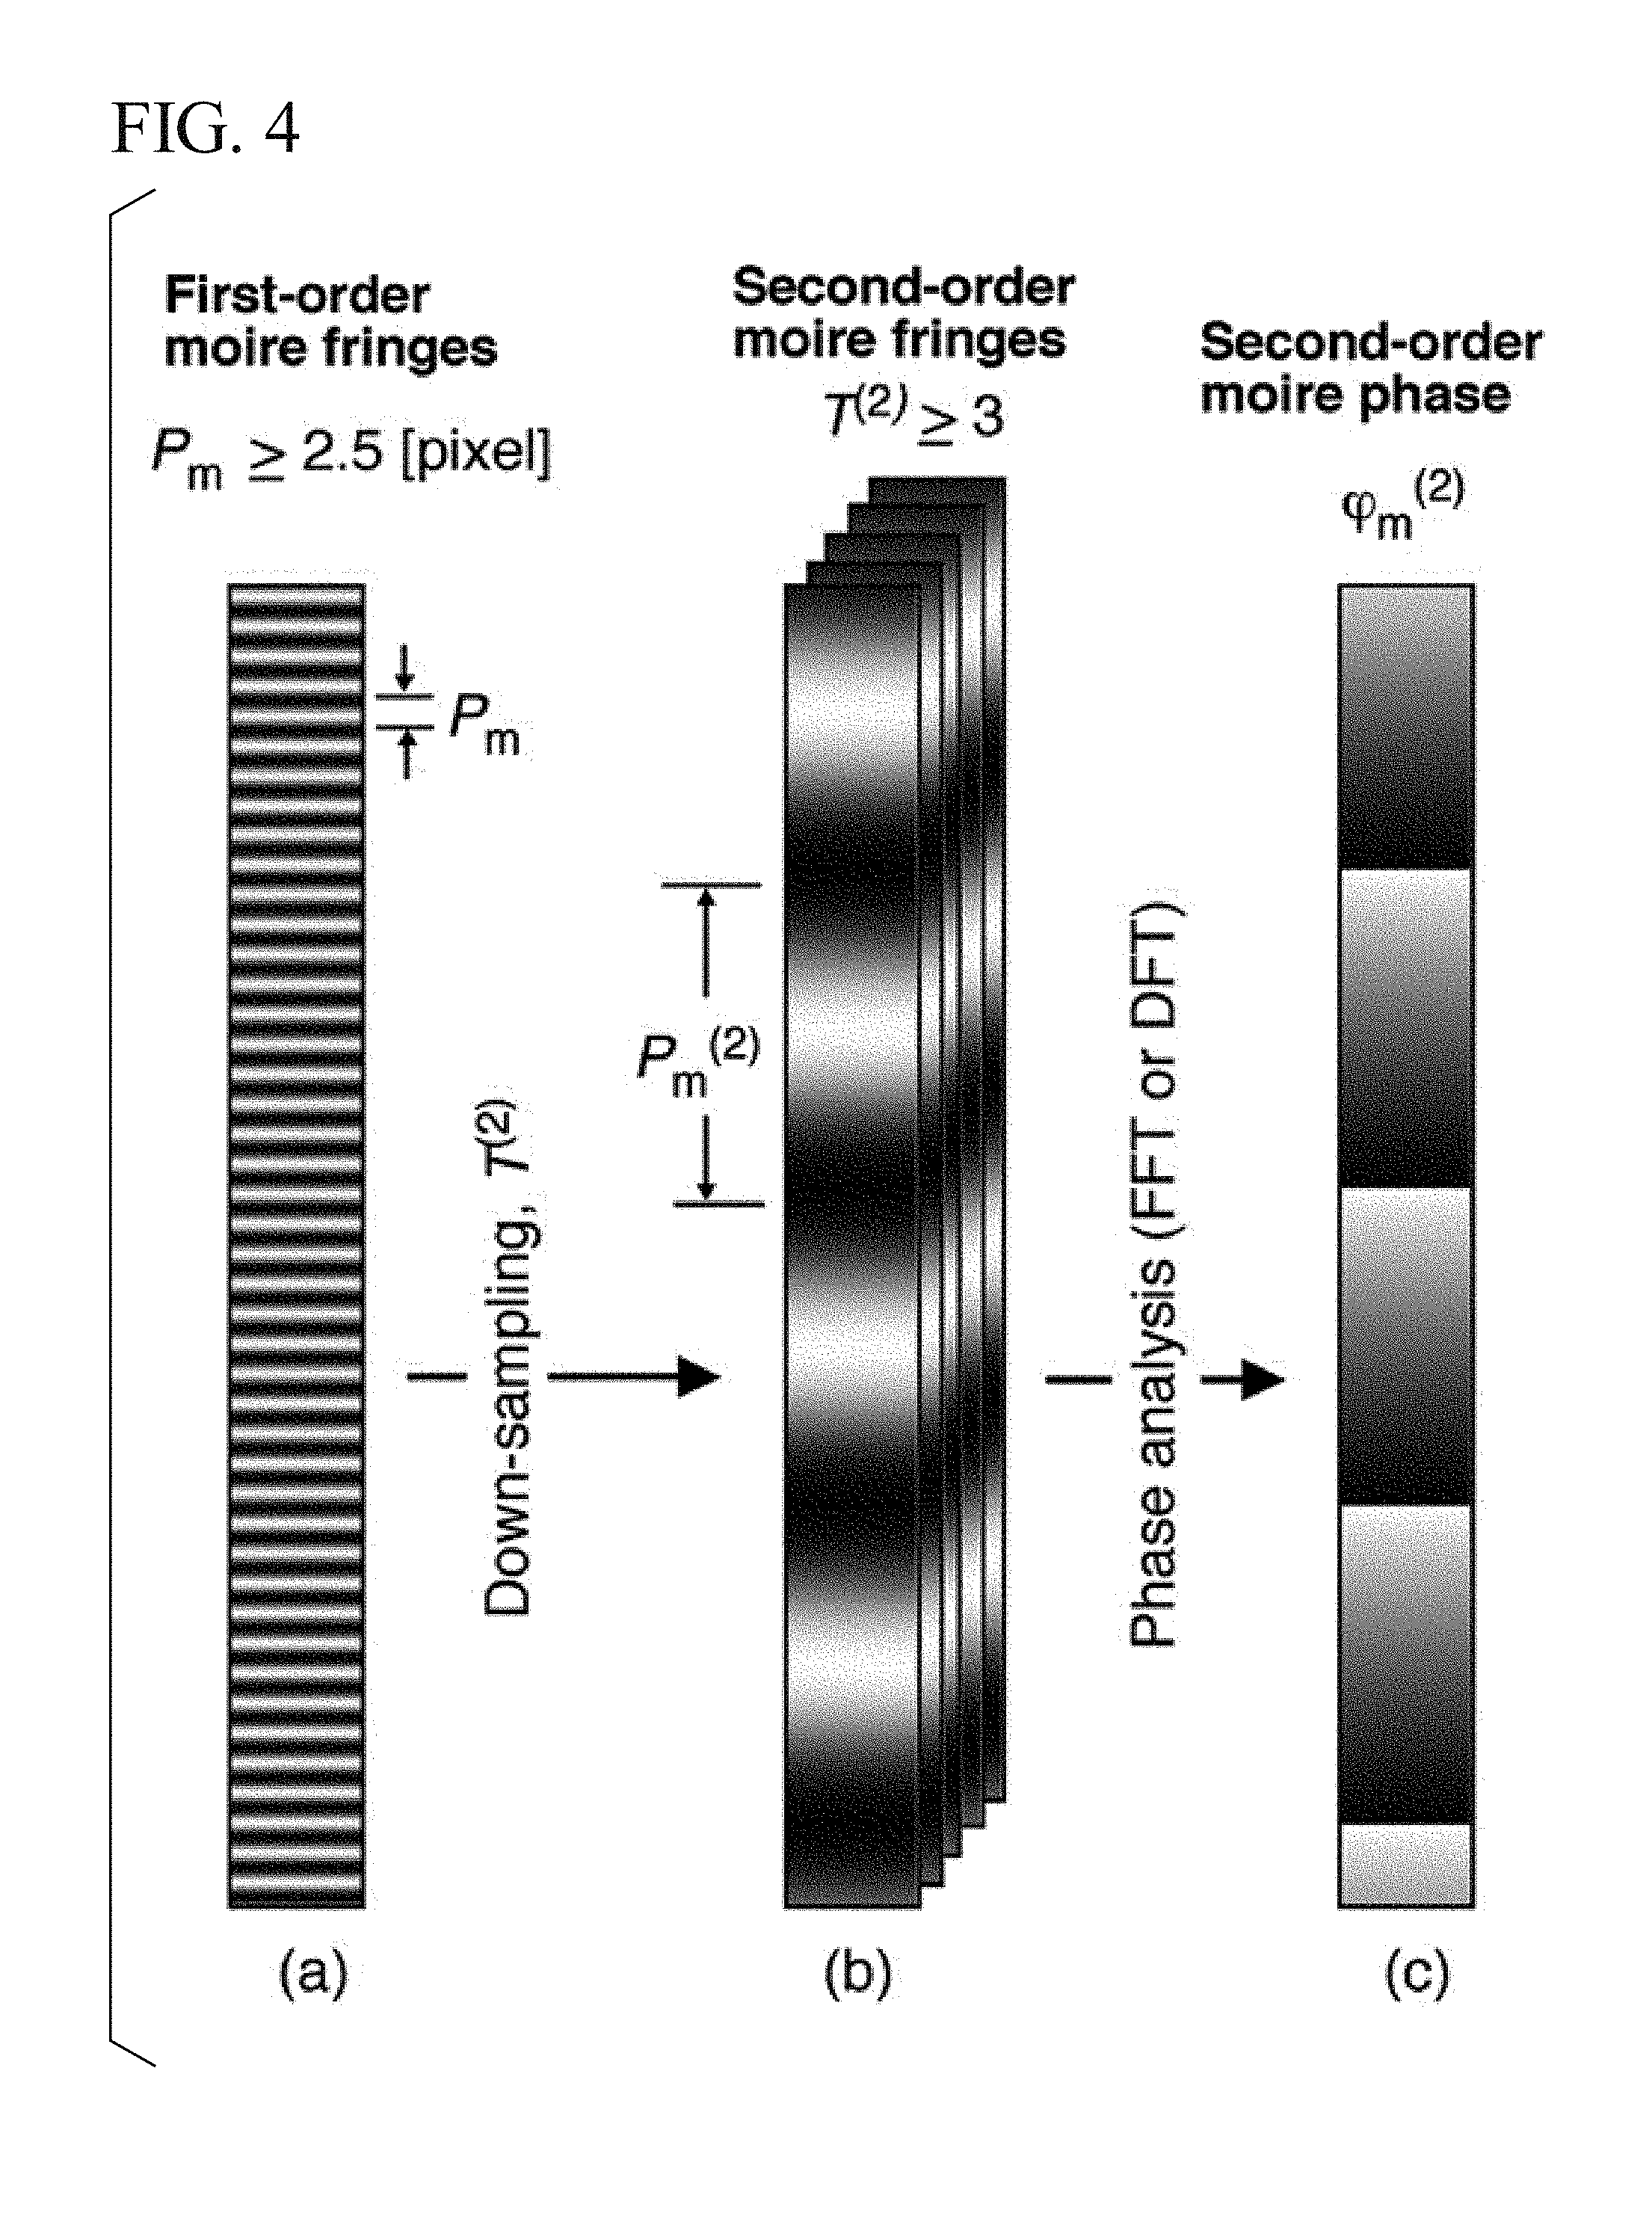
[0035] FIG. 4 shows the principle of a method of generating the first kind of 2nd-order moire fringes and calculating a phase distribution.
[0036] The pitch of the specimen grating and the pitch of the reference grating (the microscope scanning line or the camera imaging pixel digital grating) in the x-direction (or the y-direction, the direction will be omitted below) are defined as P and T, respectively.
[0037] Phase expressions of the specimen grating and the reference grating are .phi..sub.s=2.pi.x/P (or .phi..sub.s=2.pi.y/P) and .phi..sub.r=2.pi.x/T (or .phi..sub.r=2.pi.y/T), respectively.
[0038] The intensity distribution of the traditional moire fringes is expressed by Equation (1) on the assumption that A(x,y) denotes the amplitude of the moire fringe, .phi..sub.0 denotes an initial phase, and B(x,y) includes the background intensity- and high-order frequencies (2.pi.x/P, 2.pi.x(1/P+1/T), and the like). Moire fringes having a pitch interval P.sub.m (1/P.sub.m=1/P-1/T) are generated by a slight difference between the grating pitch P of the specimen and the reference grating or the down-sampling pitch T.
[ Math . 1 ] I m ( x , y ) = A ( x , y ) cos [ 2 .pi. y ( 1 P - 1 T ) + .PHI. 0 ] + B ( x , y ) ( 1 ) ##EQU00001##
[0039] When the high-order frequencies are excluded, the phase of the traditional moire fringes is expressed by Equation (2).
[ Math . 2 ] .PHI. m ( x ) = 2 .pi. y ( 1 P - 1 T ) + .PHI. 0 ( 2 ) ##EQU00002##
[0040] In order to improve the measurement accuracy of the shape and deformation, the traditional moire fringes are analyzed by a spatial phase shifting method in the sampling moire method.
[0041] The traditional moire fringes are treated as a "grating" used when phase-shifted 2nd-order moire fringes are generated.
[0042] When a down-sampling pitch is assumed to be T.sup.(2), the intensity of the 2nd-order moire fringes can be expressed by Equation (3) on the assumption that A.sup.(2)(x,y) denotes the amplitude of the 2nd-order moire fringes, k denotes a number of the phase shifting procedure, and B.sup.(2)(x,y) includes the background intensity and high-order frequencies (2.pi.x/P, 2.pi.x(1/P+1/T), and the like) of the 2nd-order moire fringes.
[ Math . 3 ] I m ( 2 ) ( x , y ; k ) = A ( 2 ) ( x , y ) cos [ 2 .pi. x ( 1 P - 1 T - 1 T ( 2 ) ) + .PHI. 0 + 2 .pi. k T ( 2 ) ] + B ( 2 ) ( x , y ) ( k = 0 , 1 , . . . , T ( 2 ) - 1 ) ( 3 ) ##EQU00003##
[0043] As a result, the phase of the 2nd-order moire fringes is expressed by Equation (4) and can be calculated by one-dimensional discrete Fourier transform (DFT) or fast Fourier transform (FFT).
[ Math . 4 ] .PHI. m ( 2 ) ( x ) = 2 .pi. x ( 1 P - 1 T - 1 T ( 2 ) ) + .PHI. 0 = arg { k = 0 T ( 2 ) - 1 [ I m ( 2 ) ( x , y ; k ) ] W T ( 2 ) k } ( 4 ) ##EQU00004##
[0044] Here, a twiddle factor W is defined as in Equation (5).
[ Math . 5 ] W K k = exp ( - j 2 .pi. k K ) , ( k = 0 , 1 , . . . , K - 1 ) ( 5 ) ##EQU00005##
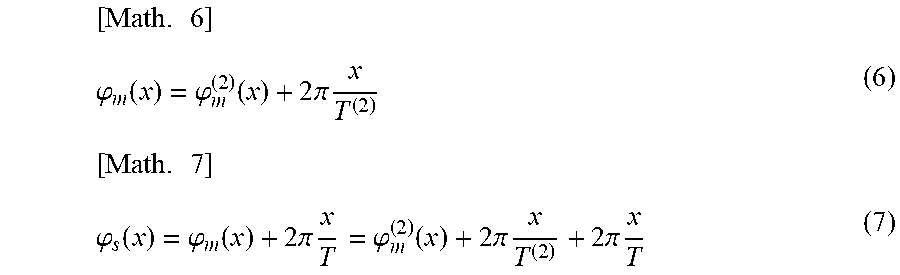
[0045] The original moire fringe phase .phi..sub.m and the original grating phase .phi..sub.s can be respectively obtained by Equation (6) and Equation (7) using the phase of the 2nd-order moire fringes which is obtained here.
[ Math . 6 ] .PHI. m ( x ) = .PHI. m ( 2 ) ( x ) + 2 .pi. x T ( 2 ) ( 6 ) [ Math . 7 ] .PHI. s ( x ) = .PHI. m ( x ) + 2 .pi. x T = .PHI. m ( 2 ) ( x ) + 2 .pi. x T ( 2 ) + 2 .pi. x T ( 7 ) ##EQU00006##
[0046] In this manner, the traditional moire fringes are regarded as a grating and the sampling moire method as a spatial phase analysis method is applied, so that it is possible to perform high-accuracy analysis in addition to the original feature of a wide field of view.
[0047] Calculation Principle 2 of Phase Distribution of 2nd-Order Moire Fringes (Case in which Grating Image is Down-Sampled in Two Stages)
[0048] FIG. 5 shows the principle of the method of calculating the phase distribution of the second kind of 2nd-order moire fringes.
[0049] Here, the pitch of a one-dimensional grating projected on the surface of the object in the vertical direction or a grating attached to the surface of the specimen is assumed to be P. The intensity distribution of the grating image captured in this case is expressed by Equation (8).
[ Math . 8 ] I ( x , y ) = a ( x , y ) cos [ 2 .pi. x P + .PHI. 0 ] + b ( x , y ) ( 8 ) ##EQU00007##
[0050] Here, a(x,y), b(x,y), and .phi..sub.0 are the amplitude, the background intensity, and the initial phase of the grating, respectively.
[0051] When down-sampling and intensity interpolation are performed on the captured grating image at a sampling (camera imaging pixel digital grating) pitch T in the x-direction, phase expressions of the grating and the sampling grating are .phi..sub.s=2.pi.x/P and .phi..sub.r=2.pi.x/T, respectively.
[0052] The intensity of the traditional moire fringes which is obtained by the sampling moire method can be expressed by Equation (9) on the assumption that A(x,y) denotes the amplitude of the moire fringes, .phi..sub.0 denotes an initial phase, and B(x,y) includes the background intensity and high-order frequencies (2.pi.x/P, 2.pi.x (1/P+1/T), and the like).
[0053] Unlike Equation (1), a plurality of phase-shifted moire fringes are obtained here at the same time.
[ Math . 9 ] I m ( x , y ; t ) = A ( x , y ) cos [ 2 .pi. x ( 1 P - 1 T ) + .PHI. 0 + 2 .pi. t T ] + B ( x , y ) ( t = 0 , 1 , . . . , T - 1 ) ( 9 ) ##EQU00008##
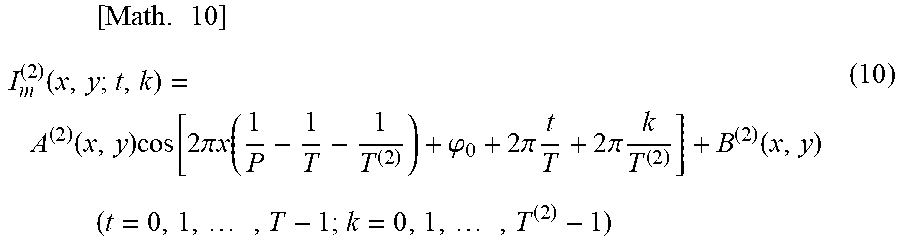
[0054] These phase-shifted moire fringes obtained here are treated as "gratings" used for generation of the 2nd-order moire fringes. When a down-sampling pitch is assumed to be T.sup.(2) as down-sampling at the second stage with respect to each of the phase shifting moire fringes, the intensity distribution of the 2nd-order moire fringes can be expressed by Equation (10) on the assumption that A.sup.(2)(x,y) denotes the amplitude of the 2nd-order moire fringes, k and t denote the numbers of the phase shifting procedures, and B.sup.(2)(x,y) denotes the background intensity of the 2nd-order moire fringes.
[0055] In this case, T.times.T.sup.(2) phase-shifted 2nd-order moire fringes are obtained.
[ Math . 10 ] I m ( 2 ) ( x , y ; t , k ) = A ( 2 ) ( x , y ) cos [ 2 .pi. x ( 1 P - 1 T - 1 T ( 2 ) ) + .PHI. 0 + 2 .pi. t T + 2 .pi. k T ( 2 ) ] + B ( 2 ) ( x , y ) ( 10 ) ( t = 0 , 1 , , T - 1 ; k = 0 , 1 , , T ( 2 ) - 1 ) ##EQU00009##
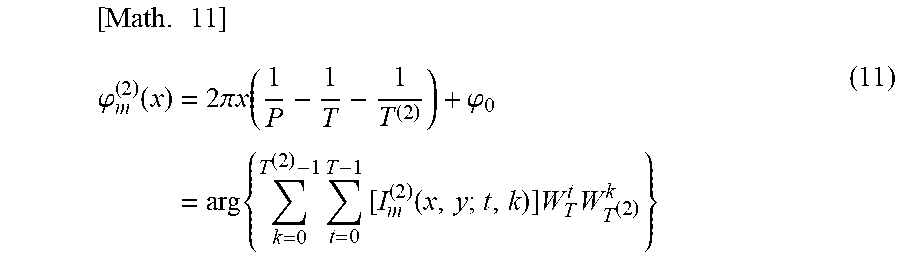
[0056] As a result, the phase of the 2nd-order moire fringes can be expressed by Equation (11) and calculated by two-dimensional discrete Fourier transform or fast Fourier transform.
[ Math . 11 ] .PHI. m ( 2 ) ( x ) = 2 .pi. x ( 1 P - 1 T - 1 T ( 2 ) ) + .PHI. 0 = arg { k = 0 T ( 2 ) - 1 t = 0 T - 1 [ I m ( 2 ) ( x , y ; t , k ) ] W T t W T ( 2 ) k } ( 11 ) ##EQU00010##
[0057] The original moire fringe phase .phi..sub.m and the original grating phase .phi..sub.s can be respectively obtained by Equation (6) and Equation (7) using the phase of the 2nd-order moire fringes which is obtained here.
[0058] In addition, the intensity distribution of the grating image obtained by imaging a one-dimensional grating projected on the surface of the object in an oblique direction or a grating attached to the surface of the specimen by using a digital camera is expressed by Equation (12).
[ Math . 12 ] I ( x , y ) = a ( x , y ) cos [ 2 .pi. x P x + 2 .pi. y P y + .PHI. 0 ] + b ( x , y ) ( 12 ) ##EQU00011##
[0059] Here, P.sub.x and P.sub.y are pitch intervals of the grating in the x-direction and the y-direction, respectively.
[0060] When down-sampling and intensity interpolation are performed on a captured grating image at sampling (camera imaging pixel digital grating) pitches T.sub.x and T.sub.y in the x-direction and the y-direction, respectively, the intensity distribution of the traditional moire fringes which are obtained by a two-dimensional sampling moire method can be expressed by Equation (13).
[ Math . 13 ] I m ( x , y , t x , t y ) = A ( x , y ) cos [ 2 .pi. x ( 1 P x - 1 T x ) + 2 .pi. y ( 1 P y - 1 T y ) + .PHI. 0 + 2 .pi. t x T x + 2 .pi. t y T y ] + B ( x , y ) ( t x = 0 , 1 , , T x - 1 ; t y = 0 , 1 , , T y - 1 ) ( 13 ) ##EQU00012##
[0061] These phase-shifted moire fringes obtained here are treated as "gratings" used for generation of the 2nd-order moire fringes.
[0062] When down-sampling pitches in the x-direction and the y-direction are assumed to be T.sub.x.sup.(2) and T.sub.y.sup.(2) as down-sampling at the second stage with respect to each of the phase shifting moire fringes, the intensity distributions of these phase-shifted 2nd-order moire fringes can be expressed by Equation (14) on the assumption that A.sup.(2)(x,y) denotes the amplitude of the 2nd-order moire fringes, k.sub.x and k.sub.y denote the numbers of the phase shifting procedures in the x-direction and the y-direction, respectively, and B.sup.(2)(x,y) is the background intensity of the 2nd-order moire fringes.
[ Math . 14 ] I m ( 2 ) ( x , y ; t x , t y , k x , k y ) = A ( 2 ) ( x , y ) cos [ 2 .pi. x ( 1 P x - 1 T x - 1 T x ( 2 ) ) + 2 .pi.y ( 1 P y - 1 T y - 1 T y ( 2 ) ) + .PHI. 0 + 2 .pi. t x T x + 2 .pi. t y T y + 2 .pi. k x T x ( 2 ) + 2 .pi. k y T y ( 2 ) ] + B ( 2 ) ( x , y ) ( t x = 0 , 1 , , T x - 1 ; t y = 0 , 1 , , T y - 1 ; k x = 0 , 1 , , T x ( 2 ) - 1 ; k y = 0 , 1 , , T y ( 2 ) - 1 ) ( 14 ) ##EQU00013##
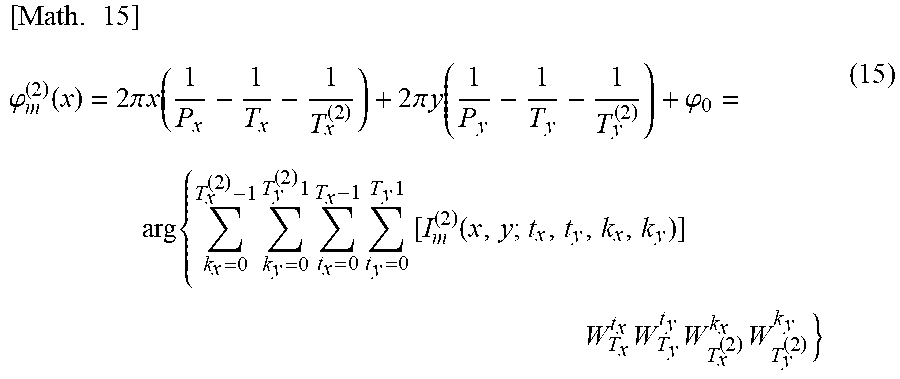
[0063] The phase of the 2nd-order moire fringes can be calculated by (multidimensional) discrete Fourier transform or fast Fourier transform as shown in Equation (15).
[ Math . 15 ] .PHI. m ( 2 ) ( x ) = 2 .pi. x ( 1 P x - 1 T x - 1 T x ( 2 ) ) + 2 .pi. y ( 1 P y - 1 T y - 1 T y ( 2 ) ) + .PHI. 0 = arg { k x = 0 T x ( 2 ) - 1 k y = 0 T y ( 2 ) 1 t x = 0 T x - 1 t y = 0 T y 1 [ I m ( 2 ) ( x , y ; t x , t y , k x , k y ) ] W T x t x W T y t y W T x ( 2 ) k x W T y ( 2 ) k y } ( 15 ) ##EQU00014##
[0064] The original moire fringe phase .phi..sub.m and the original grating phase .phi..sub.s can be respectively obtained by Equation (6) and Equation (7) using the phase of the 2nd-order moire fringes which is obtained here.
[0065] Calculation Principle 3 of Phase Distribution of 2nd-Order Moire Fringes (Method of Adjusting Pitch of Moire Fringes after Grating Image is Down-Sampled)
[0066] FIG. 6 shows the principle of the method of calculating the phase distribution of the third kind of 2nd-order moire fringes after adjusting the pitch interval of the traditional moire fringes
[0067] In the 2nd-order moire method according to the present invention, moire fringes generated by first down-sampling are regarded as a grating and down-sampling processing is performed again. However, in the case in which the pitch interval between the moire fringes is sparse, a down-sampling pitch of 2nd-order moire fringes becomes large, and a spatial resolution may be reduced.
[0068] In this case, a method capable of adjusting the pitch of the moire fringes using the phase value of the moire fringes will be described below so that the second down-sampling processing can be performed at an appropriate pitch interval.
[0069] In the sampling moire method, it is possible to generate dense (multiplied) moire fringes by performing down-sampling and intensity interpolation processing at a pitch T close to the grating pitch P and using a sine wave or cosine wave function of a value obtained by multiplying a phase value of obtained sparse moire fringes by N which is an integer shown in Equation (16) again.
[Math. 16]
[0070] I.sub.m.sup.(2)(x,y)=sin[N.phi..sub.m(x,y)] or cos[N.phi..sub.m(x,y)] (16)
[0071] When the 2nd-order moire fringes are generated at a down-sampling pitch of a value close to an interval between adjusted moire fringes obtained by this method and are applied to the 2nd-order moire fringe phase calculation method having been described above, phase analysis for the 2nd-order moire fringes can be performed with high accuracy.
[0072] In this method, it is advantageous to selectively determine whether accuracy is prioritized or a spatial resolution is prioritized by changing N which is an adjustment factor.
[0073] Table 1 shows comparison between features and application conditions of the three techniques according to the present invention which have been described above and traditional phase analysis methods. An optimum method is selectable depending on whether the grating itself to be recorded or the interval between moire fringes is dense or sparse. Table 2 shows comparison between the traditional methods and the present invention in measurement of the three-dimensional shape and the out-of-plane displacement, and Table 3 shows comparison between several traditional methods and the present invention in measurement of the in-plane displacement and strain.
[0074] As compared with the traditional methods, it is possible to measure the shape and deformation with high accuracy and at high speed or with high accuracy and a wide field of view.
TABLE-US-00001 TABLE 1 Application conditions of the proposed three kinds of 2nd-order moire techniques Application conditions When When recorded traditional Large Proposed image is moire is High High view techniques grating moire dense sparse accuracy speed field Basic 2nd-order moire .largecircle. .largecircle. .largecircle. .DELTA. .largecircle. .circleincircle. .largecircle. Multiple spatial phase .largecircle. X .largecircle. .DELTA. .circleincircle. .DELTA. .DELTA. shifting + 2nd-order moire Moire spacing adjustment + .largecircle. .largecircle. .DELTA. .largecircle. .circleincircle. .largecircle. .largecircle. 2nd-order moire
TABLE-US-00002 TABLE 2 Comparison of different moire techniques for 3D shape and out-of-plane displacement measurement Dynamic measurement High from a High spatial accuracy single image resolution Traditional Projection moire .DELTA. .largecircle. .DELTA. techniques Temporal phase- .largecircle. X .largecircle. shifting moire Sampling moire .DELTA. .largecircle. .largecircle. Temporal- .circleincircle. X .largecircle. spatial phase- shifting moire Proposed 2nd-order moire .circleincircle. .largecircle. .DELTA. technique
TABLE-US-00003 TABLE 3 Comparison of different moire techniques for in-plane displacement and strain measurement High Dynamic Large High spatial accuracy deformation view field resolution Traditional Scanning moire .DELTA. .DELTA. .largecircle. .DELTA. techniques Moire .DELTA. .largecircle. .circleincircle. .largecircle. interferometry Sampling moire .largecircle. .largecircle. .DELTA. .largecircle. Digital/overlapping .DELTA. .largecircle. .DELTA. .DELTA. moire Temporal phase- .largecircle. X .largecircle. .largecircle. shifting moire Proposed 2nd-order moire .circleincircle. .largecircle. .largecircle. .DELTA. technique
[0075] Principle of Measurement of Three-Dimensional Shape of Object Using 2nd-Order Moire Fringes
[0076] As an example of the method of measuring an object, for example, grating projection and imaging are performed on the reference surface which is a planar object. The phase distribution of the reference surface is assumed to be .phi..sub.ref. In addition, grating projection and imaging are performed on the object installed in front of the reference surface and the phase distribution of the object is assumed to be .phi..sub.object. Here, the relationship between the phase difference of the reference surface and the object and the height of the object is approximately proportional as shown in Equation. (17).
[Math. 17]
[0077] z=.kappa.(.phi..sub.object-.phi..sub.ref)=.kappa..DELTA..phi. (17)
[0078] Therefore, when the phase-to-height conversion factor .kappa. is obtained by calibrating the relation between a distance (height) at each of two locations and the phase difference at that time while moving the reference surface to several locations in advance in the depth (height) direction, it is possible to measure the height of the object in a non-contact manner.
[0079] Principle of Measurement of Deformation (Displacement and Strain Distribution) Using 2nd-Order Moire Fringes
[0080] When an external force (force, a thermal change, or the like) is loaded to deform a structural material, the pitch of a grating on the surface of the specimen changes from P to P' in the x-direction due to deformation.
[0081] In the case in which the pitch of the reference grating T does not change, the moire fringe phase after deformation is as shown in Equation (18), similar to Equation (2).
[ Math . 18 ] .PHI. m ' ( x ) = 2 .pi. x ( 1 P ' - 1 T ) + .PHI. 0 ( 18 ) ##EQU00015##
[0082] When the pitch of a specimen grating changes from P to P', the phase of the specimen grating of the specimen changes to .phi..sub.s=2.pi.y/P', and thus the phase difference between the specimens before and after deformation is as shown in Equation (19).
[ Math . 19 ] .DELTA..PHI. s ( x ) = 2 .pi. x ( 1 P ' - 1 P ) ( 19 ) ##EQU00016##
[0083] As seen from Equations (2), (18), and (19), the phase difference between the traditional moire fringes is equal to the phase difference between the specimen gratings before and after deformation.
[ Math . 20 ] .DELTA..PHI. m ( x ) = .PHI. m ' ( x ) - .PHI. m ( x ) = 2 .pi. x ( 1 P ' - 1 P ) = .DELTA..PHI. s ( x ) ( 20 ) ##EQU00017##
[0084] With the deformation, in the case in which the pitch of the specimen grating changes from P to P' in the x-direction due to deformation and the pitch of the reference grating T.sup.(2) does not change, the 2nd-order moire fringes after deformation is as shown in Equation (21), similar to Equation (4).
[ Math . 21 ] .PHI. m ' ( 2 ) ( x ) = 2 .pi. x ( 1 P ' - 1 T - 1 T ( 2 ) ) + .PHI. 0 ( 21 ) ##EQU00018##
[0085] It can be seen that the phase difference between the 2nd-order moire fringes is equal to the phase difference between the traditional moire fringes before and after deformation and the phase difference between the specimen gratings before and after deformation.
[ Math . 22 ] .DELTA..PHI. m ( 2 ) ( y ) = .PHI. m ' ( 2 ) ( y ) - .PHI. m ( 2 ) ( y ) = 2 .pi. y ( 1 P ' - 1 P ) = .DELTA..PHI. m ( y ) = .DELTA..PHI. s ( y ) ( 22 ) ##EQU00019##
[0086] Assuming that u expresses the displacement of the specimen grating in the x-direction, the phase of the deformed specimen grating can be expressed as .phi..sub.s'(x)=2.pi.(x-u)/P.
[0087] The phase difference between the specimen gratings can be calculated by .DELTA..phi..sub.s(x)=.phi..sub.s'(x)-.phi..sub.s(x)=-2.pi.u/p on the basis of the phase .phi..sub.s(x)=2.pi.x/p of the specimen grating before deformation. As a result, the displacement is proportional to the phase difference between the specimen gratings.
[0088] Here, p is the actual pitch of the grating on the specimen surface.
[0089] The displacement of the specimen in the x-direction is determined by Equation (23).
[ Math . 23 ] u x = - p 2 .pi. .DELTA..PHI. s ( x ) = - p 2 .pi. .DELTA..PHI. m ( 2 ) ( x ) ( 23 ) ##EQU00020##
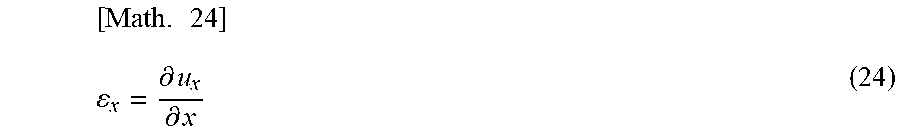
[0090] The strain of the specimen in the x-direction can be measured from the first derivative of the displacement u.sub.x.
[ Math . 24 ] x = .differential. u x .differential. x ( 24 ) ##EQU00021##
[0091] Similarly, in the case in which the pitch of the grating in the y-direction is p, measurement of the displacement and strain in the y-direction can be calculated by Equation (25) and Equation (26).
[ Math . 25 ] u y = - p 2 .pi. .DELTA..PHI. s ( y ) = - p 2 .pi. .DELTA..PHI. m ( 2 ) ( y ) ( 25 ) [ Math . 26 ] y = .differential. u y .differential. y ( 26 ) ##EQU00022##
First Embodiment: Measurement of Three-Dimensional Shape
[0092] Hereinafter, the first embodiment of the present invention will be described with reference to the accompanying drawings.
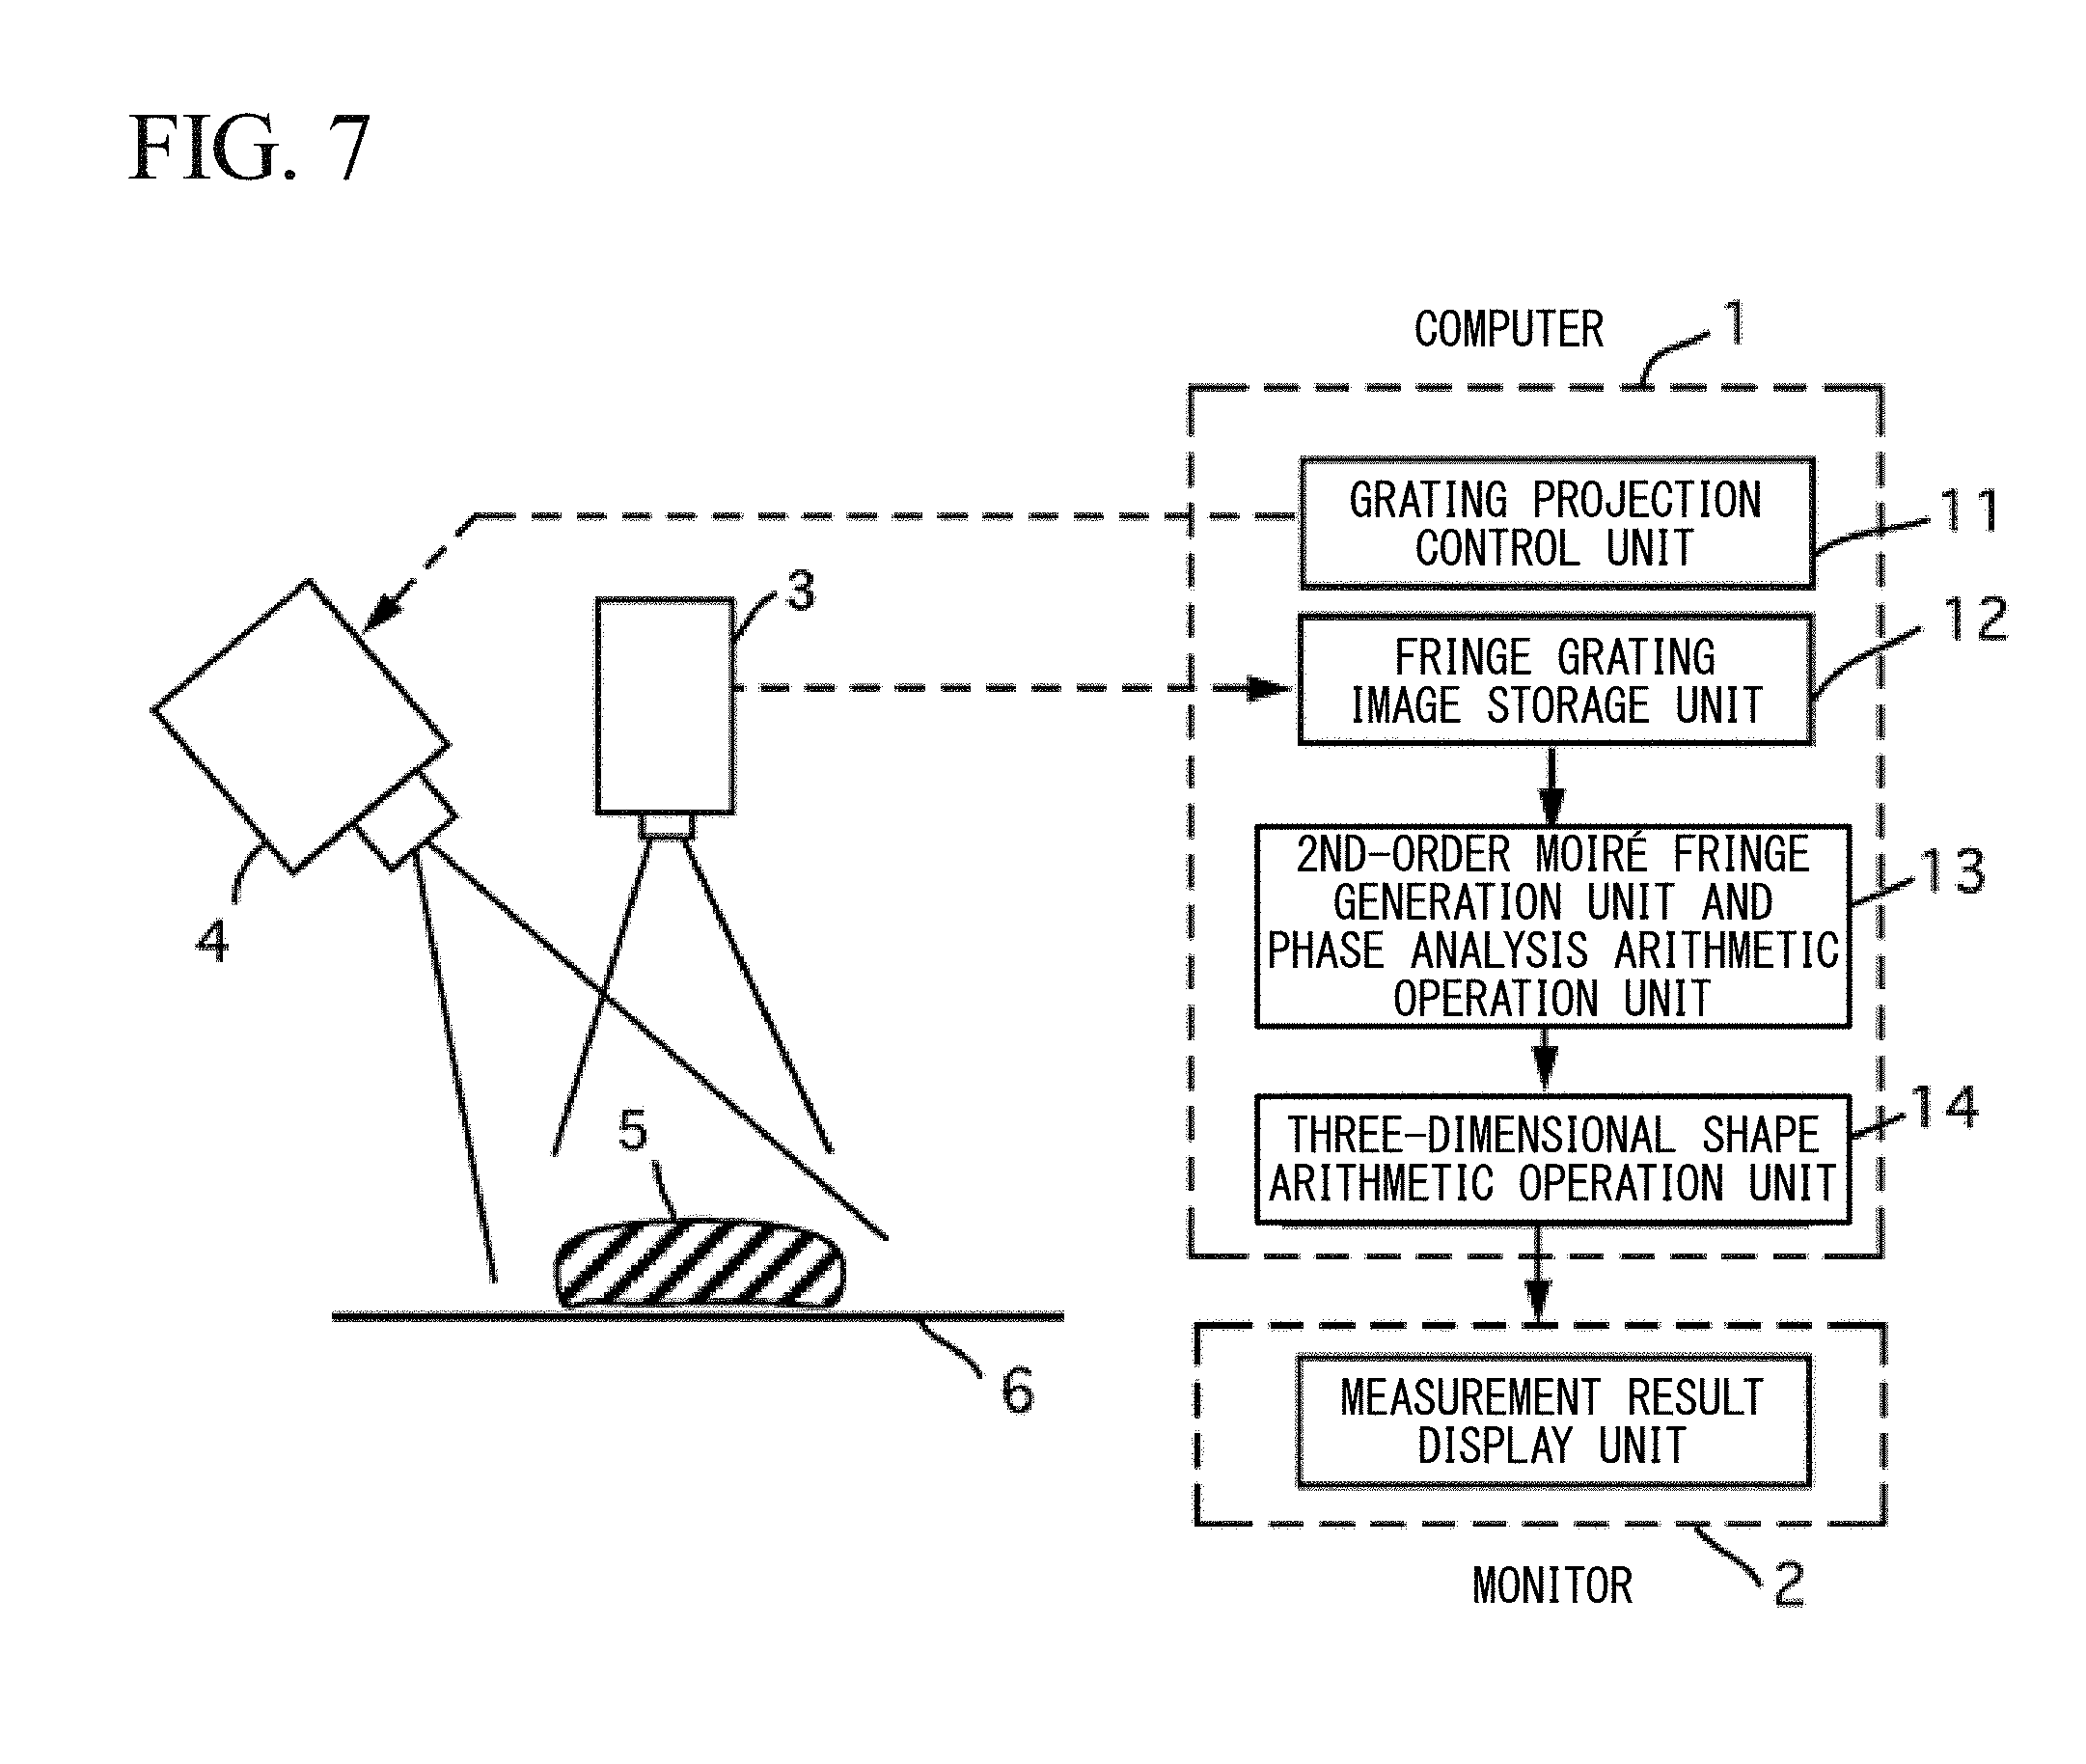
[0093] FIG. 7 is a diagram showing an example of arrangement of a computer 1, an imaging sensor 3, a grating projection device 4, a measurement target 5, and a reference surface (planar object) 6 in a three-dimensional shape measurement system for an object according to the present embodiment.
[0094] In the example shown in FIG. 7, the three-dimensional shape measurement system measures the shape of a three-dimensional object as a measurement target.
[0095] A grating pattern which is set from a grating projection control unit 11 (The pitch and the height factor (conversion factors for the phase difference and the height of a regular grating) on a reference surface are known) is projected by the grating projection device 4, and the grating pattern of the projected pattern which is distorted in accordance with the shape of the object is imaged by a fringe grating image storage unit 12 using the imaging sensor 3 (any of various cameras or microscopes).
[0096] With respect to the captured image, the phase distribution of the 2nd-order moire fringe image is calculated by a 2nd-order moire fringe generation unit and phase analysis arithmetic operation unit 13 using the method according to the present invention, and the height distribution is further calculated from the phase distribution by a three-dimensional shape arithmetic operation unit 14.
[0097] Measurement results thereof are displayed on a monitor display unit 2.
Second Embodiment: Measurement of Displacement and Strain
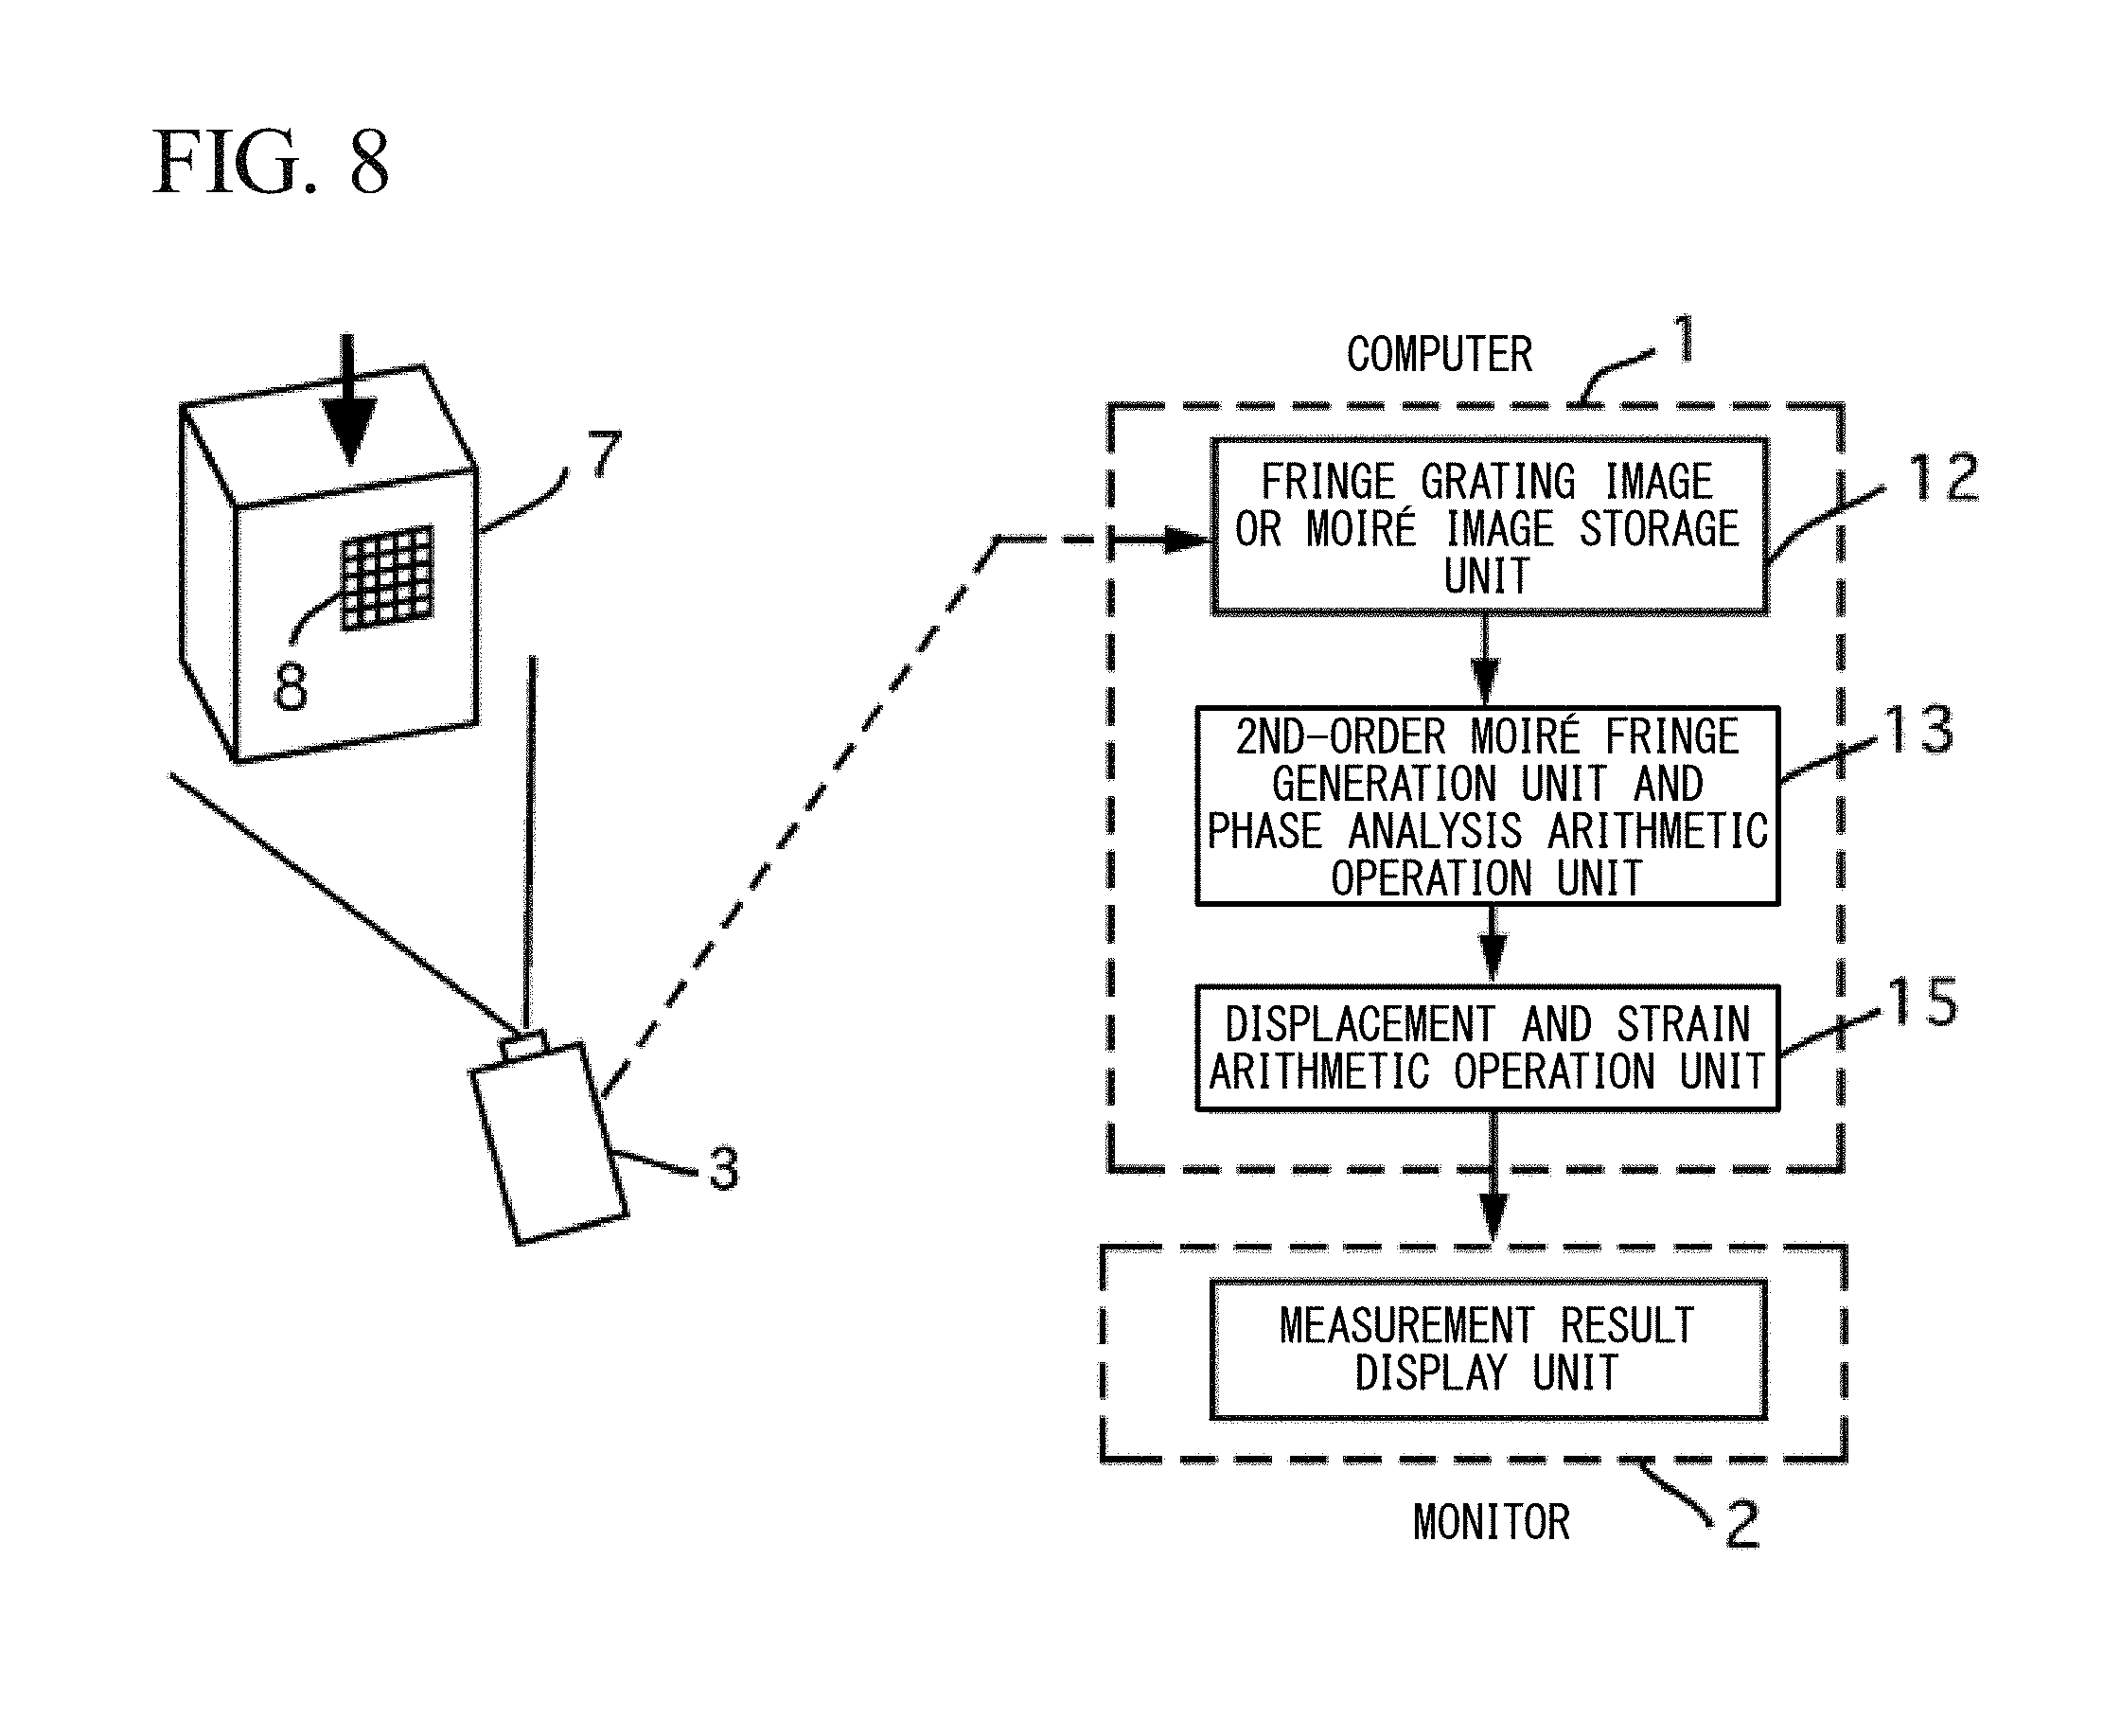
[0098] FIG. 8 is a diagram showing an example of arrangement of a computer 1, an imaging sensor 3, a structural material 7 as the measurement target, and a minute grating 8 (one-dimensional or two-dimensional) in a displacement and strain distribution measurement system for the material according to the present embodiment.
[0099] In the example shown in FIG. 8, the deformation measurement system records the grating image or moire fringes of a minute grating which is imparted to the surface of the structural material as the measurement target and of which the pitch is known by using the imaging sensor 3.
[0100] The impartation may not only be attachment of a regular grating to the surface of the material but also be a repetitive pattern which exists on the specimen surface in advance, for example, as seen in an atomic array image observed in a metal material.
[0101] Moire fringes recorded in the storage unit 12 or moire fringes generated from a grating image are processed by the 2nd-order moire fringe generation unit and phase analysis arithmetic operation unit 13. The displacement and strain distribution results measured by a displacement and strain arithmetic operation unit 15 are further displayed on a monitor 2.
[0102] Shape Deformation Measurement Procedure
[0103] FIG. 9 is a flowchart showing measurement of the shape and deformation which is performed by the 2nd-order moire method.
[0104] (S1) In the case of measurement of the three-dimensional shape, a grating pattern is projected on the surface of the object.
[0105] In the case of measurement of displacement and strain distributions, a regular grating manufactured on the specimen surface, or a periodic structure of the specimen itself can be set to be a grating.
[0106] (S2) Next, the specimen grating is disposed under an image recording device.
[0107] The image recording device may be a scanning microscope such as a laser scanning microscope (LSM), a scanning electron microscope (SEM), a transmission electron microscope (TEM), or an atomic force microscope (AFM), a digital camera such as a charge coupled device (CCD) camera or a complementary metal oxide semiconductor (CMOS) camera, or a moire interferometer.
[0108] Next, the scanning line interval of a microscope or the pixel size of a camera is adjusted to the vicinity of the specimen grating pitch (or an integral multiple thereof (a natural number of 2 or greater) or a fractional multiple with an integer as a denominator).
[0109] Microscope or CCD/CMOS moire fringes are recorded in a wide field of view in the image recording device by interference between the specimen grating and a microscope scanning line or a pixel array.
[0110] Alternatively, interference moire fringes generated by two coherent laser interferences are recorded by an interferometer.
[0111] Microscope moire, CCD/CMOS moire, and interference moire are techniques for directly observing and recording moire fringes.
[0112] In addition to this, there are methods of capturing a grating image and generating moire fringes (for example, digital moire, sampling moire, overlapped moire, and the like) by image processing.
[0113] In these techniques, the specimen grating pitch on a captured image can be reduced to less than two pixels in order to enlarge a field of view.
[0114] Moire fringes obtained by the sampling moire method or the digital moire method are generated by interference between down-sampling and intensity interpolation or between the specimen grating and a digital grating close to the pitch (or an integral multiple or a fractional multiple) of the specimen grating. Overlapped (geometric) moire fringes are generated by overlapping between specimen gratings before and after deformation.
[0115] (S3) Phase-shifted 2nd-order moire fringes are generated by down sampling, intensity interpolation, and spatial phase shifting by using these traditional moire fringes and a pitch close to the interval therebetween.
[0116] Then, it is possible to obtain the phase distribution of 2nd-order moire fringes from the phase-shifted 2nd-order moire fringes.
[0117] (S5) It is possible to accurately perform quantitative evaluation of (S4) displacement and strain distributions with a wide field of view from the phase difference between 2nd-order moire fringes before and after deformation.
[0118] This shape deformation measurement method is referred to as the 2nd-order moire method.
[0119] The 2nd-order moire method can be extended in multiple stages as long as moire fringes having the same phase difference can be generated using digital gratings.
[0120] Accordingly, the 2nd-order moire method includes a multistage moire method to the extent that the method conforms to the problem of the present invention.
[0121] In the case in which moire fringes before deformation can be estimated by comparing the change in the phase (phase gradient) of moire fringes of an undeformed portion and the change in the phase of moire fringes of a deformed portion with each other from only one moire fringe pattern after deformation, it is also possible to obtain the strain from one moire fringe pattern after deformation.
[0122] The 2nd-order moire method may be applied using moire fringes estimated at the time of obtaining the change in the phase of the moire fringes and moire fringes after deformation as moire fringes before and after deformation.
[0123] However, this technique is unsuitable in the case in which a distorted grating pattern on a reference surface is imaged because a grating is obliquely projected onto an object in the measurement of the three-dimensional shape described in the first embodiment shown in FIG. 7, except for the case in which a regular grating image (which would have been obtained in the case of the reference surface) on the reference surface is estimated from the distorted grating image.
[0124] Flow of Program of the Present Invention
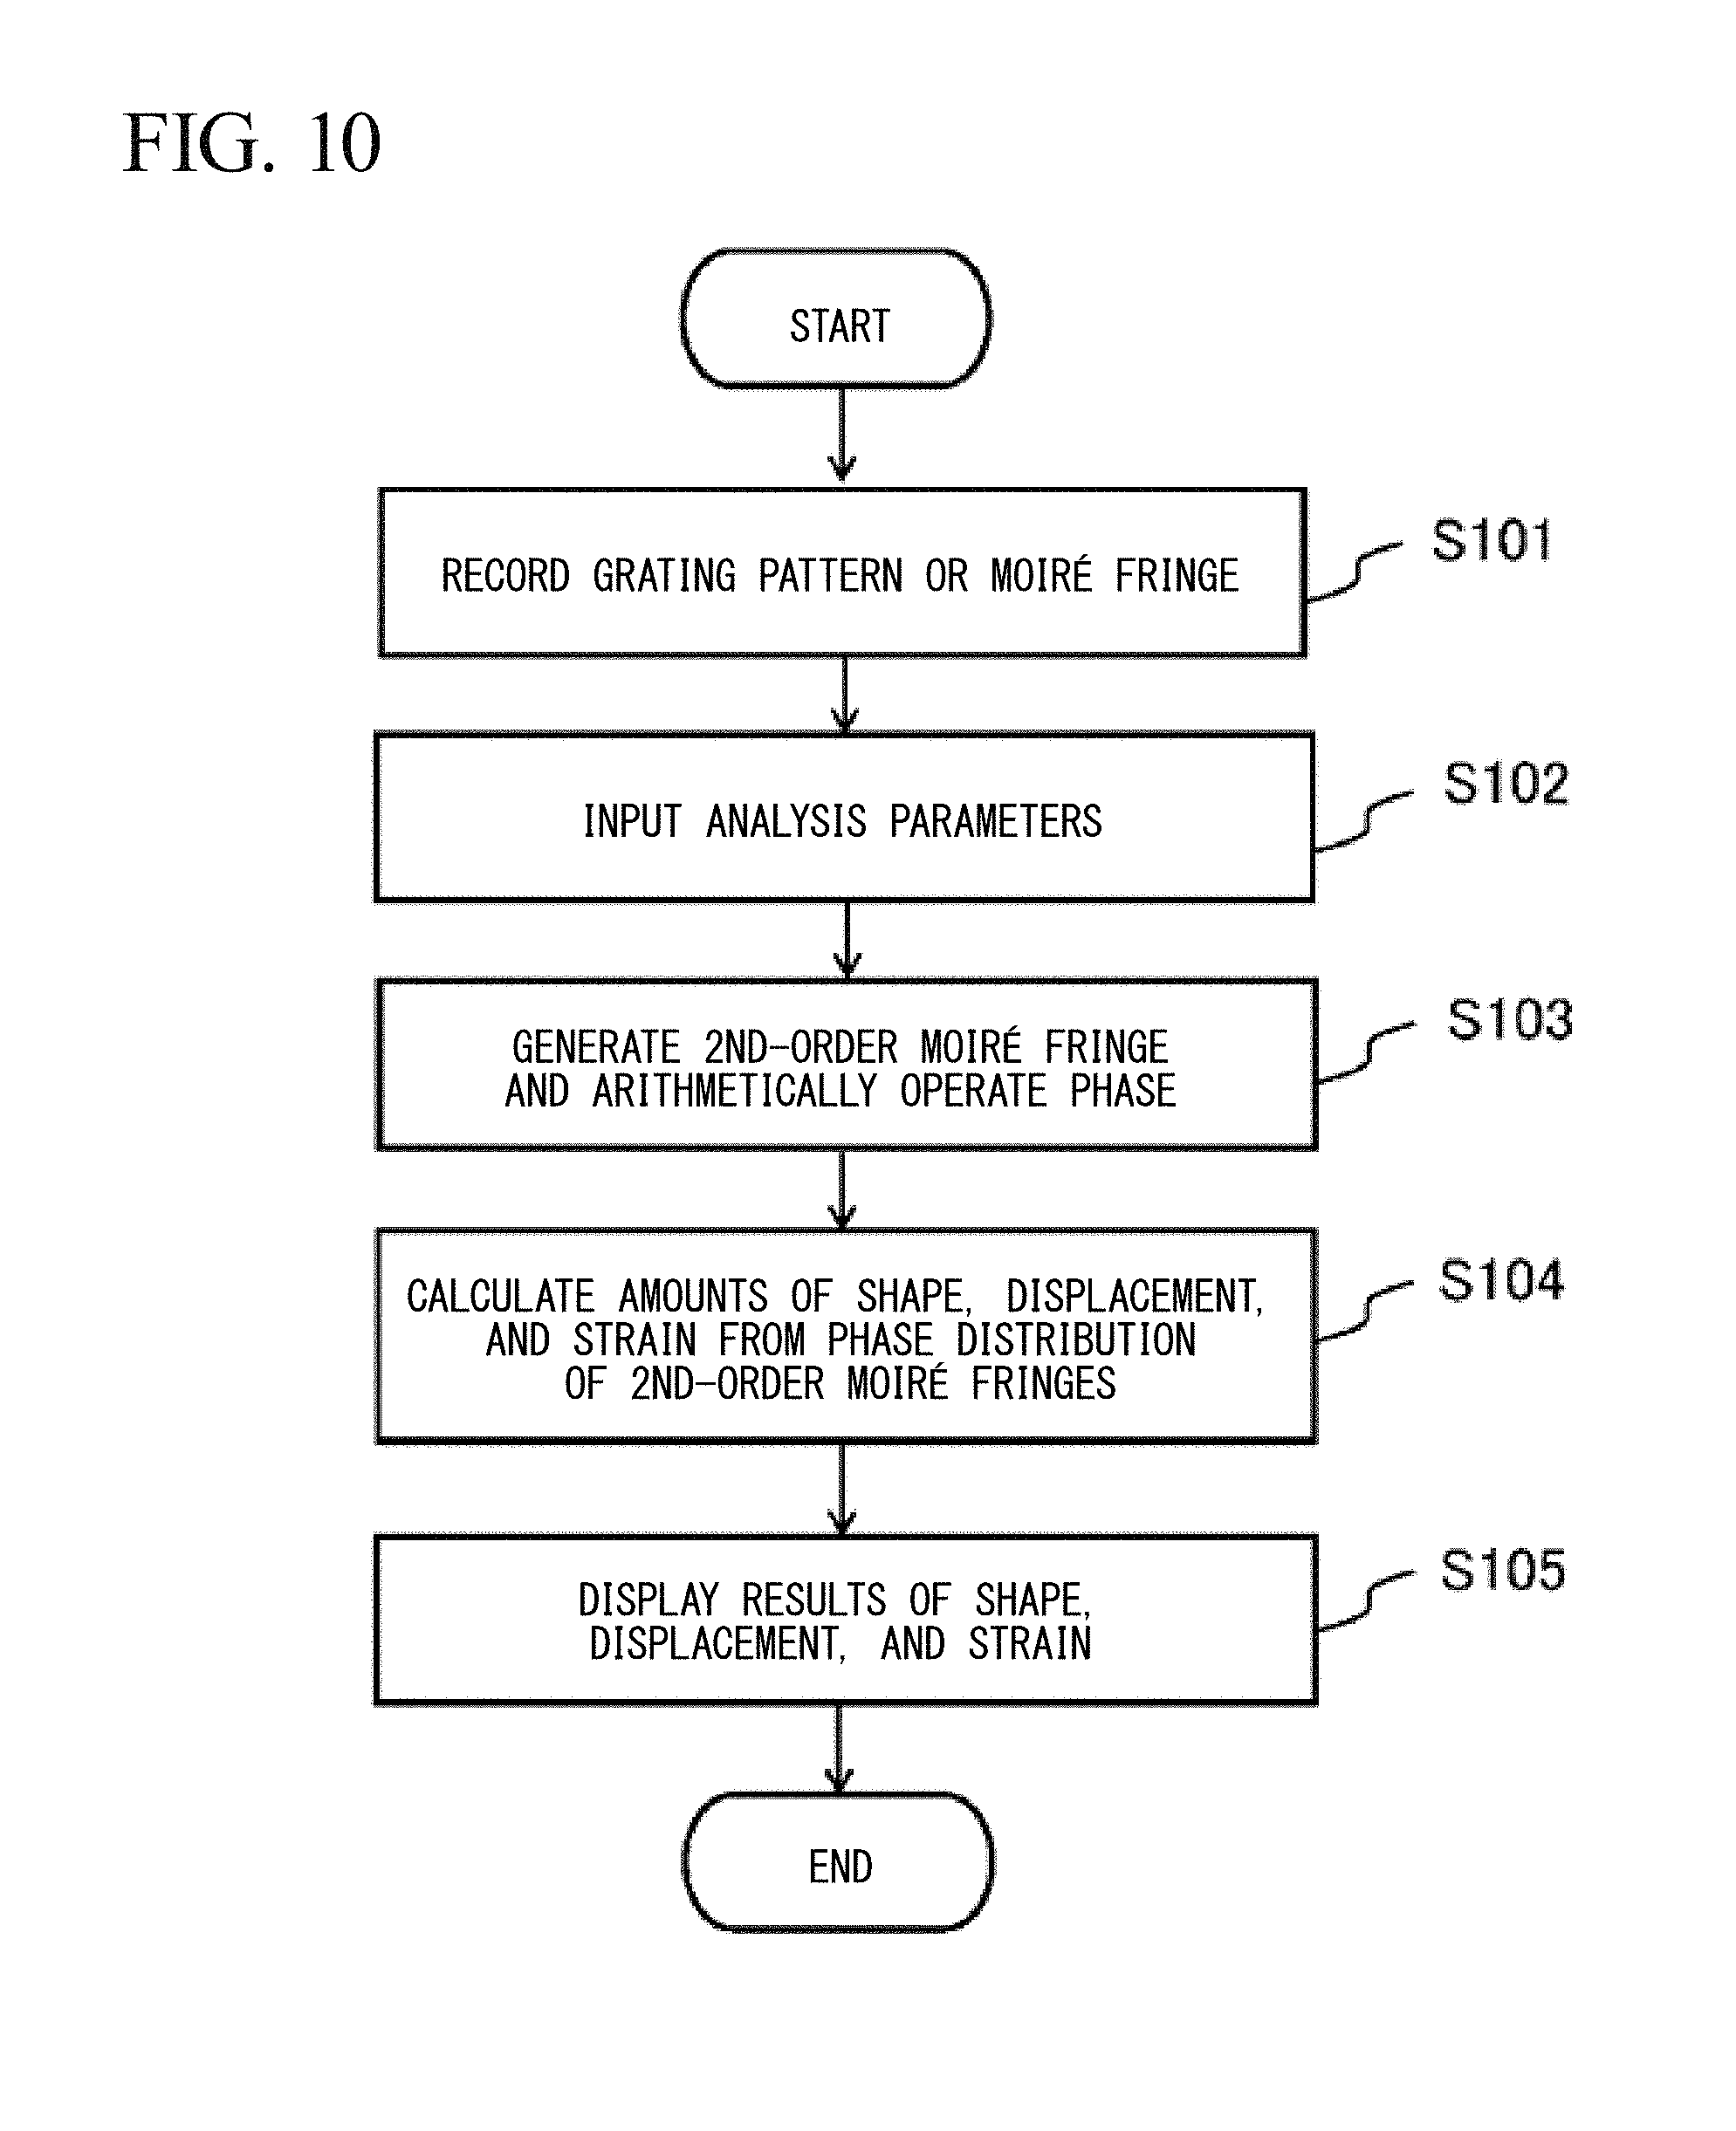
[0125] Next, the shape deformation measurement process according to the present invention will be described. FIG. 10 is a flowchart showing a shape deformation measurement process according to the present invention. The process shown in FIG. 10 includes steps S101, S102, S103, S104, and S105.
[0126] In the process shown in FIG. 10, the processing of step S105 is performed in a sequential order after step S101.
[0127] A program language can be appropriately selected as long as the above-described equations can be arithmetically operated, and a computer for executing the program may be either a special-purpose machine or a general-purpose machine.
[0128] After the grating pattern or moire fringes are recorded (S101), parameters such as pitch dimensions, the height factor, and an integer for generating moire fringes are input (S102), a necessary arithmetic operation is performed using the 2nd-order moire method (S103), the amounts of the shape, displacement, or strain is calculated from a phase component of 2nd-order moire fringes (S104), and results thereof are displayed (S105).
Advantageous Effects of Invention
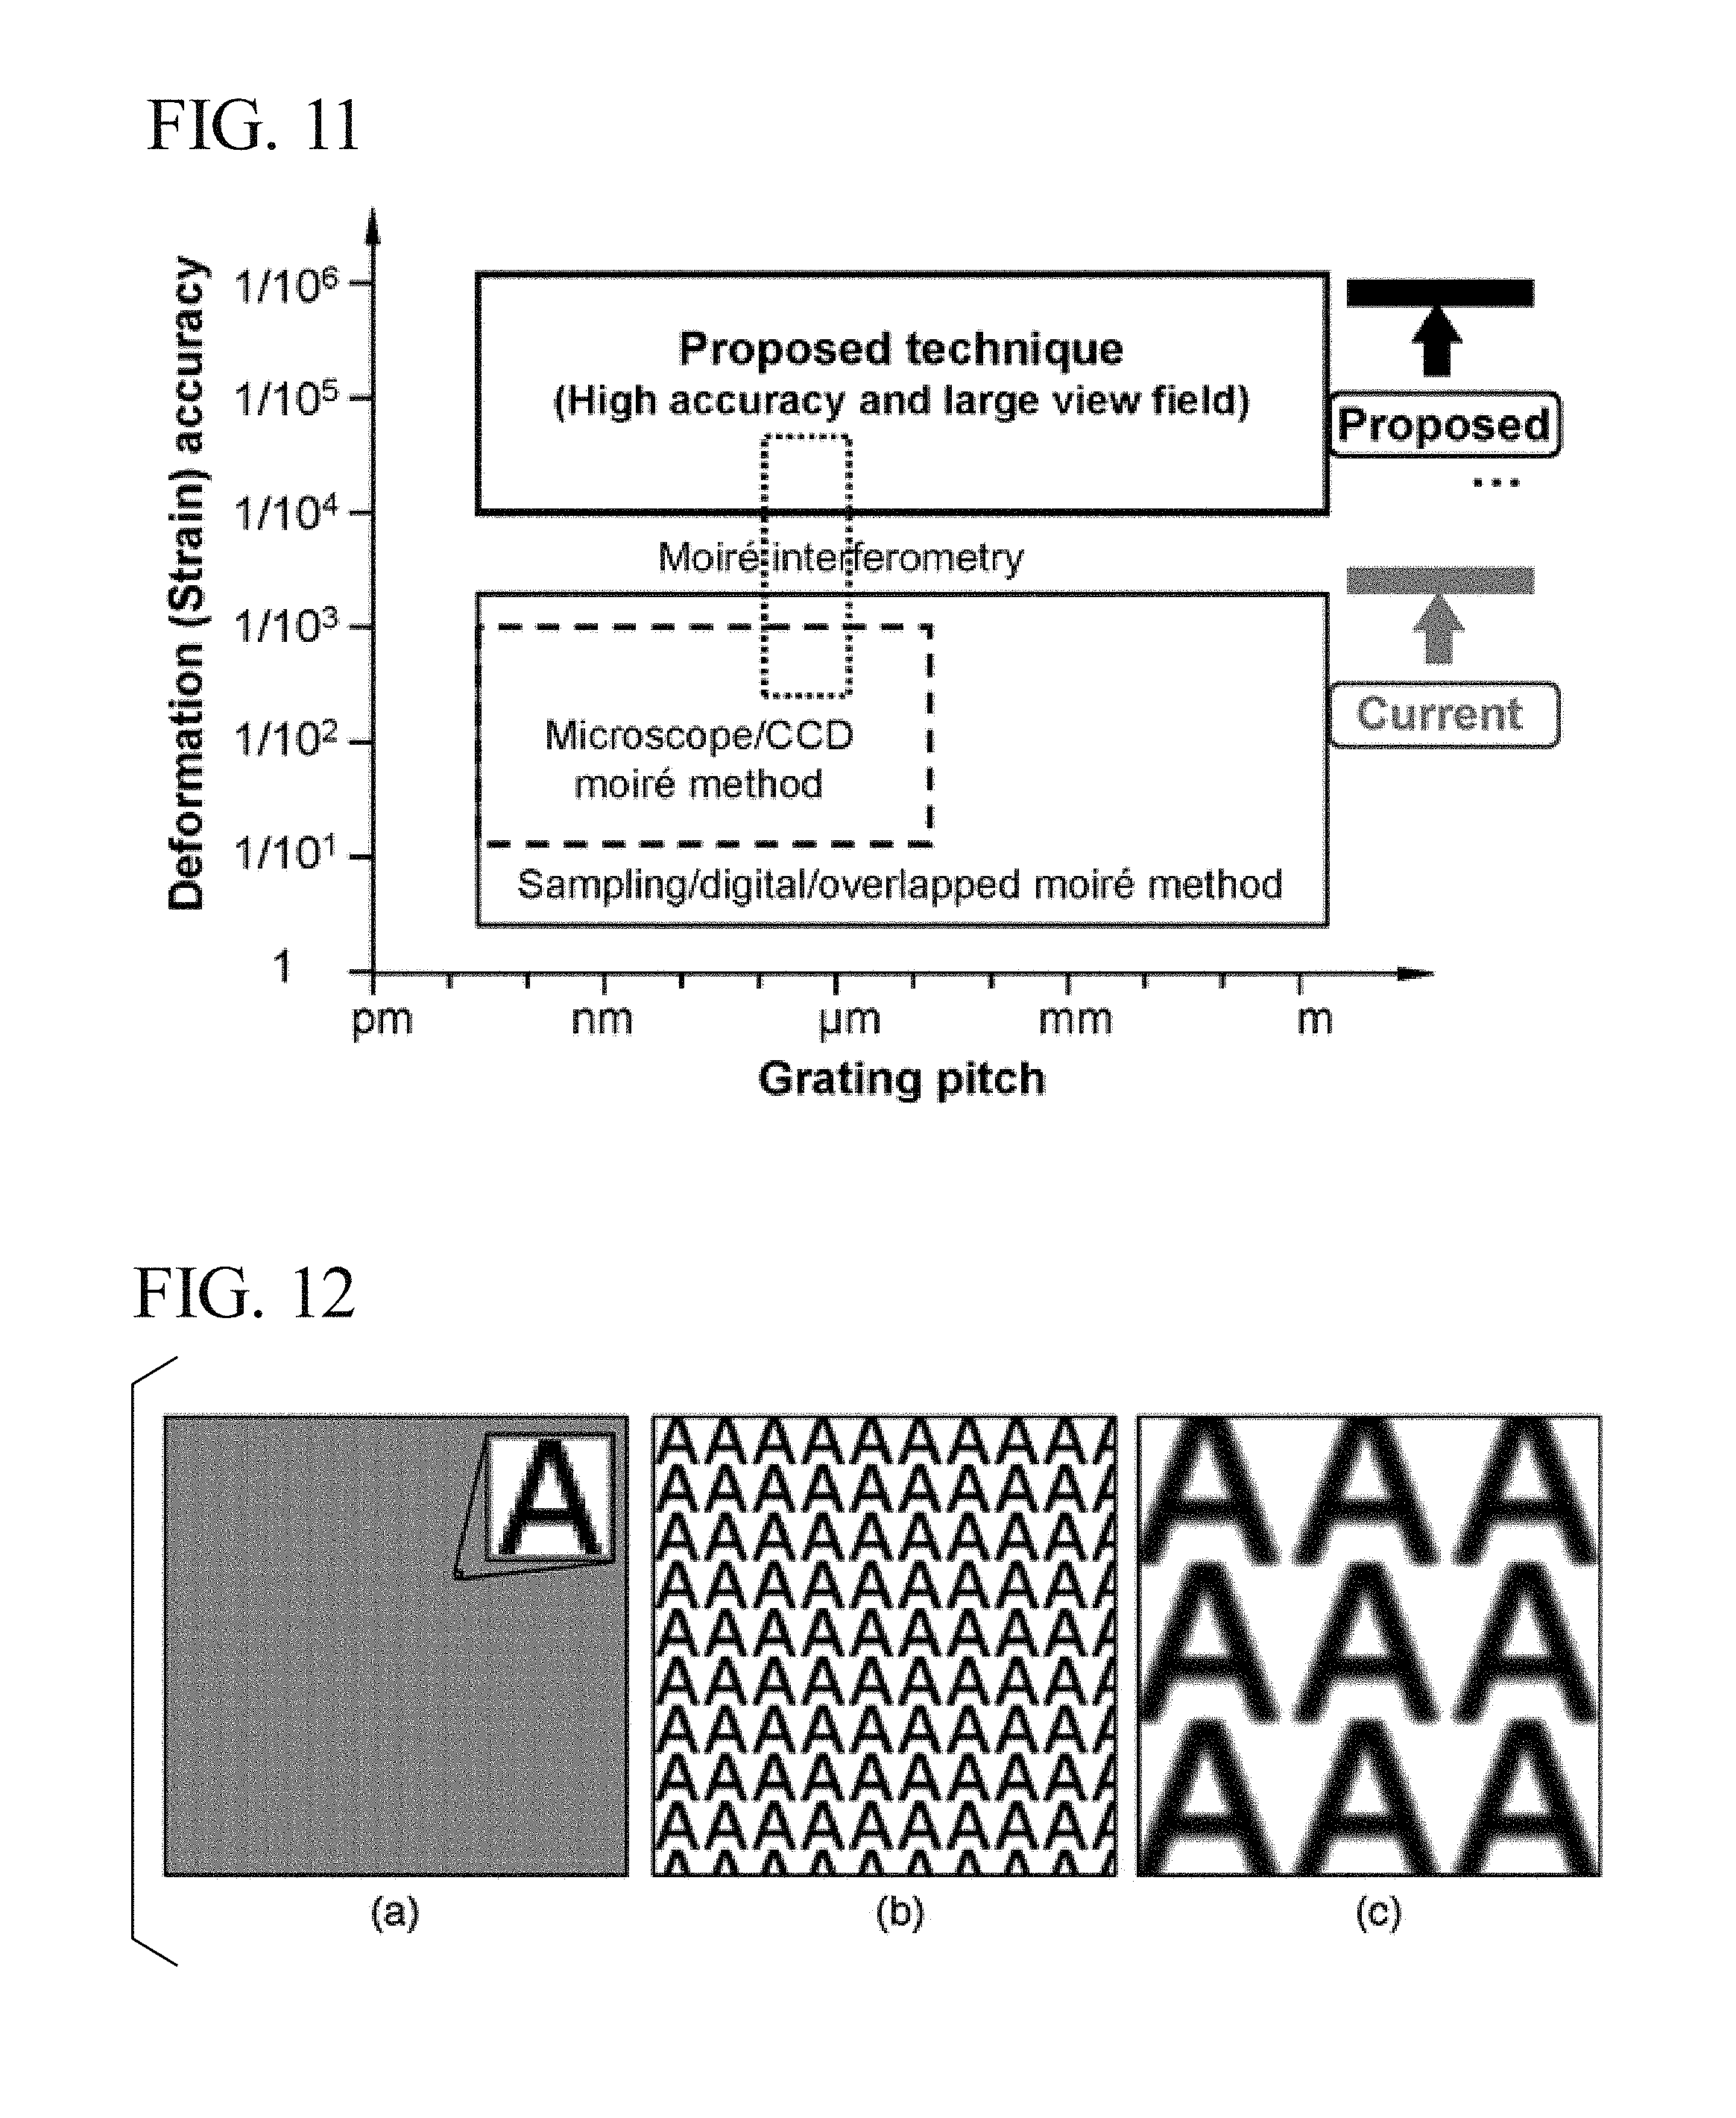
[0129] According to the present invention, it is possible to measure the full-field displacement and strain distributions with a wide field of view and a high level of measurement accuracy or dynamically with high accuracy by the 2nd-order moire method, and thus the following effects are exerted (FIG. 11).
[0130] Effect 1: The proposed technique prominently improves measurement accuracy through phase analysis as compared to the microscope moire method, the CCD moire method, the digital moire method, the overlapped moire method, and the fringe centering method used for moire interferometry. The strain sensitivity is theoretically 10.sup.-6. In addition, according to the present invention, it is possible to eliminate strain measurement errors caused by scanning distortion of various microscopes.
[0131] Effect 2: An analysis region in the proposed technique can be expanded by several tens to several hundred times as compared to the sampling moire method, the digital moire method, and the overlapped moire method.
[0132] Effect 3: Only a single moire pattern or a single grating image is required to be recorded for deformation measurement.
[0133] The proposed technique is suitable for a dynamic material test in which the spatiotemporal phase shifting method cannot be applied.
[0134] Effect 4: This technique has good noise-resistance characteristics and can be used for measurement of nanoscale to meter scale non-destructive deformation in the case in which a moire pattern or a grating image can be recorded.
BRIEF DESCRIPTION OF DRAWINGS
[0135] FIG. 1 is a diagram showing principles of different phase analysis techniques.
[0136] FIG. 2 shows fields of view in different moire methods.
[0137] FIG. 3(a) is a diagram showing traditional moire fringes, and FIG. 3(b) is a diagram showing the principle of formation of the 2nd-order moire fringes.
[0138] FIG. 4 is a diagram showing the principle of calculation of the phase distribution of the obtained 2nd-order moire fringes by performing down-sampling processing on a moire fringe pattern.
[0139] FIG. 5 is a diagram showing the principle of calculation of the phase distribution of the obtained 2nd-order moire fringes by performing down-sampling processing on a grating image in two stages.
[0140] FIG. 6 is a flow diagram showing the principle of generation of multiplication type moire fringes using a phase distribution and imaging processing.
[0141] FIG. 7 is a configuration diagram of the three-dimensional shape measurement device according to the present invention.
[0142] FIG. 8 is a configuration diagram of a displacement and strain measurement device according to the present invention.
[0143] FIG. 9 is a flowchart of the deformation measurement step in the proposed technique.
[0144] FIG. 10 is a flowchart of the deformation measurement program in the proposed technique.
[0145] FIG. 11 is a table showing comparison between distributions of strain measurement accuracies of different moire methods.
[0146] FIG. 12 shows an example in which the 2nd-order moire method is applied to any two-dimensional repetitive patterns.
[0147] FIG. 13 shows an example in which multiplication type moire fringes are generated by the third method according to the present invention.
[0148] FIG. 14 shows an example of phase analysis performed on a projection grating by the 2nd-order moire method.
[0149] FIG. 15 is a diagram showing comparison between phase analysis results of projection gratings according to the traditional methods and the present invention.
[0150] FIG. 16 shows an example in which the 2nd-order moire method is applied to the measurement of the three-dimensional non-contact shape through grating projection.
[0151] FIG. 17 is a diagram showing comparison between height measurement results of objects according to the traditional methods and the present invention.
[0152] FIG. 18 is a diagram showing simulation verification results of uniform deformation measurement in the proposed technique.
[0153] FIG. 19 is a diagram showing simulation verification results of non-uniform deformation measurement in the proposed technique.
[0154] FIG. 20 is a diagram showing analysis results of displacement and strain distributions obtained using inclined gratings having random noise in the case in which strain values obtained by simulation are 0 .mu..epsilon. and 1000 .mu..epsilon..
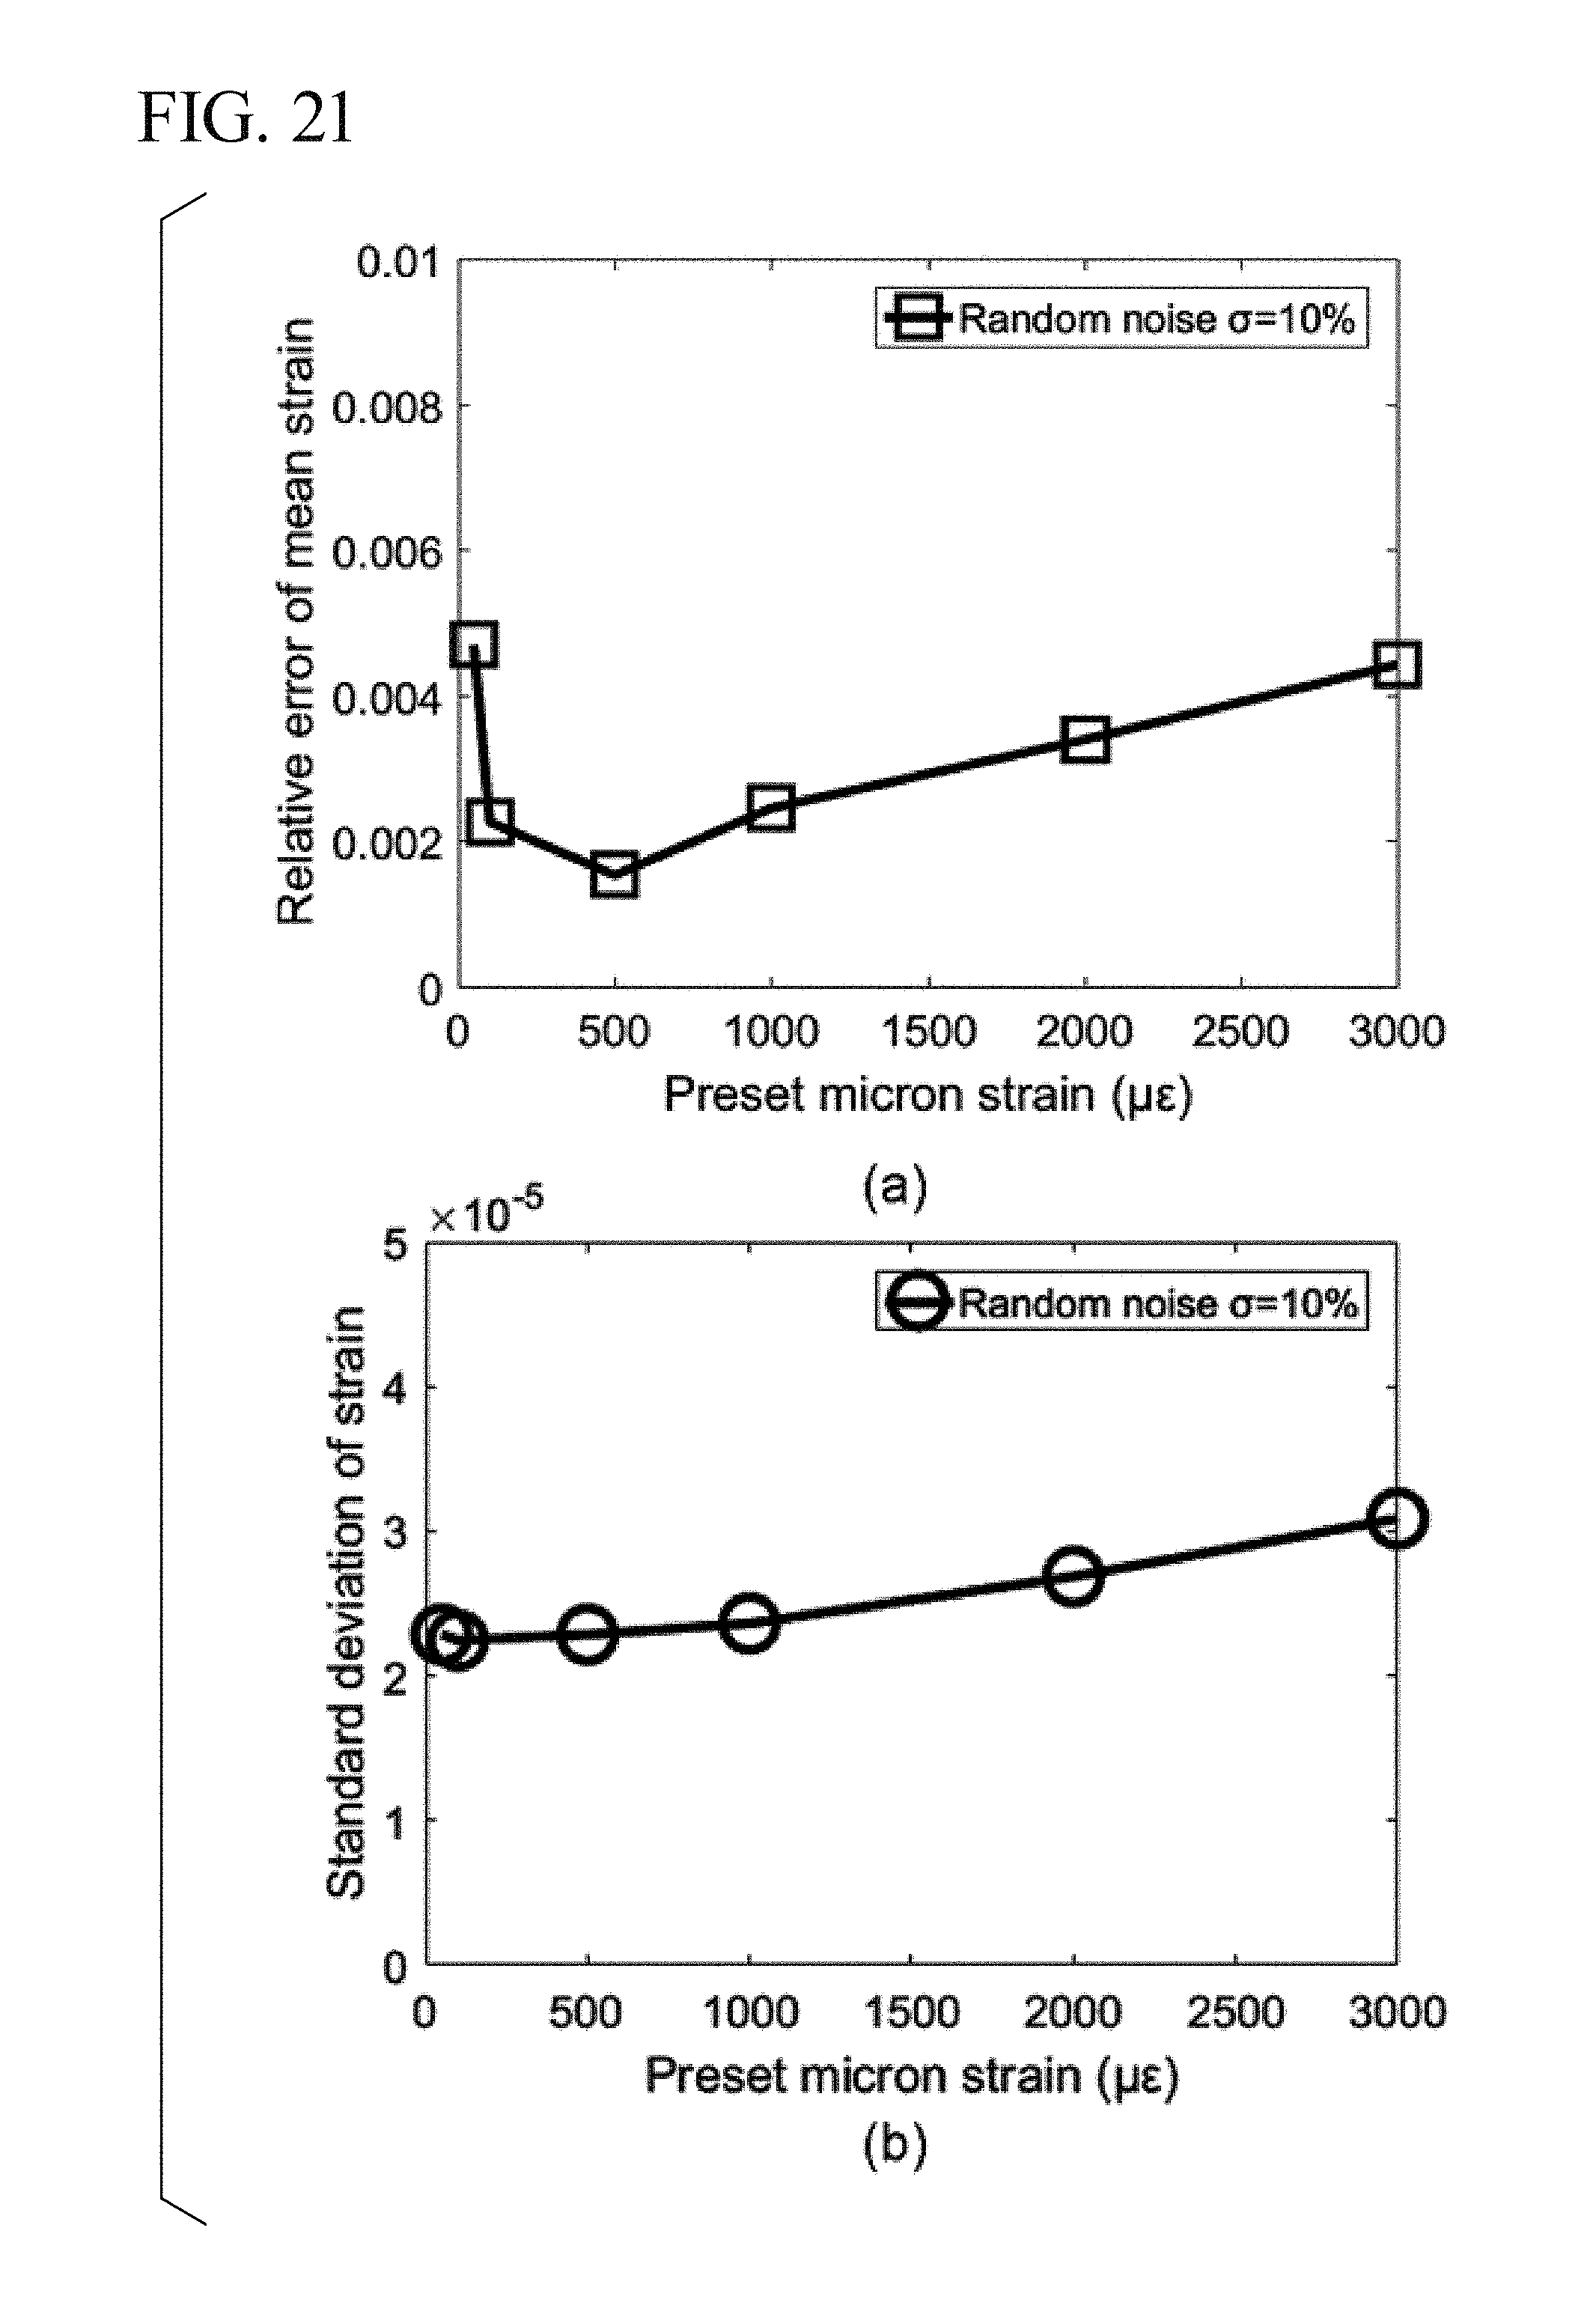
[0155] FIG. 21(a) is diagram showing the error of the mean strain measured by the 2nd-order moire method on the basis of the strain value (preset) obtained by simulation, and FIG. 21(b) is diagram showing the standard deviation of the measured strain.
[0156] FIG. 22 is photographs showing an aluminum test piece and setup of a tension experiment using a laser microscope.
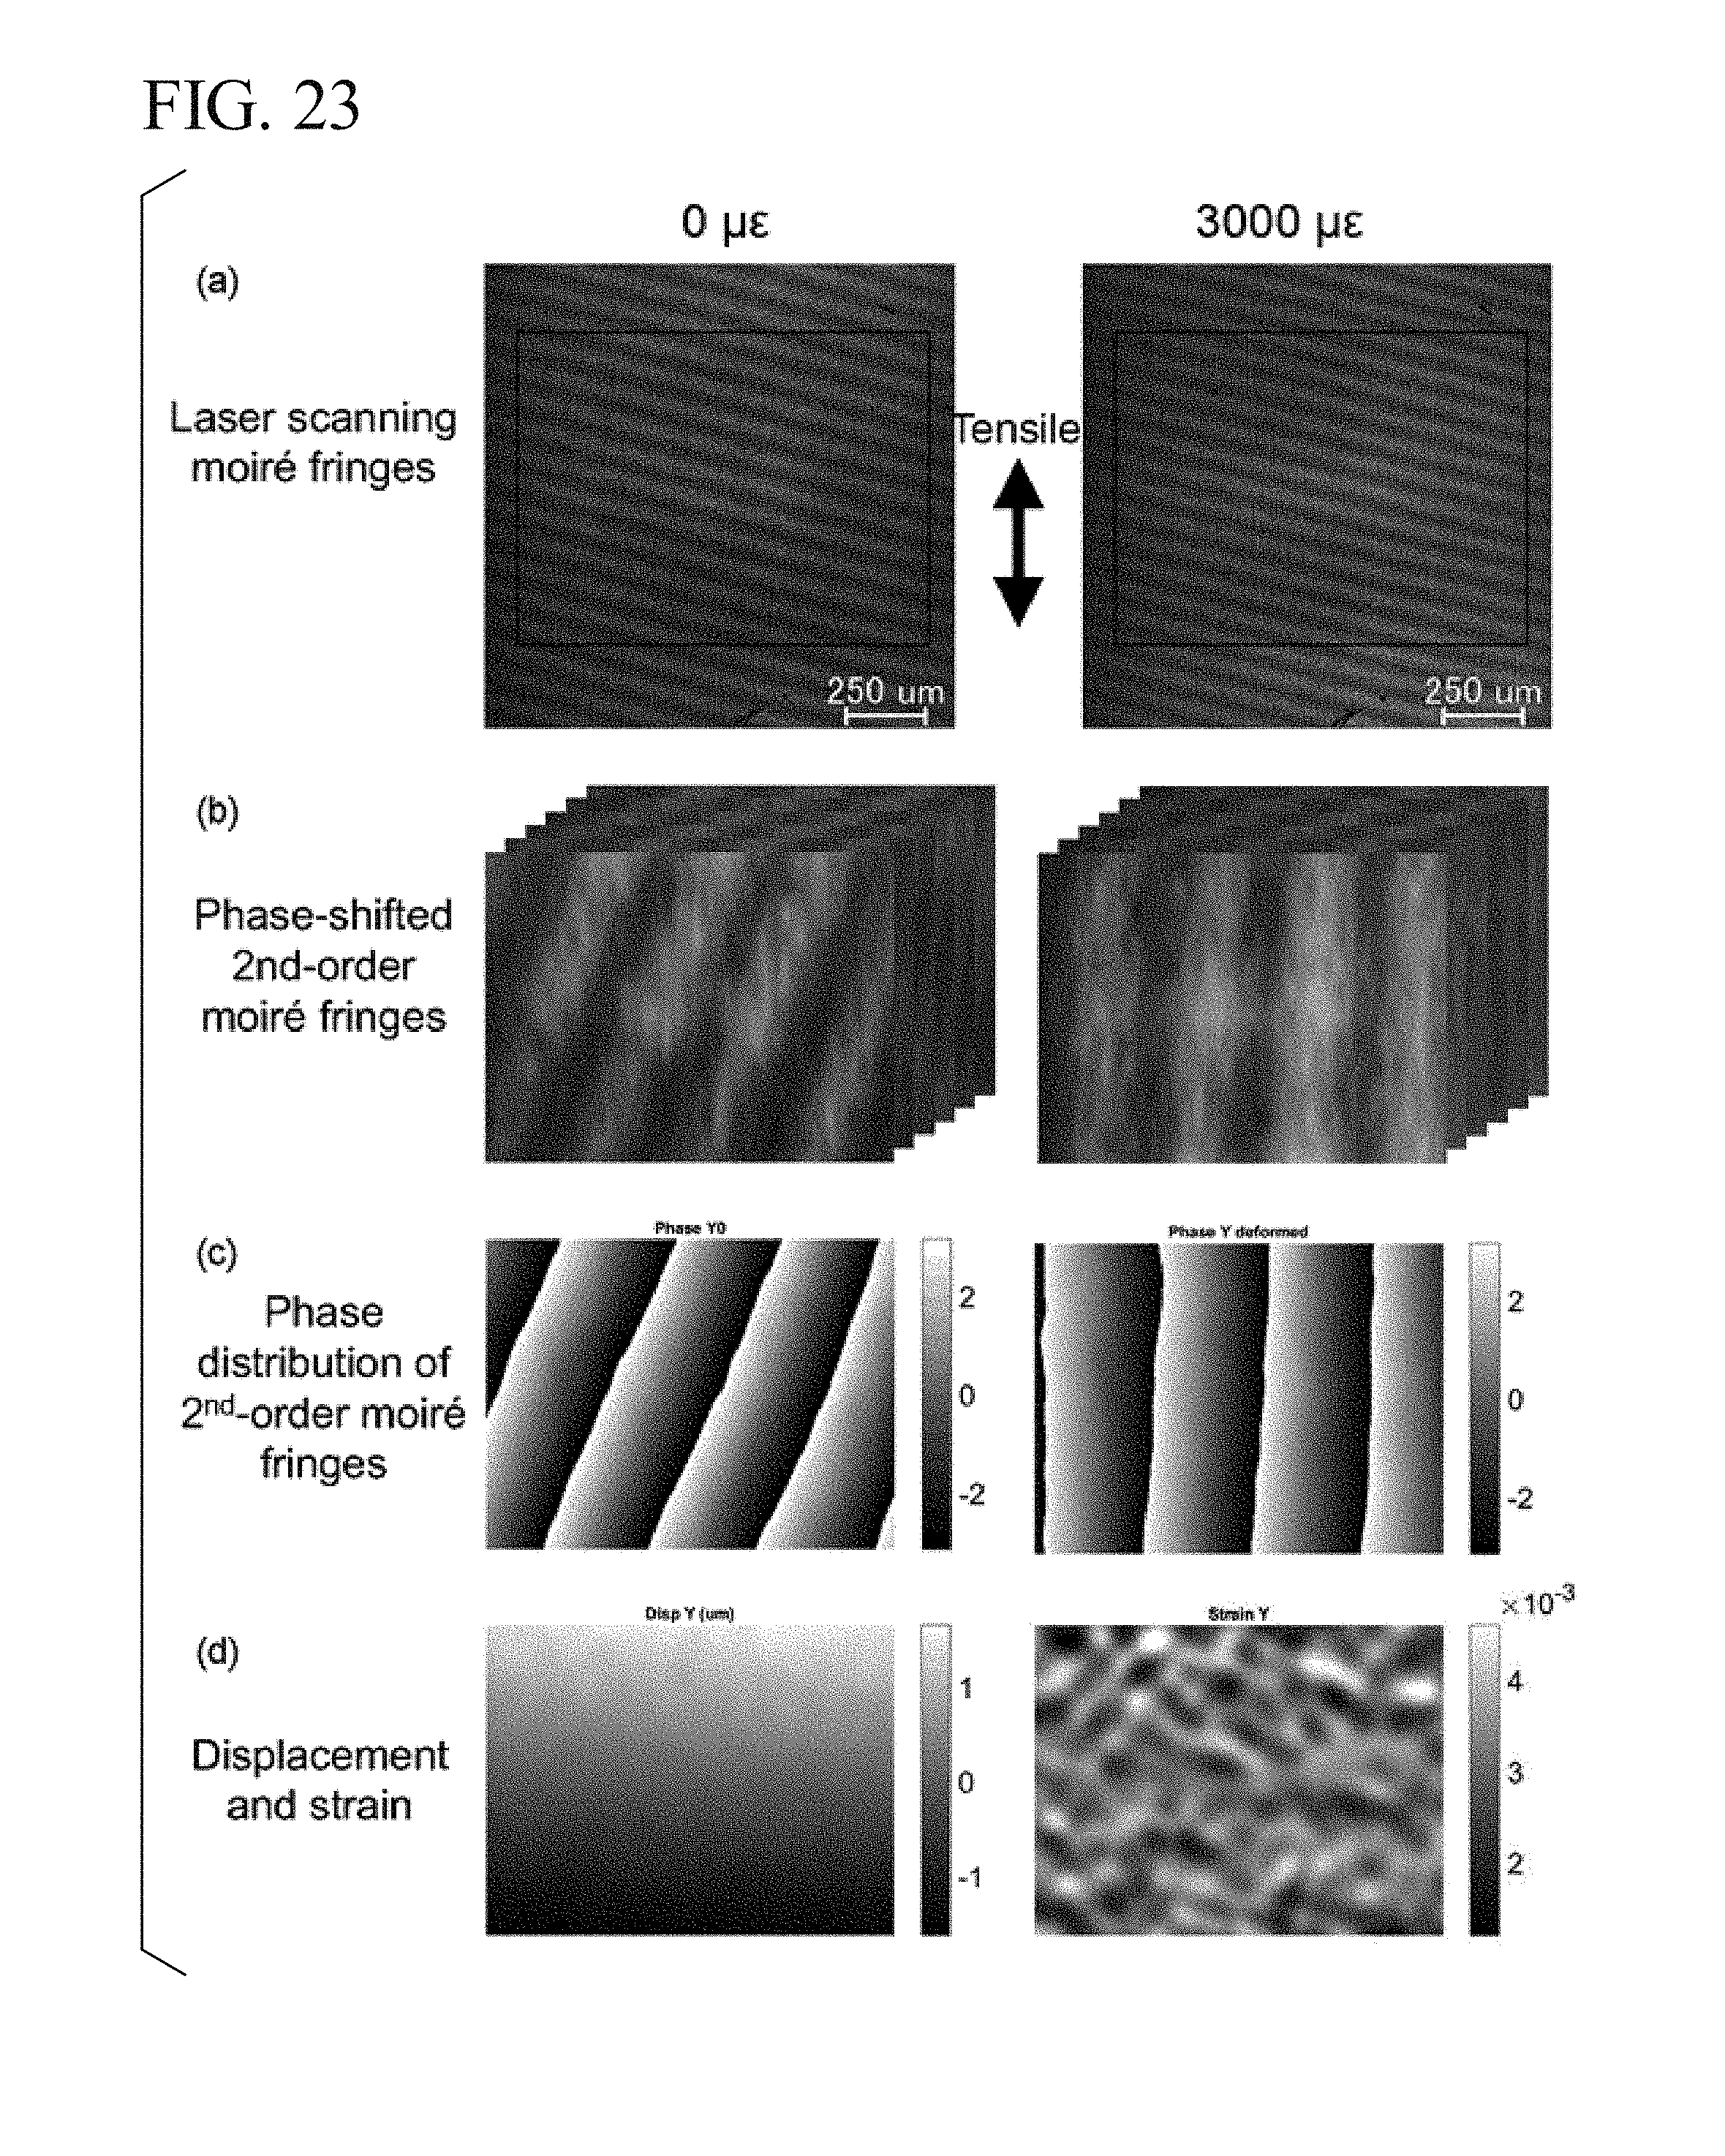
[0157] FIG. 23 is a diagram showing results of displacement and strain distribution measurement performed by the 2nd-order moire method when the strain gauge value is 3000 .mu..epsilon. during the tension test for the aluminum test piece.
[0158] FIG. 24 is a diagram showing comparison between the stress curve and the strain curve of the aluminum specimen which are obtained using the proposed technique and a strain gauge.
DESCRIPTION OF EMBODIMENTS
Example 1
[0159] Confirmation of Principle of Generation of 2nd-Order Moire Fringes of any Repetitive Pattern Obtained by Simulation
[0160] Here, effects in the case in which a 2nd-order moire method is applied to any two-dimensional repetitive pattern are described.
[0161] FIG. 12(a) shows a repetitive pattern (an alphabetical character A) which exists or is fabricated on the surface of an object.
[0162] FIG. 12(b) shows the moire fringe image obtained by performing first down-sampling on the pattern shown in FIG. 12(a) at a fixed pitch in the x-direction and the y-direction.
[0163] This moire fringe image is regarded as a grating, and FIG. 12(c) shows the moire fringe image obtained by further performing second down-sampling on the moire fringe image at a fixed pitch in the x-direction and the y-direction.
[0164] It can be understood that the original repetitive pattern A is further enlarged.
[0165] This is called 2nd-order moire.
Example 2
[0166] Confirmation of Principle of Generation of Multiplication Type Moire Fringes Obtained by Simulation
[0167] In the present invention, the interval between moire fringes obtained by performing down-sampling processing on a grating image may be large.
[0168] In this case, it is possible to reconfigure multiplication type moire fringes in which the interval between moire fringes becomes small so that an appropriate interval between moire fringes is obtained by the third method according to the present invention.
[0169] FIG. 13 shows results of generation of (multiplication type) moire fringes by simulation.
[0170] FIG. 13(a) shows a grating pattern having a pitch interval of 3.02 pixels generated by the simulation.
[0171] FIG. 13(b) shows two phase-shifted moire fringe images obtained by performing thinning processing on a grating image of FIG. 13(a) with a down-sampling pitch of 2 pixels.
[0172] Since the grating pitch P (3.02 pixels) is greatly different from the sampling pitch T (2 pixels), it can be confirmed that moire fringes cannot be generated.
[0173] FIG. 13(c) shows three phase-shifted moire fringe images obtained by performing thinning processing on the grating image of FIG. 13(a) with a down-sampling pitch of 3 pixels.
[0174] Since the grating pitch P (3.02 pixels) and the sampling pitch T (3 pixels) are close to each other, distinct moire fringes can be generated, but it can be understood that the interval between the moire fringes is large.
[0175] The application of the 2nd-order moire method in this situation results in a problem in that the spatial resolution is significantly decreased.
[0176] FIG. 13(d) shows four moire fringe images generated when the number of thinning out for shifting four phases obtained by thinning out the grating image of FIG. 13(a) with a down-sampling pitch of 4 pixels.
[0177] Similarly to FIG. 13(b), since the grating pitch P (3.02 pixels) and a sampling pitch T (4 pixels) are greatly different from each other, it can be understood that moire fringes cannot be generated.
[0178] FIG. 13(e) shows a phase distribution image of moire fringes calculated using the moire fringe image (FIG. 13(c)) generated when the sampling pitch is 3 pixels.
[0179] FIG. 13(f) shows results of the moire fringe image reconfigured (multiplication type) in the case in which the adjustment factor N is changed from 1 to 20 by using the phase distribution image.
[0180] In this manner, it is possible to adjust the interval between moire fringes from a sparse state to a dense state by changing the adjustment factor N.
Example 3
[0181] Verification of Non-Contact Measurement Experiment of Three-Dimensional Shape of Object which is Performed by Grating Projection Method
[0182] Effects of the improvement in the accuracy of non-contact measurement of the three-dimensional shape of an object which is performed by the 2nd-order moire method proposed in the present invention are confirmed through an experiment.
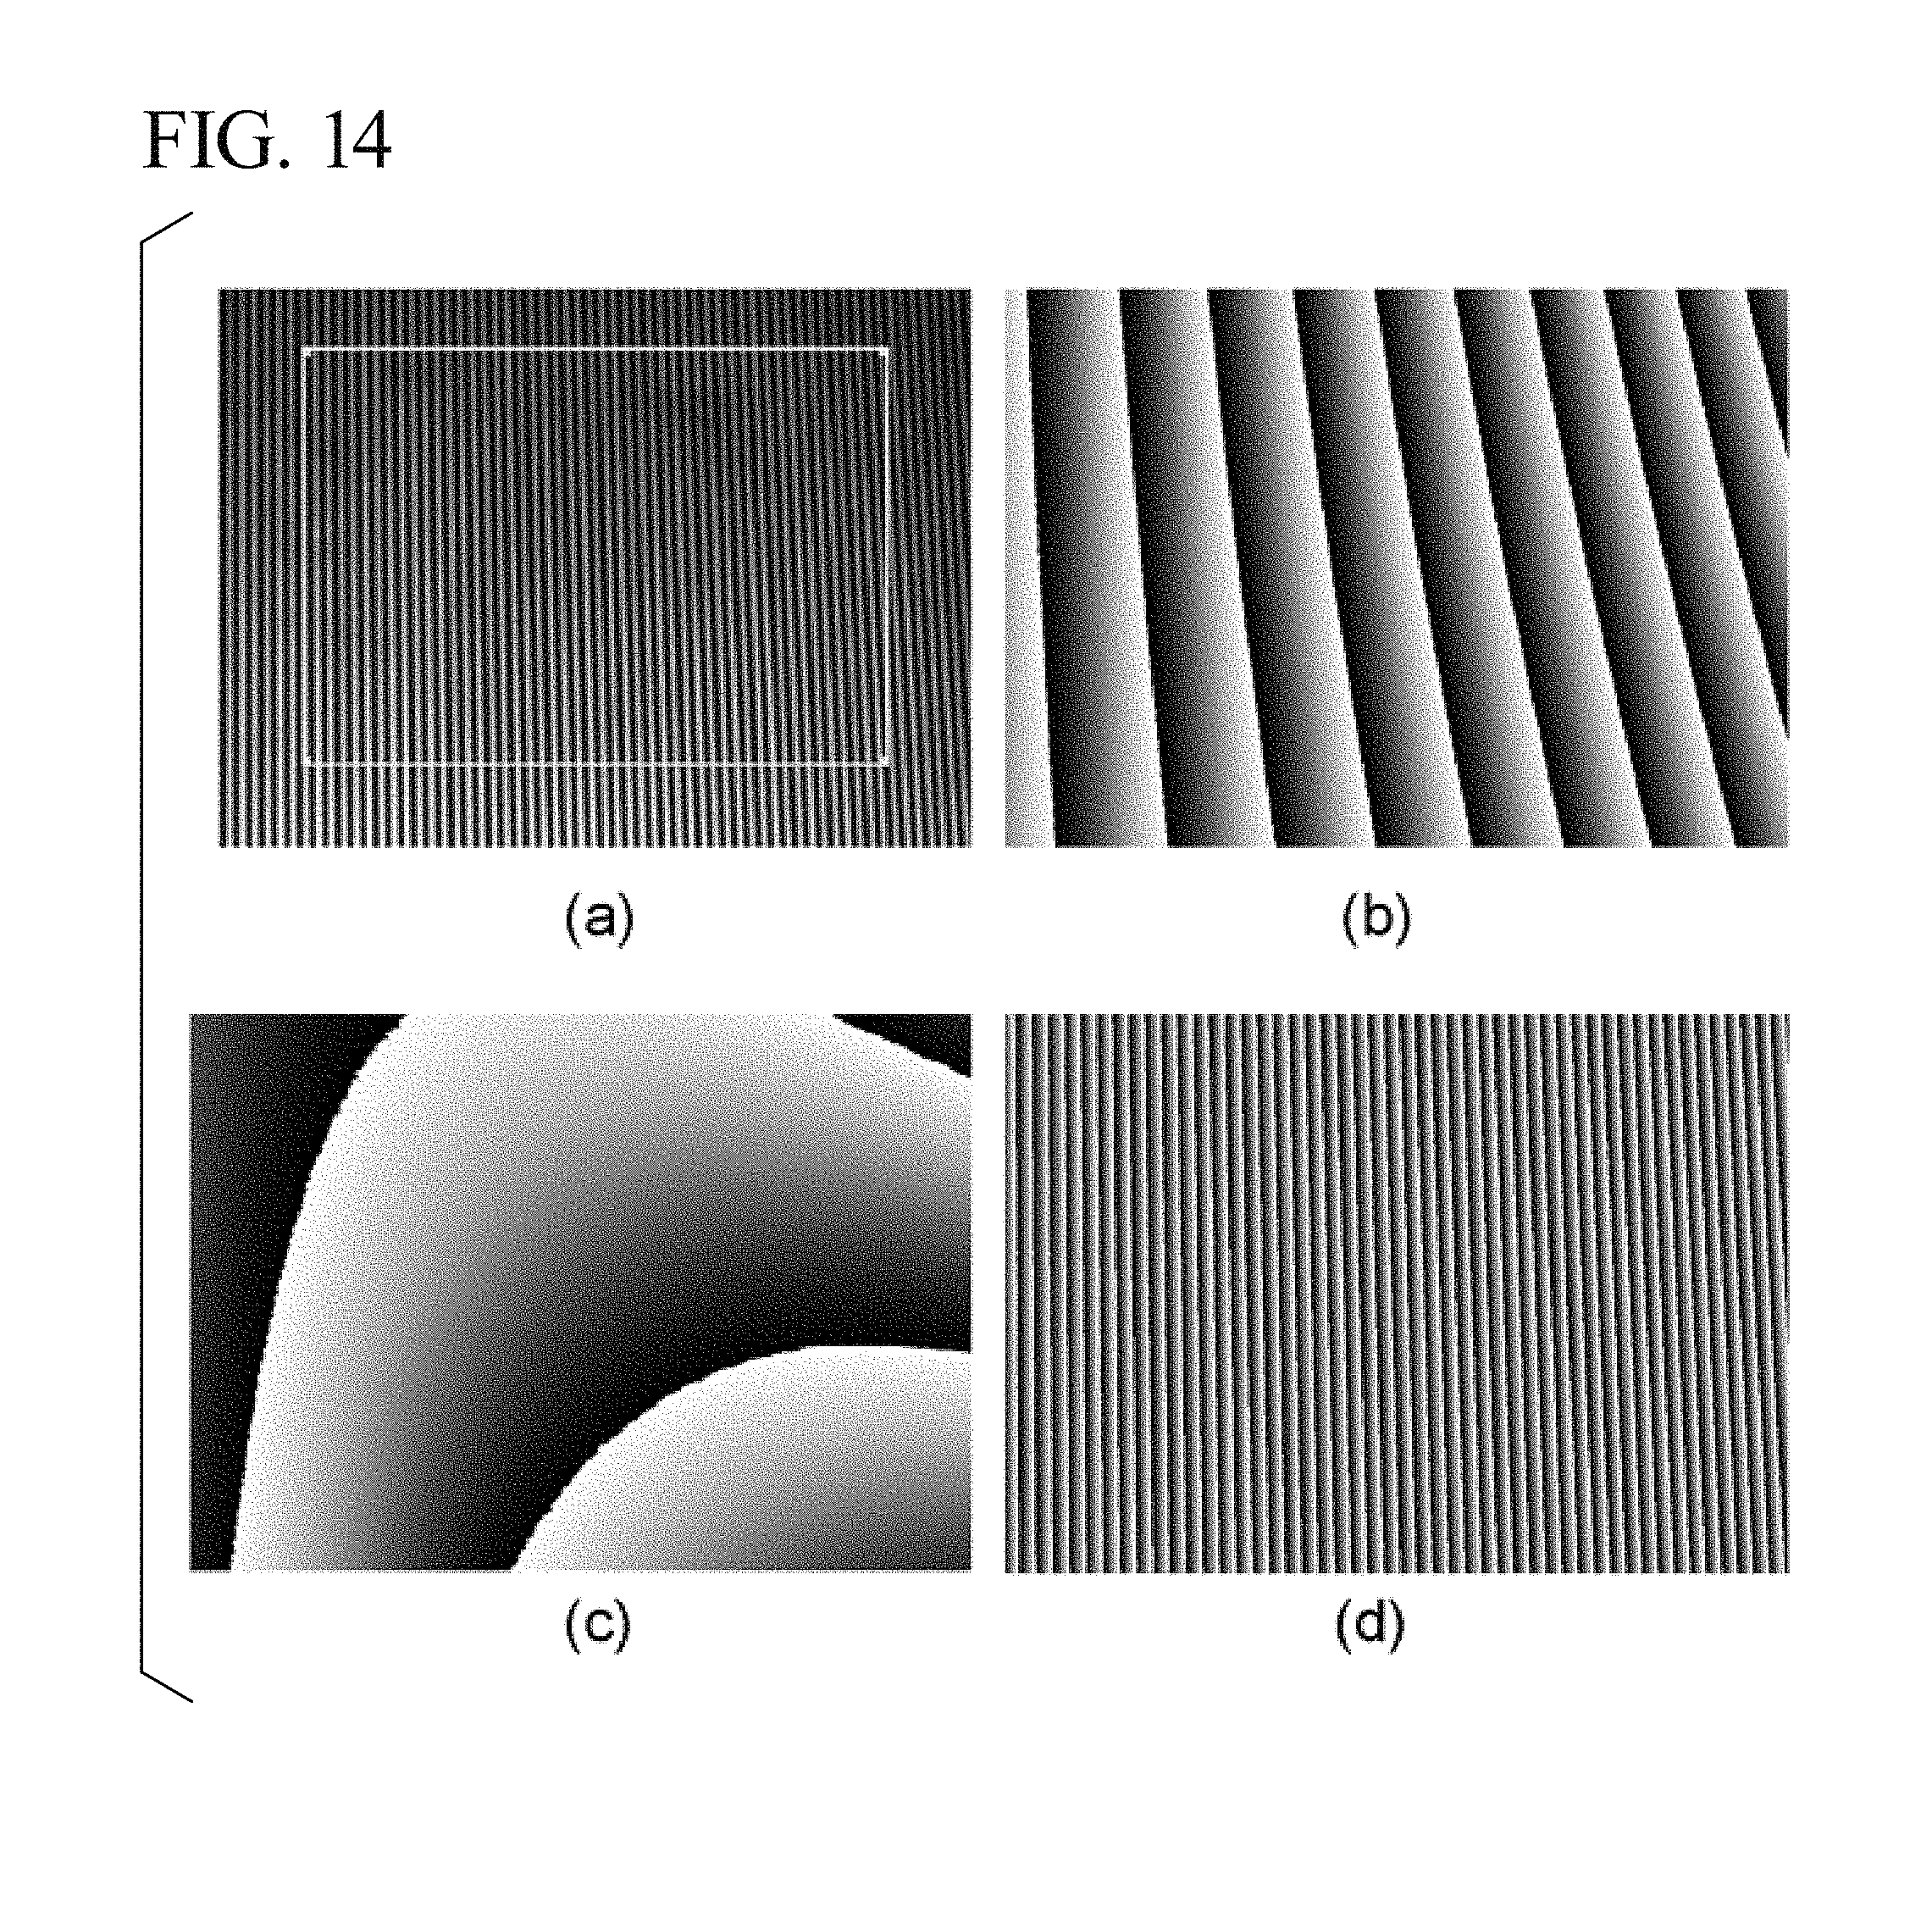
[0183] FIG. 14 shows an example of analysis results obtained in the case in which the image of a grating, which is projected by a grating projection device, is captured by a camera, and is applied to a 2nd-order moire method using the three-dimensional shape measurement device as shown in FIG. 7.
[0184] Here, the grating image captured by projecting sine waves having fixed cycles (cycles of 8 pixels in a projector) on the reference surface is shown in FIG. 14(a). FIG. 14(b) shows a phase distribution of moire fringes calculated using 25 phase-shifted moire fringes by applying the traditional sampling moire method to FIG. 14(a) to perform down-sampling and intensity interpolation on 25 pixels in the horizontal direction.
[0185] FIG. 14(c) shows the phase distribution of 2nd-order moire fringes calculated by two-dimensional discrete Fourier transform by regarding these moire fringe images as phase-shifted grating images, further performing down-sampling and intensity interpolation on 100 pixels in the horizontal direction, and using 2500 of 100.times.25 phase-shifted 2nd-order moire fringe images to be generated.
[0186] FIG. 14(d) shows the phase distribution of the original projection grating obtained by adding the phase of the sampling point to the phase distribution of 2nd-order moire fringes (Equation (7)).
[0187] In the case of this example, it is possible to generate 2500 phase-shifted moire fringes from one grating image and to perform phase analysis with a higher level of accuracy.
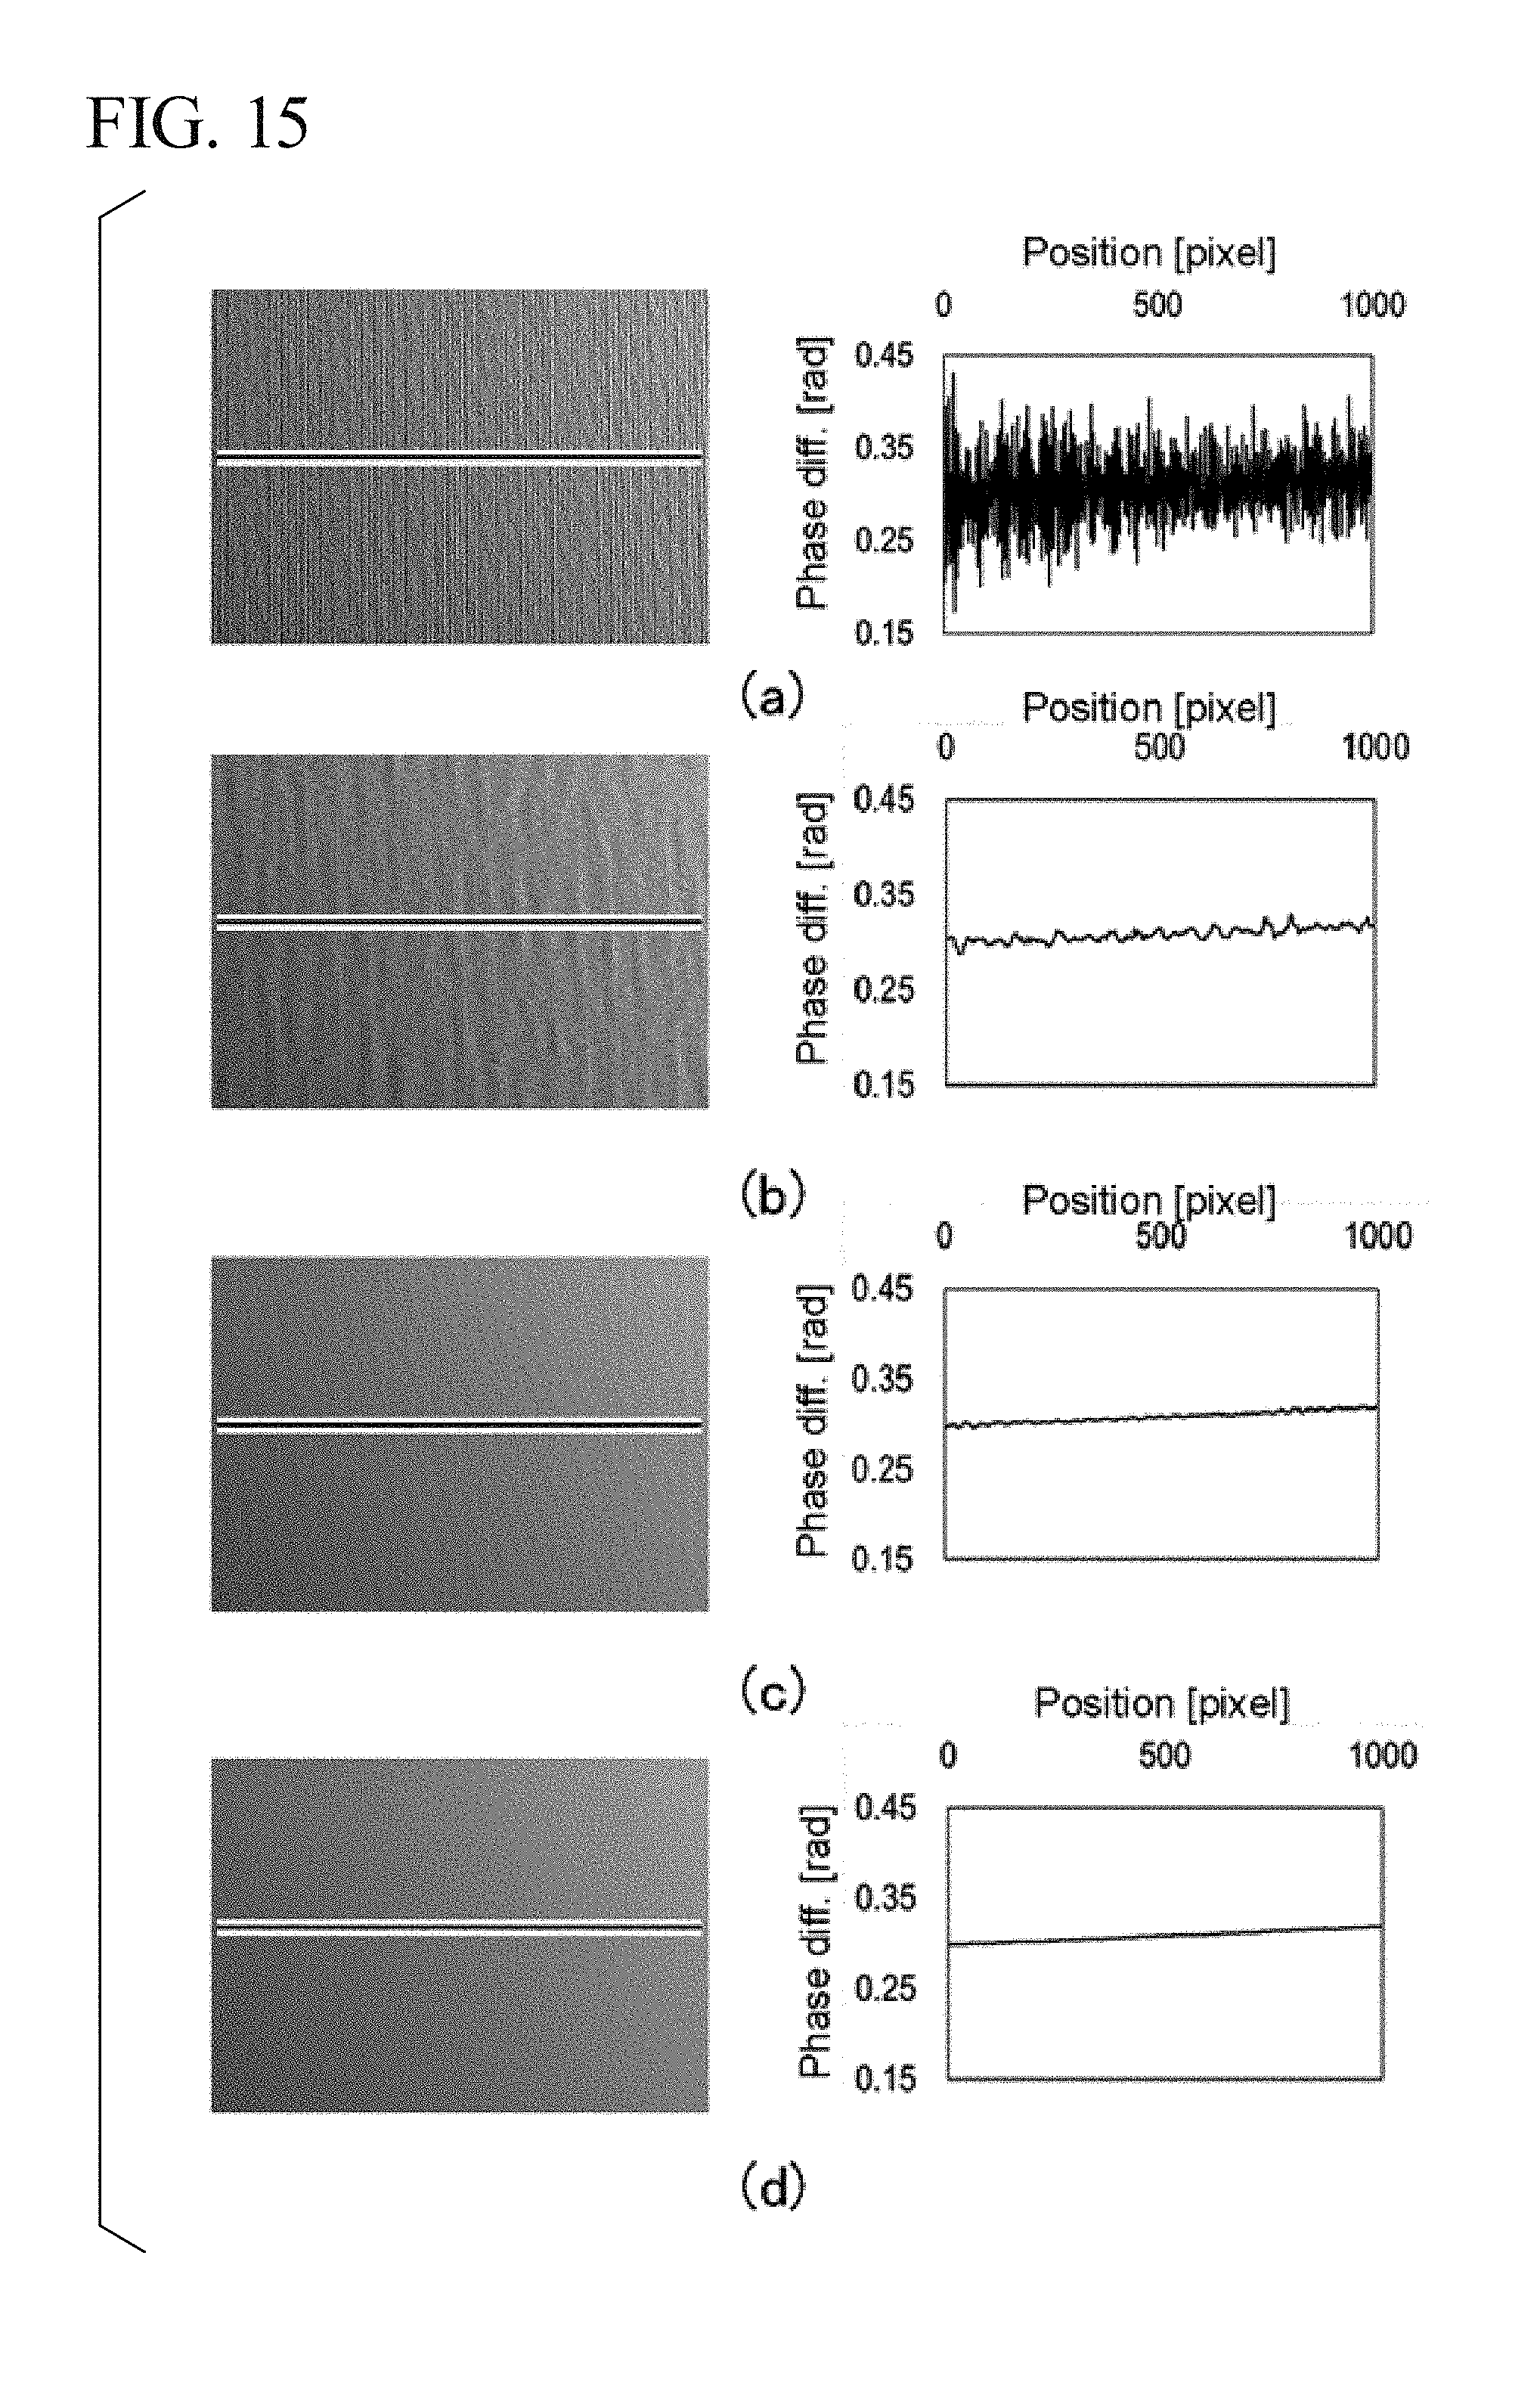
[0188] FIG. 15 shows comparison results of analysis performed on the grating image on the reference surface as shown in the FIG. 14(a) according to the phase shifting method, the sampling moire method, and the spatiotemporal phase shifting method which are traditional techniques and the present invention.
[0189] FIG. 15(a) shows results (phase gradient) obtained by horizontally spatially differentiating a phase distribution obtained by calculating eight captured phase-shifted grating images by the traditional phase shifting method.
[0190] The left diagram shows a phase gradient distribution, and the right diagram is the cross-sectional view of one horizontal center line.
[0191] Similarly, FIG. 15(b) shows results obtained by calculating one captured grating image by the sampling moire method (the number of thinning-out is 25 pixels).
[0192] FIG. 15(c) shows results obtained by calculating eight captured phase-shifted grating images by the spatiotemporal phase shifting method (the number of thinning-out is 25 pixels).
[0193] FIG. 15(d) shows results obtained by calculating one captured grating image by the present invention (the number of thinning-out is 25 pixels at the first stage and is 100 pixels at the second stage).
[0194] A correct result is that the phase gradient of the reference surface is a smooth straight line with a certain inclination.
[0195] As can be seen from the results of FIG. 15, the traditional phase shifting methods have great measurement errors.
[0196] The sampling moire method can perform phase calculation using one grating image but has a measurement error.
[0197] Since the spatiotemporal phase shifting method uses both temporal and spatial intensity information, the spatiotemporal phase shifting method is more accurate than the phase shifting method and the sampling moire method but is not suitable for dynamic measurement because a plurality of images are required.
[0198] On the other hand, according to the present invention, the most accurate results are obtained using only one grating image, and thus the effectiveness of the present invention is shown.
[0199] Next, an example in which the dynamic three-dimensional shape is measured with high accuracy by the second method according to the present invention will be described.
[0200] FIG. 16 shows analysis results obtained by applying a reference surface and a grating image of an object (hand) obtained by capturing a grating, which is projected by a grating projection device, by a camera to the 2nd-order moire method using the three-dimensional shape measurement device as shown in FIG. 7.
[0201] FIG. 16(a) shows images captured by cameras installed at different angles by projecting two types of sinusoidal grating patterns with grating pitch ratios of 8 and 9 on the reference surface and the object in order from the top.
[0202] Phase distributions calculated by performing the 2nd-order moire method on these images are shown in FIG. 16(b).
[0203] Here, two types of grating patterns with grating pitch ratios of 8 and 9 are used so that a height can be measured even with an object having a depth.
[0204] The phase difference between the reference surface and the object in the case in which the grating pitch ratio is 8 is shown in FIG. 16(c), and similarly, the phase difference between the reference surface and the object in the case in which the grating pitch ratio is 9 is shown in FIG. 16(d).
[0205] Analysis conditions in the case in which the grating pitch ratio is 8 are the same as those in FIG. 14.
[0206] In analysis conditions in the case in which the grating pitch ratio is 9, the first down-sampling pitch is 29 pixels and the second down-sampling pitch is 110 pixels.
[0207] FIG. 16(e) shows the phase distribution after phase connection of the object (hand) which is obtained by applying the two types of phase difference results shown in FIGS. 16(c) and 16(d) to an algorithm of phase connection using the existing grating with a plurality of pitches.
[0208] The height distribution of the object can be finally obtained by multiplying FIG. 16(e) by the height factor obtained by calibration.
[0209] FIG. 17 shows results of measurement of the height of the hand which are obtained by the traditional phase shifting method and the sampling moire method and the 2nd-order moire method according to the present invention.
[0210] FIG. 17(a) shows results of measurement performed by the traditional phase shifting method, and shows data regarding the shape of the hand which is obtained using a total of 17 images of eight images obtained by shifting the phase of the grating image having the grating pitch ratio of 8 by 2 .pi./8 and nine images obtained by shifting the phase of the grating image having the grating pitch ratio of 9 by 2.pi./9.
[0211] The left side shows shape distributions, and the right side shows data regarding one horizontal line.
[0212] FIG. 17(b) shows results of measurement performed by the sampling moire method. A dynamic shape can be measured using only a total of two images of an image having the grating pitch ratio of 8 and an image having the grating pitch ratio of 9, but there is a problem in that the measurement results have much noise.
[0213] FIG. 17(c) shows results obtained by the 2nd-order moire method according to the present invention.
[0214] This example shows analysis results in a condition in which the signal-noise (SN) ratio of the projected grating pattern is extremely low.
[0215] Therefore, the phase shifting method (FIG. 17(a)) and the spatiotemporal phase shifting method require a large number of phase-shifted grating images, and thus it is difficult to apply the methods to dynamic measurement.
[0216] On the other hand, the sampling moire method (FIG. 17(b)) is suitable for dynamic measurement. However, measurement results have much noise, and there are many locations where the shape cannot be measured well.
[0217] According to the present invention (FIG. 17(c)), it can be confirmed that it is possible to calculate the shape of the hand with less measurement errors using only a total of two images of an image having the grating pitch ratio of 8 and an image having the grating pitch ratio of 9.
[0218] As can be seen from the experiment results of FIG. 17, the present invention is effective for high-accuracy and dynamic three-dimensional shape measurement.
[0219] However, the present technique using the 2nd-order moire method uses intensity information in a wide field of view, and thus it is necessary to note that the present technique is not suitable for measurement of a rapidly changing object.
Example 4
[0220] Simulation Verification of Proposed Technique in Uniform Deformation Measurement
[0221] Example 4 is an example in which accuracy is verified in the case in which the proposed 2nd-order moire method is performed through simulation and uniform deformation measurement is performed.
[0222] A regular grating having a 10-pixel pitch can be linearly extended and the current strain is 100 .mu..epsilon. (FIG. 18(a)). A grating image of the regular grating was 10,000 pixels long.
[0223] The micron strain (.mu..epsilon.) mentioned here is a minus sixth power of 10 in the unit of the amount of strain.
[0224] When the pitch of the reference grating was 9 pixels, well-known digital sampling moire fringes before and after deformation were obtained (FIG. 18 (b)).
[0225] Both intervals between the well-known moire fringes before and after deformation were approximately 90 pixels.
[0226] Known moire fringes were treated as regular gratings and down-sampled by 88 pixels, and 2nd-order moire fringes before and after deformation were obtained in combination with the spatial phase shifting method (FIG. 18(c)).
[0227] The phase of the 2nd-order moire fringes before and after deformation was calculated using the present invention (FIG. 18(d)).
[0228] Next, changes in phase and displacements having the same distribution characteristics were measured (FIG. 18(e)).
[0229] Finally, the strain distribution was determined, so that the mean strain of 101 .mu..epsilon. was obtained.
[0230] As compared with the preset strain 100 .mu..epsilon., the measurement error was only 1 .mu..epsilon., and the accuracy of this measurement method was confirmed.
Example 5
[0231] Simulation Verification of Proposed Technique in Non-Uniform Deformation Measurement
[0232] The present example is an example indicating that distribution characteristics (FIG. 19) of measurement of the non-uniform displacement and strain are the same as theoretical characteristics.
[0233] A numerical value obtained from MATLAB function peaks (x, y) was added to the phase of a regular grating of 8.1 pixels per pitch (the left side in FIG. 19(a), before deformation) to deform the regular grating (the right side in FIG. 19(a), after deformation).
[0234] A grating image was 256.times.180 pixels.
[0235] When the reference grating pitch was set to 7 pixels, known moire fringes before and after deformation appeared (FIG. 19(b)).
[0236] An interval between the known moire fringes before and after deformation was 46 to 57 pixels.
[0237] Phase-shifted 2nd-order moire fringes before and after deformation were obtained in combination with the spatial phase shifting method by down-sampling the known moire fringes by 41 pixels (FIG. 19(c)).
[0238] The phase of the moire fringes before and after deformation was obtained using the present invention (FIG. 19(d)).
[0239] Changes in the phases (FIG. 19(e)) and displacement and strain distributions were measured.
[0240] Distribution characteristics of the measured displacement and strain (FIG. 19(f)) matched theoretically obtained results.
Example 6
[0241] Simulation Verification of Proposed Technique of Inclined Grating with Random Noise
[0242] In the present example, measurement of the displacement of an inclined grating with random noise will be described.
[0243] The angle of inclination of the grating line was 0.0086 rad, the grating pitch in the vertical direction was 2.0572 pixels, and the grating image was 1300.times.900 pixels.
[0244] A random noise with amplitude of 10% of the grating amplitude was added to the inclined grating, and images in the cases in which tensile strains equivalent to 50 .mu..epsilon., 100 .mu..epsilon., 500 .mu..epsilon., 1000 .mu..epsilon. and 2000 .mu..epsilon. were loaded were generated through simulation.
[0245] The process of generating moire fringes and 2nd-order moire fringes in the cases in which strains are 0 .mu..epsilon. and 1000 .mu..epsilon. is shown in FIG. 20. It is possible to measure displacement and strain from the phase difference between 2nd-order moire fringes.
[0246] Errors of the mean strain measured by setting strains given through simulation to the horizontal axis are shown in FIG. 21(a).
[0247] FIG. 21(b) shows the standard deviation of the measured strain.
[0248] Since all of relative errors are less than 1% and standard deviations are less than 4.times.10.sup.-5, it can be confirmed that high-accuracy strain measurement can be performed.
Example 7
[0249] Experimental Verification of Deformation of Loaded Aluminum
[0250] In the present example, validity and accuracy of the proposed deformation measurement are shown through experiment.
[0251] An aluminum specimen was stretched under a laser microscope (FIG. 22).
[0252] Dimensions of the aluminum specimen were 27, 6.3, and 0.5 (mm) in length, width, and thickness, respectively.
[0253] A grating having a pitch of 3.0 .mu.m was manufactured on the surface of the aluminum specimen by UV nanoimprint lithography.
[0254] After a strain gauge is attached to the side opposite to the specimen, a tensile load was applied under the microscope.
[0255] Laser scanning moire fringes generated due to interference between the grating on the specimen and the scanning line was observed by making the magnification of the objective lens as 5 times.
[0256] A series of laser scanning moire fringes were recorded during the tension process.
[0257] FIG. 23 shows the deformation measurement process for the aluminum specimen under the tensile load by taking the case in which the value of the strain gauge is 3000 .mu..epsilon. as an example.
[0258] FIG. 24 shows stress-strain curves of the aluminum specimen obtained using the mean strain evaluated from the proposed technique and the strain evaluated from the strain gauge.
[0259] The value of the mean strain evaluated from the proposed technique is well matched with that of the strain gauge method, and thus it is possible to verify the validity and measurement accuracy of the proposed technique.
INDUSTRIAL APPLICABILITY
[0260] The proposed 2nd-order moire method and its program can be used to measure full-field displacements and strains of various materials and structure from nanoscale to meter scale.
[0261] Analyzable objects include metals, polymers, ceramics, semiconductors, composite materials, hybrid structures, and thin films in industrial fields such as aerospace, automobiles, electronic packaging, biomedical fields, military, and material manufacture.
[0262] Typical applications in the industrial field mainly include the following four aspects.
[0263] 1) Evaluation of Separation, Crack Propagation, and Instability Mode
[0264] The proposed technique can predict the region where a crack occurs by finding the strain concentration region from full-field deformation.
[0265] The form of crack propagation can be evaluated by measuring the deformation distribution near the tip of the crack.
[0266] It is possible to quantitatively analyze modes of damages including an instability mode, layer separation, buckling, and a crack due to various mechanical loads, electric loads, thermal loads, magnetic loads, and combined loads thereof.
[0267] 2) Evaluation of Residual Strain and Stress Distribution, and Provision of Optimized Design Guidelines
[0268] It is possible to detect the residual strain inside a material and the influence on its structural stability in combination with a stress release method (heating, a hole drilling method, a ring core method, or the like).
[0269] Measurement of the deformation distribution in the vicinity of an interface helps to find areas that are easily destroyed and provides guidance for strengthening and toughening materials and optimal design of materials and interfaces.
[0270] 3) Evaluation of Mechanical Properties and Monitoring of Structural Health
[0271] Deformation measurement information can be used to determine material constants such as a stress-strain curve, a Young's modulus, a Poisson's ratio, an elastic limit, a yield strength, and an ultimate strength.
[0272] It is possible to evaluate displacement and strain distributions caused by a mechanical, electrical, or thermal load for structural health monitoring.
[0273] 4) Evaluation of Height, Depth, and Flatness and Control of Manufacturing Quality
[0274] It is possible to quantitatively evaluate the height, depth, surface flatness, and the out-of-plane displacement of an object from the measured three-dimensional shape. The proposed technique is useful for industrial fields such as control of manufacturing quality, machine vision, and automatic processing.
REFERENCE SIGNS LIST
[0275] 1 Computer [0276] 2 Monitor [0277] 3 Imaging sensor (various cameras and microscopes) [0278] 4 Grating projection device [0279] 5 Three-dimensional object as measurement target [0280] 6 Reference surface (planar object) [0281] 7 Structural material as measurement target [0282] 8 Minute grating (one-dimensional or two-dimensional) [0283] 11 Grating projection control unit [0284] 12 Fringe grating image storage unit [0285] 13 2nd-order moire fringe generation unit and phase analysis arithmetic operation unit [0286] 14 Three-dimensional shape arithmetic operation unit [0287] 15 Displacement and strain arithmetic operation unit
* * * * *
D00000
D00001
D00002
D00003
D00004
D00005
D00006
D00007
D00008
D00009
D00010
D00011
D00012

D00013
D00014
D00015

D00016

D00017

D00018

D00019

D00020
D00021

D00022
D00023


XML
uspto.report is an independent third-party trademark research tool that is not affiliated, endorsed, or sponsored by the United States Patent and Trademark Office (USPTO) or any other governmental organization. The information provided by uspto.report is based on publicly available data at the time of writing and is intended for informational purposes only.
While we strive to provide accurate and up-to-date information, we do not guarantee the accuracy, completeness, reliability, or suitability of the information displayed on this site. The use of this site is at your own risk. Any reliance you place on such information is therefore strictly at your own risk.
All official trademark data, including owner information, should be verified by visiting the official USPTO website at www.uspto.gov. This site is not intended to replace professional legal advice and should not be used as a substitute for consulting with a legal professional who is knowledgeable about trademark law.