Methods for Treating Urothelial Carcinoma Using Genotypic and Phenotypic Biomarkers
Darling; David ; et al.
U.S. patent application number 16/194956 was filed with the patent office on 2019-07-04 for methods for treating urothelial carcinoma using genotypic and phenotypic biomarkers. This patent application is currently assigned to Pacific Edge Limited. The applicant listed for this patent is Pacific Edge Limited. Invention is credited to Mark Dalphin, David Darling, Laimonis Kavalieris, Satish Kumar, Paul O'Sullivan, James Miller Suttie.
| Application Number | 20190203300 16/194956 |
| Document ID | / |
| Family ID | 53180146 |
| Filed Date | 2019-07-04 |


View All Diagrams
| United States Patent Application | 20190203300 |
| Kind Code | A1 |
| Darling; David ; et al. | July 4, 2019 |
Methods for Treating Urothelial Carcinoma Using Genotypic and Phenotypic Biomarkers
Abstract
New methods for treating patents for urothelial cancer (UC) include combining selected phenotypic variables with levels of genotypic expression into a metric, the "G+P INDEX." The G+P INDEX combines age, sex, smoking history, presence of hematuria, and frequency of hematuria with genotypic expression of the genetic markers, MDK, CDC2, HOXA13, IGFBP5, and optionally IL8Rb, then determining of the G+P INDEX value obtained for a patient is within one of three groups, either: (1) at High Risk of UC, (2) at Risk of UC, or (3) at Low Risk of UC. For groups 1 and 2, further clinical and laboratory work up or treatment is indicated, and patients in group 3 are monitored periodically to determine the need for further clinical workup. Using the G+P INDEX can save substantial time, effort, and funds by avoiding unnecessary medical diagnostic procedures for patients having or are at risk for developing UC.
| Inventors: | Darling; David; (Dunedin, NZ) ; Suttie; James Miller; (Dunedin, NZ) ; Dalphin; Mark; (Dunedin, NZ) ; Kavalieris; Laimonis; (Dunedin, NZ) ; O'Sullivan; Paul; (Dunedin, NZ) ; Kumar; Satish; (Havelock North, NZ) | ||||||||||
| Applicant: |
|
||||||||||
|---|---|---|---|---|---|---|---|---|---|---|---|
| Assignee: | Pacific Edge Limited Dunedin NZ |
||||||||||
| Family ID: | 53180146 | ||||||||||
| Appl. No.: | 16/194956 | ||||||||||
| Filed: | November 19, 2018 |
Related U.S. Patent Documents
| Application Number | Filing Date | Patent Number | ||
|---|---|---|---|---|
| 15159359 | May 19, 2016 | 10131955 | ||
| 16194956 | ||||
| PCT/US2014/066678 | Nov 20, 2014 | |||
| 15159359 | ||||
| 61907013 | Nov 21, 2013 | |||
| Current U.S. Class: | 1/1 |
| Current CPC Class: | C12Q 2600/158 20130101; C12Q 2600/16 20130101; G01N 2800/60 20130101; C12Q 1/6886 20130101; C12Q 2600/118 20130101; G01N 33/57407 20130101; G01N 33/57484 20130101; G01N 33/50 20130101 |
| International Class: | C12Q 1/6886 20060101 C12Q001/6886; G01N 33/574 20060101 G01N033/574; G01N 33/50 20060101 G01N033/50 |
Claims
1. A method for treating a patient for urothelial carcinoma comprising the steps: a) providing a sample of urine from a patient; b) quantifying a value, M1, comprising detecting and quantifying the levels of expression of the human genotypic markers, midkine (MDK) using a forward primer having the sequence of SEQ ID NO.3, cyclin dependent kinase 1 (CDC2), homeobox A13 (HOXA13), insulin like growth factor binding protein (IGFBP5) in said sample where MI=[IGFBP5]-[HOXA13]+[MDK]+[CDC2] in said sample, where the square brackets "[ ]" are defined as the log of concentrations in the sample of urine of each of said genotypic markers; c) detecting the log concentration of IL8Rb in said sample; d) assessing the phenotypic variables: detecting in the urine of 3 or more red blood cells per high power field in a 6-month period (HFREQ), subject's age greater than 50 years AgeGT50), gender, smoking history (SMK), and detecting the red blood cell count (RBC) of said patient and e) quantifying a value of G+P INDEX according to either: G+P INDEX=(1*HFREQ+3*Gender+4*SMK)+(5*M1+2*IL8Rb), or formula (i), G+P INDEX=(w1*HFREQ+w2*AgeGT50+w3*Gender+w4*SMK+w5*RBC)+(w6*M1+w7*IL8Rb), or formula (ii), G+P INDEX=-8.46+0.79 IGF-1.60 HOXA+2.10 MDK+0.95 CDC-0.38 IL8Rb+0.98 SNS+0.56 Hfreq+1.11 Gender+0.64 Age; where the terms w1-w7 are respectively the weights assigned to each of the variables; where formula (iii), HFREQ means the frequency of finding 3 or more red blood cells per high power field in a 6-month period; if frequency is low, then HFREQ is set to 0, and if higher than 3 red blood cells per high power field, then HFREQ is set to 1; AgeGT50 refers to subject's age, if greater than 50 years then AgeGT50 is set to 1, and if less than 50 years, then AgeGT50 is set to 0; Gender is assigned a value of 1 for male, and 0 for female; SMK means whether the subject is a current or ex-smoker; if non-smoker then SMK is set to 0 and if a smoker, then SMK is set to 1; RBC means red blood cell count: if 25 or more then RBC is set to 1, and if less than 25, then RBS is set to 0; if M1>4.5 then M1 is set to 1, if M1 is less than 4.5, then M1 is set to 0; if IL8Rb>2.5 then IL8Rb is set to 1, if IL8Rb is less than 2.5, IL8Rb is set to 0; the symbols "*" means the multiplication operator, and weighting factors, w1-w7 are respectively the weights assigned to each of the variables listed in the G+P INDEX; and if the G+P INDEX has value of from 6-10, said patient undergoes additional clinical or laboratory tests, cytology, uretoscopy, and/or CT scan.
2. The method of claim 1, where if the G+P INDEX has a value of from 11-15, said patient is tested for flexibile cystoscopy, abdonimal ultrasound, or is treated immediately for urothelial carcinoma.
3. The method of claim 1, wherein if the G+P INDEX has a value from 0 to 5, said patient receives the normal standard of care and be placed on a waiting list.
4. The method of claim 1, wherein expression of MDK is determined using a reverse primer having the sequence of SEQ ID No. 4.
5. The method of claim 1, wherein expression of MDK is determined using a probe having the sequence of SEQ ID NO.5.
6. The method of claim 1, wherein expression of CDC2 is determined using a forward primer having the sequence of SEQ ID NO.9.
7. The method of claim 1, wherein expression of CDC2 is determined using a reverse primer having the sequence of SEQ ID NO.10.
8. The method of claim 1, wherein expression of CDC2 is determined using a probe having the sequence of SEQ ID NO.11.
9. The method of claim 1, wherein expression of CDC2 is determined using a forward primer having the sequence of SEQ ID NO.9.
10. The method of claim 1, wherein expression of HOXA13 is determined using a forward primer having the sequence of SEQ ID NO.12.
11. The method of claim 1, wherein expression of HOXA13 is determined using a reverse primer having the sequence of SEQ ID NO.13.
12. The method of claim 1, wherein expression of HOXA13 is determined using a probe having the sequence of SEQ ID NO.14.
13. The method of claim 1, wherein expression of IGFBP5 is determined using a forward primer having the sequence of SEQ ID NO.6.
14. The method of claim 1, wherein expression of IGFBP5 is determined using a reverse primer having the sequence of SEQ ID NO.7.
15. The method of claim 1, wherein expression of IGFBP5 is determined using a probe having the sequence of SEQ ID NO.8.
16. The method of claim 1, wherein expression of IL8Rb is determined using a forward primer having the sequence of SEQ ID NO.15.
17. The method of claim 1, wherein expression of IL8Rb is determined using a reverse primer having the sequence of SEQ ID NO.16.
18. The method of claim 1, wherein expression of IL8Rb is determined using a probe having the sequence of SEQ ID NO.15.
19. The method of claim 1 for treating a patient having an inflammatory condition of the bladder, comprising the steps: a) providing a sample of urine from said patient; b) detecting the log concentration of IL8Rb in said sample using a forward primer having the sequence of SEQ ID NO.15, wherein if the level of IL8Rb in said sample is greater than the levels of IL8Rb in a group of patients not having an inflammatory condition of the bladder, said patient is treated using an antiinflammatory agent.
20. The method of claim 1, where said human genotypic markers are measured as mRNA or as cDNA.
Description
CLAIM OF PRIORITY
[0001] This application is a Continuation under 35 U.S.C. 111(a) of U.S. patent application Ser. No. 16/159,359 filed 19 May 2016, now entitled "Methods for Detecting Genetic and Phenotypic Biomarkers of Urothelial Carcinoma and Treatment Thereof" (Now U.S. Pat. No. 10,131,955 issued 20 Nov. 2018), inventors David Darling, Jamese Miller Suttie, Mark Dalphin, Laimonis Kavalieris, Paul O'Sullivan, and Satish Kumar, which is a Continuation under 35 U.S.C. 111(a) of International Patent Application No. PCT/US2014066678 filed 20 Nov. 2014, titled "Triaging Patients Having Asymptomatic Hematuria Using Genotypic and Phenotypic Biomarkers," which claims priority to U.S. Provisional Patent Application No. 61/907,013 filed 21 Nov. 2013; Inventors David Darling, Satish Kumar, Mark Dalphin, and Paul O'Sullivan. Each of these applications are herein incorporated fully by reference.
FIELD OF THE INVENTION
[0002] This invention relates to the detection of patients not having disease. Specifically, this invention relates to the use of genetic markers and phenotypic markers for triaging patients that present with hematuria without cancer. Particularly, this invention relates to analysis of genetic markers and phenotypic markers in triaging patients with either macroscopic or microscopic hematuria. More particularly, this invention relates to use of genetic and phenotypic markers in combination to triage patients with asymptomatic macroscopic or microscopic hematuria and to predict whether a patient's condition warrants further clinical procedures.
BACKGROUND
[0003] Survival of cancer patients is greatly enhanced when the cancer is treated early. In the case of bladder cancer, patients diagnosed with disease that is confined to the primary site have a 5 year survival rate of 73%, compared to 6% for patients with metastatic disease (Altekruse et al). Therefore, developments that lead to early and accurate diagnosis of bladder cancer can lead to an improved prognosis for the patients. To aid in early detection of cancer a number of cancer specific markers have been identified. However the use of these markers can result in false positive results in patients having inflammatory bladder diseases, and not bladder cancer.
[0004] Asymptomatic hematuria ("AH") is one of the most frequent urological findings, with incidence rates of between 2% and 30% depending on the population (Schwartz G: Proper evaluation of asymptomatic microscopic hematuria in the era of evidence-based medicine-progress is being made. Mayo Clin Proc. 2013, 88(2); 123-125, McDonald M, Swagerty D, Wetzel L: Assessment of Microscopic hematuria in adults. AFP 2006 73:10, Grossfield G, Wolf J, Litwan M, Hricak H, Shuler C, Agerter D, et al. Asymptomatic microscopic hematuria in adults: summary of AUA best practice policy recommendations. AFP 2001:63:1145-54).
[0005] AH is, however, indicative of broad range of pathologies with urinary tract malignancy incidences in the AH population ranging from 1.9-7%. Full diagnostic work up on all confirmed AH patients puts a considerable burden on many healthcare systems. Use of phenotypic indicators to segregate high and low risk patients has been explored in a recent study by Loo et al. (Loo R, Lieberman S, Slezak J, Landa H, Mariani A, Nicolaisen G, Aspera A and Jaconsen S:
[0006] Stratifying risk of urinary tract malignant tumors in patients with asymptomatic microscopic hematuria. Mayo Clin Proc. 2013, 88(2); 129-138).
[0007] The above-mentioned study of 4414 patients presenting with confirmed AH showed that 73% of patients had no cause identified, while 26% of patients warranted some form of urological work up to identify the cause. Approximately 2.5% of patients presenting with AH were diagnosed with urothelial malignancy, with other conditions such as urinary tract infection (UTI) (2.3%), kidney stones (16.2%), prostatic bleeding (4%), and contamination (0.4%) making up the alterative diagnoses (Loo et al., Id.).
SUMMARY
[0008] We have identified a new problem in the field, namely how to identify patients presenting with hematuria who do not have or are at low risk for having bladder cancer. This solves the problem that many patients with hematuria and without bladder cancer may undergo expensive and invasive further workup when such workups are not needed. Thus, this invention is useful to exclude individuals from the hazards and costs associated with full work-up for bladder cancer when a combination of genetic information and phenotypic information provides identification of patients that do not have, or are at low risk of having bladder cancer, and to effectively triage patients having no cancer, from those having cancerous conditions, including urothelial carcinomas, transitional cell carcinoma (TCC) and non-cancerous conditions, including inflammatory disease. This invention represents a new approach to a new problem, in that it is unexpectedly useful, not to diagnose cancer, but rather to diagnose non-cancers. The use of combinations of genetic and phenotypic criteria provide unexpectedly better discrimination than either genetic or phenotypic variables alone. Data were obtained from 541 observations from validated under CLIA standards and CURT+North Shore product trial using bootstrap procedures for internal validation. Phenotypic variables included presence of: (1) smoking history, (2) hematuria, (3) gender, and (4) age. Genetic variables included analysis of expression of IGF, HOXA13, MDK, CDC, and IL8R. The genetic+phenotypic model ("G+P") performed unexpectedly better than either genetic or phenotypic variables alone.
[0009] Macrohematuria, or finding of visually identified blood in the urine is a common finding in patients with bladder cancer. For those patients, it is often standard practice to perform additional diagnostic procedures to diagnose bladder cancer. However, readily identifying patients with microhematuria and understanding the implications of microhematuria in urothelial carcinomas, remained a problem.
[0010] We herein provide improved methods for determining whether a patient presenting with either macrohematuria or microhematuria could avoid invasive and expensive further clinical procedures to detect urothelial carcinomas (UC) including bladder cancer, if such patient is at a sufficiently low probability of having bladder cancer to warrant not carrying out additional procedures.
[0011] Factors attributable to high probability of urothelial carcinoma (UC) are described. Demographic factors such as gender, race and age in addition to environmental factors such as smoking history and occupational exposure to aromatic amines contribute significantly to the risk of developing UC. Characterization of patients in healthcare assessment based on these factors is used routinely on an ad-hoc basis. For example, it is well accepted that a 60 year old male with smoking history presenting with hematuria has a higher probability of being positive for UC than a 35 year old non-smoking female presenting with the same symptoms, however these differences have not been quantitated to contribute to the overall probability of the patient having UC. Attribution of specific weights to various genotypic and phenotypic factors and combining these with a diagnostic test output can add significantly to the accuracy of the diagnostic power of non-invasive tests and provide clinicians with greater certainty in segregating patients on the basis of their probability of having UC as defined by the clinical and biomarker test results.
[0012] Although there are methods available to detect the presence of bladder cancer, there are no reliable and accurate methods to determine whether a patient does not have, or is at low risk of having bladder cancer. To address this need, we have developed new analytical methods for distinguishing between cancerous conditions from non-cancerous ones in patients presenting with hematuria, either macrohematuria or microhematuria. In some aspects of this invention, we combine quantified phenotypic variables and quantified expression of genetic markers to form a combined segregation index (the "G+P INDEX") in order to effectively triage out AH patients with a low probability of having UC from those AH patients that have high probability of UC. This segregation defines those that don't need a complete urological workup from those that do require a complete workup and thereby avoids unnecessary work-ups on patients of low probability of UC.
[0013] Phenotypic Assays
[0014] Phenotypic variables evaluated in the G+P INDEX include frequency of hematuria (HFREQ), age, gender, smoking history, and red blood count (RBC). These terms are defined herein below. Phenotypic variables are defined herein to include clinical findings and observations.
[0015] Genotypic Assays
[0016] In general, preferred genotypic assays developed by Pacific Edge Ltd. include quantification of expression of the genetic markers CDC2, HOXA13, MDK and IGFBP5 (a "4-marker assay"). In another preferred assay, the above 4 markers and a fifth marker, IL8R, is quantified (a "5-marker" or Cxbladder.RTM. assay; a trademark of Pacific Edge Ltd., Dunedin, New Zealand) (Holyoake A, O'Sullivan P, Pollock R et al: Development of a multiplex RNA urine test for the detection and stratification of transitional cell carcinoma of the bladder. Clin Cancer Res 2008; 14: 742, and O'Sullivan P, Sharples K, Dalphin M et al: A Multigene Urine Test for the Detection and Stratification of Bladder Cancer in Patients Presenting with Hematuria. J Urol 2012, Vol. 188 No 3; 746), and International Patent Application No. PCT/NZ2011/000238, entitled "Novel Markers for Detection of Bladder Cancer." Each of these publications and patent application are herein incorporated fully by reference as if separately so incorporated.
[0017] In preferred embodiments, a 4-marker assay can be performed on unfractionated urine using PCR amplification to quantify four mRNA markers (for CDC2, HOXA13, MDK and IGFBP5), which are overexpressed in urothelial carcinoma. IL8R is highly overexpressed in neutrophils and is consequently elevated in non-malignant inflammatory conditions. Inclusion of this 5th mRNA marker significantly reduced the risk of false positive detection of transitional cell carcinoma (TCC). From the patient's perspective, the test is non-invasive and very simple. A single sample of urine often mid-stream urine but not exclusively, is taken, and this can often be done at home without coming into the clinic.
[0018] The Cxbladder.RTM. assay has been shown to be considerably more sensitive than cytology in patients presenting with macroscopic hematuria. Most notably, the Cxbladder.RTM. assay achieved a sensitivity of 100% (at a pre-specified specificity of 85%) for all urothelial carcinomas with a stage greater than Ta, and 97% for all high-grade tumors. The Cxbladder.RTM. assay attributes a single value score that combines the quantitative gene expression of five genes represented in the patients urine. The score segregates patients into three classes based on the probability that the patient has a urothelial carcinoma.
[0019] For patients presenting with hematuria, (either macrohematuria or microhematuria), this invention has been shown to enhance these genotypic tools (either the 4-marker assay or Cxbladder.RTM. assay) with the addition of phenotypic variables collected from the patient over the same time period, and to combine these into a new tool, an index that can be used to segregate patients into three defined risk classes relative to the patient's probability of having urothelial carcinoma ("UC").
Aspects
[0020] Aspects of this invention are illustrated below. It can be understood that these are not the only aspects or embodiments of this invention. Persons of ordinary skill can combine one or more aspects together to produce additional aspects or embodiments.
[0021] One aspect includes a method for determining, in a patient presenting with hematuria, or the level of risk for having urothelial cancer, comprising:
[0022] providing a sample of urine from said patient;
[0023] quantifying a value, MI, comprising quantifying the levels of expression of human MDK, CDC2, HOXA13, and IGFBP5 in said sample;
[0024] assessing the phenotypic variables HFREQ, AgeGT, sex, SMK, and RBC of said patient;
[0025] calculating G+P INDEX according to either:
G+P INDEX=(1*HFREQ+3*Gender+4*SMK)+(5*M1+2*IL-8), or formula (i),
G+P INDEX=(w1*HFREQ+w2*AgeGT50+w3*Gender+w4*SMK+w5*RBC)+(w6*M1+w7*IL-8), or formula (ii),
G+P INDEX=-8.46+0.79 IGF-1.60 HOXA+2.10 MDK+0.95 CDC 0.38 IL8R+0.98 SNS+0.56 Hfreq+1.11 Gender+0.64 Age; and formula (iii),
[0026] determining whether the G+P INDEX is greater than a threshold indicating the level of risk that the patient has urothelial cancer.
[0027] Additional aspects include the method of the other aspect, where said threshold is selected from the group of G+P INDEX values of from 0 to 5, from 6 to 10, or from 11-15, where said value of from 0 to 5 indicates Low Risk, 6 to 10 indicates Moderate Risk, and 11-15 indicates High Risk.
[0028] Further aspects include the method of any other aspect, where if said threshold is a G+P INDEX value of from 6-10, said patient undergoes additional clinical or laboratory tests.
[0029] Yet further aspects includc the method of any prior aspect, where if said threshold is a G+P INDEX value of from 11-15, said patient undergoes additional clinical or laboratory tests.
[0030] Still further aspects include the method of any other aspect, where if said threshold is a G+P INDEX value of from 0-5, the patient is placed on a watch list for further clinical or laboratory tests.
[0031] Additional aspects include the method of any other aspect, where the threshold is established using a statistical method.
[0032] Still further aspects include the method of any other aspect, wherein the statistical method is any one of Linear Discriminant Analysis (LDA), Logistic Regression (Log Reg), Support Vector Machine (SVM), K-nearest 5 neighbors (KN5N), and Partition Tree Classifier (TREE).
[0033] Additional aspects include the method of any other aspect, further comprising quantifying expression of one additional genotypic marker selected from FIG. 6 or FIG. 7.
[0034] Other aspects include the method of any previous aspect, where said step of quantifying genetic expression is carried out by detecting the levels of mRNA.
[0035] Further aspects include the method of any other aspect, wherein said step of quantifying genetic expression is carried out by detecting the levels of cDNA.
[0036] Yet further aspects include the method of any of any other aspect, where said step of quantifying genetic expression is carried out using an oligonucleotide complementary to at least a portion of said cDNA.
[0037] Additional aspects include the method of any other aspect, where said step of quantifying genetic expression is carried out using qRT-PCR method using a forward primer and a reverse primer.
[0038] Yet additional aspects include the method of any other aspect, where said step of quantifying genetic expression is carried out by detecting the levels of a protein.
[0039] Still other aspects include the method of any other aspect, where said step of quantifying genetic expression is carried out by detecting the levels of a peptide.
[0040] Additional aspects include the method of any of any other aspect, where said step of quantifying genetic expression is carried out using an antibody directed against said marker.
[0041] Yet further additional aspects include the method of any of claim 1 to 8 or 13-15, where said step of quantifying genetic expression is carried out using a sandwich-type immunoassay method, or using an antibody chip.
[0042] Still further aspects include the method of any other aspect, where said quantifying genetic expression is carried out using a monoclonal antibody.
[0043] Other aspects include the method any of any other aspect, where said quantifying genetic expression is carried out using a polyclonal antiserum.
G+P INDEX
[0044] Phenotypic and genotypic variables described above are combined into a G+P INDEX according to the following relationship:
G+P INDEX=(w1*HFREQ+w2*AgeGT50+w3*Gender+w4*SMK+w5*RBC)+(w6*M1+w7*IL-8),
where HFREQ means the frequency of finding 3 or more red blood cells per high power field in a 6-month period; if frequency is low then HFREQ=0, and if higher than 3 red blood cells per high power field, then 1. AgeGT50 refers to subject's age, if greater than 50 years then AgeGT50=1, and if less than 50 years, then 0. Gender is assigned a value of 1 for male, and 0 for female. SMK means whether the subject is a current or ex-smoker; if non-smoker then SMK=0 and if a smoker, then 1. RBC means red blood cell count; if 25 or more then RBC is set to 1, and if less than 25, then 0. MI is a combination of expression of the genetic markers MDK, CDC, IGFBP5, and HOXA13; if M1>4.5 then set it to 1, if less than 4.5, 0. IL-8 refers to expression level of RNA for IL-8; if IL-8>2.5 then IL-8 is set to 1, if less than 2.5, 0. The symbols "*" means the multiplication operator, and weighting factors, w1-w7 are respectively the weights assigned to each of the variables listed above in the G+P INDEX.
[0045] In other preferred embodiments, (AgeGT50 and RBC) may be dropped from the model as shown below:
G+P INDEX=(1*HFREQ+3*Gender+4*SMK).+-.(5*M1+2*IL-8)
[0046] The G+P INDEX produces a value between 0 and 15. A patient with G+P INDEX value of 11 to 15 is considered to be at "High Risk" for bladder cancer, and indicates the need for additional work up for bladder cancer. A patient with a G+P INDEX value of 6 to 10 is considered to be at "Moderate Risk" for developing bladder cancer, and additional work up is indicated. A patient with a G+P INDEX of 0 to 5 is considered to be at "Low Risk" for developing bladder cancer. Patients in the "Low Risk" group are placed on a watchful waiting list, and if additional symptoms appear, or if recurrent episodes of microhematuria occur, they are reevaluated for possible further work up.
[0047] As described more fully in Example 3 (FIGS. 18 and 19), we found that the ROC curve for the quantified phenotypic variables alone produced a modest level of diagnostic power. The ROC curve for the quantified genotypic markers alone produced a significant level of diagnostic power. We found an unexpectedly better diagnostic power when both genotypic and phenotypic variables were combined into a G+P INDEX.
[0048] Quantification of Genetic Expression
[0049] Proteins or nucleic acids that are secreted by or cleaved from the cell, or lost by apoptotic mechanisms, either alone or in combination with each other, have utility as serum or body fluid markers for the diagnosis of disease, including inflammatory disease in bladder and/or bladder cancer or as markers for monitoring the progression of established disease. Detection of protein and cell markers can be carried out using methods known in the art, and include the use of RT-PCT, qRT-PCR, monoclonal antibodies, polyclonal antisera and the like.
[0050] Specifically the present invention provides methods for triaging patients presenting with hematuria, (either macrohematuria or microhematuria), comprising: (i) providing a biological sample; (ii) detecting one or more bladder tumor markers (BTMs) in said sample. Bladder tumor markers of particular interest include MDK, CDC2, HOXA13, and IGFBP5 (a "4-marker assay"). Optionally, one can also detect the levels of human neutrophil marker interleukin 8 receptor B (IL8Rb) in the sample (Cxbladder.RTM. assay). The presence of cancer can be established by comparing the levels of the one or more BTMs with the levels in normal patients, patients having early stage bladder cancer, and/or patients having an inflammatory disease. For example, the presence of cancer can be established by comparing the expression of BTMs against a threshold of expression. The threshold may be in the order of expression that is at least 1.1, 1.2, 1.3, 1.4, 1.5, 1.6, 1.7, 1.8, 1.9, 2, 3, 4, 5, 6, 7, 8, 9, or 10, 100, 1000, or up to 10,000 times the level of expression in a group of patients not having cancer. In other aspects, a high expression of IL8Rb without altered expression of a bladder tumor marker can be indicative of an inflammatory disease rather than cancer.
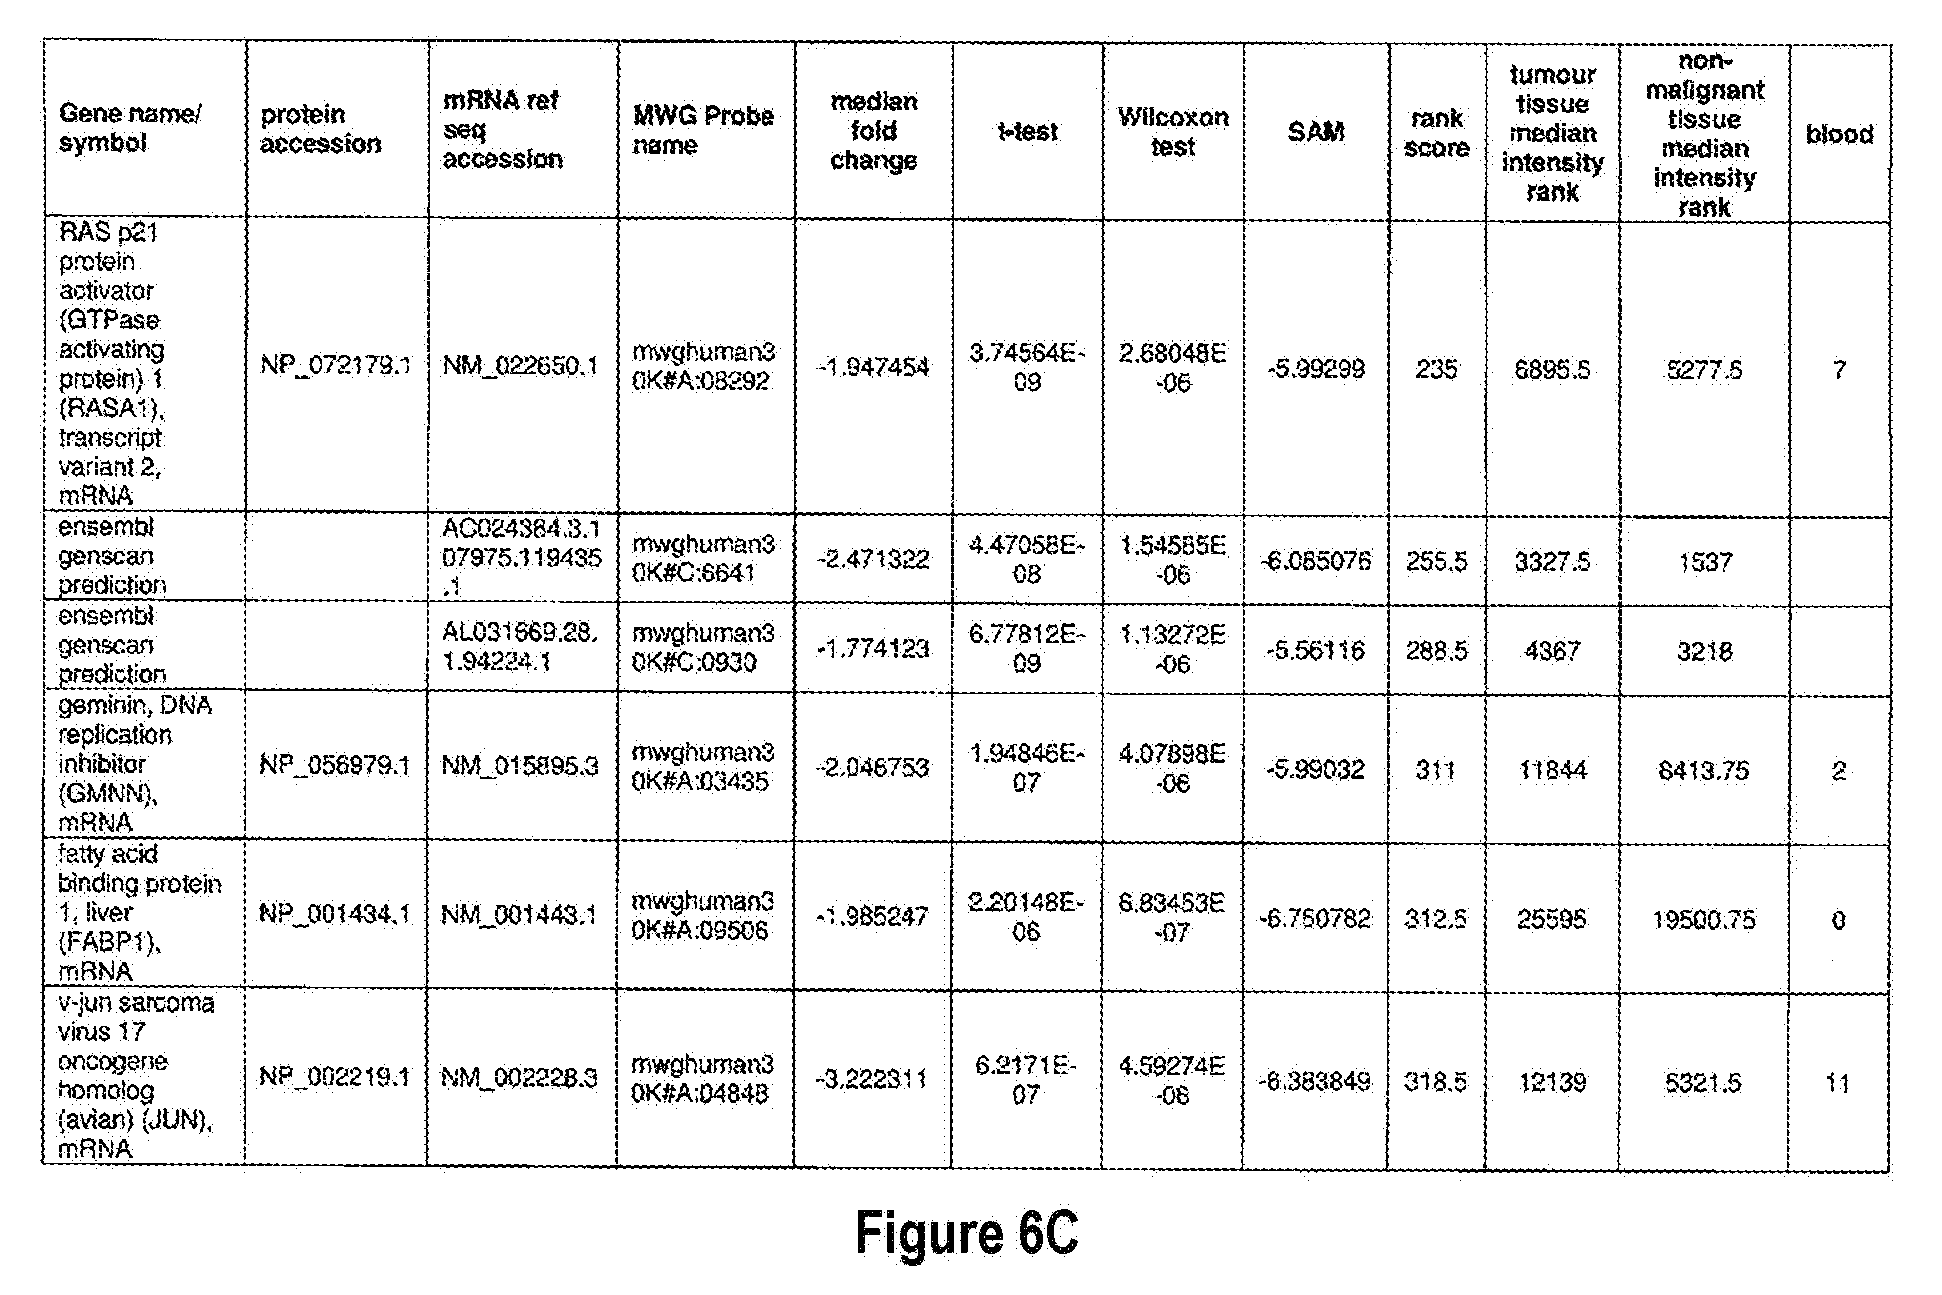
[0051] The methods of the present invention can be used in conjunction with any suitable marker for detecting bladder cancer. Examples of suitable markers for use in the invention are outlined in FIG. 6 or 7. The present invention includes the use of any one or more of the markers outlined in FIG. 6 or 7.
[0052] Optionally, in other preferred embodiments, the present invention can include any combination of IL8Rb with one or more of the markers MDK, CDC2, HOXA13, and IGFBP5, which can also be in combination with one or more other marker suitable for detecting bladder cancer, for example, any one of more of the markers outlined in FIG. 6 or 7. More specifically, the present invention includes quantification of expression of any one or more combination of markers: IL8Rb/MDK, IL8Rb/CDC2, IL8Rb/HOXA13, IL8Rb/IGFBP5, IL8Rb/MDK/CDC2, IL8Rb/MDK/HOXA13, IL8Rb/MDK/IGFBP5, IL8Rb/CDC2/HOXA13, IL8Rb/CDC2/IGFBP5, IL8Rb/HOXA13/IGFBP5, IL8Rb/MDK/CDC2/HOXA13, IL8Rb/MDK/CDC2/IGFBP5, IL8Rb/CDC2/HOXA13/IGFBP5, and IL8Rb/MDK/CDC2/HOXA13/IGFBP5. These combinations can optionally include one or more further markers suitable for detecting bladder cancer, for example any one of more of the markers outlined in FIG. 6 or 7.
[0053] The present invention also provides for a method for detecting inflammatory conditions of the bladder, comprising: (i) providing a biological sample from a patient; and (ii) detecting the levels of human neutrophil marker interleukin 8 receptor B (IL8Rb) in said sample. The presence of inflammatory conditions of the bladder is established by comparing the levels of IL8Rb with the levels in normal patients, patients having hematuria, and patients having an inflammatory condition of the bladder. For example, the presence of an inflammatory condition of the bladder can be established by comparing the expression of the marker IL8Rb against a threshold, The threshold may be in the order of expression that is at least 1.1, 1.2, 1.3, 1.4, 1.5, 1.6, 1.7, 1.8, 1.9, 2, 3, 4, 5, 6, 7, 8, 9, 10, 100, 1000, or up to 10,000 times the level of expression in another group of patients.
[0054] Preferred genotypic methods of the present invention can be carried out by detecting any suitable marker of gene expression, for example determining the levels of mRNA, cDNA, a protein or peptide utilizing any suitable method.
[0055] The establishment of a diagnosis can be established through the use classifier system, for example Linear Discriminant Analysis (LDA), Logistic Regression (Log Reg), Support Vector Machine (SVM), K-nearest 5 neighbors (KN5N), and Partition Tree Classifier (TREE).
BRIEF DESCRIPTION OF THE FIGURES
[0056] This invention is described with reference to specific embodiments thereof and with reference to the figures (the same as FIG., Fig., and Figure), in which:
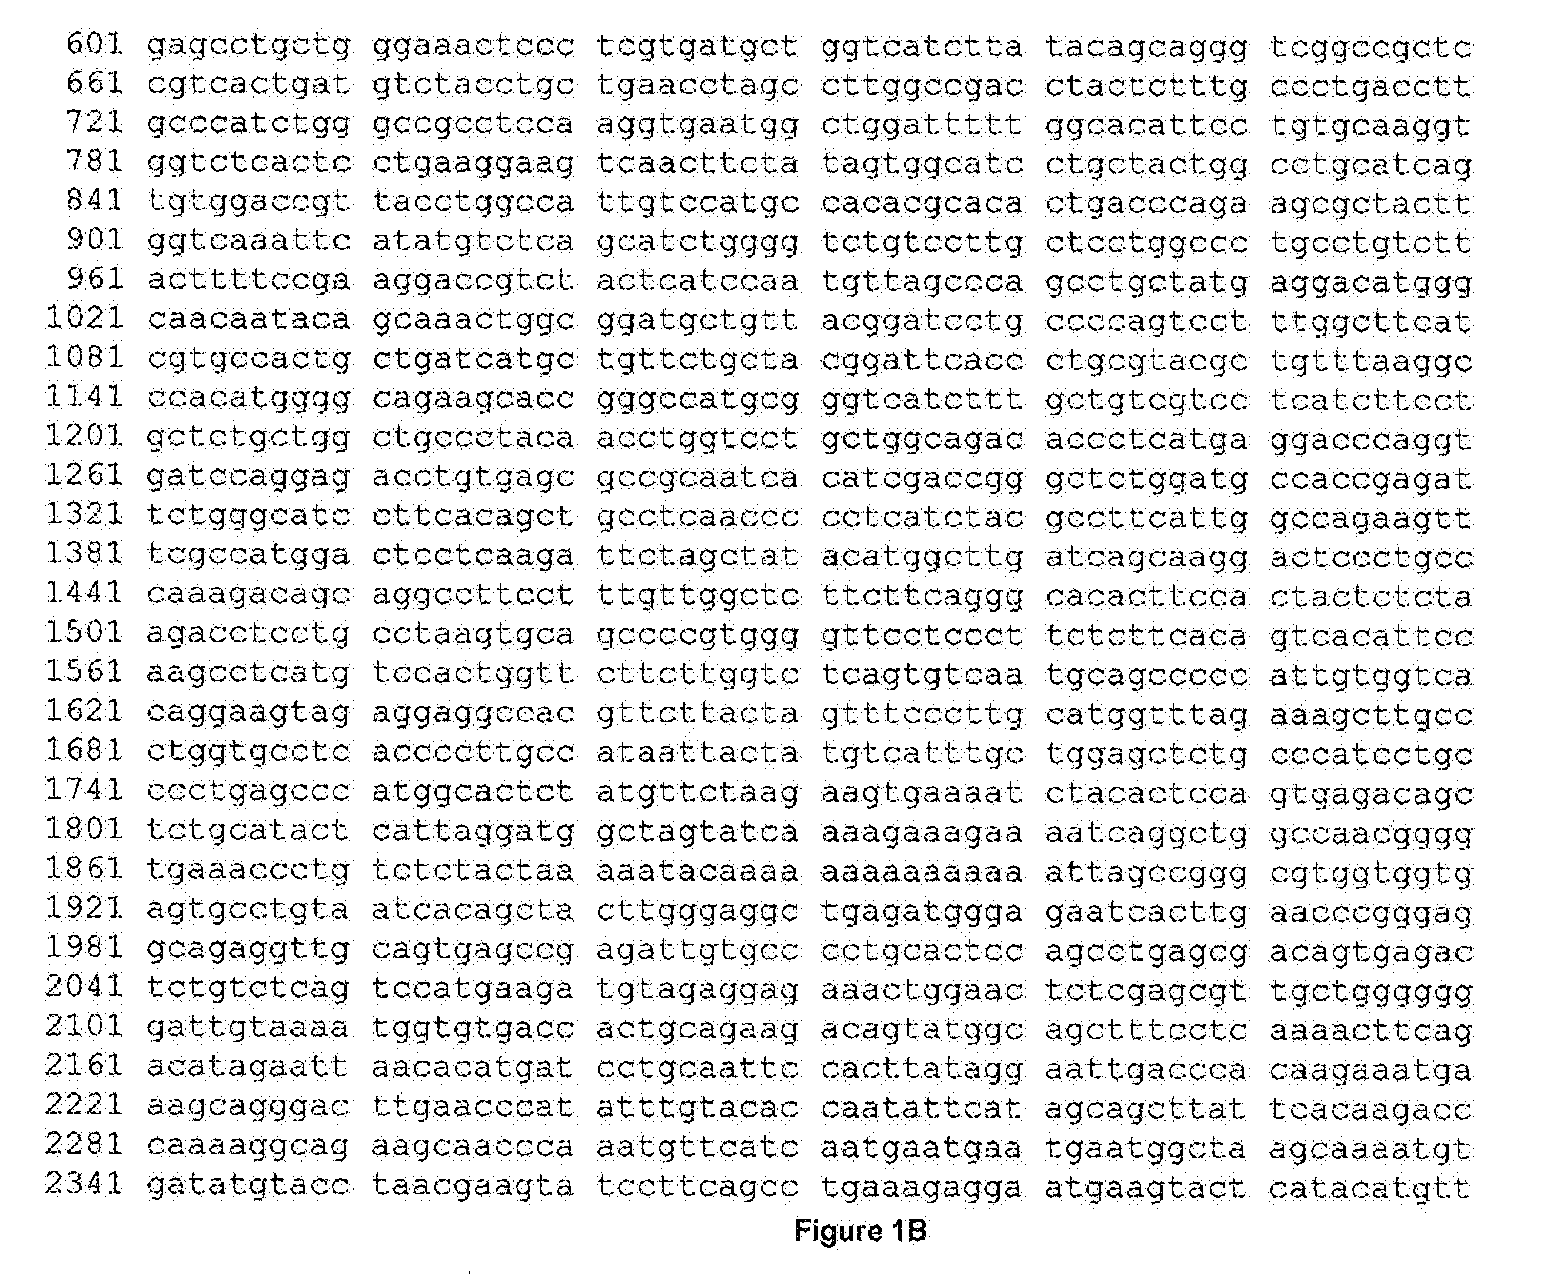
[0057] FIGS. 1A, 1B, and 1C depict protein and cDNA sequences of IL8Rb (also known as CXCR2).
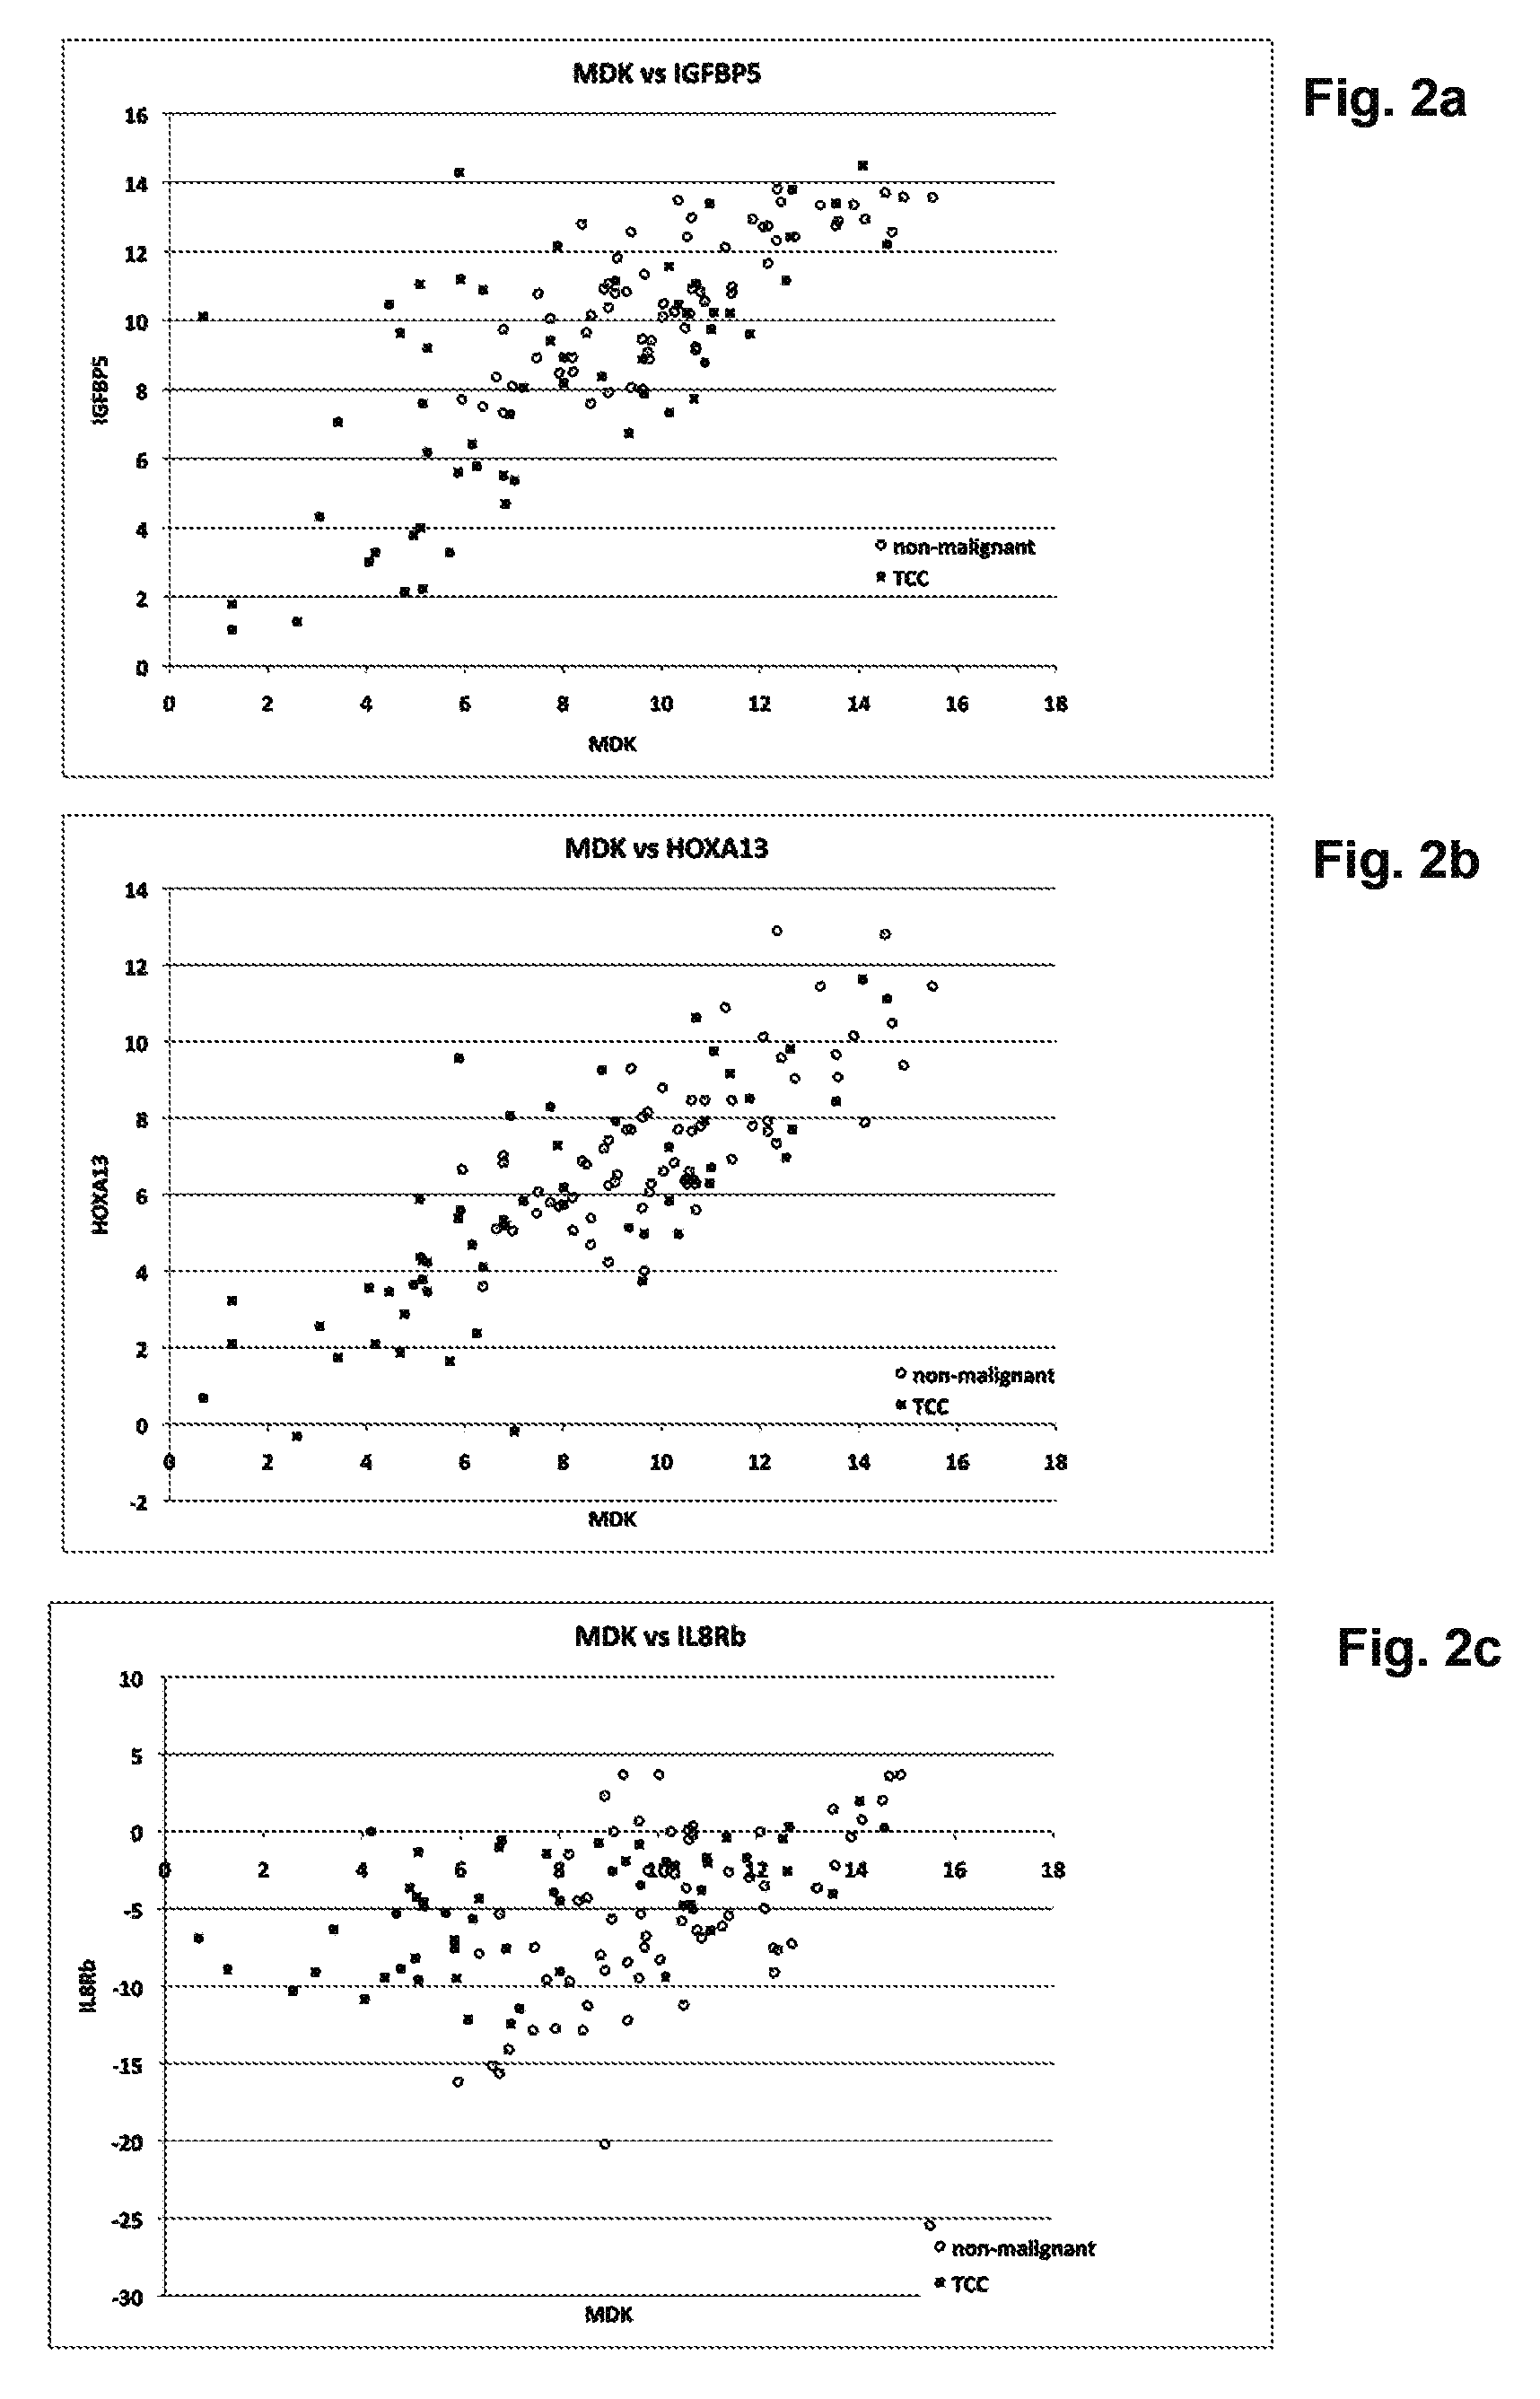
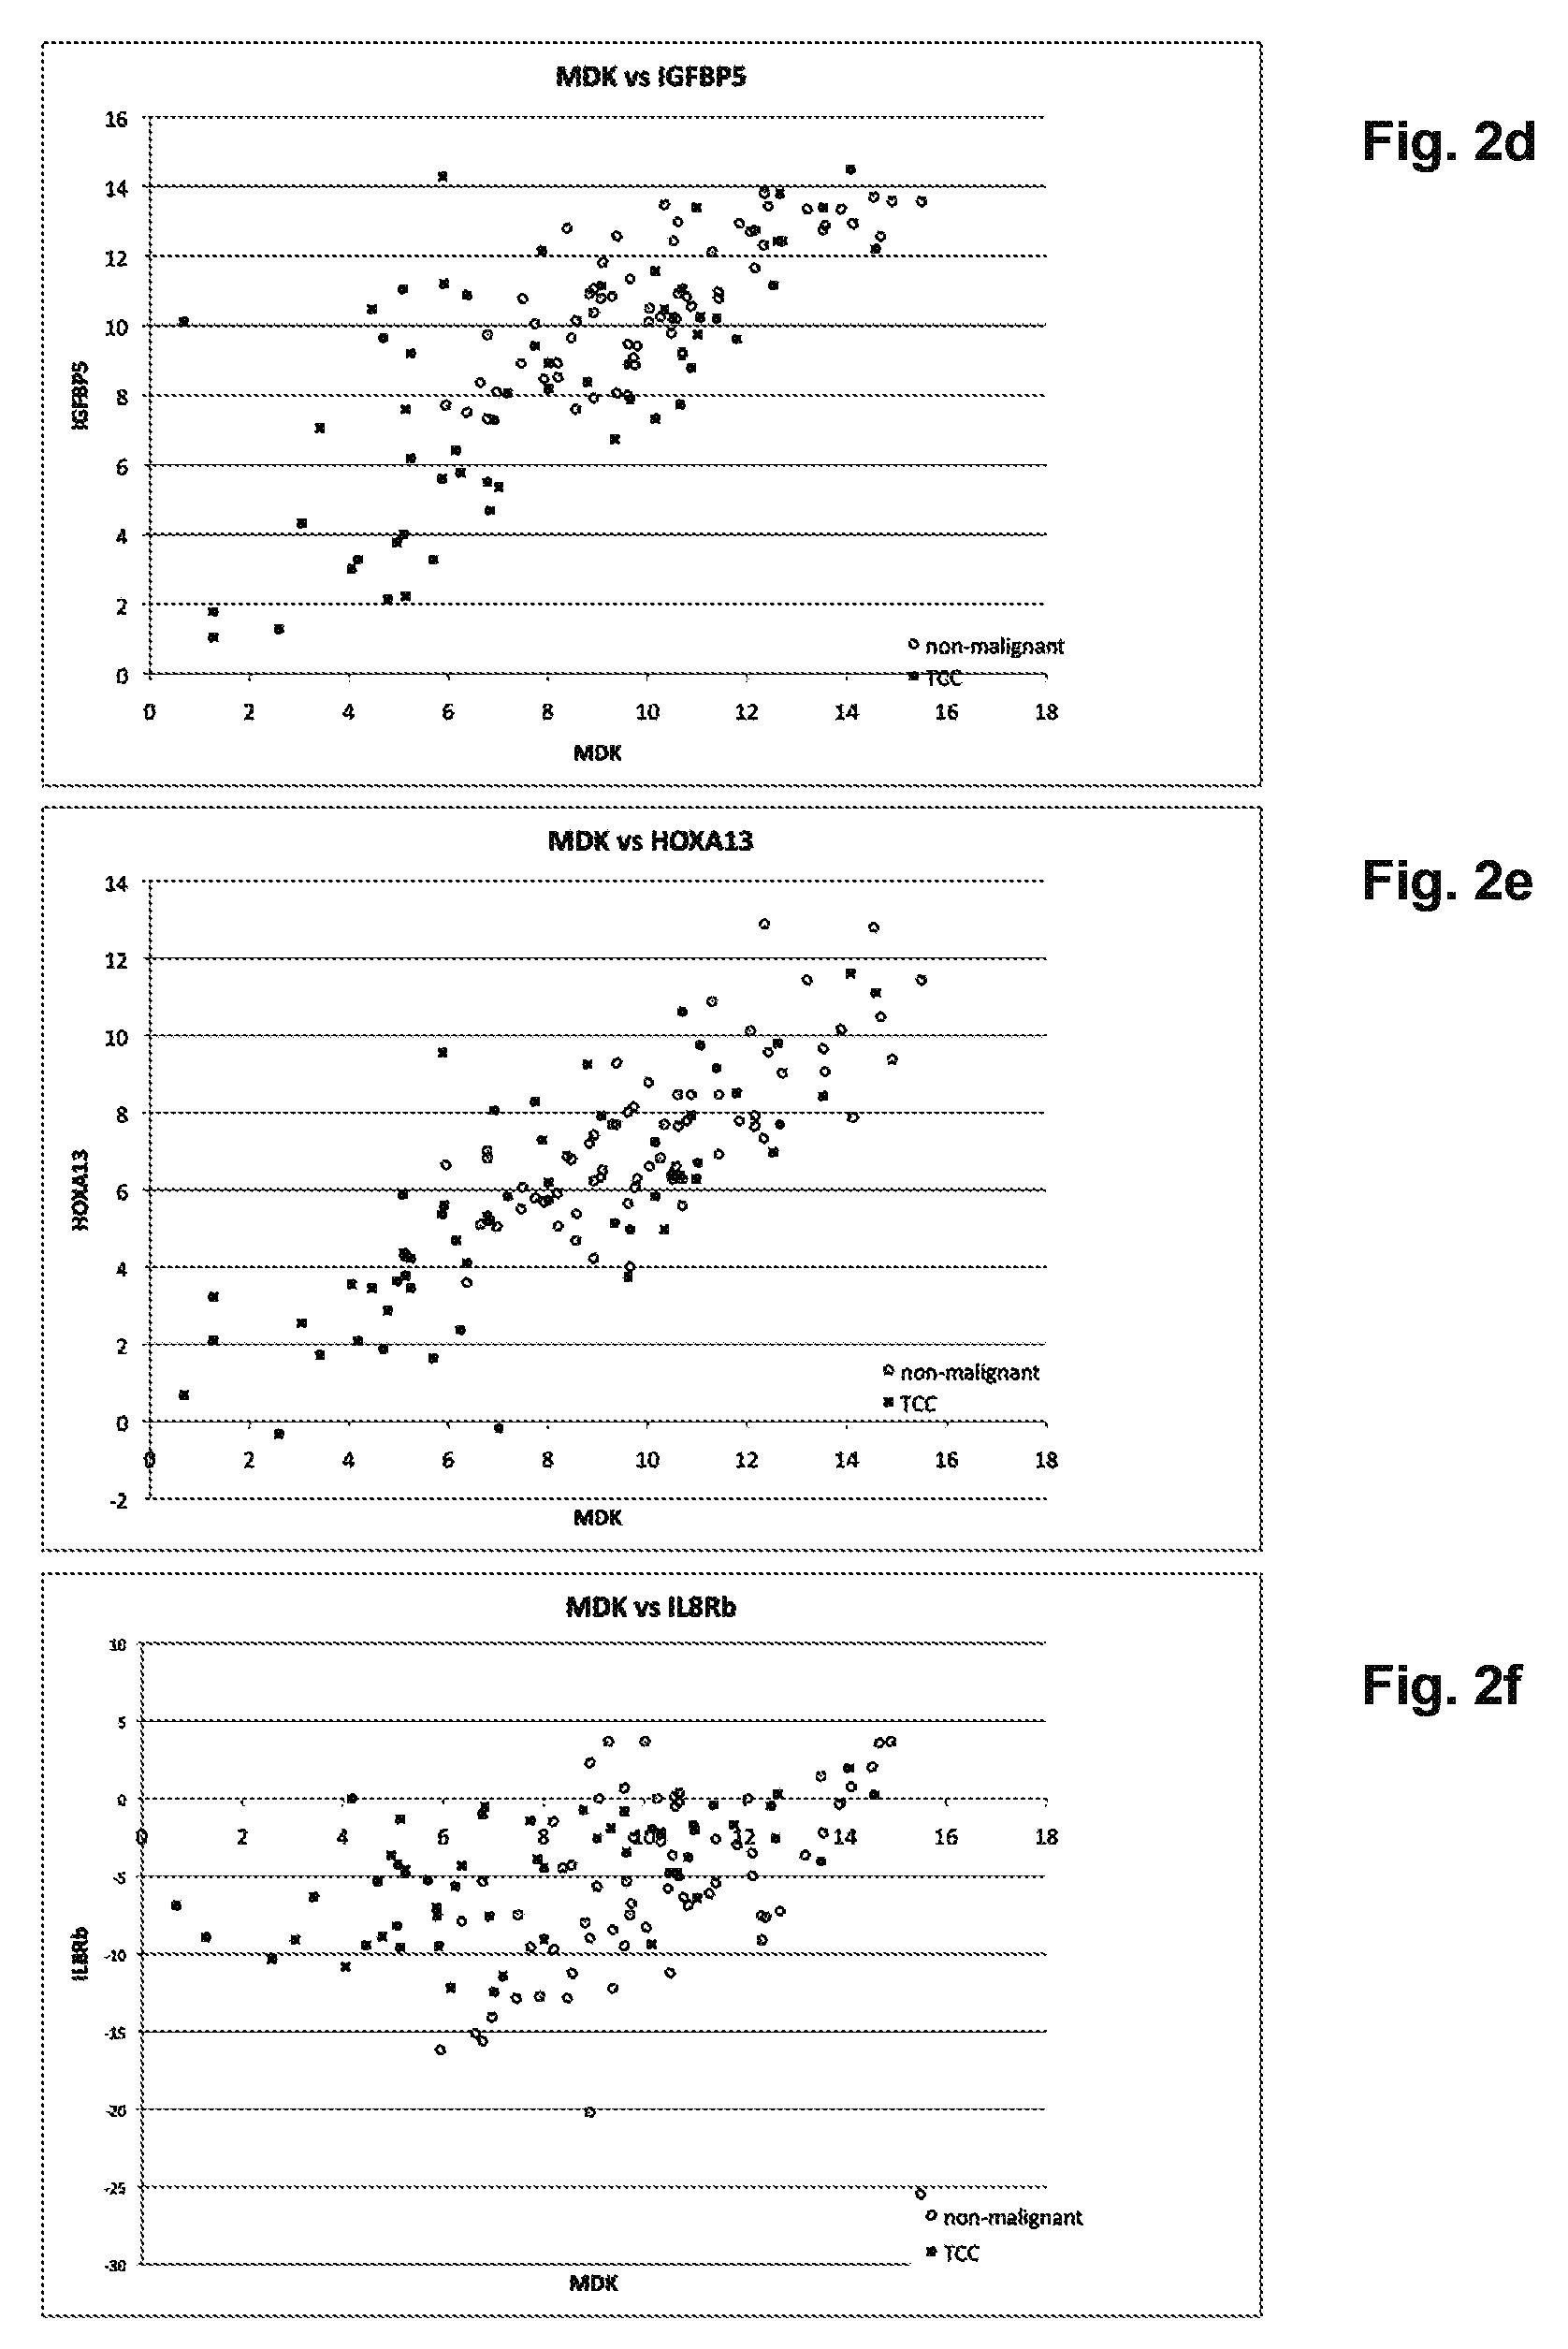
[0058] FIGS. 2A-2F depict graphs of scatter plots showing the effect of IL8Rb on the separation of TCC from non-malignant disease (prostate disease, cystitis, urinary tract infection and urolithiasis). IL8Rb has been substituted for different bladder cancer RNA markers in FIGS. 2C and 2F.
[0059] FIG. 2A. MDK/IGFBP5;
[0060] FIG. 2B. MDK/HOXA13;
[0061] FIG. 2C. MDK/IL8Rb;
[0062] FIG. 2D. CDC2/IGFBP5;
[0063] FIG. 2E. CDC2/HOXA13;
[0064] FIG. 2F. CDC2/IL8Rb.
[0065] FIGS. 3A-3B depict ROC curve analysis (sensitivity vs specificity) showing the effect of including IL8Rb in diagnostic algorithms derived using linear discriminate analysis (LD) and linear regression (LR). The ROC curves were derived from patients with TCC and upper urinary tract cancers (n=61), and the non-malignant diseases cystitis, urinary tract infection and urolithiasis (n=61).
[0066] FIG. 3A. LD1 (solid) and LD2 (dashed).
[0067] FIG. 3B. LR1 (solid) and LR2 (dashed). IL8Rb is included in LD2 and LR2.
[0068] FIGS. 4a and 4b depict extended ROC curve analysis showing the effect of including IL8Rb in diagnostic algorithms derived using linear discriminate analysis (LD) and linear regression (LR). The ROC curves are derived from patients with TCC (n=56) and, unlike FIG. 3, any non-malignant disease in the cohort (n=386).
[0069] FIG. 4a. LD1 (solid) and LD2 (dashed).
[0070] FIG. 4b. LR1 (dashed) and LR2 (solid). IL8Rb is included in LD2 and LR2.
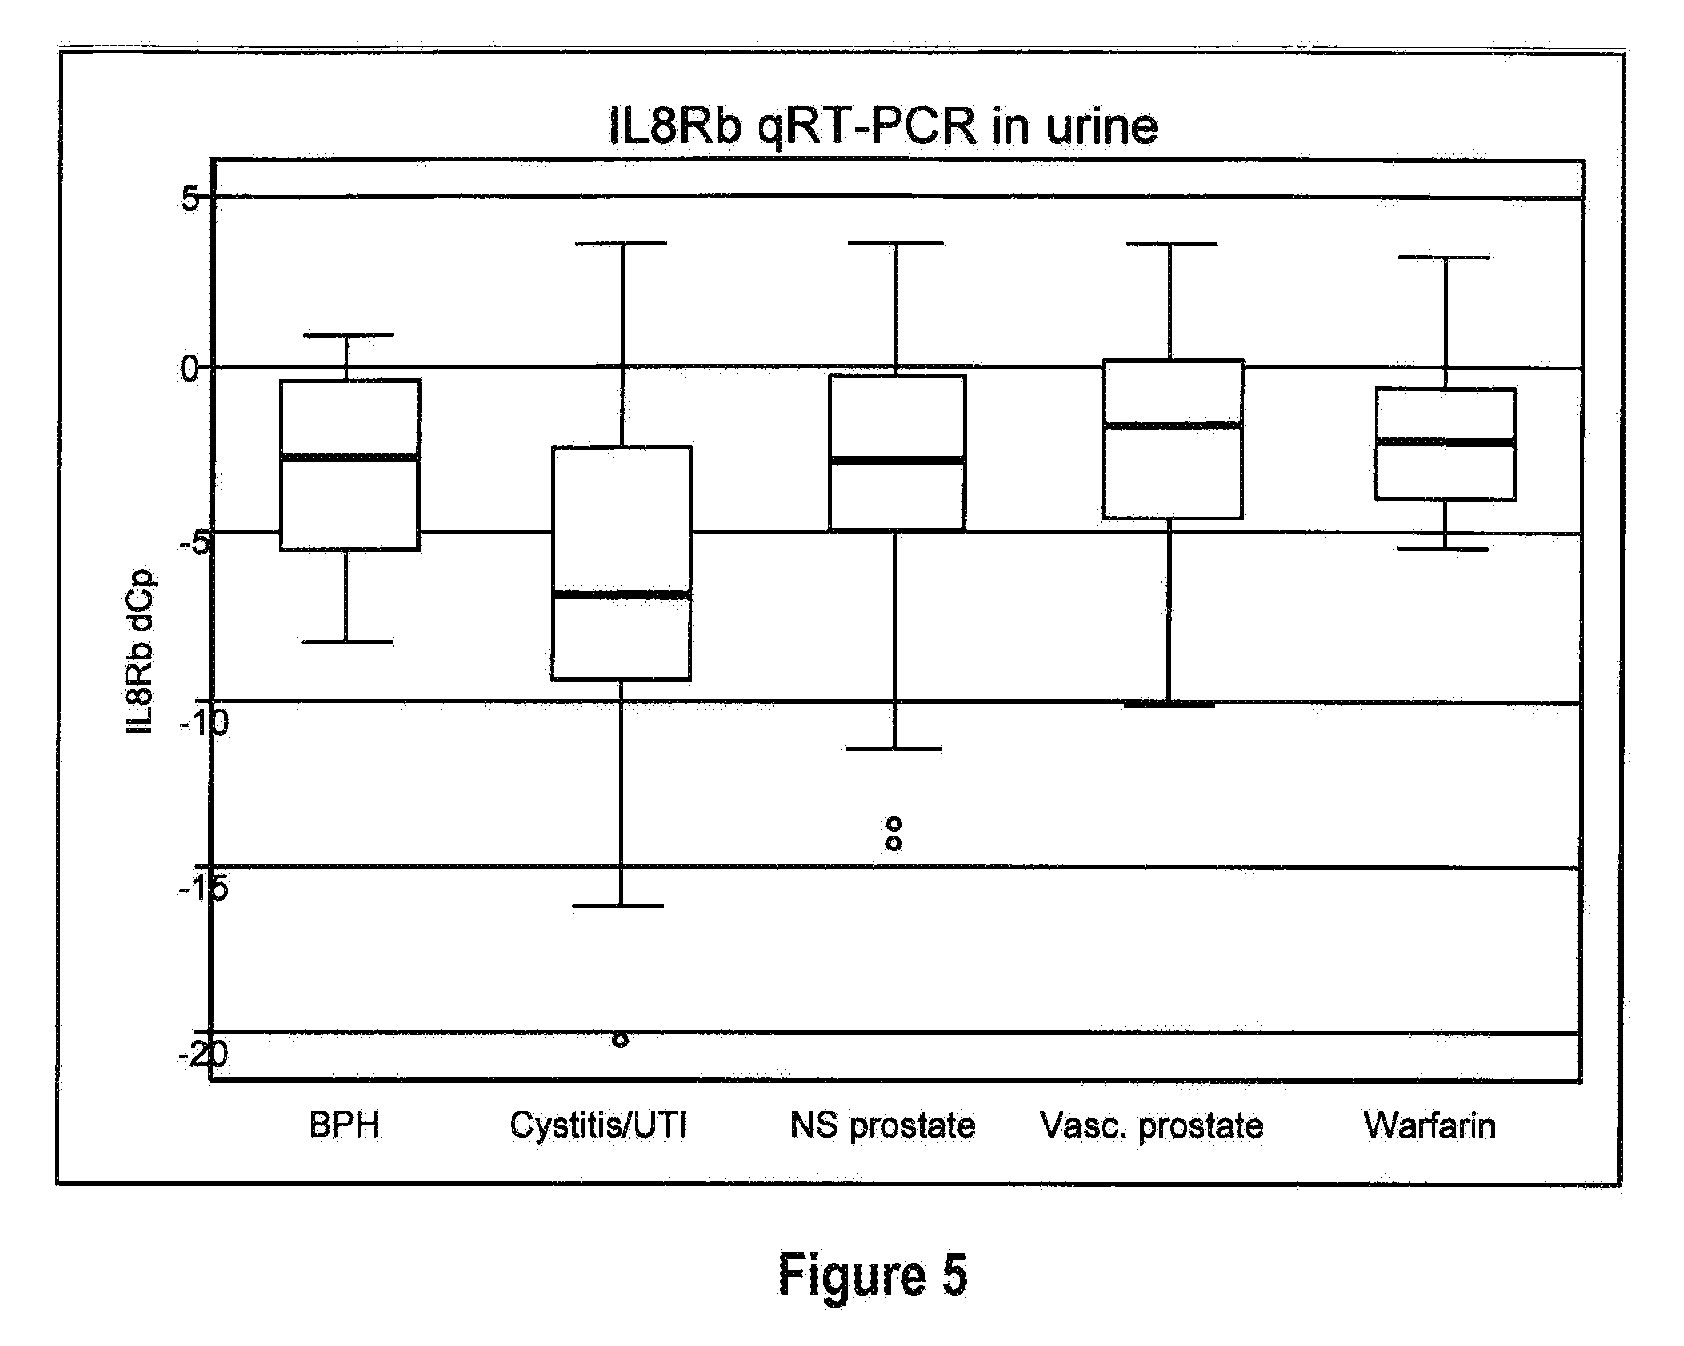
[0071] FIG. 5 depicts box plots showing the accumulation of IL8Rb mRNA in the urine of patients with non-malignant urological disease. The RNA has been quantified by qRT-PCR using the delta-Ct method (Holyoake et al, 2008). With this method a lower Ct reflects higher RNA levels. BPH: benign prostatic hyperplasia; UTI: urinary tract infection; NS prostate: non-specific prostate diseases; Vasc. Prostate: vascular prostate; warfarin: hematuria secondary to warfarin use. The observations in patients with cystitis/UTI are significantly different (p=0.001) to the other non-malignant presentations shown.
[0072] FIGS. 6A-6YY depict markers known to be over expressed in bladder cancer, and are suitable for use in the present invention.
[0073] FIGS. 7A-7D depict markers known to be under expressed in bladder cancer, and are suitable for use in the present invention.
[0074] FIG. 8 depicts a flow chart for the patient recruitment procedures and numbers for Example 2.
[0075] FIG. 9 depicts baseline clinical and demographic characteristics of the patients by disease status at 3 months.
[0076] FIG. 10 depicts overall sensitivity and specificity of the urine tests.
[0077] FIGS. 11A-11B depict various ROC curves;
[0078] FIG. 11A depicts ROC curves for NMP22 ELISA and uRNA-D (test comprising the four markers MDK+CDC2+IGFBP5+HOXA13); and
[0079] FIG. 11B depicts ROC curve for the five markers MDK, CDC2, HOXA13, IGFBP5 and IL8Rb.
[0080] FIG. 12 depicts the sensitivity of urine tests by stage, grade, location of tumour, multiplicity of tumor, hematuria status, creatinine of urine sample and sex. Tables show numbers and percent with a positive urine test among those with TCC.
[0081] FIG. 13 depicts specificity of urine tests by diagnosis, macrohematuria or, creatinine and sex. Tables show number and % with a negative urine test result among those without TCC.
[0082] FIGS. 14A(I)-14O(V): depict ROC curves for the combinations of markers:
[0083] FIGS. 14A(I)(-14A(V): MDK,
[0084] FIGS. 14B(I)-14B(V): CDC,
[0085] FIGS. 14C(I)-14C(V): IGFBP5,
[0086] FIGS. 14D(I)-14D(V): HOXA13,
[0087] FIGS. 14E(i)-14E(v): MDK+CDC2,
[0088] FIGS. 14F(i)-14F(v): MDK+IGFBP5,
[0089] FIGS. 14G(i)-14G(v): MDK+HOXA13,
[0090] FIGS. 14H(I)-14H(V): CDC2+IGFBP5,
[0091] FIGS. 14I(I)-14I(V): CDC+HOXA13,
[0092] FIGS. 14J(I)-16J)V): IGF+HOXA13,
[0093] FIGS. 14K(I)-14K(V): MDK+CDC2+IGFBP5,
[0094] FIGS. 14L(I)-14L(V): MDK+CDC2+HOXA13,
[0095] FIGS. 14M(I)-14M(V): MDK+IGFBP5+HOXA13,
[0096] FIGS. 14N(I)-14N(V): CDC2+IGFBP5+HOXA13,
[0097] FIGS. 14O(I)-14O(V): MDK+CDC2+IGFBP5+HOXA13, plus or minus IL8Rb, using five different classifier models (i) Linear Discriminant Analysis (LDA), (ii) Logistic Regression (Log Reg), (iii) Support Vector Machine (SVM), (iv) K-nearest 5 neighbors (KN5N), and (v) Partition Tree Classifier (TREE).
[0098] FIGS. 15A-15B depict results of sensitivity selectivity studies.
[0099] FIG. 15A depicts "Area Under the Curve" (AUC) for up to 20% false positive rate (at 80% specificity) of the ROC curves from FIG. 14 and
[0100] FIG. 15B shows the difference the AUC resulting from the inclusion of IL8Rb.
[0101] FIGS. 16a-16e depict graphs of the sensitivity of the combinations of the four markers MDK, CDC2, IGFBP5, and HOXA13, plus or minus IL8Rb, using five different classifier models (i) Linear Discriminant Analysis (LDA), (ii) Logistic Regression (Log Reg), (iii) Support Vector Machine (SVM), (iv) K-nearest 5 neighbors (KN5N), and (v) Partition Tree Classifier (TREE), at different set specificities; (a) 80%, (b) 85%, (c) 90%, (d) 95%, (e) 98%.
[0102] FIGS. 17a-17j depict the gains in sensitivity from adding IL8Rb at different set specificities FIG. 17a 80%, FIG. 17b 85%, FIG. 17c 90%, FIG. 17d 95%, FIG. 17e 98%, and the resulting gains in specificity from adding IL8Rb at different set specificities FIG. 17f 80%, FIG. 17g 85%, FIG. 17h 90%, FIG. 17i 95%, FIG. 17j 98%.
[0103] FIG. 18 depicts ROC curves for testing of patients having hematuria studied using either genetic testing alone, phenotype evaluation alone, and/or both genetic testing and phenotypic evaluation.
[0104] FIG. 19 depicts a graph of odds ratios (horizontal axis) for variables gender, smoking history and HFREQNEW of this invention.
[0105] FIGS. 20A and 20B depict flow charts for standards of reporting diagnostic accuracy.
[0106] FIG. 20A depicts a flow chart for patients with macrohaematuria across all three cohorts in this study.
[0107] FIG. 20B depicts flow chart for reporting diagnostic accuracy in patients with microhematuria included in this study.
[0108] FIG. 21 depicts ROC curves representing the three classification models. P INDEX (dotted line), G INDEX (dashed line) and G+P INDEX (solid line).
[0109] FIG. 22 depicts NPV versus proportion of patients with haematuria testing negative according each model. P INDEX (dotted line), G INDEX (dashed line), and G+P INDEX (solid line).
[0110] FIG. 23 depicts a graph of the relationship between detect results (horizontal axis) versus Triage result (vertical axis).
[0111] FIG. 24 depicts a graph of G2 INDEX (horizontal axis) versus G1+P INDEX (vertical axis).
DETAILED DESCRIPTION
Definitions
[0112] Before describing the embodiments of the invention in detail, it will be useful to provide some definitions of terms as used herein.
[0113] The term "marker" refers to a molecule that is associated quantitatively or qualitatively with the presence of a biological phenomenon. Examples of "markers" include a polynucleotide, such as a gene or gene fragment, whether coding or non-coding, DNA or DNA fragment RNA or RNA fragment, whether coding or non-coding; or a gene product, including a polypeptide such as a peptide, oligopeptide, protein, or protein fragment; or any related metabolites, by products, or any other identifying molecules, such as antibodies or antibody fragments, whether related directly or indirectly to a mechanism underlying the phenomenon. The markers of the invention include the nucleotide sequences (e.g., GenBank sequences) as disclosed herein, in particular, the full-length sequences, any coding sequences, any fragments, any possible probes (e.g., created across an exon-exon boundary), including those with capture motifs, hairpins or fluorophores, or any complements thereof, and any measurable marker thereof as defined above.
[0114] As used herein "antibodies" and like terms refer to immunoglobulin molecules and immunologically active portions of immunoglobulin (Ig) molecules, i.e., molecules that contain an antigen binding site that specifically binds (immunoreacts with) an antigen. These include, but are not limited to, polyclonal, monoclonal, chimeric, single chain, Fc, Fab, Fab', and Fab.sub.2 fragments, and a Fab expression library. Antibody molecules relate to any of the classes IgG, IgM, IgA, IgE, and IgD, which differ from one another by the nature of heavy chain present in the molecule. These include subclasses as well, such as IgG1, IgG2, and others. The light chain may be a kappa chain or a lambda chain. Reference herein to antibodies includes a reference to all classes, subclasses, and types. Also included are chimeric antibodies, for example, monoclonal antibodies or fragments thereof that are specific to more than one source, e.g., a mouse or human sequence. Further included are camelid antibodies, shark antibodies or nanobodies.
[0115] The terms "cancer" and "cancerous" refer to or describe the physiological condition in mammals that is typically characterized by abnormal or unregulated cell growth. Cancer and cancer pathology can be associated, for example, with metastasis, interference with the normal functioning of neighboring cells, release of cytokines or other secretory products at abnormal levels, suppression or aggravation of inflammatory or immunological response, neoplasia, pre-malignancy, malignancy, invasion of surrounding or distant tissues or organs, such as lymph nodes, etc.
[0116] The term "tumor" refers to all neoplastic cell growth and proliferation, whether malignant or benign, and all pre-cancerous and cancerous cells and tissues.
[0117] The term "bladder cancer" refers to a tumor originating in the bladder. These tumors are able to metastasize to any organ.
[0118] The term "BTM" or "bladder tumor marker" or "BTM family member" means a tumor marker (TM) that is associated with urothelial cancers, bladder cancer, transitional cell carcinoma of the bladder (TCC), squamous cell carcinomas, and adenocarcinomas of the bladder. The term BTM also includes combinations of individual markers, whose combination improves the sensitivity and specificity of detecting bladder cancer. It is to be understood that the term BTM does not require that the marker be specific only for bladder tumors. Rather, expression of BTM can be altered in other types of cells, diseased cells, tumors, including malignant tumors.
[0119] The term "under expressing BTM" means a marker that shows lower expression in bladder tumors than in non-malignant bladder tissue.
[0120] The term "over expressing BTM" means a marker that shows higher expression in bladder tumors than in non-malignant tissue.
[0121] The terms "differentially expressed," "differential expression," and like phrases, refer to a gene marker whose expression is activated to a higher or lower level in a subject (e.g., test sample) having a condition, specifically cancer, such as melanoma, relative to its expression in a control subject (e.g., reference sample). The terms also include markers whose expression is activated to a higher or lower level at different stages of the same condition; in diseases with a good or poor prognosis; or in cells with higher or lower levels of proliferation. A differentially expressed marker may be either activated or inhibited at the polynucleotide level or polypeptide level, or may be subject to alternative splicing to result in a different polypeptide product. Such differences may be evidenced by a change in mRNA levels, surface expression, secretion or other partitioning of a polypeptide, for example.
[0122] Differential expression may include a comparison of expression between two or more markers (e.g., genes or their gene products); or a comparison of the ratios of the expression between two or more markers (e.g., genes or their gene products); or a comparison of two differently processed products (e.g., transcripts or polypeptides) of the same marker, which differ between normal subjects and diseased subjects; or between various stages of the same disease; or between diseases having a good or poor prognosis; or between cells with higher and lower levels of proliferation; or between normal tissue and diseased tissue, specifically cancer, or melanoma. Differential expression includes both quantitative, as well as qualitative, differences in the temporal or cellular expression pattern in a gene or its expression products among, for example, normal and diseased cells, or among cells which have undergone different disease events or disease stages, or cells with different levels of proliferation.
[0123] The term "expression" includes production of polynucleotides and polypeptides, in particular, the production of RNA (e.g., mRNA) from a gene or portion of a gene, and includes the production of a polypeptide encoded by an RNA or gene or portion of a gene, and the appearance of a detectable material associated with expression. For example, the formation of a complex, for example, from a polypeptide-polypeptide interaction, polypeptide-nucleotide interaction, or the like, is included within the scope of the term "expression". Another example is the binding of a binding ligand, such as a hybridization probe or antibody, to a gene or other polynucleotide or oligonucleotide, a polypeptide or a protein fragment, and the visualization of the binding ligand. Thus, the intensity of a spot on a microarray, on a hybridization blot such as a Northern blot, or on an immunoblot such as a Western blot, or on a bead array, or by PCR analysis, is included within the term "expression" of the underlying biological molecule.
[0124] The terms "gene expression threshold," and "defined expression threshold" are used interchangeably and refer to the level of a marker in question, outside which the expression level of the polynucleotide or polypeptide serves as a predictive marker for a condition in the patient. For example, the expression of IL8Rb above a certain threshold is diagnostic that the patient has an inflammatory condition. A threshold can also be used when testing a patient for suspected bladder cancer, using bladder cancer makers. Expression levels above a threshold indicates that the patient has an inflammatory bladder condition, likely to cause a false positive test for cancer, whereas an expression level of IL8Rb below a threshold is predictive that the patient does not have an inflammatory bladder condition. By including the measurement of IL8Rb any result from the expression of the bladder tumor markers can be relied upon if the levels of IL8Rb is below the threshold (i.e. a positive result is likely to be positive for the patient having cancer rather than increased levels of the bladder tumor markers actually resulting from exfoliation of non-malignant cells from the mucosa from inflammation).
[0125] The term "diagnostic threshold" refers to a threshold in which a patient can be said to have been diagnosed either with or without a given condition, for example bladder cancer. A diagnostic threshold is generally set to achieve a desired sensitivity and specificity, depending on factors such as population, prevalence, and likely clinical outcome. In general the diagnostic threshold can be calculated and/or established using algorithms, and/or computerized data analysis.
[0126] The exact threshold will be dependent on the population and also any model being used to predict disease (predictive model). A threshold is established experimentally from clinical studies such as those described in the Examples below. Depending on the prediction model used, the expression threshold may be set to achieve maximum sensitivity, or for maximum specificity, or for minimum error (maximum classification rate). For example a higher threshold may be set to achieve minimum errors, but this may result in a lower sensitivity. Therefore, for any given predictive model, clinical studies will be used to set an expression threshold that generally achieves the highest sensitivity while having a minimal error rate.
[0127] The term "sensitivity" means the proportion of individuals with the disease who test (by the model) positive. Thus, increased sensitivity means fewer false negative test results.
[0128] The term "specificity" means the proportion of individuals without the disease who test (by the model) negative. Thus, increased specificity means fewer false positive test results.
[0129] The term "Receiver Operating Characteristic" ("ROC curve") means a plot of the true positive rate (sensitivity) against the false positive rate (specificity) for different cut off points for a particular marker or test. Each point on the ROC curve represents a specific sensitivity/specificity point that will correspond to a given threshold. ROC curves can be important to establish a threshold to give a desired outcome. The area under a ROC curve represents (expressed as an Area Under the Curve (AUC) analysis, can be a measure of how well a given marker or test consisting of a number of markers, can distinguish between two or more diagnostic outcomes. ROC curves can also be used to compare the accuracy of two different tests.
[0130] The term "oligonucleotide" refers to a polynucleotide, typically a probe or primer, including, without limitation, single-stranded deoxyribonucleotides, single- or double-stranded ribonucleotides, RNA: DNA hybrids, and double-stranded DNAs. Oligonucleotides, such as single-stranded DNA probe oligonucleotides, are often synthesized by chemical methods, for example using automated oligonucleotide synthesizers that are commercially available, or by a variety of other methods, including in vitro expression systems, recombinant techniques, and expression in cells and organisms.
[0131] The term "overexpression" or "overexpressed" refers to an expression level of a gene or marker in a patient that is above that seen in normal tissue. Expression may be considered to be overexpressed if it is 1.1, 1.2, 1.3, 1.4, 1.5, 1.6, 1.7, 1.8, 1.9, 2, 10, 100, 1000, or up to 10,000 times the expression in normal tissue or in tissues from another group of patients.
[0132] The term "polynucleotide," when used in the singular or plural, generally refers to any polyribonucleotide or polydeoxribonucleotide, which may be unmodified RNA or DNA or modified RNA or DNA. This includes, without limitation, single- and double-stranded DNA, DNA including single- and double-stranded regions, single- and double-stranded RNA, and RNA including single- and double-stranded regions, hybrid molecules comprising DNA and RNA that may be single-stranded or, more typically, double-stranded or include single- and double-stranded regions. Also included are triple-stranded regions comprising RNA or DNA or both RNA and DNA. Specifically included are mRNAs, cDNAs, and genomic DNAs, and any fragments thereof. The term includes DNAs and RNAs that contain one or more modified bases, such as tritiated bases, or unusual bases, such as inosine. The polynucleotides of the invention can encompass coding or non-coding sequences, or sense or antisense sequences. It will be understood that each reference to a "polynucleotide" or like term, herein, will include the full-length sequences as well as any fragments, derivatives, or variants thereof.
[0133] The term "phenotypic," means a trait that is observable in a clinical setting, or in a clinical interview, or in a patient's history. When used in a formula for calculating G+P index, "phenotypic" or "P" means the patient's age, sex, incidence of hematuria, and smoking history.
[0134] "Polypeptide," as used herein, refers to an oligopeptide, peptide, or protein sequence, or fragment thereof, and to naturally occurring, recombinant, synthetic, or semi-synthetic molecules. Where "polypeptide" is recited herein to refer to an amino acid sequence of a naturally occurring protein molecule, "polypeptide" and like terms, are not meant to limit the amino acid sequence to the complete, native amino acid sequence for the full-length molecule. It will be understood that each reference to a "polypeptide" or like term, herein, will include the full-length sequence, as well as any fragments, derivatives, or variants thereof.
[0135] The term "qPCR" or "QPCR" refers to quantitative polymerase chain reaction as described, for example, in PCR Technique: Quantitative PCR, J. W. Larrick, ed., Eaton Publishing, 1997, and A-Z of Quantitative PCR, S. Bustin, ed., IUL Press, 2004.
[0136] The term "Reverse Transcription" means a process in which an oligoribonucleotide, including a messenger RNA ("mRNA") is used as a template for biochemical synthesis of a complementary oligodeoxyribonucleotide ("cDNA") using an enzyme ("Reverse Transcriptase"), which binds to the template RNA, and catalyzes a series of addition reactions that sequentially attaches deoxyribonucleotide bases to form an oligodeoxyribonucleotide strand that is complementary to the RNA template.
[0137] The term "Hematuria" is defined as the presence of blood in the urine. It may present as macroscopic hematura (visible traces of blood cells) or microscopic hematuria (microscopic traces of blood) within the urine. A confirmed indication of microhematuria is defined as 3 or more red blood cells present per microscopic high-powered field (HPF) on a minimum of 3 properly collected urine samples. Microhematuria may also be detected by urine dipstick (colorimetric comparison estimate) at clinic. Hematuria (either microscopic or macroscopic) may be asymptomatic (no additional symptoms associated with hematuria) or symptomatic. Additional symptoms include dysuria (painful urination), a feeling of incomplete emptying of the bladder or increased frequency or urination.
[0138] "Stringency" of hybridization reactions is readily determinable by one of ordinary skill in the art, and generally is an empirical calculation dependent upon probe length, washing temperature, and salt concentration. In general, longer probes require higher temperatures for proper annealing, while shorter probes need lower temperatures. Hybridization generally depends on the ability of denatured DNA to re-anneal when complementary strands are present in an environment below their melting temperature. The higher the degree of desired homology between the probe and hybridizable sequence, the higher the relative temperature which can be used. As a result, it follows that higher relative temperatures would tend to make the reaction conditions more stringent, while lower temperatures less so. Additional details and explanation of stringency of hybridization reactions, are found e.g., in Ausubel et al., Current Protocols in Molecular Biology, Wiley Interscience Publishers, (1995).
[0139] "Stringent conditions" or "high stringency conditions", as defined herein, typically: (1) employ low ionic strength and high temperature for washing. For example 0.015 M sodium chloride/0.0015 M sodium citrate/0.1% sodium dodecyl sulfate at 50.degree. C.; (2) employ a denaturing agent during hybridization, such as formamide, for example, 50% (v/v) formamide with 0.1% bovine serum albumin/0.1% Fico11/0.1% polyvinylpyrrolidone/50 mM sodium phosphate, buffer at pH 6.5 with 750 mM sodium chloride, 75 mM sodium citrate at 42.degree. C.; or (3) employ 50% formamide, 5.times.SSC (0.75 M NaCl, 0.075 M sodium citrate), 50 mM sodium phosphate (pH 6.8), 0.1% sodium pyrophosphate, 5.times., Denhardt's solution, sonicated salmon sperm DNA (50 ug/ml), 0.1% SDS, and 10% dextran sulfate at 42.degree. C., with washes at 42.degree. C. in 0.2.times.SSC (sodium chloride/sodium citrate) and 50% formamide at 55.degree. C., followed by a high-stringency wash comprising 0.1.times.SSC containing EDTA at 55.degree. C.
[0140] "Moderately stringent conditions" may be identified as described by Sambrook et al., Molecular Cloning: A Laboratory Manual, New York: Cold Spring Harbor Press, 1989, and include the use of washing solution and hybridization conditions (e. g., temperature, ionic strength, and % SDS) less stringent that those described above. An example of moderately stringent conditions is overnight incubation at 37.degree. C. in a solution comprising: 20% formamide, 5.times.SSC (150 mM NaCl, 15 mM trisodium citrate), 50 mM sodium phosphate (pH 7.6), 5.times.Denhardt's solution, 10% dextran sulfate, and 20 mg/ml denatured sheared salmon sperm DNA, followed by washing the filters in 1.times.SSC at about 37-50.degree. C. The skilled artisan will recognize how to adjust the temperature, ionic strength, etc. as necessary to accommodate factors such as probe length and the like.
[0141] The term "IL8Rb" means neutrophil marker interleukin 8 receptor B (also known as chemokine (C--X--C motif) receptor 2 [CXCR2]) (FIG. 1; SEQ ID NOs. 1 and 2), and includes the marker IL8Rb. The term includes a polynucleotide, such as a gene or gene fragment, RNA or RNA fragment; or a gene product, including a polypeptide such as a peptide, oligopeptide, protein, or protein fragment; or any related metabolites, by products, or any other identifying molecules, such as antibodies or antibody fragments.
[0142] The term "reliability" includes the low incidence of false positives and/or false negatives. Thus, with higher reliability of a marker, fewer false positives and/or false negatives are associated with diagnoses made using that marker.
[0143] "Accuracy" is the proportion of true results (true positives plus true negatives) divided by the number of total cases in the population, according to the formula:
True Positives + True Negatives Total Number of Measurements ##EQU00001##
[0144] The term "triage" means to differentiate patients with hematuria that have a low probability of having bladder cancer from those patients with hematuria that have a reasonable probability of having bladder cancer and requiring further clinical work up, including cystoscopy or other clinical procedure.
Embodiments
[0145] Therefore, in certain preferred embodiments, a combination of genetic markers and phenotypic markers are provided that permit differentiating patients having a low probability of having bladder cancer from those patients with a sufficient risk of having bladder to warrant further clinical work up, possibly including cystoscopy or other procedures. In other embodiments, markers are provided that have reliability greater than about 70%; in other embodiments, greater than about 73%, in still other embodiments, greater than about 80%, in yet further embodiments, greater than about 90%, in still others, greater than about 95%, in yet further embodiments greater than about 98%, and in certain embodiments, about 100% reliability.
[0146] For genetic analysis, the practice of the present invention will employ, unless otherwise indicated, conventional techniques of molecular biology (including recombinant techniques), microbiology, cell biology, and biochemistry, which are within the skill of the art. Such techniques are explained fully in the literature, such as, Molecular Cloning: A Laboratory Manual, 2nd edition, Sambrook et al., 1989; Oligonucleotide Synthesis, M J Gait, ed., 1984; Animal Cell Culture, R. I. Freshney, ed., 1987; Methods in Enzymology, Academic Press, Inc.; Handbook of Experimental Immunology, 4th edition, D. M. Weir & CC. Blackwell, eds., Blackwell Science Inc., 1987; Gene Transfer Vectors for Mammalian Cells, J. M. Miller & M. P. Calos, eds., 1987; Current Protocols in Molecular Biology, F. M. Ausubel et al., eds., 1987; and PCR: The Polymerase Chain Reaction, Mullis et al., eds., 1994.
[0147] It is to be understood that the above terms may refer to protein, DNA sequence and/or RNA sequence. It is also to be understood that the above terms also refer to non-human proteins, DNA and/or RNA having homologous sequences as depicted herein.
Embodiments of this Invention
[0148] Often patients referred to a urologist with hematuria are booked to be seen in a dedicated hematuria clinic. Patients with macroscopic hematuria are often prioritized over those with micro hematuria. The information provided at the time of referral from the primary care provider can be highly variable, making accurate stratification of patients by probability of having a urothelial cancer difficult. Often urine cytology is routinely requested before the patient is seen and, if positive, is used to increase the patients priority of receiving a full clinical work-up, however urine cytology, whilst highly specific, has a very low sensitivity and hence is of little practical value with its high rate of false-negatives.sup.(6).
Phenotypic and Genotypic Analysis of Patients With Hematuria Not Having Bladder Cancer
[0149] G+P INDEX
[0150] Phenotypic and genotypic variables described above are combined into a G+P INDEX according to the following relationship:
[0151] G+P INDEX=(w1*HFREQ+w2*AgeGT50+w3*Gender+w4*SMK+w5*RBC)+(w6*M1+w7*I- L-8), where HFREQ means the frequency of finding 3 or more red blood cells per high power field in a 6-month period; if frequency is low then HFREQ=0, and if higher than 3 red blood cells per high power field, then 1. AgeGT50 refers to subject's age, if greater than 50 years then AgeGT50=1, and if less than 50 years, then 0. Gender is assigned a value of 1 for male, and 0 for female. SMK means whether the subject is a current or ex-smoker; if non-smoker then SMK=0 and if a smoker, then 1. RBC means red blood cell count; if 25 or more then RBC is set to 1, and if less than 25, then 0. M1 is a combination of expression of the genetic markers MDK, CDC, IGFBP5, and HOXA13; if M1>4.5 then set it to 1, if less than 4.5, 0. IL-8 refers to expression level of RNA for IL-8; if IL-8>2.5 then IL-8 is set to 1, if ness than 2.5, 0. The symbols "*" means the multiplication operator, and weighting factors, w1-w7 are respectively the weights assigned to each of the variables listed above in the G+P INDEX.
[0152] In other preferred embodiments, (AgeGT50 and RBC) may be dropped from the model as shown below:
G+P INDEX=(1*HFREQ+3*Gender+4*SMK).+-.(5*M1+2*IL-8)
[0153] The G+P INDEX produces a value between 0 and 15. A patient with G+P INDEX value of 11 to 15 is considered to be at "High Risk" for bladder cancer, and indicates the need for additional work up for bladder cancer. A patient with a G+P INDEX value of 6 to 10 is considered to be at "Moderate Risk" for developing bladder cancer, and additional work up is indicated. A patient with a G+P INDEX of 0 to 5 is considered to be at "Low Risk" for developing bladder cancer. Patients in the "Low Risk" group are placed on a watchful waiting list, and if additional symptoms appear, or if recurrent episodes of microhematuria occur, they are reevaluated for possible further work up.
[0154] Genotypic variables useful for differentiating patients without and with bladder cancer include expression of RNA markers "M1" being a combination of MDK, CDC, IGFBP5 (IGBP5), and HOXA13. Another genotypic variable is expression of RNA for IL8R. Coefficients for these genotypic variables are shown in Table 7 below. A threshold of 4.5 and 2.5 was used for M1 and IL8R, respectively, and a coefficient of 5 and 2, respectively, were assigned.
[0155] The G+P INDEX produces a value between 0 and 15. A G+P INDEX value of 11 to 15 is considered "High Risk" for bladder cancer, and indicates the need for additional work up for bladder cancer. A G+P INDEX value of 6 to 10 is considered "Moderate Risk" for developing bladder cancer, and additional work up is indicated. A G+P INDEX of 0 to 5 is considered "Low Risk" for developing bladder cancer, and these patients are placed on a waiting list, and if additional symptoms appear, or if recurrent episodes of microhematuria occur, are reevaluated for possible fuller work up.
[0156] As described more fully in Example 3 (FIGS. 18 and 19), we found that the ROC curve for phenotypic data alone produced a modest level of diagnostic power. The ROC curve for genotypic data alone produced a significant level of diagnostic power. We found an unexpectedly better diagnostic power when both genotypic and phenotypic data was combined into a G+P INDEX.
Genetic Analysis of Patients not Having Bladder Cancer
[0157] In some preferred embodiments, this invention combines use of a 4-marker assay or a Cxbladder.RTM. assay (genotypic variables) and one or more of five key risk factors (phenotypic variables) to produce a selection index that can be used to triage patients with microscopic or macroscopic hematuria in terms of their potential risk of having urothelial cancer. While not precluding the need for a flexible cystoscopy, patients deemed at high risk of urothelial cancer based on phenotypic variables and genotypic variables may be seen earlier, potentially improving overall patient outcome.
[0158] Genotypic markers can be used as tools to detect cancer-free patients or to select patient groups that are at low, medium or high risk of having a disease. The markers can, for example, be differentially expressed between disease tissue and corresponding non-disease tissue. In this situation, the detection of differential expression is associated with the presence of the disease. Alternatively, the marker can be associated directly with changes occurring in the disease tissues, or changes resulting from the disease Inflammatory diseases are associated with an increase in neutrophils. It has been found that the neutrophil marker interleukin 8 receptor B (IL8Rb; FIG. 1; SEQ ID NOs 1 and 2), can provide a good marker for the presence of neutrophils in a sample, and therefore can be used as a diagnostic marker for the detection of inflammatory disease in a sample, and in particular, in the detection of inflammatory disease of the bladder.
[0159] As shown in FIG. 5, accumulation of IL8Rb in urine is indicative of the presence of inflammatory disease of the bladder. Specifically, FIG. 5 shows the accumulation of IL8Rb in the urine of patients having the conditions; benign prostatic hyperplasia, urinary tract infection, non-specific prostate diseases, vascular prostate and secondary warfarin use. It will be appreciated however, that the use of IL8Rb is not be limited to the detection of these diseases only, but that these examples show that IL8Rb does increase in samples from patients having an inflammatory disease of the bladder. That is, IL8Rb can be used as a marker of inflammation associated with bladder disease and therefore is suitable for use in detecting any condition associated with inflammation. Therefore, the detection of the amount of IL8Rb can be used as a marker for inflammatory disease of the bladder. More particularly, IL8Rb can be used to detect inflammatory disease of the bladder associated with the accumulation of neutrophils.
[0160] Urine tests for TCC rely largely on the presence of markers in the urine derived from exfoliated tumor cells. The ability to detect these cells can be masked by the presence of large numbers of contaminating cells, such as, blood and inflammatory cells. Moreover, inflammation of the bladder lining can result in the increased exfoliation of non-malignant cells from the mucosa. As a result, urine tests that use markers derived from bladder transitional cells have a higher likelihood of giving a false positive result from urine samples taken from patients with cystitis, urinary tract infection or other conditions resulting in urinary tract inflammation or transitional cell exfoliation, such as, urolithiasis (Sanchez-Carbayo et al).
[0161] One way to try and avoid such false positive results has been to select markers with low relative expression in blood or inflammatory cells. The use of such markers results in fewer false positives in TCC patients presenting with non-malignant, inflammatory conditions. However, low expression of the markers in hematologically-derived cells fails to compensate for the enhanced rate of exfoliation of non-malignant transitional cells.
[0162] It has been discovered that the negative impact of exfoliated transitional cells from inflamed tissue has on the accuracy of bladder cancer urine tests can be minimized by improving the identification of patients with inflammatory conditions of the urinary tract. Here it has been surprisingly found that using the marker IL8Rb in combination with one or more bladder tumor markers (BTM's) provides for a more accurate detection of bladder cancer. In particular, a marker based test for bladder cancer that includes the marker IL8Rb is less susceptible to false positive results, which can result in patients suffering from an inflammatory non-cancer condition.
[0163] In general, the presence or absence of an inflammatory condition is established by having a threshold of gene expression, above which expression of IL8Rb is indicative of an inflammatory condition. For example, the expression of IL8Rb above a certain threshold is diagnostic that the patient has an inflammatory condition (see thresholds described above)
[0164] When IL8Rb is used in conjunction with one or more markers predictive for the presence of bladder cancer, the presence of elevated expression of the bladder tumor marker(s), and expression of IL8Rb, above a certain threshold, is predictive of the patient having an inflammatory condition and not cancer. Furthermore, if the test is preformed on urine from the patient, then this result is predictive of the patient having an inflammatory bladder condition. The high levels of the bladder tumor markers are most likely the result of non-malignant cells coming from the mucosa as a result of the inflammation. That is, the patient, although having high levels of the bladder tumor marker(s) does not actually have bladder cancer--a false positive.
[0165] Alternatively, if the patient has abnormally high levels or diagnostic levels of one or more bladder tumor markers, but the level of IL8Rb is below a threshold, then the patient is likely to have cancer, and in particular bladder or urothelial cancer. This is especially so, if the test is preformed on urine from the patient. This result is of significant benefit to the health provider because they can be sure that the patient does have cancer, and can start treatment immediately, and not be concerned that the result is actually caused an inflammatory condition giving a false positive result.
[0166] It has been surprisingly shown that the quantification of RNA from the gene encoding the neutrophil marker interleukin 8 receptor B (IL8Rb) improves the overall performance of detecting patients with TCC, using known TCC or BTM markers. The reference sequences for IL8Rb are shown in FIG. 1 and SEQ ID NOs 1 and 2). In addition to its role in TCC detection, it has been explored whether IL8Rb could be used as a urine marker to aid in the diagnosis of inflammatory disease (FIG. 5).
[0167] The use of IL8Rb marker can be used in isolation for the detection of inflammatory conditions of the bladder utilizing known methods for detecting gene expression levels. Examples of methods for detecting gene expression are outlined below.
[0168] Alternatively, IL8Rb can be combined with one of more BTMs to detect bladder cancer. It has been shown that by utilizing the inflammatory disease marker IL8Rb as part of the test for bladder cancer, the influence of inflamed tissue on creating a false positive result is minimized. The marker IL8Rb can be used in association with any bladder cancer markers, or alternatively can be used with two or more markers, as part of a signature, for detecting bladder cancer.
[0169] Reducing the number of false positive results means that fewer patients not having bladder cancer are subjected to potentially unnecessary procedures, including cystoscopy, which carries its own risks. Reducing the number of false negative results means that it is more likely that a patient with bladder cancer is detected, and can therefore be further evaluated for cancer.
[0170] The action of IL8Rb to improve the detection of bladder cancer results from the ability to separate non-malignant conditions from patients having bladder cancer. This is achieved because an increase of IL8Rb is indicative of an increase in the presence of neutrophils in a sample. Therefore, the ability of IL8Rb is not dependent on the bladder tumor marker used. As shown in FIGS. 2, and 12 to 15, when combined with a variety of bladder tumor markers and combinations of bladder tumor markers, IL8Rb had the general effect of increasing the specificity of the ability of the marker(s) to detect cancer in the subjects.
[0171] One example of a signature according to the present invention is the use of IL8Rb in combination with MDK, CDC2, IGFBP5 and HOXA13, which may also be in combination with one or more other marker suitable for detecting bladder cancer, for example any one of more of the markers outlined in FIG. 6 or 7. As shown in FIGS. 14 and 15, IL8Rb can be used in any combination of the markers, specifically the combinations IL8Rb/MDK, IL8Rb/CDC2, IL8Rb/HOXA13, IL8Rb/IGFBP5, IL8Rb/MDK/CDC2, IL8Rb/MDK/HOXA13, IL8Rb/MDK/IGFBP5, IL8Rb/CDC2/HOXA13, IL8Rb/CDC2/IGFBP5, IL8Rb/HOXA13/IGFBP5, IL8Rb/MDK/CDC2/HOXA13, IL8Rb/MDK/CDC2/IGFBP5, IL8Rb/CDC2/HOXA13/IGFBP5, and IL8Rb/MDK/CDC2/HOXA13/IGFBP5. As shown in FIGS. 14 and 15, the inclusion of IL8Rb increased the ability of the marker, or the combination of markers to accurately diagnose bladder cancer in a subject. The present invention is not to be limited to these specific combinations but can optionally include one or more further markers suitable for detecting bladder cancer, for example any one of more of the markers outlined in FIG. 6 or 7. Table 1 below shows the identifiers for the specific markers MDK, CDC2, IGFBP5 and HOXA13 and IL8Rb.
TABLE-US-00001 TABLE 1 Identifiers for Bladder Tumor Markers HGNC NCBI Gene Entrez PE Gene Name Gene Name (Official) NCBI RefSeq ID HGNC URL MDK MDK NM_002391 4192 http://www.genenames.org/data/hgnc_data.php?hgnc_id=6972 CDC CDK1 NM_001170406 983 http://www.genenames.org/data/hgnc_data.php?hgnc_id=1722 IGF IGFBP5 NM_000599 3488 http://www.genenames.org/data/hgnc_data.php?hgnc_id=5474 HOXA HOXA13 NM_000522 3209 http://www.genenames.org/data/hgnc_data.php?hgnc_id=5102 IL8Rb CXCR2 NM_001168298 3579 http://www.genenames.org/data/hgnc_data.php?hgnc_id=6027
[0172] FIGS. 2 to 4 and 12 to 17 show the effect of using IL8Rb in combination with four known, representative, markers of bladder cancer; MDK, CDC2, IGFBP5 and HOXA13. The results show that by incorporating the use if IL8Rb individually with each marker (FIGS. 2, 14 and 15 to 17), but also when used with all possible combinations of the four BTM markers as a signature, there is an improvement in the ability to separate the samples of patients with TCC and those with non-malignant conditions.
[0173] As shown in FIGS. 10 to 13, the inclusion of IL8Rb with the four markers MDK, CDC2, IGFBP5 and HOXA13 (uRNA-D) not only increased the overall performance of the test compared to the four markers alone, the test also compared extremely favorably with other known tests, NMP22.RTM. "a registered trademark of Matritech, Inc., of Massachusetts, United States" Elisa, NMP22 BladderChek.RTM. (a registered trademark of Matritech, Inc., of Massachusetts, United States), and cytology. FIGS. 14 through 17 also show the effect of IL8Rb in the various combinations of the four markers MDK, CDC2, IGFBP5 and HOXA13.
[0174] FIG. 14 shows the ROC curves for all the combinations of the four markers MDK, CDC2, IGFBP5 and HOXA13, with and without IL8Rb, calculated using five different classifier models (i) Linear Discriminant Analysis (LDA), (ii) Logistic Regression (Log Reg), (iii) Support Vector Machines (SVM), (iv) K-nearest 5 neighbors (KN5N), and (v) Partition Tree Classifier (TREE). FIG. 15 tabulates the Area Under the Curve (AUC) for all 5 classifiers and all 15 combinations of the 4 biomarkers, with and without IL8Rb. This AUC calculation is restricted to the area from a false positive rate of 0 to a false positive rate of 20%, covering the useful ranges of specificity (80-100%). The AUC quantifies the visible differences on the ROC curves of FIG. 14. FIG. 16 shows the sensitivity of all combinations of the four markers measured with and without IL8Rb at specificities of FIG. 16(a) 80%, FIG. 16(b) 85%, FIG. 16(c) 90%, FIG. 16(d) 95%, and FIG. 16(e) 98%. FIG. 17 tabulates the changes in either sensitivity (vertical direction on the ROC curves; better is "up") or specificity (horizontal direction on the ROC curve; better is to the left) at the fixed specificities of FIGS. 17(a, f) 80%, FIGS. 17(b, g) 85%, FIGS. 17(c, h) 90%, FIGS. 17(d, I) 95%, and FIGS. 17(e, j) 98%, respectively.
[0175] These results show that IL8Rb, in general, improves the ability of the biomarkers (MDK, CDC, IGFBP5, and HOXA13), singly or in combination, to classify tumor from normal samples.
[0176] These results generally show that the IL8Rb was able to increase the accuracy at which the test could detect bladder or urothelial cancer. The biggest gains were seen with either markers that did not perform as well without the inclusion of IL8Rb or with classifiers that did not perform as well. Smaller gains were seen for markers and/or classifiers that performed well prior to adding IL8Rb and therefore there was less room for improvement. It is important to note that the results show a population based analysis and the benefit of incorporating IL8Rb could be greater when diagnosis individual patients, especially those whose diagnosis on the expression of the BTM markers maybe unclear.
[0177] These results show that not only can IL8Rb be used to detect inflammatory disease of the bladder, but also when used in combination with markers for bladder cancer, results in an improved detection of bladder cancer, arising from a reduction in "false positive" results.
[0178] These results also show the utility of IL8Rb in that it affects the overall performance of the various markers combinations, and confirms the ability of IL8Rb to improve the performance of one or more bladder cancer markers to accurately detect cancer in a patient. Further, FIG. 14 and FIG. 15 show that the same results can be achieved using a range of classifier models, and shows that the result is not dependent on a classifier model or algorithm, but rather the combination of markers used. These results confirm that any suitable classifier model or algorithm could be used in the present invention. In particular, FIG. 14 and FIG. 15 show that IL8Rb has a greater effect at the higher specificities, and in particular in the most clinically applicable ranges.
[0179] Therefore, using the G+P Index of this invention, we are able to accurately triage patients with hematuria based on phenotypic and genetic variables into groups being at "High Risk" for having urothelial cancer and warrant immediate further work-up, "At Risk" and warrant immediate work-up, and those with "Low Risk" who may be placed on a watch list for later evaluation.
Detection of Genetic Markers in Body Samples
[0180] In several preferred embodiments, assays for cancer can be desirably carried out on samples obtained from blood, plasma, serum, peritoneal fluid obtained for example using peritoneal washes, or other body fluids, such as urine, lymph, cerebrospinal fluid, gastric fluid or stool samples. For the detection of inflammatory conditions of the bladder or bladder cancer the test is ideally preformed on a urine sample.
[0181] Specifically, present methods for detecting inflammatory bladder disease or bladder cancer can be conducted on any suitable sample from the body that would be indicative of the urine, but ideally the level of IL8Rb, and any further cancer marker is established directly from a urine sample.
[0182] A test can either be performed directly on a urine sample, or the sample may be stabilized by the addition of any suitable compounds or buffers known in the art to stabilize and prevent the breakdown of RNA and/or protein in the sample so that it can be analyzed at a later date, or even to ensure that the RNA and/or protein is stabilized during the analysis.
[0183] The determination of either the protein and/or RNA level in the subject's urine can be performed directly on the urine, or the urine can be treated to further purify and/or concentrate the RNA and/or protein. Many methods for extracting and/or concentrating proteins and/or RNA are well known in the art and could be used in the present invention.
[0184] It can be appreciated that many methods are well known in the art for establishing the expression level of a particular gene, either at the RNA and/or protein level, and any suitable method can be used in the present invention. Some common methods are outlined below, however, the invention is not restricted to these methods and any method for quantifying protein and/or RNA levels is suitable for use in the present invention.
General Approaches to Disease and Cancer Detection Using Genotypic Markers
[0185] General methodologies for determining expression levels are outlined below, although it will be appreciated that any method for determining expression levels would be suitable.
Quantitative PCR (qPCR)
[0186] Quantitative PCR (qPCR) can be carried out on tumor samples, on serum and plasma using specific primers and probes. In controlled reactions, the amount of product formed in a PCR reaction (Sambrook, J., E Fritsch, E. and T Maniatis, Molecular Cloning: A Laboratory Manual 3.sup.rd. Cold Spring Harbor Laboratory Press: Cold Spring Harbor (2001)) correlates with the amount of starting template. Quantification of the PCR product can be carried out by stopping the PCR reaction when it is in log phase, before reagents become limiting. The PCR products are then electrophoresed in agarose or polyacrylamide gels, stained with ethidium bromide or a comparable DNA stain, and the intensity of staining measured by densitometry. Alternatively, the progression of a PCR reaction can be measured using PCR machines such as the Applied Biosystems' Prism7000.TM. (a trademark of Applera Corporation, Connecticut, United States) or the Roche LightCycler.TM. (a trademark of Roche Molecular Systems, Inc., California, United States), which measure product accumulation in real-time. Real-time PCR measures either the fluorescence of DNA intercalating dyes such as Sybr Green into the synthesized PCR product, or the fluorescence released by a reporter molecule when cleaved from a quencher molecule; the reporter and quencher molecules are incorporated into an oligonucleotide probe which hybridizes to the target DNA molecule following DNA strand extension from the primer oligonucleotides. The oligonucleotide probe is displaced and degraded by the enzymatic action of the Taq polymerase in the next PCR cycle, releasing the reporter from the quencher molecule. In one variation, known as Scorpion, the probe is covalently linked to the primer.
Reverse Transcription PCR (RT-PCR)
[0187] RT-PCR can be used to compare RNA levels in different sample populations, in normal and tumor tissues, with or without drug treatment, to characterize patterns of expression, to discriminate between closely related RNAs, and to analyze RNA structure.
[0188] For RT-PCR, the first step is the isolation of RNA from a target sample. The starting material is typically total RNA isolated from human tumors or tumor cell lines, and corresponding normal tissues or cell lines, respectively. RNA can be isolated from a variety of samples, such as tumor samples from breast, lung, colon (e.g., large bowel or small bowel), colorectal, gastric, esophageal, anal, rectal, prostate, brain, liver, kidney, pancreas, spleen, thymus, testis, ovary, uterus, bladder etc., tissues, from primary tumors, or tumor cell lines, and from pooled samples from healthy donors. If the source of RNA is a tumor, RNA can be extracted, for example, from frozen or archived paraffin-embedded and fixed (e.g., formalin-fixed) tissue samples.
[0189] The first step in gene expression profiling by RT-PCR is the reverse transcription of the RNA template into cDNA, followed by its exponential amplification in a PCR reaction. The two most commonly used reverse transcriptases are avian myeloblastosis virus reverse transcriptase (AMV-RT) and Moloney murine leukemia virus reverse transcriptase (MMLV-RT). The reverse transcription step is typically primed using specific primers, random hexamers, or oligo-dT primers, depending on the circumstances and the goal of expression profiling. For example, extracted RNA can be reverse-transcribed using a GeneAmp.RTM. RNA PCR kit (Perkin Elmer, Calif., USA), following the manufacturer's instructions. The derived cDNA can then be used as a template in the subsequent PCR reaction.
[0190] Although the PCR step can use a variety of thermostable DNA-dependent DNA polymerases, it typically employs the Taq DNA polymerase, which has a 5'-3' nuclease activity but lacks a 3'-5' proofreading endonuclease activity. Thus, TaqMan.RTM. qPCR (a registered trademark of Roche Molecular Systems, Inc., California, United States) typically utilizes the 5' nuclease activity of Taq or Tth polymerase to hydrolyze a hybridization probe bound to its target amplicon, but any enzyme with equivalent 5' nuclease activity can be used.
[0191] Two oligonucleotide primers are used to generate an amplicon typical of a PCR reaction. A third oligonucleotide, or probe, is designed to detect nucleotide sequence located between the two PCR primers. The probe is non-extendible by Taq DNA polymerase enzyme, and is labeled with a reporter fluorescent dye and a quencher fluorescent dye. Any laser-induced emission from the reporter dye is quenched by the quenching dye when the two dyes are located close together as they are on the probe. During the amplification reaction, the Taq DNA polymerase enzyme cleaves the probe in a template-dependent manner. The resultant probe fragments disassociate in solution, and signal from the released reporter dye is free from the quenching effect of the second fluorophore. One molecule of reporter dye is liberated for each new molecule synthesized, and detection of the unquenched reporter dye provides the basis for quantitative interpretation of the data.
[0192] TaqMan.RTM. RT-PCR (a registered trademark of Roche Molecular Systems, Inc., California, United States) can be performed using commercially available equipment, such as, for example, ABI PRISM7700.TM. Sequence Detection System (a trademark of Applera Corporation, Connecticut, United States) (Perkin-Elmer-Applied Biosystems, Foster City, Calif., USA), or Lightcycler.TM. (a registered trademark of Roche Molecular Systems, Inc., California, United States((Roche Molecular Biochemicals, Mannheim, Germany). In a preferred embodiment, the 5' nuclease procedure is run on a real-time quantitative PCR device such as the ABI PRISM 7700.TM. Sequence Detection System. The system consists of a thermocycler, laser, charge-coupled device (CCD), camera, and computer. The system amplifies samples in a 96-well format on a thermocycler. During amplification, laser-induced fluorescent signal is collected in real-time through fiberoptic cables for all 96 wells, and detected at the CCD. The system includes software for running the instrument and for analyzing the data.
[0193] 5' nuclease assay data are initially expressed as Cp, or the threshold cycle. As discussed above, fluorescence values are recorded during every cycle and represent the amount of product amplified to that point in the amplification reaction. The point when the fluorescent signal is first recorded as statistically significant is the threshold cycle, Cp.
Real-Time Quantitative PCR (qRT-PCR)
[0194] A more recent variation of the RT-PCR technique is the real time quantitative PCR, which measures PCR product accumulation through a dual-labeled fluorigenic probe (i.e., TaqMan.RTM. probe. Real time PCR is compatible both with quantitative competitive PCR and with quantitative comparative PCR. The former uses an internal competitor for each target sequence for normalization, while the latter uses a normalization gene contained within the sample, or a housekeeping gene for RT-PCR. Further details are provided, e.g., by Held et al., Genome Research 6: 986-994 (1996).
[0195] Expression levels can be determined using fixed, paraffin-embedded tissues as the RNA source. According to one aspect of the present invention, PCR primers are designed to flank intron sequences present in the gene to be amplified. In this embodiment, the first step in the primer/probe design is the delineation of intron sequences within the genes. This can be done by publicly available software, such as the DNA BLAT software developed by Kent, W. J., Genome Res. 12 (4): 656-64 (2002), or by the BLAST software including its variations. Subsequent steps follow well established methods of PCR primer and probe design.
[0196] In order to avoid non-specific signals, it is useful to mask repetitive sequences within the introns when designing the primers and probes. This can be easily accomplished by using the Repeat Masker program available on-line through the Baylor College of Medicine, which screens DNA sequences against a library of repetitive elements and returns a query sequence in which the repetitive elements are masked. The masked sequences can then be used to design primer and probe sequences using any commercially or otherwise publicly available primer/probe design packages, such as Primer Express (Applied Biosystems); MGB assay-by-design (Applied Biosystems); Primer3 (Steve Rozen and Helen J. Skaletsky (2000) Primer3 on the VIMNV for general users and for biologist programmers in: Krawetz S, Misener S (eds) Bioinformatics Methods and Protocols: Methods in Molecular Biology. Humana Press, Totowa, N.J., pp 365-386).
[0197] The most important factors considered in PCR primer design include primer length, melting temperature (Tm), and G/C content, specificity, complementary primer sequences, and 3' end sequence. In general, optimal PCR primers are generally 1730 bases in length, and contain about 20-80%, such as, for example, about 50-60% G+C bases. Melting temperatures between 50 and 80.degree. C., e.g., about 50 to 70.degree. C., are typically preferred. For further guidelines for PCR primer and probe design see, e.g., Dieffenbach, C. W. et al., General Concepts for PCR Primer Design in: PCR Primer, A Laboratory Manual, Cold Spring Harbor Laboratory Press, New York, 1995, pp. 133-155; Innis and Gelfand, Optimization of PCRs in: PCR Protocols, A Guide to Methods and Applications, CRC Press, London, 1994, pp. 5-11; and Plasterer, T. N. Primerselect: Primer and probe design. Methods Mol. Biol. 70: 520-527 (1997), the entire disclosures of which are hereby expressly incorporated by reference.
Microarray Analysis
[0198] Differential expression can also be identified, or confirmed using the microarray technique. Thus, the expression profile of disease specific markers can be measured in either fresh or paraffin-embedded tumor tissue, using microarray technology. In this method, polynucleotide sequences of interest (including cDNAs and oligonucleotides) are plated, or arrayed, on a microchip substrate. The arrayed sequences (i.e., capture probes) are then hybridized with specific polynucleotides from cells or tissues of interest (i.e., targets). Just as in the RT-PCR method, the source of RNA typically is total RNA isolated from human tumors or tumor cell lines, and corresponding normal tissues or cell lines. Thus RNA can be isolated from a variety of primary tumors or tumor cell lines. If the source of RNA is a primary tumor, RNA can be extracted, for example, from frozen or archived formalin fixed paraffin-embedded (FFPE) tissue samples and fixed (e.g., formalin-fixed) tissue samples, which are routinely prepared and preserved in everyday clinical practice.
[0199] In a specific embodiment of the microarray technique, PCR amplified inserts of cDNA clones are applied to a substrate. The substrate can include up to 1, 2, 5, 10, 15, 20, 25, 30, 35, 40, 45, 50, or 75 nucleotide sequences. In other aspects, the substrate can include at least 10,000 nucleotide sequences. The microarrayed sequences, immobilized on the microchip, are suitable for hybridization under stringent conditions. As other embodiments, the targets for the microarrays can be at least 50, 100, 200, 400, 500, 1000, or 2000 bases in length; or 50-100, 100-200, 100-500, 100-1000, 100-2000, or 500-5000 bases in length. As further embodiments, the capture probes for the microarrays can be at least 10, 15, 20, 25, 50, 75, 80, or 100 bases in length; or 10-15, 10-20, 10-25, 10-50, 10-75, 10-80, or 20-80 bases in length.
[0200] Fluorescently labeled cDNA probes may be generated through incorporation of fluorescent nucleotides by reverse transcription of RNA extracted from tissues of interest. Labeled cDNA probes applied to the chip hybridize with specificity to each spot of DNA on the array. After stringent washing to remove non-specifically bound probes, the chip is scanned by confocal laser microscopy or by another detection method, such as a CCD camera. Quantitation of hybridization of each arrayed element allows for assessment of corresponding mRNA abundance. With dual colour fluorescence, separately labeled cDNA probes generated from two sources of RNA are hybridized pairwise to the array. The relative abundance of the transcripts from the two sources corresponding to each specified gene is thus determined simultaneously.
[0201] The miniaturized scale of the hybridization affords a convenient and rapid evaluation of the expression pattern for large numbers of genes. Such methods have been shown to have the sensitivity required to detect rare transcripts, which are expressed at a few copies per cell, and to reproducibly detect at least approximately two-fold differences in the expression levels (Schena et al., Proc. Natl. Acad. Sci. USA 93 (2): 106-149 (1996)). Microarray analysis can be performed by commercially available equipment, following manufacturer's protocols, such as by using the Affymetrix GenChip.RTM. technology, Illumina microarray technology or Incyte's microarray technology. The development of microarray methods for large-scale analysis of gene expression makes it possible to search systematically for molecular markers of cancer classification and outcome prediction in a variety of tumor types.
RNA Isolation, Purification, and Amplification
[0202] General methods for mRNA extraction are well known in the art and are disclosed in standard textbooks of molecular biology, including Ausubel et al., Current Protocols of Molecular Biology, John Wiley and Sons (1997). Methods for RNA extraction from paraffin embedded tissues are disclosed, for example, in Rupp and Locker, Lab Invest. 56: A67 (1987), and De Sandres et al., BioTechniques 18: 42044 (1995). In particular, RNA isolation can be performed using purification kit, buffer set, and protease from commercial manufacturers, such as Qiagen, according to the manufacturer's instructions. For example, total RNA from cells in culture can be isolated using Qiagen RNeasy.RTM. "a registered trademark of Qiagen GmbH, Hilden, Germany" mini-columns. Other commercially available RNA isolation kits include MasterPure.TM. Complete DNA and RNA Purification Kit (EPICENTRE (D, Madison, Wis.), and Paraffin Block RNA Isolation Kit (Ambion, Inc.). Total RNA from tissue samples can be isolated using RNA Stat-60 (Tel-Test). RNA prepared from tumour can be isolated, for example, by cesium chloride density gradient centrifugation.
[0203] The steps of a representative protocol for profiling gene expression using fixed, paraffin-embedded tissues as the RNA source, including mRNA isolation, purification, primer extension and amplification are given in various published journal articles (for example: T. E. Godfrey et al. J. Molec. Diagnostics 2: 84-91 (2000); K. Specht et al., Am. J. Pathol. 158: 419-29 (2001)). Briefly, a representative process starts with cutting about 10 micron thick sections of paraffin-embedded tumor tissue samples. The RNA is then extracted, and protein and DNA are removed. After analysis of the RNA concentration, RNA repair and/or amplification steps may be included, if necessary, and RNA is reverse transcribed using gene specific promoters followed by RT-PCR. Finally, the data are analyzed to identify the best treatment option(s) available to the patient on the basis of the characteristic gene expression pattern identified in the tumor sample examined.
Immunohistochemistry and Proteomics
[0204] Immunohistochemistry methods are also suitable for detecting the expression levels of the proliferation markers of the present invention. Thus, antibodies or antisera, preferably polyclonal antisera, and most preferably monoclonal antibodies specific for each marker, are used to detect expression. The antibodies can be detected by direct labeling of the antibodies themselves, for example, with radioactive labels, fluorescent labels, hapten labels such as, biotin, or an enzyme such as horseradish peroxidase or alkaline phosphatase. Alternatively, unlabeled primary antibody is used in conjunction with a labeled secondary antibody, comprising antisera, polyclonal antisera or a monoclonal antibody specific for the primary antibody. Immunohistochemistry protocols and kits are well known in the art and are commercially available.
[0205] Proteomics can be used to analyze the polypeptides present in a sample (e.g., tissue, organism, or cell culture) at a certain point of time. In particular, proteomic techniques can be used to assess the global changes of polypeptide expression in a sample (also referred to as expression proteomics). Proteomic analysis typically includes: (1) separation of individual polypeptides in a sample by 2-D polyacrylamide gel electrophoresis (2-D PAGE); (2) identification of the individual polypeptides recovered from the gel, e.g., by mass spectrometry or N-terminal sequencing, and (3) analysis of the data using bioinformatics. Proteomics methods are valuable supplements to other methods of gene expression profiling, and can be used, alone or in combination with other methods, to detect the products of the proliferation markers of the present invention.
Hybridization Methods Using Nucleic Acid Probes Selective for a Marker
[0206] These methods involve binding the nucleic acid probe to a support, and hybridizing under appropriate conditions with RNA or cDNA derived from the test sample (Sambrook, J., E Fritsch, E. and T Maniatis, Molecular Cloning: A Laboratory Manual 3.sup.rd. Cold Spring Harbor Laboratory Press: Cold Spring Harbor (2001)). These methods can be applied to markers derived from a tumour tissue or fluid sample. The RNA or cDNA preparations are typically labeled with a fluorescent or radioactive molecule to enable detection and quantification. In some applications, the hybridizing DNA can be tagged with a branched, fluorescently labeled structure to enhance signal intensity (Nolte, F. S., Branched DNA signal amplification for direct quantitation of nucleic acid sequences in clinical specimens. Adv. Clin. Chem. 33, 201-35 (1998)). Unhybridized label is removed by extensive washing in low salt solutions such as 0.1.times.SSC, 0.5% SDS before quantifying the amount of hybridization by fluorescence detection or densitometry of gel images. The supports can be solid, such as nylon or nitrocellulose membranes, or consist of microspheres or beads that are hybridized when in liquid suspension. To allow washing and purification, the beads may be magnetic (Haukanes, B-1 and Kvam, C., Application of magnetic beads in bioassays. Bio/Technology 11, 60-63 (1993)) or fluorescently-labeled to enable flow cytometry (see for example: Spiro, A., Lowe, M. and Brown, D., A Bead-Based Method for Multiplexed Identification and Quantitation of DNA Sequences Using Flow Cytometry. Appl. Env. Micro. 66, 4258-4265 (2000)).
[0207] A variation of hybridization technology is the QuantiGene Plex.RTM. assay (a registered trademark of Panomics, of California, United States) (Genospectra, Fremont) which combines a fluorescent bead support with branched DNA signal amplification. Still another variation on hybridization technology is the Quantikine.RTM. mRNA assay (R&D Systems, Minneapolis). Methodology is as described in the manufacturer's instructions. Briefly the assay uses oligonucleotide hybridization probes conjugated to Digoxigenin. Hybridization is detected using anti-Digoxigenin antibodies coupled to alkaline phosphatase in colorometric assays.
[0208] Additional methods are well known in the art and need not be described further herein.
Enzyme-Linked Immunological Assays (ELISA)
[0209] Briefly, in sandwich ELISA assays, a polyclonal or monoclonal antibody against the marker is bound to a solid support (Crowther, J. R. The ELISA guidebook. Humana Press: New Jersey (2000); Harlow, E. and Lane, D., Using antibodies: a laboratory manual. Cold Spring Harbor Laboratory Press: Cold Spring Harbor (1999)) or suspension beads. Other methods are known in the art and need not be described herein further. Monoclonal antibodies can be hybridoma-derived or selected from phage antibody libraries (Hust M. and Dubel S., Phage display vectors for the in vitro generation of human antibody fragments. Methods Mol Biol. 295:71-96 (2005)). Nonspecific binding sites are blocked with non-target protein preparations and detergents. The capture antibody is then incubated with a preparation of sample or tissue from the patient containing the antigen. The mixture is washed before the antibody/antigen complex is incubated with a second antibody that detects the target marker. The second antibody is typically conjugated to a fluorescent molecule or other reporter molecule that can either be detected in an enzymatic reaction or with a third antibody conjugated to a reporter (Crowther, Id.). Alternatively, in direct ELISAs, the preparation containing the marker can be bound to the support or bead and the target antigen detected directly with an antibody-reporter conjugate (Crowther, Id.).
[0210] Methods for producing monoclonal antibodies and polyclonal antisera are well known in the art and need not be described herein further.
Immunodetection
[0211] The methods can also be used for immunodetection of marker family members in sera or plasma from bladder cancer patients taken before and after surgery to remove the tumour, immunodetection of marker family members in patients with other cancers, including but not limited to, colorectal, pancreatic, ovarian, melanoma, liver, oesophageal, stomach, endometrial, and brain and immunodetection of marker family members in urine and stool from bladder cancer patients.
[0212] Disease markers can also be detected in tissues or samples using other standard immunodetection techniques such as immunoblotting or immunoprecipitation (Harlow, E. and Lane, D., Using antibodies: a laboratory manual. Cold Spring Harbor Laboratory Press: Cold Spring Harbor (1999)). In immunoblotting, protein preparations from tissue or fluid containing the marker are electrophoresed through polyacrylamide gels under denaturing or non-denaturing conditions. The proteins are then transferred to a membrane support such as nylon. The marker is then reacted directly or indirectly with monoclonal or polyclonal antibodies as described for immunohistochemistry. Alternatively, in some preparations, the proteins can be spotted directly onto membranes without prior electrophoretic separation. Signal can be quantified by densitometry.
[0213] In immunoprecipitation, a soluble preparation containing the marker is incubated with a monoclonal or polyclonal antibody against the marker. The reaction is then incubated with inert beads made of agarose or polyacrylamide with covalently attached protein A or protein G. The protein A or G beads specifically interact with the antibodies forming an immobilized complex of antibody-marker-antigen bound to the bead. Following washing the bound marker can be detected and quantified by immunoblotting or ELISA.
Establishing a Diagnosis Based on Genotypic Analysis
[0214] Once the level of expression of IL8Rb, and optionally one or more further cancer markers, has been obtained then a diagnosis for that subject can be established. If the expression of IL8Rb is above the expression seen in subjects that do not have an inflammatory bladder disease, and/or is consistent with the level of expression in subjects known to have an inflammatory bladder disease, then the subject will be diagnosed as having an inflammatory bladder disease. Alternatively, if the expression is not above the expression seen in subjects that do not have an inflammatory bladder disease, and/or is below the levels of expression in subjects known to have an inflammatory bladder disease, then the subject will be diagnosed as not an inflammatory bladder disease.
[0215] In the situation where IL8Rb is used in conjunction with one or more markers for Bladder cancer, then the expression level of IL8Rb will be compared with the level of expression of subjects without an inflammatory bladder disease, and/or subjects known to have an inflammatory bladder disease. The one or more cancer markers are compared to the expression level in subjects without bladder cancer and/or subjects known to have bladder cancer. If the expression level of the IL8Rb is consistent with a subject that does not have an inflammatory bladder disease (less than a subject having an inflammatory bladder disease) and the expression level of the one or more bladder cancer markers are consistent with a subject having bladder cancer (differential to a subject that does not have bladder cancer), then the subject is diagnosed as having bladder cancer. If the expression level of the IL8Rb is greater than a subject that does not have an inflammatory bladder disease (consistent with a subject having an inflammatory bladder disease) and the expression level of the one or more bladder cancer markers are consistent with a subject having bladder cancer (differential to a subject that does not have bladder cancer), then the subject is diagnosed as having an inflammatory bladder disease. If the expression level of the IL8Rb is consistent with a subject that does not have an inflammatory bladder disease (less than a subject having an inflammatory bladder disease) and the expression level of the one or more bladder cancer markers are consistent with a subject that does not have bladder cancer (differential to a subject that does have bladder cancer), then the subject is diagnosed as having neither bladder cancer or an inflammatory bladder disease.
[0216] Because there is often an overlap in expression levels between the normal and disease expression of a diagnostic marker, in order to establish a diagnosis for a subject it is typical to establish a classifying threshold. A classifying threshold is a value or threshold which distinguishes subjects into disease or non disease categories. A threshold is commonly evaluated with the use of a Receiver Operating Characteristic (ROC) curve, which plots the sensitivity against specificity for all possible thresholds.
Determination of Diagnostic Thresholds
[0217] For tests using disease markers, diagnostic thresholds can be derived that enable a sample to be called either positive or negative for the disease, e.g., bladder cancer. These diagnostic thresholds are determined by the analysis of cohorts of patients that are investigated for the presence of bladder cancer or inflammatory bladder disease. Diagnostic thresholds may vary for different test applications; for example, diagnostic thresholds for use of the test in population screening are determined using cohorts of patients who are largely free of urological symptoms, and these diagnostic thresholds may be different to those used in tests for patients who are under surveillance for bladder cancer recurrence. A diagnostic threshold can be selected to provide a practical level of test specificity in the required clinical setting; that is, a specificity that allows reasonable sensitivity without excessive numbers of patients receiving false positive results. This specificity may be within the range of 80-100%.
[0218] A diagnostic threshold is determined by applying an algorithm that combines the genotypic expression levels of each marker to each sample from a prospective clinical trial.
[0219] Samples used are from patients with bladder cancer and a range of non-malignant urological disorders. A diagnostic threshold is selected by determining the score of the algorithm that resulted in the desired specificity. For example, in some applications a specificity of 85% is desired. The A diagnostic threshold is then set by selecting an algorithm score that results in 85% of patients without bladder cancer being correctly classed as negative for cancer. In other applications (such as population screening), higher specificity, such as 90%, is favoured. To set a threshold for this application, an algorithm score that results in 90% of patients without bladder cancer being correctly classed as negative for cancer is selected. Examples of the use of an algorithm is outlined in the Examples.
[0220] As an alternative to single thresholds, the test may use test intervals which provide different degrees of likelihood of presence of disease and which have different clinical consequences associated with them. For example, a test may have three intervals; one associated with a high (e.g. 90%) risk of the presence of bladder cancer, a second associated with a low risk of bladder cancer and a third regarded as being suspicious of disease. The "suspicious" interval could be associated with a recommendation for a repeat test in a defined period of time.
[0221] Data Analysis
[0222] Once the method to test for the amount of RNA and/or protein has been completed, the data then has to be analyzed in order to determine the distribution of biomarker values associated with tumor and non-tumor samples. This typically involves normalizing the raw data, i.e., removing background "noise" etc and averaging any duplicates (or more), comparison with standards and establishing cut-offs or thresholds to optimally separate the two classes of samples. Many methods are known to do this, and the exact method will depend on specific method for determining the amount of RNA and/or protein used.
[0223] Below is an example of how the data analysis could be performed when using qRT-PCR. However, it will be appreciated the general process could be adapted to be used for other methods of establishing the RNA and/or protein content, or other methods could be established by someone skilled in the art to achieve the same result.
[0224] Data
[0225] Measurements of fluorescence are taken at wavelengths .omega..sub.i i=1,2 at each cycle of the PCR. Thus for each well we observe a pair of fluorescence curves, denoted by f.sub.t(.omega..sup.i), where t=1, . . . , k denotes cycle number and i=1,2 indexes the wavelengths.
[0226] Fluorescence curves have a sigmoidal shape beginning with a near horizontal baseline and increasing smoothly to an upper asymptote. The location of a point C.sub.p where the fluorescence curve departs from the linear baseline will be used to characterize the concentration of the target gene. A precise definition of C.sub.p follows later. The following is an example of a scheme to process these data. [0227] Compensate for fluorescence overlap between frequency bands, [0228] Estimate a smooth model for each fluorescence curve in order to estimate C.sub.p [0229] Combine data from replicated wells. [0230] Estimate standard curves [0231] Compute a concentration relative to the standard. Each biological sample yields relative concentrations of 5 genes, which are the inputs to the discriminant function.
[0232] Color Compensation
[0233] Denote the level of fluorescence of dye j at cycle t and frequency .omega. by W.sub.tj(.omega.). In a multiplexed assay the measured response at any frequency .omega. is the sum of contributions from all dyes at that frequency, so for each cycle.
f.sub.t(.omega.)=W.sub.t1(.omega.)+W.sub.t2(.omega.)+ . . .
The purpose of color compensation is to extract the individual contributions W.sub.tj(.omega.), from the observed mixtures f.sub.t(.omega.).
[0234] In the ideal situation, fluorescence W.sub.tj(.omega..sub.o), due to dye j at a frequency .omega. is proportional to its fluorescence W.sub.tj(.omega..sub.o) at reference frequency .omega..sub.o, regardless of the level of W.sub.tj(.omega..sub.o). This suggests the linear relationship
[ f t ( .omega. 1 ) f t ( .omega. 2 ) ] = [ W t 1 ( .omega. 1 ) + W t 2 ( .omega. 1 ) W t 1 ( .omega. 2 ) + W t 2 ( .omega. 2 ) ] = [ 1 A 12 A 21 1 ] [ W t 1 ( .omega. 1 ) W t 2 ( .omega. 2 ) ] ##EQU00002##
for some proportionality constants A.sub.12 and A.sub.21 that are to be determined.
[0235] In reality, there are additional effects, which are effectively modeled by introducing linear terms in this system, so
[ f t ( .omega. 1 ) f t ( .omega. 2 ) ] = [ 1 A 12 A 21 1 ] [ W t 1 ( .omega. 1 ) W t 2 ( .omega. 2 ) ] + [ a 1 + b 1 t a 2 + b 2 t ] ##EQU00003##
After estimating the "color compensation" parameters A.sub.12 and A.sub.21 we can recover W.sub.t1(.omega..sub.1) and W.sub.t2(.omega..sub.2), albeit distorted by a linear baseline, by matrix multiplication:
[ W t 1 ( .omega. 1 ) W t 2 ( .omega. 2 ) ] = [ 1 A 12 A 21 1 ] - 1 [ f t ( .omega. 1 ) f t ( .omega. 2 ) ] + [ a 1 * + b 1 * t a 2 * + b 2 * t ] ##EQU00004##
[0236] W.sub.t1(.omega..sub.1) and W.sub.t2(.omega..sub.2) are called "color compensated" data. The linear distortions a.sub.i*+b.sub.i*t in the last term of this expression will be accommodated in the baseline estimate when estimating a model for the colour compensated data below 2. It has no influence on the estimate of C.sub.p.
[0237] Estimation of the color compensation coefficients requires a separate assay using single (as opposed to duplex) probes. Then W.sub.t2(.omega..sub.2)=0 giving:
[ f t ( .omega. 1 ) f t ( .omega. 2 ) ] = [ 1 A 12 A 21 1 ] [ W t 1 ( .omega. 1 ) 0 ] + [ a 1 + b 1 t a 2 + b 2 t ] ##EQU00005## Thus,
f.sub.t(.omega..sub.2)=A.sub.21f.sub.t(.omega..sub.1)+a*+b*t
[0238] The coefficient A.sub.21 can be estimated by ordinary linear regression of f.sub.t(.omega..sub.2) on f.sub.t(.omega..sub.1) and PCR cycle t for t=1, . . . , k.
Model Estimation
[0239] In this section, let y.sub.t t=1, . . . , k denote a color compensated fluorescence curve.
[0240] Amplification
[0241] Models are only estimated for fluorescence curves that show non-trivial amplification. We define the term "amplification" as a non-trivial departure from the linear baseline of the color compensated fluorescence curve. Use signal to noise ratio (SNR) to quantify amplification. Here SNR is defined as the ratio of signal variance to noise variance. Noise variance is set as part of calibration of the assay procedure and remains unchanged: for this purpose, use the residual variance from a linear model for the baseline from wells that can have no amplification, i.e., wells without RNA. For each fluorescence curve, estimate the signal variance as the residual variance from the best fitting straight line ("best" is meant in the least squares sense.) [0242] If SNR is less than a specified threshold, the fluorescence curve is close to linear and no amplification is present. Then there is no point of departure from the baseline and the concentration in the sample may be declared as zero. [0243] If the SNR is above the threshold, amplification is present and a concentration can be estimated. Thresholds for the (dimensionless) SNR are selected to provide clear discrimination between "amplified" and "non amplified" curves. For example, the following ranges for thresholds are effective for the markers.
TABLE-US-00002 [0243] Fluor Gene Range JOE MDK 40-120 JOE CDC 35-70 JOE IL8R 30-60 FAM IGF 50-80 FAM HOXA 50-150 FAM XENO 50-80
[0244] Model
[0245] Estimate a sigmoidal model for each fluorescence curve. Any suitable parametric form of model can be used, but it must be able to model the following features: [0246] linear baseline that may have a non-zero slope, [0247] asymmetries about the mid point. [0248] asymptotes at lower and upper levels [0249] smooth increase from baseline to upper asymptote An example of a model that achieves these requirements is
[0249] g t ( .theta. ) = A + A s t + D ( 1 + ( t B ) E ) F ##EQU00006##
We call this the "6PL model". The parameter vector .theta.=[A,As,D,B,E,F] is subject to the following constraints to ensure that g.sub.t (.theta.) is an increasing function of t and has the empirical properties of a fluorescence curve.
D>0,B>0,E<0,F<0
[0250] The other two parameters determine the base line A+A.sub.st, and these parameters do not need explicit constraints though A is always positive and the slope parameter A.sub.s is always small. The parameter D determines the level of amplification above the baseline. The remaining parameters B.E.F have no intrinsic interpretation in themselves but control the shape of the curve. These parameters are also the only parameters that influence the estimate of C.sub.p. When A.sub.s=0 this is known as the five-parameter logistic function (5PL) and if, in addition, F=1 this model reduces four-parameter logistic model (4PL), Gottschalk and Dunn (2005), Spiess et al. (2008).
[0251] Initialization
[0252] Initial values for non-linear estimation are set as [0253] A.sub.s=0,F=1 [0254] A=mean(y, . . . , y.sub.5) [0255] D=range(y.sub.1, . . . , yk) [0256] B=cycle corresponding to half height [0257] E is initialized by converting g.sub.t (.theta.) into a linear form having set the values of the remaining parameters to their initial values defined above. Linearization obtains
[0257] E log ( 1 + t B ) = log ( D y t - A ) ##EQU00007##
[0258] Now estimate E by regression of log
( D y t - A ) ##EQU00008##
on log
( 1 + t B ) ##EQU00009##
for t selected so that
A + D 10 < y t < A + 9 D 10 ##EQU00010##
[0259] An alternative form of this model that leads to an almost identical analysis (with its own initialization) is:
A + A s t + D ( 1 + exp ( - t - B E ) F ##EQU00011##
When A.sub.s=0 this is sometimes known as the Richards equation, Richards (1959).
[0260] Estimation Criterion
[0261] Estimate parameters to minimize a penalized sum of squares criterion:
t ( y t - g t ( .theta. ) ) 2 + .lamda. ( .theta. ) ##EQU00012##
[0262] Here .lamda.(.theta.) is a non-negative function that penalizes large values of some (or all) of the parameters in .theta.. This method is known as regularization or ridge regression (Hoerl, 1962) and may be derived from a Bayesian viewpoint by setting a suitable prior distribution for the parameter vector .theta.. A satisfactory choice for the penalty is:
.lamda.(.theta.)=.lamda.(B.sup.2+D.sup.2+E.sup.2+F.sup.2)
[0263] Large values of .lamda. bias the parameter estimates towards zero and reduce the variance of the parameter estimates. Conversely, small (or zero) .lamda. leads to unstable parameter estimates and convergence difficulties in minimization algorithms. The choice of .lamda. is a compromise between bias and variance or stability. Empirical evidence shows that a satisfactory compromise between bias and variance may be achieved if .lamda. is chosen in the range:
0.01>.lamda.>0.0001.
This choice also ensures convergence of the optimization algorithm.
[0264] Algorithm Choice
[0265] For any choice of .lamda. in the above range, the description in the previous paragraph completely defines the parameter estimates. A non-linear least squares procedure based on the classical Gauss-Newton procedure (such as the Levenberg-Marquardt algorithm as implemented in More, 1978) has been successfully used and is a suitable approach. General purpose optimizing algorithms such as Nelder and Mead, 1965, or Broyden-Fletcher algorithm as implemented by Byrd, et al., 1995) have also been successfully trialed in this context.
[0266] C.sub.p Estimate
[0267] C.sub.p is the point at time t that maximizes the second derivative of g.sub.t (.theta.). Each fluorescence curve yields a C.sub.p that characterizes the concentration of the target gene. The average of the estimated C.sub.ps for each set of technical replicates is computed and used in the subsequent analysis.
[0268] Standard Curves
[0269] Absolute or relative concentrations are derived from a comparison with standard curves on the same PCR plate. Model a dilution series using the linear model:
C.sub.p=R+S log.sub.10 Conc
where Conc is an absolute or relative concentration of the standard. The intercept and slope parameters are plate specific. Model the between-plate variability in the intercept and slope parameters by setting population models
R.about.N(.mu..sub.R,.sigma..sub.R.sup.2)
S.about.N(.mu..sub.s,.sigma..sub.S.sup.2)
where the parameters .mu..sub.R, .sigma..sub.R.sup.2, .mu..sub.S, .sigma..sub.S.sup.2 as are set on the basis of prior data as described below. Then for a given plate R and S can be interpreted as observations from these populations.
[0270] For replicate i of standard at concentration Conc.sub.j the following model can be used:
C.sub.p(i,j)=R+S log.sub.10 Conc.sub.j+.di-elect cons..sub.ij
where .di-elect cons..sub.ij.about.N(0, .sigma..sub.j.sup.2). Note that the variance of the residuals depends on C.sub.p. Empirical estimates of Var(.di-elect cons..sub.ij) are given in Table 2. Estimate the parameters R and S using by maximizing the likelihood function. Interpret the slope parameter in terms of the efficiency of the PCR process through the expression:
S = - 1 log 10 Efficiency ##EQU00013##
[0271] This model has a Bayesian interpretation: Give vague (non-informative) prior distributions to the parameters .mu..sub.R, .sigma..sub.R.sup.2, .mu..sub.S, .sigma..sub.S.sup.2. Then the population models for R and S and for C.sub.p(i,j) fully determine a probability model for the prior data. A Markov chain Monte Carlo (MCMC) algorithm (Lunn et al., 2009) allows estimation of .mu..sub.R, .sigma..sub.R.sup.2, .mu..sub.S, .sigma..sub.S.sup.2. If the prior distribution is omitted, a traditional frequentist interpretation results. Following this estimation procedure it is possible to obtain the gene-dependent population parameter estimates in Table 3.
TABLE-US-00003 TABLE 2 Variance of Residuals C.sub.p .sigma..sup.2 12 0.0100 13 0.0108 14 0.0119 15 0.0134 16 0.0155 17 0.0184 18 0.0224 19 0.0279 20 0.0356 21 0.0466 22 0.0625 23 0.0860 24 0.1212 25 0.1750 26 0.2591 27 0.3931 28 0.6112 29 0.9741
TABLE-US-00004 TABLE 3 Population Parameters for Slopes and Intercepts of Standard Curves .mu..sub.R .sigma..sub.R.sup.2 .mu..sub.S .sigma..sub.S.sup.2 MDK 19.49 0.5112 -3.426 0.0481 CDC 18.91 0.2343 -3.414 0.0198 IL8R 31.43 0.0919 -3.192 0.0017 IGF 20.63 0.3835 -3.275 0.0247 HOXA 22.51 0.1544 -3.270 0.0037
[0272] The estimates of intercept and slope of the standard curve are denoted by {circumflex over (R)} and S.
[0273] Relative Concentrations .DELTA.C.sub.p
[0274] Use the standard curve to compute C.sub.p(REF) at the concentration Conc.sub.REF from the expression: C.sub.p(REF)={circumflex over (R)}+S log.sub.10 Conc.sub.REF. The relative concentration of a sample is given by the expression:
.DELTA. C p = C p - C p ( REF ) S ^ = log 10 Conc SAMPLE Conc REF ##EQU00014##
[0275] Alternatively S may be approximated at a fixed level corresponding to a PCR efficiency of 2. Then S=-1/log.sub.10(2)=-3.32. Use the same notation .DELTA.C.sub.P for either choice. The resulting .DELTA.C.sub.P estimates, one for each gene, are inputs to the discriminant function in the next step.
[0276] Discriminant Function
[0277] The .DELTA.C.sub.P values correspond to a relative biomarker value with plate-to-plate variation removed. Examination of the 5 .DELTA.C.sub.P values in comparison with each other (for example, see FIG. 2), shows how tumor samples typically have different biomarker values than non-tumor samples. Furthermore, while there is overlap in the areas for tumor and normal, a large number of samples are effectively well separated. Under these circumstances, many different statistical classifiers could be used to separate the normal from the tumor samples. We show here that a sample of several classifiers do work to separate these samples. We used 5 different classification methods: 1) Linear Discriminant Analysis (LDA), 2) Logistic Regression (Log Reg); 3) Support Vector Machines (SVM); 4) K-nearest-neighbor (KNN) based on 5 neighbors (KNSN); and 5) Recursive partitioning trees (TREE) (Cite: Venables & Ripley and Dalgaard).
[0278] Creation of a classifier requires a dataset containing the biomarker values for a large number of samples which should represent the ultimate population to be tested by the classifier. For example, if a classifier is to be used for screening an at-risk population (eg age 50 and older, smokers), then the set of data required for creating the classifier (called the "training set") should mirror that population and contain only samples from people older than 50 who smoke. Typically to obtain measurement precision of smaller than 10% error for parameters like sensitivity and specificity, the training set needs to be larger than 300 samples.
[0279] Estimation of the effectiveness of a classifier can be made using cross-validation. In cross-validation (Wikipedia: Cross-validation), the dataset is divided into a small number of equally sized partitions (typically 3 to 10). One section is left out and the remaining sections used to build a classifier; then the left out section is tested by the new classifier and its predictions noted. This is done for each section in turn and all the predictions combined and analysed to compute the characteristics of the classifier: Sensitivity, Specificity, etc. If the cross-validation is performed by partitioning the data into 10 parts, it is called 10-fold cross-validation; similarly, 3 parts would be 3-fold cross-validation. If the data are partitioned into as many classes are there are samples, this is called "leave one out cross-validation". By testing on data not used to build the classifier, this method provides an estimate of the classifier performance in the absence of additional samples.
[0280] We have built classifiers using all 15 combinations of 4 biomarkers, MDK, IGFBP5, CDC2, and HOXA13, all with and without the IL8Rb biomarker, using the clinical trial dataset described elsewhere in this document (Example 1) and tested those 30 classifiers using 10-fold cross-validation. This was done for each of the 5 classifier types listed above and the ROC curves computed. All work was performed using the R Statistical Programming Environment (CITE). These results (FIG. 14) show that in most cases, the classifier with IL8Rb is more sensitive for values of specificity which are useful diagnostically (False Positive Rate of 0 to 20%; Specificity from 100 to 80%). The Area Under the Curve (AUC) for the region with diagnostic utility of specificities is used to quantify how well classifiers perform with larger values indicating better classifier performance. FIG. 15a tabulates the AUC for each classifier and biomarker combination, while FIG. 15b shows the amount of increase in AUC for each condition when IL8Rb is added. In most cases, the addition of IL8Rb improves the ability to make accurate diagnoses. Specific sensitivity values for diagnostically useful specificity values are tabulated for all the classifiers in FIGS. 16a-16e. In addition, FIGS. 17a-17j tabulate the amount of gain in sensitivity or specificity which the addition of IL8Rb provides.
[0281] The utility of the classifier is created when, having created it and tested it, it is used to test a new sample. To simplify the interpretation of results, a cut-off score or threshold is established; samples on one side of the cut-off are considered positive and on the other side, negative for tumors. Additional cut-offs may be established for example to indicate increasing levels of certainty of results. In this case, we have established a cut-off which gives a false positive rate of 15% in our training set. Using our cross-validated ROC curves, we can then estimate our sensitivity. Typically, we also establish a cut-off at a positive predictive value of 75%. To use these cut-offs we establish a "negative" result for scores less than the cut-off established by the 85% specificity. Scores greater than the 75% PPV are called "positive" and score between the two are called "indeterminate" " or "suspicious".
Antibodies to IL8Rb
[0282] In additional aspects, this invention includes manufacture of antibodies against IL8Rb. The marker IL8Rb can be produced in sufficient amount to be suitable for eliciting an immunological response. In some cases, a full-length IL8Rb can be used, and in others, a peptide fragment of a IL8Rb may be sufficient as an immunogen. The immunogen can be injected into a suitable host (e.g., mouse, rabbit, etc) and if desired, an adjuvant, such as Freund's complete adjuvant or Freund's incomplete adjuvant can be injected to increase the immune response. It can be appreciated that making antibodies is routine in the immunological arts and need not be described herein further. As a result, one can produce antibodies, including monoclonal or phage-display antibodies, against IL8Rb.
[0283] In yet further embodiments, antibodies can be made against the protein or the protein core of the tumor markers identified herein or against an oligonucleotide sequence unique to a IL8Rb. Although certain proteins can be glycosylated, variations in the pattern of glycosylation can, in certain circumstances, lead to mis-detection of forms of IL8Rb that lack usual glycosylation patterns. Thus, in certain aspects of this invention, IL8Rb immunogens can include deglycosylated IL8Rb or deglycosylated IL8Rb fragments. Deglycosylation can be accomplished using one or more glycosidases known in the art. Alternatively, IL8Rb cDNA can be expressed in glycosylation-deficient cell lines, such as prokaryotic cell lines, including E. coli and the like.
[0284] Expression vectors can be made having IL8Rb-encoding oligonucleotides therein. Many such vectors can be based on standard vectors known in the art. Vectors can be used to transfect a variety of cell lines to produce IL8Rb-producing cell lines, which can be used to produce desired quantities of IL8Rb for development of specific antibodies or other reagents for detection of IL8Rb or for standardizing developed assays for IL8Rb.
Kits
[0285] Based on the discoveries of this invention, several types of test kits can be envisioned and produced. First, kits can be made that have a detection device pre-loaded with a detection molecule (or "capture reagent"). In embodiments for detection of IL8Rb mRNA, such devices can comprise a substrate (e.g., glass, silicon, quartz, metal, etc) on which oligonucleotides as capture reagents that hybridize with the mRNA to be detected is bound. In some embodiments, direct detection of mRNA can be accomplished by hybridizing mRNA (labeled with cy3, cy5, radiolabel or other label) to the oligonucleotides on the substrate. In other embodiments, detection of mRNA can be accomplished by first making complementary DNA (cDNA) to the desired mRNA. Then, labeled cDNA can be hybridized to the oligonucleotides on the substrate and detected.
[0286] Antibodies can also be used in kits as capture reagents. In some embodiments, a substrate (e.g., a multi-well plate) can have a specific IL8Rb and BTM capture reagents attached thereto. In some embodiments, a kit can have a blocking reagent included. Blocking reagents can be used to reduce non-specific binding. For example, non-specific oligonucleotide binding can be reduced using excess DNA from any convenient source that does not contain IL8Rb and BTM oligonucleotides, such as salmon sperm DNA. Non-specific antibody binding can be reduced using an excess of a blocking protein such as serum albumin. It can be appreciated that numerous methods for detecting oligonucleotides and proteins are known in the art, and any strategy that can specifically detect marker associated molecules can be used and be considered within the scope of this invention.
[0287] Antibodies can also be used when bound to a solid support, for example using an antibody chip, which would allow for the detection of multiple markers with a single chip.
[0288] In addition to a substrate, a test kit can comprise capture reagents (such as probes), washing solutions (e.g., SSC, other salts, buffers, detergents and the like), as well as detection moieties (e.g., cy3, cy5, radiolabels, and the like). Kits can also include instructions for use and a package.
[0289] Detection of IL8Rb and BTMs in a sample can be performed using any suitable technique, and can include, but are not limited to, oligonucleotide probes, qPCR or antibodies raised against cancer markers.
[0290] It will be appreciated that the sample to be tested is not restricted to a sample of the tissue suspected of being an inflammatory disease or tumor. The marker may be secreted into the serum or other body fluid. Therefore, a sample can include any bodily sample, and includes biopsies, blood, serum, peritoneal washes, cerebrospinal fluid, urine and stool samples.
[0291] It will also be appreciate that the present invention is not restricted to the detection of cancer in humans, but is suitable for the detection of cancer in any animal, including, but not limited to dogs, cats, horses, cattle, sheep, deer, pigs and any other animal known to get cancer.
General Tests for Inflammatory Disease or Cancer Markers in Body Fluids
[0292] In general, methods for assaying for oligonucleotides, proteins and peptides in these fluids are known in the art. Detection of oligonucleotides can be carried out using hybridization methods such as Northern blots, Southern blots or microarray methods, or qPCR. Methods for detecting proteins include such as enzyme linked immunosorbent assays (ELISA), protein chips having antibodies, suspension beads radioimmunoassay (RIA), Western blotting and lectin binding. However, for purposes of illustration, fluid levels of a disease markers can be quantified using a sandwich-type enzyme-linked immunosorbent assay (ELISA). For plasma assays, a 5 uL aliquot of a properly diluted sample or serially diluted standard marker and 75 uL of peroxidase-conjugated anti-human marker antibody are added to wells of a microtiter plate. After a 30 minute incubation period at 30.degree. C., the wells are washed with 0.05% Tween 20 in phosphate-buffered saline (PBS) to remove unbound antibody. Bound complexes of marker and anti-marker antibody are then incubated with o-phenylendiamine containing H.sub.20.sub.2 for 15 minutes at 30.degree. C. The reaction is stopped by adding 1 M H.sub.2SO.sub.4, and the absorbance at 492 nm is measured with a microtiter plate reader.
[0293] It can be appreciated that anti-IL8Rb antibodies can be monoclonal antibodies or polyclonal antisera. It can also be appreciated that any other body fluid can be suitably studied.
[0294] It is not necessary for a marker to be secreted, in a physiological sense, to be useful. Rather, any mechanism by which a marker protein or gene enters the serum can be effective in producing a detectable, quantifiable level of the marker. Thus, normal secretion of soluble proteins from cells, sloughing of membrane proteins from plasma membranes, secretion of alternatively spliced forms of mRNA or proteins expressed therefrom, cell death (either apoptotic) can produce sufficient levels of the marker to be useful.
[0295] There is increasing support for the use of serum markers as tools to diagnose and/or evaluate efficacy of therapy for a variety of cancer types.
EXAMPLES
[0296] The examples described herein are for purposes of illustrating embodiments of the invention. Other embodiments, methods and types of analyses are within the scope of persons of ordinary skill in the molecular diagnostic arts and need not be described in detail hereon. Other embodiments within the scope of the art are considered to be part of this invention.
Example 1: Genotypic Analysis of Bladder Cancer
[0297] Methods
[0298] Patients:
[0299] Between April 2008 and September 2009, 485 patients presenting with macroscopic hematuria, but no prior history of urinary tract malignancy, were recruited at eleven urology clinics in New Zealand and Australia. Each patient provided a urine sample immediately prior to undergoing cystoscopy and any additional diagnostic procedures. A diagnosis was made by three months following enrollment in the study. Of these 485 patients, gene expression data on all five study genes was successfully obtained for 442 patients using the methods described below. The characteristics of these patients are shown in Table 4.
TABLE-US-00005 TABLE 4 Characteristics of the Study Population I Diagnosis Number Benign prostatic hyperplasia 18 Cystitis 18 Exercise-induced hematuria 3 Non-specific kidney disease 3 Non-specific neoplasia 3 Non-specific prostate disease 63 Vascular prostate 49 Other urological cancer (non-TCC) 5 Superficial vessels 3 Urethral stricture 6 Urinary tract infection 18 Urolithiasis 25 Warfarin use 10 Unknown etiology 155 Miscellaneous 7 TCC 56 Total 442
[0300] Table 4 shows the number of patients in each of the main diagnostic categories at three months after the patient's initial presentation with gross hematuria.
[0301] Urine Analysis:
[0302] Urine samples were analyzed by central review cytology (Southern Community Laboratories, Dunedin, New Zealand). The diagnostic tests NMP22 BladderChek.RTM. (Matritech) and NMP22 ELISA (Matritech) were carried out according to the manufacturer's instructions at the clinical site (BladderChek.RTM.) or by Southern Community Laboratories (NMP22 ELISA).
[0303] RNA Quantification:
[0304] 2 mls or urine from each patient was mixed with RNA extraction buffer containing 5.64M guanidine thiocyanate, 0.5% sarkosyl and 50 mM NaoAc pH6.5. Total RNA was then extracted by Trizol extraction (Invitrogen) and the RNeasy procedure (Qiagen), as previously described1. RNA was eluted from the columns in 35 ul water and 3 ul was used in each subsequent monoplex or duplex quantitative reverse transcription polymerase chain reaction (qRT-PCR) assay. Each 16 ul qRT-PCR reaction contained 0.3 U RNAse-OUT (Invitrogen), 0.225 uM each Taqman probe, 1.25 U Superscript III (Invitrogen), 0.275 uM each primer, 1.5 U Fast Start Taq polymerase (Roche), 10 mM DTT, 0.375 mM dNTPs, 4.5 mM MgSO4, 1.6 ul 10.times.Fast Start PCR buffer (Roche) and 2.6 ul GC Rich solution (Roche). Primers and fluorescently dual-labeled probes were obtained from Integrated DNA Technologies (Coralville USA) for each of the five study genes: MDK, CDC2, HOXA13, IGFBP5 and IL8Rb. Primer/probe sequences are shown in Table 2. Reactions were set up in 96 well plates and cycled as follows on a Roche Light Cycler.RTM. 480: 50.degree. C., 15 mins; 95.degree. C. 8 mins; 10 cycles of 95.degree. C. 15 sec, 60.degree. C. 2 mins and 30 cycles of 95.degree. C. 15 secs, 60.degree. C. 1 min. Standard curves of 1/16 serial dilutions of a reference RNA (derived from pooled cell line RNAs) were included on each plate to generate range of 0.3 pg/.mu.l to 20 ng/.mu.l. Data was collected at the extension phase of the final 30 thermocycles and exported as a raw text file. Table 5 below depicts primers and probe sequences used for qRT-PCR quantification of the five RNA markers.
TABLE-US-00006 TABLE 5 Marker Forward Seq Reverse Seq Probe MDK TGC ACC CCC TGA TTA AAG CTA ACG AGC CCT TCC CTT TCT AAG ACC AAA AGA CAG AA TGG CTT TGG CCT TT (SEQ ID NO. 3) (SEQ ID NO. 4) (SEQ ID NO. 5) IGFBP5 CGT TGT ACC GGG ACG CAT CAC TCA ACG AAG AGA AAG CAG TGC CCA ATT TT TGC AAA CCT TCC GTG A (SEQ ID NO. 7) CGT (SEQ ID NO. 8) (SEQ ID NO. 6) CDC2 GCC GCC GCG TGT CTA CCC TTA TAC ACA AGC CGG GAT CTA GAA TAA T ACT CCA TAG G CCA TAC CCA TTG (SEQ ID NO. 9) (SEQ ID NO. 10) ACT AAC T (SEQ ID NO. 11) HOXA13 TGG AAC GGC TGG CGT ATT CCC GTT CAA ACT CTG CCC GAC CAA ATG TAC TG GT GTG GTC TCC CA (SEQ ID NO. 12) (SEQ ID NO. 13) (SEQ ID NO. 14) IL8Rb CCT TGA GGC CCT GTA GGA CAC CTC CAG TGG CCA CTC CAA ACA GTG AAG AAG AG TAA CAG CAG GTC ACA TC (SEQ ID NO. 16) ACA (SEQ ID NO. 15) (SEQ ID NO. 17)
[0305] qRT-PCR Data Analysis
[0306] Raw fluorescence data was exported from the Roche LightCycler.RTM. 480 as a tab-delimited file containing cycle number versus two channels of fluorescence data for all wells on the plate. The data were processed using an R program that applied color compensation (Bernard 1999) to the data to correct for bleed over from one fluorescent channel into another. It then fitted a 5-point logistic model to estimate the C.sub.P using the second derivative maximum (Spiess 2008).
[0307] All samples and controls were applied in duplicate to the PCR plates. The C.sub.P values from the duplicate wells were averaged before use. If the difference between the two C.sub.P values exceeded 3 units, that sample was repeated. To provide standardization across PCR plates, C.sub.p's were expressed as .DELTA.C.sub.P's relative to a reference RNA (derived from pooled cell line RNAs) at 20 ng/.mu.l: .DELTA.C.sub.P=C.sub.P (sample)-C.sub.P (reference RNA)
[0308] Statistical Analysis
[0309] qRT-PCR .DELTA.C.sub.P values from MDK, CDC2, HOXA13, IGFBP5 and IL8Rb were used to generate classifiers to separate samples containing TCCs from samples containing no TCCs, based on Linear Discriminant Analysis or Logistic Regression (Venables 2002). In both cases, interactions between genes were permitted in the classifier models. The generation of the LDA followed standard procedures, as described, for example in "Modern Applied Statistics with S, 4th edition" by W. N. Venables and B. D. Ripley (2002), Springer. The dataset from the study was cleaned of any incomplete data then the R Statistical Environment (R Development Core Team (2009) and the function "lda" from the package MASS (Venables and Ripley (2002)) were used to generate and test the linear discriminant on the clinical trial data.
[0310] The generation of the Logistic Regression classifier was performed in a similar manner to the generation of the LDA. Again, the study data was cleaned of incomplete data. A logistic regression classifier was created using R; no additional packages were required. Logistic regression was performed as described by Dalgaard (2008). Comparison among classifiers was made using ROC curves, using the R package, ROCR (Sing et al. 2009). Confidence intervals for ROC curves were generated using the methods of Macskassy et al (Macskassy 2005). The following algorithms were generated:
[0311] Linear Discriminant Classifier
[0312] The first classifier, a linear discriminant, (called LDA-3), Is based on five gene values (normalized to a Reference value by subtracting the reference value) allowing for multiway interactions between the genes. The classifier was built in R using the `lda( )` function from the package called "MASS". (R version 2.9.1; MASS version 7.2-49). The classifier was built using the following equation:
lda3<-lda(TCC.YN.about.MDK*IGF*CDC*HOXA*IL8R,data=uRNA.Trial)
Where lda3 is the created model; TCC.YN is the true value for "presence of TCC in urine" (Yes or No) as determined by cystoscopy; MDK, IGF, CDC, HOXA and IL8R are the normalized gene Cp value; and uRNA Trial is a data file containing the Cp values for the each of the 5 genes and TCC.YN (yes or no) from the clinical trial. Use of the ASTERISK, `*`, in the formula signifies multiplication. Evaluation of the classifier score takes as input a new data frame containing the five gene values as well as the classifier, lda3, to output a classifier score:
score<-c(predict(lda3,new.data)$x),
where "score" is the output used from the classifier to predict the presence of TCCs; "1da3" is the classifier created above and "new.data" is a data FILE containing the measured values of the five genes called by the same names as used in classifier creation. The syntax, `$x` and "c( . . . )" is present to extract the score specifically from the large amount of information returned by the predict function. Setting the score cut off to 0.112 and above, sets our specificity to 85% for presence of TCCs in the urine sample. The coefficients for LDA-3 are shown in Table 6.
TABLE-US-00007 TABLE 6 MDK.d.R100 5.333639e+00 IGF.d.R100 3.905978e+00 CDC.d.R100 6.877143e-01 HOXA.d.R100 6.073742e+00 IL8R.d.R100 -1.229466e+00 MDK.d.R100:IGF.d.R100 -7.420480e-01 MDK.d.R100:CDC.d.R100 -2.611158e-01 IGF.d.R100:CDC.d.R100 -1.965410e-01 MDK.d.R100:HOXA.d.R100 -8.491556e-01 IGF.d.R100:HOXA.d.R100 -4.037102e-01 CDC.d.R100:HOXA.d.R100 -3.429627e-01 MDK.d.R100:IL8R.d.R100 1.903118e-01 IGF.d.R100:IL8R.d.R100 2.684005e-01 CDC.d.R100:IL8R.d.R100 -1.229809e-01 HOXA.d.R100:IL8R.d.R100 2.909062e-01 MDK.d.R100:IGF.d.R100:CDC.d.R100 4.108895e-02 MDK.d.R100:IGF.d.R100:HOXA.d.R100 7.664999e-02 MDK.d.R100:CDC.d.R100:HOXA.d.R100 4.832034e-02 IGF.d.R100:CDC.d.R100:HOXA.d.R100 2.116340e-02 MDK.d.R100:IGF.d.R100:IL8R.d.R100 -3.750854e-02 MDK.d.R100:CDC.d.R100:IL8R.d.R100 1.664612e-02 IGF.d.R100:CDC.d.R100:IL8R.d.R100 2.089442e-03 MDK.d.R100:HOXA.d.R100:IL8R.d.R100 -1.539486e-02 IGF.d.R100:HOXA.d.R100:IL8R.d.R100 -3.894153e-02 CDC.d.R100:HOXA.d.R100:IL8R.d.R100 6.295032e-03 MDK.d.R100:IGF.d.R100:CDC.d.R100:HOXA.d.R100 -4.359738e-03 MDK.d.R100:IGF.d.R100:CDC.d.R100:IL8R.d.R100 -2.019317e-04 MDK.d.R100:IGF.d.R100:HOXA.d.R100:IL8R.d.R100 3.746882e-03 MDK.d.R100:CDC.d.R100:HOXA.d.R100:IL8R.d.R100 -2.902150e-03 IGF.d.R100:CDC.d.R100:HOXA.d.R100:IL8R.d.R100 4.799489e-04 MDK.d.R100:IGF.d.R100:CDC.d.R100:HOXA.d.R100:IL8R.d.R100 7.512308e-05
[0313] Logistic Regression Classifier
[0314] A second classifier based on Logistic Regression was derived from the same cleaned dataset as LDA-3. Instead of using the lda( ) function, however, we used the glm( ) function from the package stats (included with a base install of R) as shown below:
lr1<-glm(TCC.YN.about.CDC*IGF*HOXA*IL8R*MDK,
family=binomial("log it"),data=uRNA.Trial),
where "lr1" is the classifier created and the other parameters are as described for the linear discriminant. Once again, full interaction is specified using the operator. Classification is performed in a manner very similar to that for LDA-3:
score<-predict(lr1,new.data,type=`response`),
where "score" is the value used to classify urine samples based on the measurement of the five genes in "new.data", as above. The cut off for lr1 is set to 0.102 to achieve a specificity of 85%; values about the cut off are considered to be positive to TCCs. The coefficients for the classifier are: [0315] -103.0818143+3.9043769*CDC.d.R100+13.1120675*IGF.d.R100+17.4771819*HOXA.d- .R100+-10.7711519*IL8R.d.R100+21.1027595*MDK.d.R100+-0.5938881*CDC.d.R100*- IGF.d.R100+-1.0736184*CDC.d.R100*HOXA.d.R100+-1.3340189*IGF.d.R100*HOXA.d.- R100+0.3126461*CDC.d.R100*IL8R.d.R100+1.4597355*IGF.d.R100*IL8R.d.R100+1.8- 739459*HOXA.d.R100*IL8R.d.R100+-1.035054*CDC.d.R100*MDK.d.R100+-2.5885156*- IGF.d.R100*MDK.d.R100+-2.7013483*HOXA.d.R100*MDK.d.R100+1.4546134*IL8R.d.R- 100*MDK.d.R100+0.0767503*CDC.d.R100*IGF.d.R100*HOXA.d.R100+-0.0663361*CDC.- d.R100*IGF.d.R100*IL8R.d.R100+-0.1015552*CDC.d.R100*HOXA.d.R100*IL8R.d.R10- 0+-0.2110656*IGF.d.R100*HOXA.d.R100*IL8R.d.R100+0.1361215*CDC.d.R100*IGF.d- .R100*MDK.d.R100+0.1601118*CDC.d.R100*HOXA.d.R100*MDK.d.R100+0.259745*IGF.- d.R100*HOXA.d.R100*MDK.d.R100+-0.0106468*CDC.d.R100*IL8R.d.R100*MDK.d.R100- +-0.1947899*IGF.d.R100*IL8R.d.R100*MDK.d.R100+-0.185286*HOXA.d.R100*IL8R.d- .R100*MDK.d.R100+0.0136603*CDC.d.R100*IGF.d.R100*HOXA.d.R100*IL8R.d.R100+-- 0.0151368*CDC.d.R100*IGF.d.R100*HOXA.d.R100*MDK.d.R100+0.0056651*CDC.d.R10- 0*IGF.d.R100*IL8R.d.R100*MDK.d.R100+0.0030538*CDC.d.R100*HOXA.d.R100*IL8R.- d.R100*MDK.d.R100+0.0232556*IGF.d.R100*HOXA.d.R100*IL8R.d.R100*MDK.d.R100+- -0.000867*CDC.d.R100*IGF.d.R100*HOXA.d.R100*IL8R.d.R100*MDK.d.R100
Results
[0316] qRT-PCR Analysis of Urine Samples
[0317] To obtain an overview of the effect of IL8Rb on TCC detection, two dimensional scatter plots were constructed using qRT-PCR data obtained from the urine of patients with either TCC (n=56) or the non-malignant conditions urolithiasis (n=25), urinary tract infection (n=18) or cystitis (n=18). The scatter plots were constructed using pairs of genes from a four gene signature (MDK, CDC2, HOXA13, IGFBP5). IL8Rb was then substituted for one gene of each pair and the data re-plotted. These plots are shown in FIGS. 2a-2f. Substitution of IL8Rb for IGFBP5 and HOXA13 in plots with MDK (FIGS. 2a-2c) showed improved separation between samples from patients with TCC and those with non-malignant conditions. The same trend was observed in plots with CDC2 in which IL8Rb was substituted for IGFBP5 and HOXA13 (FIGS. 2d-2f).
[0318] The contribution of IL8Rb to the correct diagnosis of TCC in patients presenting with gross hematuria was then quantified by ROC curve analysis. qRT-PCR data for each gene in the signature (MDK, CDC2, IGFBP5 and HOXA13) and IL8Rb was used to develop linear discriminate algorithms that maximized the discrimination between the patients with TCC and those without. Two linear discriminate algorithms were developed using the entire cohort of 442 samples: LD1, which used the qRT-PCR data from MDK, CDC2, HOXA13 and IGFBP5 and LD2, which used MDK, CDC2, HOXA13, IGFBP5 and IL8Rb. LD1 and LD2 were then used to generate ROC curves showing the sensitivity and specificity of TCC detection in the group of patients with confirmed TCC (n=56) or the non-malignant conditions urolithiasis (n=25), urinary tract infection (n=18) or cystitis (n=18). FIG. 3a shows the ROC curves for LD1 and LD2. The area under the ROC curve for LD1 was 78% compared to 84% for LD2.
[0319] As an alternative to linear discriminate analysis, logistic regression was used as an independent method to develop an algorithm for the discrimination between patients with TCC and those with non-malignant disease. As for the linear discriminate analysis, the logistic regression algorithms were developed using the entire cohort of 442 samples. The ROC curves obtained using logistic regression and the 56 TCC and 61 non-malignant samples described above are shown in FIG. 3b. The area under the ROC curve for LR1 (obtained using qRT-PCR data from MDK, CDC2, HOXA13 and IGFBP5) was 80% compared to 86% for LR2 (obtained using qRT-PCR data from MDK, CDC2, HOXA13, IGFBP5 and IL8Rb). This data clearly illustrates that inclusion of IL8Rb in methods for the detection of TCC using urine samples can lead to improved discrimination between patients with TCC and non-malignant diseases such as cystitis, urinary tract infection and urolithiasis.
[0320] To confirm the improved accuracy afforded by IL8Rb for the discrimination between patients with TCC and urolithiasis, urinary tract infection or cystitis was maintained in an unselected cohort of patients comprising a larger number and diversity of non-malignant patients, the ROC curve analyses were repeated with the entire cohort of 442 samples described in Table 1. In this analysis, the area under the curve for LD1 and LD2 was 86 and 89%, respectively (FIG. 4a). Similarly, the area under the curve for LR1 was 87% and for LR2 91% (FIG. 4b). This result confirms that IL8Rb leads to improved accuracy in the detection of TCC using urine samples.
[0321] This improvement in cancer detection due to the inclusion of IL8Rb was further illustrated by applying LD1/LD2 and LR1/LR2 to the 442 patient cohort and then determining the sensitivity of detection of stage Ta TCC alone. Stage Ta tumors are smaller, more differentiated tumors that are typically more difficult to detect than higher stage tumors. LD1 detected 18/31 (58%) of the Ta tumors compared to 19/31 (61%) for LD2 at a specificity of 85%. LR1 detected 21/31 (68%) compared to 24/31 (77%) for LR2 (specificity of 85%). This data shows that the inclusion of IL8Rb into the LD and LR algorithms increased the sensitivity of detection of stage Ta tumors by up to 9%. In comparison to these RNA tests, the three other bladder cancer tests in this study showed markedly lower accuracy for the detection of Ta tumors: urine cytology (39% sensitivity, 94% specificity), NMP22 ELISA (35% sensitivity, 88% specificity) and NMP22 (BladderChek.RTM. "a registered trademark of Matritech, Inc. of Massachusetts, United States") (39% sensitivity, 96% specificity).
IL8Rb as an Aid in the Diagnosis of Inflammation of the Urinary Tract
[0322] To determine the ability of IL8Rb to be used in the diagnosis of patients with inflammation of the urinary tract due to causes such as cystitis or urinary tract infections, the urine levels of IL8Rb mRNA in hematuria patients diagnosed with benign prostate hyperplasia, non-specific prostate disease, vascular prostate, hematuria secondary to warfarin use, and cystitis/urinary tract infection were determined by qRT-PCR. The mean IL8Rb .DELTA.Ct levels for each of these conditions were -3.12, -3.10, -2.84, -1.98 and -5.27, respectively. The difference between the mean of the IL8Rb level in patients with cystitis/urinary tract infection and the other non-malignant states combined was determined to be significant (p=0.001) using the Wilcoxon rank sum test. Box plots portraying this data are shown in FIG. 5. This data shows an elevation of IL8Rb levels in the majority of patients diagnosed with either cystitis or urinary tract infection compared to the other non-malignant conditions examined. Overlap between plots is likely to be explained by a combination of three factors: (i) the inability of standard clinical practice to correctly diagnose each condition, (ii) co-morbidity (e.g., infection and benign prostate hyperplasia), and (iii) the normal association of high urine neutrophil counts in a subset of patients with benign prostate hyperplasia, non-specific prostate disease, vascular prostate or hematuria secondary to warfarin use. Regardless, given the strict association between inflammation and neutrophil numbers, the quantification of IL8Rb in urine provides an accurate method of detecting inflammation of the urinary tract, be it as a consequence of infection or in association with other non-malignant conditions.
Example 2
[0323] Methods
[0324] Study Population
[0325] A consecutive series of patients without a prior history of TCC were recruited prospectively from nine urology clinics in New Zealand and two in Australia between 28 Apr. 2008 and 11 Aug. 2009. The patient set included the patients used in example 1, but included an additional 46 patients, whose data was not available for the first analysis. The further studying also includes further analysis of the results obtained. The samples were collected and RNA collected and tested as described in Example 1.
[0326] RNA Test Development
[0327] uRNA.RTM. consists of four mRNA markers, CDC2, HOXA13, MDK and IGFBP5. These markers were selected on the basis of their low expression in blood and inflammatory cells and over-expression in TCC..sup.2 In this cohort study, we prospectively specified a linear discriminate algorithm (uRNA-D) that combined the four markers into a single score. uRNA-D was independent, being developed on an earlier dataset. It was not however, derived using a strictly characterized patient group representing the intended target population for the test. As a consequence, the study protocol also defined the development of a new algorithm (Classifier-D) for the use of the five markers CDC2, HOXA13, MDK, IGFBP5 and IL8Rb using data obtained from the patients recruited to the current cohort study.
[0328] In addition to Classifier-D, a second algorithm (Classifier-S) was derived using the cohort study data to enable identification of tumors that were either of advancing stage (.gtoreq.stage 1) or high grade (WHO/ISUP 1998 classification). Algorithm-S comprised all five markers, including CDC2 and HOXA13 which had previously been shown to be differentially expressed between Stage Ta tumors and those .gtoreq.stage 1.
[0329] Classifier Development
[0330] Development of two classifiers for the use of the five markers CDC2, HOXA13, MDK, IGFBP5 and IL8Rb (Classifier-D and Classifier-S) were based on data obtained in this study, in accordance with the methods outlined in this specification. Briefly, logistic regression models were made using the statistical programming environment, R (R Development Core Team (2011). R: A language and environment for statistical computing. R Foundation for Statistical Computing, Vienna, Austria. ISBN 3-900051-07-0, URL http://www.R-project.org/). Models made using .DELTA.C.sub.P values for each of the five markers and their two way interactions (e.g., MDK.times.CDC2, MDK.times.IGFBP5, etc) were evaluated for their ability to classify; those with the lowest AIC values were evaluated in a leave-one-out cross validation procedure for their sensitivity when the specificity was set to 85%. Several models demonstrated comparable performance for each of Classifier-D and Classifier-S, with the model with the fewest numbers of parameters being selected.
[0331] Statistical Methods
[0332] Where a diagnostic test was specified in the protocol, proportions and 95% confidence intervals were calculated for sensitivity and specificity. Receiver operating characteristic (ROC) curves were plotted and compared using the Stata roctab and roccomp commands (Statacorp and Delong). For Classifier-D confidence intervals are not appropriate, but Fishers exact or Chi squared tests (where sample sizes allow) were used to test for an association between TCC or patient characteristics and chances of true positive or false positive results. Logistic regression models were used to explore factors associated with false positive and false negative results. All analyses were carried out in Stata version 11.2.
Results
[0333] A total of 517 patients were initially recruited to the study; 4% of patients were excluded because they were found to be ineligible (n=10), did not undergo cystoscopy (n=9), TCC status was not stated (n=2) or they did not provide an acceptable urine sample (n=2) (FIG. 8). A further 10 patients were excluded from the analysis because they did not have results for one or more of the urine tests. The baseline demographic and clinical characteristics of the 485 remaining patients are shown in FIG. 9.
[0334] The prevalence of TCC in the cohort was 13.6%. Two were missing a review stage (both were Ta by local review) and two were not given a review grade (one was grade 1 by the local pathologist, the other low). Of the 66 tumors, 55 were superficial (stage Ta, T1 or Tis) and 11 were muscle invasive (T2). No patients had detectable metastases or involvement of regional lymph nodes. Using the 1973 grading system, 24 were classified as grade 3, 38 grade 2, three grade 1 and one unknown. With the WHO98 system, 29 were classified as high grade, four mixed, 32 low grade and one unknown. In addition to the TCCs, two patients were diagnosed with a papilloma, and seven with other neoplasms (five of these urological).
[0335] The cutoff for the uRNA-D test was determined on the study cohort, with specificity set at 85%. With this cutoff, uRNA-D detected 41 of the 66 TCC cases (sensitivity of 62%), compared with NMP22.TM. ELISA (50%), Bladderchek.RTM. (38%) and cytology (56%). The RNA test developed on the cohort data Classifier-D detected 54 of the TCC cases (82%) at a specificity of 85% and 48 (73%) at a specificity of 90%. uRNA-D and NMP22.TM. ELISA values can be directly compared as both tests were fully specified prior to the study. FIG. 21 shows the ROC curves; the area under the curves (AUCs) are 0.81 and 0.73 respectively (p=0.03). The ROC curve for Classifier-D was 0.87 (FIG. 21), and the improvement in performance relative to uRNA-D appears to be mostly in the range of clinically relevant specificities (above 80%).
[0336] Overall, Classifier-D detected 97% of the high/grade 3 tumors, compared to uRNA-D (83%), cytology (83%), NMP22 ELISA (69%) and Bladderchek.RTM. (38%). Classifier-D was also more sensitive for the detection of low-grade tumors (69%), with the other tests ranging from 28-41% (FIG. 12) Classifier-D was positive for all the TCC cases of Stage .gtoreq.1 plus both Tis, but the sensitivity was 68% for stage Ta (p=0.016, FIG. 12). This was still substantially higher than the other tests, with uRNA-D being the next highest at 41%. TCC patients with macrohematuria or microhematuria evident in their urine sample were more likely to have their TCC detected by including IL8Rb than those without macrohematuria or microhematuria (p<0.0005), though this is likely to be at least partially a result of the higher proportion of high stage and grade TCCs among those with macrohematuria or microhematuria. Numbers were insufficient to explore this further in regression analyses.
[0337] Of the 12 cases missed by Classifier-D, all were stage Ta and all except one were low grade (WHO ISUP 1998). Only two of the twelve (both low grade, stage Ta TCC) were picked up by another test (one by both NMP22.TM. ELISA and BladderChek.RTM. and one by uRNA-D). Of the 12 cases missed by Classifier-D, all were stage Ta and all except one were low grade (WHO ISUP 1998). Only two of the twelve (both low grade, stage Ta TCC) were picked up by another test (one by both NMP22.TM. ELISA and BladderChek.RTM. and one by uRNA-D). Cytology did not pick up any TCCs that Classifier-D missed.
[0338] Patient A: High Grade renal pelvic T2 tumour, no concurrent Tis, no size given.
[0339] Patient B: High grade Bladder T3a no concurrent Tis, 2.times.3 cm
[0340] Patient C: a high grade tumour measuring 4.8.times.5.6 cm with extensive stromal and muscularis propria invasion, extending to the perivescical fat with no evidence of metastasis.
[0341] The specificity of the urine tests among those with alternative diagnoses and according to urine sample characteristics are shown in FIG. 13. Control patients with macrohematuria or microhematuria were more likely to have false positive tests than those without macrohematuria or microhematuria (p=0.002), and there was a trend that patients with calculi may as well, although the differences in specificity by diagnosis were not statistically significant overall (p=0.12). There were five patients with other urological cancers; only one of these gave a positive Classifier-D test result. Results from fitting logistic regression models were similar. In a logistic regression model with diagnosis and macrohematuria or microhematuria, the association with macrohematuria or microhematuria status remained significant (p=0.006) and, when compared directly to no diagnosis those with calculi had a 2.7 fold increased odds of a false positive test (95% CI (1.1 to 6.4), p=0.03). Age did not affect the specificity of the test.
[0342] Macrohematuria or microhematuria detected in the urine sample was the only factor clearly associated with test sensitivity. The predictive value of a positive test in this cohort was 63% for those with macrohematuria or microhematuria and 24% for those without, largely reflecting the greater prevalence of TCC in the patients with macrohematuria or microhematuria (39% vs 6%).
[0343] There were 54 patients with TCC in whom the Classifier-D test was positive. These patients were classified into severe and less severe TCC using Classifier-S. Severe TCC was defined as stage .gtoreq.1 or grade 3 at any stage. At a specificity of 90%, Classifier-S correctly classified 32/35 (91%) of the severe TCC cases.
Example 3: Combined Genotype and Phenotype Analysis of Patients with Hematuria I
[0344] This study focuses on patients presenting with confirmed asymptomatic microscopic hematuria (AH) who are undergoing a full clinical work-up for the investigation of possible urothelial cancer (UC). Approximately 500 patients are enrolled to participate in the study.
[0345] As used herein, terms are defined below in additional examples.
Objectives
[0346] Objectives are to determine the: (1) efficacy of a genotypic and phenotypic algorithm in patients presenting with micro hematuria who are scheduled for a full urological clinical work-up, (2) performance characteristics (sensitivity, specificity, area under the ROC curve, positive and negative predictive values) of the genotypic and phenotypic algorithm G+P INDEX for the detection of primary UC in patients presenting with confirmed microscopic hematuria, and (3) number of patients correctly diagnosed as negative for UC by a genotypic and phenotypic tool, the G+P INDEX and therefore do not require investigative cystoscopy.
Study Population
[0347] The study population consists of patients presenting with confirmed micro-hematuria who fulfill study requirements. Patients are recruited from general practices that refer patients to the urological clinics.
Informed Consent
[0348] Patients scheduled for investigative cystoscopy are contacted to discuss possible participation. Patients are informed of the nature of the study and consent is obtained. Patients provide demographic, occupational, and smoking history information, and ensure that they fully understand the patient information and consent forms prior to provision of their urine samples. Study coordinators complete a CRF page detailing the relevant inputs to the genotypic and phenotypic index and transfer the data for analysis.
Inclusion Criteria
[0349] Patients undergoing cystoscopic investigation for Urothelial Carcinoma following a confirmed clinical finding of microscopic hematuria (Minimum of 3 RBC per high power field (HPF)) on 2 or 3 properly collected urine specimens.sup.(3). [0350] Patients are willing to comply with study requirements. [0351] Patients are over 18 years of age.
Exclusion Criteria
[0351] [0352] Prior history of urothelial caarcinoma (UC). [0353] Current presentation of macroscopic hematuria [0354] Prior history (past 12 months of an episode of Macroscopic Hematuria with confirmed diagnosis (malignant or otherwise).
G+P Index
[0355] We developed a novel index, the "G+P Index," which comprises of a combination of both genotypic and phenotypic data. The Genotypic ("G") component utilizes RNA biomarker expression information in conjunction with five clinical factors collected from the patient in the same time window (Phenotypic data "P") to determine the risk of UC in AH patients.
[0356] All patients receive a standard clinical work-up to determine true clinical outcome and the outputs from this study are simulated outputs based on the clinical data collected and the genotypic data collected from the patients' urine samples. As such, patient care is not altered as a result of the study output. Patients provide urine samples, which are sent for genetic analysis.
Patient Triage
[0357] No change to overall standard of care is made for patients participating in the study. All patients scheduled for a full urological work-up undertake the appropriate investigations according to the current standard of care.
Study Data
[0358] Demographic and risk factor information are inputs to the genotypic and phenotypic index. Final disease state (as determined by flexible cystoscopy and follow up) are collated with (.PHI.) results and demographic information and subjected to statistical analysis.
Determination of the G+P Index
[0359] Using datasets obtained from samples collected from a large number of sites in New Zealand and Australia from approximately 500 patients, a training model to predict the probability of `TCC=Yes` was developed.
Data Collected for Variables Used in the Training and Validation Populations
[0360] Phenotypic Variables [0361] Clinical findings are: Gender, Age, Smoking history, and HFREQNEW (<=1 denoted as Low; >1 denoted as High).
[0362] Genotypic Variables
[0363] Genotypic Variables include expression of RNA markers: M1 (=MDK+CDC+IGBP5-HOXA13) and IL8R. Table 7 below shows estimates of the coefficients of each of the factors in the validation G+P INDEX:
TABLE-US-00008 TABLE 7 Analysis of Maximum Likelihood Estimates Wald Standard Chi- Parameter DF Estimate Error Square Pr > ChiSq Exp(Est) Intercept 1 -4.8445 0.6532 55.0092 <.0001 0.008 gender 2 1 -1.8544 0.6750 7.5484 0.0060 0.157 smoke 2 1 -0.9049 0.4537 3.9775 0.0461 0.405 HFREQNEW Low 1 -0.7015 0.3478 4.0681 0.0437 0.496 M1 1 1.2221 0.1553 61.9328 <.0001 3.394 IL8R 1 -0.2408 0.1789 1.8112 0.1784 0.786
[0364] FIG. 18 depicts ROC curves for the G+P Index. FIG. 18 is a graph of sensitivity (vertical axis) versus 1-specificity (horizontal axis) for results according to an embodiment of this invention. For comparison, a diagonal line depicts the model. The outcomes based solely upon Phenotypic information is shown as the dash-dotted line, the outcome based solely upon Genotypic information is shown as the dashed line, and the outcomes based on the G+P Index are shown as the solid line. These results indicate that the combination of Genotypic and Phenotypic information provides an unexpected, substantial improvement in prediction of outcome.
[0365] Exploratory models considered seven phenotypic variables, but AgeGT50 showed insignificant effect while there was insufficient data for RBC, so both of these variables were dropped from the final model. Based on the significance level of the remaining five phenotypic variables and the two RNA markers, an index was constructed. Using relationship between M1, IL8R and TCC(=yes) in the training dataset, a threshold of 4.5 and 2.5 was used for M1 and IL8R respectively. A score of 5, 4, 3, 2 and 1 was assigned to M1, Smokers, Male, IL8R, and HFREQ--which result in an index score ranging from 0 to 15. The integrated algorithm based on co-efficient is given below as the combined G+P index:
G+P INDEX=(1*HFREQ+3*Gender+4*SMK)+(5*M1+2*IL-8)
[0366] Odds ratios for different clinical factors that were retained in the final model are shown in FIG. 19. An odds ratio can be interpreted as having a harmful or protective effect upon the subject depending on how far it deviates from 1 (i.e., no effect). Odds ratios whose confidence limits exclude 1 are statistically significant. Generally, the factors with higher odd ratio (e.g. SMK, Gender) are assigned larger weights compared to factors with small odds ratio (e.g. HFREQ).
[0367] The classification table for the full model is presented below in Table 8.
TABLE-US-00009 TABLE 8 Classification Table Correct Incorrect Percentages Prob Non- Non- False False Level Event Event Event Event Correct Sensitivity Specificaty POS NEG 0.000 66 0 415 0 13.7 100.0 0.0 86.3 -- 0.050 61 245 170 5 63.6 92.4 59.0 73.6 2.0 0.100 54 319 96 12 77.5 81.8 76.9 64.0 3.6 0.150 47 358 57 19 84.2 71.2 86.3 54.8 5.0 0.200 45 376 39 21 87.5 68.2 90.6 46.4 5.3 0.250 40 381 34 26 87.5 60.6 91.8 45.9 6.4 0.030 37 391 24 29 89.0 56.1 94.2 39.3 6.9 0.350 36 398 17 30 90.2 54.5 95.9 32.1 7.0 0.400 35 402 13 31 90.9 53.0 96.9 27.1 7.2 0.450 35 403 12 31 91.1 53.0 97.1 25.5 7.1 0.500 31 407 8 35 91.1 47.0 98.1 20.5 7.9 0.550 29 408 7 37 90.0 43.9 98.3 19.4 8.3 0.600 29 408 7 37 90.9 42.4 98.6 17.6 8.5 0.650 28 409 6 38 90.9 42.4 98.6 17.6 8.5 0.700 24 409 6 42 90.0 36.4 98.6 20.0 9.3 0.750 20 409 6 46 89.2 30.3 98.6 23.1 10.1 0.800 12 410 5 54 87.7 18.2 98.9 29.4 11.6 0.850 11 411 4 55 87.7 16.7 99.0 26.7 11.8 0.900 6 412 3 60 86.9 9.1 99.3 33.3 12.7 0.950 1 413 2 65 86.1 1.5 99.5 66.7 13.6 1.000 0 415 0 66 86.3 0.0 100.0 -- 13.7
[0368] Preliminary Validation Study of G+P Index
[0369] To further test the use of the G+P Index, we carried out another study. Based on the statistical significance of various clinical and RNA markers, an index was constructed. There were 98 subjects whose TCC status (yes or no) as well as G+P INDEX variables were available.
[0370] A score of 5, 4, 3, 2 and 1 was assigned to M1 (genetic tests), Smokers, Male, IL8R, and HFREQ--which results in an index score ranging from 0 to 15. The number of true positives and true negatives were 6 and 84 respectively. Similarly, the number of false positives and false negatives were 5 and 3 respectively. Thus, the overall accuracy of the proposed index was 0.92.
[0371] Implications and Follow Up Based on the G+P Index
[0372] If the G+P INDEX result indicates a "High Risk" of UC defined as a score of 11-15 or above, the patient is prioritized for a flexible cystoscopy and abdominal ultrasound as clinically indicated.
[0373] If the G+P INDEX result indicates an "Moderate Risk" of UC, defined as a score of from 6-10, the patient is reviewed and followed up as per clinical practice. Consideration may be given to the use of cytology, uretoscopy and/or a CT scan.
[0374] If the G+P INDEX result indicates a "Low Risk" of UC, defined as a score of from 0-5, the patient will receive the normal standard of care and be placed on the appropriate waiting list.
REFERENCES
[0375] The following references relate to the disclosure above. [0376] Agresti, A. and Coull, B. A. (1998) Approximate is better than "ex-act" for interval estimation of binomial proportions. The American Statistician, 52, 119-126. [0377] Altekruse S F, Kosary C L, Krapcho M, Neyman N, Aminou R, Waldron W, Ruhl J, Howlader N, Tatalovich Z, Cho H, Mariotto A, Eisner M P, Lewis D R, Cronin K, Chen H S, Feuer E J, Stinchcomb D G, Edwards B K (eds). SEER Cancer Statistics Review, 1975-2007, National Cancer Institute. Bethesda, Md., http://seer.cancer.gov/csr/1975_2007/, based on November 2009 SEER data submission, posted to the SEER web site, 2010. [0378] Brown, L. D. Cal, T. T. and DasGupta, A. (2001) Interval estimation for a binomial proportion. Statistical Science, 16, 101-133. [0379] Buckhaults et al., (Cancer Research 61:6996-7001 (2002) describes certain secreted and cell surface genes expressed in colorectal tumours. [0380] Byrd, R. H., Lu, P., Nocedal, J. and Zhu, C. (1995) A limited memory algorithm for bound constrained optimization. SIAM J. Scientific Computing, 16, 1190-1208. [0381] Dalgaard (2008). "Introductory Statistics with R, 2nd edition"; Peter Dalgaard, Chapter 13 (2008), Springer, ISBN 978-0-387-79053-4. [0382] DeLong, E. R., D. M. DeLong, and D. L. Clarke-Pearson. 1988. Comparing the areas under two or more correlated receiver operating characteristic curves: A nonparametric approach. Biometrics 44: 837-845. [0383] Gottschalk, P. G. and Dunn, J. R. (2005) The five-parameter logistic: A characterization and comparison with the four-parameter logistic. Analytic Biochemistry, 343, 54-65. Doi:10.1016/j.ab0.2005.04.035 [0384] Grossfield G, Wolf J, Litwan M, Hricak H, Shuler C, Agerter D, et al. Asymptomatic microscopic hematuria in adults: summary of AUA best practice policy recommendations. AFP 2001:63:1145-54. [0385] Hall et al (Laryngoscope 113(1):77-81 (2003) (PMID: 12679418) (Abstract) described predictive value of serum thyroglobulin in thyroid cancer. [0386] Hoerl, A. E. (1962) Application of ridge analysis to regression problems. Chemical Engineering Progress, 58, 54-59. [0387] Holyoake A, O'Sullivan P, Pollock R, Best T, Watanabe J, Kajita Y, et al. Development of a multiplex RNA urine test for the detection and stratification of transitional cell carcinoma of the bladder. Clin Cancer Res. 2008 Feb. 1; 14(3):742-9. [0388] Hotte et al., (AJ. American Cancer Society 95(3):507-512 (2002) describes plasma osteopontin as a protein detectable in human body fluids and is associated with certain malignancies. [0389] Kim et al., (JAMA 287(13):1671-1679 (2002) describes osteopontin as a potential diagnostic biomarker for ovarian cancer. [0390] Koopman et al., (Cancer Epidemiol. Biomarkers Pre.sup.y 13(3):487-491 (2004) (Abstract) describes osteopontin as a biomarker for pancreatic adenocarcinoma. [0391] Kuo et al (Clin. Chim. Acta. 294(1-2):157-168 (2000) (Abstract) describes serum matrix metalloproteinase-2 and -9 in HCF- and HBV-infected patients. [0392] Leman et al., (Urology, 69(4) 714-20 (2007) (Abstract) describes EPCA-2 as a serum marker for prostate cancer. [0393] Loo R, Lieberman S, Slezak J, Landa H, Mariani A, Nicolaisen G, Aspera A and Jaconsen S: Stratifying risk of urinary tract malignant tumors in patients with asymptomatic microscopic hematuria. Mayo Clin Proc. 2013, 88(2); 129-138. [0394] Lunn, D., Spiegelhalter, D., Thomas, A. and Best, N. (2009) The BUGS project: Evolution, critique and future directions (with discussion), Statistics in Medicine 28: 3049-3082. [0395] Marchi et al., (Cancer 112, 1313-1324 (2008) (Abstract) describes ProApolipoprotein Al as a serum marker of brain metastases in lung cancer patients. [0396] Martin et al., (Prostate Cancer Prostatic Dis. Mar. 9, 2004 (PMID: 15007379) (Abstract) described use of human kallikrein 2, prostate-specific antigen (PSA) and free PSA as markers for detection of prostate cancer. [0397] Mazzaferri et al., (J. Clin. Endocrinol. Metab. 88(4):1433-1441 (2003) (Abstract) describes thyroglobulin as a potential monitoring method for patients with thyroid carcinoma. [0398] McDonald M, Swagerty D, Wetzel L: Assessment of Microscopic hematuria in adults. AFP 2006 73:10. [0399] Melle et al., (Clin. Chem. 53(4), 629-635 (2007) (Abstract) describes HSP27 as a serum marker for pancreatic adenocarcinoma. [0400] More, J. J. (1978) The Levenberg-Marquardt algorithm: implementation and theory, in Lecture Notes in Mathematics 630: Numerical Analysis, G. A. Watson (Ed.), Springer-Verlag: Berlin, pp. 105-116. [0401] Nelder, J. A. and Mead, R. (1965) A simplex algorithm for function minimization. Computer Journal 7, 308-31. [0402] O'Sullivan P, Sharples K, Dalphin M et al: A Multigene Urine Test for the Detection and Stratification of Bladder Cancer in Patients Presenting with Hematuria. J Urol 2012, Vol 188 No 3; 746 [0403] Pellegrini et al., (Cancer Immunol. Immunother. 49(7):388-394 (2000) (Abstract) describes measurement of soluble carcinoembryonic antigen and TIMP 1 as markers for pre-invasive colorectal cancer.
[0404] (R Development Core Team (2009). R: A language and environment for statistical computing. R Foundation for Statistical Computing, Vienna, Austria. ISBN 3-900051-07-0, URL http://WWW. R-project.org/) [0405] Richards, F. J. (1959) A flexible growth function for empirical use. Journal of Experimental Botany. 10, 290-300. [0406] Rudland et al., (Cancer Rese arch 62: 3417-3427 (2002) describes osteopontin as a metastasis associated protein in human breast cancer. [0407] Sing et al (2009). (Tobias Sing, Oliver Sander, Niko Beerenwinkel and Thomas Lengauer (2009). ROCR: Visualizing the performance of scoring classifiers. R package version 1.0-4. http://CRAN.R-project.org/package=ROCR). [0408] Speiss, A.-N., Feig, C. and Ritz, C. (2008) Highly accurate sigmoidal fitting of real-time RCR data by introducing a parameter for asymmetry. BMC Bioinformatics, 9, 221. Doi:10.1186/1471-2105-9-211. [0409] Sprenger H, Lloyd A R, Lautens L L, Bonner T I, Kelvin D J. Structure, genomic organization, and expression of the human interleukin-8 receptor B gene. J Biol Chem. 1994 Apr. 15; 269(15):11065-72. [0410] StataCorp. 2009. Stata Statistical Software: Release 11. College Station, Tex.: StataCorp LP. [0411] Schwartz G: Proper evaluation of asymptomatic microscopic hematuria in the era of evidence-based medicine-progress is being made. Mayo Clin Proc. 2013, 88(2); 123-125. [0412] Trivedi C and Messing E M: Commentary: the role of cytologic analysis of voided urine in the work-up of asymptomatic microhematuria. BMC Urology 2009, 9:13 [0413] Tsigkou et al., (I Clin Endocrinol Metab, 92(7) 2526-31 (2007) (Abstract) describes total inhibin as a potential serum marker for ovarian cancer. [0414] Tsigkou et al., (I Clin Endocrinol Metab, 92(7) 2526-31 (2007) (Abstract) describes total inhibin as a potential serum marker for ovarian cancer. [0415] Venables, W. N. & Ripley, B. D. (2002). Modern Applied Statistics with S. Fourth Edition. Springer, New York. ISBN 0-387-95457-0). [0416] Whitley et al, (Dim Lab. Med. 24(1):29-47 (2004) (Abstract) describes thyroglobulin as a serum marker for thyroid carcinoma. [0417] Yoshikawa et al., (Cancer Letters, 151: 81-86 (2000) describes tissue inhibitor of matrix metalloproteinase-1 in plasma of patients with gastric cancer.
Example 4: Triage of Patients Presenting with Hematuria Using G+P Index II
[0418] The G+P INDEX indicates a Positive when it takes values in the range of 11 to 15.
Definitions
[0419] As used herein, the following definitions are used in this and the following examples.
[0420] "AMH" means asymptomatic microhematuria;
[0421] "AUA" means American Urological Association;
[0422] "AUC" means area under the curve;
[0423] "CI" means confidence interval;
[0424] "CT" means computed tomography;
[0425] "ELISA" means enzyme-linked immunosorbent assay;
[0426] "FISH" means fluorescence in situ hybridization;
[0427] "HPF" means high-powered field;
[0428] "log OR" means log odds ratio;
[0429] "Hfreq" means average daily frequency of hematuria during the most recent hematuria episode;
[0430] "ISUP" means International Society of Urological Pathology;
[0431] "MRI" means magnetic resonance imaging;
[0432] "NPV" means negative predictive value;
[0433] "OR" means odds ratio;
[0434] "QC" means quality control;
[0435] "QoL" means quality of life;
[0436] "Phenotypic" is used to define clinical prognostic characteristics and to distinguish them from gene expression-based biomarkers that have been broadly defined as `genotypic` variables.
[0437] "RBC" means red blood cell;
[0438] "ROC" means receiver operating curve;
[0439] "RT-qPCR" means quantitative reverse transcription polymerase chain reaction;
[0440] "STARD" means Standards for Reporting of Diagnostic Accuracy;
[0441] "UC" means urothelial carcinoma;
[0442] "WHO" means World Health Organization.
[0443] Introduction
[0444] Hematuria, which is most often associated with causes such as benign prostatic enlargement, infection or urinary calculi, but is also symptomatic of urothelial carcinoma (UC), is estimated to occur in between 1 and 22% of patients in a general population [1,2]. Macroscopic (macro-) hematuria is characterized by a visible colour change in the urine of patients, while microscopic (micro-) hematuria is defined more precisely as the presence of .gtoreq.3 red blood cells per high-powered field (RBCs/HPF) in three concurrently collected urine samples [2]. The overall prevalence of UC in patients with microhematuria has been reported to be approximately 4%, whereas several studies have consistently shown that the prevalence of UC is much higher in patients with macrohematuria, ranging from approximately 12-23% [2-6], yet up to four times as many patients with micro-versus macrohematuria present for urological evaluation [7]. Notably, given that recent changes to the American Urological Association (AUA) guidelines [2] have seen the threshold for asymptomatic microhematuria (AMH) lowered to .gtoreq.3 RBCs/HPF in a single sample, and even lower thresholds (.gtoreq.1 RBC/HPF) have been proposed [8], a consequential increase in the number of patients with hematuria who will undergo a urological work-up to investigate potential UC and a corresponding increase in the overall clinical and financial burden of these patients on healthcare systems is expected.
[0445] Such hematuria-related referrals place a significant clinical burden on urologists, as all patients must undergo a full work-up to provide an often inconclusive diagnosis. Furthermore, the existing diagnostic tests--many of which are invasive or have high radiation loadings--can have a detrimental effect on patient quality of life (QoL), especially if the patient receives repeated cystoscopies as mandated in the current guidelines [2]. It has been reported that for cystoscopies performed without prophylactic antibiotics, 22% of patients had asymptomatic bacteriuria and 1.9% of patients developed a febrile urinary tract infection (UTI) within 30 days [9]. Other studies have also reported a high prevalence of macrohematuria, pain on voiding and transient erectile dysfunction in men following cystoscopy [10,11].
[0446] Healthcare systems also incur a significant financial burden as a result of patients with hematuria undergoing a full urological work up [12,13] and it has been concluded that urine cytology adds costs without offering any significant diagnostic benefit [14-16]. Consequently, integrating an accurate, non-invasive test into the primary clinical work-up of patients presenting with hematuria allows physicians to effectively triage patients with hematuria, thereby reducing the number of patients undergoing a full urological work-up and investigative cystoscopy for UC, and offers significant benefits to both patients and healthcare systems [15-19].
[0447] Several clinical prognostic characteristics, including age, gender, smoking history and degree of hematuria, are well-established as risk factors for UC in patients with hematuria [3,20-22]. Recently, several groups have attempted to develop models based on clinical prognostic characteristics to predict the risk of UC in patients with hematuria [20-22], but critically, these models offer limited accuracy and have largely been focused on detecting patients with UC rather than ruling out patients who do not have disease. These detection-focused models have therefore been insufficient to reliably identify patients with disease during a primary evaluation, even if used in combination with urine cytology [20-22].
[0448] Despite the higher incidence of UC in patients presenting with macrohematuria, a number of studies show there is no significant difference in the distribution of UC by grade and stage in patients presenting with micro-compared with those presenting with macrohematuria [5,23-25]. Therefore, the AUA recommends that all patients with macrohematuria or AMH be referred to a urologist for a full urological work-up, as severity of hematuria is not sufficiently predictive for the presence of UC [2]. However, as patients with hematuria may only undergo limited urinalysis in a primary evaluation, consisting of cytology and in some cases imaging studies, such as ultrasound, a full urological work-up is often necessary to conclusively detect or rule out UC. While urine cytology is specified in current guidelines and routinely used in patients with suspected UC, cytology results are often inconclusive with atypical or suspicious findings and also suffer from a low diagnostic yield driven by a relatively high risk of false negative results for patients with UC-related hematuria [2,26,27]. Consequently, it can be difficult to rule out benign causes of hematuria, whether macrohematuria or AMH, during a primary evaluation, especially if UC-related hematuria is intermittent and appears to resolve following treatment for a benign cause [12].
[0449] A number of gene-based studies have set out to profile urinary biomarkers in patients with UC, and these biomarkers may be useful in their own right for detecting disease [28,29]. An opportunity also exists to triage out patients on the basis of their clinical characteristics and gene expression profile. Combining NMP22 enzyme-linked immunosorbent assay (ELISA) tests or a panel of gene markers with clinical characteristics has been shown to improve diagnostic accuracy compared with clinical characteristics alone, but these combined models have not yet delivered significant advances in overall diagnostic accuracy, especially when attempting to identify low-risk patients [30,31]. Nevertheless it is considered that incorporating clinical factors and specific gene expression into a combined algorithm is likely to provide the best guidance for diagnosing and managing patients with hematuria or UC [32].
[0450] Cxbladder.TM. Detect (Pacific Edge Ltd., Dunedin, New Zealand), a multigene test performed on unfractionated urine has previously been shown to be more sensitive than urine cytology and NMP22 for detecting UC in patients with macrohematuria [33] and more accurate than urine cytology, NMP22 and fluorescence in situ hybridization (FISH) in a comparative analysis (Kasabov, Darling, Breen, et al., unpublished observations). Cxbladder Detect uses quantitative reverse transcription polymerase chain reaction (RT-qPCR) technology to quantify five mRNA markers, four markers that are overexpressed in UC alongside a fifth marker that is elevated in non-malignant inflammatory conditions, and offers a high level of specificity and sensitivity when used to detect UC in patients presenting with hematuria [33]. It was hypothesized that an integrated model combining high-performance genetic biomarkers with phenotypic variables collected from the same patients will provide superior clinical resolution using high sensitivity (i.e. a low probability of a patient with UC receiving a false negative result), high negative predictive value (i.e. a high proportion of all negative results being true) and a high test-negative rate to enable the accurate triage of patients who have a low probability of UC. These genotypic and phenotypic variables when combined into a novel segregation model enable patients with hematuria who have a low probability of UC to be identified and triaged, as opposed to undergoing a full urological work-up.
[0451] Methods
[0452] Patient Selection
[0453] A prospective sample of 695 patients have been analysed, where true clinical outcome was determined using a conventional clinical evaluation. The study sample consists of an initial cohort of patients with hematuria was consented and sampled as previously described [33], where a consecutive series of 517 patients with a recent history of macrohematuria, aged .gtoreq.45 years and without a prior history of UC, were recruited prospectively from nine urology clinics in Australia and New Zealand. These patients were followed for three months for determination of UC status or alternative diagnosis following multigene analysis of urine samples, with a positive UC diagnosis being based on cystoscopical appearance and histopathological examination. The stage of disease was classified according to the TNM staging criteria determined by pathology and diagnostic imaging investigations and tumor grade was classified according to local pathology practice, using the 1998 World Health Organization (WHO)/International Society of Urological Pathology (ISUP) consensus classification [34].
[0454] Additional cohorts of 94 and 84 patients undergoing urological investigations following a macrohematuria event were subsequently recruited from two centers in New Zealand between March 2012 and April 2013 and included in the development of models. Centers were selected to participate on the basis of their previous experience participating in the initial study and their willingness to evaluate the Cxbladder Detect product within individual clinical settings.
[0455] An additional representative test set of 45 patients presenting with microhematuria were prospectively collected and used for further validation of the G+P INDEX, as set out below.
[0456] Eligibility criteria were similar to those of [33], except that patients aged .gtoreq.18 years and those who had previously undergone a cystoscopy to investigate UC that proved to be negative were eligible for enrolment. Furthermore, as in [33], patients exhibiting symptoms indicative of a UTI, or bladder or renal calculi, were excluded.
[0457] Ethical approval for this study was granted by all participating centers and informed consent obtained from all patients providing samples.
[0458] Urine Sample Collection and Assessment
[0459] To provide gene expression data, a single mid-stream urine sample was collected from participants using the Urine Sampling System from Pacific Edge. Multigene analysis of samples from all studies was carried out in accordance with the standard operating procedure, as is used for the commercially available Cxbladder Detect multigenic test. All urine samples (4.5 mL) from the initial cohort were collected at a clinic prior to cystoscopy and transferred to a stabilization liquid via vacuum driven aspiration and sent to Pacific Edge within 48 hours. The samples were then stored at -80.degree. C. until required for batch analysis. Samples from the subsequent cohorts were collected in the same manner, but shipped to Pacific Edge at ambient temperature and processed within 7 days of sample collection in accordance with revised quality control (QC) limits and tolerance testing performed at the Pacific Edge diagnostic laboratory.
[0460] Statistical Analysis
[0461] Univariate logistic regression was used to estimate the unadjusted (raw) log odds ratio (log OR) co-efficients for four binary phenotypic variables associated with UC: age, gender, smoking history and average daily frequency of hematuria during the patient's most recent hematuria episode (Hfreq; see Table 9).
TABLE-US-00010 TABLE 9 Definitions of binary phenotypic variables associated with UC and their corresponding scores Score Phenotypic parameter 0 1 Gender Female Male Age <60 years .gtoreq.60 years Smoking history Never smoked Current or past smoker Hfreq .ltoreq.1 episode/day >1 episode/day
[0462] Multivariate logistic regression on all four phenotypic variables was used to generate adjusted log OR co-efficients in the phenotypic model (P INDEX).
[0463] G INDEX was developed using logistic regression to determine the association between UC and mRNA concentrations for the five Cxbladder.RTM. Detect genes (IGFBP5, HOXA13, MDK, CDK1 and CXCR2) in urine samples. A multivariate genotypic-phenotypic model (G+P INDEX) was generated using a combination of all nine variables from the G INDEX and P INDEX. These linear models determined the log OR from which the probability of a patient having UC was derived.
[0464] The relative performance of each of model was illustrated in receiver operating curves (ROCs) plotting the false positive rate versus the true positive rate when testing for UC, as determined by each model. Area under the curve (AUC) was used to compare the relative efficiency of each model with an AUC approaching 1 deemed to be optimal.
[0465] To reduce potential bias when model estimation and prediction are performed on the same data set, a bias-corrected AUC was calculated for each of the three logistic regression models using bootstrap resampling [35]. The difference between the nominal AUC from the original sample and the average AUC from the bootstrap samples is an estimate of the sample bias and the nominal AUCs were adjusted accordingly. Bootstrap estimates of bias-corrected confidence intervals (CIs) were also obtained [36].
[0466] Furthermore, it was a design criteria for this clinical test that the performance characteristics of each model must exceed a threshold NPV of 0.97, with as high a sensitivity as possible with the further caveat of having a high test-negative rate. The test negative rate is selected to provide a high clinical resolution when triaging out patients presenting with hematuria who have a low probability of having UC. Comparisons were made between the G INDEX, P INDEX and G+P INDEX and the performance of each model was determined in terms of sensitivity and NPV with a sufficiently high test-negative rate to provide an effective tool for triaging out patients with haematuria who have a low probability of UC.
[0467] Results
[0468] Sample Demographics
[0469] Of the 695 patients with macrohematuria registered across the three cohorts, 23 were deemed to be ineligible and samples from a further 85 patients were excluded after enrolment due to the absence of sufficient data or samples failing to meet QC standards (see FIG. 20A). In total, samples from 587 patients were available for modelling comprising 72 UC-positive and 515 UC-negative samples.
[0470] Of the 45 samples from patients with microhematuria provided, 40 were suitable for analysis with 5 patients deemed ineligible and excluded from the analysis (see FIG. 20B). All 45 patients had received a full urological evaluation and clinical truth was confirmed as UC-negative. Full demographic data from both sample populations is presented in Table 10.
TABLE-US-00011 TABLE 10 Sample population demographics for patients with macro- and microhematuria with complete data Patients with Patients with macrohematuria microhematuria Parameter (N = 587), n (%) (N = 40), n (%) Age, years 0-49 65 (11.1) 21 (52.5) 50-59 111 (18.9) 60-69 145 (24.7) 19 (47.5) 70-79 175 (29.8) 80-100 91 (15.5) Gender Female 113 (19.3) 25 (62.5) Male 474 (80.7) 15 (37.5) Smoking history Never smoked 246 (41.9) 25 (62.5) Current or past 341 (58.1) 15 (37.5) smoker Hfreq .ltoreq.1 332 (56.6) 40 (100) (episodes/day) >1 255 (43.4) -- Tumor stage Normal 515 (87.7) 40 (100) T1 16 (2.7) -- T2 11 (1.9) -- T3 2 (0.3) -- Ta 40 (6.8) -- Tis 3 (0.5) --
[0471] Relationship Between Phenotypic Variables and Risk of UC in Patients with Macrohematuria
[0472] Unadjusted univariate logistic regression analyses of each of the four binary phenotypic variables indicated that age .gtoreq.60 years, male gender, a history of smoking and a high frequency of macrohematuria were all associated with an increased risk of UC (Table 11).
TABLE-US-00012 TABLE 11 Unadjusted and adjusted ORs for UC by phenotypic and genotypic factors for patients with hematuria Unadjusted Adjusted P Adjusted OR variable OR G + P variable Phenotypic variables Control UC (95% CI) (95% CI) OR (95% CI) Age, years <60 151 11 2.30 2.24 1.89 .gtoreq.60 364 61 (1.22-4.73) (1.18-4.65) (0.85-4.64) Gender Female 105 8 2.05 1.58 3.03 Male 410 64 (1.01-4.75) (0.76-3.72) (1.12-9.36) Smoking Never 227 19 2.20 2.19 2.67 history smoked (1.29-3.91) (1.27-3.92) (1.34-5.64) Current 288 53 or past smoker Hfreq (average .ltoreq.1 300 32 1.74 1.80 1.76 episodes/day) >1 215 40 (1.06-2.88) (1.08-3.00) (0.93-3.35) Unadjusted Adjusted G Adjusted OR variable OR G + P variable Genotypic variables (95% CI) (95% CI) OR (95% CI) IGFBP5 7.34 2.15 2.21 (4.59-12.33) (1.03-4.58) (1.03-4.83) HOXA13 6.27 0.33 0.20 (3.92-10.34) (0.13-0.83) (0.07-0.56) MDK 7.10 4.76 8.14 (4.73-11.10) (1.74-13.62) (2.64-26.60) CDK1 7.80 3.47 2.59 (5.11-12.39) (1.39-9.13) (0.98-7.18) CXCR2 1.69 0.65 0.69 (1.36-2.10) (0.45-0.92) (0.47-0.98)
Adjusted P INDEX, G INDEX and G+P INDEX variable ORs are the exponentiated co-efficients in the P INDEX, G INDEX and G+P INDEX, respectively. Adjusted log OR co-efficients were calculated in the multivariate logistic regression model.
[0473] P INDEX=-3.78+0.81.times.Age+0.46.times.Gender+0.78.times.Smoking history+0.59.times.Hfreq, where each phenotypic variable is assigned a binary score of 0 or 1, as designated in Table 9, and the confidence intervals for the co-efficients are presented in Table 11. The bias-corrected estimate for AUC for the P INDEX is 0.66 (95% CI: 0.55-0.67; FIG. 21).
[0474] Relationship Between Genotypic Variables and Risk of UC in Patients with Macrohematuria
[0475] The G INDEX was estimated by logistic regression using the log mRNA concentrations of the five genes IGFBP5, HOXA13, MDK, CDK1 and CXCR2 in urine samples to predict UC occurrence.
G INDEX=-6.22+0.77.times.IGFBP5-1.11.times.HOXA13+1.56.times.MDK+1.24.ti- mes.CDK1-0.43.times.CXCR2
[0476] The G INDEX gives a bias-corrected AUC of 0.83 (95% CI: 0.74-0.89; FIG. 21).
[0477] Relationship Between Genotypic and Phenotypic Variables and Risk of UC in Patients with Macrohematuria
[0478] The five continuous genotypic variables were then combined with the four binary phenotypic variables to estimate the G+P INDEX using mulitvariate logistic regression.
G+P INDEX=-8.46+(0.79.times.IGF-1.60.times.HOXA+2.10.times.MDK+0.95.time- s.CDC-0.38.times.IL8R)+(0.64.times.Age+1.11.times.Gender+0.98.times.Smokin- g history+0.56.times.Hfreq)
[0479] The G+P INDEX gives a bias-corrected AUC of 0.86 (95% CI: 0.80-0.91).
[0480] Comparison between G INDEX and G+P INDEX
[0481] There is overlap between the confidence intervals for the G INDEX and G+P INDEX, so a bootstrap version of a paired test was constructed by determining the difference in AUC for the G INDEX and G+P INDEX for each bootstrap sample. Ten thousand bootstrap samples with a sample size of n=587 were generated by random sampling with replacement from the original 587 samples available for analysis. The resulting 95% CI for the difference between models was 0.01-0.08. Thus the probability that the true difference between the two AUCs is less than 0.01 is <0.025, indicating that there is a high likelihood of the AUC for the G+P INDEX being significantly greater than the AUC for the G INDEX.
[0482] NPV and Sensitivity of Models
[0483] The G+P INDEX generated an NPV>0.97 over the range of test-negative rates from 0.2 to 0.7 and was almost always higher than the NPV for the G INDEX model (FIG. 22). The G+P INDEX offered performance characteristics of sensitivity of 0.95 and NPV 0.98 when the test-negative rate was 0.4 (Table 12; FIG. 22). In contrast, the G INDEX only achieved sensitivity of 0.86 and an NPV of 0.96 when the test-negative rate was 0.4 (Table 12).
TABLE-US-00013 TABLE 12 Performance Characteristics of Each Model When Thresholds Are Set For Varying Test Negative Rates Threshold Test-negative NPV Sensitivity Specificity (logOR) rate (95% CI) (95% CI) (95% CI) (95% CI) P INDEX -2.54 0.25 (0.21-0.28) 0.97 (0.92-0.99) 0.93 (0.85-0.98) 0.27 (0.23-0.31) -2.52 0.38 (0.34-0.42) 0.95 (0.91-0.97) 0.83 (0.74-0.91) 0.41 (0.37-0.45) -2.39 0.42 (0.37-0.45) 0.95 (0.91-0.97) 0.82 (0.72-0.90) 0.45 (0.40-0.49) -1.95 0.51 (0.47-0.54) 0.92 (0.89-0.95) 0.68 (0.56-0.78) 0.53 (0.49-0.57) -1.93 0.51 (0.46-0.55) 0.92 (0.89-0.95) 0.68 (0.56-0.78) 0.53 (0.49-0.58) -1.73 0.82 (0.79-0.85) 0.90 (0.87-0.92) 0.32 (0.22-0.43) 0.84 (0.81-0.87) G INDEX -3.46 0.20 (0.17-0.23) 0.94 (0.88-0.97) 0.90 (0.80-0.95) 0.22 (0.18-0.25) -3.23 0.30 (0.26-0.34) 0.95 (0.91-0.98) 0.89 (0.80-0.95) 0.33 (0.28-0.37) -3.04 0.40 (0.36-0.44) 0.96 (0.92-0.98) 0.86 (0.77-0.93) 0.44 (0.40-0.48) -2.86 0.50 (0.46-0.54) 0.97 (0.94-0.98) 0.86 (0.77-0.93) 0.55 (0.51-0.59) -2.63 0.60 (0.56-0.63) 0.96 (0.94-0.98) 0.82 (0.71-0.90) 0.66 (0.62-0.69) -2.41 0.70 (0.66-0.73) 0.96 (0.94-0.98) 0.78 (0.65-0.86) 0.77 (0.73-0.80) G + P INDEX -4.02 0.20 (0.17-0.23) 0.97 (0.93-0.99) 0.96 (0.88-0.99) 0.22 (0.19-0.26) -3.67 0.30 (0.26-0.33) 0.98 (0.94-0.99) 0.94 (0.87-0.99) 0.33 (0.29-0.37) -3.33 0.40 (0.36-0.44) 0.98 (0.95-1.00) 0.95 (0.86-0.98) 0.45 (0.40-0.49) -2.99 0.50 (0.46-0.54) 0.98 (0.96-0.99) 0.92 (0.83-0.97) 0.56 (0.52-0.60) -2.71 0.60 (0.56-0.64) 0.97 (0.95-0.99) 0.86 (0.76-0.93) 0.67 (0.63-0.71) -2.37 0.70 (0.66-0.73) 0.97 (0.94-0.98) 0.80 (0.70-0.88) 0.77 (0.73-0.80)
[0484] Application of the G+P INDEX in Patients with Microhematuria
[0485] While the G+P INDEX was developed using data from patients with macrohematuria, its robustness was tested in a further 40 samples from patients with microhematuria (Hfreq=0). A higher test-negative rate was expected in a microhaematuria population as the incidence of UC is lower in this population, and using a test negative rate of 0.4, 32 (80%) patients tested negative and would be correctly triaged out, therefore not requiring a full urological work-up for the determination of UC.
Discussion
[0486] This study defines a clinical tool that offers clinicians and physicians the ability to effectively triage-out patients presenting with hematuria from the need to have a full urological work-up for the detection of UC. The study presents an internally validated genotypic-phenotypic model, G+P INDEX, with bootstrap-based CI estimates, that offers a combination of high sensitivity and high NPV (i.e. a low probability of an individual patient with UC providing a false-negative result and a high proportion of all negative results being true) that is not offered by models derived exclusively from genotypic or phenotypic data alone. This provides clinicians and physicians with a unique opportunity to triage out patients with both micro- and macrohematuria, in particular by identifying patients with a low risk of having UC who do not require a full urological work up.
[0487] A high test-negative rate in the context of high sensitivity is an important consideration for an effective triage-out test that aims to direct patients with a low probability of UC away from a full clinical work-up [37]. Accordingly, at a test-negative rate of 0.4 the sensitivity of the G+P INDEX presented here maximizes both the sensitivity and NPV (0.95 and 0.98, respectively). This can be compared with the best fit selected from the genotypic model published in [33] (sensitivity=0.82; NPV=0.97) and is also comparable with the sensitivity and NPV of both cystoscopy (sensitivity=0.89-0.98; NPV=0.99) and virtual cystoscopy using computed tomography (CT) scans or magnetic resonance imaging (MRI) (sensitivity=0.94 and 0.91, respectively) [38-40].
[0488] It is acknowledged that the sample population used to derive the G INDEX, P INDEX and G+P INDEX in this instance consisted of patients with macrohematuria. However, the high sensitivity of this test at a test negative rate of 0.4 in patients with macrohematuria allows the G+P INDEX to be applied across both macro- and microhematuria populations. Presuming that patients with and without UC are similarly distributed amongst the micro- and macrohematuria patient populations, but with an expected UC prevalence of 4% in the microhematuria population, a high NPV can also be expected in the microhematuria patient population.
[0489] By applying the G+P INDEX to the sample population of patients with microhematuria who do not have UC it was shown that 80% of the patients would have been triaged out on the basis of the result. Only 20% would be referred for a full urological work-up. This compares with conventional guidelines that would currently see all of the patients (100%) with microhematuria that cannot be attributed to a benign cause undergoing a full urological work-up, incurring significant unnecessary costs and negatively impacting patient QoL.
[0490] Severity of hematuria is correlated with the probability of a patient having UC, but not the stage or grade of any tumour, and an estimated 96% and 77-88% of patients with micro- and macrohematuria, respectively, referred to a urologist will not have UC [2-6]. Therefore, avoiding potentially unnecessary urological work-ups for patients with hematuria has several benefits. Cystoscopy may be associated with adverse effects, such as pain on voiding, bleeding, UTIs, male sexual dysfunction and the anxiety that accompanies an inconclusive or unconfirmed UC diagnosis [9-11]. Most notably, this novel approach has the potential to reduce the burden on resources and the financial cost associated with a full urological work-up on UC-negative patients. For example, in the UK, avoiding cystoscopy in patients with hematuria with an initial negative cytology and/or tumor biomarker test has been estimated to save approximately US$770 per patient (.English Pound.483 per patient) evaluated [13]. The G+P INDEX described here provides an effective alternative to the use of urine cytology when used in a primary evaluation setting. This is particularly relevant in settings where primary evaluation is carried out by primary care physicians.
[0491] On this basis, if we assign an arbitrary `nominal cost` of US$4,500 for each full urological work up, the total cost for working up 1,000 patients with microhematuria would approach US$4.5 million. In contrast, if 80% of patients with microhematuria are triaged out using the G+P INDEX at an arbitrary nominal cost of US$2,500, the total direct cost of testing and full urological work-ups for the remaining 20% of patients would total US$3.4 million. This provides a notional net saving in direct costs of approximately US$1.1 million per 1,000 patients with microhematuria.
[0492] While the genotypic algorithm developed by O'Sullivan et al. [33] comprised the same genotypic constituents as the G+P INDEX presented here, the balance between sensitivity and specificity was calibrated for the optimal primary detection of UC in symptomatic patients (i.e. presenting with hematuria) who were undergoing a full urological work-up. In contrast, the G+P INDEX in this study also incorporated phenotypic variables and has been optimized for high sensitivity and high NPV, to segregate out those patients with hematuria who do not require a full urological work-up for suspected UC. No attempt is made to define or select patients with UC. Instead the aim is to confidently rule out those who do not have UC, and as such, all patients not segregated out would progress for a full urological work-up.
[0493] While several studies have previously sought to develop predictive models that consider phenotype when assessing the risk of UC in patients presenting with hematuria, the accuracy of phenotype-dependent models alone appears to be limited. For example, Loo et al. [21] prospectively investigated whether phenotypic parameters could be used to identify patients with microhematuria who may not have required a urological referral and full work-up and concluded that age, male gender and a recent diagnosis of macrohematuria were significant predictors of UC. A history of smoking and >25 RBCs/HPF in a recent urinalysis were not statistically significant predictors of UC, in isolation, but even when included in their `Hematuria Risk Index` to improve predictive accuracy, this index resulted in an AUC of 0.809 [21]. Interestingly, the phenotypic ORs in this study and those identified by Loo et al. are comparable, with overlapping 95% CIs for smoking history and gender, and while age, gender and smoking history have similar weightings in each model, the influence of the genotypic component of the G+P INDEX presented here is likely to account for the higher AUC [21].
[0494] Likewise, Cha et al. [20] reported that age, smoking history and degree of hematuria, but not gender, were significantly correlated with the presence of UC in patients with asymptomatic hematuria and used a multivariate model to develop a nomogram comprised of phenotypic and urine cytology data for predicting UC. As with Loo et al. [21], the reported phenotypic ORs are comparable to those reported here, but even after incorporating urine cytology into the nomogram, the AUC of 0.831 reported in [20] was lower than that of the G+P INDEX.
[0495] In another study, Tan et al. [22] retrospectively stratified patients with hematuria who had been referred to a specialist urology clinic into high- and low-risk groups using a nomogram derived from patient age, gender, smoking history and the degree of hematuria. While comparisons with this study must be made with caution given the high proportion of patients who were excluded due to an absence of data (80 out of 405 patients), the AUC of 0.804, sensitivity of 0.900 and NPV of 0.953 were all lower than the G+P INDEX described here.
[0496] Several attempts have also been made to improve the accuracy of phenotypic models by supplementing them with the results of urinary biomarker tests. When the nuclear matrix protein NMP22 point of care proteomic assay is used in isolation to detect UC it has a sensitivity of 0.557 and NPV of 0.968 [17]. Lotan et al. [41] published a multivariable algorithm comprising phenotypic factors, NMP22 and urine cytology with an AUC for predicting UC of 0.826 that was then prospectively validated with an AUC of 0.802 [31]. However, it is important to note that this model attempted to discriminate between high-risk patients who did and did not have UC, as opposed to maximizing sensitivity and NPV to triage-out patients with a low probability of UC.
[0497] The improved accuracy obtained with algorithms comprising both genotypic and phenotypic data have previously been demonstrated in breast cancer, in particular [42-45]. Likewise, Mitra et al. [30] used a combination of molecular markers and smoking intensity to calculate a multivariate model that was superior to routine clinicopathological parameters in predicting survival in patients with UC. However, the present study is the first to demonstrate that phenotypic risk factors can be combined with genotypic data to increase the accuracy of a model for separating patients with haematuria into categories requiring differential levels of urological follow up and clinical care rather than survivorship prediction.
[0498] When phenotypic data are combined with genotypic data in a model, the resolution of data is likely to impact the accuracy of the model. For example, smoking is a well understood risk factor for UC and is included in most phenotypic models for detecting UC. In Cha et al. [20], Tan et al. [22], Lotan et al. [31,41] and the current study, the binary discriminants never smoked and current/ex-smoker were used, whereas Mitra et al. [30] calculated smoking intensity on the basis of years of smoking and number of cigarettes smoked each day and Loo et al. [21] categorized smokers into never smoked, passive smokers, smokers who had ceased and current smokers. While it is known that the risk of UC increases substantially with exposure to smoking [46], arbitrarily defining phenotypic variables may limit the overall accuracy and utility of phenotypic models. In contrast, an interaction between a patient's genotypic and phenotypic variables would not be unexpected. However, combining the impact of phenotypic factors and genetic variables in a single tool improved the accuracy of the model described in this study. A similar principle also applies to describing hematuria phenotype. Patients presenting with micro- or macrohematuria are essentially on a biological continuum and have different likelihoods of having UC [2-6,21]. Accordingly, despite all patients with microhematuria in this study having a Hfreq score of 0, the severity of their hematuria, in combination with other phenotypic factors, is likely to be indirectly accounted for in the genotypic component of the G+P INDEX.
REFERENCES
[0499] The articles recited immediately below refer to Example 4, and are all incorporated herein fully by reference. [0500] 1. Kelly J D, Fawcett D P, Goldberg L C: Assessment and management of non-visible haematuria in primary care. BMJ 2009, 338:a3021. [0501] 2. Davis R, Jones J S, Barocas D A, Castle E P, Lang E K, Leveillee R J, Messing E M, Miller S D, Peterson A C, Turk TMT, Weitzel W: Diagnosis, evaluation and follow-up of asymptomatic microhematuria (AMH) in adults: AUA guideline. J Urol 2012, 188(6 Suppl):2473-2481. [0502] 3. Sutton J M. Evaluation of hematuria in adults. JAMA 1990, 263:2475-2480. [0503] 4. Khadra M H, Pickard R S, Charlton M, Powell P H, Neal D E: A prospective analysis of 1,930 patients with hematuria to evaluate clinical practice. J Urol 2000, 163:524-527. [0504] 5. Davidson P: Re-design of a haematuria clinic: Assessment of 2346 haematuria patients. J Urol 2011, 185(4S):e495. [0505] 6. Price S J, Shephard E A, Stapley S A, Barraclough K, Hamilton W T: Non-visible versus visible haematuria and bladder cancer risk: A study of electronic records in primary care. Br J Gen Pract 2014, 64:e584-e589. [0506] 7. Buteau A, Seideman C A, Svatek R S, Youssef R F, Chakrabati G, Reed G, Bhat D, Lotan Y: What is evaluation of hematuria by primary care physicians? Use of electronic medical records to assess practice patterns with intermediate follow-up. Urol Oncol 2014, 32:128-134. [0507] 8. Jimbo M: Evaluation and management of hematuria. Prim Care 2010, 373:461-472. [0508] 9. Herr H W: The risk of urinary tract infection after flexible cystoscopy in bladder tumor patients who did not receive prophylactic antibiotics. J Urol 2014 Jul. 18. pii: S0022-5347(14)03963-9. [0509] 10. Burke D M, Shackley D C, O'Reilly P H: The community-based morbidity of flexible cystoscopy. BJU Int 2002, 89:347-349. [0510] 11. Stay K, Leibovici D, Goren E, Livshitz A, Siegel Y I, Lindner A, Zisman A: Adverse effects of cystoscopy and its impact on patients' quality of life and sexual performance. Isr Med Assoc J 2004, 6:474-478. [0511] 12. Rao P K, Jones J S: How to evaluate `dipstick hematuria`: What to do before you refer. Cleve Clin J Med 2008, 75:227-233. [0512] 13. Rodgers M, Nixon J, Hempel S, Aho T, Kelly J, Neal D, Duffy S, Ritchie G, Kleijnen J, Westwood M: Diagnostic tests and algorithms used in the investigation of haematuria: systematic reviews and economic evaluation. Health Technol Assess 2006, 10:iii-iv, xi-259. [0513] 14. Falebita O A, Lee G, Sweeney P: Urine cytology in the evaluation of urological malignancy revisited: is it still necessary? Urol Int 2010, 84:45-49. [0514] 15. Feifer A H, Steinberg J, Tanguay S, Aprikian A G, Brimo F, Kassouf W: Utility of urine cytology in the workup of asymptomatic microscopic hematuria in low-risk patients. Urology 2010, 75:1278-1282. [0515] 16. Svatek R S, Hollenbeck B K, Holmang S, Lee R, Kim S, Stenzl A, Lotan Y. The economics of bladder cancer: Costs and considerations of caring for this disease. Eur Urol 2014, 66:253-262. [0516] 17. Grossman H B, Messing E, Soloway M, Tomera K, Katz G, Berger Y, Shen Y: Detection of bladder cancer using a point-of-care proteomic assay. JAMA 2005, 293:810-816. [0517] 18. Friedlander D F, Resnick M J, You C, Bassett J, Yarlagadda V, Penson D F, Barocas D A: Variation in the intensity of hematuria evaluation: a target for primary care quality improvement. Am J Med 2014, 127:633-640. [0518] 19. Shinagare A B, Silverman S G, Gershanik E F, Chang S L, Khorasani R: Evaluating hematuria: impact of guideline adherence on urologic cancer diagnosis. Am J Med 2014, 127:625-632. [0519] 20. Cha E K, Tirsar L A, Schwentner C, Hennenlotter J, Christos P J, Stenzl A, Mian C, Martini T, Pycha A, Shariat S F, Schmitz-Drager B J: Accurate risk assessment of patients with asymptomatic hematuria for the presence of bladder cancer. World J Urol 2012, 30:847-852. [0520] 21. Loo R K, Lieberman S F, Slezak J M, Landa L M, Mariani A J, Nicolaisen G, Aspera A M, Jacobsen S J: Stratifying risk of urinary tract malignant tumors in patients with asymptomatic microscopic hematuria. Mayo Clin Proc 2013, 88:129-138. [0521] 22. Tan G H, Shah S A, Ann H S, Hemdan S N, Shen L C, Galib NAFA, Singam P, Kong C H C, Hong G E, Bahadzor B, Zainuddin Z M: Stratifying patients with haematuria into high or low risk groups for bladder cancer: a novel clinical scoring system. Asian Pac J Cancer Prev 2013, 14:6327-6330. [0522] 23. Sultana S, Goodman C, Bryne D, Baxby K: Microscopic haematuria: urological investigation using a standard protocol. Br J Urol 1996, 78:691-698. [0523] 24. Sugimura K, Ikemoto S-I, Kawashima H, Nishisaka N, Kishimoto T: Microscopic hematuria as a screening marker for urinary tract malignancies. Int J Urol 2001, 8:1-5. [0524] 25. Viswanath S, Zelhof B, Ho E, Sethia K, Mills R: Is routine urine cytology useful in the haematuria clinic? Ann R Coll Surg Engl 2008, 90:153-155. [0525] 26. Steiner H, Bergmeister M, Verdorfer I, Granig T, Mikuz G, Bartsch G, Stoehr B, Brunner A: Early results of bladder-cancer screening in a high-risk population of heavy smokers. BJU Int 2008, 102:291-296. [0526] 27. Yeung C, Dinh T, Lee J: The health economics of bladder cancer: An updated review of the published literature. Pharmacoeconomics 2014, 32:1093-1104. [0527] 28. Holyoake A, O'Sullivan P, Pollock R, Best T, Watanabe J, Kajita Y, Matsui Y, Ito M, Nishiyama H, Kerr N, da Silva Tatley F, Cambridge L, Toro T, Ogawa O, Guilford P: Development of a multiplex RNA urine test for the detection and stratification of transitional cell carcinoma of the bladder. Clin Cancer Res 2008, 14:742-749. [0528] 29. Sapre N, Anderson P D, Costello A J, Hovens C M, Corcoran N M: Gene-based urinary biomarkers for bladder cancer: an unfulfilled promise? Urol Oncol 2014, 32:48.e9-e17. [0529] 30. Mitra A P, Castelao J E, Hawes D, Tsao-Wei D D, Jiang X, Shi S R, Datar R H, Skinner E C, Stein J P, Groshen S, Yu M C, Ross R K, Skinner D G, Cortessis V K, Cote R J: Combination of molecular alterations and smoking intensity predicts bladder cancer outcome. Cancer 2013, 119:756-765. [0530] 31. Lotan Y, Svatek R S, Krabbe L M, Xylinas E, Klatte T, Shariat S F: Prospective external validation of model for bladder cancer detection. J Urol 2014, 192:1343-1348. [0531] 32. Abogunrin F, O'Kane H F, Ruddock M W, Stevenson M, Reid C N, O'Sullivan J M, Anderson N H, O'Rourke D, Duggan B, Lamont J V, Boyd R E, Hamilton P, Nambirajan T, Williamson K E: The impact of biomarkers in multi-variate algorithms for bladder cancer diagnosis in patients with hematuria. Cancer 2012, 118:2641-2650. [0532] 33. O'Sullivan P, Sharples K, Dalphin M, Davidson P, Gilling P, Cambridge L, Harvey J, Toro T, Giles N, Luxmanan C, Felipe Alves C, Yoon H S, Hinder V, Masters J, Kennedy-Smith A, Beaven T, Guilford P: A multigene urine test for the detection and stratification of bladder cancer in patients presenting with hematuria. J Urol 2012, 188:741-747. [0533] 34. Epstein J I, Amin M B, Reuter V R, Mostofi F K: The World Health Organization/International Society of Urological Pathology consensus classification of urothelial (transitional cell) neoplasms of the urinary bladder. Bladder Consensus Conference Committee. Am J Surg Pathol 1998, 22:1435-1448. [0534] 35. Efron B, Tibshirani R J: An introduction to the bootstrap. New York: Chapman Hill; 1993. [0535] 36. DiCiccio T J, Tibshirani R J: Bootstrap confidence intervals. Statist Sci 1996, 11:189-228. [0536] 37. Van't Hoog A H, Cobelens F, Vassall A, van Kampen S, Dorman S E, Alland D, Ellner J: Optimal triage test characteristics to improve the cost-effectiveness of the Xpert MTB/RIF assay for TB diagnosis: A decision analysis. PLoS ONE 2013, 8:e82786. [0537] 38. Qu X, Huang X, Wu L, Huang G, Ping X, Yan W: Comparison of virtual cystoscopy and ultrasonography for bladder cancer detection: A meta-analysis. Eur J Radiol 2010, 80:188-197. [0538] 39. Mowatt G, N'Dow J, Vale L, Nabi G, Boachie C, Cook J A, Fraser C, Griffiths T R; Aberdeen Technology Assessment Review (TAR) Group: Photodynamic diagnosis of bladder cancer compared with white light cystoscopy: Systematic review and meta-analysis. Int J Technol Assess Health Care 2011, 27:3-10. [0539] 40. Blick C G, Nazir S A, Mallett S, Turney B W, Onwu N N, Roberts I S, Crew J P, Cowan N C: Evaluation of diagnostic strategies for bladder cancer using computed tomography (CT) urography, flexible cystoscopy and voided urine cytology: results for 778 patients from a hospital haematuria clinic. BJU Int 2012, 110:84-94. [0540] 41. Lotan Y, Capitanio U, Shariat S F, Hutterer G C, Karakiewicz P I: Impact of clinical factors, including a point-of-care nuclear matrix protein-22 assay and cytology, on bladder cancer detection. BJU Int 2009, 103:1368-1374. [0541] 42. Tyrer J, Duffy S W, Cuzick J: A breast cancer prediction model incorporating familial and personal risk factors. Stat Med 2004, 23:1111-1130. [0542] 43. Dubsky P, Brase J C, Jakesz R, Rudas M, Singer C F, Greil R, Dietze O, Luisser I, Klug E, Sedivy R, Bachner M, Mayr D, Schmidt M, Gehrmann M C, Petry C, Weber K E, Fisch K, Kronenwett R, Gnant M, Filipits M, on behalf the Austrian Breast and Colorectal Cancer Study Group (ABCSG): The EndoPredict score provides prognostic information on late distant metastases in ER+/HER2- breast cancer patients. Br J Cancer 2013, 109:2959-2964. [0543] 44. Brentnall A R, Evans D G, Cuzick J: Distribution of breast cancer risk from SNPs and classical risk factors in women of routine screening age in the UK. Br J Cancer 2014, 110:827-828. [0544] 45. Filipits M, Nielsen T O, Rudas M, Greil R, Stoger H, Jakesz R, Bago-Horvath Z, Dietze O, Regitnig P, Gruber-Rossipal C, Muller-Holzner E, Singer C F, Mlineritsch B, Dubsky P, Bauernhofer T, Hubalek M, Knauer M, Trapl H, Fesl C, Schaper C, Ferree S, Liu S, Cowens J W, Gnant M, Austrian Breast and Colorectal Cancer Study Group: The PAM50 risk-of-recurrence score predicts risk for late distant recurrence after endocrine therapy in postmenopausal women with endocrine-responsive early breast cancer. Clin Cancer Res 2014, 20:1298-1305. [0545] 46. Krabbe L M, Svatek R S, Shariat S F, Messing E, Lotan Y: Bladder Cancer Risk: Use of the PLCO and NLST to Identify as Suitable Screening Cohort. Urol Oncol. 20149 July 16): pii: 51078-1439 (14)00215-4.
CONCLUSIONS
[0546] In conclusion, the G+P INDEX reported here shows a significant opportunity to change clinical utility. G+P INDEX is able to accurately triage out patients who present to their clinician or physician with hematuria, who have a low probability of UC with a high overall test-negative rate, high level of sensitivity and high NPV. This model is suitable for use during primary evaluation of patients with hematuria to triage out patients who do not require a full urological work-up, thereby potentially reducing the number of patients with hematuria requiring referral for specialist urological evaluation for UC, helping to maintain patient QoL and helping to reduce diagnosis-related costs.
Example 5: Triage of Patents with Hematuria Using the G+P Index III ("G2")
[0547] A further use of the G+P INDEX is to categorize patients according to Risk of UC. The risk category is then used to prioritize patients for follow up investigation.
[0548] This example provides an alternative method for triaging patients using an index, herein termed the "G2+P Index." It is similar to the G+P Index described above in Example 4.
Definition of G.sub.2
[0549] This classifier calculates the following formula:
M 1 = [ IGF ] - [ HOXA ] + [ MDK ] + [ CDC ] ; then , R = - 6.9802 + 0.2007 * M 1 + 1.7893 * [ IL 8 R ] + 0.1552 * M 1 2 - 0.2882 * [ IL 8 R ] 2 - 0.0720 * M 1 * [ IL 8 R ] ##EQU00015##
to obtain the score:
[0550] SCORE=e.sup.R/(1+e.sup.R), where [IGF], [HOXA], [MDK], [CDC] and [IL8R] are the logarithms of the sample concentrations for the genes IGF, HOXA, MDK, CDC and IL8R, respectively; is ordinary multiplication, and e=2.718282 . . . is the base of the natural (Napierian) logarithm.
[0551] A high SCORE indicates a higher likelihood of UC being present. As an example, we may set a threshold of 0.12 and declare a SCORE >=0.12 as having a high likelihood of having UC, and those scores below 0.12 has having a low likelihood of having UC.
Example 6: Concurrent Use of [G1=P]-Index and G2 to Triage Out Patients Who Present with Hematuria Who have a Low Probability of Urothelial Carcinoma
[0552] A. Patents with Micro-Haematuria
[0553] Patient Data-Set [0554] 45 patient samples were assayed [0555] 5 patients lack Smoking Status and were excluded from this analysis [0556] All patients have completed a full urological work-up and none have urothelial carcinoma. [0557] Phenotypic variables: Gender, Age, SmokingStatus [0558] Patient demographics are shown in Table 13 below.
TABLE-US-00014 [0558] TABLE 13 Gender Age NonSmoker ExSmoker Smoker Female Age < 60 10 1 2 Age > 60 9 1 2 Male Age < 60 3 2 3 Age > 60 3 2 2
Observed Test Negative Rate:
[0559] Using a Test Negative Rate of 40% as the threshold, data is shown below in Table 14.
TABLE-US-00015 TABLE 14 TNR 40% LR < 0.12 0.12 <= LR < 0.23 0.23 <= LR Triage Negative 28 3 1 Triage Positive 4 2 2
[0560] Using a Negative Test Rate of 50% as the threshold, data is shown below in Table 15.
TABLE-US-00016 TABLE 15 TNR 50% LR < 0.12 0.12 <= LR < 0.23 0.23 <= LR Triage Negative 28 3 3 Triage Positive 4 2 0
[0561] Using a Negative Test Rate of 60% as the threshold gives identical results.
[0562] The highest risk group (Male, Current or Ex-Smoker, Age >=60) were all positive for this Triage classification.
SUMMARY AND CONCLUSIONS
[0563] 1. By deed of the clinical guidelines all 41 patients would normally receive a full urological work-up. [0564] 2. All 41 did receive a full-work-up and all 41 were determined to have no urothelial carcinoma. [0565] 3. At a Test Negative Rate (TNR of 50% 85% of the micro-hematuria patients would be screened out and therefore consequentially not receive a full urological work-up. [0566] 4. If Cxbladder-triage was used at a TNR of 50% (Triage Index -3.33) 85.4% of the patients would be triaged out and consequently, correctly would not receive a full urological work-up. [0567] 5. If Cxbladder-triage was used at a TNR of 40% (Triage Index -3.0) 80.5% of the patients would be triaged out and consequently, correctly would not receive a full urological work-up.
[0568] B. Patients with Macrohematuria
Patient Data Set
[0569] 587 samples from Clinical Trial data and North Shore and CURT product trials were used. This data set was a subset consisting of complete data containing Age, Gender, Smoking Status and Haematuria frequency, as well as gene concentrations for IGF, HOXA, MDK, CDC, IL8R.
[0570] We used the same data used to develop the Cxbladder-triage model below;
G+P INDEX=-8.46+0.79 IGF-1.60 HOXA+2.10 MDK+0.95 CDC-0.38 IL8R+0.98 SNS+0.56 Hfreq+1.11 Gender+0.64 Age
[0571] We plotted the triage score against G2 diagnostic score in FIG. 24. The Triage thresholds -3.33, -2.99 and -2.71 correspond to Test Negative rates of 40%, 50% and 60% respectively. The verticals are the Cxbladder thresholds of 0.12 and 0.23. Filled circles correspond to tumours; green are Ta, and red are all other higher stage tumours. Table 16 shows the clinical findings.
TABLE-US-00017 TABLE 16 Stage No-cancer T1 T2 T2a T3 Ta Tis Count 515 16 10 1 2 40 3
[0572] We considered the counts in the 4 quadrants of FIG. 24 and determined by various cutoffs for Triage Index and G2.
[0573] The threshold for the Cxbladder-triage (Triage Index) of -3 corresponds to a Test Negative rate of 50%. Table 17 shows these results.
TABLE-US-00018 TABLE 17 Quadrant Thresholds Control TCC Bottom Left Triage < -3 AND G2 < 0.12 272 6 Top Left Triage > -3 AND G2 < 0.12 155 7 Bottom Left Triage < -3 AND G2 >= 0.12 16 0 Top Right Triage > -3 AND G2 >= 0.12 72 59
[0574] Using a Cxbladder-triage threshold of -3.33 (Test Negative Rate of 40%) with the same G2 threshold of 0.12, we observed the data shown in Table 18.
TABLE-US-00019 TABLE 18 Quadrant Thresholds Control TCC Bottom Left Triage < -3.33 AND G2 < 0.12 222 4 Top Left Triage > -3.33 AND G2 < 0.12 205 9 Bottom Right Triage < -3.33 AND G2 >= 0.12 9 0 Top Right Triage > -3.33 AND G2 >= 0.12 79 59
SUMMARY AND CONCLUSIONS
[0575] 1. Use of a serial combination of Cxbladder Triage (G+P) and Cxbladder Detect (G2) on the same patients in the same time interval provided a comprehensive segregation of patients into four key clinical groupings.
[0576] 2. For a combined population of patients presenting with micro and macro hematuria and using a Test Negative Rate of 40% there was a total of 235 of the 587 patients (40.0%) of the patients triaged out. We conclude that these patients will not need a full work-up for UC.
[0577] 3. For the same population the corresponding residual group of 352 (60%) patients will receive a full urological work-up.
[0578] 4. This residual group contained all high grade and late stage tumours. These patients were not triaged out and would therefore consequently, correctly receive a full urological work-up.
[0579] 5. A total of 4 low-grade Ta's (5.6% of the total number of tumours) will be triaged out and will not receive the full work-up.
[0580] 6. If the triage rules allow triage out of all patients below the 40% Test Negative Rate and with G2 scores <0.12 then there were a total of 13 low grade Ta's triaged out that will not receive a full work-up and all high grade late stage tumours will be caught and receive a full urological work-up.
[0581] 7. These modified triage rules also resulted in a total of 440 patients triaged out of a total of 587 (75%).
ADVANTAGES AND GENERAL CONCLUSIONS
[0582] In conclusion, the G+P INDEX reported here shows a significant opportunity to change clinical utility. G+P INDEX is able to accurately triage out patients who present to their clinician or physician with haematuria, who have a low probability of UC with a high overall test-negative rate, high level of sensitivity and high NPV. This model is suitable for use by primary care physicians to triage out patients who do not require a full urological work up, thereby reducing the number of patients with haematuria requiring referral for specialist urological evaluation for UC, helping to maintain patient quality of life and reducing diagnosis-related costs. The disclosed methods provided unexpectedly accurate assessment of the lack of need for follow-up investigation for those with hematuria. These represent excellent effects that could not have been achieved without use of the disclosures contained herein.
INCORPORATION BY REFERENCE
[0583] All patents, patent applications and non-patent literature citations are herein incorporated fully by reference as if separately so incorporated.
INDUSTRIAL APPLICABILITY
[0584] Embodiments of this invention are useful in the fields of healthcare and medicine.
Technical Arts
[0585] Embodiments of this invention provide highly accurate, sensitive, and specific computer-impolemented methods for triaging patients to determine which patients do not require substantial short-term procedures or follow up. The methods improve computer operations by providing new and non-obvious computer operations based on analysis of specific genetic and phenotypic information from patients with hematuria that yield tangible, useful, and concrete results to improve the quality of health care and reduce cost.
Sequence CWU 1
1
171360PRTHomo sapiens 1Met Glu Asp Phe Asn Met Glu Ser Asp Ser Phe
Glu Asp Phe Trp Lys1 5 10 15Gly Glu Asp Leu Ser Asn Tyr Ser Tyr Ser
Ser Thr Leu Pro Pro Phe 20 25 30Leu Leu Asp Ala Ala Pro Cys Glu Pro
Glu Ser Leu Glu Ile Asn Lys 35 40 45Tyr Phe Val Val Ile Ile Tyr Ala
Leu Val Phe Leu Leu Ser Leu Leu 50 55 60Gly Asn Ser Leu Val Met Leu
Val Ile Leu Tyr Ser Arg Val Gly Arg65 70 75 80Ser Val Thr Asp Val
Tyr Leu Leu Asn Leu Ala Leu Ala Asp Leu Leu 85 90 95Phe Ala Leu Thr
Leu Pro Ile Trp Ala Ala Ser Lys Val Asn Gly Trp 100 105 110Ile Phe
Gly Thr Phe Leu Cys Lys Val Val Ser Leu Leu Lys Glu Val 115 120
125Asn Phe Tyr Ser Gly Ile Leu Leu Leu Ala Cys Ile Ser Val Asp Arg
130 135 140Tyr Leu Ala Ile Val His Ala Thr Arg Thr Leu Thr Gln Lys
Arg Tyr145 150 155 160Leu Val Lys Phe Ile Cys Leu Ser Ile Trp Gly
Leu Ser Leu Leu Leu 165 170 175Ala Leu Pro Val Leu Leu Phe Arg Arg
Thr Val Tyr Ser Ser Asn Val 180 185 190Ser Pro Ala Cys Tyr Glu Asp
Met Gly Asn Asn Thr Ala Asn Trp Arg 195 200 205Met Leu Leu Arg Ile
Leu Pro Gln Ser Phe Gly Phe Ile Val Pro Leu 210 215 220Leu Ile Met
Leu Phe Cys Tyr Gly Phe Thr Leu Arg Thr Leu Phe Lys225 230 235
240Ala His Met Gly Gln Lys His Arg Ala Met Arg Val Ile Phe Ala Val
245 250 255Val Leu Ile Phe Leu Leu Cys Trp Leu Pro Tyr Asn Leu Val
Leu Leu 260 265 270Ala Asp Thr Leu Met Arg Thr Gln Val Ile Gln Glu
Thr Cys Glu Arg 275 280 285Arg Asn His Ile Asp Arg Ala Leu Asp Ala
Thr Glu Ile Leu Gly Ile 290 295 300Leu His Ser Cys Leu Asn Pro Leu
Ile Tyr Ala Phe Ile Gly Gln Lys305 310 315 320Phe Arg His Gly Leu
Leu Lys Ile Leu Ala Ile His Gly Leu Ile Ser 325 330 335Lys Asp Ser
Leu Pro Lys Asp Ser Arg Pro Ser Phe Val Gly Ser Ser 340 345 350Ser
Gly His Thr Ser Thr Thr Leu 355 36022880DNAHomo sapiens 2aggttcaaaa
cattcagaga cagaaggtgg atagacaaat ctccaccttc agactggtag 60gctcctccag
aagccatcag acaggaagat gtgaaaatcc ccagcactca tcccagaatc
120actaagtggc acctgtcctg ggccaaagtc ccaggacaga cctcattgtt
cctctgtggg 180aatacctccc caggagggca tcctggattt cccccttgca
acccaggtca gaagtttcat 240cgtcaaggtt gtttcatctt ttttttcctg
tctaacagct ctgactacca cccaaccttg 300aggcacagtg aagacatcgg
tggccactcc aataacagca ggtcacagct gctcttctgg 360aggtgtccta
caggtgaaaa gcccagcgac ccagtcagga tttaagttta cctcaaaaat
420ggaagatttt aacatggaga gtgacagctt tgaagatttc tggaaaggtg
aagatcttag 480taattacagt tacagctcta ccctgccccc ttttctacta
gatgccgccc catgtgaacc 540agaatccctg gaaatcaaca agtattttgt
ggtcattatc tatgccctgg tattcctgct 600gagcctgctg ggaaactccc
tcgtgatgct ggtcatctta tacagcaggg tcggccgctc 660cgtcactgat
gtctacctgc tgaacctagc cttggccgac ctactctttg ccctgacctt
720gcccatctgg gccgcctcca aggtgaatgg ctggattttt ggcacattcc
tgtgcaaggt 780ggtctcactc ctgaaggaag tcaacttcta tagtggcatc
ctgctactgg cctgcatcag 840tgtggaccgt tacctggcca ttgtccatgc
cacacgcaca ctgacccaga agcgctactt 900ggtcaaattc atatgtctca
gcatctgggg tctgtccttg ctcctggccc tgcctgtctt 960acttttccga
aggaccgtct actcatccaa tgttagccca gcctgctatg aggacatggg
1020caacaataca gcaaactggc ggatgctgtt acggatcctg ccccagtcct
ttggcttcat 1080cgtgccactg ctgatcatgc tgttctgcta cggattcacc
ctgcgtacgc tgtttaaggc 1140ccacatgggg cagaagcacc gggccatgcg
ggtcatcttt gctgtcgtcc tcatcttcct 1200gctctgctgg ctgccctaca
acctggtcct gctggcagac accctcatga ggacccaggt 1260gatccaggag
acctgtgagc gccgcaatca catcgaccgg gctctggatg ccaccgagat
1320tctgggcatc cttcacagct gcctcaaccc cctcatctac gccttcattg
gccagaagtt 1380tcgccatgga ctcctcaaga ttctagctat acatggcttg
atcagcaagg actccctgcc 1440caaagacagc aggccttcct ttgttggctc
ttcttcaggg cacacttcca ctactctcta 1500agacctcctg cctaagtgca
gccccgtggg gttcctccct tctcttcaca gtcacattcc 1560aagcctcatg
tccactggtt cttcttggtc tcagtgtcaa tgcagccccc attgtggtca
1620caggaagtag aggaggccac gttcttacta gtttcccttg catggtttag
aaagcttgcc 1680ctggtgcctc accccttgcc ataattacta tgtcatttgc
tggagctctg cccatcctgc 1740ccctgagccc atggcactct atgttctaag
aagtgaaaat ctacactcca gtgagacagc 1800tctgcatact cattaggatg
gctagtatca aaagaaagaa aatcaggctg gccaacgggg 1860tgaaaccctg
tctctactaa aaatacaaaa aaaaaaaaaa attagccggg cgtggtggtg
1920agtgcctgta atcacagcta cttgggaggc tgagatggga gaatcacttg
aacccgggag 1980gcagaggttg cagtgagccg agattgtgcc cctgcactcc
agcctgagcg acagtgagac 2040tctgtctcag tccatgaaga tgtagaggag
aaactggaac tctcgagcgt tgctgggggg 2100gattgtaaaa tggtgtgacc
actgcagaag acagtatggc agctttcctc aaaacttcag 2160acatagaatt
aacacatgat cctgcaattc cacttatagg aattgaccca caagaaatga
2220aagcagggac ttgaacccat atttgtacac caatattcat agcagcttat
tcacaagacc 2280caaaaggcag aagcaaccca aatgttcatc aatgaatgaa
tgaatggcta agcaaaatgt 2340gatatgtacc taacgaagta tccttcagcc
tgaaagagga atgaagtact catacatgtt 2400acaacacgga cgaaccttga
aaactttatg ctaagtgaaa taagccagac atcaacagat 2460aaatagttta
tgattccacc tacatgaggt actgagagtg aacaaattta cagagacaga
2520aagcagaaca gtgattacca gggactgagg ggaggggagc atgggaagtg
acggtttaat 2580gggcacaggg tttatgttta ggatgttgaa aaagttctgc
agataaacag tagtgatagt 2640tgtaccgcaa tgtgacttaa tgccactaaa
ttgacactta aaaatggttt aaatggtcaa 2700ttttgttatg tatattttat
atcaatttaa aaaaaaacct gagccccaaa aggtatttta 2760atcaccaagg
ctgattaaac caaggctaga accacctgcc tatatttttt gttaaatgat
2820ttcattcaat atcttttttt taataaacca tttttacttg ggtgtttata
aaaaaaaaaa 2880318DNAHomo sapiens 3tgcaccccca agaccaaa 18426DNAHomo
sapiens 4tgattaaagc taacgagcag acagaa 26526DNAHomo sapiens
5ccttcccttt cttggctttg gccttt 26622DNAHomo sapiens 6cgttgtacct
gcccaattgt ga 22720DNAHomo sapiens 7gggacgcatc actcaacgtt
20827DNAHomo sapiens 8aagagaaagc agtgcaaacc ttcccgt 27916DNAHomo
sapiens 9gccgccgcgg aataat 161028DNAHomo sapiens 10tgtctaccct
tatacacaac tccatagg 281131DNAHomo sapiens 11agccgggatc taccataccc
attgactaac t 311220DNAHomo sapiens 12tggaacggcc aaatgtactg
201320DNAHomo sapiens 13tggcgtattc ccgttcaagt 201423DNAHomo sapiens
14actctgcccg acgtggtctc cca 231523DNAHomo sapiens 15ccttgaggca
cagtgaagac atc 231623DNAHomo sapiens 16cctgtaggac acctccagaa gag
231727DNAHomo sapiens 17tggccactcc aataacagca ggtcaca 27
References
-
genenames.org/data/hgnc_data.php?hgnc_id=6972CDCCDK1NM_001170406983
-
-
-
-
-
R-project.org
-
seer.cancer.gov/csr/1975_2007
-
CRAN.R-project.org/package=ROCR
D00000
D00001
D00002
D00003
D00004
D00005
D00006
D00007
D00008
D00009
D00010
D00011
D00012

D00013

D00014

D00015

D00016

D00017
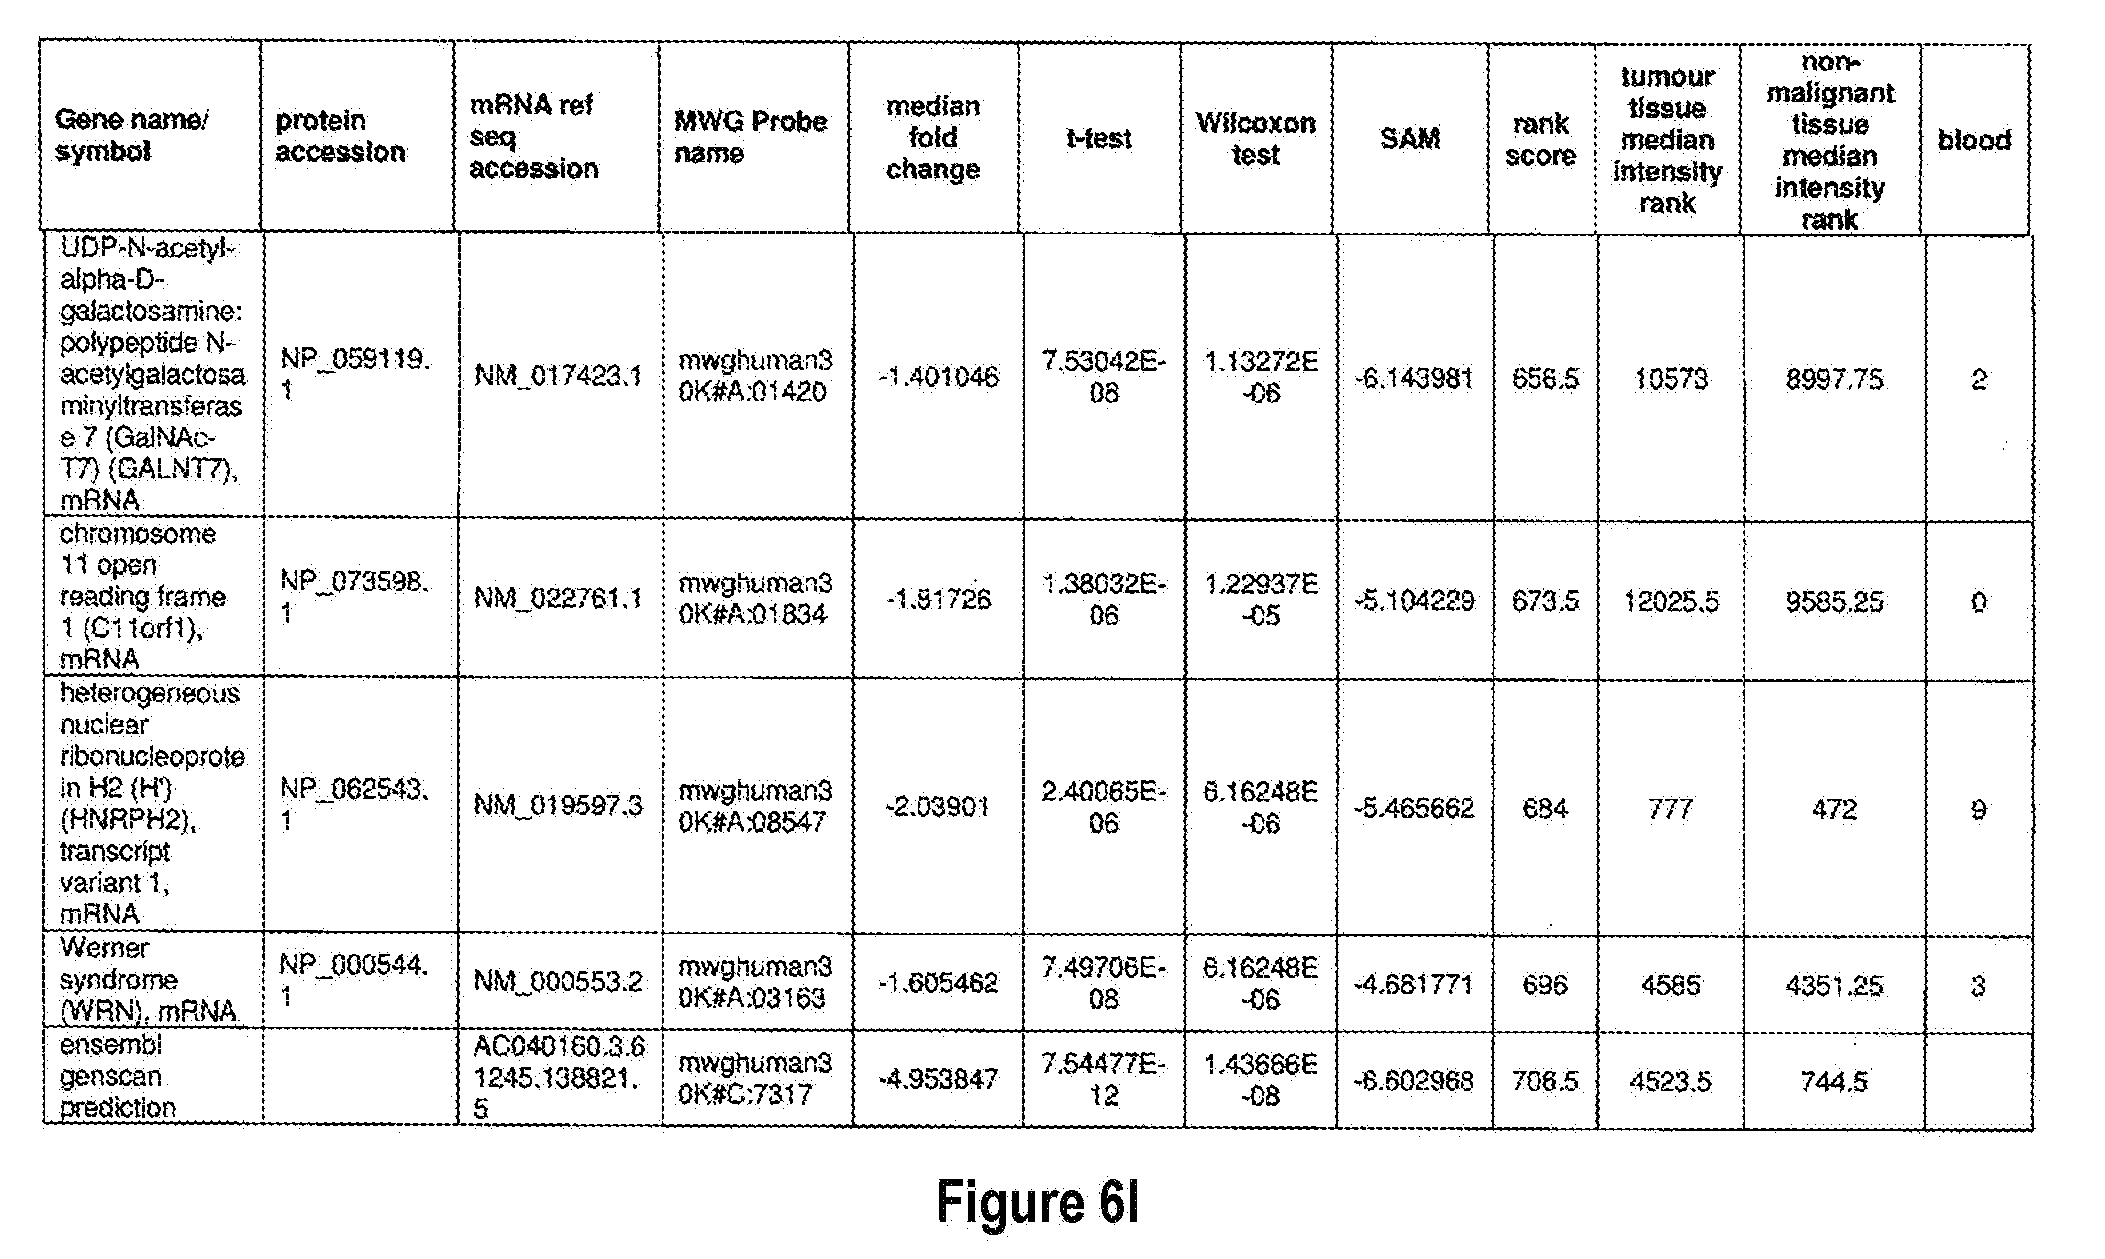
D00018

D00019

D00020

D00021

D00022

D00023

D00024

D00025

D00026
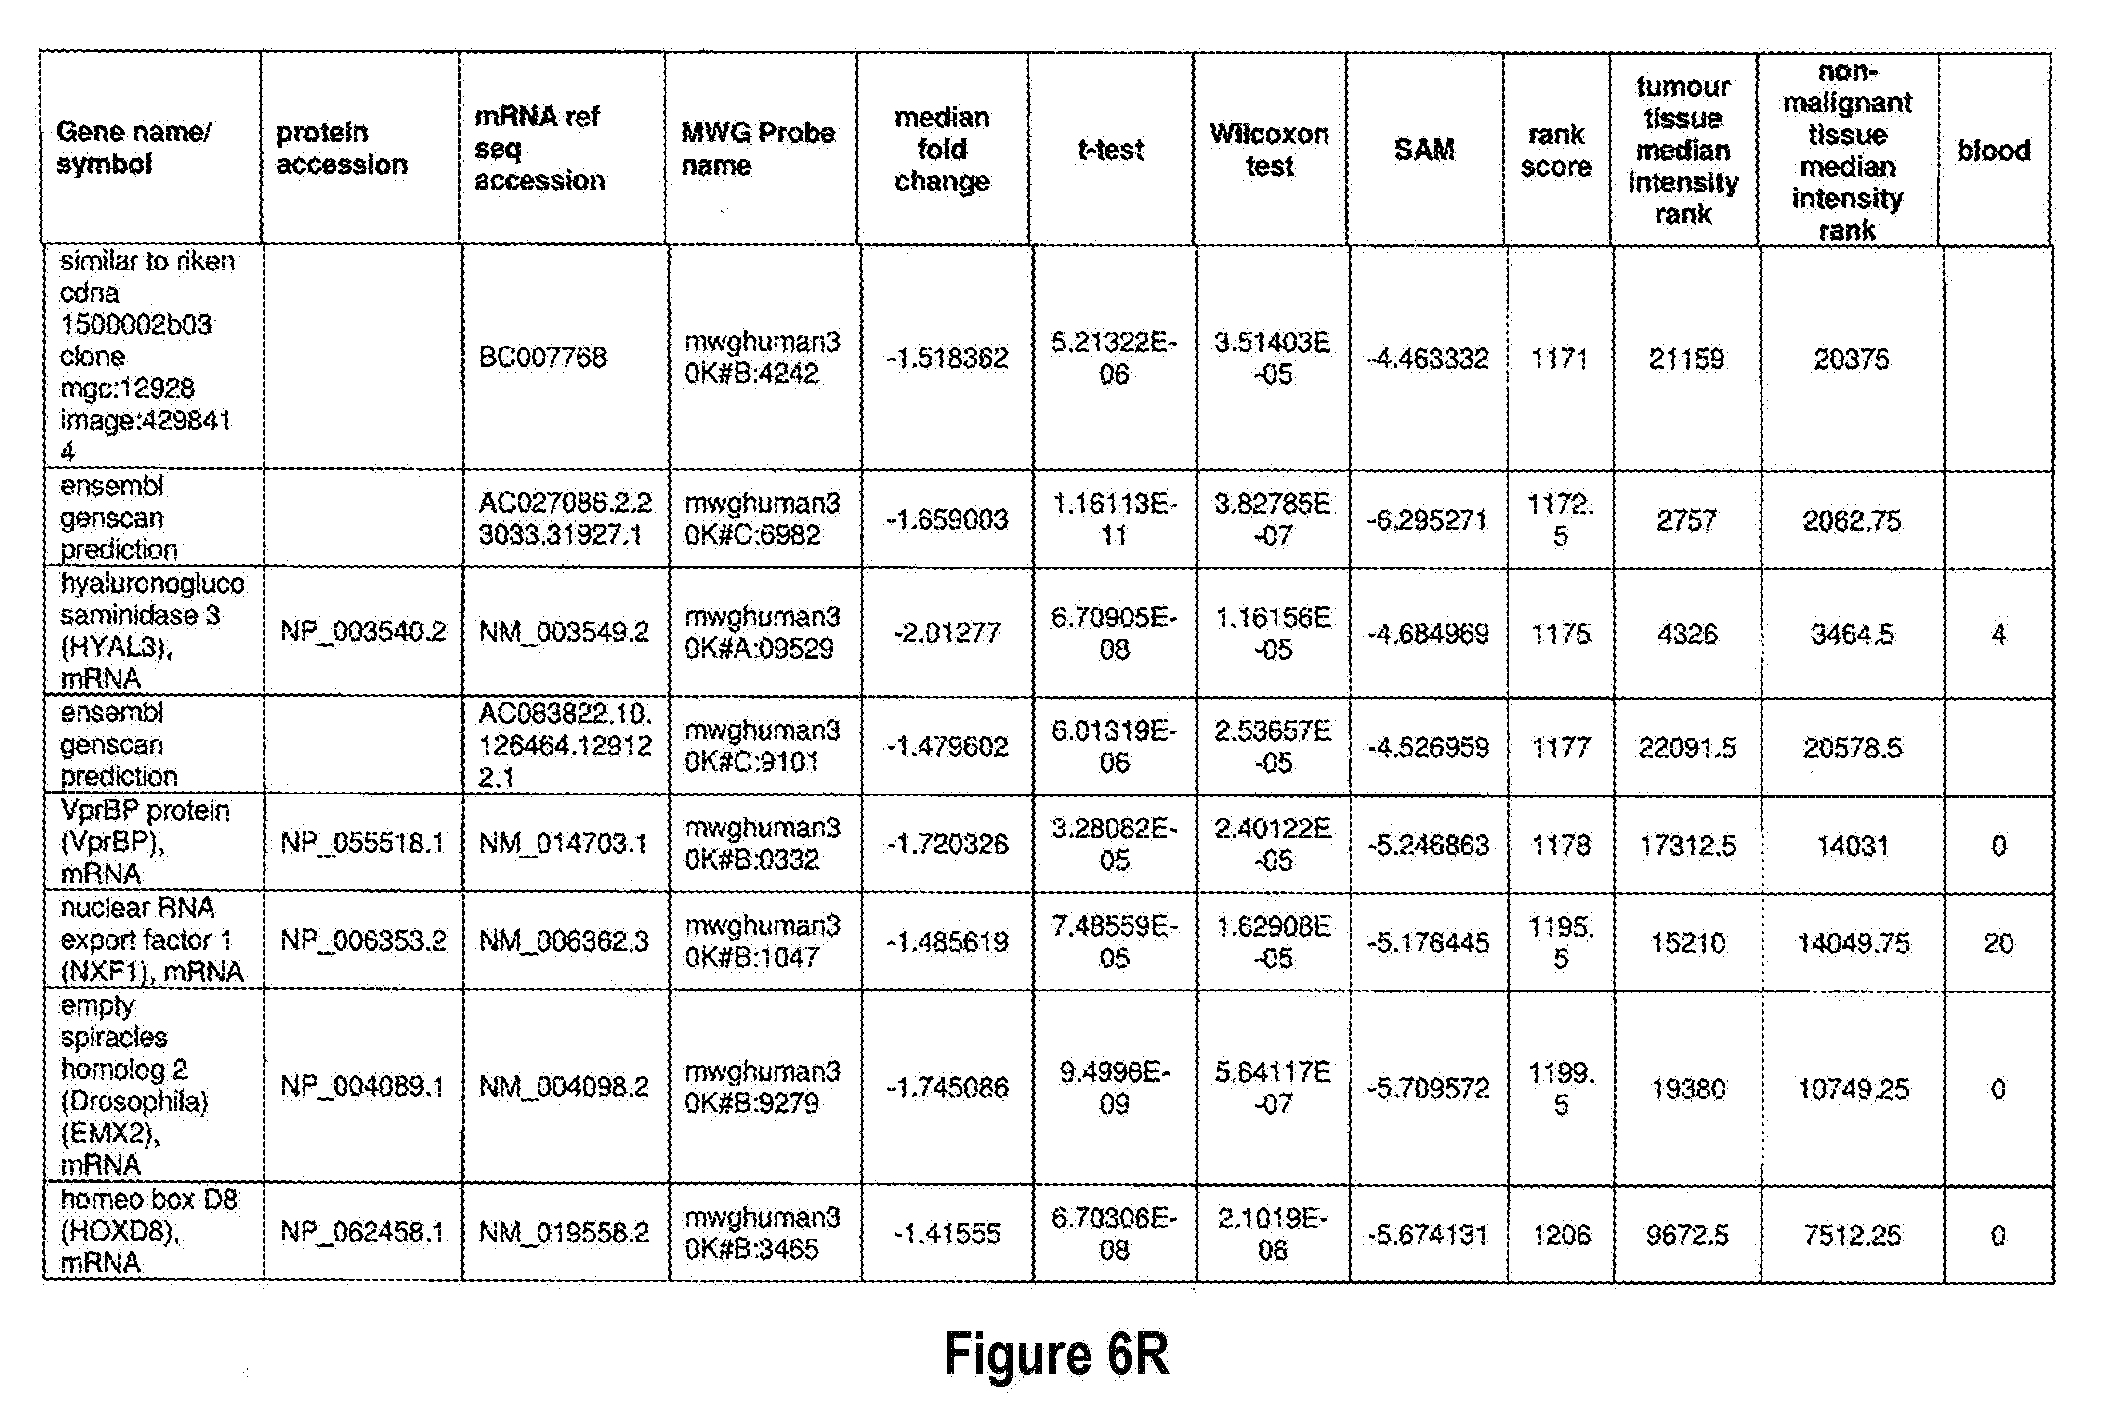
D00027

D00028

D00029

D00030

D00031

D00032

D00033

D00034

D00035

D00036

D00037

D00038

D00039

D00040

D00041
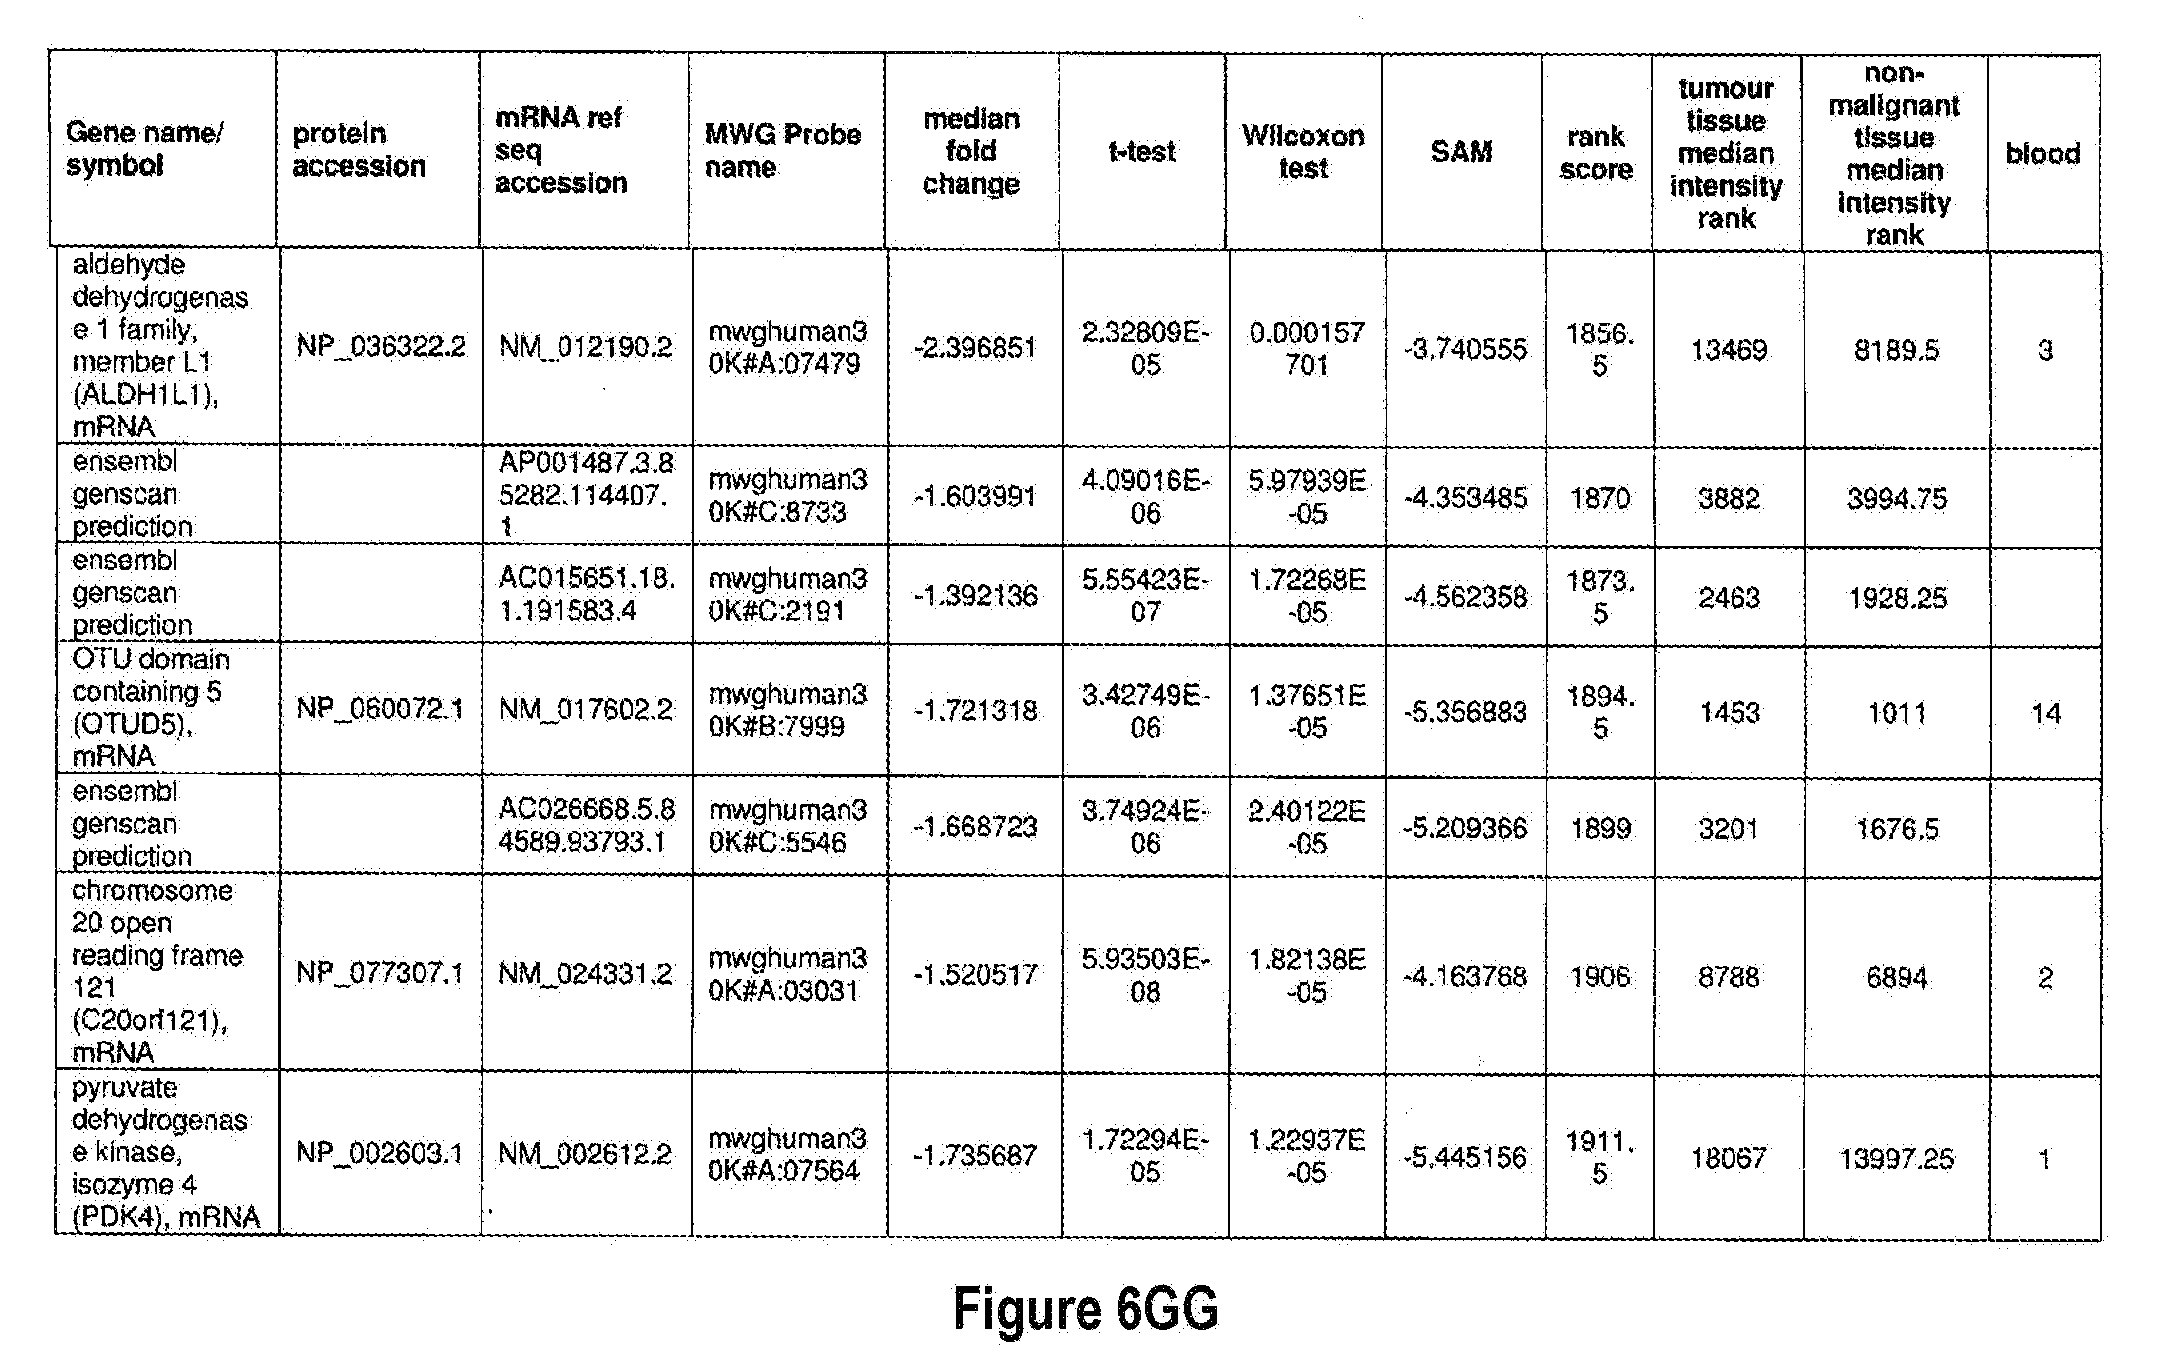
D00042

D00043

D00044
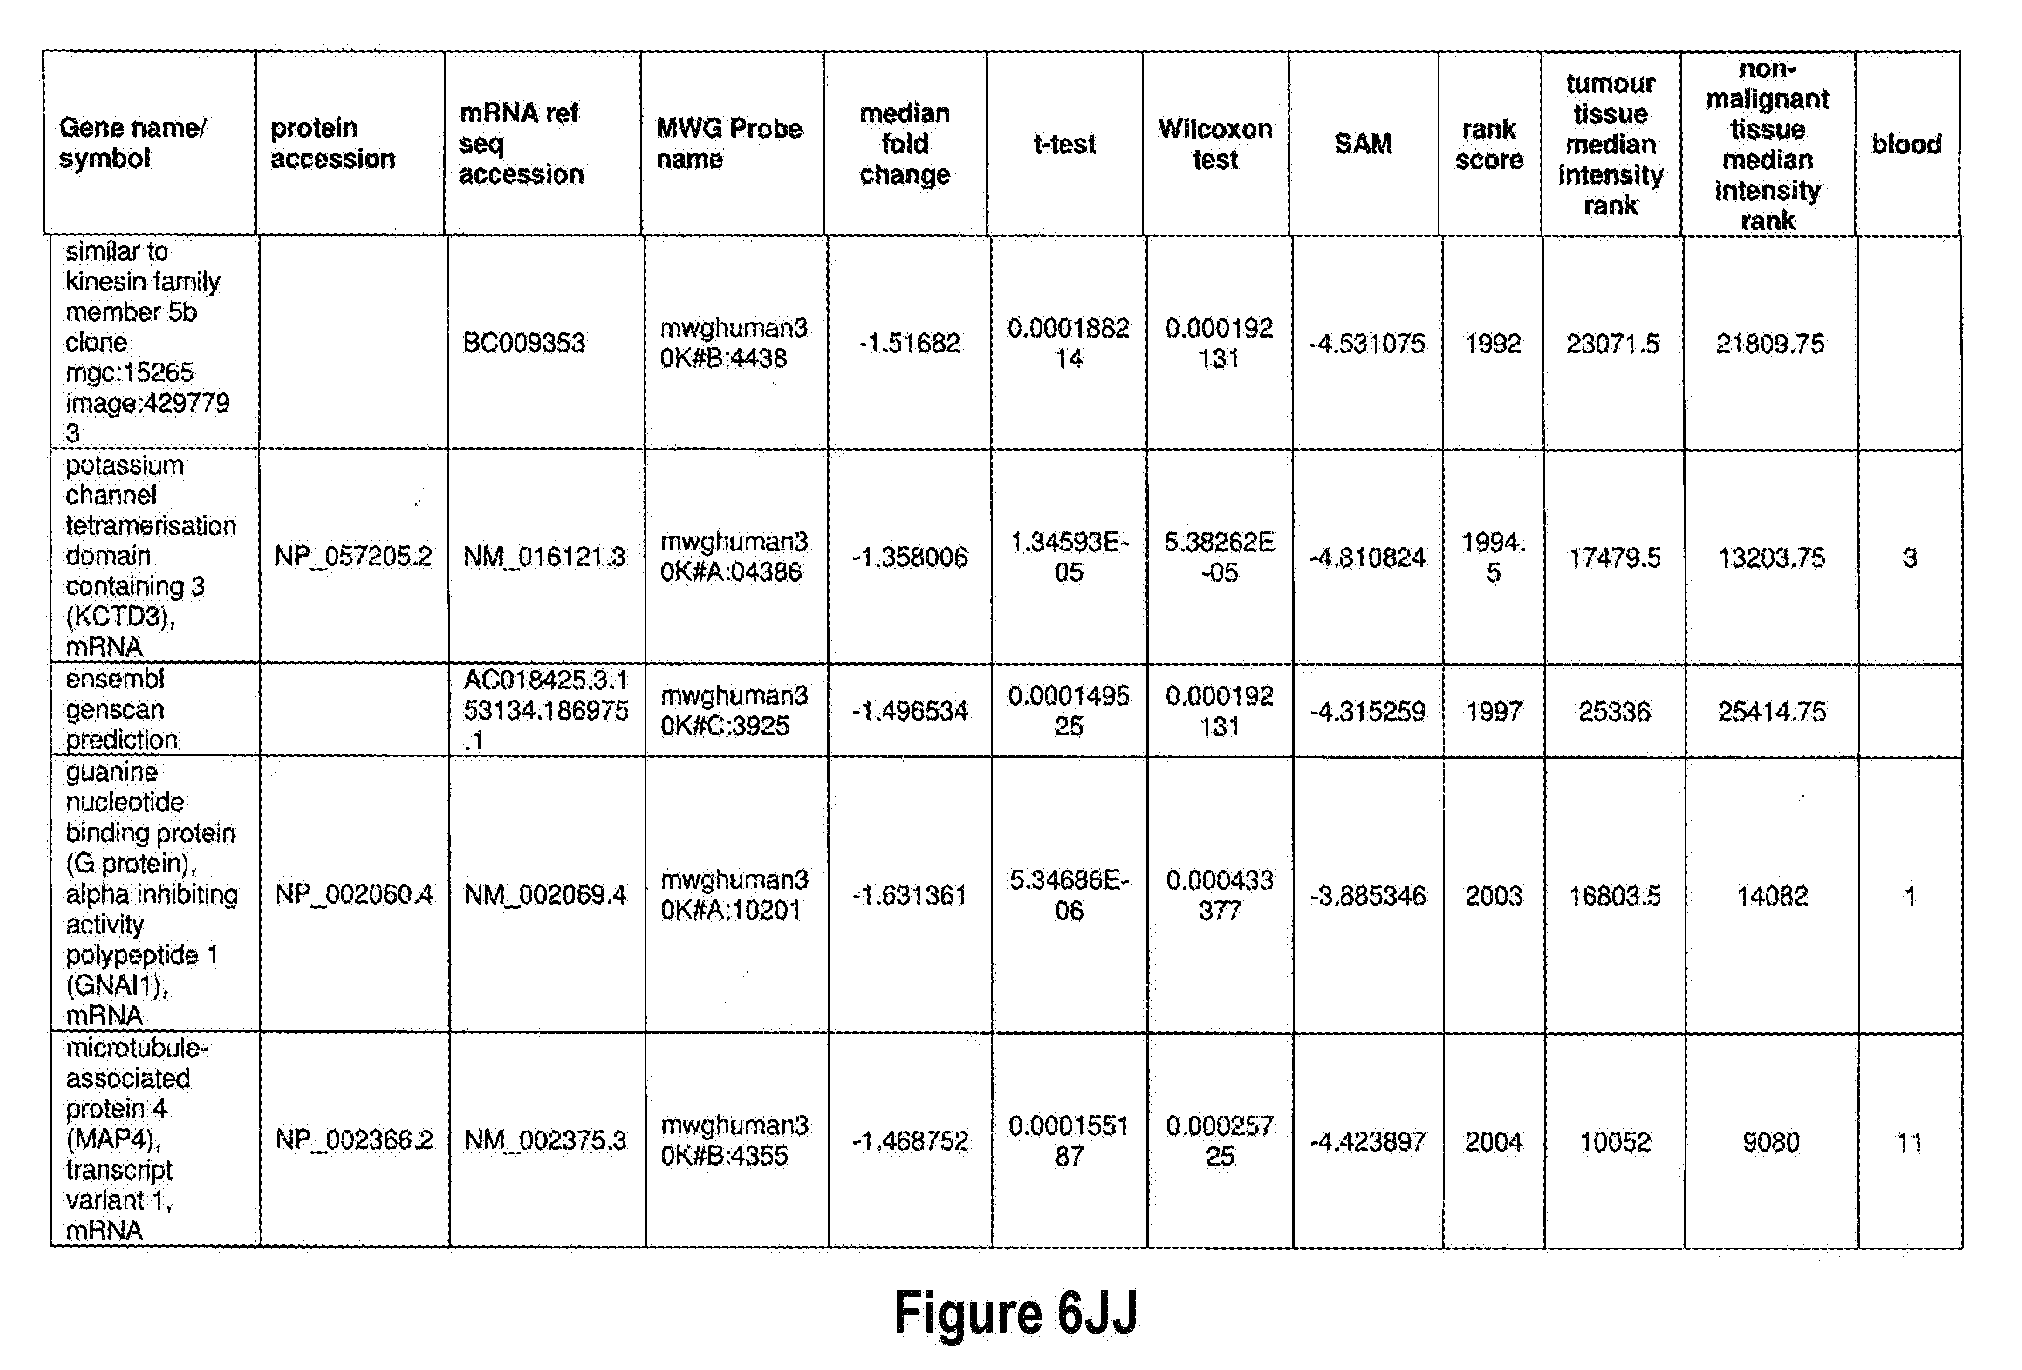
D00045

D00046

D00047

D00048

D00049

D00050
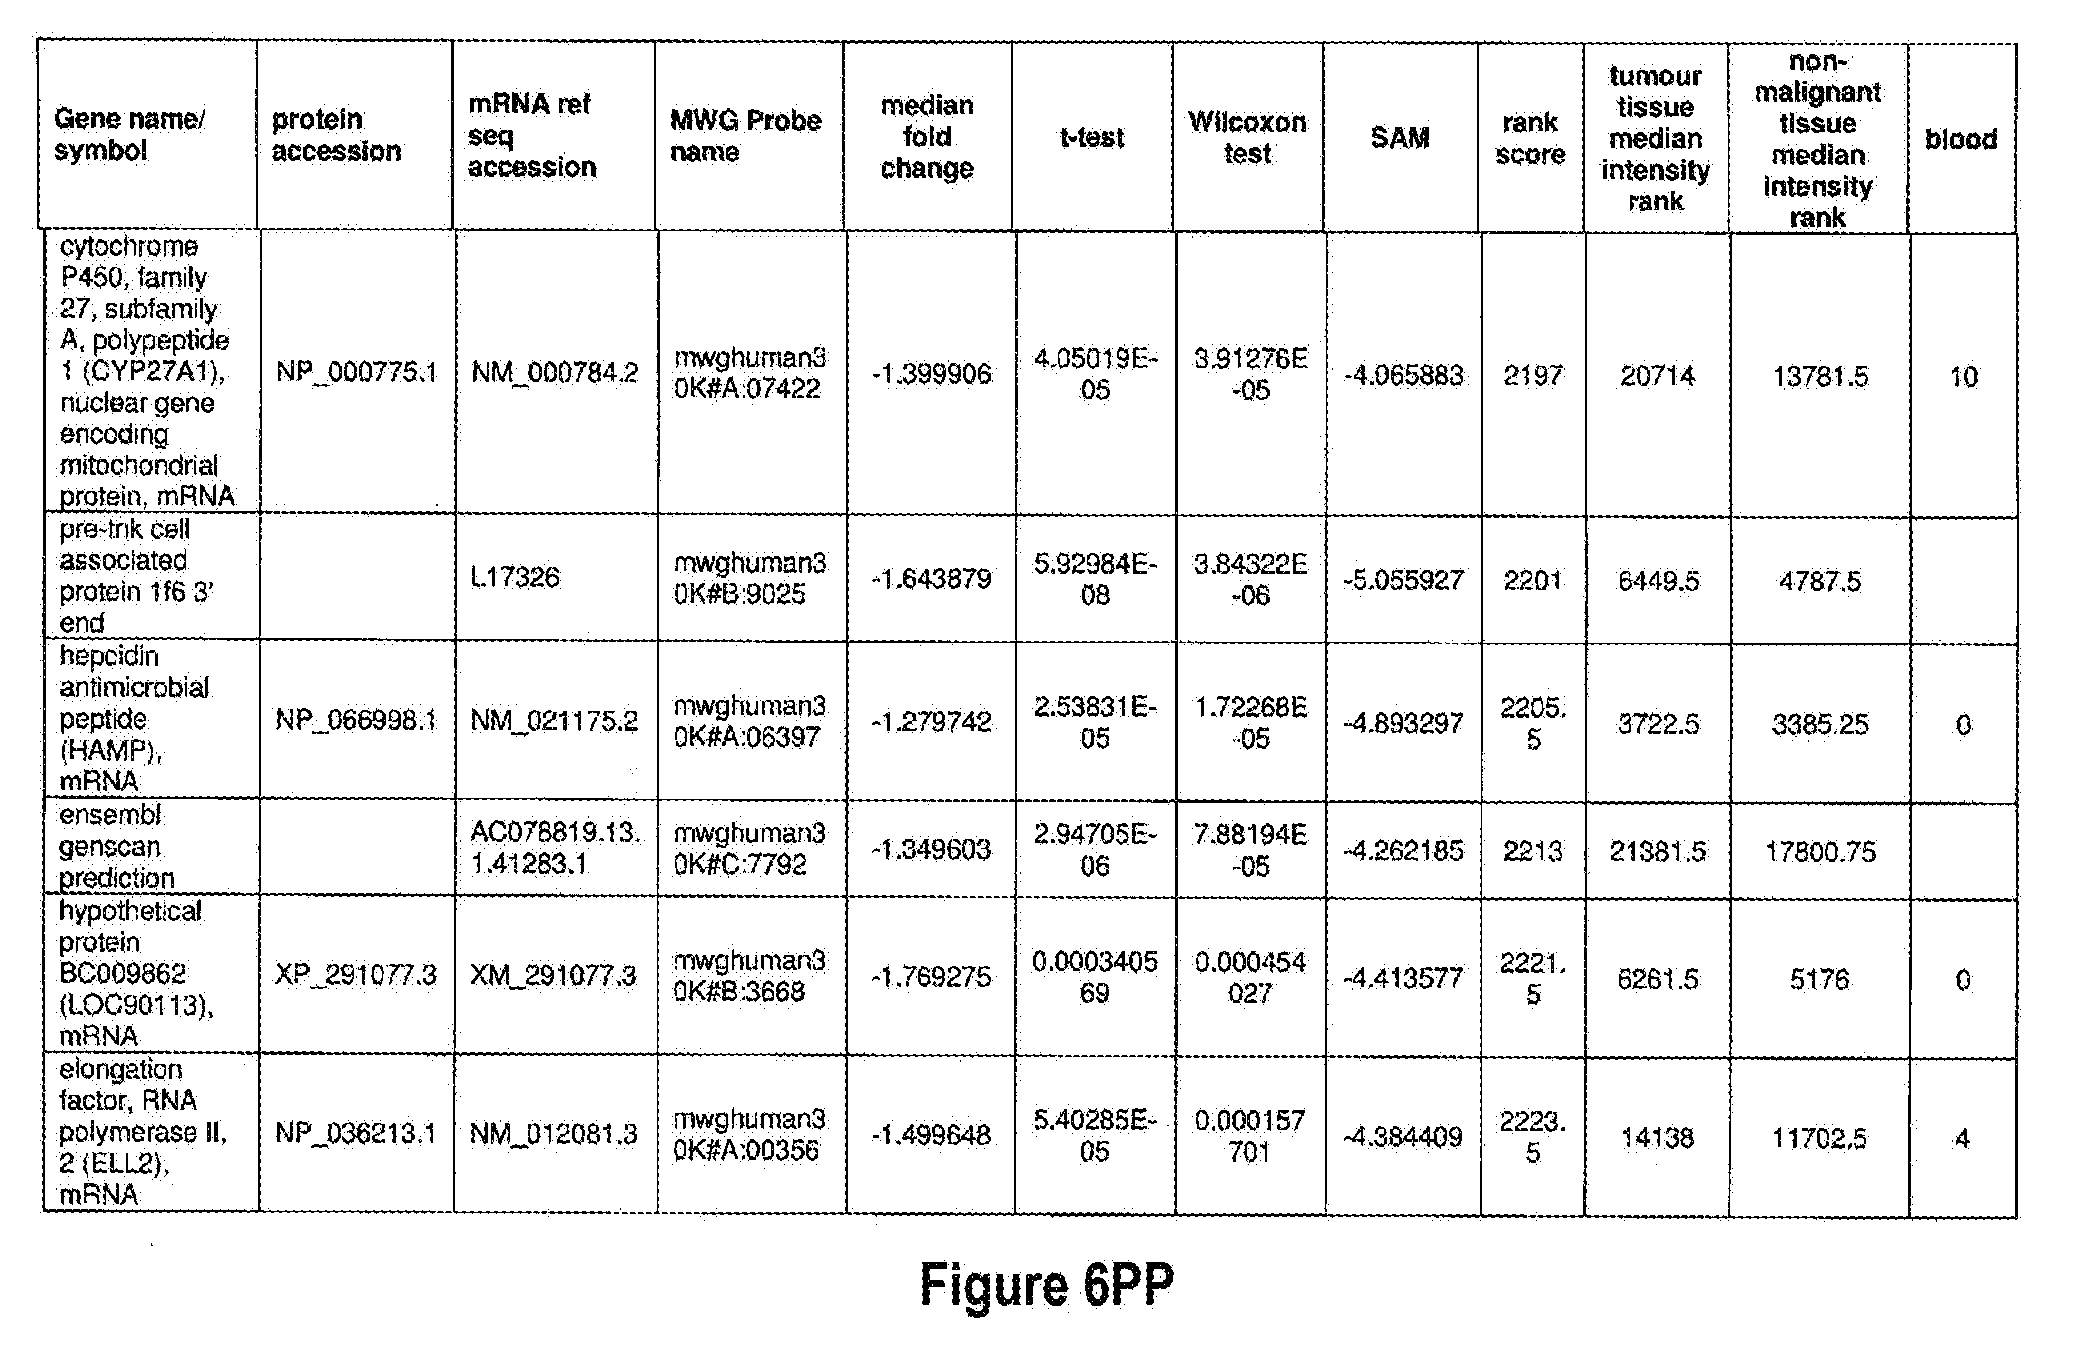
D00051
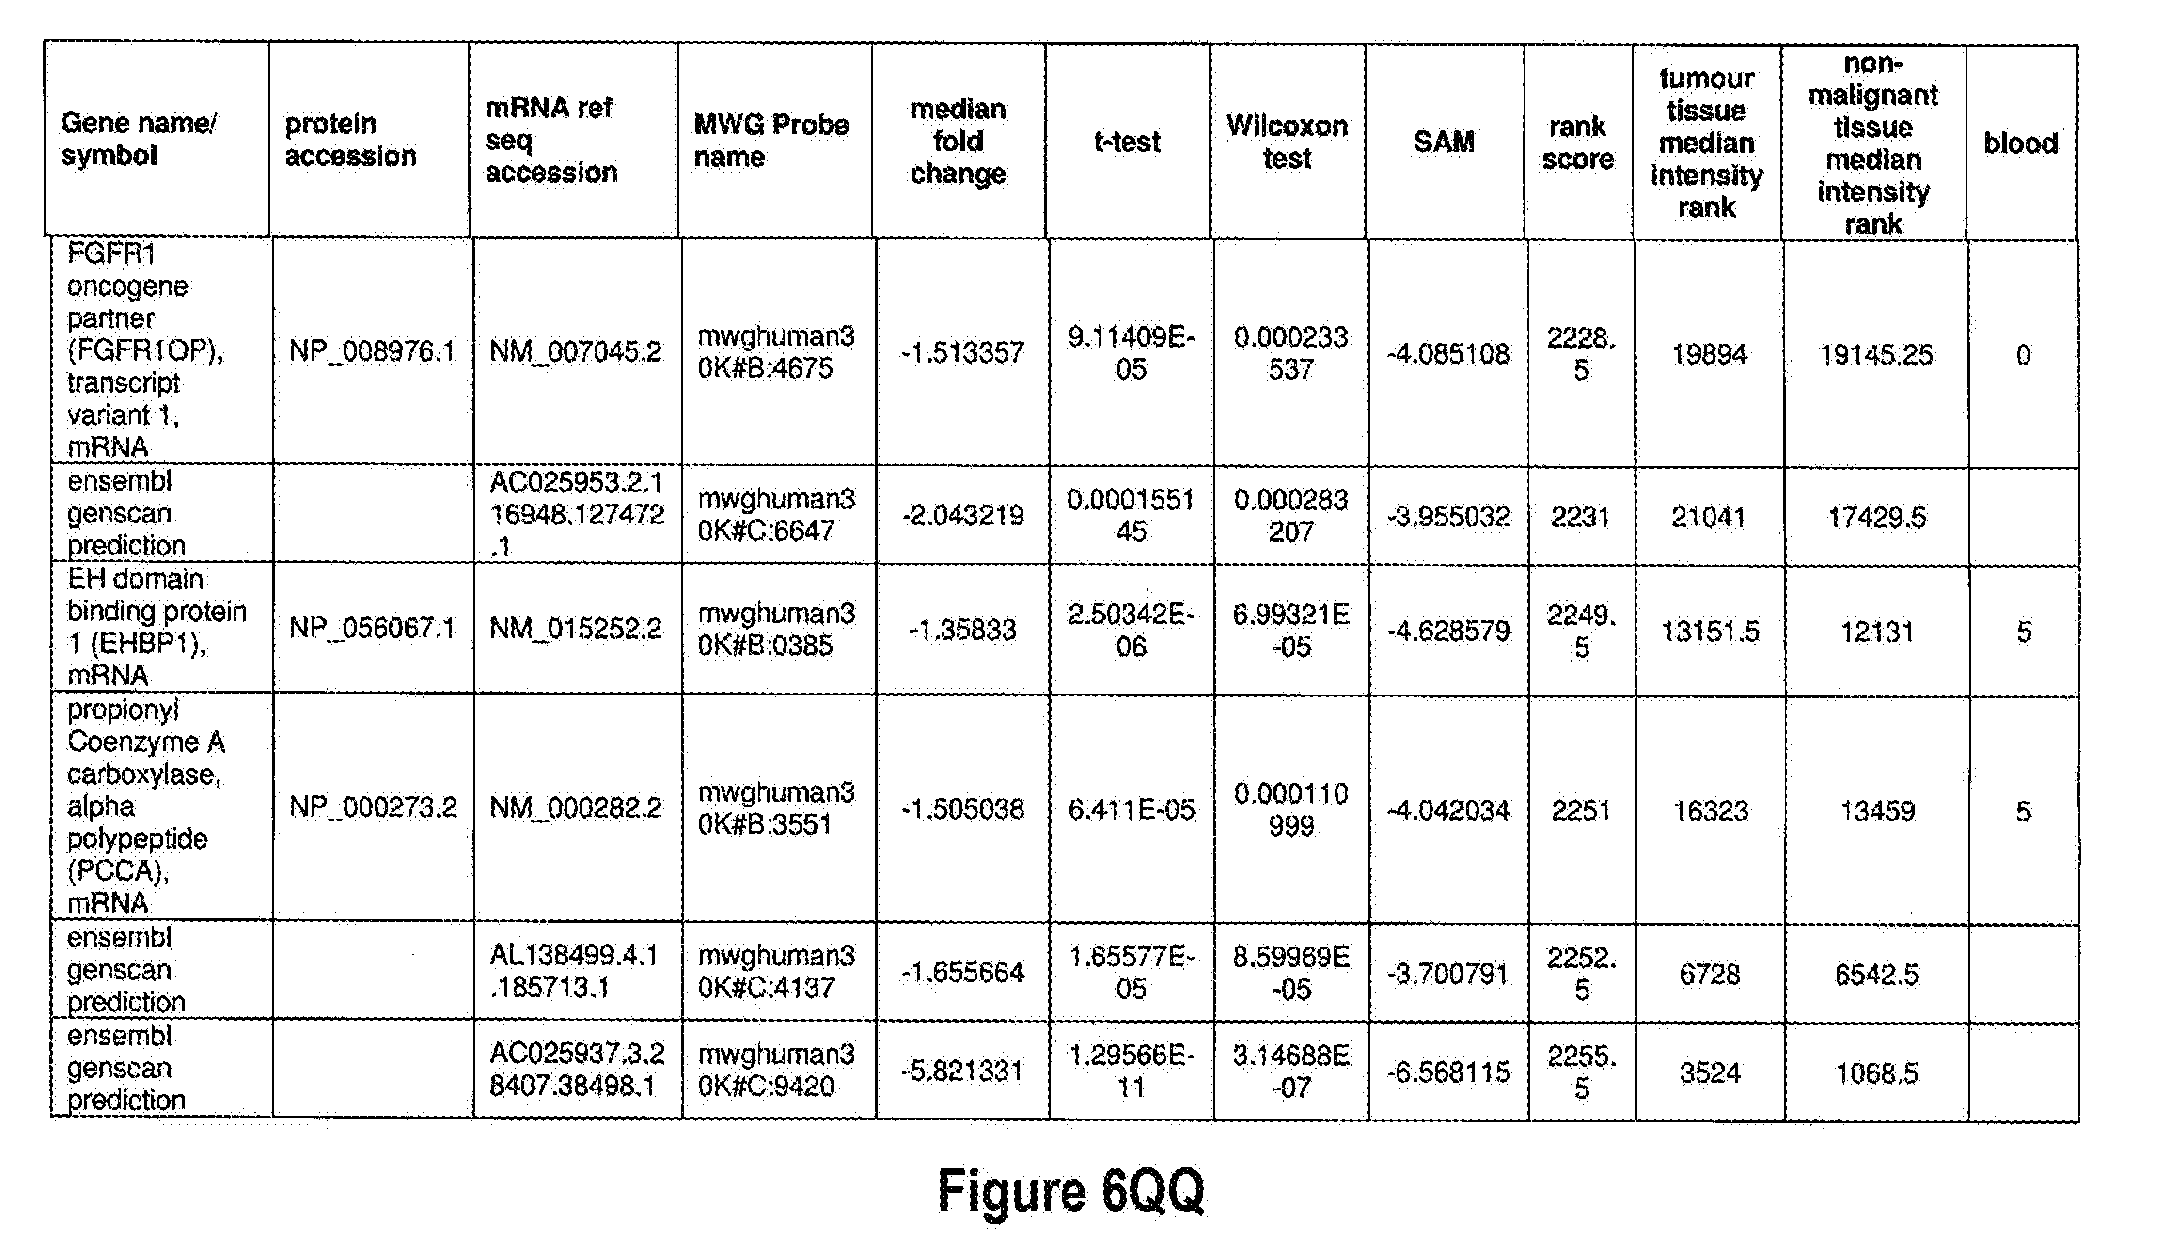
D00052

D00053
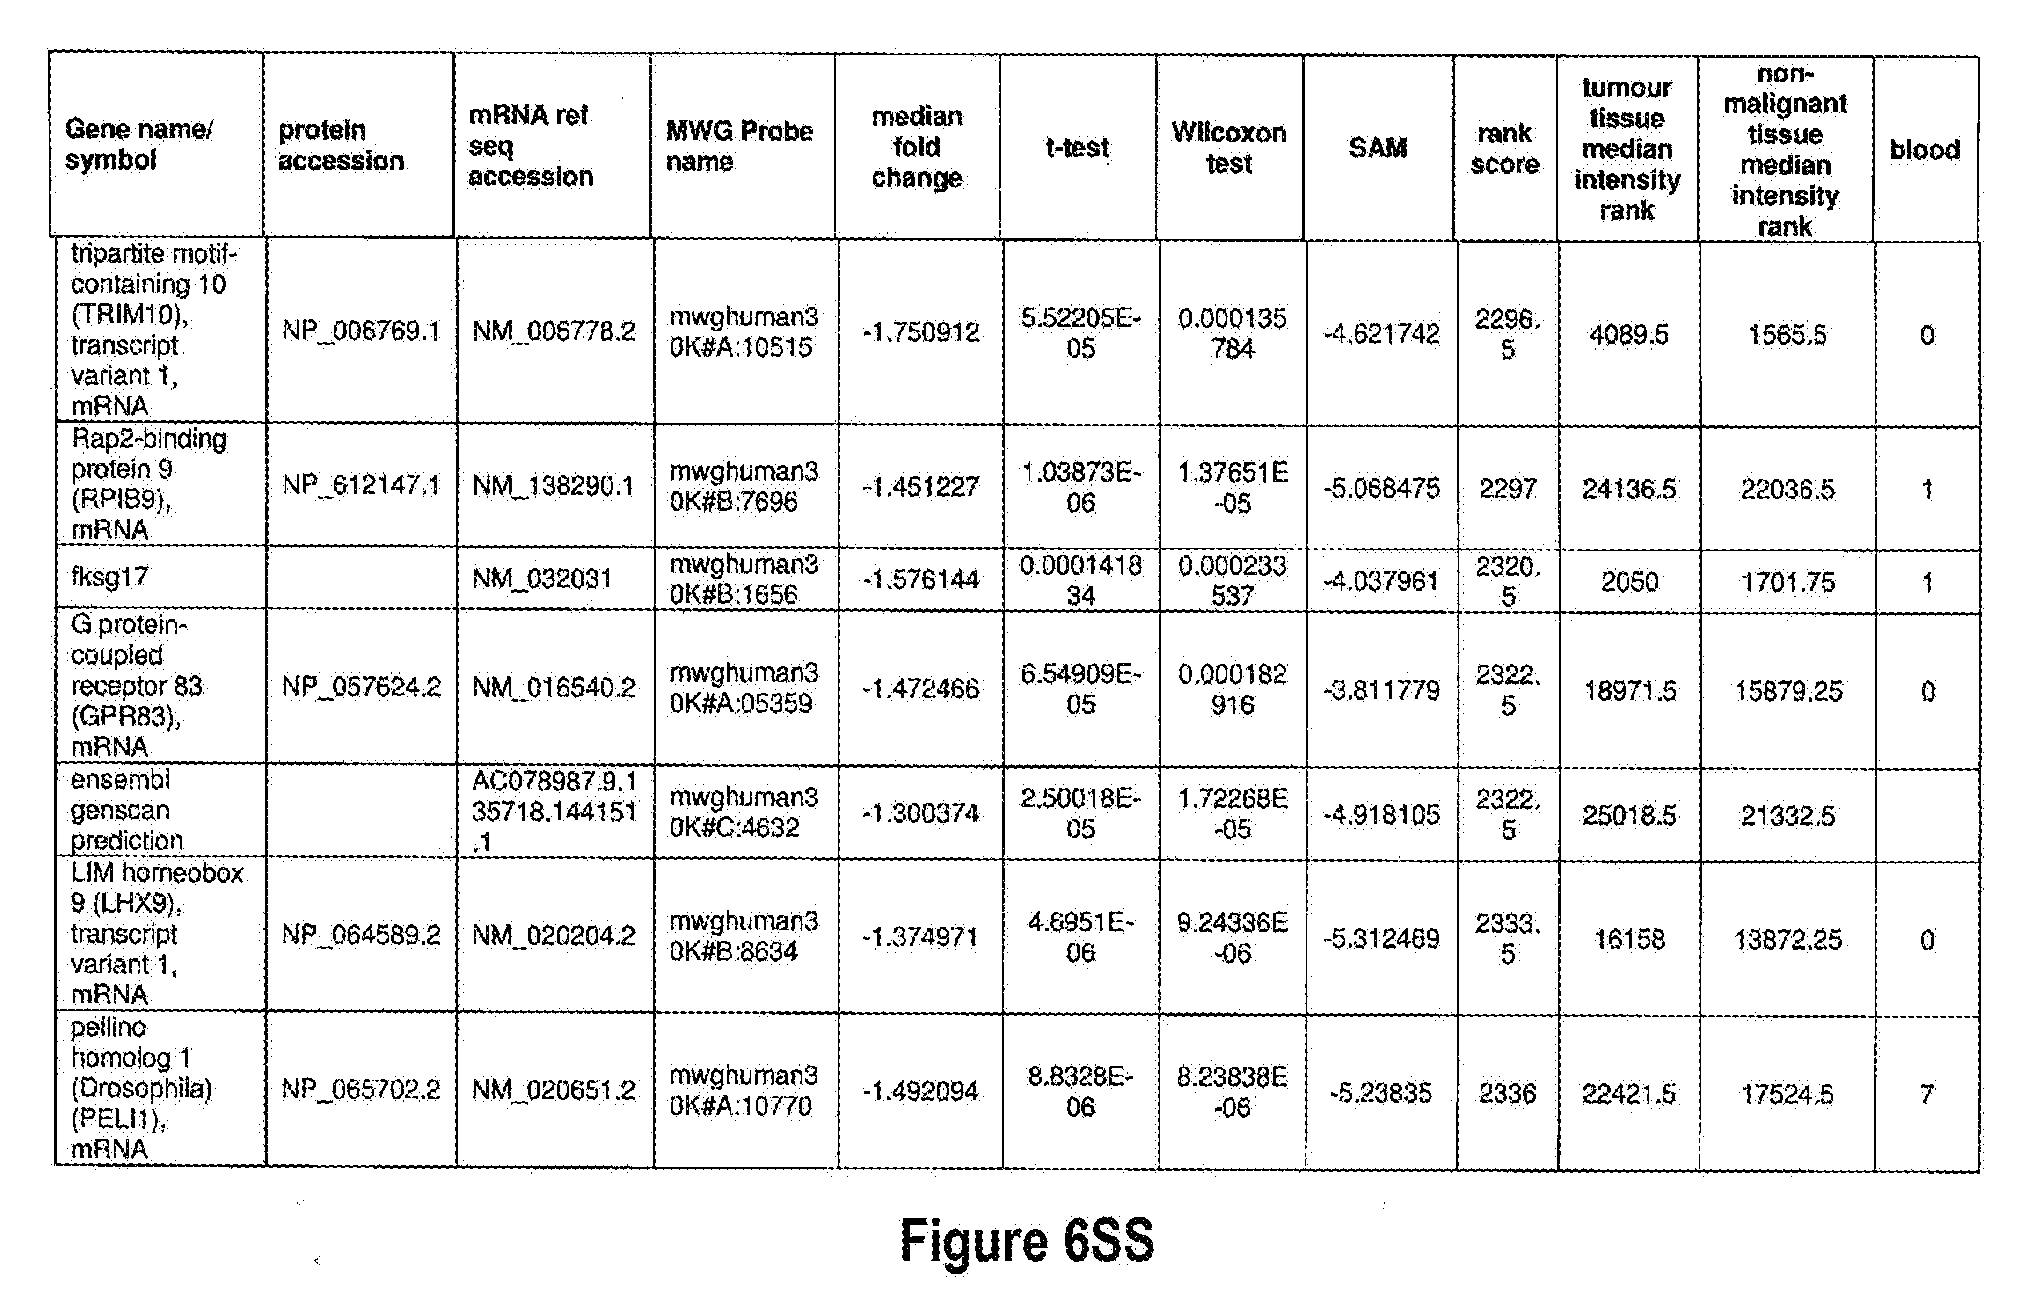
D00054

D00055

D00056

D00057
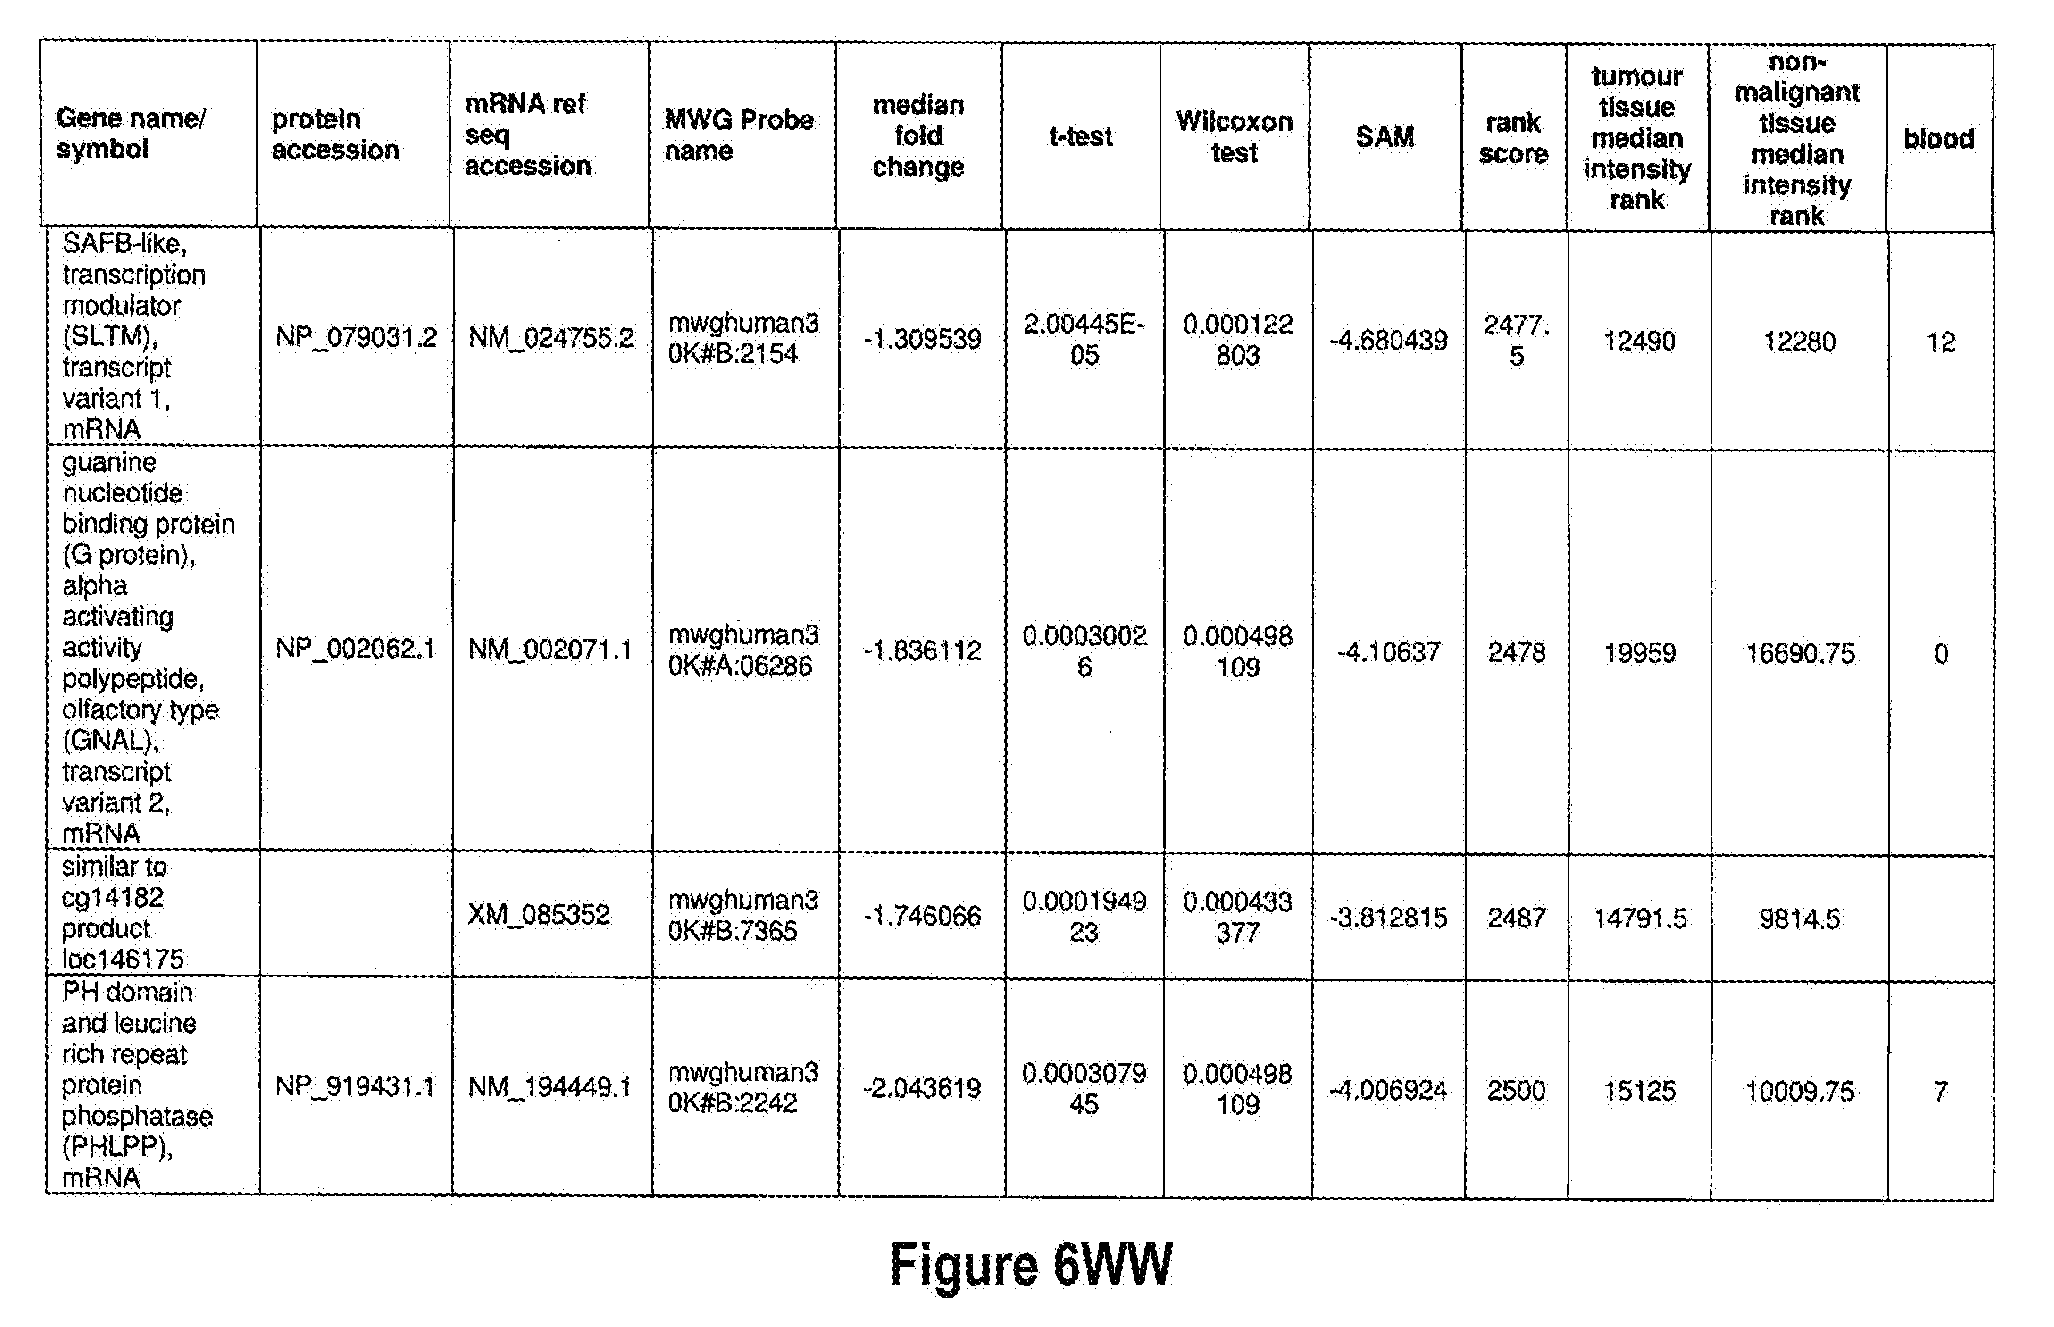
D00058
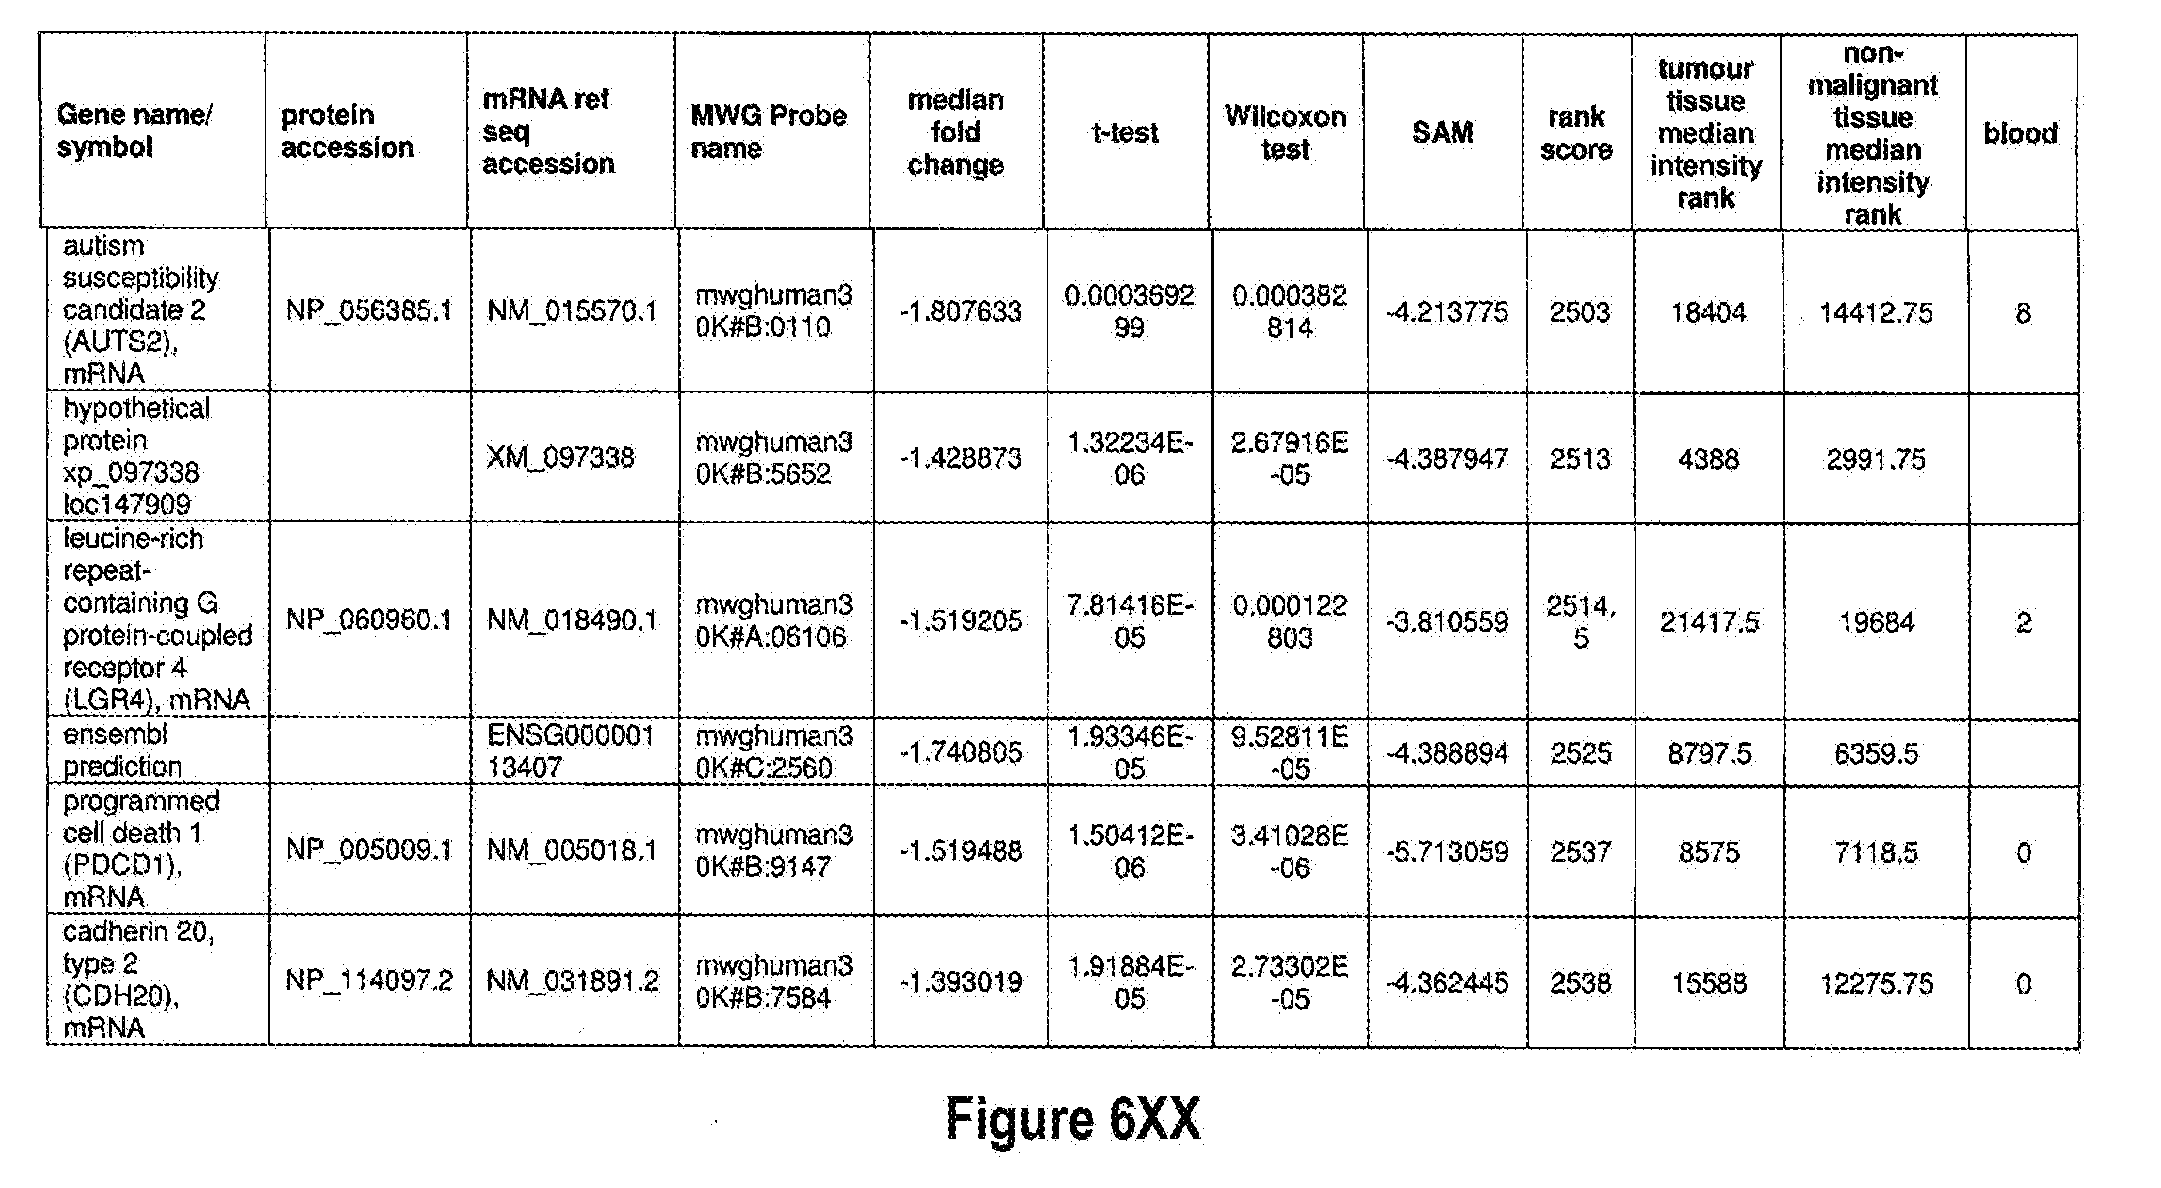
D00059

D00060

D00061

D00062

D00063
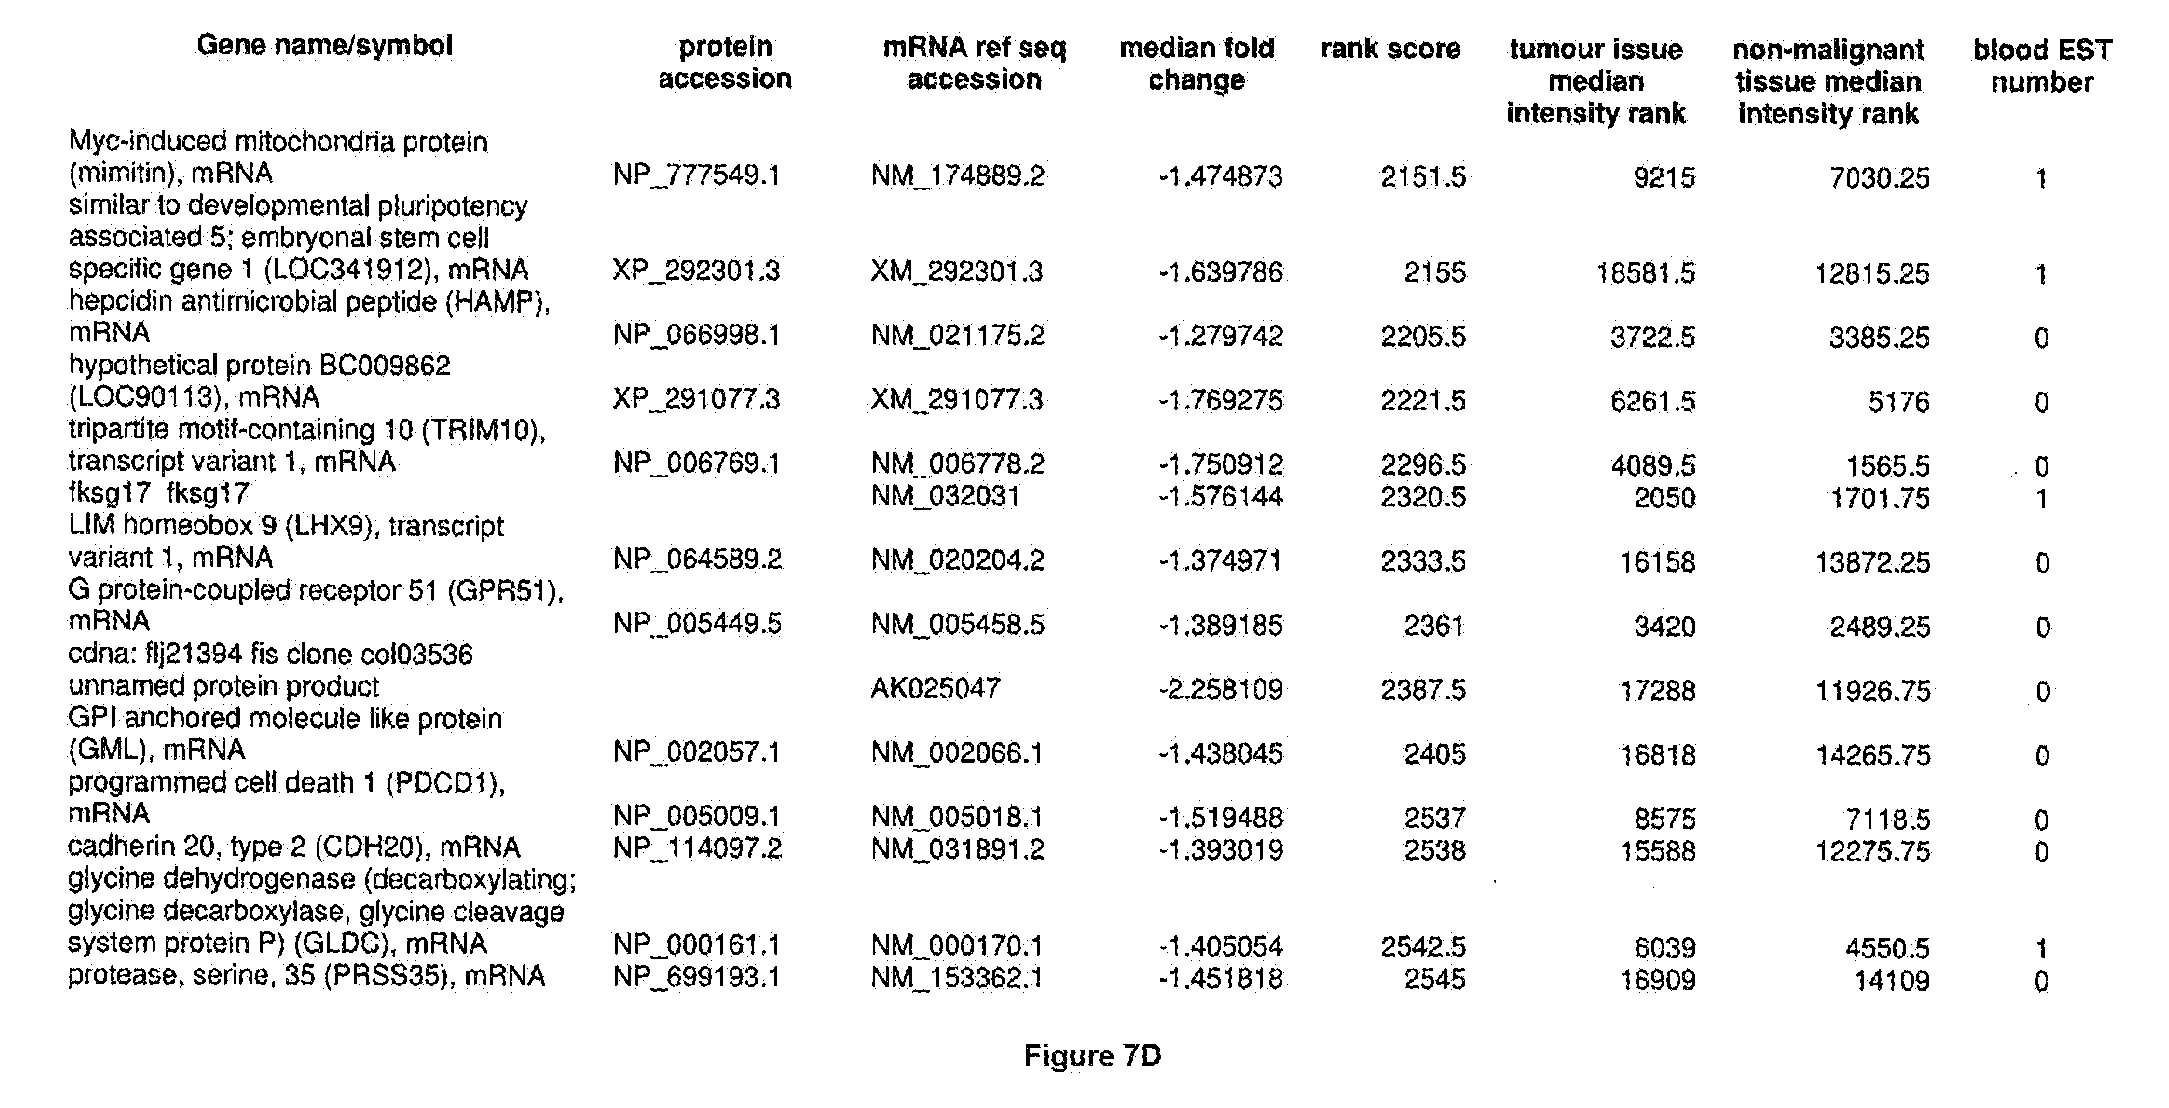
D00064

D00065

D00066

D00067

D00068
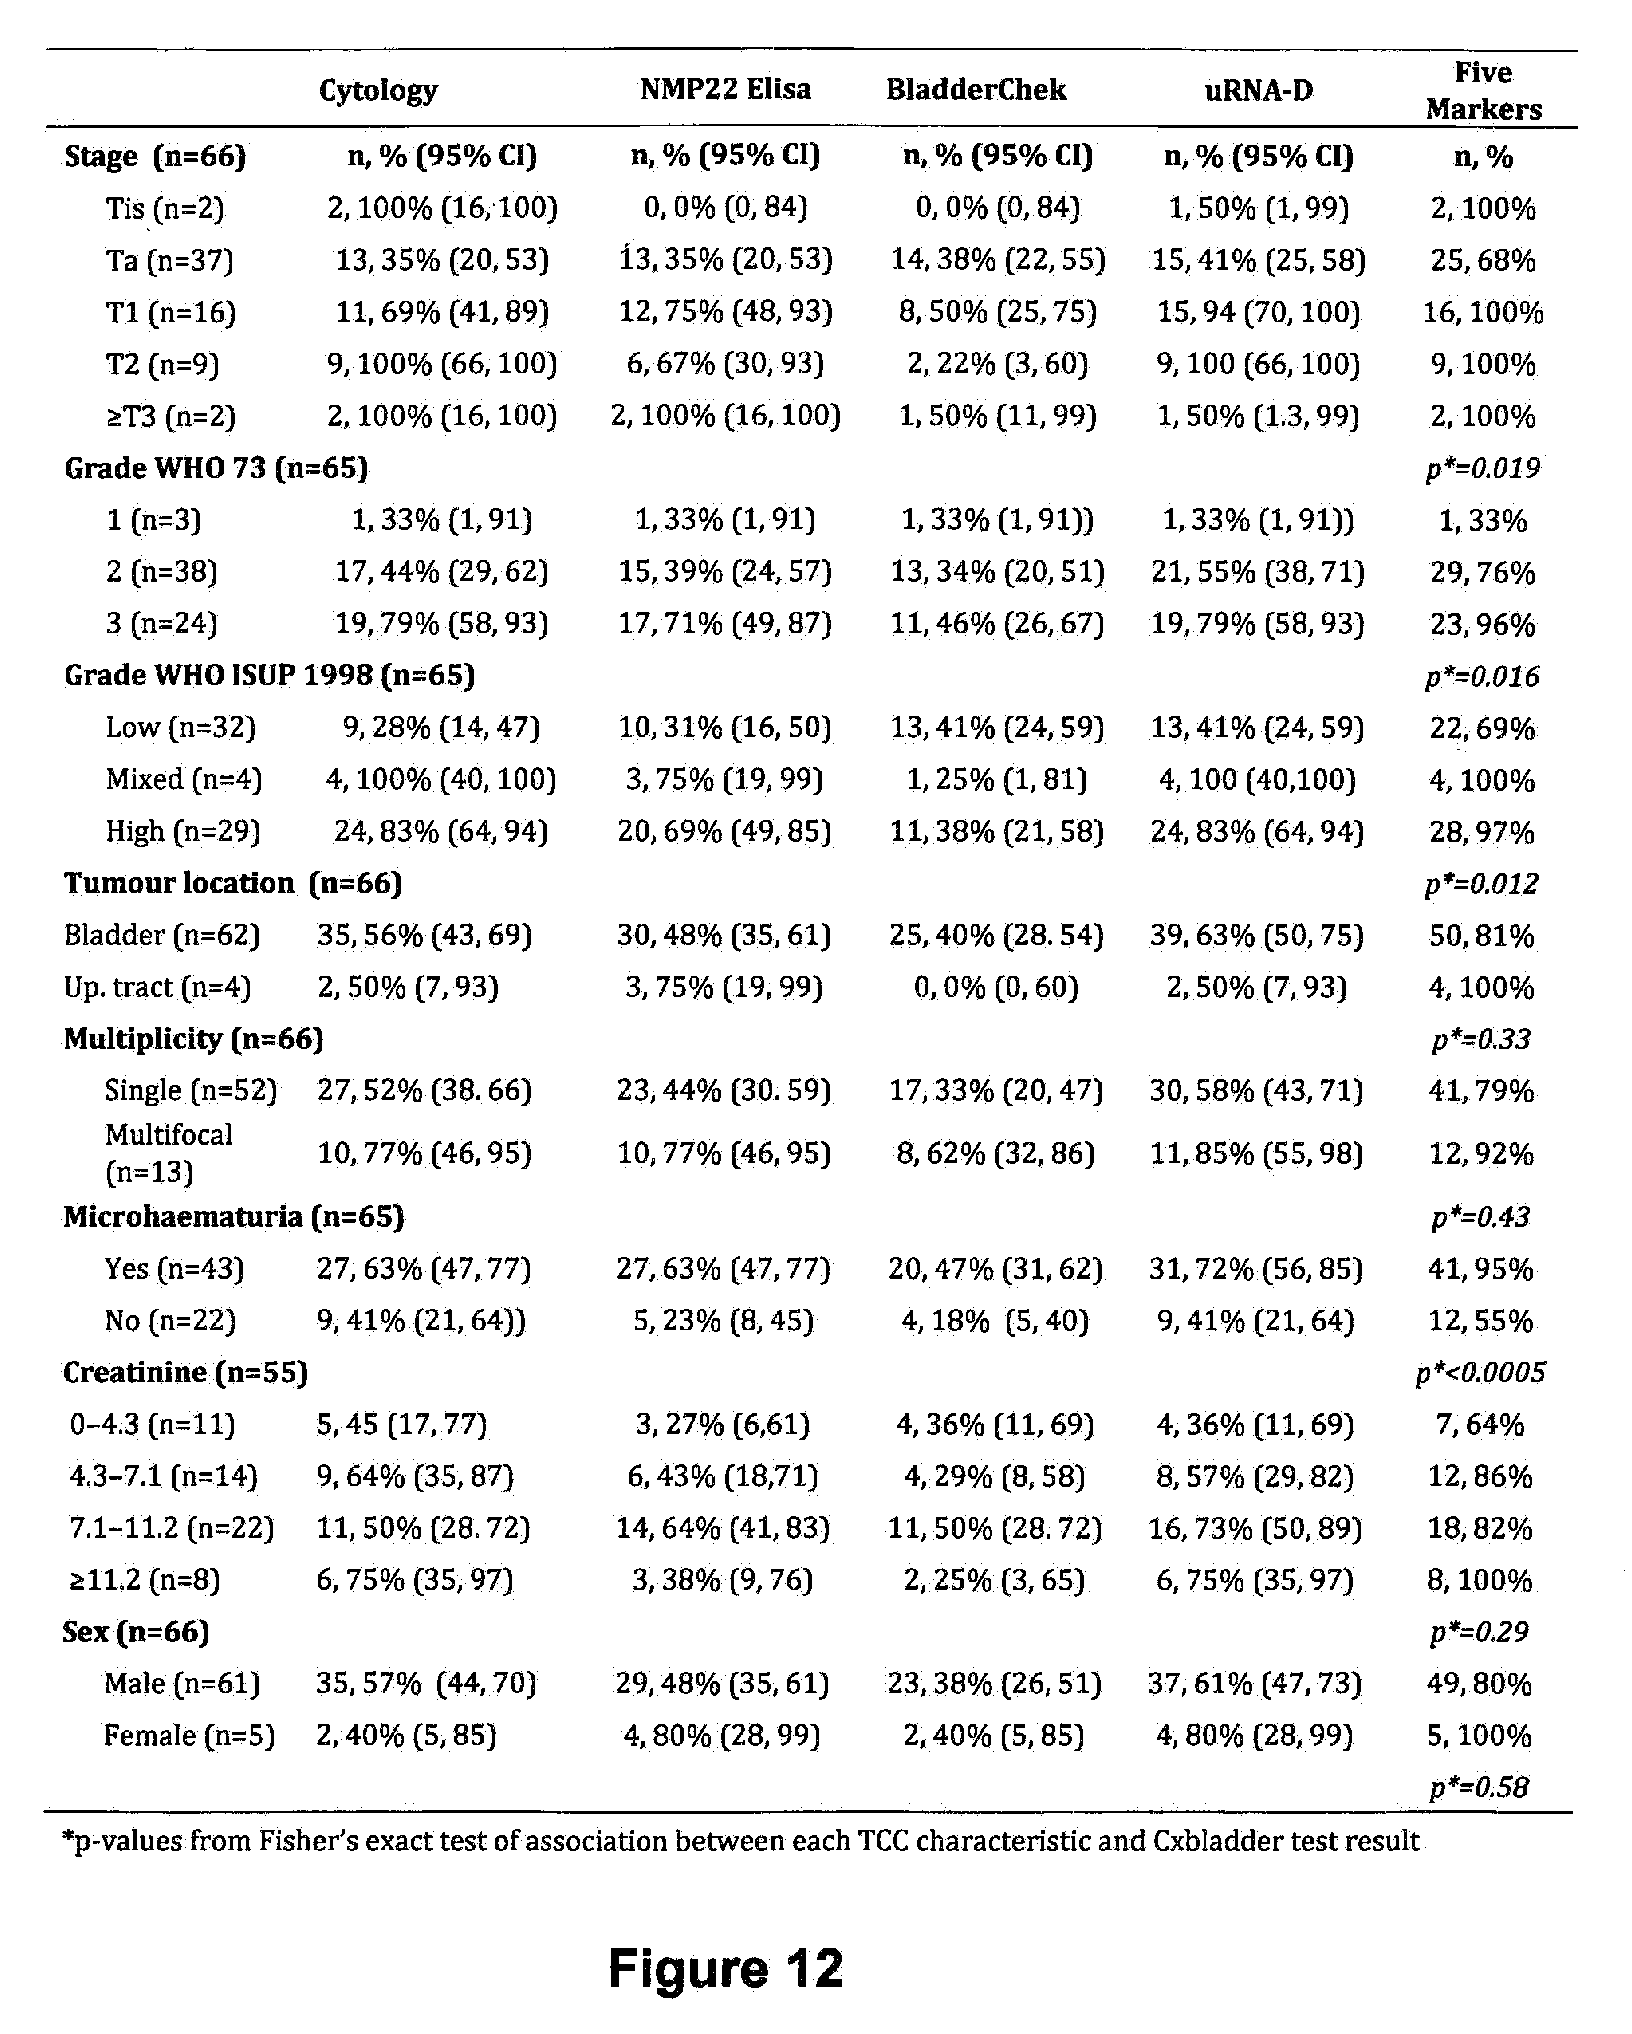
D00069

D00070

D00071

D00072

D00073

D00074

D00075

D00076
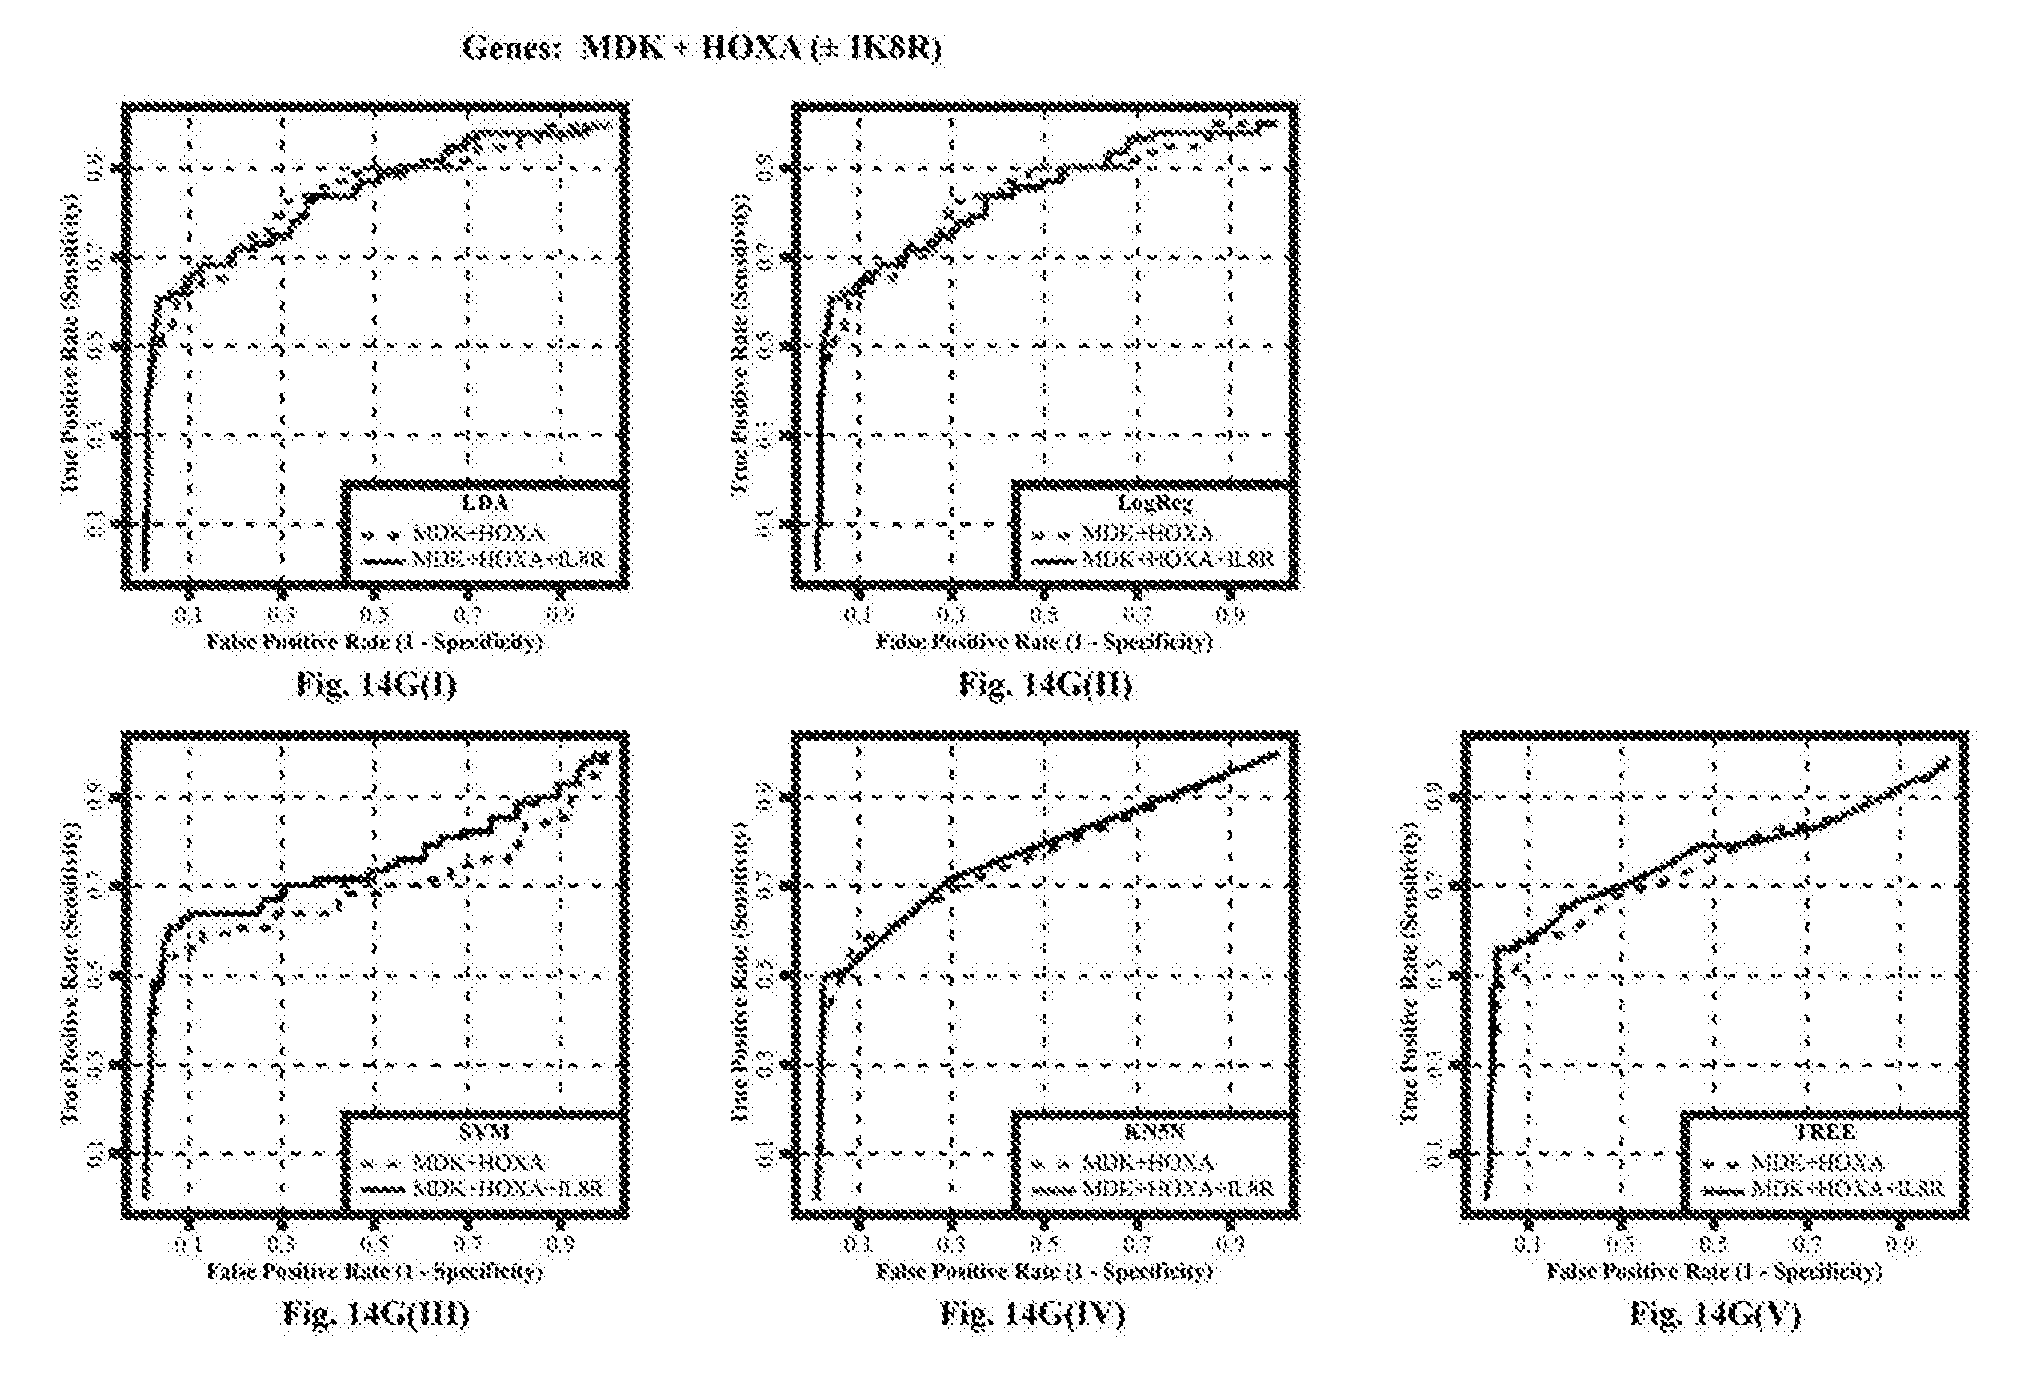
D00077
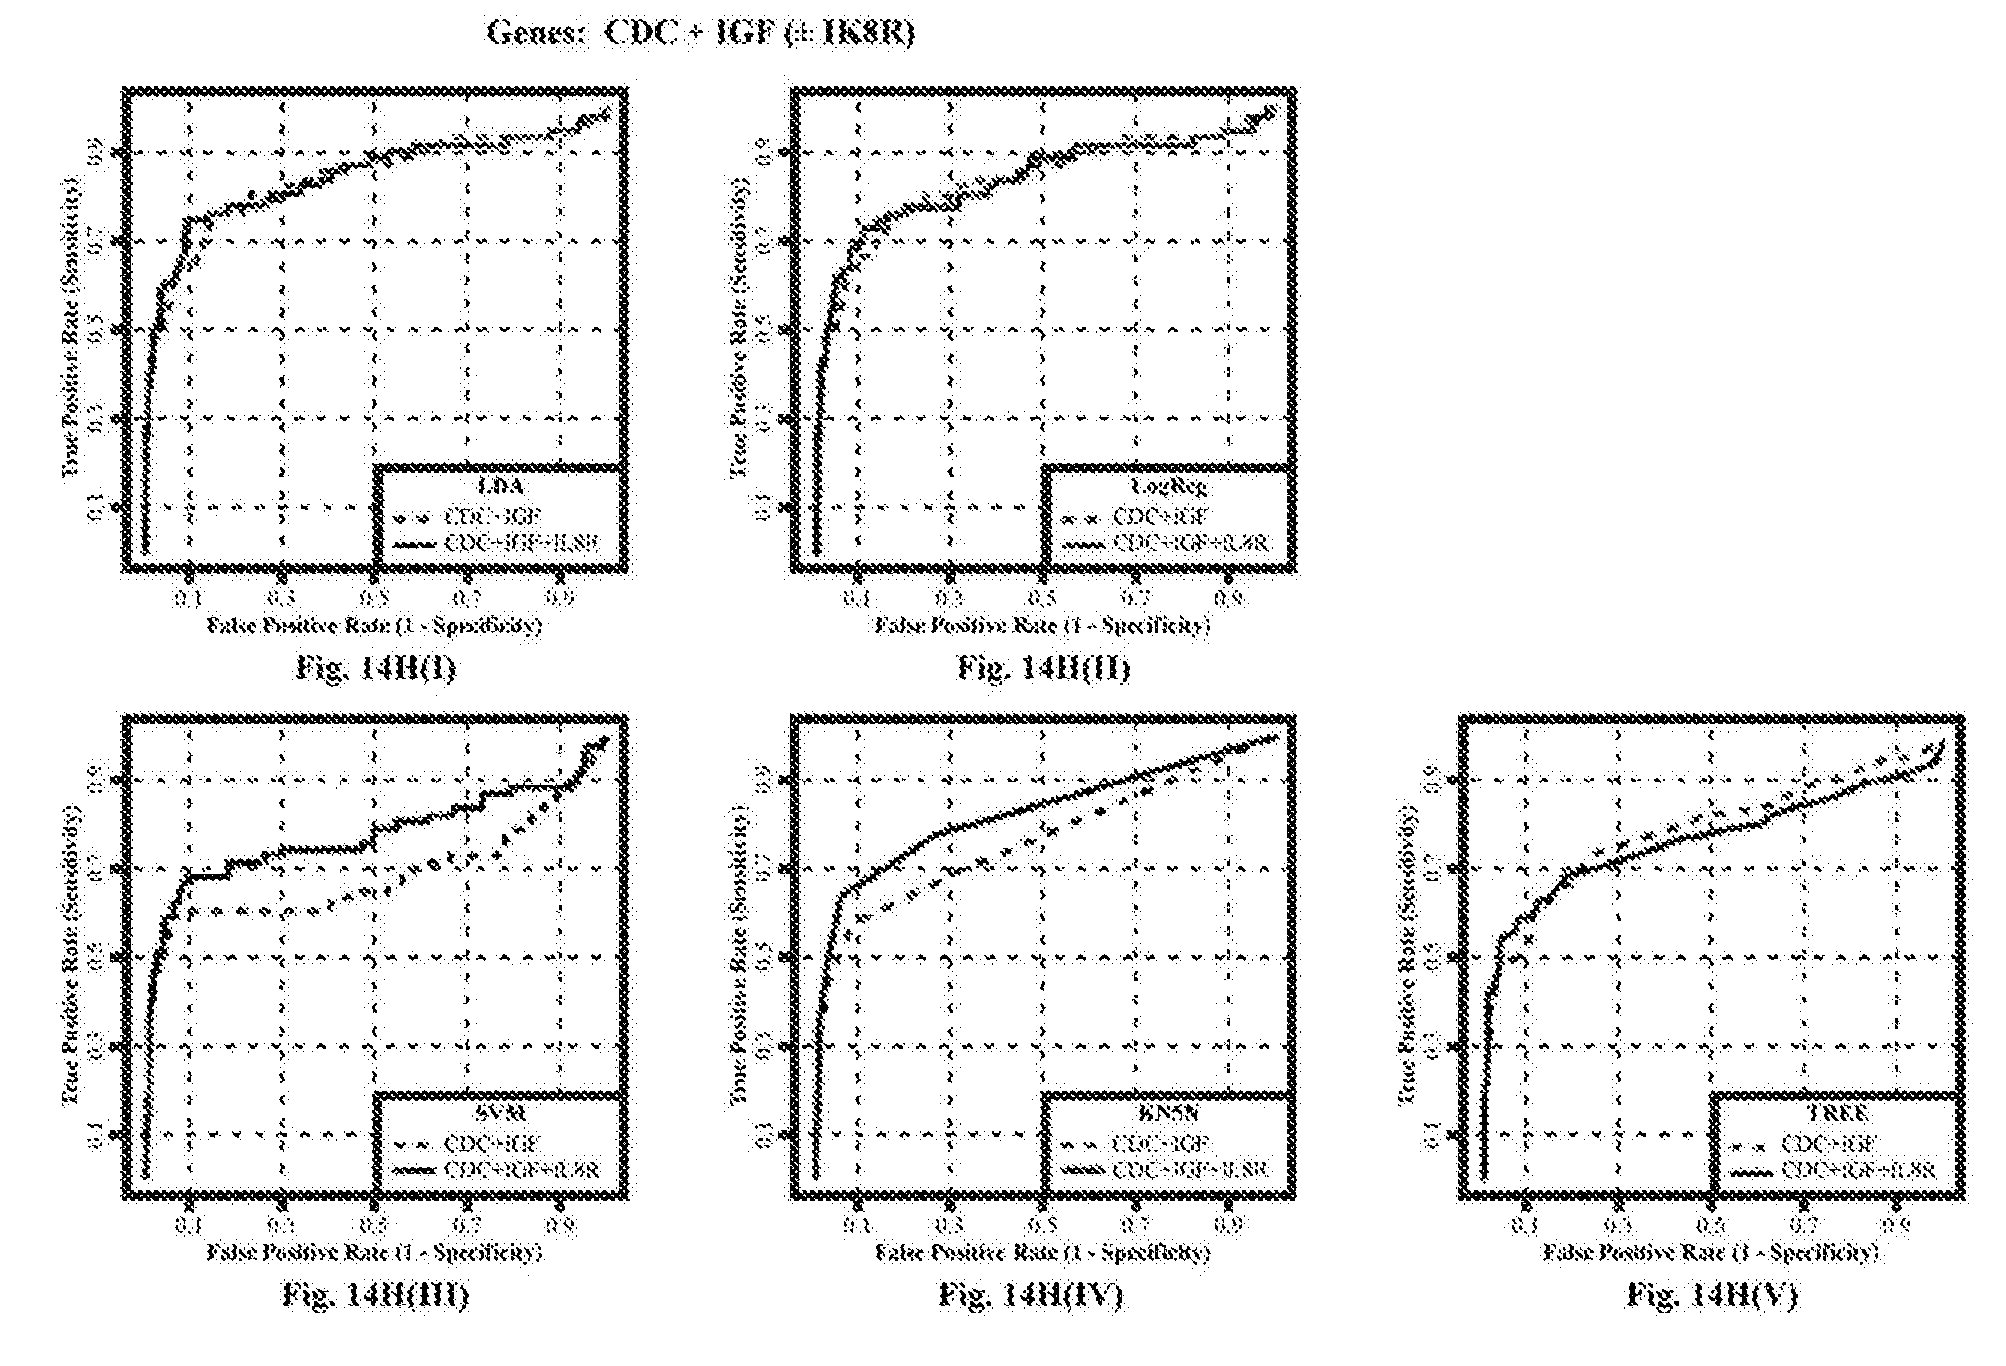
D00078

D00079

D00080

D00081

D00082

D00083

D00084
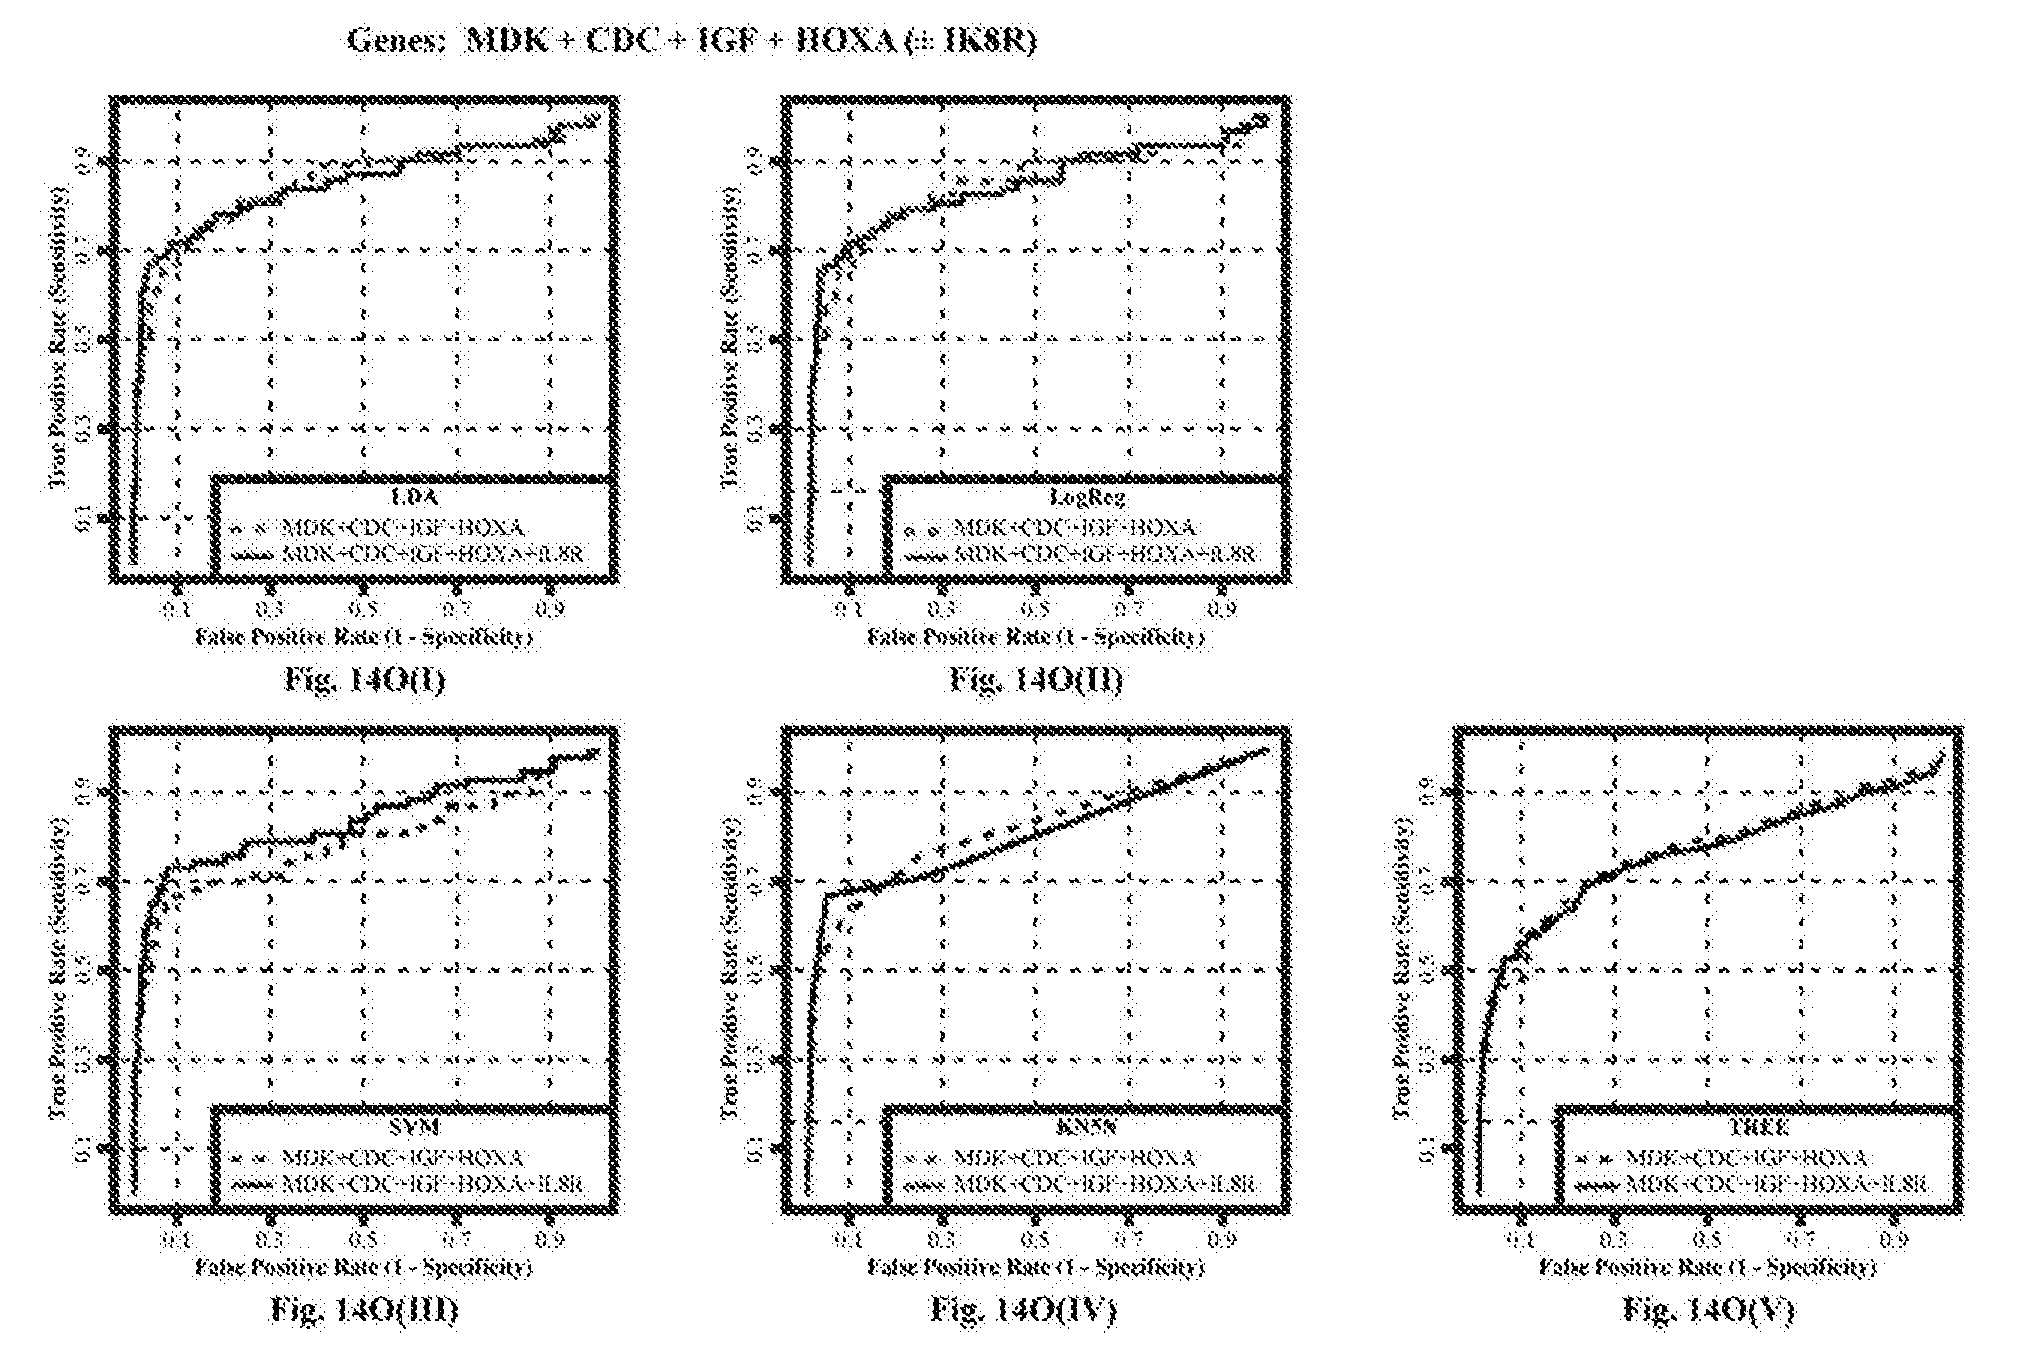
D00085
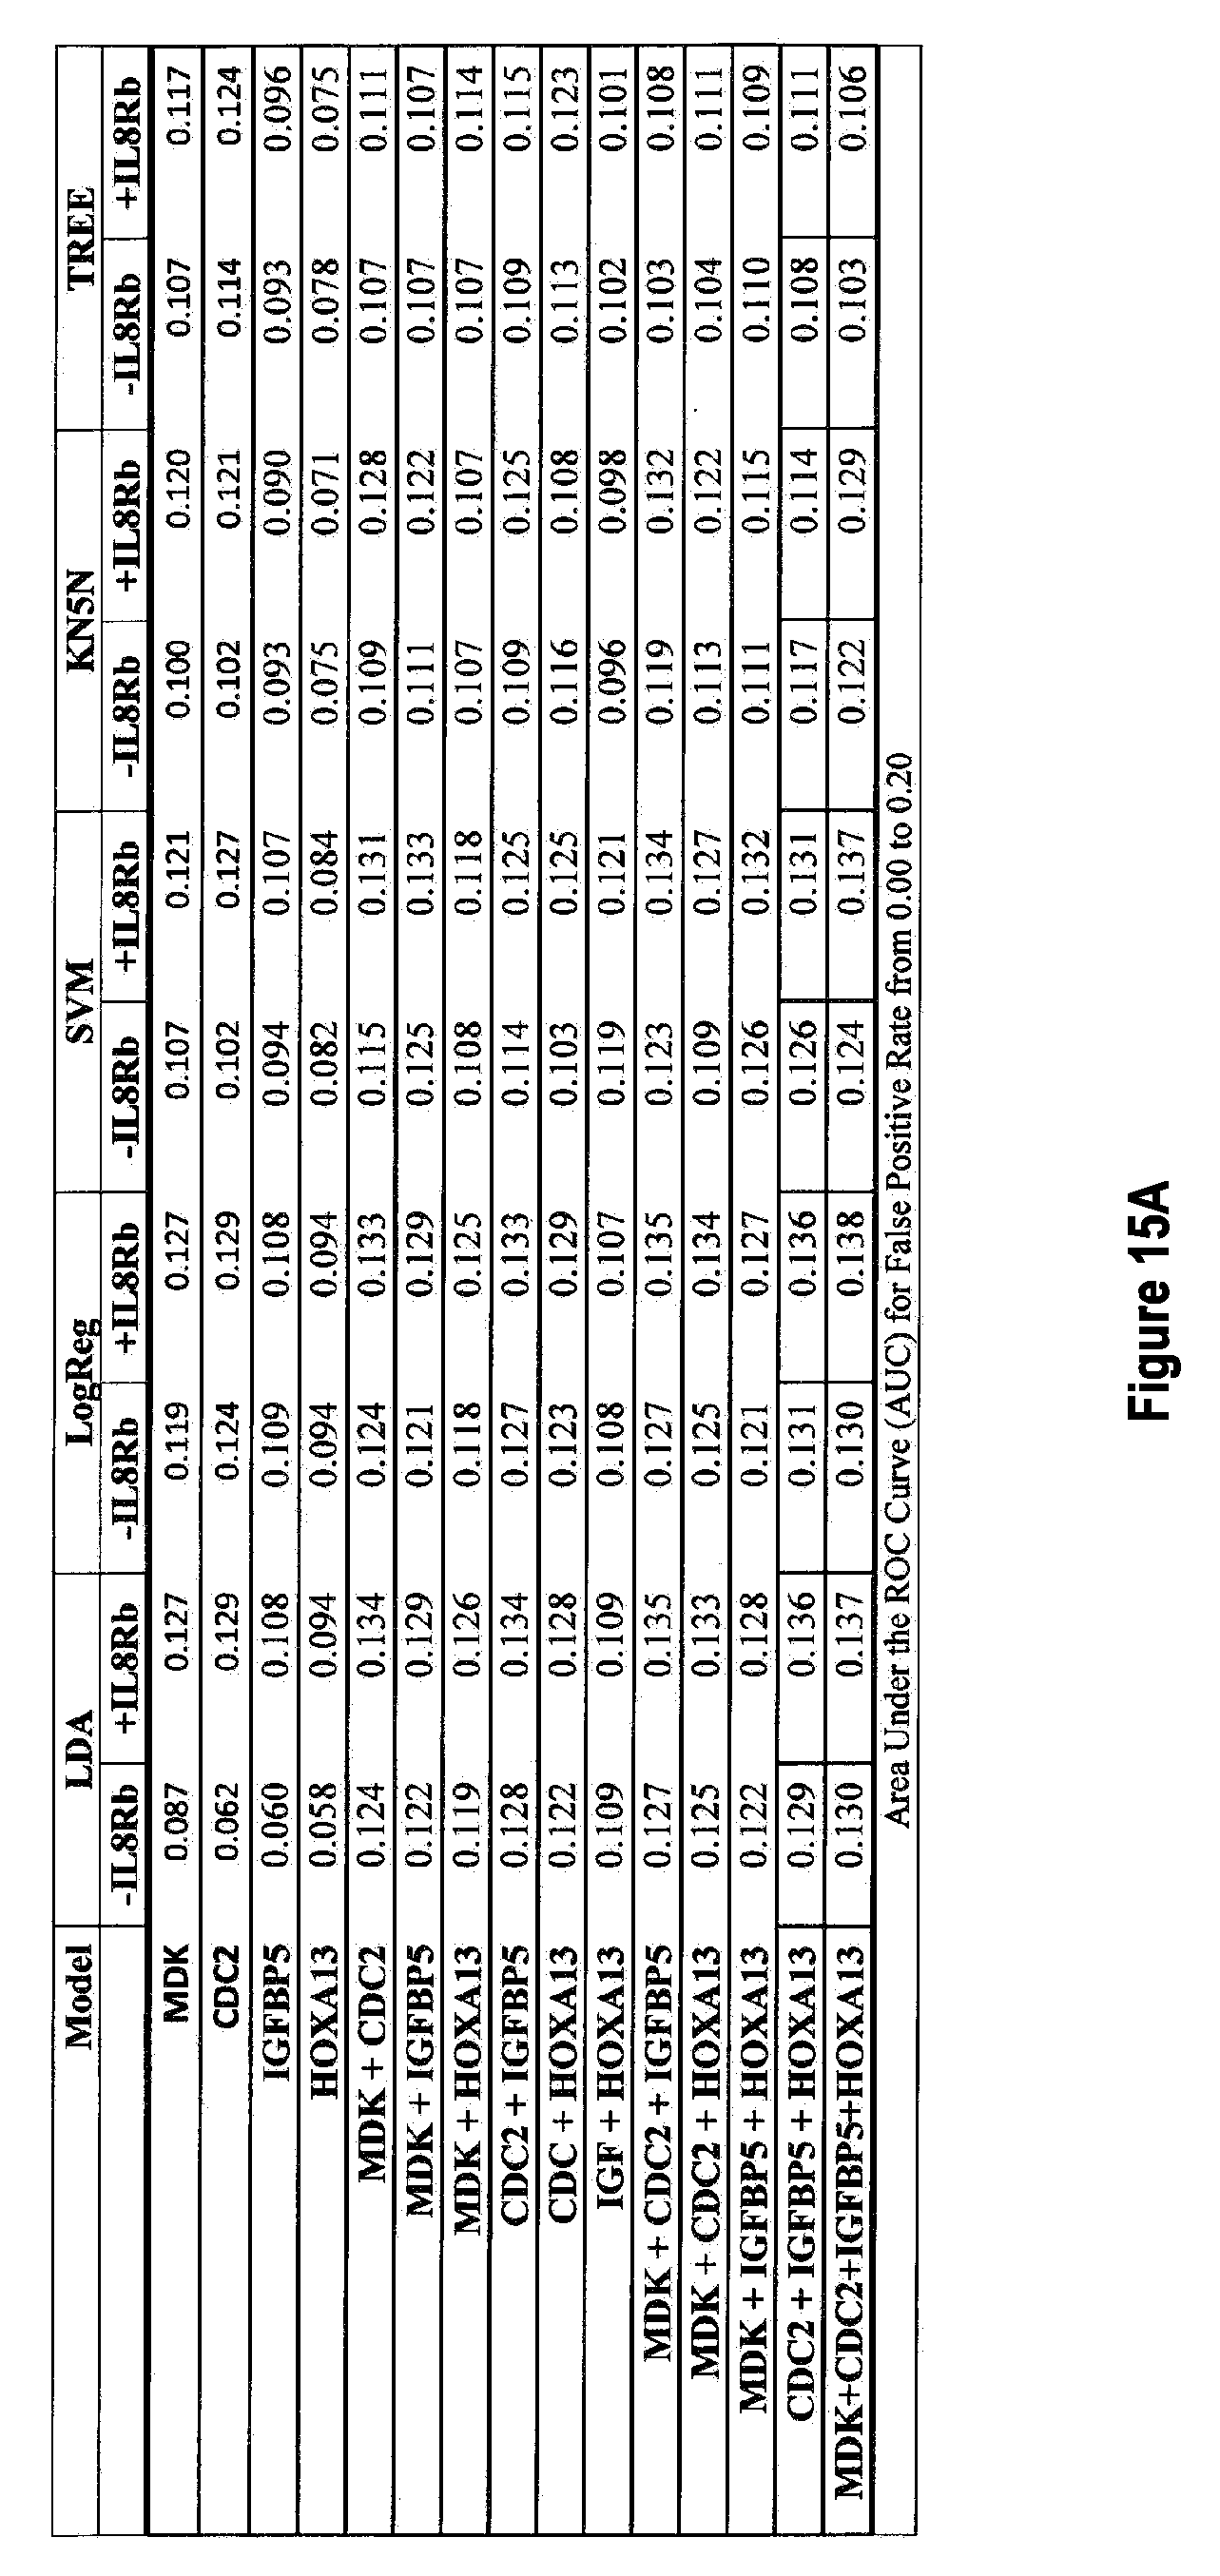
D00086

D00087
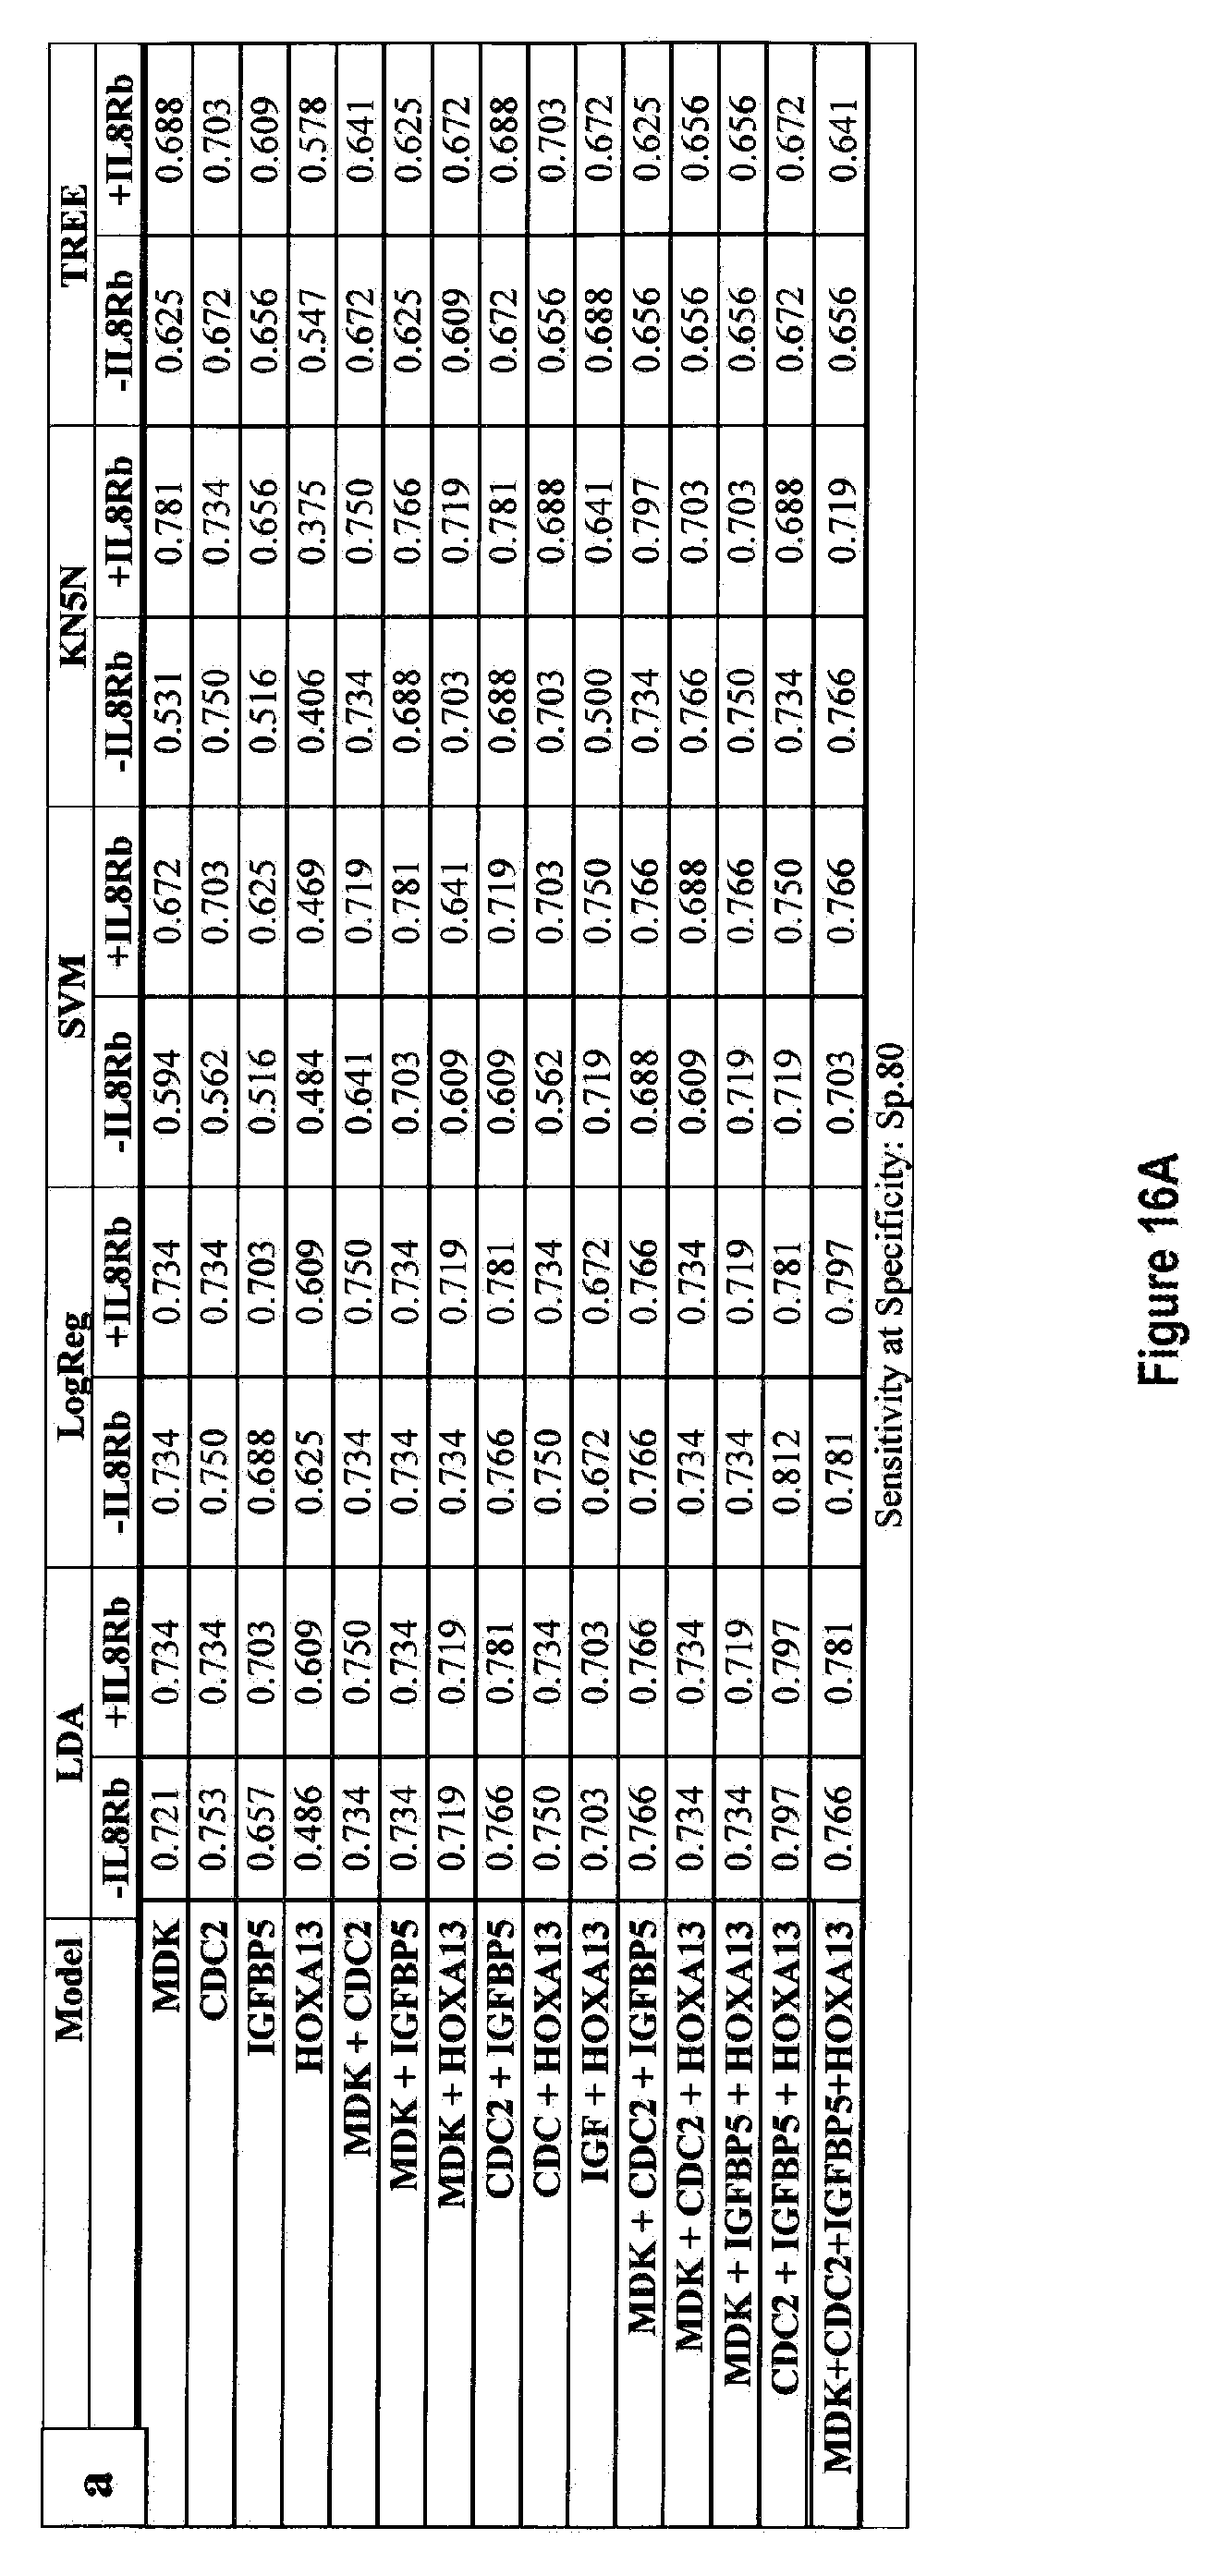
D00088

D00089

D00090

D00091

D00092
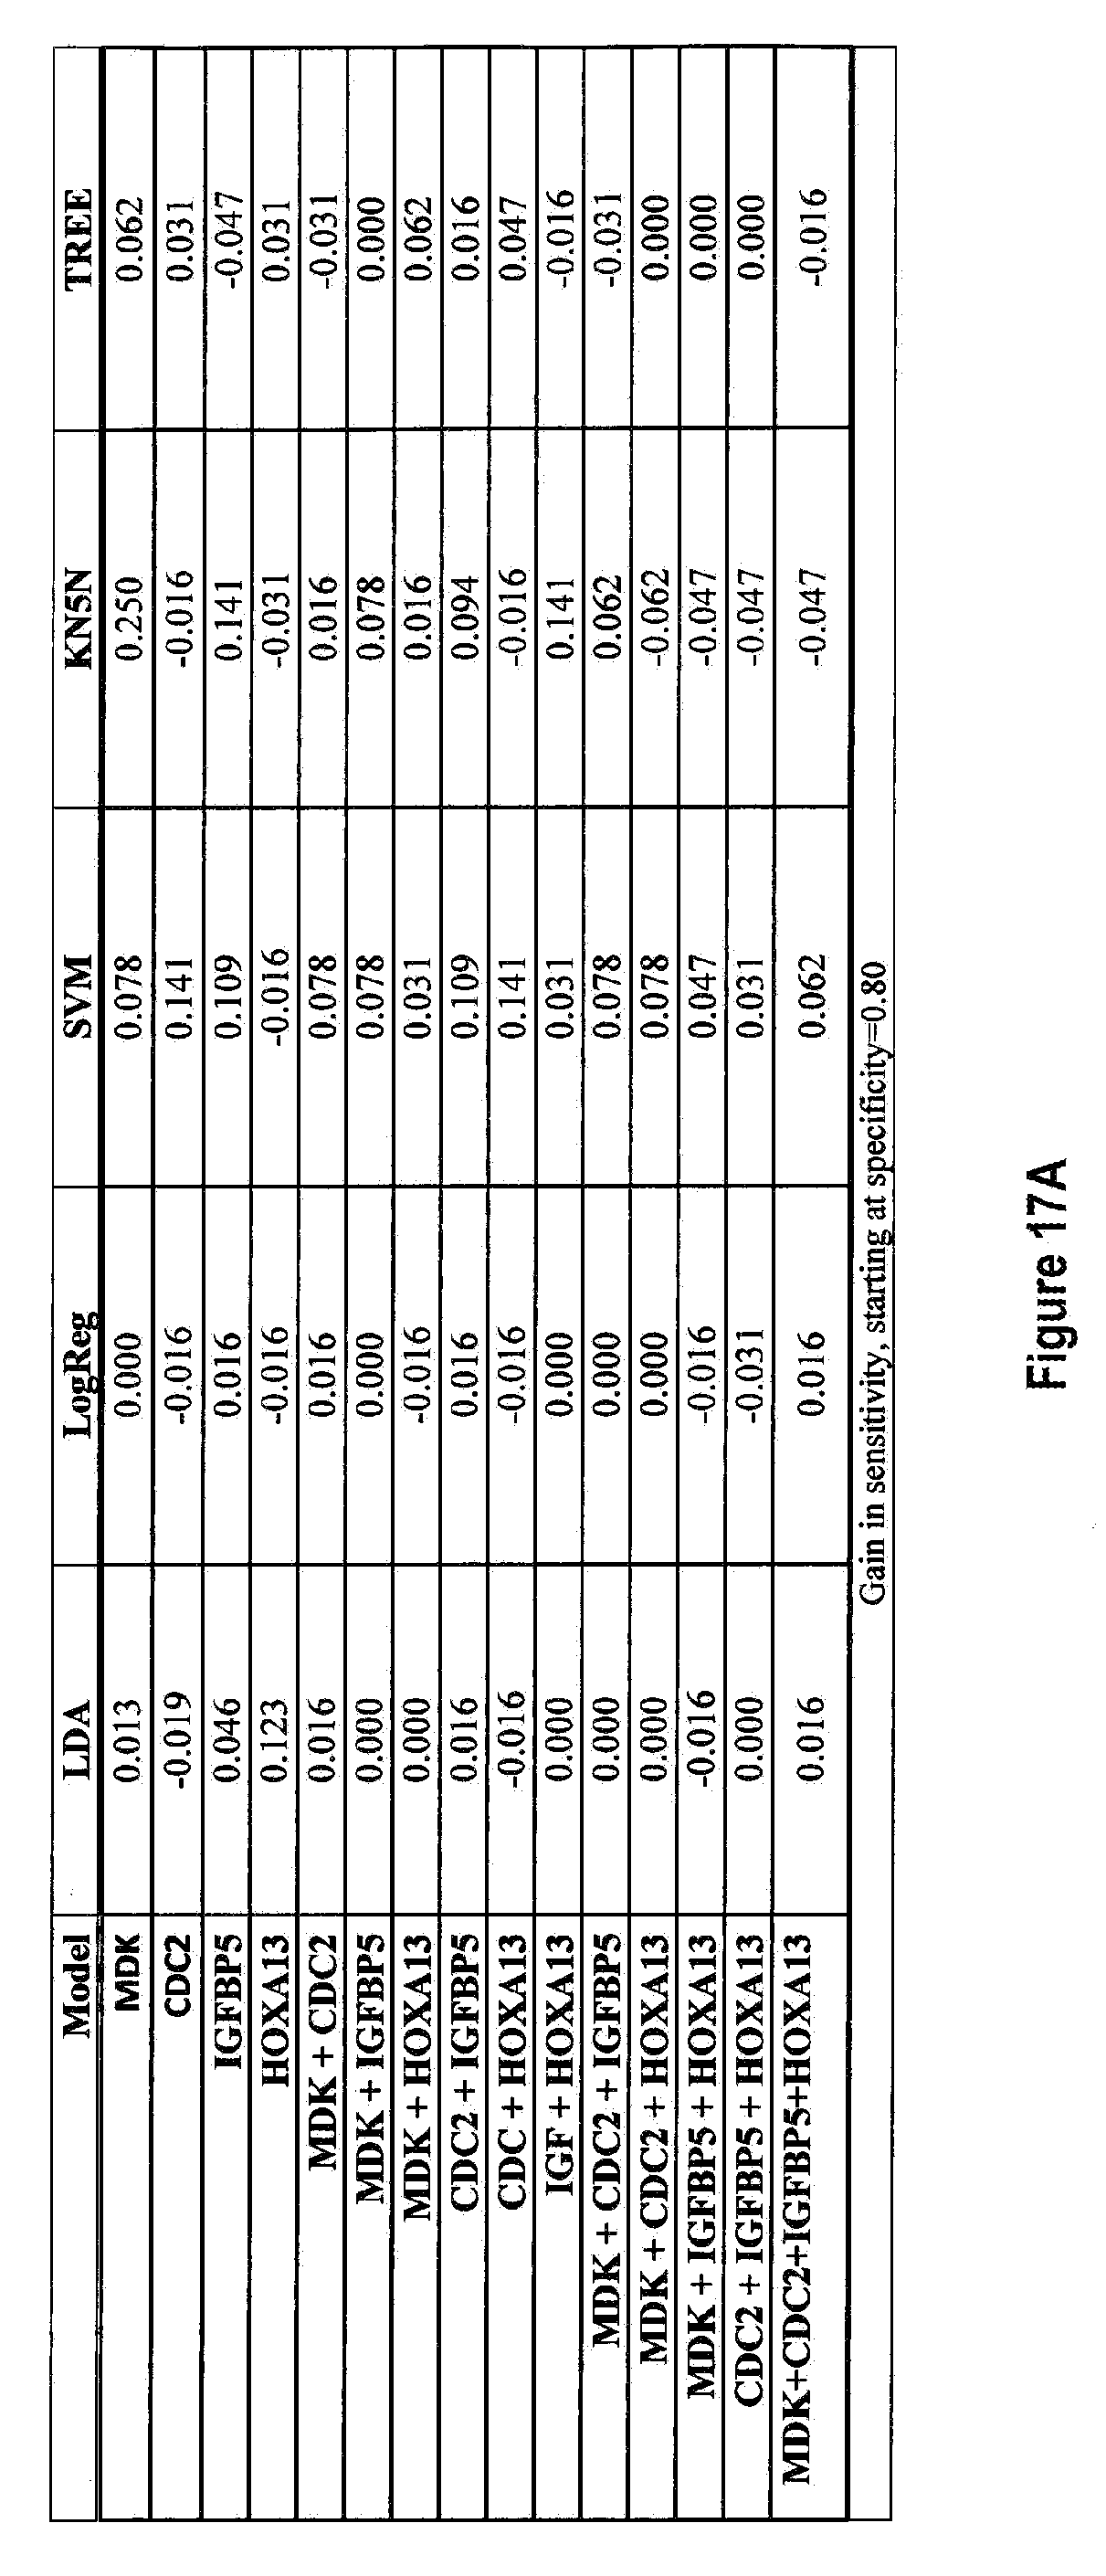
D00093

D00094
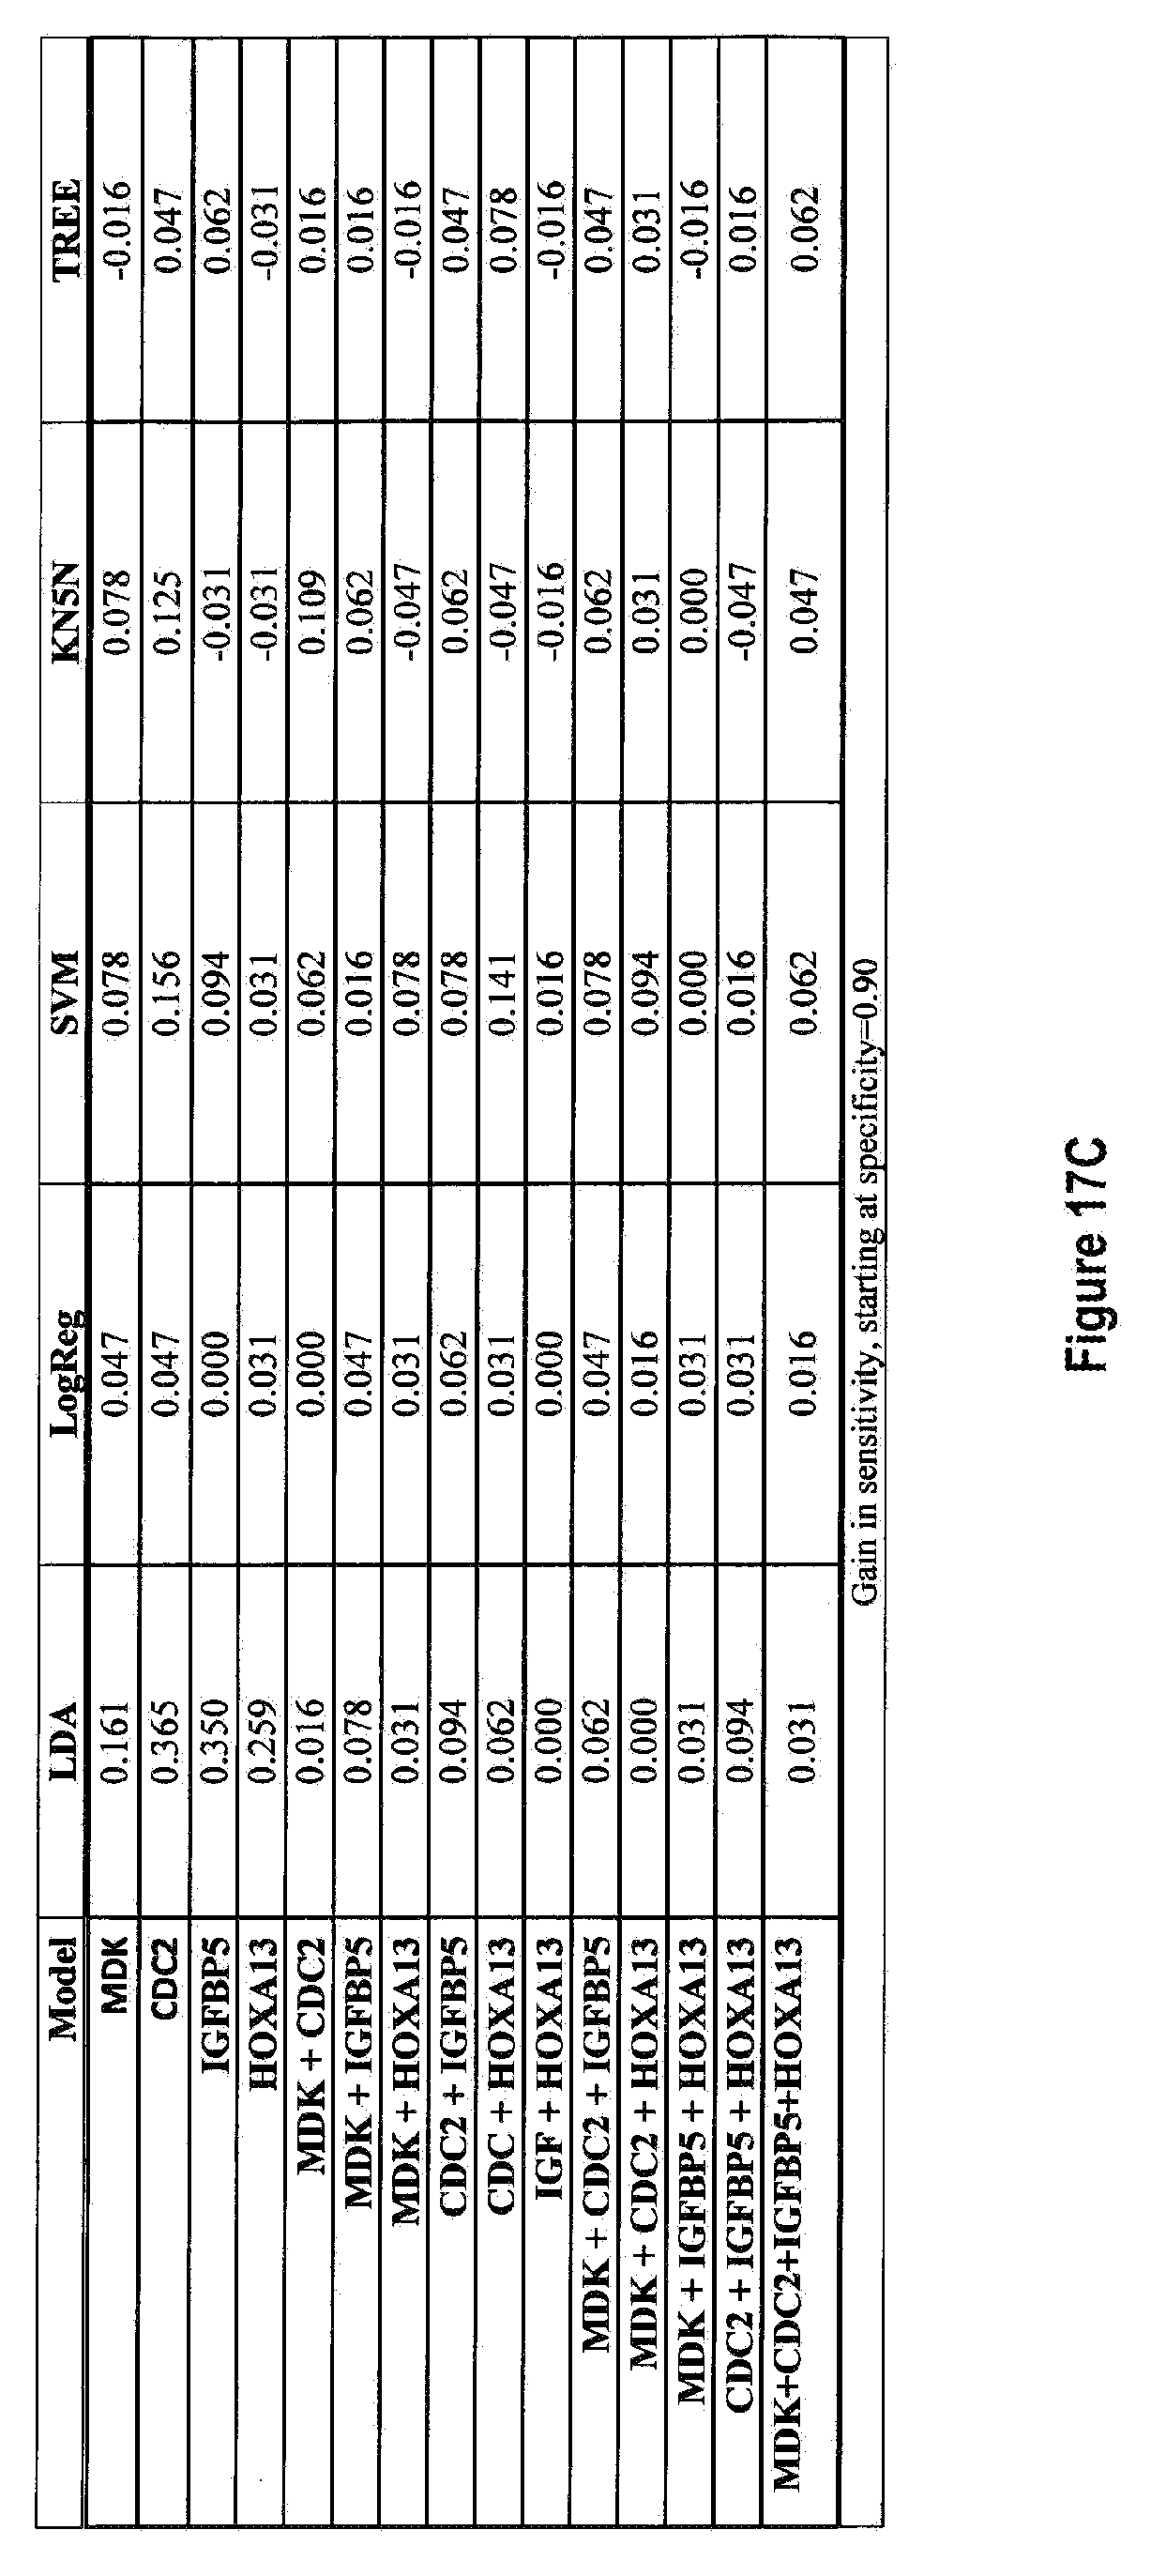
D00095

D00096

D00097

D00098

D00099

D00100
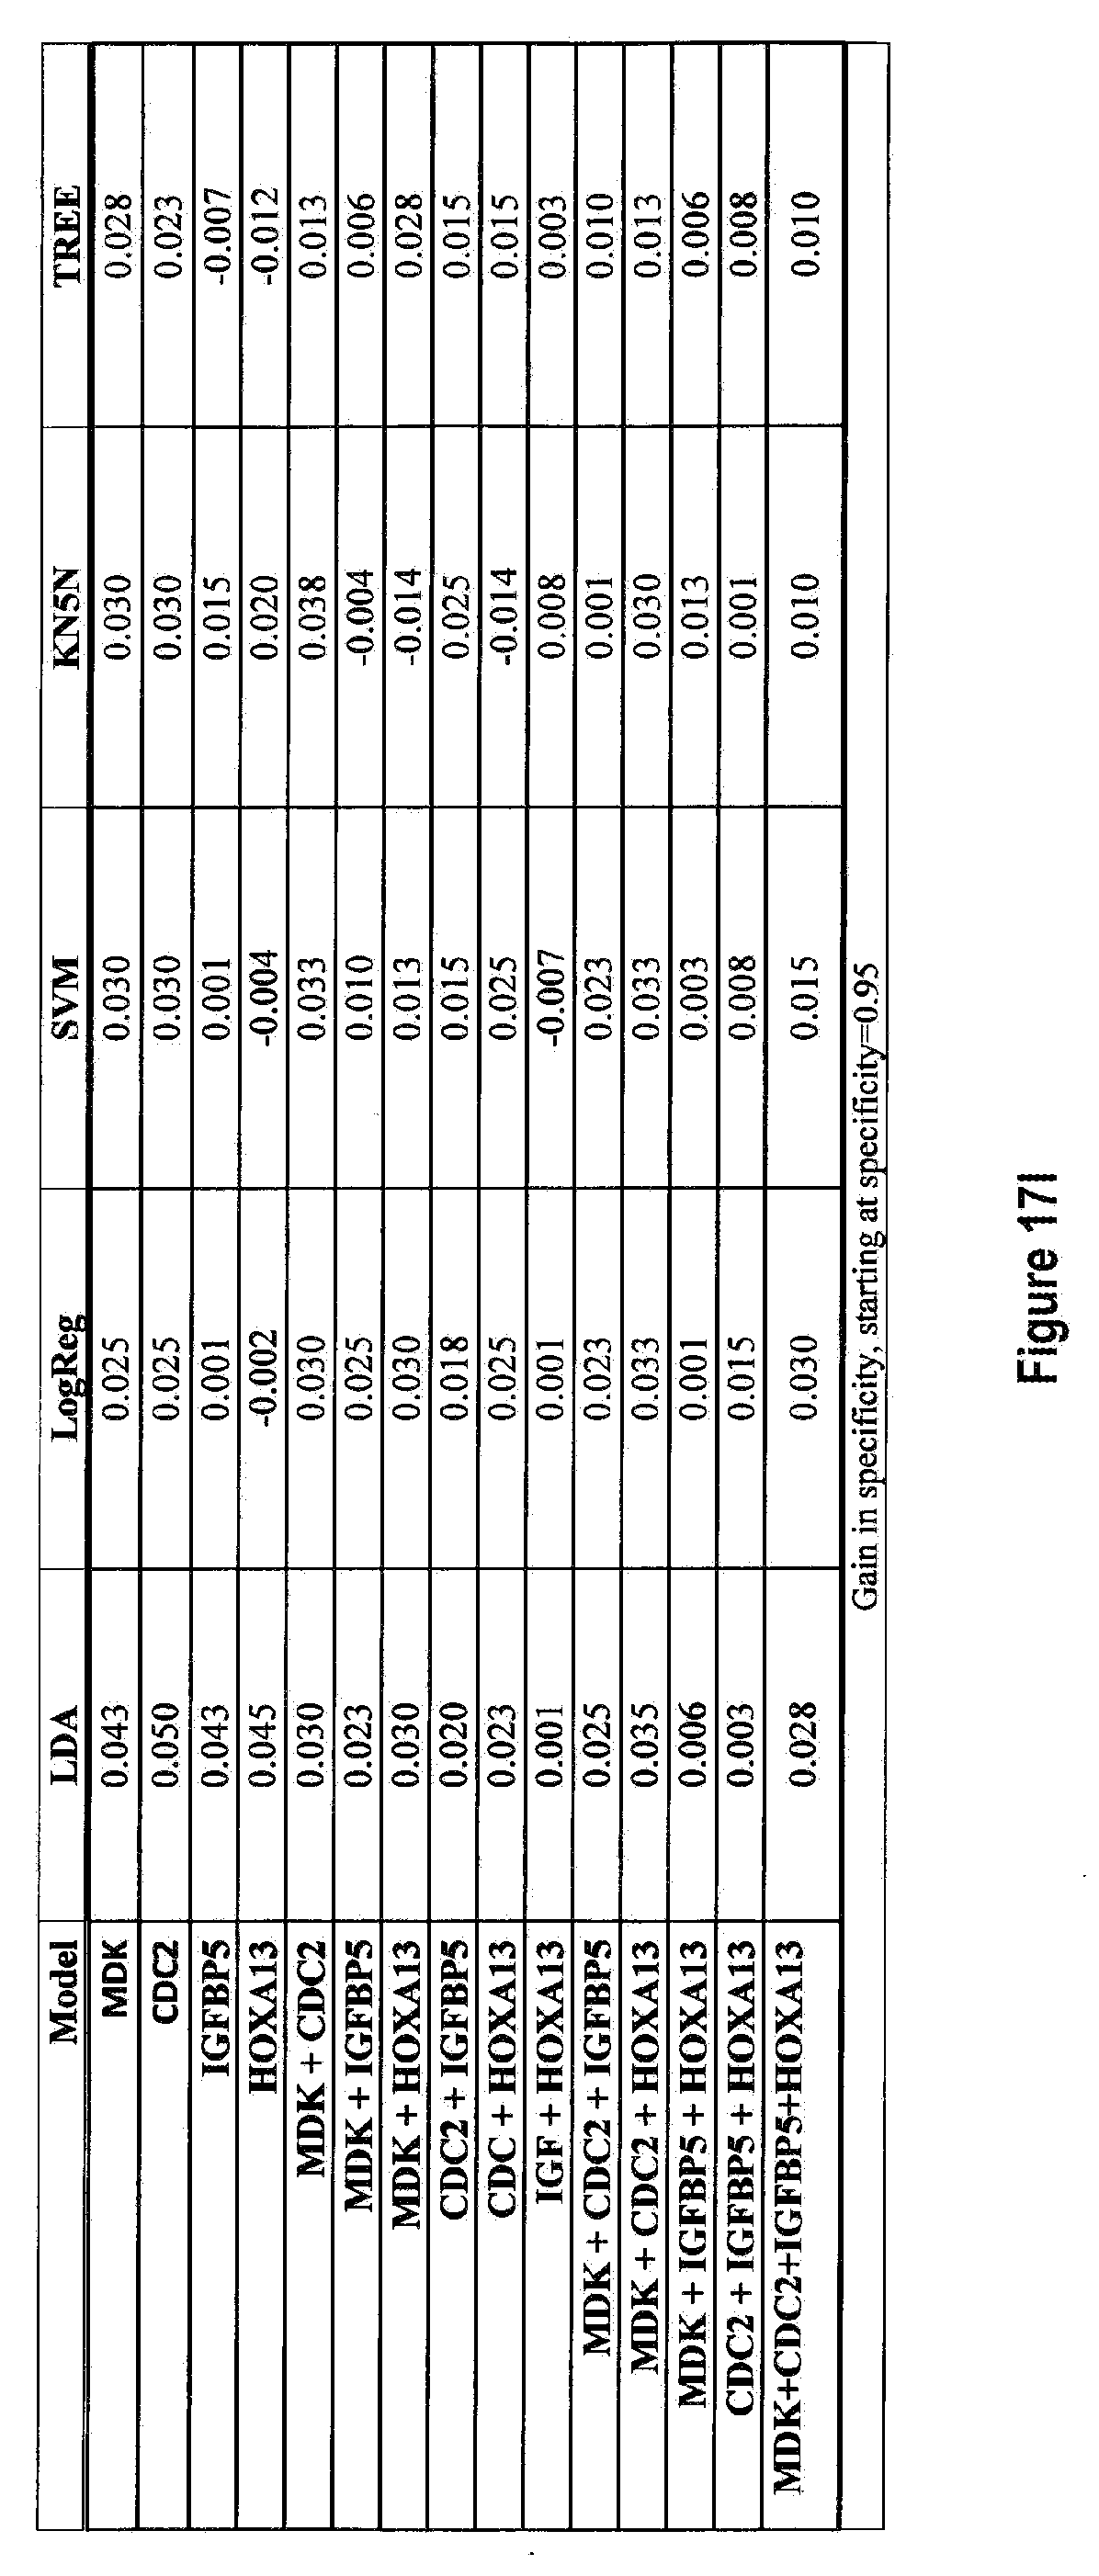
D00101

D00102

D00103

D00104

D00105

D00106

D00107

D00108

D00109


S00001
XML
uspto.report is an independent third-party trademark research tool that is not affiliated, endorsed, or sponsored by the United States Patent and Trademark Office (USPTO) or any other governmental organization. The information provided by uspto.report is based on publicly available data at the time of writing and is intended for informational purposes only.
While we strive to provide accurate and up-to-date information, we do not guarantee the accuracy, completeness, reliability, or suitability of the information displayed on this site. The use of this site is at your own risk. Any reliance you place on such information is therefore strictly at your own risk.
All official trademark data, including owner information, should be verified by visiting the official USPTO website at www.uspto.gov. This site is not intended to replace professional legal advice and should not be used as a substitute for consulting with a legal professional who is knowledgeable about trademark law.