Locomotive Control System
Kumar; Ajith Kuttannair ; et al.
U.S. patent application number 16/222822 was filed with the patent office on 2019-06-27 for locomotive control system. The applicant listed for this patent is General Electric Company. Invention is credited to Munishwar Ahuja, Shankar Chandrasekaran, Subhas Chandra Das, Ajith Kuttannair Kumar, Rupam Mukherjee.
| Application Number | 20190193760 16/222822 |
| Document ID | / |
| Family ID | 66949260 |
| Filed Date | 2019-06-27 |


View All Diagrams
| United States Patent Application | 20190193760 |
| Kind Code | A1 |
| Kumar; Ajith Kuttannair ; et al. | June 27, 2019 |
LOCOMOTIVE CONTROL SYSTEM
Abstract
A locomotive control system measures actuating parameters of a locomotive propulsion system and monitors the actuating parameters according to a forcing function of operation of the propulsion system. A degraded component of the locomotive is identified by comparing actuating parameters generated according to the forcing function with actuating parameters expressed as a function of speed of another locomotive propulsion system, examining changes in the generated actuating parameters over time, examining oscillations in movement of the locomotive during gear shifting, comparing wheel speed decreases during another forcing function, and/or comparing a magnitude of a spectrum of the actuating parameters of with one or more designated magnitudes.
| Inventors: | Kumar; Ajith Kuttannair; (Erie, PA) ; Chandrasekaran; Shankar; (Erie, PA) ; Das; Subhas Chandra; (Bangalore, IN) ; Mukherjee; Rupam; (Bangalore, IN) ; Ahuja; Munishwar; (Bangalore, IN) | ||||||||||
| Applicant: |
|
||||||||||
|---|---|---|---|---|---|---|---|---|---|---|---|
| Family ID: | 66949260 | ||||||||||
| Appl. No.: | 16/222822 | ||||||||||
| Filed: | December 17, 2018 |
Related U.S. Patent Documents
| Application Number | Filing Date | Patent Number | ||
|---|---|---|---|---|
| 62608730 | Dec 21, 2017 | |||
| Current U.S. Class: | 1/1 |
| Current CPC Class: | B61C 5/00 20130101; B61L 3/006 20130101; B61L 3/008 20130101; B61L 15/0072 20130101; B61L 3/002 20130101; B61L 15/0081 20130101; B61C 17/12 20130101 |
| International Class: | B61L 3/00 20060101 B61L003/00; B61L 15/00 20060101 B61L015/00 |
Claims
1. A locomotive control system comprising: a locomotive having a propulsion system and one or more sensors located onboard the locomotive, the one or more sensors configured to measure one or more actuating parameters generated by the propulsion system while the locomotive is stationary, idling, or during changes in movement of the locomotive; and one or more processors communicatively coupled with the one or more sensors, the one or more processors configured to control operation of the propulsion system according to a forcing function and to monitor the one or more actuating parameters while the propulsion system is operating according to the forcing function, wherein the one or more processors are configured to identify a degraded component of the locomotive by one or more of: comparing the actuating parameters that are monitored with speed actuating parameters expressed as a function of speed of at least one other propulsion system associated with at least one other locomotive, examining changes in the actuating parameters that are monitored over time, examining oscillations in changes in movement of the locomotive during shifting of gears between different torques or between different transmission torques during operation of the propulsion system according to the forcing function, comparing decreases in wheel speed of the locomotive during operation of the propulsion system according to the forcing function with designated wheel speeds associated with at least one other locomotive, or comparing a magnitude of one or more frequencies in a frequency domain spectrum of the actuating parameters of the locomotive with one or more designated magnitudes while the locomotive is one or more of moving, idling, or stationary.
2. The locomotive control system of claim 1, wherein the forcing function is one or more of a designated forcing function that predefines the actuating parameters of the propulsion system of the locomotive, a naturally occurring forcing function that identifies operational conditions of the propulsion system that are not automatically implemented, or a combination of the designated forcing function and the naturally occurring forcing function.
3. The locomotive control system of claim 1, wherein the forcing function defines one or more of motor torques of the propulsion system, a terrain over which the locomotive travels, a gradient of a route on which the locomotive travels, a speed bump of the locomotive, a stiff gradient of the locomotive, a coasting operation of the locomotive, or a combination of forces that one or more of assist motion or oppose motion of the locomotive.
4. The locomotive control system of claim 1, wherein the actuating parameters include one or more of torque generated by the propulsion system, power generated by the propulsion system, force generated by the propulsion system, tractive effort generated by the propulsion system, speed of the locomotive, or an opposing force to generated torque of the propulsion system.
5. The locomotive control system of claim 1, wherein the propulsion system is one or more of a motor or a prime mover other than an engine of the locomotive.
6. The locomotive control system of claim 1, wherein the forcing function designates one or more of: engine torques as a function of engine speeds that are generated by an engine of the locomotive, application of one or more brakes of the locomotive, or shifting of gears in a transmission of the locomotive.
7. The locomotive control system of claim 1, wherein the one or more processors are configured to monitor torques generated by the propulsion system during operation of the locomotive according to operational conditions designated by the forcing function, wherein the one or more processors are configured to identify the degraded component of the locomotive by one or more of: comparing torques that are generated by the propulsion system during operation according to the forcing function as the actuating parameters, with the forcing function designating torques as a function of the speed of the other propulsion system that is associated with the at least one other locomotive, or examining the changes in the actuating parameters that are generated by the propulsion system during operation according to the forcing function over time, wherein the degraded component of the locomotive is determined responsive to a variance in the actuating parameters that are generated by the propulsion system exceeding one or more designated thresholds.
8. The locomotive control system of claim 1, wherein the one or more processors are configured to identify the degraded component of the locomotive by examining the oscillations in the changes in movement of the locomotive during shifting of gears and determining that the oscillations exceed one or more thresholds.
9. The locomotive control system of claim 1, wherein the one or more processors are configured to identify the degraded component of the locomotive by comparing the magnitude of the one or more frequencies in the frequency domain spectrum of the actuating parameters of the locomotive with one or more designated magnitudes.
10. A locomotive control system comprising: a locomotive having one or more motors configured to generate torque to propel the locomotive; one or more sensors configured to measure a response of the locomotive to the torque that is generated by the one or more motors, the one or more sensors configured to generate sensor data representative of the response that is measured; and a hardware controller configured to direct the one or more motors of the locomotive to generate the torque according to a designated torque profile, the controller also configured to receive the sensor data and to determine a frequency spectrum of the response of the locomotive, the controller also configured to compare one or more parts of the frequency spectrum with a threshold to determine that a component of the locomotive is degraded and to automatically change movement of the locomotive responsive to determining that the component is degraded.
11. The locomotive control system of claim 10, wherein the designated torque profile is a pseudo random binary sequence of torques to be generated by the one or more motors.
12. The locomotive control system of claim 10, wherein the one or more sensors are configured to measure one or more of speeds or accelerations of the locomotive as the response of the locomotive to the torque that is generated by the one or more motors.
13. The locomotive control system of claim 10, wherein the one or more sensors are configured to measure rotor speeds of the one or more motors as the response of the locomotive to the torque that is generated by the one or more motors.
14. A locomotive control system comprising: an engine configured to be disposed onboard a locomotive and to receive a supply of fuel for cylinders of the engine; a power electronics circuit configured to be coupled with the engine and to conduct electric current to one or more motors of the locomotive for propelling the locomotive; one or more sensors configured to monitor direct current link voltages in the power electronics circuit coupled with the engine; and one or more processors configured to be communicatively coupled with the one or more sensors, the one or more processors also configured to change the supply of fuel to at least one of the cylinders of the engine, to determine a magnitude of a frequency in a frequency spectrum of the direct current link voltages that are monitored, and to determine whether the at least one cylinder that receives the supply of fuel that is changed is damaged or degraded based on the magnitude of the frequency that is determined.
15. The locomotive control system of claim 14, wherein the one or more processors are configured to change the supply of fuel to the at least one cylinder by reducing fuel supplied to the least one cylinder.
16. The locomotive control system of claim 14, wherein the one or more processors are configured to change the supply of fuel to the at least one cylinder by cutting out the at least one cylinder.
17. The locomotive control system of claim 14, wherein the one or more processors are configured to change the supply of fuel to the at least one cylinder by stopping injection of the fuel to a first cylinder of the cylinders while other cylinders of the cylinders in the engine continue being injected with the fuel.
18. The locomotive control system of claim 14, wherein the frequency in the frequency spectrum is at one half of a frequency of a speed at which the engine operates.
19. The locomotive control system of claim 14, wherein the one or more processors are configured to sequentially change the supply of fuel to other cylinders in the plural cylinders, monitor the direct current link voltages, determine the magnitude of the frequency, and determine whether each of the other cylinders receiving the sequentially changed supply of fuel is damaged or degraded based on the magnitude of the frequency.
20. The locomotive control system of claim 14, wherein the one or more processors are configured to change the supply of the fuel to the at least one cylinder by increasing fuel supplied to the at least one cylinder relative to one or more other cylinders of the engine.
Description
CROSS-REFERENCE TO RELATED APPLICATIONS
[0001] This application claims priority to U.S. Provisional Application No. 62/608,730, which was filed on 21 Dec. 2017, and the entire disclosure of which is incorporated herein by reference.
FIELD
[0002] Embodiments of the inventive subject matter described herein relate to systems that control vehicles such as locomotives based on evaluated health of the vehicles and/or components of the vehicles.
BACKGROUND
[0003] A variety of different types of vehicles, (e.g., locomotives, other off-highway vehicles, trucks, cars, sport utility vehicles, marine vessels, etc.) have various power assemblies that include axle or wheel components and many interconnected components and assemblies that are subjected to degradation due to infancy, age, operational stresses, etc. This is true for the many different types of vehicles and the operating method of the vehicles (e.g., autonomous or driverless vehicles, semi-autonomous vehicles, or driver-operated vehicles).
[0004] Degradation of these components with time may not be easily recognizable. To recognize the incipient damage from degradation, tear down of specific parts or of the entire vehicle may be required, followed by manual inspection, inspection with specialized equipment, and/or specific tests. These inspection methods incur high cost in terms of labor, equipment cost, downtime, etc. Degradation of vehicle components or assemblies can negatively impact operation of the vehicle and/or other components and assemblies when the level of degradation reaches a severe level, which can result in breakdown of any component or assembly, derating the vehicle performance, or rendering the vehicle completely inoperable.
[0005] Severe degradation, wear or breakdown of components or assemblies leading to breakdown of the vehicle can result in significant costs in terms of labor, downtime, and replacement parts. While some known systems and methods such as periodic inspection or operator detections of anomalies, which can vary from person to person) can attempt to predict when repair or replacement of components is needed. But, these approaches lack accuracy in predictions and/or result in the identification of the need for repair or replacement at too late of a time.
BRIEF DESCRIPTION
[0006] In one embodiment, a locomotive control system is provided. The control system includes a locomotive having a propulsion system and one or more sensors located onboard the locomotive. The one or more sensors configured to measure one or more actuating parameters of the propulsion system while the locomotive is stationary, idling, or during changes in movement of the locomotive. The control system also includes one or more processors communicatively coupled with the one or more sensors. The one or more processors are configured to monitor the one or more actuating parameters according to a forcing function that represents operation of the propulsion system of the locomotive. The one or more processors also are configured to identify a degraded component of the locomotive by one or more of (a) comparing actuating parameters that are generated by the propulsion system according to the forcing function with (speed) actuating parameters expressed as a function of speed of another propulsion system associated with at least one other locomotive, (b) examining changes in the actuating parameters that are generated by the propulsion system according to the forcing function over time, (c) examining oscillations in the changes in movement of the locomotive during shifting of gears between different torques or between different transmission torques of the forcing function, (d) comparing decreases in wheel speed of the locomotive during operation according to the forcing function with designated wheel speeds associated with at least one other locomotive, and/or (e) comparing a magnitude of one or more frequencies in a frequency domain spectrum of the actuating parameters of the locomotive with one or more designated magnitudes while the locomotive is one or more of moving, idling, or stationary.
[0007] In one embodiment, a locomotive control system is provided that includes a locomotive having one or more motors configured to generate torque to propel the locomotive and one or more sensors configured to measure a response of the locomotive to the torque that is generated by the one or more motors. The one or more sensors are configured to generate sensor data representative of the response that is measured. The control system also includes a hardware controller configured to direct the one or more motors of the locomotive to generate the torque according to a designated torque profile. The controller also is configured to receive the sensor data and to determine a frequency spectrum of the response of the locomotive. The controller is configured to compare one or more parts of the frequency spectrum with a threshold to (a) determine that a component of the locomotive is degraded and to (b) automatically change movement of the locomotive responsive to determining that the component is degraded.
[0008] In one embodiment, a locomotive control system includes an engine configured to be disposed onboard a locomotive and to receive a supply of fuel for cylinders of the engine, a power electronics circuit configured to be coupled with the engine and to conduct electric current to one or more motors of the locomotive for propelling the locomotive, one or more sensors configured to monitor direct current link voltages in the power electronics circuit coupled with the engine, and one or more processors configured to be communicatively coupled with the one or more sensors. The one or more processors also are configured to change the supply of fuel to at least one of the cylinders of the engine, to determine a magnitude of a frequency in a frequency spectrum of the direct current link voltages that are monitored, and to determine whether the at least one cylinder that receives the supply of fuel that is changed is damaged or degraded based on the magnitude of the frequency that is determined.
BRIEF DESCRIPTION OF THE DRAWINGS
[0009] Reference is now made briefly to the accompanying drawings, in which:
[0010] FIG. 1 schematically illustrates an example of a wheel and axle combination of a vehicle;
[0011] FIG. 2 illustrates several examples of torque and speed relationships for a healthy vehicle as measured by the sensors shown in FIG. 1;
[0012] FIG. 3 illustrates one example of a comparison between torque and speed relationships as measured by the sensors shown in FIG. 1;
[0013] FIGS. 4 and 5 illustrate other examples of comparisons between torque and speed relationships as measured by the sensors shown in FIG. 1;
[0014] FIG. 6 illustrates engine or motor torques and transmission torques of a vehicle as measured by the sensors shown in FIG. 1;
[0015] FIG. 7 illustrates moving speeds of vehicles as measured by one or more of the sensors shown in FIG. 1;
[0016] FIG. 8 illustrates moving speeds of vehicles as measured by one or more of the sensors shown in FIG. 1;
[0017] FIG. 9 illustrates braking efforts or forces of the vehicle while braking according to one example;
[0018] FIG. 10 illustrates moving speeds of the vehicle and wheel speeds of the wheel while braking according to one example;
[0019] FIG. 11 illustrates examples of torque references and measured torques of the motor in the vehicle shown in FIG. 1;
[0020] FIG. 12 illustrates rotor speeds of the motor in the vehicle shown in FIG. 1;
[0021] FIG. 13 illustrates one example of an engine speed spectrum and a wheel speed spectrum;
[0022] FIG. 14 illustrates a flowchart of one embodiment a method for evaluating vehicle health;
[0023] FIG. 15 illustrates another example of an engine speed spectrum;
[0024] FIG. 16 illustrates one example of a forcing function;
[0025] FIG. 17 illustrates three examples of sensed changes in length of the secondary suspension in the first wheel and axle combination of the vehicle in response to implementation of the forcing function shown in FIG. 16;
[0026] FIG. 18 illustrates one example of sensed changes in length of a secondary suspension in another wheel and axle combination of the same vehicle in response to implementation of the forcing function shown in FIG. 16;
[0027] FIG. 19 schematically illustrates another embodiment of the control system shown in FIG. 1;
[0028] FIG. 20 illustrates operation of the control system shown in FIG. 19;
[0029] FIG. 21 illustrates one embodiment of a timing diagram for examination of the cylinders of the engine.
[0030] FIG. 22 illustrates one example of a spatial representation of a cylinder firing sequence of the engine shown in FIG. 19 when a first cylinder of the engine is cut out and a twelfth cylinder of the same engine is weak;
[0031] FIG. 23 illustrates one example of a magnitude of the DC link voltage data spectrum at one half the frequency of the engine speed when a healthy cylinder is cut out and no other cylinder of the engine is weak;
[0032] FIG. 24 illustrates one example of a magnitude of the DC link voltage data spectrum at one half the frequency of the engine speed when a healthy cylinder is cut out and another cylinder of the engine is weak;
[0033] FIG. 25 illustrates one example of a magnitude of the DC link voltage data spectrum at one half the frequency of the engine speed when a weak cylinder is cut out;
[0034] FIG. 26 illustrates examples of magnitudes of DC link voltage spectra at one half of the engine speed frequency at different fueling levels for a healthy cylinder;
[0035] FIG. 27 illustrates examples of magnitudes of DC link voltage spectra at one half of the engine speed frequency at different fueling levels for a weak or degraded cylinder; and
[0036] FIG. 28 illustrates a flowchart of one embodiment of a method for identifying a weak cylinder in an engine.
DETAILED DESCRIPTION
[0037] Reference will be made below in detail to example embodiments of the inventive subject matter, examples of which are illustrated in the accompanying drawings. Wherever possible, the same reference numerals used throughout the drawings refer to the same or like parts. Although example embodiments of the inventive subject matter are described with respect to rail vehicles, embodiments of the inventive subject matter are also applicable for use with other vehicles. For example, the vehicles may be off-highway vehicles designed to perform an operation associated with a particular industry, such as mining, construction, farming, etc., and may include haul trucks, cranes, earth moving machines, mining machines, farming equipment, tractors, material handling equipment, earth moving equipment, etc. Optionally, the vehicles may be on-road vehicles, such as automobiles, tractor-trailer rigs, on-road dump trucks, etc. Moreover, yet other embodiments of the inventive subject matter are applicable to purely electric vehicles and machinery, such as battery powered vehicles. The inventive subject matter can be applicable for marine vehicles also.
[0038] Components in vehicle power assemblies, such as wheel-axle combinations, suspension systems, trucks, platforms, etc., can degrade due to various reasons in a variety of different vehicles (e.g., locomotives, other off-highway vehicles, trucks, cars, sport utility vehicles, marine vessels, or the like). If the degradation persists for a long duration, the degradation may lead to failure of primary components in the power assemblies, and may further lead to secondary damages. It can be difficult to identify underlying issues with these components unless inspected or subjected to specific tests. The inventive subject matter described herein uses readings from existing sensor or sensors and/or processed parameters from those sensors, which can be correlated to specific components. Then, without physical inspection of the component, the extent of damage (e.g., abnormality, degradation, or change) can be identified. The inventive subject matter can account for the normal wear and tear of a vehicle (e.g., a ten-year old car may not behave or operate in the same way as new or younger car). While the description herein focuses on locomotives, one or more embodiments may pertain to other types of vehicles, such as automobiles, trucks, marine vessels, mining vehicles, or the like.
[0039] The inventive subject matter described herein can provide early signs of component or assembly degradation (to take appropriate action) via various modes (examples on the on-board computer or on a central database, which also can send the wireless messages to the vehicle owner or other authorized person in case of unmanned or driver-less vehicles). By noticing the degradation at an early stage, well planned maintenance or immediate action can be taken to avoid any severe damage, secondary damages, downtime and, therefore, saving in related costs.
[0040] One embodiment of the inventive subject matter described herein examines data from previously existing sensors or sensor readings and correlates this data to specific components of the vehicle. The sensors may be pre-existing in that the sensors (or the data that is output by the sensors, or derived parameters from one or more sensors or processed parameter from combinations of those sensors) are used for one or more purposes other than evaluation of the health of the vehicle or vehicle component. For example, the sensor or sensor data may be used for control of the vehicle. The systems and methods described herein can use this sensor data to evaluate the health of the vehicle or vehicle component without physical inspection of the component. The extent of damage, abnormality, degradation, or other change in the component can be identified from this sensor data.
[0041] Using one or more embodiments of the inventive subject matter described herein, a forcing function of a known pattern is generated for a vehicle axle, motor, or propulsion system (e.g., the torque generated by engine of car). During normal operation or with predefined test cases, the performance can be monitored on a continuous or defined interval basis. Measuring parameters (e.g., displacement, speed, acceleration, etc.) from existing sensors (e.g., a speed sensor) or with special sensors (e.g., a three-axis accelerometer) can allow for the health of various vehicle components to be evaluated, or derived parameters from one or more sensors or processed parameter from combinations of those sensors. From the measured parameters, evaluating frequency responses, natural frequency components, damping, rise times, settling times, absolute/RMS/average magnitude, mean/standard deviation, or any other such quantity can be determined to evaluate the extent of degradation of vehicle components. An unhealthy or damaged condition of a vehicle component can be evaluated by examining the response of the components to identify deviations in the response over time, by identifying the difference from a component response from predefined or designated healthy responses, or by examining the absolute response of the component. or deviation in specific parameters within a specific type of vehicles.
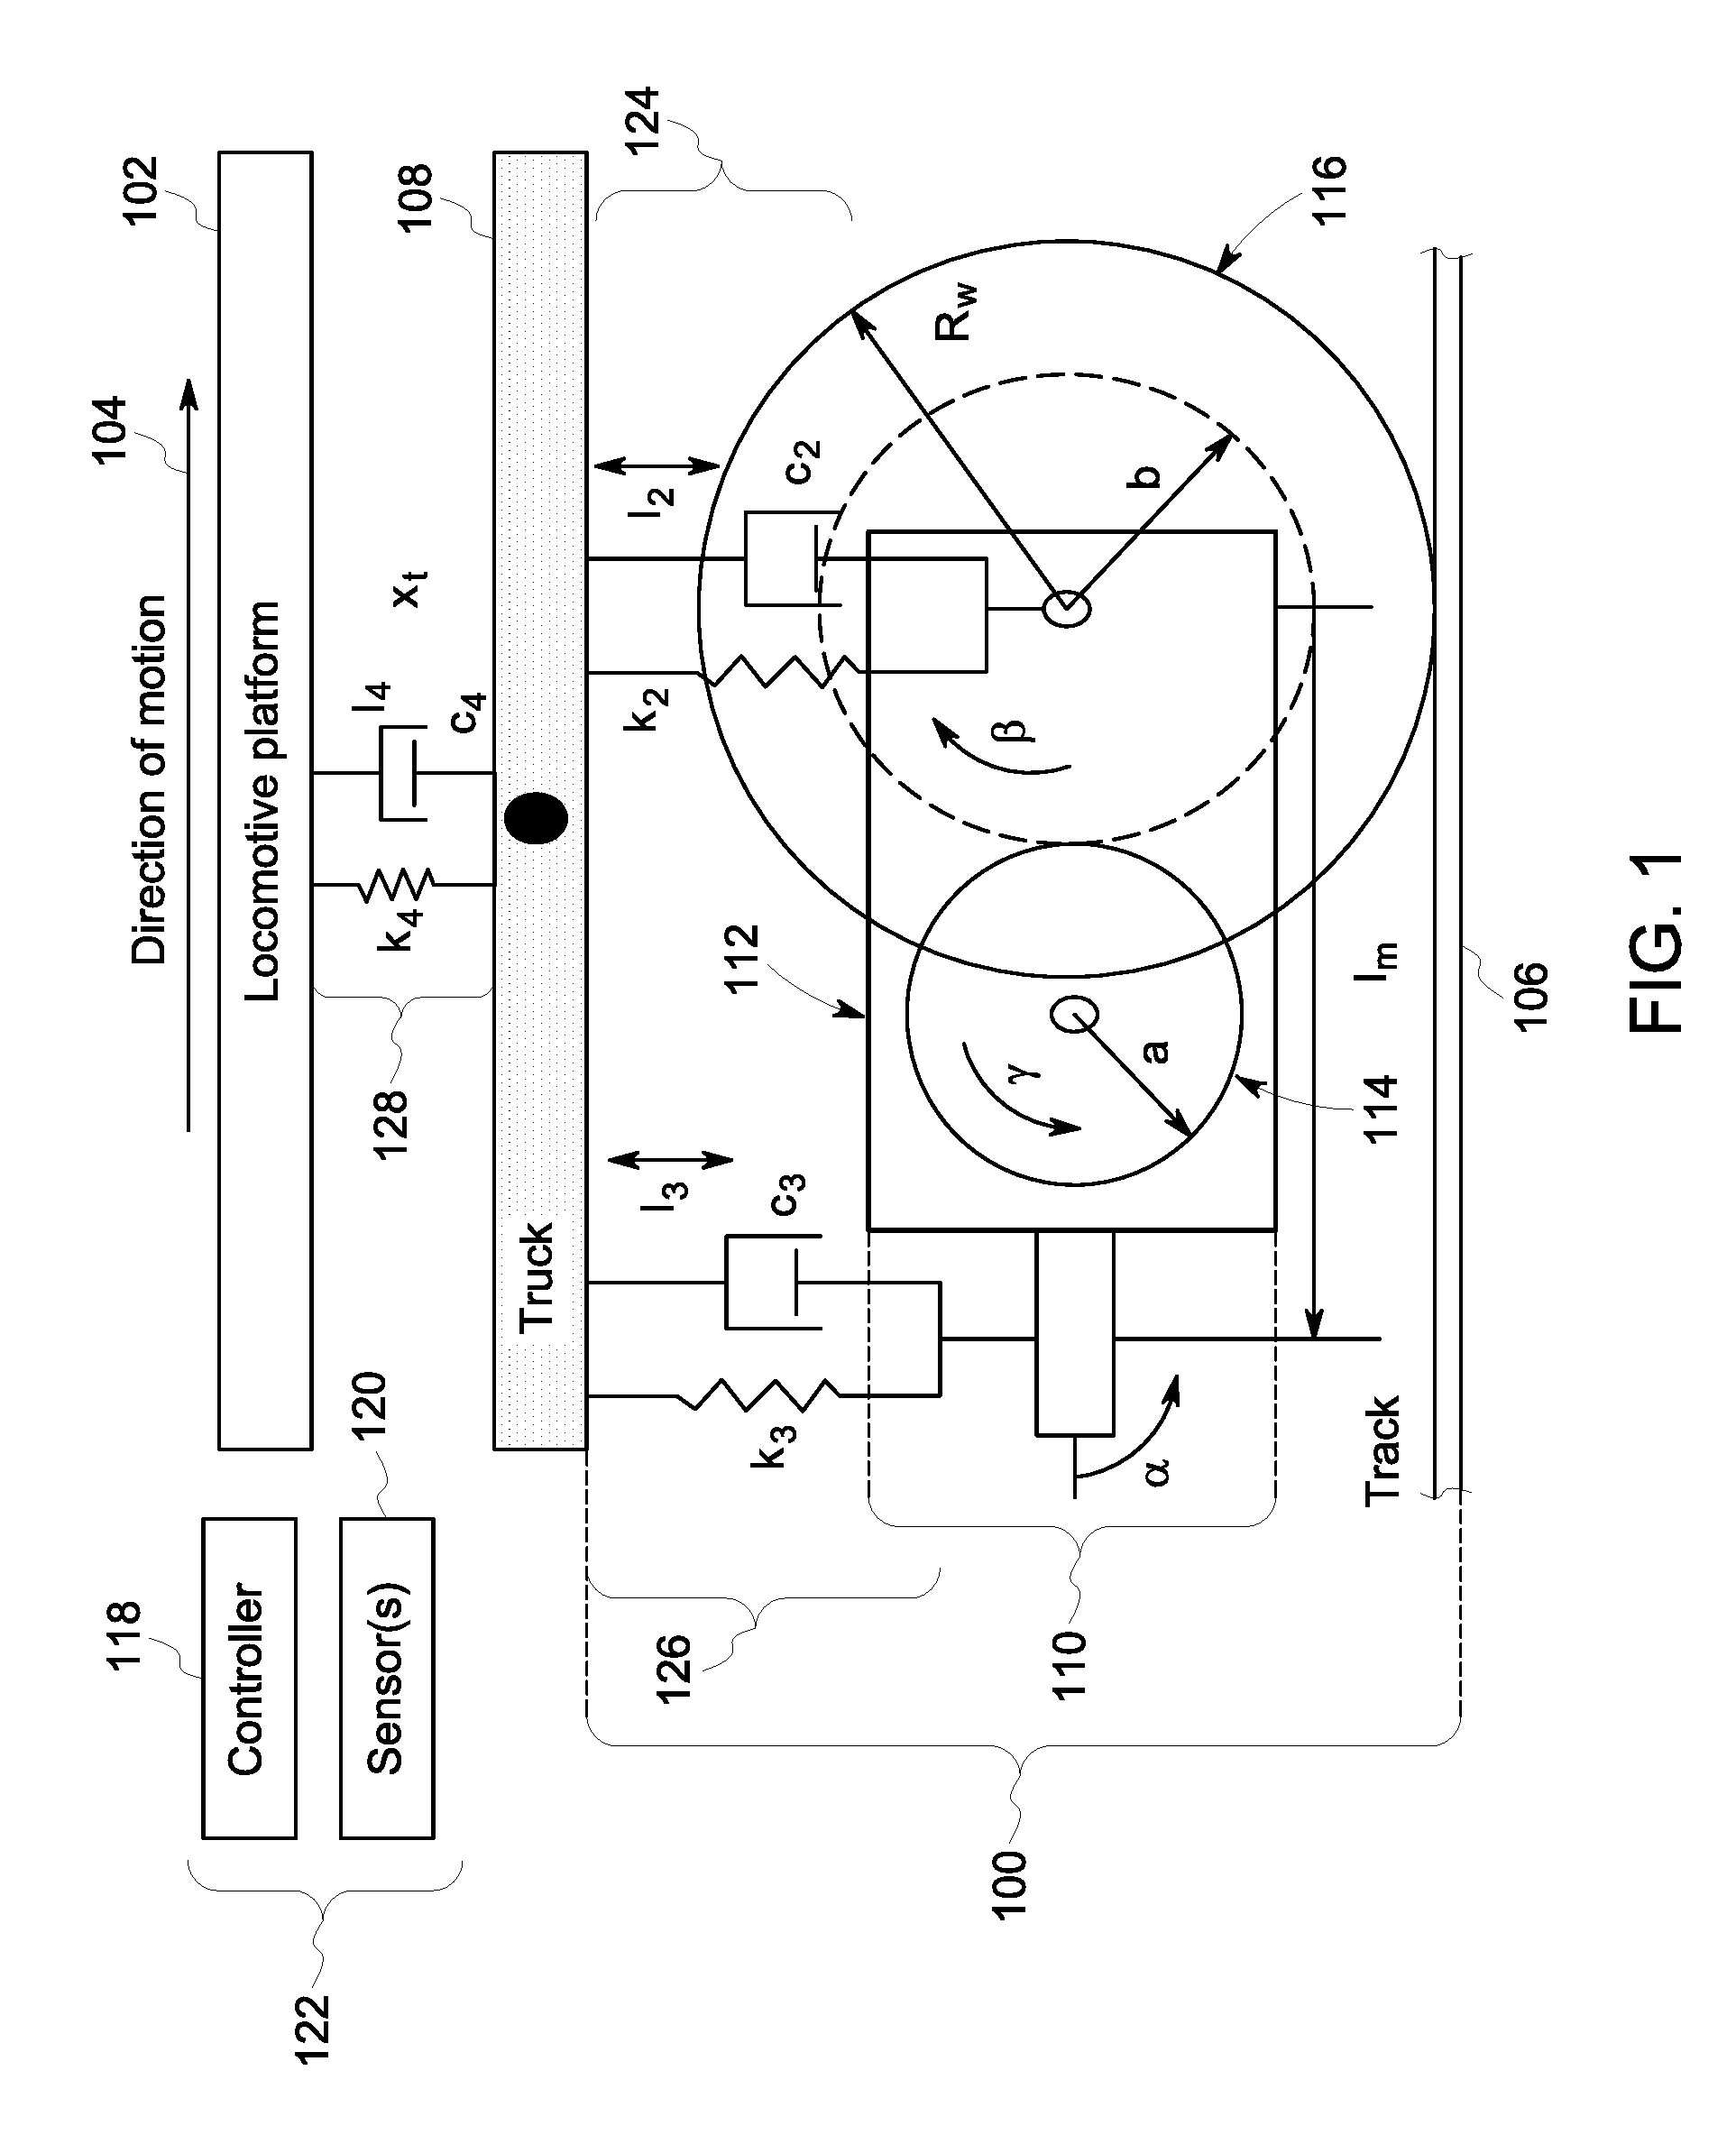
[0042] FIG. 1 schematically illustrates an example of a wheel and axle combination 100 of a locomotive having a locomotive control system 122. The vehicle is represented by a vehicle platform 102 (e.g., "Locomotive Platform" in FIG. 1) and a truck 108, which can represent part of a vehicle chassis. The vehicle is moving in a direction of motion 104 along a route 106 ("Track" in FIG. 1). While the vehicle and route are indicated in FIG. 1 as being a locomotive and a track, respectively, not all embodiments of the inventive subject matter described herein are limited to rail vehicles. One or more embodiments can be used with automobiles, off-highway vehicles, or the like.
[0043] A motor 110 having a stator 112 and a rotor 114 rotates an axle joined to a wheel 116 or directly rotates the wheel 116 to propel the vehicle along the route. The motor is coupled with the truck by a primary suspension 124, such as one or more springs, flexible bodies, or the like, as well as by another coupling 126, such as a dog bone connection. The truck is coupled with the platform by a secondary suspension 128, such as one or more springs, flexible bodies, or the like. These suspensions can at least partially absorb vibrations and shocks encountered during movement of the vehicle and/or vibrations of vehicle components.
[0044] One or more sensors 120 can measure various parameters of the wheel and axle combination during movement of the vehicle. The parameters are shown in FIG. 1 and described herein. Parameters l2 and l3 represent linear displacements of the wheel and axle combination, and the motor, respectively, from the vehicle platform and/or truck. Parameters .alpha. and .beta. represent angular displacements of the rotor and wheel, respectively.
[0045] While the vehicle is stationary, any one or any combination of these parameters causes a finite angular displacement .gamma.. This displacement .gamma. represents relative displacement of the rotor with respect to the stator of the motor (e.g., a traction motor). One or more of the changes of these parameters with respect to time (e.g., the velocities {dot over (l)}2, {dot over (l)}3, {dot over (.alpha.)}, and {dot over (.beta.)} will cause a rotational angular rotor velocity {dot over (.gamma.)}:
[0046] While the vehicle is moving (e.g., at a constant speed), the velocities {dot over (l)}2, {dot over (l)}3, and {dot over (.alpha.)} should be zero, and the velocities {dot over (.gamma.)} and {dot over (.beta.)} should be constant. Hardware, software, operator inputs, external factors may cause one or more of the velocities {dot over (l)}2, {dot over (l)}3, and {dot over (.alpha.)} to have a value other than zero. If {dot over (.beta.)} is constant, then the velocity {dot over (.gamma.)} may no longer have a zero value. If the velocities {dot over (l)}2, {dot over (l)}3, and {dot over (.alpha.)} are oscillatory in nature and the velocity {dot over (.beta.)} is constant, then the rotor velocity {dot over (.gamma.)} will be oscillatory.
[0047] In one embodiment of the inventive subject matter, a locomotive control system 122 of the vehicle has a controller 118 and the sensors 120 that measure motor phase voltage and phase current of electric energy supplied to the motor, and rotor speed (e.g., {dot over (.gamma.)}) as feedbacks for motor control. The controller can be formed from hardware circuitry that includes and/or is connected with one or more processors (e.g., one or more microprocessors, field programmable gate arrays, and/or integrated circuits) that perform operations described herein. The sensors can include a voltage and/or current sensor that measures the phase voltage and current supplied to the motor, as well as the rotor speed. The controller optionally can also measure the speed at which the wheel rotates (e.g., for speed control of the vehicle), but due to various constraints, it may not be feasible to measure the actual speed of the wheel. Instead, the controller can monitor the rotor speed and then scale the rotor speed to estimate the wheel speed.
[0048] If oscillation is present in the rotor speed (e.g., due to external factors), disturbance or noise will also appear in the estimated wheel speed that is monitored by the controller. If the wheel speed does not have disturbances, but the rotor speed that is monitored by the controller does have noise (e.g., due to disturbances caused by changes in the velocities {dot over (l)}2, {dot over (l)}3, and {dot over (.alpha.)}), then the wheel speed that is monitored by the controller will have a scaled component of this noise.
[0049] The controller may take corrective action if the disturbance in wheel speed is detected (e.g., due to wheel slip or excessive acceleration). But, if noise in the wheel speed is caused by oscillation in the rotor speed (and the noise is not identified as caused by the rotor speed oscillation), then the controller may incorrectly implement the corrective action. This can degrade performance of the vehicle, such as by reducing or losing adhesion of the wheel to the route, causing motor torque to pulsate, and/or vibration of the actuating parameter having a frequency of variation that matches the system spring-mass frequency.
[0050] An actuating parameter of a vehicle is work or other energy that is output by a propulsion system of the vehicle. Examples of actuating parameters are provided herein, and include motor torque, power, speed, pulling force, tractive effort generated by the propulsion system, (e) speed of the locomotive, and/or (f) an opposing force to generated torque of the propulsion system.
[0051] In one embodiment, the frequency or range of frequencies of the wheel and axle combination frequencies may need to be identified for the controller to suppress or reduce the wheel and axle combination frequencies that interfere with the speed sensor. While these frequencies can be identified by the controller and sensors measuring the displacements and velocities described above while the vehicle operates at various known or designated speeds and motor torque combinations, this can be a time consuming and costly endeavor.
[0052] FIG. 1 is just an example of a single wheel axle of a locomotive. But the inventive subject matter described herein can be extended for any other type truck/axle/platform arrangement, and may be used for any other vehicle having (a) one or more axles under same truck and/or platform, (b) the spring damper with each axle may have none, single or multiple or combination of those spring damper arrangement, (c) a motor-axle transmission of a direct drive or geared (single or multi-stage gear) type, (d) propulsion components other than a wheel-axle system.
[0053] Instead, in at least one embodiment of the inventive subject matter described herein, the controller may direct a vehicle propulsion system (e.g., an engine in a vehicle having engine-driven axles, or an electrical propulsion system in case a vehicle having electrical motor driven axles) to generate incremental torque pulses. These torque pulses can have different designated pulse widths and can be applied by the propulsion system on an axle in a particular or designated sequence. The controller can select a combination of torque pulse widths and sequences can be a pseudo random binary sequence (PRBS) or another type of sequence.
[0054] In a vehicle having axles and/or wheels directly driven from the propulsion system, the controller can direct the propulsion system to apply the torque pulse sequence, and for motor driven system, the motor can apply the torque pulse sequence on top of (superimposed on) the actual torque generated to propel the vehicle. With the total torque (torque pulses plus propulsion torque) applied by an actuator of the propulsion system (e.g., an engine or motor or any similar system), the controller acquires data from the sensor(s). The controller compares the gain of the speed or torque for different frequency components, and can identify which frequency components have greater gain(s). These frequency components can then be attenuated by the controller applying one or more filters, such as a Kalman filter or another filter that attenuates noise in the measured rotor speeds). This can help eliminate or reduce noise from the motor or speeds of the propulsion system or torques measured by the sensors.
[0055] During normal operation (e.g., operation of a vehicle having healthy components), the controller can monitor the torques generated by the propulsion system or generated motor torques and speeds on a continuous basis, defined interval basis, or other repeating basis. The torques and speeds can be monitored based on data generated by the sensors. The sensors can measure displacement or other movement, speeds (engine, wheel, motor, gear, etc.), acceleration, etc. The controller can then calculate the frequency response, the natural frequency component, dampening, rise time, settling time, absolute magnitude, root mean square value of the magnitude, average magnitude, mean, standard deviation, or other calculation of the engine or motor or wheel torques and/or speeds as one or more derived quantities. The derived quantities can be used to estimate or quantify degradation of the engine, axle, wheel, and/or interconnecting gears (e.g., the transmission). This method can be extended to vehicles with any other actuating parameter (in place of torque), such as power, speed, pulling force or any similar.
[0056] For example, the controller can compare one or more of the derived quantities with derived quantities of a vehicle known to be healthy to identify differences (if any). As another example, the controller can compare one or more of the derived quantities with derived quantities of a set or fleet of vehicles to identify differences (if any). As another example, the controller can monitor the derived quantities of the same vehicle over time to track changes over time or the controller can monitor the derived quantities of the combination of a set of vehicles and of same vehicle over time to track changes in any components.
[0057] In one embodiment, the controller can generate and/or look out for one or more forcing functions of known patterns for an axle or motor of the vehicle. In one example, this forcing function is a relationship between a speed at which the propulsion system operates and resultant torque. Three variations on the forcing functions can exist. First, a forcing function can be a designated forcing function that designates or predefines operating settings or outputs of the propulsion system. With a designated forcing function, the controller of the vehicle can direct the propulsion system to operate at designated settings or outputs dictated or defined by the forcing function. Second, a forcing function can be a naturally occurring or uncontrolled forcing function, where the controller of the vehicle monitors operations of the propulsion system to determine when these operates match or coincide with designated settings or outputs dictated or defined by the forcing function. This type of forcing function is not created by the controller, but is identified by the controller when the vehicle operates in a defined, designated way. For example, the controller can monitor the torque generated by a motor to determine when the torque is within predefined limits (e.g., fifty to sixty percent of a maximum torque that can be generated by the motor) during travel. The controller can examine sensor data (or processed sensor data) that is obtained or indicative of sensed information during the same time period that the torque was within these predefined limits. Third, a forcing function can be a combination forcing function, which is a union or mix of the first and second types of forcing function. This third forcing function can involve the controller monitoring operations of the vehicle to determine when the operations of the propulsion system match, coincide with, or otherwise fall within a defined range and, responsive to this occurring, the controller can change movement of the vehicle (such as by directing the propulsion system to operate in a predefined or designated manner). For example, the controller can monitor the torque generated by a motor to determine when the torque is at 50% of the maximum torque that the motor can generate. Responsive to identifying this torque output, the controller can direct the motor to generate a 1 hertz torque waveform superimposed on the 50% torque output as the forcing function.
[0058] FIG. 2 illustrates several examples of torque and speed relationships 200, 202, 204, 206, 208, 210 for a healthy vehicle as measured by the sensors shown in FIG. 2. The torque and speed relationships are shown alongside a horizontal axis 212 representative of operating speed of the propulsion system and a vertical axis 214 representative of torque. The first relationship 202 shows the relationship between torque and speed for the propulsion system of the vehicle, and can be referred to as the propulsion system relationship. The second through fifth relationships 202, 204, 206, 208, 210 show the relationships between the gear torques and the speed for first through fifth gears of the transmission of the healthy vehicle, respectively.
[0059] Each of the torque and speed relationships can be determined from the controller using a forcing function of a known pattern. The pattern can be torque that changes during normal operation of the vehicle, torque that changes in steps (e.g., step responses), torque that changes according to sine pulses, etc. The controller can use the forcing function regardless of the type or weight of the load carried by the vehicle (e.g., light load, heavy load, no load, etc.).
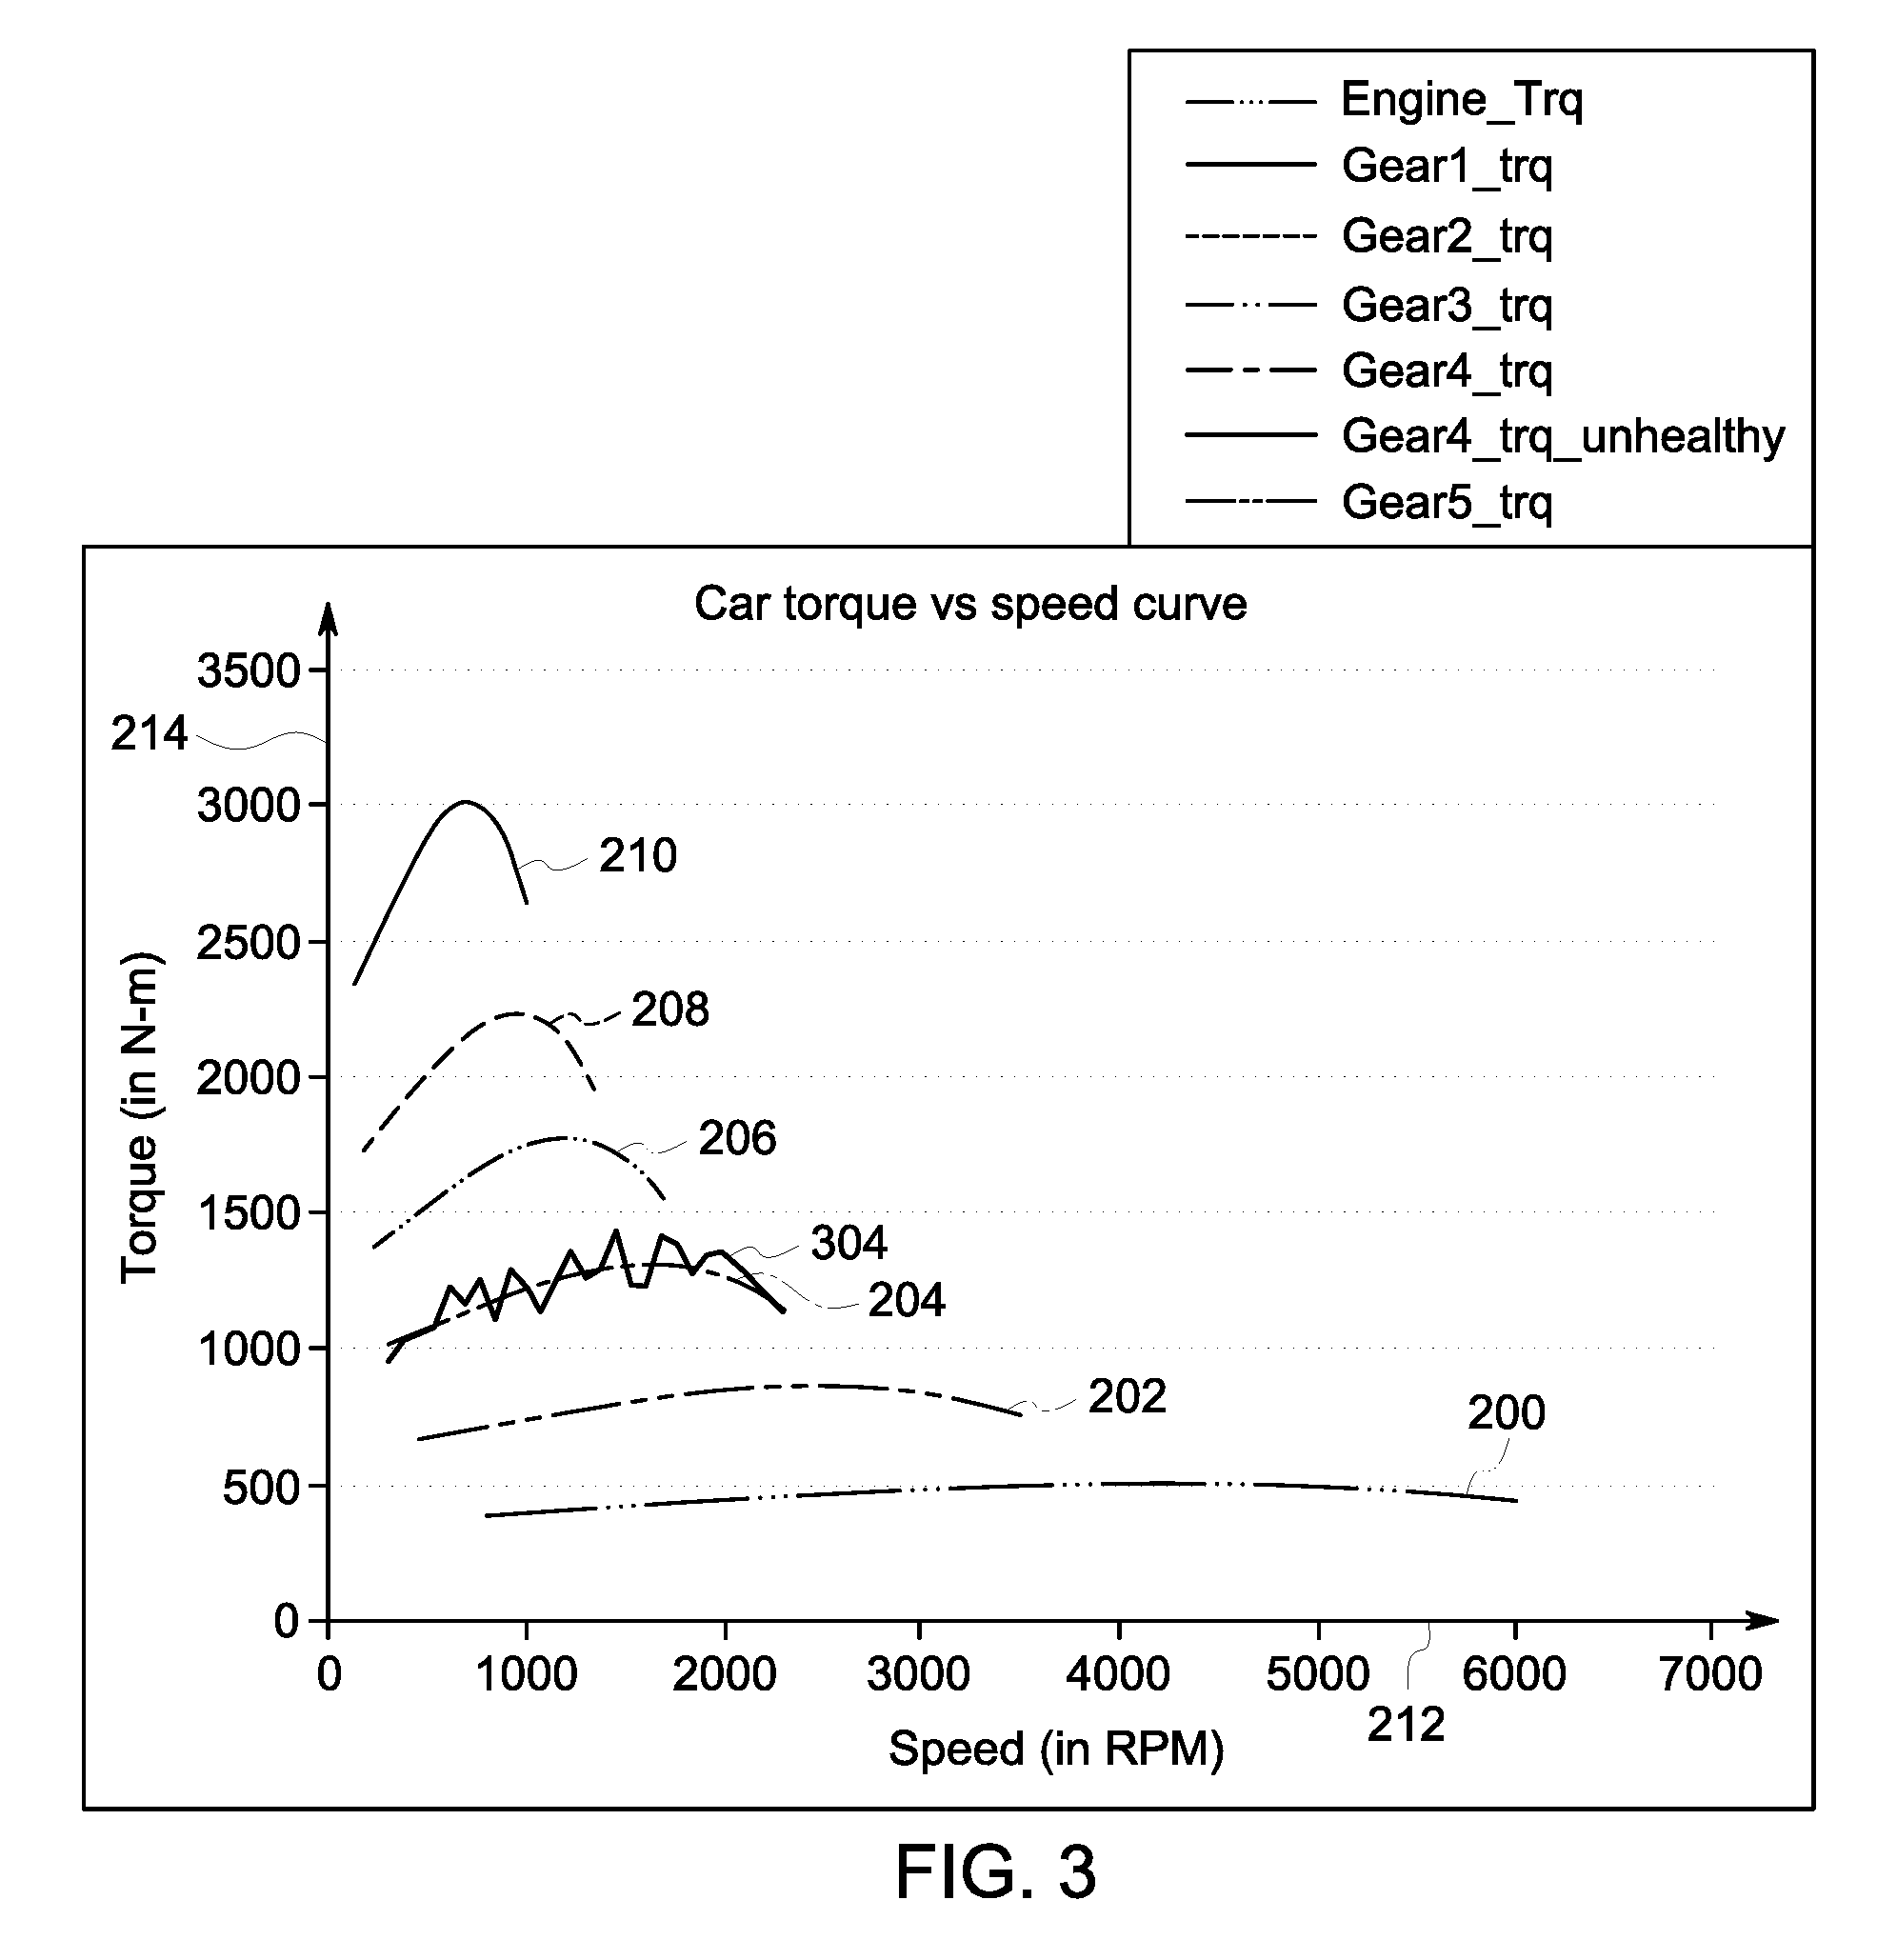
[0060] FIG. 3 illustrates one example of a comparison between torque and speed relationships as measured by the sensors shown in FIG. 2. As shown in FIG. 3, the controller monitors a torque and propulsion system speed relationship 304 for a vehicle while the vehicle operates in fourth gear. The controller compares this relationship 304 with the relationship 204 of a healthy vehicle (the same or different vehicle) and identifies differences between the relationships 204, 304. These differences can indicate to the controller that there is a component of the vehicle used while the vehicle operates in fourth gear that is degrading or otherwise in need of repair or replacement.
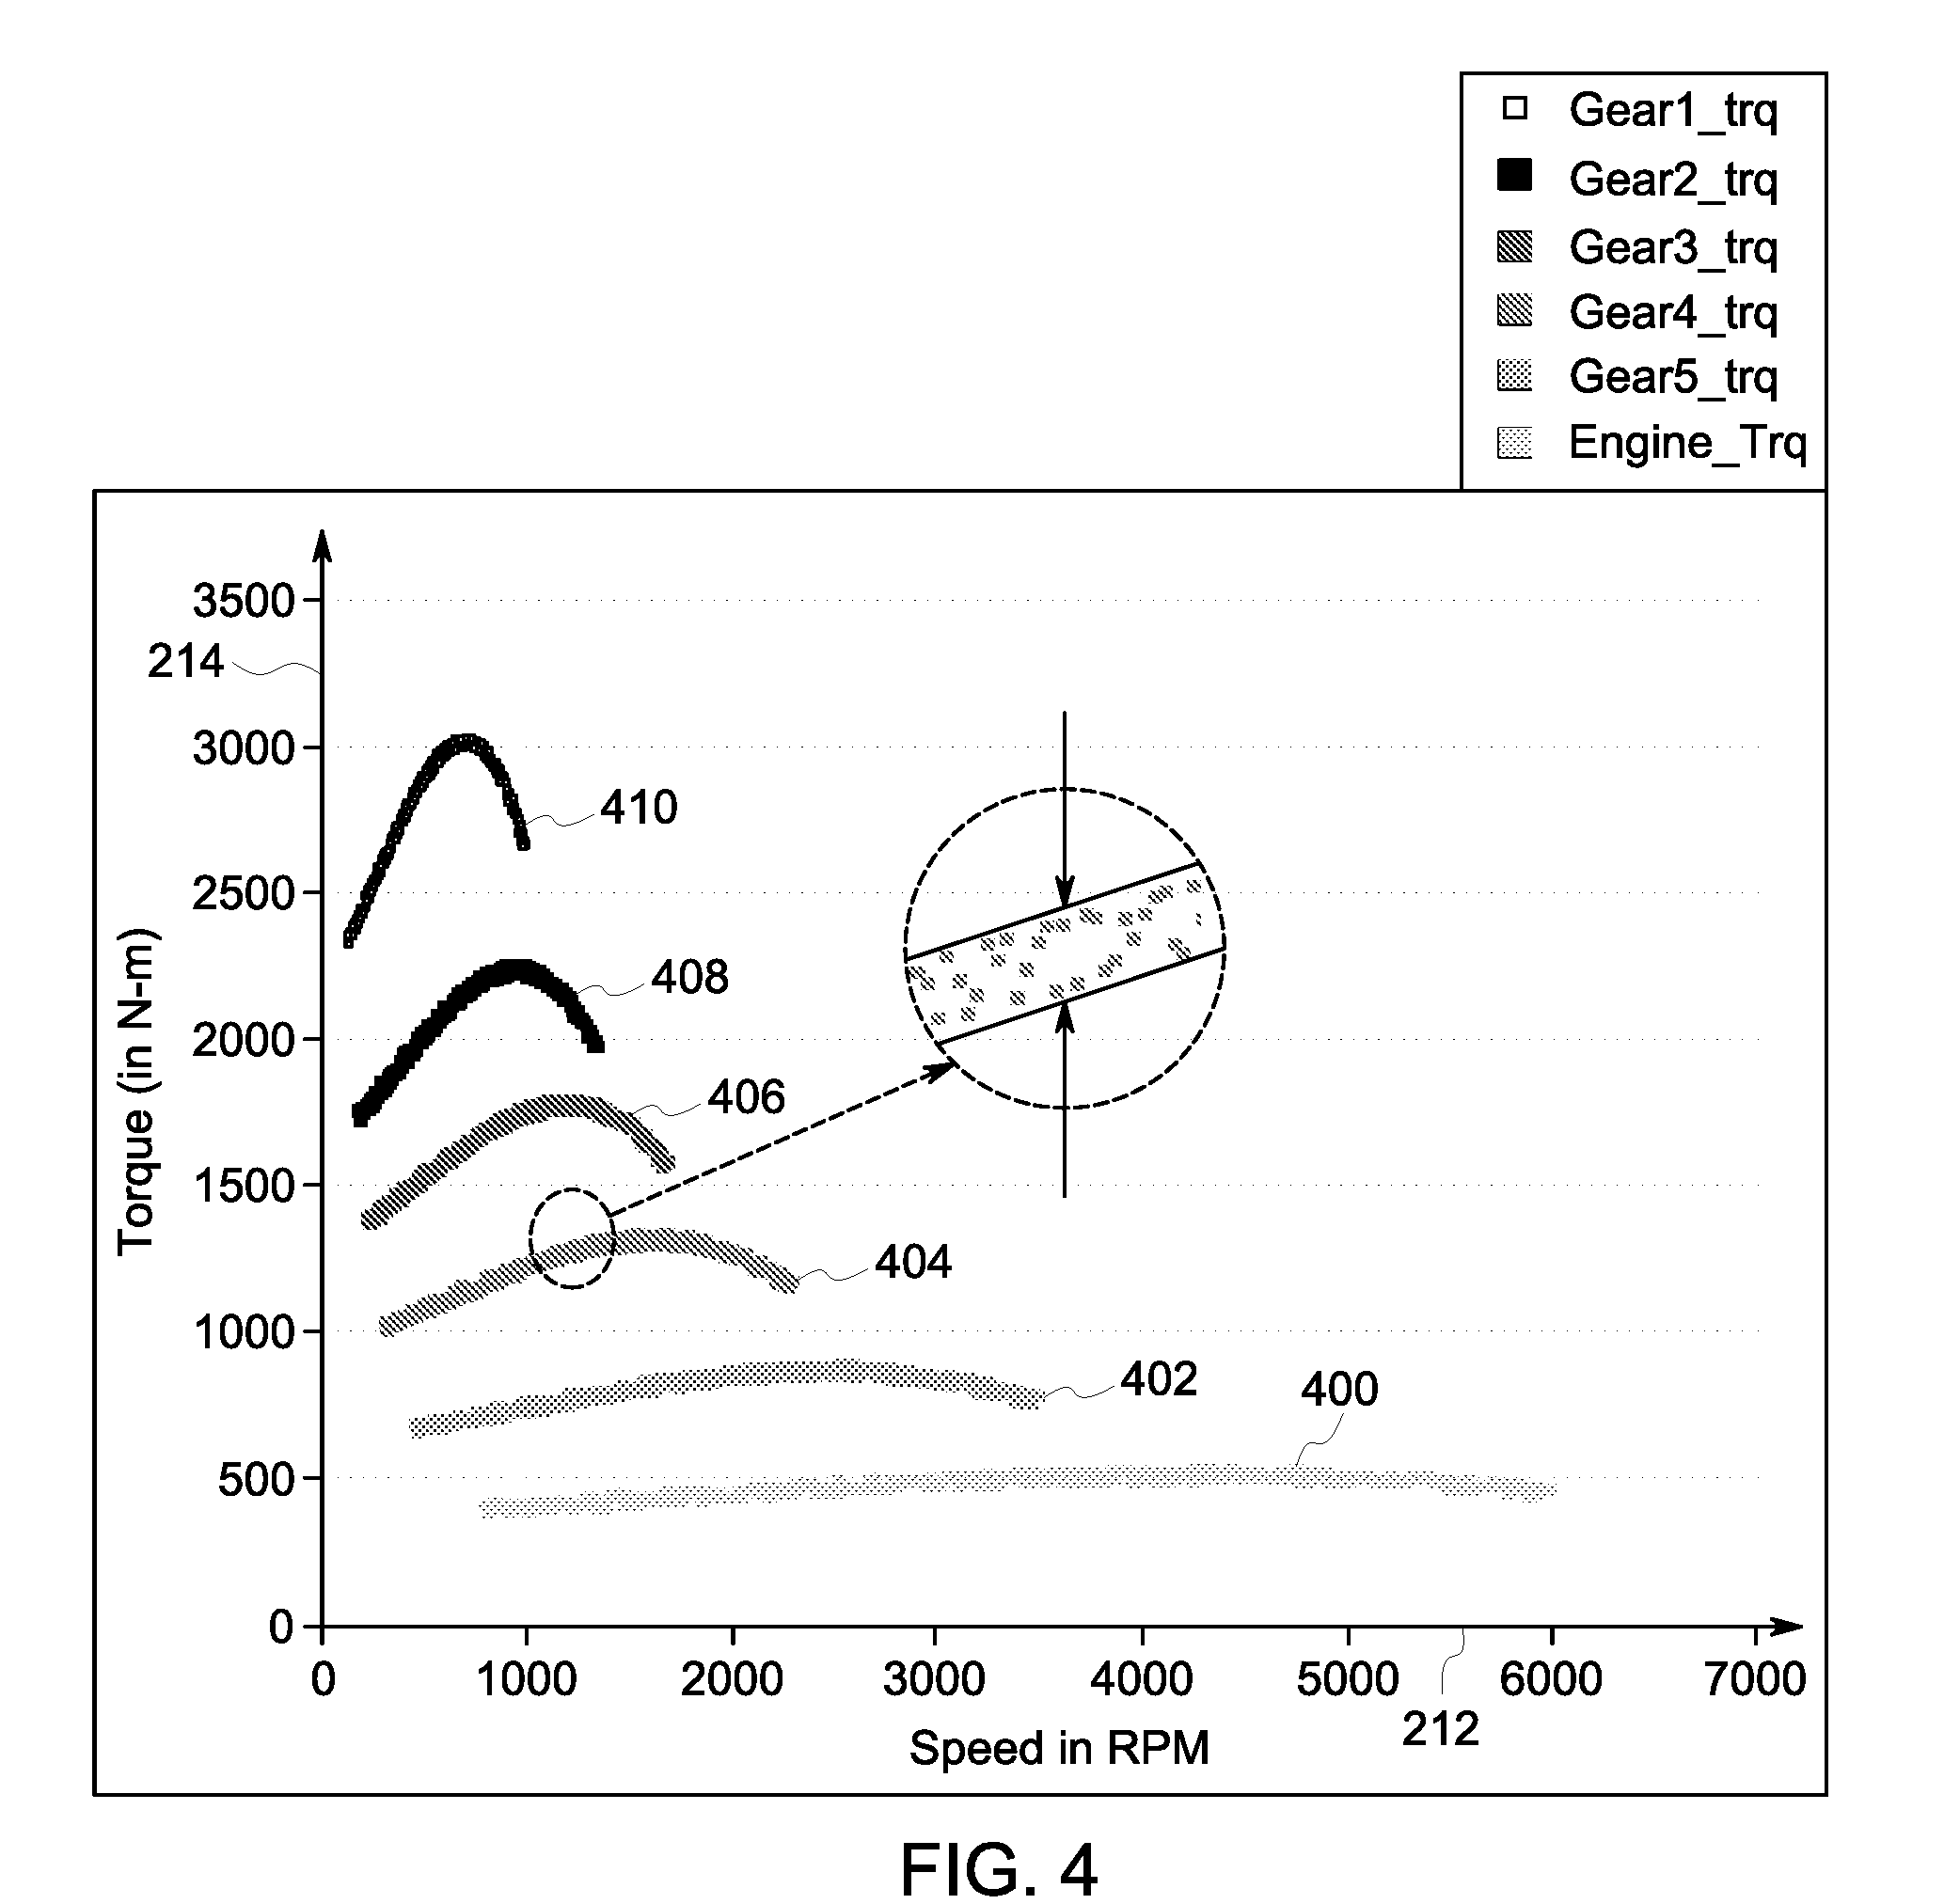
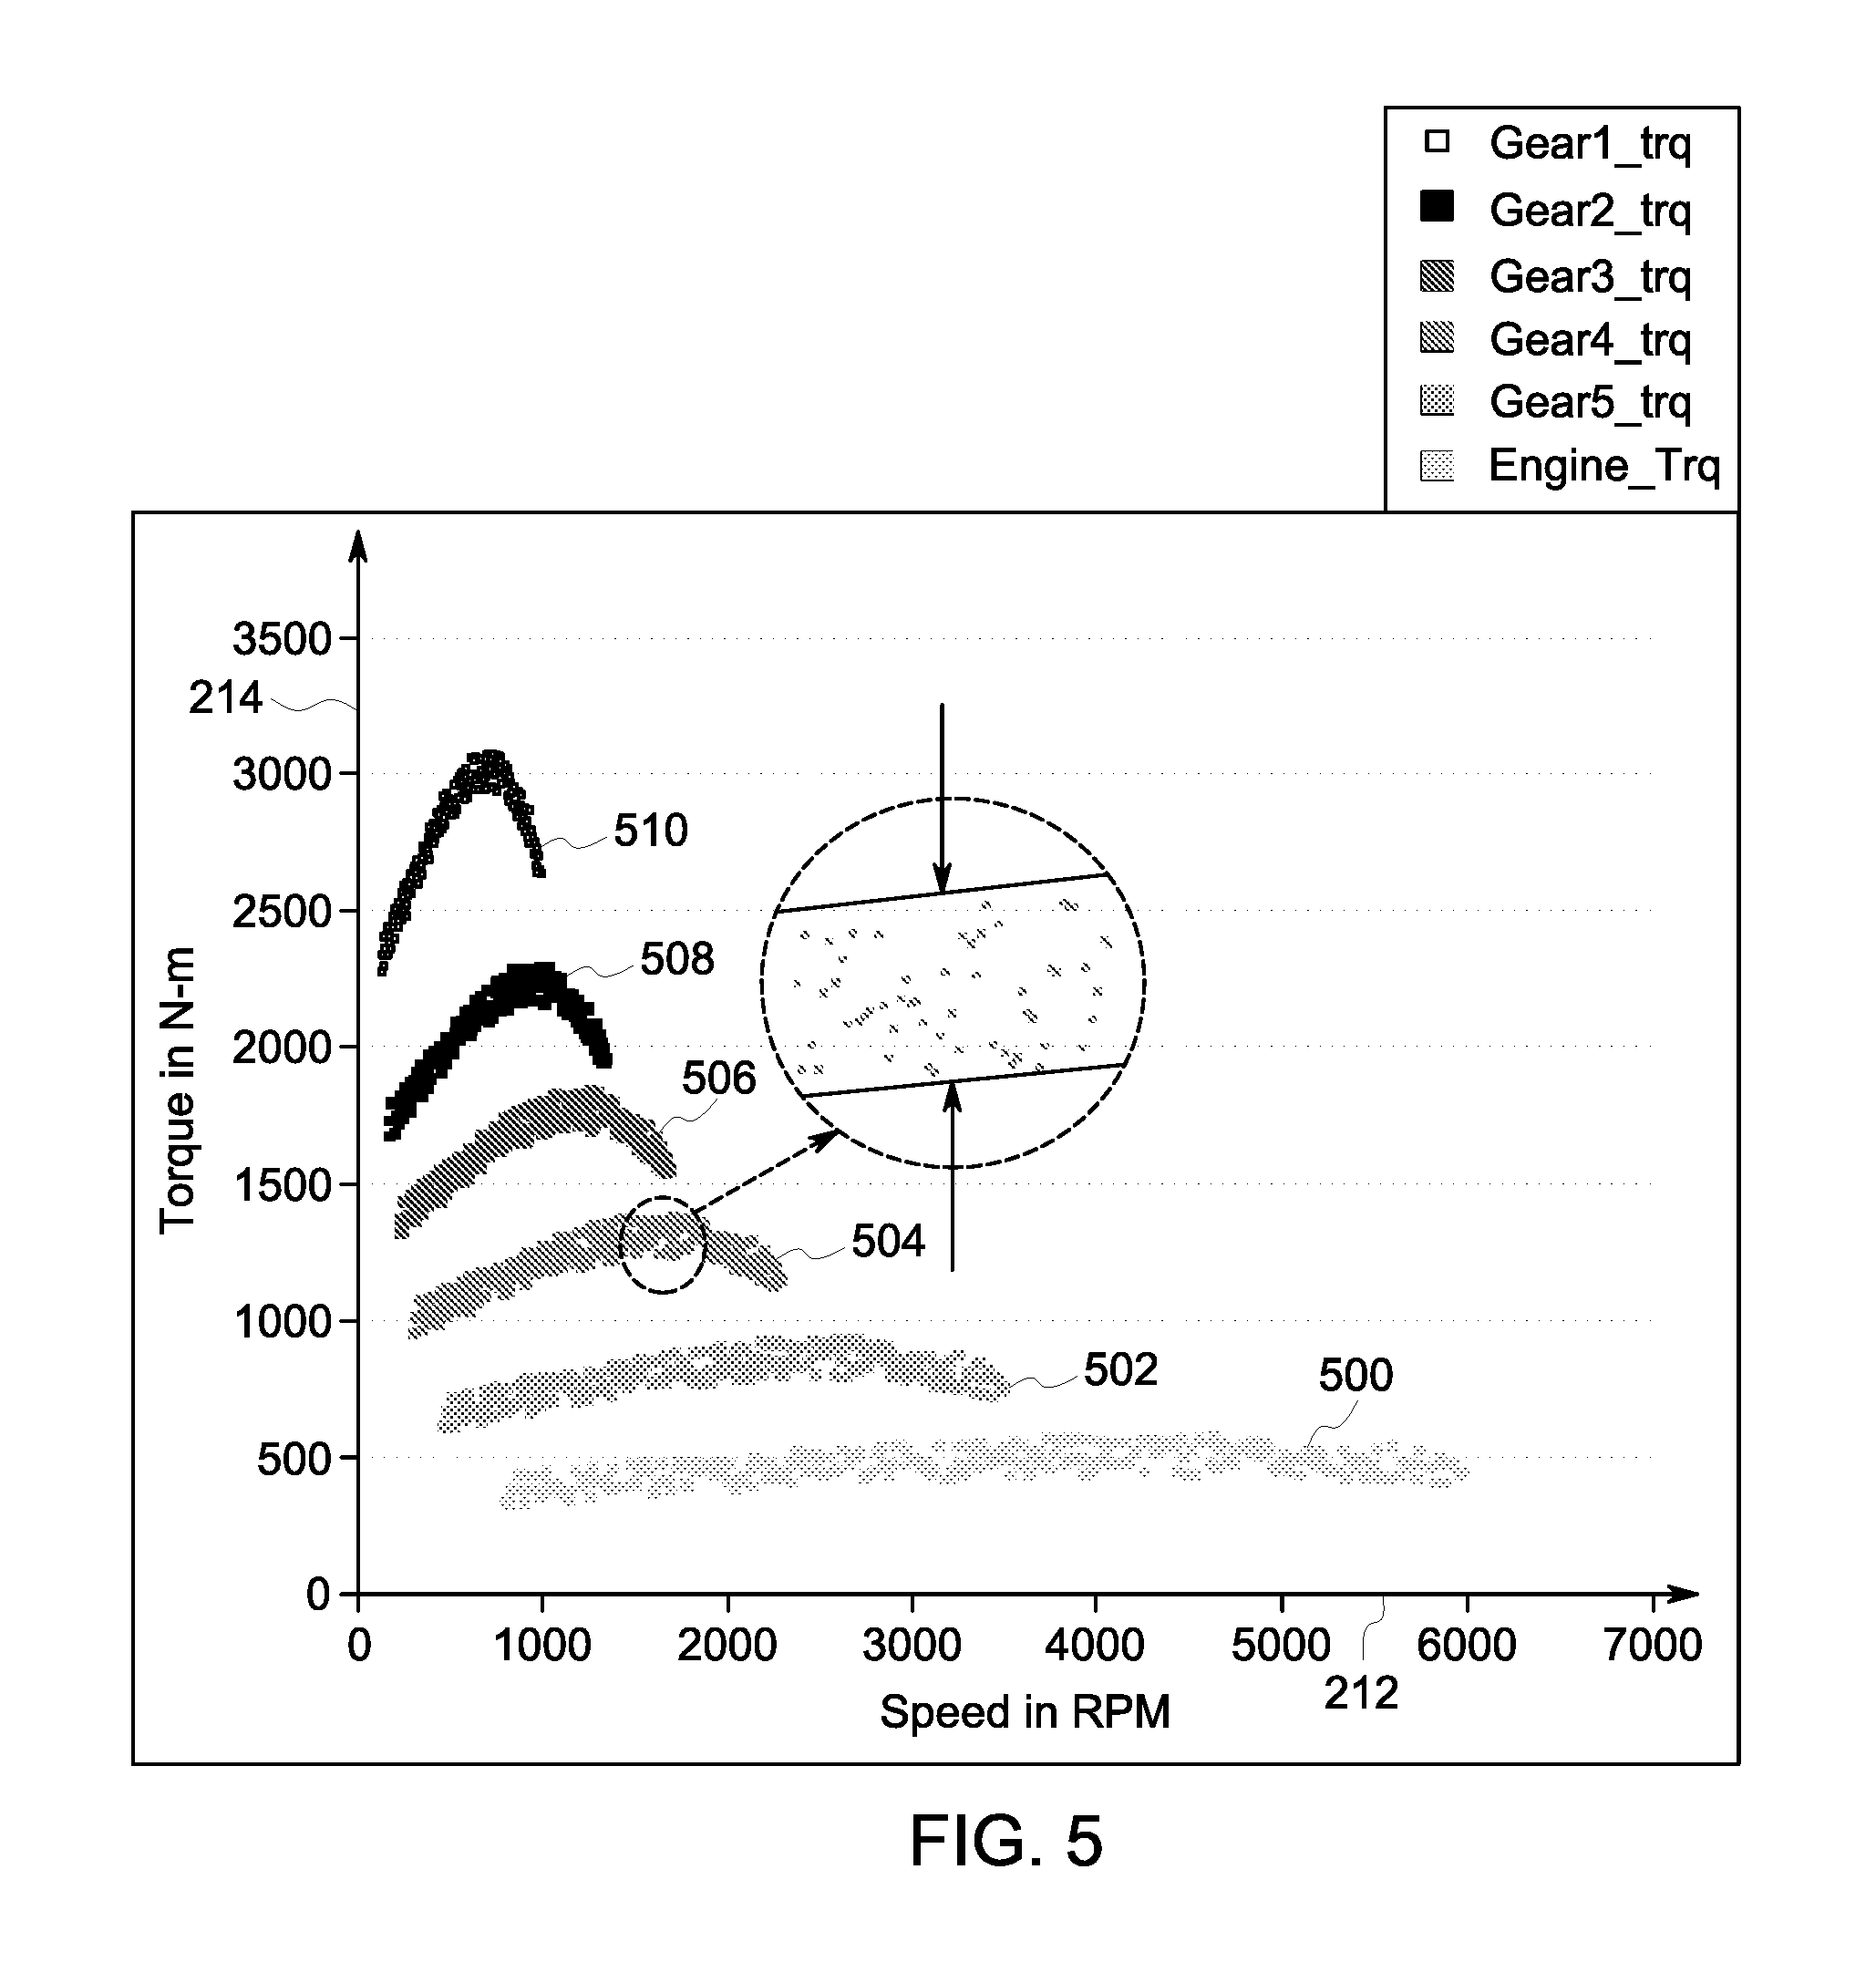
[0061] FIGS. 4 and 5 illustrate other examples of comparisons between torque and speed relationships as measured by the sensors shown in FIG. 2. The controller can obtain the measured torques and speeds from the sensors onboard the same vehicle over time. The torque and speed relationships 400, 402, 404, 406, 408, 410 shown in FIG. 4 represent the relationships between the gear torques and the propulsion system speed for the engine (relationship 400) and for first through fifth gears of the transmission of the vehicle (relationships 402, 404, 406, 408, 410, respectively). The torque and speed relationships 500, 502, 504, 506, 508, 510 shown in FIG. 5 represent the relationships between the gear torques and the speed for the propulsion system (relationship 500) and for first through fifth gears of the transmission of the vehicle (relationships 502, 504, 506, 508, 510, respectively). The relationships shown in FIGS. 4 and 5 may be obtained from data of the same vehicle (e.g., at different times), or from different vehicles.
[0062] The controller can examine the sensor data points forming the relationships shown in FIGS. 4 and 5 and determine that there is a wider range of measured torques in the relationships shown in FIG. 5. For example, the data points making up the relationships shown in FIG. 5 extend over a wider range of torques for each or several of the propulsion system speeds. This can indicate that the propulsion system (e.g., the wheel and axle combination, and motor) of the vehicle associated with the relationships shown in FIG. 5 may have degraded from an earlier time associated with the relationships shown in FIG. 4, or that the vehicle associated with the relationships shown in FIG. 5 has a more degraded propulsion system than the vehicle associated with the relationships shown in FIG. 4.
[0063] FIG. 6 illustrates engine or motor torques 600 and transmission torques 602 of a vehicle as measured by the sensors shown in FIG. 1. The motor/engine torques and transmission torques are shown alongside a horizontal axis 604 representative of time and vertical axes 606, 608 representative of magnitudes of generated torque. The transmission torques decrease in steps at different times. Each step decrease indicates that the vehicle has shifted gears to a higher gear. The motor/engine torques similarly have step changes at corresponding times, also indicating a change in gears of the vehicle.
[0064] FIGS. 7 and 8 illustrate moving speeds 700, 800 of vehicles as measured by one or more of the sensors shown in FIG. 1. The moving speeds can be measured as the vehicle changes gears as shown in FIG. 6. For example, the moving speeds shown in FIG. 7 can be measured for the vehicle that changes gears at the same times shown in FIG. 6. The moving speeds shown in FIG. 8 can be measured for the vehicle that changes gears at the same times shown in FIG. 6. The moving speeds shown in FIGS. 7 and 8 are shown alongside the horizontal axis 604 and a vertical axis 706 representative of vehicle speeds.
[0065] The controller can examine the moving speeds and identify oscillations 702, 802 in the speeds at or around the same times that the vehicle shifts gears. The magnitude of the oscillations can indicate whether the vehicle is healthy or in need of repair. For example, the magnitude of the oscillations shown in FIG. 7 may be examined by the controller and determine to not exceed one or more thresholds, while the magnitude of the oscillations shown in FIG. 8 may be examined by the controller and determine to exceed one or more thresholds. The controller can determine that the vehicle associated with the oscillations shown in FIG. 8 needs repair and/or one or more components of the vehicle need replacement.
[0066] FIGS. 9 and 10 illustrate braking efforts or forces 909, moving speeds 1001 of the vehicle, and wheel speeds 1009 of the wheel while braking according to one example. The braking efforts, moving speeds, and wheel speeds can be measured by the sensors of the control system as the vehicle brakes to slow down and stop from a moving state. The braking efforts are shown alongside a horizontal axis 905 representative of time and a vertical axis 907 representative of magnitudes of braking efforts. The moving and wheel speeds are shown alongside the horizontal axis 905 and a vertical axis 1007 representative of speeds.
[0067] Also shown in FIGS. 9 and 10 are designated braking efforts 901 and designated wheel speeds 1003. The controller can obtain the braking efforts, moving speeds, and wheel speeds from the sensors as the vehicle is engaging in the forcing function of braking. The controller can compare the braking efforts to the designated braking efforts and the wheel speeds to the designated wheel speeds to determine if the brakes are degraded. In the illustrated examples, because the braking effort oscillates, is not constant, and varies from the designated braking effort, and/or because the wheel speeds oscillate and/or vary from the designated wheel speeds, the controller can determine that one or more components of the brakes of the vehicle are degraded and need repair or replacement.
[0068] FIG. 11 illustrates examples of torque references 900 and measured torques 902 of the motor in the vehicle shown in FIG. 1. FIG. 12 illustrates rotor speeds 1002 of the motor in the vehicle shown in FIG. 1. The measured torques and rotor speeds can be measured by the sensors shown in FIG. 1. The torque references represent the sequence of torque pulses that the controller directs the motor to generate, as described above. The torque references and measured torques are shown in FIG. 11 alongside a horizontal axis 904 representative of time and a vertical axis 906 representative of motor torques. The rotor speeds are shown alongside the horizontal axis 904 and a vertical axis 1006 representative of rotational speeds of the motor.
[0069] The controller can select the sequence of torque reference pulses from among several different sequences, with each sequence associated with a different frequency range of interest that is to be applied to a component of the vehicle under examination. The controller can compare the applied frequencies and the frequencies of sensor data of a measured parameter of the vehicle in the frequency domain to determine the health of a vehicle component or the vehicle itself. For example, the controller can compare the frequencies of the torque applied by the motor (according to the torque pulse sequence directed by the controller) with the frequencies of the speed at which the motor operates.
[0070] FIG. 13 illustrates one example of an engine speed or drive train spectrum 1100 and a wheel speed spectrum 1102. The engine speed or drive train and wheel speed spectra are shown along a horizontal axis 1104 representative of different frequencies and a vertical axis 1106 representative of magnitudes of the engine speed or drive train spectrum and the wheel speed spectrum. The controller can generate or otherwise determine the engine speed or drive train and wheel speed spectra based on parameters sensed by the sensors shown in FIG. 1. The controller can examine the spectra at one or more expected or designated frequencies to determine if the magnitude of the spectra at the designated frequencies exceed a predefined upper limit. For example, the wheel speed spectra can be associated with a limit of zero decibels at a frequency of twenty radians per second and the engine speed spectra can be associated with a limit of forty decibels at a frequency of sixty radians per second. The actuating parameter which is generated by the engine or drive train can be extended to any other source (such as, motor or any prime mover with single or multi-stage gear). The spectrum of actuating quantity can be replaced with magnitude, RMS value, average value or any other mathematical quantification.
[0071] The controller can examine the engine speed and wheel speed spectra and determine if either spectrum exceeds a limit at an associated frequency. If a spectrum exceeds the limit, then the controller can determine that the corresponding vehicle component is degrading or needs repair or replacement. For example, the controller can determine that the wheel speed spectrum does not exceed the limit of zero decibels at twenty radians per second, but that the engine speed spectrum does exceed the limit of forty decibels at sixty radians per second. The controller can then determine that the motor has degraded and needs repair or replacement. Responsive to determining that a component needs repair or replacement, the controller can then generate one or more signals that direct an output device to notify an operator of the vehicle of the unhealthy component, and/or that direct another system (e.g., an automated robotic system) to repair, replace, or obtain a replacement of the unhealthy component. Optionally, responsive to determining that a component needs repair or replacement, the controller can change movement of the vehicle, such as by automatically slowing or stopping movement of the vehicle.
[0072] FIG. 14 illustrates a flowchart of one embodiment a method 1200 for evaluating vehicle health. The method 1200 can be performed by the controller to determine whether one or more vehicle components have degraded and need repair or replacement without stopping operation of the vehicle or taking apart the vehicle. The method 1200 also can identify degraded components without requiring additional sensors be added to the vehicle.
[0073] At 1202, performance of one or more vehicle components are monitored. For example, existing speed sensors can be used to monitor parameters such as motor rotor speeds (which can be used to determine estimated wheel speeds), the amount of torque generated by a motor, etc.
[0074] At 1204, one or more quantities are derived from the monitored parameters. For example, the frequency response of the parameters, one or more frequency components of the parameters, or the like, can be determined from the parameters. At 1206, the derived quantity or quantities are evaluated. This evaluation can include comparing the derived quantity with a designated value of the quantity. This designated value can be indicative of a healthy vehicle or healthy component of the vehicle. Optionally, the evaluation can include comparing the derived quantity with a derived quantity that is calculated from plural vehicles. For example, the derived quantity can be compared with a root mean square, average, median, or the like, of the same quantity but measured for a fleet of vehicles. As another example, the derived quantity can be monitored over time to see how the quantity changes with respect to time.
[0075] At 1208, a determination is made as to whether the derived quantity indicates an unhealthy (e.g., degraded) vehicle or vehicle component. For example, if the derived quantity deviates from the designated value, the same quantity determined for a group of vehicles, or changes in a negative manner over time, then the derived quantity can indicate a degraded component of the vehicle. As another example, if the derived quantity exceeds or falls below an associated limit or threshold, then the derived quantity can indicate a degraded vehicle component. If the derived quantity indicates a degraded component of a vehicle, then flow of the method 1200 can proceed toward 1210. Otherwise, the method 1200 can return toward 1202 or may terminate. At 1210, the vehicle is repaired. For example, the component can be repaired or replaced in response to determining that the derived quantity indicates that the component has degraded.
[0076] One embodiment of the inventive subject matter described herein provides a computerized system and method that identifies early degradation in the health of various components of vehicles by acquiring data from sensors with known forcing functions. Measurements of the health of vehicle components can be determined by measuring sensor outputs using on-board and/or off-board computer systems with known forcing functions, and comparing the sensor inputs with available baseline values. Based on and/or responsive to measuring the health of one or more components, the system or method can automatically repair and/or replace one or more components.
[0077] The health of various components of axles, trucks, platforms, etc., of vehicles is monitored with known operating conditions and modes. The known operating conditions can be designated speeds, motor torques, tractive efforts, engine speeds, power generated, etc. The known operating modes include a motoring mode, a braking mode, a coasting mode (where the vehicle is moving without tractive effort or braking effort being generated), etc. The known operating conditions or modes provide measures of a forcing function of the vehicle. When a particular forcing function is generated or reached (e.g., during normal operation as opposed to a testing operation of the vehicle), various parameters such as engine speed or displacement of any particular location on a three-dimensional plane or corresponding acceleration are measured using available sensors.
[0078] The sensor inputs are acquired (with on-board computer or separate data acquisition system) and processed (e.g., using a fast Fourier transform, calculating a root mean square value, average, study of one or more patterns of sensor data, etc.). Deviation of one or more of these processed parameters from a designated healthy value, a previously calculated value, and/or values of a fleet of vehicles is determined. Based on this deviation, a determination of whether one or more components of the vehicle need to be repaired or replaced, and a repair of the vehicle or replacement of a part can be automatically performed.
[0079] In one embodiment, a complete physical model of the vehicle or vehicle component can be derived. From this model, axle combination dynamics, axle-to-axle interactions, or the like, can be modeled on a very detailed level and the possible interaction of these dynamics on sensor at various locations can be determined. The forcing function can be various types, such as multiple pulses of various frequency range, step function, sine or cosine function, or any other pattern. With the forcing function, the sensors may be of different types measuring different type of movement (rotational or linear, displacement, velocity or acceleration, etc.)
[0080] Many vehicle components are not easily accessible or may not be easily inspected, which can make it difficult to determine signs of degradation. With the systems and methods described herein, determination of early degradation of such components are possible, and the repair or replacement can be optimally scheduled to save cost and downtime.
[0081] Returning to the description of the wheel and axle combination of the vehicle shown in FIG. 1, the movements of one or more components of the vehicle can be monitored over time by the controller to determine whether an absolute value of the magnitude and/or frequency of any of these movements exceed designated thresholds or limits while the vehicle operates within one or more operating conditions. The controller can use a model of the wheel and axle combination that represents each of the suspensions as a separate spring damper. In the model, each component can be associated with a natural frequency of movement that is actuated at one or more operating points or conditions of the vehicle.
[0082] FIG. 15 illustrates another example of an engine speed spectrum 1300. This engine speed spectrum can be generated or determined by the controller examining rotor speeds sensed by one or more of the sensors shown in FIG. 1. The controller can transform the rotor speeds measured by the sensors from the time domain to the frequency domain using a fast Fourier transform or another transform. The spectrum shown in FIG. 15 is shown alongside a horizontal axis 1302 representative of frequencies and a vertical axis 1304 representative of magnitudes of the rotor speeds.
[0083] The controller can examine the engine speed spectrum 1300 and identify one or more peaks 1306, 1308, 1310 at one or more associated frequencies. These peaks and the magnitudes of the peaks can be the derived quantities referred to above and that are used to evaluate the health of vehicle components. The controller may be programmed or otherwise provided with certain designated frequencies that are associated with natural frequencies of movement of one or more of the suspensions. For example, the primary suspension 124 shown in FIG. 1 may be associated with a first designated frequency that is the same frequency at which the first peak 1306 appears. The controller can determine from this correspondence that the first peak 1306 indicates movement of the primary suspension, and is not due to wear or degradation of the wheel and axle combination. The second peak 1308 occurs at a frequency that is not associated with any designated frequency of a known component. Therefore, the controller can identify the presence of the second peak 1308 as indicating degradation of some component of the wheel and axle combination. The third peak 1310 occurs at a designated frequency associated with torsional vibration of the wheel and/or axle.
[0084] For the first and third peaks that occur at designated frequencies associated with components of the vehicle, the controller can determine if the magnitude of these peaks exceeds one or more designated threshold or limits associated with the corresponding components. For example, the controller can compare the first peak with one upper limit and can compare the third peak with another upper limit. If the first peak exceeds the corresponding limit, then the controller determines that the primary suspension has degraded or is otherwise in need of repair or replacement. If the third peak exceeds the corresponding limit, then the controller determines that the wheel and/or axle has degraded or is otherwise in need of repair or replacement.
[0085] In one embodiment, at least one of the sensors shown in FIG. 1 can be a displacement or distance sensor that measures how far a suspension (e.g., the secondary suspension also shown in FIG. 1) is compressed. The compression distance of a suspension can be provided from the sensors to the controller as a parameter of the wheel and axle combination, and can be examined to determine the health or degradation state of the suspension.
[0086] FIG. 16 illustrates one example of a forcing function 1400. The forcing function represents torque applied by a motor to a first wheel and axle combination of the vehicle. FIG. 17 illustrates three examples of sensed changes in length 1500, 1502, 1504 of the secondary suspension in the first wheel and axle combination of the vehicle in response to implementation of the forcing function shown in FIG. 16. FIG. 18 illustrates one example of sensed changes in length 1600 of a secondary suspension in another wheel and axle combination of the same vehicle in response to implementation of the forcing function shown in FIG. 16.
[0087] The forcing function and the changes in length of the secondary suspensions shown in FIGS. 16 through 18 are shown alongside horizontal axes 1406 representative of time. The forcing function also is shown alongside a vertical axis 1408 representative of torque generated by motors that rotate the axles in the first and second wheel and axle combinations. The sensed changes in length shown in FIG. 17 are shown alongside a vertical axis 1508 representative of how far the secondary suspension for the first wheel and axle combination is compressed. The sensed changes in length shown in FIG. 18 are shown alongside a vertical axis 1608 representative of how far the secondary suspension for the first wheel and axle combination is compressed.
[0088] The forcing function shown in FIG. 16 indicates that the controller directed the motors to increase the torque generated by the motors at a time t.sub.0. The controller can monitor the changes in secondary suspension lengths monitored by the sensors and as shown in FIGS. 17 and 18. The first changes in length 1500 shown in FIG. 17 can be examined by the controller to identify degradation in the secondary suspension of the first wheel and axle combination. For example, the first changes in length increase following the increase in torque generated by the motor at the time t.sub.0, but the first changes in length remain at or below an upper threshold or limit 1510. The controller can then determine that the secondary suspension of the first wheel and axle combination is not damaged or degraded to the state where repair or replacement is needed.
[0089] In another example, however, the different, second changes in length 1502 indicate how the secondary suspension in the first wheel and axle combination is compressed following generation of the torque according to the forcing function. The controller can examine the second changes in length and determine that these changes in length increase to a rounded peak and then decrease to the upper threshold or limit following generation of the torque at the time t.sub.0. Or, the third changes in length 1504 can indicate how the secondary suspension in the first wheel and axle combination is compressed following generation of the torque according to the forcing function. The controller can examine the third changes in length and determine that these changes in length increase to a plateau above the upper threshold or limit, and then decrease to the upper threshold or limit following generation of the torque at the time t.sub.0.
[0090] The controller can examine the third changes in length 1504 and determine that the increase of the changes in length of the secondary suspension above the threshold or limit indicate that the secondary suspension is degraded, and can determine that the secondary suspension is severely degraded due to the changes in length increasing to a maximum (e.g., the plateau) before decreasing. But, the controller can examine the second changes in length 1502 and determine that the increase of the changes in length of the secondary suspension above the threshold or limit indicate that the secondary suspension is degraded, but not as degraded as the third changes in length 1504 would otherwise indicate due to the second changes in length 1502 not increasing to the maximum plateau.
[0091] The controller can examine the changes in length 1600 of the secondary suspension in the second wheel and axle combination and determine that the way in which the changes in length 1600 vary after the time t.sub.0 that the torque is generated indicates degradation of the secondary suspension. For example, even though the changes in length 1600 do not increase to a maximum plateau and does not increase above the threshold 1510, the variations in the secondary suspension (for a wheel and axle combination other than the wheel and axle combination having the motor that applied the torque) can indicate degradation in the secondary suspension of the other wheel and axle combination.
[0092] One or more additional embodiments of the inventive subject matter described herein can be used to evaluate the health or predict the failure of one or more cylinders in an engine. A computerized system that is onboard a vehicle can have a first computing unit (e.g., processor or group of processors) that operates as a supervisory control of the vehicle (e.g., to automatically control one or more functions of the vehicle) and one or more additional second computing units operating to execute an engine cylinder failure detection algorithm. The first computing unit can be referred to herein as a supervisory controller and the second computing unit(s) can be referred to herein as monitoring controllers. Each unit and/or controller can be formed from hardware circuitry that includes and/or is connected with one or more processors (e.g., one or more microprocessors, field programmable gate arrays, and/or integrated circuits) that perform the associated functions or operations described herein.
[0093] The supervisory controller checks for allowable system conditions (e.g., vehicle speed, motor torque, a designated sample time, etc.) to enable execution of the engine cylinder failure detection algorithm by the monitoring controller(s). Upon execution of this algorithm, the monitoring controller obtains a signal (e.g., a direct current link voltage of the rectified output of alternator driven by the engine), which can have the signature of a single or multiple engine cylinder failure. The monitoring controller can perform a data validity check, and evaluate 0.5.times. engine frequency components from the frequency spectrum of the direct current link voltage (or any other multiple of engine frequency or engine speed or other parameters). If specific frequency component magnitudes are higher than a predefined threshold, then engine unbalance is detected, and one or more cylinders of the engine can be identified as needing repair. In one embodiment, repair of the engine can then be automatically implemented.
[0094] FIG. 19 schematically illustrates another embodiment of the control system 122 shown in FIG. 1. The control system includes the controller 118 shown in FIG. 1 and two sensors 1700, 1702 of the sensors 120 shown in FIG. 1. Also shown in FIG. 19 are an engine 1704, an alternator (or generator) 1706 coupled with the engine, and power electronics or circuitry 1708 that conducts electric current generated by the alternator to the motors 110 of the vehicle. The sensor 1700 represents a speed sensor that measures how rapidly the engine operates and the sensor 1702 represents a direct current link sensor that measures the electric current conducted from the alternator and/or through the power electronics to the motor(s) of the vehicle.
[0095] FIG. 20 illustrates operation of the control system 122 shown in FIG. 19. The controller 118 can include a supervisory control unit 1800, several computing units 1802, 1804, 1806, and an engine control unit 1808. Each of the units 1800, 1802, 1804, 1806, 1808 can represent the same or separate hardware circuitry that includes and/or is connected with one or more of the same or different processors. The units 1800, 1802, 1804, 1806, 1808 perform the functions or operations described herein. While three computing units 1802, 1804, 1806 are shown, optionally, there may be a single computing unit, two computing units, or more than three computing units. The control system can be entirely disposed onboard a vehicle, or one or more components (e.g., the computing units) can be disposed off-board the vehicle.
[0096] In operation, the supervisory control unit receives sensor data 1810 from the sensors to determine whether the operational conditions of the engine and/or motor are acceptable (e.g., within designated limits). For example, the supervisory control unit can monitor the speed of the engine to determine whether the sensor data is within predefined limits. Optionally, the supervisory control unit can receive other sensor data to determine if the sensor data is within acceptable limits, such as the torque created by one or more motors, the sample time (e.g., whether there is sufficient time to acquire and evaluate sensor data), or other sensor data. If the sensor data indicates acceptable operating conditions, then the supervisory control unit can communicate a trigger signal 1812 to one or more of the computing units to initiate an algorithm or process for evaluating cylinders of the engine. The supervisory control unit also can communicate the same or a similar trigger signal to the engine control unit to inform the engine control unit when the cylinders are to be evaluated. Otherwise, the supervisory control unit does not communicate the trigger signal.
[0097] Responsive to receiving the trigger signal, the computing unit(s) obtain or capture sensor data 1814 from the DC link sensor. This sensor data can represent direct current link voltage sensed from the power electronics. The sensor data from the DC link sensor can indicate failure of one or more cylinders of the engine, as described herein. For example, the computing unit(s) in receipt of the DC link sensor data can examine spectrum analysis by evaluating the frequency components of the DC link voltage at one or more frequencies, such as at one half of the frequency at which the engine is operating (e.g., half the speed of the engine operating speed). If the magnitude of the DC link voltage at the one or more frequencies (e.g., 0.5 of the engine frequency component) exceeds one or more previously defined thresholds or upper limits, then the DC link voltage can indicate degradation, damage, or failure of one or more cylinders in the engine. The thresholds or limits can include the magnitude of one half the engine frequency component when the same cylinder is cut out and no other cylinder is faulty (as previously measured), the magnitude of one half the engine frequency component when no cylinder is cut out and no other cylinder is faulty (as previously measured), and/or the magnitude of one half the engine frequency component when the same cylinder was last examined. The computing unit(s) that detected the cylinder failure can communicate a failure signal 1816 to the supervisory control unit. In one embodiment, a different computing unit can be dedicated to examining the frequency component(s) from a different cylinder.
[0098] To identify which cylinder of the engine has failed, the engine control unit can sequentially cut out individual cylinders of the engine and can communicate a cut-out signal 1818 to the supervisory control unit that indicates which cylinder of the cylinders in the engine is or will be cut-out. A cylinder can be cut-out by not injecting fuel into the cylinder and thereby preventing combustion within that cylinder, while other cylinders (that are not cut out) continue to receive fuel and combust fuel-and-air mixtures in the cylinders. The supervisory control unit then communicates the trigger signal to one of more of the computing units, as described above. The computing units perform the spectrum analysis described above with each cylinder being cut out at different times to determine which cylinder has failed.
[0099] FIG. 21 illustrates one embodiment of a timing diagram for examination of the cylinders of the engine. The timing diagram defines a sequence of several time periods shown alongside (e.g., above) a common timeline 1900. The sequence includes a cylinder cut-out pattern 1902 that indicates when each cylinder of the engine is cut out. For example, the raised portions of the cylinder cut-out pattern indicate that a cylinder is cut out, with the identity of the cylinder indicated by CC1, CC2, and so on. In the illustrated embodiment, the engine includes twelve cylinders, but optionally can include fewer or more cylinders.
[0100] A trigger pattern 1904 of the sequence indicates when the trigger signal is sent from the supervisory control unit to the computing unit(s) to begin examination of the data from the DC link sensor. The raised portions of the trigger pattern indicate when the trigger signal is sent to a different computing unit, with the notations SCT1, SCT2, and so on, indicating which computing unit receives the trigger signal.
[0101] A data acquisition pattern 1906 of the sequence indicates when a computing unit acquires data from the DC link sensor while a cylinder is cut out. The data acquisition pattern includes shorter shapes that extend over part of the timeline to indicate when the DC link sensor data is obtained by the computing unit. The notations DA1-1, DA1-7, DA2-8, and so on, indicate which computing unit is obtaining the DC link sensor data and which cylinder is cut out. For example, DA3-9 indicates that the third computing unit is acquiring DC link sensor data while the ninth cylinder of the engine is cut out.
[0102] A spectrum analysis pattern 1908 of the sequence indicates when a computing unit is analyzing the spectrum of the DC link sensor data, as described above. The spectrum analysis pattern includes elongated shapes that extend over part of the timeline to indicate when the computing unit is examining the spectrum of the DC link sensor data acquired while a cylinder is cut out. The notations SA1-1, SA1-7, SA2-8, and so on, indicate which computing unit is examining the spectrum of the DC link sensor data and which cylinder is cut out. For example, SA3-9 indicates that the third computing unit is examining the spectrum of the DC link sensor data while the ninth cylinder of the engine is cut out.
[0103] As shown by the sequence in FIG. 21, different cylinders are cut out at different times, but the acquisition of sensor data and analysis of the sensor data can be performed during overlapping time periods by different computing units.
[0104] The analysis of the sensor data spectrum can be performed in a variety of manners to determine whether a cylinder of an engine is degraded, faulty, or otherwise not working, and/or to identify which cylinder of the engine is degraded, faulty, or otherwise not working. In one embodiment, the computing unit examines the magnitude at one-half of the frequency of the engine speed in the spectrum of DC link voltages measured by the DC link sensor. The magnitude of the spectrum at this frequency is the vector sum of the magnitude caused by a potentially weak, damaged, or otherwise degraded cylinder and the magnitude caused by the cylinder that has been cut out.
[0105] FIG. 22 illustrates one example of a spatial representation 2000 of a cylinder firing sequence of the engine shown in FIG. 19 when a first cylinder of the engine is cut out and a twelfth cylinder of the same engine is weak (e.g., faulty, damaged, or degraded). The spatial representation includes several axes 2002 that radially extend from a common location and that each represent magnitudes of the frequency response of the DC link sensor data for a different cylinder. A vector 2004 represents the magnitude of the frequency in the DC link spectrum at one half the engine speed when the first cylinder ("cyl1" in FIG. 22) is cut out and the twelfth cylinder ("cyl12" in FIG. 22) is weak. The vector 2004 is the combination of a vector 2006 along the axis associated with the magnitude of the spectrum at one half of the engine frequency for the first cylinder and another vector 2008 along the axis associated with the magnitude of the spectrum at one half of the engine frequency for the twelfth cylinder.
[0106] FIG. 23 illustrates one example of a magnitude 2100 of the DC link voltage data spectrum at one half the frequency of the engine speed when a healthy (not weak) cylinder is cut out and no other cylinder of the engine is weak. FIG. 24 illustrates one example of a magnitude 2200 of the DC link voltage data spectrum at one half the frequency of the engine speed when a healthy cylinder is cut out and another cylinder of the engine is weak. FIG. 25 illustrates one example of a magnitude 2300 of the DC link voltage data spectrum at one half the frequency of the engine speed when a weak cylinder is cut out. The magnitudes shown in FIGS. 23 through 25 are shown alongside a horizontal axis 2102 representative of frequencies of the DC link sensor data spectrum and a vertical axis 2104 representative of magnitudes of the frequency in the DC link sensor data spectrum at a frequency that is one half of the engine frequency (or speed). Also shown in FIGS. 23 through 25 is a designated threshold or limit 2106, which indicates a faulty or weak cylinder.
[0107] The computing unit examining the sensor data spectrum can examine the magnitude shown in FIG. 25 and determine that the cylinder from which the sensor data is obtained is not a weak cylinder because this magnitude does not exceed the designated threshold. But, the computing unit examining the sensor data spectrum can examine the magnitude shown in FIG. 26 and determine that the cylinder is a weak cylinder because this magnitude does exceed the designated threshold. The computing unit examining the sensor data spectrum can examine the magnitude shown in FIG. 27 and determine that the cylinder is the cylinder that was cut out because the magnitude far exceeds the designated threshold (e.g., by more than the magnitude shown in FIG. 26 and associated with the weak cylinder). The magnitudes of the spectra that are examined by the computing units can be the derived quantities used to evaluate vehicle component health, as described above.
[0108] The Table below illustrates examples of different magnitudes of the DC link sensor data spectrum at a frequency that is one half of the frequency of the engine speed when the twelfth cylinder ("CC12" in the Table) is weak and when different cylinders are cut out. The magnitudes are expressed as percentages of the threshold described above. The phase angles of the vectors (e.g., the vector 2006 shown in FIG. 20) for the corresponding magnitudes also are shown in the Table.
TABLE-US-00001 0.5x freq magnitude with different cylinders cutout with Cyl12 is a weak cylinder Cylinder # cutout CC CC CC CC CC CC CC CC CC CC CC CC 1 2 3 4 5 6 7 8 9 10 11 12 Mag (%) 125.1 117.9 100.6 88.9 73.2 70.0 78.4 88.9 108.1 117.9 128.2 100 Phase 29.1 47.3 80.3 103.0 148.5 180.0 231.0 257.0 293.5 312.7 -17.4 0.0 Angle(in .degree.)
[0109] Alternatively or additionally, the computing unit(s) can determine which cylinder is weak by individually fueling each cylinder until the magnitude of the frequency in the DC link voltage spectrum at one half of the engine speed frequency disappears or is reduced to zero. For example, each cylinder can be individually over-fueled (injected with more fuel than the other cylinders) or under-fueled (injected with less fuel than the other cylinders) in a sequence by controlling the fuel injectors associated with the cylinders. The magnitude of the frequency in the DC voltage link spectrum at one half of the engine speed frequency is examined and, when the magnitude at the frequency at one half of the engine speed frequency disappears or reduces to zero, the cylinder that is over- or under-fueled while the magnitude disappears is identified by the computing unit as a weak cylinder. The magnitudes of the spectra that are examined by the computing units can be the derived quantities used to evaluate vehicle component health, as described above.
[0110] Alternatively or additionally, the computing unit(s) can determine which cylinder is weak by individually fueling each cylinder in a step-wise manner and comparing the magnitude of the frequency in the DC link voltage spectrum at one half of the engine speed frequency at each fueling step with a designated range of magnitudes associated with a healthy cylinder. For example, a first cylinder may be injected with 10% of the amount of fuel that is otherwise provided to this cylinder during normal operating conditions (when the cylinders are not being tested as described herein). The magnitude of the frequency in the DC link voltage spectrum at one half of the engine speed frequency is examined. Then, this same cylinder is injected with another amount of fuel (e.g., 20% of the amount otherwise provided) and the magnitude is examined. Then, this same cylinder is injected with another amount of fuel (e.g., 30% of the amount otherwise provided) and the magnitude is examined, and so on. This process can be repeated for one or more, or all, other cylinders in the engine. The magnitudes of the spectra that are examined by the computing units can be the derived quantities used to evaluate vehicle component health, as described above.
[0111] FIG. 26 illustrates examples of magnitudes 2400, 2402, 2404 of DC link voltage spectra at one half of the engine speed frequency at different fueling levels for a healthy cylinder. The magnitudes 2400, 2402, 2404 are shown alongside a horizontal axis 2406 representative of different fueling levels of the cylinder (e.g., 10%, 20%, etc.) and alongside a vertical axis 2408 representative of the magnitudes of the frequency of the DC link voltage spectra at one half of the engine speed frequency. Also shown in FIG. 26 are designated ranges 2410, 2412, 2414 of magnitudes at corresponding fueling levels. The ranges of magnitudes indicate acceptable ranges of the magnitude of the DC link voltage spectra at the one half of the engine speed frequency. If the magnitude for a fuel level falls within the corresponding range, then that magnitude indicates that the cylinder is healthy. As shown in FIG. 26, the magnitudes all fall within the ranges, thereby indicating to the computing unit(s) that the cylinder under examination is healthy. The ranges of magnitudes can be determined from measurements performed when the cylinders are known to be healthy at the different fuel levels.
[0112] FIG. 27 illustrates examples of magnitudes 2500, 2502, 2504 of DC link voltage spectra at one half of the engine speed frequency at different fueling levels for a weak or degraded cylinder. The magnitudes 2500, 2502, 2504 are shown alongside the horizontal axis 2406 and the vertical axis 2408. As shown in FIG. 27, the magnitude 2500 at the fueling level of 10% is within the associated range 2410, but the magnitudes 2502, 2504 associated with the fueling levels of 30% and 110%, respectively, fall outside the associated ranges 2412, 2414. This can indicate to the computing unit(s) that the cylinder under examination is not healthy and may be weak or degraded.
[0113] FIG. 28 illustrates a flowchart of one embodiment of a method 2600 for identifying a weak cylinder in an engine. The method 2600 can represent the operations performed by the control system in examining the cylinders of an engine. At 2602, the engine operates by directing fuel-and-air mixtures into the cylinders of the engine. At 2604, a determination is made as to whether the operating conditions of the engine are acceptable for examination of the cylinders. If the operating conditions are acceptable, then flow of the method 2600 can proceed toward 2606. Otherwise, flow of the method 2600 can return toward 2602 until the conditions are acceptable, or the method 2600 can terminate.
[0114] At 2606, a value of a variable i is set to one and a value of a variable n is set to the number of cylinders in the engine. Optionally, these values can be set at another point in the method 2600. Optionally, the variable i is set to another value. At 2608, the cylinder is cut off. For example, injection of fuel to the i.sup.th cylinder may be temporarily suspended or stopped. At 2610, the DC link voltage of the power electronics of the vehicle is monitored while the i.sup.th cylinder is cut out. At 2612, a determination is made as to whether the DC link voltage indicates that one or more of the cylinders is weak. For example, the magnitude of the frequency of a spectrum of the DC link voltage can be examined and/or compared to one or more thresholds to determine if any cylinder is weak, as described above. Optionally, the amount of fueling to the cylinder can be changed and the DC link voltage spectrum can be examined, as described above. The fueling amount can be changed by increasing or decreasing the amount of fuel supplied to the cylinder, also as described above. If the DC link voltage indicates that a cylinder is weak, then flow of the method 2600 can proceed toward 2614. Otherwise, flow of the method 2600 can continue toward 2616.
[0115] At 2614, the i.sup.th cylinder is identified as a weak cylinder. One or more remedial actions can be performed, such as automatically decreasing operation of the engine (e.g., decreasing the speed of the engine), automatically stopping operation of the engine, changing an amount of fuel supplied to the weak cylinder, or the like. Flow of the method 2600 can proceed toward 2616 or can terminate (e.g., at 2618).
[0116] At 2616, a determination is made as to whether the current value of i is equal to n, the number of cylinders in the engine. If the value of i is equal to the number of cylinders in the engine, then flow of the method 2600 can terminate at 2618, or can return toward 2602. If the value of i is not equal to the number of cylinders in the engine (e.g., i is less than n), then flow of the method 2600 can proceed toward 2620. At 2620, the value of i is incrementally increased (e.g., by one), and flow of the method 2600 can return toward 2608.
[0117] In one embodiment, a locomotive control system is provided. The control system includes a locomotive having a propulsion system and one or more sensors located onboard the locomotive. The one or more sensors configured to measure one or more actuating parameters of the propulsion system while the locomotive is stationary, idling, or during changes in movement of the locomotive. The control system also includes one or more processors communicatively coupled with the one or more sensors. The one or more processors are configured to monitor the one or more actuating parameters according to a forcing function that represents operation of the propulsion system of the locomotive. The one or more processors also are configured to identify a degraded component of the locomotive by one or more of (a) comparing actuating parameters that are generated by the propulsion system according to the forcing function with (speed) actuating parameters expressed as a function of speed of another propulsion system associated with at least one other locomotive, (b) examining changes in the actuating parameters that are generated by the propulsion system according to the forcing function over time, (c) examining oscillations in the changes in movement of the locomotive during shifting of gears between different torques or between different transmission torques of the forcing function, (d) comparing decreases in wheel speed of the locomotive during operation according to the forcing function with designated wheel speeds associated with at least one other locomotive, and/or (e) comparing a magnitude of one or more frequencies in a frequency domain spectrum of the actuating parameters of the locomotive with one or more designated magnitudes while the locomotive is one or more of moving, idling, or stationary.
[0118] In one embodiment, a locomotive control system includes a locomotive having a propulsion system and one or more sensors located onboard the locomotive. The one or more sensors are configured to measure one or more actuating parameters generated by the propulsion system while the locomotive is stationary, idling, or during changes in movement of the locomotive. The system also includes one or more processors communicatively coupled with the one or more sensors. The one or more processors are configured to control operation of the propulsion system according to a forcing function and to monitor the one or more actuating parameters while the propulsion system is operating according to the forcing function. The one or more processors are configured to identify a degraded component of the locomotive by one or more of (a) comparing the actuating parameters that are monitored with speed actuating parameters expressed as a function of speed of at least one other propulsion system associated with at least one other locomotive, (b) examining changes in the actuating parameters that are monitored over time, (c) examining oscillations in changes in movement of the locomotive during shifting of gears between different torques or between different transmission torques during operation of the propulsion system according to the forcing function, (d) comparing decreases in wheel speed of the locomotive during operation of the propulsion system according to the forcing function with designated wheel speeds associated with at least one other locomotive, and/or (e) comparing a magnitude of one or more frequencies in a frequency domain spectrum of the actuating parameters of the locomotive with one or more designated magnitudes while the locomotive is one or more of moving, idling, or stationary.
[0119] Optionally, the forcing function is one or more of (a) a designated forcing function that predefines the actuating parameters of the propulsion system of the locomotive, (b) a naturally occurring forcing function that identifies operational conditions of the propulsion system that are not automatically implemented, and/or (c) a combination of the designated forcing function and the naturally occurring forcing function. The forcing function optionally can define one or more of (a) motor torques of the propulsion system, (b) a terrain over which the locomotive travels, (c) a gradient of a route on which the locomotive travels, (d) a speed bump of the locomotive, (e) a stiff gradient of the locomotive, (f) a coasting operation of the locomotive, and/or (g) a combination of forces that one or more of assist motion or oppose motion of the locomotive.
[0120] The actuating parameters may include one or more of (a) torque generated by the propulsion system, (b) power generated by the propulsion system, (c) force generated by the propulsion system, (d) tractive effort generated by the propulsion system, (e) speed of the locomotive, and/or (f) an opposing force to generated torque of the propulsion system. The propulsion system can be one or more of (a) a motor and/or (b) a prime mover other than an engine of the locomotive.
[0121] The forcing function can designate one or more of (a) engine torques as a function of engine speeds that are generated by an engine of the locomotive, (b) application of one or more brakes of the locomotive, and/or (c) shifting of gears in a transmission of the locomotive. The one or more processors can be configured to monitor torques generated by the propulsion system during operation of the locomotive according to operational conditions designated by the forcing function. The one or more processors can be configured to identify the degraded component of the locomotive by one or more of (a) comparing torques that are generated by the propulsion system during operation according to the forcing function as the actuating parameters (with the forcing function designating torques as a function of the speed of the other propulsion system that is associated with the at least one other locomotive) and/or (b) examining the changes in the actuating parameters that are generated by the propulsion system during operation according to the forcing function over time (where the degraded component of the locomotive is determined responsive to a variance in the actuating parameters that are generated by the propulsion system exceeding one or more designated thresholds).
[0122] Optionally, the one or more processors can be configured to identify the degraded component of the locomotive by examining the oscillations in the changes in movement of the locomotive during shifting of gears and determining that the oscillations exceed one or more thresholds. The one or more processors can be configured to identify the degraded component of the locomotive by comparing the magnitude of the one or more frequencies in the frequency domain spectrum of the actuating parameters of the locomotive with one or more designated magnitudes.
[0123] In one embodiment, a locomotive control system is provided that includes a locomotive having one or more motors configured to generate torque to propel the locomotive and one or more sensors configured to measure a response of the locomotive to the torque that is generated by the one or more motors. The one or more sensors are configured to generate sensor data representative of the response that is measured. The control system also includes a hardware controller configured to direct the one or more motors of the locomotive to generate the torque according to a designated torque profile. The controller also is configured to receive the sensor data and to determine a frequency spectrum of the response of the locomotive. The controller is configured to compare one or more parts of the frequency spectrum with a threshold to (a) determine that a component of the locomotive is degraded and to (b) automatically change movement of the locomotive responsive to determining that the component is degraded.
[0124] Optionally, the designated torque profile can be a pseudo random binary sequence of torques to be generated by the one or more motors. The one or more sensors can be configured to measure one or more of speeds or accelerations of the locomotive. The one or more sensors can be configured to measure rotor speeds of the one or more motors.
[0125] In one embodiment, a locomotive control system includes an engine configured to be disposed onboard a locomotive and to receive a supply of fuel for cylinders of the engine, a power electronics circuit configured to be coupled with the engine and to conduct electric current to one or more motors of the locomotive for propelling the locomotive, one or more sensors configured to monitor direct current link voltages in the power electronics circuit coupled with the engine, and one or more processors configured to be communicatively coupled with the one or more sensors. The one or more processors also are configured to change the supply of fuel to at least one of the cylinders of the engine, to determine a magnitude of a frequency in a frequency spectrum of the direct current link voltages that are monitored, and to determine whether the at least one cylinder that receives the supply of fuel that is changed is damaged or degraded based on the magnitude of the frequency that is determined.
[0126] Optionally, the one or more processors can be configured to change the supply of fuel to the at least one cylinder by reducing fuel supplied to the least one cylinder. The one or more processors can be configured to change the supply of fuel to the at least one cylinder by cutting out the at least one cylinder. The one or more processors can be configured to change the supply of fuel to the at least one cylinder by stopping injection of the fuel to a first cylinder of the cylinders while other cylinders of the cylinders in the engine continue being injected with the fuel.
[0127] The frequency in the frequency spectrum can be at one half of a frequency of a speed at which the engine operates.
[0128] The one or more processors can be configured to sequentially change the supply of fuel to other cylinders in the plural cylinders, monitor the direct current link voltages, determine the magnitude of the frequency, and determine whether each of the other cylinders receiving the sequentially changed supply of fuel is damaged or degraded based on the magnitude of the frequency.
[0129] Optionally, the one or more processors are configured to change the supply of the fuel to the at least one cylinder by increasing fuel supplied to the at least one cylinder relative to one or more other cylinders of the engine.
[0130] In an embodiment, a system (e.g., vehicle system, or vehicle controls system) includes a vehicle and one or more processors. The vehicle has a propulsion system and one or more sensors located onboard the vehicle. The one or more sensors are configured to measure one or more actuating parameters generated by the propulsion system while the vehicle is stationary, idling, or during changes in movement of the vehicle. The one or more processors are communicatively coupled with the one or more sensors, and are configured to monitor the one or more actuating parameters according to a forcing function that represents operation of the propulsion system of the vehicle. The one or more processors are configured to identify a degraded component of the vehicle by one or more of: comparing the actuating parameters that are generated by the propulsion system and monitored according to the forcing function with speed actuating parameters expressed as a function of speed of at least one other propulsion system associated with at least one other vehicle; examining changes in the actuating parameters that are generated by the propulsion system and monitored according to the forcing function over time; examining oscillations in changes in movement of the vehicle during shifting of gears between different torques or between different transmission torques of the forcing function; comparing decreases in wheel speed of the vehicle during operation according to the forcing function with designated wheel speeds associated with at least one other vehicle; and/or comparing a magnitude of one or more frequencies in a frequency domain spectrum of the actuating parameters of the vehicle with one or more designated magnitudes while the vehicle is one or more of moving, idling, or stationary.
[0131] In another embodiment, the forcing function is one or more of a designated forcing function that predefines the actuating parameters of the propulsion system of the vehicle, a naturally occurring forcing function that identifies operational conditions of the propulsion system that are not automatically implemented, or a combination of the designated forcing function and the naturally occurring forcing function.
[0132] In another embodiment, the forcing function defines one or more of motor torques of the propulsion system, a terrain over which the vehicle travels, a gradient of a route on which the vehicle travels, a speed bump of the vehicle, a stiff gradient of the vehicle, a coasting operation of the vehicle, or a combination of forces that one or more of assist motion or oppose motion of the vehicle.
[0133] In another embodiment, the actuating parameters include one or more of torque generated by the propulsion system, power generated by the propulsion system, force generated by the propulsion system, tractive effort generated by the propulsion system, speed of the vehicle, or an opposing force to generated torque of the propulsion system.
[0134] In another embodiment, the propulsion system is one or more of a motor or a prime mover other than an engine of the vehicle.
[0135] In another embodiment, the forcing function designates one or more of: engine torques as a function of engine speeds that are generated by an engine of the vehicle, application of one or more brakes of the vehicle, or shifting of gears in a transmission of the vehicle.
[0136] In another embodiment, the one or more processors are configured to monitor torques generated by the propulsion system during operation of the vehicle according to operational conditions designated by the forcing function. The one or more processors are configured to identify the degraded component of the vehicle by one or more of: comparing torques that are generated by the propulsion system during operation according to the forcing function as the actuating parameters, with the forcing function designating torques as a function of the speed of the other propulsion system that is associated with the at least one other vehicle; and/or examining the changes in the actuating parameters that are generated by the propulsion system during operation according to the forcing function over time, wherein the degraded component of the vehicle is determined responsive to a variance in the actuating parameters that are generated by the propulsion system exceeding one or more designated thresholds.
[0137] In another embodiment, the one or more processors are configured to identify the degraded component of the vehicle by examining the oscillations in the changes in movement of the vehicle during shifting of gears and determining that the oscillations exceed one or more thresholds.
[0138] In another embodiment, the one or more processors are configured to identify the degraded component of the vehicle by comparing the magnitude of the one or more frequencies in the frequency domain spectrum of the actuating parameters of the vehicle with one or more designated magnitudes.
[0139] In another embodiment, a vehicle control system includes a vehicle, one or more sensors, and a hardware controller (e.g., electrical circuit with a processor). The vehicle has one or more motors configured to generate torque to propel the vehicle. The one or more sensors are configured to measure a response of the vehicle to the torque that is generated by the one or more motors, the one or more sensors configured to generate sensor data representative of the response that is measured. The hardware controller is configured to direct the one or more motors of the vehicle to generate the torque according to a designated torque profile. The controller also is configured to receive the sensor data and to determine a frequency spectrum of the response of the vehicle. The controller also is configured to compare one or more parts of the frequency spectrum with a threshold to determine that a component of the vehicle is degraded and to automatically change movement of the vehicle responsive to determining that the component is degraded.
[0140] In another embodiment, the designated torque profile is a pseudo random binary sequence of torques to be generated by the one or more motors.
[0141] In another embodiment, the one or more sensors are configured to measure one or more of speeds or accelerations of the vehicle as the response of the vehicle to the torque that is generated by the one or more motors.
[0142] In another embodiment, the one or more sensors are configured to measure rotor speeds of the one or more motors.
[0143] In another embodiment, a vehicle control system includes an engine, a power electronics circuit, one or more sensors, and one or more processors. The engine is configured to be disposed onboard a vehicle and to receive a supply of fuel for cylinders of the engine. The power electronics circuit is configured to be coupled with the engine and to conduct electric current to one or more motors of the vehicle for propelling the vehicle. The one or more sensors are configured to monitor direct current link voltages in the power electronics circuit coupled with the engine. The one or more processors are configured: to be communicatively coupled with the one or more sensors; to change the supply of fuel to at least one of the cylinders of the engine; to determine a magnitude of a frequency in a frequency spectrum of the direct current link voltages that are monitored; and to determine whether the at least one cylinder that receives the supply of fuel that is changed is damaged or degraded based on the magnitude of the frequency that is determined.
[0144] In another embodiment, the one or more processors are configured to change the supply of fuel to the at least one cylinder by reducing fuel supplied to the least one cylinder.
[0145] In another embodiment, the one or more processors are configured to change the supply of fuel to the at least one cylinder by cutting out the at least one cylinder.
[0146] In another embodiment, the one or more processors are configured to change the supply of fuel to the at least one cylinder by stopping injection of the fuel to a first cylinder of the cylinders while other cylinders of the cylinders in the engine continue being injected with the fuel.
[0147] In another embodiment, the frequency in the frequency spectrum is at one half of a frequency of a speed at which the engine operates.
[0148] In another embodiment, the one or more processors are configured to sequentially change the supply of fuel to other cylinders in the plural cylinders, monitor the direct current link voltages, determine the magnitude of the frequency, and determine whether each of the other cylinders receiving the sequentially changed supply of fuel is damaged or degraded based on the magnitude of the frequency.
[0149] In another embodiment, the one or more processors are configured to change the supply of the fuel to the at least one cylinder by increasing fuel supplied to the at least one cylinder relative to one or more other cylinders of the engine.
[0150] It is to be understood that the above description is intended to be illustrative, and not restrictive. For example, the above-described embodiments (and/or aspects thereof) may be used in combination with each other. In addition, many modifications may be made to adapt a particular situation or material to the teachings of the inventive subject matter without departing from its scope. While the dimensions and types of materials described herein are intended to define the parameters of the inventive subject matter, they are by no means limiting and are exemplary embodiments. Many other embodiments will be apparent to those of skill in the art upon reviewing the above description. As used herein, the terms "including" and "in which" are used as the plain-English equivalents of the respective terms "comprising" and "wherein." Moreover, terms such as "first," "second," "third," "upper," "lower," "bottom," "top," etc. are used merely as labels, and are not intended to impose numerical or positional requirements on their objects.
[0151] This written description uses examples to disclose several embodiments of the inventive subject matter, including the best mode, and also to enable one of ordinary skill in the art to practice the embodiments of inventive subject matter, including making and using any devices or systems and performing any incorporated methods.
[0152] As used herein, an element or step recited in the singular and proceeded with the word "a" or "an" should be understood as not excluding plural of said elements or steps, unless such exclusion is explicitly stated. Furthermore, references to "one embodiment" of the inventive subject matter are not intended to be interpreted as excluding the existence of additional embodiments that also incorporate the recited features. Moreover, unless explicitly stated to the contrary, embodiments "comprising," "including," or "having" an element or a plurality of elements having a particular property may include additional such elements not having that property.
[0153] Since certain changes may be made in the above-described system and method without departing from the spirit and scope of the inventive subject matter herein involved, it is intended that all the subject matter of the above description or shown in the accompanying drawings shall be interpreted merely as examples illustrating the inventive concept herein and shall not be construed as limiting the inventive subject matter.
* * * * *
D00000
D00001
D00002
D00003
D00004
D00005
D00006
D00007
D00008
D00009
D00010
D00011
D00012

D00013
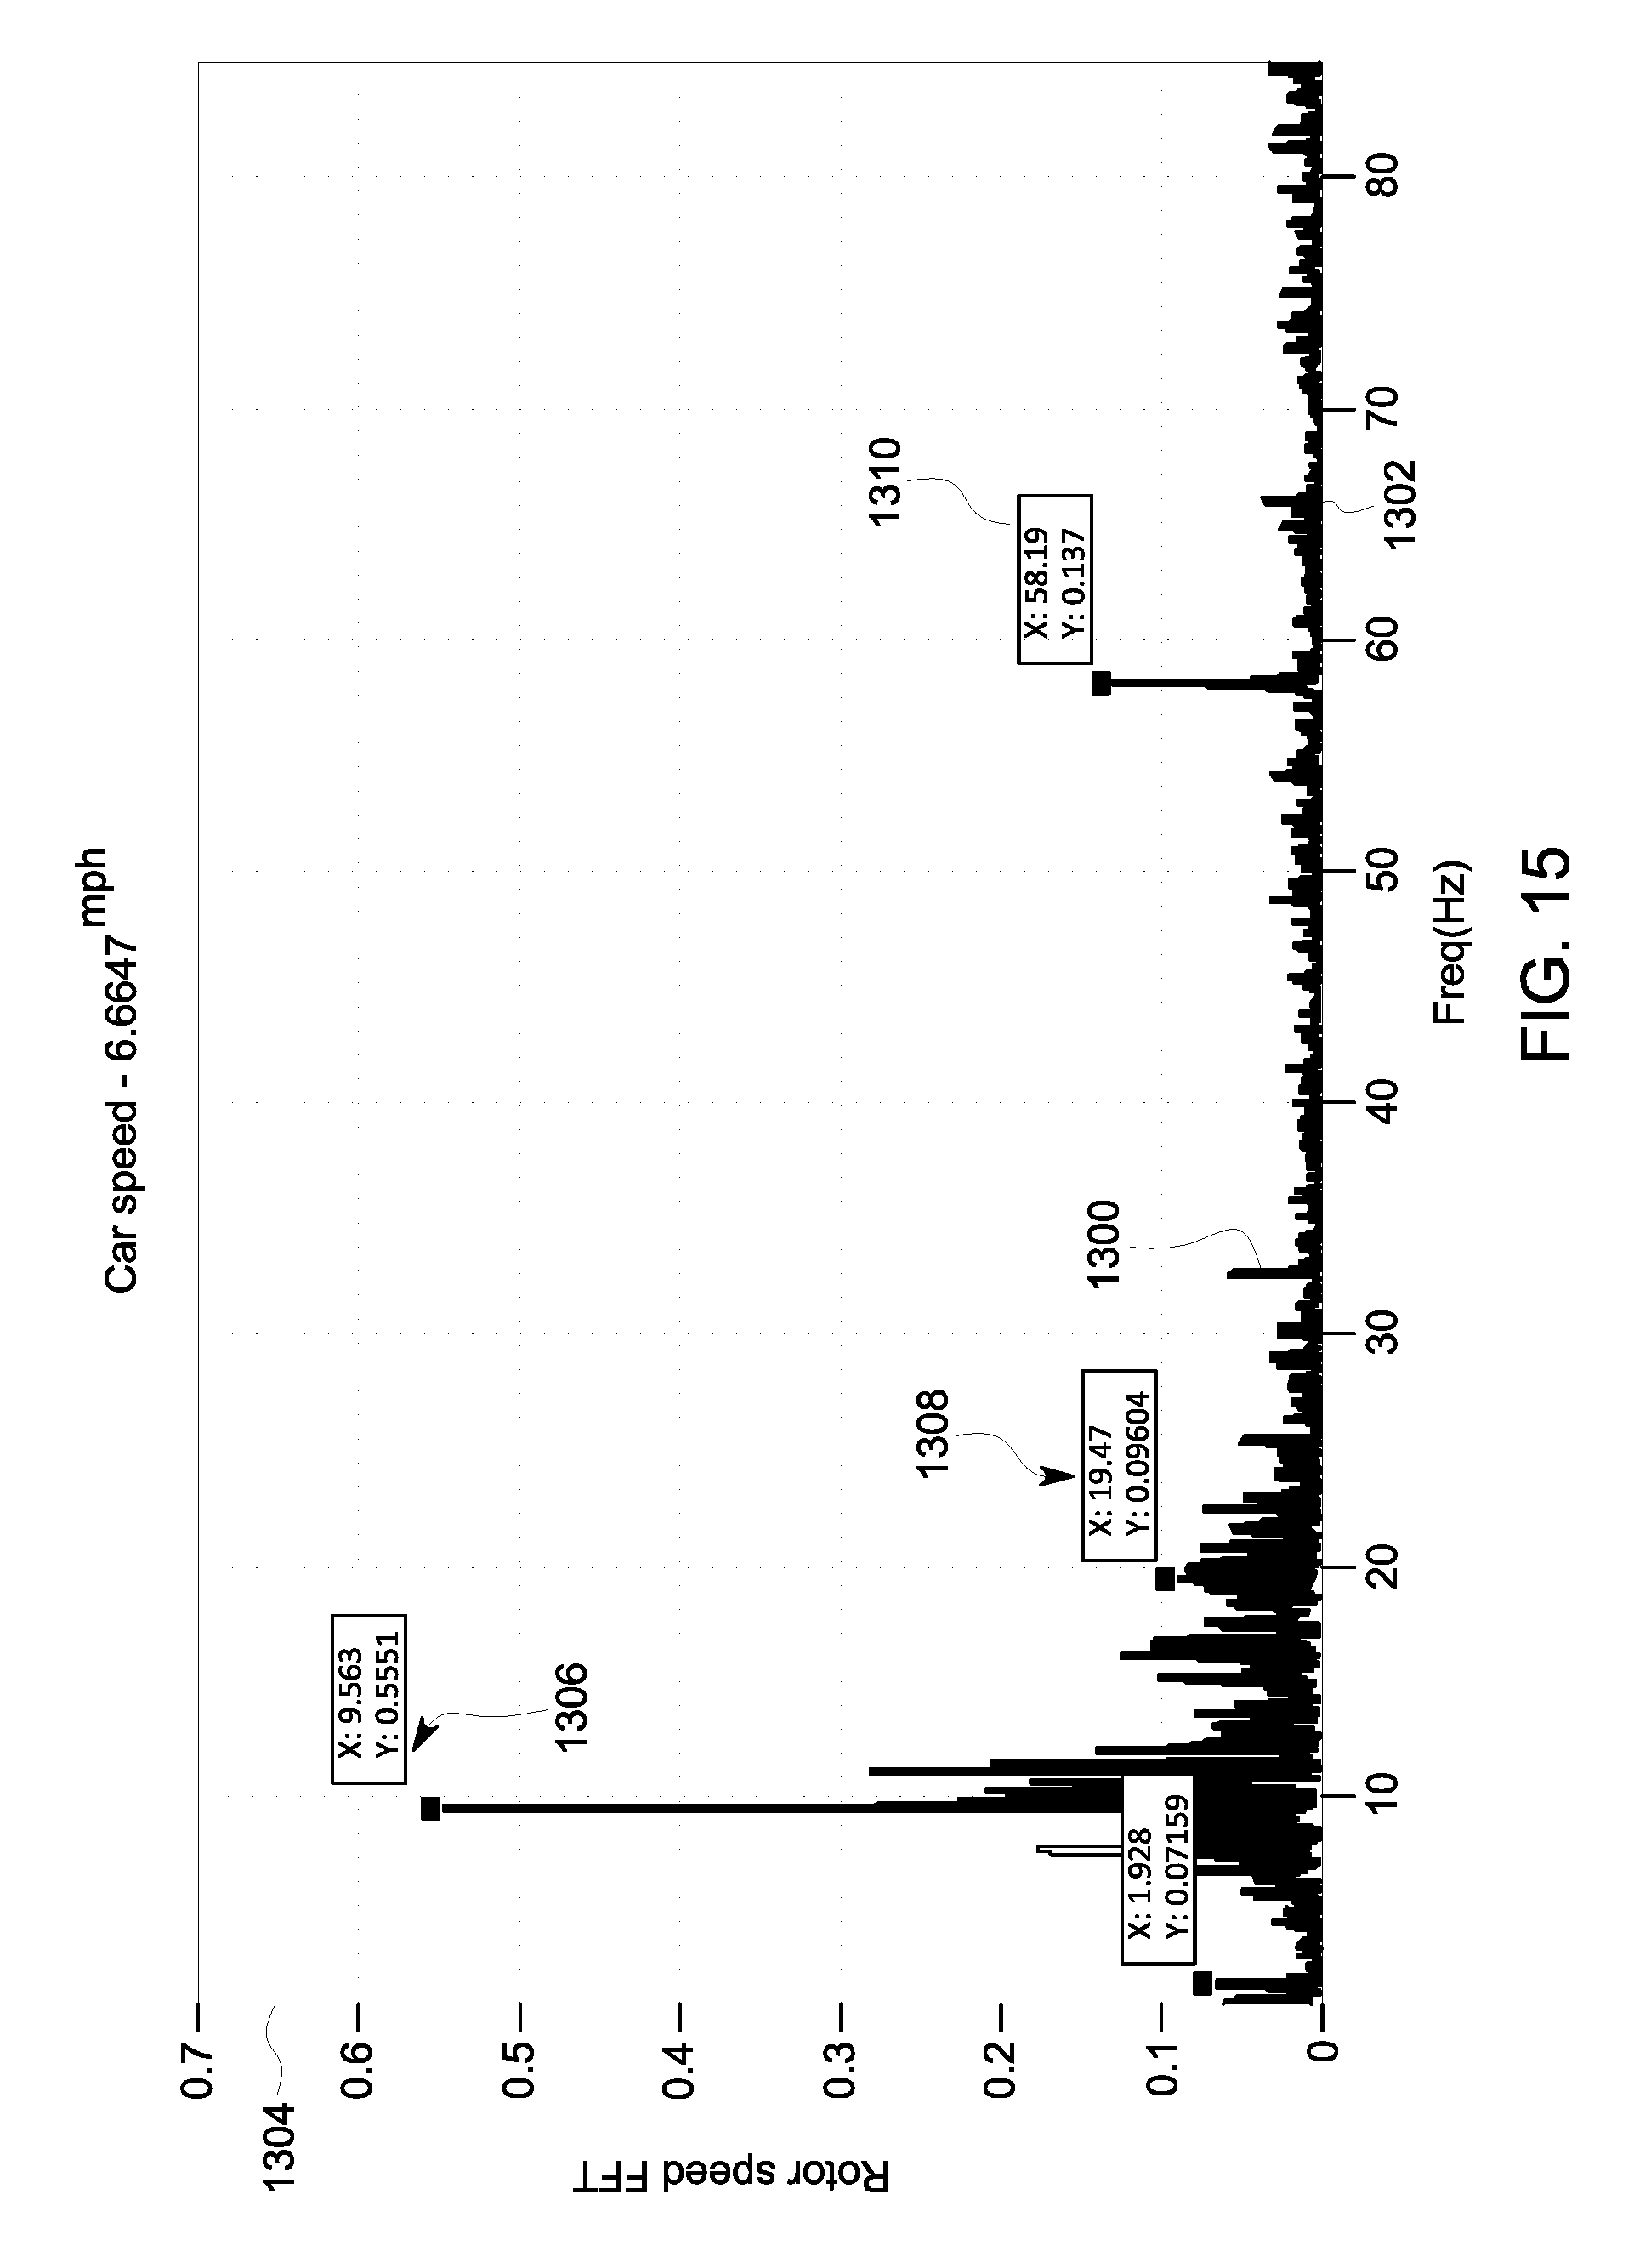
D00014

D00015

D00016

D00017
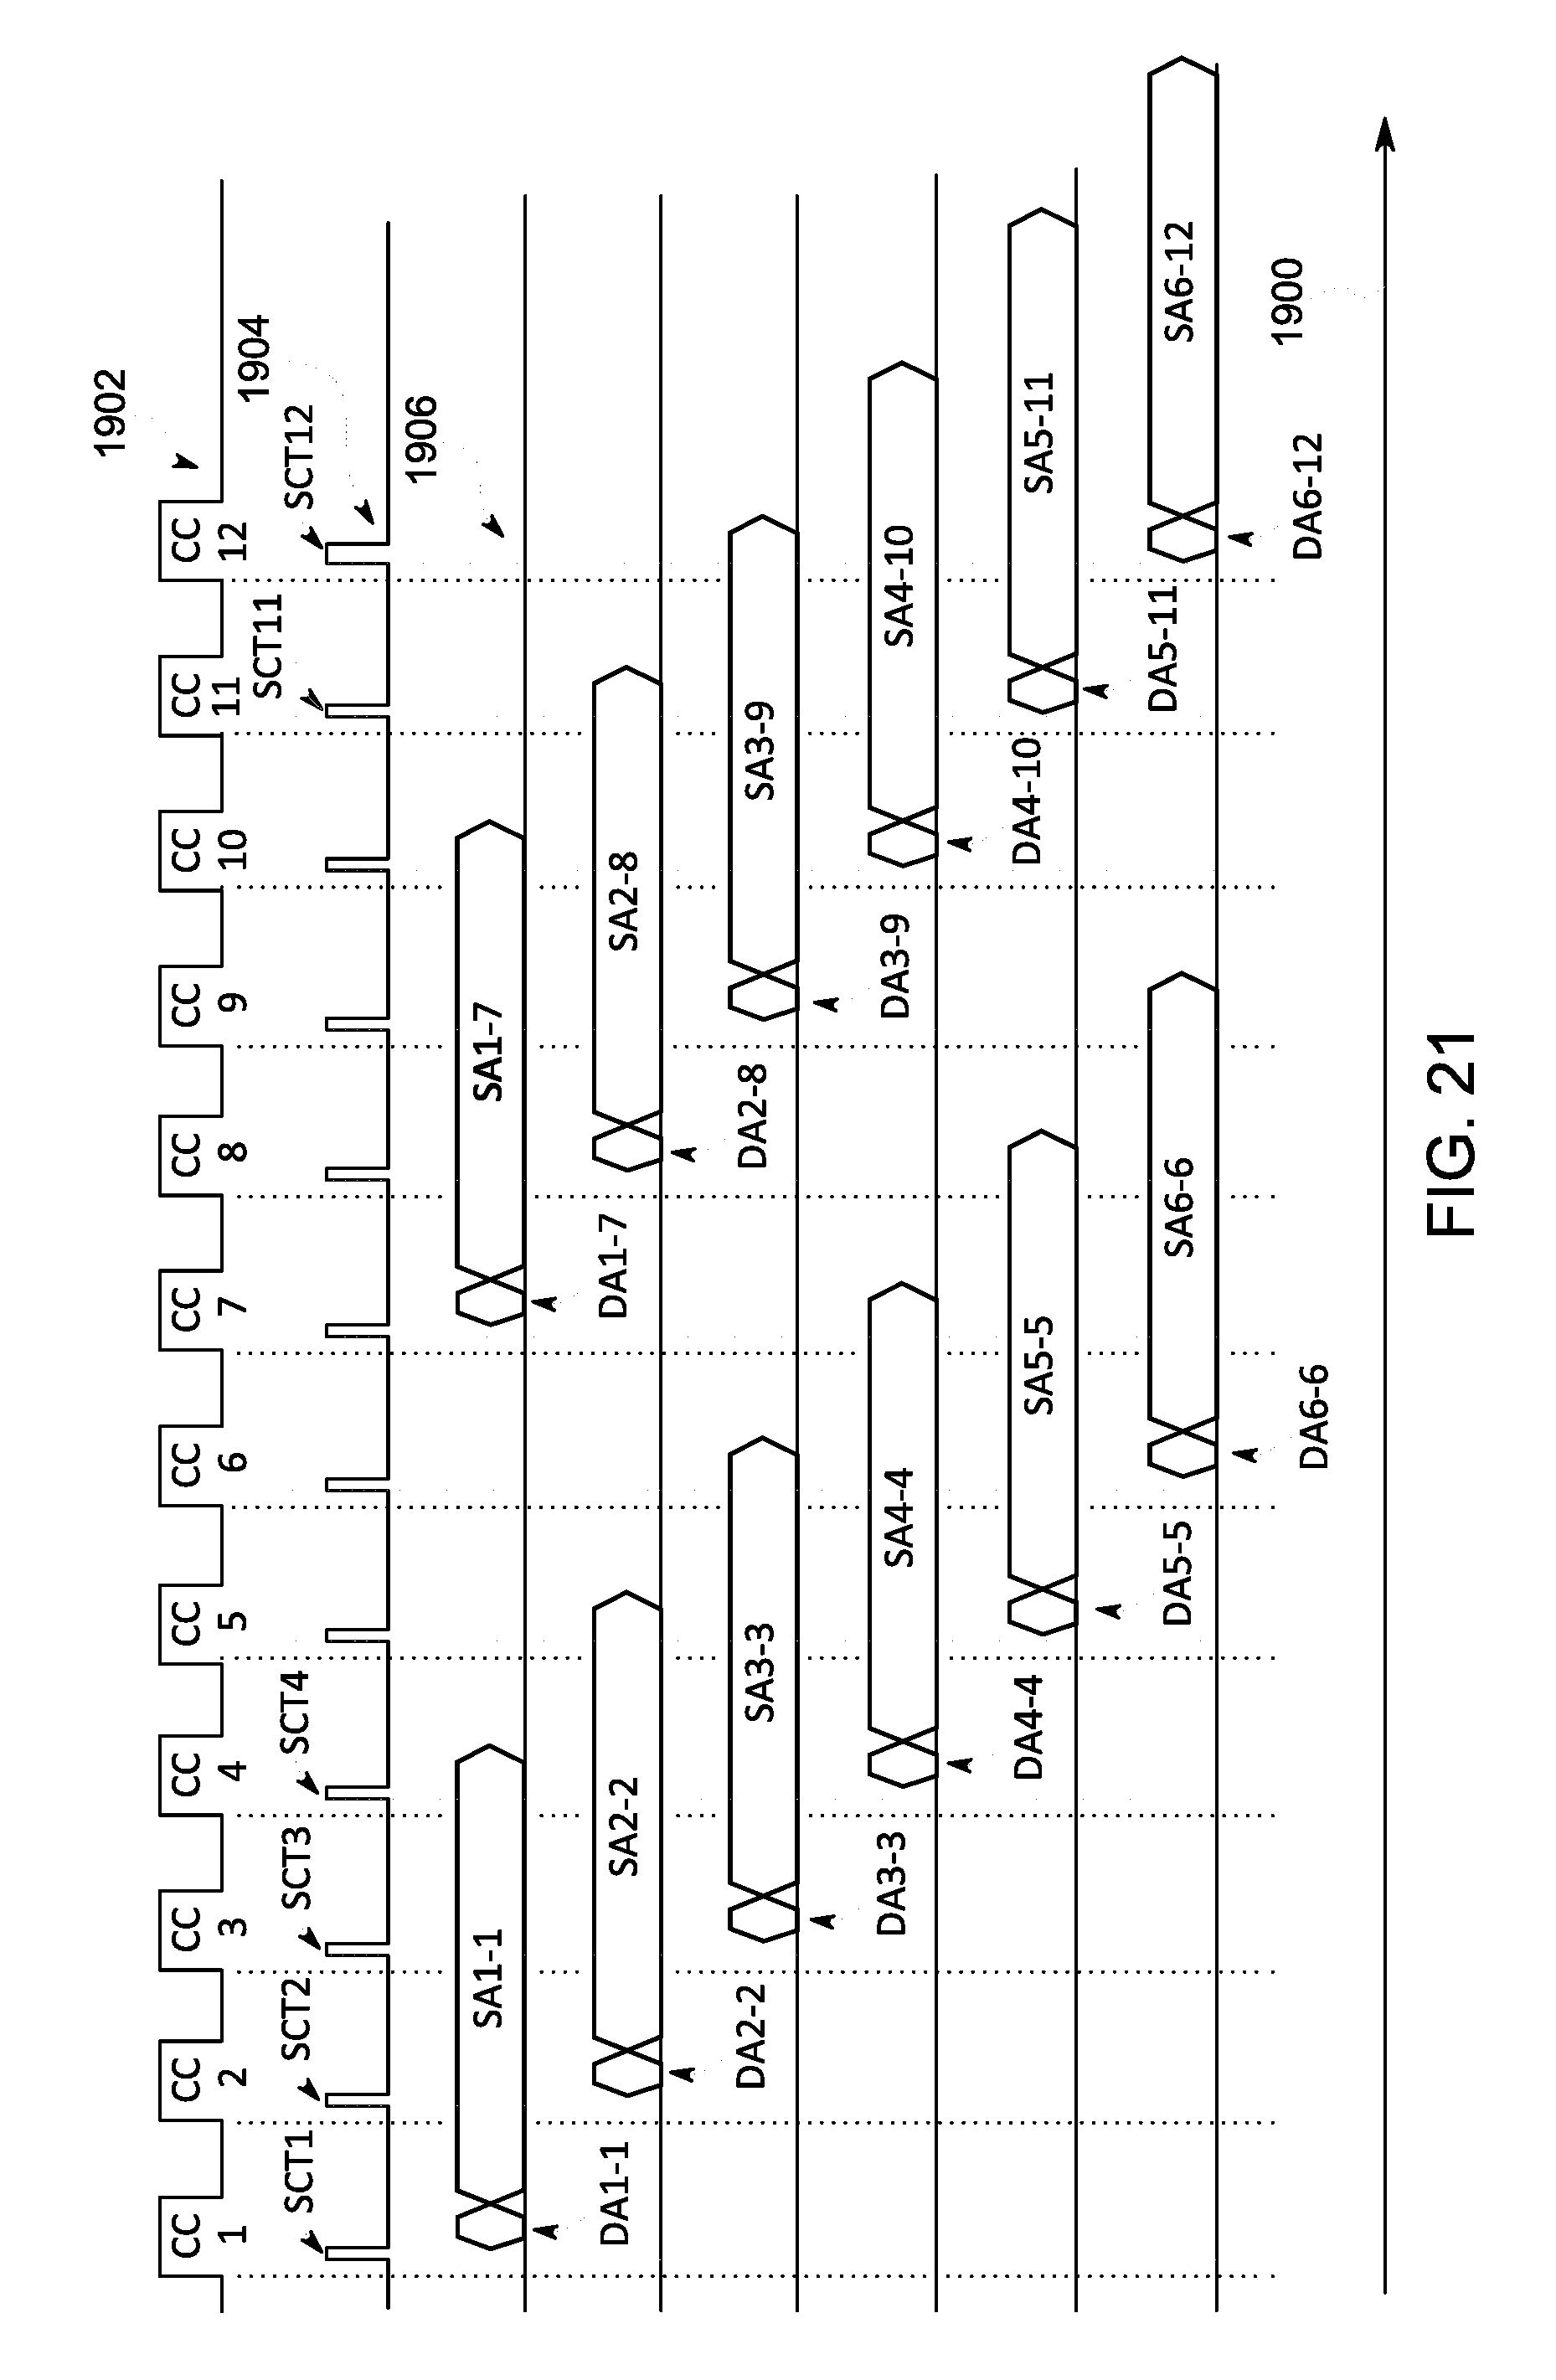
D00018

D00019
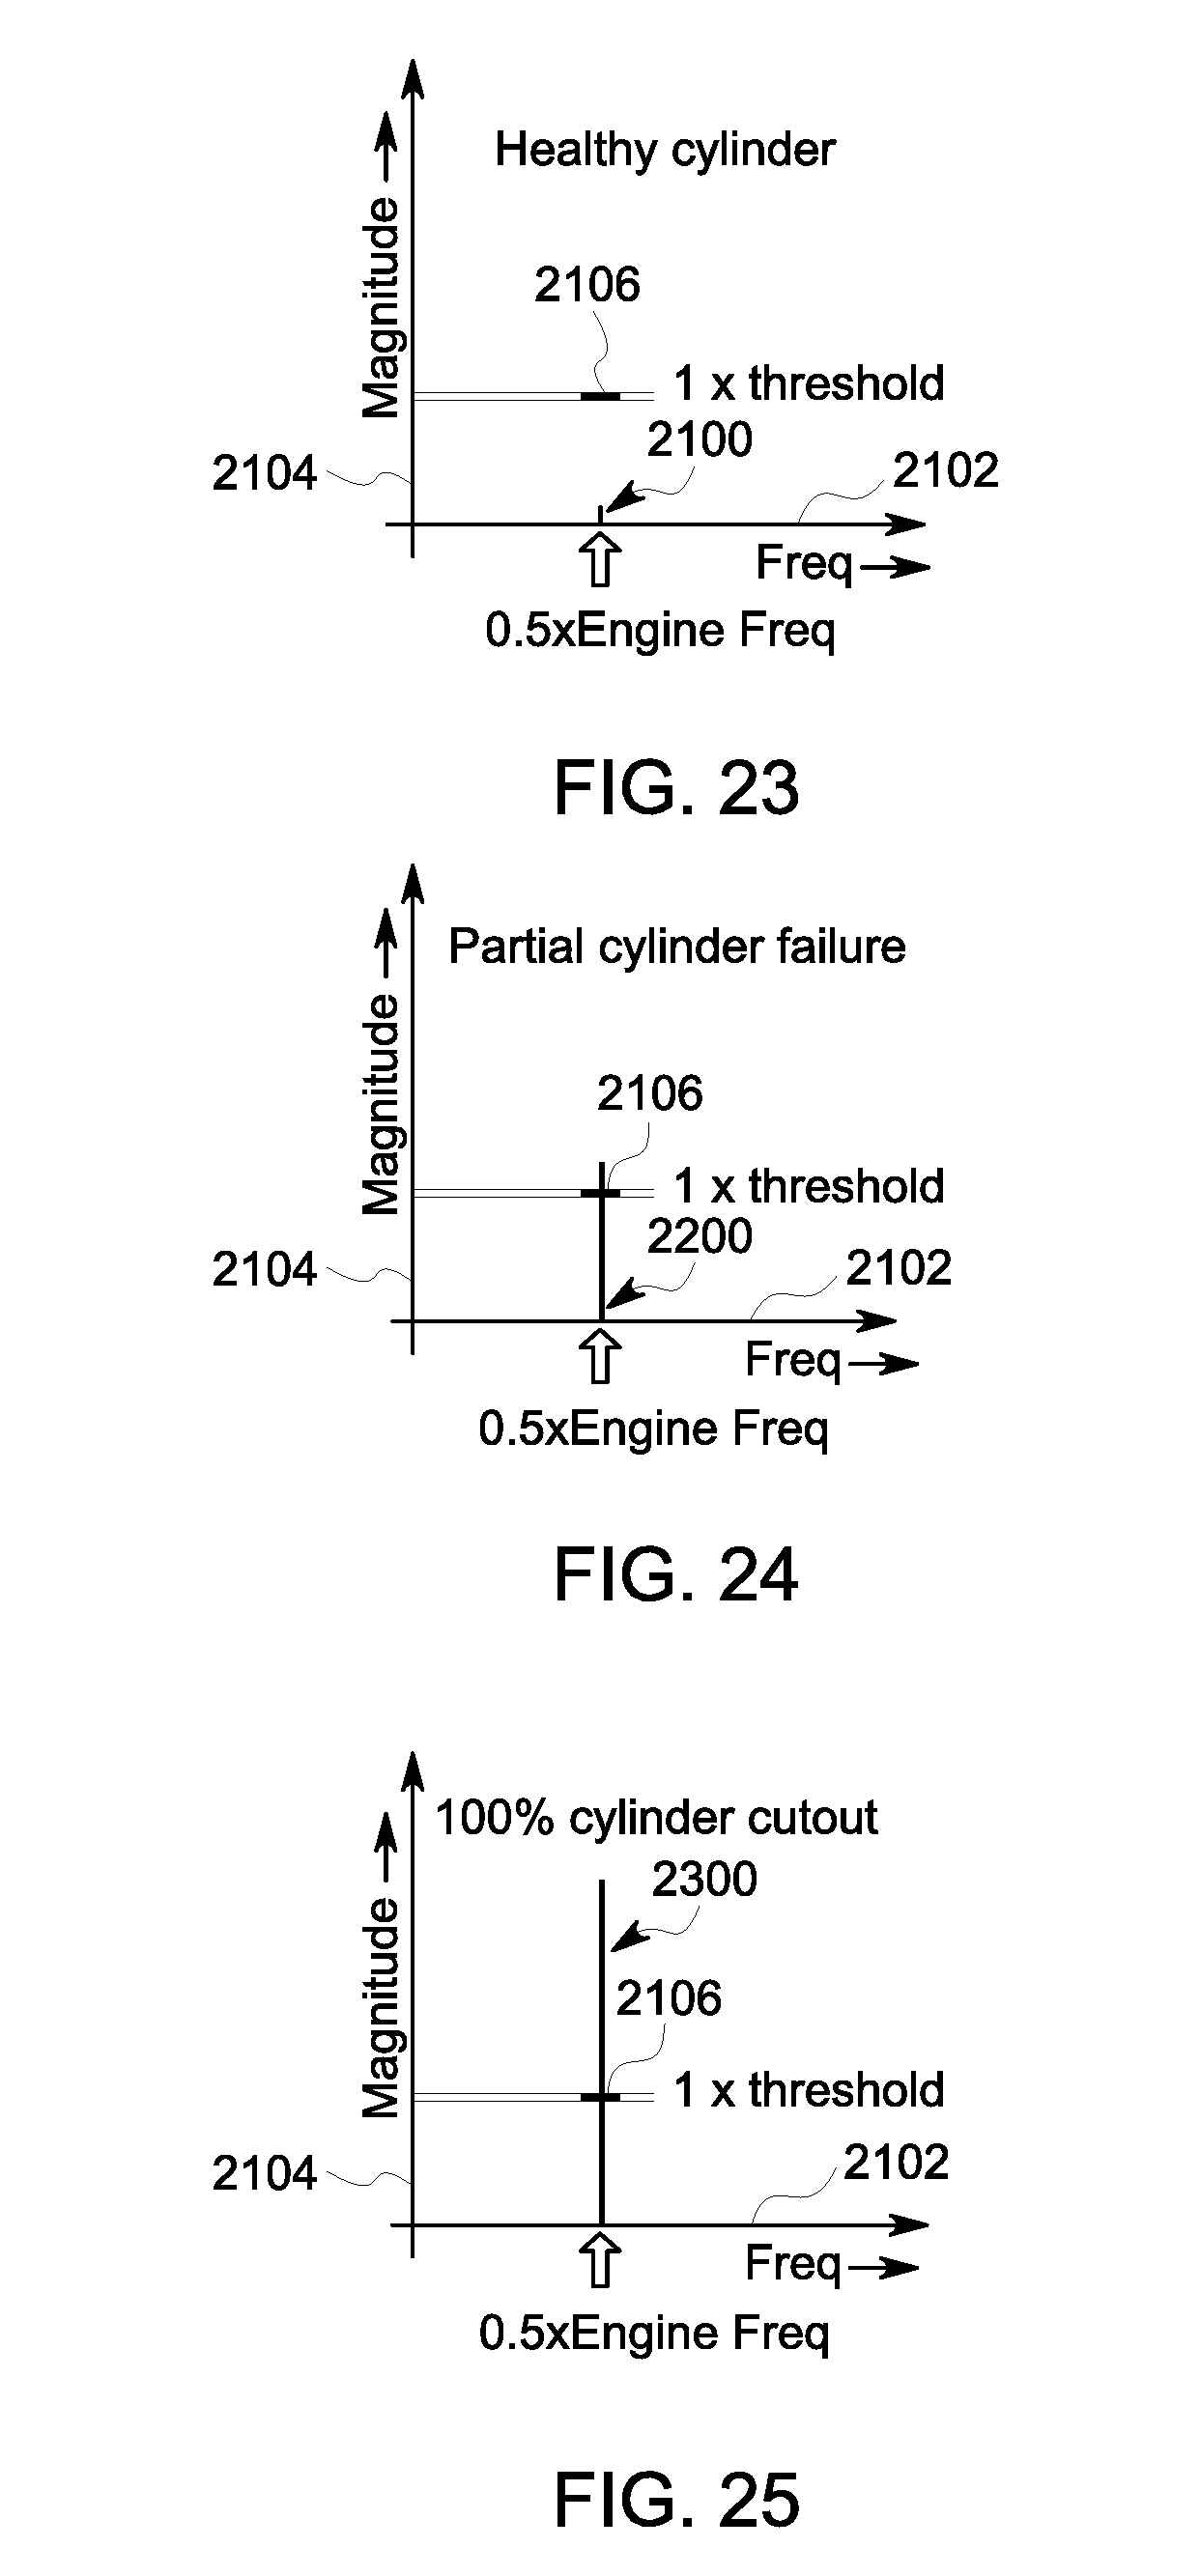
D00020

D00021

XML
uspto.report is an independent third-party trademark research tool that is not affiliated, endorsed, or sponsored by the United States Patent and Trademark Office (USPTO) or any other governmental organization. The information provided by uspto.report is based on publicly available data at the time of writing and is intended for informational purposes only.
While we strive to provide accurate and up-to-date information, we do not guarantee the accuracy, completeness, reliability, or suitability of the information displayed on this site. The use of this site is at your own risk. Any reliance you place on such information is therefore strictly at your own risk.
All official trademark data, including owner information, should be verified by visiting the official USPTO website at www.uspto.gov. This site is not intended to replace professional legal advice and should not be used as a substitute for consulting with a legal professional who is knowledgeable about trademark law.