Marker For The Classification, Diagnosis And Treatment Of Scoliosis
Moreau; Alain ; et al.
U.S. patent application number 16/277565 was filed with the patent office on 2019-06-13 for marker for the classification, diagnosis and treatment of scoliosis. This patent application is currently assigned to Chu Sainte-Justine. The applicant listed for this patent is Chu Sainte-Justine. Invention is credited to Marie - Yvonne Akoume Ndong, Alain Moreau.
| Application Number | 20190178896 16/277565 |
| Document ID | / |
| Family ID | 52627658 |
| Filed Date | 2019-06-13 |


View All Diagrams
| United States Patent Application | 20190178896 |
| Kind Code | A1 |
| Moreau; Alain ; et al. | June 13, 2019 |
MARKER FOR THE CLASSIFICATION, DIAGNOSIS AND TREATMENT OF SCOLIOSIS
Abstract
A method of classifying a subject having idiopathic scoliosis (IS) or at risk of developing IS comprising: determining the cellular response to Gi stimulation in a cell sample from the subject in the presence of OPN; determining the cellular response to Gi stimulation in a cell sample from the subject in the absence of OPN; and comparing the cellular response obtained in the presence of OPN with the cellular response obtained in the absence of OPN, whereby the comparing step enables the classification of the subject into one IS functional group. Also provided is the use of the foregoing method to classify borderline subjects and kits for applying the methods.
| Inventors: | Moreau; Alain; (Montreal, CA) ; Akoume Ndong; Marie - Yvonne; (Montreal, CA) | ||||||||||
| Applicant: |
|
||||||||||
|---|---|---|---|---|---|---|---|---|---|---|---|
| Assignee: | Chu Sainte-Justine Montreal CA |
||||||||||
| Family ID: | 52627658 | ||||||||||
| Appl. No.: | 16/277565 | ||||||||||
| Filed: | February 15, 2019 |
Related U.S. Patent Documents
| Application Number | Filing Date | Patent Number | ||
|---|---|---|---|---|
| 14917757 | Mar 9, 2016 | 10247737 | ||
| PCT/CA2014/050853 | Sep 9, 2014 | |||
| 16277565 | ||||
| 61879314 | Sep 18, 2013 | |||
| 61875162 | Sep 9, 2013 | |||
| Current U.S. Class: | 1/1 |
| Current CPC Class: | C12N 2310/14 20130101; A61K 38/19 20130101; C12N 2320/30 20130101; A61F 5/02 20130101; A61F 5/026 20130101; A61K 31/713 20130101; G01N 33/6893 20130101; G01N 2333/47 20130101; G01N 33/48728 20130101; G01N 2800/10 20130101; G01N 2800/52 20130101; C12N 15/1138 20130101; A61K 31/4045 20130101; A61K 45/06 20130101; A61K 33/04 20130101; G01N 2333/726 20130101; G01N 2800/50 20130101; A61K 31/4045 20130101; A61K 2300/00 20130101; A61K 31/713 20130101; A61K 2300/00 20130101; A61K 33/04 20130101; A61K 2300/00 20130101 |
| International Class: | G01N 33/68 20060101 G01N033/68; A61K 38/19 20060101 A61K038/19; A61K 45/06 20060101 A61K045/06; A61K 31/713 20060101 A61K031/713; A61F 5/02 20060101 A61F005/02; G01N 33/487 20060101 G01N033/487; A61K 33/04 20060101 A61K033/04; C12N 15/113 20060101 C12N015/113; A61K 31/4045 20060101 A61K031/4045 |
Claims
1. A method of classifying a subject having idiopathic scoliosis (IS) or at risk of developing IS or a method of determining the risk of developing IS in a subject comprising: (A) a) contacting a cell sample from the subject with i) an agonist of cluster I or cluster II GiPCR; and ii) Pertussis toxin (PXT); b) determining the cellular response to Gi stimulation; and c) classifying said subject into a IS functional group according to the subject's cellular response profile; or (B) a) contacting a cell sample from the subject with an agonist of a cluster II GiPCR; b) determining the cellular response to Gi protein stimulation by cellular impedance; and c) classifying the subject into a IS functional group according to the subject's cellular impedance profile.
2. The method of claim 1: i. 1(A), wherein step (c) comprises (i) classifying said subject into a first functional group when the cellular response is above the cellular response of a control sample; or (ii) classifying said subject into a second functional group when the cellular response is substantially comparable to the cellular response of a control sample; or ii. 1(B), wherein step (c) comprises: (i) classifying the subject into a first IS functional group when said cellular impedance profile comprises a phase of negative impedance followed by a phase of positive impedance; or (ii) classifying the subject into a second IS functional group when the cellular impedance profile does not comprise a phase of negative impedance.
3. The method of claim 1, wherein said cluster I GiPCR is lysophosphatidic acid receptor (LPAR), melatonin receptor (MT1 or MT2), mu-opioid receptor (OR) or adenosine receptor (AR) or wherein said cluster II GiPCR is cannabinoid receptor (CB2R) or a .alpha.2-Adrenoreceptor (.alpha.2AR).
4. The method of claim 3, wherein said agonist of cluster I GiPCR is melatonin, iodomelatonin, phenylmelatonin, LPA, DAMGO or NECA or wherein said agonist of cluster II GiPCR is CB65 or UK14304.
5. The method of claim 1(A), wherein the cellular response to Gi stimulation is determined by measuring cellular impedance, preferably by cellular dielectric spectroscopy.
6. The method of claim 1, further comprising classifying borderline subjects into one IS functional group by using an alternative classification method, and wherein said alternative classification method is preferably performed prior to step (a).
7. The method of claim 6, wherein the alternative classification method comprises: (i) determining the difference between cellular responses to Gi and Gs protein stimulations in the cell sample from the subject; (ii) determining the magnitude of a cellular response to Gi stimulation in the cell sample relative to a control sample; (iii) measuring cAMP concentration; (iv) determining the phosphorylation state of Gi.alpha. proteins in the cell sample; or (v) determining cellular proliferation of the cell sample relative to a control sample.
8. The method of claim 7, wherein (i) determining the difference between cellular responses to Gi and Gs protein stimulations comprises (i a) measuring cAMP cellular concentration produced by each of Gi and Gs protein stimulations; (i b) measuring cellular impedance, wherein said cellular impedance is preferably measured by cellular dielectric spectroscopy (CDS); (i c) determining the .DELTA.G in the sample from the subject; or (i d) by determining a ratio between cellular responses to Gi and Gs protein stimulations (Gi/Gs).
9. The method of claim 8, wherein: in (i c) the .DELTA.G is determined by measuring cellular impedance and the cellular impedance is measured by CDS, and wherein i) a .DELTA.G below -10 is indicative that the subject belongs to IS functional group FG1; ii) a .DELTA.G above -10 and below +10 is indicative that the subject belongs to IS functional group FG2; and iii) a .DELTA.G above +10 is indicative that the subject belongs to IS functional group FG3; or in (i d) i) a ratio below about 0.5 is indicative that the subject belongs to IS functional group FG1; ii) a ratio between about 0.5 and 1.5, is indicative that the subject belongs to IS functional group FG2; and iii) a ratio above 1.5 is indicative that the subject belongs to IS functional group FG3.
10. The method of claim 7, wherein: in (ii):(ii a) a reduction of between about 60-90% of the cellular response to Gi stimulation relative to control is indicative that the subject belongs to IS functional group FG1; (ii b) a reduction of between about 40-60% of the cellular response to Gi stimulation relative to control is indicative that the subject belongs to IS functional group FG2; and (ii c) a reduction between about 10-40% of the cellular response to Gi stimulation relative to control is indicative that the subject belongs to IS functional group FG3; in (iii):(iii a) an increase in cAMP concentration relative to baseline is indicative that the subject belongs to IS functional group FG1, (iii b) no significant or weak reduction in cAMP concentration relative to baseline is indicative that the subject belongs to IS functional group FG2; and (iii c) a reduction in cAMP concentration relative to baseline is indicative that the subject belongs to IS functional group FG3; in (iv): (iv a) an increase in the level of serine phosphorylated Gi.alpha.1, Gi.alpha.2 and Gi.alpha.3 proteins as compared to a control sample is indicative that the subject belongs to IS functional group FG1; (iv b) an absence of serine phosphorylation in Gi.alpha.3 proteins or a level of serine phosphorylation on Gi.alpha.3 proteins comparable or lower to the level of serine phosphorylation in Gi.alpha.3 proteins in a control sample is indicative that the subject belongs to IS functional group FG2; and (iv c) an absence of serine phosphorylation in Gi.alpha.1 proteins or a level of serine phosphorylation on Gi.alpha.1 proteins comparable to the level of serine phosphorylation in Gi.alpha.1 proteins in a control sample is indicative that the subject belongs to IS functional group FG3; or in (v): (v a) a reduction in cellular proliferation of about 50% or more relative to control is indicative that the subject belongs to IS functional group FG1; (v b) a reduction in cellular proliferation between about 25% and 45% relative to control is indicative that the subject belongs to IS functional group FG2; and (v c) a reduction in cellular proliferation of about 25% or less relative to control is indicative that the subject belongs to IS functional group FG3.
11. The method of claim 10, wherein in (ii), the magnitude of a cellular response to Gi stimulation is determined by measuring cellular impedance, preferably by cellular dielectric spectroscopy (CDS).
12. A method of selecting a preventive measure, treatment or follow-up schedule for a subject suffering from IS or at risk of developing IS comprising classifying the subject using the method as defined in claim 1; wherein a) when the subject is classified as belonging to the FG1 functional group: i) the level of OPN in said subject is increased; ii) the level of HA in said subject is increased; iii) the level of CD44 in said subject is decreased; and/or iv) the frequency of assessment of scoliosis progression is decreased; b) when the subject is classified as belonging to the FG2 functional group: i) the level of OPN is said subject is decreased; ii) the level of HA in said subject is decreased; and/or iii) the level of CD44 in said subject is increased; iv) the frequency of assessment of scoliosis progression is increased; and/or v) the subject is prescribed corrective surgery prior to reaching a scoliosis with a cobb angle of 45 degree; c) when the subject is classified as belonging to the FG3 functional group: i) the level of OPN is said subject is decreased; ii) the level of HA in said subject is decreased; iii) the level of CD44 in said subject is increased; and/or v) the frequency of assessment of scoliosis progression is decreased.
13. The method of claim 12, wherein: (aa) increasing the level of OPN comprises administering OPN; applying pulsative compressive pressure to a body part of the subject or applying low intensity pulsed ultrasound to a body part of the subject; (bb) increasing the level of HA comprises administering to the subject HA supplements or complying to a HA-rich diet and wherein decreasing the level of HA comprises complying to a HA-poor diet; (cc) decreasing OPN level comprises brace treatment, accupoint heat sensitive moxibustion, heat therapy with pad, thermal bath, electroacupuncture, administering melatonin, administering selenium or administering PROTANDIM; or (dd) decreasing the frequency of assessment of scoliosis progression comprises performing less than 22 radiological examinations within 3 years following classification.
14. The method of claim 1, wherein (i) the subject is a subject pre-diagnosed with IS; (ii) the subject is asymptomatic; and/or (iii) the subject has at least one family member suffering from IS.
15. The method of claim 1, wherein the cell sample comprises osteoblasts, chondrocytes, myoblasts and/or peripheral blood mononuclear cells (PBMCs), preferably fresh PBMCs comprising lymphocytes.
16. The method of claim 1, wherein said Gi stimulation further comprises contacting the cell with GP Ant-2.
17. The method of claim 7, wherein the Gs stimulation comprises contacting the cells with isoproterenol.
18. A kit for classifying a subject having idiopathic scoliosis (IS) or at risk of developing IS or for predicting the risk of developing IS comprising: (A) a) Pertussis toxin (PTX); and b) a cluster I GiPCR and/or a cluster II receptor agonist; and optionally, (B) c) a ligand for Gs stimulation; d) one or more antibodies for detecting Gi.alpha. phosphorylation; and/or e) instructions for classifying the subject or for predicting the risk of developing IS.
19. The kit of claim 18, wherein the cluster I GiPCR is lysophosphatidic acid receptor (LPAR), mu-opioid receptor (OR) or adenosine receptor (AR) or melatonin receptor and the cluster II GiPCR is cannabinoid receptor (CB2R) or a .alpha.2-Adrenoreceptor (.alpha.2AR), and/or wherein the agonist is melatonin, iodomelatonin, phenylmelatonin, LPA, DAMGO, NECA, CB65 or UK14304.
20. A composition for classifying a subject having idiopathic scoliosis (IS) or at risk of developing IS or for determining the risk of developing IS in a subject comprising: (A) a) cell sample from the subject; b) Pertussis toxin (PTX); and c) a cluster I GiPCR and/or a cluster II GiPCR agonist; and optionally, (B) d) a ligand for Gs stimulation; and/or e) one or more antibodies for detecting Gi.alpha. phosphorylation.
21. The composition of claim 20, wherein the cluster I GiPCR is LPAR, OR, A1R or melatonin receptor and the cluster II GiPCR is CB2R or .alpha.2AR, and/or wherein the agonist is melantonin, iodomelatonin, phenylmelatonin, LPA, DAMGO, NECA, CB65 or UK14304.
Description
CROSS-REFERENCE TO RELATED APPLICATIONS
[0001] This application is a divisional application of U.S. application Ser. No. 14/917,757 filed on Sep. 9, 2014, now allowed, which is a National Phase Entry of PCT application Ser. No. PCT/CA2014/050853 filed on Sep. 9, 2014 and published in English under PCT Article 21(2), which itself claims benefit of U.S. provisional application Ser. No. 61/875,162, filed on Sep. 9, 2013 and of U.S. provisional application Ser. No. 61/879,314, filed on Sep. 18, 2013. All documents above are incorporated herein in their entirety by reference.
FIELD OF THE INVENTION
[0002] The present invention relates to markers for idiopathic scoliosis diagnosis and prognosis. More specifically, the present invention is concerned with methods of identifying subjects at risk of developing scoliosis and methods of classifying subjects having or at risk of developing scoliosis according to their GiPCR mediated cellular responses in the presence of osteopontin (OPN).
BACKGROUND OF THE INVENTION
[0003] Idiopathic Scoliosis (IS) (e.g., Infantile Idiopathic Scoliosis, Juvenile Idiopathic Scoliosis or Adolescent Idiopathic Scoliosis (AIS)) is a spine deformity of unknown cause generally defined as a lateral curvature greater than 10 degrees accompanied by a vertebral rotation.sup.1. The condition affects 4% of the paediatric population and is most commonly diagnosed between the ages of 9 to 13 years.sup.2,3,4. The diagnosis is primarily of exclusion and is made only after ruling out other causes of spinal deformity such as vertebral malformation, neuromuscular or syndromic disorders. Traditionally, the trunkal asymmetry is revealed by Adams forward bending test and measured with scoliometer during physical examination.sup.5. The diagnosis can then be confirmed by radiographic observation of the curve and the angle measurement using the Cobb method.sup.6.
[0004] Once diagnosed, the primary concern for physicians in managing scoliotic children is whether the curve will progress. Indeed, the curve progression is often unpredictable and is more frequently observed among girls than in boys.sup.7. If untreated, the curve can progress dramatically, creating significant physical deformity and even cardiopulmonary problems. These manifestations become life threatening when the curve exceeds 70 degrees.sup.8,9. The current treatment options to prevent or stop curve progression include bracing and surgery. In general, bracing is recommended for curves between 25 and 40 degrees, while surgery is reserved for curve greater than 45 degrees or curves that are unresponsive to bracing.
[0005] Today in the United States there are approximately one million children between ages 10 and 16 with some degree of IS and about 100 000 children in Canada are diagnosed with IS. The total cost of diagnosis and monitoring of the scoliotic children by X-ray exposure is over $2.5 billion dollars annually in North America. Approximately, 10% of children diagnosed with idiopathic scoliosis have curve progression requiring corrective surgery.sup.10. About 29,000 scoliosis surgeries are done every year in North America, resulting in significant psychological and physical morbidity.
[0006] Currently, there is no approved method or test available to identify subjects at risk of developing IS or to predict which affected individuals will show a curve progression that will require surgery. Therefore, the application of current treatments, such as bracing or surgical correction, is delayed until a significant deformity is detected or until a significant progression is clearly demonstrated, resulting in a delayed, less than optimal treatment and often important psychological sequels (Scoliosis Research Society) Morbidity & Mortality Committee annual Report 1997). All diagnosed children are subjected to multiple radiographs over several years, usually until they reach skeletal maturity. It is estimated that the typical patients with scoliosis will have approximately 22 radiological examinations over a 3-year period.sup.11. Because of the potential risk of multiple radiographic examinations, the alternative approaches that could allow performing the prognosis of idiopathic scoliosis without exposing children to ionizing radiation are strongly desirable.
[0007] The major limitation in developing prognostic tests that could facilitate treatment choices for patients is the heterogeneous nature of IS. At the clinical level, the heterogeneity of IS is clearly illustrated by the variability of curve patterns, localisations and curve magnitude even in families with multiple affected members. In absence of reliable IS phenotypes, there is a need to understand better the molecular changes associated with disease onset and spinal deformity progression. Molecular definition of disease is rapidly replacing traditional pathology-based disease descriptions in part because of its utility in identifying the optimal treatment regimen for patients.
[0008] In this regard, the present inventors have previously discovered that scoliotic patients and subjects at risk of developing scoliosis are less responsive to Gi protein (inhibitory guanine nucleotide binding protein in G protein coupled receptors (GPCRs) also known as G.sub.i alpha subunit) stimulation when compared with healthy control subjects. The presence of a general differential Gi-signaling dysfunction allowed to stratify/classify patients into three functional groups (FG1, FG2 and FG3) representing distinct biological endophenotypes. This impairment was detected in all cell types tested including bone-forming cells; muscle-forming cells and blood cells (e.g., PBMCs). Furthermore, because the response impairment is generalized and not specific to a particular receptor, any Gi-PCR agonist can be used to classify subjects.
[0009] A first classification method is based on the percentage of degree of reduction (inhibitory response) relative to control group. The classification ranges were fixed between about 10 and 40% (or below 40%) of reduction of response relative to control group for FG3, about 40 and 60% for FG2 and above about 60% (e.g., between about 60% and 90%) for FG1. The same the classification ranges can be expressed as the percentage of maximal response relative to the control (as opposed to the % of reduction of response relative to the control). In such a case, the ranges are fixed between about 10-40% for FG1, about 40 and 60% for FG2 and about 60-90% for FG3. Both classification ranges can be used interchangeably (See Moreau et al., 2004; Akoume et al., 2010; Azeddine et al., 2007; Letellier et al., 2008; WO2003/073102, WO2010/040234 to Moreau, which are incorporated herein by reference in their entirety).
[0010] More recently, the present inventors have modified this approach by demonstrating that the three functional groups can clearly be distinguished according to the profile of imbalance between response to Gi and Gs stimulation (i.e. Gi response minus Gs response or Gi/Gs-See PCT/CA2014/050562, which is incorporated herein by reference). It was found that the response to Gi stimulation predominated in FG3, while no substantial imbalance (or a very small imbalance) was observed in FG2. In contrast, FG1 exhibited predominance for response to Gs stimulation. In addition, evidence was provided to the effect that patients belonging to the FG2 endophenotype are more at risk of progressing to the point of needing surgery.sup.17.
[0011] The differences in Gi-mediated cellular response observed among the three endophenotypes is (at least partly) a consequence of differences observed at the level of Gi protein phosphorylation. When Gi.alpha. proteins are phosphorylated they become inactive. The inventors have shown that the degree of serine phosphorylation of Gi.alpha. proteins can alternatively be used to classify subjects into a specific functional group. In FG1 subjects, all Gi.alpha. proteins (Gi.alpha.1-3) are phosphorylated and their level of serine phosphorylation is substantially higher than in control subjects. In FG2 Gi.alpha.1 and Gi.alpha.2 are phosphorylated, the level of Gi.alpha.1 and Gi.alpha.2 phosphorylation is higher than in control subjects and most Gi.alpha.3 proteins are not phosphorylated and thus, remain functional. Finally, in FG3 subjects Gi.alpha.2 and Gi.alpha.3 are phosphorylated, their level of phosphorylation is higher than in control subjects and most Gi.alpha.1 are not phosphorylated and thus remain functional.sup.18.
[0012] The assessment of an imbalance between Gi and Gs coupled receptor signaling (as opposed to the assessment of a Gi-coupled receptor signaling impairment), greatly simplifies the risk assessment and endophenotype (functional group) assessment by eliminating the need of a reference signal from a control subject. The establishment of a reference signal is often difficult and may sometimes constitute an obstacle because the control subject(s) from whom the reference signal is derived should preferably match with age, gender and medication, if any.
[0013] Although the methods of diagnosing subjects suffering from scoliosis or at risk of developing scoliosis described above provide significant advantages, certain subjects are more difficult to classify into a functional group (FG1, FG2 or FG3) because their response to Gi stimulation or degree of Gi/Gs imbalance approaches the cut-off values defined for the classification. Furthermore, determining the phosphorylation level/pattern of Gi.alpha. proteins may be more difficult to implement in a clinical setting. Therefore, there is a need for novel alternative or complementary methods for classifying subjects having diseases involving spinal deformities (e.g., scoliosis, such as IS) and for diagnosing a predisposition to scoliosis.
[0014] The present description refers to a number of documents, the content of which is herein incorporated by reference in their entirety.
SUMMARY OF THE INVENTION
[0015] Accordingly, there are provided novel alternative methods of identifying subjects at risk of developing IS and of classifying IS subjects into a specific IS functional group. The methods can be used alone or in combination with one or more previous methods to increase the specificity of the functional group identification which in turn can increase the specificity and sensitivity of risk prediction and/or facilitate/improve the application of preventive or treatment measures. Once a subject is identified as belonging to a given functional group, treatment and preventive measures can be adapted to his/her specific endophenotype.
[0016] Applicants demonstrate herein for the first time a differential effect of osteopontin (OPN) on the response to Gi stimulation among functional groups in IS. Subjects suffering from IS can be classified into a particular functional group based on their Gi mediated response to OPN. Furthermore, subjects at risk of developing IS may also be identified and classified. Indeed, it was found that in the presence of OPN, the response to Gi stimulation increases in FG1, while it decreases in FG2 and FG3. Furthermore, the response to Gi stimulation decreases to a higher extent in the FG2 than in the FG3 functional group.
[0017] In a second aspect, Applicants show herein that IS subjects or subjects at risk of developing IS can be classified according to their impedance signature (i.e., the shape of their impedance curve) in response to GiPCR stimulation with four Gi-coupled receptor clusters (GiPCR clusters). By using cluster II GiPCR agonists (e.g., agonists to the CB2R .alpha.2AR, .alpha.2BR and .alpha.2C receptors), it is possible to rapidly distinguish subjects belonging to the FG1 functional group over those belonging to the FG2 and FG3 functional groups. Indeed, subjects belonging to the FG1 group show a characteristic negative impedance phase in response to Gi-PCR cluster II stimulation, which is not present for subjects belonging to the FG2 and FG3 groups. Hence, this method can also be useful to identify or classify subjects which are difficult to identify or classify using other methods such as subjects which have a Gi cellular response considered to be borderline between two groups.
[0018] In a third aspect, the present inventors have found that IS subjects or subjects at risk of developing IS can also be classified according to their Gi-mediated response in the presence of inhibitors/antagonists of Gi proteins such as Pertussis Toxin (PTX) and GP Ant-2, which inactivates Gi/G.sub.o proteins. The IC50 value for GP Ant-2 is smaller for FG1 subjects than for FG3 subjects. FG2 subjects have an IC50 value for GP-Ant 2 which is between that of FG1 and FG3 subjects. Similar results were obtained with the G-protein antagonist PTX, although the differences were less important. Unexpectedly, at high concentrations of PTX subjects belonging to the FG1 functional group can also be rapidly distinguished over FG2 and FG3 subjects based on their response to cluster I and/or cluster II GiPCR agonists. Indeed, at high PTX concentrations, stimulation by cluster I or cluster II agonists results in a cellular response which is substantially higher than the response observe in FG2 and FG3 subjects (as opposed to a lower/decreased response normally observed at lower concentrations of PTX). This difference/shift in the FG1 response was not observed with the GP Ant-2 antagonist.
[0019] Accordingly, in an aspect there is provided a method of classifying a subject having idiopathic scoliosis (IS) or at risk of developing IS comprising: (a) determining the cellular response to Gi stimulation in a cell sample from the subject in the presence of OPN; (b) determining the cellular response to Gi stimulation in a cell sample from the subject in the absence of OPN; and (c) comparing the cellular response obtained in the presence of OPN with the cellular response obtained in the absence of OPN, whereby the comparing step enables the classification of the subject into one IS functional group.
[0020] In a specific embodiment of the method, an increase in cellular response following Gi-stimulation in the presence of OPN in the sample is indicative that the subject belongs to functional group FG1; and wherein a decrease in cellular response following Gi-stimulation in the presence of OPN is indicative that the subject belongs to functional group FG2 or FG3.
[0021] In another specific embodiment, step (c) comprises determining the Fold effect (Fe) of OPN on the cellular response to Gi stimulation. In another specific embodiment, a Fe value above about 100% is indicative that the subject belongs to IS functional group FG1; a Fe value below about 50% is indicative that the subject belongs to IS functional group FG2 and a Fe value below about 95% and above about 50% is indicative that the subject belongs to IS functional group FG3. In another specific embodiment, the method is used to classify subjects found to be borderline according to a previously used alternative classification method, into one IS functional group.
[0022] The present invention also concerns a method of classifying a subject having idiopathic scoliosis (IS) or at risk of developing IS comprising: (a) contacting a cell sample from the subject with i) an agonist of cluster I or cluster II GiPCR; and ii) Pertussis toxin (PXT); (b) Determining the cellular response to Gi stimulation; and (c) Classifying the subject into a IS functional group according to the subject's cellular response profile. In an embodiment, step (c) comprises (i) classifying the subject into a first functional group when the cellular response is above the cellular response of a control sample; or (ii) classifying the subject into a second functional group when the cellular response is substantially comparable to the cellular response of a control sample. In an embodiment, the cluster I GiPCR is lysophosphatidic acid receptor (LPAR), melatonin receptor (MT1 or MT2), mu-opioid receptor (OR) or adenosine receptor (AR). In an embodiment, the agonist is melatonin, iodomelatonin, phenylmelatonin, LPA, DAMGO or NECA. In a particular embodiment, the cluster II GiPCR is cannabinoid receptor (CB2R) or a .alpha.2-Adrenoreceptor (.alpha.2AR). In an embodiment, the agonist is CB65 or UK14304.
[0023] In another specific embodiment of the above methods, the cellular response to Gi stimulation is determined by measuring cellular impedance. In another specific embodiment, the cellular impedance is measured by cellular dielectric spectroscopy.
[0024] The present invention further provides a method of classifying a subject having idiopathic scoliosis IS or at risk of developing IS comprising: (a) contacting a cell sample from the subject with an agonist of a cluster II GiPCR; (b) determining the cellular response to Gi protein stimulation by cellular impedance; and (c) classifying the subject into a IS functional group according to the subject's cellular impedance profile. In an embodiment, step (c) comprises: (i) classifying the subject into a first IS functional group when the cellular impedance profile comprises a phase of negative impedance followed by a phase of positive impedance; and (ii) classifying the subject into a second IS functional group when the cellular impedance profile does not comprise a phase of negative impedance. In an embodiment the cluster II GiPCR is cannabinoid receptor (CB2R) or a .alpha.2-Adrenoreceptor (.alpha.2AR). In an embodiment, the agonist is CB65 or UK14304.
[0025] In another specific embodiment, the methods of the present invention further comprise classifying borderline subjects into one IS functional group by using an alternative classification method. In another specific embodiment, the alternative classification method is performed prior to step (a) of the method.
[0026] In another specific embodiment, the alternative classification method comprises determining the difference between cellular responses to Gi and Gs protein stimulations in the cell sample from the subject. In another specific embodiment, determining the difference between cellular responses to Gi and Gs protein stimulations comprises measuring cAMP cellular concentration produced by each of Gi and Gs protein stimulations.
[0027] In another specific embodiment, determining the difference between cellular responses to Gi and Gs protein stimulations comprises measuring cellular impedance. In another specific embodiment, the cellular impedance is measured by cellular dielectric spectroscopy (CDS). In another specific embodiment, determining the difference between cellular responses to Gi and Gs protein stimulations is performed by determining the .DELTA.G in the sample from the subject. In another specific embodiment, the .DELTA.G is determined by measuring cellular impedance and the cellular impedance is measured by CDS, and wherein i) a .DELTA.G below -10 is indicative that the subject belongs to IS functional group FG1; ii) a .DELTA.G above -10 and below +10 is indicative that the subject belongs to IS functional group FG2; and iii) a .DELTA.G above +10 is indicative that the subject belongs to IS functional group FG3.
[0028] In another specific embodiment, determining the difference between cellular responses to Gi and Gs protein stimulations is performed by determining a ratio between cellular responses to Gi and Gs protein stimulations (Gi/Gs). In another specific embodiment, i) a ratio below about 0.5 is indicative that the subject belongs to IS functional group FG1; ii) a ratio between about 0.5 and 1.5, is indicative that the subject belongs to IS functional group FG2; and iii) a ratio above 1.5 is indicative that the subject belongs to IS functional group FG3
[0029] In another specific embodiment, the alternative method comprises determining the magnitude of a cellular response to Gi stimulation in the cell sample relative to a control sample. In another specific embodiment, i) a reduction of between about 60-90% of the cellular response to Gi stimulation relative to control is indicative that the subject belongs to IS functional group FG1; ii) a reduction of between about 40-60% of the cellular response to Gi stimulation relative to control is indicative that the subject belongs to IS functional group FG2; and iii) a reduction between about 10-40% of the cellular response to Gi stimulation relative to control is indicative that the subject belongs to IS functional group FG3. In another specific embodiment, i) a reduction above 60% of the cellular response to Gi stimulation relative to control is indicative that the subject belongs to IS functional group FG1; ii) a reduction of between about 40-60% of the cellular response to Gi stimulation relative to control is indicative that the subject belongs to IS functional group FG2; and iii) a reduction below about 40% of the cellular response to Gi stimulation relative to control is indicative that the subject belongs to IS functional group FG3. In another specific embodiment, the magnitude of a cellular response to Gi stimulation is determined by measuring cellular impedance. In another specific embodiment, cellular impedance is measured by cellular dielectric spectroscopy (CDS). In another specific embodiment, the alternative method comprises measuring cAMP concentration. In another specific embodiment, i) an increase in cAMP concentration relative to baseline is indicative that the subject belongs to IS functional group FG1, ii) no significant or weak reduction in cAMP concentration relative to baseline is indicative that the subject belongs to IS functional group FG2; and iii) a reduction in cAMP concentration relative to baseline is indicative that the subject belongs to IS functional group FG3.
[0030] In another specific embodiment, the alternative method comprises determining the phosphorylation state of Gi.alpha. proteins in the cell sample. In another specific embodiment, i) the presence of serine phosphorylated Gi.alpha.1, Gi.alpha.2 and Gi.alpha.3 proteins (or of an increase in or substantially higher level of serine phosphorylated Gi.alpha.1, Gi.alpha.2 and Gi.alpha.3 proteins as compared to a control sample from a subject not having IS or not at risk of developing IS) is indicative that the subject belongs to IS functional group FG1; ii) an absence of serine phosphorylation in Gi.alpha.3 proteins (or a level of serine phosphorylation in Gi.alpha.3 proteins comparable or lower to the level of serine phosphorylation in Gi.alpha.3 proteins in a control sample from a subject not having IS or not at risk of developing IS) is indicative that the subject belongs to IS functional group FG2; and iii) an absence of serine phosphorylation in Gi.alpha.1 proteins (or a level of serine phosphorylation in Gi.alpha.1 protein comparable or lower to the level of serine phosphorylation in Gi.alpha.1 proteins in a control sample from a subject not having IS or not at risk of developing IS) is indicative that the subject belongs to IS functional group FG3.
[0031] In another specific embodiment, the alternative method comprises determining cellular proliferation of the cell sample relative to a control sample. In another specific embodiment, i) a reduction in cellular proliferation of about 50% or more relative to control is indicative that the subject belongs to IS functional group FG1; ii) a reduction in cellular proliferation between about 25% and 45% relative to control is indicative that the subject belongs to IS functional group FG2; and iii) a reduction in cellular proliferation of about 25% or less relative to control is indicative that the subject belongs to IS functional group FG3.
[0032] In accordance with another aspect of the present invention, there is provided a method of predicting the risk of developing IS comprising: a) determining the cellular response to Gi stimulation in a cell sample from the subject in the presence of OPN; b) determining the cellular response to Gi stimulation in a cell sample from the subject in the absence of OPN; and c) comparing the cellular response obtained in the presence of OPN with the cellular response obtained in the absence of OPN, whereby the comparing step enables the prediction of the risk of developing IS. In a specific embodiment, an increase in cellular response following Gi-stimulation in the presence of OPN in the sample is indicative that the subject belongs to functional group FG1; and wherein a decrease in cellular response following Gi-stimulation in the presence of OPN is indicative that the subject belongs to functional group FG2 or FG3 and wherein identification of the subject as belonging to the FG2 functional group indicates that the subject is at risk of developing severe IS. In another specific embodiment, step (c) comprises determining the Fold effect (Fe) of OPN on the cellular response to Gi stimulation. In another specific embodiment, a Fe value above about 100% is indicative that the subject belongs to IS functional group FG1; a Fe value below about 50% is indicative that the subject belongs to IS functional group FG2 and a Fe value below about 95% and above about 50% is indicative that the subject belongs to IS functional group FG3.
[0033] The present invention further relates to method of determining the risk of developing IS in a subject comprising: (a) contacting a cell sample from the subject with i) an agonist of cluster I or cluster II GiPCR; and ii) Pertussis toxin (PXT); (b) determining the cellular response to Gi stimulation; and (c) classifying the subject into a IS functional group according to the subject's cellular response profile. In an embodiment, step (c) comprises (i) classifying the subject into a first functional group when the cellular response is above the cellular response of a control sample; or (ii) classifying the subject into a second functional group when the cellular response is substantially comparable to the cellular response of a control sample. In a particular embodiment, the cluster I GiPCR is lysophosphatidic acid receptor (LPAR), melatonin receptor (MT1 or MT2), mu-opioid receptor (OR) or adenosine receptor (AR). In an embodiment, the agonist is melatonin, iodomelatonin, phenylmelatonin, LPA, DAMGO or NECA. In an embodiment, the cluster II GiPCR is cannabinoid receptor (CB2R) or a .alpha.2-Adrenoreceptor (.alpha.2AR). In a particular embodiment, the agonist is CB65 or UK14304. In an embodiment, the identification of the subject as belonging to the FG2 functional group indicates that the subject is at risk of developing severe IS.
[0034] In another specific embodiment, the cellular response to Gi stimulation is determined by measuring cellular impedance. In another specific embodiment, the cellular impedance is measured by cellular dielectric spectroscopy.
[0035] The present invention also relates to a method of determining the risk of developing IS in a subject comprising: (a) contacting a cell sample from the subject with an agonist of a cluster II GiPCR; (b) determining the cellular response to Gi protein stimulation by cellular impedance; and (c) classifying the subject into a IS functional group according to the subject's cellular impedance profile. In an embodiment, step (c) comprises: (i) classifying the subject into a first IS functional group when the cellular impedance profile comprises a phase of negative impedance followed by a phase of positive impedance; and (ii) classifying the subject into a second IS functional group when the cellular impedance profile does not comprise a phase of negative impedance. In an embodiment the cluster II GiPCR is cannabinoid receptor (CB2R) or a .alpha.2-Adrenoreceptor (.alpha.2AR). In an embodiment, the identification of the subject as belonging to the FG2 functional group indicates that the subject is at risk of developing severe IS.
[0036] In another specific embodiment, the method further comprises classifying borderline subjects into one IS functional group by using an alternative classification method. In another specific embodiment, the alternative classification method is performed prior to step (a) of the method of the present invention. In another specific embodiment, the alternative classification method comprises determining the difference between cellular responses to Gi and Gs protein stimulations in the cell sample from the subject. In another specific embodiment, determining the difference between cellular responses to Gi and Gs protein stimulations comprises measuring cAMP cellular concentration produced by each of Gi and Gs protein stimulations. In another specific embodiment, determining the difference between cellular responses to Gi and Gs protein stimulations comprises measuring cellular impedance. In another specific embodiment, the cellular impedance is measured by cellular dielectric spectroscopy (CDS). In another specific embodiment, determining the difference between cellular responses to Gi and Gs protein stimulations is performed by determining the .DELTA.G in the sample from the subject. In another specific embodiment, the .DELTA.G is determined by measuring cellular impedance and the cellular impedance is measured by CDS, and wherein i) a .DELTA.G below -10 is indicative that the subject belongs to IS functional group FG1; ii) a .DELTA.G above -10 and below +10 is indicative that the subject belongs to IS functional group FG2; and iii) a .DELTA.G above +10 is indicative that the subject belongs to IS functional group FG3.
[0037] In another specific embodiment, determining the difference between cellular responses to Gi and Gs protein stimulations is performed by determining a ratio between cellular responses to Gi and Gs protein stimulations (Gi/Gs). In another specific embodiment, i) a ratio below about 0.5 is indicative that the subject belongs to IS functional group FG1; ii) a ratio between about 0.5 and 1.5, is indicative that the subject belongs to IS functional group FG2; and iii) a ratio above 1.5 is indicative that the subject belongs to IS functional group FG3.
[0038] In another specific embodiment, the alternative method comprises determining the magnitude of a cellular response to Gi stimulation in the cell sample relative to a control sample. In another specific embodiment, i) a reduction of between about 60-90% of the cellular response to Gi stimulation relative to control is indicative that the subject belongs to IS functional group FG1; ii) a reduction of between about 40-60% of the cellular response to Gi stimulation relative to control is indicative that the subject belongs to IS functional group FG2; and iii) a reduction between about 10-40% of the cellular response to Gi stimulation relative to control is indicative that the subject belongs to IS functional group FG3. In another specific embodiment, i) a reduction above 60% of the cellular response to Gi stimulation relative to control is indicative that the subject belongs to IS functional group FG1; ii) a reduction of between about 40-60% of the cellular response to Gi stimulation relative to control is indicative that the subject belongs to IS functional group FG2; and iii) a reduction below about 40% of the cellular response to Gi stimulation relative to control is indicative that the subject belongs to IS functional group FG3.
[0039] In another specific embodiment, the magnitude of a cellular response to Gi stimulation is determined by measuring cellular impedance. In another specific embodiment, cellular impedance is measured by cellular dielectric spectroscopy (CDS). In another specific embodiment, the alternative method comprises measuring cAMP concentration. In another specific embodiment, i) an increase in cAMP concentration relative to baseline is indicative that the subject belongs to IS functional group FG1, ii) no significant or weak reduction in cAMP concentration relative to baseline is indicative that the subject belongs to IS functional group FG2; and iii) a reduction in cAMP concentration relative to baseline is indicative that the subject belongs to IS functional group FG3.
[0040] In another specific embodiment, the alternative method comprises determining the phosphorylation state of Gi.alpha. proteins in the cell sample. In another specific embodiment, i) the presence of serine phosphorylated Gi.alpha.1, Gi.alpha.2 and Gi.alpha.3 proteins (or of a substantially higher level of serine phosphorylated Gi.alpha.1, Gi.alpha.2 and Gi.alpha.3 proteins as compared to a control sample not having IS or not at risk of developing IS) is indicative that the subject belongs to IS functional group FG1; ii) an absence of serine phosphorylation in Gi.alpha.3 proteins (or a level of serine phosphorylation in Gi.alpha.3 protein comparable or lower to the level of serine phosphorylation in Gi.alpha.3 proteins in a control sample from a subject not having IS or not at risk of developing IS) is indicative that the subject belongs to IS functional group FG2; and iii) an absence of serine phosphorylation in Gi.alpha.1 proteins (or a level of serine phosphorylation in Gi.alpha.1 proteins comparable or lower to the level of serine phosphorylation in Gi.alpha.1 proteins in a control sample from a subject not having IS or not at risk of developing IS) is indicative that the subject belongs to IS functional group FG3. In another specific embodiment, the alternative method comprises determining cellular proliferation of the cell sample relative to a control sample. In another specific embodiment, i) a reduction in cellular proliferation of about 50% or more relative to control is indicative that the subject belongs to IS functional group FG1; ii) a reduction in cellular proliferation between about 25% and 45% relative to control is indicative that the subject belongs to IS functional group FG2; and iii) a reduction in cellular proliferation of about 25% or less relative to control is indicative that the subject belongs to IS functional group FG3.
[0041] In accordance with another aspect of the present invention, there is provided a method of selecting a preventive measure, treatment or follow-up schedule for a subject suffering from IS or at risk of developing IS comprising classifying the subject using one or more of the above-noted methods: a) When the subject is classified as belonging to the FG1 functional group: i) the level of OPN in said subject is increased; ii) the level of HA in said subject is increased; iii) the level of CD44 in said subject is decreased; and/or iv) the frequency of assessment of scoliosis progression is decreased; b) when the subject is classified as belonging to the FG2 functional group: i) the level of OPN is said subject is decreased; ii) the level of HA in said subject is decreased; and/or iii) the level of CD44 in said subject is increased; iv) the frequency of assessment of scoliosis progression is increased; and/or v) the subject is prescribed corrective surgery prior to reaching a scoliosis with a cobb angle of 45 degree; or c) when the subject is classified as belonging to the FG3 functional group: i) the level of OPN is said subject is decreased; ii) the level of HA in said subject is decreased; iii) the level of CD44 in said subject is increased; and/or iv) the frequency of assessment of scoliosis progression is decreased.
[0042] In an embodiment, increasing the level of OPN comprises performing massages such as by applying pulsative compressive pressure to a body part of the subject. In an embodiment, increasing the level of OPN comprises administering OPN or a fragment thereof or derivative thereof to the subject. In an embodiment, increasing the level of OPN comprises applying low intensity pulsed ultrasound (LIPUS) to the subject. In a specific embodiment, increasing the level of HA comprises administering to the subject HA supplements or complying to a HA-rich diet. In a specific embodiment, decreasing the level of HA comprises complying to a HA-poor diet. In an embodiment decreasing OPN level comprises brace treatment. In an embodiment decreasing OPN level comprises administering to the subject selenium supplements, melatonin or PROTANDIM.TM.. In an embodiment decreasing OPN level comprises accupoint heat sensitive moxibustion, heat therapy with pad, thermal bath and electroacupuncture. In a specific embodiment decreasing the frequency of assessment of scoliosis progression comprises performing less than 22 radiological examinations within the 3 years following classification.
[0043] In a specific embodiment of the methods, the subject is a subject pre-diagnosed with IS. In another specific embodiment, the subject is asymptomatic. In another specific embodiment, the subject is a subject having at least one family member suffering from IS. In another specific embodiment, the cell sample comprises osteoblasts, chondrocytes, myoblasts and/or peripheral blood mononuclear cells (PBMCs). In another specific embodiment, the cell sample comprises PBMCs. In another specific embodiment, the PBMCs comprise lymphocytes. In another specific embodiment, the PBMCs are frozen PBMCs. In another specific embodiment, the PBMCs are fresh PBMCs. In another specific embodiment, the Gi stimulation comprises contacting the cells with somatostatin. In another specific embodiment, the Gi-stimulation comprises contacting the cells with a cluster I, cluster II, cluster III and/or cluster IV receptor agonist. In an embodiment the cluster I receptor is the melatonin receptor (MT1 or MT2), lysophosphatidic acid receptor (LPAR), mu-opioid receptor (OR) or the adenosine receptor (AR). In an embodiment, the cluster I agonist is LPA, DAMGO or NECA. In an embodiment, the cluster II receptor is .alpha.2 adrenergic receptor or the type 2 cannabinoid receptor (CB2R). In an embodiment, the cluster II agonist is CB65 or UK14304. In an embodiment, the cluster III receptor is the somatostatin receptor (SSTR) or the formyl peptide receptor 2 (FPR2). In an embodiment, the cluster III agonist is somatostatin or MMK1. In an embodiment, the cluster iv receptor is the Apelin receptor (APJR), the 5-HT1 receptor (5-HT1R) or the domapine D2 receptor (D2R). In an embodiment, the cluster iv agonist is Apelin-17, BP554 or quinpirole. In another specific embodiment, the Gi stimulation comprises contacting the cells with a cluster I or cluster II agonist. In another specific embodiment, the Gs stimulation comprises contacting the cells with isoproterenol. In another specific embodiment, the IS is Adolescent idiopathic scoliosis (AIS).
[0044] In accordance with another aspect of the present invention, there is provided a kit for classifying a subject having idiopathic scoliosis (IS) or at risk of developing IS or for predicting the risk of developing IS comprising: OPN; and one or more ligands for Gi stimulation.
[0045] In another aspect of the present invention, there is provided a kit for classifying a subject having idiopathic scoliosis (IS) or at risk of developing IS or for predicting the risk of developing IS comprising: a cluster II GiPCR (e.g., CB2R or .alpha.2AR) agonist (e.g., CB65 or UK14304). In an embodiment, the kit further comprises at least one of i) a cluster iv GiPCR (e.g., APJR, 5-HT1R or D2R) agonist (e.g., Apelin-17 BP554 or quinpirole); ii) OPN; iii) PTX and iv) instructions for classifying the subject or for predicting the risk of developing IS.
[0046] In another aspect of the present invention, there is provided a kit for classifying a subject having idiopathic scoliosis (IS) or at risk of developing IS or for predicting the risk of developing IS comprising: i) a cluster I GiPCR (e.g., LPAR, OR, A1R or melatonin receptor) and/or cluster II GiPCR (e.g., CB2R or .alpha.2AR) agonist (e.g., melatonin, LPA, DAMGO, NECA, CB65 or UK14304); and ii) PTX. In an embodiment, the kit further comprises at least one of i) a cluster III GiPCR agonist (e.g., somatostatin, MMK1); ii) a cluster IV GiPCR agonist (Apelin-17, BP554 or quinpirole); iii) OPN; and/or v) instructions for classifying the subject or for predicting the risk of developing IS.
[0047] In an embodiment, the above-noted kits are for predicting the risk of developing IS.
[0048] In another specific embodiment, the above-noted kits further comprise: a ligand for Gs stimulation; one or more antibodies for detecting Gi.alpha. phosphorylation (e.g., an antibody specific for Gi.alpha.1, Gi.alpha.2 and/or Gi.alpha.3); hyaluronic acid (HA) and/or instructions for classifying the subject or for predicting the risk of developing IS.
[0049] In an embodiment, the above-mentioned method is performed on more than one receptor coupled to a G, protein. In another embodiment, the above-mentioned method is performed using more than one ligand specific for a receptor coupled to a G.sub.i protein. In another specific embodiment, each ligand is specific to a different receptor coupled to a G.sub.i protein (e.g., 2, 3, 4, 5 or 6 ligands).
[0050] Other objects, advantages and features of the present invention will become more apparent upon reading of the following non-restrictive description of specific embodiments thereof, given by way of example only with reference to the accompanying drawings.
BRIEF DESCRIPTION OF THE DRAWINGS
[0051] In the appended drawings:
[0052] FIG. 1 shows an embodiment of a design for cell seeding in accordance with the present invention;
[0053] FIG. 2 shows an embodiment for a design for dispensing compounds in accordance with the present invention;
[0054] FIG. 3 shows the percent (%) viability and cell concentration obtained in an illustrative experiment described in Examples 1 and 2 as determined using an automated cell counter and viability analyzer;
[0055] FIG. 4 illustrates the .DELTA.G functional classification. The graph illustrates the difference between responses to Gi and Gs (i.e. .DELTA.G) stimulation obtained in PBMCs from patients with IS. Values were measured by the CDS-based system in response to 10 .mu.M of Somatostatin and isoproterenol. Each point represents the .DELTA.G of both responses in duplicate;
[0056] FIG. 5 shows the effect of rOPN on the cellular response to Gi stimulation in PBMCs. Cells were serum-starved for 18 h in the presence or absence of 0.5 .mu.g/mL rOPN and then stimulated with 10 .mu.M of somatostatin to initiate Gi-mediated cellular response. Data in the graph were generated from maximum-minimum impedance and correspond to the average of response in duplicate;
[0057] FIGS. 6A-6D show the functional status (i.e., the magnitude of the cellular response to GiPCR-stimulation) of Gi proteins in PBMCs from control and scoliotic subjects. PBMCs from control and scoliotic subjects were exposed to increasing concentrations of somatostatin to stimulate Gi proteins via endogenous somatostatin receptor. The cellular response was measured by CDS-based system as described in Example 1. Curves were generated from maximum-minimum impedance. Each curve represents the non-linear regression performed with GraphPad.TM. Prism 5.0 software. Data were normalized to maximal response in cells from control subjects and each point corresponds to the average of response in duplicate. As shown, the percentage of maximal response relative to the control following Gi stimulation are below 40% (e.g., between about 10-40% for FG1), about 40 and 60% for FG2 and above 60% (e.g., about 60-90% for FG3).
[0058] FIG. 7 shows the distribution of functional groups among different phases of scoliosis. A large cohort of scoliotic patients comprising 794 moderate cases (curvatures between 10 and 44 degrees) and 162 severe cases (curvature greater than 45 degrees) regularly followed at Sainte-Justine Hospital, were classified according to their degree of imbalance between response to Gi and Gs stimulation (.DELTA.G). Responses were measured by the CDS-based system in response to 10 .mu.M of somatostatin and isoproterenol;
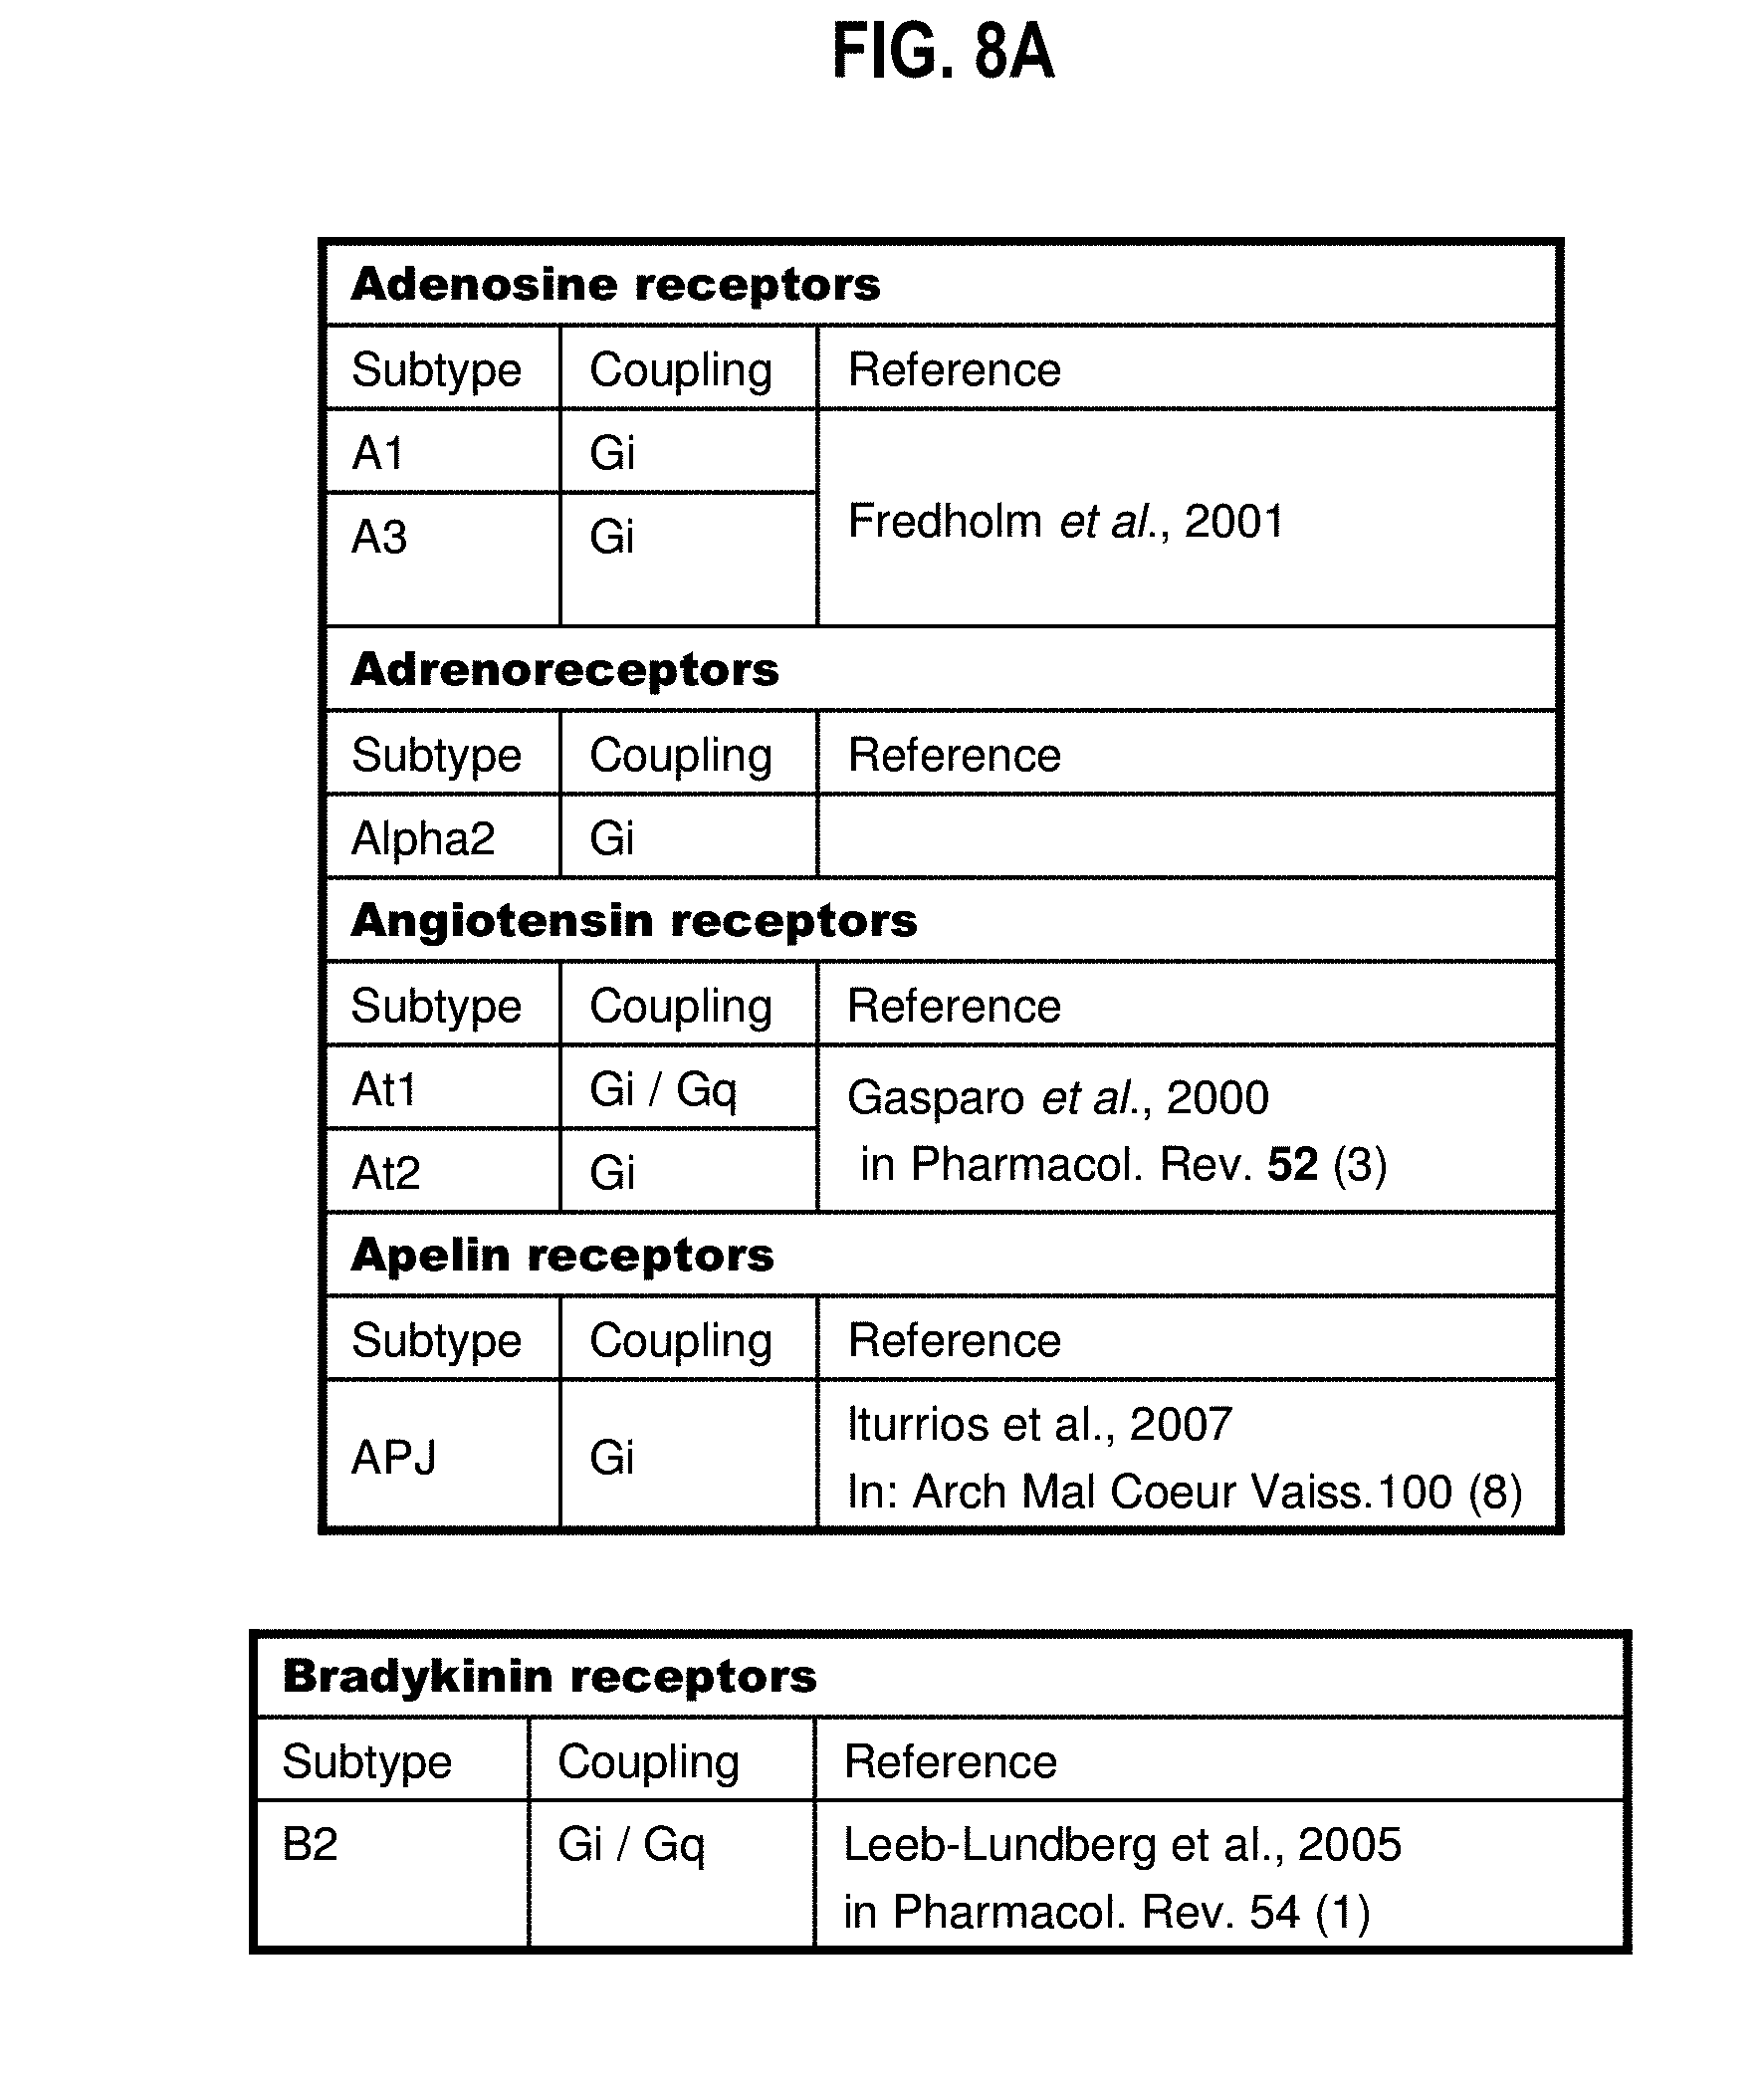
[0059] FIGS. 8A-8G show a list of known Gi-protein coupled receptors;
[0060] FIGS. 9A-9DDD show a list of known ligands to Gi-protein coupled receptors;
[0061] FIGS. 10A-10J show that IS subjects or subjects at risk of developing IS can be classified according to their impedance signature in response to GiPCR stimulation in four receptor clusters. Impedance signatures of various GiPCR agonists in AIS osteoblasts reveal 4 distinct clusters. Cells were stimulated with 10 .mu.M of (FIG. 10A) LPA, (FIG. 10B) DAMGO, (FIG. 10C) NECA, (FIG. 10D) CB65, (FIG. 10E) UK14304, (FIG. 10F) Somatostatin, (FIG. 10G) MMK1, (FIG. 10H) Apelin-17, (FIG. 10I) BP554 or (FIG. 10J) Quinpirole. The targeted endogenous receptors are shown in parentheses. The impedance represented in y-axis as dziec was measured by the Cellkey.TM. system every 2 sec. Data are representative of impedance signature in osteoblasts from 12 individuals tested three times in duplicate for each group;
[0062] FIGS. 11A-11B show dual melatonin signaling in AIS. (FIG. 11A) Effect of 16 h pre-treatment with 1 .mu.g/mL PTX on kinetic signature of melatonin. (FIG. 11B) Effect of 16 h pre-treatment with varying concentration of PTX on impedance response to 10 .mu.M melatonin normalized to the response in the presence of vehicle. Data are expressed as mean .+-.SEM of experiments performed three times in duplicate for n=12 patients per group. *P<0.05, **P<0.01, ***P<0.001, versus control group based on one-way ANOVA followed by in post-doc test of Dunnett;
[0063] FIGS. 12A-12J show the variations in the effect of PTX on response to various selective agonists of Gi-coupled receptors in FG1 subjects, depending on the receptor cluster. Osteoblasts from control subjects or AIS patients of different groups were pre-incubated with varying concentrations of PTX for 16 h prior stimulation with 10 .mu.M of specific synthetic agonist. The tested agonists and targeted receptors are indicated in each panel. Data were normalized to response in the presence of vehicle and are expressed as mean.+-.SEM of experiments performed three times in duplicate for n=12 patients per group. *P<0.05, **P<0.01, ***P<0.001, versus control group based on one-way ANOVA followed by in post-doc test of Dunnett;
[0064] FIGS. 13A-13B show the validation of the Gs and Gq siRNA effectiveness in AIS osteoblasts. (FIG. 13A) Total RNA extracted from control and AIS osteoblasts transfected with scramble, Gs or Gq siRNA and nontranfected (NT) cells, were subjected to qPCR analysis, using .beta.-actin as internal control. Data are expressed as mean.+-.SEM of n=12 patients for each group. * P<0.05, **P<0.01, ***P<0.001, versus NT cells based on one-way ANOVA followed by in post-doc test of Dunnett. (FIG. 13B) Total cell lysates from cells transfected with scramble, Gs or Gq siRNA, were subjected to western blot analysis, using antibody to .alpha.-tubulin as control. Bands shown are representative of results obtained with osteoblasts from 12 different patients for each AIS group.
[0065] FIGS. 14A-14P show the differential effects of Gs and Gq knockdown by siRNA method on the biphasic impedance signature of GiPCR agonists among AIS groups. Osteoblasts from control subjects and AIS patients of each functional group were transfected with scramble siRNA, Gs siRNA, or Gq siRNA. Efficiency of siRNA in control and AIS groups was verified with qPCR and Western blot analyses 48 hours after transfection, and response to stimulation with GiPCR agonist of cluster I, cluster II, cluster III and cluster IV was evaluated by challenging cells with 10 .mu.M of (FIG. 14A-14D) LPA, (FIG. 14EA-14H) CB65, (FIG. 14I-14L) Somatostatin and (FIG. 14M-14P) Apelin-17, respectively. Results from control subjects are shown in FIGS. 14A, 14E, 14I, 14M; in FG1 subjects are shown in FIGS. 14B, 14F, 14J, 14N; in FG2 subjects are shown in FIGS. 14C, 14G, 14K, 14O; and in FG3 subjects are shown in FIGS. 14D, 14H, 14L, 14P. The impedance represented in y-axis as dziec was measured every 2 sec. Data are representative of impedance signatures generated by CellKey.TM. system in osteoblasts from 12 individuals tested three times in duplicate for each group.;
[0066] FIGS. 15A-15B summarize alternative methods to classify IS subjects or subjects at risk of developing IS; and
[0067] FIGS. 16A-16H provide examples of Examples of clusters I to IV GiPCR ligands (e.g., full or partial agonists).
DESCRIPTION OF ILLUSTRATIVE EMBODIMENTS
[0068] The Applicants have tested on a large number of pre-classified subjects (by one or more of previous stratification methods (e.g., response to Gi-agonist stimulation (cAMP production inhibition, impedance modifications (by cellular dielectric spectroscopy), etc.)) the effect of OPN on Gi response.
[0069] They have found that depending on the functional group (e.g., FG1, FG2 or FG3), subjects at risk of suffering from scoliosis (e.g., already diagnosed IS subjects or suspected IS subjects) have a different Gi-dependent cellular response in the presence of OPN. In the FG1 group the presence of OPN increases the cellular response following Gi stimulation, while in groups FG2 and FG3, the Gi-dependent cellular response is decreased in the presence of OPN. Groups FG2 and FG3 can be further distinguished based on the extent of the OPN effect.
[0070] Applicants have also found that subjects can further be distinguished based on their impedance profiles following Gi protein stimulation in four GiPCR clusters (I, II, III and IV). The impedance profile for each cluster has a different shape. In addition, in the case of GiPCR cluster II, only FG1 subject show an impedance profile comprising a characteristic negative impedance phase followed by a positive phase, thereby enabling to easily distinguish FG1 subjects from FG2 and FG3 subjects.
[0071] Furthermore, results presented herein show that FG1 subjects can further be distinguished over FG2 and FG3 subjects based on their cellular response to GiPCR cluster I and/or II stimulation in the presence of high concentration of PTX.
[0072] The methods of the present invention can be used to classify subjects already diagnosed with IS or to identify subject at risk of developing IS. For example asymptomatic subjects predisposed to IS (e.g., a subject having at least one family member suffering from IS) can be tested and their risk of developing scoliosis determined based e.g., on their impedance profile following Gi protein stimulation with Gi PCR cluster I, II, III and/or IV agonist (or ligand) or based on their Gi response in the presence of i) OPN; or ii) PTX;. Their risk of developing severe scoliosis and of requiring surgery can also be determined based on their classification into a specific functional group. The present methods can be used alone or preferably in combination with one or more alternative methods of identifying the risk of developing IS and/or classifying subjects into one particular functional group (endophenotype). Combining the assessment of OPN effect, PTX effect (e.g., for cluster I and II GiPCR cellular response) or cluster II GiPCR stimulation on Gi cellular response with another method of identifying the risk of developing IS and/or classifying IS subjects allows to greatly improve the specificity of the method by allowing the classification of otherwise borderline subjects into one specific functional group (i.e., when one classification method alone did not enable to distinguish between two groups (e.g., between FG1 and FG2 or FG2 and FG3)). Thus, the precision of prior classification tests based on the response to Gi stimulation (or Gi/Gs imbalance) can thus further be improved by demonstrating a differential effect of osteopontin (OPN); or PTX on the response to Gi stimulation among functional groups or by looking at the impedance profiles in response to Gi protein stimulation in the presence of cluster I, II, III or iv GiPCR agonists.
[0073] The following predictive algorithm Table 6 is used in accordance with the present invention for the selection of agonists and GPCRs (Clusters I, II, III, IV) corresponding to functional classification of idiopathic scoliosis patients.
TABLE-US-00001 TABLE 6 Cluster I Cluster II Cluster III Cluster IV FG1 LPA/Gs+ CB65/Gs+ Somatostatin/Gs+ Apelin-17/Gs- and Gq+ and Gq- FG2 LPA/Gq+ CB65/Gs- Somatostatin/Gq+ Apelin-17/Gs- and Gq- and Gq- FG3 LPA/Gq+ CB65/Gs- Somatostatin/Gs+ Apelin-17/Gs- and Gq- and Gq+ and Gq- Cluster Gs permissive Gs permissive Mainly Gq permissive Not permissive characteristics (coupled) only (coupled) only (coupled) for all groups (not coupled) for FG1 for FG1 with weak Gs interaction for Gq and Gs Gq permissive (coupling) for FG1 and (coupled) only FG3 groups for FG2 and FG3
[0074] Cluster I GiPCR (and their ligands (e.g., agonists)) are coupled to Gs only for FG1, while being coupled to Gq for FG2 and FG3. Cluster II GiPCR (and their ligands (e.g., agonists)) are coupled to Gs, for FG1 only. Cluster III GiPCR (and their ligands (e.g., agonists)) are mainly coupled to Gq but also show a weak interaction with Gs for FG1 and FG3 groups. Cluster IV GiPCR (and ligands (e.g., agonists)) are not coupled to Gq and Gs.
[0075] Non-limiting examples of GICPR and their agonist for cluster I, II, III and IV are given in Table 7 below.
[0076] Accordingly, the present invention provides a method of classifying a subject having IS or at risk of developing IS (and/or of predicting the risk of developing IS) comprising: (a) determining the cellular response to Gi stimulation in a cell sample from the subject in the presence of OPN; (b) determining the cellular response to Gi stimulation in a cell sample from the subject in the absence of OPN; (c) comparing the cellular response obtained in the presence of OPN with the cellular response obtained in the absence of OPN; whereby the comparing step enables the classification of the subject into one IS functional group (and/or enables predicting the risk of developing IS).
[0077] In the above method based on the effect of OPN, classification into a specific functional group can be performed as follows. For example, when detecting an increase in cellular response following Gi-stimulation in the presence of OPN (when compared to in the absence of OPN), the subject is classified into the FG1 functional group; whereas when detecting a decrease in cellular response following Gi-stimulation in the presence of OPN (when compared to in the absence of OPN), the subject is classified into the FG2 or FG3 functional group depending on the extent of the OPN effect (the FG2 functional group being more sensitive to OPN).
[0078] Optionally and advantageously, the above-described methods may further comprise determining the fold effect (Fe) of OPN on Gi-mediated response which allows to more effectively distinguish between groups. The fold effect of OPN is determined by dividing the average of response magnitude to Gi stimulation in presence of OPN (RmGiOPN) with the average of response magnitude to Gi stimulation in the absence of OPN (RmGi) using the following formula:
Fe=100.times.(RmGiOPN/RmGi)
[0079] According to the above formulae, a Fe value above about 100% is indicative that the subject belongs to IS functional group FG1; a Fe value below about 50% is indicative that the subject belongs to IS functional group FG2 and a Fe value below about 95% and above about 50% is indicative that the subject belongs to IS functional group FG3.
[0080] The present invention also provides a method of classifying a subject having idiopathic scoliosis (IS) or at risk of developing IS (and/or of predicting the risk of developing IS) comprising: a) Contacting a cell sample from the subject with i) an agonist of cluster I or cluster II GiPCR; and ii) Pertussis toxin (PXT); b) Determining the cellular response to Gi protein stimulation; and c) Classifying the subject into a IS functional group according to the subject's cellular response profile.
[0081] Subjects can be classified into a specific functional group based on their response curve in the presence of increasing amounts of PTX. For all functional groups (i.e., FG1, FG2 and FG3), the response curve showed a left shift with respect to the control sample (i.e., the IC50 for PTX was smaller than in control samples). This characteristic can be used to identify subjects at risk of developing scoliosis.
[0082] Following GiPCR cluster I or cluster II agonist stimulation, the response curve in the presence of PTX is characterized by a first phase in which the response decreases with increasing amounts of PTX followed by a second phase where the response increases with increasing amounts of PTX (V shape curve). In the second phase of the response, the % of response relative to administration of a control vehicle is above that of the corresponding % of response for control (subjects not having IS or not at risk of developing IS), FG2 and FG3 subjects. Hence, a magnitude of cellular response in the presence of high concentration of PTX that is above that of a control (subjects not having IS or not at risk of developing IS as well as FG2 and FG3 subjects) indicates that the subjects belongs to the FG1 functional group.
[0083] By "high PTX concentration" is meant a concentration of PXT at which the GiPCR-mediated cellular response is almost completely inhibited by PTX in cells from subjects not having IS or not at risk of developing IS. For example, a high PTX concentration is a concentration at which the % of the GiPCR-mediated response is from about 0% (i.e., background noise) to 20%, from about 0% to 15% or from about 0% to 10%, preferably below 5% of the corresponding cellular response in the presence of a vehicle (instead of PTX). The high PTX concentration may also be expressed relative to the IC50 value for PTX in control samples. For example, a high PTX concentration in accordance with the present invention is a concentration that is at least 3.times., 5.times., 6.times., 8.times., 9.times., 10.times., 75.times., 100.times., 150.times., 200.times., 250.times., 500.times., 750.times. or 1000.times. the concentration of PTX at which 50% of the cellular response is normally inhibited (IC50) in control cells (e.g., cells from subjects not having IS or not at risk of developing IS). In an embodiment, the high PTX concentration is 6.times. the IC50 concentration. In a particular embodiment, the high PTX concentration is 0.5 ug/ml). As one skilled in the art can appreciate from the results presented herein, the higher the concentration of PTX, the greater the difference in the cellular response between FG1 subjects and control/FG2/FG3 subjects.
[0084] In another aspect, the present invention concerns a method of classifying a subject having idiopathic scoliosis IS or at risk of developing IS comprising: a) Contacting a cell sample from the subject with an agonist of a cluster II GiPCR; b) Determining the cellular response to Gi protein stimulation by cellular impedance; and c) Classifying the subject into a IS functional group according to the subject's cellular impedance profile.
[0085] Classification into a specific functional group can also be made by looking at the shape of the impedance profile following stimulation with one or more of clusters I, II, III and IV GiPCR agonists relative to control samples. Each GiPCR cluster gives a shape of impedance curve (i.e, an impedance signature) which is different from the other clusters. In addition, among a given GiPCR cluster, controls, FG1, FG2 and FG3 subjects have an impedance profile which is different from the other functional groups and from control, healthy subjects. Unexpectedly and advantageously, following stimulation with cluster II GiPCR agonists, subjects belonging to the FG1 or FG2/FG3 functional groups can be easily classified/identified by the sole shape of their impedance curve in the absence of any control sample. Indeed, GiPCR cluster II agonist stimulation of samples from subjects belonging to the FG1 functional group results in an impedance curve which begins with a negative impedance phase followed by a phase of positive impedance. This negative impedance phase is absent in FG2 and FG3 subjects, thereby allowing to unambiguously identify FG1 subjects.
[0086] All classification methods described herein can be used for i) predicting the risk of developing a scoliosis in a subject, ii) for selecting an appropriate preventive measure or treatment iii) for identifying compounds useful in the prevention or treatment of scoliosis or for simply classifying a subject into a specific functional group for clinical trials or other studies in which the effect of a given molecule or treatment may differ between functional groups.
[0087] The above described methods may be used alone or in combination and may also be used in addition to at least one other/alternative method of classification and/or method of predicting the risk of developing IS (e.g., method using the .DELTA.G to classify the subject and/or predict the risk of developing IS). The at least one other method may be used prior to or after using one or more of the above-described methods. In a specific embodiment, the at least one other/alternative method is used prior to using the one or more above-described methods. When the at least one other/alternative method is used prior to using the one or more above-described methods, the above-described methods may advantageously be used (alone or in combination) to classify subjects that had borderline values (i.e. could not be clearly classified into one functional group) by using the other/alternative method (e.g., subjects having a .DELTA.G of about 10 or about -10 using CDS) into a IS functional group. When the other/alternative method is used after the above-cited one or more methods, it may advantageously be used to classify subjects that had borderline values (i.e. could not be clearly classified into one functional group) by using the above-described method (e.g., subjects having Fe value of about 50% or between about 95 and about 100%) into a IS functional group.
[0088] As used herein the terms "borderline subjects" refer to subjects that could not be classified with sufficient confidence (i.e., specificity) into one specific IS functional group using a specific method of classifying IS subjects or where there is a need to simply confirm to which specific functional group a subject belongs.
[0089] OPN also has an effect on the cellular response to Gi stimulation in normal cells. In normal cells, OPN will decrease the cellular response to Gi-stimulation through its interaction with integrins (e.g., .alpha..sub.5.beta..sub.1). The use of a control sample (e.g., sample from a normal healthy subject) is therefore preferred for identification of at least FG3 subjects based on the above method since these subjects have a Gi cellular response that is closest to normal subjects and a response to Gi-stimulation that is least modified in the presence of OPN. The same observation is made when classifying subjects in accordance with their impedance profile or in the presence of a GiPCR antagonists. When used for predicting the risk of developing a scoliosis in asymptomatic patients, FG3 subjects may thus be difficult to unambiguously identify if no comparison is made with normal subjects. Preferably, a control a sample is used for identification of FG2 and FG3 subjects when predicting the risk of developing a scoliosis.
[0090] Hence, in certain embodiments of the above-mentioned methods, an additional step of further comparing the results with a control sample (e.g., one or more samples from healthy subject(s) or an equivalent "control value" derived from samples from control subjects) may be useful where, for example, asymptomatic subjects are tested for classifying subjects or predicting the risk of developing scoliosis. This step may however be omitted if an optimal concentration of OPN (i.e., concentration showing no or weak effect on normal cells) has been selected or if only certain functional groups need to be identified (e.g., FG1 and FG2). A control sample (e.g., sample from normal subject) may also not be necessary when the above methods are used as a classification method for borderline subjects in conjunction with (e.g., prior to) an alternative classification method as explained below. In those cases, the alternative method has already determined with a control that the subject has an IS.
[0091] As indicated above, Applicants have discovered that combining one or more methods of the present invention (e.g., the detection of the OPN effect on Gi cellular response) with another classification method allows to more precisely classify subjects having values that are borderline between two functional groups or fall outside the above OPN Fe ranges (e.g., a Fe value of about 50% or between about 95 and about 100%). Any alternative method of classifying a subject into a functional subgroup may be used in accordance with the present invention. For example, confirmation can be performed by classifying the subject into one IS functional group by i) determining the difference (.DELTA.G) or ratio (e.g., Gi/Gs) between cellular responses to Gi and Gs protein stimulations in the cell sample from the subject; ii) determining the magnitude of a cellular response to GiPCR-stimulation in the cell sample relative to a control sample (using GiPCR agonist stimulation and optionally antagonists of GiPCR cellular response) ; iii) determining the phosphorylation states of Gi proteins; or iv) determining the cell (e.g., osteoblasts, chondrocytes, myoblasts) proliferation (described in Moreau et al., 2004; Akoume et al., 2010; Azeddine et al., 2007; Letellier et al., 2008; and WO2003/073102; WO2010/040234 and PCT/CA2014/050562 and U.S. 61/879,314 to Moreau, all incorporated herein by reference).
[0092] Preferably, the confirmation is performed by determining the difference between cellular responses to Gi and Gs protein stimulations (.DELTA.G) in the cell sample from the subject. The .DELTA.G is determined by subtracting the average of response magnitude to Gi stimulation (RmGi) from the average of response magnitude to Gs stimulation (RmGs) using the following formula:
.DELTA.G=RmGi-RmGs.
[0093] According to the .DELTA.G classification, response to Gi stimulation predominates in FG3, while no apparent (i.e., no substantial) imbalance is observed in FG2 subjects. In contrast, FG1 subjects exhibit predominance for response to Gs stimulation. A value of .DELTA.G below -10 is indicative that the subject belongs to IS subgroup FG1; a value of .DELTA.G above -10 and below +10 is indicative that the subject belongs to IS subgroup FG2; and a value of .DELTA.G above +10 is indicative that the subject belongs to IS subgroup FG3.
[0094] Alternatively, the difference between Gi and Gs responses may be expressed as a ratio of response to Gi vs. Gs stimulation (Gi/Gs). The FG3 group shows a predominance of response to Gi stimulation (i.e. a Gi/Gs ratio of more than about 1.5), there is no substantial imbalance observed in the FG2 group (i.e. a Gi/Gs ratio of between about 0.5 and 1.5) and the FG1 group exhibits a predominance of response to Gs stimulation (i.e. a Gi/Gs ratio of less than about 0.5).
[0095] In the case where classification is resolved by determining the magnitude of a cellular response to Gi stimulation in the cell sample relative to a control sample: i) a cellular response to Gi stimulation lower than the control sample by about 60% (e.g., 60% to 90%) is indicative that the subject belongs to IS subgroup FG1; ii) a cellular response to Gi stimulation lower than the control sample by about 40 to 60% is indicative that the subject belongs to IS subgroup FG2; and iii) a cellular response to Gi stimulation lower than the control sample by less than about (i.e., at most) 40% (or by about 10 to 40%) is indicative that the subject belongs to IS subgroup FG3. The above classification is based on the percentage of degree of reduction relative to control group. Alternatively, the classification can be expressed as the percentage of maximal response relative to the control. In such an embodiment, i) a maximal response below 40% of the control (e.g., between about 10 and 40%) is indicative that the subject belongs to IS subgroup FG1; ii) a maximal response between about 40 and 60% of the control is indicative that the subject belongs to IS subgroup FG2; and iii) a maximal response above about 60% of the control (or between about 60 and 90%) is indicative that the subject belongs to IS subgroup FG3. Because the Gi-mediated defective signaling is due to reduced Gi-protein activity, the magnitude of a cellular response to Gi-stimulation for each endophenotype (i.e., FG1, FG2 and FG3 subgroups) can also be assessed by determining (e.g., measuring) the effect of a GPCR antagonist (e.g., GP Ant-2 or PTX) or GiPCR activator (e.g., mastoparan-7). For example, inhibition curves of GPCR antagonist GP Ant-2 on response to various selective agonists of Gi-coupled receptors (from clusters i to iv) give relative inhibition profiles (e.g., IC50 FG1>IC50 FG2>IC50 FG3) which reflect the magnitude of Gi-mediated response relative to control observed for agonist stimulation. GiPCR activator Mastoparan-7 produces Gi protein-response profiles in control and IS (FG1, FG2 and FG3) groups similar to that observed for any other Gi-protein agonists with similar degree (%) of Gi-mediated response relative to the control group. The magnitude of a cellular response to Gi stimulation (as measured following Gi-stimulation and/or inhibition) can be determined by various methods including but not limited to determination of impedance (e.g., CDS), Time-Resolved fluorescence (TRF), Time-Resolved-Florescence Resonance Energy Transfer (TR-FRET), Enzyme Fragment complementation (EFC), melanophore phenotype and optical biosensor.
[0096] In certain subjects, scoliosis develops rapidly over a short period of time to the point of requiring a corrective surgery (often when the deformity reaches a Cobb's angle .gtoreq.45.degree.). Current courses of action available from the moment a scoliosis such as IS is diagnosed (when scoliosis is apparent) include observation (including periodic x-rays, when Cobb's angle is around 10-25.degree.), orthopedic devices (such as bracing, when Cobb's angle is around) 25-30.degree.), and surgery (Cobb's angle over 45.degree.). Thus, a more reliable determination of the risk of progression (through better classification) could enable to 1) select an appropriate diet to remove certain food products identified as contributors to scoliosis in certain subjects (e.g., Hyaluronic acid (HA) for FG1 and FG2 subjects); 2) select the best therapeutic agent o treatment or preventive measure (an inhibitor of OPN expression or activity (e.g., neutralizing antibody specific to OPN, sCD44 or RGD peptide or derivative thereof, long term brace treatment which reduce OPN level, melatonin, selenium, PROTANDIM) in the case of FG2 and FG3 subjects or a stimulator of OPN expression or activity in the case of FG1 subjects (e.g., HA supplements or HA-rich diet, antibody against CD44 etc.); 3) select the least invasive available treatment such as postural exercises (e.g., massages (e.g., 30-90 minutes pulsative compressive pressure applied locally) or low intensity pulsed ultrasound (LIPUS) which increase OPN level for FG1 subjects, orthopedic device (brace) or other treatment or preventive measure (e.g., acupoint heat sensitive moxibustion, heat therapy with pad, thermal bath, electroacupuncture) which decrease OPN level, for FG2 and FG3 subjects, or less invasive surgeries or surgeries without fusions (a surgery that does not fuse vertebra and preserves column mobility) and/or 4) the best follow-up schedule (e.g., increasing or decreasing the number of follow-up visit to the doctor during for example a 3, 6 or 12 month period or increasing or decreasing the number of x-rays during for example a 3, 6 or 12 month period).
[0097] Applicants have determined that subjects classified in the FG2 functional group are more at risk of developing severe scoliosis (i.e., a scoliosis which will require corrective surgery, or which will progress more rapidly). Furthermore, as disclosed herein and in co-pending WO2015032004 to Moreau et al., OPN, which is an important factor in scoliosis progression and development, has opposite effects in FG1 subjects as compared to FG2 and FG3 subjects. Applicant's have found that OPN has a protective effect in FG1 subjects by increasing the Gi-mediated cellular response in these subjects (i.e. OPN is able to help compensate the Gi signalling defect present in scoliosis subjects or subject at risk of developing scoliosis). Conversely, FG2 and FG3 subjects are sensitive to OPN i.e., that OPN further reduces the Gi-mediated response in these subjects and thereby further contributes (enhance) scoliosis development and progression. OPN' s effect is more pronounced in FG2 subjects, which are qualified as being "hypersensitive to OPN.
[0098] The present inventors have also previously established that OPN' s inhibitory action on Gi-mediated cell signalling is due (at least partly) to its interaction with integrins (e.g., .alpha..sub.5.beta..sub.1). This interaction can be modulated by the presence of CD44, another OPN receptor. A mutation in CD44 (CT mutation) has been shown to further increase the sensitivity of scoliotic subjects to the damaging effects of OPN (see PCT/CA2014/050569, to Moreau). CD44 (e.g., soluble CD44) can compete with integrins for OPN binding and therefore indirectly regulate OPN' s effect on Gi-mediated cell signaling. Furthermore, PIPK1.gamma. activity increases the affinity of integrins for OPN through FAK and Src. In turn, PIP1K.gamma. activity is regulated by PTP.mu.. PIPK1.gamma. has been shown to be upregulated while PTP.mu. has been shown to be downregulated in cells from IS subjects (see WO2014201560 to Moreau et al.).
[0099] Accordingly, the present invention provides a method of predicting the risk of developing severe IS comprising determining the effect of OPN on the cellular response to GiPCR stimulation by comparing the cellular response obtained in the presence of OPN with the cellular response obtained in the absence of OPN and classifying the subject into one IS functional, wherein classification into the FG2 functional group is indicative that the subject is at risk of developing severe IS. Corresponding methods of predicting the risk of developing scoliosis are provided based on i) the impedance signature in response to Gi protein stimulation (e.g., cluster II receptor agonists) and ii) the cellular response to Gi protein stimulation in the presence of PTX. The present invention also encompasses selecting the most efficient and least invasive known preventive action, treatment or follow-up schedule in view of the determined classification and risk of developing scoliosis.
[0100] Accordingly, the present invention provides a method of selecting a preventive action, treatment or follow-up schedule for a subject suffering from IS comprising classifying the subject using at least one of the above described classification methods.
[0101] As discussed above, in the FG1 subgroup, OPN has a protective effect on scoliosis development and progression. Accordingly, in these subjects it is desirable to increase OPN level or bioavailability rather than to decrease it. Preventive and treatment measures in FG1 subjects should thus aim at increasing OPN level or activity. Conversely, FG2 and FG3 subjects are particularly sensitive to OPN. In these subjects high OPN levels are undesirable and can increase the risk of scoliosis development. Preventive and treatment measures in FG2 and FG3 subjects should thus aim at decreasing OPN level or activity.
[0102] Hyaluronic Acid (HA) is known to compete with OPN for binding to CD44 (another OPN receptor) and thus to increase the level of OPN available to bind to integrins. Accordingly, one way of increasing OPN's activity (e.g., binding to integrins) is by increasing the amount of HA in the subject which in turn increases OPN bioavailability. This can be done for example by taking HA supplements or by increasing HA intake or HA synthesis by favoring certain food. Non-limiting examples of food with high HA content or which stimulates/support HA production include, meat and meat organs (e.g., veal, lamb, beef and gizzards, livers, hearts and kidneys), fish, poultry (including meat fish and poultry broths), soy (including soy milk), root vegetables containing starch including potatoes and sweet potatoes, satoimo (Japanese sweet potato), imoji (Japanese sweet potato), Konyaku concoction (root vegetable concoction. Fruits and vegetables rich in vitamin C, magnesium or zinc are also useful as they support the synthesis of HA by the body. Non-limiting examples of food rich in vitamin C include lemons, oranges, limes, grapefruit, guava, mango, cherries, kiwi, blueberries, raspberries, all varieties of grapes, parsley and thyme. Fruits and vegetables rich in magnesium include apples, bananas, tomatoes, avocados, pineapples, melons, peaches, pears, spinach, cauliflower, broccoli, asparagus, green lettuce, Brussels sprouts and green beans. Non-limiting examples of food rich in zinc include pumpkins, yeast, peanuts, whole grains, beans, and brown rice.
[0103] Conversely, FG2 and FG3 subjects should decrease or maintain lower levels of HA and therefore should comply with a HA-poor diet (by avoiding one or more of the above foods).
[0104] Other non-limiting examples of treatment or preventive measures which increase OPN expression (e.g., circulating OPN levels) or activity and which may be beneficial to FG1 subjects include low intensity pulsed ultrasound (LIPUS) and the application of massages/pulsative compressive pressure as described in U.S. Ser. No. 13/822,982.
[0105] Other non-limiting examples of treatment or preventive measures which decrease OPN expression (e.g., circulating OPN levels) or activity and which may be beneficial to FG2 and/or FG3 subjects include acupoint heat sensitive moxibustion, heat therapies with pad, thermal bath, electroacupuncture, melatonin, selenium (as supplements or by complying to a selenium-rich diet), PROTANDIM (nutraceutical cocktail known to reduce plasma or serum OPN levels and used as a natural anti-oxidant mix), etc, which have been shown to decrease OPN levels.
[0106] Other ways to increase or decrease the level or activity OPN include the examples provided in Table 1, below.
TABLE-US-00002 TABLE 1 Non-limiting examples of treatment and preventive measures according to the functional endophenotype. Treatment or Functional group Preventive measure FG1 FG2 FG3 Comments Increase in OPN yes no no OPN has a protective level or activity effect in FG1 subjects but constitute a risk factor in FG2 and FG3 subjects. Increase in sCD44 no yes yes Decreases OPN's level bioavailability to integrins Incease HA level yes avoid avoid HA increases OPN's bioavailability Decrease HA level avoid yes yes HA increases OPN's bioavailability Brace treatment Avoid or close yes yes Long term brace treatment monitoring of decreases OPN level (see OPN level required. US 61/879,314) Massages (e.g., pulsative yes avoid avoid Increase OPN compressive pressure) level (see US 13/822,982) Src inhibitors -- yes yes Involved in the activation of PIPK1.gamma. FAK inhibitors -- yes yes Involved in the activation of PIPK1.gamma. RGD peptides -- yes yes Inhibit the binding of OPN to integrins Decreasing PIPK1.gamma. -- yes yes Increases binding of level or activity integrins to OPN (e.g., inhibitors) Increasing the level -- yes yes Involves in the or activity of PTP.mu. dephosphorylation (inhibition) of PIPK1.gamma. Early corrective no yes no FG2 subjects have an surgery (before 45 increased risk of severe degrees Cobb angle) scoliosis (assessment of sCD44 levels, OPN levels and presence of mutation in CD44 which decreases affinity toward OPN are also important in making decision)
[0107] In an embodiment, when the subject is classified as belonging to the FG2 functional group the subject is prescribed corrective surgery prior to reaching a 45 degree scoliosis (e.g., prior to reaching 30, 32, 34, 36, 38, 40, 41, 42, 43, 44 degree scoliosis); and wherein when the subject belongs to the FG1 or FG2 functional group, the subject has a decreased risk of curve progression over a 45.degree. angle and the subject is prescribed fewer than 22 radiological examinations within the next 3 years following classification.
[0108] The present invention also encompasses kits for classifying subjects having IS or at risk of developing IS; kits for predicting the risk of developing IS and kits for predicting the risk of developing severe IS. Such kits may comprise 1. (a) recombinant OPN (rOPN); (b) one or more ligands (e.g., agonists) for stimulating GiPCRs (e.g., Cluster I, II, III or iv ligands (e.g., agonists), Mastoparan, etc.); or 2. a) PTX; b) one or more ligands for stimulating GiPCRs (e.g., Cluster I, II, III or IV ligands (e.g., agonists). Optionally the kits may comprise (c) i) one or more ligands for stimulating GsPCRs; ii) one or more ligands for inhibiting GiPCR (e.g., antagonists, GP Ant-2) and/or (ii) one or more antibody for detecting Gi.alpha. phosphorylation, together with instructions for using the kit.
Definitions
[0109] For clarity, definitions of the following terms in the context of the present invention are provided.
[0110] As used herein the terms "at risk of developing a scoliosis" or "at risk of developing IS" refer to a genetic or metabolic predisposition of a subject to develop a scoliosis (i.e. spinal deformity) and/or a more severe scoliosis at a future time (i.e., curve progression of the spine). For instance, an increase of the Cobb's angle of a subject (e.g., from 40.degree. to 50.degree. or from 18.degree. to 25.degree. is a "development" of a scoliosis. The terminology "a subject at risk of developing a scoliosis" includes asymptomatic subjects which are more likely than the general population to suffer in a future time of a scoliosis such as subjects (e.g., children) having at least one parent, sibling or family member suffering from a scoliosis. Among others, age (adolescence), gender and other family antecedent are factors that are known to contribute to the risk of developing a scoliosis and are used to evaluate the risk of developing a scoliosis. Also included in the terminology "a subject at risk of developing a scoliosis" are subjects already diagnosed with IS but which are at risk to develop a more severe scoliosis (i.e. curve progression).
[0111] As used herein, the terms "severe scoliosis", "severe IS" or "severe progression" is an increase of the Cobb's angle to 45.degree. or more, potentially at a younger age.
[0112] As used herein the term "subject" is meant to refer to any mammal including human, mouse, rat, dog, chicken, cat, pig, monkey, horse, etc. In a particular embodiment, it refers to a human.
[0113] As used herein the term "treating" or "treatment" in reference to scoliosis is meant to refer to at least one of a reduction of Cobb's angle in a preexisting spinal deformity, improvement of column mobility, preservation/maintenance of column mobility, improvement of equilibrium and balance in a specific plan; maintenance/preservation of equilibrium and balance in a specific plan; improvement of functionality in a specific plan, preservation/maintenance of functionality in a specific plan, cosmetic improvement, and combination of any of the above.
[0114] As used herein the term "preventing" or "prevention" in reference to scoliosis is meant to refer to a at least one of a reduction in the progression of a Cobb's angle in a patient having a scoliosis or in an asymptomatic patient, a complete prevention of apparition of a spinal deformity, including changes affecting the rib cage and pelvis in 3D, or a combination of any of the above.
[0115] As used herein the terms "follow-up schedule" is meant to refer to future medical visits a subject diagnosed with a scoliosis or at risk of developing a scoliosis is prescribed once the diagnosis or risk evaluation is made. For example, when a subject is identified as being at risk of developing a severe scoliosis or at risk of rapid curve progression (e.g., a subject classified as belonging to the FG2 subgroup in accordance with the present invention), the number of medical visits (e.g., to the orthopedist) is increased and/or the number of x-rays in a given period (e.g., 3, 6 or 12 months) is increased. On the other hand, when a subject is identified as having a lower risk of curve progression or rapid curve progression (e.g., subject being classified as belonging to the F1 or FG3 subgroup) the number of medical visits or x-rays may be decreased to less than the average (e.g., less than 22 x-rays over a 3 year period or less than 1 visit every 3 months, 6 months or 12 months).
[0116] As used herein, the terminology "blood sample" is meant to refer to blood, plasma or serum.
[0117] As used herein, the terminology "cell sample" is meant to refer to a sample containing cells expressing the desired GPCR(s) in sufficient amount to detect a cellular response in accordance with the present invention. The cells in the cell sample may be any type of cells as long as they express the desired GPCR to be tested. The cells used herein naturally express one or more receptors coupled to G, proteins and were selected in part for their accessibility for collection from subjects. Hence, cells such as osteoblasts, osteoclasts, peripheral blood mononuclear cell (PBMC) (inherently including principally lymphocytes but also monocytes) and myoblasts are advantageously accessible and may conveniently be used in the methods of the present invention. Blood cells (e.g., PBMCs, platelets (thrombocytes), etc.) in particular are particularly accessible and provide for a more rapid testing. Any blood cell can be used for the methods of the present invention so long as it possesses at least one GPCR receptor coupled to a Gi protein. The cells can be fresh or frozen and may or may not have been cultured (expanded) prior to testing. The "sample" may be of any origin including blood, saliva, tears, sputum, urine, feces, biopsy (e.g., muscle biopsy), as long as it contains cells expressing the desired GPCR(s).
[0118] The methods of the invention may be performed using cell expressing one or more receptor(s) coupled to a G, and/or Gs proteins. "Receptor" as used herein refers to wild-type receptors as well as to fragments and/or variants thereof that retains the activity (i.e. GPCR-mediated activity) of the wild-type receptors. FIGS. 8A-8G present a non-exhaustive list of GiPCRs suitable for use in the method of the present invention.
[0119] As used herein the terminology "control sample" is meant to refer to a sample from which it is possible to make a comparison and to classify/stratify subjects into a specific functional group. In an embodiment, a "control sample" is a sample that does not originate from a subject known to have scoliosis or known to be a likely candidate for developing a scoliosis (e.g., idiopathic scoliosis (e.g., Infantile Idiopathic Scoliosis, Juvenile Idiopathic Scoliosis or Adolescent Idiopathic Scoliosis (AIS))). In another embodiment, the control sample is from one or more subjects of the group FG1, FG2 or FG3. In the context of the present invention, "a control sample" also includes a "control vaule" or "reference signal" derived from one or more control samples from one or more subjects. In methods for predicting the risk of developing scoliosis in a subject that is pre-diagnosed with scoliosis, the sample may also come from the subject under scrutiny at an earlier stage of the disease or disorder. In an embodiment, the control sample is a cell of the same type (e.g., both the test sample and the reference sample(s) are e.g., lymphocytes, osteoblasts, myoblasts or chondrocytes) as that from the subject. Of course, multiple control samples derived from different categories of subjects (e.g., FG1, FG2, FG3 and healthy subjects) can be used in the methods of the present invention. As used herein, the term "reference signal" or "control value" is meant to refer to a signal (e.g., fluorescence, impedance, cAMP concentration or any other measurable signal) that serves as a reference in predicting the risk of developing scoliosis or in establishing classification of a subject into a particular functional group. A reference signal can be obtained by using one or more samples from suitable control subjects (subjects not having a scoliosis or not at risk of developing a scoliosis, FG1, FG2 or FG3 subjects depending on the method). The reference signal may originate from a single control subject ((i.e., a normal healthy subject or a subject already classified in a given endophenotype group) or may be derived from a group of control subjects (i.e., equivalent to the average response in control subjects).
[0120] "GPCRs" or "G protein-coupled receptors" constitute a large protein family of receptors that sense molecules outside the cell and activate inside signal transduction pathways leading to various cellular responses.
[0121] The G protein-coupled receptor is activated by an external signal in the form of a ligand (e.g., agonists). This creates a conformational change in the receptor, causing activation of a G protein. Further effect depends on the type of G protein. Four types of G proteins exist : G.alpha.s (Gs), G.alpha.i/o (Gi), G.alpha.q/11, and G.alpha.12/13. G.alpha.s (Gs) is a heterotrimeric G protein subunit that activates the cAMP-dependent pathway by activating adelylate cyclase. G.alpha.i/o (Gi) is a heterotrimeric G protein subunit that inhibits the cAMP-dependent pathway by inhibiting adelylate cyclase. As supported herein by the identification of four difference GiPCR receptor cluster, G protein-coupled receptors are not necessarily exclusively coupled to a particular type of G protein (e.g., Gi or Gs) but may interact with other G proteins (e.g., Gi or Gs) depending on the conditions.
[0122] The ligands (e.g., agonists and antagonists) that bind and activate (inhibit) these receptors include light-sensitive compounds, odors, pheromones, hormones, and neurotransmitters, and vary in size from small molecules to peptides to large proteins. As used herein, the term "ligand" includes any molecule (synthetic or natural) capable of binding to GPCR to modulate (increase or decrease) its cellular response. Accordingly, the term "ligand" in the expression "GiPCR ligand" or "GsPCR ligand" includes agonists of GiPCR, agonists of GsPCR, antagonists of GiPCR and antagonists of GsPCR. Any molecule can be used in accordance to the present invention as long as it allows measuring the magnitude of the cellular responses involving Gi or GsPCR.
[0123] There are two principal signal transduction pathways involving the G protein-coupled receptors: the cAMP signal pathway and the phosphatidylinositol signal pathway. When a ligand binds to the GPCR it causes a conformational change in the GPCR, which allows it to act as a guanine nucleotide exchange factor (GEF). The GPCR can then activate an associated G-protein by exchanging its bound GDP for a GTP. The G-protein's a subunit, together with the bound GTP, can then dissociate from the .beta. and .gamma. subunits to further affect intracellular signaling proteins or target functional proteins directly depending on the a subunit type.
[0124] The effector of both the Gs and Gi pathways is the cyclic-adenosine monophosphate (cAMP) generating enzyme adenylate cyclase, or AC. AC catalyzes the conversion of cytosolic adenosine triphosphate (ATP) to cAMP, and all are directly stimulated by G-proteins of the Gs class. Conversely, interaction with G.alpha. subunits of the Gi type inhibits AC from generating cAMP. Thus, a GPCR coupled to G.alpha.s counteracts the actions of a GPCR coupled to G.alpha.i/o, and vice versa. The level of cytosolic cAMP may then determine the activity of various ion channels as well as members of the ser/thr specific protein kinase A (PKA) family Thus, cAMP is considered a second messenger and PKA a secondary effector.
[0125] Accordingly, as used herein the term "GiPCR" refers to a GPCR preferably (i.e., mainly) coupled to the G.alpha.i proteins (e.g., Gi.alpha.1, Gi.alpha.2 and Gi.alpha.3) which when stimulated by a ligand (i.e., an agonist to the GiPCR receptor) inhibits (reduces) the production of cAMP in a cell. The methods of the present invention may be performed by stimulating any GiPCR and more than one GiPCR at the same time (1, 2, 3, 4 GiPCRs). GPCRs coupled to the G.sub.i protein include, for example, CD47, serotonin receptors (5-HT), adenosine receptors, adrenergic receptors, cannabinoid receptors, histamine receptors, prostaglandin receptors and dopamine receptors. Non-limiting examples of GiPCRs suitable for use in the method of the present invention are presented in FIGS. 8A-8G. Furthermore, any ligand of a given GiPCR may be used in accordance with the present invention as long as it leads to the activation of the Gi protein and reduction of cellular cAMP. Multiple ligands (agonists and antagonists) may also be used in accordance with the present invention. Ligands (e.g., synthetic or natural) of GiPCRs are well known in the art and several of these ligands are commercially available. FIGS. 9A-9DDD present a non-exhaustive list of GiPCR ligands suitable for use in the method of the present invention. In an embodiment, the above-mentioned receptor coupled to a G.sub.i protein is a melatonin receptor, a serotonin receptor, a somatostatin receptor, an Apelin receptor, a dopaminergic receptor, a lysophosphatidic acid receptor, a formyl peptide receptor, an .alpha.-adrenergic receptor, an adenosine receptor, a cannabinoid receptor or any combination thereof. In a further embodiment, the above-mentioned receptor is LPAR, A1R, MT2R, 5-HT1AR, .alpha.2-ADR, A3R, OR, D2R, SSTR, APJ, FPR2 or CB2.
[0126] In a specific embodiment, the above-mentioned ligand is a known agonist of the receptor. In an embodiment, the above-mentioned ligand is (a) melatonin for the MT2 receptor, (b) 1-[3-(3,4-Methylenedioxyphenoxy)propyl]-4-phenyl-piperazine maleate (known as BP554 maleate) for the 5-HT1A receptor, (c) 5-bromo-N-(4,5-dihydro-1H-imidazol-2-yl)-6-quinoxalinamine (known as UK14304) for the .alpha.2-AD receptor; (d) 1-Deoxy-1-[6-[[(3-iodophenyl)methyl]amino]-9H-purin-9-yl]-N-methyl-.beta.- -D-ribofuranuronamide (known as IB-MECA) for the A3 receptor; Lysophosphatidic acid (known as LPA) for the LPA receptor; (2S)-2-[[2-[[(2R)-2-[[(2S)-2-amino-3-(4-hydroxyphenyl)propanoyl]amino]pro- panoyl]amino]acetyl]-methylamino]-N-(2-hydroxyethyl)-3- phenylpropanamide (known as DMAGO) for the mu-opioid receptor, 1-(6-Amino-9H-purin-9-yl)-1-deoxy-N-ethyl-.beta.-D-ribofuranuronamide (known as NECA) for the adenosine receptors (e.g., A1, A2a and A3); somatostatin for the SSTR receptor; peptide MMK-1 (LESIFRSLLFRVM) for the FPR2 receptor; Apelin-17 for the APJR receptor; (4aR, 8aR)-5-propyl-4,4a,5,6,7,8,8a,9-octahydro-1H-pyrazolo[3 ,4-g]quinolone (known as quinpirole) for the D2 and D3 receptors and/or (e) N-Cyclohexyl-7-chloro-1-[2-(4-morpholinyl)ethyl]quinolin-4(1H)-one-3-carb- oxamide (known as CB65) for the CB2 receptor.
[0127] Similarly, as used herein the term "GsPCR" refers to a GPCR preferably (i.e., mainly) coupled to the G.alpha.s protein which when stimulated by a ligand (i.e., an agonist to the GsPCR receptor) leads to the activation of the cAMP-dependent pathway thereby increasing the level of cAMP in a cell. When assessing an imbalance between Gi and Gs cellular responses in accordance with the methods of the present invention the activity (cellular response) of any GsPCR may assessed. Also the activity (cellular response) of more than one GsPCR may be assessed at the same time (1, 2, 3, 4 GsPCRs). Non-limiting examples of GsPCRs that can be used in accordance with the present invention include receptors types 5-HT4 and 5-HT7, ACTH receptor, Adenosine receptor types A2a and A2b, Arginine vasopressin receptor 2, .beta.-adrenergic receptors types .beta.1, .beta.2 and .beta.3, Calcitonin receptor, Calcitonin gene-related peptide receptor, corticotropin-releasing hormone receptor, Dopamine receptors D1-like family (D1 and D5), FSH-receptor, Gastric inhibitory polypeptide receptor, Glucagon receptor, Histamine H2 receptor, Luteinizing hormone/choriogonadotropin receptor, melanocortin receptor: MC1R, MC2R (aka ACTH receptor), MC3R, MC4R, MCSR, Parathyroid hormone receptor 1, Prostaglandin receptor types D2 and 12, secretin receptor and thyrotropin receptor. Furthermore, any ligand of a given GsPCR may be used in accordance with the present invention as long as it leads to the activation of the Gs protein and production of cAMP. Of course, the effect of antagonists to GsPCR may also alternatively be used to determine the magnitude of the cellular response to GsPCR stimulation and the use of antagonists is within the scope of the present invention. For example, the IC50 could be calculated to assess magnitude of GsPCR response within a cell. Antagonists to GsPCR are well-known and the skilled practitioner knows how to assess the magnitude of response to GsPCR response in the presence of antagonists. Multiple ligands (agonists and antagonists) for GsPCR may also be used in accordance with the present invention. Ligands (e.g., synthetic or natural) of GsPCRs are well known in the art and several of these ligands are commercially available.
[0128] As used herein, the expression "cellular response" in "determining the cellular response to Gi/Gs stimulation" for example is meant to refer to any detectable cellular response/reaction due to Gi or GsPCR stimulation and/or inhibition (agonist/antagonist ligand binding). For example, any cellular response linked to the activation/inhibition of the cAMP-dependent pathway may be used to assess Gi/GsPCR cellular response in accordance with the present invention. Cellular response to Gi/GsPCR stimulation includes but is not limited to cAMP inhibition/activation; Gi and/or Gs proteins phosphorylation pattern and/or levels, kinases phosphorylation pattern and/or levels (PKA, PKC, CAMK1, CK, CAMK2), cellular proliferation levels, changes in protein-protein interactions and cellular impedance modifications (detected by cellular dielectric spectroscopy (CDS)). All of these cellular responses can be assessed following Gi or Gs-PCR stimulation with any agonists in the presence or absence of antagonists as long as it allows to determine the relative level of GiPCR and/or GsPCR cellular response in order to distinguish between the three endophenotypes (FG1, FG2 and FG3). For example, as disclosed herein, the magnitude of GiPCR response can be assessed and the endophenotypes distinguished based on their relative cellular response in the presence of GP Ant-2 or PTX, which both inhibit GPCRs. FIGS. 15A-15B provide examples of cellular responses expected when stimulating GiPCRs in the presence and absence of OPN.
[0129] "GiPCR/GsPCR stimulation" or "Gi/Gs stimulation" refers to GiPCR or GsPCR activation (ligand binding) leading to a cAMP-dependent cellular response. As noted above Gi/Gs stimulation is achieved by contacting a cell expressing a given GiPCR/GsPCR with its cognate ligand(s).
[0130] The changes in the magnitude of the signal induced by the ligand (i.e., changes in cellular response(s) induced by e.g. an agonist or antagonist) may be detected using any suitable methods. Methods for measuring the magnitude or intensity of the signal (e.g., intracellular response) mediated through GiPCRs are well known in the art. The magnitude of the signal may be determined, for example, by measuring the level of a molecule, such as a second messenger (e.g., cAMP, Ca.sup.2+) or a gene product (e.g., mRNA or protein) whose level is modulated following triggering of the receptor by a ligand. The magnitude of the signal may also be determined, for example, by measuring changes in protein-protein interactions (e.g., by fluorescence resonance energy transfer (FRET); Time Resolved (TR)-FRET or bioluminescence resonance energy transfer (TR-BRET)) following triggering of the receptor by a ligand. Other methods to measure the magnitude or intensity of the signal mediated through GiPCRs include, for example, measurement of cAMP levels (Medhurst et al., 2003. In: J Neurochem., 84), measurement of thallium flux using GIRK-thallium Flux Assay (Niswender et al., 2008; In: Mol Pharmacol. 73(4)), Patch-clamp (Saugstad et al., 1996. In: J. Neurosci. 16), measurement of GTP.gamma.S binding using [.sup.35S] GTP.gamma.S labelling assay (Riobo et al., 2006. In: Proc Natl Acad Sci USA, 103), and measurement of the changes in impedance (Peters et al., 2007. In: J Biomol. Screen. 12: 312-9). Other non-limiting examples of suitable methods include Enzyme Fragment Complementation (EFC), Time Resolved Florescence (TRF), melanophore phenotype and optical biosensor. In an embodiment, the change in magnitude of the signal is determined using the changes in impedance that occurs in the cell following receptor triggering (e.g., cellular dielectric spectroscopy (CDS)). Such measurement may be made, for example, using the real-time cell electronic sensing (RT-CES.TM.) technology (ACEA Biosciences Inc., San Diego, Calif., USA) (Huang et al., Analyst, 2008, 133(5): 643-648; Solly et al., Assay Drug Dev. Technol., 2004, 2(4): 363-372) or using the CellKey.TM. technology (MDS Sciex, Concord, Ontario, Canada) according to the method described below. In a preferred embodiment, the magnitude of a cellular response to Gi or Gs stimulation is determined by (TR)-FRET, EFC, TRF, melanophore phenotype, optical biosensor or CDS.
[0131] In an embodiment, a lower or higher signal refers to a difference of at least about 5%, or 10%, in further embodiments at least about 15%, 20%, 25%, 30%, 35%, 40%, 45% ,50%, 55%, 60%, 65%, 70% 75%, 80%, 85%, 90%, 95% 100%, 120%, 130%, 140%, 150%, 160%, 170%, 180%, 190% or 200% between the signal obtained with the test sample (sample obtained from the subject being tested) relative to the reference (control) signal. In an embodiment, a substantially identical signal refers to a signal that differs by less than 10%, in further embodiments by less than 9%, 8%, 7%, 6% or 5%, as compared to the reference signal.
[0132] In an embodiment, the methods are performed in a format suitable for high throughput assays, e.g., 96- or 384-well format, and suitable robots, (e.g., pipetting robots), and instrumentation may be used. In an embodiment, the assay will be assayed in plates (e.g., 96-wells, 384-wells, etc.) containing the test sample and one or more samples.
[0133] As used herein, the terminology "fold effect" or "Fe", when used in the context of the present invention refers to the effect of OPN on the magnitude of the Gi-mediated cellular response. The fold effect (Fe) of OPN on Gi-mediated response is calculated by dividing the average of response magnitude to Gi stimulation in presence of OPN (RmGiOPN) with the average of response magnitude to Gi stimulation in the absence of OPN (RmGi) using the following formula:
Fe=100.times.(RmGiOPN/RmGi).
[0134] The articles "a," "an" and "the" are used herein to refer to one or to more than one (i.e., to at least one) of the grammatical object of the article.
[0135] The term "including" and "comprising" are used herein to mean, and are used interchangeably with, the phrases "including but not limited to" and "comprising but not limited to".
[0136] The terms "such as" are used herein to mean, and is used interchangeably with, the phrase "such as but not limited to".
[0137] The present invention is illustrated in further details by the following non-limiting examples.
[0138] The classification protocols described below details embodiments of the experimental and analytical procedure for a cell-based assay developed in Applicants' laboratory as a functional test to predict the risk of developing idiopathic scoliosis in asymptomatic and IS subjects (e.g., AIS). In a first aspect of the present invention, the assay comprises the evaluation of the functional status (relative cellular response) of Gi and Gs proteins in cells (e.g., peripheral blood mononuclear cells (PBMCs)) by e.g., changes in impedance (e.g., cellular dielectric spectroscopy (CDS) assessed using e.g., CellKey.TM. apparatus) and in the classification of children into functional groups (FG1, FG2, FG3) with respect to the difference between the degree of response to Gi and Gs proteins stimulation (.DELTA.G). Of course, any other suitable methods of assessing Gi and Gs cellular response (e.g., TR-FRET; EFC, TRF, melanophore phenotype and optical biosensor) can be used in accordance with the present methods. The classification is further confirmed by the determination of the effect of osteopontin (OPN) on the subject's cellular response to Gi stimulation.
[0139] In accordance with the technique followed in Examples 1 and 2 below, approximately a volume of 10 mL of blood is required to extract PBMCs by Ficoll-gradient and cells are then stored in liquid nitrogen. The optimal number of PBMCs (about 1.5.times.10.sup.5 cells or more) to perform the assay is obtained after about two days of cell culture. Essentially, cells are first incubated with phytohemmaglutinin (PHA). After 24 h incubation, the medium is replaced by a PHA-free culture medium for an additional 24 h prior to cell seeding and OPN treatment. Cells are then spectroscopically screened for their response to somatostatin and isoproterenol which activate Gi and Gs proteins, respectively, through their cognate receptors. Both somatostatin and isoproterenol are simultaneously injected with an integrated fluidics system and the cells' responses are monitored for 15 min.
[0140] The assay can be performed with fresh or frozen PBMCs (conserved frozen for up to one year) and the procedure is completed within 4 days. Since using freshly isolated PBMCs may be cumbersome when testing large number of individuals, frozen PBMCs may optimally be used and offer a more practical alternative in clinical setting. In addition, the use of frozen PBMCs allows simultaneous analysis, within a single assay run, of PBMCs samples from multiple time points during a longitudinal study. To maximize assay reproducibility, Applicants recommend avoiding freeze-thaw cycle and using the frozen sample only once. The procedure is very simple, allowing for accurate detection of defective Gi protein function in a short time. Using this procedure, asymptomatic and scoliotic children can be easily classified to better predict their clinical outcome without any danger for their health. However, when performing classification according to the degree of maximum response to Gi stimulation relative to the healthy control subjects.sup.12, the fact that these control subjects should, not only match with age and gender of scoliotic or asymptomatic children, but also not be on any medication, may constitute an important obstacle for the recruitment of control subjects. Therefore, performing classification by examining the degree of imbalance between response to Gi and Gs protein stimulation (i.e. average of response magnitude to Gi stimulation (RmGi) minus the average of response magnitude to Gs stimulation (RmGs)) in the same individual is ideal to eliminate the necessity of using control subjects.
[0141] The use of the CDS-based system to perform this prognostic test advantageously simultaneously provides Gi- and Gs-mediated cellular response in the same assay.
[0142] Certain patients will exhibit borderline values in the .DELTA.G CDS-based assay (or other classification methods based on e.g., Gi cellular response detection) making them difficult to classify, as illustrated by results presented in FIG. 4. Applicants have discovered that OPN induces a Gi-mediated cellular response that varies between the three functional groups. Applicants have found that in the presence of OPN, the response to Gi stimulation increases in functional FG1, while it decreases in FG2, and, to a lesser extent, in FG3.
[0143] The present invention is illustrated in further, details by the following non-limiting examples.
EXAMPLE 1
Materials and Methods
[0144] Reagents and equipment. Table 2 presents the reagents, equipment and their sources used in an embodiment of the method of the present invention.
TABLE-US-00003 TABLE 2 Name Company Catalog Number Comments RPMI Wisent Inc 350-005-CL FBS Therno Scientific SH3007103 Hyclone DMSO Sigma Aldrich D2650 Ficoll-Plaque GE Healthcare 17144003 Antibiotic-Antimycotic Invitrogen 15240-062 Phytohemagglutinin (PHA) Invitrogen (Gibco) 10576-015 Recombinant Human Osteopontin R & D Systems, Inc 1433-OP/CF Somatostatin Tocris 1157 Isoproterenol Tocris 1743 PBS Wisent Inc 311-010-CL Sterile pipette tips Axygen Scientific 301-06-451 Sterile Eppendorf tubes Ultident 24-MCT-150-C 50 mL conical tubes VWR International 89039-658 Cellkey .TM. Small sample 96W Molecular Devices 1026496 microplate Cellkey .TM. tips Cybio OL3800-25-559N Pre-cut pierceable seals Excel Scientific, Inc. XP-100 Equipment Automated cell counter Beckman Coulter 731050 (Vicell XR) Cell culture hood Forma Scientific 1284 Class II Liquid Nitrogen storage Thermo Scientific CY5093570 Water bath VWR International 89032-204 Standard light microscope Leica Microsystems DMIL LED Cell culture incubator Thermo Scientific 51019557 5% CO.sub.2 at 37.degree. C. Low speed centrifuge Thermo Scientific 75004364 Cellkey .TM. system Molecular Devices 1019185
[0145] The solutions are prepared according to Table 3. The balanced salt solution (BSS) is kept at room temperature and all other solutions at 4.degree. C. until the time of use. Cold media is warmed to 37.degree. C. in a water bath for a few minutes before using.
TABLE-US-00004 TABLE 3 Solutions Solution A Anhydrous D-glucose 0.1% CaCL.sub.22H2O 0.05 mM MgCL.sub.2 0.98 mM KCL 5.4 mM Tris 145 mM Solution B NaCL 140 mM Balanced Salt Solution A 1 volume Solution (BSS) Solution B 9 volume Complete media RPMI-1640 500 mL Antibiotic-antimycotic 1% FBS 10% Supplementary RPMI-1640 50 mL media Antibiotic-antimycotic 1% FBS 40% Freezing media RPMI-1640 50 mL Antibiotic-antimycotic 1% FBS 40% DMSO 20% PHA media RPMI-1640 500 mL Antibiotic-antimycotic 1% FBS 10% Phytohemaglutinin 1%
[0146] 1. Preparation of solutions: 1. Prepare solutions according to Table 3 above. 2. Keep balanced salt solution (BSS) at room temperature and all other solutions at 4.degree. C. until the time of use. 3. Heat media to 37.degree. C. in the water bath for a few minutes before using.
[0147] 2. Preparation and storage of PBMCs. 1. Collect 10 mL of whole blood in EDTA-treated collection tubes to prepare two aliquots of PBMCs using 5 mL for each aliquot. 2. Transfer 5 mL of whole blood from the EDTA-treated collection tube to a 50 mL tube. 3. Add an equal volume of BSS and mix sample by gentle pipetting up and down. 4. Place 3 mL of Ficoll in two 15 mL Falcon tubes. 5. Carefully layer 4.5 mL of diluted blood mixture over the Ficoll in each tube. 6. Let the tubes rest for up to 5 minutes to favor a clear separation of the blood and Ficoll. 7. Centrifuge the tubes at 400.times.g for 30 minutes at room temperature with no brake. 8. Carefully remove the tubes from the centrifuge so as to not disturb the layering. The PBMCs are visible at the BSS/Ficoll interface. 9. Harvest the cloudy layer of PBMCs at the interface of both tubes with a pipette and transfer to a new 50 mL tube. 10. Add 20 mL of complete media. 11. Centrifuge the tube at 288.times.g for 7 minutes at room temperature. 12. Remove the supernatant by aspiration. 13. Re-suspend the cell pellet in 500 .mu.L of supplementary media. 14. Add an equal volume of freezing media. 15. Transfer the cell suspension to a cryovial. 16. Place the cryovial into a cryofreezing container with isopropanol. 17. Store the freezing container at -80 .degree. C. overnight. 18. Transfer the frozen PBMCs aliquot to liquid nitrogen for long-term storage.
[0148] 3. Functional Assay: Day 1: 1. Place PBMCs aliquot from liquid nitrogen in water bath at 37.degree. C. for a minute or until defrosted. 2. Transfer the cell suspension to a 50 mL tube with a sterile pipette. 3. Add 15 mL of Complete media and spin the cells down at 200.times.g for 5 minutes at room temperature. 4. Remove the supernatant by aspiration. 5. Gently suspend cell pellet in 1 mL of PHA media. 6. Complete the volume to 20 mL with the same media. 7. Cap the tube loosely to allow air to enter. 8. Leave the tube overnight at 37 .degree. C. in a CO.sub.2 incubator to allow quiescent lymphocytes to transform into rapidly-proliferating lymphoblasts.
[0149] Day 2: 1. Take the tube out of the incubator, screw the caps completely and spin the cells down at 200.times.g for 5 min at room temperature. 2. Remove the supernatant by aspiration. 3. Gently suspend cell pellet in 1 mL of complete media. 4. Complete the volume to 20 mL with the same media. 5. Cap the tube loosely to allow air to enter. 6. Leave the tube overnight at 37.degree. C. in a CO.sub.2 incubator to expand cell numbers.
[0150] Day 3: 1. Take the tube out of the incubator, screw the caps completely and spin the cells down at 200.times.g for 5 mM at room temperature. 2. Remove the supernatant by aspiration. 3. Wash cells twice with 10 mL of RPMI-1640 (media developed for growing human normal and neoplastic leukocytes (peripheral blood lymphocytes)) by centrifugation at 200.times.g for 5 mM at room temperature. 4. Gently re-suspend the cell pellet in 600 .mu.L of RPMI-1640. 5. Measure the cell concentration and viability, using an automated cell counter and viability analyzer. 6. Add appropriate volume of RPMI-1640 to adjust to a cell concentration of 1.5.times.10.sup.5 cell/20 .mu.L. 7. Treat cells with recombinant OPN (rOPN) or vehicle (PBS). 7.1 Transfer 100 .mu.L of cell suspension to two sterile 1.5 ml eppendorf tubes. 7.2 Add rOPN in one tube to a final concentration of 0.5 .mu.g/mL. 7.3 Add an equal volume of PBS in the second tube. 7.4 Gently mix each condition by pipetting up and down twice using a sterile pipette set at 100 .mu.L. 8. Prepare the small sample 96-well microplate. 8.1 Add 5 .mu.L of RPMI-1640 to each well. 8.2 Centrifuge the plate at 200.times.g for 3 min to remove any air bubbles. 9. Seed the untreated cells as well as cells treated with rOPN or PBS. 9.1 Before transferring cells from tube to microplate, gently pipette up and down once to ensure a uniform suspension of cells. 9.2 Add 40 .mu.L of cell suspension per well in quadruplicate for untreated cells, in duplicate for rOPN or PBS treated cells. Refer to FIG. 1 for the design. This design allows 12 patients to be tested on the same microplate. 9.3 Leave the cell plate under the sterile hood for 5 minutes to allow cells to rest and settle evenly to the bottom of the well before placing in the incubator. 9.4 Incubate the plate for 18 h at 37.degree. C. in a CO.sub.2 incubator to optimise the effect of OPN.
[0151] Day 4: 1. Run the plate with compounds. 1.1 Take the plate out of the incubator and leave it at room temperature for around 30 mM 1.2 Prepare 1 mL of 100 .mu.M of Somatostatin (which activates Gi-mediated cellular response) and isoproterenol (which activates Gs-mediated cellular response) in RPMI-1640 by adding 10 .mu.L of stock solution (10 mM) in 990 .mu.L of RPMI-1640. 1.3 Fill the compound plate by dispensing 20 .mu.L in appropriate wells as indicated in FIG. 2. 1.4 Cover the compound plate with a pre-cut pierceable seal to avoid change in compound concentration due to evaporation before or during incubation in the CDS-based system. 1.5 Load cell plate, pipette tips and compound plate into the CDS-based system. 1.6 Name the plate in the CDS-based instrument software. 1.7 Select the appropriate protocol. 1.8 The integrated fluidics system simultaneously adds the compounds to all wells by injecting 5 .mu.L per well to achieve a final concentration of 10 .mu.M in a total volume of 50 .mu.L. 1.9 The CDS-based system automatically collects the data for 15 min after compound addition.
[0152] Data Analysis: 1. Select low and high ranges of frequencies to use when calculating extracted values for the non-adherent cells. 2. Select drift correction to correct the linear change in baseline impedance measurements over time. 3. Select data filtering to reduce variations in the kinetic response measurement due to electronic noise and compound addition. 4. Select the Max-Min method for the full analysis time. 5. Export data to Excel under the plate format option. 6. Calculate delta G (.DELTA.G) by subtracting the average of response magnitude to Gi stimulation (RmGi) from the average of response magnitude to Gs stimulation (RmGs) using the following formula:
.DELTA.G=RmGi-RmGs
[0153] 7. Calculate the percentage of the fold effect (Fe) of OPN on Gi-mediated response by dividing the average of response magnitude to Gi stimulation in presence of OPN (RmGiOPN) with the average of response magnitude to Gi stimulation in presence of PBS (RmGiPBS) using the following formula:
Fe=100.times.(RmGiOPN/RmGiPBS)
[0154] Refer to Table 4 to classify patients.
TABLE-US-00005 TABLE 4 Dynamic ranges Functional Dynamic ranges with .DELTA.G Groups with Fe .DELTA.G < -10 FG1 Fe > 100% -10 < .DELTA.G < +10 FG2 Fe < 50% .DELTA.G > +10 FG3 50% < Fe < 95%
EXAMPLE 2
IS Subjects or Sujects at Risk of Developing IS can be Classified According to their Response to OPN Stimulation
[0155] Cell viability was comparable between all samples with values consistent in the range of 86 and 96%. In contrast, high variations were noted in cell numbers among samples (FIG. 3). Of the 32 pre-classified samples used, two had insufficient number of cells and have not been further classified. The functional classification of all patient samples used had been previously determined using one or more alternative classification method (e.g., cAMP-detection, impedance modification, etc.). An illustration of the functional classification according to the .DELTA.G determined with CDS is showed in FIG. 4. The vertical axis of this figure is divided into three sections delineating the functional groups with dynamic ranges established as >+10 for FG3, between +10 and -10 for FG2 and finally <-10 for FG1. Among 30 patients tested 14, 6 and 5 patients were clearly classified into groups FG3, FG2 and FG1, respectively, while five patients notably 345, 353, 370, 371 and 382 had borderlines values (see FIG. 4).
[0156] The evaluation of the OPN effect on the response to Gi stimulation revealed that OPN increased the response in patients 353 and 371. In contrast, the response was reduced by more than 50% in patients 345 and 382 and by less than 50% in patient 370 following rOPN treatment (FIG. 5). According to the classification criteria (Table 4) it was possible to categorize patients 353 and 371 in FG1, patients 345 and 382 in FG2, and patient 370 in FG3.
[0157] In parallel, all patients were screened for their response to Gi protein stimulation and compared to control subjects. As expected, the latter classified the borderline subjects in the same functional group as the method determining the Gi mediated response in the presence or absence OPN ("Gi/OPN") did (FIGS. 6A-6D). The classification of a large cohort of scoliotic patients regularly followed in our special clinic at Sainte-Justine Hospital has revealed that the three functional groups were similarly distributed among moderate cases, while the FG2 was predominant among severe cases (FIG. 7), identifying patients categorized into this functional group as more at risk for severe progression of the disease and indicating that this classification test can be useful in the prognosis of IS.
EXAMPLE 3
IS Subjects or Sujects at Risk of Developing IS can be Classified According to their Impedance Signature in Response to GiPCR Stimulation in Four Distinct Receptor Clusters
[0158] In order to demonstrate that to determine if the reduced ability of Gi proteins to promote signal transduction in AIS is a generalized impairment and is not restricted to melatonin receptors, we performed a comparative study with various synthetic compounds activating selectively other receptors coupled to Gi proteins. A total of ten compounds were tested and the representative refraction index curves generated by each of these compounds in control and AIS osteoblasts are illustrated in FIGS. 10A-10J). Analysis of impedance signature revealed that the tested compounds fell into four distinct clusters. In the cluster I (FIGS. 10A-10C), compounds elicit shapes of impedance profiles similar to those obtained with melatonin, consisting of a biphasic shape of impedance in all three AIS groups with a negative phase of larger extent for FG1. In cluster II (FIGS. 10D and 10E), the compounds elicit negative response only in FG1. In cluster III (FIGS. 10F and 10G), the compounds elicit a relatively short transient negative phase of a similar extent in all three AIS groups, while in cluster IV (FIGS. 10H-10J), the compounds totally lack this feature and elicit complete positive impedance in all AIS groups. Despite these differences in the shape of impedance profiles, the regression analysis of concentration-response curve of each tested compound revealed no significant difference in EC50 values between control and AIS groups (Table 5), while all groups were clearly distinguished by the amplitude of their maximum response (data not shown). In each case, the three AIS functional groups were less responsive than the control group. The reduction degree for each functional group relative to the control group was similar to that obtained with melatonin. This suggests that AIS patients can be classified using agonists of any GiPCR, with respect to the range of values as established with a melatonin receptor agonist.
[0159] Furthermore, based on the impedance profiles provided in FIGS. 10D-10E for cluster II agonists, it is possible to rapidly distinguish subjects belonging to the FG1 functional group over those belonging to the FG2 and FG3 functional groups. Indeed, subjects belonging to the FG1 functional group show a characteristic reduction in impedance, which is not present for the FG2 and FG3 groups.
TABLE-US-00006 TABLE 5 Potency of various GiPCR agonists for impedance response in osteoblasts from control and AIS patients Control FG1 FG2 FG3 EC.sub.50 (nM) EC.sub.50 (nM) EC.sub.50 (nM) EC.sub.50 (nM) Melatonin 33.4 .+-. 8.4 42.3 .+-. 9.4 48.68 .+-. 6.4 45.79 .+-. 5.3 LPA 8.52 .+-. 1.5 8.78 .+-. 0.6 8.54 .+-. 1.4 8.59 .+-. 1.2 DAMGO 18.78 .+-. 2.2 18.67 .+-. 2.1 19.11 .+-. 2.3 19.88 .+-. 2.4 NECA 20.85 .+-. 2.2 20.88 .+-. 1.7 20.83 .+-. 1.2 22.25 .+-. 2.2 CB65 13.91 .+-. 1.2 13.97 .+-. 1.2 13.7 .+-. 1.2 13.95 .+-. 1.3 UK14304 16.48 .+-. 2.3 18.52 .+-. 4.2 16.65 .+-. 1.6 17.8 .+-. 1.3 Somatostatin 31.12 .+-. 3.3 31.23 .+-. 3.1 31.3 .+-. 2.6 30.98 .+-. 2.3 MMK1 48.95 .+-. 4.3 50.51 .+-. 2.3 50.45 .+-. 5.2 51.58 .+-. 2.3 Apelin-17 32.50 .+-. 2.3 32.45 .+-. 2.6 32.67 .+-. 1.9 39.1 .+-. 2.4 BP554 22.30 .+-. 1.7 22.33 .+-. 2.3 22.50 .+-. 1.6 22.37 .+-. 1.5 Quinpirole 43.57 .+-. 4.1 45.39 .+-. 4.2 47.1 .+-. 3.2 48.7 .+-. 5.1
EXAMPLE 4
IS Subjects or Sujects at Risk of Developing IS can be Classified According to their Response to GiPCR Stimulation in the Presence of PTX
[0160] The effect of PTX on response to various selective agonists of Gi-coupled receptors was tested in AIS endophenotype groups FG1, FG2 and FG3 in four gene clusters.
[0161] The amount of functional Gi proteins was selectively decreased by incubating osteoblasts with pertussis toxin (PTX) and Melatonin. Results showed that treatment with PTX did not alter the initial drop of the impedance response to melatonin in AIS groups but dramatically reduced the positive component as well in control as in AIS groups (FIG. 11A).
[0162] The concentration-response curve describing the maximum impedance response showed that at low concentrations, PTX inhibited the response to melatonin in control and AIS groups, while at high concentrations, this treatment selectively increased response in FG1 (FIG. 11B). These results support a relationship between the divergent defective melatonin signaling and reduced Gi protein activity among AIS groups and raise the possibility of a compensatory Gi-independent signaling pathway in AIS patients classified in FG1 group.
[0163] To determine if the reduced ability of Gi proteins to promote signal transduction in AIS is restricted to melatonin receptors, a comparative study using various agonists belonging to the four previously identified receptor clusters (see Example 3) in the presence of PTX was performed.
[0164] As shown in FIGS. 12A-12J, following treatment with PTX at higher concentrations, only receptor agonists of clusters I and II (FIGS. 12A-12E) elicited increased response in FG1 as observed following melatonin receptor stimulation, while response to receptor agonists of clusters III and IV in contrast, were abolished in all groups (FIGS. 12F-12J). This supports the notion of a compensatory Gi-independent signaling in FG1 but independent of the receptor.
[0165] Based on these results, FG1 functional group could be easily distinguished by their response to cluster I and cluster II agonists in the presence of PTX. This test could advantageously be used to stratify borderline subjects (which may not be identified as belonging to the FG1 or FG2 functional group with sufficient confidence (high specificity) using other known methods or other GiPCR ligands.
[0166] Whether this signaling defect is confined in osteoblasts was examined by extending the analysis on myoblasts and PBMCs. It was found that both cell types exhibited a response pattern similar to that obtained with osteoblasts following stimulation with each of the tested compounds (data not shown). These findings are strongly indicative that the defective Gi-mediated signaling is a generalized impairment expressed in AIS.
EXAMPLE 5
Differential Effects of Gs and Gq Knockdown by SiRNA Method on the Biphasic Impedance Signature of giPCR Agonists Among AIS Groups
[0167] All Gi.sub.1, Gi.sub.2, Gi.sub.3, Gs and scrambled siRNA were obtained from Ambion (Ambion USA). The sequences used for gene silencing are shown in supplemental Table 3. Osteoblasts from control subjects and AIS patients were transiently transfected in serum-free medium, using Lipofectamine RNAiMAX reagent (Invitrogen) according to the manufacturer's instructions and functional experiments were performed 48 h post transfection. The gene knockdown was evaluated by quantitative real-time PCR (qPCR).
[0168] The possibility that the disparity in the shape of impedance among AIS groups in response to GiPCR activation implicates a component of Gs or Gq proteins-dependent response was then examined For this purpose, the small interference RNA (siRNA) approach to knockdown Gs or Gq examined For this purpose, the small interference RNA (siRNA) approach was used to knockdown Gs or Gq proteins prior to stimulate cells. Efficiency of siRNA was confirmed by qPCR (FIG. 13A) and western blot analyses (FIG. 13B). Results illustrated in FIGS. 14A-14P show that Gs or Gq protein deletion has no effect on the impedance signature of GiPCR agonists in control group (FIGS. 14A, 14E, 14I, 14M) for any agonist cluster. In contrast, in FG1 (FIGS. 14B, 14F, 14J, 14N), the negative phase was completely abrogated by the deletion of Gs protein for clusters I and II and by the deletion of Gq protein for cluster III, while the positive phase remained unaffected by these deletions in all clusters. In FG2 subgroup (FIGS. 14C, 14G, 14K, 14O), the deletion of Gs protein was without effect on the negative phase in any clusters, while deletion of Gq protein led to the loss of negative phase without affecting the positive phase. Similar observations were noticed in FG3 (FIGS. 14D, 14H, 14L, 14P). These results suggest that Gs and Gq protein-dependent responses are integrated in the biphasic impedance signature of GiPCR in AIS. It appears that reduced Gi proteins associated with this disease favours the functional duality of these receptors and that the dual coupling to Gi and Gs protein is exclusively favoured in FG1.
[0169] The scope of the claims should not be limited by the preferred embodiments set forth in the examples but should be given the broadest interpretation consistent with the description as a whole.
REFERENCES
[0170] Kane, W. J. Prevalence: a call for a statement of terms. Clin Orthop. Relat Res. 126, 43-46 (1977). [0171] Bunnell, W. P. Selective screening for scoliosis. Clin Orthop Relat Res. 434, 40-45 (2005). [0172] Asher, M. A. & Burton, D. C. Adolescent idiopathic scoliosis: natural history and long term treatment effects. Scoliosis. 1(1), 2 (2006). [0173] Fong, D. Y., Lee, C. F., Cheung, K. M., Cheng, J. C., Ng, B. K., Lam, T. P., Mak, K. H., Yip, P. S. & Luk, K. D. A meta-analysis of the clinical effectiveness of school scoliosis screening. Spine (Phila Pa 1976). 35(10),1061-1071 (2010) [0174] Chowanska, J., Kotwicki, T., Rosadzinski, K. & Sliwinski, Z. School screening for scoliosis: can surface topography replace examination with scoliometer? Scoliosis. 7(9), 1748-7161 (2012). [0175] Kim, H., Kim, H. S., Moon, E. S., Yoon, C. S., Chung, T. S., Song, H. T., Suh, J. S., Lee, Y. H. & Kim, S. Scoliosis imaging: what radiologists should know. Radiographics. 30(7), 1823-1842 (2010) [0176] Wong, H. K., Hui, J. H., Rajan, U. & Chia, H. P. Idiopathic scoliosis in Singapore schoolchildren: a prevalence study 15 years into the screening program. Spine (Phila Pa 1976). 30(10), 1188-1196 (2005). [0177] Nachemson, A. A long term follow-up study of non-treated scoliosis. Acta Orthop [0178] Scand. 39 (4), 466-476 (1968). [0179] Enneking, W. F., & Harrington, P. Pathological changes in scoliosis. J Bone Joint Surg Am. 51 (1), 165-84 (1969). [0180] Miller, N. H. Cause and natural history of adolescent idiopathic scoliosis. Orthop Clin North Am. 30(3), 343-52 (1999). [0181] Nash, C. L. Jr., Gregg, E. C., Brown, R. H., & Pillai, K. Risks of exposure to X-rays in patients undergoing long-term treatment for scoliosis. J Bone Joint Surg Am. 61 (3), 371-400 (1979). [0182] Akoume, M. Y., Azeddine, B., Turgeon, I., Franco, A., Labelle, H., Poitras, B., Rivard, C H., Grimard, G., Ouellet, J., Parent, S., & Moreau, A. Cell-based screening test for idiopathic scoliosis using cellular dielectric spectroscopy. Spine (Phila Pa. 1976). 35 (13), 601-608 (2010). [0183] Akoume, M. Y., Veillette, M., Elbakry, M., Julien, C., Franco, A., Labelle, H., Poitras, B., Rivard, C H.,Grimard, G., Ouellet, J., Parent, S., Lombardi, G., Colombini, A., Banfi, G., Brayda-Bruno, M., & Moreau, A. Disrupted Gi-coupled receptor signaling occurs in adolescent idiopathic scoliosis. J. clin. Invest. (2013) (submitted) [0184] Verdonk, E, Johnson, K, McGuinness, R., Leung G., Chen, Y. W., Tang, H. R., Michelotti, J. M. & Liu, V. F. Cellular dielectric spectroscopy: a label-free comprehensive platform for functional evaluation of endogenous receptors. Assay Drug Dev Technol. 4(5), 609-6019 (2006). [0185] Moreau, A., S. Forget, et al. (2004). "Melatonin signaling dysfunction in adolescent idiopathic scoliosis." Spine 29(16): 1772-1781. [0186] Azeddine, B., K. Letellier, et al. (2007). "Molecular determinants of melatonin signaling dysfunction in adolescent idiopathic scoliosis." Clin Orthop Relat Res 462: 45-52. [0187] Letellier, K., B. Azeddine, et al. (2008). "Estrogen cross-talk with the melatonin signaling pathway in human osteoblasts derived from adolescent idiopathic scoliosis patients." J Pineal Res 45(4): 383-393. [0188] PCT/CA2014/050562.
* * * * *
D00001
D00002
D00003
D00004
D00005
D00006
D00007
D00008
D00009
D00010
D00011
D00012
D00013

D00014

D00015

D00016

D00017

D00018

D00019

D00020

D00021

D00022

D00023

D00024

D00025

D00026

D00027

D00028
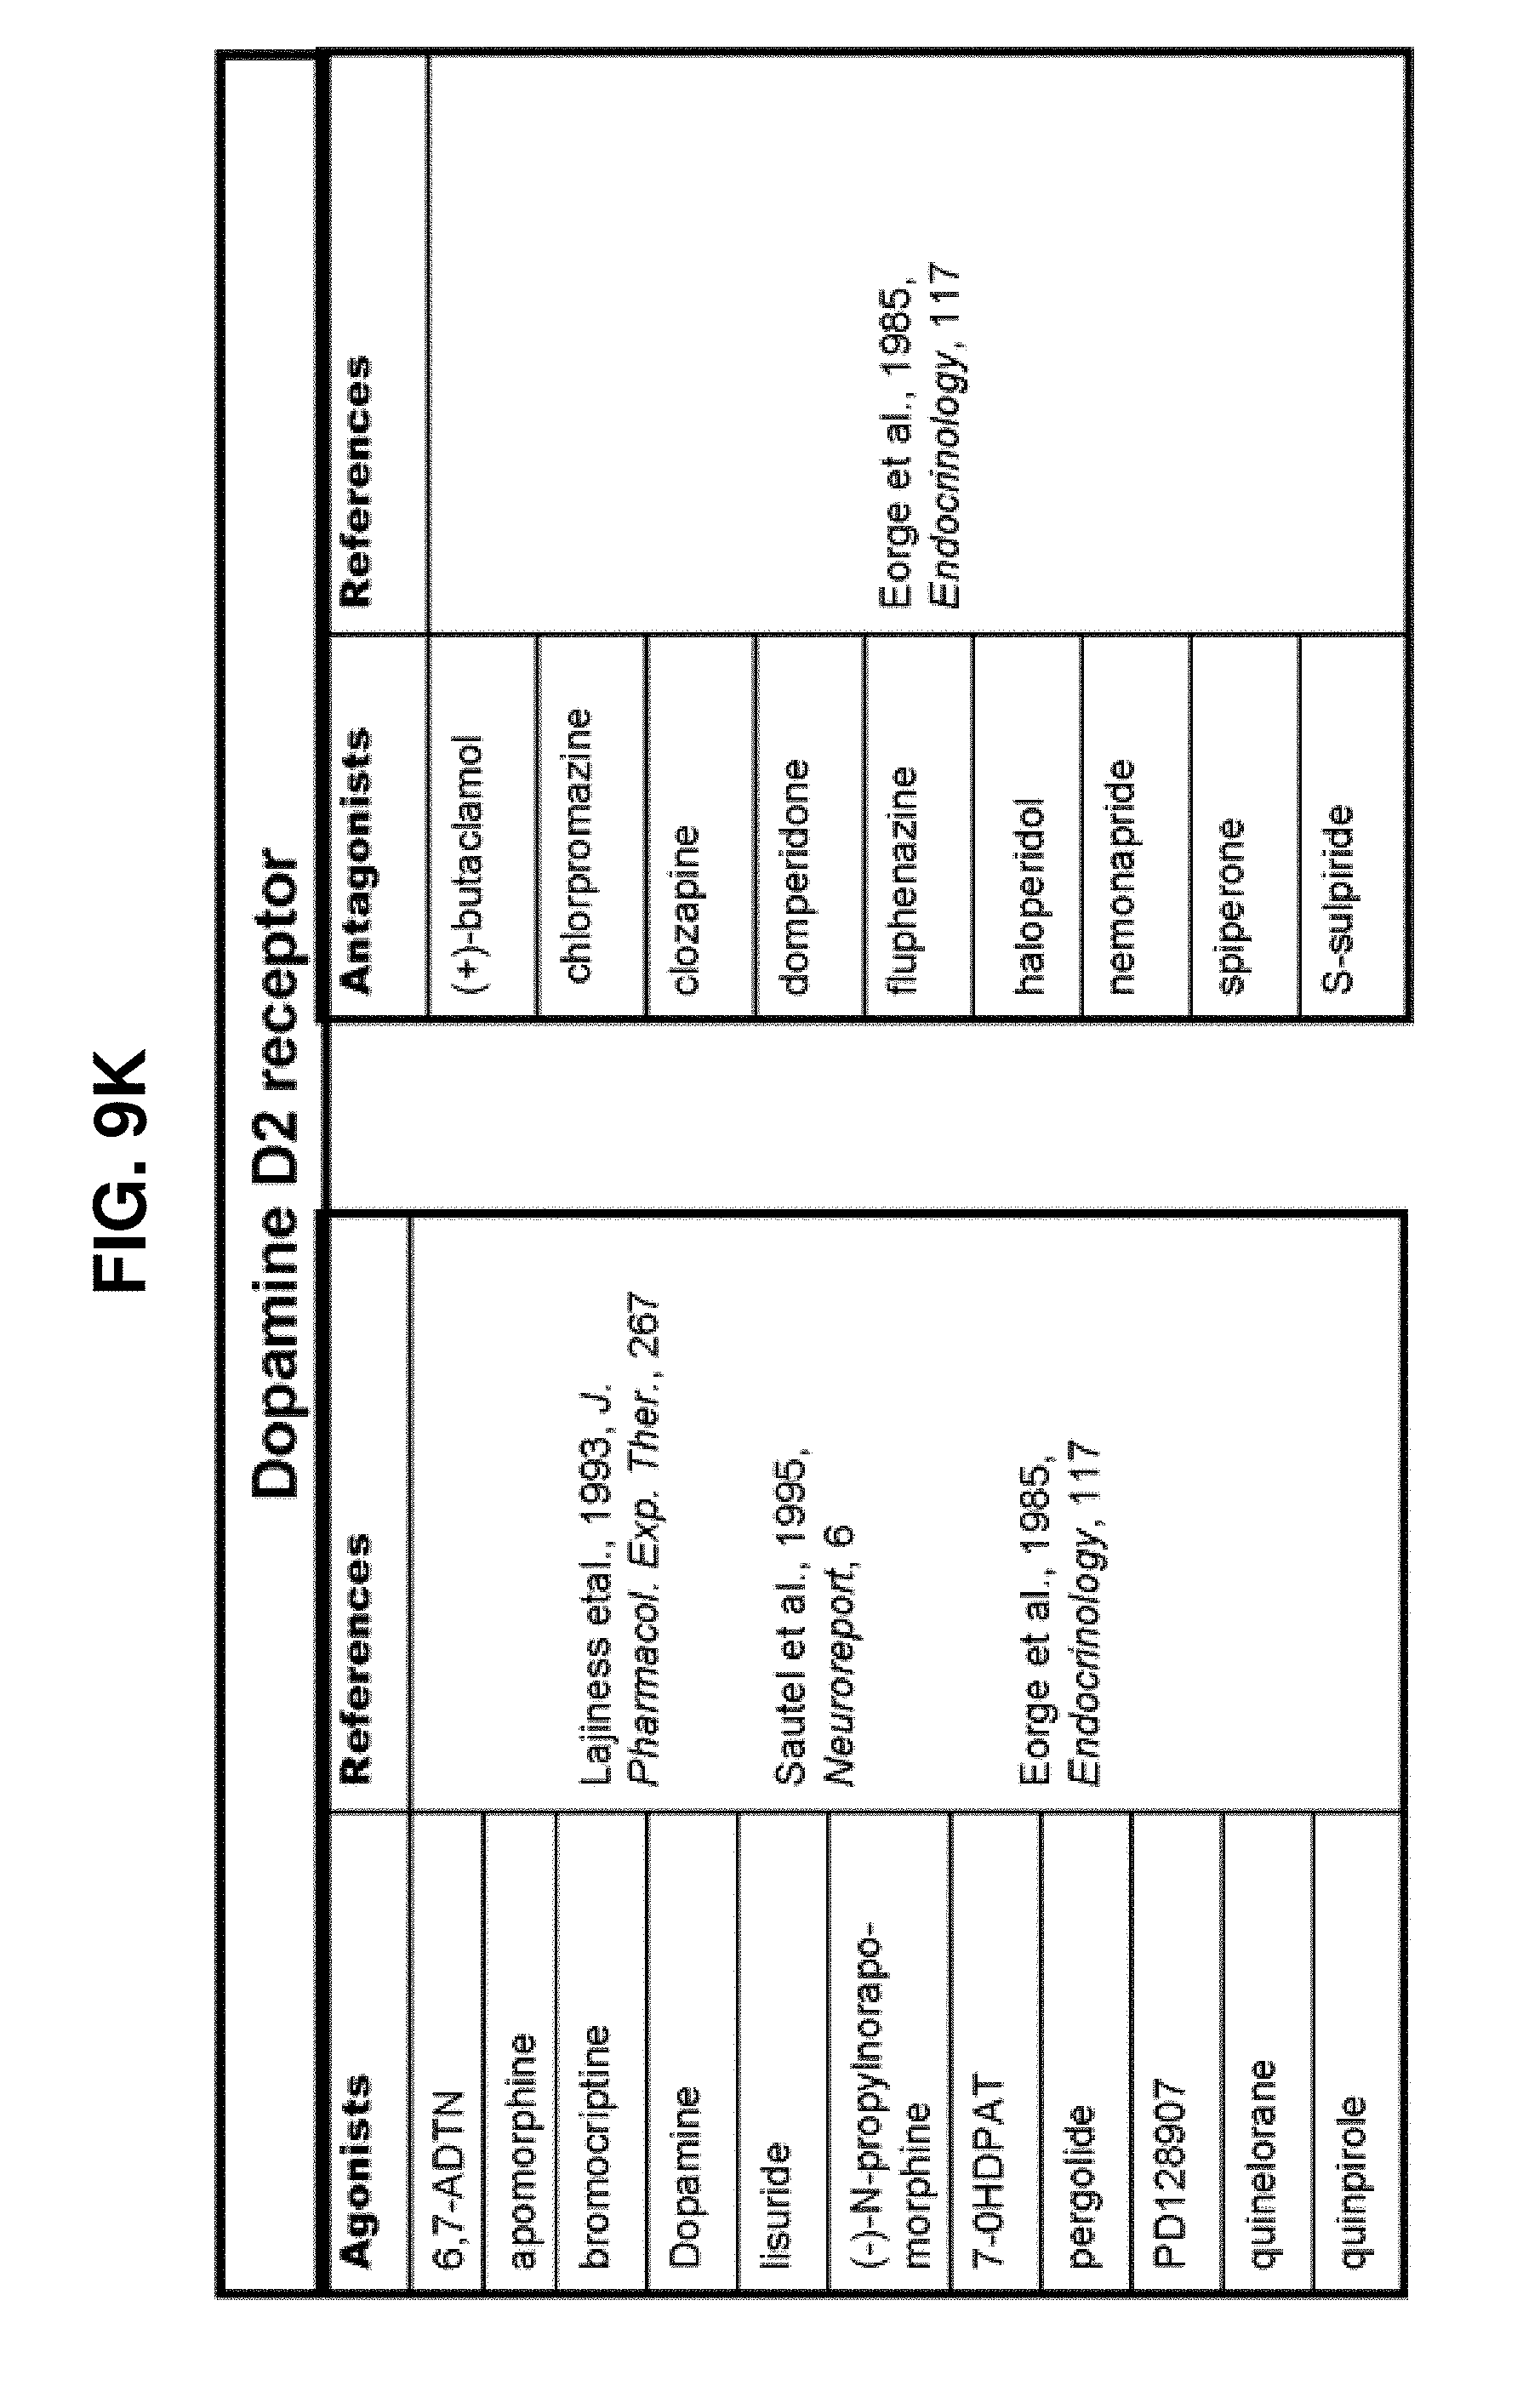
D00029

D00030
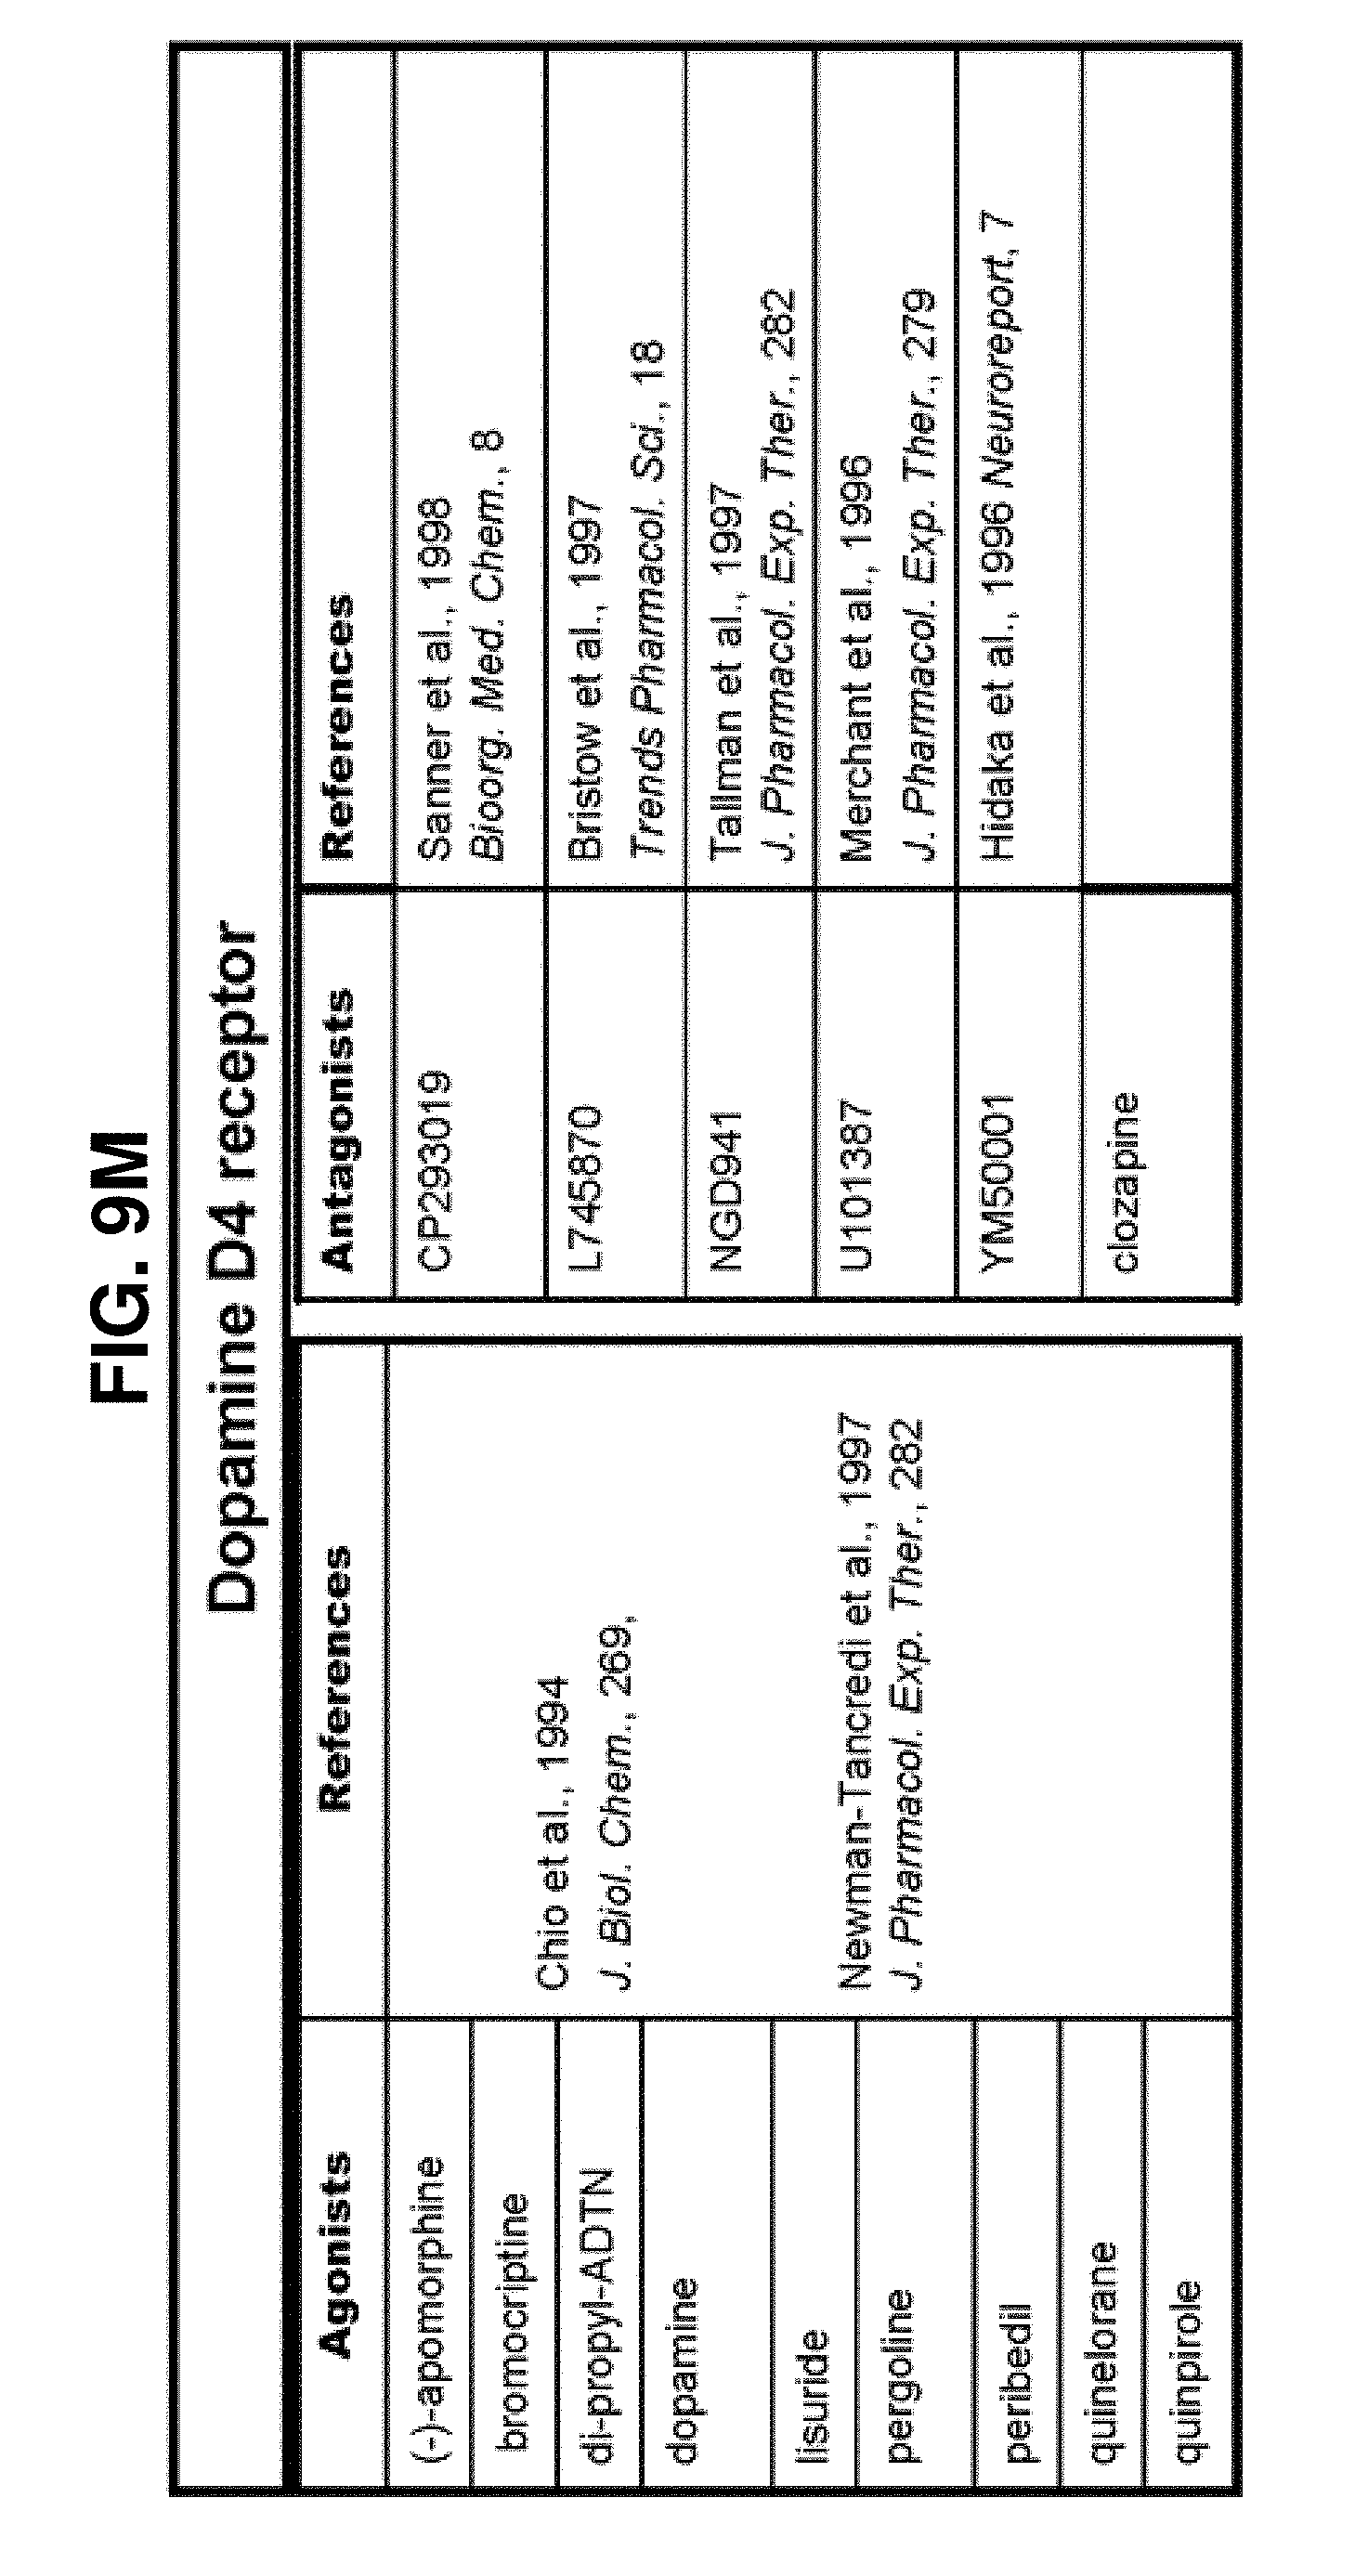
D00031

D00032

D00033

D00034

D00035

D00036

D00037

D00038
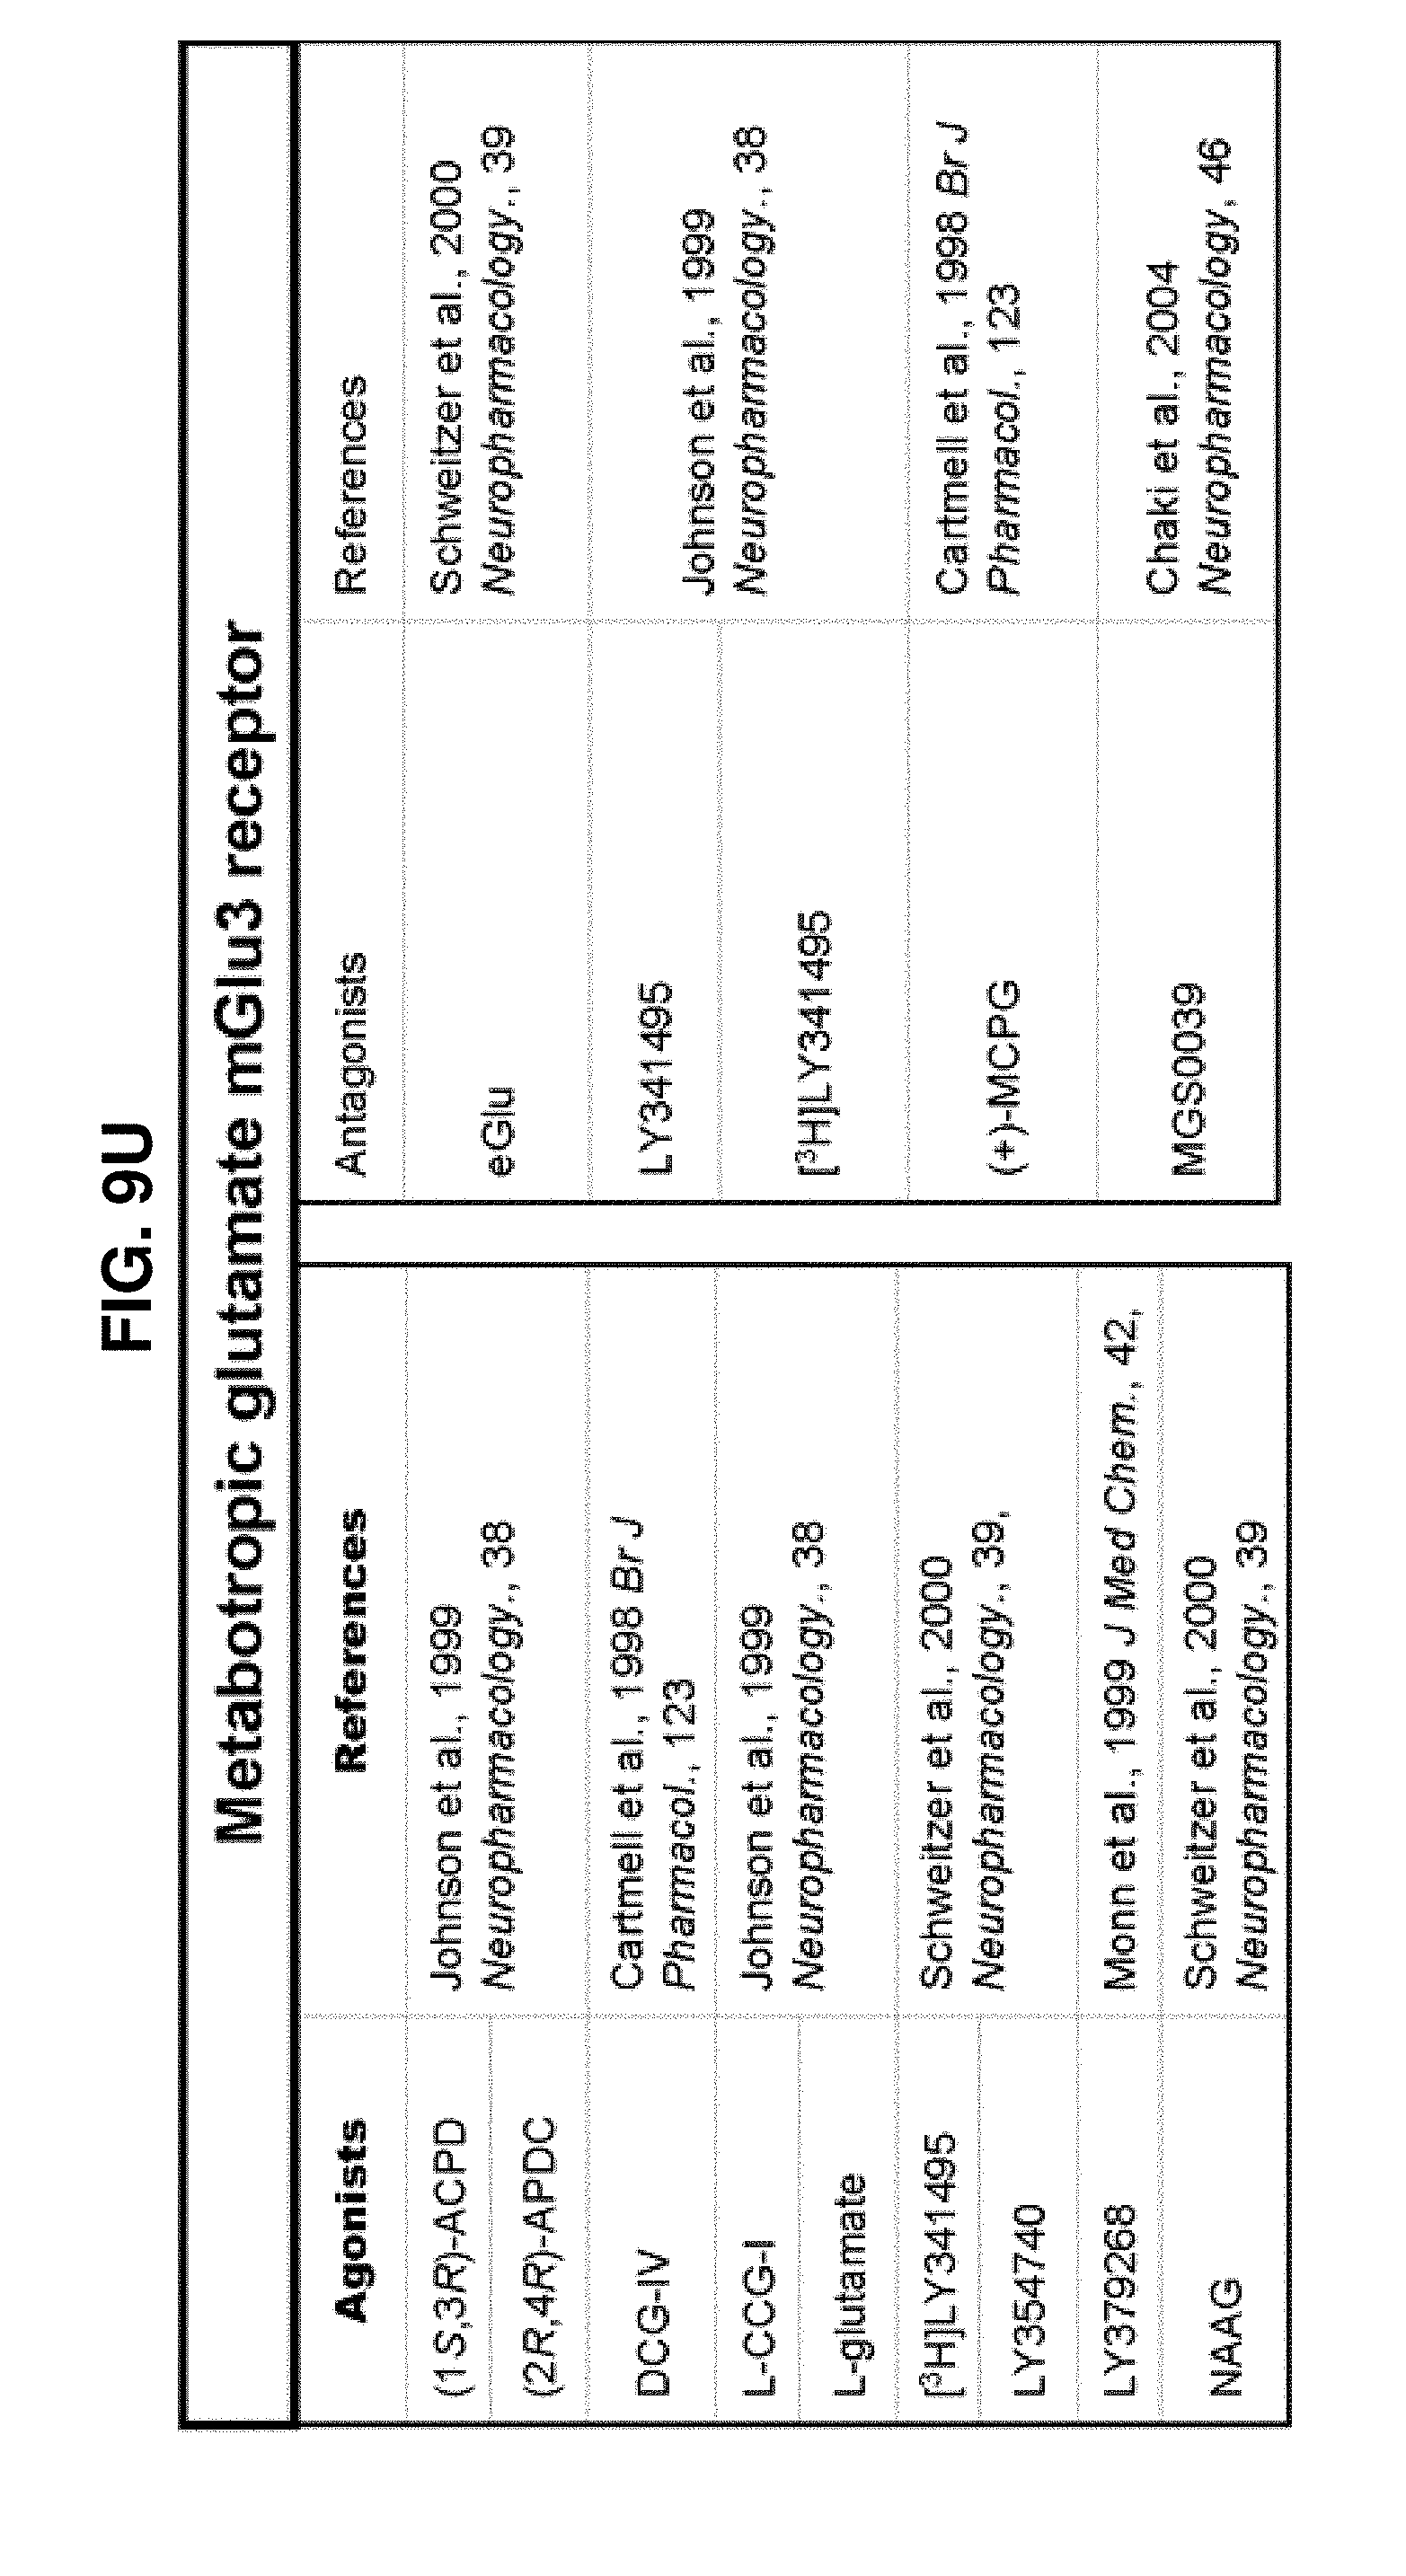
D00039

D00040
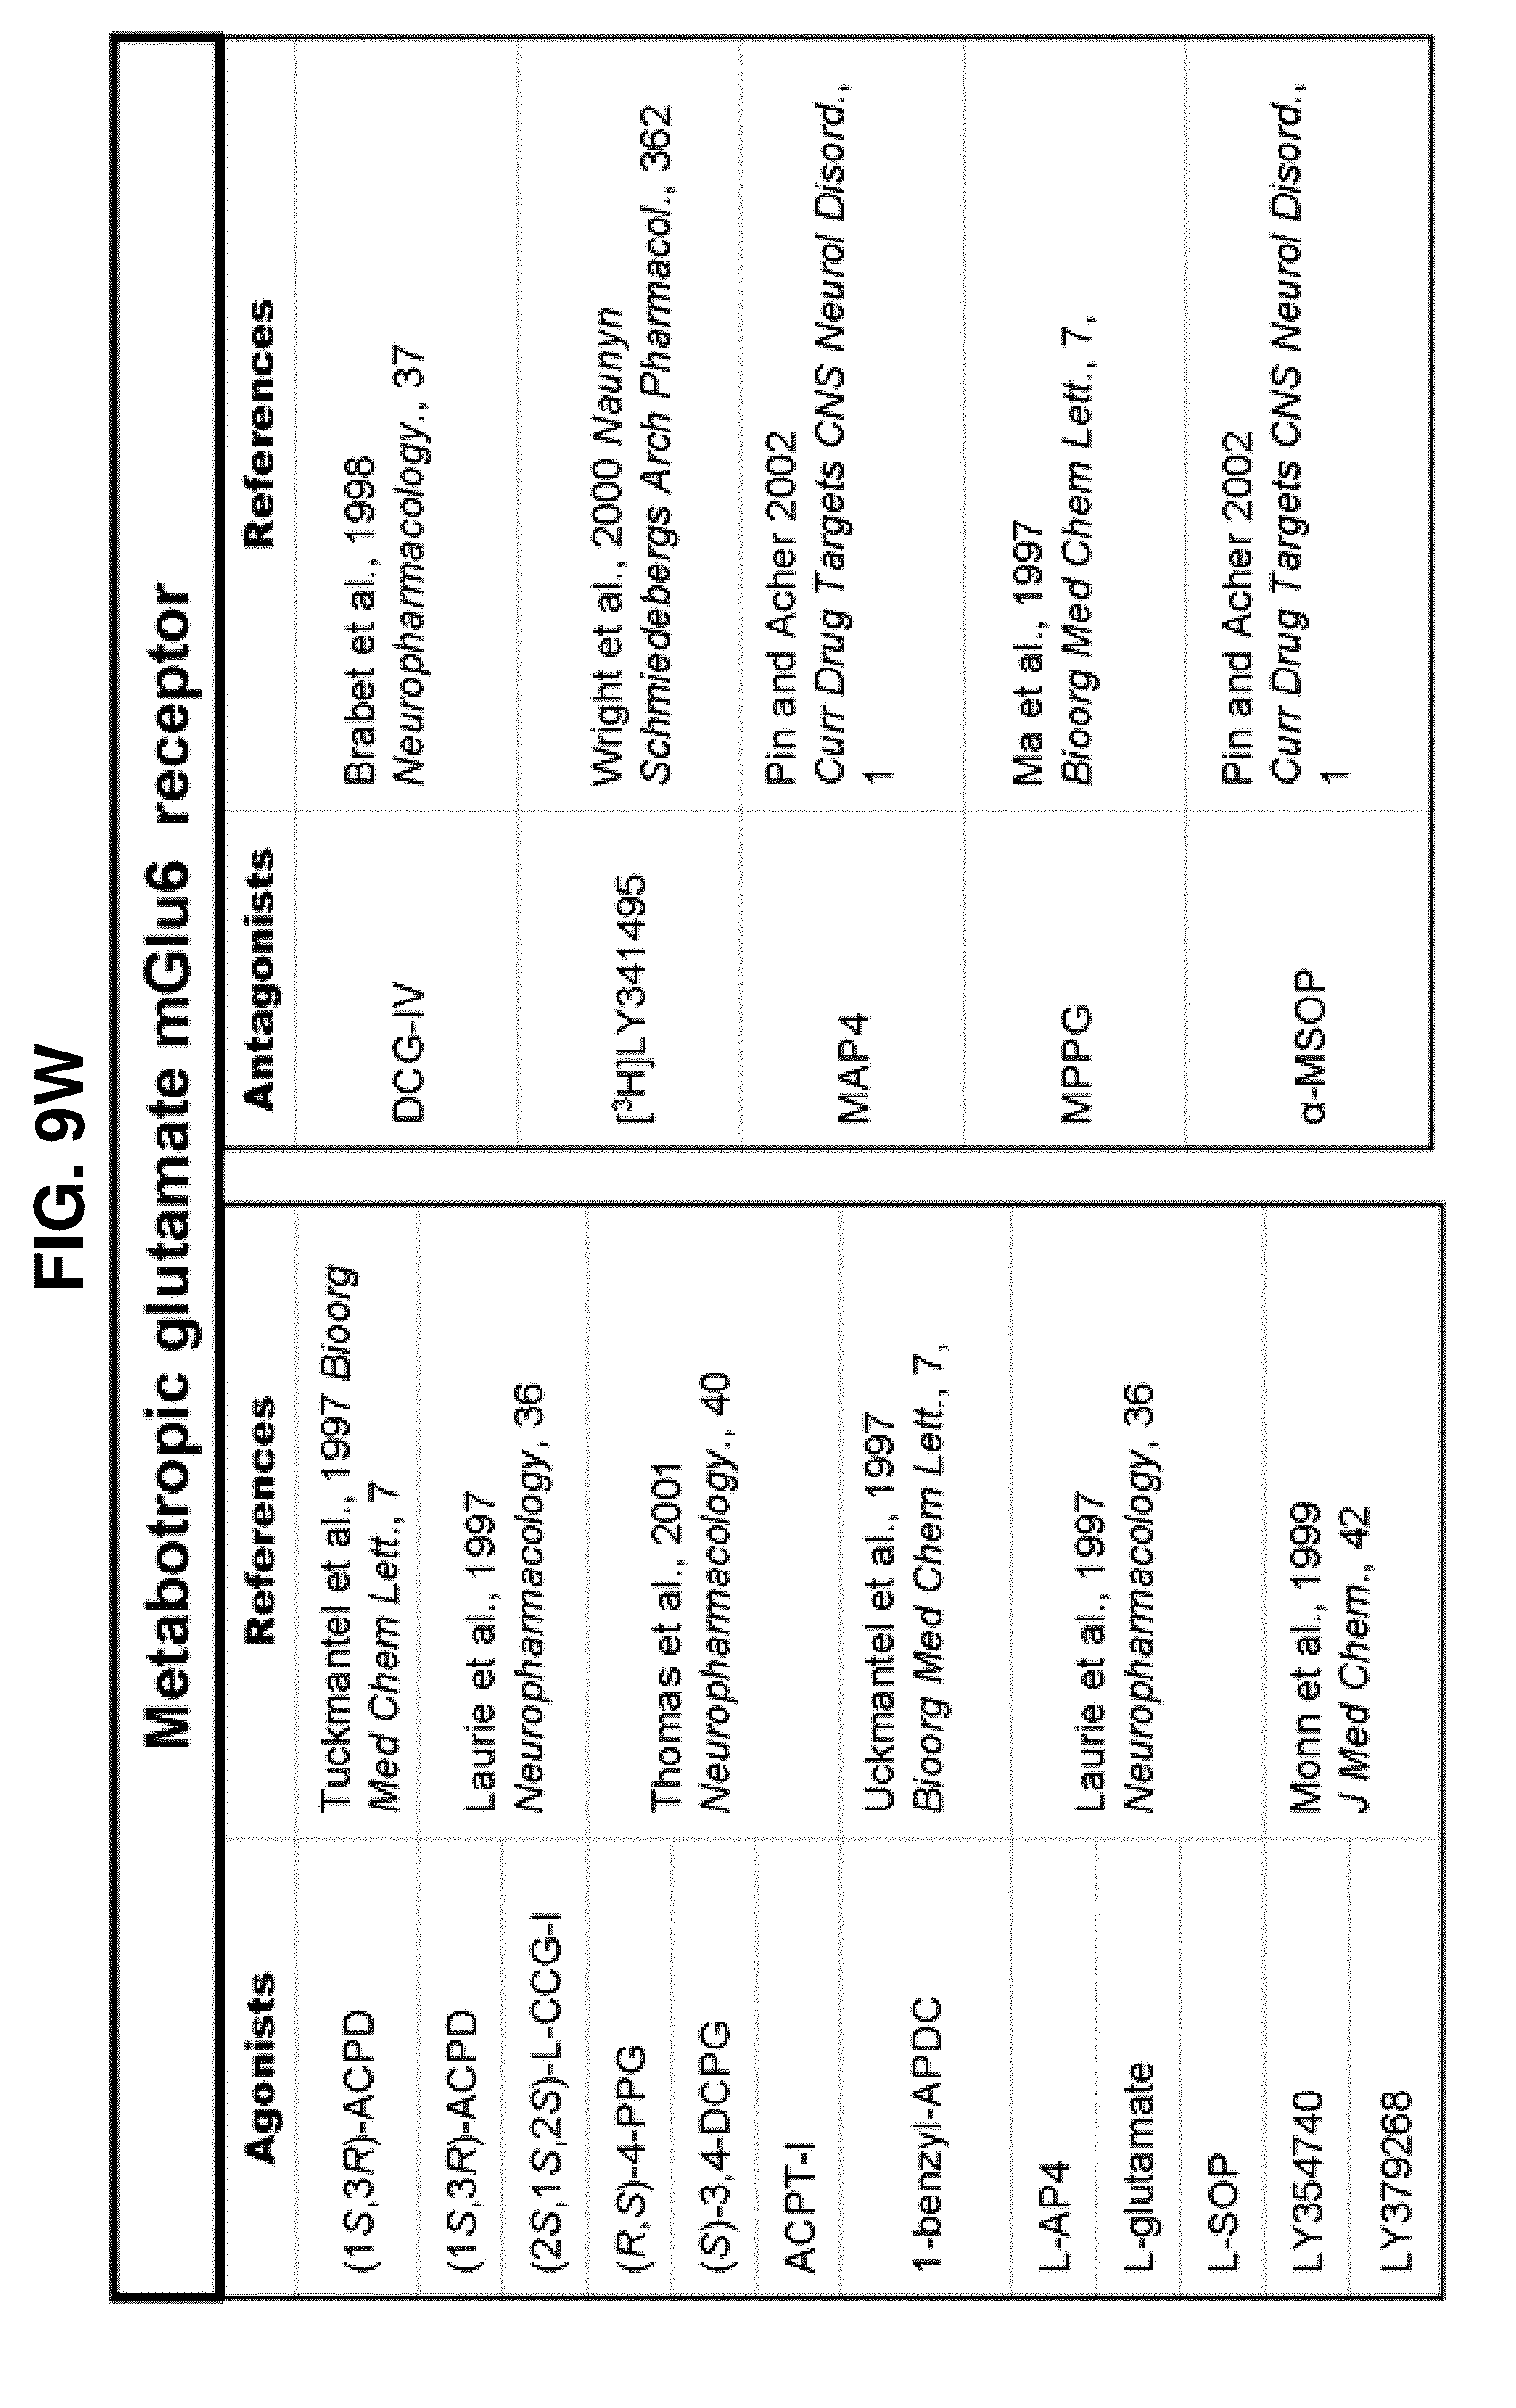
D00041

D00042

D00043

D00044

D00045

D00046

D00047
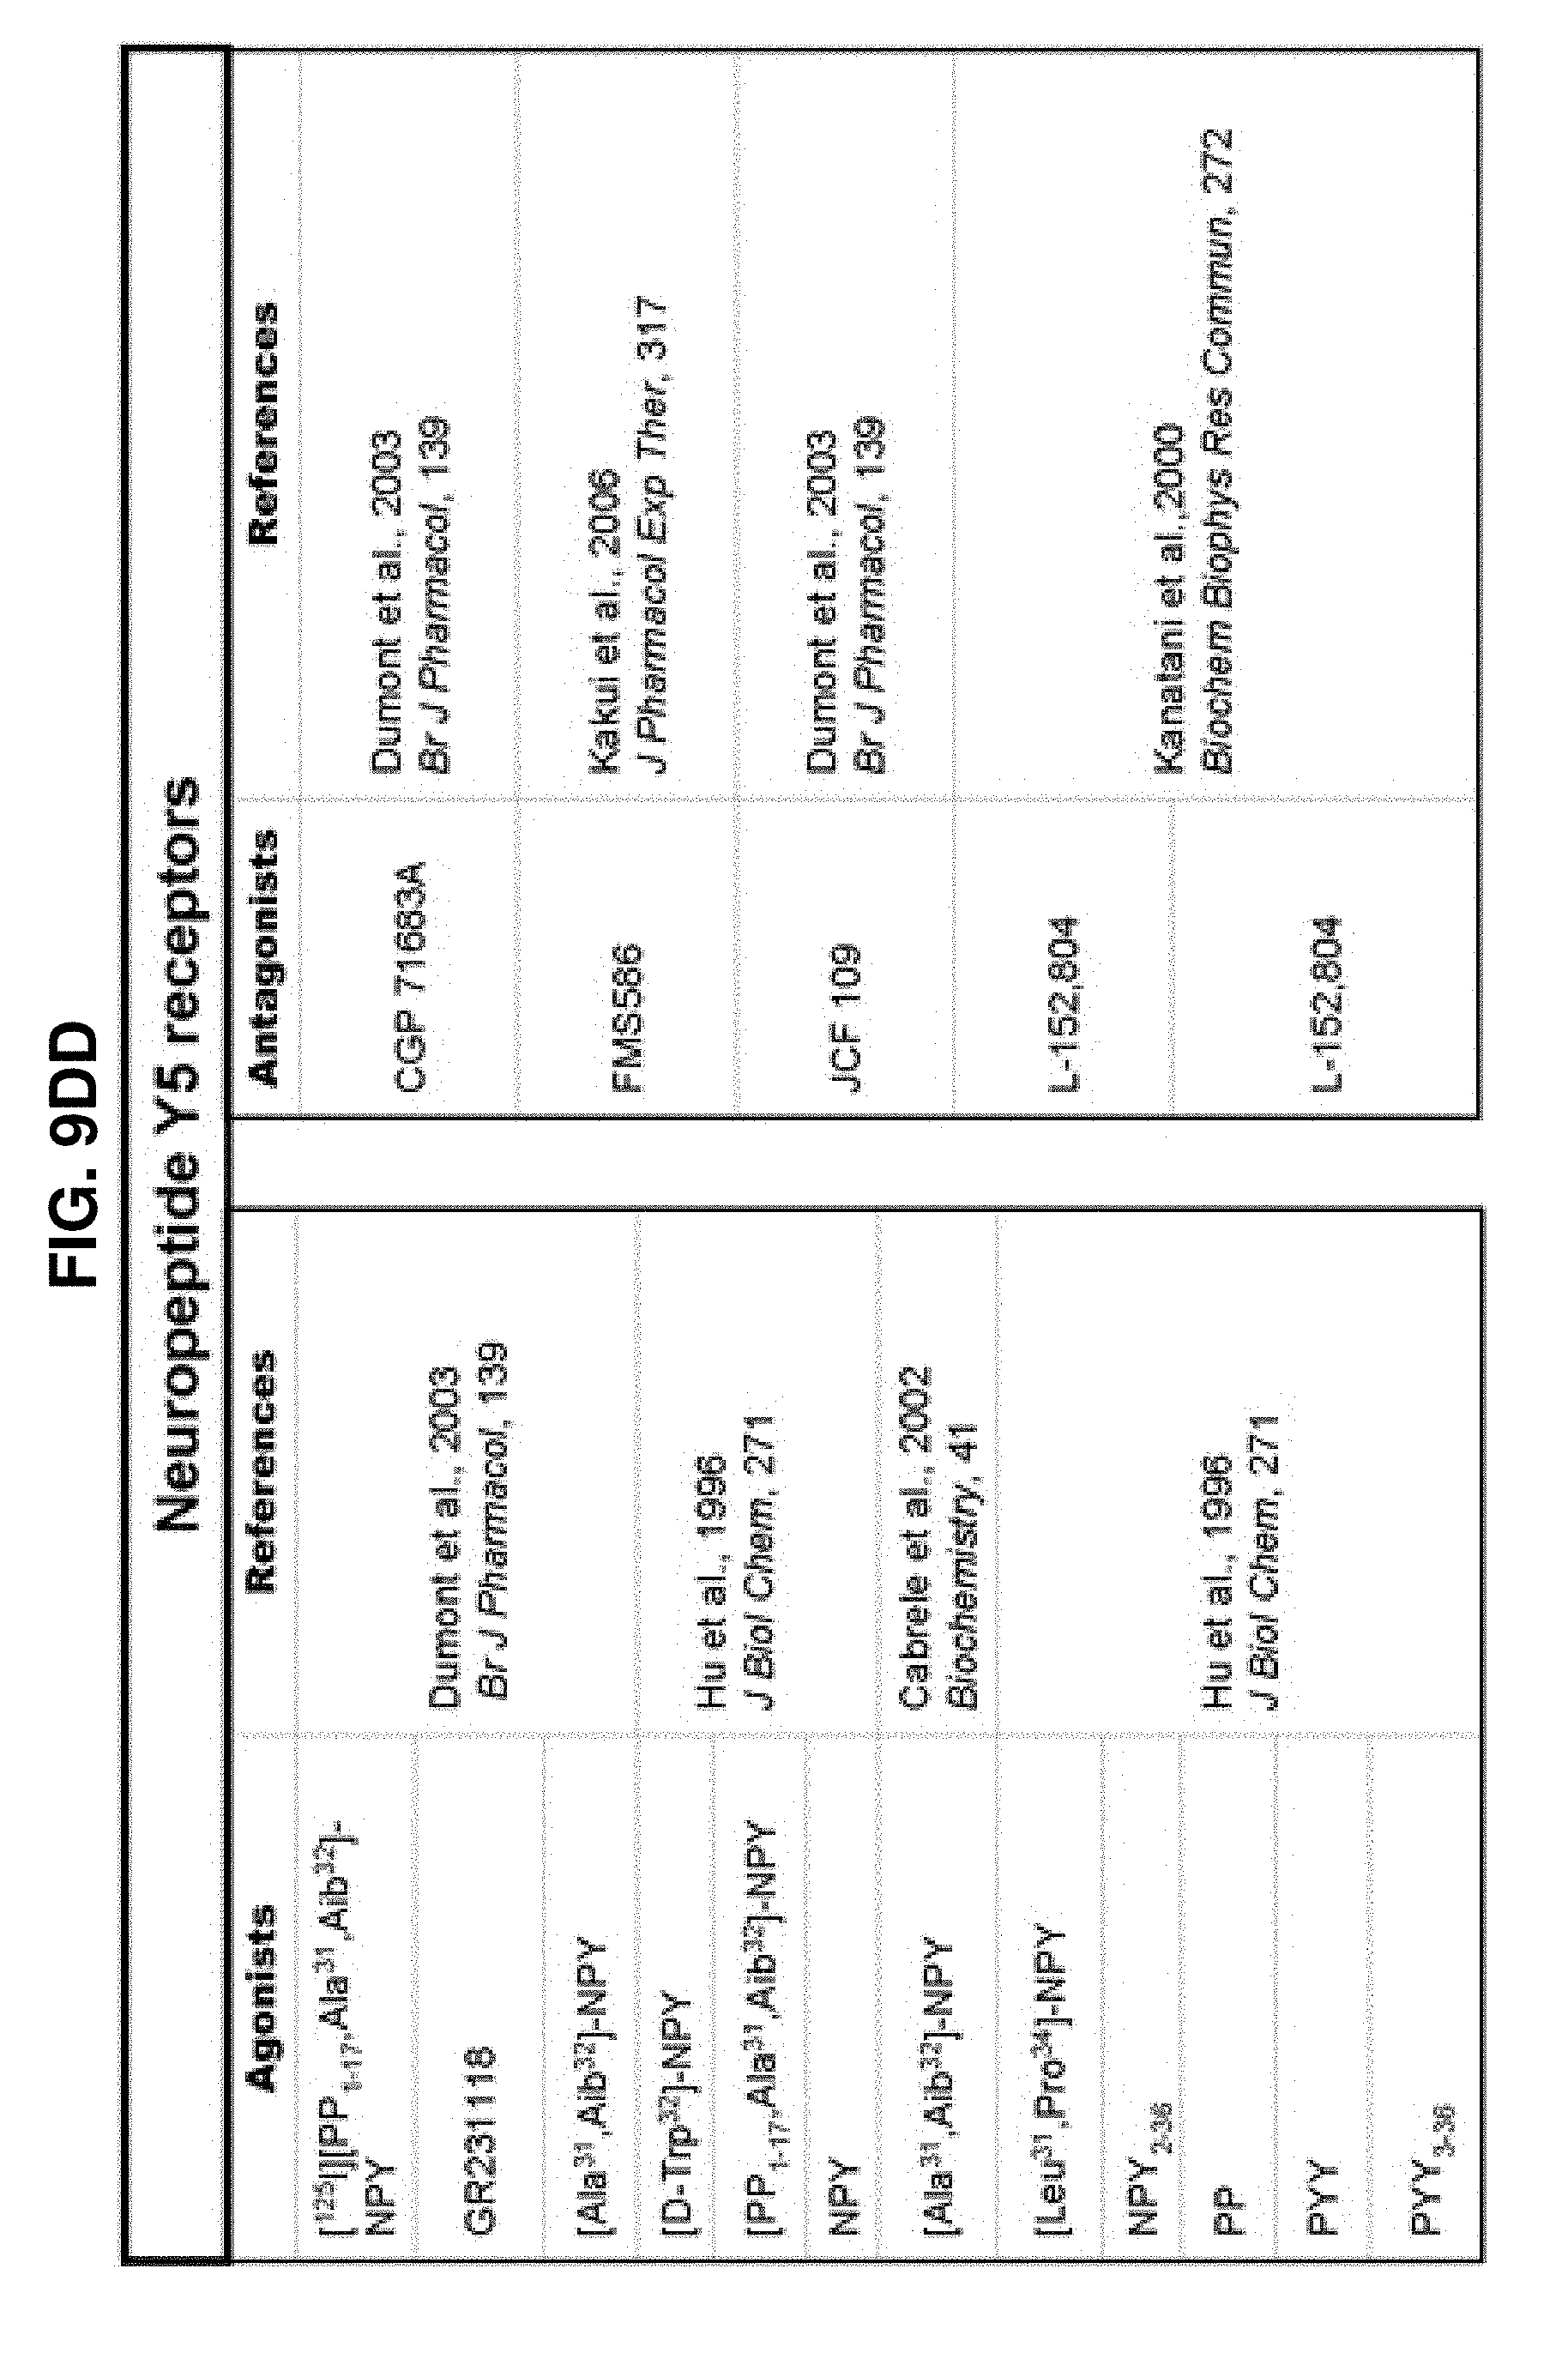
D00048

D00049

D00050

D00051
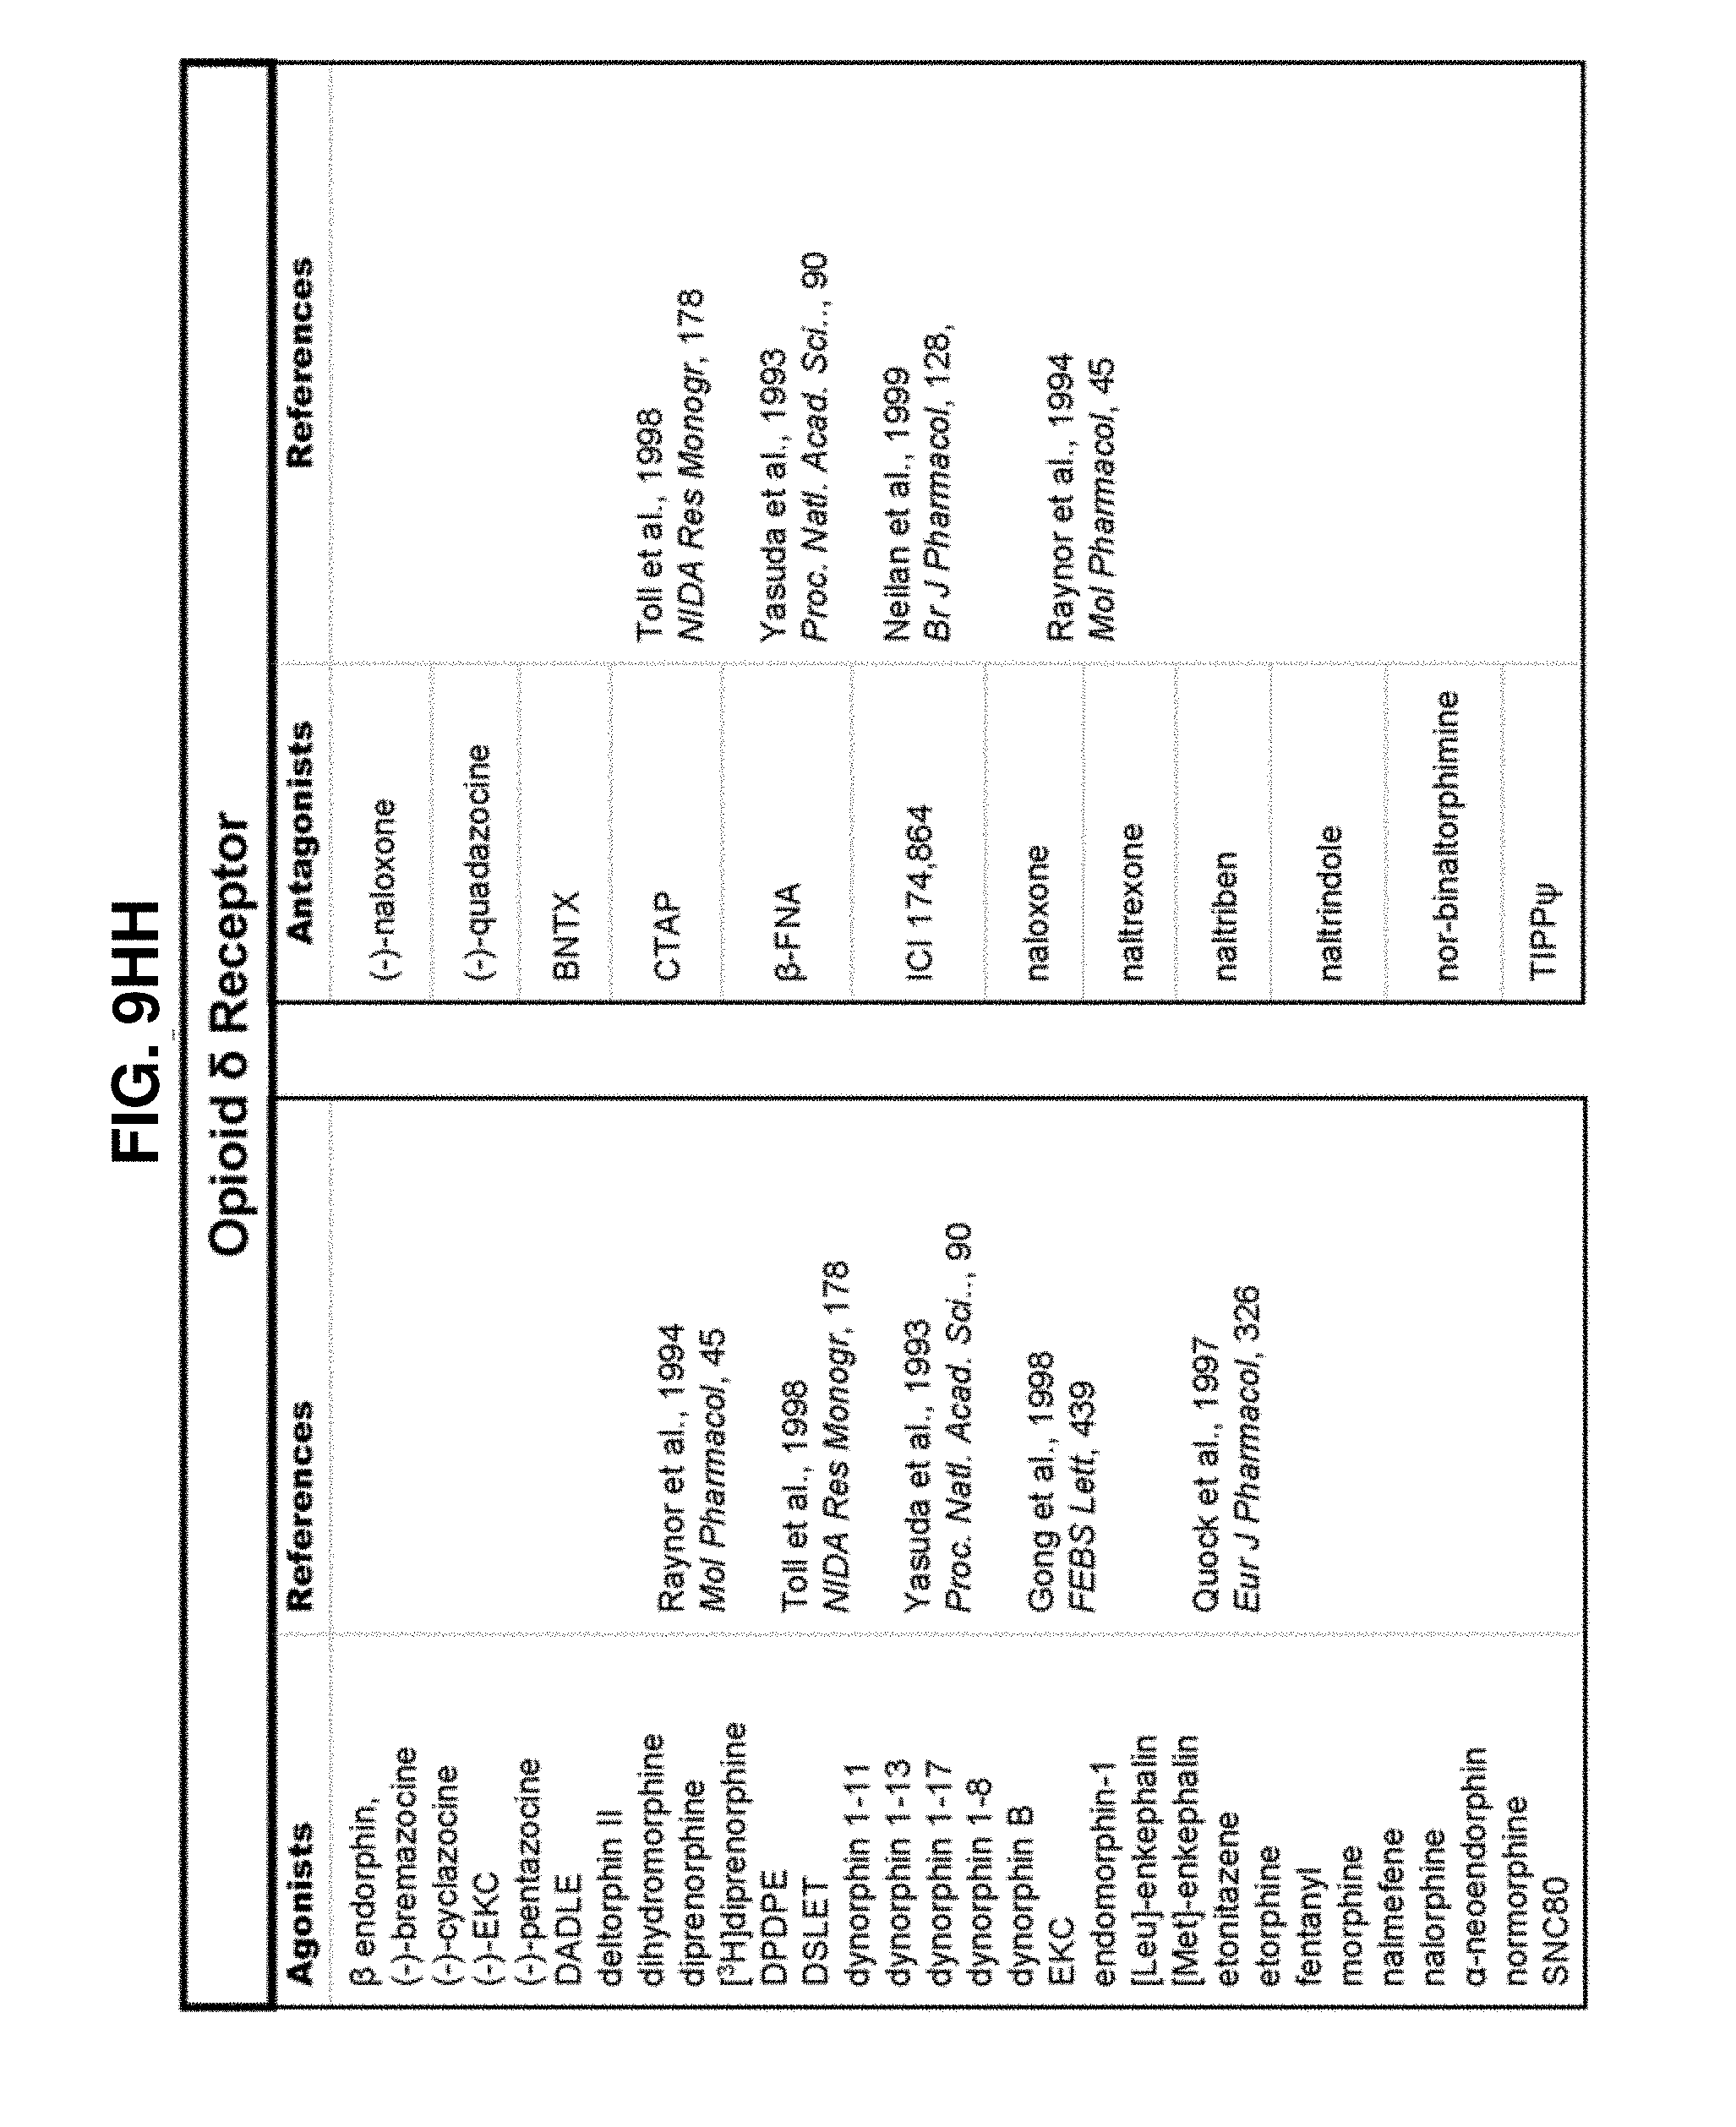
D00052

D00053

D00054

D00055

D00056

D00057

D00058

D00059

D00060

D00061

D00062

D00063
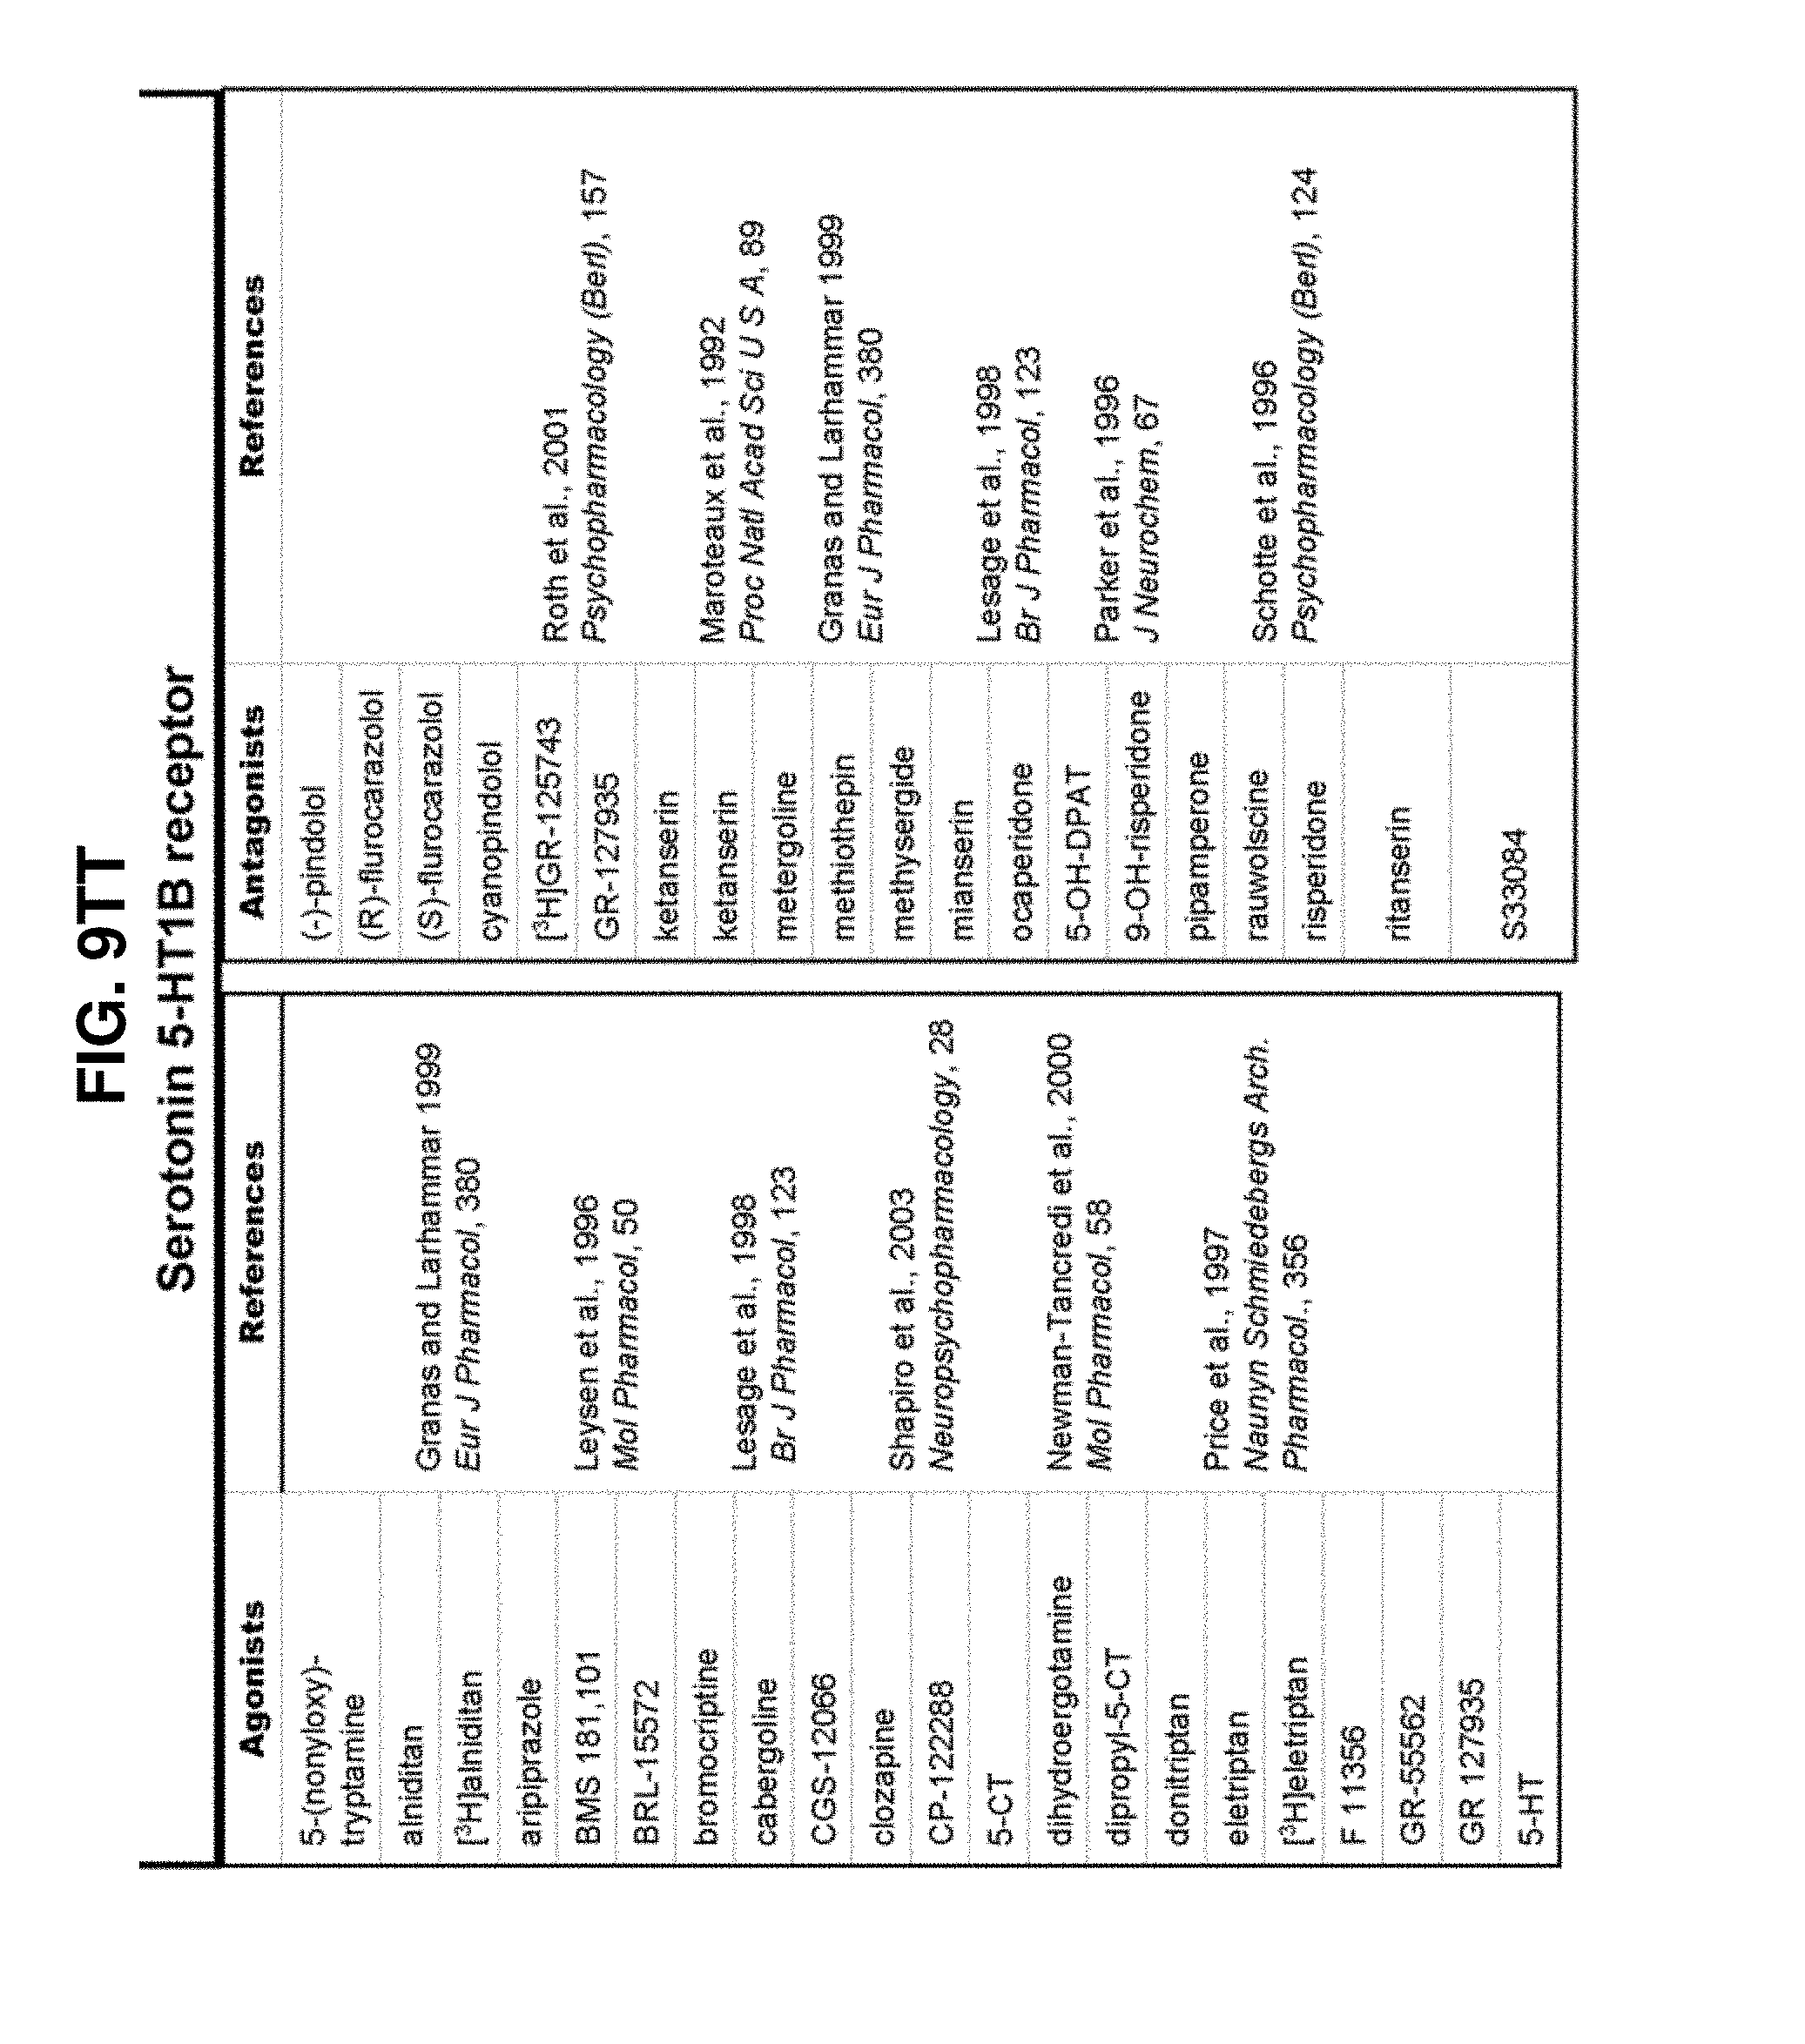
D00064

D00065
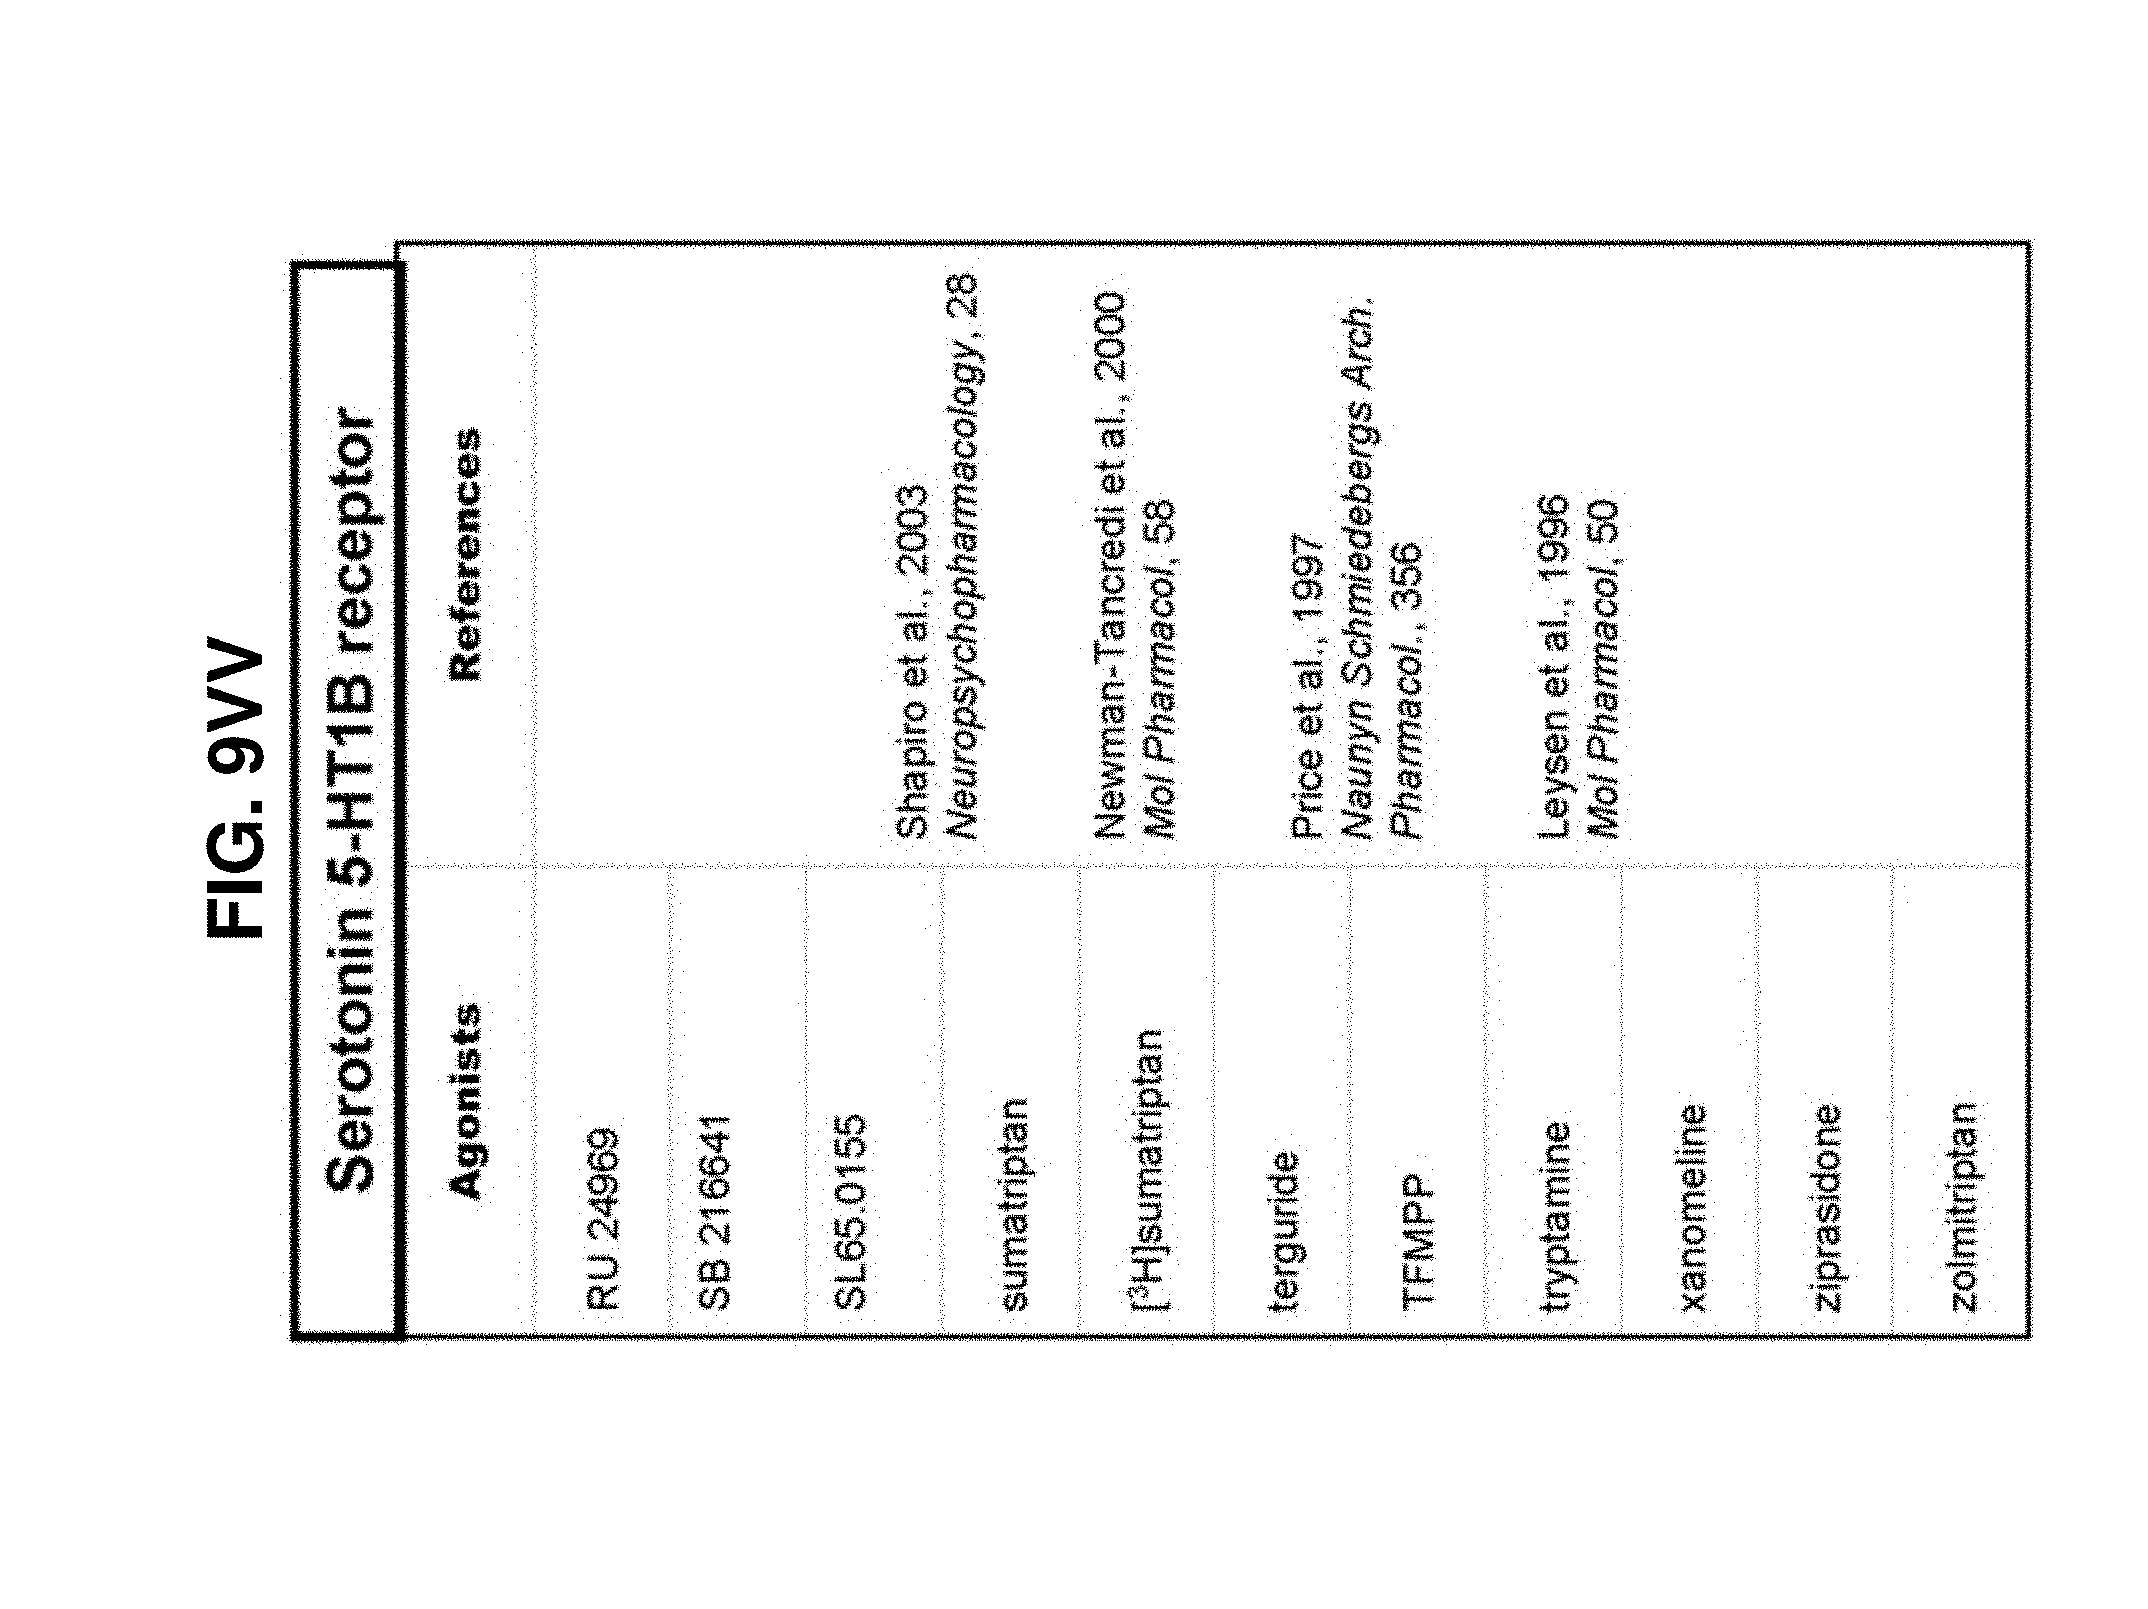
D00066

D00067
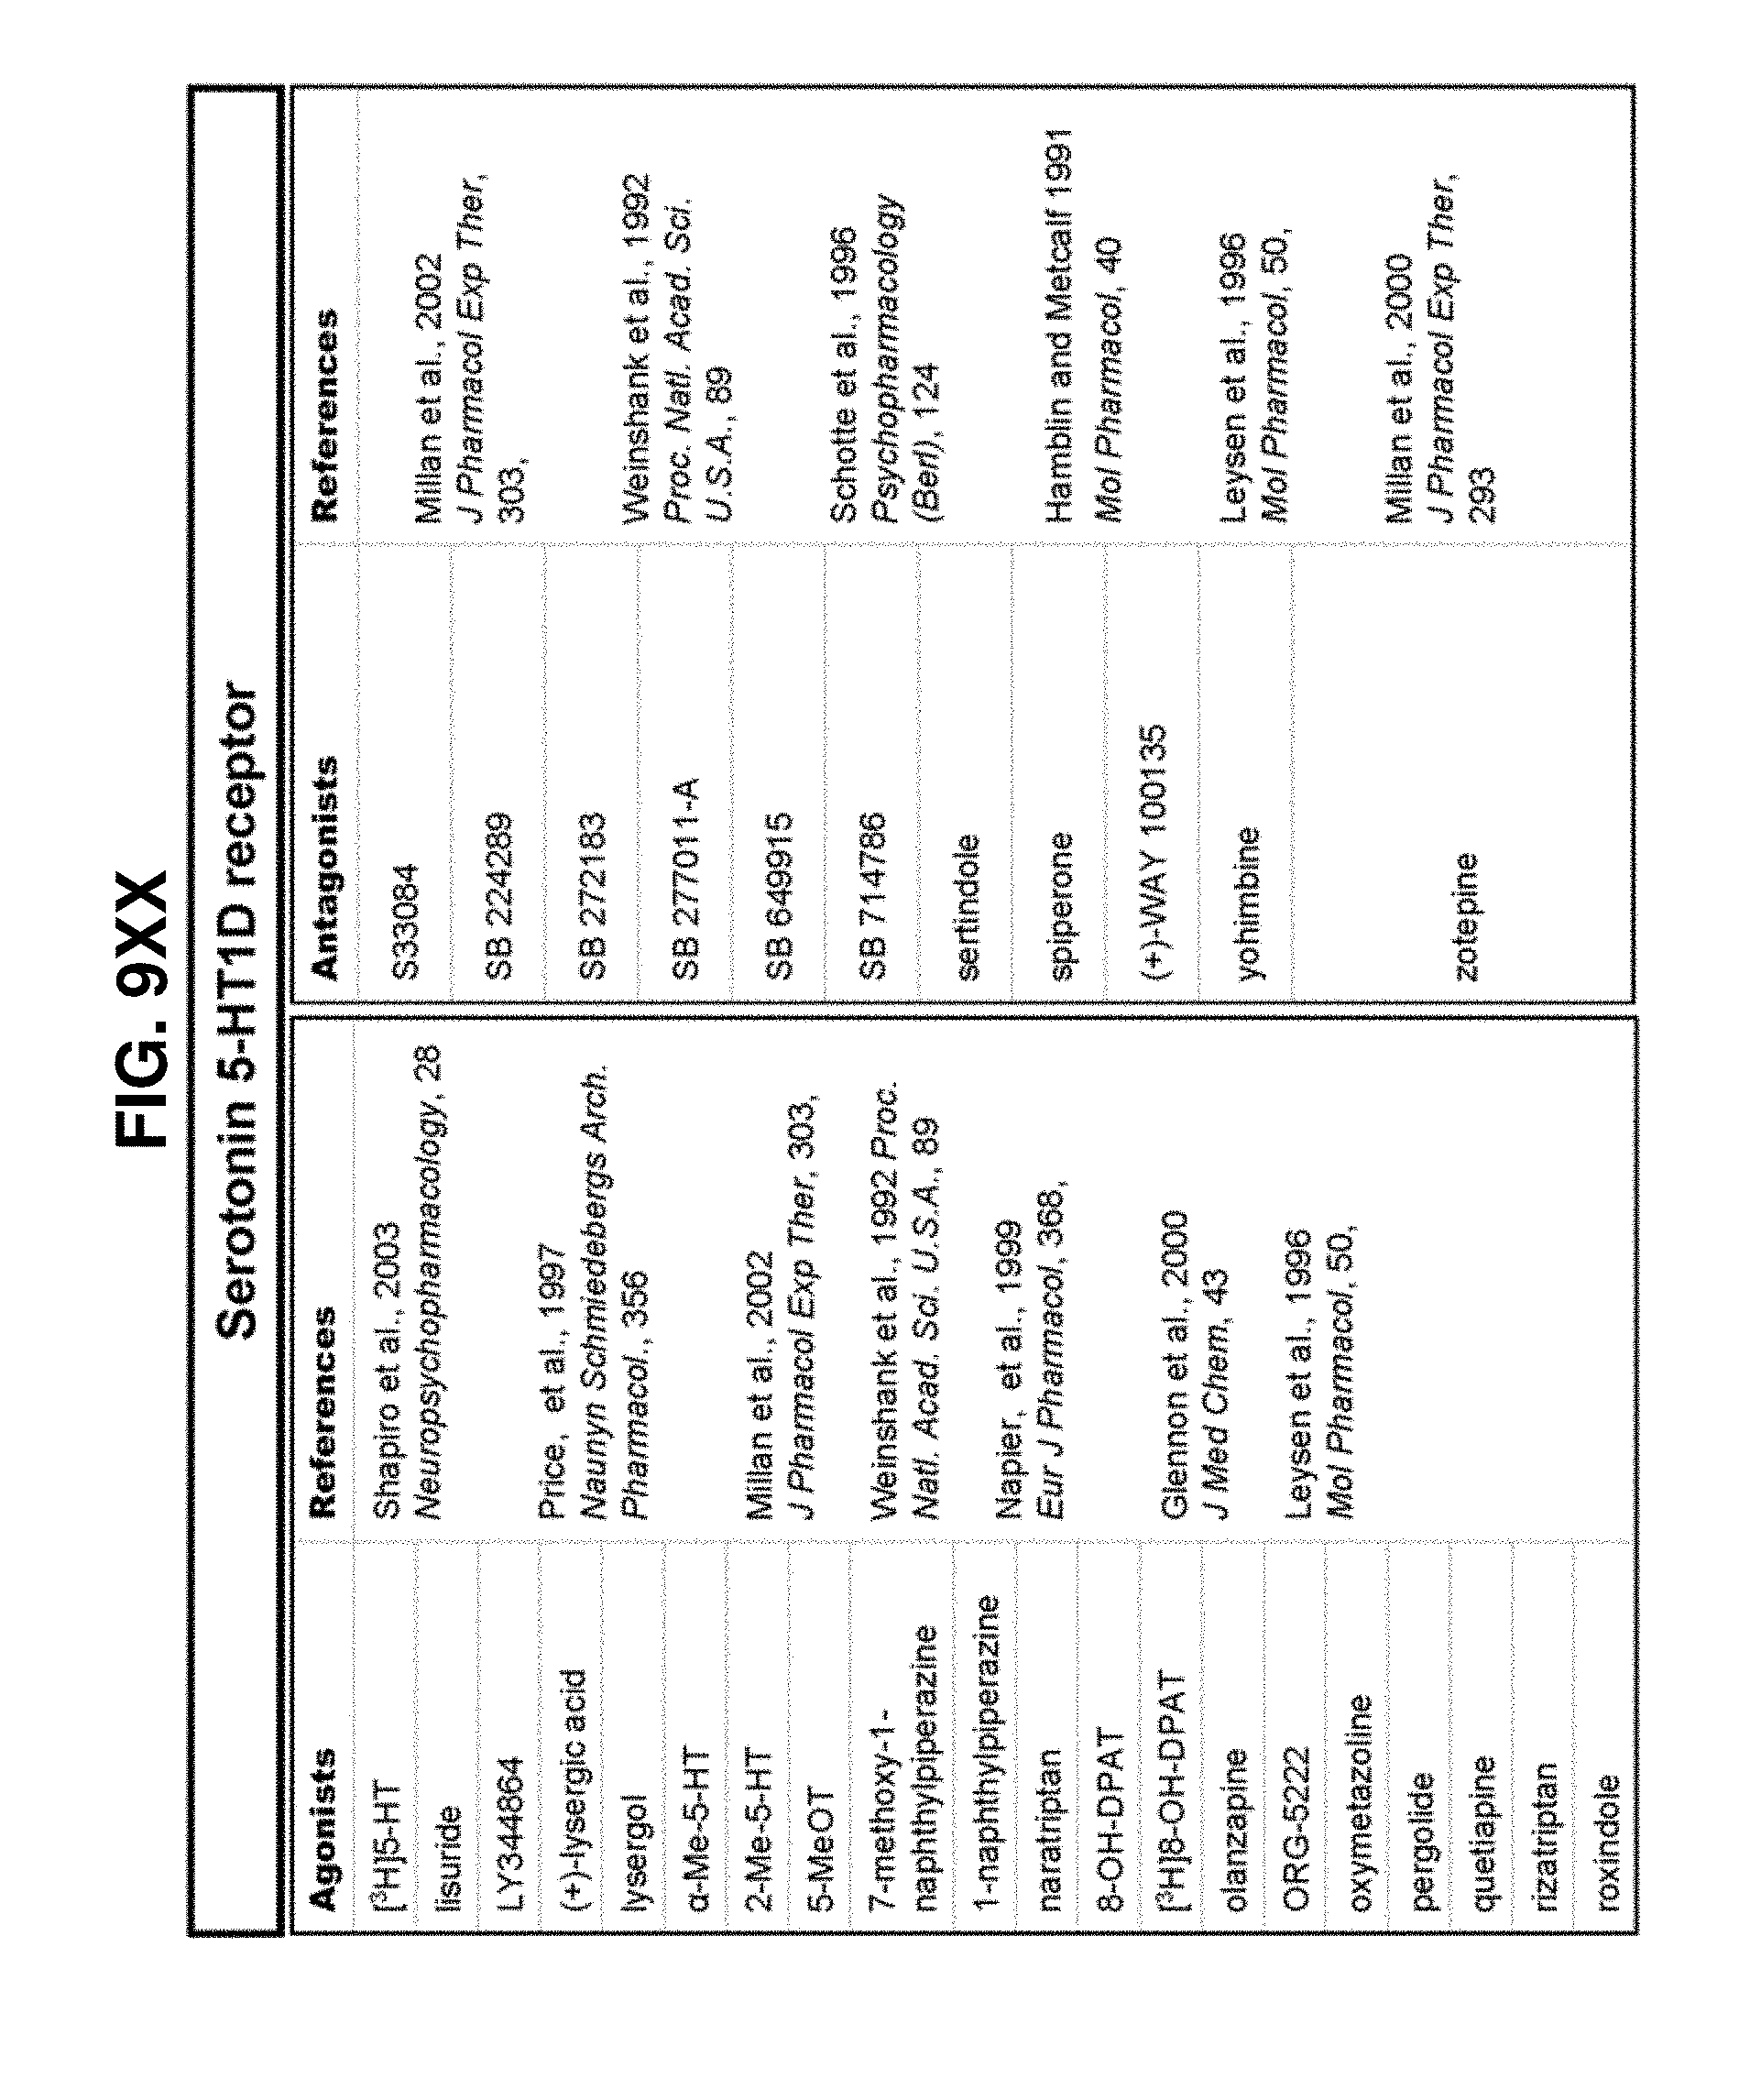
D00068

D00069

D00070

D00071

D00072

D00073

D00074

D00075

D00076

D00077

D00078

D00079

D00080

D00081

D00082

D00083

D00084

D00085

D00086

D00087

D00088

D00089

D00090

D00091

D00092

D00093

D00094

D00095

D00096

D00097

D00098

D00099

D00100

D00101
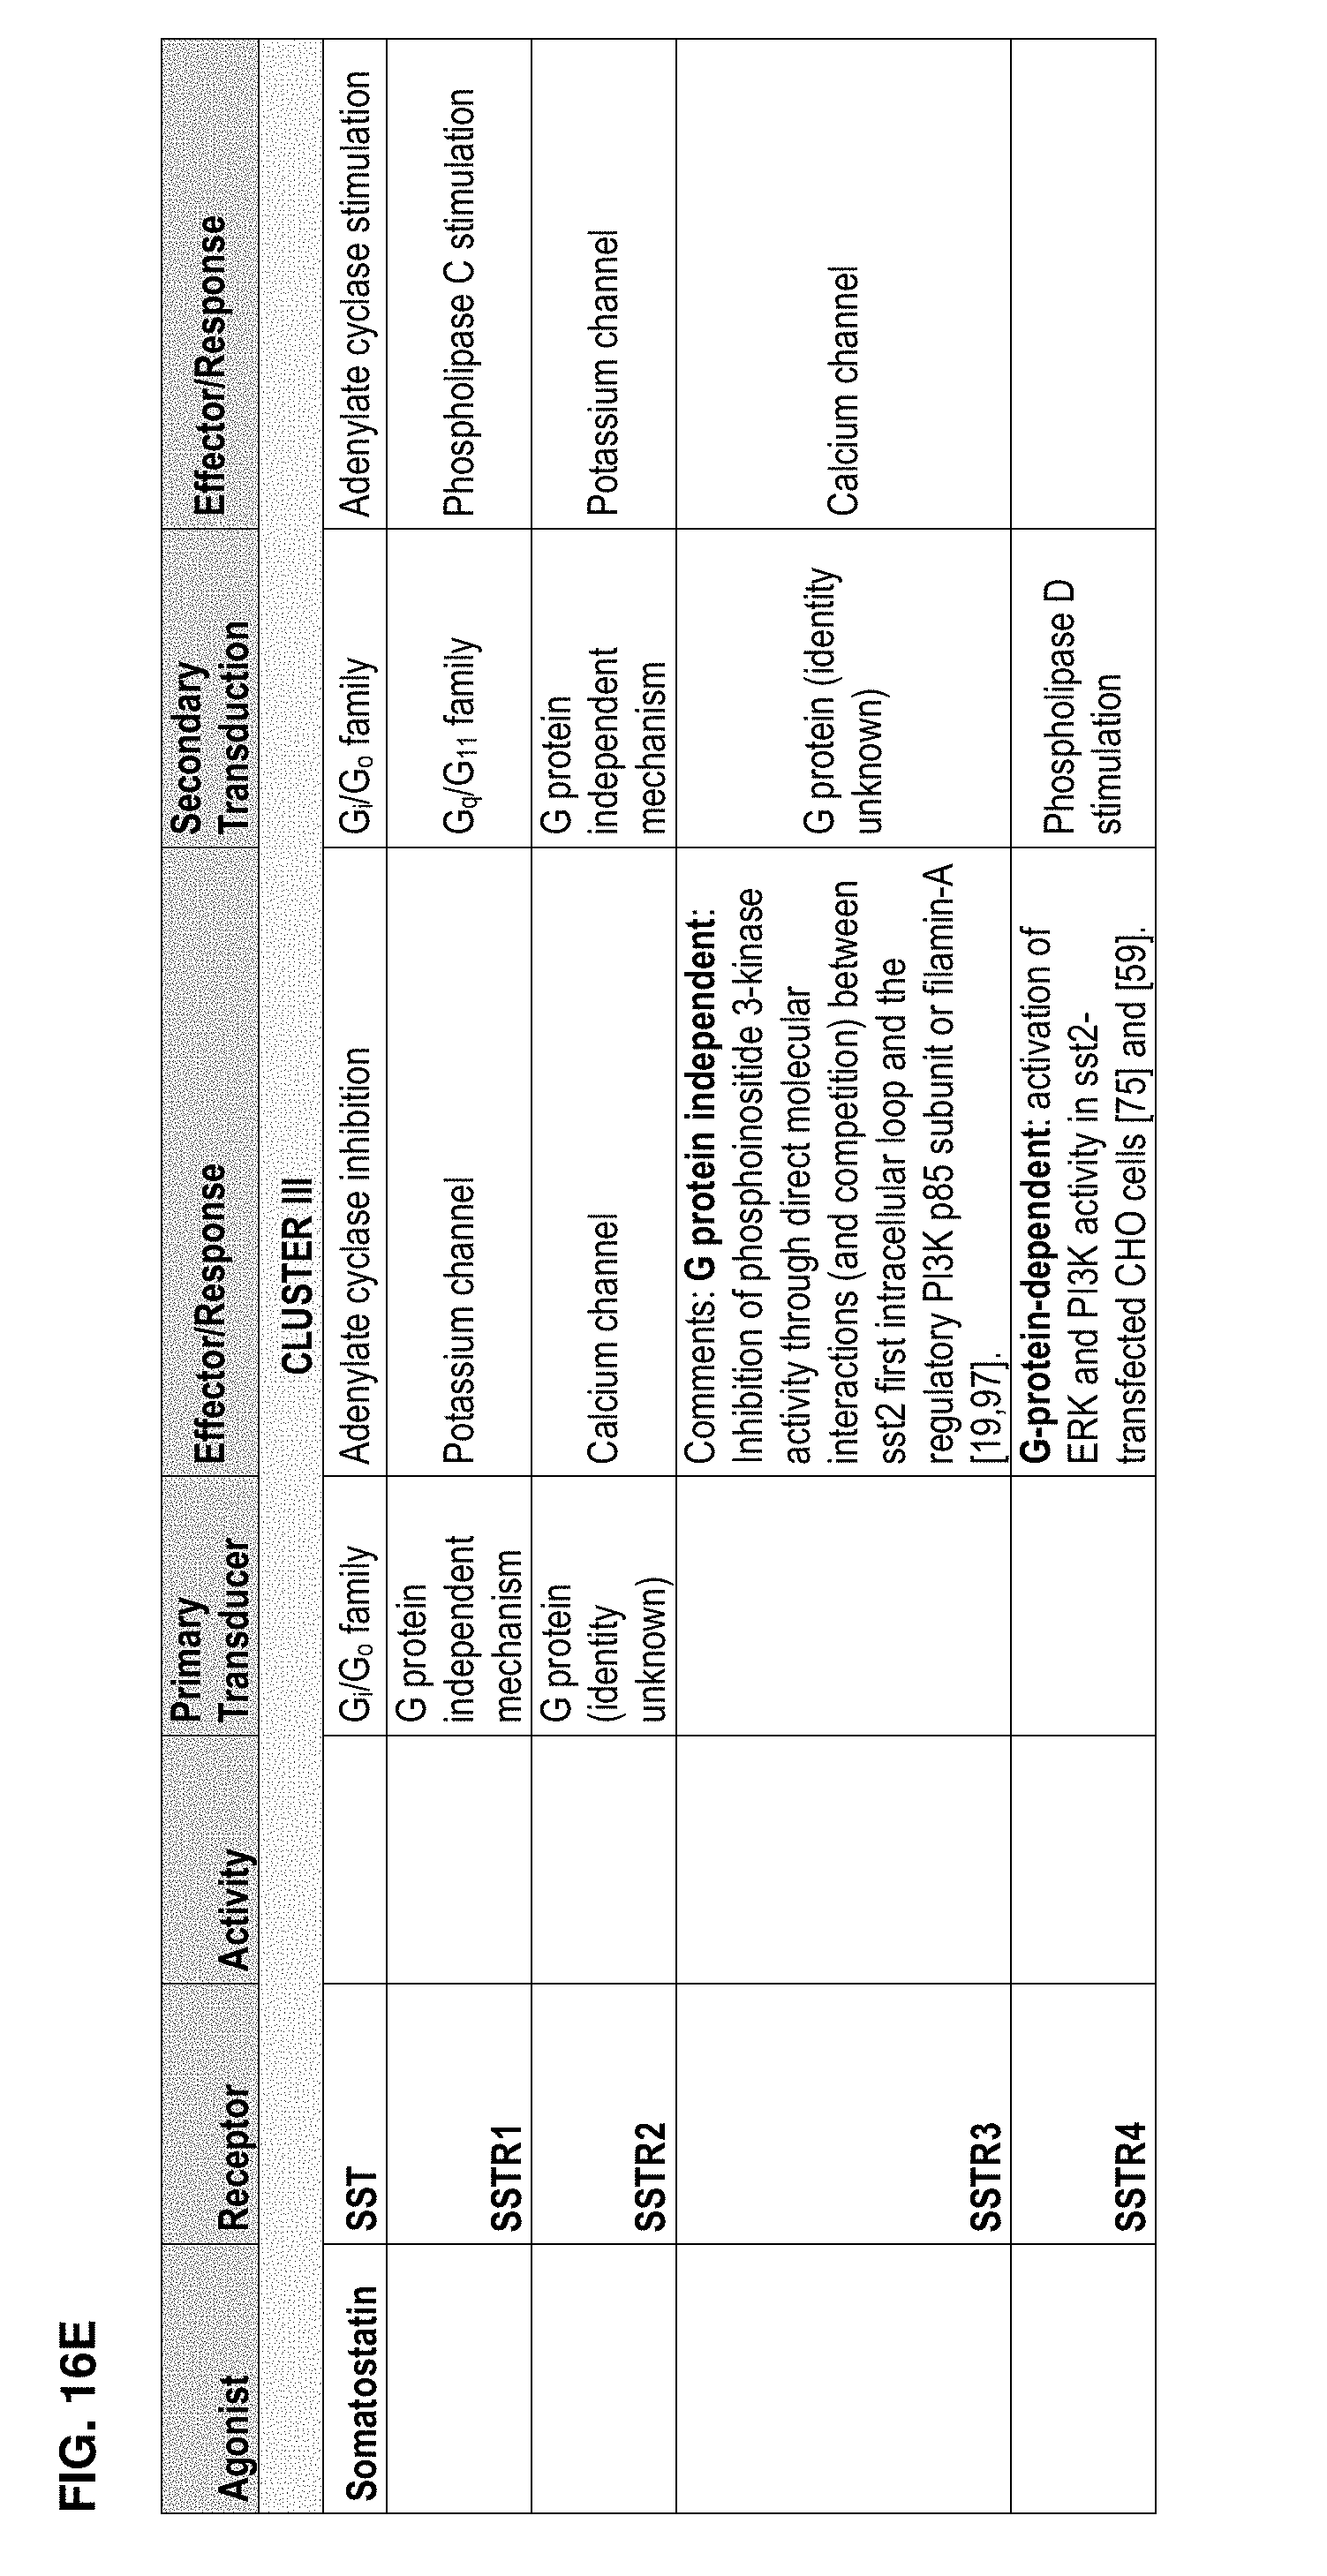
D00102

D00103

D00104

XML
uspto.report is an independent third-party trademark research tool that is not affiliated, endorsed, or sponsored by the United States Patent and Trademark Office (USPTO) or any other governmental organization. The information provided by uspto.report is based on publicly available data at the time of writing and is intended for informational purposes only.
While we strive to provide accurate and up-to-date information, we do not guarantee the accuracy, completeness, reliability, or suitability of the information displayed on this site. The use of this site is at your own risk. Any reliance you place on such information is therefore strictly at your own risk.
All official trademark data, including owner information, should be verified by visiting the official USPTO website at www.uspto.gov. This site is not intended to replace professional legal advice and should not be used as a substitute for consulting with a legal professional who is knowledgeable about trademark law.