Process For Microsatellite Instability Detection
Georgiadis; Andrew ; et al.
U.S. patent application number 16/204642 was filed with the patent office on 2019-06-06 for process for microsatellite instability detection. The applicant listed for this patent is PERSONAL GENOME DIAGNOSTICS INC.. Invention is credited to Andrew Georgiadis, Mark Sausen.
| Application Number | 20190169685 16/204642 |
| Document ID | / |
| Family ID | 66658895 |
| Filed Date | 2019-06-06 |


View All Diagrams
| United States Patent Application | 20190169685 |
| Kind Code | A1 |
| Georgiadis; Andrew ; et al. | June 6, 2019 |
PROCESS FOR MICROSATELLITE INSTABILITY DETECTION
Abstract
The invention provides methods for determining the MSI status of a patient by liquid biopsy with sample preparation using hybrid capture and non-unique barcodes. In certain aspects, the invention provides a method of detecting microsatellite instability (MSI). The method includes obtaining cell-free DNA (cfDNA) from a sample of blood or plasma from a patient and sequencing portions of the cfDNA to obtain sequences of a plurality of tracts of nucleotide repeats in the cfDNA. A report is provided describing an MSI status in the patient when a distribution of lengths of the plurality of tracts has peaks that deviate significantly from peaks in a reference distribution.
| Inventors: | Georgiadis; Andrew; (Ellicott City, MD) ; Sausen; Mark; (Baltimore, MD) | ||||||||||
| Applicant: |
|
||||||||||
|---|---|---|---|---|---|---|---|---|---|---|---|
| Family ID: | 66658895 | ||||||||||
| Appl. No.: | 16/204642 | ||||||||||
| Filed: | November 29, 2018 |
Related U.S. Patent Documents
| Application Number | Filing Date | Patent Number | ||
|---|---|---|---|---|
| 62593664 | Dec 1, 2017 | |||
| 62741448 | Oct 4, 2018 | |||
| Current U.S. Class: | 1/1 |
| Current CPC Class: | C12Q 1/6869 20130101; G16H 20/00 20180101; C12Q 1/6827 20130101; G16H 50/20 20180101; G16B 40/00 20190201; C12Q 2563/185 20130101; G16B 5/20 20190201; C12Q 1/6886 20130101; G16B 20/00 20190201; G16H 10/40 20180101; G16H 15/00 20180101; G16H 50/30 20180101; C12Q 1/6869 20130101; C12Q 2535/122 20130101; C12Q 2563/179 20130101 |
| International Class: | C12Q 1/6869 20060101 C12Q001/6869; C12Q 1/6827 20060101 C12Q001/6827; C12Q 1/6886 20060101 C12Q001/6886; G16H 50/30 20060101 G16H050/30; G16H 50/20 20060101 G16H050/20; G16B 5/20 20060101 G16B005/20 |
Claims
1. A method of determining micro satellite instability (MSI) comprising: obtaining cell-free DNA (cfDNA) from a liquid sample from a patient; sequencing fragments of the cfDNA to obtain sequences of a plurality of tracts of nucleotide repeats in the cfDNA; and providing a report describing an MSI status of the patient depicting a distribution of lengths of the plurality of tracts that have peaks that deviate from peaks in a reference distribution.
2. The method of claim 1, wherein the reference distribution is from a matched normal DNA sample.
3. The method of claim 2, further comprising attaching non-unique barcodes to the fragments.
4. The method of claim 3, further comprising amplifying the fragments to produce amplicons that include barcode information and copies of the fragments, wherein the sequencing step comprises sequencing the amplicons.
5. The method of claim 4, wherein the obtained sequences include a plurality of sequence reads and the method includes: aligning the sequence reads to a reference, and identifying groups of sequence reads that originated from a unique cfDNA fragment by means of the barcode information and position or content of the sequence reads.
6. The method of claim 5, wherein the use of the non-unique barcodes to identify groups of sequence reads that originated from a unique cfDNA fragment which allows for the lengths of the plurality of tracts to be determined correctly by correcting for errors introduced by sequencing artifacts or polymerase slippage during the amplifying step.
7. The method of claim 4, wherein the target portions are markers for MSI.
8. The method of claim 7, wherein the markers include one or more of BAT25, BAT26, MON027, NR21, NR24, Penta C, and Penta D.
9. The method of claim 7, wherein the markers include BAT25, BAT26, MON027, NR21, and NR24.
10. The method of claim 7, wherein the one or more microsatellite markers are selected from the group consisting of BAT-25, BAT-26, MONO-27, NR-21, NR-24, Penta C, and Penta D.
11. The method of claim 7, further comprising recommending a treatment for the patient based on the MSI status.
12. The method of claim 11, wherein the MSI status indicates that the patient is microsatellite instable and the treatment comprises an immune checkpoint inhibitor.
13. The method of claim 12, further comprising administering the immune checkpoint inhibitor to the patient.
14. The method of claim 13, wherein the immune checkpoint inhibitor comprises an antibody.
15. The method of claim 14, wherein the antibody is selected from the group consisting of: an anti-PD-1 antibody; an anti-IDO antibody; anti-CTLA-4 antibody; an anti-PD-L1 antibody; and an anti-LAG-3 antibody.
16. The method of claim 1, wherein the sequencing is next-generation, short-read sequencing.
17. The method of claim 1, wherein the sample is from blood, serum, plasma, urine, saliva or other biological fluid.
18. A method of detecting microsatellite instability (MSI), the method comprising: obtaining a sample comprising fragments of cell-free DNA (cfDNA) from a patient; attaching barcodes to the fragments, wherein at least some of the barcodes are not unique; sequencing the barcodes to obtain sequences of a plurality of markers in the DNA; determining a distribution of lengths of the plurality of markers; providing a report describing MSI in the patient when peaks in the distribution deviate from expected peaks in a modeled healthy or reference distribution.
19. A method of detecting micro satellite instability (MSI), the method comprising: obtaining fragments cell-free DNA (cfDNA) from a sample of plasma from a patient; sequencing portions of the cfDNA to obtain sequences of a plurality of tracts of nucleotide repeats in the cfDNA; assembling the sequences using information from endogenous barcodes at the starts and ends of the fragments; and providing a report describing an MSI status in the patient when a distribution of lengths of the plurality of tracts has peaks that deviate significantly from peaks in a reference distribution.
20. The method of claim 7, wherein the markers comprise any polynucleotide tract.
21. The method of any of the preceding claims, wherein the method is used in screening for Lynch syndrome.
22. A method for generating a personalized cancer treatment report, the method comprising: acquiring a liquid sample from a subject having or suspected of having cancer, determining the MSI status of the subject by the method of claim 1 and generating a personalized cancer treatment report to memorialize the presence or absence of microsatellite instability in the subject.
23. The method of claim 22, wherein the cancer treatment report comprises one or more of the following: (i) information on prognosis, resistance, or potential therapeutic options; (ii) information on the likely effectiveness of a therapeutic option; (iii) the acceptability of a therapeutic option, or the advisability of applying the therapeutic option to the subject; or (iv) information on the administration of a drug.
24. The method of claim 22, wherein the sample comprises cfDNA.
25. The method of claim 1, wherein the subject has a cancer selected from pancreatic, colon, gastric, endometrial, cholangiocarcinoma, breast, lung, head and neck, kidney, bladder, prostate cancer, or hematopoietic cancers.
26. The method of claim 18, wherein the subject has a cancer selected from pancreatic, colon, gastric, endometrial, cholangiocarcinoma, breast, lung, head and neck, kidney, bladder, prostate cancer, or hematopoietic cancers.
27. The method of claim 19, wherein the subject has a cancer selected from pancreatic, colon, gastric, endometrial, cholangiocarcinoma, breast, lung, head and neck, kidney, bladder, prostate cancer, or hematopoietic cancers.
28. The method of claim 22, wherein the subject has a cancer selected from pancreatic, colon, gastric, endometrial, cholangiocarcinoma, breast, lung, head and neck, kidney, bladder, prostate cancer, or hematopoietic cancers.
29. A method for generating a personalized cancer treatment report, the method comprising: acquiring a liquid sample from a subject having or suspected of having cancer, determining the MSI status of the subject by the method of claim 18 and generating a personalized cancer treatment report to memorialize the presence or absence of microsatellite instability in the subject.
30. A method for generating a personalized cancer treatment report, the method comprising: acquiring a liquid sample from a subject having or suspected of having cancer, determining the MSI status of the subject by the method of claim 19 and generating a personalized cancer treatment report to memorialize the presence or absence of microsatellite instability in the subject.
Description
CROSS-REFERENCE TO RELATED APPLICATIONS
[0001] This application claims benefit of priority under 35 U.S.C. .sctn. 119(e) of U.S. Ser. No. 62/593,664 filed Dec. 1, 2017, and of U.S. Ser. No. 62/741,448 filed Oct. 4, 2018, the entire contents of which is incorporated herein by reference in its entirety.
TECHNICAL FIELD
[0002] The present invention relates generally to the detection, monitoring, and treatment of cancer and more specifically to determining the MSI status of a patient by liquid biopsy.
BACKGROUND
[0003] Cancer causes more than a half a million deaths each year in the United States alone. The success of current treatments depends on the type of cancer and the stage at which it is detected. Many treatments include costly and painful surgeries and chemotherapies, and are often unsuccessful. Early and accurate detection of mutations is essential for effective cancer therapy.
[0004] Many cancers involve the accumulation of mutations that results from failure of the DNA mismatch-repair (MMR). One important marker of MMR deficiency is microsatellite instability (MSI), a polymorphism of tandem nucleotide repeat lengths ubiquitously distributed throughout the genome. The presence of MMR-deficiency or MSI may serve as a marker for immunotherapy response with checkpoint inhibition. Knowledge of MSI status is thus important and valuable for the treatment of cancer. While it may be possible to determine MSI status by sequencing DNA from a tumor sample, such as a formalin-fixed paraffin-embedded (FFPE) tumor tissue specimen, there are patients for whom tumor material is not readily obtained.
[0005] Absent a fixed tissue specimen, a potential source for tumor information is through the analysis of circulating tumor DNA (ctDNA). ctDNA is released from tumor tissue into the blood and can be analyzed by liquid biopsy. Liquid biopsies potentially allow for the detection and characterization of cancer. However, liquid biopsies present their own inherent challenges associated with low circulating tumor DNA (ctDNA) levels as well as problems with faithfully amplifying and sequencing regions of DNA characterized by tracts of mononucleotide repeats.
SUMMARY OF THE INVENTION
[0006] The present invention is based on the seminal discovery that a circulating tumor DNA based approach is useful for the detection of high tumor mutation burden and microsatellite instability in cancer patients with advanced disease and can be used to predict responders to immune checkpoint blockade.
[0007] The invention provides methods for determining the MSI status of a patient by liquid biopsy. Methods include a sample preparation using hybrid capture and non-unique barcodes. The sample preparation both compensates for errors such as sequencing artifacts and polymerase slippage and provides for the successful capture of target DNA even when present only at a very low fraction of total DNA. Methods include sequencing tracts of mononucleotide repeats within captured sample and modelling the distribution of lengths of those tracts. A peak-finding operation evaluates peaks in the modelled distribution and reveals MSI in the patient when the peaks deviate from a reference distribution (e.g., such as by indicating that the tracts of mononucleotide repeats in the patient's DNA are markedly shorter than in healthy DNA).
[0008] Methods of the disclosure are amenable to implementation in conjunction with other genomic screenings such as screening panels of markers, genes, or whole genomes to report mutations or mutational burden. Methods may be implemented by including MSI markers within any suitable liquid-biopsy based sequencing assay and may evaluate MSI status by interrogating MSI markers such as BAT-25, BAT-26, MONO-27, NR-21, and NR-24, BAT-40, TGF.beta. RII, IGFIIR, hMSH3, BAX and dinucleotide D2S123, D9S283, D9S1851 and D18S58 loci, by way of example, or by modeling distributions of lengths of any other suitable set(s) of repeats in the genome.
[0009] In certain aspects, the invention provides a method of detecting microsatellite instability (MSI). The method includes obtaining cell-free DNA (cfDNA) from a sample of plasma from a patient and sequencing portions of the cfDNA to obtain sequences of a plurality of tracts of nucleotide repeats in the cfDNA. A report is provided describing an MSI status in the patient when a distribution of lengths of the plurality of tracts has peaks that deviate significantly from peaks in a reference distribution. Obtaining the cfDNA may include capturing target portions of DNA with probes, fragmenting the target portions to yield fragments, and attaching barcodes to the fragments. In preferred embodiments, the barcodes are non-unique barcodes that include duplicates such that different ones of the fragments are attached to identical barcodes.
[0010] The method may include amplifying the fragments to produce amplicons that include barcode information and copies of the fragments, wherein the sequencing step comprises sequencing the amplicons. In one aspect, the sequencing is next-generation, short-read sequencing. The obtained sequences may include a plurality of sequence reads and the method may include aligning the sequence reads to a reference, and identifying groups of sequence reads that originated from a unique segment of the cfDNA by means of the barcode information and position or content of the sequence reads.
[0011] The use of the non-unique barcodes to identify groups of sequence reads that originated from a unique segment of the cfDNA allows for the lengths of the plurality of tracts to be determined correctly by correcting for errors introduced by sequencing artifacts or polymerase slippage during the amplifying step.
[0012] Preferably, the target portions are markers for MSI such as one or more of BAT25, BAT26, MON027, NR21, NR24, Penta C, and Penta D. For example, the markers may include all of BAT25, BAT26, MON027, NR21, and NR24. In certain embodiments, each of the microsatellite markers is selected from the group consisting of BAT-25, BAT-26, MONO-27, NR-21, NR-24, Penta C, and Penta D, BAT-40, TGF.beta. RII, IGFIIR, hMSH3, BAX and dinucleotide D2S123, D9S283, D9S1851 and D18S58 loci, by way of example.
[0013] In some embodiments, the method includes recommending a treatment for the patient based on the MSI status. Where the MSI status indicates that the patient is microsatellite instable, the treatment may include an immune checkpoint inhibitor. In certain embodiments, the method includes administering the treatment (e.g., the immune checkpoint inhibitor) to the patient. The immune checkpoint inhibitor may be, for example, an antibody such as an anti-PD-1 antibody; an anti-IDO antibody; anti-CTLA-4 antibody; an anti-PD-L1 antibody; or an anti-LAG-3 antibody.
[0014] Related aspects provide a method of detecting microsatellite instability (MSI) that includes obtaining a sample comprising fragments of cell-free DNA from a patient; attaching barcodes to the fragments, wherein at least some of the barcodes are not unique; sequencing the barcodes to obtain sequences of a plurality of markers in the DNA; determining a distribution of lengths of the plurality of markers; and providing a report describing MSI in the patient when peaks in the distribution deviate significantly from expected peaks in a modeled healthy distribution.
BRIEF DESCRIPTION OF THE DRAWINGS
[0015] FIG. 1 diagrams a method for determining MSI status.
[0016] FIG. 2 shows a system for performing methods of the invention.
[0017] FIG. 3 shows a model of length distribution of mononucleotide repeats.
[0018] FIG. 4 shows a report provided by systems and methods of the invention.
[0019] FIGS. 5A-5D Plasma-Based Detection of Microsatellite Instability. (A) Prior to error correction and Digital Peak Finding (DPF) (light pink), the mononucleotide count distribution demonstrated high background noise due to sequencing related aberrations and polymerase slippage in library preparation PCR and sequencing. These are subsequently resolved after error correction and DPF (dark pink) to create distinct distributions for MSI and MSS alleles. (B) Across the BAT25, BAT26, MON027, NR21, and NR24 mononucleotide loci in 163 healthy donor plasma specimens, the error corrected mononucleotide count distribution was assessed with a DPF algorithm to identify mononucleotide alleles and determine MSI status. Prior to error correction and DPF (light pink), the majority of healthy donor samples exhibit alleles below the MSI cutoff (hashed line). Kaplan-Meier curves for progression free survival (C) and overall survival (D) among patients with progressive metastatic carcinoma were determined using MSI status from pre-treatment plasma specimens. In MSI patients (n=9*), median progression free survival was 16.17 months, while median overall survival was not reached. In MSS patients (n=7*), median progression free survival and median overall survival were 2.81 and 7.6 months, respectively. *Three patients with a tissue enrollment status of MSI-H were classified as MSS using pre-treatment baseline cfDNA obtained from plasma.
[0020] FIGS. 6A-6E Plasma-Based Detection of High Tumor Mutation Burden. (A) Using whole exome sequencing data derived from The Cancer Genome Atlas (TCGA), a significant positive correlation between the tumor mutation burden (TMB) evaluated in the 98 kb targeted regions compared to the whole exome analyses was observed (r=0.91, p<0.0001; Pearson correlation). (B) Comparison of the accuracy for determination of the TMB derived from the targeted panel in plasma compared to whole-exome analyses of matched archival tissue samples in 13 patients yielded a significant positive correlation (r=0.693, p=0.007; Pearson correlation). (C) The overall TMB status at baseline was assigned as TMB-High or TMB-Low using a cutoff of 50.8 mutations/Mbp sequenced. In total, six patients were categorized as TMB-High and ten patients as TMB-Low, with a median load of 132 mutations/Mbp sequenced and 15.2 mutations/Mbp sequenced, respectively. Additionally, 163 healthy donor cases were evaluated, all of which were determined to be TMB-Low, with a median load of 0 mutations/Mbp sequenced across the panel. Kaplan-Meier curves for progression free survival (D) and overall survival (E) among this same cohort of patients were determined using TMB status from pre-treatment plasma specimens with a cutoff of 50.8 mutations/Mbp sequenced. In TMB-High patients (n=6), median progression free survival and median overall survival were not reached. In TMB-Low patients (n=10), median progression free survival and median overall survival were 2.84 and 7.62 months, respectively.
[0021] FIGS. 7A-7F Serial Plasma-Based Overall Survival Analysis for Patients Treated with Immune Checkpoint Blockade. (A) Evaluation of overall survival with the protein biomarker level at last dose (CEA or CA19-9). A significant inverse correlation was observed between the overall survival in months when compared to the residual protein biomarker (r=-0.99, p=<0.001; Pearson correlation). (B) Kaplan-Meier curves for overall survival among patients with tissue enrollment status of MSI and detectable protein biomarker levels (n=8). For patients with >80% reduction in protein biomarker levels (n=4), median overall survival was not reached. For patients with .ltoreq.80% reduction in protein biomarker levels (n=4), median overall survival was 5.26 months. (C) Evaluation of overall survival compared to residual MSI allele levels at last dose. A significant inverse correlation was observed between the overall survival when compared to the residual MSI allele levels (r=-0.70, p=0.034; Pearson correlation). (D) Kaplan-Meier curves for overall survival among patients with tissue enrollment status of MSI and detectable MSI status at baseline (n=9). For patients with two consecutive timepoints displaying no residual MSI alleles (n=4) median overall survival was not reached. For patients with multiple timepoints containing residual MSI alleles (n=5) median overall survival was 7.64 months. (E) Evaluation of overall survival compared to residual TMB levels at last dose. A significant inverse correlation was observed between the overall survival in months when compared to the residual TMB levels (r=-0.95, p=<0.001; Pearson correlation). (F) Kaplan-Meier curves for overall survival among patients with tissue enrollment status of MSI and detectable TMB levels at baseline (n=11). For patients with >90% reduction in TMB levels (n=4), median overall survival was not reached. For patients with .ltoreq.90% reduction in TMB levels (n=7), median overall survival was 7.64 months. "/" indicates a censored datapoint; "*" indicates cases where baseline protein biomarker, MSI or TMB was not detected and were not included in the subsequent analyses; In cases where residual protein biomarker, MSI or TMB levels increased when compared to baseline, values of greater than 100% are indicated.
[0022] FIGS. 8A-8D Monitoring of Patients During Immune Checkpoint Blockade. For three patients with a complete response to immune checkpoint blockade (CS97 (A), CS98 (B), and CS00 (C) and one patient with progressive disease (CS05 (D)), circulating protein biomarkers (CEA, ng/mL and CA19-9, units/mL), residual alleles exhibiting MSI, and TMB levels were evaluated over time during treatment. In each case exhibiting a complete response, residual MSI and TMB alleles were reduced to 0% mutant allele fraction (MAF) between 0.6 and 4.8 months after first dose.
[0023] FIGS. 9A-9D Archival Tissue-Based Detection of Microsatellite Instability and High Tumor Mutation Burden. Kaplan-Meier curves for progression free survival (A) and overall survival (B) among patients with progressive metastatic carcinoma were determined using MSI status from archival tissue. In MSI patients (n=12), median progression free survival and median overall survival were 4.23 and 20.69 months, respectively. In MSS patients (n=4), median progression free survival and median overall survival were 2.81 and 6.31 months, respectively. Kaplan-Meier curves for progression free survival (C) and overall survival (D) among patients with progressive metastatic carcinoma were determined. In TMB-High patients (n=10), median progression free survival was 10.81 months, while median overall survival was not reached. In TMB-Low patients (n=3), median progression free survival and median overall survival were 2.81 and 5.02 months, respectively.
[0024] FIGS. 10A-10F Plasma-Based Progression Free Survival Analysis for Patients Treated with Immune Checkpoint Blockade. (A) Evaluation of progression free survival with the protein biomarker level at last dose (CEA or CA19-9). An inverse correlation was observed between the progression free survival in months when compared to the residual protein biomarker (r=-0.92, p=0.001; Pearson correlation). (B) Kaplan-Meier curves for progression free survival among patients with tissue enrollment status of MSI and detectable protein biomarker levels (n=8). For patients with >80% reduction in protein biomarker levels (n=4), median progression free survival was not reached. For patients with .ltoreq.80% reduction in protein biomarker levels (n=4), median progression free survival was 2.63 months. (C) Evaluation of progression free survival compared to residual MSI allele levels at last dose. A significant inverse correlation was observed between the progression free survival in months when compared to the residual MSI allele levels (r=-0.84, p=0.004; Pearson correlation). (D) Kaplan-Meier curves for progression free survival among patients with tissue enrollment status of MSI and detectable MSI status at baseline (n=9). For patients with two consecutive timepoints displaying no residual MSI alleles (n=4) median progression free survival was not reached. For patients with multiple timepoints containing residual MSI alleles (n=5) median progression free survival was 3.01 months. (E) Evaluation of progression free survival compared to residual TMB levels at last dose. A significant inverse correlation was observed between the progression free survival in months when compared to the residual TMB levels (r=-0.98, p=<0.001; Pearson correlation). (F) Kaplan-Meier curves for progression free survival among patients with tissue enrollment status of MSI and detectable TMB levels at baseline (n=11). For patients with >90% reduction in TMB levels (n=4), median progression free survival was not reached. For patients with .ltoreq.90% reduction in TMB levels (n=7), median progression free survival was 2.88 months. "/" indicates a censored datapoint; "*" indicates cases where baseline protein biomarker, MSI or TMB was not detected and were not included in the subsequent analyses; In cases where residual protein biomarker, MSI or TMB levels increased when compared to baseline, values of greater than 100% are indicated.
[0025] FIG. 11 Radiographic Imaging of Case CS98 Displaying a Complete Response to Immune Checkpoint Blockade. After 20 weeks of treatment with immune checkpoint blockade, radiographic imaging was performed and revealed potential lesions in the liver, but later disappeared, so likely instead represented inflammatory liver nodules.
DETAILED DESCRIPTION OF THE INVENTION
[0026] The present invention relates to the discovery that microsatellite instability (MSI) and high tumor mutation burden (TMB-High) are pan-tumor biomarkers used to select patients for treatment with immune checkpoint blockade. The present invention shows a plasma-based approach for detection of MSI and TMB-High in patients with advanced cancer. To detect sequence alterations across a 98 kilobase panel, including those in microsatellite regions, the inventors developed an error correction approach with specificities >99% (n=163) and sensitivities of 75% (n=12) and 60% (n=10), respectively, for MSI and TMB-High. For patients treated with PD-1 blockade, the data demonstrate that MSI and TMB-High in pre-treatment plasma predicted progression-free survival (hazard ratios 0.2 and 0.12, p=0.01 and 0.004, respectively). The data shows the results when plasma during therapy was analyzed in order to develop a prognostic signature for patients who achieved durable response to PD-1 blockade. These analyses demonstrate the feasibility of non-invasive pan-cancer screening and monitoring of patients who exhibit MSI or TMB-High and have a high likelihood of responding to immune checkpoint blockade.
[0027] The disclosure provides for the detection of MSI by liquid biopsy. While plasma is the illustrative example provided herein, it is understood that a liquid biopsy can be performed with a biological sample including blood, plasma, saliva, urine, feces, tears, mucosal secretions and other biological fluids.
[0028] In particular, methods of the disclosure provide and include the analytical validation of an integrated NGS-based liquid biopsy approach for the detection of microsatellite instability associated with cancers such as pancreatic, colon, gastric, endometrial, cholangiocarcinoma, breast, lung, head and neck, kidney, bladder, or prostate cancer, as well as hematopoietic cancers, among others. Failure of the DNA mismatch repair (MMR) pathway during DNA replication in cancer leads to the increased accumulation of somatic mutations. One important marker of MMR deficiency is microsatellite instability (MSI), which presents as polymorphism of tandem nucleotide repeat lengths ubiquitously distributed throughout the genome. Methods of the disclosure are offered to assay for and detect those markers via liquid biopsy. Additionally, since the presence of MMR-deficiency or MSI may serve as a marker for immunotherapy response with checkpoint inhibition, methods may be used to determine a course of treatment such as immunotherapy or the administration of a checkpoint inhibitor.
[0029] Microsatellite instability (MSI) and mismatch repair (MMR) deficiency have recently been demonstrated to predict immune checkpoint blockade response. The checkpoint inhibitor pembrolizumab is now indicated for the treatment of adult and pediatric patients with any unresectable or metastatic solid tumors identified as having either of these biomarkers. This indication covers patients with solid tumors that have progressed following prior treatment and have no satisfactory alternative treatment options.
[0030] Cancer is characterized by the accumulation of somatic mutations that have the potential to result in the expression of neoantigens, which may elicit T-cell-dependent immune responses against tumors. MMR is a mechanism by which post-replicative mismatches in daughter DNA strands are repaired and replaced with the correct DNA sequence. MMR deficiency results in both MSI and high tumor mutation burden (TMB-High), which increases the likelihood that acquired somatic mutations may be transcribed and translated into proteins that are recognized as immunogenic neoantigens. Historically, testing for MSI has been restricted to screening for Hereditary Non-Polyposis Colorectal Cancer (HNPCC), which is often characterized by early age onset colorectal cancer and endometrial cancer, as well as other extracolonic tumors. HNPCC, commonly referred to as Lynch Syndrome, is caused by mutations in the DNA mismatch repair genes (MLH1, MSH2, MSH6 and PMS2), as well as the more recently described, EPCAM(16). In addition to familial conditions, MSI can occur sporadically in cancer, and both hereditary and sporadic MSI patients respond to immune checkpoint blockade(1,2). A recent study, conducted across 39 tumor types and 11,139 patients to determine the landscape of MSI prevalence, concluded that 3.8% of these cancers across 27 tumor types displayed MSI, including 31.4% of uterine/endometrial carcinoma, 19.7% of colon adenocarcinoma, and 19.1% of stomach adenocarcinoma.
[0031] MSI can be detected through alterations in the length of microsatellite sequences typically due to deletions of repeating units of DNA to create novel allele lengths in tumor-derived DNA when compared to a matched-normal or a reference population. Current methods for MSI testing, using tissue biopsies and resection specimens, include PCR-based amplification followed by capillary electrophoresis, and more recently, next-generation sequencing (NGS) based approaches, which are used to quantify microsatellite allele lengths. The challenge associated with application of the former approach are polymerase induced errors (stutter bands), particularly in samples with low tumor purity, such as cell-free DNA (cfDNA), which can mask true biological alleles exhibiting MSI. In the case of NGS based approaches, sensitivity is typically limited by the accuracy for determination of homopolymer lengths. A novel method was recently described for determination of MSI using pre-PCR elimination of wild-type DNA homopolymers in liquid biopsies. However, given the low prevalence of MSI across cancer, it would be preferable to develop an NGS profiling approach which can include other clinically actionable alterations in cancer, including TMB, sequence mutations, copy number alterations, and translocations.
[0032] In addition to the technical challenges associated with MSI detection, it is often not possible to readily obtain biopsy or resection tissue for genetic testing due to insufficient material (biopsy size and tumor cellularity), exhaustion of the limited material available after prior therapeutic stratification, logistical considerations for tumor and normal sample acquisition after initial diagnosis, or safety concerns related to additional tissue biopsy interventions(26). In contrast, plasma-based approaches offer the unique opportunity to obtain a rapid and real-time view of the primary tumor and metastatic lesions along with associated response to therapy. Circulating tumor DNA can be used to monitor and assess residual disease in response to clinical intervention, such as surgery or chemotherapy(27-33), which can directly impact patient care. To determine the clinical impact of identifying tumors that harbor MSI or TMB-High using cfDNA, we developed and applied a 98 kb 58-gene targeted panel to cancer patients with advanced disease treated with PD-1 blockade. FIG. 1 diagrams a method 101 of detecting microsatellite instability (MSI). The method 101 includes obtaining 107 cell-free DNA (cfDNA) from a sample of plasma from a patient. Preferably, non-unique barcode are attached 111. Portions of the cfDNA are sequenced 115 to obtain sequences of a plurality of tracts of nucleotide repeats in the cfDNA. The method 101 includes modeling 121 a distribution of lengths of tracts of nucleotide repeats. A report is provided 125 describing an MSI status in the patient when a distribution of lengths of the plurality of tracts has peaks that deviate significantly from peaks in a reference distribution. Obtaining the cfDNA may include capturing target portions of DNA with probes, fragmenting the target portions to yield fragments, and attaching barcodes to the fragments.
[0033] Briefly, cell-free DNA may be extracted from cell line or blood or plasma specimens and prepared into a genomic library suitable for next-generation sequencing with oligonucleotide barcodes through end-repair, A-tailing and adapter ligation. An in-solution hybrid capture, utilizing for example, 120 base-pair (bp) RNA oligonucleotides may be performed.
[0034] In one embodiment, at least about 10-100 ng, such as 50 ng of DNA in 100 microliters of TE is fragmented in a sonicator to a size of about 150-450 bp. To remove fragments smaller than 150 bp, DNA may be purified using Agencourt AMPure XP beads (Beckman Coulter, IN) in a ratio of 1.0 to 0.9 of PCR product to beads twice and, e.g., washed using 70% ethanol per the manufacturer's instructions. Purified, fragmented DNA is mixed with H2O, End Repair Reaction Buffer, End Repair Enzyme Mix (cat# E6050, NEB, Ipswich, Mass.). The mixture is incubated then purified using Agencourt AMPure XP beads (Beckman Coulter, IN) in a ratio of 1.0 to 1.25 of PCR product to beads and washed using 70% ethanol per the manufacturer's instructions. To A-tail, end-repaired DNA is mixed with Tailing Reaction Buffer and Klenow (exo-) (cat# E6053, NEB, Ipswich, Mass.). The mixture is incubated at 37 degree C. for 30 min and purified using Agencourt AMPure XP beads (Beckman Coulter, IN) in a ratio of 1.0 to 1.0 of PCR product to beads and washed using 70% ethanol per the manufacturer's instructions. For adaptor ligation, A-tailed DNA is mixed with H2O, PE-adaptor (Illumina), Ligation buffer and Quick T4 DNA ligase (cat# E6056, NEB, Ipswich, Mass.). The ligation mixture was incubated, then amplified.
[0035] Exonic or targeted regions were captured in solution using the Agilent SureSelect v.4 kit according to the manufacturer's instructions (Agilent, Santa Clara, Calif.). The captured library was then purified with a Qiagen MinElute column purification kit. To purify PCR products, a NucleoSpin Extract II purification kit (Macherey-Nagel, PA) may be used before sequencing.
[0036] Targeted sequencing is performed. Two technical challenges to implementing these approaches in the form of a liquid biopsy include the limited amount of DNA obtained and the low mutant allele frequency associated with the MSI markers. It may be that as few as several thousand genomic equivalents are obtained per milliliter of plasma, and the mutant allele frequency can range from <0.01% to >50% total cfDNA. see Bettegowda, 2014, Detection of circulating tumor DNA in early- and late-stage human malignancies, Sci Trans Med 6(224):224ra24, incorporated by reference. The disclosed techniques overcome such problems and improve test sensitivity, optimized methods for conversion of cell-free DNA into a genomic library, and digital sequencing approaches to improve the specificity of next-generation sequencing approaches.
[0037] Methods may include extracting and isolating cell-free DNA from a blood or plasma sample and assigning an exogenous barcode to each fragment to generate a DNA library. The exogenous barcodes are from a limited pool of non-unique barcodes, for example 8 different barcodes. The barcoded fragments are differentiated based on the combination of their exogenous barcode and the information about the reads that results from sequencing such as the sequence of the reads (effectively, an endogenous barcode) or position information (e.g., stop and/or start position) of the read mapped to a reference. The DNA library is redundantly sequenced 115 and the sequences with matching barcodes are reconciled. The reconciled sequences may be aligned to a human genome reference.
[0038] The invention recognizes that completely unique barcode sequences are unnecessary. Instead, a combination of predefined set of non-unique sequences together with the endogenous barcodes can provide the same level of sensitivity and specificity that unique barcodes could for biologically relevant DNA amounts and can, in-fact, correct for sequencing artifacts or polymerase slippage. A limited pool of barcodes is more robust than a conventional unique set and easier to create and use. Methods include obtaining a sample comprising nucleic acid fragments, providing a plurality of sets of non-unique barcodes, and tagging 111 the nucleic acid fragments with the barcodes to generate a genomic library, wherein each nucleic acid fragment is tagged with the same barcode as another different nucleic acid fragment in the genomic library.
[0039] In embodiments, the plurality of sets is limited to twenty or fewer unique barcodes. In other embodiments, the plurality of sets is limited to ten or fewer unique barcodes.
[0040] According to the present invention, a small pool of non-unique exogenous barcodes can be used to provide a robust assay that achieves levels of sensitivity that are comparable to traditional, more complex barcoding schemes, while vastly reducing cost and complication.
[0041] After processing steps such as those described above, nucleic acids can be sequenced. Sequencing may be by any method known in the art. DNA sequencing techniques include classic dideoxy sequencing reactions (Sanger method) using labeled terminators or primers and gel separation in slab or capillary, and next generation sequencing methods such as sequencing by synthesis using reversibly terminated labeled nucleotides, pyrosequencing, 454 sequencing, Illumina/Solexa sequencing, allele specific hybridization to a library of labeled oligonucleotide probes, sequencing by synthesis using allele specific hybridization to a library of labeled clones that is followed by ligation, real time monitoring of the incorporation of labeled nucleotides during a polymerization step, polony sequencing, and SOLiD sequencing. Separated molecules may be sequenced by sequential or single extension reactions using polymerases or ligases as well as by single or sequential differential hybridizations with libraries of probes.
[0042] A sequencing technique that can be used includes, for example, use of sequencing-by-synthesis systems sold under the trademarks GS JUNIOR, GS FLX+ and 454 SEQUENCING by 454 Life Sciences, a Roche company (Branford, Conn.), and described by Margulies, M. et al., Genome sequencing in micro-fabricated high-density picotiter reactors, Nature, 437:376-380 (2005); U.S. Pat. No. 5,583,024; U.S. Pat. No. 5,674,713; and U.S. Pat. No. 5,700,673, the contents of which are incorporated by reference herein in their entirety.
[0043] Other examples of DNA sequencing techniques include SOLiD technology by Applied Biosystems from Life Technologies Corporation (Carlsbad, Calif.) and ion semiconductor sequencing using, for example, a system sold under the trademark ION TORRENT by Ion Torrent by Life Technologies (South San Francisco, Calif.). Ion semiconductor sequencing is described, for example, in Rothberg, et al., An integrated semiconductor device enabling non-optical genome sequencing, Nature 475:348-352 (2011); U.S. Pub. 2010/0304982; U.S. Pub. 2010/0301398; U.S. Pub. 2010/0300895; U.S. Pub. 2010/0300559; and U.S. Pub. 2009/0026082, the contents of each of which are incorporated by reference in their entirety.
[0044] Another example of a sequencing technology that can be used is Illumina sequencing. Illumina sequencing is based on the amplification of DNA on a solid surface using fold-back PCR and anchored primers. Adapters are added to the 5' and 3' ends of DNA that is either naturally or experimentally fragmented. DNA fragments that are attached to the surface of flow cell channels are extended and bridge amplified. The fragments become double stranded, and the double stranded molecules are denatured. Multiple cycles of the solid-phase amplification followed by denaturation can create several million clusters of approximately 1,000 copies of single-stranded DNA molecules of the same template in each channel of the flow cell. Primers, DNA polymerase and four fluorophore-labeled, reversibly terminating nucleotides are used to perform sequential sequencing. After nucleotide incorporation, a laser is used to excite the fluorophores, and an image is captured and the identity of the first base is recorded. The 3' terminators and fluorophores from each incorporated base are removed and the incorporation, detection and identification steps are repeated. Sequencing according to this technology is described in U.S. Pat. No. 7,960,120; U.S. Pat. No. 7,835,871; U.S. Pat. No. 7,232,656; U.S. Pat. No. 7,598,035; U.S. Pat. No. 6,911,345; U.S. Pat. No. 6,833,246; U.S. Pat. No. 6,828,100; U.S. Pat. No. 6,306,597; U.S. Pat. No. 6,210,891; U.S. Pub. 2011/0009278; U.S. Pub. 2007/0114362; U.S. Pub. 2006/0292611; and U.S. Pub. 2006/0024681, each of which are incorporated by reference in their entirety.
[0045] Preferably sequencing is done redundantly for deep coverage, preferably at least 30.times. coverage or 100.times.. DNA libraries may be sequenced using paired-end 111umina HiSeq 2500 sequencing chemistry to an average target total coverage of either >20,000-fold or >5,000-fold coverage for each targeted base. Sequence data may be mapped to the reference human genome. Preferably, the sequencing is next-generation, short-read sequencing. The obtained sequences may include a plurality of sequence reads and the method may include aligning the sequence reads to a reference, and identifying groups of sequence reads that originated from a unique segment of the cfDNA by means of the barcode information and position or content of the sequence reads. Primary processing of sequence data may be performed using Illumina CASAVA software (v1.8), including masking of adapter sequences. Sequence reads may bealigned against the human reference genome (version hg18) using ELAND with additional realignment of select regions using the Needleman-Wunsch method.
[0046] In some embodiments, the barcodes are non-unique barcodes that include duplicates such that different ones of the fragments are attached to identical barcodes. The high clinical efficacy of MSI status now requires a fast, objective, highly sensitive screening method, particularly in late-stage patients where tumor material may not be readily obtained. However, to extend this approach to a liquid biopsy panel requires technological advances to both overcome the inherent challenges associated with low circulating tumor DNA (ctDNA) levels which is compounded by polymerase slippage in mononucleotide repeat regions during PCR amplification as well as other sequencing artifacts.
[0047] To overcome these limitations, we applied error correction approach using molecular barcoding together with high sequencing depth and a novel peak finding algorithm to more accurately identify the specific mononucleotide sequences in cell-free DNA (cfDNA) analyses of a 64 gene panel, by way of illustration. The MSI markers can be sequenced in conjunction with such 64 gene panel, or in isolation (e.g,. just sequence the markers) or in conjunction with any other gene panel (e.g., >300 genes) or with whole genome or whole exome sequencing.
[0048] The method may include amplifying the fragments to produce amplicons that include barcode information and copies of the fragments, wherein the sequencing step comprises sequencing the amplicons.
[0049] The use of the non-unique barcodes to identify groups of sequence reads that originated from a unique segment of the cfDNA allows for the lengths of the plurality of tracts to be determined correctly by correcting for errors introduced by sequencing artifacts or polymerase slippage during the amplifying step. By eliminating a significant majority of sequencing errors and polymerase slippage artifacts, we were able to reduce background error rates by >90%. Combined with implementation of a distribution modeling and a peak finding algorithm, we were able to accurately sequence the mononucleotide tracts to minimize false discovery rates for cfDNA analyses.
[0050] FIG. 2 shows a system 901 for performing methods of the disclosure. The system 901 includes a computer 933, and may optionally include a server computer 909. In certain embodiments, the system 901 includes a sequencing instrument 955 (such as an Illumina HiSeq device) which may itself include an instrument computer 951 (e.g., onboard in the sequencing instrument). Any of the computers may communicate via network 915. Each computer preferably includes at least one tangible, non-transitory memory device 975 and any input/output devices coupled to a processor. The memory may include instructions executable by the processor(s) to perform methods such as a method of detecting microsatellite instability (MSI) that includes obtaining a sample comprising fragments of cell-free DNA from a patient; attaching barcodes to the fragments, wherein at least some of the barcodes are not unique; sequencing the barcodes to obtain sequences of a plurality of markers in the DNA; determining a distribution of lengths of the plurality of markers; and providing a report describing MSI in the patient when peaks in the distribution deviate significantly from expected peaks in a modeled healthy distribution.
[0051] FIG. 3 illustrates distribution modeling for peak finding. In the illustrated distribution model 301, a model 307 of a distribution of lengths of tracts of nucleotide repeats is determined. It may be compared to a reference distribution 305 and an operation may be performed to find a peak 313 for the patient data 307 and/or the reference distribution 305 (which may be from patient healthy sample DNA or from a human genome reference or any other suitable source. In some embodiments, when the peak finding operation determines that the patient peak 313 is sufficiently deviant from a location of a reference peak, the method and system report the patient as MSI (microsatellite instable) for the relevant marker. Most preferably, the peak finding and distribution modeling is performed for each MSI marker. A benefit of the described method is that the distribution modeling and peak finding may be reliably implemented and automated in a high-throughput system.
[0052] MSI may be assayed by hybrid capture and NGS to address such markers as mononucleotide repeat markers such as BAT25, BAT26, MON027, NR21, and NR24. See U.S. Pub. 2017/0267760, incorporated by reference. Knowledge of MSI status is important and valuable in the treatment of many cancers, and there are patients for whom tumor material is not readily obtained. Tumors deficient in mismatch repair are particularly susceptible to a particular form of immunotherapy because this phenotype results in ongoing accumulation of mutations at a high frequency. Methods may include recommending or administering treatment for cancer patients that display the microsatellite instability phenotype or other high mutational burden. The treatment involves an inhibitory antibody for an immune checkpoint. Such checkpoints include PD-1, IDO, CTLA-4, PD-L1, and LAG-3 by way of example. Other immune checkpoints can be used as well. Antibodies can be administered by any means that is convenient, including but not limited to intravenous infusion, oral administration, subcutaneous administration, sublingual administration, ocular administration, nasal administration, and the like.
[0053] Preferably, the method 101 includes providing 125 a report with MSI status.
[0054] FIG. 4 shows a report 410 that includes a status of "instable" for certain MSI markers. Preferably, the target portions are markers for MSI such as one or more of BAT25, BAT26, MON027, NR21, NR24, Penta C, and Penta D. For example, the markers may include all of BAT25, BAT26, MON027, NR21, and NR24. In certain embodiments, each of the microsatellite markers is selected from the group consisting of BAT-25, BAT-26, MONO-27, NR-21, NR-24, Penta C, and Penta D.
[0055] In some embodiments, the method includes recommending a treatment for the patient based on the MSI status. Where the MSI status indicates that the patient is microsatellite instable, the treatment may include an immune checkpoint inhibitor. In certain embodiments, the method includes administering the treatment (e.g., the immune checkpoint inhibitor) to the patient. The immune checkpoint inhibitor may be, for example, an antibody such as an anti-PD-1 antibody; an anti-IDO antibody; anti-CTLA-4 antibody; an anti-PD-L1 antibody; or an anti-LAG-3 antibody. Types of antibodies which can be used include any that are developed for the immune checkpoint inhibitors. These can be monoclonal or polyclonal. They may be single chain fragments or other fragments of full antibodies, including those made by enzymatic cleavage or recombinant DNA techniques. They may be of any isotype, including but not limited to IgG, IgM, IgE. The antibodies may be of any species source, including human, goat, rabbit, mouse, cow, chimpanzee. The antibodies may be humanized or chimeric. The antibodies may be conjugated or engineered to be attached to another moiety, whether a therapeutic molecule or a tracer molecule. The therapeutic molecule may be a toxin, for example. The present invention is more particularly described in the following examples which are intended as illustrative only since numerous modifications and variations therein will be apparent to those skilled in the art. The following examples are intended to illustrate but not limit the invention.
EXAMPLES
Example 1
Methods
[0056] Patients and Sample Collection
[0057] Formalin fixed paraffin embedded (FFPE) tumor and matched normal buffy coat specimens (n=61) from individuals with cancer were obtained after surgical resection through commercial biorepositories from BioIVT (Hicksville, N.Y., USA), Indivumed (Hamburg, Germany), and iSpecimen (Lexington, Mass., USA). Plasma samples from healthy individuals (n=163) were procured through BioIVT (Hicksville, N.Y., USA) during routine screening with negative results and no prior history of cancer. Human cells from previously characterized MSI cell lines were obtained from ATCC (Manassas, Va., USA) (n=5; LS180, LS411N, SNU-C2B, RKO, and SNU-C2A). Finally, baseline and serial plasma samples from cancer patients with progressive metastatic carcinoma (n=16; 11 colorectal, 3 ampullary, and 2 small intestine) were obtained while patients were enrolled in a phase 2 clinical trial to evaluate immune checkpoint blockade with pembrolizumab(1,2). Radiographic and serum protein biomarker data for CEA and CA19-9 were collected as a part of routine clinical care. All samples were obtained under Institutional Review Board approved protocols with informed consent for research.
[0058] Orthogonal Testing of FFPE Tissue for MSI Status
[0059] The Promega MSI analysis system (Madison, Wis., USA) was used to assess MSI status in DNA derived from FFPE tumor tissue together with matched normal buffy coat by multiplex PCR and fluorescent capillary electrophoresis. Tumors were classified as MSI if two or more of the five mononucleotide markers (BAT25, BAT26, MONO27, NR21, and NR24) had significant length differences compared to the matched normal allele lengths. Additionally, 2-pentanucleotide repeat loci (PentaC and PentaD) were used to confirm case identity between normal and tumor samples.
[0060] Sample Preparation and Next-Generation Sequencing
[0061] FFPE Tumor and Normal Analyses
[0062] Sample processing from tissue or buffy coat, library preparation, hybrid capture, and sequencing were performed as previously described at Personal Genome Diagnostics (Baltimore, Md.)(34,36). Briefly, DNA was extracted from FFPE tissue and matched normal buffy coat cells using the Qiagen FFPE Tissue Kit and DNA Blood Mini Kit, respectively (Qiagen, Hilden, Germany). Genomic DNA was sheared using a Covaris sonicator (Woburn, Mass., USA) to a size range of 150-450 bp, and subsequently used to generate a genomic library using the New England Biolabs (Ipswich, Mass., USA) end-repair, A-tailing, and adapter ligation modules. Finally, genomic libraries were amplified and captured using the Agilent SureSelect XT in-solution hybrid capture system with a custom 120 bp RNA panel targeting the pre-defined regions of interest across 125 genes (Table 1). Captured libraries were sequenced on the Illumina HiSeq 2000 or 2500 (Illumina, San Diego, Calif., USA) with 100 bp paired end reads.
[0063] Plasma Analyses
[0064] Sample processing from plasma, library preparation, hybrid capture, and sequencing were performed as previously described at Personal Genome Diagnostics (Baltimore, Md.)(34). Briefly, blood was collected in EDTA tubes and centrifuged at 800 g for 10 minutes at 4.degree. C. to separate plasma from white blood cells. Cell-free DNA was extracted from plasma using the QIAamp Circulating Nucleic Acid Kit (Qiagen, Hilden, Germany). Libraries were prepared with 5-250 ng of cfDNA using the NEBNext DNA Library Prep Kit (New England Biolabs, Ipswich, Mass., USA). After end repair and a-tailing, a pool of eight unique Illumina dual index adapters with 8 bp barcodes were ligated to cfDNA to allow for accurate error correction of duplicate reads, followed by 12 cycles of amplification. Targeted hybrid capture was performed using Agilent SureSelect XT in-solution hybrid capture system with a custom 120 bp RNA panel targeting the pre-defined regions of interest across 58 genes (Table 4) according to the manufacturer protocol (Agilent Technologies, Santa Clara, Calif., USA). Captured libraries were sequenced on the Illumina HiSeq 2000 or 2500 (Illumina, San Diego, Calif., USA) with 100 bp paired end reads.
Example 2
Microsatellite Instability Analyses by Next-Generation Sequencing
[0065] Sequence data were aligned to the human reference genome assembly (hg19) using BWA-MEM(37). Reads mapping to microsatellites were excised using Samtools(38) and analyzed for insertion and deletion events (indels). In most cases, alignment and variant calling did not generate accurate indel calls in repeated regions due to low quality bases surrounding the microsatellites. Therefore, a secondary local realignment and indel quantitation was performed. Reads were considered for an expanded indel analysis if (i) the mononucleotide repeat was contained to more than eight bases inside of the start and end of the read, (ii) the indel length was .ltoreq.12 bases from the reference length, (iii) there were no single base changes found within the repeat region, (iv) the read had a mapping score of 60, and (v) .ltoreq.20 bases of the read were soft clipped for alignment. After read specific mononucleotide length analysis, error correction was performed to allow for an aggregated and accurate quantitation among duplicated fragments using molecular barcoding. Reads were aggregated into barcode families by using the ordered and combined read 1 and read 2 alignment positions with the molecular barcode. Barcode families were considered for downstream analysis if they comprised of at least 2 reads and >50% of reads had consistent mononucleotide lengths. The error corrected mononucleotide length distribution was subjected to a peak finding algorithm where local maxima were required to be greater than the error corrected distinct fragment counts of the adjacent lengths .+-.2 bp. Identified peaks were further filtered to only include those which had >3 error corrected distinct fragments at .gtoreq.1% of the absolute coverage. The shortest identified mononucleotide allele length was compared to the hg19 reference length. If the allele length was .gtoreq.3 bp shorter than the reference length, the given mononucleotide loci was classified as exhibiting instability. This approach was applied across all mononucleotide loci. Samples were classified as MSI-H if .gtoreq.20% of loci were MSI. In the targeted 58 gene plasma panel, BAT25, BAT26, MONO27, NR21, and NR24 mononucleotide loci were for the determination of MSI status. In the targeted 125 gene targeted tissue panel, an additional 65 microsatellite regions were used for MSI classification.
Example 3
Tumor Mutational Burden Analyses by Next-Generation Sequencing
[0066] Next generation sequencing data were processed and variants were identified using the VariantDx custom software as previously described(34). A final set of candidate somatic mutations were selected for tumor mutational burden analyses based on: (i) variants enriched due to sequencing or alignment error were removed (.ltoreq.5 observations or <0.30% mutant allele fraction), (ii) nonsynonymous and synonymous variants were included, but variants arising in non-coding regions were removed, (iii) hotspot variants annotated in COSMIC (version 72) were not included to reduce bias toward driver alterations, (iv) common germline SNPs found in dbSNP (version 138) were removed as well as variants deemed private germline variants based on the variant allele frequency, and (v) variants associated with clonal hematopoietic expansion were not included in the candidate variant set(39).
[0067] In Silico TCGA Analyses
[0068] In order to evaluate the accuracy of the 98 kb targeted panel for prediction of TMB, a comparison to whole-exome sequencing data derived from The Cancer Genome Atlas (TCGA)(35) was performed by considering synonymous and nonsynonymous alterations, excluding known hotspot mutations which may not be representative of TMB in the tumor. The cutoff for consideration as TMB-High was set to 5 candidate variants (50.8 mutations/Mbp sequenced) based on in silico analyses utilizing the TCGA data to achieve >95% accuracy (>36 mutations/Mbp).
[0069] Statistical Analyses
[0070] Due to small sample size, Firth's Penalized Likelihood was used to evaluate significant differences between Kaplan-Meier curves for progression free survival and overall survival with the classifiers baseline MSI status, baseline TMB status, two consecutive timepoints with >80% reduction in baseline protein biomarker levels, two consecutive timepoints with 0% residual MSI alleles on treatment, and two consecutive timepoints with >90% reduction in baseline TMB levels. Pearson correlations were used to evaluate significant association between TMB in the 58 gene targeted panel compared to whole-exome analyses, progression free and overall survival compared to residual protein biomarker levels, and progression free and overall survival compared to residual MSI and TMB allele levels. A student t-test was used to evaluate significant differences between the mean TMB level in TMB-High and TMB-Low patients. Response rate was calculated as the number of patients exhibiting a complete or partial response as a proportion of the total patients considered, and then evaluated using a Fisher's exact test.
Example 4
Development of an Assay to Identify MSI in Cell-Free DNA
[0071] To identify MSI in tumor-derived cfDNA, a method to detect length polymorphisms in mononucleotide tract alleles in circulating tumor DNA (ctDNA), which occur at low frequency in plasma, is needed. To overcome this issue, we developed a highly sensitive error-correction approach incorporating the commonly-used mononucleotide tracts BAT25, BAT26, MONO27, NR21, and NR24 for the determination of MSI status in tissue and plasma specimens using NGS. DNA was converted into an NGS compatible library using molecular barcoding, after which these targeted microsatellite loci were enriched using in-solution hybrid capture chemistry together with the regions associated with other clinically relevant genomic alterations.
[0072] To address the technical challenges associated with detection of low level allele length polymorphisms obtained from NGS, we combined an error correction approach for accurate determination of insertions and deletions (indels) present in the cfDNA fragments, together with a digital peak finding (DPF) method for quantification of MSI and MSS alleles. Redundant sequencing of each cfDNA fragment was performed, and reads were aligned to the five microsatellite loci contained in the human reference genome (hg19). cfDNA sequences were then analyzed for indels through a secondary local alignment at these five microsatellite loci to more accurately determine the indel length. To perform the error correction, duplicated reads associated with each cfDNA molecule were consolidated, only recognizing indels present throughout barcoded DNA fragment replicates obtained through redundant sequencing. Finally, the DPF approach was applied across the error corrected distribution of indels to identify high confidence alleles which exhibit microsatellite instability (FIGS. 5A and 5B).
[0073] To demonstrate the capability of this approach, we first evaluated the performance of the method for detection of MSI in formalin fixed, paraffin embedded (FFPE) tumor tissue specimens obtained from 31 MSI-High (MSI-H) and 30 microsatellite stable (MSS) tumors previously characterized with the PCR-based Promega MSI analysis system. In addition to these five mononucleotide markers, we sequenced 125 selected cancer genes which harbor clinically actionable genetic alterations consisting of sequence mutations (single base substitutions and indels), copy number alterations, and gene rearrangements in cancer (Table 1). Analyses of these 61 colorectal tumors yielded 193 Gb of total sequence data, corresponding to 832-fold distinct coverage on average across the 979 kb panel (Table 2). Analysis of these five mononucleotide loci, together with 65 additional microsatellite regions contained within the 125 gene panel resulted in 100% sensitivity (31/31) and 100% specificity (30/30) for determination of MSI status using the patient-matched tumor and normal samples (Table 3) Similarly, analysis of tumor NGS data using the DPF approach without the patient-matched normal sample yielded 100% concordance (61/61).
[0074] Next, we evaluated the signal-to-noise ratio in homopolymer regions from next-generation sequencing data obtained using cfDNA extracted from plasma. Together with the five mononucleotide loci, we developed a 98 kb, 58 gene panel for sequence mutation (single base substitutions and indels) analyses of clinically actionable genetic alterations in cancer (Table 4). To demonstrate the specificity of this approach for direct detection of MSI, we first obtained plasma from healthy donors (n=163), all of which would be expected to be tumor-free and MSS. These analyses yielded over 1.2 Tb of total sequence data, corresponding to 2,600-fold distinct coverage on average across the 98 kb targeted panel, and resulted in a per-patient specificity of 99.4% (162/163) for determination of MSI status (FIG. 5B, Tables 5 and 6).
[0075] Because ctDNA, even in patients with advanced cancer, may be present at mutant allele fractions (MAFs) less than 5%, we characterized the ability of DPF for sensitive and reproducible detection of MSI at low MAFs. Five previously characterized MSI cell line samples obtained from ATCC (LS180, LS411N, SNU-C2B, RKO, and SNU-C2A) were sheared to a fragment profile simulating cfDNA and diluted with normal DNA to yield a total of 25 ng evaluated at 1% MAF. Additionally, three of these cell lines (LS180, LS411N, and SNU-C2B) were evaluated at 1% MAF in triplicate within, and triplicate across library preparation and sequencing runs (Table 5). Based on the MAF observed in the parental cell line, the cases detected as MSI were computationally confirmed to contain MSI allele MAFs of 0.35%-1.87%, with a median MSI allele MAF of 0.92%. In total, MSI was detected in 90% (18/20) of samples and demonstrated 93.3% (14/15) repeatability and reproducibility within and across runs (Table 6). For one case which was not detected as MSI, one MSI allele was identified at 0.33% MAF and for the other case, no MSI alleles were detected.
Example 5
Assessment of MSI in cfDNA in Patients Treated with PD-1 Blockade
[0076] To evaluate the analytical and clinical performance of this approach for determination of MSI in cfDNA from patients with late-stage cancers, we obtained baseline and serial plasma from patients with metastatic cancers (including 11 colorectal, 3 ampullary, and 2 small intestine), with or without MMR deficiency, while enrolled in a clinical trial to evaluate immune checkpoint blockade with the PD-1 blocking antibody, pembrolizumab(1,2)(Table 7). In total, 12 MSI-H cases and 4 MSS cases, determined through archival tissue-based analyses, were evaluated across at least two timepoints, including baseline, and after approximately 2 weeks, 10 weeks, 20 weeks, and >100 weeks.
[0077] Patients with MSI tumors as determined by archival tissue analyses had improved progression-free survival (hazard ratio, 0.25; p=0.05, likelihood ratio test) and overall survival (hazard ratio, 0.24; p=0.041, likelihood ratio test) (FIGS. 9A and 9B and Table 8). In cfDNA, we could detect MSI in 75% (9/12) of the previously characterized MSI-H patients, and correctly identified 100% (4/4) of the MSS patients (Table 6). Of the three cases that were MSI in the tumor tissue and MSS in the cfDNA, one was a colorectal tumor (patient exhibited progressive disease) and two were small intestinal tumors (one patient exhibited a partial response and one exhibited progressive disease) with relatively low levels of ctDNA with MAF of 0.4%, 1.1%, and no detectable ctDNA in the third case(34) (Table 7).
[0078] We then evaluated pre-treatment MSI status in ctDNA to predict response and clinical outcome to treatment with PD-1 blockade. We assessed radiographic response, progression-free and overall survival to predict clinical outcome. When compared to progression free survival, direct detection of MSI in baseline cfDNA could be used to predict response to immune checkpoint blockade (hazard ratio, 0.2; p=0.01, likelihood ratio test) (FIGS. 5C and 5D).
[0079] Estimating Tumor Mutation Burden in ctDNA
[0080] In addition to MSI status, we also evaluated the ability of our cfDNA panel to predict TMB across a range of tumor types, using whole exome sequencing data derived from The Cancer Genome Atlas (TCGA)(35). We considered synonymous and nonsynonymous alterations identified by TCGA and excluded known hotspot mutations which may not be representative of TMB in the tumor. These analyses demonstrated a positive correlation between predicted TMB from our targeted 58 gene plasma panel compared to the TCGA whole exome analyses (r=0.91, p<0.0001; Pearson correlation) (FIG. 6A). We determined that a cutoff of five mutations (50.8 mutations/Mbp sequenced) in the targeted plasma panel could be used to identify tumors with exceptionally high TMB related to MMR deficiency (>36 mutations/Mbp) at >95% accuracy.
[0081] Patients with TMB-High tumors as determined by archival tissue analyses (.gtoreq.10 mutations/Mbp) had improved progression-free survival (hazard ratio, 0.19; p=0.041, likelihood ratio test) and overall survival (hazard ratio, 0.18; p=0.047, likelihood ratio test) (FIGS. 9C and 9D). We also evaluated the accuracy of TMB derived from the targeted panel in 13 baseline plasma cases, compared to whole-exome analyses of tumor and matched normal tissue in the same patients(1,2), and a similar correlation was identified (r=0.69, p=0.007; Pearson correlation) (FIG. 6B). These patients were classified as either TMB-High or TMB-Low using a cutoff of 50.8 mutations/Mbp sequenced, which captured six of the ten tumors categorized as TMB-High by archival tissue and provided a statistically significant difference in the TMB classification (p=0.0072, t-test) (FIG. 6C). This algorithm was applied to the same 163 healthy donor plasma samples and 100% (163/163) were determined to be TMB-Low (FIG. 6C). When considering TMB classification as a predictor of clinical outcome from the same phase 2 study cohort, TMB-High status was associated with favorable progression free survival (hazard ratio, 0.12; p=0.004 likelihood ratio test) and overall survival (hazard ratio, 0.16; p=0.014, likelihood ratio test) (FIGS. 6D and 6E). Interestingly, all four MSI-H enrolled patients exhibiting a complete response were classified as TMB-High, and all five enrolled MSI-H patients with progressive disease were classified as TMB-Low (Table 7).
Example 6
Assessment of Molecular Remission and Biomarker Dynamics in Patients Treated with PD-1 Blockade
[0082] In addition to baseline plasma analyses, we also hypothesized that the molecular remission, as measured by ctDNA during treatment, would be predictive of long term durable response to immune checkpoint blockade. We first evaluated the utility of monitoring serum tumor protein biomarkers CEA or CA19-9 for determination of response and found that multiple consecutive timepoints with a >80% reduction in the baseline protein biomarker level resulted in improved overall and progression free survival (hazard ratio, 0.05; p=0.01 and hazard ratio, 0.05; p=0.01, likelihood ratio test, respectively) (FIGS. 7A and 7B and FIGS. 10A and 10B). When evaluating the on-treatment serial plasma samples for residual ctDNA levels, there was a significant inverse correlation between the overall and progression free survival when compared to the residual MSI allele levels at last dose (r=-0.70, p=0.034 and r=-0.84, p=0.004, respectively; Pearson correlation) (FIGS. 7C and FIG. 10C). We were able to correctly identify four of the six MSI patients who would achieve a long term durable clinical response requiring multiple consecutive on-treatment time points with 0% residual alleles displaying MSI, all four of which displayed a complete response (hazard ratio, 0.09; p=0.032, likelihood ratio test for overall survival) (FIG. 7D and FIG. 10D). A similar trend was observed when considering patients with a >90% decrease in overall TMB across two timepoints when compared to baseline (hazard ratio, 0.07; p=0.013, likelihood ratio test for overall survival) (FIGS. 7E and 7F and FIGS. 10E and 10F).
[0083] Additionally, for three patients (CS97, CS98, and CS00) with a complete response to immune checkpoint blockade, and one patient (CS05) without a response to immune checkpoint blockade, circulating protein biomarkers (CEA, ng/mL or CA19-9, units/mL) and residual alleles exhibiting MSI and TMB were evaluated over time during treatment (FIG. 8). In each of the patients exhibiting a complete response, there was a concurrent decrease in the circulating protein biomarker levels, the residual MSI alleles, and TMB levels, which correlated with reduced overall tumor volume as assessed by radiographic imaging. Protein biomarker levels decreased by more than 80% between 1.3 to 2.3 months after first dose. Residual MSI alleles and TMB levels were reduced by >90% between 0.6 and 4.8 months after first dose for these three cases. However, for patient CS05 with progressive disease, the protein biomarker levels remained relatively constant, but there was an increase in residual alleles exhibiting MSI and TMB of 78% and 50%, respectively, at 4.8 months. This correlated with a 13% increase in tumor volume as assessed by radiographic imaging at 5 months.
[0084] Patient CS97 demonstrated a partial radiographic response at 10.6 months, however, achieved a 100% reduction in residual MSI and TMB levels at 2.8 months. CS97 then went on to a complete radiographic response at 20.2 months (Table 7). A different patient, CS98, appeared to develop new liver lesions at 20 weeks suggestive of progressive disease (FIG. 11). However, following an initial spike, protein biomarkers and residual MSI and TMB levels demonstrated a biochemical tumor response at 1.3 and 4.8 months. A liver biopsy demonstrated only inflammatory changes in the location where new lesions were noted, suggesting checkpoint therapy induced inflammation. Radiographic imaging finally demonstrated resolution of any hepatic lesions and a 100% reduction in tumor volume at 16.8 months. A similar pattern was observed for patient CS00 where significant reduction in protein biomarker and residual MSI and TMB levels occurred at 1.5 and 0.6 months, respectively, however, radiographic imaging did not demonstrate a 100% reduction in tumor volume until 17 months. These data suggest that the residual MSI allele burden and TMB prognostic signature are indicative of overall tumor response to immune checkpoint blockade.
Discussion
[0085] The checkpoint inhibitor pembrolizumab is now indicated for the treatment of adult and pediatric patients with unresectable or metastatic solid tumors identified as having MSI or MMR deficiency(1,2). This represents the first pan-cancer biomarker indication, and now covers patients with solid tumors that have progressed following prior treatment and have no satisfactory alternative treatment options, as well as patients with colorectal cancer that have progressed following treatment with certain chemotherapy drugs. However, it is often not possible to readily obtain biopsy or resection tissue for genetic testing due to insufficient material, exhaustion of the limited material available after prior therapeutic stratification, logistical considerations for tumor and normal sample acquisition after initial diagnosis, or safety concerns related to additional tissue biopsy interventions(26).
[0086] We have described the development of a method for simultaneous detection of MSI and TMB-High directly from cfDNA and demonstrated proof of concept for the clinical utility afforded through these analyses for the prediction of response to immune checkpoint blockade. Additionally, given the concordance with circulating protein biomarker data while these patients were on treatment, these data suggest that the residual MSI allele burden and TMB prognostic signature could be applied to other tumor types where standardized protein biomarkers do not exist and may be an earlier predictor of response than radiographic imaging.
[0087] These methods described herein provide feasibility for a viable diagnostic approach for screening and monitoring of patients who exhibit MSI or TMB-High and may respond to immune checkpoint blockade.
TABLE-US-00001 TABLE 1 125 Gene List for FFPE Tissue Analyses Gene Sequence Mutations Translocations Amplifications (n = 125) (n = 117) (n = 29) (n = 41) ABL1 Yes -- -- AKT1 Yes -- Yes ALK Yes Yes Yes AR Yes -- Yes ATM Yes -- -- ATRX Yes -- -- AXL Yes Yes Yes BCL2 Yes Yes Yes BCR -- Yes -- BRAF Yes Yes Yes BRCA1 Yes Yes -- BRCA2 Yes Yes -- CBFB -- Yes -- CCND1 Yes -- Yes CCND2 Yes -- Yes CCND3 Yes -- Yes CDK4 Yes -- Yes CDK6 Yes -- Yes CDKN2A Yes -- -- CHEK2 Yes -- -- CREBBP Yes -- -- CSF1R Yes -- Yes CTNNB1 Yes -- -- DDR2 Yes -- -- DNMT3A Yes -- -- EGFR Yes Yes Yes EP300 Yes -- -- EPHA2 Yes -- -- ERBB2 Yes -- Yes ERBB3 Yes -- Yes ERBB4 Yes -- -- ERCC3 Yes -- -- ERG Yes Yes -- ESR1 Yes -- -- ETV1 -- Yes -- ETV4 -- Yes -- ETV5 -- Yes -- ETV6 -- Yes -- EWSR1 -- Yes -- EZH2 Yes -- -- FANCA Yes -- -- FANCD2 Yes -- -- FANCG Yes -- -- FBXW7 Yes -- -- FGFR1 Yes Yes Yes FGFR2 Yes Yes Yes FGFR3 Yes Yes Yes FGFR4 Yes -- Yes FLT1 Yes -- Yes FLT3 Yes -- Yes FLT4 Yes -- Yes FOXL2 Yes -- -- GNA11 Yes -- -- GNAQ Yes -- -- GNAS Yes -- -- HDAC2 Yes -- -- HNF1A Yes -- -- HRAS Yes -- -- IDH1 Yes -- -- IDH2 Yes -- -- JAK1 Yes -- -- JAK2 Yes -- Yes JAK3 Yes -- -- KDR Yes -- Yes KEAP1 Yes -- -- KIT Yes -- Yes KMT2A Yes -- -- KRAS Yes -- Yes MAP2K1 Yes -- -- MAP2K2 Yes -- -- MEN1 Yes -- -- MET Yes -- Yes MLH1 Yes -- -- MLH3 Yes -- -- MPL Yes -- -- MRE11A Yes -- -- MSH2 Yes -- -- MSH6 Yes -- -- MST1R Yes -- Yes MTOR Yes -- -- MYC Yes Yes Yes MYCN Yes -- Yes MYD88 Yes -- -- NBN Yes -- -- NF1 Yes -- -- NOTCH1 Yes -- -- NPM1 Yes -- -- NRAS Yes -- -- NTRK1 Yes Yes Yes NTRK2 Yes Yes Yes NTRK3 Yes Yes Yes PALB2 Yes -- -- PDGFRA Yes Yes Yes PDGFRB Yes Yes Yes PIK3CA Yes -- Yes PIK3CB Yes -- Yes PIK3R1 Yes -- -- PMS2 Yes -- -- POLD1 Yes -- -- POLE Yes -- -- PTCH1 Yes -- -- PTEN Yes -- -- PTPN11 Yes -- -- RAD51 Yes -- -- RAF1 Yes Yes -- RARA Yes Yes -- RB1 Yes -- -- RET Yes Yes Yes RNF43 Yes -- -- ROS1 Yes Yes Yes RUNX1 Yes -- Yes SDHB Yes -- -- SMAD4 Yes -- -- SMARCB1 Yes -- -- SMO Yes -- -- SRC Yes -- -- STK11 Yes -- -- TERT Yes -- -- TET2 Yes -- -- TMPRSS2 -- Yes -- TP53 Yes -- -- TSC1 Yes -- -- TSC2 Yes -- -- VEGFA Yes -- Yes VHL Yes -- --
TABLE-US-00002 TABLE 2 Summary of Next Generation Sequencing Statistics for FFPE Tumor and Matched Normal Samples Orthog- DPF onal Matched Promega and DPF Bases Mapped Average Average MSI Tumor Tumor Bases to Targeted Total Distinct Analysis Normal Only Case Sample Tumor Bases Mapped to Regions of Coverage Coverage System Analysis Analysis ID Type Tumor Type Purity Sequenced Genome Interest (Fold) (Fold) Result Result Result T1 Tumor Colorectal Cancer 40% 3,166,928,200 2,938,394,500 1,273,077,559 1,158 927 MSI-H MSI-H MSI-H T2 Tumor Colorectal Cancer 40% 2,956,194,800 2,731,020,900 1,118,791,878 1,102 769 MSI-H MSI-H MSI-H T2 Tumor Colorectal Cancer 80% 4,620,105,200 4,266,153,700 1,719,208,838 1,705 1,151 MSI-H MSI-H MSI-H T4 Tumor Colorectal Cancer 60% 3,830,551,400 3,577,875,700 1,587,036,697 1,584 1,047 MSI-H MSI-H MSI-H T5 Tumor Colorectal Cancer 60% 3,694,440,800 3,417,070,000 1,421,110,311 1,423 1,021 MSI-H MSI-H MSI-H T6 Tumor Colorectal Cancer 70% 2,781,902,600 2,581,541,800 1,314,484,935 1,308 509 MSI-H MSI-H MSI-H T7 Tumor Colorectal Cancer 50% 2,946,039,800 2,766,061,900 1,287,341,543 1,287 870 MSI-H MSI-H MSI-H T8 Tumor Colorectal Cancer 40% 3,418,941,400 3,141,032,200 1,134,791,347 1,128 699 MSI-H MSI-H MSI-H T9 Tumor Colorectal Cancer 60% 2,554,068,000 2,397,514,900 1,059,806,697 1,065 789 MSI-H MSI-H MSI-H T10 Tumor Colorectal Cancer 70% 2,490,357,800 2,325,119,000 1,041,133,466 1,045 577 MSI-H MSI-H MSI-H T11 Tumor Colorectal Cancer 70% 2,802,989,100 2,574,326,700 1,021,889,116 1,028 611 MSI-H MSI-H MSI-H T12 Tumor Colorectal Cancer 60% 2,732,188,800 2,532,625,600 1,102,256,555 1,106 809 MSS MSS MSS T13 Tumor Colorectal Cancer 60% 3,374,700,400 3,160,846,000 1,444,383,958 1,452 856 MSS MSS MSS T14 Tumor Colorectal Cancer 30% 4,449,316,000 4,158,857,900 1,912,478,277 1,908 1,254 MSS MSS MSS T15 Tumor Colorectal Cancer 40% 3,221,878,600 2,990,670,400 1,289,368,393 1,297 984 MSS MSS MSS T16 Tumor Colorectal Cancer 30% 2,706,508,600 2,523,131,100 1,106,624,877 1,112 859 MSS MSS MSS T17 Tumor Colorectal Cancer 25% 3,251,114,200 2,856,483,800 961,918,119 966 736 MSS MSS MSS T18 Tumor Colorectal Cancer 30% 3,231,913,800 3,009,768,900 1,360,021,648 1,348 991 MSS MSS MSS T19 Tumor Colorectal Cancer 25% 3,363,038,600 3,113,118,000 1,384,620,931 1,376 997 MSS MSS MSS T20 Tumor Colorectal Cancer 15% 2,438,680,600 2,276,538,900 1,062,441,883 1,068 664 MSS MSS MSS T21 Tumor Colorectal Cancer 50% 3,835,047,200 3,616,937,100 1,599,268,481 1,585 1,070 MSS MSS MSS T22 Tumor Colorectal Cancer 50% 3,571,104,800 3,364,850,000 1,560,304,548 1,549 1,027 MSS MSS MSS T23 Tumor Colorectal Cancer 50% 3,358,858,000 3,148,152,000 1,543,361,455 1,531 381 MSS MSS MSS T24 Tumor Colorectal Cancer 30% 3,800,714,600 3,454,271,300 1,451,100,665 1,437 1,021 MSS MSS MSS T25 Tumor Colorectal Cancer 70% 2,786,623,600 2,616,808,300 1,300,533,976 1,308 839 MSS MSS MSS T26 Tumor Colorectal Cancer 70% 2,745,441,000 2,560,749,200 1,144,854,802 1,150 831 MSS MSS MSS T27 Tumor Colorectal Cancer 50% 2,718,178,000 2,492,681,200 1,007,856,362 1,009 772 MSS MSS MSS T28 Tumor Colorectal Cancer 50% 3,811,856,800 3,469,104,100 1,178,261,647 1,164 881 MSS MSS MSS T29 Tumor Colorectal Cancer 60% 2,836,284,200 2,619,980,200 1,070,525,027 1,076 803 MSS MSS MSS T30 Tumor Colorectal Cancer 60% 3,054,498,800 2,864,552,700 1,219,192,787 1,225 918 MSS MSS MSS T31 Tumor Colorectal Cancer 80% 2,580,688,000 2,400,044,300 974,909,901 980 778 MSS MSS MSS T32 Tumor Colorectal Cancer 15% 2,794,799,600 2,572,462,100 1,100,684,869 1,106 852 MSS MSS MSS T33 Tumor Colorectal Cancer 25% 4,145,168,800 3,782,601,800 1,600,830,943 1,581 1,023 MSS MSS MSS T34 Tumor Colorectal Cancer 30% 2,805,656,200 2,574,761,000 1,165,019,629 1,164 830 MSS MSS MSS T35 Tumor Colorectal Cancer 25% 3,314,533,600 3,084,210,800 1,337,527,973 1,324 978 MSS MSS MSS T36 Tumor Colorectal Cancer 40% 3,083,111,800 2,855,861,400 1,234,493,152 1,237 871 MSS MSS MSS T37 Tumor Colorectal Cancer 50% 2,944,656,600 2,738,021,600 1,185,096,762 1,184 871 MSI-H MSI-H MSI-H T38 Tumor Colorectal Cancer 50% 2,753,927,200 2,556,267,100 l,111,967,617 1,107 826 MSI-H MSI-H MSI-H T39 Tumor Colorectal Cancer 50% 2,909,479,000 2,736,312,200 1,240,864,480 1,245 880 MSI-H MSI-H MSI-H T40 Tumor Colorectal Cancer 50% 2,861,106,600 2,664,312,500 1,238,921,489 1,135 816 MSI-H MSI-H MSI-H T41 Tumor Colorectal Cancer 50% 3,067,986,400 2,803,426,000 1,187,719,134 1,191 807 MSI-H MSI-H MSI-H T42 Tumor Colorectal Cancer 50% 2,575,126,400 2,352,723,700 985,780,477 986 729 MSI-H MSI-H MSI-H T43 Tumor Colorectal Cancer 50% 3,553,245,200 3,291,761,000 1,519,022,764 1,520 569 MSI-H MSI-H MSI-H T44 Tumor Colorectal Cancer 50% 3,879,433,600 3,543,367,700 1,412,136,767 1,401 951 MSI-H MSI-H MSI-H T45 Tumor Colorectal Cancer 50% 2,906,836,200 2,640,548,900 1,084,265,479 1,083 708 MSI-H MSI-H MSI-H T46 Tumor Colorectal Cancer 50% 3,691,316,800 3,373,293,300 1,490,830,422 1,477 633 MSI-H MSI-H MSI-H T47 Tumor Colorectal Cancer 50% 3,682,074,800 3,431,016,500 1,578,799,330 1,565 1,099 MSI-H MSI-H MSI-H T48 Tumor Colorectal Cancer 50% 3,219,857,800 2,968,614,400 1,345,719,299 1,346 953 MSI-H MSI-H MSI-H T49 Tumor Colorectal Cancer 50% 3,682,200,200 3,314,391,200 1,446,490,248 1,448 827 MSI-H MSI-H MSI-H T50 Tumor Colorectal Cancer 50% 2,698,383,600 2,488,106,900 1,176,178,010 1,178 824 MSI-H MSI-H MSI-H T51 Tumor Colorectal Cancer 50% 3319,692,800 2,956,351,200 1,252,235,401 1,242 798 MSI-H MSI-H MSI-H T52 Tumor Colorectal Cancer 50% 3360,317,400 3,095,067,800 1,411,042,834 1,410 1,024 MSI-H MSI-H MSI-H T53 Tumor Colorectal Cancer 25% 2,961,110,600 2,731,451,400 1,142,603,080 1,149 597 MSI-H MSI-H MSI-H T54 Tumor Colorectal Cancer 25% 2,777,509,400 2,589,331,600 1,149,189,533 1,155 769 MSI-H MSI-H MSI-H T53 Tumor Colorectal Cancer 25% 2,639,198,800 2,442,326,100 911,827,087 916 617 MSS MSS MSS T56 Tumor Colorectal Cancer 20% 2,755,033,400 2,531,769,000 1,000,935,424 1,007 681 MSI-H MSI-H MSI-H T57 Tumor Colorectal Cancer 20% 2,447,814,600 2,287,722,900 1,015,055,726 1,020 696 MSS MSS MSS T58 Tumor Colorectal Cancer 20% 3,286,578,200 3,057,086,600 1,307,312,335 1,314 961 MSS MSS MSS T59 Tumor Colorectal Cancer 25% 2,903,957,600 2,684,504,100 1,230,635,449 1,238 569 MSS MSS MSS T60 Tumor Colorectal Cancer 30% 3,057,011,000 2,834,612,800 1,299,500,617 1,298 678 MSS MSS MSS T61 Tumor Colorectal Cancer 30% 3,524,443,800 3,332,286,300 1,616,082,336 1,617 890 MSI-H MSI-H MSI-H N1 Normal NA NA 1,544,823,000 1,450,418,000 585,339,892 586 521 NA NA NA N2 Normal NA NA 1,902,151,400 1,773,538,400 686,222,130 686 604 NA NA NA N3 Normal NA NA 1,845,286,600 1,717,939,600 660,169,442 663 574 NA NA NA N4 Normal NA NA 1,747,777,400 1,604,382,200 578,803,459 581 507 NA NA NA N5 Normal NA NA 1,358,892,200 1,270,257,700 532,386,922 536 466 NA NA NA N6 Normal NA NA 1,403,909,400 1,328,105,100 603,030,506 606 525 NA NA NA N7 Normal NA NA 1,477,544,600 1,386,426,800 600,947,522 604 517 NA NA NA N8 Normal NA NA 1,922,041,400 1,784,316,400 701,537,824 704 613 NA NA NA N9 Normal NA NA 1,389,792,400 1,302,753,500 551,063,430 556 478 NA NA NA N10 Normal NA NA 1,368,669,200 1,282,523,900 527,619,827 533 468 NA NA NA N11 Normal NA NA 1,124,099,400 1,056,703,600 434,115,592 439 390 NA NA NA N12 Normal NA NA 1,297,100,600 1,221,405,100 504,944,038 510 450 NA NA NA N13 Normal NA NA 1,320,243,600 1,222,723,200 477,732,672 482 362 NA NA NA N14 Normal NA NA 2,096,304,800 1,924,550,100 629,989,948 634 563 NA NA NA N15 Normal NA NA 1,857,918,400 1,749,514,000 741,540,523 745 637 NA NA NA N16 Normal NA NA 1,296,158,400 1,225,401,300 539,144,010 545 481 NA NA NA N17 Normal NA NA 1,172,080,200 1,072,384,000 351,008,283 354 321 NA NA NA N18 Normal NA NA 2,197,386,400 2,043,193,200 792,440,480 793 683 NA NA NA N19 Normal NA NA 1,126,031,600 1,057,174,000 429,799,839 435 388 NA NA NA N20 Normal NA NA 2,203,340,000 2,079,985,600 923,434,168 927 780 NA NA NA N21 Normal NA NA 1,999,881,200 1,849,375,700 663,902,271 666 578 NA NA NA N22 Normal NA NA 1,919,525,200 1,795,389,600 721,484,943 723 621 NA NA NA N23 Normal NA NA 1,331,809,200 1,260,705,600 596,587,867 602 517 NA NA NA N24 Normal NA NA 1,903,783,600 1,792,126,800 790,507,492 792 691 NA NA NA N25 Normal NA NA 1,386,758,000 1,304,498,200 573,306,885 579 511 NA NA NA N26 Normal NA NA 1,288,502,200 1,211,465,700 518,972,645 524 465 NA NA NA N27 Normal NA NA 2,531,366,000 2,385,834,400 1,019,543,903 1,027 883 NA NA NA N28 Normal NA NA 1,992,785,000 1,873,292,800 802,670,846 804 687 NA NA NA N29 Normal NA NA 1,455,104,600 1,366,776,900 575,386,950 581 510 NA NA NA N30 Normal NA NA 1,664,936,200 1,561,641,100 646,468,058 652 572 NA NA NA N31 Normal NA NA 1,200,639,800 1,128,641,300 463,140,630 467 416 NA NA NA N32 Normal NA NA 1,167,761,400 1,092,348,500 438,958,934 442 396 NA NA NA N33 Normal NA NA 1,665,825,400 1,541,475,700 609,072,888 612 544 NA NA NA N34 Normal NA NA 1,367,489,200 1,290,133,900 556,470,787 563 499 NA NA NA N35 Normal NA NA 1,503,631,400 1,412,540,500 580,358,931 585 509 NA NA NA N36 Normal NA NA 1,549,988,400 1,458,406,100 628,637,957 634 560 NA NA NA N37 Normal NA NA 1,568,304,000 1,468,430,300 616,176,975 620 519 NA NA NA N38 Normal NA NA 1,701,739,600 1,592,992,100 659,495,963 662 556 NA NA NA N39 Normal NA NA 1,309,687,400 1,234,750,100 546,420,462 551 464 NA NA NA N40 Normal NA NA 1,712,442,800 1,608,493,700 702,640,817 705 588 NA NA NA N41 Normal NA NA 1,191,012,000 1,122,882,200 485,771,595 491 415 NA NA NA N42 Normal NA NA 2,147,527,600 2,012,745,300 865,817,634 870 721 NA NA NA N43 Normal NA NA 2,632,733,800 2,480,587,000 1,109,697,317 1,120 878 NA NA NA N44 Normal NA NA 1,425,864,600 1,323,295,400 519,416,405 524 445 NA NA NA N45 Normal NA NA 1,155,307,800 1,076,440,400 436,138,888 439 377 NA NA NA N46 Normal NA NA 1,221,955,800 1,150,302,700 518,176,709 523 444 NA NA NA N47 Normal NA NA 1,869,437,000 1,735,921,400 728,621,647 732 602 NA NA NA N48 Normal NA NA 1,587,657,000 1,487,987,900 631,794,049 637 537 NA NA NA N49 Normal NA NA 1,781,366,200 1,673,812,500 729,333,555 734 619 NA NA NA N50 Normal NA NA 1,148,277,400 1,076,124,300 342,181,739 346 294 NA NA NA N51 Normal NA NA 1,904,405,800 1,764,410,700 680,778,768 687 576 NA NA NA N52 Normal NA NA 1,640,495,200 1,534,588,100 662,986,346 669 549 NA NA NA N53 Normal NA NA 1,495,963,000 1,388,748,600 604,616,038 612 448 NA NA NA N54 Normal NA NA 1,411,743,800 1,318,632,100 570,759,302 578 432 NA NA NA N55 Normal NA NA 1,254,353,600 1,146,429,600 439,784,552 445 346 NA NA NA N56 Normal NA NA 1,358,890,600 1,256,167,000 500,055,838 506 375 NA NA NA N57 Normal NA NA 1,257,193,000 1,177,020,700 528,523,113 535 410 NA NA NA NS8 Normal NA NA 1,315,380,800 1,233,333,300 528,722,180 535 432 NA NA NA N59 Normal NA NA 1,275,383,800 1,172,703,600 504,548,697 511 383 NA NA NA N60 Normal NA NA 2,296,267,800 2,109,785,900 916,969,966 925 645 NA NA NA N61 Normal NA NA 1,433,371,200 1,350,514,800 632,414,511 639 475 NA NA NA
TABLE-US-00003 TABLE 3 Comparison of Microsatellite Status Determined through FFPE Tissue Analyses Promega MSI Analysis System FFPE Tissue Analysis MSI-H MSS 125 Gene Targeted Panel MSI 31 0 MSS 0 30
TABLE-US-00004 TABLE 4 58 Gene List for Plasma Analyses Gene (n = 58) Sequence Region Covered AKT1 Hot Exon Analysis ALK Full RefSeq/CCDS Coding Sequence AR Full RefSeq/CCDS Coding Sequence ATM Hot Exon Analysis BRAF Full RefSeq/CCDS Coding Sequence BRCA1 Hot Exon Analysis BRCA2 Hot Exon Analysis CCND1 Hot Exon Analysis CCND2 Hot Exon Analysis CCND3 Hot Exon Analysis CD274 Full RefSeq/CCDS Coding Sequence CDK4 Full RefSeq/CCDS Coding Sequence CDK6 Full RefSeq/CCDS Coding Sequence CDKN2A Hot Exon Analysis CTNNB1 Hot Exon Analysis DNMT3A Hot Exon Analysis EGFR Full RefSeq/CCDS Coding Sequence ERBB2 Full RefSeq/CCDS Coding Sequence ESR1 Hot Exon Analysis EZH2 Hot Exon Analysis FGFR1 Hot Exon Analysis FGFR2 Hot Exon Analysis FGFR3 Hot Exon Analysis FLT3 Hot Exon Analysis GNAS Hot Exon Analysis HRAS Hot Exon Analysis IDH1 Hot Exon Analysis IDH2 Hot Exon Analysis JAK2 Hot Exon Analysis KIT Full RefSeq/CCDS Coding Sequence KRAS Full RefSeq/CCDS Coding Sequence MAP2K1 Kinase Domain MET Hot Exon Analysis + Adjacent Exon 14 Introns MTOR Hot Exon Analysis MYC Hot Exon Analysis MYCN Hot Exon Analysis NPM1 Hot Exon Analysis NRAS Hot Exon Analysis NTRK1 Hot Exon Analysis NTRK2 Hot Exon Analysis NTRK3 Hot Exon Analysis PALB2 Hot Exon Analysis PIK3CA Hot Exon Analysis PIK3CB Hot Exon Analysis PIK3R1 Hot Exon Analysis POLD1 Exonuclease Domain POLE Exonuclease Domain PTCH1 Hot Exon Analysis PTEN Hot Exon Analysis RB1 Hot Exon Analysis RET Full RefSeq/CCDS Coding Sequence RNF43 Hot Exon Analysis ROS1 Kinase and Catalytic Domain TERT Hot Exon Analysis + Promoter TP53 Full RefSeq/CCDS Coding Sequence TSC1 Hot Exon Analysis TSC2 Hot Exon Analysis VHL Hot Exon Analysis
TABLE-US-00005 TABLE 5 Summary of Next Generation Sequencing Statistics for Healthy Donor Samples, Contrived Samples, and Clinical Plasma Samples Bases Clinical Mapped to Average Average Tissue Plasma Plasma Targeted Total Distinct Trial MSI TMB Case Sample Bases Bases Mapped Regions of Coverage Coverage Enrollment Analysis Analysis ID Type Sequenced to Genome Interest (Fold) (Fold) MSI Status Result Result HD1 Healthy 4,610,602,000 4,591,372,800 2,313,780,895 23,135 1,326 NA MSS TMB-Low Donor HD2 Healthy 8,891,644,000 8,866,148,100 4,437,521,303 44,386 2,567 NA MSS TMB-Low Donor HD3 Healthy 5,591,552,000 5,569,655,300 2,532,932,984 25,273 1,413 NA MSS TMB-Low Donor HD4 Healthy 5,573,545,400 5,543,102,100 2,255,758,545 22,481 1,654 NA MSS TMB-Low Donor HD5 Healthy 5,207,559,600 5,185,499,400 2,470,481,571 24,671 1,860 NA MSS TMB-Low Donor HD6 Healthy 6,388,732,200 6,377,549,900 3,432,543,524 34,319 3,762 NA MSS TMB-Low Donor HD7 Healthy 4,734,677,000 4,712,020,800 2,345,085,749 23,450 1,514 NA MSS TMB-Low Donor HD8 Healthy 5,302,549,600 5,278,776,000 2,691,437,847 26,923 1,141 NA MSS TMB-Low Donor HD9 Healthy 7,465,978,000 7,443,127,900 3,937,377,476 39,278 2,632 NA MSS TMB-Low Donor HD10 Healthy 6,074,039,400 6,052,256,300 3,176,126,200 31,723 1,707 NA MSS TMB-Low Donor HD11 Healthy 6,213,183,600 6,193,263,500 3,215,135,348 31,924 1,629 NA MSS TMB-Low Donor HD12 Healthy 7,312,985,200 7,287,955,400 3,361,626,922 33,392 2,219 NA MSS TMB-Low Donor HD13 Healthy 6,510,483,400 6,494,893,800 2,976,435,079 29,539 4,803 NA MSS TMB-Low Donor HD14 Healthy 8,627,645,800 8,610,309,100 4,370,055,158 43,159 4,240 NA MSS TMB-Low Donor HD15 Healthy 8,091,438,800 8,070,832,700 4,064,773,281 40,137 2,755 NA MSS TMB-Low Donor HD16 Healthy 8,479,048,000 8,460,878,600 4,274,823,876 42,218 2,387 NA MSS TMB-Low Donor HD17 Healthy 9,956,617,400 9,928,487,500 4,056,620,966 40,013 6,204 NA MSS TMB-Low Donor HD18 Healthy 8,764,661,800 8,741,658,300 4,365,489,881 43,257 1,659 NA MSS TMB-Low Donor HD19 Healthy 7,889,783,000 7,869,480,500 3,564,990,160 35,371 3,264 NA MSS TMB-Low Donor HD20 Healthy 7,633,405,000 7,615,920,000 3,881,573,734 38,491 1,890 NA MSS TMB-Low Donor HD21 Healthy 7,861,255,200 7,840,463,800 3,898,962,179 38,636 1,558 NA MSS TMB-Low Donor HD22 Healthy 4,781,596,200 4,700,767,800 2,047,246,059 20,023 914 NA MSS TMB-Low Donor HD23 Healthy 6,681,047,200 6,637,094,200 3,496,324,530 34,651 1,777 NA MSS TMB-Low Donor HD24 Healthy 7,177,461,600 7,153,542,900 3,634,434,110 36,048 1,926 NA MSS TMB-Low Donor HD25 Healthy 7,434,671,400 7,407,050,700 3,898,804,784 38,653 2,302 NA MSS TMB-Low Donor HD26 Healthy 7,429,101,000 7,401,652,100 3,673,202,567 36,392 2,038 NA MSS TMB-Low Donor HD27 Healthy 8,503,220,200 8,481,220,900 4,481,836,913 44,189 4,007 NA MSS TMB-Low Donor HD28 Healthy 7,913,436,400 7,891,591,400 3,999,331,489 39,604 6,476 NA MSS TMB-Low Donor HD29 Healthy 4,614,537,000 4,554,941,500 2,105,579,210 20,597 697 NA MSS TMB-Low Donor HD30 Healthy 7,492,256,600 7,465,117,200 3,476,188,532 34,328 2,857 NA MSS TMB-Low Donor HD31 Healthy 8,328,282,600 8,286,892,200 4,210,419,884 41,650 3,095 NA MSS TMB-Low Donor HD32 Healthy 7,016,633,400 6,995,998,500 3,531,038,365 34,933 1,236 NA MSS TMB-Low Donor HD33 Healthy 8,194,639,600 8,172,001,600 4,176,117,225 41,166 2,952 NA MSS TMB-Low Donor HD34 Healthy 6,007,170,600 5,988,709,000 2,841,711,258 28,277 3,526 NA MSS TMB-Low Donor HD35 Healthy 7,712,474,800 7,687,926,200 3,538,858,830 34,870 3,962 NA MSS TMB-Low Donor HD36 Healthy 6,447,382,600 6,427,425,700 3,393,662,901 33,415 2,859 NA MSS TMB-Low Donor HD37 Healthy 8,134,672,200 8,105,317,200 4,054,212,131 39,967 1,544 NA MSS TMB-Low Donor HD38 Healthy 5,535,483,200 5,524,427,300 2,816,615,357 28,054 1,983 NA MSS TMB-Low Donor HD39 Healthy 7,564,324,200 7,546,630,900 3,764,230,400 37,490 4,300 NA MSS TMB-Low Donor HD40 Healthy 8,036,286,000 8,014,954,300 4,048,484,998 40,197 3,096 NA MSS TMB-Low Donor HD41 Healthy 7,640,735,400 7,622,537,500 3,929,173,586 39,049 1,971 NA MSS TMB-Low Donor HD42 Healthy 6,677,376,600 6,656,214,200 2,797,826,119 27,836 1,938 NA MSS TMB-Low Donor HD43 Healthy 8,409,420,800 8,391,690,200 4,451,721,807 43,978 3,316 NA MSS TMB-Low Donor HD44 Healthy 8,467,700,000 8,440,226,300 3,675,196,602 36,497 5,083 NA MSS TMB-Low Donor HD45 Healthy 7,197,353,200 7,170,267,700 3,698,926,248 36,497 1,831 NA MSS TMB-Low Donor HD46 Healthy 8,318,236,800 8,281,776,900 4,148,545,120 40,815 1,773 NA MSS TMB-Low Donor HD47 Healthy 9,006,412,400 8,978,934,000 4,760,007,319 46,907 2,891 NA MSS TMB-Low Donor HD48 Healthy 7,344,659,400 7,321,998,700 3,843,864,822 37,828 1,883 NA MSS TMB-Low Donor HD49 Healthy 8,288,914,400 8,270,435,900 4,445,831,613 43,940 3,272 NA MSS TMB-Low Donor HD50 Healthy 8,639,110,000 8,615,224,600 4,502,933,702 44,423 2,244 NA MSS TMB-Low Donor HD51 Healthy 7,575,511,200 7,555,273,900 3,939,210,286 39,053 3,320 NA MSS TMB-Low Donor HD52 Healthy 8,427,667,800 8,400,593,500 4,420,970,865 43,296 3,497 NA MSS TMB-Low Donor HD53 Healthy 8,542,647,000 8,516,087,000 4,385,330,122 42,944 3,771 NA MSS TMB-Low Donor HD54 Healthy 8,453,014,000 8,428,500,700 4,387,819,781 43,296 2,325 NA MSS TMB-Low Donor HD55 Healthy 9,298,955,400 9,271,088,500 4,819,496,438 47,546 2,341 NA MSS TMB-Low Donor HD56 Healthy 8,478,268,200 8,444,312,700 4,094,638,378 40,360 2,050 NA MSS TMB-Low Donor HD57 Healthy 8,199,783,400 8,170,058,600 3,957,778,287 39,001 2,457 NA MSS TMB-Low Donor HD58 Healthy 9,346,566,000 9,314,731,900 4,924,333,229 48,509 1,727 NA MSS TMB-Low Donor HD59 Healthy 8,919,385,800 8,892,662,500 4,390,523,968 43,293 3,513 NA MSS TMB-Low Donor HD60 Healthy 8,389,446,000 8,370,187,100 4,369,738,805 43,148 1,477 NA MSS TMB-Low Donor HD61 Healthy 9,905,663,600 9,881,313,200 4,974,727,427 49,048 6,168 NA MSS TMB-Low Donor HD62 Healthy 9,174,224,000 9,148,992,500 4,535,168,624 44,655 2,138 NA MSS TMB-Low Donor HD63 Healthy 8,084,463,600 8,057,658,800 3,968,831,440 38,915 1,992 NA MSS TMB-Low Donor HD64 Healthy 8,983,082,400 8,950,678,700 3,826,555,016 37,464 3,223 NA MSS TMB-Low Donor HD65 Healthy 7,442,509,800 7,422,697,300 3,854,553,775 38,261 2,341 NA MSS TMB-Low Donor HD66 Healthy 8,337,674,200 8,316,432,900 4,007,211,501 39,529 2,369 NA MSS TMB-Low Donor HD67 Healthy 7,154,104,000 7,129,207,200 3,440,461,741 34,040 2,871 NA MSS TMB-Low Donor HD68 Healthy 8,659,740,200 8,618,184,400 4,184,609,095 41,321 3,957 NA MSS TMB-Low Donor HD69 Healthy 7,771,232,400 7,753,568,600 3,681,096,130 36,485 3,124 NA MSS TMB-Low Donor HD70 Healthy 4,405,077,200 4,384,751,000 1,552,688,622 15,295 2,094 NA MSS TMB-Low Donor HD71 Healthy 5,920,713,000 5,898,405,200 2,633,560,458 26,073 1,061 NA MSS TMB-Low Donor HD72 Healthy 7,579,429,200 7,554,654,800 2,748,860,562 27,222 2,043 NA MSS TMB-Low Donor HD73 Healthy 8,631,626,800 8,607,231,300 3,343,564,755 33,121 3,291 NA MSS TMB-Low Donor HD74 Healthy 6,949,033,000 6,931,273,900 3,127,174,082 30,958 3,031 NA MSS TMB-Low Donor HD75 Healthy 5,875,099,600 5,864,389,100 2,962,088,150 29,390 4,277 NA MSS TMB-Low Donor HD76 Healthy 6,626,185,400 6,609,772,800 3,084,072,011 30,517 2,136 NA MSS TMB-Low Donor HD77 Healthy 11,291,302,400 11,238,394,500 5,110,554,826 49,923 3,453 NA MSS TMB-Low Donor HD78 Healthy 5,515,433,800 5,483,434,100 1,965,775,908 19,120 834 NA MSS TMB-Low Donor HD79 Healthy 6,954,396,400 6,931,242,800 3,311,490,206 32,327 3,145 NA MSS TMB-Low Donor HD80 Healthy 6,152,936,200 6,131,263,700 2,720,849,245 26,546 2,270 NA
MSS TMB-Low Donor HD81 Healthy 8,733,434,600 8,702,900,400 4,271,410,537 41,795 3,890 NA MSS TMB-Low Donor HD82 Healthy 6,720,050,800 6,692,163,400 2,871,213,549 28,127 2,200 NA MSS TMB-Low Donor HD83 Healthy 7,729,687,400 7,705,631,600 3,769,457,577 37,031 3,098 NA MSS TMB-Low Donor HD84 Healthy 8,665,550,000 8,633,041,400 4,135,285,473 40,550 2,542 NA MSS TMB-Low Donor HD85 Healthy 7,972,481,400 7,950,462,100 3,776,002,282 37,290 3,000 NA MSS TMB-Low Donor HD86 Healthy 8,250,349,800 8,215,560,400 4,149,026,011 40,906 2,274 NA MSS TMB-Low Donor HD87 Healthy 7,218,789,600 7,194,779,100 3,266,906,096 32,493 3,137 NA MSS TMB-Low Donor HD88 Healthy 6,682,720,200 6,654,240,600 3,392,475,194 33,738 2,498 NA MSS TMB-Low Donor HD89 Healthy 6,871,691,000 6,856,541,800 3,521,282,340 34,894 2,744 NA MSS TMB-Low Donor HD90 Healthy 8,772,448,000 8,749,280,600 4,178,273,953 41,258 1,494 NA MSS TMB-Low Donor HD91 Healthy 7,480,832,800 7,457,217,500 3,595,805,873 35,471 2,266 NA MSS TMB-Low Donor HD92 Healthy 5,975,083,600 5,958,618,100 2,873,989,002 28,615 1,701 NA MSS TMB-Low Donor HD93 Healthy 5,375,821,400 5,360,555,500 2,567,619,902 25,583 2,090 NA MSS TMB-Low Donor HD94 Healthy 6,280,445,200 6,260,287,600 3,139,767,399 31,191 2,533 NA MSS TMB-Low Donor HD95 Healthy 8,135,958,600 8,115,624,700 4,130,225,448 40,731 2,317 NA MSS TMB-Low Donor HD96 Healthy 7,017,152,200 7,000,775,900 3,355,455,453 33,091 2,169 NA MSS TMB-Low Donor HD97 Healthy 7,423,045,000 7,401,835,700 3,612,561,174 35,619 1,489 NA MSS TMB-Low Donor HD98 Healthy 7,575,649,400 7,542,405,300 3,306,732,212 32,637 1,985 NA MSS TMB-Low Donor HD99 Healthy 8,101,683,000 8,073,383,300 3,916,838,207 38,584 2,250 NA MSS TMB-Low Donor HD100 Healthy 8,227,634,200 8,195,376,800 3,707,557,242 36,571 1,908 NA MSS TMB-Low Donor HD101 Healthy 7,409,985,800 7,378,039,500 2,943,037,267 29,002 1,815 NA MSS TMB-Low Donor HD102 Healthy 7,813,906,600 7,786,978,900 3,615,038,253 35,836 3,086 NA MSS TMB-Low Donor HD103 Healthy 7,127,926,200 7,092,785,200 2,681,989,940 26,428 1,720 NA MSS TMB-Low Donor HD104 Healthy 7,010,324,000 6,980,650,200 2,688,769,169 26,520 1,612 NA MSS TMB-Low Donor HD105 Healthy 7,822,779,200 7,785,449,900 3,212,888,783 31,319 1,715 NA MSS TMB-Low Donor HD106 Healthy 7,364,897,200 7,339,416,100 3,586,900,299 35,320 2,452 NA MSS TMB-Low Donor HD107 Healthy 8,493,402,800 8,458,319,500 3,260,053,476 32,076 3,556 NA MSS TMB-Low Donor HD108 Healthy 9,834,233,000 9,805,201,200 4,706,975,042 46,015 2,353 NA MSS TMB-Low Donor HD109 Healthy 6,747,679,000 6,733,999,600 3,110,916,970 30,972 1,938 NA MSS TMB-Low Donor HD110 Healthy 7,069,059,200 7,054,426,600 3,473,558,000 34,223 2,862 NA MSS TMB-Low Donor HD111 Healthy 10,374,032,800 10,334,762,500 5,226,977,407 51,127 3,737 NA MSS TMB-Low Donor HD112 Healthy 9,373,668,400 9,330,427,800 3,826,086,189 37,392 2,960 NA MSS TMB-Low Donor HD113 Healthy 6,510,073,600 6,495,529,700 3,083,434,125 30,646 2,714 NA MSS TMB-Low Donor HD114 Healthy 5,788,275,000 5,775,686,700 2,790,114,913 27,752 1,891 NA MSS TMB-Low Donor HD115 Healthy 5,628,781,800 5,608,788,400 2,324,130,331 23,040 1,336 NA MSS TMB-Low Donor HD116 Healthy 6,622,736,800 6,595,711,900 2,853,684,669 28,019 1,732 NA MSS TMB-Low Donor HD117 Healthy 8,235,416,200 8,206,562,800 4,066,198,888 40,037 2,147 NA MSS TMB-Low Donor HD118 Healthy 8,142,539,800 8,113,673,000 3,498,426,122 34,518 2,319 NA MSS TMB-Low Donor HD119 Healthy 6,567,610,600 6,552,480,100 3,520,404,897 35,102 1,423 NA MSS TMB-Low Donor HD120 Healthy 8,172,503,000 8,146,438,000 3,738,973,301 36,834 2,391 NA MSS TMB-Low Donor HD121 Healthy 7,086,855,800 7,066,717,300 3,531,225,022 35,183 2,010 NA MSS TMB-Low Donor HD122 Healthy 6,632,081,800 6,613,761,500 2,824,890,605 28,087 4,498 NA MSS TMB-Low Donor HD123 Healthy 8,716,718,200 8,692,336,500 4,249,954,641 42,108 2,897 NA MSS TMB-Low Donor HD124 Healthy 5,846,065,600 5,827,023,000 2,398,968,620 23,846 1,985 NA MSS TMB-Low Donor HD125 Healthy 5,987,677,000 5,975,740,400 3,037,726,557 30,200 1,896 NA MSS TMB-Low Donor HD126 Healthy 6,450,910,600 6,433,946,800 2,901,586,776 28,839 1,732 NA MSS TMB-Low Donor HD127 Healthy 6,521,277,600 6,505,071,200 3,237,555,270 32,254 1,946 NA MSS TMB-Low Donor HD128 Healthy 5,183,805,800 5,174,096,900 2,624,001,866 26,114 1,626 NA MSS TMB-Low Donor HD129 Healthy 6,060,923,800 6,032,344,900 3,294,503,839 33,028 2,041 NA MSS TMB-Low Donor HD130 Healthy 6,931,215,400 6,664,206,100 2,861,090,396 27,128 2,616 NA MSS TMB-Low Donor HD131 Healthy 6,881,530,800 6,868,642,100 3,207,081,669 31,800 5,415 NA MSS TMB-Low Donor HD132 Healthy 8,447,741,200 8,422,297,100 4,171,378,734 41,085 2,511 NA MSS TMB-Low Donor HD133 Healthy 6,647,519,000 6,618,288,100 3,015,315,572 29,699 974 NA MSI TMB-Low Donor HD134 Healthy 9,017,435,200 8,992,906,300 4,677,984,882 46,146 3,595 NA MSS TMB-Low Donor HD135 Healthy 6,184,647,200 6,158,774,700 2,847,813,354 28,060 1,659 NA MSS TMB-Low Donor HD136 Healthy 7,819,615,400 7,794,596,100 3,895,863,689 38,457 2,214 NA MSS TMB-Low Donor HD137 Healthy 9,297,185,200 9,266,997,400 4,986,929,926 49,160 3,316 NA MSS TMB-Low Donor HD138 Healthy 6,088,725,600 6,071,004,400 2,871,318,994 28,468 1,376 NA MSS TMB-Low Donor HD139 Healthy 7,078,148,600 7,064,739,600 3,681,471,294 36,397 3,204 NA MSS TMB-Low Donor HD140 Healthy 7,991,284,600 7,973,783,500 3,998,658,283 39,667 3,312 NA MSS TMB-Low Donor HD141 Healthy 8,078,032,000 8,054,876,800 4,060,189,135 40,087 1,762 NA MSS TMB-Low Donor HD142 Healthy 7,768,653,400 7,744,059,500 3,415,300,515 33,884 1,990 NA MSS TMB-Low Donor HD143 Healthy 6,099,199,600 6,080,885,000 2,775,841,946 27,543 3,106 NA MSS TMB-Low Donor HD144 Healthy 7,710,555,200 7,694,753,100 3,714,118,122 36,768 3,794 NA MSS TMB-Low Donor HD145 Healthy 7,799,141,400 7,769,239,200 3,941,900,921 38,944 2,524 NA MSS TMB-Low Donor HD146 Healthy 6,726,282,600 6,712,047,100 3,413,345,451 33,896 2,071 NA MSS TMB-Low Donor HD147 Healthy 7,976,941,800 7,958,488,700 3,953,916,025 39,148 3,075 NA MSS TMB-Low Donor HD148 Healthy 6,773,777,600 6,756,376,400 3,398,770,425 33,685 1,878 NA MSS TMB-Low Donor HD149 Healthy 7,241,584,800 7,214,148,600 3,197,797,413 31,671 1,957 NA MSS TMB-Low Donor HD150 Healthy 8,772,019,000 8,744,087,400 4,198,896,205 41,505 2,404 NA MSS TMB-Low Donor HD151 Healthy 9,597,923,600 9,554,309,500 4,304,212,463 42,013 1,918 NA MSS TMB-Low Donor HD152 Healthy 9,766,675,200 9,730,121,800 4,232,551,267 41,381 2,131 NA MSS TMB-Low Donor HD153 Healthy 7,964,424,400 7,902,830,700 3,958,568,012 38,872 2,430 NA MSS TMB-Low Donor HD154 Healthy 8,703,468,000 8,679,744,500 4,526,278,703 44,722 5,251 NA MSS TMB-Low Donor HD155 Healthy 7,877,226,800 7,859,052,900 3,985,810,986 39,418 3,773 NA MSS TMB-Low Donor HD156 Healthy 7,747,095,200 7,729,059,800 3,978,272,416 39,396 3,948 NA MSS TMB-Low Donor HD157 Healthy 7,689,538,200 7,670,324,700 3,678,385,491 36,403 2,146 NA MSS TMB-Low Donor HD158 Healthy 6,036,060,400 6,021,050,700 2,871,615,508 28,452 1,793 NA MSS TMB-Low Donor HD159 Healthy 9,284,331,400 9,261,722,300 4,572,013,112 45,219 4,489 NA MSS TMB-Low Donor HD160 Healthy 8,039,083,200 8,017,829,900 3,668,403,298 36,433 2,958 NA MSS TMB-Low Donor HD161 Healthy 6,337,931,000 6,315,879,600 2,863,889,709 28,364 1,286 NA MSS TMB-Low Donor HD162 Healthy 10,292,765,800 10,260,537,400 5,291,273,703 51,768 3,546 NA MSS TMB-Low Donor HD163 Healthy 9,258,149,800 9,233,715,900 4,485,768,075 43,995 4,143 NA MSS TMB-Low Donor
CL1 LS180 7,612,745,000 7,589,215,100 3,392,459,288 33,523 2,083 MSI MSI N/A CL2 LS411N 7,678,713,000 7,654,819,800 3,291,800,936 32,532 2,149 MSI MSI N/A CL3 SNU- 6,256,132,400 6,240,909,800 2,807,306,207 27,761 2,420 MSI MSI N/A C2B CL4 RKO 7,066,840,000 7,048,897,500 3,177,373,078 31,421 2,085 MSI MSS N/A CL5 SNU- 7,669,517,600 7,650,812,200 3,439,833,485 34,079 3,069 MSI MSI N/A C2A CL6 LS180 8,691,502,000 8,658,803,000 3,445,624,572 33,838 2,426 MSI MSI N/A CL7 LS180 8,535,101,200 8,503,984,000 3,893,865,285 38,211 2,595 MSI MSI N/A CL8 LS180 8,083,764,400 8,056,986,800 3,780,724,828 37,152 2,455 MSI MSI N/A CL9 LS180 7,904,478,600 7,881,702,700 3,696,511,241 36,324 2,407 MSI MSI N/A CL10 LS180 7,764,828,000 7,737,044,900 3,531,063,394 34,455 2,138 MSI MSI N/A CL11 LS411N 8,245,419,000 8,222,207,200 3,748,315,492 36,967 2,471 MSI MSI N/A CL12 LS411N 6,575,842,800 6,554,550,700 3,030,898,415 29,795 2,430 MSI MSS N/A CL13 LS411N 8,271,559,000 8,245,273,600 3,762,761,032 36,919 2,295 MSI MSI N/A CL14 LS411N 7,934,153,000 7,905,178,000 3,458,080,463 33,948 2,451 MSI MSI N/A CL15 LS411N 7,108,328,800 7,085,747,100 3,057,622,227 30,157 2,159 MSI MSI N/A CL16 SNU- 8,456,505,800 8,424,591,600 3,925,699,391 38,462 2,482 MSI MSI N/A C2B CL17 SNU- 7,577,529,000 7,556,499,800 3,380,433,809 33,424 2,261 MSI MSI N/A C2B CL18 SNU- 6,993,859,200 6,976,543,600 3,225,795,617 31,918 2,171 MSI MSI N/A C2B CL19 SNU- 5,882,123,600 5,860,372,800 2,447,923,970 24,221 2,066 MSI MSI N/A C2B CL20 SNU- 7,878,616,400 7,858,594,100 3,506,238,369 34,685 2,058 MSI MSI N/A C2B CS94P1 Clinical 9,263,762,400 9,244,770,800 3,825,312,992 37,868 8,416 MSI MSI TMB-Low CS94P2 Clinical 8,813,423,000 8,792,480,600 3,978,488,566 39,021 8,506 Timepoint MSI N/A Sample CS94P3 Clinical 8,964,792,200 8,937,833,100 3,676,739,247 36,159 9,963 Timepoint MSS N/A Sample CS95P1 Clinical 7,636,898,200 7,570,902,200 2,114,468,194 20,804 2,175 MSS MSI TMB-Low CS95P2 Clinical 8,719,884,400 8,686,639,300 3,776,909,959 37,371 3,279 Timepoint MSS N/A Sample CS95P3 Clinical 7,946,606,600 7,923,725,300 3,681,799,356 36,417 3,069 Timepoint MSI N/A Sample CS96P1 Clinical 8,340,755,000 8,311,711,700 3,710,084,604 36,690 5,686 MSS MSS TMB-Low CS96P2 Clinical 6,198,454,200 6,168,225,100 2,565,799,692 24,735 5,781 Timepoint MSS N/A Sample CS96P3 Clinical 5,912,813,200 5,893,031,300 2,980,746,401 28,844 7,161 Timepoint MSS N/A Sample CS97P1 Clinical 7,017,701,200 6,998,604,600 3,287,599,575 31,839 8,100 MSI MSI TMB-High CS97P2 Clinical 7,308,707,000 7,285,576,000 3,660,108,635 35,033 8,563 Timepoint MSI N/A Sample CS97P3 Clinical 5,469,610,600 5,445,096,000 2,704,635,549 25,902 4,807 Timepoint MSS N/A Sample CS97P4 Clinical 6,624,844,800 6,602,615,600 3,295,259,498 31,752 5,692 Timepoint MSS N/A Sample CS97P5 Clinical 7,934,394,400 7,916,551,300 3,787,601,674 36,642 7,400 Timepoint MSS N/A Sample CS97P6 Clinical 5,527,711,600 5,504,889,500 2,466,586,812 23,568 3,104 Timepoint MSS N/A Sample CS98P1 Clinical 6,412,760,400 6,389,582,100 3,056,873,694 29,246 6,535 MSI MSI TMB-High CS98P2 Clinical 6,672,529,200 6,656,140,900 3,244,885,418 31,287 6,232 Timepoint MSI N/A Sample CS98P3 Clinical 7,239,611,200 7,210,354,900 3,337,128,346 31,960 4,571 Timepoint MSS N/A Sample CS98P4 Clinical 4,884,469,600 4,870,410,300 2,398,774,907 23,146 3,886 Timepoint MSS N/A Sample CS98P5 Clinical 6,684,455,800 6,629,107,600 3,043,981,443 29,758 2,048 Timepoint MSS N/A Sample CS99P1 Clinical 7,515,207,800 7,492,829,500 3,558,158,353 35,107 3,567 MSS MSS TMB-Low CS99P2 Clinical 7,295,781,200 7,266,983,100 3,137,279,510 30,900 2,698 Timepoint MSS N/A Sample CS99P3 Clinical 8,069,010,600 8,015,635,800 3,679,851,982 36,047 4,776 Timepoint MSS N/A Sample CS99P4 Clinical 7,293,700,400 7,259,226,900 3,264,415,728 32,140 2,399 Timepoint MSS N/A Sample CS00P1 Clinical 6,374,270,600 6,354,057,400 3,037,772,591 29,333 4,464 MSI MSI TMB-High CS00P2 Clinical 7,800,574,000 7,772,352,900 3,639,270,013 35,789 7,769 Timepoint MSS N/A Sample CS00P3 Clinical 8,999,308,800 8,975,347,800 4,386,806,111 43,097 7,970 Timepoint MSS N/A Sample CS00P4 Clinical 8,380,704,400 8,356,079,400 4,080,252,921 40,115 6,470 Timepoint MSS N/A Sample CS00P5 Clinical 9,582,201,400 9,546,328,100 3,353,260,614 32,916 6,017 Timepoint MSS N/A Sample CS00P6 Clinical 10,156,844,200 10,115,758,100 4,837,193,865 47,487 3,644 Timepoint MSS N/A Sample CS01P1 Clinical 8,967,808,600 8,936,498,200 2,764,042,296 27,189 7,682 MSS MSS TMB-Low CS01P2 Clinical 7,912,113,000 7,890,663,500 4,022,370,530 38,855 8,822 Timepoint MSS N/A Sample CS01P3 Clinical 6,484,354,600 6,455,565,800 3,188,722,876 30,729 7,517 Timepoint MSS N/A Sample CS02P1 Clinical 4,189,797,200 4,152,277,300 1,904,218,928 18,244 1,223 MSI MSS TMB-Low CS02P2 Clinical 10,780,428,800 10,746,068,700 5,446,642,208 52,607 4,747 Timepoint MSS N/A Sample CS03P1 Clinical 7,050,276,200 7,025,996,100 3,272,196,914 31,585 4,411 MSI MSI TMB-High CS03P2 Clinical 7,863,350,800 7,834,129,600 3,881,768,067 37,547 4,004 Timepoint MSS N/A Sample CS03P3 Clinical 5,886,551,400 5,855,839,700 2,592,954,330 25,054 1,821 Timepoint MSS N/A Sample CS03P4 Clinical 5,120,290,200 5,089,916,800 2,462,851,445 23,841 1,370 Timepoint MSS N/A Sample CS04P1 Clinical 7,761,417,200 7,737,522,100 3,680,626,639 35,734 5,451 MSS MSS TMB-Low CS04P2 Clinical 7,248,720,000 7,230,958,400 3,711,116,296 36,019 5,988 Timepoint MSS N/A Sample CS04P3 Clinical 6,981,545,200 6,963,312,600 3,392,271,571 32,934 6,670 Timepoint MSS N/A Sample CS04P4 Clinical 8,074,351,200 8,052,943,600 3,852,185,218 37,331 8,083 Timepoint MSS N/A Sample CS04P5 Clinical 5,970,210,800 5,949,218,300 2,795,371,329 27,047 8,641 Timepoint MSS N/A Sample CS05P1 Clinical 5,968,039,800 5,946,488,700 2,729,734,351 26,410 5,574 MSI MSI TMB-Low CS05P2 Clinical 6,623,933,000 6,600,539,800 3,226,910,099 31,277 6,687 Timepoint MSI N/A Sample CS05P3 Clinical 4,496,120,400 4,477,585,500 2,194,338,785 21,245 3,297 Timepoint MSI N/A Sample CS06P1 Clinical 8,211,159,400 8,186,988,800 4,156,128,019 40,389 8,002 MSI MSI TMB-High CS06P2 Clinical 6,178,650,200 6,150,639,400 2,894,449,740 27,945 6,038 Timepoint MSI N/A Sample CS06P3 Clinical 6,478,543,800 6,455,283,900 3,163,299,171 30,602 4,990 Timepoint MSS N/A Sample CS06P4 Clinical 6,548,847,200 6,526,980,300 3,098,470,879 30,056 6,184 Timepoint MSI N/A Sample CS06P5 Clinical 5,595,054,000 5,528,052,700 2,505,771,405 23,684 3,530 Timepoint MSI N/A Sample CS07P1 Clinical 10,952,067,600 10,913,583,200 2,792,942,847 27,492 8,179 MSI MSI TMB-High CS07P2 Clinical 10,529,570,200 10,492,696,000 4,154,390,112 40,862 7,298 Timepoint MSI N/A Sample CS07P3 Clinical 9,716,580,000 9,688,288,100 4,626,575,627 45,358 9,111 Timepoint MSI N/A Sample CS08P1 Clinical 6,015,494,400 5,979,103,500 2,862,781,196 27,006 7,909 MSI MSI TMB-Low CS08P2 Clinical 6,132,402,200 6,089,687,400 3,043,241,991 28,664 9,537 Timepoint MSI N/A Sample CS08P3 Clinical 6,909,139,800 6,867,393,100 3,360,042,873 31,839 7,216 Timepoint MSI N/A Sample CS09P1 Clinical 5,711,066,800 5,673,140,500 2,598,635,892 24,508 4,781 MSI MSS TMB-Low CS09P2 Clinical 6,038,788,400 6,017,962,600 2,867,990,049 27,725 6,346 Timepoint MSS N/A Sample
TABLE-US-00006 TABLE 6 Comparison of Microsatellite Status Determined through Healthy Donor, Contrived, and Clinical Plasma Analyses Healthy Donors and Expected Status Contrived Sample Analysis MSI-H MSS 58 Gene Targeted Panel MSI 18 1 MSS 2 162 Tissue MSI Status Clinical Plasma Analysis MSI-H MSS 58 Gene Targeted Panel MSI 9 0 MSS 3 4
TABLE-US-00007 TABLE 7 Summary of Clinical Information for 16 Patients Evaluated for Response to Immune Checkpoint Blockade Lynch Tissue Metastases Syndrome Time to Duration Case Enrollment Tumor Stage Detected (Medical Best Best Response Time to ORR Time to CR of Response ID MSI Status Type (On Study) At Baseline History) Reponse (Months) (Months) (Months) (Months) CS94 MSI-H Ampulla of Vater IV Y Lynch syndrome PD N/A N/A N/A N/A CS95 MSI-H Small Intestine IV Y Lynch syndronte PD N/A N/A N/A N/A CS96 MSS Colorectal IV Y No PD N/A N/A N/A N/A CS97 MSI-H Colorectal IV Y Lynch syndrome CR 20.2 6.5 20.2 34.7 CS98 MSI-H Colorectal IV Y Lynch syndrome CR 16.9 12.4 16.9 36.2 CS99 MSS Colorectal IV Y No PD N/A N/A N/A N/A CS00 MSI-H Ampulla of Vater IV Y Lynch syndrome CR 17.1 2.4 17.0 45.4 CS01 MSS Colorectal IV Y No PD N/A N/A N/A N/A CS02 MSI-H Small Intestine IV Y No PR 2.6 2.6 N/A 4.8 CS03 MSI-H Colorectal IV Y Lynch syndrome CR 15.2 2.9 15.2 39.1 CS04 MSS Colorectal IV Y No PD N/A N/A N/A N/A CS05 MSI-H Colorectal IV Y Lynch syndrome PD N/A N/A N/A N/A CS06 MSI-H Colorectal IV Y Lynch syndrome PR 2.6 2.6 N/A 13.6 CS07 MSI-H Ampulla of Vater IV Y Lynch syndrome NE N/A N/A N/A N/A CS08 MSI-H Colorectal IV Y No PD N/A N/A N/A N/A CS09 MSI-H Colorectal IV Y Unknown PD N/A N/A N/A N/A Progression Two Consecutive Timepoints Free Overall Last Protein with >80% Reduction Case Survival Survival Dose Censored Censored Biomarkers in Baseline Protein ID (Months) (Months) (Months) (Progression) (Overall) Evaluated Biomarker Levels CS94 3.0 3.6 3.0 1 1 CEA No CS95 2.8 20.7 5.6 1 1 CEA N/A-Baseline Normal Reference Range CS96 2.8 5.0 2.4 1 1 CEA No CS97 41.2 48.8 10.6 0 0 CEA Yes CS98 48.6 48.8 23.8 0 0 CEA Yes CS99 2.8 8.8 2.3 1 1 CEA No CS00 47.8 47.8 23.9 0 0 CEA; CEA: N/A-Baseline CA19-9 Normal Reference Range CA19-9: Yes CS01 1.7 4.9 1.8 1 1 CEA No CS02 5.5 43.9 23.6 1 0 CEA: CEA: N/A-Baseline CA19-9 Normal Reference Range CA19-9: N/A-Baseline Normal Reference Range CS03 42.0 42.0 23.8 0 0 CEA N/A - Baseline Normal Reference Range CS04 2.9 7.6 3.8 1 1 CEA No CS05 2.9 15.9 4.8 1 1 CEA No CS06 16.2 40.0 23.7 1 0 CEA No CS07 2.4 2.4 1.4 1 1 CEA No CS08 3.0 7.6 3.4 1 1 CEA N/A-Baseline Normal Reference Range CS09 1.4 6.9 4.5 1 1 CEA No Total Plasma Plasma Plasma Plasma Plasma Plasma Exome Plasma Plasma Time Time Time Time Time Time Mutation Mutation Case Samples Point 1 Point 2 Point 3 Point 4 Point 5 Point 6 Load Load ID Evaluated (Months) (Months) (Months) (Months) (Months) (Months) (mutations/Mbp) (mutations/Mbp Sequenced) C594 3 0.1 0.5 3.0 N/A N/A N/A 23.1 40.6 C595 3 0.0 0.5 6.5 N/A N/A N/A 64.0 10.2 C596 3 0.0 0.5 2.8 N/A N/A N/A 0.1 10.2 C597 6 0.0 0.5 2.8 10.6 12.5 22.8 70.2 111.7 C598 5 0.0 0.5 4.8 14.0 28.7 N/A 120.5 203.2 C599 4 0.0 0.5 0.9 2.8 N/A N/A N/A 10.2 CSOO 6 0.0 0.6 2.9 4.4 11.7 25.9 139.2 152.4 CS01 3 0.0 0.5 0.9 N/A N/A N/A 2.3 20.3 CSO2 2 0.0 0.6 N/A N/A N/A N/A 40.8 0.0 CSO3 4 0.0 0.6 12.8 27.3 N/A N/A 28.2 50.8 CS04 5 0.0 0.6 1.3 2.9 4.5 N/A 0.8 20.3 CS05 3 0.0 0.5 4.8 N/A N/A N/A 39.8 10.2 CS06 5 0.0 0.5 5.1 11.1 23.7 N/A 11.0 91.4 CS07 3 0.0 0.4 0.9 N/A N/A N/A 68.7 233.6 CS08 3 0.0 0.7 3.0 N/A N/A N/A N/A 40.6 CS09 2 0.0 0.7 N/A N/A N/A N/A N/A 20.3 Time Difference Baseline Between Plasma Tissue Average Tumor Two Consecutive Timepoints Baseline and Plasma ctDNA Mutation with >90% Plasma Two Consecutive Timepoints Case Collection Level at Burden Reduction inTMB MSI with 0% Residual MSI ID (Months) Baseline Status Levels on Treatment Status Alleles on Treatment CS94 10.6 1.3% TMB-Low No MSI-H No CS95 54.0 0.4% TMB-Low No MSS N/A CS96 25.3 2.3% TMB-Low No MSS N/A CS97 4.9 7.1% TMB-High Yes MSI-H Yes CS98 30.3 5.5% TMB-High Yes MSI-H Yes CS99 N/A 15.0% TMB-Low No MSS N/A CS00 13.7 2.3% TMB-High Yes MSI-H Yes CS01 76.2 0.8% TMB-Low No MSS N/A CS02 0.0 0.0% TMB-Low N/A MSS N/A CS03 18.5 0.5% TMB-High Yes MSI-H Yes CS04 48.8 2.3% TMB-Low No MSS N/A CS05 6.2 0.7% TMB-Low No MSI-H No CS06 16.3 4.6% TMB-High No MSI-H No CS07 16.3 7.9% TMB-High No MSI-H No CS08 N/A 7.2% TMB-Low No MSI-H No CS09 N/A 1.1% TMB-Low No MSS N/A
TABLE-US-00008 TABLE 8 Comparison of Tumor Mutation Burden and Microsatellite Status for Patients Evaluated for Response to Immune Checkpoint Blockade Tissue Plasma Response MSI-H MSS MSI MSS Complete Response 4 0 4 0 Partial Response 2 0 1 1 Progressive Disease 5 4 3 6 Not Evaluable 1 0 1 0 Tissue Plasma Response TMB-High TMB-Low TMB-High TMB-Low Complete Response 4 0 4 0 Partial Response 2 0 1 1 Progressive Disease 3 3 0 9 Not Evaluable 1 0 1 0 TMB-H is classified as .gtoreq.10 mutations/Mbp sequenced for tissue and .gtoreq.50.8 mutations/Mbp sequenced for plasma
REFERENCES
[0088] 1. Le D T, Durham J N, Smith K N, Wang H, Bartlett B R, Aulakh L K, et al. Mismatch repair deficiency predicts response of solid tumors to PD-1 blockade. Science 2017;357(6349):409-13 doi 10.1126/science.aan6733. [0089] 2. Le DT, Uram J N, Wang H, Bartlett B R, Kemberling H, Eyring A D, et al. PD-1 Blockade in Tumors with Mismatch-Repair Deficiency. The New England journal of medicine 2015;372(26):2509-20 doi 10.1056/NEJMoa1500596. [0090] 3. Vogelstein B, Papadopoulos N, Velculescu V E, Zhou S, Diaz L A, Jr., Kinzler K W. Cancer genome landscapes. Science 2013;339(6127):1546-58 doi 10.1126/science.1235122. [0091] 4. Schumacher T N, Schreiber R D. Neoantigens in cancer immunotherapy. Science 2015;348(6230):69-74 doi 10.1126/science.aaa4971. [0092] 5. Segal N H, Parsons D W, Peggs K S, Velculescu V, Kinzler K W, Vogelstein B, et al. Epitope landscape in breast and colorectal cancer. Cancer research 2008;68(3):889-92 doi 10.1158/0008-5472.CAN-07-3095. [0093] 6. Warthin A. Heredity with reference to carcinoma: As shown by the study of the cases examined in the pathological laboratory of the university of michigan, 1895-1913. Archives of internal medicine 1913;XII(5):546-55 doi 10.100.sup.1/archinte.1913.00070050063006. [0094] 7. Lynch H T, Shaw M W, Magnuson C W, Larsen A L, Krush A J. Hereditary factors in cancer. Study of two large midwestern kindreds. Archives of internal medicine 1966;117(2):206-12. [0095] 8. Nicolaides N C, Papadopoulos N, Liu B, Wei Y F, Carter K C, Ruben S M, et al. Mutations of two PMS homologues in hereditary nonpolyposis colon cancer. Nature 1994;371(6492):75-80 doi 10.1038/371075a0. [0096] 9. Hendriks Y M, Wagner A, Morreau H, Menko F, Stormorken A, Quehenberger F, et al. Cancer risk in hereditary nonpolyposis colorectal cancer due to MSH6 mutations: impact on counseling and surveillance. Gastroenterology 2004;127(1):17-25. [0097] 10. Papadopoulos N, Nicolaides N C, Wei Y F, Ruben S M, Carter K C, Rosen C A, et al. Mutation of a mutL homolog in hereditary colon cancer. Science 1994;263(5153):1625-9. [0098] 11. Bronner C E, Baker S M, Morrison P T, Warren G, Smith L G, Lescoe M K, et al. Mutation in the DNA mismatch repair gene homologue hMLH1 is associated with hereditary non-polyposis colon cancer. Nature 1994;368(6468):258-61 doi 10.1038/368258a0. [0099] 12. Leach F S, Nicolaides N C, Papadopoulos N, Liu B, Jen J, Parsons R, et al. Mutations of a mutS homolog in hereditary nonpolyposis colorectal cancer. Cell 1993;75(6):1215-25. [0100] 13. Fishel R, Lescoe M K, Rao M R, Copeland N G, Jenkins N A, Garber J, et al. The human mutator gene homolog MSH2 and its association with hereditary nonpolyposis colon cancer. Cell 1993;75(5):1027-38. [0101] 14. Lindblom A, Tannergard P, Werelius B, Nordenskjold M. Genetic mapping of a second locus predisposing to hereditary non-polyposis colon cancer. Nature genetics 1993;5(3):279-82 doi 10.1038/ng1193-279. [0102] 15. Peltomaki P, Aaltonen L A, Sistonen P, Pylkkanen L, Mecklin J P, Jarvinen H, et al. Genetic mapping of a locus predisposing to human colorectal cancer. Science 1993;260(5109):810-2. [0103] 16. Kempers M J, Kuiper R P, Ockeloen C W, Chappuis P O, Hutter P, Rahner N, et al. Risk of colorectal and endometrial cancers in EPCAM deletion-positive Lynch syndrome: a cohort study. The Lancet Oncology 2011;12(1):49-55 doi 10.1016/S1470-2045(10)70265-5. [0104] 17. Hause R J, Pritchard C C, Shendure J, Salipante S J. Classification and characterization of microsatellite instability across 18 cancer types. Nature medicine 2016;22(11):1342-50 doi 10.1038/nm.4191. [0105] 18. Bonneville R, Krook M A, Kautto E A, Miya J, Wing M R, Chen H-Z, et al. Landscape of Microsatellite Instability Across 39 Cancer Types. JCO Precision Oncology 2017(1):1-15 doi 10.1200/po.17.00073. [0106] 19. Murphy K M, Zhang S, Geiger T, Hafez M J, Bacher J, Berg K D, et al. Comparison of the microsatellite instability analysis system and the Bethesda panel for the determination of microsatellite instability in colorectal cancers. The Journal of molecular diagnostics: JMD 2006;8(3):305-11 doi 10.2353/jmoldx.2006.050092. [0107] 20. Niu B, Ye K, Zhang Q, Lu C, Xie M, McLellan M D, et al. MSIsensor: microsatellite instability detection using paired tumor-normal sequence data. Bioinformatics 2014;30(7):1015-6 doi 10.1093/bioinformatics/btt755. [0108] 21. Foltz S M, Liang W W, Xie M, Ding L. MIRMMR: binary classification of microsatellite instability using methylation and mutations. Bioinformatics 2017;33(23):3799-801 doi 10.1093/bioinformatics/btx507. [0109] 22. Kautto E A, Bonneville R, Miya J, Yu L, Krook M A, Reeser J W, et al. Performance evaluation for rapid detection of pan-cancer microsatellite instability with MANTIS. Oncotarget 2017;8(5):7452-63 doi 10.18632/oncotarget.13918. [0110] 23. Huang M N, McPherson J R, Cutcutache I, Teh B T, Tan P, Rozen S G. MSIseq: Software for Assessing Microsatellite Instability from Catalogs of Somatic Mutations. Scientific reports 2015;5:13321 doi 10.1038/srep13321. [0111] 24. Salipante S J, Scroggins S M, Hampel H L, Turner E H, Pritchard C C. Microsatellite instability detection by next generation sequencing. Clinical chemistry 2014;60(9):1192-9 doi 10.1373/clinchem.2014.223677. [0112] 25. Ladas I, Yu F, Leong K W, Fitarelli-Kiehl M, Song C, Ashtaputre R, et al. Enhanced detection of microsatellite instability using pre-PCR elimination of wild-type DNA homo-polymers in tissue and liquid biopsies. Nucleic acids research 2018 doi 10.1093/nar/gky251. [0113] 26. Tsai E B, Pomykala K, Ruchalski K, Genshaft S, Abtin F, Gutierrez A, et al. Feasibility and Safety of Intrathoracic Biopsy and Repeat Biopsy for Evaluation of Programmed Cell Death Ligand-1 Expression for Immunotherapy in Non-Small Cell Lung Cancer. Radiology 2018;287(1):326-32 doi 10.1148/radio1.2017170347. [0114] 27. Sausen M, Leary R J, Jones S, Wu J, Reynolds C P, Liu X, et al. Integrated genomic analyses identify ARID1A and ARID1B alterations in the childhood cancer neuroblastoma. Nature genetics 2013;45(1):12-7 doi 10.1038/ng.2493. [0115] 28. Leary R J, Kinde I, Diehl F, Schmidt K, Clouser C, Duncan C, et al. Development of personalized tumor biomarkers using massively parallel sequencing. Science translational medicine 2010;2(20):20ra14 doi 10.1126/scitranslmed.3000702. [0116] 29. Forshew T, Murtaza M, Parkinson C, Gale D, Tsui D W, Kaper F, et al. Noninvasive identification and monitoring of cancer mutations by targeted deep sequencing of plasma DNA. Science translational medicine 2012;4(136):136ra68 doi 10.1126/scitranslmed.3003726. [0117] 30. McBride D J, Orpana A K, Sotiriou C, Joensuu H, Stephens P J, Mudie L J, et al. Use of cancer-specific genomic rearrangements to quantify disease burden in plasma from patients with solid tumors. Genes, chromosomes & cancer 2010;49(11):1062-9 doi 10.1002/gcc.20815. [0118] 31. Diehl F, Schmidt K, Choti M A, Romans K, Goodman S, Li M, et al. Circulating mutant DNA to assess tumor dynamics. Nature medicine 2008;14(9):985-90 doi 10.1038/nm.1789. [0119] 32. Dawson S J, Rosenfeld N, Caldas C. Circulating tumor DNA to monitor metastatic breast cancer. The New England journal of medicine 2013;369(1):93-4 doi 10.1056/NEJMc1306040. [0120] 33. Sausen M, Phallen J, Adleff V, Jones S, Leary R J, Barrett M T, et al. Clinical implications of genomic alterations in the tumour and circulation of pancreatic cancer patients. Nature communications 2015;6:7686 doi 10.1038/ncomms8686. [0121] 34. Phallen J, Sausen M, Adleff V, Leal A, Hruban C, White J, et al. Direct detection of early-stage cancers using circulating tumor DNA. Science translational medicine 2017;9(403) doi 10.1126/scitranslmed.aan2415. [0122] 35. Ellrott K, Bailey M H, Saksena G, Covington K R, Kandoth C, Stewart C, et al. Scalable Open Science Approach for Mutation Calling of Tumor Exomes Using Multiple Genomic Pipelines. Cell systems 2018;6(3):271-81 e7 doi 10.1016/j.cels.2018.03.002. [0123] 36. Jones S, Anagnostou V, Lytle K, Parpart-Li S, Nesselbush M, Riley D R, et al. Personalized genomic analyses for cancer mutation discovery and interpretation. Science translational medicine 2015;7(283):283ra53 doi 10.1126/scitranslmed.aaa7161. [0124] 37. Li H, Durbin R. Fast and accurate short read alignment with Burrows-Wheeler transform. Bioinformatics 2009;25(14):1754-60 doi 10.1093/bioinformatics/btp324. [0125] 38. Li H, Handsaker B, Wysoker A, Fennell T, Ruan J, Homer N, et al. The Sequence Alignment/Map format and SAMtools. Bioinformatics 2009;25(16):2078-9 doi 10.1093/bioinformatics/btp352. [0126] 39. Xie M, Lu C, Wang J, McLellan M D, Johnson K J, Wendl M C, et al. Age-related mutations associated with clonal hematopoietic expansion and malignancies. Nature medicine 2014;20(12):1472-8 doi 10.1038/nm.3733.
[0127] Any and all references and citations to other documents, such as patents, patent applications, patent publications, journals, books, papers, web contents, that have been made throughout this disclosure are hereby incorporated herein by reference in their entirety for all purposes.
[0128] Although the present invention has been described with reference to specific details of certain embodiments thereof in the above examples, it will be understood that modifications and variations are encompassed within the spirit and scope of the invention. Accordingly, the invention is limited only by the following claims.
* * * * *
D00000
D00001
D00002
D00003
D00004
D00005
D00006
D00007
D00008
D00009
D00010
D00011
D00012
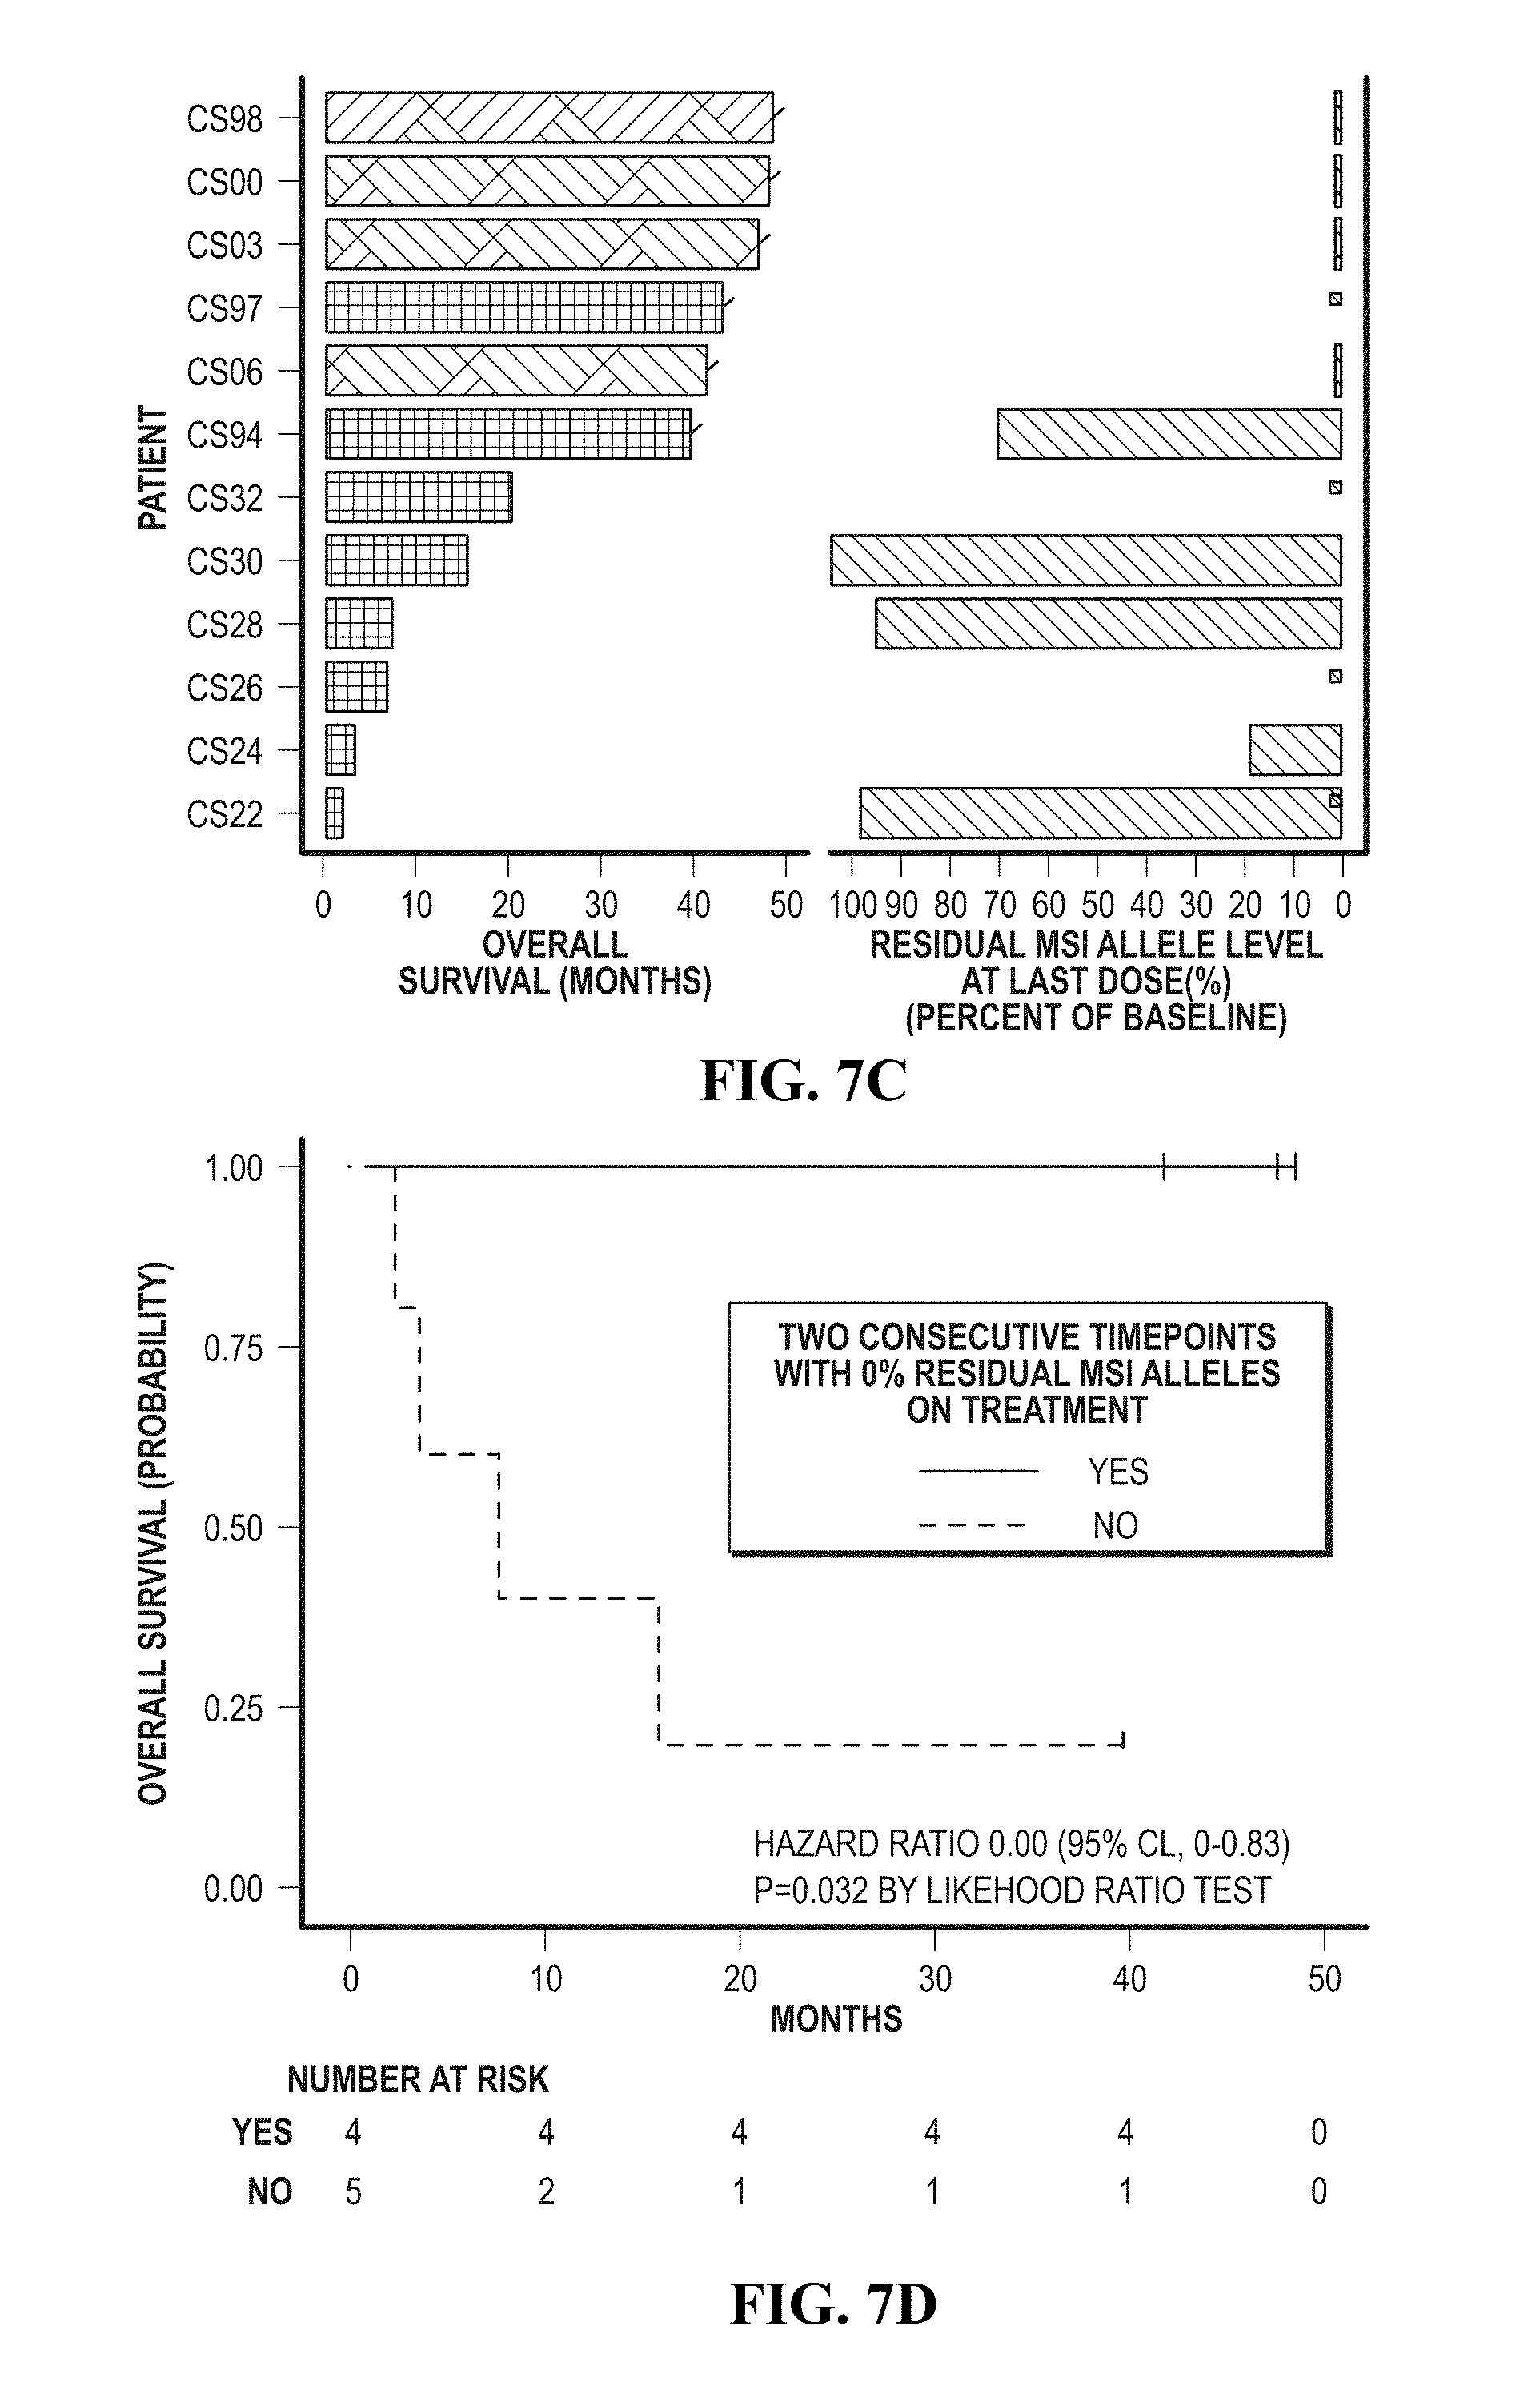
D00013

D00014

D00015

D00016

D00017

D00018

D00019
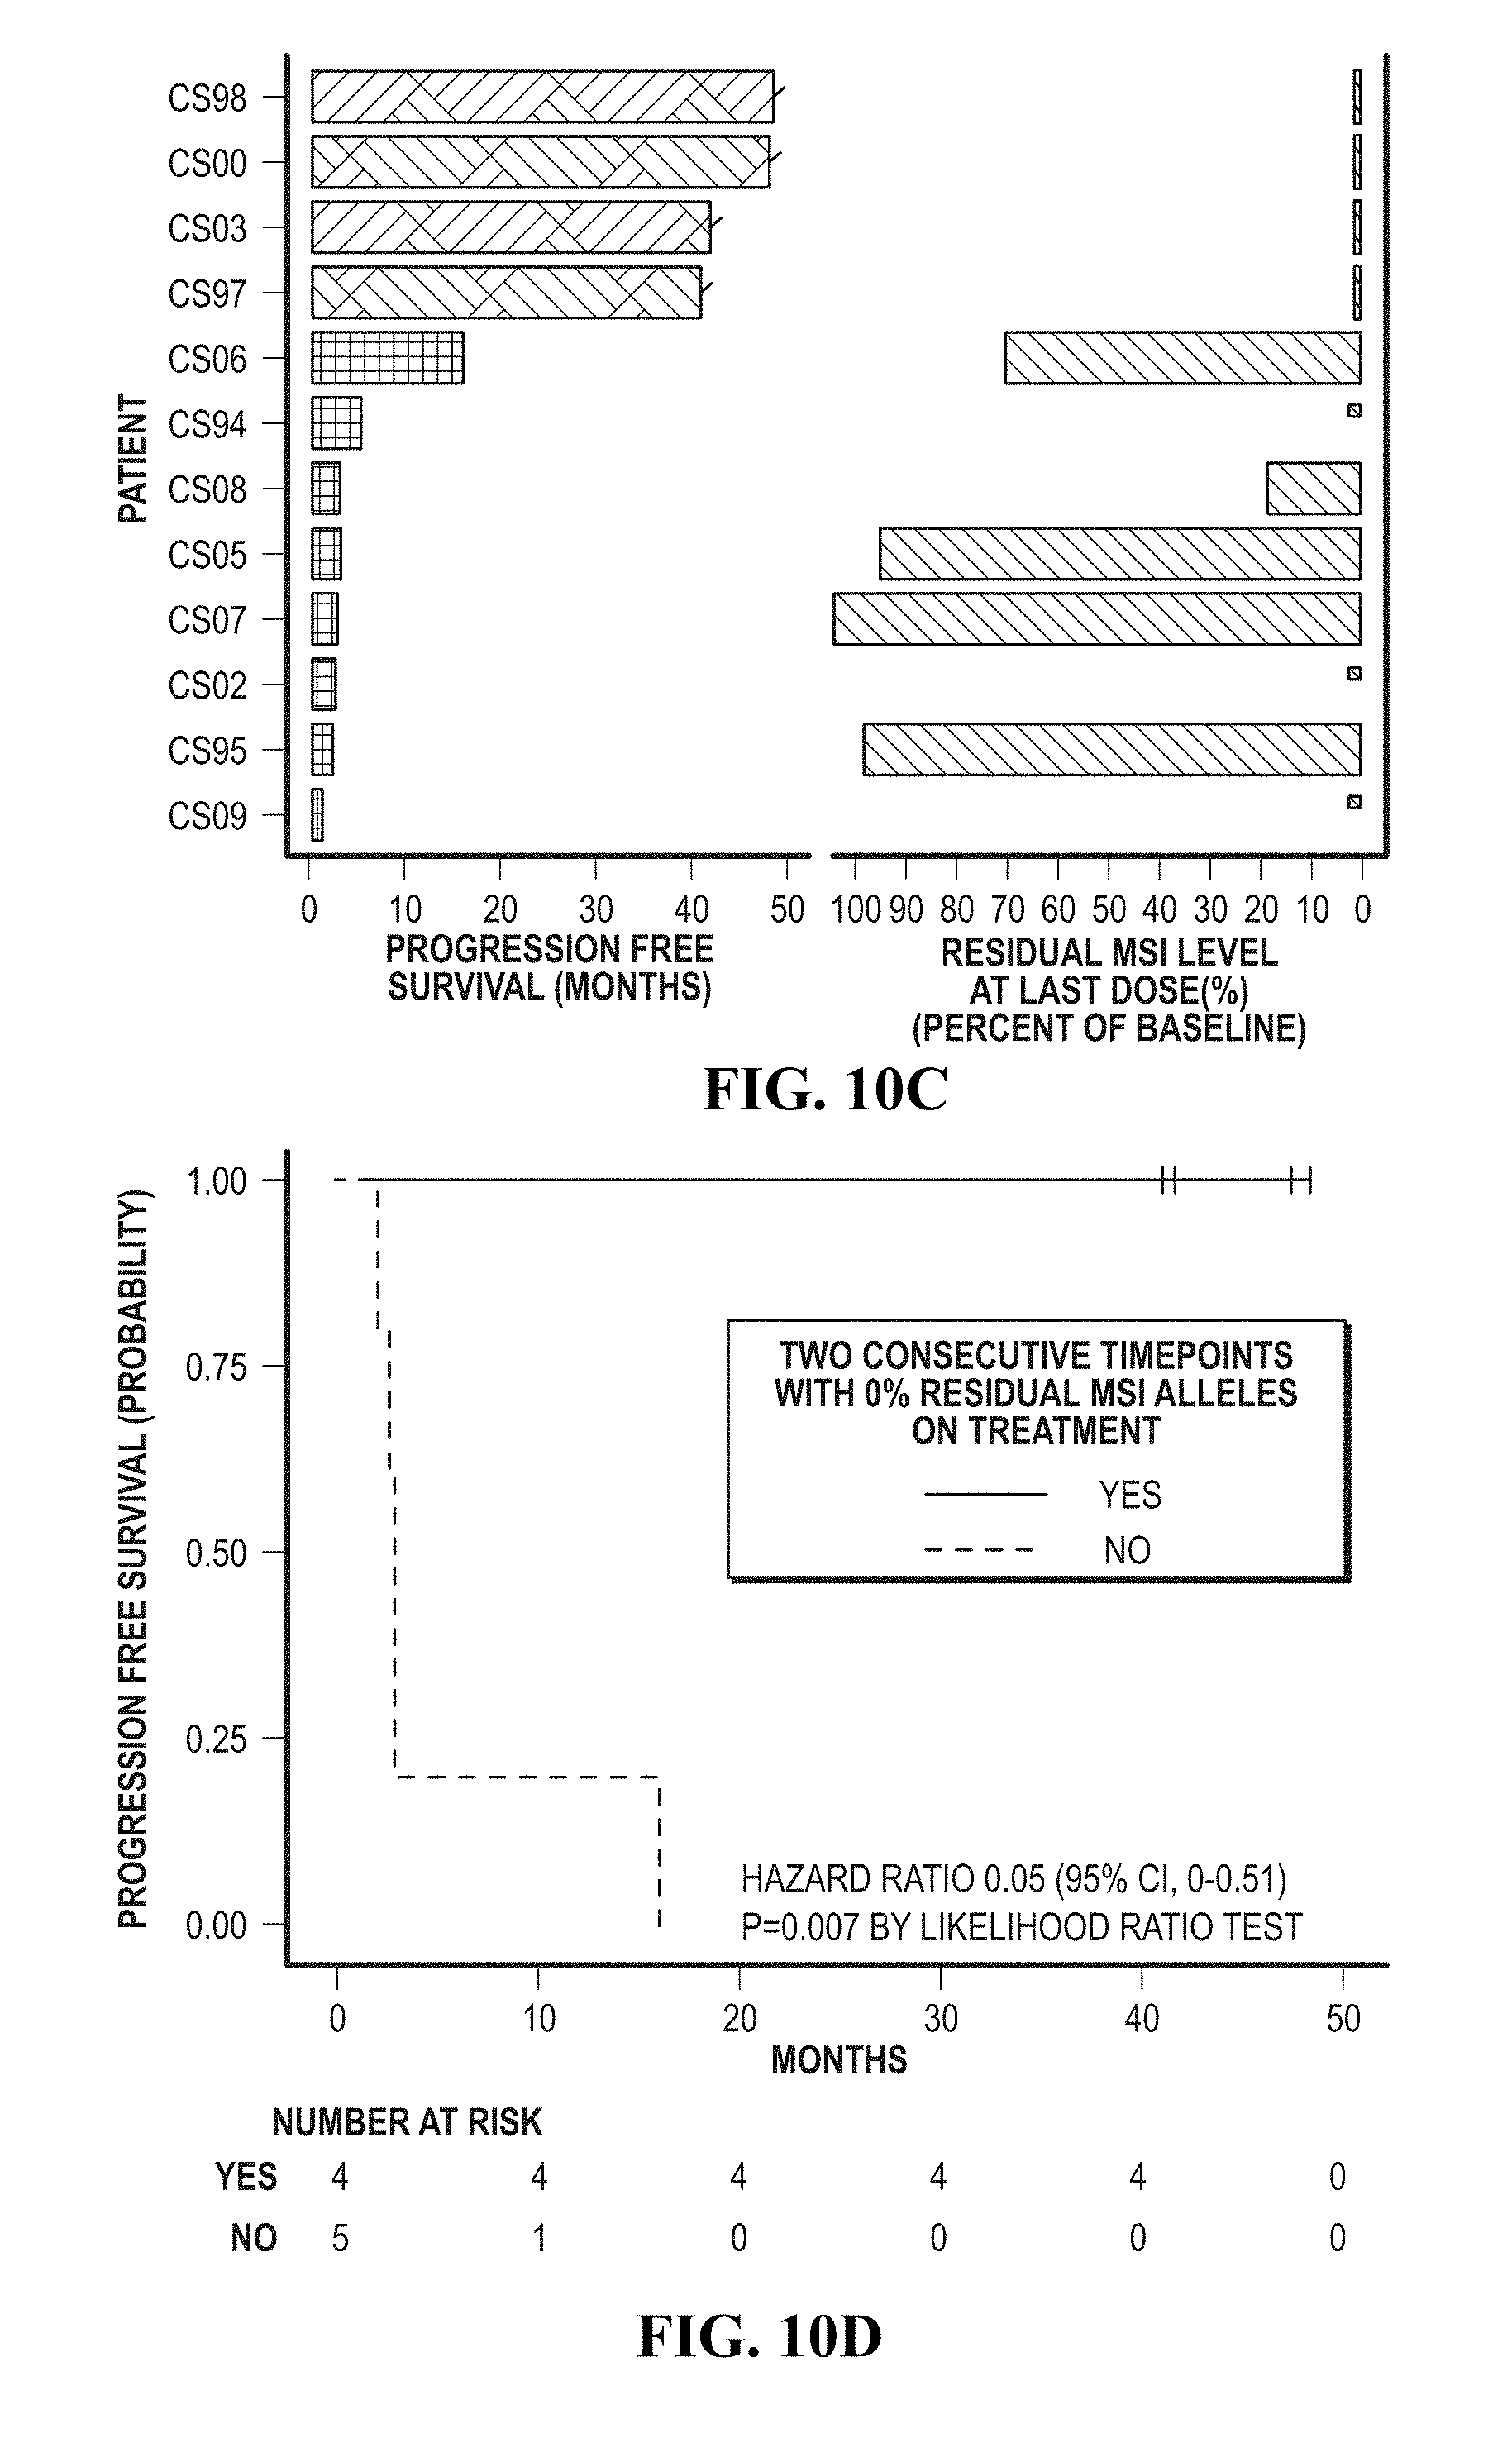
D00020

D00021

XML
uspto.report is an independent third-party trademark research tool that is not affiliated, endorsed, or sponsored by the United States Patent and Trademark Office (USPTO) or any other governmental organization. The information provided by uspto.report is based on publicly available data at the time of writing and is intended for informational purposes only.
While we strive to provide accurate and up-to-date information, we do not guarantee the accuracy, completeness, reliability, or suitability of the information displayed on this site. The use of this site is at your own risk. Any reliance you place on such information is therefore strictly at your own risk.
All official trademark data, including owner information, should be verified by visiting the official USPTO website at www.uspto.gov. This site is not intended to replace professional legal advice and should not be used as a substitute for consulting with a legal professional who is knowledgeable about trademark law.