Pharmaceutical Combination for Use in Glycemic Control in Diabetes Type 2 Patients
Niemoeller; Elisabeth ; et al.
U.S. patent application number 16/038733 was filed with the patent office on 2019-05-09 for pharmaceutical combination for use in glycemic control in diabetes type 2 patients. The applicant listed for this patent is Sanofi-Aventis Deutschland GmbH. Invention is credited to Gabor Boka, Patrick Miossec, Isabel Muehlen-Bartmer, Elisabeth Niemoeller, Louise Silvestre.
| Application Number | 20190134160 16/038733 |
| Document ID | / |
| Family ID | 46826464 |
| Filed Date | 2019-05-09 |


| United States Patent Application | 20190134160 |
| Kind Code | A1 |
| Niemoeller; Elisabeth ; et al. | May 9, 2019 |
Pharmaceutical Combination for Use in Glycemic Control in Diabetes Type 2 Patients
Abstract
The present invention refers to a pharmaceutical combination for use in glycemic control in diabetes type 2 patients.
| Inventors: | Niemoeller; Elisabeth; (Frankfurt am Main, DE) ; Muehlen-Bartmer; Isabel; (Frankfurt am Main, DE) ; Silvestre; Louise; (Paris, FR) ; Boka; Gabor; (Paris, FR) ; Miossec; Patrick; (Paris, FR) | ||||||||||
| Applicant: |
|
||||||||||
|---|---|---|---|---|---|---|---|---|---|---|---|
| Family ID: | 46826464 | ||||||||||
| Appl. No.: | 16/038733 | ||||||||||
| Filed: | July 18, 2018 |
Related U.S. Patent Documents
| Application Number | Filing Date | Patent Number | ||
|---|---|---|---|---|
| 15197378 | Jun 29, 2016 | |||
| 16038733 | ||||
| 13595590 | Aug 27, 2012 | 9408893 | ||
| 15197378 | ||||
| Current U.S. Class: | 1/1 |
| Current CPC Class: | A61K 31/427 20130101; A61P 3/10 20180101; A61K 31/155 20130101; A61K 31/4439 20130101; A61K 38/26 20130101; A61P 43/00 20180101; A61K 38/26 20130101; A61K 2300/00 20130101; A61K 31/155 20130101; A61K 2300/00 20130101; A61K 31/4439 20130101; A61K 2300/00 20130101; A61K 31/427 20130101; A61K 2300/00 20130101 |
| International Class: | A61K 38/26 20060101 A61K038/26; A61K 31/427 20060101 A61K031/427; A61K 31/155 20060101 A61K031/155; A61K 31/4439 20060101 A61K031/4439 |
Foreign Application Data
| Date | Code | Application Number |
|---|---|---|
| Aug 29, 2011 | EP | 11179149.7 |
Claims
1. A method for improving glycemic control in a patient with type 2 diabetes not adequately controlled by treatment with a glitazone, the method comprising administering lixisenatide as an add-on treatment to the patient in need thereof; wherein the patient is not adequately controlled by treatment with a glitazone at a dose of 10 mg/day to 60 mg/day; and wherein the lixisenatide is administered at a starting dose of 10 .mu.g daily and titrated to a maintenance dose of 20 .mu.g daily by day 15 of lixisenatide treatment.
2. The method of claim 1, wherein the patient is inadequately controlled by treatment with a glitazone and metformin.
3. The method of claim 1, wherein the glitazone is pioglitazone.
Description
CROSS-REFERENCE TO RELATED APPLICATIONS
[0001] This application is a divisional of U.S. patent application Ser. No. 13/595,590 filed on Aug. 27, 2012, which claims priority from European Patent Application No. 11179149.7 filed Aug. 29, 2011, the disclosures of which are incorporated herein by reference in their entirety.
DESCRIPTION
[0002] Subject of the present invention is a pharmaceutical combination for use in glycemic control in diabetes type 2 patients, said combination comprising (a) desPro.sup.36Exendin-4(1-39)-Lys.sub.6-NH.sub.2 (AVE0010, lixisenatide) or/and a pharmaceutically acceptable salt thereof, and (b) a glitazone or/and a pharmaceutically acceptable salt thereof.
[0003] In a healthy person the release of insulin by the pancreas is strictly coupled to the concentration of blood glucose. An increased level of blood glucose, as appears after meals, is rapidly counterbalanced by a respective increase in insulin secretion. In fasting condition the plasma insulin level drops to a basal value which is sufficient to ensure the continuous supply of glucose to insulin-sensitive organs and tissues and to keep the hepatic glucose production at a low level at night.
[0004] In contrast to diabetes type 1, there is not generally a lack of insulin in diabetes type 2 but in many cases, particularly in progressive cases, the treatment with insulin is regarded as the most suitable therapy, if required in combination with orally administered anti-diabetic drugs.
[0005] An increased glucose level in the blood over several years without initial symptoms represents a significant health risk. It could clearly be shown by the large-scale DCCT study in the USA (The Diabetes Control and Complications Trial Research Group (1993) N. Engl. J. Med. 329, 977-986) that chronically increased levels of blood glucose are a main reason for the development of diabetes complications. Examples for diabetes complications are micro and macrovascular damages that possibly manifest themselves in retinopathies, nephropathies or neuropathies and lead to blindness, renal failure and the loss of extremities and are accompanied by an increased risk of cardiovascular diseases. It can thus be concluded that an improved therapy of diabetes primarily has to aim keeping blood glucose in the physiological range as closely as possible.
[0006] A particular risk exists for overweight patients suffering from diabetes type 2, e.g. patients with a body mass index (BMI) >30. In these patients the risks of diabetes overlap with the risks of overweight, leading e.g. to an increase of cardiovascular diseases compared to diabetes type 2 patients being of a normal weight. Thus, it is particularly necessary to treat diabetes in these patients while reducing the overweight.
[0007] Glitazones (also termed thiazolidinediones) such as pioglitazone are antihyperglycemic agents that reduce insulin resistance by sensitizing muscle, liver and adipose tissue (Dormandy et al., Lancet 2005, 366:1270-89, Yki-Jarvinen, N Engl J Med 2004, 351: 1106-18).
[0008] Metformin is a biguanide hypoglycemic agent used in the treatment of non-insulin-dependent diabetes mellitus (diabetes mellitus type 2) not responding to dietary modification. Metformin improves glycemic control by improving insulin sensitivity and decreasing intestinal absorption of glucose. Metformin is usually administered orally. However, control diabetes mellitus type 2 in obese patients by metformin may be insufficient. Thus, in these patients, additional measures for controlling diabetes mellitus type 2 may be required.
[0009] The compound desPro.sup.36Exendin-4(1-39)-Lys.sub.6-NH.sub.2 (AVE0010, lixisenatide) is a derivative of Exendin-4. Lixisenatide is disclosed as SEQ ID NO:93 in WO 01/04156:
TABLE-US-00001 SEQ ID NO: 1: Lixisenatide (44 AS) H-G-E-G-T-F-T-S-D-L-S-K-Q-M-E-E-E-A-V-R-L-F-I-E-W- L-K-N-G-G-P-S-S-G-A-P-P-S-K-K-K-K-K-K-NH2 SEQ ID NO: 2: Exendin-4 (39 AS) H-G-E-G-T-F-T-S-D-L-S-K-Q-M-E-E-E-A-V-R-L-F-I-E W-L-K-N-G-G-P-S-S-G-A-P-P-P-S-NH2
[0010] Exendins are a group of peptides which can lower blood glucose concentration. The Exendin analogue lixisenatide is characterised by C-terminal truncation of the native Exendin-4 sequence. Lixisenatide comprises six C-terminal lysine residues not present in Exendin-4.
[0011] In the context of the present invention, lixisenatide includes pharmaceutically acceptable salts thereof. The person skilled in the art knows pharmaceutically acceptable salts of lixisenatide. A preferred pharmaceutically acceptable salt of lixisenatide employed in the present invention is acetate.
[0012] In the Example of the present invention, it has been demonstrated in diabetes type 2 patients that lixisenatide in an add-on therapy to a glitazone significantly improved glycemic control: [0013] Lixisenatide in combination with pioglitazone ("lixisenatide group") significantly decreased the fasting plasma glucose compared to the pioglitazone group ("placebo group") from baseline to Week 24. [0014] In the lixisenatide group, the HbA1c values were significantly decreased compared to the placebo group from baseline to Week 24. [0015] In the lixisenatide group, the percentages of patients reaching HbA.sub.1c values <6.5% or <7% at Week 24 were significantly higher than in the placebo group. [0016] The fasting plasma insulin concentration was lower in the lixisenatide group, compared to the placebo group.
[0017] One aspect of the present invention is a pharmaceutical combination, said combination comprising [0018] (a) desPro.sup.36Exendin-4(1-39)-Lys.sub.6-NH.sub.2 or/and a pharmaceutically acceptable salt thereof, and [0019] (b) a glitazone or/and a pharmaceutically acceptable salt thereof.
[0020] The combination of the present invention can be used for the treatment of diabetes type 2 patients, or/and for the treatment of conditions associated with diabetes type 2. Such conditions include a decrease of glucose tolerance, an increased postprandial plasma glucose concentration, an increase in fasting plasma glucose concentration, an increased HbA1c value, or/and an increased fasting plasma insulin concentration.
[0021] A preferred aspect of the present invention is a pharmaceutical combination for use in glycemic control in diabetes type 2 patients, said combination comprising [0022] (a) desPro.sup.36Exendin-4(1-39)-Lys.sub.6-NH.sub.2 or/and a pharmaceutically acceptable salt thereof, and [0023] (b) a glitazone or/and a pharmaceutically acceptable salt thereof.
[0024] As demonstrated by the Example of the present invention, the combination as described herein can be used for improving glycemic control. In the present invention, "improvement of glycemic control" or "glycemic control" in particular refers to improvement of glucose tolerance, improvement of postprandial plasma glucose concentration, improvement of fasting plasma glucose concentration, improvement of the HbA1c value or/and improvement of fasting plasma insulin concentration.
[0025] In particular, improvement of glucose tolerance includes improvement of the postprandial plasma glucose concentration or/and improvement of fasting plasma insulin concentration. More particular, improvement of glucose tolerance includes improvement of the postprandial plasma glucose concentration.
[0026] In particular, improvement of postprandial plasma glucose concentration is reduction of the postprandial plasma glucose concentration. Reduction means in particular that the plasma glucose concentration reaches normoglycemic values or at least approaches these values.
[0027] In particular, improvement of fasting plasma glucose concentration is reduction of the fasting plasma glucose concentration. Reduction means in particular that the plasma glucose concentration reaches normoglycemic values or at least approaches these values.
[0028] In particular, improvement of the HbA1c value is reduction of the HbA1c value. Reduction of the HbA1c value in particular means that the HbA1c value is reduced below 6.5% or 7%, for example after treatment for at least one month, at least two months, at least three months, at least four months, at least five months, at least six months or at least one year.
[0029] In particular, improvement of fasting plasma insulin concentration is reduction of fasting plasma insulin concentration. The plasma insulin concentration is coupled to the plasma glucose concentration. Under treatment as described herein, in fasting condition the plasma insulin may reach or at least approach values to ensure the continuous supply of glucose to insulin-sensitive organs and tissues or/and to keep the hepatic glucose production at a low level at night. At fasting conditions, the insulin concentration may reach or at least approach values associated with normoglycemia or plasma glucose concentration approaching normoglycemia.
[0030] In the context of the present invention, "glitazone", as used herein, includes pharmaceutically acceptable salts thereof. The glitazone may be selected from pioglitazone, troglitazone, rosiglitazone, and pharmaceutically acceptable salts thereof.
[0031] In the present invention, the glitazone, in particular pioglitazone, may be administered orally. The skilled person knows formulations of the glitazone, in particular pioglitazone, suitable for treatment of diabetes type 2 by oral administration. Pioglitazone may be administered to a patient in need thereof, in an amount sufficient to induce a therapeutic effect. The glitazone, in particular pioglitazone, may be administered in a dose of at least 10 mg/day, at least 20 mg/day, at least 30 mg/day, or at least 40 mg/day. The maximal daily dose of the glitazone, in particular pioglitazone, may be 50 mg/day or 60 mg/day. A preferred dosing range is 10 mg/day to 50 mg/day or 30 mg/day to mg/day. A more preferred dose is about 30 mg/day. For oral administration, the glitazone, in particular pioglitazone, may be formulated in a solid dosage form, such as a tablet or pill. The glitazone, in particular pioglitazone, may be formulated with suitable pharmaceutically acceptable carriers, adjuvants, or/and auxiliary substances.
[0032] The pharmaceutical combination of the present invention may further comprise metformin or/and a pharmaceutically acceptable salt thereof. Metformin is the international nonproprietary name of 1,1-dimethylbiguanide (CAS Number 657-24-9). In the present invention, the term "metformin" includes any pharmaceutically acceptable salt thereof.
[0033] In the present invention, metformin may be administered orally. The skilled person knows formulations of metformin suitable for treatment of diabetes type 2 by oral administration. Metformin may be administered to a patient in need thereof, in an amount sufficient to induce a therapeutic effect. Metformin may be administered in a dose of at least 1.0 g/day or at least 1.5 g/day. For oral administration, metformin may be formulated in a solid dosage form, such as a tablet or pill. Metformin may be formulated with suitable pharmaceutically acceptable carriers, adjuvants, or/and auxiliary substances.
[0034] If metformin is present in the combination of the present invention, metformin and the glitazone, in particular pioglitazone, may be provided in one formulation, for example in a solid dosage form, such as a tablet or pill. Metformin and the glitazone, in particular pioglitazone, may be formulated with suitable pharmaceutically acceptable carriers, adjuvants, or/and auxiliary substances.
[0035] In the present invention, desPro.sup.36Exendin-4(1-39)-Lys.sub.6-NH.sub.2 or/and a pharmaceutically acceptable salt may be administered in an add-on therapy to administration of the glitazone, in particular pioglitazone.
[0036] In the present invention, the terms "add-on", "add-on treatment", "add-on therapy" and "on top of` relate to treatment of diabetes mellitus type 2 with the glitazone, in particular pioglitazone, and lixisenatide. Also included may be the treatment with metformin, as disclosed herein. The glitazone, in particular pioglitazone, and lixisenatide may be administered within a time interval of 24 h. The glitazone, in particular pioglitazone, and lixisenatide each may be administered in a once-a-day-dosage. The glitazone, in particular pioglitazone, and lixisenatide may be administered by different administration routes. The glitazone, in particular pioglitazone, may be administered orally, and lixisenatide may be administered parenterally.
[0037] The patient to be treated by the medicament of the present invention may be a patient suffering from diabetes type 2. The Example demonstrates in these patients, that administration of lixisenatide in combination with the glitazone, in particular pioglitazone, provides an advantageous therapy.
[0038] The patient to be treated by the medicament of the present invention suffering from diabetes type 2 may be a patient suffering from diabetes type 2, wherein diabetes type 2 is not adequately controlled by treatment with the glitazone, in particular pioglitazone, alone, for instance with a dose selected from the range of 10 mg/day to 50 mg/day, in particular about 30 mg/day, for at least 2 or at least 3 months. In the present invention, a patient the diabetes type 2 of which is not adequately controlled may have a HbA1c value in the range of 7% to 10%.
[0039] The patient to be treated by the medicament of the present invention suffering from diabetes type 2 may be an obese patient. In the present invention, an obese patient may have a body mass index of at least 30 kg/m.sup.2.
[0040] The patient to be treated by the medicament of the present invention suffering from diabetes type 2 may have a normal body weight. In the present invention, a patient having normal body weight may have a body mass index in the range of 17 kg/m.sup.2 to 25 kg/m.sup.2, 17 kg/m.sup.2 to <30 kg/m.sup.2 or <30 kg/m.sup.2.
[0041] The patient to be treated by the medicament of the present invention may be an adult patient. The patient may have an age of at least 18 years of may have an age in the range of 18 to 80 years, of 18 to 50 years, or 40 to 80 years, or 50 to 60 years. The patient may be younger than 50 years.
[0042] The patient to be treated by the medicament of the present invention preferably does not receive an antidiabetic treatment, for instance by insulin or/and related compounds.
[0043] The patient to be treated by the medicament of the present invention may suffer from diabetes mellitus type 2 for at least 1 year or at least 2 years. In particular, in the diabetes type 2 patient, diabetes mellitus type 2 has been diagnosed at least 1 year or at least 2 years before onset of therapy by the medicament of the present invention.
[0044] The diabetes type 2 patient may have a HbA1c value of at least about 8% or at least about 7.5%. The patient may also have a HbA1c value of about 7% to about 10%. The example of the present invention demonstrates that treatment by lixisenatide results in a reduction of the HbA1c value in diabetes type 2 patients.
[0045] In yet another aspect of the present invention, the combination as described herein can be used for improving the HbA1c value in a patient suffering from diabetes type 2, as described herein.
[0046] In yet another aspect of the present invention, the combination as described herein can be used for improving glucose tolerance in a patient suffering from diabetes type 2, as described herein.
[0047] In yet another aspect of the present invention, the combination as described herein can be used for improving postprandial plasma glucose concentration in a patient suffering from diabetes type 2, as described herein.
[0048] In yet another aspect of the present invention, the combination as described herein can be used for improving fasting plasma glucose concentration in a patient suffering from diabetes type 2, as described herein.
[0049] In yet another aspect of the present invention, the combination as described herein can be used for improving fasting plasma insulin concentration in a patient suffering from diabetes type 2, as described herein.
[0050] In the present invention, normoglycemic values are blood glucose concentrations of in particular 60-140 mg/dl (corresponding to 3,3 bis 7.8 mM/L). This range refers in particular to blood glucose concentrations under fasting conditions or/and postprandial conditions.
[0051] The diabetes type 2 patient may have a 2 hours postprandial plasma glucose concentration of at least 10 mmol/L, at least 12 mmol/L, or at least 14 mmol/L. These plasma glucose concentrations exceed normoglycemic concentrations.
[0052] The diabetes type 2 patient may have a glucose excursion of at least 2 mmol/L, at least 3 mmol/L, at least 4 mmol/L or at least 5 mmol/L. In the present invention, the glucose excursion is in particular the difference of the 2 hours postprandial plasma glucose concentration and the plasma glucose concentration 30 minutes prior to a meal test.
[0053] "Postprandial" is a term that is well known to a person skilled in the art of diabetology. The term "postprandial" describes in particular the phase after a meal or/and exposure to glucose under experimental conditions. In a healthy person this phase is characterised by an increase and subsequent decrease in blood glucose concentration. The term "postprandial" or "postprandial phase" typically ends up to 2 h after a meal or/and exposure to glucose.
[0054] The diabetes type 2 patient as disclosed herein may have a fasting plasma glucose concentration of at least 8 mmol/L, at least 8.5 mmol/L or at least 9 mmol/L. These plasma glucose concentrations exceed normoglycemic concentrations.
[0055] In the present invention, desPro.sup.36Exendin-4(1-39)-Lys.sub.6-NH.sub.2 or/and the pharmaceutically acceptable salt thereof may be administered to a patient in need thereof, in an amount sufficient to induce a therapeutic effect.
[0056] In the present invention, desPro.sup.36Exendin-4(1-39)-Lys.sub.6-NH.sub.2 or/and the pharmaceutically acceptable salt thereof may be formulated with suitable pharmaceutically acceptable carriers, adjuvants, or/and auxiliary substances.
[0057] The compound desPro.sup.36Exendin-4(1-39)-Lys.sub.6-NH.sub.2 or/and a pharmaceutically acceptable salt thereof may be administered parenterally, e.g. by injection (such as by intramuscular or by subcutaneous injection). Suitable injection devices, for instance the so-called "pens" comprising a cartridge comprising the active ingredient, and an injection needle, are known. The compound desPro.sup.36Exendin-4(1-39)-Lys.sub.6-NH.sub.2 or/and a pharmaceutically acceptable salt thereof may be administered in a suitable amount, for instance in an amount in the range of 10 to 15 .mu.g per dose or 15 to 20 .mu.g per dose.
[0058] In the present invention, desPro.sup.36Exendin-4(1-39)-Lys.sub.6-NH.sub.2 or/and a pharmaceutically acceptable salt thereof may be administered in a daily dose in the range of 10 to 20 .mu.g, in the range of 10 to 15 .mu.g, or in the range of 15 to 20 .mu.g. DesPro.sup.36Exendin-4(1-39)-Lys.sub.6-NH.sub.2 or/and a pharmaceutically acceptable salt thereof may be administered by one injection per day.
[0059] In the present invention, desPro.sup.36Exendin-4(1-39)-Lys.sub.6-NH.sub.2 or/and a pharmaceutically acceptable salt thereof may be provided in a liquid composition. The skilled person knows liquid compositions of lixisenatide suitable for parenteral administration. A liquid composition of the present invention may have an acidic or a physiologic pH. An acidic pH preferably is in the range of pH 1-6.8, pH 3.5-6.8, or pH 3.5-5. A physiologic pH preferably is in the range of pH 2.5-8.5, pH 4.0-8.5, or pH 6.0-8.5. The pH may be adjusted by a pharmaceutically acceptable diluted acid (typically HCl) or pharmaceutically acceptable diluted base (typically NaOH).
[0060] The liquid composition comprising desPro.sup.36Exendin-4(1-39)-Lys.sub.6-NH.sub.2 or/and a pharmaceutically acceptable salt thereof may comprise a suitable preservative. A suitable preservative may be selected from phenol, m-cresol, benzyl alcohol and p-hydroxybenzoic acid ester. A preferred preservative is m-cresol.
[0061] The liquid composition comprising desPro.sup.36Exendin-4(1-39)-Lys.sub.6-NH2 or/and a pharmaceutically acceptable salt thereof may comprise a tonicity agent. A suitable tonicity agent may be selected from glycerol, lactose, sorbitol, mannitol, glucose, NaCl, calcium or magnesium containing compounds such as CaCl.sub.2. The concentration of glycerol, lactose, sorbitol, mannitol and glucose may be in the range of 100-250 mM. The concentration of NaCl may be up to 150 mM. A preferred tonicity agent is glycerol.
[0062] The liquid composition comprising desPro.sup.36Exendin-4(1-39)-Lys.sub.6-NH2 or/and a pharmaceutically acceptable salt thereof may comprise methionine from 0.5 .mu.g/mL 20 .mu.g/mL, preferably from 1 .mu.g/mL to 5 .mu.g/mL. Preferably, the liquid composition comprises L-methionine.
[0063] Yet another aspect of the present invention refers to a method of treatment of a medical indication, as described herein. For example, the method may comprise the administration of the combination as described herein. The method may be a method of treatment of diabetes type 2 patients, or/and of treatment of conditions associated with diabetes type 2, as described herein. The patient may be a patient as defined herein.
[0064] A further aspect of the present invention is a method for improvement of glycemic control in diabetes type 2 patients, said method comprising administering desPro.sup.36Exendin-4(1-39)-Lys.sub.6-NH2 or/and a pharmaceutically acceptable salt thereof, in combination with a glitazone, in particular pioglitazone, to a patient in need thereof. In particular, the combination as described herein may be administered. In the method of the present invention, the patient may be the patient defined herein.
[0065] Yet another aspect of the present invention refers to the use of the combination as described herein for the manufacture of a medicament for the treatment of a medical indication, as described herein. For example, the combination of the present invention can be used for the manufacture of a medicament for the treatment of diabetes type 2 patients, or/and for the treatment of conditions associated with diabetes type 2. In particular, the combination of the present invention can be used for the manufacture of a medicament for the improvement of glycemic control, improvement of glucose tolerance, improvement of postprandial plasma glucose concentration, improvement of fasting plasma glucose concentration, improvement of the HbA1c value or/and improvement of fasting plasma insulin concentration. The patient may be a patient as defined herein.
[0066] The invention is further illustrated by the following example and figures.
BRIEF DESCRIPTION OF THE DRAWINGS
[0067] FIG. 1--Study design. End of treatment* indicates once the anticipated End of Study date is known, the investigational site must contact the patient to schedule the End of treatment visit (.+-.4 weeks relative to the end date of the study) for end of treatment assessments and the patient continues the study medication until this visit.
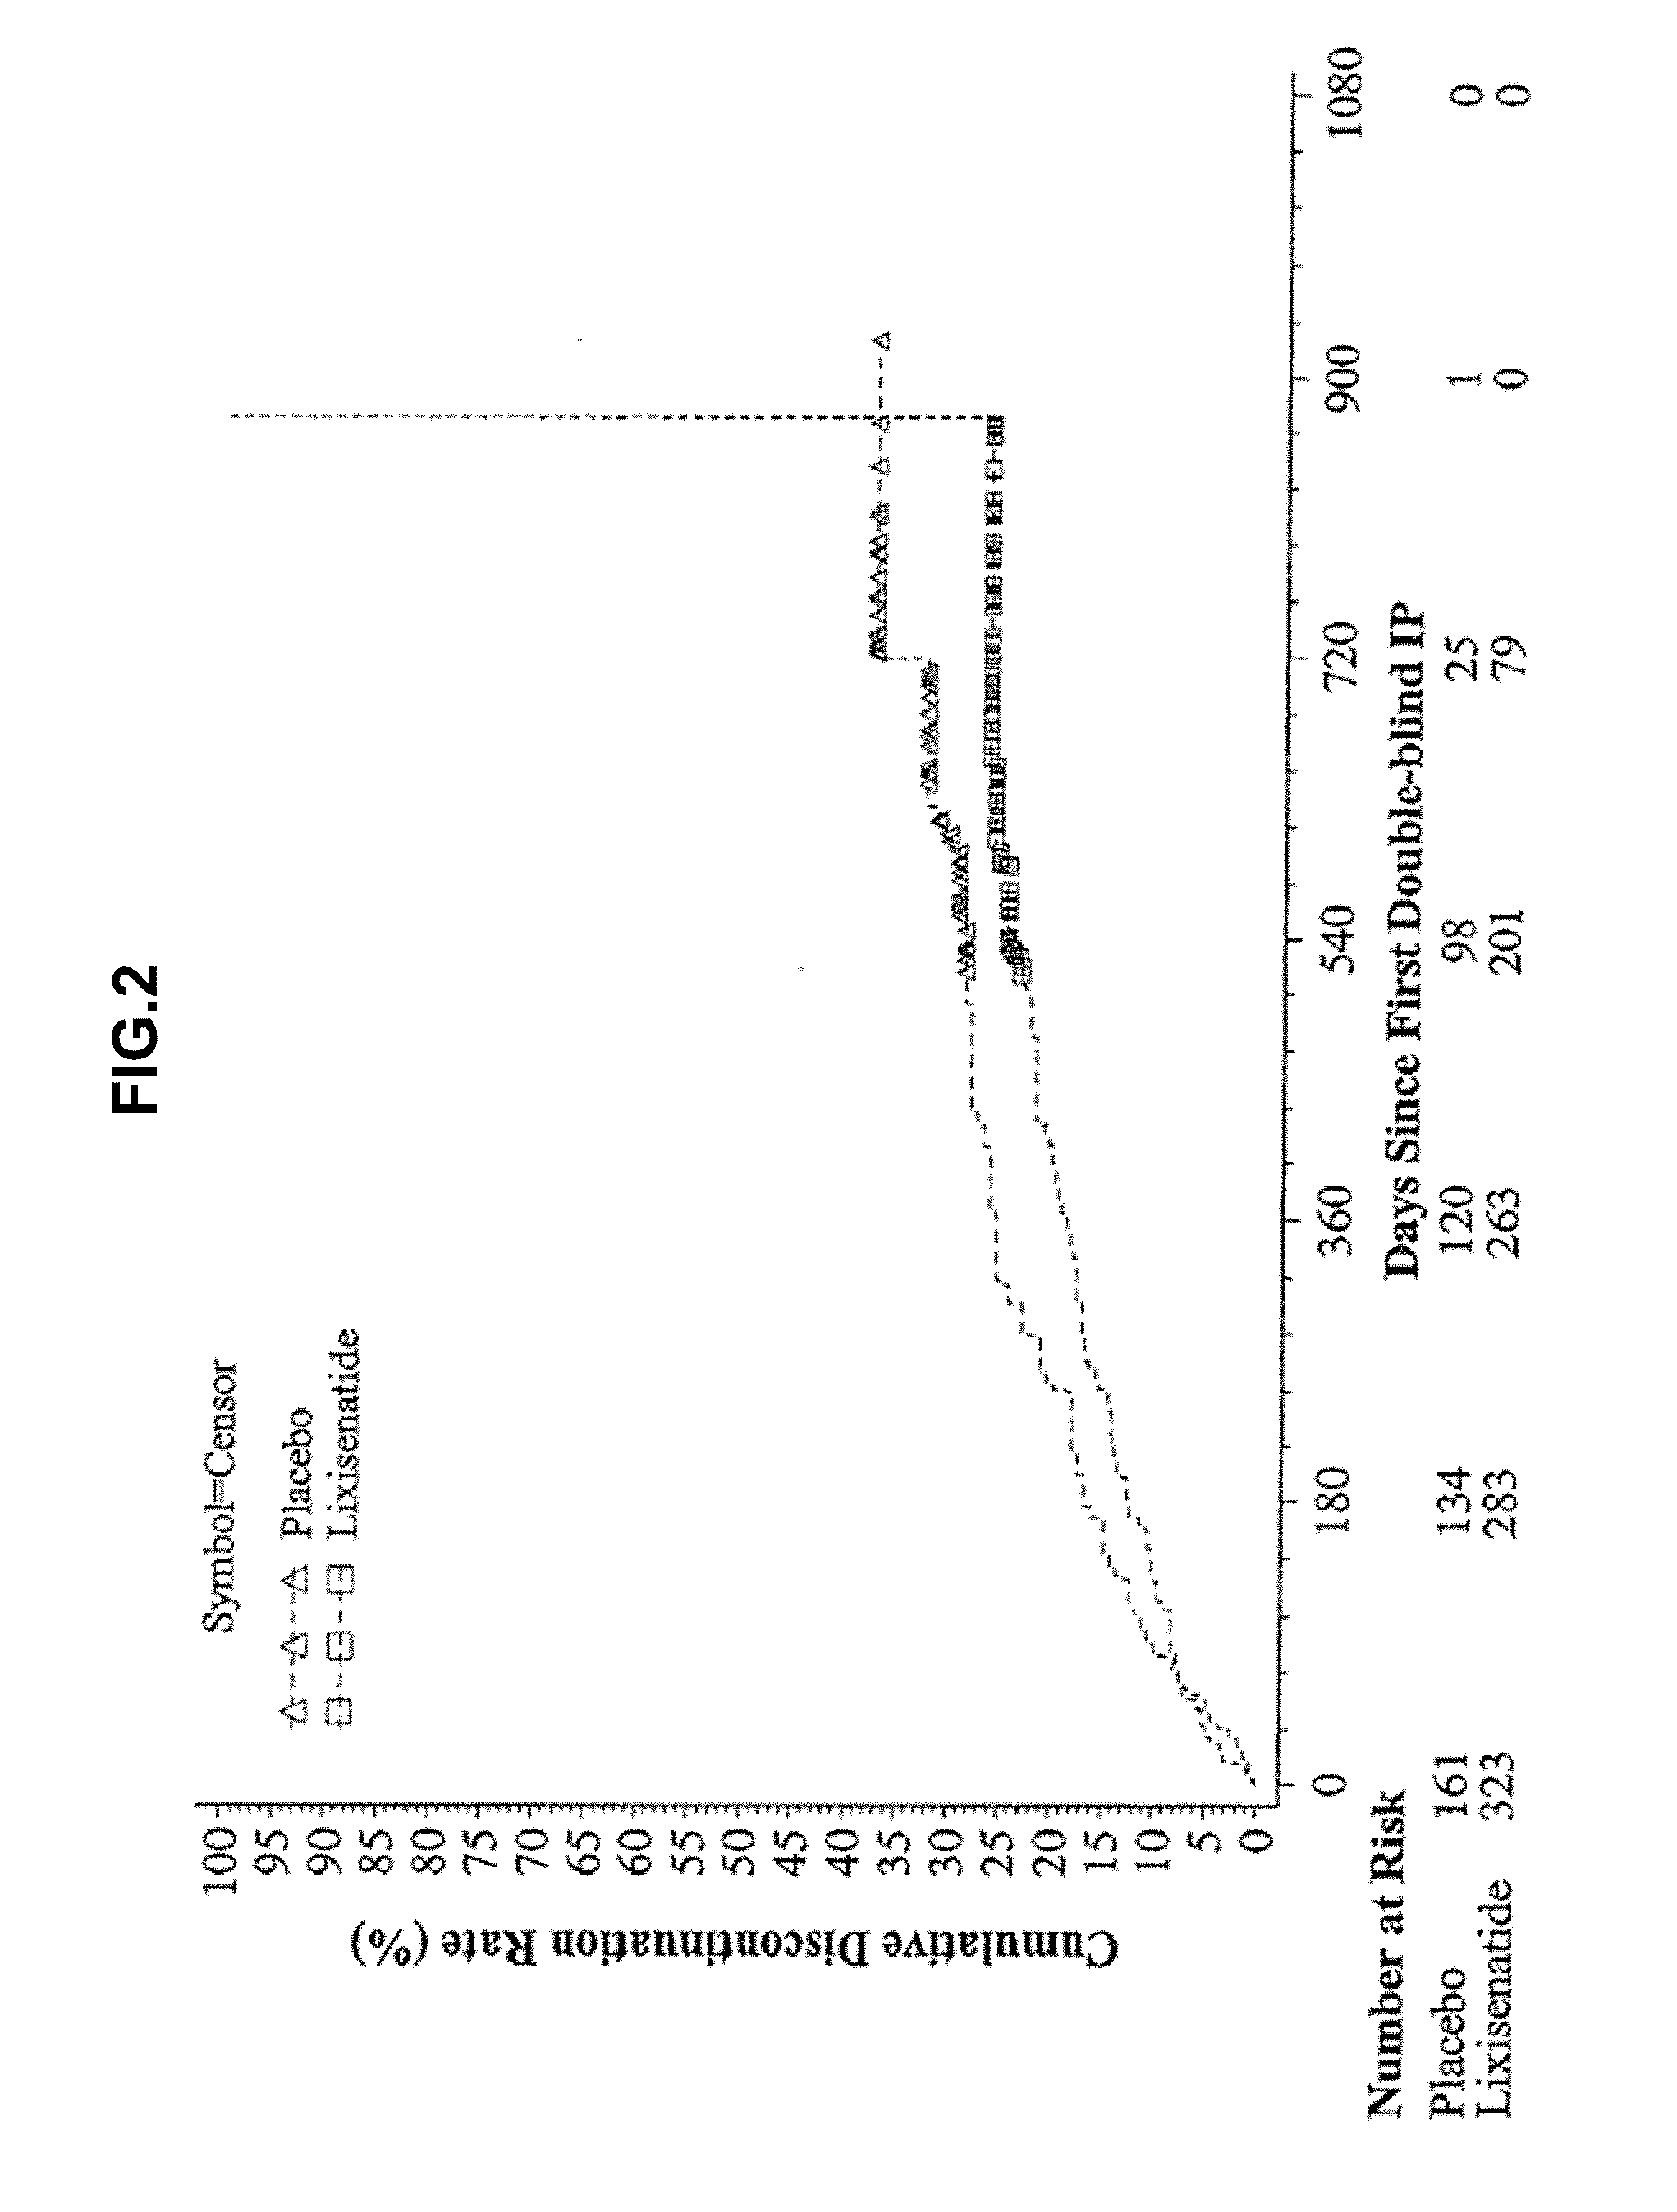
[0068] FIG. 2--Kaplan-Meier plot of time to treatment discontinuation due to any reason--Randomized population.
[0069] FIG. 3--Plot of mean change in HbA1c (%) from baseline by visit up to Week 24--mITT population. LOCF=Last observation carried forward. Note: The plot includes measurements before the introduction of rescue medication and up to 3 days after the last dose of the double-blind investigational product injection on or before Visit 12 (Week 24), or Day 169 if Visit 12 (Week 24) is not available.
[0070] FIG. 4--Plot of mean change in fasting plasma glucose (mmol/L) from baseline by visit up to Week 24--mITT population. LOCF=Last observation carried forward. Note: The plot includes measurements before the introduction of rescue medication and up to 1 day after the last dose of the double-blind investigational product injection on or before Visit 12 (Week 24), or Day 169 if Visit 12 (Week 24) is not available.
[0071] FIG. 5 Plot of mean change in body weight (kg) from baseline by visit up to Week 24--mITT population. LOCF=Last observation carried forward. Note: The plot includes measurements before the introduction of rescue medication and up to 3 days after the last dose of the double-blind investigational product injection on or before Visit 12 (Week 24), or Day 169 if Visit 12 (Week 24) is not available.
[0072] FIG. 6--Plot of mean change in HbA1c (%) from baseline by visit-mITT population. LOCF=Last observation carried forward, EOT=Last on-treatment value. Note: The analysis excludes measurements obtained after the introduction of rescue medication and/or after the treatment cessation plus 3 days. For Week 24 (LOCF), the analysis includes measurements obtained up to 3 days after the last dose of the double-blind investigational product injection on or before Visit 12 (Week 24), or Day 169 if Visit 12 (Week 24) is not available.
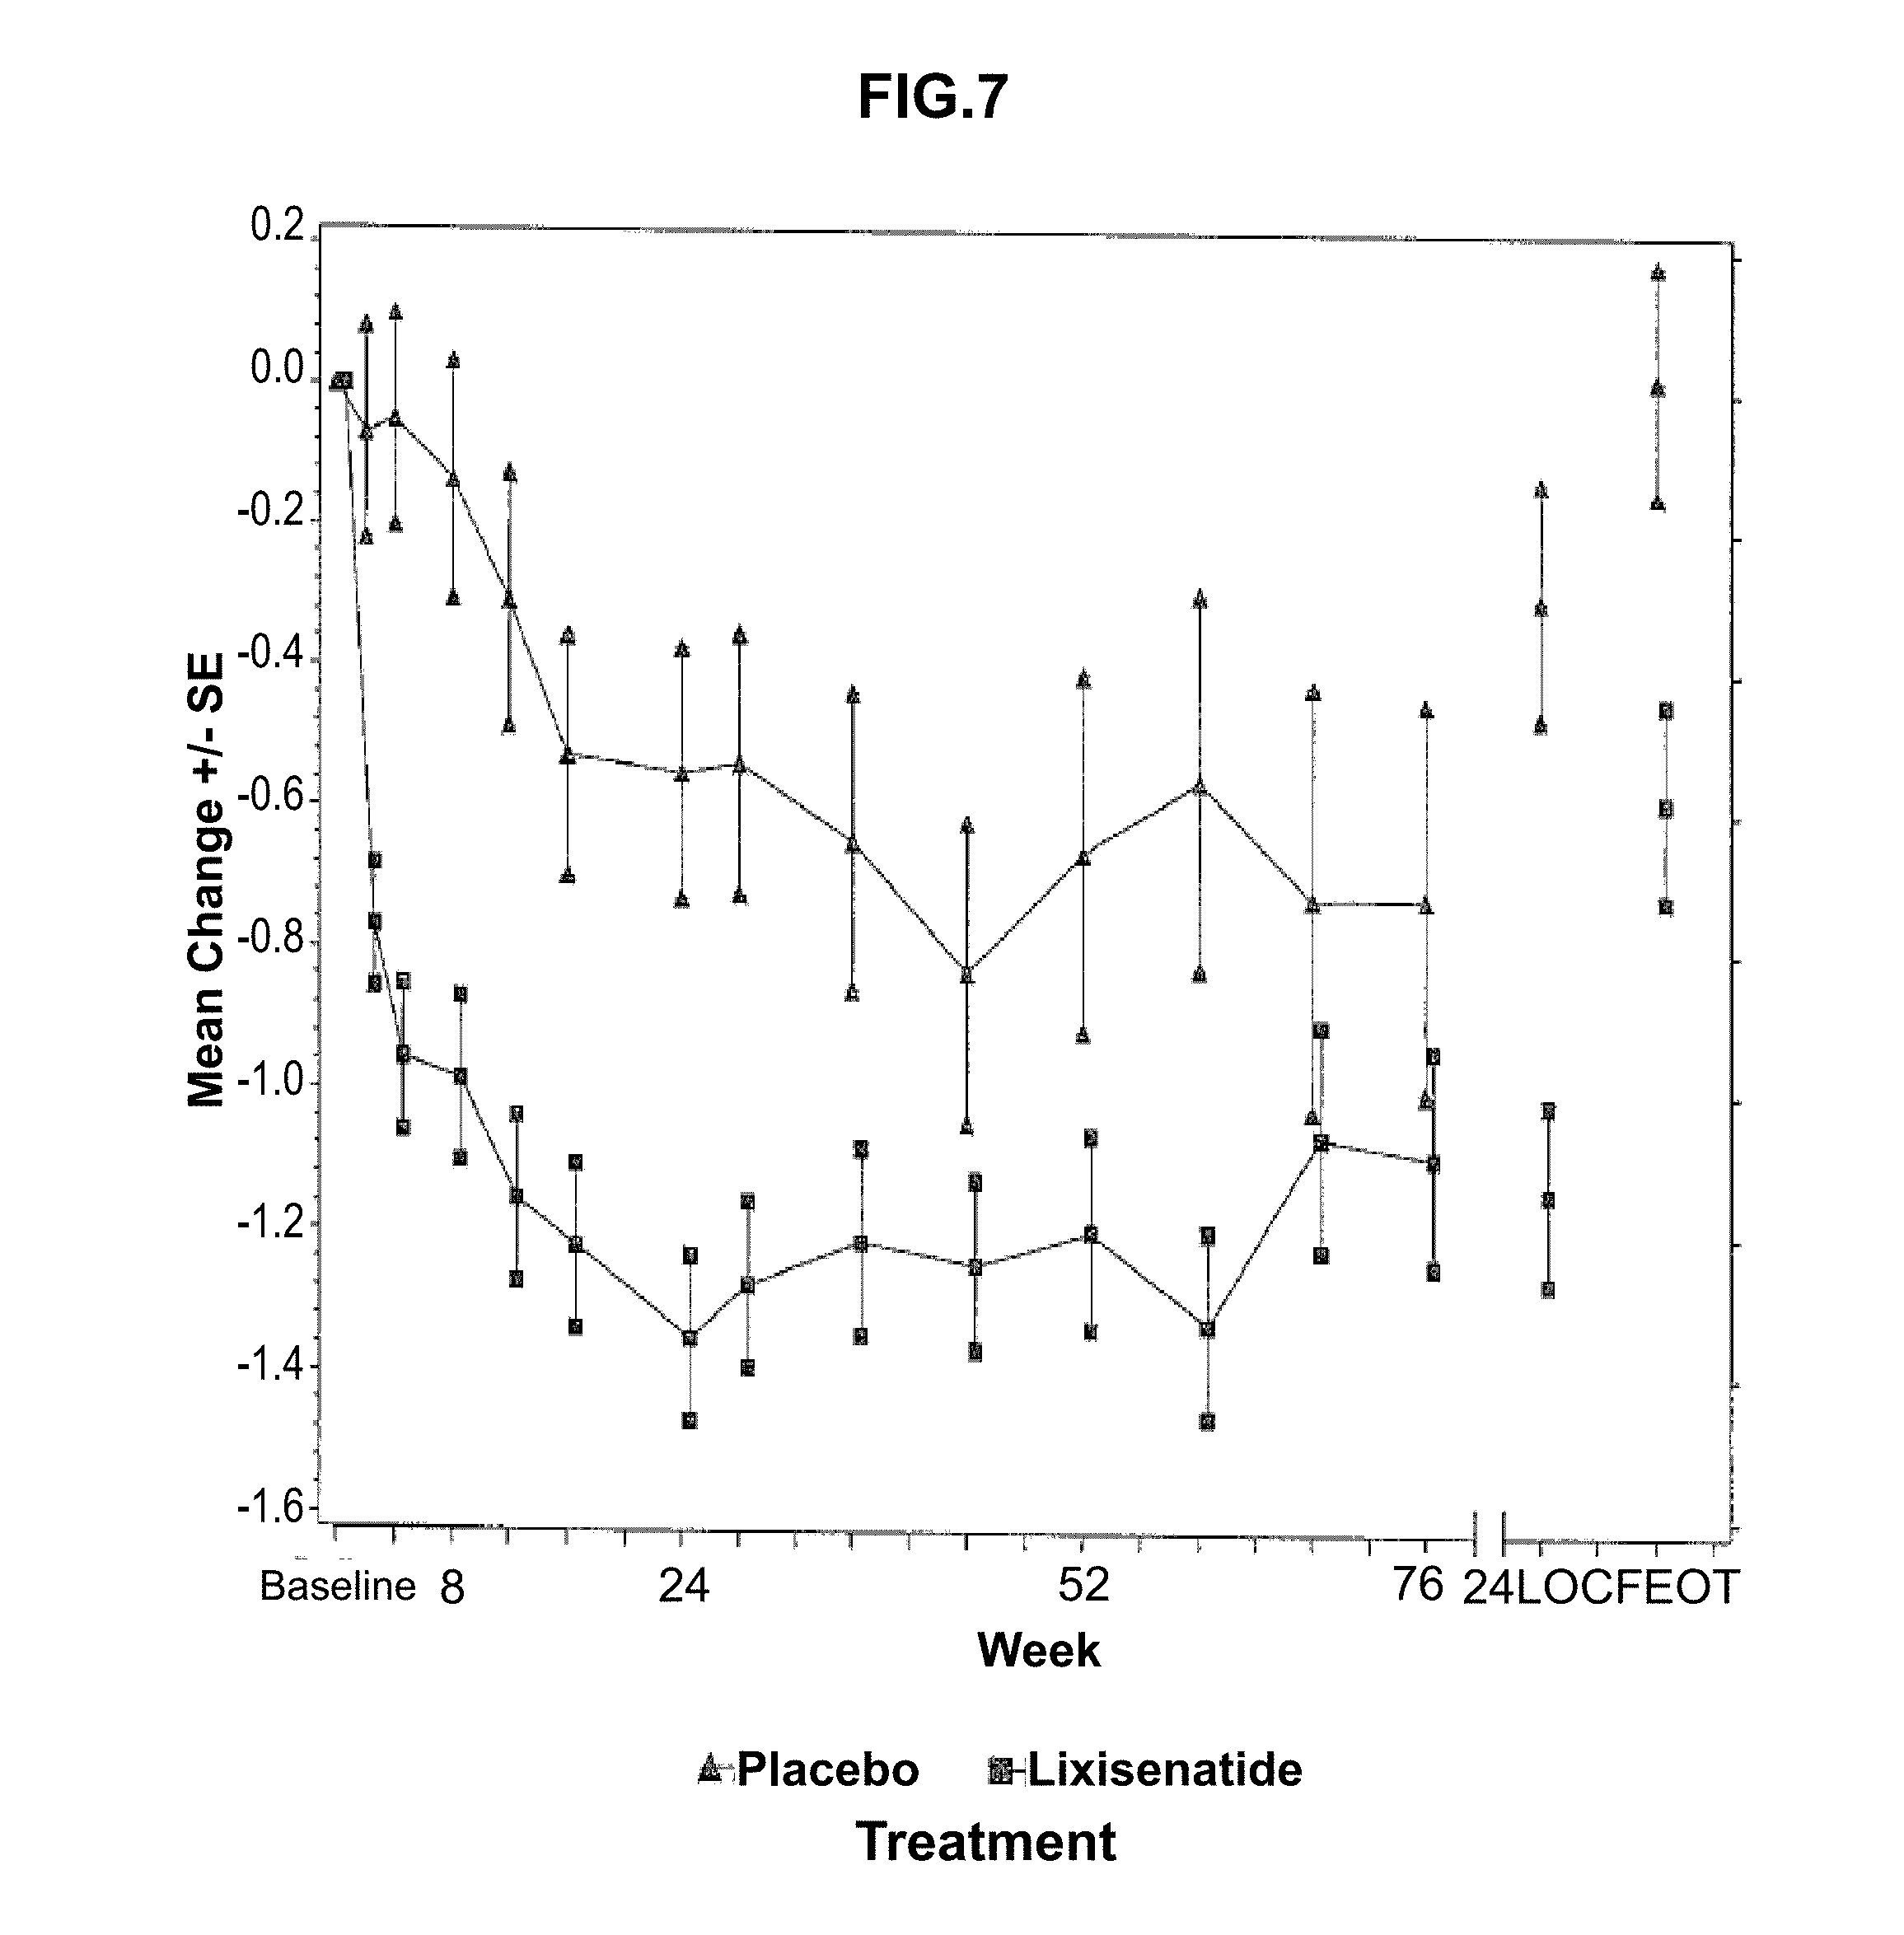
[0073] FIG. 7--Plot of mean change in fasting plasma glucose (mmol/L) from baseline by visit--mITT population. LOCF=Last observation carried forward, EOT=Last on-treatment value. Note: The analysis excludes measurements obtained after the introduction of rescue medication and/or after the treatment cessation plus 1 day. For Week 24 (LOCF), the analysis includes measurements obtained up to 1 day after the last dose of the double-blind investigational product injection on or before Visit 12 (Week 24), or Day 169 if Visit 12 (Week 24) is not available.
[0074] FIG. 8--Plot of mean change in body weight (kg) from baseline by visit--mITT population. LOCF=Last observation carried forward, EOT=Last on-treatment value. Note: The analysis excludes measurements obtained after the introduction of rescue medication and/or after the treatment cessation plus 3 days. For Week 24 (LOCF), the analysis includes measurements obtained up to 3 days after the last dose of the double-blind investigational product injection on or before Visit 12 (Week 24), or Day 169 if Visit 12 (Week 24) is not available.
EXAMPLE
Summary
[0075] The Example refers to a randomized, double-blind, placebo-controlled, 2-arm, unbalanced design, parallel-group, multicenter, multinational study assessing the efficacy and safety of lixisenatide on top of pioglitazone in patients with type 2 diabetes, not adequately controlled with pioglitazone. The approximate minimum double-blind study duration per patient was 79 weeks (up to 2 weeks screening+1 week run-in +24 weeks main double-blind treatment+variable extension+3 days follow-up).
[0076] The study was conducted in 150 centers in 13 countries. The primary objective of the study was to assess the efficacy of lixisenatide on glycemic control in comparison to placebo as an add-on treatment to pioglitazone in terms of HbA1c reduction (absolute change) over a period of 24 weeks.
[0077] A total of 484 patients were randomized to one of two treatment groups (323 in lixisenatide and 161 in placebo). All randomized patients were exposed to the study treatment. Demographics and baseline characteristics were generally similar across the treatment groups. Five patients (3 on lixisenatide and 2 on placebo) were excluded from the modified intent-to-treat (mITT) population for efficacy analyses due to no post-baseline efficacy data. During the overall study treatment period, 136 (28.1%) patients prematurely discontinued the study treatment (26.0% for lixisenatide and 32.3% for placebo). For the lixisenatide group, the main reason for treatment discontinuation was "other reasons" (10.5% versus 12.4% for placebo) followed by "adverse events" (9.0% versus 8.7% for placebo).
[0078] Efficacy analyses are based on the main 24-week double-blind treatment period. The least squares (LS) mean changes from baseline to Week 24 in HbA1c were -0.90% in the lixisenatide group and -0.34% in the placebo group (LS mean difference vs. placebo=-0.56%; p-value<0.0001). The percentages of patients reaching HbA1c.ltoreq.6.5% or <7% at Week 24 were significantly higher in the lixisenatide group than in the placebo group (for HbA1c.ltoreq.6.5%, 28.9% in the lixisenatide group versus 10.1% in the placebo group; for HbA1c<7%, 52.3% in the lixisenatide group versus 26.4% in the placebo group). The HbA1c responder analysis (HbA1c.ltoreq.6.5% or <7% at Week 24) using Cochran-Mantel-Haenszel (CMH) method also showed a significant treatment difference between lixisenatide and placebo at Week 24 (p-value<0.0001).
[0079] For fasting plasma glucose (FPG), a significant decrease from baseline to Week 24 was observed in the lixisenatide group compared to the placebo group (LS mean difference versus placebo=-0.84 mmol/L; p-value<0.0001). For body weight, the LS mean decrease was 0.21 kg from baseline at Week 24 in the lixisenatide group, compared to a LS mean increase of 0.21 kg in the placebo group, and the difference between the 2 groups was not significant (LS mean difference versus placebo=-0.41 kg). Per the testing strategy for multiplicity adjustment, the inferential testing for the subsequent efficacy variables was exploratory, since the body weight analysis failed to show a statistically significant difference. There is no relevant difference observed in .beta.-cell function assessed by HOMA-.beta. between lixisenatide and placebo with LS mean difference of -0.25 (95% CI: [-6.579 to 6.070]). The percentage of patients requiring rescue therapy at Week 24 was substantially lower in the lixisenatide group (12 patients [3.8%]), compared to the placebo group (18 [11.3%]). For fasting plasma insulin (FPI), the LS mean reduction was greater in the lixisenatide group than in the placebo group with LS mean difference of -9.36 pmol/L (95% CI: [-16.586 to -2.124]).
[0080] Safety analyses are based on the treatment period of the whole study. Lixisenatide was well tolerated. The proportions of patients who experienced treatment emergent adverse events (TEAEs) were 87.9% in the lixisenatide group and 83.2% in the placebo group. No patients in the lixisenatide group died, but 2 patients in the placebo group died. One had a treatment emergent acute myocardial infarction leading to death and the other died due to a post-treatment AE (end stage debility) following respiratory failure with multiorgan failure. The percentage of patients who had serious TEAEs was lower in the lixisenatide group (7.4%) than in the placebo group (9.3%). The most commonly reported TEAEs in the lixisenatide group were nausea (26% versus 13.7% for placebo), followed by nasopharyngitis (16.4% versus 14.9% for placebo) and headache (13.3% versus 11.8% for placebo). During the on-treatment period of the whole study, 23 (7.1%) patients in the lixisenatide group had symptomatic hypoglycemia per protocol definition, compared to 7 (4.3%) in the placebo group. None of the symptomatic hypoglycemia events were severe in intensity. Twenty-two (6.8%) patients in the lixisenatide group and 8 (5.0%) in the placebo group experienced injection site reaction AEs. A total of 12 patients (9 [2.8%] patients in the lixisenatide group and 3 [1.9%] in the placebo group) reported 19 events that were adjudicated as allergic reactions by the Allergic Reaction Assessment Committee (ARAC). Of these, 5 events in 3 patients in the lixisenatide group (1 patient with allergic dermatitis, 1 with urticaria, and 1 with angioedema, anaphylactic reaction, and allergic conjunctivitis) were adjudicated as possibly related to IP. No events were adjudicated as possibly related to IP in the placebo group. No case of pancreatitis or thyroid cancer was reported in the study.
1 OBJECTIVES
1.1 Primary Objective
[0081] The primary objective of this study was to assess the efficacy of lixisenatide on glycemic control in comparison to placebo as an add-on treatment to pioglitazone in type 2 diabetes patients treated with pioglitazone in terms of absolute HbA1c reduction over a period of 24 weeks.
1.2 Key Secondary Objective(s)
[0082] The secondary objectives of this study were: [0083] To assess the effects of lixisenatide on [0084] Percentage of patients reaching HbA1c<7%, [0085] Percentage of patients reaching HbA1c.ltoreq.6.5%, [0086] Fasting Plasma Glucose (FPG), [0087] Body weight, [0088] .beta.-cell function assessed by HOMA-.beta., [0089] Fasting plasma insulin (FPI). [0090] To assess lixisenatide safety and tolerability.
2 TRIAL DESIGN
[0091] This was an unbalanced (2:1), randomized, double-blind, placebo-controlled, 2-arm parallel-group, multicenter, multinational study with an variable extension period comparing lixisenatide treatment with placebo in type 2 diabetes patients (300 patients in lixisenatide arm and 150 patients in placebo arm). The study was double-blind with regard to active and placebo treatments. The study drug volume (i.e. dose of active drug or matching placebo) was not blinded. The patients were stratified by screening values of HbA1c (<8%, .gtoreq.8%) and metformin use (Yes, No) at screening.
[0092] The approximate minimum double-blind study duration per patient was 79 weeks (up to 2 weeks screening+1 week run-in +24 weeks main double-blind treatment+variable extension+3 days follow-up). Patients who had completed the 24-week main double-blind period underwent a variable double blind extension period, which ended for all patients approximately at the scheduled date of week 76 visit (V25) for the last randomized patient.
[0093] The trial design is illustrated by FIG. 1.
3 PRIMARY AND KEY SECONDARY ENDPOINTS
3.1 Primary Endpoint
[0094] The primary efficacy variable was the absolute change in HbA1c from baseline to Week 24, which was defined as: HbA1c value at Week 24--HbA1c value at baseline.
[0095] If a patient permanently discontinued the treatment or received rescue therapy during the main 24-week double-blind treatment period or did not have HbA1c value at Week 24, the last post-baseline HbA1c measurement during the main 24-week double-blind on-treatment period was used as HbA1c value at Week 24 (last observation carried forward [LOCF] procedure).
3.2 Key Secondary Endpoints
3.2.1 Key Secondary Efficacy Endpoints
[0096] For secondary efficacy variables, the same procedure for handling missing assessments/early discontinuation was applied as for the primary efficacy variable.
Continuous Variables:
[0097] Change in FPG (mmol/L) from baseline to Week 24, [0098] Change in body weight (kg) from baseline to Week 24, [0099] Change in .beta.-cell function assessed by HOMA-.beta. from baseline to Week 24, [0100] Change in FPI (pmol/L) from baseline to Week 24.
Categorical Variables:
[0100] [0101] Percentage of patients with HbA1c<7% at Week 24, [0102] Percentage of patients with HbA1c.gtoreq.6.5% at Week 24, [0103] Percentage of patients requiring rescue therapy during the main 24-week double-blind treatment period, [0104] Percentage of patients with .gtoreq.5% weight loss (kg) from baseline at Week 24.
3.2.2 Safety Endpoints
[0105] The safety analysis was based on the reported TEAEs and other safety information including symptomatic hypoglycemia and severe symptomatic hypoglycemia, local tolerability at injection site, allergic events (as adjudicated by ARAC), suspected pancreatitis, increased calcitonin, vital signs, 12-lead ECG and laboratory tests.
[0106] Major cardiovascular events were also collected and adjudicated in a blinded manner by a Cardiovascular events Adjudication Committee (CAC). The adjudicated and confirmed events by CAC from this study and other lixisenatide phase 3 studies will be pooled for analyses and summarized in a separate report based on the statistical analysis plan for the overall cardiovascular assessment of lixisenatide. The KRM/CSR will not present the summary of the adjudicated and confirmed CV events from this study.
4 SAMPLE SIZE CALCULATION ASSUMPTIONS
[0107] The sample size/power calculations were performed based on the primary variable, absolute change from baseline to Week 24 in HbA1c.
[0108] Three-hundred (300) patients in the lixisenatide treatment and 150 in the placebo treatment arm provided a power of 96% (or 86%) to detect differences of 0.5% (or 0.4%) in the absolute change from baseline to Week 24 in HbA1c between the lixisenatide group and the placebo group. This calculation assumed a common standard deviation of 1.3% with a 2-sided test at the 5% significance level. The sample size calculations were based upon the 2-sample t-test and made using nQuery Advisor.RTM. 5.0. Standard deviation was estimated in a conservative manner from previously conducted diabetes studies (based on published data of similarly designed study and on internal data, not published), taking into account early dropout.
5 STATISTICAL METHODS
5.1 Analysis Populations
[0109] The modified intent-to-treat (mITT) population consisted of all randomized patients who received at least 1 dose of double-blind investigational product (IP), and had both a baseline assessment and at least 1 post-baseline assessment of efficacy variables.
[0110] The safety population was defined as all randomized patients who took at least one dose of the double-blind IP.
5.2 Primary Efficacy Analysis
[0111] The primary efficacy variable (change in HbA1c from baseline to Week 24) was analyzed using an analysis of covariance (ANCOVA) model with treatment groups (lixisenatide and placebo), randomization strata of screening HbA1c (<8.0, .gtoreq.8.0%), randomization strata of metformin use (Yes, No) at screening, and country as fixed effects and the baseline HbA1c value as a covariate.
[0112] Both means and adjusted means for lixisenatide and placebo were provided, as well as 95% confidence intervals (CI) constructed for adjusted mean differences between lixisenatide and placebo. Difference between lixisenatide and placebo and two-sided 95% confidence interval, as wells as p-value were estimated within the framework of ANCOVA.
[0113] The primary analysis of the primary efficacy variable was performed based on the mITT population and the measurements obtained during the main 24-week double-blind on-treatment period for efficacy variables. The main 24-week double-blind on-treatment period for efficacy analysis was the time from the first dose of the double-blind IP up to 3 days (except for FPG and FPI, which was up to 1 day) after the last dose of the double-blind IP injection on or before V12/Week 24 visit (or D169 if V12/Week 24 visit is missing), or up to the introduction of the rescue therapy, whichever the earliest. The LOCF procedure was used by taking this last available post-baseline on-treatment HbA1c measurement (before the introduction of rescue therapy) as the HbA1c value at Week 24.
5.3 Key Secondary Efficacy Analysis
[0114] A step down testing procedure was applied in order to ensure the control of type 1 error. Once the primary variable was statistically significant at .alpha.=0.05, the testing procedure was performed to test the following secondary efficacy variables by the following prioritized order. The tests stop as soon as an endpoint was found not statistically significant at .alpha.=0.05. [0115] Change in FPG (mmol/L) from baseline to Week 24, [0116] Change in body weight (kg) from baseline to Week 24, [0117] Change in .beta.-cell function assessed by HOMA-.beta. from baseline to Week 24, [0118] Percentage of patients requiring rescue therapy during the 24-week treatment period, [0119] Change in FPI (mmol/L) from baseline to Week 24.
[0120] All continuous secondary efficacy variables at Week 24 as described in Section 3.2.1 were analyzed using the similar approach and ANCOVA model as described in Section 5.2 for the primary analysis of the primary efficacy endpoint. The adjusted estimates of the treatment mean difference between lixisenatide and placebo and two-sided 95% confidence intervals were provided.
[0121] The following categorical secondary efficacy variables at Week 24 were analyzed using a Cochran-Mantel-Haenszel (CMH) method stratified on randomization strata (screening HbA1c [<8.0, .gtoreq.8.0%] and screening metformin use [Yes, No]): [0122] Percentage of patients with HbA1c<7.0% at Week 24, [0123] Percentage of patients with HbA1c.ltoreq.6.5% at Week 24, [0124] Percentage of patients requiring rescue therapy during the main 24-week double-blind treatment period.
[0125] Number and percentage of patients with .gtoreq.5% weight loss from baseline at Week 24 were presented by treatment groups.
[0126] Results for all efficacy endpoints during the variable extension period and at the end of treatment were to be evaluated by descriptive statistics only.
5.4 Safety Analysis
[0127] The safety analyses were primarily based on the on-treatment period of the whole study. The on-treatment period of the whole study was defined as the time from the first dose of double-blind IP up to 3 days after the last dose of IP administration during the whole study period regardless of rescue status. The 3-day interval was chosen based on the half-life of the IP (approximately 5 times the half-life).
[0128] In addition, the safety analyses for the 24-week double-blind treatment period will be summarized in the CSR.
[0129] The summary of safety results (descriptive statistics or frequency tables) is presented by treatment groups.
6 RESULTS
6.1 Study Patients
6.1.1 Patient Accountability
[0130] The study was conducted in 150 centers in 13 countries (Austria, Canada, France, Germany, Greece, Guatemala, India, Mexico, Peru, Puerto Rico, Romania, Turkey, and United States of America). A total of 906 patients were screened and 484 were randomized to 1 of the 2 treatment groups. The most common reason for non-randomization was HbA1c value out of range at the screening visit as defined per protocol (283 [31.2%] out of 906 screened patients).
[0131] All 484 randomized patients were exposed to the study treatment and 5 patients (3 in the lixisenatide group and 2 in the placebo group) were excluded from mITT population for efficacy analyses due to no post-baseline efficacy data. Table 1 provides the number of patients included in each analysis population.
[0132] Due to his investigator's non-compliance to the clinical protocol and violation of good clinical practices, one patient in the lixisenatide group was discontinued by the sponsor. The patient was exposed for 113 days and included in the analyses for safety and efficacy.
TABLE-US-00002 TABLE 1 Analysis populations - Randomized population Placebo Lixisenatide All (N = 161) (N = 323) (N = 484) Randomized population 161 (100%) 323 (100%) 484 (100%) Efficacy population 159 (98.8%) 320 (99.1%) 479 (99.0%) Modified Intent-to-Treat (mITT) Safety population 161 323 484 Note: The safety patients are tabulated according to treatment actually received (as treated). For the efficacy population, patients are tabulated according to their randomized treatment (as randomized).
6.1.2 Study Disposition
[0133] Table 2 provides the summary of patient disposition for each treatment group. During the overall treatment period, 136 (28.1%) patients prematurely discontinued the study treatment (26.0% for lixisenatide and 32.3% for placebo). In the lixisenatide group, the main reason for treatment discontinuation was "other reasons" (10.5% versus 12.4% for placebo) followed by "adverse events" (9.0% versus 8.7% for placebo).
[0134] Similar results were observed for the 24-week treatment period, where a total of 59 (12.2%) patients prematurely discontinued the study treatment (10.8% for lixisenatide and 14.9% for placebo) with main reasons in the lixisenatide group also being "other reasons" (4.0% versus 5.0% for placebo) and "adverse events" (4.0% versus 5.6% for placebo). The category of "other reasons" were confirmed by investigators to be not AE related, and included but was not limited to personal reasons, schedule conflict, moving, injection not convenient, site closure etc. The time-to-onset of treatment discontinuation due to any reason for the overall treatment period is depicted in FIG. 2. A lower rate of discontinuation was observed in the lixisenatide group during the whole treatment period, as compared to the placebo group. The increase of the rate of discontinuation from around 25 to 100% in the lixisenatide group at the end of the study was due to the patient who had been followed the longest, discontinued at Day 874.
[0135] One patient in the lixisenatide group who discontinued treatment due to "Glycosylated haemoglobin increased" in Table 20 was counted as lack of efficacy in Table 2, while 2 patients in the placebo group who discontinued for AE were not counted in Table 20 because their AEs leading to treatment discontinuation occurred during the pre- or post-treatment period.
TABLE-US-00003 TABLE 2 Patient disposition - Randomized population Placebo Lixisenatide (N = 161) (N = 323) Randomized and treated 161 (100%) 323 (100%) Did not complete 24-week 24 (14.9%) 35 (10.8%) double-blind study treatment Subject's request for 24-week 20 (12.4%) 26 (8.0%) treatment discontinuation Reason for 24-week study treatment 24 (14.9%) 35 (10.8%) discontinuation Adverse event 9 (5.6%) 13 (4.0%) Lack of efficacy 5 (3.1%) 2 (0.6%) Poor compliance to protocol 1 (0.6%) 4 (1.2%) Lost to follow-up 1 (0.6%) 3 (0.9%) Other reasons 8 (5.0%) 13 (4.0%) Did not complete double-blind study 52 (32.3%) 84 (26.0%) treatment Subject's request for treatment 42 (26.1%) 65 (20.1%) discontinuation Reason for study treatment 52 (32.3%) 84 (26.0%) discontinuation Adverse event 14 (8.7%) 29 (9.0%) Lack of efficacy 10 (6.2%) 11 (3.4%) Poor compliance to protocol 6 (3.7%) 6 (1.9%) Lost to follow-up 2 (1.2%) 4 (1.2%) Other reasons 20 (12.4%) 34 (10.5%) Status at last study contact 161 (100%) 323 (100%) Alive 155 (96.3%) 318 (98.5%) Dead 2 (1.2%) 0 Lost to follow-up 4 (2.5%) 5 (1.5%) Note: Percentages are calculated using the number of randomized patients as denominator.
6.1.3 Demographics and Baseline Characteristics
[0136] The demographic and patient baseline characteristics were generally similar across treatment groups for the safety population (Table 3). The median age was 56 years and 52.5% were male. The study population was primarily Caucasian (83.7%) and 67.6% of the safety population had a BMI.gtoreq.30 kg/m.sup.2.
[0137] Disease characteristics including diabetic history were generally comparable between two treatment groups (Table 4). The median duration of diabetes was 7.22 years and the median age at onset of diabetes was 48 years. Patients were on pioglitazone for a median duration of 0.83 years and the median daily dose was 30 mg. At screening, 81% of patients had used metformin with a median duration of 3.37 years and a median daily dose of 2000 mg.
[0138] HbA1c, FPG and HOMA-13 at baseline were generally comparable across treatment groups for the safety population (Table 5). A higher mean body weight at baseline was observed in the placebo group (96.74 kg) compared to the lixisenatide group (92.93 kg). Both the mean and the median of FPI are higher in the placebo group (66.07 pmol/L and 53.78 pmol/L, respectively) compared to the lixisenatide group (63.32 pmol/L and 46.14 pmol/L, respectively). The average HbA1c at baseline was 8.07%.
TABLE-US-00004 TABLE 3 Demographics and patient characteristics at screening or baseline - Safety population Placebo Lixisenatide All (N = 161) (N = 323) (N = 484) Age (years) Number 161 323 484 Mean (SD) 55.3 (9.5) 56.0 (9.5) 55.8 (9.5) Median 55.0 56.0 56.0 Min:Max 28:77 26:82 26:82 Age group (years) [n (%)] Number 161 323 484 <50 41 (25.5%) 66 (20.4%) 107 (22.1%) >=50 to <65 90 (55.9%) 199 (61.6%) 289 (59.7%) >=65 to <75 29 (18.0%) 49 (15.2%) 78 (16.1%) >=75 1 (0.6%) 9 (2.8%) 10 (2.1%) Gender [n (%)] Number 161 323 484 Male 82 (50.9%) 172 (53.3%) 254 (52.5%) Female 79 (49.1%) 151 (46.7%) 230 (47.5%) Race [n (%)] Number 161 323 484 Caucasian/White 132 (82.0%) 273 (84.5%) 405 (83.7%) Black 9 (5.6%) 14 (4.3%) 23 (4.8%) Asian/Oriental 8 (5.0%) 14 (4.3%) 22 (4.5%) Other 12 (7.5%) 22 (6.8%) 34 (7.0%) Ethnicity [n (%)] Number 161 323 484 Hispanic 41 (25.5%) 87 (26.9%) 128 (26.4%) Not Hispanic 120 (74.5%) 236 (73.1%) 356 (73.6%) Screening HbA1c (%) Number 161 322 483 Mean (SD) 8.15 (0.82) 8.15 (0.82) 8.15 (0.82) Median 8.00 8.00 8.00 Min:Max 7.0:10.0 7.0:10.0 7.0:10.0 Randomization strata of screening HbA1c (%) [n (%)] Number 161 323 484 <8 79 (49.1%) 159 (49.2%) 238 (49.2%) .gtoreq.8 82 (50.9%) 164 (50.8%) 246 (50.8%) Randomization strata of metformin use at screening [n (%)] Number 161 323 484 Yes 132 (82.0%) 264 (81.7%) 396 (81.8%) No 29 (18.0%) 59 (18.3%) 88 (18.2%) Baseline BMI (kg/m).sup.2 Number 161 323 484 Mean (SD) 34.44 (7.04) 33.66 (6.71) 33.92 (6.82) Median 33.69 33.59 33.62 Min:Max 21.7:52.8 20.2:62.7 20.2:62.7 Baseline BMI Group (kg/m).sup.2 [n (%)] Number 161 323 484 <30 51 (31.7%) 106 (32.8%) 157 (32.4%) .gtoreq.30 110 (68.3%) 217 (67.2%) 327 (67.6%) BMI = Body Mass Index.
TABLE-US-00005 TABLE 4 Disease characteristics at screening or baseline - Safety population Placebo Lixisenatide All (N = 161) (N = 323) (N = 484) Duration of diabetes (years) Number 161 323 484 Mean (SD) 8.09 (5.58) 8.11 (5.44) 8.10 (5.48) Median 7.27 7.18 7.22 Min:Max 1.0:30.4 0.9:32.1 0.9:32.1 Age at onset of type 2 diabetes (years) Number 161 323 484 Mean (SD) 47.22 (9.41) 47.84 (8.88) 47.63 (9.05) Median 48.00 48.00 48.00 Min:Max 21.0:69.0 20.0:74.0 20.0:74.0 Duration of pioglitazone treatment (years) Number 161 323 484 Mean (SD) 1.79 (2.51) 1.69 (2.00) 1.72 (2.18) Median 0.77 0.87 0.83 Min:Max 0.2:18.3 0.2:11.2 0.2:18.3 Daily dose of pioglitazone (mg) at baseline Number 161 323 484 Mean (SD) 33.26 (6.21) 33.81 (6.64) 33.63 (6.50) Median 30.00 30.00 30.00 Min:Max 30.0:45.0 30.0:60.0 30.0:60.0 Categorized daily dose of pioglitazone at baseline (mg) [n (%)] Number 161 323 484 <30 0 0 0 .gtoreq.30-<45 126 (78.3%) 242 (74.9%) 368 (76.0%) .gtoreq.45 35 (21.7%) 81 (25.1%) 116 (24.0%) Metformin use at screening [n (%)] Number 161 323 484 Yes 131 (81.4%) 261 (80.8%) 392 (81.0%) No 30 (18.6%) 62 (19.2%) 92 (19.0%) Duration of metformin treatment (years) Number 131 261 392 Mean (SD) 4.27 (3.84) 4.34 (3.77) 4.32 (3.79) Median 3.33 3.37 3.37 Min:Max 0.3:20.5 0.2:25.8 0.2:25.8 Daily dose of metformin at baseline (mg) Number 131 261 392 Mean (SD) 1872.90 (273.25) 1895.02 (295.24) 1887.63 (287.92) Median 1700.00 2000.00 2000.00 Min:Max 1500.0:2550.0 1500.0:3000.0 1500.0:3000.0 Categorized daily dose of metformin at baseline (mg) [n (%)] Number 131 261 392 <1500 0 0 0 1500-<2500 119 (90.8%) 236 (90.4%) 355 (90.6%) 2500-<3000 12 (9.2%) 23 (8.8%) 35 (8.9%) .gtoreq.3000 0 2 (0.8%) 2 (0.5%) History of gestational diabetes [n (%)] Number (Female) 79 151 230 Yes (Female) 6 (7.6%) 15 (9.9%) 21 (9.1%) No (Female) 73 (92.4%) 136 (90.1%) 209 (90.9%) Prior use of GLP-1 receptor agonist [n (%)] Number 161 323 484 Yes 5 (3.1%) 17 (5.3%) 22 (4.5%) No 156 (96.9%) 306 (94.7%) 462 (95.5%) Diabetic retinopathy [n (%)] Number 160 323 483 Yes 5 (3.1%) 13 (4.0%) 18 (3.7%) No 151 (94.4%) 303 (93.8%) 454 (94.0%) Unknown 4 (2.5%) 7 (2.2%) 11 (2.3%) Diabetic sensory or motor neuropathy [n (%)] Number 160 323 483 Yes 19 (11.9%) 69 (21.4%) 88 (18.2%) No 140 (87.5%) 251 (77.7%) 391 (81.0%) Unknown 1 (0.6%) 3 (0.9%) 4 (0.8%) Diabetic autonomic neuropathy [n (%)] Number 160 323 483 Yes 5 (3.1%) 3 (0.9%) 8 (1.7%) No 155 (96.9%) 316 (97.8%) 471 (97.5%) Unknown 0 4 (1.2%) 4 (0.8%) Diabetic nephropathy [n (%)] Number 160 323 483 Yes Microalbuminuria 8 (5.0%) 14 (4.3%) 22 (4.6%) Overt proteinuria 5 (3.1%) 10 (3.1%) 15 (3.1%) Impaired renal function 0 1 (0.3%) 1 (0.2%) Dialysis or transplantation 0 1 (0.3%) 1 (0.2%) Unknown 0 0 0 No 3 (1.9%) 2 (0.6%) 5 (1.0%) Unknown 148 (92.5%) 300 (92.9%) 448 (92.8%) 4 (2.5%) 9 (2.8%) 13 (2.7%) Categorized microalbumin at randomization [n (%)] Number 67 139 206 <3 mg/L (Not reportable) 9 (13.4%) 15 (10.8%) 24 (11.7%) .gtoreq.3 mg/L (Reportable) 58 (86.6%) 124 (89.2%) 182 (88.3%) <20 mg/L 37 (55.2%) 84 (60.4%) 121 (58.7%) .gtoreq.20-<200 mg/L 18 (26.9%) 33 (23.7%) 51 (24.8%) .gtoreq.200 mg/L 3 (4.5%) 7 (5.0%) 10 (4.9%) Creatinine clearance at screening (ml/min) Number 158 309 467 Mean (SD) 136.34 (57.86) 128.08 (46.51) 130.88 (50.73) Median 126.32 121.42 122.24 Min:Max 46.7:438.3 38.3:349.5 38.3:438.3 Categorized creatinine clearance at screening [n (%)] Number 158 309 467 <30 ml/min (severe renal impairment) 0 0 0 .gtoreq.30-<50 ml/min (moderate renal impairment) 1 (0.6%) 5 (1.6%) 6 (1.3%) .gtoreq.50-.ltoreq.80 ml/min (mild renal impairment) 15 (9.5%) 28 (9.1%) 43 (9.2%) >80 ml/min (no renal impairment) 142 (89.9%) 276 (89.3%) 418 (89.5%) GLP-1 = Glucagon like peptide-1. Creatinine clearance value is derived using the equation of Cockcroft and Gault.
TABLE-US-00006 TABLE 5 Baseline efficacy variables - Safety population Placebo Lixisenatide All (N = 161) (N = 323) (N = 484) HbA1c (%) Number 161 323 484 Mean (SD) 8.06 (0.79) 8.08 (0.90) 8.07 (0.86) Median 7.90 7.90 7.90 Min:Max 6.5:10.2 6.5:12.7 6.5:12.7 FPG (mmol/L) Number 161 323 484 Mean (SD) 9.13 (2.20) 9.11 (2.15) 9.12 (2.16) Median 8.70 8.80 8.80 Min:Max 4.7:17.9 4.5:17.2 4.5:17.9 Weight (kg) Number 161 323 484 Mean (SD) 96.74 (25.58) 92.93 (22.90) 94.20 (23.87) Median 92.90 92.00 92.20 Min:Max 45.0:198.3 48.5:162.7 45.0:198.3 FPI (pmol/L) Number 142 300 442 Mean (SD) 66.07 (48.12) 63.32 (57.69) 64.21 (54.76) Median 53.78 46.14 48.72 Min:Max 4.9:356.1 9.4:635.7 4.9:635.7 HOMA-.beta. Number 141 300 441 Mean (SD) 36.23 (26.50) 34.69 (30.30) 35.18 (29.12) Median 29.29 26.52 27.49 Min:Max 1.1:157.6 3.8:276.3 1.1:276.3 FPG = Fasting Plasma Glucose; FPI = Fasting Plasma Insulin.
6.1.4 Dosage and Duration
[0139] The average treatment exposure was 560.2 days (80 weeks) in the lixisenatide group, compared to 518.6 days (74 weeks) in the placebo group (Table 6). Of 323 lixisenatide treated patients, 286 (88.5%) were exposed to IP for 24 weeks (169 days) or longer, and 199 (61.6%) were exposed for 18 months (547 days) or longer. Five patients did not record the last administration date on CRF page "End of treatment" and hence their duration of exposure was set to missing following the SAP data handling convention.
[0140] At the end of double-blind treatment, 92.3% of patients reached the target daily dose of 20 .mu.g in the lixisenatide group, lower than the placebo group (97.5%) (Table 7). Similar result was observed at the end of 24-week double-blind treatment period (92.6% for lixisenatide versus 98.8% for placebo) (Table 8). The dose at the end of titration is presented in Table 28.
TABLE-US-00007 TABLE 6 Exposure to investigational product - Safety population Placebo Lixisenatide (N = 161) (N = 323) Cumulative duration of 225.8 490.8 treatment exposure (patient years) Duration of study treatment (days) Number 159 320 Mean (SD) 518.6 (232.5) 560.2 (226.2) Median 588.0 615.5 Min:Max 3:925 6:874 Duration of study treatment by category [n (%)] Missing duration 2 (1.2%) 3 (0.9%) 1-14 days 1 (0.6%) 7 (2.2%) 15-28 days 1 (0.6%) 6 (1.9%) 29-56 days 5 (3.1%) 8 (2.5%) 57-84 days 7 (4.3%) 3 (0.9%) 85-168 days 9 (5.6%) 10 (3.1%) 169-364 days 16 (9.9%) 25 (7.7%) 365-546 days 23 (14.3%) 62 (19.2%) 547-728 days 76 (47.2%) 126 (39.0%) >728 days 21 (13.0%) 73 (22.6%) Cumulative duration of study treatment by category [n (%)] Missing duration 2 (1.2%) 3 (0.9%) .gtoreq.1 day 159 (98.8%) 320 (99.1%) .gtoreq.15 days 158 (98.1%) 313 (96.9%) .gtoreq.29 days 157 (97.5%) 307 (95.0%) .gtoreq.57 days 152 (94.4%) 299 (92.6%) .gtoreq.85 days 145 (90.1%) 296 (91.6%) .gtoreq.169 days 136 (84.5%) 286 (88.5%) .gtoreq.365 days 120 (74.5%) 261 (80.8%) .gtoreq.547 days 97 (60.2%) 199 (61.6%) .gtoreq.729 days 21 (13.0%) 73 (22.6%) Duration of exposure = (date of the last double-blind investigational product injection - date of the first double-blind investigational product injection) + 1.
TABLE-US-00008 TABLE 7 Number (%) of patients by final total daily dose at the end of the double-blind treatment - Safety population Placebo Lixisenatide Final dose (N = 161) (N = 323) <10 .mu.g 1 (0.6%) 0 10 .mu.g 2 (1.2%) 10 (3.1%) 15 .mu.g 1 (0.6%) 15 (4.6%) 20 .mu.g 157 (97.5%) 298 (92.3%) Dose = Dose of active drug or volume-matched placebo. Note: Percentages are calculated using the number of safety patients as the denominator.
TABLE-US-00009 TABLE 8 Number (%) of patients by final total daily dose at the end of 24-week treatment - Safety population Dose at the end of the 24- Placebo Lixisenatide week (N = 161) (N = 323) 10 .mu.g 1 (0.6%) 10 (3.1%) 15 .mu.g 1 (0.6%) 14 (4.3%) 20 .mu.g 159 (98.8%) 299 (92.6%) Dose = Dose of active drug or volume-matched placebo. Note: Percentages are calculated using the number of safety patients as the denominator.
6.2 Efficacy
6.2.1 Primary Efficacy Endpoint
Main Analysis
[0141] Table 9 summarizes the results of the primary efficacy parameter, change from baseline to Week 24 (LOCF) in HbA1c using an ANCOVA analysis.
[0142] The pre-specified primary analysis showed that treatment with lixisenatide resulted in a statistically significant decrease in HbA1c from baseline to Week 24, compared with the placebo group (LS mean-difference versus the placebo group=-0.56%; p-value<0.0001).
TABLE-US-00010 TABLE 9 Mean change in HbA1c (%) from baseline to Week 24 - mITT population Placebo Lixisenatide HbA1c (%) (N = 159) (N = 320) Baseline Number 148 308 Mean (SD) 8.05 (0.78) 8.08 (0.91) Median 7.90 7.90 Min:Max 6.5:10.2 6.5:12.7 Week 24 (LOCF) Number 148 308 Mean (SD) 7.59 (0.96) 7.06 (0.96) Median 7.40 6.90 Min:Max 5.5; 10.4 5.3:11.3 Change from baseline to week 24 (LOCF) Number 148 308 Mean(SD) -0.46 (1.00) -1.02 (1.09) Median -0.40 -0.90 Min:Max -4.0:2.5 -5.4:3.5 LS Mean (SE).sup.a -0.34 (0.100) -0.90 (0.089) LS Mean difference (SE) vs. -0.56 (0.088) Placebo.sup.a 95% CI (-0.731 to -0.386) p-value <.0001 LOCF = Last observation carried forward. .sup.aAnalysis of covariance (ANCOVA) model with treatment groups (lixisenatide and placebo), randomization strata of screening HbA1c (<8.0, .gtoreq.8.0%), randomization strata of metformin use at screening, and country as fixed effects and baseline HbA1c value as a covariate. Note: The analysis includes measurements before the introduction of rescue medication and up to 3 days after the last dose of the double-blind investigational product injection on or before Visit 12 (Week 24), or Day 169 if Visit 12 (Week 24) is not available. Patients with both baseline and Week 24 (LOCF) measurements are included.
[0143] FIG. 3 illustrates the mean (.+-.SE) change from baseline in HbA1c over time during the main 24-week double-blind treatment period. FIG. 6 in the appendix displays the mean (.+-.SE) change from baseline in HbA1c over time up to Week 76. The reduction of HbA1c was maintained over time beyond 24 weeks.
Secondary Analysis
[0144] Table 10 summarizes the proportion of patients with treatment response HbA1c<6.5% or <7% at Week 24, respectively. The analysis of HbA1c responders using the CMH method showed a statistically significant treatment difference between the lixisenatide group and the placebo group (p-value<0.0001).
TABLE-US-00011 TABLE 10 Number (%) of patients with HbA1c value 6.5% or <7% respectively at Week 24 - mITT population Placebo Lixisenatide HbA1c (%) (N = 159) (N = 320) Number 148 308 .ltoreq.6.5% 15 (10.1%) 89 (28.9%) >6.5% 133 (89.9%) 219 (71.1%) p-value vs. placebo.sup.a <0.0001 Number 148 308 <7.0% 39 (26.4%) 161 (52.3%) .gtoreq.7.0% 109 (73.6%) 147 (47.7%) p-value vs. placebo.sup.a <0.0001 .sup.aCochran-Mantel-Haenszel (CMH) method stratified by randomization strata of screening HbA1c (<8.0 or .gtoreq.8.0%) and randomization strata of metformin use at screening (Yes or No). Note: The analysis includes measurements before the introduction of rescue medication and up to 3 days after the last dose of the double-blind investigational product injection on or before Visit 12 (Week 24), or Day 169 if Visit 12 (Week 24) is not available.
6.2.2 Key Secondary Efficacy Endpoints
[0145] The ANCOVA analyses of FPG, body weight, HOMA-.beta. and FPI are presented in this section. FIG. 4 and FIG. 5 illustrate the mean (.+-.SE) change from baseline in FPG and body weight over time during the main 24-week double-blind treatment period. Mean (.+-.SE) changes from baseline in FPG and body weight over time up to Week 76 are depicted in FIG. 7 and FIG. 8 in the appendix respectively. The percentage of patients who were rescued during the main 24 week double-blind treatment period is presented in Table 15.
[0146] For FPG, a significant decrease from baseline to Week 24 was observed in the lixisenatide group compared to the placebo group (LS mean difference versus placebo=-0.84 mmol/L; p-value<0.0001) (Table 11).
[0147] For body weight, the LS mean decrease was 0.21 kg from baseline at Week 24 in the lixisenatide group, compared to a LS mean increase of 0.21 kg in the placebo group, but the difference between the 2 groups was not significant (LS mean difference versus placebo=-0.41 kg) (Table 12). About 9.2% patients in the lixisenatide group and 5.1% in the placebo group had 5% weight loss from baseline to Week 24 (Table 13).
[0148] Per the testing strategy for multiplicity adjustment, the inferential testing for the subsequent efficacy variables was exploratory, since the body weight analysis failed to show a statistically significant difference.
[0149] For .beta.-cell function assessed by HOMA-.beta., no relevant difference was observed between lixisenatide and placebo with LS mean difference of -0.25 (95% CI: [-6.579 to 6.070]) (Table 14).
[0150] The percentage of patients requiring rescue therapy at Week 24 was substantially lower in the lixisenatide group (12 patients [3.8%]) compared to the placebo group (18 patients [11.3%]) (Table 15).
[0151] For FPI, the LS mean reduction was greater in the lixisenatide group than in the placebo group with LS mean difference of -9.36 pmol/L (95% CI: [-16.586 to -2.124]) (Table 16).
TABLE-US-00012 TABLE 11 Mean change in fasting plasma glucose (mmol/L) from baseline to Week 24 - mITT population Placebo Lixisenatide Fasting plasma glucose (mmol/L) (N = 159) (N = 320) Baseline Number 159 317 Mean (SD) 9.12 (2.19) 9.14 (2.15) Median 8.70 8.80 Min:Max 4.7:17.9 4.5:17.2 Week 24 (LOCF) Number 159 317 Mean (SD) 8.82 (2.32) 8.00 (2.29) Median 8.50 7.70 Min:Max 3.8:16.9 4.5:27.6 Change from baseline to week 24 (LOCF) Number 159 317 Mean (SD) -0.30 (2.12) -1.14 (2.24) Median -0.40 -1.10 Min:Max -7.0:6.0 -9.6:17.6 LS Mean (SE).sub.a -0.32 (0.215) -1.16 (0.192) LS Mean difference (SE) vs. -0.84 (0.189) Placebo.sub.a 95% CI (-1.209 to -0.467) p-value <.0001 LOCF = Last observation carried forward. .sub.aAnalysis of covariance (ANCOVA) model with treatment groups (lixisenatide and placebo), randomization strata of screening HbA1c (<8.0, .gtoreq.8.0%), metformin use at screening (Yes, No), and country as fixed effects and baseline fasting plasma glucose as a covariate. Note: The analysis includes measurements before the introduction of rescue medication and up to 1 day after the last dose of the double-blind investigational product injection on or before Visit 12 (Week 24), or Day 169 if Visit 12 (Week 24) is not available. Patients with both baseline and Week 24 (LOCF) measurements are included.
TABLE-US-00013 TABLE 12 Mean change in body weight (kg) from baseline to Week 24 - mITT population Placebo Lixisenatide Body weight (kg) (N = 159) (N = 320) Baseline Number 157 315 Mean (SD) 97.03 (25.81) 92.83 (23.01) Median 93.00 92.00 Min:Max 45.0:198.3 48.5:162.7 Week 24 (LOCF) Number 157 315 Mean(SD) 97.14 (26.19) 92.38 (23.17) Median 94.00 92.00 Min:Max 45.1:199.6 46.5:167.1 Change from baseline to week 24 (LOCF) Number 157 315 Mean (SD) 0.12 (3.24) -0.44 (3.17) Median 0.00 -0.50 Min:Max -11.9:11.7 -12.6:9.8 LS Mean (SE).sup.a 0.21 (0.357) -0.21 (0.324) LS Mean difference (SE) vs. -0.41 (0.314) Placebo.sup.a 95% CI (-1.031 to 0.201) p-value 0.1864 LOCF = Last observation carried forward. .sup.aAnalysis of covariance (ANCOVA) model with treatment groups (lixisenatide and placebo), randomization strata of screening HbA1c (<8.0, .gtoreq.8.0%), metformin use at screening (Yes, No), and country as fixed effects and baseline body weight as a covariate. Note: The analysis includes measurements before the introduction of rescue medication and up to 3 days after the last dose of the double-blind investigational product injection on or before Visit 12 (Week 24), or Day 169 if Visit 12 (Week 24) is not available. Patients with both baseline and Week 24 (LOCF) measurements are included.
TABLE-US-00014 TABLE 13 Number (%) of patients with 5% weight loss from baseline to Week 24 - mITT population Placebo Lixisenatide Weight loss (N = 159) (N = 320) Number 157 315 .gtoreq.5% 8 (5.1%) 29 (9.2%) <5% 149 (94.9%) 286 (90.8%) The analysis includes measurements before the introduction of rescue medication and up to 3 days after the last dose of the double-blind investigational product injection on or before Visit 12 (Week 24), or Day 169 if Visit 12 (Week 24) is not available.
TABLE-US-00015 TABLE 14 Mean change in HOMA-beta from baseline to Week 24 - mITT population Placebo Lixisenatide HOMA-.beta. (N = 159) (N = 320) Baseline Number 124 281 Mean (SD) 37.37 (26.24) 33.93 (27.49) Median 30.03 26.27 Min:Max 1.1:157.6 3.8:206.8 Week 24 (LOCF) Number 124 281 Mean(SD) 44.26 (41.19) 42.48 (30.87) Median 34.23 33.21 Min:Max 2.0:356.7 3.6:208.9 Change from baseline to week 24 (LOCF) Number 124 281 Mean(SD) 6.88 (36.07) 8.55 (27.98) Median 3.70 7.26 Min:Max -63.9:328.5 -140.1:163.1 LS Mean (SE).sup.a 6.98 (3.575) 6.72 (2.963) LS Mean difference (SE) vs. Placebo.sup.a -0.25 (3.217) 95% CI (-6.579 to 6.070) p-value 0.9369 LOCF = Last observation carried forward. .sup.aAnalysis of covariance (ANCOVA) model with treatment groups (lixisenatide and placebo), randomization strata of screening HbA1c (<8.0, .gtoreq.8.0%), metformin use at screening (Yes, No), and country as fixed effects and baseline HOMA-.beta. value as a covariate. Note: The analysis includes measurements before the introduction of rescue medication and up to 1 day after the last dose of the double-blind investigational product injection on or before Visit 12 (Week 24), or Day 169 if Visit 12 (Week 24) is not available. Patients with both baseline and Week 24 (LOCF) measurements are included.
TABLE-US-00016 TABLE 15 Number (%) of patients requiring rescue therapy during the main 24-week double-blind treatment period - mITT population Placebo Lixisenatide Requiring rescue therapy (N = 159) (N = 320) Number 159 320 Yes 18 (11.3%) 12 (3.8%) No 141 (88.7%) 308 (96.3%) p-value vs. placebo.sup.a 0.0011 .sup.aCochran-Mantel-Haenszel (CMH) method stratified by randomization strata of screening HbA1c (<8.0 or .gtoreq.8.0%) and metformin use at screening (Yes, No).
TABLE-US-00017 TABLE 16 Mean change in fasting plasma insulin (pmol/L) from baseline to Week 24 - mITT population Placebo Lixisenatide Fasting plasma insulin (pmol/L) (N = 159) (N = 320) Baseline Number 125 281 Mean (SD) 68.08 (49.25) 62.66 (56.88) Median 56.25 45.99 Min:Max 4.9:356.1 9.4:635.7 Week 24 (LOCF) Number 125 281 Mean (SD) 67.41 (47.06) 57.11 (36.28) Median 56.68 48.14 Min:Max 9.5:274.9 7.7:358.8 Change from baseline to Week 24 (LOCF) Number 125 281 Mean (SD) -0.67 (40.70) -5.55 (51.84) Median -1.65 0.65 Min:Max -143.9:186.8 -517.1:199.3 LS Mean (SE).sup.a -1.01 (4.080) -10.36 (3.397) LS Mean difference (SE) vs. -9.36 (3.678) Placebo.sup.a 95% CI (-16.586 to -2.124) p-value 0.0114 LOCF = Last observation carried forward. .sup.aAnalysis of covariance (ANCOVA) model with treatment groups (lixisenatide and placebo), randomization strata of screening HbA1c (<8.0, .gtoreq.8.0%), randomization strata of metformin use at screening (Yes, No), and country as fixed effects and baseline fasting plasma insulin value as a covariate. The analysis includes measurements before the introduction of rescue medication and up to 1 day after the last dose of the double-blind investigational product injection on or before Visit 12 (Week 24), or Day 169 if Visit 12 (Week 24) is not available. Patients with both baseline and Week 24 (LOCF) measurements are included.
6.3 Safety
[0152] An overview of the adverse events observed during the on-treatment period for the whole study is provided in Table 17. The proportions of patients who experienced treatment emergent adverse events (TEAEs) were 87.9% in the lixisenatide group and 83.2% in the placebo group. No patients in the lixisenatide group died, but 2 patients in the placebo group died. One had a treatment emergent acute myocardial infarction leading to death and the other died due to a post-treatment AE (end stage debility) following respiratory failure with multiorgan failure. The percentage of patients who had serious TEAEs was lower in the lixisenatide group (7.4%) than in the placebo group (9.3%). Higher percentage of patients in the lixisenatide group (9.3%) experienced TEAEs leading to treatment discontinuation than in the placebo group (7.5%). Table 18, Table 19, and Table 20 summarize TEAEs leading to death, serious TEAEs, and TEAEs leading to treatment discontinuation by primary SOC, HLGT, HLT and PT, respectively. The most common TEAE leading to treatment discontinuation was nausea in the lixisenatide group (6 patients [1.9%]) while no patient discontinued treatment due to nausea in the placebo group.
[0153] Table 30 in the appendix presents the incidences of TEAEs during the on-treatment period of the whole study occurring in at least 1% of patients in any treatment group. Nausea was the most frequently reported TEAE in the lixisenatide group (84 patients [26.0%] versus 22 [13.7%] for placebo). The second most frequently reported TEAE in the lixisenatide group was nasopharyngitis (53 [16.4%] versus 24 [14.9%] for placebo) followed by headache (43 [13.3%] versus 19 [11.8%] for placebo), upper respiratory tract infection (41 [12.7%] versus 18 [11.2%] for placebo), diarrhoea (35 [10.8%] versus 23 [14.3%] for placebo), and dizziness (33 [10.2%] versus 13 [8.1%] for placebo).
TABLE-US-00018 TABLE 17 Overview of adverse event profile: treatment emergent adverse events during the on-treatment period of the whole study - Safety population Placebo Lixisenatide (N = 161) (N = 323) Patients with any TEAE 134 (83.2%) 284 (87.9%) Patients with any serious TEAE 15 (9.3%) 24 (7.4%) Patients with any TEAE leading to death 1 (0.6%) 0 Patients with any TEAE leading to 12 (7.5%) 30 (9.3%) permanent treatment discontinuation TEAE: Treatment Emergent Adverse Event n (%) = number and percentage of patients with at least one adverse event Note: on-treatment period of the whole study = the time from the first dose of double-blind study medication up to 3 days after the last dose administration
TABLE-US-00019 TABLE 18 Number (%) of patients experiencing TEAE(s) leading to death by primary SOC, HLGT, HLT, and PT during the on-treatment period of the whole study - Safety population PRIMARY SYSTEM ORGAN CLASS HLGT: High Level Group Term HLT: High Level Term Placebo Lixisenatide Preferred Term (N = 161) (N = 323) CARDIAC DISORDERS 1 (0.6%) 0 HLGT: Coronary artery disorders 1 (0.6%) 0 HLT: Ischaemic coronary artery disorders 1 (0.6%) 0 Acute myocardial infarction 1 (0.6%) 0 TEAE: Treatment Emergent Adverse Event, SOC: System Organ Class, HLGT: High Level Group Term, HLT: High Level Term, PT: Preferred Term. MedDRA. version: 14.0. n (%) = number and percentage of patients with at least one TEAE leading to death. Note: on-treatment period of the whole study = the time from the first dose of double-blind study medication up to 3 days after the last dose administration. Table sorted by SOC internationally agreed order and HLGT, HLT, PT alphabetic order.
TABLE-US-00020 TABLE 19 Number (%) of patients experiencing serious TEAE presented by primary SOC, HLGT, HLT, and PT during the on-treatment period of the whole study - Safety population PRIMARY SYSTEM ORGAN CLASS HLGT: High Level Group Term HLT: High Level Term Placebo Lixisenatide Preferred Term (N = 161) (N = 323) Any class 15 (9.3%) 24 (7.4%) INFECTIONS AND INFESTATIONS 3 (1.9%) 5 (1.5%) HLGT: Bacterial infectious disorders 1 (0.6%) 0 HLT: Bacterial infections NEC 1 (0.6%) 0 Cellulitis 1 (0.6%) 0 HLGT: Infections - pathogen unspecified 3 (1.9%) 5 (1.5%) HLT: Abdominal and gastrointestinal infections 0 1 (0.3%) Appendicitis 0 1 (0.3%) HLT: Lower respiratory tract and lung infections 3 (1.9%) 2 (0.6%) Bronchitis 1 (0.6%) 1 (0.3%) Pneumonia 2 (1.2%) 1 (0.3%) HLT: Skin structures and soft tissue infections 0 1 (0.3%) Diabetic foot infection 0 1 (0.3%) HLT: Urinary tract infections 0 1 (0.3%) Urinary tract infection 0 1 (0.3%) NEOPLASMS BENIGN, MALIGNANT AND UNSPECIFIED 1 (0.6%) 1 (0.3%) (INCL CYSTS AND POLYPS) HLGT: Hepatobiliary neoplasms malignant and unspecified 1 (0.6%) 0 HLT: Bile duct neoplasms malignant 1 (0.6%) 0 Bile duct cancer 1 (0.6%) 0 HLGT: Respiratory and mediastinal neoplasms malignant and 0 1 (0.3%) unspecified HLT: Non-small cell neoplasms malignant of the respiratory 0 1 (0.3%) tract cell type specified Non-small cell lung cancer 0 1 (0.3%) METABOLISM AND NUTRITION DISORDERS 1 (0.6%) 0 HLGT: Glucose metabolism disorders (incl diabetes mellitus) 1 (0.6%) 0 HLT: Hyperglycaemic conditions NEC 1 (0.6%) 0 Hyperglycaemia 1 (0.6%) 0 NERVOUS SYSTEM DISORDERS 1 (0.6%) 3 (0.9%) HLGT: Central nervous system vascular disorders 0 2 (0.6%) HLT: Central nervous system haemorrhages and 0 1 (0.3%) cerebrovascular accidents Cerebral infarction 0 1 (0.3%) HLT: Transient cerebrovascular events 0 1 (0.3%) Transient ischaemic attack 0 1 (0.3%) HLGT: Mental impairment disorders 1 (0.6%) 0 HLT: Memory loss (excl dementia) 1 (0.6%) 0 Memory impairment 1 (0.6%) 0 HLGT: Spinal cord and nerve root disorders 0 1 (0.3%) HLT: Lumbar spinal cord and nerve root disorders 0 1 (0.3%) Sciatica 0 1 (0.3%) EYE DISORDERS 0 2 (0.6%) HLGT: Ocular infections, irritations and inflammations 0 1 (0.3%) HLT: Retinal, choroid and vitreous infections and 0 1 (0.3%) inflammations Macular oedema 0 1 (0.3%) HLGT: Ocular structural change, deposit and degeneration NEC 0 1 (0.3%) HLT: Retinal structural change, deposit and degeneration 0 1 (0.3%) Retinal detachment 0 1 (0.3%) HLGT: Retina, choroid and vitreous haemorrhages and vascular 0 2 (0.6%) disorders HLT: Choroid and vitreous haemorrhages and vascular 0 1 (0.3%) disorders Vitreous haemorrhage 0 1 (0.3%) HLT: Retinopathies NEC 0 1 (0.3%) Diabetic retinopathy 0 1 (0.3%) CARDIAC DISORDERS 4 (2.5%) 3 (0.9%) HLGT: Cardiac valve disorders 1 (0.6%) 0 HLT: Mitral valvular disorders 1 (0.6%) 0 Mitral valve incompetence 1 (0.6%) 0 HLGT: Coronary artery disorders 3 (1.9%) 3 (0.9%) HLT: Coronary artery disorders NEC 1 (0.6%) 2 (0.6%) Arteriosclerosis coronary artery 0 1 (0.3%) Coronary artery disease 1 (0.6%) 1 (0.3%) HLT: Ischaemic coronary artery disorders 2 (1.2%) 1 (0.3%) Acute coronary syndrome 0 1 (0.3%) Acute myocardial infarction 1 (0.6%) 0 Angina unstable 1 (0.6%) 0 VASCULAR DISORDERS 0 2 (0.6%) HLGT: Decreased and nonspecific blood pressure disorders and 0 1 (0.3%) shock HLT: Circulatory collapse and shock 0 1 (0.3%) Shock haemorrhagic 0 1 (0.3%) HLGT: Embolism and thrombosis 0 1 (0.3%) HLT: Peripheral embolism and thrombosis 0 1 (0.3%) Blue toe syndrome 0 1 (0.3%) RESPIRATORY, THORACIC AND MEDIASTINAL DISORDERS 1 (0.6%) 1 (0.3%) HLGT: Lower respiratory tract disorders (excl obstruction and 1 (0.6%) 0 infection) HLT: Lower respiratory tract inflammatory and immunologic 1 (0.6%) 0 conditions Pneumonitis 1 (0.6%) 0 HLGT: Respiratory disorders NEC 0 1 (0.3%) HLT: Respiratory failures (excl neonatal) 0 1 (0.3%) Acute respiratory failure 0 1 (0.3%) GASTROINTESTINAL DISORDERS 1 (0.6%) 3 (0.9%) HLGT: Abdominal hernias and other abdominal wall conditions 0 2 (0.6%) HLT: Umbilical hernias 0 2 (0.6%) Umbilical hernia 0 2 (0.6%) HLGT: Gastrointestinal signs and symptoms 1 (0.6%) 0 HLT: Gastrointestinal and abdominal pains (excl oral and 1 (0.6%) 0 throat) Abdominal pain 1 (0.6%) 0 HLGT: Peritoneal and retroperitoneal conditions 0 1 (0.3%) HLT: Peritoneal and retroperitoneal haemorrhages 0 1 (0.3%) Peritoneal haemorrhage 0 1 (0.3%) HEPATOBILIARY DISORDERS 0 1 (0.3%) HLGT: Gallbladder disorders 0 1 (0.3%) HLT: Cholecystitis and cholelithiasis 0 1 (0.3%) Cholecystitis chronic 0 1 (0.3%) MUSCULOSKELETAL AND CONNECTIVE TISSUE 1 (0.6%) 3 (0.9%) DISORDERS HLGT: Joint disorders 0 3 (0.9%) HLT: ArthropathiesNEC 0 1 (0.3%) Neuropathic arthropathy 0 1 (0.3%) HLT: Crystal arthropathic disorders 0 1 (0.3%) Gouty arthritis 0 1 (0.3%) HLT: Osteoarthropathies 0 1 (0.3%) Osteoarthritis 0 1 (0.3%) HLGT: Musculoskeletal and connective tissue deformities (incl 1 (0.6%) 0 intervertebral disc disorders) HLT: Spine and neck deformities 1 (0.6%) 0 Spinal column stenosis 1 (0.6%) 0 RENAL AND URINARY DISORDERS 0 1 (0.3%) HLGT: Urolithiases 0 1 (0.3%) HLT: Renal lithiasis 0 1 (0.3%) Stag horn calculus 0 1 (0.3%) GENERAL DISORDERS AND ADMINISTRATION SITE 0 3 (0.9%) CONDITIONS HLGT: General system disorders NEC 0 3 (0.9%) HLT: Pain and discomfort NEC 0 3 (0.9%) Non-cardiac chest pain 0 3 (0.9%) INVESTIGATIONS 3 (1.9%) 0 HLGT: Endocrine investigations (incl sex hormones) 1 (0.6%) 0 HLT: Gastrointestinal, pancreatic and APUD hormone 1 (0.6%) 0 analyses Blood calcitonin increased 1 (0.6%) 0 HLGT: Gastrointestinal investigations 1 (0.6%) 0 HLT: Gastrointestinal and abdominal imaging procedures 1 (0.6%) 0 Colonoscopy 1 (0.6%) 0 HLGT: Physical examination topics 1 (0.6%) 0 HLT: Physical examination procedures 1 (0.6%) 0 Weight decreased 1 (0.6%) 0 INJURY, POISONING AND PROCEDURAL COMPLICATIONS 1 (0.6%) 3 (0.9%) HLGT: Bone and joint injuries 1 (0.6%) 2 (0.6%) HLT: Fractures and dislocations NEC 0 1 (0.3%) Multiple fractures 0 1 (0.3%) HLT: Limb injuries NEC (incl traumatic amputation) 1 (0.6%) 0 Meniscus lesion 1 (0.6%) 0 HLT: Lower limb fractures and dislocations 0 1 (0.3%) Foot fracture 0 1 (0.3%) HLGT: Injuries NEC 0 1 (0.3%) HLT: Abdominal injuries NEC 0 1 (0.3%) Abdominal injury 0 1 (0.3%) HLT: Non-site specific injuries NEC 0 1 (0.3%) Injury 0 1 (0.3%) SURGICAL AND MEDICAL PROCEDURES 2 (1.2%) 2 (0.6%) HLGT: Vascular therapeutic procedures 2 (1.2%) 2 (0.6%) HLT: Arterial therapeutic procedures (excl aortic) 2 (1.2%) 2 (0.6%) Coronary angioplasty 0 1 (0.3%) Coronary artery bypass 2 (1.2%) 0 Percutaneous coronary intervention 0 1 (0.3%) TEAE: Treatment Emergent Adverse Event, SOC: System Organ Class, HLGT: High Level Group Term, HLT: High Level Term, PT: Preferred Term. MedDRA version: 14.0. n (%) = number and percentage of patients with at least one serious TEAE. Note: on-treatment period of the whole study = the time from the first dose of double-blind study medication up to 3 days after the last dose administration. Table sorted by SOC internationally agreed order and HLGT, HLT, PT alphabetic order.
TABLE-US-00021 TABLE 20 Number (%) of patients experiencing TEAE(s) leading to permanent treatment discontinuation by primary SOC, HLGT, HLT, and PT during the on- treatment period of the whole study - Safety population PRIMARY SYSTEM ORGAN CLASS BLGT: High Level Group Term BLT: High Level Term Placebo Lixisenatide Preferred Term (N = 161) (N = 323) Any class 12 (7.5%) 30 (9.3%) INFECTIONS AND INFESTATIONS 0 1 (0.3%) HLGT: Bacterial infectious disorders 0 1 (0.3%) HLT: Bacterial infections NBC 0 1 (0.3%) Cellulitis 0 1 (0.3%) METABOLISM AND NUTRITION DISORDERS 1 (0.6%) 0 HLGT: Appetite and general nutritional disorders 1 (0.6%) 0 HLT: Appetite disorders 1 (0.6%) 0 Decreased appetite 1 (0.6%) 0 PSYCHIATRIC DISORDERS 0 2 (0.6%) HLGT: Anxiety disorders and symptoms 0 2 (0.6%) HLT: Panic attacks and disorders 0 2 (0.6%) Panic attack 0 2 (0.6%) NERVOUS SYSTEM DISORDERS 1 (0.6%) 5 (1.5%) HLGT: Central nervous system vascular disorders 0 1 (0.3%) HLT: Central nervous system haemorrhages and 0 1 (0.3%) cerebrovascular accidents Cerebral infarction 0 1 (0.3%) HLGT: Headaches 0 2 (0.6%) HLT: Headaches NEC 0 2 (0.6%) Headache 0 2 (0.6%) HLGT: Mental impairment disorders 1 (0.6%) 0 HLT: Memory loss (excl dementia) 1 (0.6%) 0 Memory impairment 1 (0.6%) 0 HLGT: Neurological disorders NEC 0 3 (0.9%) HLT: Neurological signs and symptoms NEC 0 3 (0.9%) Dizziness 0 3 (0.9%) EYE DISORDERS 0 1 (0.3%) HLGT: Vision disorders 0 1 (0.3%) HLT: Partial vision loss 0 1 (0.3%) Visual acuity reduced 0 1 (0.3%) EAR AND LABYRINTH DISORDERS 0 1 (0.3%) HLGT: Hearing disorders 0 1 (0.3%) HLT: Hearing losses 0 1 (0.3%) Deafness bilateral 0 1 (0.3%) CARDIAC DISORDERS 2 (1.2%) 1 (0.3%) HLGT: Cardiac arrhythmias 1 (0.6%) 0 HLT: Supraventricular arrhythmias 1 (0.6%) 0 Atrial fibrillation 1 (0.6%) 0 HLGT: Cardiac valve disorders 1 (0.6%) 0 HLT: Mitral valvular disorders 1 (0.6%) 0 Mitral valve incompetence 1 (0.6%) 0 HGLT: Coronary artery disorders 1 (0.6%) 1 (0.3%) HLT: Ischaemic coronary artery disorders 1 (0.6%) 1 (0.3%) Acute myocardial infarction 1 (0.6%) 0 Myocardial ischaemia 0 1 (0.3%) RESPIRATORY, THORACIC AND MEDIASTINAL DISORDERS 1 (0.6%) 2 (0.6%) HLGT: Respiratory disorders NEC 1 (0.6%) 2 (0.6%) HLT: Breathing abnormalities 0 1 (0.3%) Dyspnoea 0 1 (0.3%) HLT: Coughing and associated symptoms 1 (0.6%) 0 Cough 1 (0.6%) 0 HLT: Upper respiratory tract signs and symptoms 0 1 (0.3%) Throat tightness 0 1 (0.3%) GASTROINTESTINAL DISORDERS 1 (0.6%) 10 (3.1%) HLGT: Gastrointestinal motility and defaecation conditions 0 1 (0.3%) HLT: Diarrhoea (excl infective) 0 1 (0.3%) Diarrhoea 0 1 (0.3%) HLGT: Gastrointestinal signs and symptoms 1 (0.6%) 8 (2.5%) HLT: Flatulence, bloating and distension 0 2 (0.6%) Abdominal distension 0 1 (0.3%) Flatulence 0 1 (0.3%) HLT: Gastrointestinal and abdominal pains (excl oral and 1 (0.6%) 0 throat) Abdominal pain lower 1 (0.6%) 0 HLT: Nausea and vomiting symptoms 0 7 (2.2%) Nausea 0 6 (1.9%) Vomiting 0 2 (0.6%) HLGT: Gastrointestinal ulceration and perforation 0 1 (0.3%) HLT: Peptic ulcers and perforation 0 1 (0.3%) Peptic ulcer 0 1 (0.3%) SKIN AND SUBCUTANEOUS TISSUE DISORDERS 1 (0.6%) 3 (0.9%) HLGT: Angioedema and urticaria 0 1 (0.3%) HLT: Urticarias 0 1 (0.3%) Urticaria 0 1 (0.3%) HLGT: Epidermal and dermal conditions 1 (0.6%) 2 (0.6%) HLT: Dermatitis and eczema 1 (0.6%) 2 (0.6%) Dermatitis 0 1 (0.3%) Dermatitis allergic 0 1 (0.3%) Eczema 1 (0.6%) 0 MUSCULOSKELETAL AND CONNECTIVE TISSUE 0 3 (0.9%) DISORDERS HLGT: Joint disorders 0 1 (0.3%) HLT: Joint related signs and symptoms 0 1 (0.3%) Arthralgia 0 1 (0.3%) HLGT: Muscle disorders 0 1 (0.3%) HLT: Muscle pains 0 1 (0.3%) Myalgia 0 1 (0.3%) HLGT: Musculoskeletal and connective tissue disorders NEC 0 1 (0.3%) HLT: Musculoskeletal and connective tissue pain and 0 1 (0.3%) discomfort Pain in extremity 0 1 (0.3%) GENERAL DISORDERS AND ADMINISTRATION SITE 1 (0.6%) 5 (1.5%) CONDITIONS HLGT: General system disorders NEC 1 (0.6%) 5 (1.5%) HLT: Asthenic conditions 0 2 (0.6%) Asthenia 0 1 (0.3%) Fatigue 0 1 (0.3%) HLT: Oedema NEC 1 (0.6%) 2 (0.6%) Oedema 0 1 (0.3%) Oedema peripheral 1 (0.6%) 1 (0.3%) HLT: Pain and discomfort NEC 0 1 (0.3%) Non-cardiac chest pain 0 1 (0.3%) INVESTIGATIONS 4 (2.5%) 4 (1.2%) HLGT: Endocrine investigations (incl sex hormones) 2 (1.2%) 1 (0.3%) HLT: Gastrointestinal, pancreatic and APUD hormone 2 (1.2%) 1 (0.3%) analyses Blood calcitonin increased 2 (1.2%) 1 (0.3%) HLGT: Gastrointestinal investigations 1 (0.6%) 1 (0.3%) HLT: Digestive enzymes 1 (0.6%) 1 (0.3%) Blood amylase increased 1 (0.6%) 1 (0.3%) Lipase increased 1 (0.6%) 1 (0.3%) HLGT: Metabolic, nutritional and blood gas investigations 0 1 (0.3%) HLT: Carbohydrate tolerance analyses (incl diabetes) 0 1 (0.3%) Glycosylated haemoglobin increased 0 1 (0.3%) HLGT: Physical examination topics 1 (0.6%) 1 (0.3%) HLT: Physical examination procedures 1 (0.6%) 1 (0.3%) Weight increased 1 (0.6%) 1 (0.3%) INJURY, POISONING AND PROCEDURAL COMPLICATIONS 0 1 (0.3%) HLGT: Injuries NEC 0 1 (0.3%) HLT: Abdominal injuries NEC 0 1 (0.3%) Abdominal injury 0 1 (0.3%) TEAE: Treatment Emergent Adverse Event, SOC: System Organ Class, HLGT: High Level Group Term, HLT: High Level Term, PT: Preferred Term. MedDRA version: 14.0. n (%) = number and percentage of patients with at least one TEAE leading to permanent treatment discontinuation. Note: on-treatment period of the whole study = the time from the first dose of double-blind study medication up to 3 days after the last dose administration. Table sorted by SOC internationally agreed order and HLGT, HLT, PT alphabetic order.
[0154] During the on-treatment period of the whole study, a total of 36 patients (27 in the lixisenatide group and 9 in the placebo group) reported TEAEs on a pre-specified AE form for "symptomatic hypoglycaemia". Among them, 23 (7.1%) patients in the lixisenatide group had symptomatic hypoglycemia per protocol definition, compared to 7 (4.3%) in the placebo group (Table 21). None of the symptomatic hypoglycemia events were severe in intensity. The events in the remaining 6 patients (4 in the lixisenatide group and 2 in the placebo group) did not meet the protocol-specified symptomatic hypoglycemia definition due to the associated glucose values being >60 mg/dL or no symptoms reported.
[0155] Twenty-two (6.8%) patients in the lixisenatide group and 8 (5.0%) in the placebo group experienced injection site reaction AEs (Table 22). The injection site reaction AEs were identified by searching the term "injection site" in either the PTs coded from the investigator reported terms or the PTs from the ARAC diagnosis after the allergic reaction adjudication. None of these injection site reaction events were serious or severe in intensity or led to IP discontinuation.
[0156] A total of 56 possible allergic events were reported in 39 patients by investigators and were sent to ARAC for adjudication during the on-treatment period of the whole study. Of these, 19 events in 12 patients (9 [2.8%] patients in the lixisenatide group and 3 [1.9%] in the placebo group) were adjudicated as allergic reactions by ARAC, which included 5 events in 3 patients in the lixisenatide group (1 with allergic dermatitis, 1 with urticaria, and 1 with angioedema, anaphylactic reaction, and allergic conjunctivitis) adjudicated as possibly related to IP. (Table 23). [0157] Patient 124713001 (lixisenatide group): with a medical history of urticaria and multiple allergies, as well as pruritus, on Day 258 (7 Nov. 2009) after start of IP experienced a non-serious TEAE of WELT FROM NEEDLE (coded to PT "injection site urticaria") of mild intensity. No corrective treatment was given and the event was recovered after 7 days. The event was not considered as related to IP. From Day 264 until Day 368 after start of IP intake the patient had intermittently stopped IP administration for one day. From day 369 to day 386 the patient did not administer the IP. From day 387 to day 393 the patient again injected 20 .mu.g of IP each day. Then, again IP administration was stopped for 2 days and injected for the last time on day 396. IP was permanently stopped due to a non-serious TEAE of mild intensity REOCCURRING WELTS AFTER RESTARTING STUDY MEDICATION (coded to PT "urticaria") on day 396 day after start of IP administration. This event was considered as related to IP. The event resolved 11 days after last administration of IP without any corrective treatment. Both events were sent to ARAC for adjudication but only the 2nd event was adjudicated by ARAC as an allergic reaction urticaria (hives), possibly related to the IP. [0158] Patient 642701006 (lixisenatide group): This patient without a history of allergy experienced on Day 163 (1 Oct. 2009) after start of IP a non-serious TEAE of ALLERGY (coded to PT "hypersensitivity") of mild intensity. Thirty minutes after injection of the IP, the patient complained about generalized itch and redness of the eyes, which spontaneously disappeared without treatment. The event resolved the same day. On day 169 after start of IP, a non-serious TEAE of ALLERGIC DERMATITIS (coded to PT "dermatitis allergic") of moderate intensity was reported. Twenty-five minutes after administration of IP, the patient complained about generalized itch, swelling of eyes and tongue and swelling at the injection site. The event resolved on the same day. Oral loratadine was started on day 169 after start of IP and given as corrective treatment for 7 days. On day 170 after start of IP, another non-serious TEAE of ALLERGIC DERMATITIS (coded to PT "dermatitis allergic") of moderate intensity was reported and resolved the same day. Immediately after administration of IP, the patient complained about swelling at the injection site, generalized itch, generalized rush, swelling of the eyes and tongue, nausea. All 3 events were considered as related to IP and IP was permanently stopped due to the third event after day 170. The 3 events were adjudicated by ARAC as allergic reactions (allergic conjunctivitis, angioedema and anaphylactic reaction respectively), possibly related to the IP. [0159] Patient 840864001 (lixisenatide group): with a medical history of allergic rhinitis, pollen allergies, dust allergies, swelling (angioedema), drug allergies, rush and dermatitis, experienced a non-serious TEAE of DERMATITIS ON BILATERAL ARMS AND ABDOMEN (coded to PT "dermatitis") of moderate intensity on the third day after start of IP administration. Clindamycin was given as corrective treatment for three days. IP administration was temporarily stopped on Day 5 until Day 8 after start of IP administration. A re-challenge with IP on Day 9 to Day 13 caused a worsening on the abdominal wall. The event was considered as related to IP and the IP was permanently stopped after day 13. The event resolved 12 days (21 Dec. 2009) after permanent discontinuation from IP. This TEAE was adjudicated by ARAC as an allergic reaction (allergic dermatitis), possibly related to IP.
[0160] No event was adjudicated by ARAC as possibly related to IP in the placebo group. Per protocol, any increase in amylase and/or lipase above twice the upper limit of normal range (ULN) that had been confirmed by a repeat measurement was to be monitored and documented on a pre-specified AE form for "suspected pancreatitis". During the on-treatment period of the whole study, 2 (0.6%) patients in the lixisenatide group and 2 (1.2%) in the placebo group reported TEAEs with the pre-specified AE form (Table 24). No case of pancreatitis was diagnosed or reported.
[0161] Patients who had at least one value of lipase or amylase .gtoreq.3ULN during the on-treatment period are summarized in (Table 25). A total of 7 patients experienced elevated lipase (3ULN): 5 [1.6%] in the lixisenatide group, 2 [1.3%] in the placebo group. No one had elevated amylase .gtoreq.3ULN.
[0162] Per protocol, any calcitonin value>20 pg/mL confirmed by a repeat measurement was to be monitored and reported on the pre-specified AE form for "increased calcitonin 20 pg/mL". During the on-treatment period of the whole study, 9 (2.8%) patients in the lixisenatide group and 4 (2.5%) in the placebo group reported increased blood calcitonin on the pre-specified AE form (Table 26). Among them, 8 out of 9 patients in the lixisenatide group had calcitonin values>20 but <50 ng/L and 1 patient had a calcitonin value.gtoreq.50 ng/L, whereas in the placebo group 3 out of 4 patients had calcitonin values>20 but <50 ng/L and 1 patient had calcitonin values.gtoreq.50 ng/L. One additional patient in the lixisenatide group reported a post-treatment AE on the pre-specified adverse event form for "increased calcitonin .gtoreq.20 pg/mL" with calcitonin values.gtoreq.20 but <50 ng/L. Two patients in the lixisenatide group and 1 patient in the placebo group reported AEs that were coded to PT "thyroid neoplasm". [0163] Patient 642706001 (lixisenatide group): a non-smoker, without a history of thyroid disease and without renal insufficiency, experienced a non-serious adverse event LEFT THYROID LOBE NODULE of mild intensity twenty-four days after last administration of IP. No thyroid medication was given. The event was considered as not related to IP. At Visit 15, 255 days after start of IP, calcitonin was measured for the first time and was 16.4 ng/L. At the last day of IP, calcitonin was 22.2 ng/L and in the re-test one week later 18.9 ng/L. [0164] Patient 840738004 (lixisenatide group): a former smoker of 35 years, without a history of thyroid disease and without renal insufficiency experienced a non serious TEAE of 6 mm THYROID NODULE LEFT LOBE of mild intensity 39 days after first intake of IP. No thyroid medication was given. A thyroid ultrasound 177 days after first intake of IP confirmed a 7.times.3 mm nodule in the left lobe. The first calcitonin at start of IP intake was 19.7 ng/L. Two-hundred sixty-two days after first intake of IP a non-serious TEAE ELEVATED CALCITONIN of mild intensity was reported on the specific pages for increased calcitonin due to a calcitonin value of 20.1 ng/L. The event ELEVATED CALCITONIN was resolved without treatment 376 days after first intake of IP. Nine days before, calcitonin was 16.3 ng/L. At the last day of IP intake, calcitonin was 19.4 ng/L. Both events were considered as not related to IP.
[0165] Patients with at least one serum calcitonin measurement during the on-treatment period of the whole study are summarized in Table 27 according to the 4 pre-defined categories of calcitonin level at baseline. A total of 17 patients had calcitonin values.gtoreq.20 ng/L during the on-treatment period of the whole study: 11 (3.7%) patients in the lixisenatide group, 6 (4.2%) patients in the placebo group. Among them, 13 patients (9 for lixisenatide and 4 for placebo) reported a TEAE with the pre-specified AE form as described above. Two patients in each treatment group had at least 1 calcitonin value.gtoreq.20 ng/L but did not report a TEAE with the pre-specified AE form during the on-treatment period of the whole study. For one patient who had multiple values.gtoreq.20 but <50 ng/L in the placebo group this was due to measurements done before protocol amendment 4 which required the retesting. For the other 3 patients this was because of an unconfirmed calcitonin elevation: 1 patient in each group had a single value.gtoreq.20 but <50 ng/L and 1 in the lixisenatide group had a single value.gtoreq.50 ng/L, but their other pre- and/or post-measurements were <20 ng/L. Since calcitonin measurements were implemented in a protocol amendment after most patients were already randomized in this study. Therefore, baseline calcitonin values were not available for most patients.
[0166] One patient in the placebo group and 2 patients in the lixisenatide group had a calcitonin value>50 ng/L (Table 27). [0167] Patient 840782004 (lixisenatide group): a non-smoker, without thyroid diseases in the medical history and without renal insufficiency, on the day of the first IP administration (3 Aug. 2009) calcitonin was 37.8 ng/L and a non-serious TEAE of CALCITONIN ELEVATION of mild intensity was reported one day later. IP was continued. No corrective treatment was given. A thyroid ultrasound was not performed. The event was considered as related to IP. The further calcitonin values during the study were 64.2, 19.3, 50, 36.5 and on Day 260 (19 Apr. 2010) after start of IP it was 29.6 ng/L. Forty-three days (24 Aug. 2010) after permanent discontinuation of IP (due to lack of efficacy), calcitonin was 48.1 ng/L. [0168] Patient 040702004 (lixisenatide group): had a calcitonin value of 104 ng/L at one visit during the study. At the re-test 14 days later, calcitonin was 3 ng/L. Because at all earlier and later visits during the study calcitonin values were between <0.6 ng/L and 3 ng/L no TEAE referring to calcitonin was reported and no further thyroid investigation performed.
TABLE-US-00022 [0168] TABLE 21 Summary of symptomatic hypoglycemia during the on-treatment period of the whole study - Safety population Placebo Lixisenatide Type (N = 161) (N = 323) Total patient years 227.6 493.9 Any symptomatic hypoglycemia Number of patients with events, n (%) 7 (4.3%) 23 (7.1%) Number of patients with events per 3.1 4.7 100 patient years.sup.a Blood glucose < 60 mg/dL Number of patients with events, n (%) 7 (4.3%) 17 (5.3%) Number of patients with events per 3.1 3.4 100 patient years.sup.a No blood glucose reported Number of patients with events, n (%) 0 9 (2.8%) Number of patients with events per 0.0 1.8 100 patient years.sup.a .sup.aCalculated as (number of patients with events * 100 divided by total exposure + 3 days in patient years). Symptomatic hypoglycemia = Symptomatic hypoglycemia as defined per protocol Note: on-treatment period of the whole study = the time from the first dose of double-blind study medication up to 3 days after the last dose administration.
TABLE-US-00023 TABLE 22 Number (%) of patients experiencing injection site reactions during the on-treatment period of the whole study - Safety population Event source Placebo Lixisenatide Preferred Term (N = 161) (N = 323) Any injection site reactions 8 (5.0%) 22 (6.8%) Investigator reported PTs 7 (4.3%) 22 (6.8%) Injection site pain 4 (2.5%) 5 (1.5%) Injection site haematoma 3 (1.9%) 8 (2.5%) Injection site reaction 1 (0.6%) 4 (1.2%) Injection site swelling 1 (0.6%) 0 Injection site erythema 0 5 (1.5%) Injection site haemorrhage 0 1 (0.3%) Injection site hypersensitivity 0 1 (0.3%) Injection site mass 0 1 (0.3%) Injection site pruritus 0 4 (1.2%) Injection site rash 0 1 (0.3%) Injection site urticaria 0 2 (0.6%) PTs by ARAC diagnosis 3 (1.9%) 7 (2.2%) Injection site reaction 3 (1.9%) 7 (2.2%) ARAC = Allergic Reaction Assessment Committee. Note: on-treatment period of the whole study = the time from the first dose of double-blind study medication up to 3 days after the last dose administration.
TABLE-US-00024 TABLE 23 Number (%) of patients with events adjudicated as an allergic reaction by ARAC during the on-treatment period of the whole study - Safety population Relationship to MedDRA coded term study treatment (PT) ARAC Placebo Lixisenatide (by ARAC) for ARAC diagnosis diagnosis (N = 161) (N = 323) All Events adjudicated 3 (1.9%) 9 (2.8%) as an allergic reaction byARAC Anaphylactic reaction Anaphylactic reaction 0 1 (0.3%) Angioedema Angioedema 1 (0.6%) 1 (0.3%) Conjunctivitis allergic Allergic conjunctivitis 0 1 (0.3%) Conjunctivitis Conjunctivitis 0 1 (0.3%) Dermatitis allergic Allergic dermatitis 0 1 (0.3%) Dermatitis contact Allergic contact 1 (0.6%) 2 (0.6%) dermatitis Dermatitis contact Allergic contact 0 1 (0.3%) dermatitis (poison ivy) Dermatitis contact Contact dermatitis 1 (0.6%) 0 (poison ivy) Drug eruption Allergic dermatitis to 0 1 (0.3%) glypizide Pruritus generalised Generalized itch 1 (0.6%) 0 Rhinitis allergic Allergic rhinitis 0 1 (0.3%) Rhinitis Rhinitis 0 1 (0.3%) Urticaria Urticaria (hives) 0 1 (0.3%) Related Events adjudicated 0 3 (0.9%) as an allergic reaction by ARAC Anaphylactic reaction Anaphylactic reaction 0 1 (0.3%) Angioedema Angioedema 0 1 (0.3%) Conjunctivitis allergic Allergic conjunctivitis 0 1 (0.3%) Dermatitis allergic Allergic dermatitis 0 1 (0.3%) Urticaria Urticaria (hives) 0 1 (0.3%) Not related Events adjudicated 3 (1.9%) 6 (1.9%) as an allergic reaction by ARAC Angioedema Angioedema 1 (0.6%) 0 Conjunctivitis Conjunctivitis 0 1 (0.3%) Dermatitis contact Allergic contact 1 (0.6%) 2 (0.6%) dermatitis Dermatitis contact Allergic contact 0 1 (0.3%) dermatitis (poison ivy) Dermatitis contact Contact dermatitis 1 (0.6%) 0 (poison ivy) Drug eruption Allergic dermatitis to 0 1 (0.3%) glypizide Pruritus generalised Generalized itch 1 (0.6%) 0 Rhinitis allergic Allergic rhinitis 0 1 (0.3%) Rhinitis Rhinitis 0 1 (0.3%) ARAC = Allergic Reaction Assessment Committee. IP = Investigational Product. Note: on-treatment period of the whole study = the time from the first dose of double-blind study medication up to 3 days after the last dose administration.
TABLE-US-00025 TABLE 24 Number (%) of patients with a specific adverse event form for suspected pancreatitis completed during the on-treatment period of the whole study - Safety population Placebo Lixisenatide Preferred Term (N = 161) (N = 323) Any 2 (1.2%) 2 (0.6%) Blood amylase increased 1 (0.6%) 2 (0.6%) Lipase increased 2 (1.2%) 2 (0.6%) n (%) = number and percentage of patients with any cases reported on the AE form for suspected pancreatitis along with complementary form. Note: on-treatment period of the whole study = the time from the first dose of double-blind study medication up to 3 days after the last dose administration.
TABLE-US-00026 TABLE 25 Pancreatic enzymes: Number (%) of patients with abnormalities (PCSA) during the on-treatment period of the whole study according to baseline PCSA status - Safety population Laboratory parameter Baseline Placebo Lixisenatide By PCSA criteria n/N1 (%) (N = 161) (N = 323) Lipase (IU/L) Total* .gtoreq.3ULN 2/160 (1.3%) 5/317 (1.6%) Normal/Missing .gtoreq.3ULN 2/159 (1.3%) 5/317 (1.6%) Amylase (IU/L) Total* .gtoreq.3ULN 0/160 0/317 Normal/Missing .gtoreq.3ULN 0/160 0/317 PCSA: Potentially Clinically Significant Abnormalities, ULN = Upper limit of normal. *Regardless of baseline. Note: on-treatment period of the whole study = the time from the first dose of double-blind study medication up to 3 days after the last dose administration. The number (n) represents the subset of the total number of patients who met the criterion in question at least once. The denominator (/N1) for each parameter within a treatment group is the number of patients for the treatment group who had that parameter assessed post-baseline by baseline PCSA status. Only the worsening of the worst case for each patient is presented by baseline status.
TABLE-US-00027 TABLE 26 Number (%) of patients with increased calcitonin during the on-treatment period of the whole study - Safety population Placebo Lixisenatide Preferred Term (N = 161) (N = 323) Any 4 (2.5%) 9 (2.8%) Blood calcitonin increased 4 (2.5%) 9 (2.8%) n (%) = number and percentage of patients with any cases reported on the AE form for increased calcitonin .gtoreq.20 ng/L. Note: on-treatment period of the whole study = the time from the first dose of double-blind study medication up to 3 days after the last dose administration.
TABLE-US-00028 TABLE 27 Serum calcitonin: Number (%) of patients by pre-defined categories during the on-treatment period of the whole study according to baseline category - Safety population Laboratory criteria Baseline status Placebo Lhisenatide Post-baseline (N = 161) (N = 323) Calcitonin (ng/L) Total* .ltoreq.ULN 117/144 (81.3%) 265/303 (87.5%) >ULN-<20 ng/L 21/144 (14.6%) 27/303 (8.9%) .gtoreq.20 ng/L-.ltoreq.50 ng/L 5/144 (3.5%) 9/303 (3.0%) .gtoreq.50 ng/L 1/144 (0.7%) 2/303 (0.7%) Missing .ltoreq.ULN 72/83 (86.7%) 161/178 (90.4%) >ULN-<20 ng/L 8/83 (9.6%) 12/178 (6.7%) .gtoreq.20 ng/L-<50 ng/L 3/83 (3.6%) 5/178 (2.8%) .gtoreq.50 ng/L 0/83 0/178 .ltoreq.ULN .ltoreq.ULN 44/53 (83.0%) 104/110 (94.5%) >ULN-<20 ng/L 9/53 (17.0%) 5/110 (4.5%) .gtoreq.20 ng/L-<50 ng/L 0/53 0/110 .gtoreq.50 ng/L 0/53 1/110 (0.9%) >ULN-<20 ng/L .ltoreq.ULN 1/5 (20.0%) 0/12 >ULN-<20 ng/L 4/5 (80.0%) 10/12 (83.3%) .gtoreq.20 ng/L-<50 ng/L 0/5 2/12 (16.7%) .gtoreq.50 ng/L 0/5 0/12 .gtoreq.20 ng/L-<50 ng/L .ltoreq.ULN 0/3 0/3 >ULN-<20 ng/L 0/3 0/3 .gtoreq.20 ng/L-.ltoreq.50 ng/L 2/3 (66.7%) 2/3 (66.7%) .gtoreq.50 ng/L 1/3 (33.3%) 1/3 (33.3%) .ltoreq.50 ng/L .ltoreq.ULN 0/0 0/0 >ULN-<20 ng/L 0/0 0/0 .gtoreq.20 ng/L-<50 ng/L 0/0 0/0 .gtoreq.50 ng/L 0/0 0/0 ULN = Upper limit of normal *Regardless of baseline. Note: on-treatment period of the whole study = the time from the first dose of double-blind study medication up to 3 days after the last dose administration. The numerator represents the number of patients who were in the pre-specified categories at post-baseline in each baseline category. The denominator for each parameter within a treatment group is the number of patients for the treatment group who had that parameter assessed post-baseline by baseline status. A patient is counted only in the worst category.
7 APPENDIX
TABLE-US-00029 [0169] TABLE 28 Number (%) of patients by total daily dose at the end of titration - Safety population Dose at the Placebo Lixisenatide end of titration (N = 161) (N = 323) 10 ug 1 (0.6%) 13 (4.0%) 15 .mu.g 5 (3.1%) 21 (6.5%) 20 .mu.g 155 (96.3%) 289 (89.5%) Dose = Dose of active drug or volume-matched placebo. The scheduled visit for end of titration per protocol would be Visit 5/Week 2. Note: Percentages are calculated using the number of safety patients as the denominator.
TABLE-US-00030 TABLE 29 Mean change in HbA1c (%) from baseline by visit mITT Treatment Observed data Change from baseline Time point N Mean SD SE Median Min Max N Mean SD SE Median Min Max Placebo (N = 159) Screening 159 8.14 0.82 0.065 8.00 7.0 10.0 Baseline 159 8.06 0.79 0.063 7.90 6.5 10.2 Week* 144 7.74 0.83 0.069 7.55 6.3 10.2 144 -0.31 0.75 0.062 -0.30 -2.2 2.3 Week 12 141 7.67 0.95 0.080 7.60 6.0 10.4 141 -0.39 0.89 0.075 -0.40 -2.6 2.7 Week 24 123 7.44 0.86 0.077 7.30 5.5 10.1 123 -0.57 0.93 0.084 -0.40 -4.0 1.6 Week 24 (LOCF) 148 7.59 0.96 0.079 7.40 5.5 10.4 148 -0.46 1.00 0.082 -0.40 -4.0 2.5 Week 36 100 7.22 0.82 0.082 7.10 5.1 9.7 100 -0.77 0.99 0.099 -0.70 -4.4 1.6 Week 44 90 7.16 0.73 0.077 7.10 5.3 8.9 90 -0.77 0.92 0.097 -0.70 -3.9 1.4 Week 52 86 7.17 0.75 0.081 7.20 5.5 8.9 86 -0.74 0.92 0.100 -0.70 -3.9 1.4 Week 60 80 7.22 0.76 0.085 7.20 5.7 9.1 80 -0.67 0.97 0.109 -0.50 -3.8 1.6 Week 68 72 7.21 0.87 0.103 7.20 5.8 10.0 72 -0.66 1.03 0.121 -0.65 -3.6 1.5 Week 76 71 7.25 0.97 0.115 7.10 5.3 11.0 71 -0.62 1.07 0.127 -0.70 -3.9 2.0 Week 84 48 7.26 1.19 0.172 7.10 5.4 11.9 48 -0.58 1.11 0.160 -0.70 -2.7 2.9 Week 92 30 7.13 0.78 0.143 7.15 5.2 9.9 30 -0.67 0.86 0.156 -0.75 -3.0 1.5 Week 100 22 7.20 0.82 0.176 7.35 4.7 9.0 22 -0.69 0.78 0.167 -0.55 -2.4 0.9 Week 108 8 7.31 0.67 0.238 7.50 6.3 8.2 8 -0.65 0.98 0.347 -0.60 -2.5 0.4 Week 116 4 7.55 0.70 0.352 7.45 6.8 8.5 4 -0.25 0.76 0.380 -0.25 -1.0 0.5 Week 124 2 7.30 1.13 0.800 7.30 6.5 8.1 2 -0.50 0.85 0.600 -0.50 -1.1 0.1 Week 132 1 6.70 NC NC 6.70 6.7 6.7 1 -0.90 NC NC -0.90 -0.9 -0.9 Last on-treatment 148 7.74 1.09 0.090 7.70 4.7 11.9 148 -0.30 1.12 0.092 -0.30 -3.9 2.9 value Lixisenatide (N = 320) Screening 319 8.15 0.83 0.046 8.00 7.0 10.0 Baseline 320 8.08 0.90 0.050 7.90 6.5 12.7 Week 8 293 7.30 0.82 0.048 7.10 5.5 10.9 293 -0.78 0.80 0.047 -0.70 -6.0 3.2 Week 12 285 7.12 0.88 0.052 6.90 5.3 12.2 285 -0.97 0.93 0.055 -0.90 -5.1 3.1 Week 24 276 6.92 0.82 0.050 6.80 5.3 11.3 276 -1.16 1.02 0.061 -1.00 -5.4 3.1 Week 24 (LOCF) 308 7.06 0.96 0.055 6.90 5.3 11.3 308 -1.02 1.09 0.062 -0.90 -5.4 3.5 Week 36 242 6.80 0.80 0.051 6.75 5.2 11.4 242 -1.23 1.03 0.066 -1.10 -5.7 2.3 Week 44 231 6.81 0.72 0.047 6.80 5.3 9.4 231 -1.23 0.99 0.065 -1.10 -5.8 1.3 Week 52 223 6.84 0.73 0.049 6.80 5.2 9.4 223 -1.17 0.97 0.065 -1.00 -5.6 1.1 Week 60 203 6.81 0.67 0.047 6.80 5.1 9.1 203 -1.18 0.95 0.067 -1.00 -5.8 0.6 Week 68 207 6.84 0.72 0.050 6.80 4.6 9.5 207 -1.17 1.07 0.075 -0.90 -6.1 2.1 Week 76 194 6.87 0.74 0.053 6.80 4.8 9.5 194 -1.13 1.04 0.075 -1.05 -5.8 1.5 Week 84 142 6.91 0.78 0.065 6.80 5.5 10.2 142 -1.04 1.05 0.088 -0.90 -5.9 2.6 Week 92 114 6.96 0.72 0.068 6.90 5.2 9.0 114 -0.99 1.00 0.094 -0.80 -6.0 2.1 Week 100 87 7.08 0.82 0.088 7.00 5.7 10.3 87 -0.97 1.11 0.119 -0.85 -6.1 2.1 Week 108 46 6.86 0.63 0.093 6.80 5.6 8.3 46 -1.26 0.97 0.143 -1.00 -3.9 0.8 Week 116 20 7.06 0.73 0.162 6.85 6.1 8.6 20 -0.97 0.91 0.203 -0.80 -3.0 0.3 Week 124 6 7.47 1.11 0.455 7.55 6.1 8.8 6 -0.98 0.52 0.210 -0.95 -1.9 -0.5 Last on-treatment 308 7.33 1.09 0.062 7.20 4.8 11.3 308 -0.75 1.20 0.068 -0.70 -6.0 3.5 value NC Not computable. LOCF = Last observation carried forward. Note: The analysis excludes measurements obtained after the introduction of rescue medication and/or after the treatment cessation plus 3 days. For Week 24 (LOCF), the analysis includes measurements obtained up to 3 days after the last dose of the double-blind investigational product injection on or before Visit 12 (Week 24), or Day 169 if Visit 12 (Week 24) is not available.
TABLE-US-00031 TABLE 30 Number (%) of patients experiencing common TEAE(s) (PT .gtoreq.1% in any treatment group) presented by primary SOC, HLGT, HLT and PT during the on-treatment period of the whole study - Safety population PRIMARY SYSTEM ORGAN CLASS HLGT: High Level Group Term HLT: High Level Term Placebo Lixisenatide Preferred Term (N = 161) (N = 323) Any class 134 (83.2%) 284 (87.9%) INFECTIONS AND INFESTATIONS 77 (47.8%) 173 (53.6%) HLGT: Bacterial infectious disorders 12 (7.5%) 8 (2.5%) HLT: Bacterial infections NEC 8 (5.0%) 8 (2.5%) Cellulitis 5 (3.1%) 6 (1.9%) HLT: Streptococcal infections 4 (2.5%) 0 Pharyngitis streptococcal 4 (2.5%) 0 HLGT: Fungal infectious disorders 6 (3.7%) 10 (3.1%) HLT: Tinea infections 3 (1.9%) 3 (0.9%) Tinea pedis 3 (1.9%) 2 (0.6%) HLGT: Infections - pathogen unspecified 66 (41.0%) 152 (47.1%) HLT: Abdominal and gastrointestinal infections 4 (2.5%) 11 (3.4%) Gastroenteritis 2 (1.2%) 8 (2.5%) HLT: Dental and oral soft tissue infections 2 (1.2%) 7 (2.2%) Tooth abscess 2 (1.2%) 2 (0.6%) HLT: Ear infections 7 (4.3%) 6 (1.9%) Ear infection 6 (3.7%) 2 (0.6%) HLT: Infections NEC 2 (1.2%) 12 (3.7%) Localised infection 2 (1.2%) 1 (0.3%) Respiratory tract infection 0 5 (1.5%) HLT: Lower respiratory tract and lung infections 24 (14.9%) 28 (8.7%) Bronchitis 17 (10.6%) 25 (7.7%) Lower respiratory tract infection 4 (2.5%) 1 (0.3%) Pneumonia 5 (3.1%) 2 (0.6%) HLT: Skin structures and soft tissue infections 3 (1.9%) 8 (2.5%) Furuncle 2 (1.2%) 3 (0.9%) HLT: Upper respiratory tract infections 47 (29.2%) 107 (33.1%) Acute sinusitis 2 (1.2%) 5 (1.5%) Nasopharyngitis 24 (14.9%) 53 (16.4%) Pharyngitis 5 (3.1%) 7 (2.2%) Sinusitis 8 (5.0%) 16 (5.0%) Upper respiratory tract infection 18 (11.2%) 41 (12.7%) HLT: Urinary tract infections 11 (6.8%) 30 (9.3%) Urinary tract infection 11 (6.8%) 24 (7.4%) HLGT: Viral infectious disorders 15 (9.3%) 40 (12.4%) HLT: Influenza viral infections 9 (5.6%) 24 (7.4%) Influenza 9 (5.6%) 24 (7.4%) HLT: Viral infections NEC 5 (3.1%) 11 (3.4%) Gastroenteritis viral 3 (1.9%) 9 (2.8%) BLOOD AND LYMPHATIC SYSTEM DISORDERS 3 (1.9%) 12 (3.7%) HLGT: Anaemias nonhaemolytic and marrow depression 1 (0.6%) 9 (2.8%) HLT: Anaemias NEC 1 (0.6%) 8 (2.5%) Anaemia 1 (0.6%) 7 (2.2%) IMMUNE SYSTEM DISORDERS 3 (1.9%) 5 (1.5%) HLGT: Allergic conditions 3 (1.9%) 5 (1.5%) HLT: Atopic disorders 2 (1.2%) 2 (0.6%) Seasonal allergy 2 (1.2%) 2 (0.6%) ENDOCRINE DISORDERS 2 (1.2%) 3 (0.9%) HLGT: Thyroid gland disorders 2 (1.2%) 3 (0.9%) HLT: Thyroid hypofunction disorders 2 (1.2%) 0 Hypothyroidism 2 (1.2%) 0 METABOLISM AND NUTRITION DISORDERS 26 (16.1%) 65 (20.1%) HLGT: Appetite and general nutritional disorders 5 (3.1%) 14 (4.3%) HLT: Appetite disorders 5 (3.1%) 14 (4.3%) Decreased appetite 4 (2.5%) 13 (4.0%) HLGT: Glucose metabolism disorders (incl diabetes mellitus) 12 (7.5%) 27 (8.4%) HLT: Hyperglycaemic conditions NEC 3 (1.9%) 2 (0.6%) Hyperglycaemia 3 (1.9%) 2 (0.6%) HLT: Hypoglycaemic conditions NBC 9 (5.6%) 26 (8.0%) Hypoglycaemia 8 (5.0%) 25 (7.7%) HLGT: Lipid metabolism disorders 6 (3.7%) 8 (2.5%) HLT: Elevated triglycerides 2 (1.2%) 3 (0.9%) Hypertriglyceridaemia 2 (1.2%) 3 (0.9%) HLT: Hyperlipidaemias NEC 2 (1.2%) 1 (0.3%) Hyperlipidaemia 2 (1.2%) 1 (0.3%) HLT: Lipid metabolism and deposit disorders NEC 1 (0.6%) 5 (1.5%) Dyslipidaemia 1 (0.6%) 5 (1.5%) HLGT: Purine and pyrimidine metabolism disorders 3 (1.9%) 8 (2.5%) HLT: Disorders of purine metabolism 3 (1.9%) 8 (2.5%) Gout 2 (1.2%) 2 (0.6%) Hyperuricaemia 1 (0.6%) 6 (1.9%) PSYCHIATRIC DISORDERS 14 (8.7%) 31 (9.6%) HLGT: Anxiety disorders and symptoms 4 (2.5%) 9 (2.8%) HLT: Anxiety symptoms 4 (2.5%) 7 (2.2%) Anxiety 2 (1.2%) 5 (1.5%) Stress 2 (1.2%) 2 (0.6%) HLGT: Depressed mood disorders and disturbances 7 (4.3%) 13 (4.0%) HLT: Depressive disorders 7 (4.3%) 12 (3.7%) Depression 7 (4.3%) 12 (3.7%) HLGT: Sleep disorders and disturbances 4 (2.5%) 6 (1.9%) HLT: Disturbances in initiating and maintaining sleep 4 (2.5%) 5 (1.5%) Insomnia 4 (2.5%) 5 (1.5%) NERVOUS SYSTEM DISORDERS 44 (27.3%) 98 (30.3%) HLGT: Headaches 20 (12.4%) 44 (13.6%) HLT: Headaches NEC 19 (11.8%) 44 (13.6%) Headache 19 (11.8%) 43 (13.3%) HLT: Migraine headaches 3 (1.9%) 0 Migraine 3 (1.9%) 0 HLGT: Movement disorders (incl parkinsonism) 2 (1.2%) 3 (0.9%) HLT: Tremor (excl congenital) 2 (1.2%) 2 (0.6%) Tremor 2 (1.2%) 2 (0.6%) HLGT: Neurological disorders NEC 22 (13.7%) 48 (14.9%) HLT: Neurological signs and symptoms NEC 13 (8.1%) 34 (10.5%) Dizziness 13 (8.1%) 33 (10.2%) HLT: Paraesthesias and dysaesthesias 6 (3.7%) 8 (2.5%) Paraesthesia 5 (3.1%) 5 (1.5%) HLT: Sensory abnormalities NEC 5 (3.1%) 5 (1.5%) Hypoaesthesia 4 (2.5%) 3 (0.9%) HLGT: Peripheral neuropathies 6 (3.7%) 10 (3.1%) HLT: Peripheral neuropathies NEC 3 (1.9%) 4 (1.2%) Neuropathy peripheral 3 (1.9%) 3 (0.9%) HLGT: Spinal cord and nerve root disorders 0 7 (2.2%) HLT: Lumbar spinal cord and nerve root disorders 0 5 (1.5%) Sciatica 0 5 (1.5%) EYE DISORDERS 10 (6.2%) 26 (8.0%) HLGT: Anterior eye structural change, deposit and degeneration 2 (1.2%) 7 (2.2%) HLT: Cataract conditions 2 (1.2%) 7 (2.2%) Cataract 2 (1.2%) 7 (2.2%) HLGT: Ocular infections, irritations and inflammations 1 (0.6%) 8 (2.5%) HLT: Conjunctival infections, irritations and inflammations 0 6 (1.9%) Conjunctivitis 0 6 (1.9%) HLGT: Retina, choroid and vitreous haemorrhages and vascular 2 (1.2%) 4 (1.2%) disorders HLT: Retinopathies NEC 2 (1.2%) 4 (1.2%) Diabetic retinopathy 1 (0.6%) 4 (1.2%) HLGT: Vision disorders 4 (2.5%) 5 (1.5%) HLT: Visual disorders NBC 4 (2.5%) 4 (1.2%) Vision blurred 4 (2.5%) 4 (1.2%) EAR AND LABYRINTH DISORDERS 10 (6.2%) 11 (3.4%) HLGT: External ear disorders (excl congenital) 2 (1.2%) 0 HLT: External ear disorders NEC 2 (1.2%) 0 Cerumen impaction 2 (1.2%) 0 HLGT: Inner ear and VIIIth cranial nerve disorders 6 (3.7%) 7 (2.2%) HLT: Inner ear signs and symptoms 6 (3.7%) 6 (1.9%) Tinnitus 2 (1.2%) 2 (0.6%) Vertigo 4 (2.5%) 3 (0.9%) CARDIAC DISORDERS 11 (6.8%) 22 (6.8%) HLGT: Cardiac arrhythmias 6 (3.7%) 8 (2.5%) HLT: Supraventricular arrhythmias 5 (3.1%) 4 (1.2%) Atrial fibrillation 4 (2.5%) 1 (0.3%) HLGT: Cardiac disorder signs and symptoms 1 (0.6%) 6 (1.9%) HLT: Cardiac signs and symptoms NEC 0 6 (1.9%) Palpitations 0 6 (1.9%) HLGT: Myocardial disorders 2 (1.2%) 0 HLT: Myocardial disorders NEC 2 (1.2%) 0 Left ventricular hypertrophy 2 (1.2%) 0 VASCULAR DISORDERS 12 (7.5%) 26 (8.0%) HLGT: Vascular hypertensive disorders 9 (5.6%) 17 (5.3%) HLT: Vascular hypertensive disorders NEC 9 (5.6%) 17 (5.3%) Hypertension 9 (5.6%) 17 (5.3%) RESPIRATORY, THORACIC AND MEDIASTINAL DISORDERS 27 (16.8%) 48 (14.9%) HLGT: Bronchial disorders (excl neoplasms) 4 (2.5%) 4 (1.2%) HLT: Bronchospasm and obstruction 4 (2.5%) 4 (1.2%) Asthma 2 (1.2%) 2 (0.6%) HLGT: Respiratory disorders NEC 18 (11.2%) 40 (12.4%) HLT: Breathing abnormalities 1 (0.6%) 11 (3.4%) Dyspnoea 0 7 (2.2%) HLT: Coughing and associated symptoms 11 (6.8%) 18 (5.6%) Cough 11 (6.8%) 18 (5.6%) HLT: Upper respiratory tract signs and symptoms 6 (3.7%) 13 (4.0%) Oropharyngeal pain 3 (1.9%) 8 (2.5%) HLGT: Upper respiratory tract disorders (excl infections) 6 (3.7%) 12 (3.7%) HLT: Nasal congestion and inflammations 2 (1.2%) 5 (1.5%) Nasal congestion 2 (1.2%) 2 (0.6%) HLT: Paranasal sinus disorders (excl infections and 4 (2.5%) 6 (1.9%) neoplasms) Sinus congestion 4 (2.5%) 6 (1.9%) GASTROINTESTINAL DISORDERS 62 (38.5%) 156 (48.3%) HLGT: Abdominal hernias and other abdominal wall conditions 4 (2.5%) 6 (1.9%) HLT: Umbilical hernias 1 (0.6%) 4 (1.2%) Umbilical hernia 1 (0.6%) 4 (1.2%) HLGT: Benign neoplasms gastrointestinal 1 (0.6%) 4 (1.2%) HLT: Benign neoplasms gastrointestinal (excl oral cavity) 1 (0.6%) 4 (1.2%) Colonic polyp 1 (0.6%) 4 (1.2%) HLGT: Dental and gingival conditions 3 (1.9%) 11 (3.4%) HLT: Dental pain and sensation disorders 3 (1.9%) 4 (1.2%) Toothache 2 (1.2%) 4 (1.2%) HLGT: Gastrointestinal inflammatory conditions 8 (5.0%) 14 (4.3%) HLT: Gastritis (excl infective) 8 (5.0%) 9 (2.8%) Gastritis 8 (5.0%) 9 (2.8%) HLGT: Gastrointestinal motility and defaecation conditions 27 (16.8%) 53 (16.4%) HLT: Diarrhoea (excl infective) 23 (14.3%) 35 (10.8%) Diarrhoea 23 (14.3%) 35 (10.8%) HLT: Gastrointestinal atonic and hypomotility disorders NEC 6 (3.7%) 21 (6.5%) Constipation 4 (2.5%) 13 (4.0%) Gastrooesophageal reflux disease 3 (1.9%) 10 (3.1%) HLGT: Gastrointestinal signs and symptoms 42 (26.1%) 113 (35.0%) HLT: Dyspeptic signs and symptoms 6 (3.7%) 6 (1.9%) Dyspepsia 6 (3.7%) 5 (1.5%) HLT: Flatulence, bloating and distension 2 (1.2%) 13 (4.0%) Abdominal distension 1 (0.6%) 5 (1.5%) Flatulence 1 (0.6%) 9 (2.8%) HLT: Gastrointestinal and abdominal pains (excl oral and 10 (6.2%) 16 (5.0%) throat) Abdominal pain 6 (3.7%) 7 (2.2%) Abdominal pain lower 3 (1.9%) 2 (0.6%) Abdominal pain upper 3 (1.9%) 6 (1.9%) HLT: Gastrointestinal signs and symptoms NEC 6 (3.7%) 8 (2.5%) Abdominal discomfort 5 (3.1%) 7 (2.2%) HLT: Nausea and vomiting symptoms 25 (15.5%) 91 (28.2%) Nausea 22 (13.7%) 84 (26.0%) Vomiting 8 (5.0%) 26 (8.0%) SKIN AND SUBCUTANEOUS TISSUE DISORDERS 21 (13.0%) 52 (16.1%) HLGT: Epidermal and dermal conditions 14 (8.7%) 39 (12.1%) HLT: Dermatitis and eczema 6 (3.7%) 14 (4.3%) Dermatitis 2 (1.2%) 4 (1.2%) Dermatitis contact 1 (0.6%) 5 (1.5%) Eczema 2 (1.2%) 3 (0.9%) HLT: Erythemas 2 (1.2%) 1 (0.3%) Erythema 2 (1.2%) 1 (0.3%) HLT: Pruritus NEC 2 (1.2%) 9 (2.8%) Pruritus 2 (1.2%) 9 (2.8%) HLT: Rashes, eruptions and exanthems NEC 3 (1.9%) 15 (4.6%) Rash 3 (1.9%) 13 (4.0%) HLGT: Skin appendage conditions 7 (4.3%) 9 (2.8%) HLT: Alopecias 2 (1.2%) 1 (0.3%) Alopecia 2 (1.2%) 1 (0.3%) HLT: Apocrine and eccrine gland disorders 5 (3.1%) 4 (1.2%) Heat rash 2 (1.2%) 0 Hyperhidrosis 3 (1.9%) 4 (1.2%) HLGT: Skin vascular abnormalities 0 5 (1.5%) HLT: Purpura and related conditions 0 5 (1.5%) Ecchymosis 0 4 (1.2%) MUSCULOSKELETAL AND CONNECTIVE TISSUE 43 (26.7%) 99 (30.7%) DISORDERS HLGT: Joint disorders 17 (10.6%) 41 (12.7%) HLT: Joint related disorders NEC 3 (1.9%) 4 (1.2%) Rotator cuff syndrome 2 (1.2%) 2 (0.6%) HLT: Joint related signs and symptoms 11 (6.8%) 25 (7.7%) Arthralgia 11 (6.8%) 24 (7.4%) HLT: Osteoarthropathies 5 (3.1%) 11 (3.4%) Osteoarthritis 4 (2.5%) 10 (3.1%) HLGT: Muscle disorders 11 (6.8%) 18 (5.6%) HLT: Muscle pains 3 (1.9%) 7 (2.2%) Myalgia 3 (1.9%) 6 (1.9%) HLT: Muscle related signs and symptoms NEC 8 (5.0%) 9 (2.8%) Muscle spasms 8 (5.0%) 9 (2.8%) HLGT: Musculoskeletal and connective tissue deformities (incl 4 (2.5%) 2 (0.6%) intervertebral disc disorders)
HLT: Intervertebral disc disorders NEC 2 (1.2%) 2 (0.6%) Intervertebral disc protrusion 2 (1.2%) 2 (0.6%) HLGT: Musculoskeletal and connective tissue disorders NEC 24 (14.9%) 54 (16.7%) HLT: Musculoskeletal and connective tissue pain and 22 (13.7%) 51 (15.8%) discomfort Back pain 14 (8.7%) 22 (6.8%) Flank pain 2 (1.2%) 5 (1.5%) Musculoskeletal pain 4 (2.5%) 9 (2.8%) Neck pain 3 (1.9%) 4 (1.2%) Pain in extremity 8 (5.0%) 15 (4.6%) HLT: Musculoskeletal and connective tissue signs and 2 (1.2%) 2 (0.6%) symptoms NEC Musculoskeletal stiffness 2 (1.2%) 2 (0.6%) HLGT: Synovial and bursal disorders 2 (1.2%) 8 (2.5%) HLT: Bursal disorders 1 (0.6%) 6 (1.9%) Bursitis 1 (0.6%) 6 (1.9%) RENAL AND URINARY DISORDERS 10 (6.2%) 24 (7.4%) HLGT: Urolithiases 2 (1.2%) 8 (2.5%) HLT: Renal lithiasis 2 (1.2%) 8 (2.5%) Nephrolithiasis 2 (1.2%) 7 (2.2%) GENERAL DISORDERS AND ADMINISTRATION SITE 32 (19.9%) 84 (26.0%) CONDITIONS HLGT: Administration site reactions 7 (4.3%) 23 (7.1%) HLT: Injection site reactions 7 (4.3%) 22 (6.8%) Injection site erythema 0 5 (1.5%) Injection site haematoma 3 (1.9%) 8 (2.5%) Injection site pain 4 (2.5%) 5 (1.5%) Injection site pruritus 0 4 (1.2%) Injection site reaction 1 (0.6%) 4 (1.2%) HLGT: Body temperature conditions 3 (1.9%) 6 (1.9%) HLT: Febrile disorders 2 (1.2%) 6 (1.9%) Pyrexia 2 (1.2%) 6 (1.9%) HLGT: General system disorders NEC 24 (14.9%) 65 (20.1%) HLT: Asthenic conditions 5 (3.1%) 30 (9.3%) Asthenia 2 (1.2%) 10 (3.1%) Fatigue 3 (1.9%) 21 (6.5%) HLT: General signs and symptoms NEC 1 (0.6%) 7 (2.2%) Influenza like illness 0 4 (1.2%) HLT: Oedema NEC 12 (7.5%) 23 (7.1%) Oedema 3 (1.9%) 6 (1.9%) Oedema peripheral 9 (5.6%) 17 (5.3%) HLT: Pain and discomfort NEC 7 (4.3%) 11 (3.4%) Chest discomfort 2 (1.2%) 1 (0.3%) Non-cardiac chest pain 0 5 (1.5%) Pain 5 (3.1%) 3 (0.9%) HLGT: Tissue disorders NEC 3 (1.9%) 2 (0.6%) HLT: Mass conditions NEC 2 (1.2%) 2 (0.6%) Cyst 2 (1.2%) 1 (0.3%) INVESTIGATIONS 20 (12.4%) 40 (12.4%) HLGT: Endocrine investigations (incl sex hormones) 7 (4.3%) 10 (3.1%) HLT: Gastrointestinal, pancreatic and APUD hormone 6 (3.7%) 10 (3.1%) analyses Blood calcitonin increased 6 (3.7%) 10 (3.1%) HLGT: Gastrointestinal investigations 4 (2.5%) 6 (1.9%) HLT: Digestive enzymes 3 (1.9%) 6 (1.9%) Blood amylase increased 1 (0.6%) 4 (1.2%) Lipase increased 3 (1.9%) 6 (1.9%) HLGT: Lipid analyses 1 (0.6%) 4 (1.2%) HLT: Triglyceride analyses 1 (0.6%) 4 (1.2%) Blood triglycerides increased 1 (0.6%) 4 (1.2%) HLGT: Metabolic, nutritional and blood gas investigations 6 (3.7%) 7 (2.2%) HLT: Carbohydrate tolerance analyses (incl diabetes) 5 (3.1%) 5 (1.5%) Blood glucose decreased 4 (2.5%) 4 (1.2%) HLGT: Physical examination topics 3 (1.9%) 7 (2.2%) HLT: Physical examination procedures 3 (1.9%) 7 (2.2%) Weight increased 2 (1.2%) 5 (1.5%) INJURY, POISONING AND PROCEDURAL COMPLICATIONS 20 (12.4%) 60 (18.6%) HLGT: Bone and joint injuries 6 (3.7%) 26 (8.0%) HLT: Limb injuries NEC (incl traumatic amputation) 5 (3.1%) 17 (5.3%) Joint sprain 2 (1.2%) 6 (1.9%) Limb injury 0 9 (2.8%) Meniscus lesion 3 (1.9%) 1 (0.3%) HLGT: Injuries NEC 12 (7.5%) 41 (12.7%) HLT: Muscle, tendon and ligament injuries 3 (1.9%) 7 (2.2%) Muscle strain 3 (1.9%) 4 (1.2%) HLT: Non-site specific injuries NEC 4 (2.5%) 17 (5.3%) Fall 1 (0.6%) 5 (1.5%) Road traffic accident 2 (1.2%) 3 (0.9%) HLT: Site specific injuries NEC 2 (1.2%) 3 (0.9%) Tooth fracture 2 (1.2%) 1 (0.3%) HLT: Skin injuries NEC 5 (3.1%) 17 (5.3%) Contusion 5 (3.1%) 12 (3.7%) Excoriation 0 4 (1.2%) SURGICAL AND MEDICAL PROCEDURES 5 (3.1%) 6 (1.9%) HLGT: Head and neck therapeutic procedures 2 (1.2%) 2 (0.6%) HLT: Paranasal therapeutic procedures 2 (1.2%) 1 (0.3%) Sinus operation 2 (1.2%) 1 (0.3%) HLGT: Vascular therapeutic procedures 2 (1.2%) 2 (0.6%) HLT: Arterial therapeutic procedures (excl aortic) 2 (1.2%) 2 (0.6%) Coronary artery bypass 2 (1.2%) 0 TEAE: Treatment Emergent Adverse Event, SOC: System Organ Class, HLGT: High Level Group Term, HLT: High Level Term, PT: Preferred Term. MedDRA version: 14.0. n (%) = number and percentage of patients wi.th at least one TEAE. Note: on-treatment period of the whole study = the time from the first dose of double-blind study medication up to 3 days after the last dose administration. Table sorted by SOC internationally agreed order and HLGT, HLT, PT by alphabetic order. Only SOC with at least one PT .gtoreq.1% in at least one group are presented.
Sequence CWU 1
1
2144PRTArtificial SequenceSynthetic
PeptideMOD_RES(44)..(44)AMIDATION, C-terminal 1His Gly Glu Gly Thr
Phe Thr Ser Asp Leu Ser Lys Gln Met Glu Glu1 5 10 15Glu Ala Val Arg
Leu Phe Ile Glu Trp Leu Lys Asn Gly Gly Pro Ser 20 25 30Ser Gly Ala
Pro Pro Ser Lys Lys Lys Lys Lys Lys 35 40239PRTArtificial
SequenceSynthetic PeptideMOD_RES(39)..(39)AMIDATION, C-terminal
2His Gly Glu Gly Thr Phe Thr Ser Asp Leu Ser Lys Gln Met Glu Glu1 5
10 15Glu Ala Val Arg Leu Phe Ile Glu Trp Leu Lys Asn Gly Gly Pro
Ser 20 25 30Ser Gly Ala Pro Pro Pro Ser 35
D00001
D00002
D00003
D00004
D00005
D00006
D00007
D00008
S00001
XML
uspto.report is an independent third-party trademark research tool that is not affiliated, endorsed, or sponsored by the United States Patent and Trademark Office (USPTO) or any other governmental organization. The information provided by uspto.report is based on publicly available data at the time of writing and is intended for informational purposes only.
While we strive to provide accurate and up-to-date information, we do not guarantee the accuracy, completeness, reliability, or suitability of the information displayed on this site. The use of this site is at your own risk. Any reliance you place on such information is therefore strictly at your own risk.
All official trademark data, including owner information, should be verified by visiting the official USPTO website at www.uspto.gov. This site is not intended to replace professional legal advice and should not be used as a substitute for consulting with a legal professional who is knowledgeable about trademark law.