Detection Apparatus, Detection Method, And Computer Readable Medium
Konada; Soichiro ; et al.
U.S. patent application number 16/172870 was filed with the patent office on 2019-05-02 for detection apparatus, detection method, and computer readable medium. The applicant listed for this patent is Yokogawa Electric Corporation. Invention is credited to Soichiro Konada, Takaaki Matsuda, Norio Tanaka.
| Application Number | 20190128288 16/172870 |
| Document ID | / |
| Family ID | 66243575 |
| Filed Date | 2019-05-02 |


| United States Patent Application | 20190128288 |
| Kind Code | A1 |
| Konada; Soichiro ; et al. | May 2, 2019 |
DETECTION APPARATUS, DETECTION METHOD, AND COMPUTER READABLE MEDIUM
Abstract
Easily detecting cavitation to occur in a pump. A detection apparatus, a detection method, and a program are provided. The detection apparatus includes: a discharge pressure acquiring unit to acquire discharge pressure data indicating discharge pressure of a pump; and a detector to detect occurrence of cavitation in the pump based on a fluctuation amount of a time waveform of the discharge pressure data during a target detection period. The detector may have: a fluctuation amount calculator to calculate the fluctuation amount of the discharge pressure data during the target detection period; and a determining unit to determine, in response to the calculated fluctuation amount becoming the reference fluctuation amount or more, that cavitation has occurred in the pump.
| Inventors: | Konada; Soichiro; (Tokyo, JP) ; Tanaka; Norio; (Tokyo, JP) ; Matsuda; Takaaki; (Tokyo, JP) | ||||||||||
| Applicant: |
|
||||||||||
|---|---|---|---|---|---|---|---|---|---|---|---|
| Family ID: | 66243575 | ||||||||||
| Appl. No.: | 16/172870 | ||||||||||
| Filed: | October 29, 2018 |
| Current U.S. Class: | 1/1 |
| Current CPC Class: | F04D 29/669 20130101; F04B 49/08 20130101; F04B 49/065 20130101; F04B 11/00 20130101; F04D 15/0088 20130101; F04B 2205/04 20130101; F04B 51/00 20130101; F04B 2205/02 20130101 |
| International Class: | F04D 29/66 20060101 F04D029/66; F04D 15/00 20060101 F04D015/00; F04B 49/06 20060101 F04B049/06 |
Foreign Application Data
| Date | Code | Application Number |
|---|---|---|
| Oct 31, 2017 | JP | 2017-211094 |
Claims
1. A detection apparatus comprising: a discharge pressure acquiring unit to acquire discharge pressure data indicating discharge pressure of a pump; and a detector to detect occurrence of cavitation in the pump based on a fluctuation amount of a time waveform of the discharge pressure data during a target detection period.
2. The detection apparatus according to claim 1, wherein the detector has: a fluctuation amount calculator to calculate the fluctuation amount of the discharge pressure data during the target detection period; and a determining unit to determine that cavitation has occurred in the pump, in response to the calculated fluctuation amount becoming reference fluctuation amount or more.
3. The detection apparatus according to claim 2, wherein the fluctuation amount calculator calculates, as the fluctuation amount, difference between reference pressure data and the discharge pressure data during the target detection period.
4. The detection apparatus according to claim 3, wherein the fluctuation amount calculator calculates the difference between the discharge pressure data during the target detection period and the reference pressure data for a time length equal to the target detection period as the fluctuation amount.
5. The detection apparatus according to claim 3, wherein the fluctuation amount calculator uses the discharge pressure data that is acquired by the discharge pressure acquiring unit before the target detection period as the reference pressure data.
6. The detection apparatus according to claim 5, further comprising: a suction pressure acquiring unit to acquire suction pressure data showing suction pressure of the pump, wherein the fluctuation amount calculator uses as the reference pressure data the discharge pressure data acquired corresponding to timing at which the suction pressure data changes from a value exceeding a threshold value to a value equal to or less than the threshold value.
7. The detection apparatus according to claim 6, wherein the fluctuation amount calculator uses the discharge pressure data that is acquired corresponding to a timing at which the suction pressure data changes from being a positive pressure value to a negative pressure value as the reference pressure data.
8. The detection apparatus according to claim 6, wherein the fluctuation amount calculator uses discharge pressure data for a time length equal to the target detection period immediately before the timing as the reference pressure data.
9. The detection apparatus according to claim 3, wherein the fluctuation amount calculator is to, relatively shift the reference pressure data to the discharge pressure data during the target detection period, and match a mean value of the reference pressure data with a mean value of the discharge pressure data during the target detection period, and calculate, as the fluctuation amount, difference between the discharge pressure data and the reference pressure data during the target detection period, of which mean values are matched.
10. The detection apparatus according to claim 1, further comprising: a fluctuation amount accumulating unit to calculate a cumulative value of the fluctuation amount; and a maintenance managing unit to determine at least one of time to maintain and time to replace the pump based on the cumulative value of the fluctuation amount.
11. A detection apparatus comprising: a suction pressure acquiring unit to acquire suction pressure data indicating suction pressure of a pump; a discharge pressure acquiring unit to acquire discharge pressure data indicating discharge pressure of the pump; and a detector to detect whether cavitation is occurring in the pump based on the discharge pressure data in response to the suction pressure data becoming a threshold value or less.
12. The detection apparatus according to claim 11, further comprising: a predicting unit to predict occurrence of cavitation in the pump in response to the suction pressure data becoming the threshold value or less.
13. A detection apparatus comprising: a discharge pressure acquiring unit to acquire discharge pressure data indicating discharge pressure of a pump; and a detector to detect occurrence of cavitation in the pump based on difference between the discharge pressure data during a target detection period and the discharge pressure data before the target detection period.
14. A detection method comprising: acquiring discharge pressure data indicating discharge pressure of a pump; and detecting occurrence of cavitation in the pump based on a fluctuation amount of a time waveform of the discharge pressure data during a target detection period.
15. A computer readable medium to store a program, the program causing a computer to serve as: a discharge pressure acquiring unit to acquire discharge pressure data indicating discharge pressure of a pump; and a detector to detect occurrence of cavitation in the pump based on a fluctuation amount of a time waveform of the discharge pressure data during a target detection period.
16. A detection method comprising: acquiring suction pressure data indicating suction pressure of a pump; acquiring discharge pressure data indicating discharge pressure of the pump; and detecting whether cavitation is occurring in the pump based on the discharge pressure data in response to the suction pressure data becoming a threshold value or less.
17. A computer readable medium to store a program, the program causing a computer to serve as: a suction pressure acquiring unit to acquire suction pressure data indicating suction pressure of a pump; a discharge pressure acquiring unit to acquire discharge pressure data indicating discharge pressure of the pump; and a detector to detect whether cavitation is occurring in the pump based on the discharge pressure data in response to the suction pressure data becoming a threshold value or less.
18. A detection method comprising: acquiring discharge pressure data indicating discharge pressure of a pump; and detecting occurrence of cavitation in the pump based on difference between the discharge pressure data during a target detection period and the discharge pressure data before the target detection period.
19. A computer readable medium to store a program, the program causing a computer to serve as: a discharge pressure acquiring unit to acquire discharge pressure data indicating discharge pressure of a pump; and a detector to detect occurrence of cavitation in the pump based on difference between the discharge pressure data during a target detection period and the discharge pressure data before the target detection period.
Description
[0001] The contents of the following Japanese patent application are incorporated herein by reference.
[0002] NO. 2017-211094 filed in JP on Oct. 31, 2017.
BACKGROUND
1. Technical Field
[0003] The present invention relates to a detection apparatus, a detection method, and a program.
2. Related Art
[0004] Cavitation may occur to a pump that sucks and discharges liquid due to the liquid evaporating. Conventionally, a technique to detect occurrence of such cavitation has been known, in which frequency analysis is performed on discharge pressure of the pump (refer to Patent Document 1, for example).
[0005] Patent Document 1: Japanese Patent Application Publication No. S64-45975.
[0006] However, according to the technique in Patent Document 1, an arithmetic processing of the frequency analysis can be a large burden. For example, in a case of a plant including numerous pumps, i.e., from hundreds to thousands or more pumps, it is possible that cavitation is treated for each pump. Thus, a technique to efficiently detect cavitation by performing less arithmetic processing is desired.
SUMMARY
[0007] A first aspect of the present invention provides a detection apparatus, a detection method, and a program. The detection apparatus includes: a discharge pressure acquiring unit to acquire discharge pressure data indicating discharge pressure of a pump; and a detector to detect occurrence of cavitation in the pump based on a fluctuation amount of a time waveform of the discharge pressure data during a target detection period.
[0008] A second aspect of the present invention provides a detection apparatus, a detection method, and a program. The detection apparatus includes: a suction pressure acquiring unit to acquire suction pressure data indicating suction pressure of a pump; a discharge pressure acquiring unit to acquire discharge pressure data indicating discharge pressure of the pump; and a detector to detect whether cavitation is occurring in the pump based on the discharge pressure data in response to the suction pressure data becoming a threshold value or less.
[0009] A third aspect of the present invention provides a detection apparatus, a detection method, and a program. The detection apparatus includes: a discharge pressure acquiring unit to acquire discharge pressure data indicating discharge pressure of a pump; and a detector to detect occurrence of cavitation in the pump based on difference between the discharge pressure data during a target detection period and the discharge pressure data before the target detection period.
[0010] The summary clause does not necessarily describe all necessary features of the embodiments of the present invention. The present invention may also be a sub-combination of the features described above.
BRIEF DESCRIPTION OF THE DRAWINGS
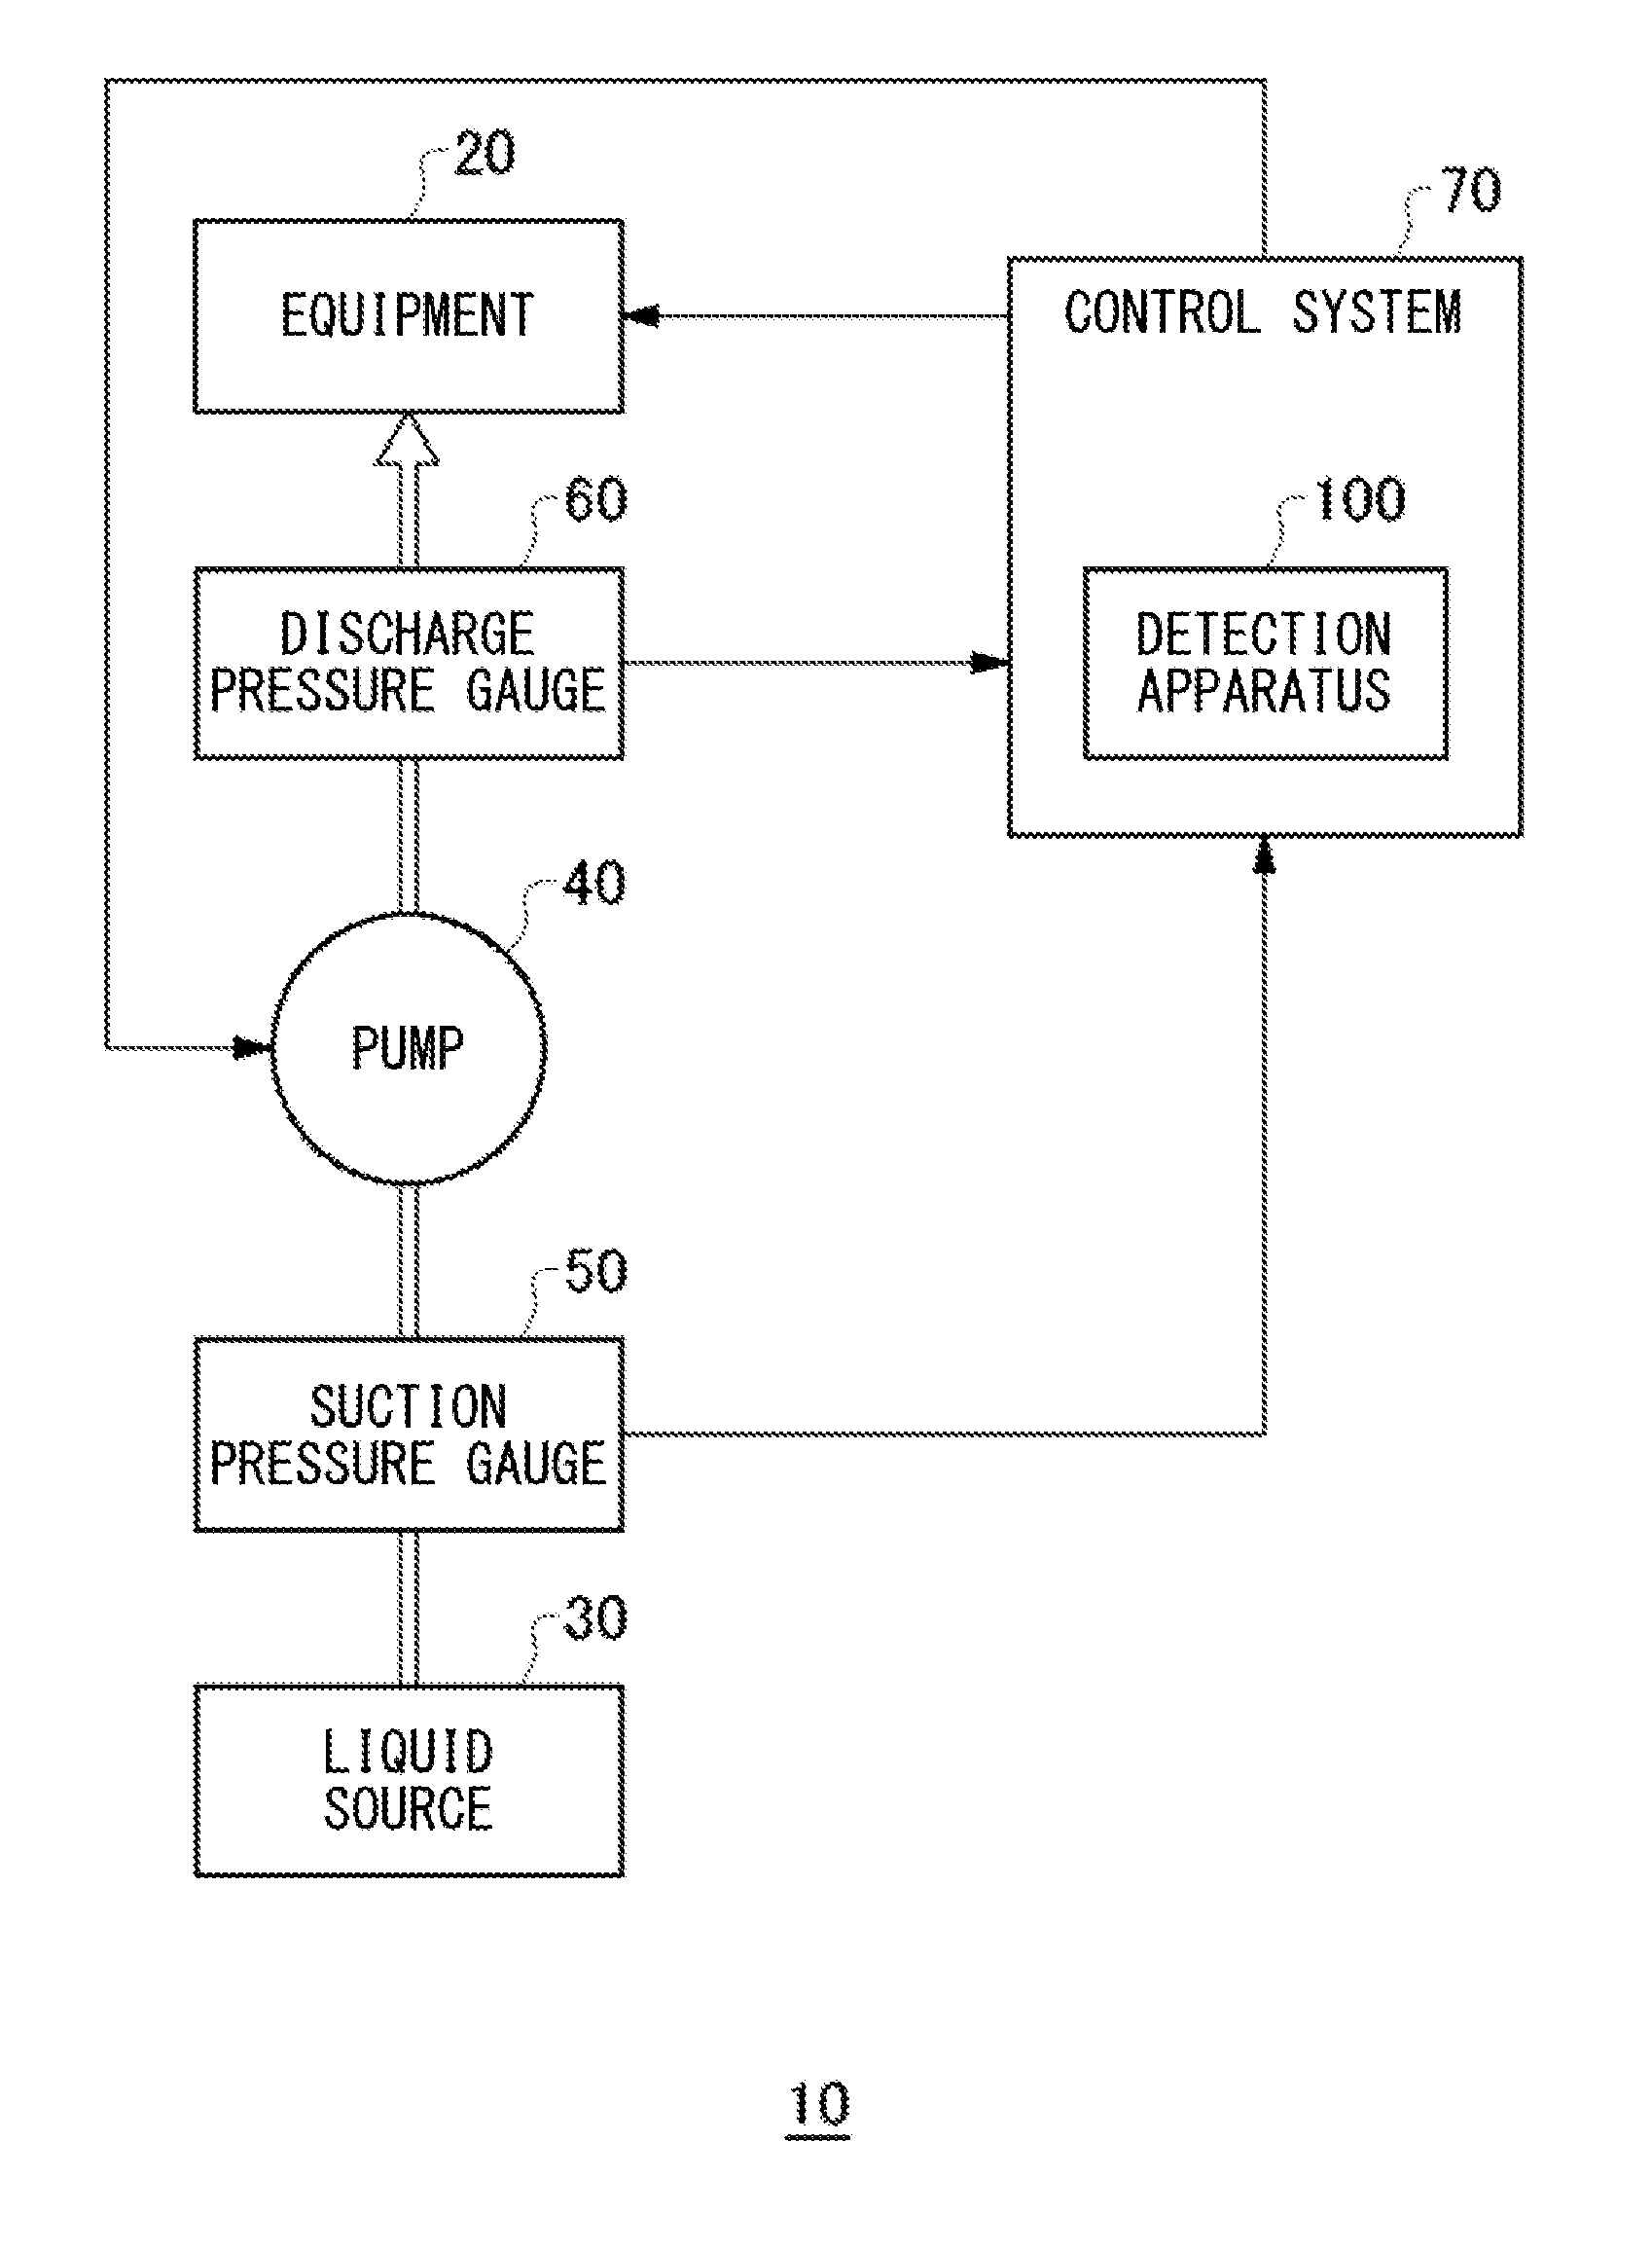
[0011] FIG. 1 illustrates an exemplary configuration of a plant 10 to which a detection apparatus 100 according to the present embodiment is provided.
[0012] FIG. 2 illustrates an example of suction pressure data and discharge pressure data acquired by the detection apparatus 100 according to the present embodiment.
[0013] FIG. 3 illustrates an exemplary configuration of the detection apparatus 100 according to the present embodiment.
[0014] FIG. 4 illustrates an exemplary operation flow of the detection apparatus 100 according to the present embodiment.
[0015] FIG. 5 illustrates one example of a fluctuation amount of discharge pressure data calculated by a fluctuation amount calculator 160 according to the present embodiment.
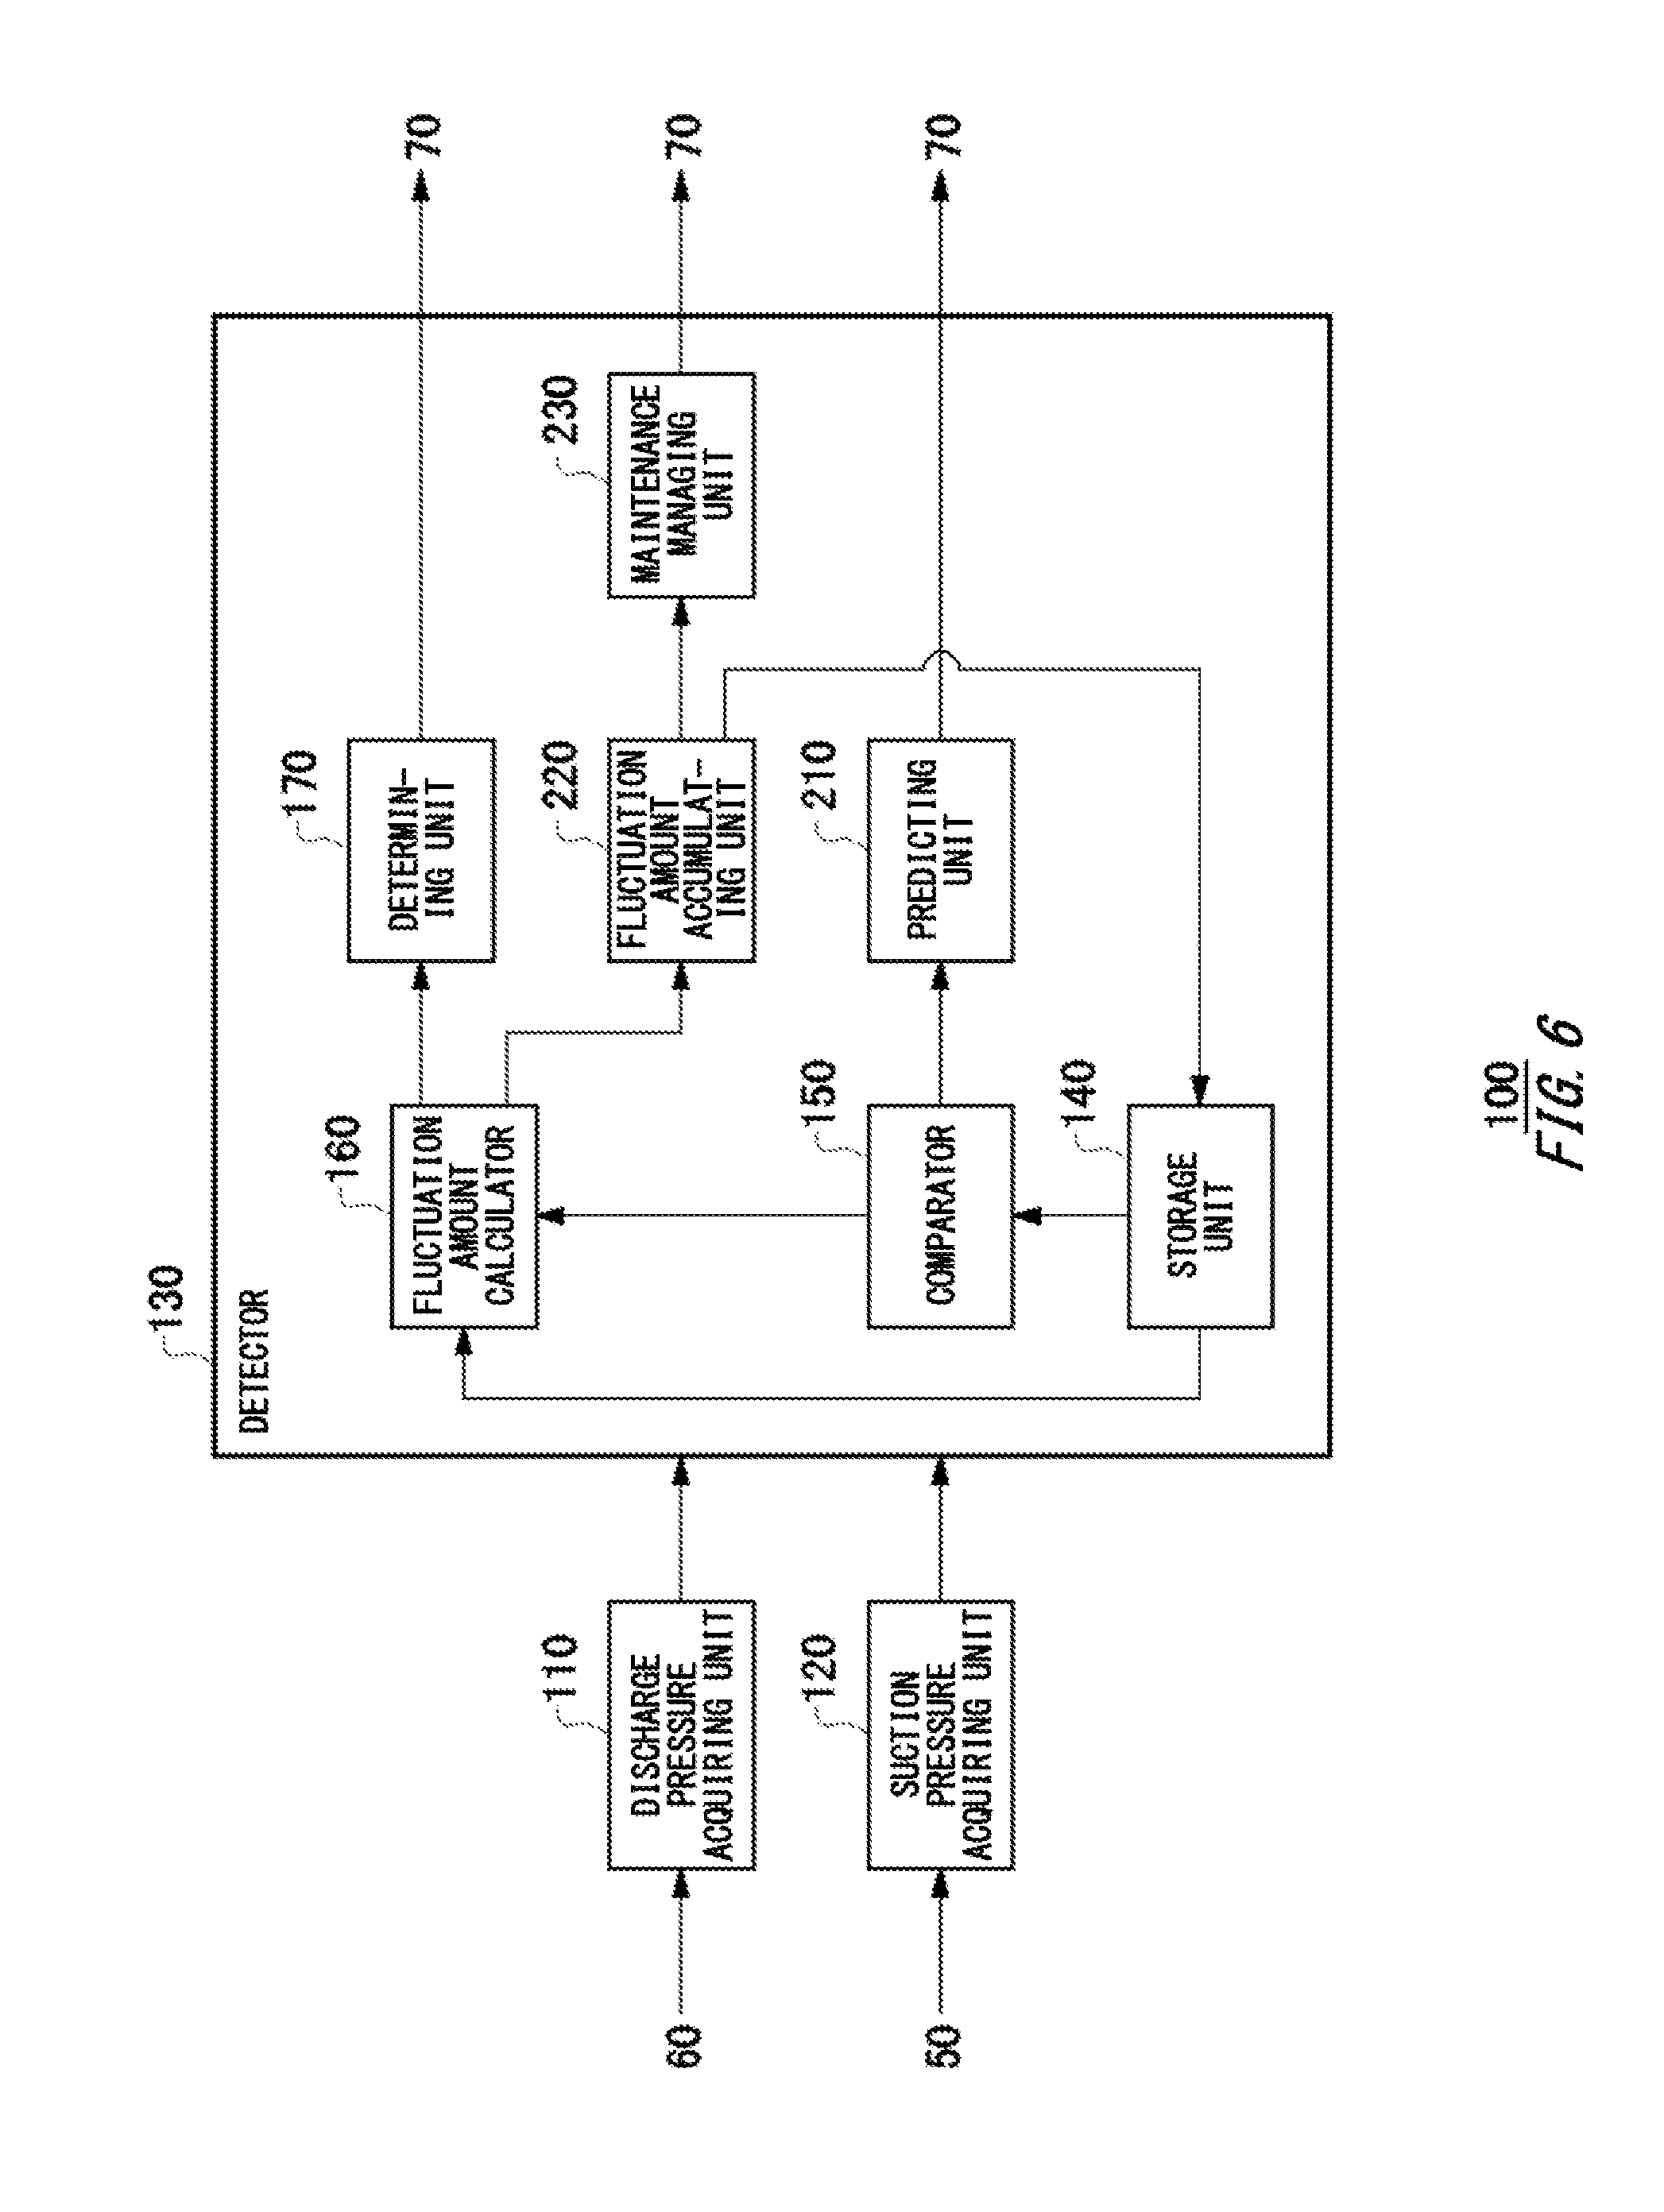
[0016] FIG. 6 illustrates a modification example of the detection apparatus 100 according to the present embodiment.
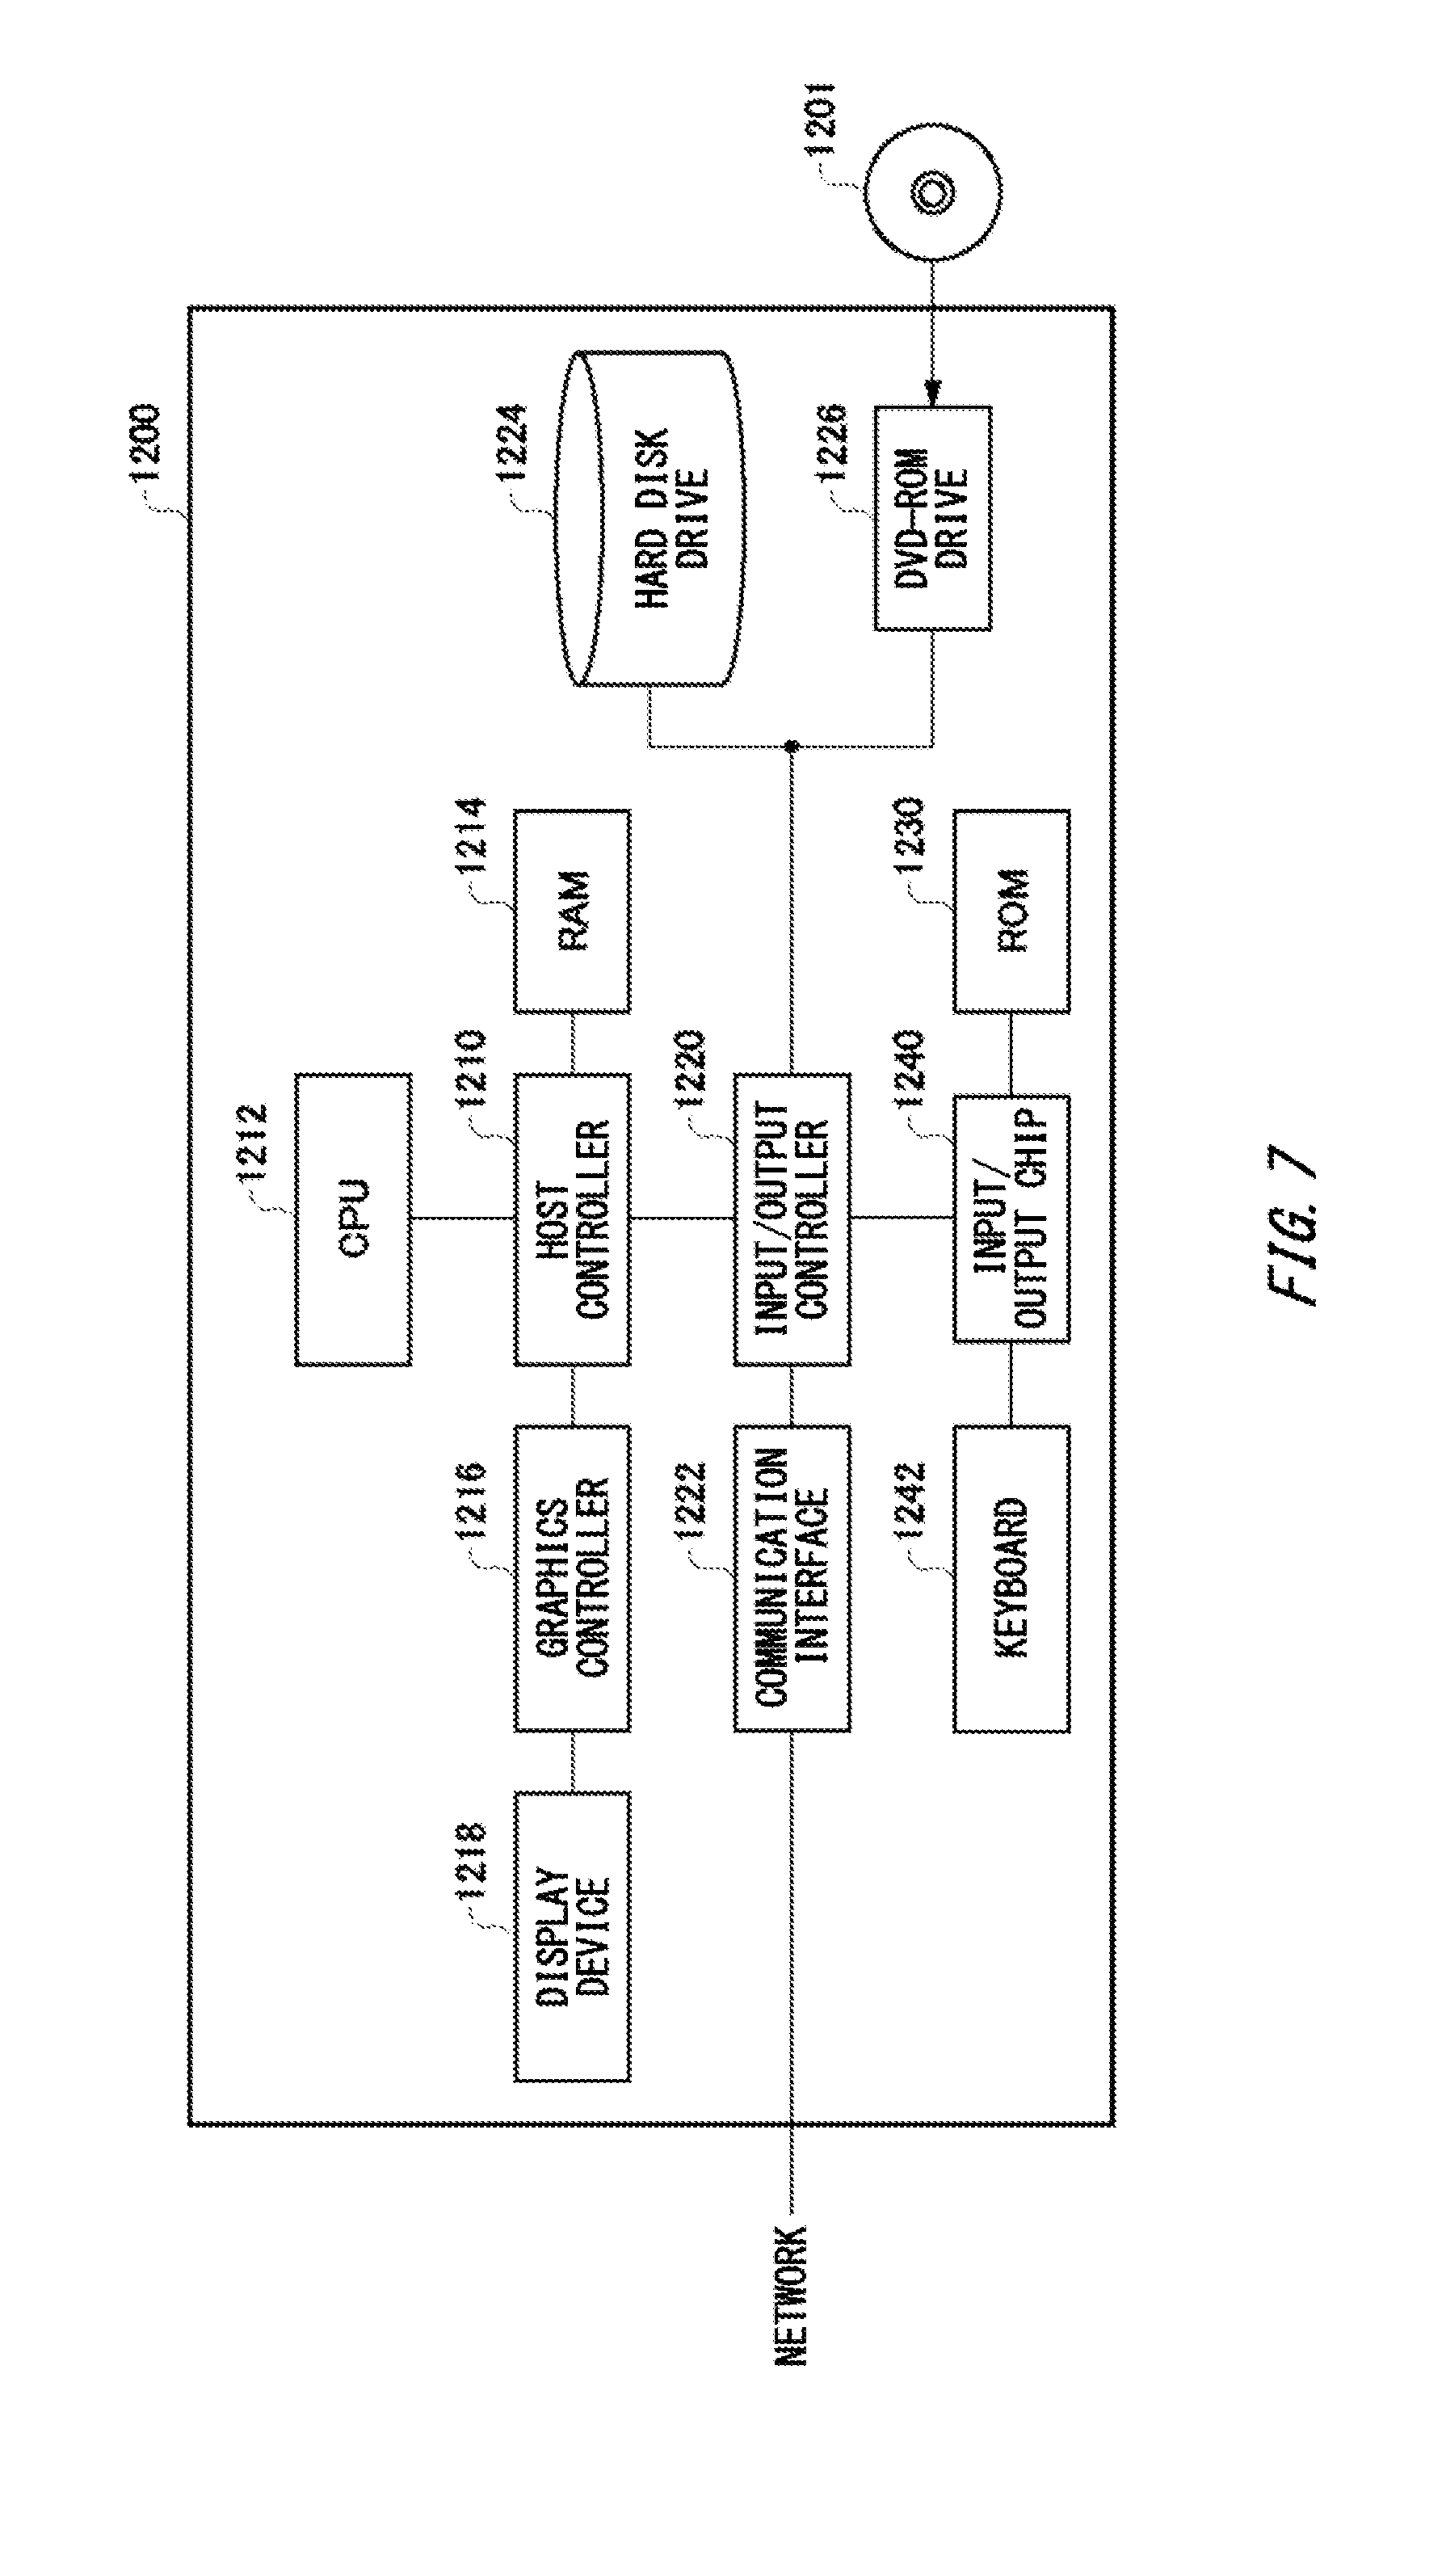
[0017] FIG. 7 illustrates an exemplary configuration of a computer 1200 in which a plurality of aspects of the present invention may be embodied.
DESCRIPTION OF EXEMPLARY EMBODIMENTS
[0018] Hereinafter, the present invention will be described with reference to embodiments of the invention. However, the following embodiments shall not be construed as limiting the claimed invention. Also, not all combinations of features described in the embodiments are essential for means to solve problems provided by aspects of the invention.
[0019] FIG. 1 illustrates an exemplary configuration of a plant 10 to which a detection apparatus 100 according to the present embodiment is provided. The plant 10 is a system to control equipment or the like while supplying liquid to the equipment or the like by a pump. The plant 10 may be at least a part of a plant facility, machinery, a production apparatus, power generating apparatus, or the like. The plant 10 includes equipment 20, a liquid source 30, a pump 40, a suction pressure gauge 50, a discharge pressure gauge 60, and a control system 70. Note that, at least some of the equipment 20, the liquid source 30, the pump 40, the suction pressure gauge 50, the discharge pressure gauge 60, and a detection apparatus 100 which are included in the plant 10 may be plural.
[0020] The equipment 20 is subject to control by the plant 10. The equipment 20 may be at least a part for plant equipment, machinery, a production apparatus, power generating apparatus, a storage apparatus, or the like. The equipment 20 may include an apparatus supplied with liquid such as water, oil, fuel, coolant, or chemicals in order to perform processing operation using the liquid. The equipment 20 may include a plurality of apparatuses.
[0021] The liquid source 30 stores or supplies the liquid supplied to the equipment 20. The liquid source 30 may be a tank or the like to preserve and store the liquid, and may also maintain pressure of the liquid. The liquid source 30 may also be a well, an oil well, or the like, which is provided in a region where a resource such as groundwater or oil field is accumulated or reserved. The liquid source 30 may also be a river, a pond, a lake, a dam, or the like. The liquid source 30 may also be a tank to store liquid supplied by another pump. The liquid source 30 may also be a pipe connected to a tank or the like.
[0022] The pump 40 supplies the equipment 20 with the liquid of the liquid source 30. The pump 40 connects between the liquid source 30 and the equipment 20 using a valve, pipe, or the like. FIG. 1 illustrates an example of a moving direction of liquid inside the pipe with an arrow from the liquid source 30 to the equipment 20. The pump 40 may be a volute pump having a rotor in a vane shape (an impeller) or the like. Also, the pump 40 may be a diffuser pump, a cascade pump, an axial flow pump, a mixed flow pump, a cross flow pump, or the like. A plurality of pumps 40 may be arranged in the plant 10.
[0023] The suction pressure gauge 50 is provided between the liquid source 30 and the pump 40 and measures suction pressure of the pump 40. The discharge pressure gauge 60 is provided between the equipment 20 and the pump 40 and measures discharge pressure of the pump 40. Each of the suction pressure gauge 50 and the discharge pressure gauge 60 is, for example, a differential pressure flow meter, a pressure transmitter, or the like. The suction pressure gauge 50 and the discharge pressure gauge 60 may serve as sensors to detect operation of the pump 40. A suction pressure gauge 50 and a discharge pressure gauge 60 may be provided to each pump 40. FIG. 1 illustrates an example in which the plant 10 is provided with one liquid source 30, one pump 40, one suction pressure gauge 50, and one discharge pressure gauge 60. Note that, at least one of the suction pressure gauge 50 and the discharge pressure gauge 60 may be used to control the plant 10.
[0024] The control system 70 controls a part or the whole of the equipment 20, the pump 40, and the like based on a measurement result of a measuring instrument such as a sensor provided in a plant. Also, the control system 70 may control a valve provided in a pipe or the like, which is provided in a plant. For example, the control system 70 controls and/or monitors operation of the equipment 20, the pump 40, the valve, and the like based on measurement data obtained by measuring the operation of the equipment 20, and measurement data for pressure, temperature, a flow rate, storage capacity, or the like of fluid of liquid etc. that is treated in the plant 10.
[0025] The control system 70 is connected to the equipment 20 or the like via wireless and/or wired communication equipment, and may be arranged at a position away from the equipment 20 or the like. The control system 70 may be constructed as an automatic operation system and/or a maintenance system such as a DCS (Distributed Control system) and a SCADA (Supervisory Control And Data Acquisition) system. In this case, the control system 70 may exchange control data and measurement data with each unit at a frequency of approximately several Hz to several kHz.
[0026] It is desirable that the above-mentioned plant 10 can perform control, maintenance, management, or the like of the equipment 20 as well as the pump 40. For example, cavitation or the like may occur to the pump 40 and may cause noise, and in some cases, it results in degradation and/or breakage of the pump 40. It is desirable for the plant 10 to be able to perform control, maintenance, management, or the like in order to suppress as much occurrence of such unstable operation as possible by monitoring the operation of the pump 40.
[0027] It is known to detect cavitation of the pump 40 in order to monitor the operation of such pump 40 by: performing numerical processing such as the Fourier transform on the discharge pressure data acquired from the discharge pressure gauge 60; and detecting abnormality on a frequency axis. However, it is difficult to detect the abnormality on the frequency axis unless the unstable operation of the pump 40 progresses to the state in which an obvious fluctuation characteristic of a certain frequency or a certain frequency band occurs to the discharge pressure data. That is, temporal difference occurs from the occurrence of cavitation to the detection of the cavitation, which makes it difficult to deal with the cavitation in some cases.
[0028] Also, such plant 10 illustrated in FIG. 1 can be a large-scale control system including from hundreds to thousands or more of pumps 40. Thus, providing one processing circuit to perform numerical processing for each pump 40 causes high cost. Furthermore, since the plant 10 communicates with each unit at a frequency of approximately several Hz to several kHz, it is difficult to perform accumulation of data, numerical processing, analysis of a result, or the like at high speed. Hence, it is desired for such plant 10 to detect cavitation in real time while preventing increase in cost, and further to predict occurrence of cavitation.
[0029] Therefore, the detection apparatus 100 is provided to such plant 10 to detect cavitation in real time based on temporal fluctuation of discharge pressure data. The detection apparatus 100 is configured to be applicable to an existing plant 10 or the like, and can detect cavitation by acquiring the discharge pressure data or the like. Note that, the detection apparatus 100 may be included in the control system 70. Also, the detection apparatus 100 may be included in a measuring instrument such as a sensor provided in the plant 10. FIG. 1 illustrates an example in which the detection apparatus 100 is included in the control system 70. First, suction pressure data and discharge pressure data acquired by the detection apparatus 100 will be described.
[0030] FIG. 2 illustrates an example of suction pressure data and discharge pressure data acquired by the detection apparatus 100 according to the present embodiment. In FIG. 2, the horizontal axes represent the time and vertical axes represent the suction pressure and the discharge pressure respectively. FIG. 2 is an example to show change in the suction pressure data and the discharge pressure data, each of which correspond to approximately the same lapse of time, by showing each measurement data in approximately the same time scale. Note that, the suction pressure data is an example of a measurement result of the suction pressure gauge 50, and the discharge pressure data is an example of a measurement result of the discharge pressure gauge 60.
[0031] Along with the operation of the pump 40, the suction pressure data may show pressure lower than the atmospheric pressure (negative pressure). FIG. 2 shows an example in which the suction pressure data gradually decreases and shows pressure lower than the atmospheric pressure from time t.sub.0 onwards. Accordingly, if the suction pressure becomes lower than the atmospheric pressure, cavitation may occur due to pressure of liquid supplied from the pump 40 to the equipment 20 being equal to or lower than saturated steam pressure and the liquid evaporating.
[0032] Note that, as shown in FIG. 2, if a noise component is superimposed on the suction pressure data, the suction pressure data may show pressure lower than the atmospheric pressure before time t.sub.0. Therefore, it is desirable that the detection apparatus 100 performs filtering processing on the suction pressure data such as averaging, smoothing, noise removing, and/or high frequency removal. Also, the suction pressure gauge 50 and the discharge pressure gauge 60 may supply data on which such filtering processing has been performed.
[0033] The discharge pressure data gradually decreases corresponding to the gradual decrease of the suction pressure data. FIG. 2 shows an example in which the gradual decrease in the suction pressure data continues with the lapse of time, and unstable fluctuation occurs to the discharge pressure data from approximately time t.sub.n onwards. Note that, with respect to the discharge pressure data from time t.sub.n onwards, unstable fluctuation is occurring and causing the discharge pressure data to oscillate, and an amplitude value is gradually increasing. Yet the discharge pressure data is still in a state in which obvious oscillation of a certain frequency or a certain frequency band is not occurring. That is, for example, even if the Fourier transform is performed on the discharge pressure data in period T, i.e., from time t.sub.n to time t.sub.n+T, amplitude strength of a certain frequency band may not be the frequency characteristic that is different compared with a amplitude strength of another band. Thus, robustness is also required in the detection apparatus 100.
[0034] Hence, if the discharge pressure data is converted to a frequency axis, cavitation cannot be detected until an obvious frequency signal occurs with the time further preceding the time range shown in FIG. 2. The detection apparatus 100 according to the present embodiment can detect occurrence of cavitation in the time range illustrated in FIG. 2 based on such time waveforms shown in FIG. 2. Such detection apparatus 100 will be described next.
[0035] FIG. 3 illustrates an exemplary configuration of the detection apparatus 100 according to the present embodiment. FIG. 3 illustrates an exemplary configuration of detection apparatus 100 that detects cavitation occurring in the pump 40 based on suction pressure data and discharge pressure data. Note that, each of the suction pressure gauge 50, the discharge pressure gauge 60, and the control system 70 may be connected to the detection apparatus 100 via wired or wireless connection or the like. The detection apparatus 100 may be connected to them via a network or the like. The detection apparatus 100 includes a discharge pressure acquiring unit 110, a suction pressure acquiring unit 120, and a detector 130.
[0036] The discharge pressure acquiring unit 110 acquires discharge pressure data indicating the discharge pressure of the pump 40. The discharge pressure acquiring unit 110 may be connected to the discharge pressure gauge 60 and may receive the discharge pressure data from the discharge pressure gauge 60. Also, if the discharge pressure data is stored in an external database or the like, the discharge pressure acquiring unit 110 may access the database or the like to acquire the discharge pressure data. Additionally, the discharge pressure acquiring unit 110 may acquire the discharge pressure data from the control system 70. The discharge pressure acquiring unit 110 supplies the detector 130 with the acquired discharge pressure data.
[0037] The suction pressure acquiring unit 120 acquires the suction pressure data indicating suction pressure of the pump 40. The suction pressure acquiring unit 120 may be connected to the suction pressure gauge 50 and may receive the suction pressure data from the suction pressure gauge 50. Also, if the suction pressure data is stored in a database or the like, the suction pressure acquiring unit 120 may access the database or the like to acquire the suction pressure data. Additionally, the suction pressure acquiring unit 120 may acquire the suction pressure data from the control system 70. The suction pressure acquiring unit 120 supplies the detector 130 with the acquired suction pressure data.
[0038] In response to the suction pressure data becoming a threshold value or less, the detector 130 detects whether cavitation is occurring in the pump 40 based on the discharge pressure data. The detector 130 detects the occurrence of cavitation in the pump 40 based on, for example, a fluctuation amount of a time waveform of discharge pressure data during a target detection period. The detector 130 has a storage unit 140, a comparator 150, a fluctuation amount calculator 160, and a determining unit 170.
[0039] The storage unit 140 stores the suction pressure data and the discharge pressure data. Also, the storage unit 140 may be able to store data processed by the detection apparatus 100. The storage unit 140 may store each of intermediate data, a calculated result, a parameter, and the like. The intermediate data is calculated (or utilized) by the detection apparatus 100 in a process of generating a detection result. Also, in response to a request from each unit in the detection apparatus 100, the storage unit 140 may supply the stored data to the requesting unit. For example, in response to a request from the comparator 150, the storage unit 140 supplies the comparator 150 with the stored suction pressure data.
[0040] The comparator 150 compares the suction pressure data with the predetermined threshold value. For example, the threshold value may be a pressure data value corresponding to the atmospheric pressure. In response to the suction pressure data becoming the threshold value or less, the comparator 150 notifies the fluctuation amount calculator 160 of the comparison result. That is, the comparator 150 may notify the fluctuation amount calculator 160 about the suction pressure data changing from being a positive pressure value to a negative pressure value.
[0041] The fluctuation amount calculator 160 calculates a fluctuation amount of the discharge pressure data during the target detection period. For example, in response to the notification from the comparator 150, the fluctuation amount calculator 160 reads out the discharge pressure data from the storage unit 140 and calculates a fluctuation amount of the discharge pressure data. The fluctuation amount calculator 160 may set reference pressure data and may calculate the fluctuation amount of the discharge pressure data from the difference between the reference pressure data and the discharge pressure data. Here, the fluctuation amount calculator 160 uses, for example, the discharge pressure data acquired by the discharge pressure acquiring unit 110 before the target detection period as the reference pressure data. The fluctuation amount calculator 160 supplies the determining unit 170 with the calculated fluctuation amount.
[0042] The determining unit 170 determines, in response to a fluctuation amount calculated by the fluctuation amount calculator 160 becoming the reference fluctuation amount or more, that cavitation has occurred in the pump 40. In response to determining the occurrence of cavitation, the determining unit 170 notifies the control system 70 of the determination result.
[0043] As described above, the detection apparatus 100 according to the present embodiment detects occurrence of cavitation based on the fluctuation amount of the discharge pressure data. More specific operation of such detection apparatus 100 will be described next.
[0044] FIG. 4 illustrates an exemplary operation flow of the detection apparatus 100 according to the present embodiment. The detection apparatus 100 performs the operation flow illustrated in FIG. 4 to detect occurrence of cavitation.
[0045] First, the detection apparatus 100 acquires discharge pressure data and suction pressure data (S410). That is, the discharge pressure acquiring unit 110 acquires the discharge pressure data and the suction pressure acquiring unit 120 acquires the suction pressure data. The pressure data acquired by each of the discharge pressure acquiring unit 110 and the suction pressure acquiring unit 120 may be stored in the storage unit 140. The discharge pressure acquiring unit 110 may acquire pressure data every time the discharge pressure gauge 60 performs sampling on the pressure data, and the suction pressure acquiring unit 120 may acquire pressure data every time the suction pressure gauge 50 performs sampling on the pressure data. Instead of this, they may collectively acquire the pressure data every time a predetermined number of times of sampling has been performed.
[0046] Next, the comparator 150 compares the suction pressure data with a threshold value (S420). For example, if the suction pressure data exceeds the threshold value (No at S420), the comparator 150 determines that a tendency of cavitation is not detected. In this case, the detection apparatus 100 returns to S410 and acquires discharge pressure data and suction pressure data to be sampled next.
[0047] Note that, if the suction pressure acquiring unit 120 acquires the next suction pressure data and stores it in the storage unit 140, the previous suction pressure data may be erased. In this case, the suction pressure acquiring unit 120 may overwrite the previously acquired suction pressure data stored in the storage unit 140 with the suction pressure data acquired next.
[0048] Also, the discharge pressure acquiring unit 110 may erase discharge pressure data before the predetermined period T. For example, if the next discharge pressure data is acquired at t.sub.k+1, the discharge pressure acquiring unit 110 erases discharge pressure data before time t.sub.k-T. In this case, the discharge pressure acquiring unit 110 may overwrite the discharge pressure data before time t.sub.k-T, which is stored in the storage unit 140, with discharge pressure data acquired next at time t.sub.k+1. Accordingly, if pressure data is acquired at time t.sub.k, the storage unit 140 at least stores the suction pressure data and the discharge pressure data acquired at time t.sub.k and the discharge pressure data acquired from time t.sub.k-T, which is back in time from time t.sub.k by a period T, to time t.sub.k.
[0049] The discharge pressure acquiring unit 110, the suction pressure acquiring unit 120, and the comparator 150 repeat acquiring the pressure data and comparing the suction pressure data with the threshold value until the suction pressure data becomes the threshold value or less. Then, if the suction pressure data becomes the threshold value or less (Yes at S420), the comparator 150 determines that a tendency of cavitation is starting to appear, and notifies the fluctuation amount calculator 160 of the comparison result. Here, an example in which the threshold value is a pressure data value corresponding to the atmospheric pressure, and the comparator 150 notifies the fluctuation amount calculator 160 about the suction pressure data becoming the threshold value or less at time t.sub.0 as shown in FIG. 2 is described.
[0050] Next, the fluctuation amount calculator 160 sets reference pressure data (S430). Here, time t.sub.0-T is back in time from the time t.sub.0 by a period T. For example, the fluctuation amount calculator 160 reads out the discharge pressure data acquired from the storage unit 140 from time t.sub.0-T to time t.sub.0 and sets the discharge pressure data as reference pressure data. That is, the fluctuation amount calculator 160 uses as the reference pressure data the data including the discharge pressure data acquired corresponding to a timing t.sub.0 at which the suction pressure data is changed from being a value exceeding the threshold value to the threshold value or less. In the present example, an example in which the fluctuation amount calculator 160 uses as reference pressure data the discharge pressure data acquired from timing t.sub.0-T to the timing t.sub.0 is described. The timing t.sub.0-T is back in time from a predetermined period T by the timing t.sub.0.
[0051] The fluctuation amount calculator 160 may store the reference pressure data that has been set in the storage unit 140. Note that, if previous reference pressure data has been stored in the storage unit 140, the fluctuation amount calculator 160 may overwrite it with the newest reference pressure data that has been set.
[0052] Next, the detection apparatus 100 acquires discharge pressure data and suction pressure data at next sampling time (S440). That is, the discharge pressure acquiring unit 110 acquires the discharge pressure data and the suction pressure acquiring unit 120 acquires the suction pressure data. Note that, if it is immediately after time t.sub.0 elapses, the discharge pressure acquiring unit 110 and the suction pressure acquiring unit 120 may continue acquiring the pressure data until a period T elapses, i.e., until time t.sub.0+T.
[0053] Next, the comparator 150 compares the suction pressure data with a threshold value (S450). If the comparison result shows that the suction pressure data exceeds the threshold value (Yes at S450), the detection apparatus 100 may determine that a tendency of cavitation has disappeared and a normal operation state has been restored, and return to S410. In this case, the comparator 150 may erase information about the reference pressure data from the storage unit 140.
[0054] Note that, it is desirable that the threshold value used for comparison by the comparator 150 at S450 is different from the threshold value used at S420. For example, if the threshold value used at S420 is a first threshold value, a second threshold value used at S450 is larger than the first threshold value by a predetermined value. That is, in order to reduce effect of noise or the like that is superimposed on the suction pressure data, the comparator 150 may perform comparison having hysteresis. For example, the second threshold value is obtained by adding acceptable magnitude of noise or the like to the first threshold value.
[0055] If the suction pressure data is the threshold value or less (No at S450), the comparator 150 may determine that the tendency of cavitation is continuing and notify the fluctuation amount calculator 160 of this fact.
[0056] Next, the fluctuation amount calculator 160 calculates a fluctuation amount of discharge pressure data (S460). The fluctuation amount calculator 160 sets as a target detection period a period from timing t.sub.2-T to timing t.sub.2. This t.sub.2 is the latest detection timing of the discharge pressure data acquired by the discharge pressure acquiring unit 110 at S440, and this timing t.sub.2-T is back in time from the timing t.sub.2 by a predetermined period T. Note that, if the discharge pressure acquiring unit 110 continues acquiring the pressure data until time t.sub.0+T, the fluctuation amount calculator 160 may set the target detection period as a period from time t.sub.0 to time t.sub.0+T.
[0057] Then, the fluctuation amount calculator 160 calculates as a fluctuation amount difference between reference pressure data and discharge pressure data during the target detection period. Accordingly, the fluctuation amount calculator 160 may calculate as a fluctuation amount difference between discharge pressure data during the target detection period and reference pressure data in a time length T having equal length as the target detection period. For example, the fluctuation amount calculator 160 relatively shifts time axes of the discharge pressure data and the reference pressure data, and calculates difference between the discharge pressure data and the reference pressure data corresponding to each time.
[0058] The fluctuation amount calculator 160 may set a value obtained by summing up (integrating) the difference between the discharge pressure data and the reference pressure data as a fluctuation amount. Also, the fluctuation amount calculator 160 may set a value obtained by summing up absolute values of the difference between the discharge pressure data and the reference pressure data as a fluctuation amount. If no change occurs to the discharge pressure data in the target detection period, or if the change is relatively small, the fluctuation amount calculated by the fluctuation amount calculator 160 is a value no larger than difference in integrated value of noise. For example, with respect to the target detection period from time t.sub.m to time t.sub.m+T in FIG. 2, change is not occurring in the discharge pressure data to the extent that occurrence of cavitation is recognized. That is, the difference between the discharge pressure data in the target detection period and the reference pressure data from time t.sub.0-T to time t.sub.0 is no larger than the noise level.
[0059] Next, the determining unit 170 compares the fluctuation amount calculated by the fluctuation amount calculator 160 with a reference fluctuation amount (S470). Here, the reference fluctuation amount may be predetermined based on a fluctuation amount of the discharge pressure data to detect. Also, the reference fluctuation amount may be no larger than a value obtained by integrating a value of noise accepted by the discharge pressure data by the number of times of sampling during the period T. For example, if a fluctuation amount is less than the reference fluctuation amount (No at S470) as shown in the target detection period from time t.sub.m to time t.sub.m+T, the detection apparatus 100 returns to S440 and acquires the next discharge pressure data and suction pressure data.
[0060] The discharge pressure acquiring unit 110, the suction pressure acquiring unit 120, and the detector 130 compare the fluctuation amount of the discharge pressure data in the next target period with the reference fluctuation amount in the next target period. Note that, the next target period may be from timing back in time from a next sampling timing of the pressure data by a period T to the sampling timing. That is, the next target period may be shifted from the last target period by one period of sampling timing.
[0061] Instead of this, the next target period may be shifted by N times of periods of sampling timing compared with the last target period (N is an integer of two or more). In this case, at S440, the discharge pressure acquiring unit 110 and the suction pressure acquiring unit 120 acquire results obtained by sampling the pressure data for N times. Note that, it is desirable that a period in which N times of sampling is performed is shorter than the period T.
[0062] The discharge pressure acquiring unit 110, the suction pressure acquiring unit 120, and the detector 130 repeat operation from S440 to S470 until the fluctuation amount of the discharge pressure data for the next target period becomes the reference fluctuation amount or more (or until it is determined Yes at S450). Then, if the fluctuation amount of the discharge pressure data becomes the reference fluctuation amount or more (Yes at S470), the determining unit 170 determines that the cavitation has occurred (S480).
[0063] For example, since change is occurring to the discharge pressure data to the extent that occurrence of cavitation is recognized in the target detection period from time t.sub.n to time t.sub.n+T in FIG. 2, the fluctuation amount of the discharge pressure data becomes the reference fluctuation amount or more. In this case, the determining unit 170 determines that cavitation has occurred, and notifies the control system 70 of this fact. As described above, the fluctuation amount calculator 160 according to the present embodiment uses as reference pressure data, which is the data during the normal operation of the pump 40, discharge pressure data of time length T having equal length as a target detection period immediately before the timing at which the suction pressure data changes from being a positive pressure value to a negative pressure value. A fluctuation amount of discharge pressure data based on such reference pressure data and the discharge pressure data in the target period will be described next.
[0064] FIG. 5 illustrates one example of a fluctuation amount of discharge pressure data calculated by a fluctuation amount calculator 160 according to the present embodiment. In FIG. 5, the horizontal axis represents the time and the vertical axis represents the discharge pressure. FIG. 5 shows an example in which the fluctuation amount calculator 160 relatively shifts time axes of the discharge pressure data and reference pressure data. That is, FIG. 5 shows an example in which start timing and end timing of the discharge pressure data and the reference pressure data are set to time t.sub.01, and time t.sub.02 respectively. Note that, time t.sub.02 is forward in time from time t.sub.01 by time T.
[0065] Here, the fluctuation amount calculator 160 may adjust offset of the discharge pressure data and the reference pressure data. For example, the fluctuation amount calculator 160 may relatively shift the reference pressure data to the discharge pressure data during the target detection period such that a mean value of the reference pressure data matches a mean value of the discharge pressure data during the target detection period. Also, the fluctuation amount calculator 160 may perform a filtering processing such as a high-pass filter to remove direct current components. Additionally, the suction pressure gauge 50 and the discharge pressure gauge 60 may supply data on which filtering processing has been performed.
[0066] The fluctuation amount calculator 160 may calculate, as a fluctuation amount, difference between reference pressure data and discharge pressure data during the target detection period, which have a corresponding mean value. In FIG. 5, areas illustrated with oblique lines are an example of difference between the discharge pressure data and the reference pressure data. As shown in FIG. 5, the difference between the discharge pressure data and the reference pressure data may have difference larger than noise in an initial stage of cavitation in which change occurs to the discharge pressure data in the target detection period.
[0067] That is, by using a time waveform of the discharge pressure data, the detection apparatus 100 according to the present embodiment can detect occurrence of cavitation even before obvious oscillation of a certain frequency or a frequency band occurs. Note that, pressure data acquired from a plant 10 under a normal operation state may also pulse. For example, if liquid flowing through the pump 40 is mixture, pulsation may occur to the pressure data in response to the mixture ratio changing. Also, pulsation may occur to the pressure data depending on environmental change or the like of the plant 10. As described above, a fluctuation width of certain degree of range may be seen even in the pressure data in a normal state. Therefore, by making the period of the reference pressure data approximately the same as the period T in the target detection period in such manner described with respect to the present embodiment, effect of the fluctuation width can be reduced.
[0068] Also, because the detection apparatus 100 does not perform numerical processing such as the Fourier transform, low cost can be achieved without using a complicated circuit, a high-performance CPU, or the like. Additionally, because the detection apparatus 100 subsequently compares next data while erasing unnecessary previous data, storage capacity for data can be reduced.
[0069] Note that, the detection apparatus 100 according to the present embodiment is described with the example in which it compares time waveforms of the reference pressure data and the discharge pressure data having the same time length as described in FIG. 5. However, this is not the sole example. The detection apparatus 100 may use reference pressure data having a time length shorter than that of the time waveform of discharge pressure data in the target period. In this case, the fluctuation amount calculator 160 may calculate each difference between a mean value of the reference pressure data and individual piece of data of discharge pressure data in the target period.
[0070] Also, the fluctuation amount calculator 160 may use as the reference pressure data one piece of discharge pressure data that is acquired corresponding to a timing t.sub.0 at which the suction pressure data is changed from being a value exceeding the threshold value to a value of the threshold value or less. That is, the fluctuation amount calculator 160 may use as the reference pressure data the discharge pressure data that is acquired corresponding to a timing at which the suction pressure data changes from being a positive pressure value to a negative pressure value. In this case, the fluctuation amount calculator 160 may calculate each difference between one sample of the reference pressure data and individual piece of data of discharge pressure data in the target period.
[0071] As described above, it is desirable that the detection apparatus 100 uses as reference pressure data the discharge pressure data of a period, time, or the like that is closer to the timing t.sub.0 at which the suction pressure data changes from being a value exceeding the threshold value to a value equal to or less than the threshold value. In this way, temporal difference between the reference pressure data and the discharge pressure data in the target detection period can be shorter in time. That is, even if pulse occurs to pressure data, fluctuation widths of fluctuation to occur to reference pressure data and discharge pressure data of a target detection period can be approximately the same, and thus effect of the pulse can be reduced.
[0072] Although it is described that the above-mentioned detection apparatus 100 according to the present embodiment can detect occurrence of cavitation, it is not limited thereto. The detection apparatus 100 may further predict occurrence of cavitation. Also, the detection apparatus 100 may provide information about maintenance and management of the pump 40. Such detection apparatus 100 will be described next.
[0073] FIG. 6 illustrates a modification example of the detection apparatus 100 according to the present embodiment. With respect to the detection apparatus 100 of the present modification example, approximately the same operation as the operation of detection apparatus 100 according to the present embodiment illustrated in FIG. 3 is illustrated with the same reference numeral, and description thereof is omitted. A detector 130 of the detection apparatus 100 of the present modification example further has a predicting unit 210, a fluctuation amount accumulating unit 220, and a maintenance managing unit 230.
[0074] In response to the suction pressure data becoming the threshold value or less, the predicting unit 210 predicts occurrence of cavitation of the pump 40. In this case, in response to the suction pressure data becoming the threshold value or less, the comparator 150 notifies the fluctuation amount calculator 160 and the predicting unit 210 of the comparison result. The predicting unit 210 predicts occurrence of cavitation in response to, for example, the suction pressure data changing from being a positive pressure value to a negative pressure value.
[0075] As described in FIG. 2, before the cavitation occurs, the suction pressure data is gradually decreased towards a negative pressure value. Hence, the predicting unit 210 can predict cavitation to occur in the future depending on whether the suction pressure data has changed to the negative pressure value. In this way, the control system 70 can perform control of preventing occurrence of the cavitation, preparation for performing control on cavitation, and the like before the cavitation occurs. Hence, not only the control system 70 can reduce occurrence of cavitation but also rapidly handle cavitation when it occurs.
[0076] Note that, in the present embodiment, an example in which the threshold value is set as a value corresponding to the atmospheric pressure is described. However, this is not the sole example. Because a value of suction pressure data for determining a tendency of cavitation may vary depending on a type, characteristic, individual difference of the pump 40, design of the control system 70, or the like, the threshold value may be predetermined corresponding to them. Also, different threshold value may be set by the comparator 150 from a threshold value used in a case of determining whether to notify fluctuation amount calculator 160, to a threshold value used in a case of determining whether to notify the predicting unit 210.
[0077] The fluctuation amount accumulating unit 220 calculates a cumulative value of a fluctuation amount of the discharge pressure data. The fluctuation amount accumulating unit 220 may receive a fluctuation amount calculated by the fluctuation amount calculator 160 to calculate the cumulative value. Also, the fluctuation amount accumulating unit 220 may calculate the cumulative value every time cavitation occurs. Additionally, the fluctuation amount accumulating unit 220 may count frequency of occurrence of cavitation, duration of the cavitation, or the like. The fluctuation amount accumulating unit 220 may store the accumulated information about the cavitation in the storage unit 140.
[0078] Based on the cumulative value of fluctuation amount of the discharge pressure data, the frequency of cavitation, the duration of the cavitation, and/or the like, the maintenance managing unit 230 determines at least one of a time to maintain and time to replace the pump 40. Because the cavitation occurring in the pump 40 caused damage to the pump 40, it is considered that the cavitation affects life time of the pump 40. Because a fluctuation amount of the discharge pressure data corresponds to amplitude strength of oscillation of the cavitation, it can be utilized as an indicator of the damage the pump 40 has received. Hence, by accumulating and recording the fluctuation amount of the discharge pressure data, inspection timing and replacement timing of the pump 40 can be determined.
[0079] The maintenance managing unit 230 may determine the inspection timing and the replacement timing of the pump 40 by, for example, comparing the cumulative value of the fluctuation amount of the discharge pressure data with a predetermined threshold value or the like. In response to the cumulative value becoming the threshold value or more, the maintenance managing unit 230 may notify the control system 70 of the inspection timing and/or the replacement timing. Note that, the maintenance managing unit 230 may set a different value from a threshold value to determine the inspection timing to a threshold value to determine the replacement timing. Also, the maintenance managing unit 230 may predetermine the threshold value based on data regarding an actual malfunction occurred in the pump 40, life time of the pump 40, and the like.
[0080] As described above, the detection apparatus 100 according to the modification example can not only detect cavitation but also perform prediction of cavitation, and maintenance and management of the pump 40 at low cost. Note that, the detection apparatus 100 may only perform the prediction of cavitation or may only perform maintenance and management of the pump 40.
[0081] With regard to the detection apparatus 100 according to the present embodiment described above, an example in which calculation of the fluctuation amount of the discharge pressure data is started in response to the suction pressure data becoming the threshold value or less is described. In this way, the detection apparatus 100 can be prevented from performing calculation or the like in vain in a range in which the suction pressure data is a normal value, and can prevent power consumption from increasing. Also, because the detection apparatus 100 can reduce amount of calculation, even if it is implemented on the control system 70, it can be prevented from affecting the control system 70 as a load. Additionally, even if the detection apparatus 100 is included in a measuring instrument such as a sensor provided in the plant 10, it can be prevented from affecting operation thereof as a load. Furthermore, because the detection apparatus 100 does not perform detection of cavitation in a range in which the suction pressure data is a normal value, frequency of erroneous detection caused by noise or the like can be reduced.
[0082] Note that, the detection apparatus 100 is not even limited to comparing time waveforms, if considering such reduced power consumption and reduced frequency of the erroneous detection. For example, in response to the suction pressure data becoming the threshold value or less, the detection apparatus 100 may perform frequency analysis for the discharge pressure data. In this case, the fluctuation amount calculator 160 may perform the Fourier transform on the discharge pressure data. Also, with respect to a frequency characteristic of the discharge pressure data, the determining unit 170 may determine whether abnormality has been occurring in a certain wavelength or a certain band. The determining unit 170 determines occurrence of abnormality by using, for example, a predetermined threshold value for the certain wavelength or the certain band. Accordingly, because the detection apparatus 100 starts the frequency analysis if tendency of cavitation is seen, it can reduce amount of calculation.
[0083] Accordingly, if the detector 130 performs the frequency analysis, the operation flow shown in FIG. 4 may be modified as follows. In S430, in response to the suction pressure data becoming the threshold value or less, the fluctuation amount calculator 160 sets the frequency characteristic of the reference pressure data. That is, the discharge pressure data acquired from time t.sub.0-T to time t.sub.0 is read out from the storage unit 140 and the Fourier transform (FFT, for example) is performed thereon to set it as the reference data.
[0084] Also, in S460, if it is determined that the tendency of cavitation is continuing, the fluctuation amount calculator 160 calculates a frequency characteristic of the discharge pressure data in the target detection period. Then, the fluctuation amount calculator 160 calculates difference between the frequency characteristic in the target detection period and the reference data on the frequency axis. Accordingly, in S470, the determining unit 170 can determine occurrence of abnormality depending on whether the certain wavelength or the certain band of the frequency characteristic of difference has exceeded the threshold value.
[0085] Instead of this, the operation flow illustrated in FIG. 4 may be modified as follows. In S460, the fluctuation amount calculator 160 performs frequency conversion on waveform data indicating difference between reference pressure data and discharge pressure data during the target detection period. Accordingly, in S470, the determining unit 170 can determine occurrence of abnormality depending on whether the certain wavelength or the certain band of the frequency characteristic of difference has exceeded the threshold value.
[0086] Although it is described that the above-mentioned detection apparatus 100 according to the present embodiment detects cavitation by using suction pressure data and discharge pressure data, it is not limited thereto. If in a case such as the power consumption or the like of the plant 10 is saved, such calculation for the fluctuation amount of the discharge pressure data may continue in the range in which the suction pressure data is a normal value. That is, the detection apparatus 100 may detect cavitation by only using the discharge pressure data.
[0087] For example, the detection apparatus 100 may perform calculation for the fluctuation amount of the discharge pressure data regardless of the change of the suction pressure data. In this case, the detection apparatus 100 may not have the suction pressure acquiring unit 120 and the comparator 150. In this case, the detector 130 detects occurrence of cavitation in the pump 40 based on a fluctuation amount of discharge pressure data during a target detection period. The detector 130 uses as reference pressure data the discharge pressure data acquired in a case in which operation of the pump 40 and/or the detection apparatus 100 is started, for example.
[0088] Also, the detector 130 may use as the reference pressure data the discharge pressure data acquired in a case in which the pump 40 is performing normal operation in advance. Also, the detector 130 may use as the reference pressure data a predetermined value such as a design value, an empirical value, or the like.
[0089] Accordingly, if the detection apparatus 100 performs calculation for the fluctuation amount of the discharge pressure data regardless of the change of the suction pressure data, the operation flow shown in FIG. 4 may be modified as follows. That is, operation in S420 and S450 regarding the suction pressure data are not performed. Also, with respect to the acquiring of the pressure data in S410 and S440, it may be sufficient if the discharge pressure acquiring unit 110 acquires the discharge pressure data. In this way, based on a time waveform of the discharge pressure data, the detection apparatus 100 can detect occurrence of cavitation.
[0090] Accordingly, the detector 130 may detect occurrence of cavitation in the pump based on difference between discharge pressure data during a target detection period and discharge pressure data before the target detection period.
[0091] Note that, in this case, the detector 130 may detect occurrence of cavitation in the pump based on, for example, difference between discharge pressure data during a target detection period and discharge pressure data immediately before the target detection period.
[0092] Because the fluctuation amount of the discharge pressure data gradually increases and gets worse after occurrence of cavitation, the detection apparatus 100 can detect the occurrence of cavitation by comparing temporally preceding discharge pressure data with temporally succeeding discharge pressure data. In this case, the operation flow illustrated in FIG. 4 may be further modified as follows. That is, in S470, if the fluctuation amount is less than the reference fluctuation amount (No at S470), return to S430 instead of S440, and set the discharge pressure data in the target period as the reference pressure data. Then, the discharge pressure data for the next target period is acquired (S440).
[0093] In this way, the detection apparatus 100 can compare the temporally preceding discharge pressure data with the temporally succeeding discharge pressure data without using the suction pressure data, and can detect occurrence of cavitation. That is, the detection apparatus 100 can detect occurrence of cavitation while having simpler configuration. Also, the detection apparatus 100 can detect change in real time cavitation.
[0094] Note that, if considering the detection of such change in real time cavitation, the detection apparatus 100 is not limited to detecting occurrence of cavitation by comparing the difference of time waveforms with the reference fluctuation amount. For example, the detection apparatus 100 may detect cavitation by performing frequency conversion on the difference between discharge pressure data during the target detection period and the discharge pressure data before the target detection period.
[0095] In this case, the fluctuation amount calculator 160 may calculate the difference between the discharge pressure data in the target detection period and the reference pressure data before performing the Fourier transform on the difference. With respect to a frequency characteristic calculated by the fluctuation amount calculator 160, the determining unit 170 may determine whether abnormality has been occurring in a certain wavelength or a certain band. The determining unit 170 determines occurrence of abnormality by using, for example, a predetermined threshold value for the certain wavelength or the certain band. This operation can be realized by further modifying S460 and S470.
[0096] With respect to the detection apparatus 100 according to the present embodiment described above, an example in which the pressure data is acquired from a pressure gauge such as the suction pressure gauge 50 and the discharge pressure gauge 60 is described. In addition to this, the detection apparatus 100 may also acquire fault information or the like of the pressure gauge from the suction pressure gauge 50 and/or the discharge pressure gauge 60. If a malfunction or the like is occurring to the pressure gauge, it is difficult to accurately detect occurrence of cavitation. Thus, if fault information or the like for the pressure gauge is acquired, the detection apparatus 100 may not perform the detection of cavitation. Instead of this, the detection apparatus 100 may add the fault information to a detection result of cavitation and notify the control system 70.
[0097] An example in which the detection apparatus 100 according to the present embodiment described above is provided to the plant 10 is described. Note that, the plant 10 is an example of a system utilizing the pump 40 to transfer liquid. The system to which the detection apparatus 100 is provided is not limited to the plant 10. Cavitation may occur to a pump 40 as long as it is for transferring liquid. Thus, the cavitation may be detected by providing the detection apparatus 100 to a system, an apparatus, or equipment using the pump 40, or the site or the like of use of the pump 40.
[0098] FIG. 7 illustrates an exemplary configuration of a computer 1200 in which a plurality of aspects of the present invention may be fully or partially embodied. A program installed in the computer 1200 can make the computer 1200 function as an operation which is associated with the apparatus according to the embodiment of the present invention, or one or more "unit(s)" of the apparatus, or can make the computer 1200 perform the operation or the one or more "unit(s)", and/or can make the computer 1200 perform processes according to the embodiment of the present invention or steps of the processes. Such programs may be executed by a CPU 1212 so that the computer 1200 performs particular operations associated with some or all of blocks in the flowchart and the block diagrams according to the present specification.
[0099] The computer 1200 according to the present embodiment includes a CPU 1212, a RAM 1214, a graphics controller 1216, and a display device 1218, and these are connected to each other by a host controller 1210. The computer 1200 also includes input/output units such as a communication interface 1222, a hard disk drive 1224, a DVD-ROM drive 1226 and an IC card drive, which are connected to the host controller 1210 via an input/output controller 1220. The computer also includes legacy input/output units such as a ROM 1230 and a keyboard 1242, these are connected to the input/output controller 1220 via an input/output chip 1240.
[0100] The CPU 1212 operates according to programs stored in the ROM 1230 and the RAM 1214, and thereby controls each unit. The graphics controller 1216 acquires image data generated by the CPU 1212 on a frame buffer or the like provided in the RAM 1214 or in the graphics controller 1216 itself, and makes the image data to be displayed on the display device 1218.
[0101] The communication interface 1222 communicates with other electronic devices via a network. The hard disk drive 1224 stores programs and data used by the CPU 1212 within the computer 1200. The DVD-ROM drive 1226 reads the programs or the data from the DVD-ROM 1201, and provides the hard disk drive 1224 with the programs or the data via the RAM 1214. The IC card drive reads programs and data from the IC card, and/or writes programs and data into the IC card.
[0102] The ROM 1230 stores therein a boot program etc. executed by the computer 1200 at the time of activation, and/or a program that depend on the hardware of the computer 1200. The input/output chip 1240 may also connect various input/output units to the input/output controller 1220 via a parallel port, a serial port, a keyboard port, a mouse port etc.
[0103] A program is provided by computer readable storage medium such as the DVD-ROM 1201 or the IC card. The program is read out from the computer readable storage medium, installed into the hard disk drive 1224, RAM 1214 or ROM 1230, which are also examples of computer readable storage medium, and executed by the CPU 1212. The information processing described in these programs is read out by the computer 1200, resulting in cooperation between a program and the above-mentioned various types of hardware resources. An apparatus or method may be constituted by realizing the operation or processing of information, according to the usage of the computer 1200.
[0104] For example, when communication is performed between the computer 1200 and an external device, the CPU 1212 may execute a communication program loaded onto the RAM 1214 to instruct communication processing to the communication interface 1222, based on the processing described in the communication program. The communication interface 1222, under control of the CPU 1212, reads transmission data stored on a transmission buffering region provided in a recording medium such as the RAM 1214, the hard disk drive 1224, the DVD-ROM 1201, or the IC card, and transmits the read transmission data to a network or writes reception data received from a network to a reception buffering region or the like provided on the recording medium.
[0105] Additionally, the CPU 1212 may cause all or a necessary portion of a file or a database to be read into the RAM 1214, the file or the database having been stored in an external recording medium such as the hard disk drive 1224, the DVD-ROM drive 1226 (DVD-ROM 1201), the IC card, etc., and perform various types of processing on the data on the RAM 1214. The CPU 1212 may then write back the processed data to the external recording medium.
[0106] Various types of information, such as various types of programs, data, tables, and databases may be stored in the recording medium for information processing. The CPU 1212 may perform, on the read-out data from the RAM 1214, various types of processing which includes various types of operations, information processing; conditional judging, conditional branch, unconditional branch, information search/replace etc., as described throughout the present disclosure and designated by an instruction sequence of the program, and write backs the result to the RAM 1214. Also, the CPU 1212 may search for information in a file, a database etc. in the recording medium. For example, when a plurality of entries, each of them having an attribute value of a first attribute associated with an attribute value of a second attribute are stored in the recording medium, the CPU 1212 may search for, from among the plurality of entries, an entry where the attribute value of the first attribute matches a designated condition, may read the attribute value of the second attribute stored in the entry, and thereby may acquire the attribute value of the second attribute associated with the first attribute that satisfies a predetermined condition.
[0107] The above-explained program or software modules may be stored in the computer readable storage medium on or near the computer 1200. Also, a recording medium such as a hard disk or a RAM provided in a server system connected to a dedicated communication network or the Internet can be used as the computer readable storage media, and thereby provide the programs to the computer 1200 via network.
[0108] While the embodiments of the present invention have been described, the technical scope of the invention is not limited to the above described embodiments. It is apparent to persons skilled in the art that various alterations and improvements can be added to the above-described embodiments. It is also apparent from the scope of the claims that the embodiments added with such alterations or improvements can be included in the technical scope of the invention.
[0109] The operations, procedures, steps, and stages of each process performed by an apparatus, system, program, and method shown in the claims, embodiments, or diagrams can be performed in any order as long as the order is not indicated by "prior to," "before," or the like and as long as the output from a previous process is not used in a later process. Even if the process flow is described using phrases such as "first" or "next" in the claims, embodiments, or diagrams, it does not necessarily mean that the process must be performed in this order.
* * * * *
D00000
D00001
D00002
D00003
D00004
D00005
D00006
D00007
XML
uspto.report is an independent third-party trademark research tool that is not affiliated, endorsed, or sponsored by the United States Patent and Trademark Office (USPTO) or any other governmental organization. The information provided by uspto.report is based on publicly available data at the time of writing and is intended for informational purposes only.
While we strive to provide accurate and up-to-date information, we do not guarantee the accuracy, completeness, reliability, or suitability of the information displayed on this site. The use of this site is at your own risk. Any reliance you place on such information is therefore strictly at your own risk.
All official trademark data, including owner information, should be verified by visiting the official USPTO website at www.uspto.gov. This site is not intended to replace professional legal advice and should not be used as a substitute for consulting with a legal professional who is knowledgeable about trademark law.