Methods, Systems And Devices For Modelling Reservoir Properties
ZANON; Stefan ; et al.
U.S. patent application number 16/088949 was filed with the patent office on 2019-04-25 for methods, systems and devices for modelling reservoir properties. The applicant listed for this patent is NEXEN ENERGY ULC. Invention is credited to David CAMPAGNA, Graham Andrew Robert NOBLE, Stefan ZANON.
| Application Number | 20190120022 16/088949 |
| Document ID | / |
| Family ID | 59962305 |
| Filed Date | 2019-04-25 |


View All Diagrams
| United States Patent Application | 20190120022 |
| Kind Code | A1 |
| ZANON; Stefan ; et al. | April 25, 2019 |
METHODS, SYSTEMS AND DEVICES FOR MODELLING RESERVOIR PROPERTIES
Abstract
Aspects of the present disclosure may provide devices, systems and methods for modelling resource production for which there may be incomplete information and/or unknown parameters. In some embodiments, the method includes applying an analytical fracture model and reducing a the number of models to be matched in a set of potential subterranean formation models.
| Inventors: | ZANON; Stefan; (Calgary, CA) ; CAMPAGNA; David; (Calgary, CA) ; NOBLE; Graham Andrew Robert; (Calgary, CA) | ||||||||||
| Applicant: |
|
||||||||||
|---|---|---|---|---|---|---|---|---|---|---|---|
| Family ID: | 59962305 | ||||||||||
| Appl. No.: | 16/088949 | ||||||||||
| Filed: | March 30, 2016 | ||||||||||
| PCT Filed: | March 30, 2016 | ||||||||||
| PCT NO: | PCT/CA2016/050369 | ||||||||||
| 371 Date: | September 27, 2018 |
| Current U.S. Class: | 1/1 |
| Current CPC Class: | E21B 43/00 20130101; E21B 41/0092 20130101; E21B 49/00 20130101; E21B 43/26 20130101 |
| International Class: | E21B 41/00 20060101 E21B041/00 |
Claims
1. A method of modelling hydrocarbon production rates for a subterranean formation, the method comprising: obtaining, by at least one processor, production data for at least one well in the subterranean formation; based at least in part on geological data for the subterranean formation, identify, at the at least one processor, a range of potential values for each of a plurality of parameters, the plurality of parameters including at least one parameter representative of geological characteristics of the subterranean formation, and fracture parameters; where each set of values including a selection from each of the ranges for the plurality of parameters defining a potential subterranean formation model, and where sets of values including different combinations of values for the plurality of parameters define a set of potential subterranean formation models; matching at least a portion of the set of potential subterranean formation models to the production data for the at least one well by iteratively: inputting, by the at least one processor, a set of parameter values selected from the ranges of potential values to an analytical fracture model to generate a production model for the subterranean formation for the particular subterranean formation model defined by the inputted set of values, the production model a function of a stimulated area value; determining at least one stimulated area value for the production model, and comparing production values for the production model with the production data for the at least one well to generate an error value; and selecting parameter values for inputting in a subsequent iteration based on a machine learning algorithm and past error values to reduce a number of analyzed subterranean formation models that do not fit the production profile; identifying production models which fit the production profile from the production data within a defined error threshold; with the identified production models which fit the production profile from the production data for the at least one well in the subterranean formation, selecting a range of stimulated area values from a subset of the identified models having the lowest generated error values; and based on a frequency distribution of the stimulated area values from the subset of the identified models having the lowest productivity value error scores, creating a forecast production model for at least a portion of the subterranean resource, the forecast production model having input parameters representative of geological characteristics of at least the portion of the subterranean formation, and an input parameter associated with the stimulated area value and limited to the selected range.
2. The method of claim 1, wherein the stimulated area value is a function of permeability and fracture area.
3. The method of claim 1, wherein the analytical fracture model is a function of the stimulated area value.
4. The method of claim 1, wherein the analytical fracture model includes dimensionless time and dimensionless pressure logs to generate the production model for a series of time steps.
5. The method of claim 1 wherein the production data is collected over a period of time.
6. The method of claim 1 wherein the geological data for the subterranean formation is collected from at least one sensing device or a petrophysical analysis of well logs.
7. The method of claim 1 wherein identifying the range of potential values for each of a plurality of parameters comprises identifying a granularity at which values can be selected within the range of potential values.
8. The method of claim 1 wherein the fracture parameters include parameters associated with a number of fractures and at least one fracture area dimension.
9. The method of claim 1 comprising: creating forecast models of different portions of the subterranean resource, each forecast production model having input parameters representative of geological characteristics of the respective portion of the subterranean formation.
10. The method of claim 9 comprising: using the forecast models, generating a visual map illustrating different production forecasts for the different portions of the subterranean formation.
11. A system for modelling hydrocarbon production rates for a subterranean formation, the system comprising at least one processor configured for: obtaining production data for at least one well in the subterranean formation; based at least in part on geological data for the subterranean formation, identify a range of potential values for each of a plurality of parameters, the plurality of parameters including at least one parameter representative of geological characteristics of the subterranean formation, and fracture parameters; where each set of values including a selection from each of the ranges for the plurality of parameters defining a potential subterranean formation model, and where sets of values including different combinations of values for the plurality of parameters define a set of potential subterranean formation models; matching at least a portion of the set of potential subterranean formation models to the production data for the at least one well by iteratively: inputting a set of parameter values selected from the ranges of potential values to an analytical fracture model to generate a production model for the subterranean formation for the particular subterranean formation model defined by the inputted set of values, the production model a function of a stimulated area value; determining at least one stimulated area value for the production model, and comparing production values for the production model with the production data for the at least one well to generate an error value; and selecting parameter values for inputting in a subsequent iteration based on a machine learning algorithm and past error values to reduce a number of analyzed subterranean formation models that do not fit the production profile; identifying production models which fit the production profile from the production data within a defined error threshold; with the identified production models which fit the production profile from the production data for the at least one well in the subterranean formation, selecting a range of stimulated area values from a subset of the identified models having the lowest generated error values; and based on a frequency distribution of the stimulated area values from the subset of the identified models having the lowest productivity value error scores, creating a forecast production model for at least a portion of the subterranean resource, the forecast production model having input parameters representative of geological characteristics of at least the portion of the subterranean formation, and an input parameter associated with the stimulated area value and limited to the selected range.
12. The system of claim 11, wherein the stimulated area value is a function of permeability and fracture area.
13. The system of claim 11, wherein the analytical fracture model is a function of the stimulated area value.
14. The system of claim 11, wherein the analytical fracture model includes dimensionless time and dimensionless pressure logs to generate the production model for a series of time steps.
15. The system of claim 11 wherein the production data is collected over a period of time.
16. The system of claim 11 wherein the geological data for the subterranean formation is collected from at least one sensing device or a petrophysical analysis of well logs.
17. The system of claim 11 wherein identifying the range of potential values for each of a plurality of parameters comprises identifying a granularity at which values can be selected within the range of potential values.
18. The system of claim 11 wherein the fracture parameters include parameters associated with a number of fractures and at least one fracture area dimension.
19. The system of claim 11 wherein the at least one processor is configured for: creating forecast models of different portions of the subterranean resource, each forecast production model having input parameters representative of geological characteristics of the respective portion of the subterranean formation.
20. The system of claim 19 wherein the at least one processor is configured for: using the forecast models, generating a visual map illustrating different production forecasts for the different portions of the subterranean formation.
21. A computer-readable medium or media having stored thereon computer-readable instructions which when executed by at least one processor configured the at least one processor for: obtaining, by the at least one processor, production data for at least one well in the subterranean formation; based at least in part on geological data for the subterranean formation, identify, at the at least one processor, a range of potential values for each of a plurality of parameters, the plurality of parameters including at least one parameter representative of geological characteristics of the subterranean formation, and fracture parameters; where each set of values including a selection from each of the ranges for the plurality of parameters defining a potential subterranean formation model, and where sets of values including different combinations of values for the plurality of parameters define a set of potential subterranean formation models; matching at least a portion of the set of potential subterranean formation models to the production data for the at least one well by iteratively: inputting, by the at least one processor, a set of parameter values selected from the ranges of potential values to an analytical fracture model to generate a production model for the subterranean formation for the particular subterranean formation model defined by the inputted set of values, the production model a function of a stimulated area value; determining at least one stimulated area value for the production model, and comparing production values for the production model with the production data for the at least one well to generate an error value; and selecting parameter values for inputting in a subsequent iteration based on a machine learning algorithm and past error values to reduce a number of analyzed subterranean formation models that do not fit the production profile; identifying production models which fit the production profile from the production data within a defined error threshold; with the identified production models which fit the production profile from the production data for the at least one well in the subterranean formation, selecting a range of stimulated area values from a subset of the identified models having the lowest generated error values; and based on a frequency distribution of the stimulated area values from the subset of the identified models having the lowest productivity value error scores, creating a forecast production model for at least a portion of the subterranean resource, the forecast production model having input parameters representative of geological characteristics of at least the portion of the subterranean formation, and an input parameter associated with the stimulated area value and limited to the selected range.
Description
FIELD
[0001] The present application relates to the field of reservoir modelling, and particularly to methods, systems and devices for modelling unconventional oil reservoir production based on collected physical data.
BACKGROUND
[0002] Hydrocarbon exploration involves trade-offs between the number and spacing of wells (and associated costs) and the geological and commercial risk based on available data which may impact production forecasting and resource development planning.
[0003] Type curves can be used to estimate reservoir production for new wells by averaging existing wells. However, in some instances, type curves may be difficult to adjust for differences, and may not account for subtle changes across an area or over time.
[0004] Simulations can also be used to model reservoir properties; however, simulations may require large amounts of input data which may be expensive to obtain, and are expensive from both a time and computational resource perspective.
[0005] Methods, systems and devices which can reduce computational requirements and/or input data requirements are desirable.
SUMMARY
[0006] In accordance with one aspect, there is provided a method of modelling hydrocarbon production rates for a subterranean formation. The method includes: obtaining, by at least one processor, production data for at least one well in the subterranean formation; based at least in part on geological data for the subterranean formation, identify, at the at least one processor, a range of potential values for each of a plurality of parameters, the plurality of parameters including at least one parameter representative of geological characteristics of the subterranean formation, and fracture parameters; where each set of values including a selection from each of the ranges for the plurality of parameters defining a potential subterranean formation model, and where sets of values including different combinations of values for the plurality of parameters define a set of potential subterranean formation models; matching at least a portion of the set of potential subterranean formation models to the production data for the at least one well by iteratively: inputting, by the at least one processor, a set of parameter values selected from the ranges of potential values to an analytical fracture model to generate a production model for the subterranean formation for the particular subterranean formation model defined by the inputted set of values, the production model a function of a stimulated area value; determine at least one stimulated area value for the production model, and comparing production values for the production model with the production data for the at least one well to generate an error value; and selecting parameter values for inputting in a subsequent iteration based on a machine learning algorithm and past error values to reduce a number of analyzed subterranean formation models that do not fit the production profile; identifying production models which fit the production profile from the production data within a defined error threshold; with the identified production models which fit the production profile from the production data for the at least one well in the subterranean formation, selecting a range of stimulated area values from a subset of the identified models having the lowest generated error values; and based on a frequency distribution of the stimulated area values from the subset of the identified models having the lowest productivity value error scores, creating a forecast production model for at least a portion of the subterranean resource, the forecast production model having input parameters representative of geological characteristics of at least the portion of the subterranean formation, and an input parameter associated with the stimulated area value and limited to the selected range.
[0007] In accordance with another aspect, there is provided a system for modelling hydrocarbon production rates for a subterranean formation. The system includes at least one processor configured for: obtaining production data for at least one well in the subterranean formation; based at least in part on geological data for the subterranean formation, identify a range of potential values for each of a plurality of parameters, the plurality of parameters including at least one parameter representative of geological characteristics of the subterranean formation, and fracture parameters; where each set of values including a selection from each of the ranges for the plurality of parameters defining a potential subterranean formation model, and where sets of values including different combinations of values for the plurality of parameters define a set of potential subterranean formation models; matching at least a portion of the set of potential subterranean formation models to the production data for the at least one well by iteratively: inputting a set of parameter values selected from the ranges of potential values to an analytical fracture model to generate a production model for the subterranean formation for the particular subterranean formation model defined by the inputted set of values, the production model a function of a stimulated area value; determine at least one stimulated area value for the production model, and comparing production values for the production model with the production data for the at least one well to generate an error value; and selecting parameter values for inputting in a subsequent iteration based on a machine learning algorithm and past error values to reduce a number of analyzed subterranean formation models that do not fit the production profile; identifying production models which fit the production profile from the production data within a defined error threshold; with the identified production models which fit the production profile from the production data for the at least one well in the subterranean formation, selecting a range of stimulated area values from a subset of the identified models having the lowest generated error values; and based on a frequency distribution of the stimulated area values from the subset of the identified models having the lowest productivity value error scores, creating a forecast production model for at least a portion of the subterranean resource, the forecast production model having input parameters representative of geological characteristics of at least the portion of the subterranean formation, and an input parameter associated with the stimulated area value and limited to the selected range.
[0008] In accordance with another aspect, there is provided a computer-readable medium or media having stored thereon computer-readable instructions which when executed by at least one processor configured the at least one processor for: obtaining, by the at least one processor, production data for at least one well in the subterranean formation; based at least in part on geological data for the subterranean formation, identify, at the at least one processor, a range of potential values for each of a plurality of parameters, the plurality of parameters including at least one parameter representative of geological characteristics of the subterranean formation, and fracture parameters; where each set of values including a selection from each of the ranges for the plurality of parameters defining a potential subterranean formation model, and where sets of values including different combinations of values for the plurality of parameters define a set of potential subterranean formation models; matching at least a portion of the set of potential subterranean formation models to the production data for the at least one well by iteratively: inputting, by the at least one processor, a set of parameter values selected from the ranges of potential values to an analytical fracture model to generate a production model for the subterranean formation for the particular subterranean formation model defined by the inputted set of values, the production model a function of a stimulated area value; determine at least one stimulated area value for the production model, and comparing production values for the production model with the production data for the at least one well to generate an error value; and selecting parameter values for inputting in a subsequent iteration based on a machine learning algorithm and past error values to reduce a number of analyzed subterranean formation models that do not fit the production profile; identifying production models which fit the production profile from the production data within a defined error threshold; with the identified production models which fit the production profile from the production data for the at least one well in the subterranean formation, selecting a range of stimulated area values from a subset of the identified models having the lowest generated error values; and based on a frequency distribution of the stimulated area values from the subset of the identified models having the lowest productivity value error scores, creating a forecast production model for at least a portion of the subterranean resource, the forecast production model having input parameters representative of geological characteristics of at least the portion of the subterranean formation, and an input parameter associated with the stimulated area value and limited to the selected range.
[0009] Many further features and combinations thereof concerning embodiments described herein will appear to those skilled in the art following a reading of the present disclosure.
DESCRIPTION OF THE FIGURES
[0010] In the figures,
[0011] FIG. 1 is a cross sectional view of an example geological formation and well;
[0012] FIG. 2 is an example system to which aspects of the present disclosure may be applied;
[0013] FIG. 3 is a perspective sectional view of an example horizontal well portion with fractures;
[0014] FIG. 4 is a top view of an example horizontal well portion with fractures;
[0015] FIGS. 5, 6 and 7 are flowcharts illustrating aspects of example methods for modelling reservoir properties;
[0016] FIGS. 8 and 9 is are stimulated area vs. error value plots;
[0017] FIG. 10 shows an example geographic map showing different production forecasts for different portions of a resource; and
[0018] FIG. 11 shows a graph showing examples of different probabilistic forecasts of production rates.
DETAILED DESCRIPTION
[0019] In hydrocarbon development, accurate estimations of rates of production can help provide information regarding the value and/or viability of a project/resource. These estimations may also guide the number, location and/or orientation of wells. Due to the high cost of development, there can be significant financial incentives to properly describe uncertainty in outcomes so informed decisions can be made as much as possible. In some examples, it may be important to keep the cost and amount of time spent acquiring the information low.
[0020] In some embodiments, aspects of the present disclosure may provide analytic devices, systems and methods for modelling resource production which are computationally less intensive or less time consuming than a complex simulation. In some embodiments, aspects of the present disclosure may have a higher degree of confidence in their models than a type curve or other similar model.
[0021] In some embodiments, aspects of the present disclosure may provide devices, systems and methods for modelling resource production based on incomplete or less information than would be necessary for other processes.
[0022] In broad embodiments, aspects of the disclosure may, in some instances, provide a practical method for spatially modelling value to target areas of highest potential investment return.
[0023] FIG. 1 illustrates a cross-sectional view of a subterranean resource or geological formation 110 which may include a number of different layers of materials having different physical characteristics as illustrated in FIG. 1 by the lines in the formation. It should be understood that these lines are illustrative only and that geological formations may have any number of layers or types of material which may not have distinct delineations but may be gradual or may contain mixtures or combinations of different material. There may also be lateral and/or vertical variations in the types of material contained within any of the geological formations.
[0024] In evaluating the subsurface or subterranean formations, in some examples, data is collected from one or more wells 100 drilled into or around the formations. In some examples, the wells are exploratory wells, production wells or wells for any other purpose. The wells may include vertical wells 100, horizontal wells 105, or any wells of any direction or structure, and/or any combination thereof.
[0025] In some examples, data collected from the well(s) 100 can include or can be used to create logs of the geologic formations penetrated by the well(s). The data can be collected from core samples or by measurements taken by devices in the borehole.
[0026] In some examples, the well data collected or generated from well measurements can include, but are not limited to, gamma ray logs, bulk density logs, neutron density logs, induction resistivity logs, and/or well core or image data.
[0027] In some examples, the geological formation may include hydrocarbon-bearing layers having low permeability such as shale or tight sandstone. Such formations may be suitable for hydrocarbon extraction using hydraulic fracturing technologies. In some instances, such unconventional plays may have large spatial variability, may involve multiple hydrocarbon fluids phases, and/or may have uncertainties in fracturing areas and permeability.
[0028] As such, in some instances, traditional techniques for conventional oil well drilling may be unsuitable for these unconventional resources.
[0029] The embodiments of the devices, systems and methods described herein may be implemented in a combination of both hardware and software. These embodiments may be implemented on programmable computers, each computer including at least one processor, a data storage system (including volatile memory or non-volatile memory or other data storage elements or a combination thereof), and at least one communication interface.
[0030] Program code may be applied to input data to perform the functions described herein and to generate output information. The output information may be applied to one or more output devices. In some embodiments, the communication interface may be a network communication interface. In embodiments in which elements may be combined, the communication interface may be a software communication interface, such as those for inter-process communication. In still other embodiments, there may be a combination of communication interfaces implemented as hardware, software, and combination thereof. In some examples, devices having at least one processor may be configured to execute software instructions stored on a computer readable tangible, non-transitory medium.
[0031] The following discussion provides many example embodiments. Although each embodiment represents a single combination of inventive elements, other examples may include all possible combinations of the disclosed elements. Thus if one embodiment comprises elements A, B, and C, and a second embodiment comprises elements B and D, other remaining combinations of A, B, C, or D, may also be used.
[0032] The technical solution of embodiments may be in the form of a software product. The software product may be stored in a non-volatile or non-transitory storage medium, which can be a compact disk read-only memory (CD-ROM), a USB flash disk, or a removable hard disk. The software product includes a number of instructions that enable a computer device (personal computer, server, or network device) to execute the methods provided by the embodiments.
[0033] The embodiments described herein are implemented by physical computer hardware, including computing devices, servers, receivers, transmitters, processors, memory, displays, and networks. The embodiments described herein provide useful physical machines and particularly configured computer hardware arrangements. The embodiments described herein are directed to electronic machines and methods implemented by electronic machines adapted for processing and transforming electromagnetic signals which represent various types of information. The embodiments described herein pervasively and integrally relate to machines, and their uses; and the embodiments described herein have no meaning or practical applicability outside their use with computer hardware, machines, and various hardware components. Substituting the physical hardware particularly configured to implement various acts for non-physical hardware, using mental steps for example, may substantially affect the way the embodiments work. Such computer hardware limitations are clearly essential elements of the embodiments described herein, and they cannot be omitted or substituted for mental means without having a material effect on the operation and structure of the embodiments described herein. The computer hardware is essential to implement the various embodiments described herein and is not merely used to perform steps expeditiously and in an efficient manner.
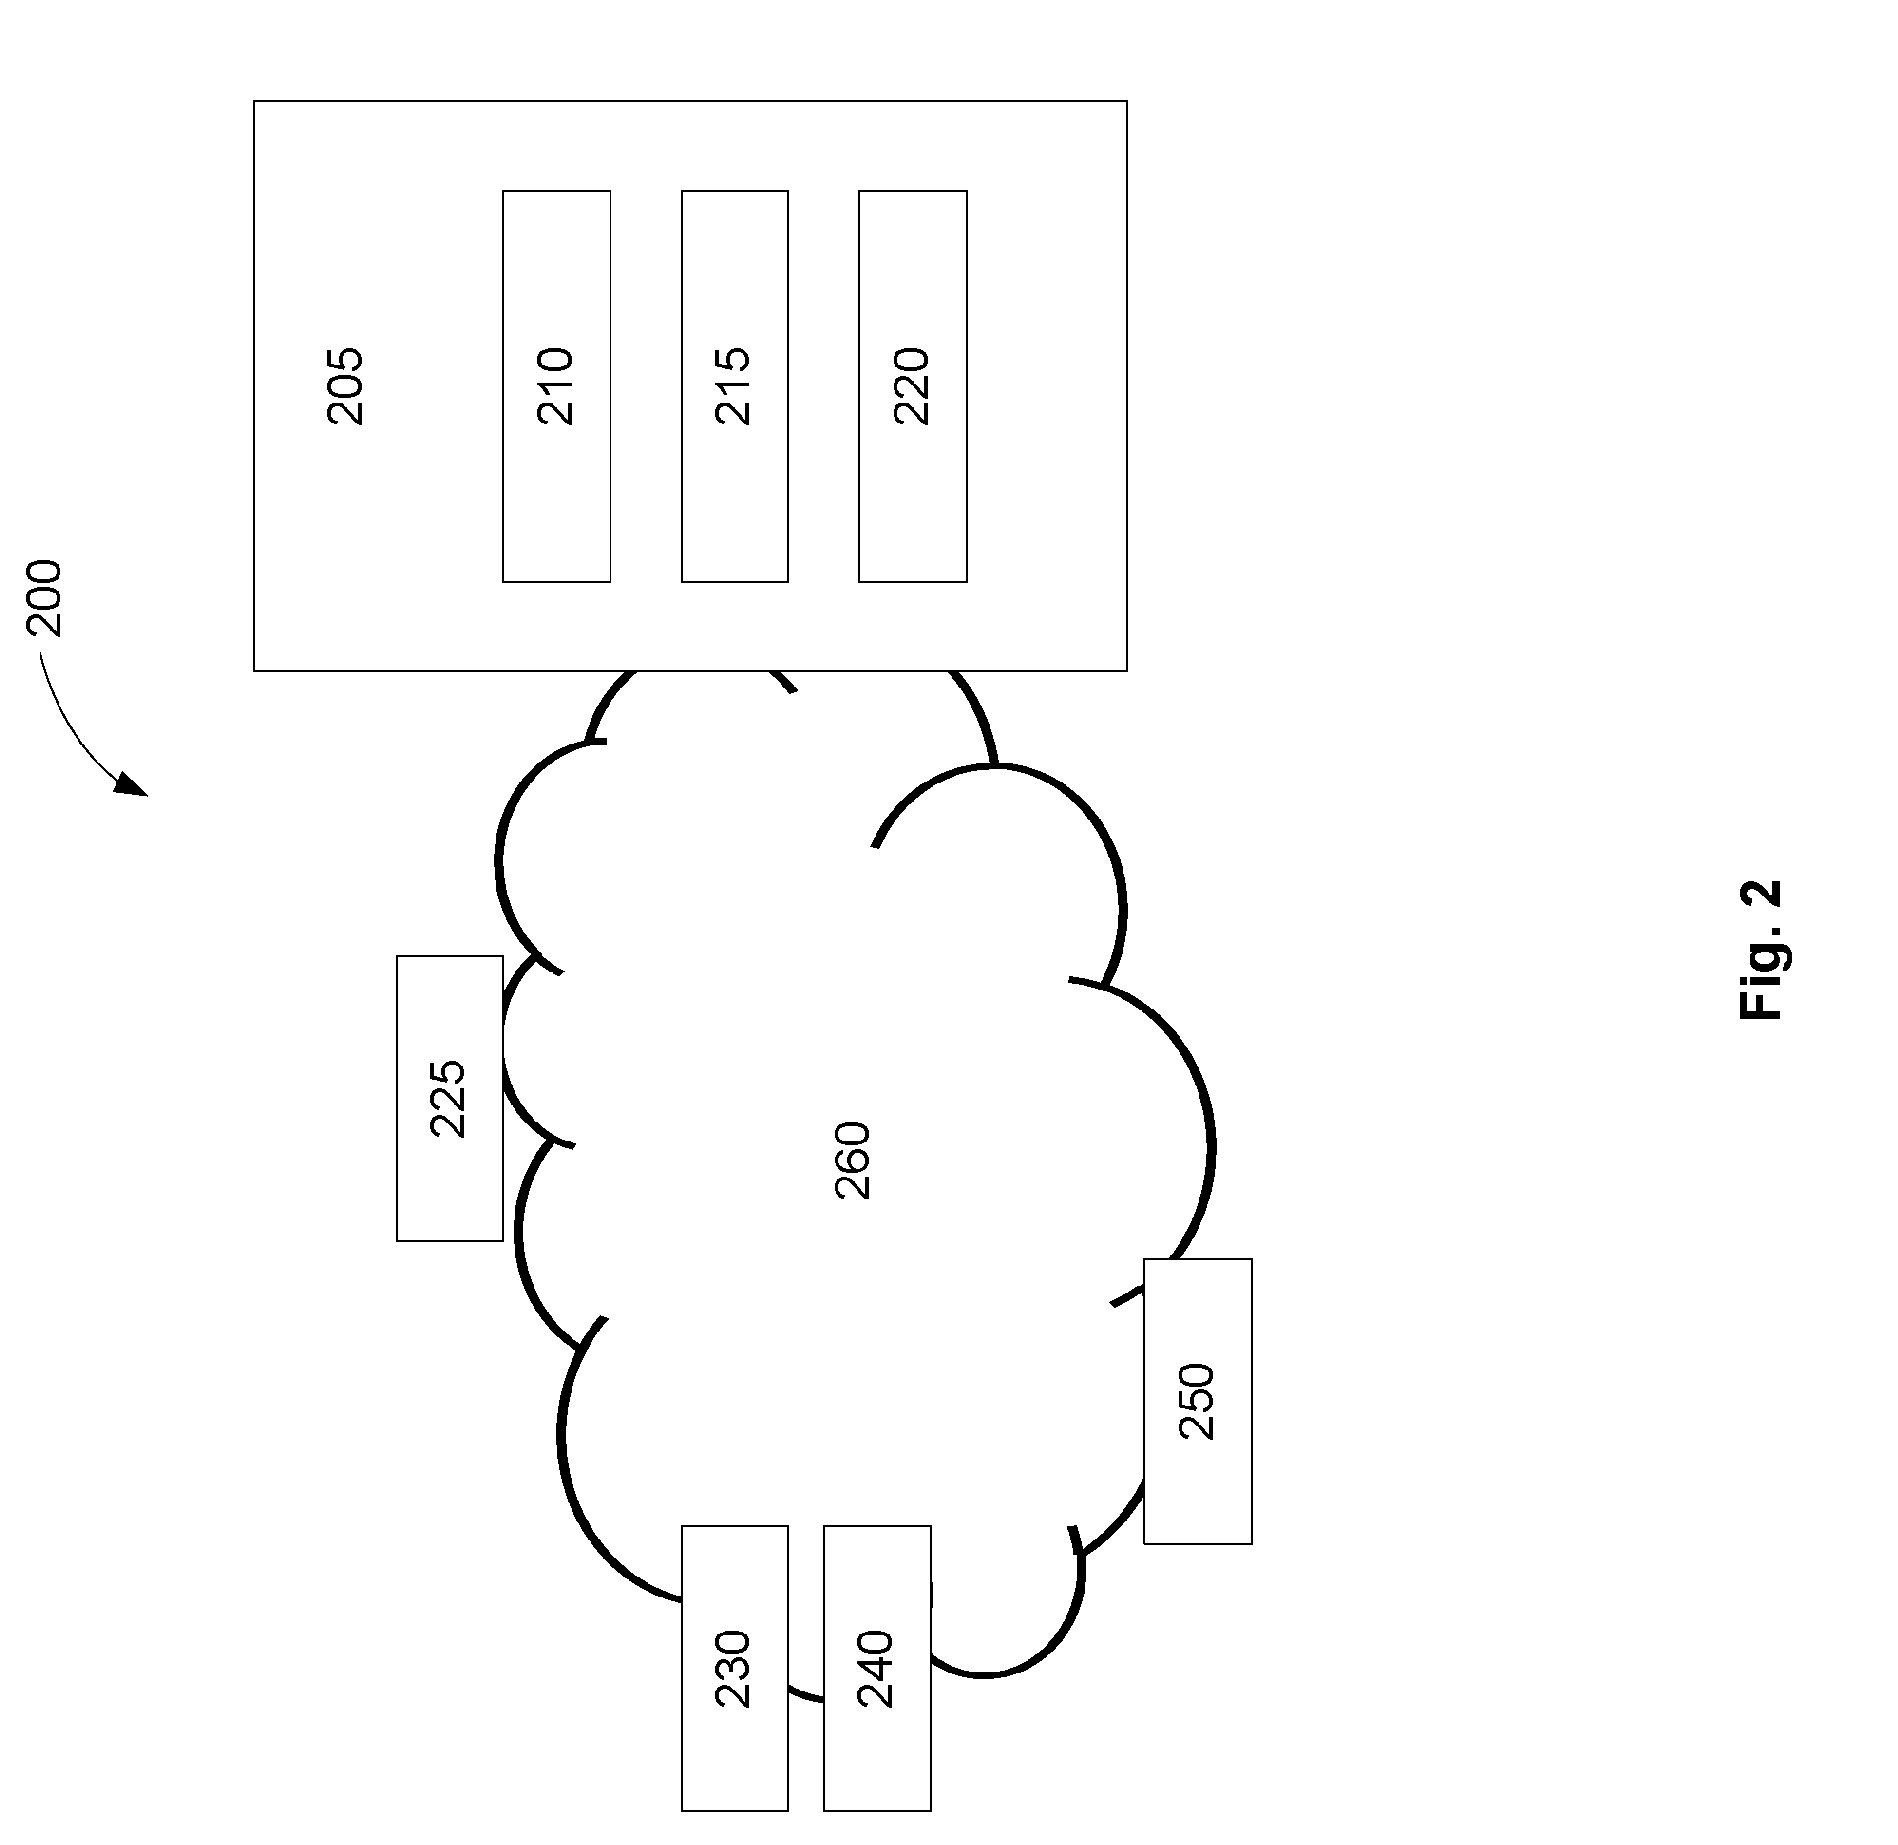
[0034] FIG. 2 shows an example system 200 include one or more devices 205 which may be used to model or predict hydrocarbon production rates. In some examples, a device 205 may be a computational device such as a computer, server, tablet or mobile device, or other system, device or any combination thereof suitable for accomplishing the purposes described herein. In some examples, the device 205 can include one or more processor(s) 210, memories 215, and/or one or more devices/interfaces 220 necessary or desirable for input/output, communications, control and the like. The processor(s) 210 and/or other components of the device(s) 205 or system 250 may be configured to perform one or more aspects of the processes described herein.
[0035] In some examples, the device(s) 205 may be configured to receive or access data from one or more volatile or non-volatile memories 215, or external storage devices 225 directly coupled to a device 205 or accessible via one or more wired and/or wireless network(s) 260. In external storage device(s) 225 can be a network storage device or may be part of or connected to a server or other device.
[0036] In some examples, the data may be accessed from one or more public databases. Such data can, in some examples, include less well characteristic and/or production data than may be available for well data from an internal source. For example, well production data may be provided as an aggregate of multiple wells or for an area without any information as to the number or size of fractures. In another example, well production data may be provided over time in less granular time periods. In some embodiments, the methods, devices, and systems described herein may generate models which account for such unknown(s).
[0037] In some examples, the device(s) 205 may be configured to receive or access data from sensors or devices 230 in the field. These sensors or devices 230 may be configured for collecting or measuring well, seismic or other geological and/or physical data. In some examples, the sensor(s)/device(s) 230 can be configured to communicate the collected data to the device(s) 205 and/or storage device(s) 225 via one or more networks 260 or otherwise. In some examples, the sensors or devices 230 may be connected to a local computing device 240 which may be configured to receive the data from the sensors/devices 230 for local storage and/or communication to the device(s) 205 and/or storage device(s) 225.
[0038] In some examples, a client device 250 may connect to or otherwise communicate with the device(s) 205 to gain access to the data and/or to instruct or request that the device(s) 205 perform some or all of the aspects described herein.
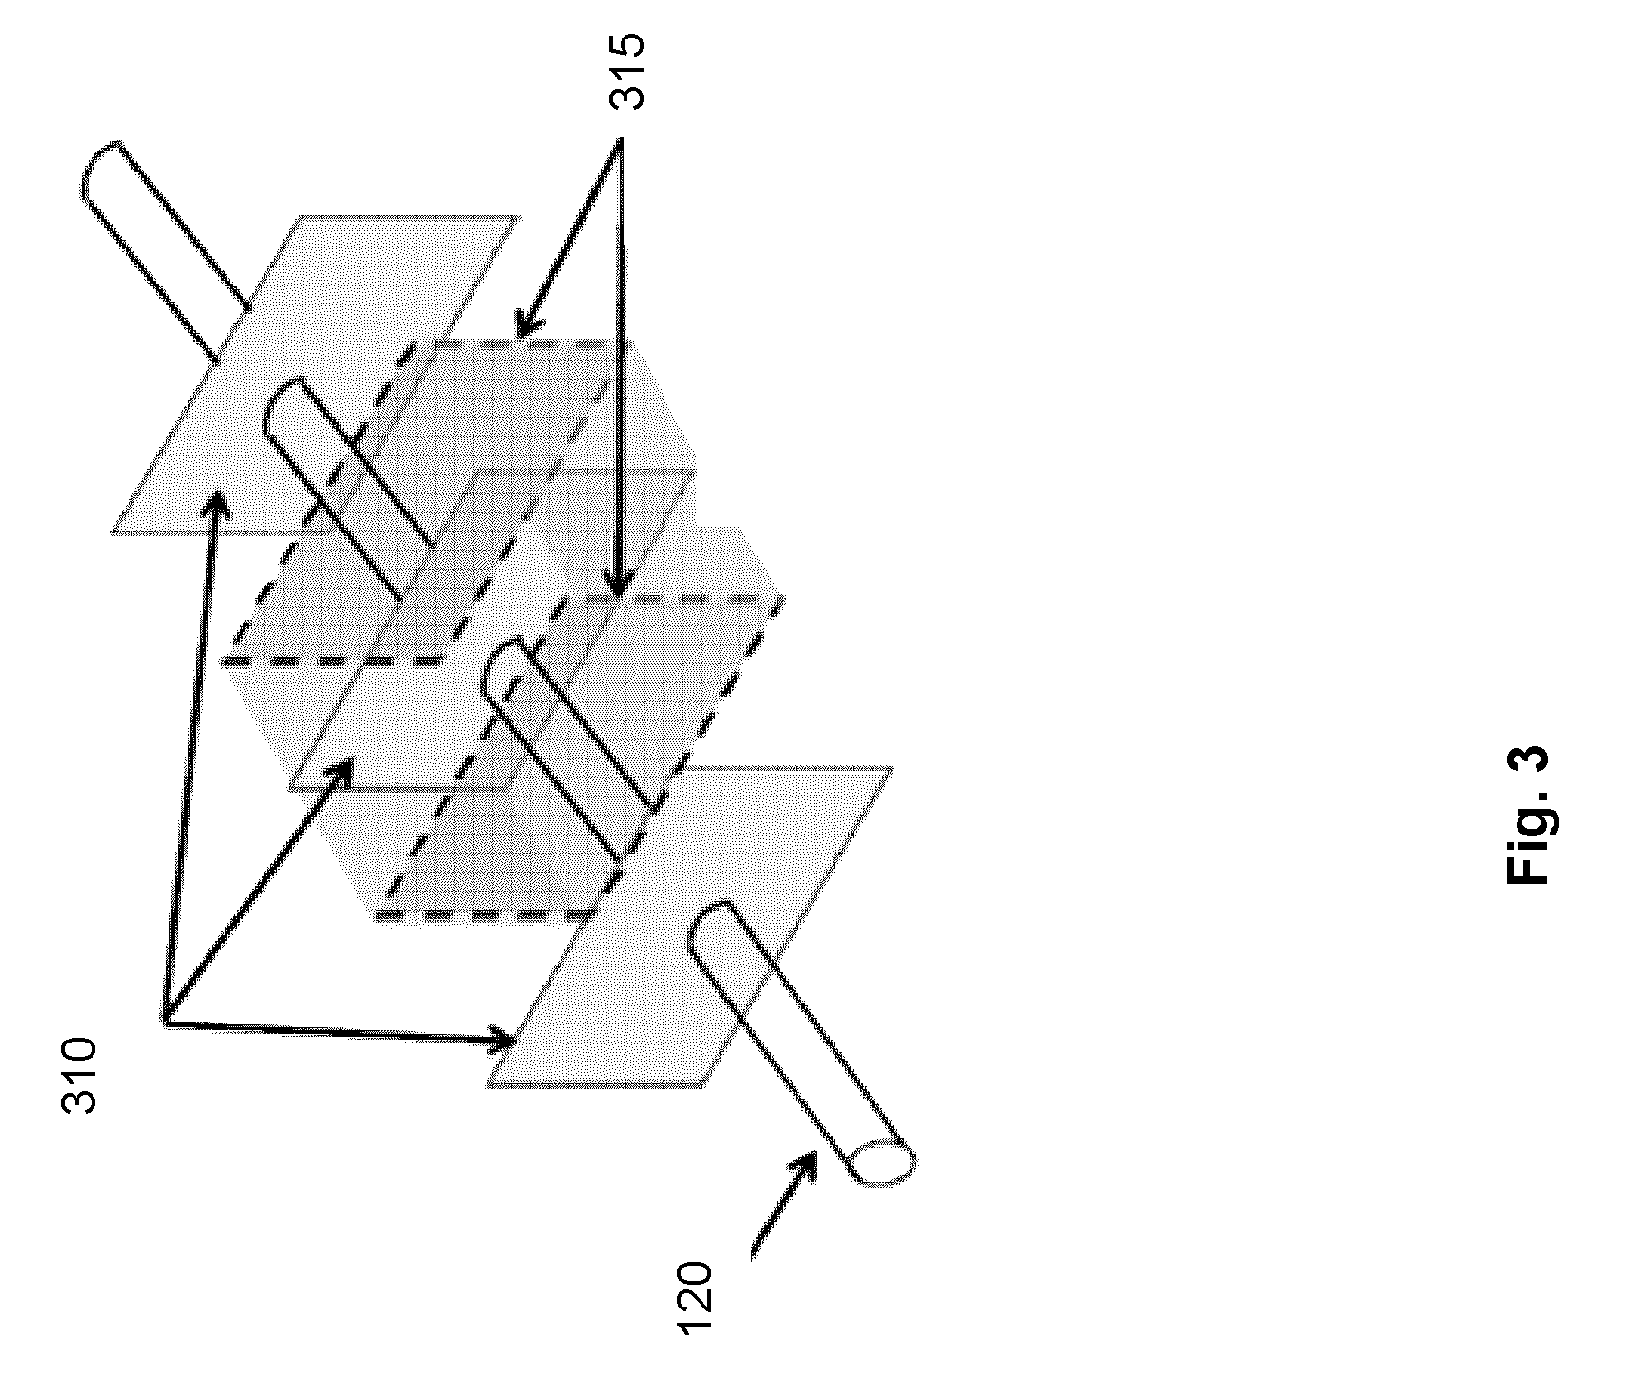
[0039] With reference to FIG. 3, in some embodiments, a well may have multiple hydraulic fractures 310, which may be transverse or in any other orientation with respect to the well. The wellbore 120 in FIG. 3 is horizontal; however, in other examples, fractures can be made relative to a wellbore of any orientation.
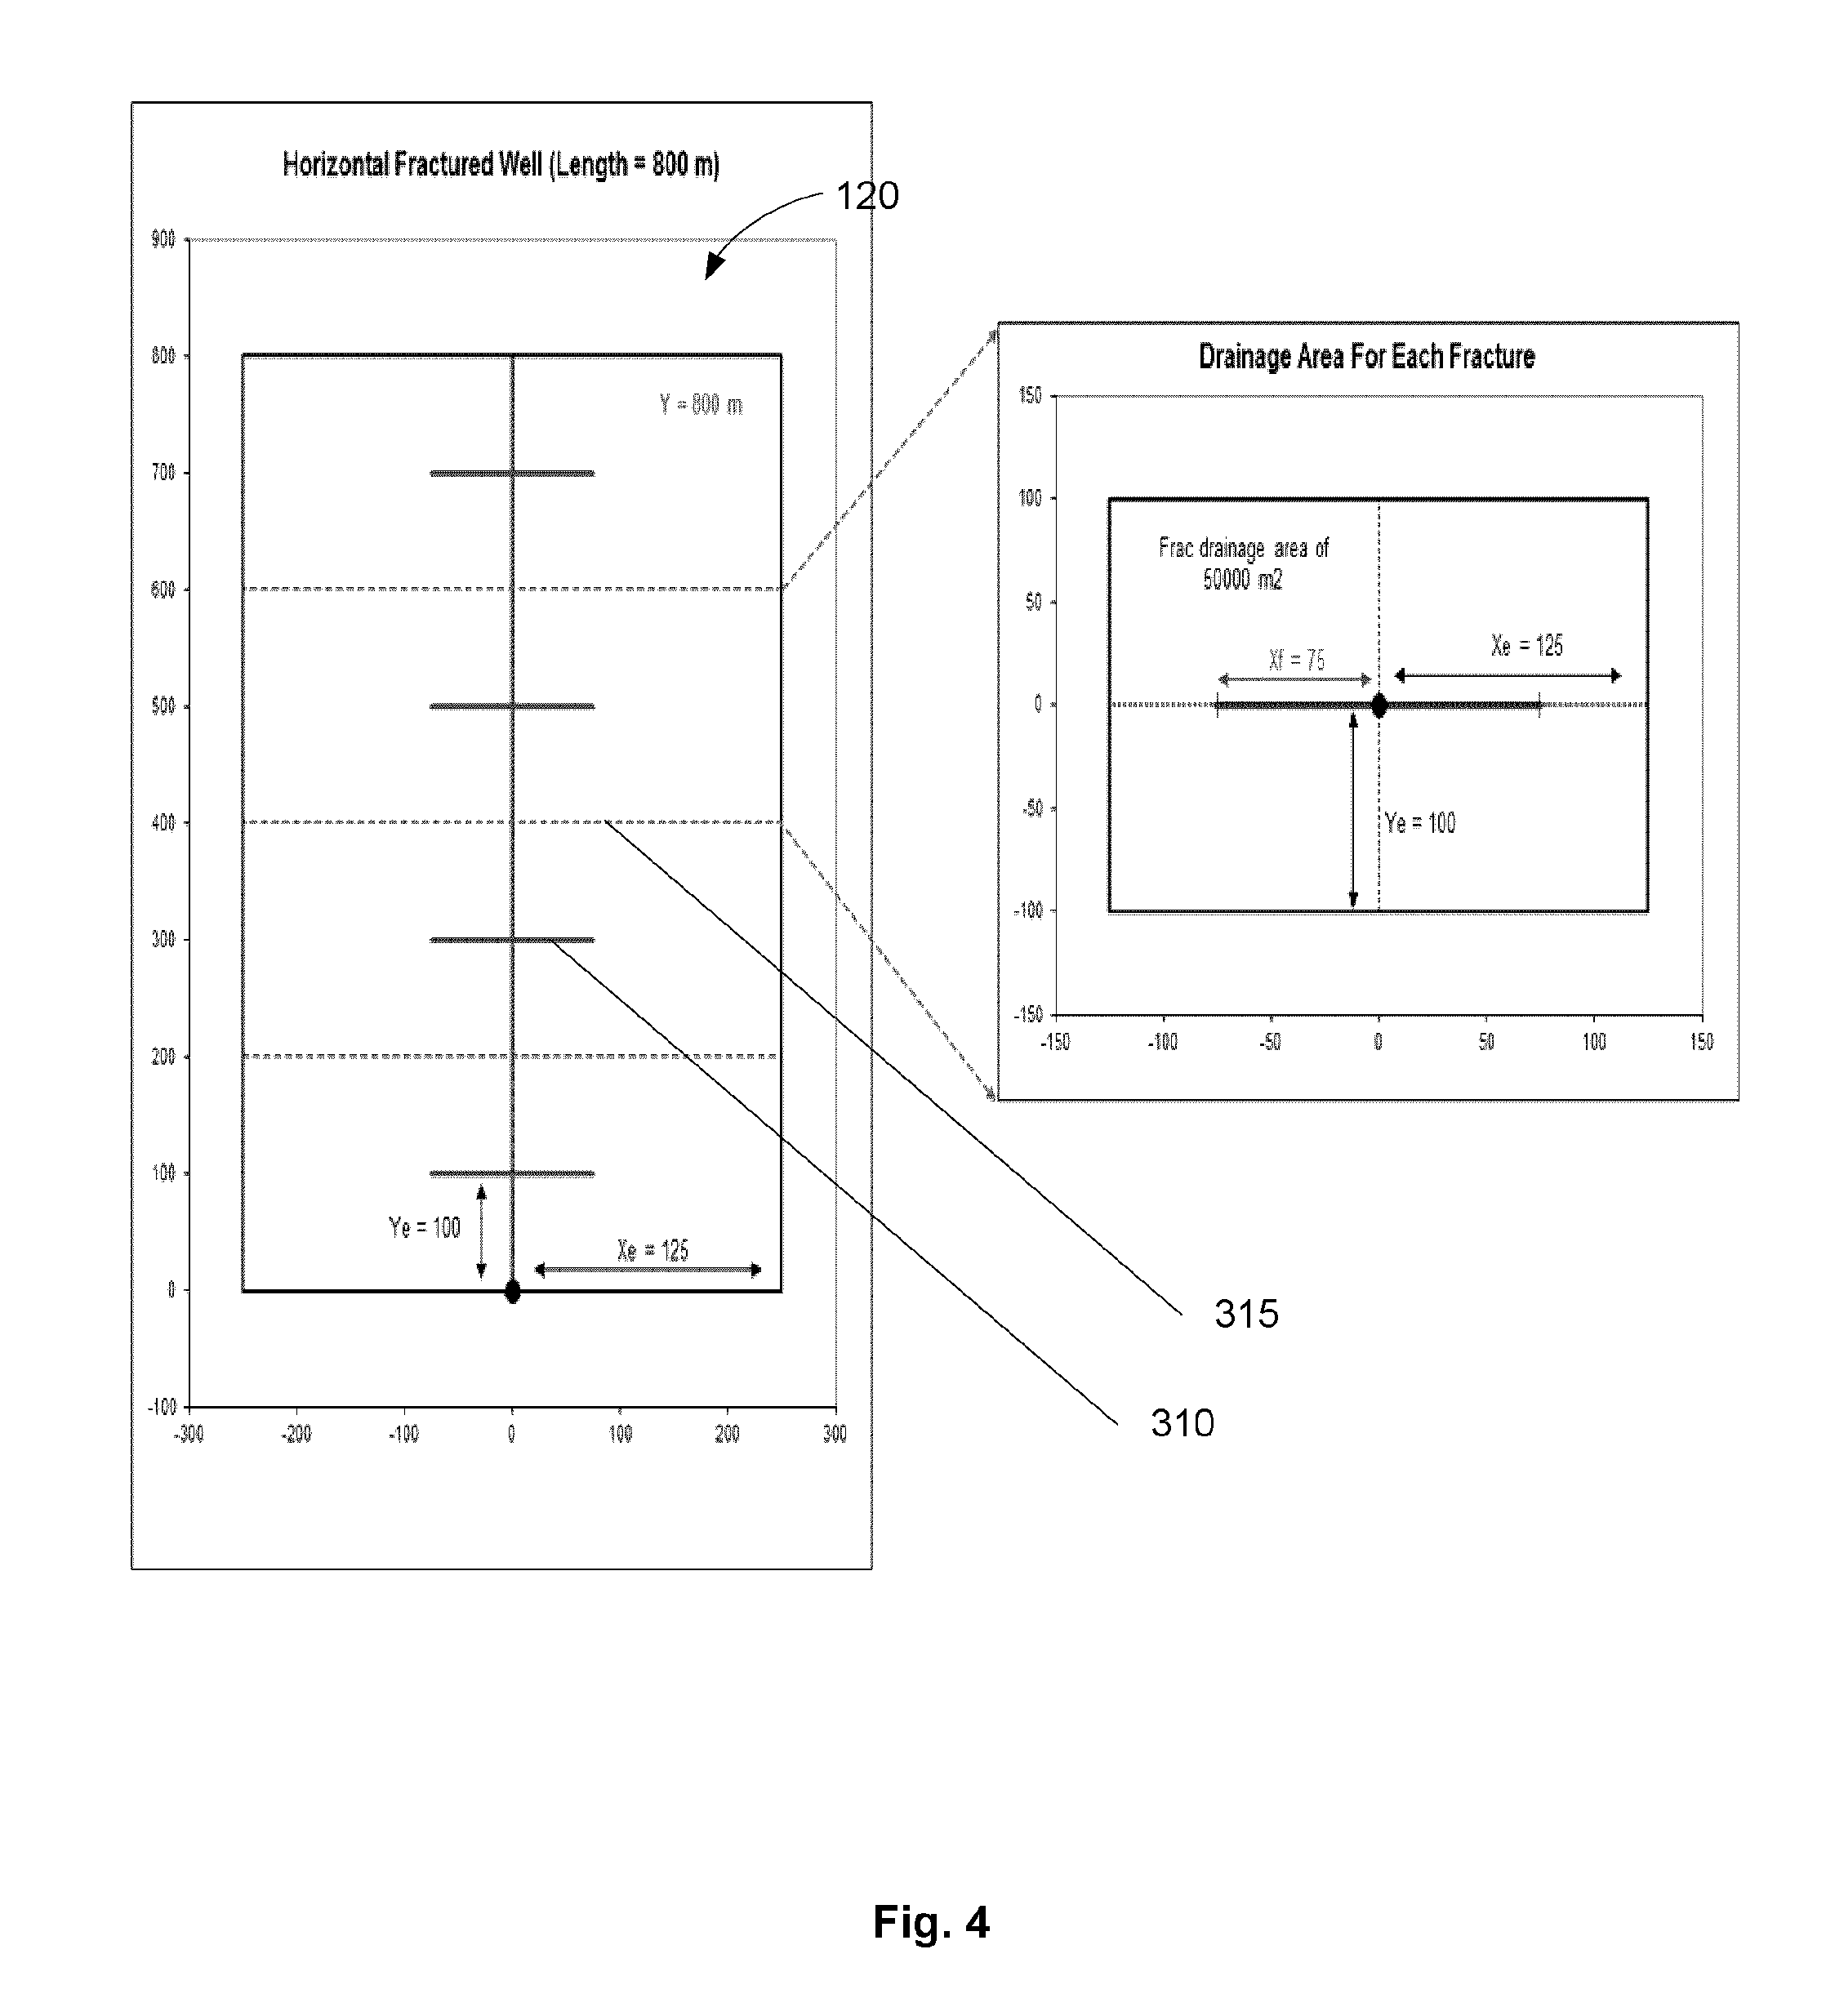
[0040] FIG. 4 shows a top-down view of the horizontal well 120 including four fractures 310. In some embodiments, a well with multiple fractures can be modelled as equally-spaced bi-wing transverse fractures. In some embodiments, the model can assume that there is a no flow boundary 315 at a midpoint between each fracture.
[0041] On the right, FIG. 4 shows an example drainage area for a single fracture 310. In some embodiments, fracture parameters can include a number of fractures, a fracture drainage area half-length Y.sub.e, a fracture drainage area half width X.sub.e, a fracture half-length X.sub.f, and the like.
[0042] In some examples, the system can be configured to treat each fracture of a multi-fracture well as multiple wells with a single fracture each. In some instances, this may simplify the models and may reduce the computational load on the system.
[0043] The model can account for spatial differences in geology through geostatistical realization. Multiple models are run on a finite and discrete number of areas with a larger defined region. Distributions can then be calculated for each area. The model can represent one region over a play or can be run on several.
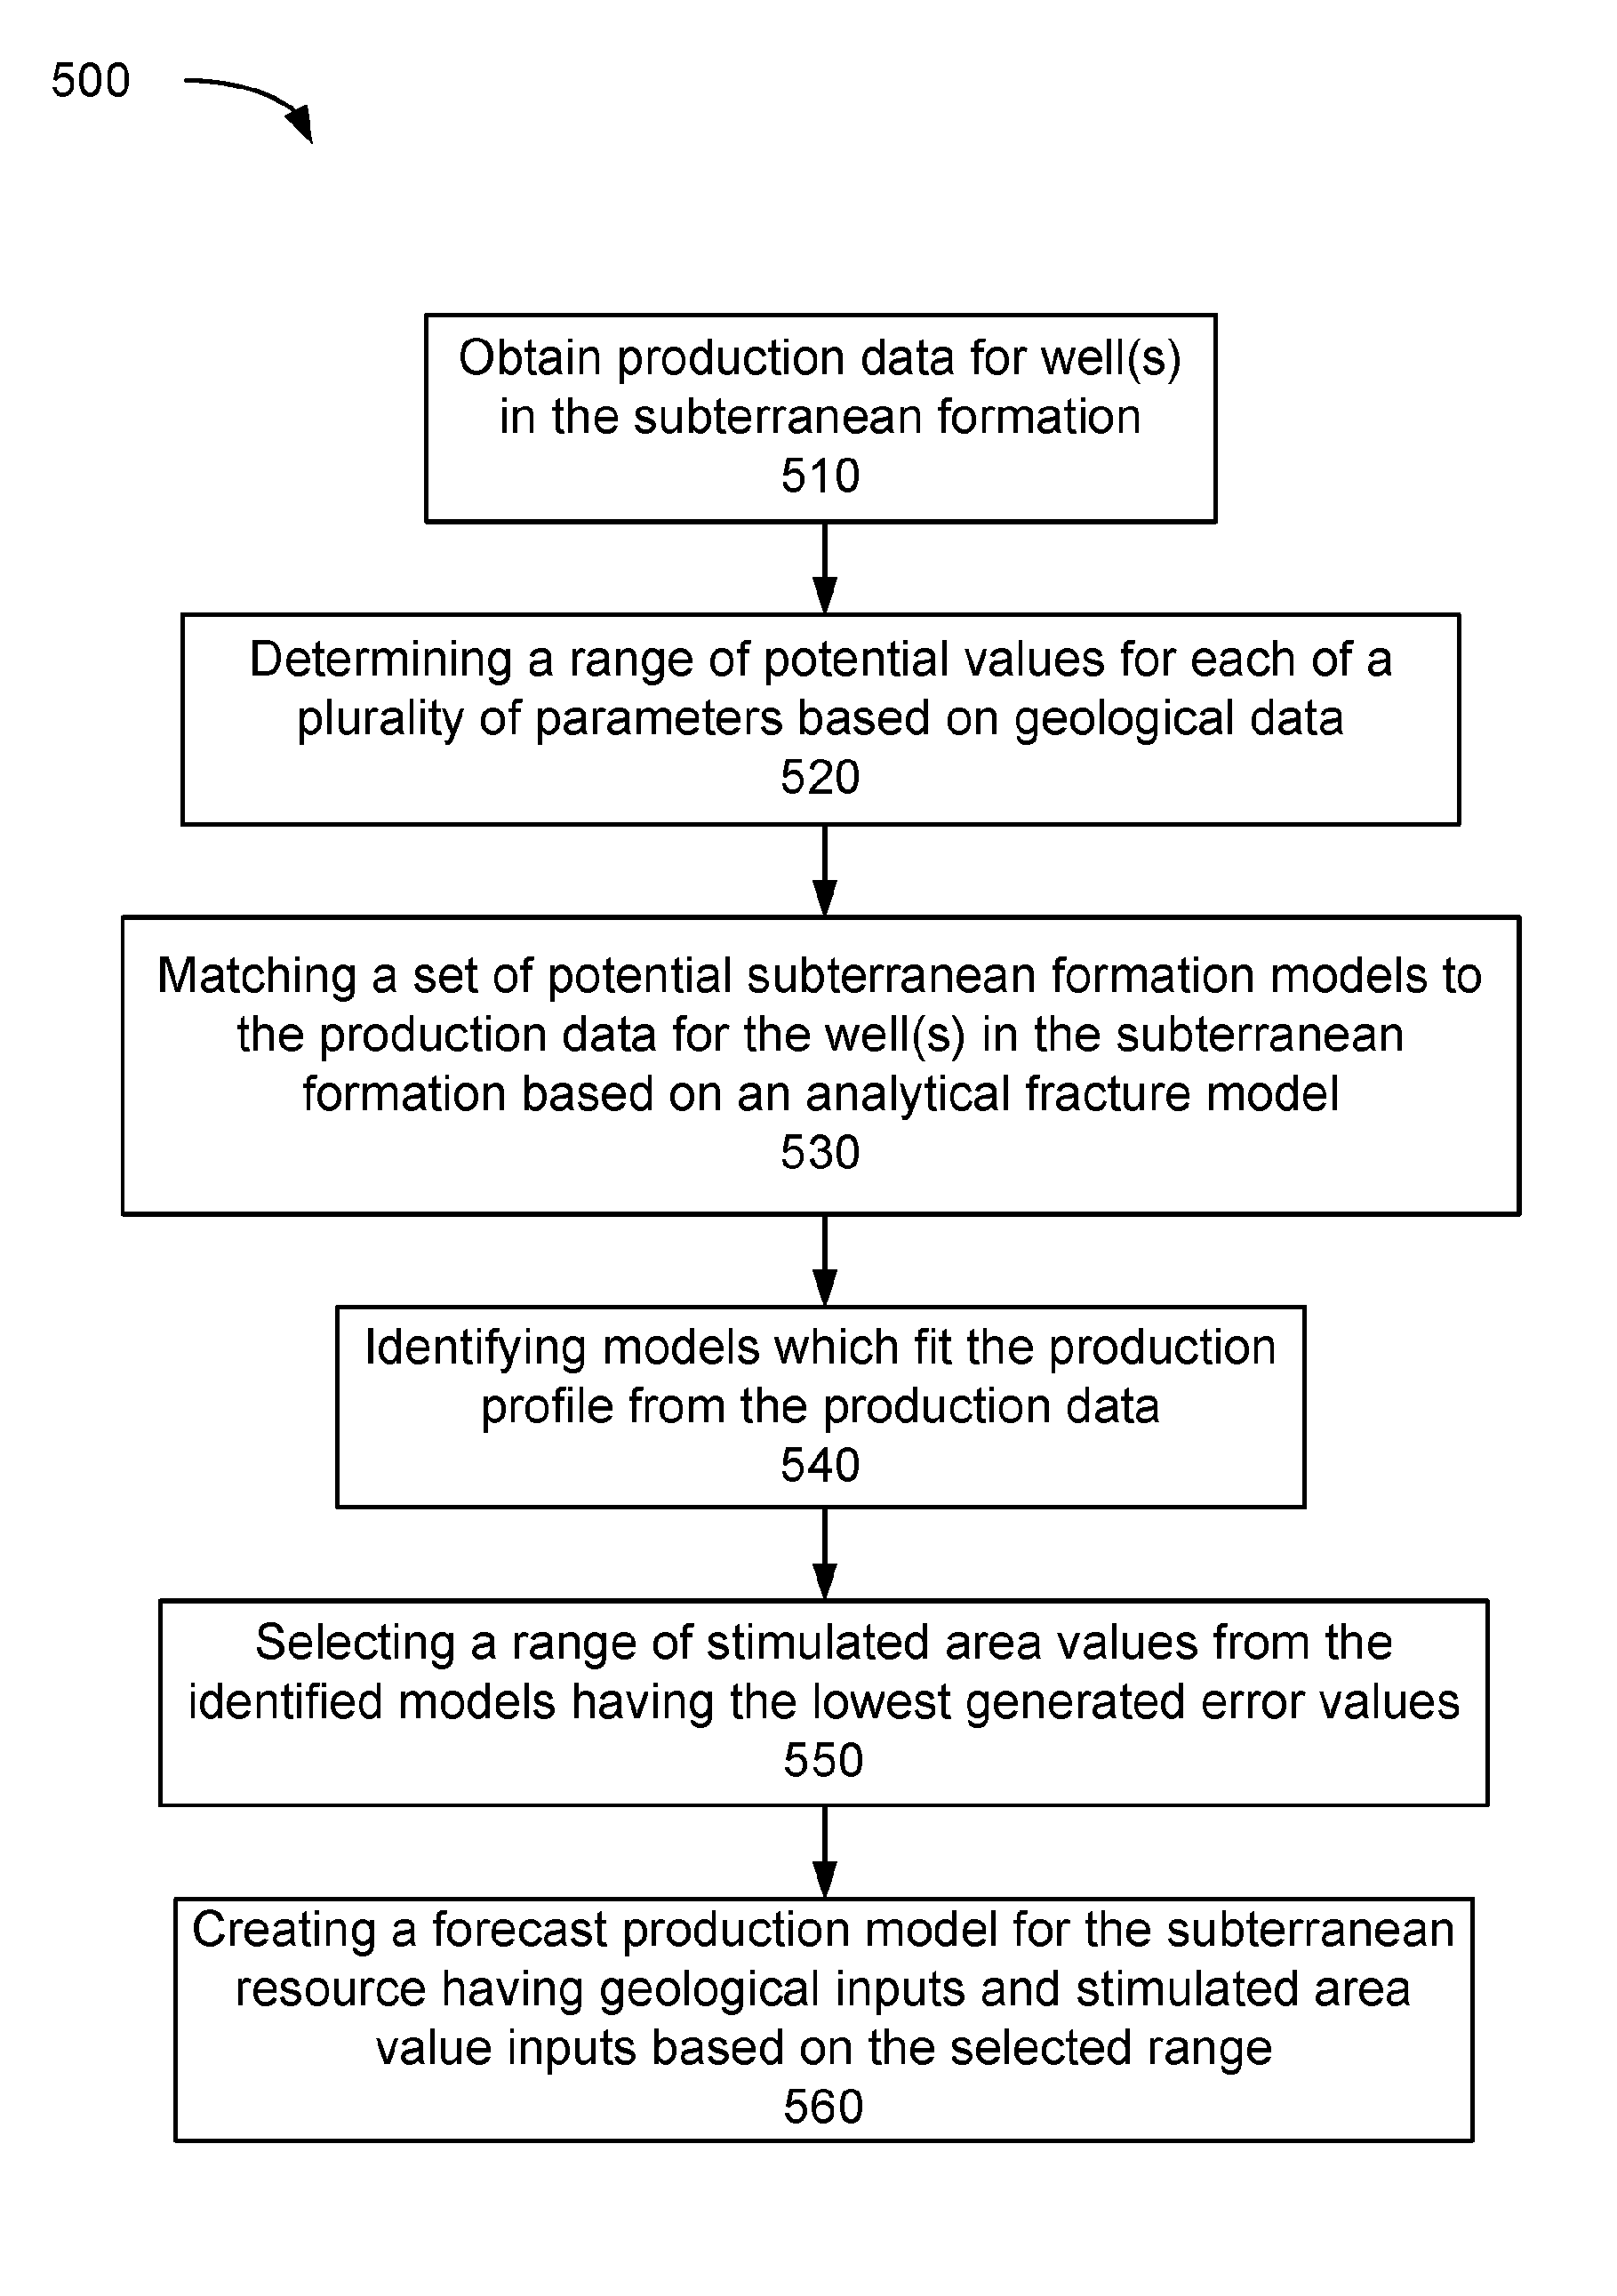
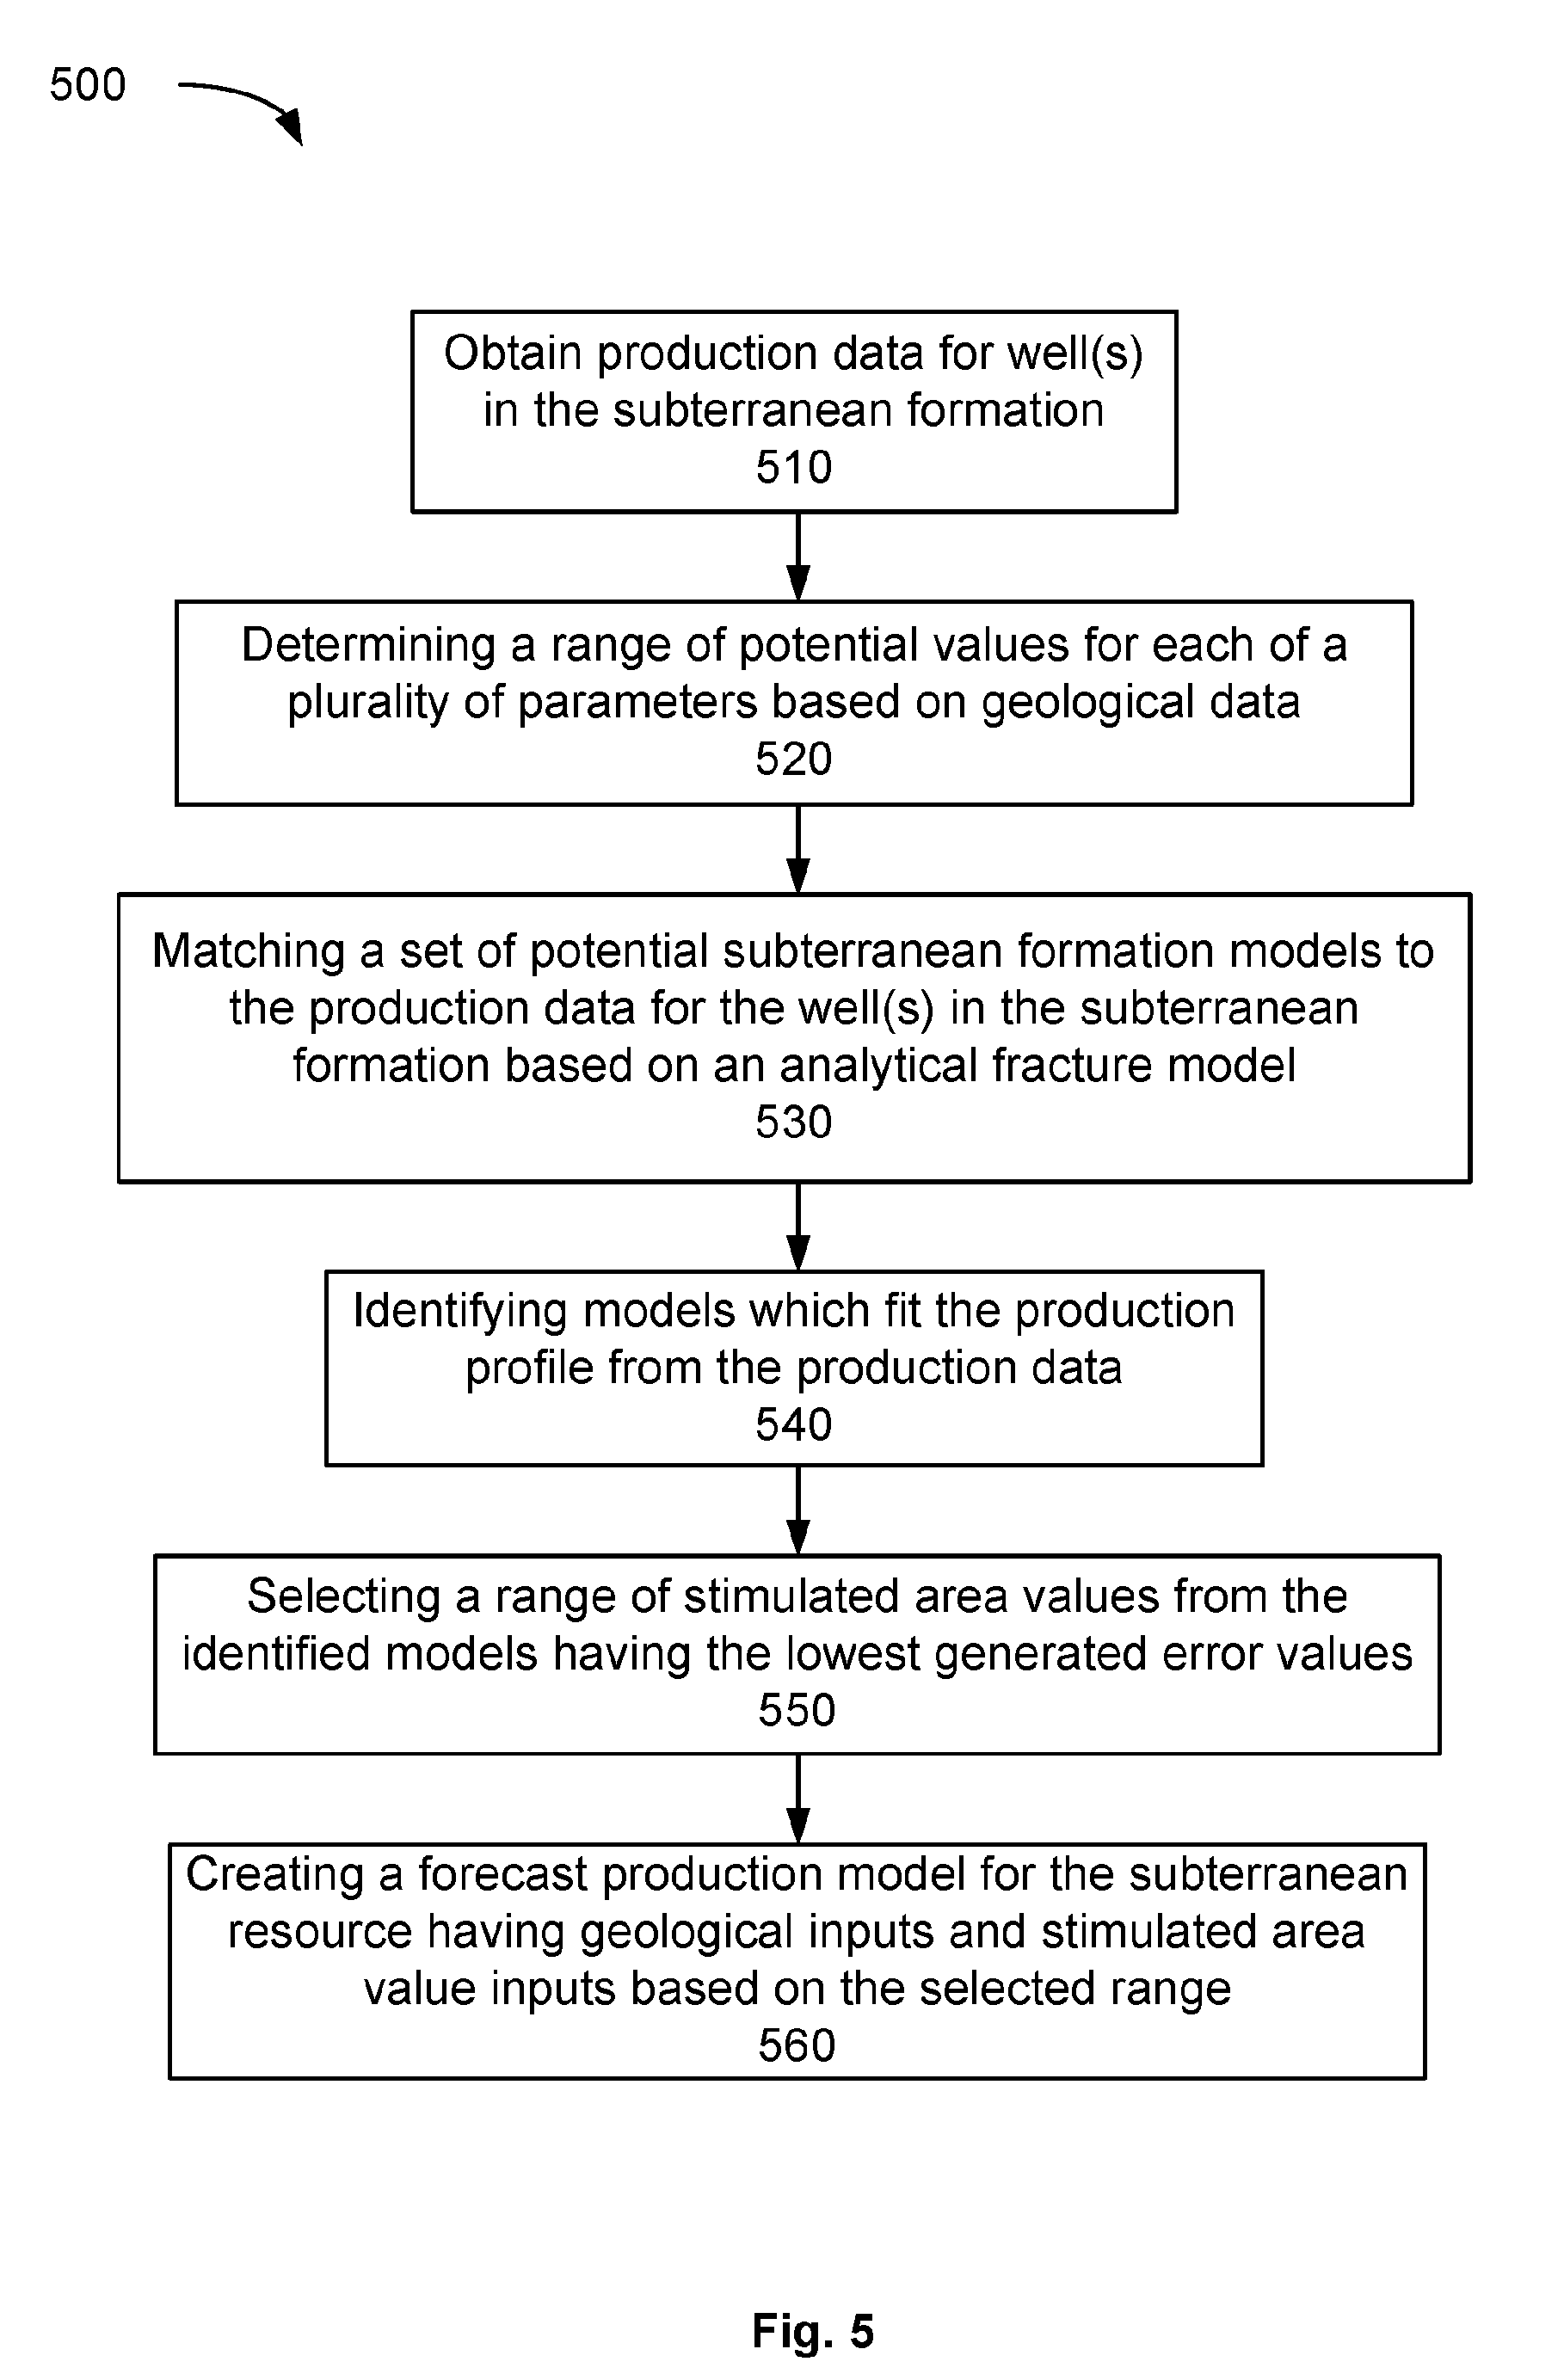
[0044] FIG. 5 shows a flowchart illustrating aspects of an example method 500 for modelling hydrocarbon production rates for a subterranean formation. At 510, one or more processor(s) 210 and/or other aspects of device(s) 205 may be configured to receive, access, compile or otherwise obtain production data for at least one well in the subterranean formation 110.
[0045] In some examples, the production data can be obtained from one or more memories 215, storage devices 215, 225, and/or sensors or field devices 230, 240. In some examples, the production data can include periodic (e.g. daily, weekly, monthly, etc.) production values, cumulative production values or any other data values from which suitable production data can be calculated.
[0046] In some embodiments, the production data for the well(s) should span at least 6 months of normalized production in order to produce meaningful results.
[0047] The processor(s) can also obtain drilling data, completion data, and/or data associated with geological properties.
[0048] In some examples, data associated with geological properties can include well logs such as gamma ray well log(s), bulk density well log(s), neutron density well log(s), resistivity well log(s), core and/or well image data, nuclear magnetic resonance log(s), and/or any other well log that can be measured in the well.
[0049] In some examples, the processor(s) drilling and/or completion data can include fracture heights, fracture half lengths, a number of fractures, a fracture drainage area half-lengths, a fracture drainage area half widths, a fracture half-lengths, well lengths, and the like.
[0050] In some embodiments, data may be obtained from internal data sources, or data collected from drilled wells and fracturing processes.
[0051] In some embodiments, data may be obtained from public sources such as a data retrieved from a government or otherwise public fracturing database. This public data may include production data for which production values for multiple fractures and/or wells may be combined into a single value. In some examples, the public data may not include all fracture characteristics or geological data.
[0052] In accordance with some embodiments, the methods, systems and devices herein may accommodate for incomplete data sources such as public data or limited confidential data from a third party while still providing a production model with a reasonable degree of confidence.
[0053] In some embodiments, the processor(s) may combine internal and external data sources.
[0054] At 520, the processor(s) identify a range of values for each parameter in a set of parameters for the subterranean formation. In some examples, the range of values for a parameter can be identified by determining a possible range of values based on geological data. In some embodiments, the processors can receive or otherwise obtain ranges of values from one or more input sources which may be based at least in part on the collected geological data for the subterranean formation.
[0055] The set of parameters can include one or more geological parameters representative of geological characteristics of the subterranean formation. For example, geological parameters can include one or more of formation height, reservoir depth, porosity, permeability, water saturation, and the like. In some examples, the geological parameters can include pressure properties, and/or rock and fluid properties including, for example, pressure gradient, initial pressure, operating conditions such as early or late well flowing pressure, months to well flowing pressure change, temperature gradient, reservoir temperature, rock compressibility, water compressibility, API (American Petroleum Institute) gravity, gas-to-oil ratio, combined gas gravity, relative gas permeability, residual gas saturation, critical gas saturation, gas viscosity, condensate gas ratio and the like.
[0056] In some examples, the set of parameters can include well parameters such as completion parameters and fracture parameters. These parameters can include fracture heights, fracture half lengths, a number of fractures, fracture drainage area half-lengths, fracture drainage area half widths, fracture half-lengths, well lengths, and the like.
[0057] In some instances, one or more parameters may be fixed or constant based on the parameter itself or the obtained data. These parameter(s) will have a single value. However, other parameters may be unknown or may not be pinpointed exactly, so the processor(s) generate or receive a range of potential values for the parameter(s). These ranges can be based on the obtained geological and/or other obtained data.
[0058] For example, the processor(s) can generate or receive parameter ranges which would be reasonable or possible based on log data, geostatistical models and/or extrapolated data between wells. In some examples, the processor(s) can generate or receive parameter ranges based on correlations with other parameters. For example, pressure(s) may be correlation with reservoir depth. In some examples, the range of values may be based on correlations with other geological formations having similar geological data.
[0059] In some embodiments, the processor(s) can generate or receive a granularity or increment by which the ranges of parameter values can be varied in the system.
[0060] Each combination of values including a selection from each range for the set of parameters corresponds to, defines or otherwise represents a potential subterranean formation model, and the total set of different combinations of values for the set of parameters defines a set of potential subterranean formation models.
[0061] At 530, the processor(s) match the set of potential subterranean formation models to the production data for the well(s). The matching is based on an analytical fracture model. In some examples, the analytical fracture model can generate a production model based on the geological parameters. However, as described herein, the base analytical model can include a number of unknowns which cannot be solved directly. In some embodiments, a number of these unknowns can be combined into a single stimulated area value. In some examples, the stimulated area value can be based on a number of parameters in the set of parameters defining or otherwise associated with properties of a subterranean formation model.
[0062] In some examples, using a combination of values for the set of parameters as inputs to the analytical fracture model, the processor(s) can generate a production model for the potential subterranean formation model corresponding to the set of input values. In some examples, the processor(s) can determine a stimulated area value for the generated production model.
[0063] The processor(s) compare the generated production model with the production data from the well(s) to generate an error value between the production of the generated model and the physical well production data. In some examples, the error value may be a total error over the production period, an average error, a maximum error, or any other error metric. In some embodiments, the error value may be based on individual production values for each time period.
[0064] In some embodiments, the error value may be based on one or more of cumulative gas production, gas production rate, cumulative oil production, oil production rate, and the like.
[0065] In some embodiments, the processor(s) are configured to select parameter values for inputting in a subsequent iteration based on a machine learning algorithm and previous error values. In some examples, the processor(s) can be configured to use a genetic algorithm to select subsequent parameter values for generating subsequent models.
[0066] In some embodiments, the genetic algorithm can optimize or improve the searching of a large solution space. It can include selecting several sets of random values from all parameters and solving for the objective matching function. The results which provide the best matching function result can be merged together to find new sets of values for testing. This process is iterated with the best matching function results from each iteration used in subsequent sets of values for testing. In addition to or alternatively to previous inputs sets being combined, in some embodiments, random variations can be introduced to input sets. In some instances, this can reduce the chance of solutions converging on a local optimal rather than a global optimal.
[0067] In some instances, this may reduce the number of models to be analyzed, and may reduce the computation time and resources required to complete the model matching process.
[0068] At 540, the processor(s) identify the models from the set of potential subterranean formation models which fit the production profile from the production data within a defined error threshold. In some examples, this includes identifying the models having an error value less than the defined error threshold. In some examples, the error threshold may be a statically defined threshold. In other examples, the error threshold may be based on a defined percentile of the models.
[0069] In some embodiments, the error at different stages of production can be weighted differently. For example, if early production results are more important, the error for earlier stages of production can be weighted more than error for later stages of production; and vice versa. These weightings can be applied to objective matching functions.
[0070] In some embodiments, the determination of the stimulated area values includes performing two runs to deliver a stable region. On the first run, a consistent number (e.g. 5000) of trials are performed on each run. On the second run, the model can be rerun with the last good solution as a starting point to ensure tight clustering of values. Again a consistent number of runs should be used. In some embodiments, three criteria are then used to define an acceptable solution space. First, a minimum absolute error of at least 20% should be achieved for a run to be considered valid. All runs should be completed with similar weighting to ensure the results are comparable. Second, the mean error can be examined as it progresses through the solution space. Cases that are within a best fit mean error will be retained. Only trials with a deviation of less than 1% will be used. Third, the maximum error of 2.times. the minimum error should be used to bound the cases. The corresponding total error for this stable region of running average stimulated area value can be used to pick a minimum and maximum stimulated area value. In other embodiments, different mechanisms for determining the stimulated area values may be used.
[0071] At 550, the processor(s) select a range of stimulated area values from the identified models which fit the production profile from the production data within the defined error threshold. In some examples, the selected range is based on the models having the lowest error values. In some examples, the selected range is based on a concentration of stimulated area values which correspond to models having a low error value.
[0072] At 560, the processor(s) create a forecast production model for the subterranean resource having inputs based on the geological data, and stimulated value input(s) based on the selected range. The process for forecasting production model is described in the following sections.
Analytical Model
[0073] As described above, in some embodiments, the matching process at 530 is based on an analytical fracture model. In some examples, the analytical fracture model can involve a gas model, an oil model or both.
[0074] FIG. 6 shows an example flowchart 600 outlining aspects of an example gas model. As described herein or otherwise, the processor(s) generate or receive physical input values or ranges of physical input values based on obtained geological data. In some examples, such geological data can be derived from petrophysical interpretation of well logs from adjacent or nearby wells. In some embodiments, the geological data can include time steps, pressure differences (initial, early, late), net pay, gas permeability, porosity, drainage area half width, fracture spacing half distance, condensate gas ratio, and the like.
TABLE-US-00001 PARAMETER Units Min Max Increments Skin Shape 0.5 3 0.1 Function Krg 0.1 0.5 0.02 Formation Net m 53.24 70.69 0.25 Thickness Frac Height % 60% 100% 2% Frac half length m 20 85 2 Well Length m 1200 1391 5 Number of Fracs Count 9 12 1 Reservoir Depth m 3236 3328 0 Pressure Gradient psi/ft 0.759927 0.834638 0.01 Early Pwf psig 2000 7500.0 100 Late Pwf psig 200 2000.0 20 Pwf Change Time Months 0 6.0 1 Temperature F/ft 0.02 0.03 0.001 Gradient Rock Compres- 1/psi 1.0E-07 6.0E-06 2.0E-07 sibility Porosity % 5% 6% 0.1% Permeability mD -4 -2.52 0.01 (log scale) Water Saturation % 10% 18% 0.25% CGR Bbl/Mmcf 50.00 89.00 5.00
[0075] From the physical inputs, the processor(s) may calculate other inputs which may be dependent or otherwise correlated with the physical inputs or other calculated inputs. These calculated inputs or correlations may include gas z factor calculations, critical temperatures and pressures for miscellaneous gasses, gas viscosity correlations, gas compressibility correlations, gas pseudopressure miscellaneous gasses, temperature, skin, k slippage and the like. These calculations may be performed with any currently known or future techniques.
[0076] The table above illustrates example physical and calculated inputs which may be used to create models for the subterranean formation.
[0077] Based on Darcy's Law, in its simplest form, radial flow q is based on both an effective permeability, and a fracture area:
q = kA * .DELTA. p .mu. * L ##EQU00001##
[0078] Assuming all other factors are constant, if permeability increases, the fracture area must be lower to achieve the same flow rate. Since these parameters are both unknown, the relationship between these parameters can be determined to select appropriate forecast models which will produce accurate results. These unknowns can be combined into a stimulated area value which may be solved based on the known production data.
[0079] In a simplified linear flow equation:
1 q = m t + b ' ##EQU00002##
[0080] Oil and gas flow equations are different:
m = 31.3 B hx f k .mu. .0. c t * 1 p i - p wf ##EQU00003##
[0081] Oil:
m = 315.4 T h .0. .mu. g c t * 1 p i - p wf * 1 x f k ##EQU00004##
[0082] Gas:
[0083] As highlighted these linear flow equations share the unknowns of pay thickness h, the fracture half-width x.sub.f, and the square root of the permeability k. In some embodiments, processor(s) can be configured to combine these into a single stimulated area value. This stimulated area value can, in some embodiments, be the stimulated area A (h*x.sub.f) times the root of the effective permeability k.
[0084] In some embodiments, the analytical model for gas may be based on an equivalent gas flow rate equation:
q g = ( skin ) ( # of fracs ) ( .DELTA. p ) ( h ) ( K gas ) ( Gas Constant ) ( 460 + T ) ( P wd Gas Frac ) Where skin = permeability adjustment factor due to liquid drop out .DELTA. p = difference in pressure across wellface h = pay thickness K gas = gas permeability T = reservoir temperature in degrees Farenheit P wd Gas Frac = dimensionless pressure ( 1 ) ##EQU00005##
[0085] The dimensionless pressure can be based on a Gringarten (Gringarten, A. C., Ramey, H. J., "Unsteady-State Pressure Distributions created by a well with a single Infinite-Conductivity Vertical Fracture", Stanford University, August 1974) approach using dimensionless time:
Tda Gas = 0.00633 * K gas * Green Function Time .mu. g * .0. * C t Gas * 4 * X e * Y e ( 2 ) ##EQU00006##
[0086] Where [0087] .mu..sub.g=gas viscosity [0088] O=porosity [0089] C.sub.t.sub.Gas=gas compressability [0090] Xe=drainage area half width, and [0091] Ye=drainage area half-length or half distance between fracs
[0092] With equation (2), the processor(s) can generate a log of dimensionless time values. In some examples, this model may assume and treat each fracture as a single vertical well with a single horizontal fracture. In some embodiments, the processor(s) handle each fracture in a well with multiple fractures as individual identical single fracture wells with a well length based on the original well length divided by the number of fractures.
[0093] Based on the above and using Green Equations, the processor(s) can generate an analytical model including a log of dimensionless time and pressure estimates. From these logs and equation (1), a single phase gas forecast estimate can be provided for each time step. These cumulative gas volumes are at surface conditions prior to liquids being removed.
[0094] The relationship of pressure drop over time p/z can be used to calculate pressure steps as the gas is produced. In some embodiments, the processor(s) generate the p/z relationship based on initial pressure, and final pressure from the measured or calculated data. For example, an initial pressure can be a known measured data point, or it can be calculated based on depth and gradient data. In some examples, the gradient may be a varied parameter during the matching process.
[0095] Based on iterations of:
P / Z slope = Pwf - Pi Qg ##EQU00007##
the pressures at each interval can be generated.
[0096] In some embodiments, each time interval can be divided into two or more subintervals. The processor(s) can be configured to determine the pressure, P/Z slope and Q for each subinterval. The average pressure across these subintervals is then used as the pressure for the whole interval. In some examples, this can potentially provide a more accurate estimation of the changing pressure as the well ages.
[0097] In some embodiments, the processor(s) can be configured to account for changes to the gas/liquid composition changes with pressure. Based on the condensate gas ratio parameter, the processor(s) can generate or access a database of PVT (pressure-volume-temperature) tables at different yield bands.
[0098] In addition to the analytical model for gas production, in some embodiments, the processor(s) can generate an analytical model which alternatively or additional accounts for oil production. FIG. 7 shows an example flowchart 700 outlining aspects of an example oil model. As described herein or otherwise, the processor(s) generate or receive physical input values or ranges of physical input values based on obtained geological data. In some examples, such geological data can be derived from petrophysical interpretation of well logs from adjacent or nearby wells. In some embodiments, the physical inputs can include time steps, pressure differences, net pay, effective permeability, porosity, drainage area half width, fracture spacing half distance, condensate gas ratio or gas oil ratio, initial water saturation and the like.
[0099] From the physical inputs, the processor(s) may calculate other inputs which may be dependent or otherwise correlated with the physical inputs or other calculated inputs. These calculated inputs or correlations may include oil viscosity, gas viscosity, oil expansion factor, gas expansion factor, bubble point pressure, oil compressibility, formation volume factors, solution gas-oil ratio, formation volume factor, oil expansion factor, and the like. In some examples, these calculated inputs may be calculated relative to a bubble point pressure. These calculations may be performed with any currently known or future techniques.
[0100] As described above, the processor(s) can generate the oil analytical model by determining a stimulated area value (e.g. A root K) similar to the gas model. However, the dimensionless time value function for oil can be based on:
Tda = 0.00633 * K oil * Green Function Time .mu. o * .0. * C t * 4 * ( ( X e * Y e ) / ( 0.3048 ) 2 ) , and ##EQU00008## q o = ( # of fracs ) ( .DELTA. p ) ( h ) ( k eff ) ( k ro ) ( 141.2 ) ( .mu. o ) ( P wd ) ( B ti ) ##EQU00008.2##
[0101] Where [0102] Tda=dimensionless time [0103] .DELTA.p=difference in pressure across wellface [0104] h=pay thickness or layer thickness*frac height [0105] K.sub.eff=absolute effective permeability [0106] K.sub.oil=relative permeability to oil [0107] P.sub.wd=dimensionless pressure [0108] .mu..sub.o=gas viscosity [0109] C.sub.t=gas compressability [0110] Xe=drainage area half width [0111] Ye=drainage area half-length or half distance between fracs [0112] # of fracs=number of fractures in the horizontal well [0113] Bti=Total expansion factor
[0114] Based on the above and using Green Equations, the processor(s) can generate an analytical oil model including a log of dimensionless time and pressure estimates. From these logs and equations, an oil forecast estimate can be provided for each time step. These cumulative gas volumes are at surface conditions prior to liquids being removed.
[0115] In some embodiments, the processor(s) can apply material balance equations to adjust the oil production model to account for different gas-oil ratios at different pressures.
[0116] Absolute permeability is the measure of the ability of a single phase fluid to move through a porous medium. When multiple phases (ie. Gas and oil, or oil and water) are present at the same time inefficiencies are created resulting in a permeability that is a fraction of the absolute permeability. This is referred to as relative permeability. Relative permeability changes as a function of the saturation of one phase as a percentage of pore volume. Relative permeability curves describe this relationship. The curves can be determined through special core analysis or assumed based on an analog. In the oil production model, relative perm can be used to account for changes in productivity as the reservoir is depleted and gas is introduced out of solution. The relative permeability adjustment causes an appropriate reduction in productivity.
Well Matching
[0117] As discussed above, the processor(s) match the set of potential subterranean formation models to the production data for the well(s) based on an analytical fracture model. In some embodiments, the processor(s) can match the potential subterranean formation models based on both an oil analytical fracture model and a gas analytical fracture model. In some embodiments, each model can produce its own production models and associated stimulated area values. In some examples, the processor(s) can use the results of the two different models (gas or oil) to determine a probability that a portion or all of a subterranean formation will use one model over the other.
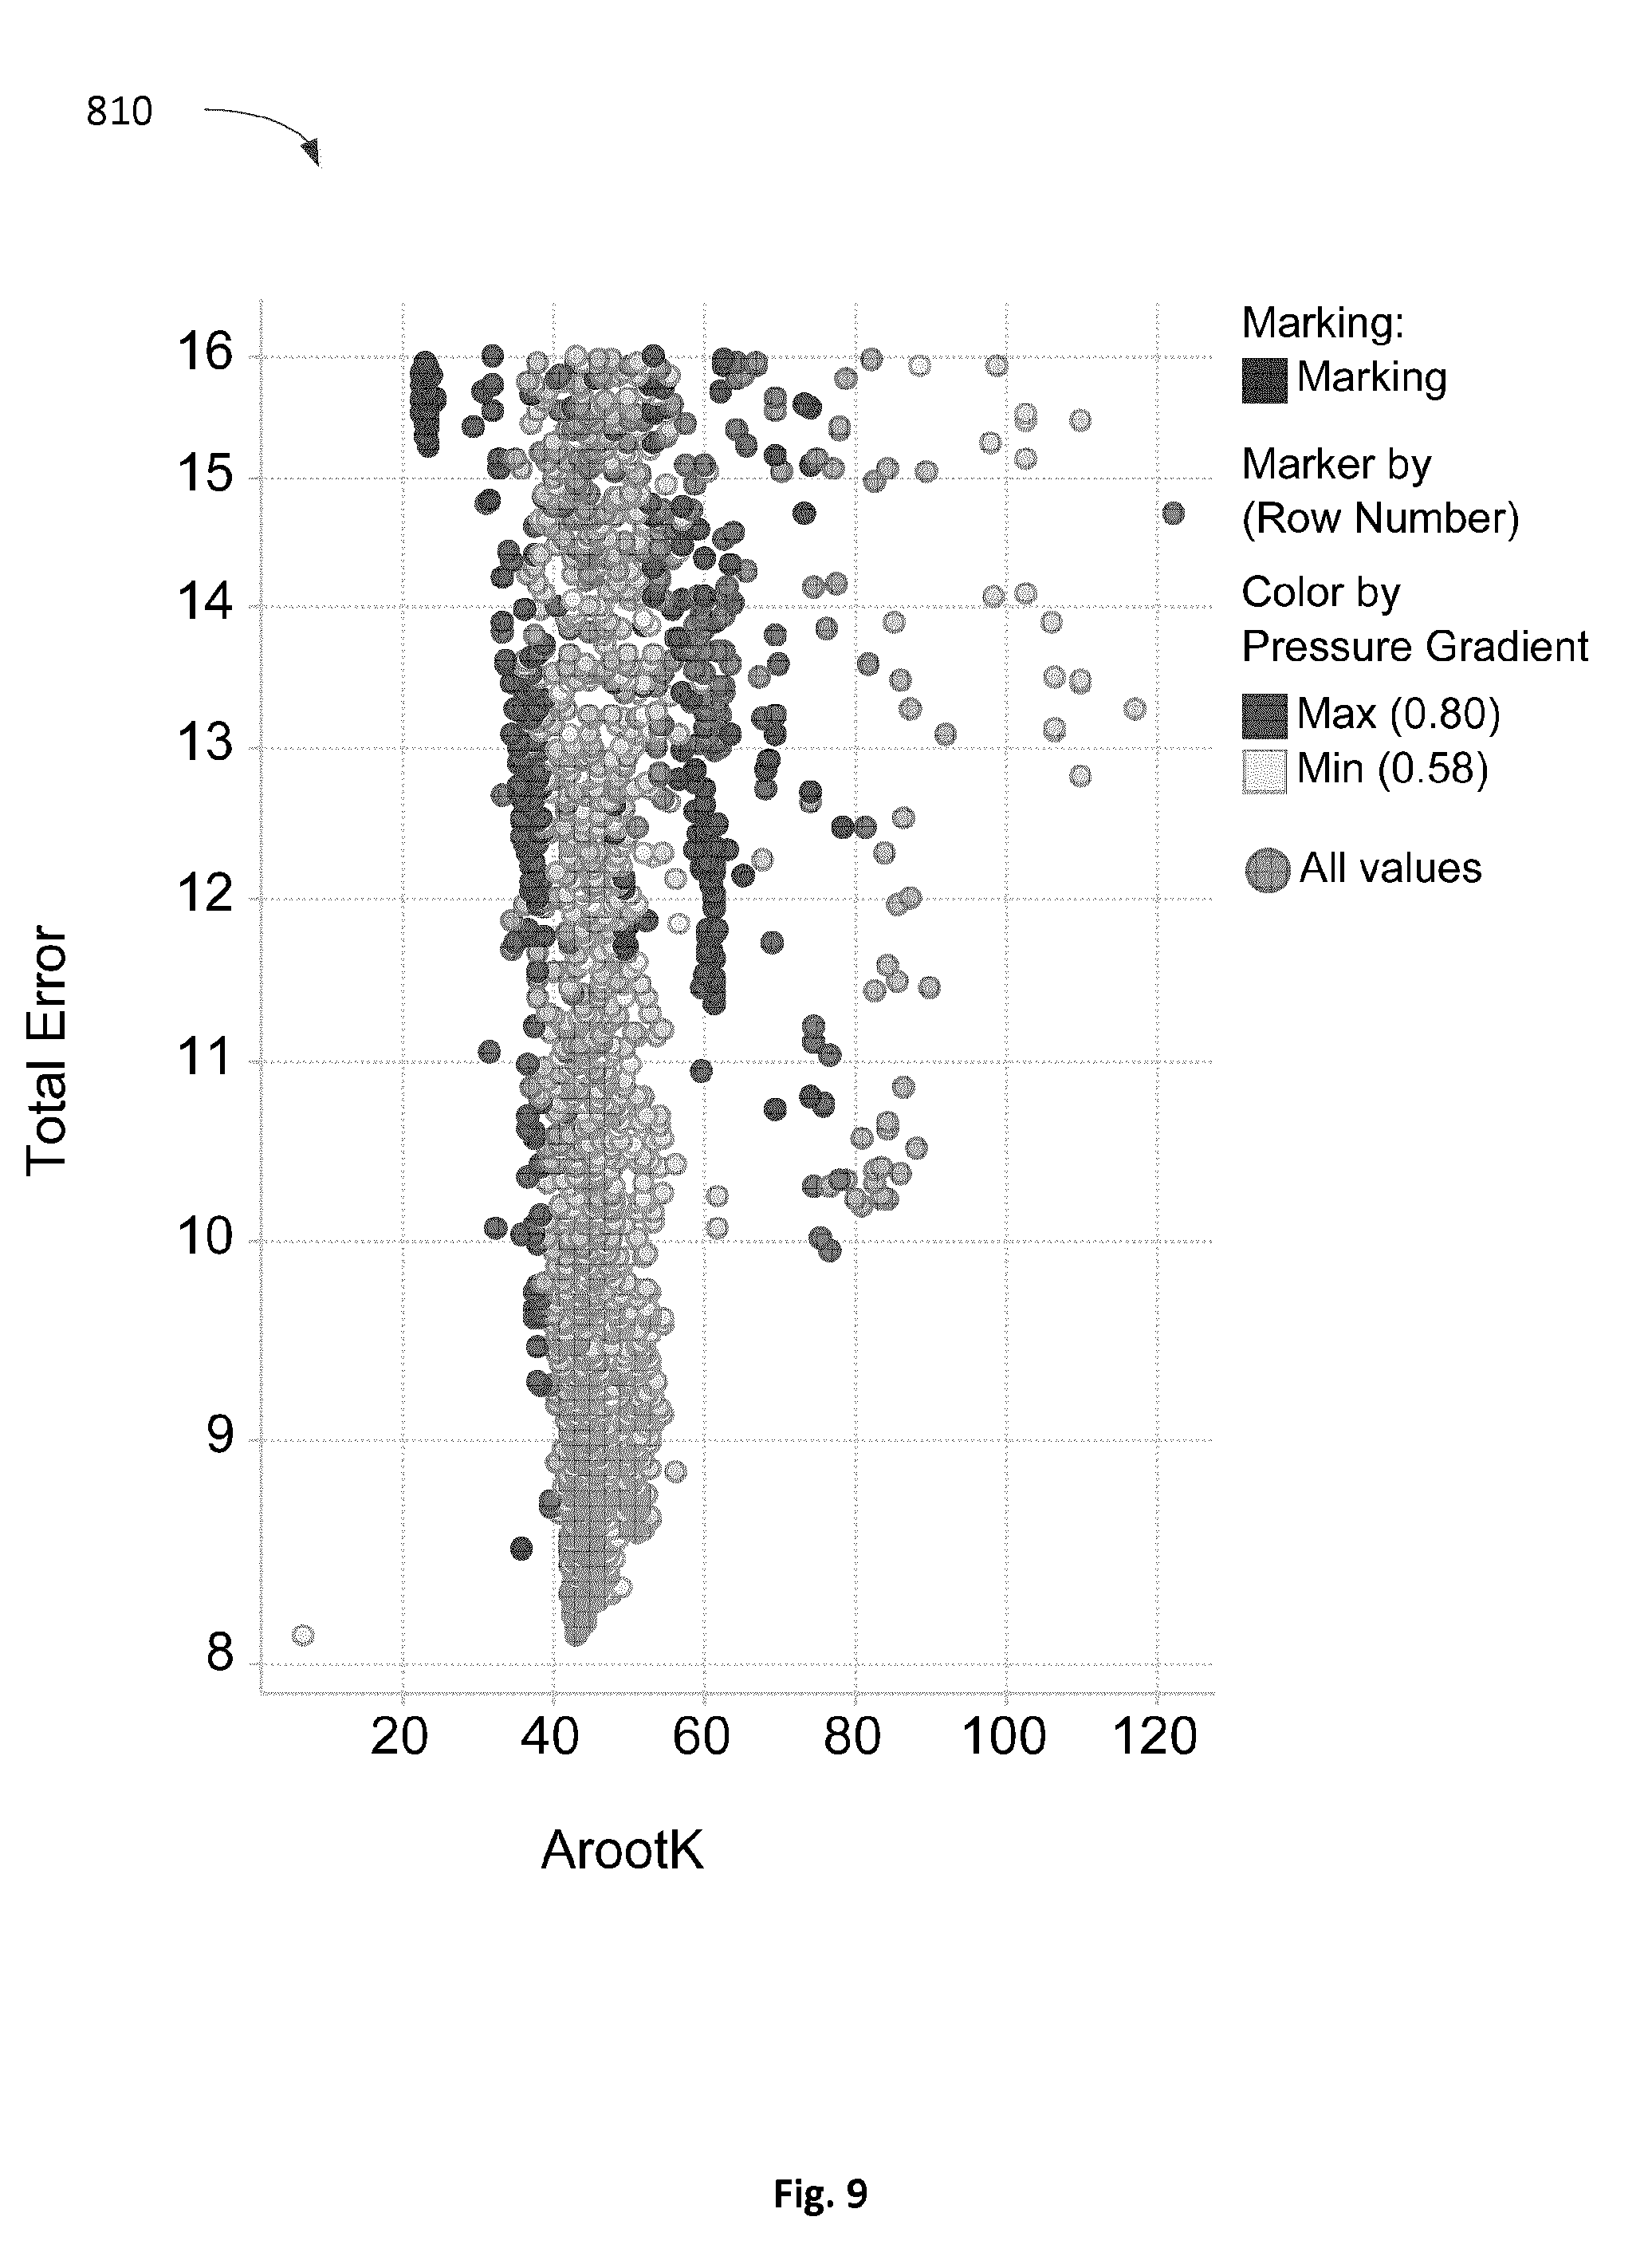
[0118] After matching the models, the processor(s) can store and/or compile all the production models and their corresponding error values and stimulated area values. FIG. 8 shows a plot 800 of stimulated area vs. error with each data point representing a matched production model. In some examples, the processor(s) can be configured to generate such a plot and output it on an output device such as a display, printer, or communication device.
[0119] The processor(s) can be configured to identify a subset 810 of the production models (see FIGS. 8 and 9) which have an error value below a defined threshold or which otherwise fit the production profile from the production data within a defined error threshold.
Forecasting Model
[0120] At 560, the processors generate a forecast production model. In some embodiments, the forecast production model is defined by a number of input parameters representative of geological characteristics of the subterranean formation. The forecast production model is based on the stimulated area values identified by the analytical model and well matching.
[0121] By applying distributions of reservoir input parameters for the area of interest, the forecast production model can generate production forecasts over time for the area of interest. In some embodiments, ranges and/or distributions of input parameters for the area of interest can be used as inputs to generate an average production forecast for the area.
[0122] In some embodiments, the forecasting model can be run deterministically using single values for each parameter or Monte Carlo or similar techniques can be used to deliver a distribution of production forecasts. Forecasts can be created for both hydrocarbon liquids and gas.
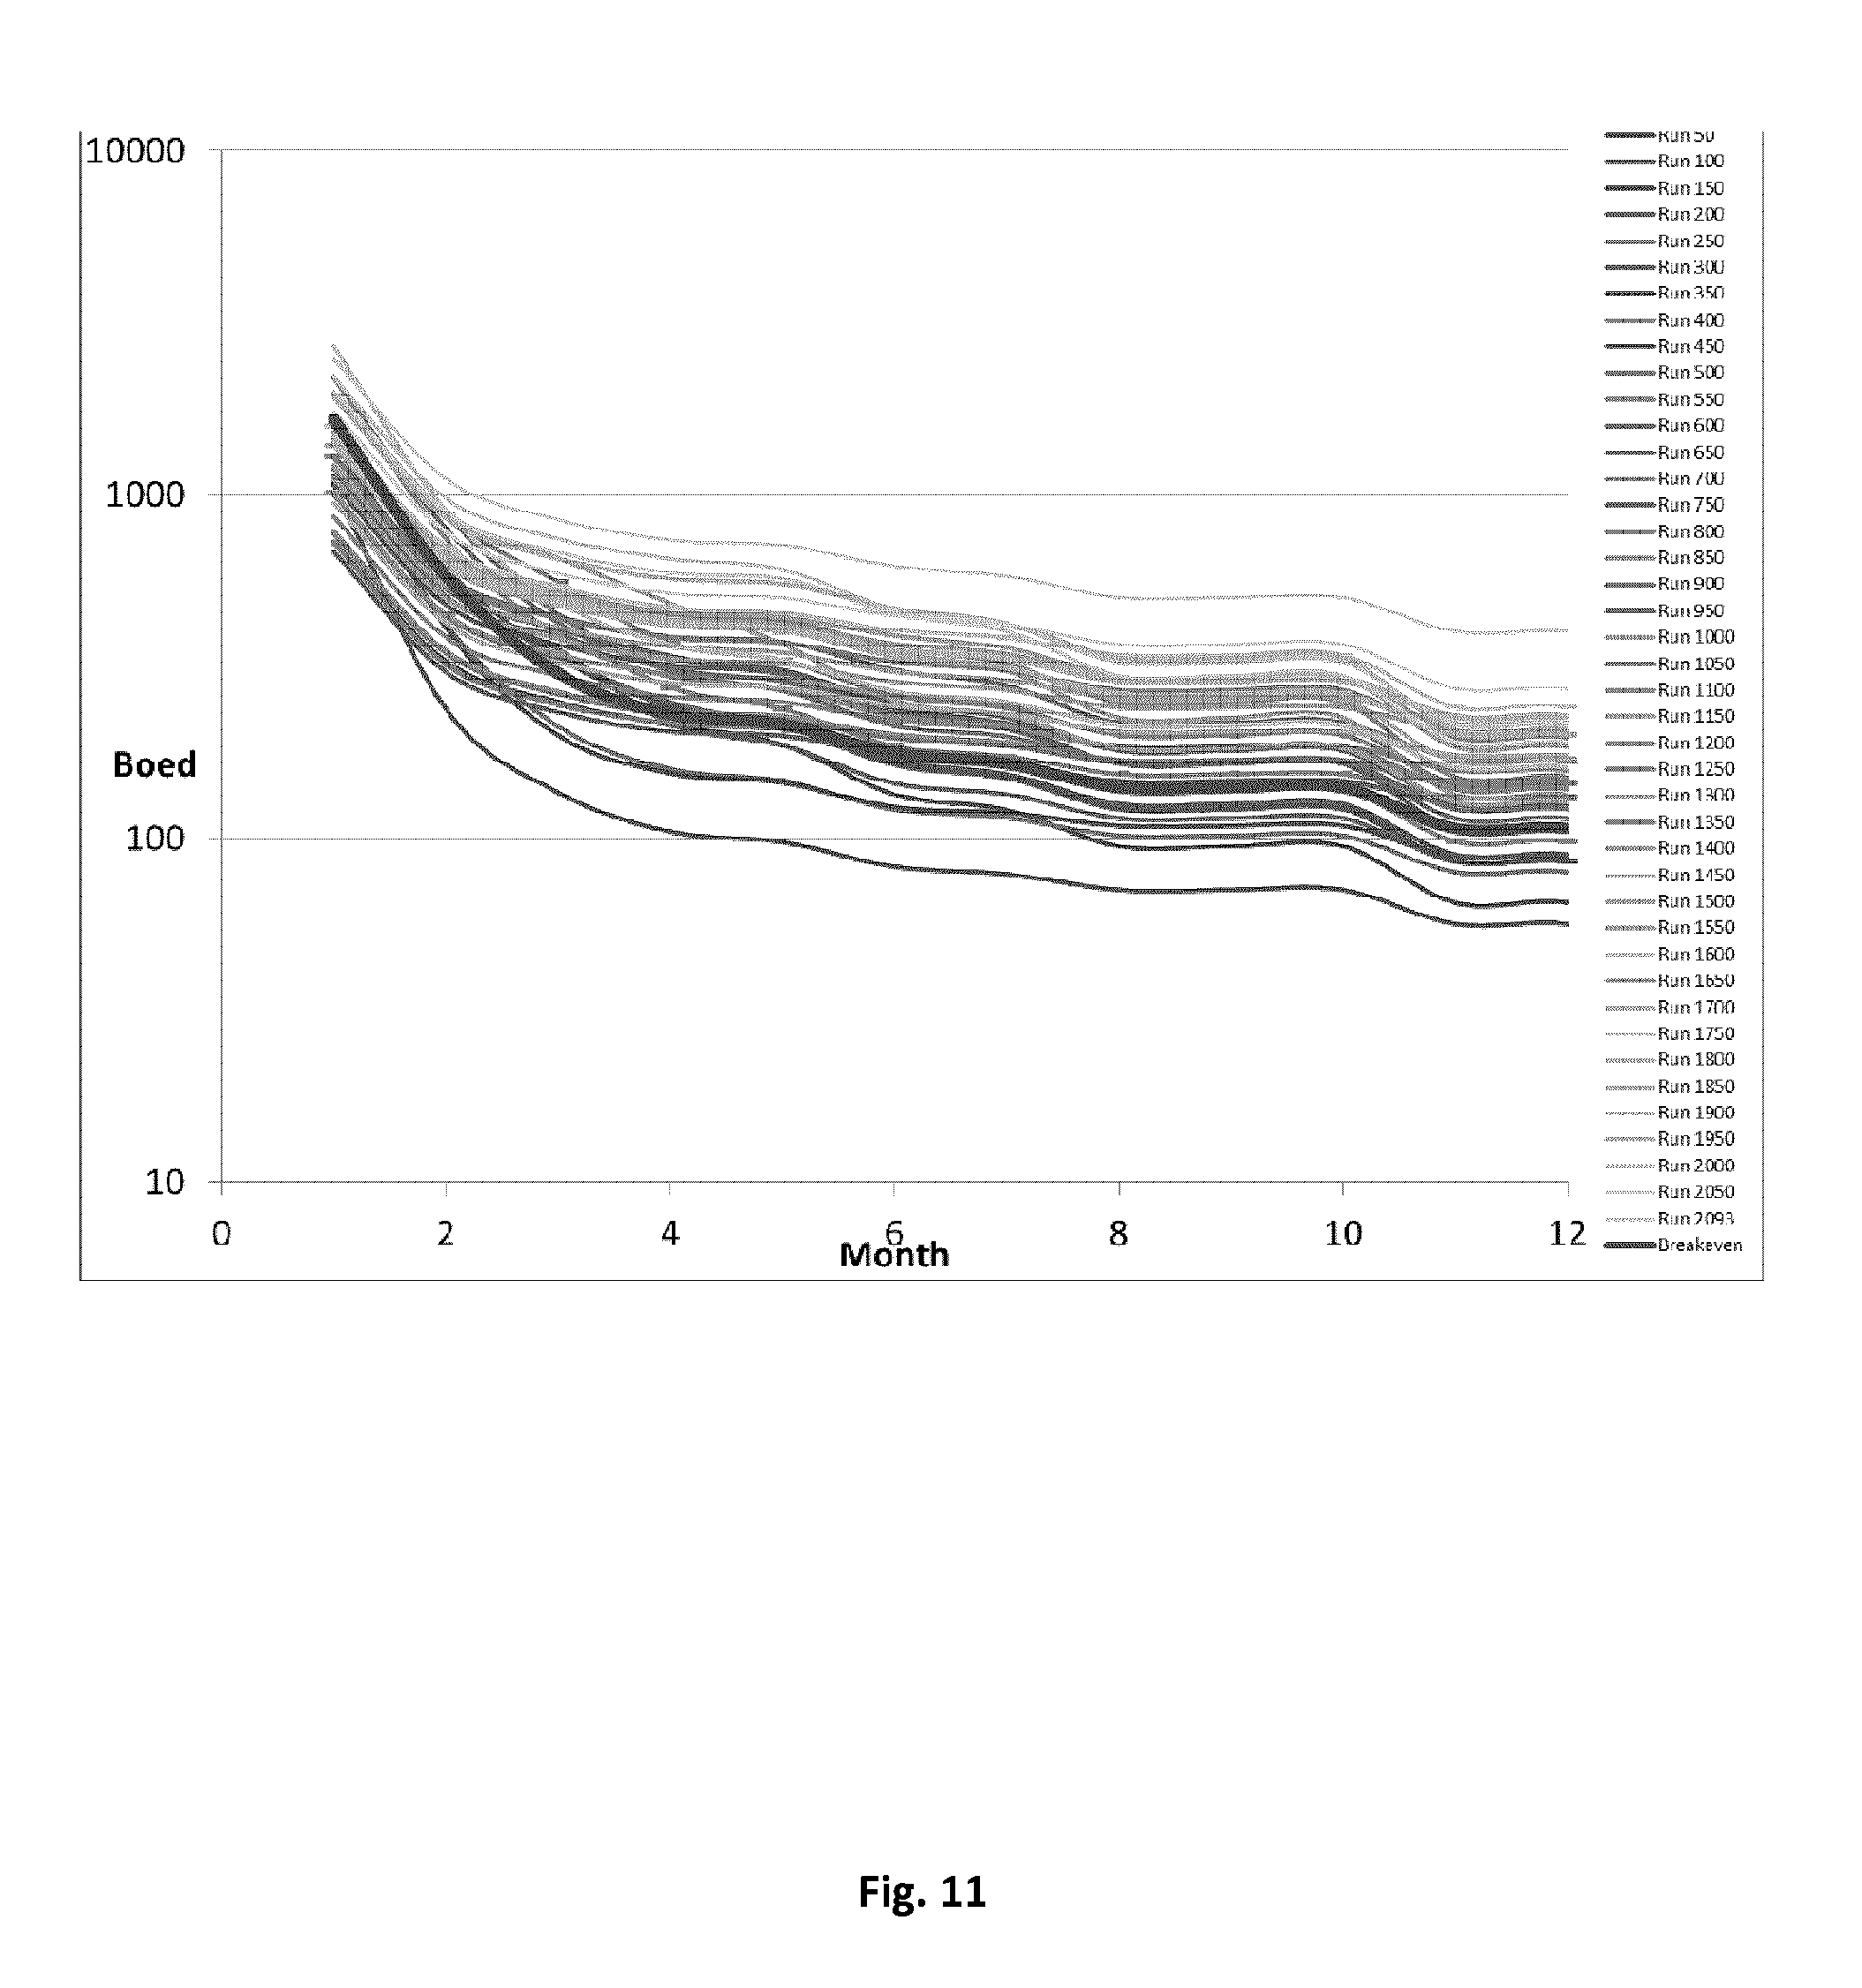
[0123] In some embodiments, the forecast models can provide an indication of predicted average production rates over time. In other embodiments, the forecast models can provide probabilistic production rates based on the possible distributions for input parameters including the geological characteristics and the stimulated area value. As illustrated in FIG. 11, in some embodiments, graphs are generated to illustrated different probabilistic production rates over time.
[0124] In some embodiments, by applying input parameters representative of geological characteristics of a particular area or localized region, the system can, in some instance, model production rates which account for physical and potentially subtle geological variations across an area.
[0125] As illustrated in FIG. 10, in some embodiments, forecast models can be used to generate a visual map illustrating different production forecasts across a prospective area. In some instances, the forecast models can be used to generate a probabilistic financial viabilities of different portions of an area.
[0126] As described herein, in some embodiments, these forecast models can in some instances account for various unknowns in the available production data and/or variations in geological characteristics across a play.
[0127] Although the embodiments have been described in detail, it should be understood that various changes, substitutions and alterations can be made herein without departing from the scope as defined by the appended claims.
[0128] Moreover, the scope of the present application is not intended to be limited to the particular embodiments of the process, machine, manufacture, composition of matter, means, methods and steps described in the specification. As one of ordinary skill in the art will readily appreciate from the disclosure of the present invention, processes, machines, manufacture, compositions of matter, means, methods, or steps, presently existing or later to be developed, that perform substantially the same function or achieve substantially the same result as the corresponding embodiments described herein may be utilized. Accordingly, the appended claims are intended to include within their scope such processes, machines, manufacture, compositions of matter, means, methods, or steps
[0129] As can be understood, the examples described above and illustrated are intended to be exemplary only. The scope is indicated by the appended claims.
* * * * *
D00000
D00001
D00002
D00003
D00004
D00005
D00006
D00007
D00008
D00009
D00010
D00011


XML
uspto.report is an independent third-party trademark research tool that is not affiliated, endorsed, or sponsored by the United States Patent and Trademark Office (USPTO) or any other governmental organization. The information provided by uspto.report is based on publicly available data at the time of writing and is intended for informational purposes only.
While we strive to provide accurate and up-to-date information, we do not guarantee the accuracy, completeness, reliability, or suitability of the information displayed on this site. The use of this site is at your own risk. Any reliance you place on such information is therefore strictly at your own risk.
All official trademark data, including owner information, should be verified by visiting the official USPTO website at www.uspto.gov. This site is not intended to replace professional legal advice and should not be used as a substitute for consulting with a legal professional who is knowledgeable about trademark law.