Method And Apparatus For Implementing Threshold Based Correction Functions For Biosensors
Mecklenburg; George A.
U.S. patent application number 16/222555 was filed with the patent office on 2019-04-25 for method and apparatus for implementing threshold based correction functions for biosensors. The applicant listed for this patent is Ascensia Diabetes Care Holdings AG. Invention is credited to George A. Mecklenburg.
| Application Number | 20190119716 16/222555 |
| Document ID | / |
| Family ID | 34967238 |
| Filed Date | 2019-04-25 |


| United States Patent Application | 20190119716 |
| Kind Code | A1 |
| Mecklenburg; George A. | April 25, 2019 |
Method And Apparatus For Implementing Threshold Based Correction Functions For Biosensors
Abstract
A biosensor system, method and apparatus are provided for implementing threshold based correction functions for biosensors. A primary measurement of an analyte value is obtained. A secondary measurement of a secondary effect is obtained and is compared with a threshold value. A correction function is identified responsive to the compared values. The correction function is applied to the primary measurement of the analyte value to provide a corrected analyte value. The correction method uses correction curves that are provided to correct for an interference effect. The correction curves can be linear or non-linear. The correction method provides different correction functions above and below the threshold value. The correction functions may be dependent or independent of the primary measurement that is being corrected. The correction functions may be either linear or nonlinear.
| Inventors: | Mecklenburg; George A.; (Elkhart, IN) | ||||||||||
| Applicant: |
|
||||||||||
|---|---|---|---|---|---|---|---|---|---|---|---|
| Family ID: | 34967238 | ||||||||||
| Appl. No.: | 16/222555 | ||||||||||
| Filed: | December 17, 2018 |
Related U.S. Patent Documents
| Application Number | Filing Date | Patent Number | ||
|---|---|---|---|---|
| 10592218 | Jul 11, 2008 | |||
| PCT/US2005/011077 | Mar 31, 2005 | |||
| 16222555 | ||||
| 60557907 | Mar 31, 2004 | |||
| 60609570 | Sep 13, 2004 | |||
| Current U.S. Class: | 1/1 |
| Current CPC Class: | C12Q 1/006 20130101; G01N 27/3274 20130101 |
| International Class: | C12Q 1/00 20060101 C12Q001/00; G01N 27/327 20060101 G01N027/327 |
Claims
1. A method for implementing threshold based correction functions for a biosensor comprising the steps of: applying a sample to the biosensor and obtaining a primary measurement of an analyte value; obtaining a secondary measurement of a secondary effect; comparing said secondary measurement of the secondary effect with a threshold value; responsive to said compared values, identifying a correction function; and applying said identified correction function to said primary measurement to provide a corrected analyte value.
2. A method for implementing threshold based correction functions for a biosensor as recited in claim 1 wherein the step responsive to said compared values, of identifying a correction function includes the steps of identifying said secondary measurement of the secondary effect less than or equal to said threshold value, identifying a first coefficient A, said first coefficient A to control magnitude of said correction function.
3. A method for implementing threshold based correction functions for a biosensor as recited in claim 2 further includes the steps of calculating said correction function represented by C.sub.n=F*T+A*(T.sub.c-T)+H, where T represents said secondary measurement of the secondary effect, T.sub.c represents said threshold value; and F, H are predefined coefficients.
4. A method for implementing threshold based correction functions for a biosensor as recited in claim 3 wherein the step of applying said identified correction function to said primary measurement to provide a corrected analyte value further includes the steps of calculating said corrected analyte value represented by Gc=Gn/Cn, where Gn represent said primary measurement of said analyte value.
5. A method for implementing threshold based correction functions for a biosensor as recited in claim 1 wherein the step responsive to said compared values, of identifying a correction function includes the steps of identifying said secondary measurement of the secondary effect greater than said threshold value, identifying a coefficient I, said coefficient I being used to control magnitude of said correction function.
6. A method for implementing threshold based correction functions for a biosensor as recited in claim 5 further includes the steps of calculating said correction function represented by C.sub.n=F*T+I*(T-T.sub.c)+H, where T represents said secondary measurement of the secondary effect, T.sub.c represents said threshold value; and F, H are predefined coefficients.
7. A method for implementing threshold based correction functions for a biosensor as recited in claim 6 wherein the step of applying said identified correction function to said primary measurement to provide a corrected analyte value further includes the steps of calculating said corrected analyte value represented by Gc=Gn/Cn, where Gn represent said primary measurement of said analyte value.
8. A method for implementing threshold based correction functions for a biosensor as recited in claim 1 wherein the step of responsive to said compared values, identifying a correction function includes the steps of storing predefined correction curves; said predefined correction curves being provided to correct for an interference effect.
9. A method for implementing threshold based correction functions for a biosensor as recited in claim 1 wherein the step of responsive to said compared values, identifying a correction function includes the steps responsive to said secondary measurement of the secondary effect being less than or equal to said threshold value of identifying a first coefficient A and identifying said correction function responsive to said identified first coefficient A.
10. A method for implementing threshold based correction functions for a biosensor as recited in claim 9 wherein the step of responsive to said compared values, identifying a correction function includes the steps responsive to said secondary measurement of the secondary effect being greater than said threshold value of identifying a second coefficient I and identifying said correction function responsive to said identified second coefficient I.
11. A method for implementing threshold based correction functions for a biosensor as recited in claim 10 wherein the steps of identifying said first coefficient A and identifying a second coefficient I include the steps of providing stored correction curves; said correction curves representing characteristics of said secondary measurement of the secondary effect.
12. A method for implementing threshold based correction functions for a biosensor as recited in claim 10 wherein the steps of identifying said correction function responsive to said identified second coefficient A and identifying said correction function responsive to said identified second coefficient I includes the steps of identifying a linear function for said correction function.
13. A method for implementing threshold based correction functions for a biosensor as recited in claim 10 wherein the steps of identifying said correction function responsive to said identified second coefficient A and identifying said correction function responsive to said identified second coefficient I includes the steps of identifying a nonlinear function for said correction function.
14. A method for implementing threshold based correction functions for a biosensor as recited in claim 1 wherein the steps of identifying said correction function includes the steps of identifying said correction function using at least one coefficient value; said at least one coefficient value being dependent upon said primary measurement of said analyte value.
15. A method for implementing threshold based correction functions for a biosensor as recited in claim 1 wherein the steps of identifying said correction function includes the steps of identifying said correction function using at least one coefficient value; said at least one coefficient value being a predefined value independent of said primary measurement of said analyte value.
16. A method for implementing threshold based correction functions for a biosensor as recited in claim 1 wherein the step of obtaining a secondary measurement of a secondary effect include the step of obtaining a temperature measurement.
17. A method for implementing threshold based correction functions for a biosensor as recited in claim 1 wherein the analyte is glucose and wherein step of obtaining a secondary measurement of a secondary effect include the step of obtaining a hemoglobin measurement.
18. A method for implementing threshold based correction functions for a biosensor as recited in claim 1 wherein the analyte is glucose and wherein step of obtaining a secondary measurement of a secondary effect include the step of obtaining a measurement indicating a concentration of hematocrit.
19. A method for implementing threshold based correction functions for a biosensor as recited in claim 1 wherein the analyte is glucose and wherein step of obtaining a secondary measurement of a secondary effect include the step of obtaining a measurement indicating a concentration of hematocrit and obtaining a temperature measurement.
20. Apparatus for implementing threshold based correction functions comprising: a biosensor for receiving a sample; a processor coupled to said biosensor; said processor responsive to said biosensor for receiving the sample for obtaining a primary measurement of an analyte value; said processor for obtaining a secondary measurement of a secondary effect; said processor for comparing said secondary measurement of the secondary effect with a threshold value; said processor responsive to said compared values, for identifying a correction function; and said processor for applying said identified correction function to said primary measurement to provide a corrected analyte value
21-23. (canceled)
Description
FIELD OF THE INVENTION
[0001] The present invention relates generally to biosensors, and more particularly, relates to a method and apparatus for implementing threshold based correction functions for biosensors.
DESCRIPTION OF THE RELATED ART
[0002] The quantitative determination of analytes in body fluids is of great importance in the diagnoses and maintenance of certain physiological abnormalities. For example lactate, cholesterol and bilirubin should be monitored in certain individuals. In particular, the determination of glucose in body fluids is of great importance to diabetic individuals who must frequently check the level of glucose in their body fluids as a means of regulating the glucose intake in their diets. While the remainder of the disclosure herein will be directed towards the determination of glucose, it is to be understood that the procedure and apparatus of this invention can be used for the determination of other analytes upon selection of the appropriate enzyme. The ideal diagnostic device for the detection of glucose in fluids must be simple, so as not to require a high degree of technical skill on the part of the technician administering the test. In many cases, these tests are administered by the patient which lends further emphasis to the need for a test which is easy to carry out. Additionally, such a device should be based upon elements which are sufficiently stable to meet situations of prolonged storage.
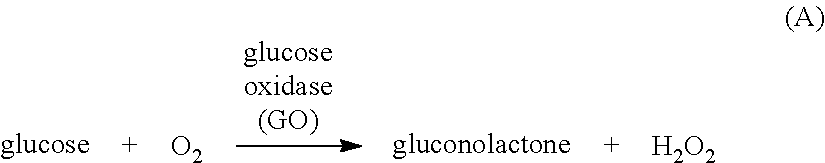
[0003] Methods for determining analyte concentration in fluids can be based on the electrochemical reaction between an enzyme and the analyte specific to the enzyme and a mediator which maintains the enzyme in its initial oxidation state. Suitable redox enzymes include oxidases, dehydrogenases, catalase and peroxidase. For example, in the case where glucose is the analyte, the reaction with glucose oxidase and oxygen is represented by equation (A).
##STR00001##
[0004] In a colorimetric assay, the released hydrogen peroxide, in the presence of a peroxidase, causes a color change in a redox indicator which color change is proportional to the level of glucose in the test fluid. While colorimetric tests can be made semi-quantitative by the use of color charts for comparison of the color change of the redox indicator with the color change obtained using test fluids of known glucose concentration, and can be rendered more highly quantitative by reading the result with a spectrophotometric instrument, the results are generally not as accurate nor are they obtained as quickly as those obtained using an electrochemical biosensor. As used herein, the term biosensor system refer to an analytical device that responds selectively to analytes in an appropriate sample and converts their concentration into an electrical signal via a combination of a biological recognition signal and a physico-chemical transducer.
H.sub.2O.sub.2-->O.sub.2+2H.sup.++2e.sup.- (B)
The electron flow is then converted to the electrical signal which directly correlates to the glucose concentration.
[0005] In the initial step of the reaction represented by equation (A), glucose present in the test sample converts the oxidized flavin adenine dinucleotide (FAD) center of the enzyme into its reduced form, (FADH.sub.2). Because these redox centers are essentially electrically insulated within the enzyme molecule, direct electron transfer to the surface of a conventional electrode does not occur to any measurable degree in the absence of an unacceptably high overvoltage. An improvement to this system involves the use of a nonphysiological redox coupling between the electrode and the enzyme to shuttle electrons between the (FADH.sub.2) and the electrode. This is represented by the following scheme in which the redox coupler, typically referred to as a mediator, is represented by M:
Glucose+GO(FAD)-->gluconolactone+GO(FADH.sub.2)
GO(FADH.sub.2)+2M.sub.OX-->GO(FAD)+2M.sub.red+2H.sup.+
2M.sub.red-->2M.sub.OX+2e.sup.-(at the electrode)
[0006] In this scheme, GO(FAD) represents the oxidized form of glucose oxidase and GO(FADH.sub.2) indicates its reduced form. The mediating species M.sub.red shuttles electrons from the reduced enzyme to the electrode thereby oxidizing the enzyme causing its regeneration in situ which, of course, is desirable for reasons of economy. The main purpose for using a mediator is to reduce the working potential of the sensor. An ideal mediator would be re-oxidized at the electrode at a low potential under which impurity in the chemical layer and interfering substances in the sample would not be oxidized thereby minimizing interference.
[0007] Many compounds are useful as mediators due to their ability to accept electrons from the reduced enzyme and transfer them to the electrode. Among the mediators known to be useful as electron transfer agents in analytical determinations are the substituted benzo- and naphthoquinones disclosed in U.S. Pat. No. 4,746,607; the N-oxides, nitroso compounds, hydroxylamines and oxines specifically disclosed in EP 0 354 441; the flavins, phenazines, phenothiazines, indophenols, substituted 1,4-benzoquinones and indamins disclosed in EP 0 330 517 and the phenazinium/phenoxazinium salts described in U.S. Pat. No. 3,791,988. A comprehensive review of electrochemical mediators of biological redox systems can be found in Analytica Clinica Acta. 140 (1982), Pp 1-18.
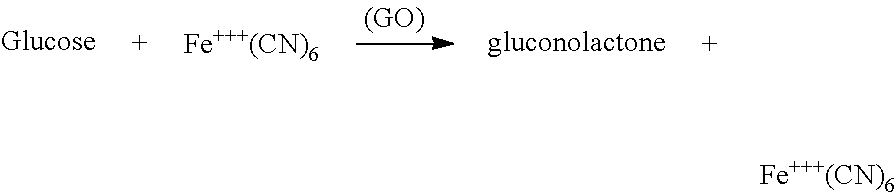
[0008] Among the more venerable mediators is hexacyanoferrate, also known as ferricyanide, which is discussed by Schlapfer et al in Clinica Chimica Acta., 57 (1974), Pp. 283-289. In U.S. Pat. No. 4,929,545 there is disclosed the use of a soluble ferricyanide compound in combination with a soluble ferric compound in a composition for enzymatically determining an analyte in a sample. Substituting the iron salt of ferricyanide for oxygen in equation (A) provides:
##STR00002##
since the ferricyanide is reduced to ferrocyanide by its acceptance of electrons from the glucose oxidase enzyme.
[0009] Another way of expressing this reaction is by use of the following equation (C):
Glucose+GO.sub.X(OX)-->Gluconalactone+GO.sub.X(red)
GO.sub.X(red)+2Fe(CN.sub.3).sup.3-.sub.6-->GO.sub.X(OX)+2Fe(CN).sup.4- -+2e.sup.- (C)
The electrons released are directly equivalent to the amount of glucose in the test fluid and can be related thereto by measurement of the current which is produced through the fluid upon the application of a potential thereto. Oxidation of the ferrocyanide at the anode renews the cycle.
[0010] U.S. Pat. No. 6,391,645 to Huang et al., issued May 21, 2002 and assigned to the present assignee, discloses a method and apparatus for correcting ambient temperature effect in biosensors. An ambient temperature value is measured. A sample is applied to the biosensors, then a current generated in the test sample is measured. An observed analyte concentration value is calculated from the current through a standard response curve. The observed analyte concentration is then modified utilizing the measured ambient temperature value to thereby increase the accuracy of the analyte determination. The analyte concentration value can be calculated by solving the following equation:
G2=(G1-(T.sub.2.sup.2-24.sup.2)*I2-(T.sub.2-24)*I1)/((T.sub.2.sup.2-24.s- up.2)*S2+(T.sub.2-24)*S1 +1)
where G1 is said observed analyte concentration value, T.sub.2 is said measured ambient temperature value and I1, I2, S1, and S2 are predetermined parameters.
[0011] While the method and apparatus disclosed by U.S. Pat. No. 6,391,645 provided improvements in the accuracy of the analyte determination, a need exists for an improved correction mechanism and that can be applied to any system that measures an analyte concentration.
[0012] As used in the following specification and claims, the term biosensor means an electrochemical sensor strip or sensor element of an analytical device or biosensor system that responds selectively to an analyte in an appropriate sample and converts their concentration into an electrical signal. The biosensor generates an electrical signal directly, facilitating a simple instrument design. Also, a biosensor offers the advantage of low material cost since a thin layer of chemicals is deposited on the electrodes and little material is wasted.
[0013] The term sample is defined as a composition containing an unknown amount of the analyte of interest. Typically, a sample for electrochemical analysis is in liquid form, and preferably the sample is an aqueous mixture. A sample may be a biological sample, such as blood, urine or saliva. A sample may be a derivative of a biological sample, such as an extract, a dilution, a filtrate, or a reconstituted precipitate.
[0014] The term analyte is defined as a substance in a sample, the presence or amount of which is to be determined. An analyte interacts with the oxidoreductase enzyme present during the analysis, and can be a substrate for the oxidoreductase, a coenzyme, or another substance that affects the interaction between the oxidoreductase and its substrate.
SUMMARY OF THE INVENTION
[0015] Important aspects of the present invention are to provide a new and improved biosensor system for determining the presence or amount of a substance in a sample including a method and apparatus for implementing threshold based correction functions for biosensors.
[0016] In brief, a method and apparatus are provided for implementing threshold based correction functions for biosensors. A sample is applied to the biosensor and a primary measurement of an analyte value is obtained. A secondary measurement of a secondary effect is obtained and is compared with a threshold value. A correction function is identified responsive to the compared values. The correction function is applied to the primary measurement of the analyte value to provide a corrected analyte value.
[0017] In accordance with features of the invention, the correction method uses correction curves that are provided to correct for an interference effect. The correction curves can be linear or non-linear. The correction method provides different correction functions above and below the threshold value. The correction functions may be dependent or independent of the primary measurement that is being corrected. The correction functions may be either linear or nonlinear.
[0018] In accordance with features of the invention, the secondary measurement of a secondary effect includes a plurality of effects that are use separately or together in combination to identify the correction function. For example, the secondary effects include temperature, Hemoglobin, and the concentration of hematocrit of a blood sample that are identified and used to minimize the interference of the secondary effects on the accuracy of the reported results.
BRIEF DESCRIPTION OF THE DRAWING
[0019] The present invention together with the above and other objects and advantages may best be understood from the following detailed description of the preferred embodiments of the invention illustrated in the drawings, wherein:
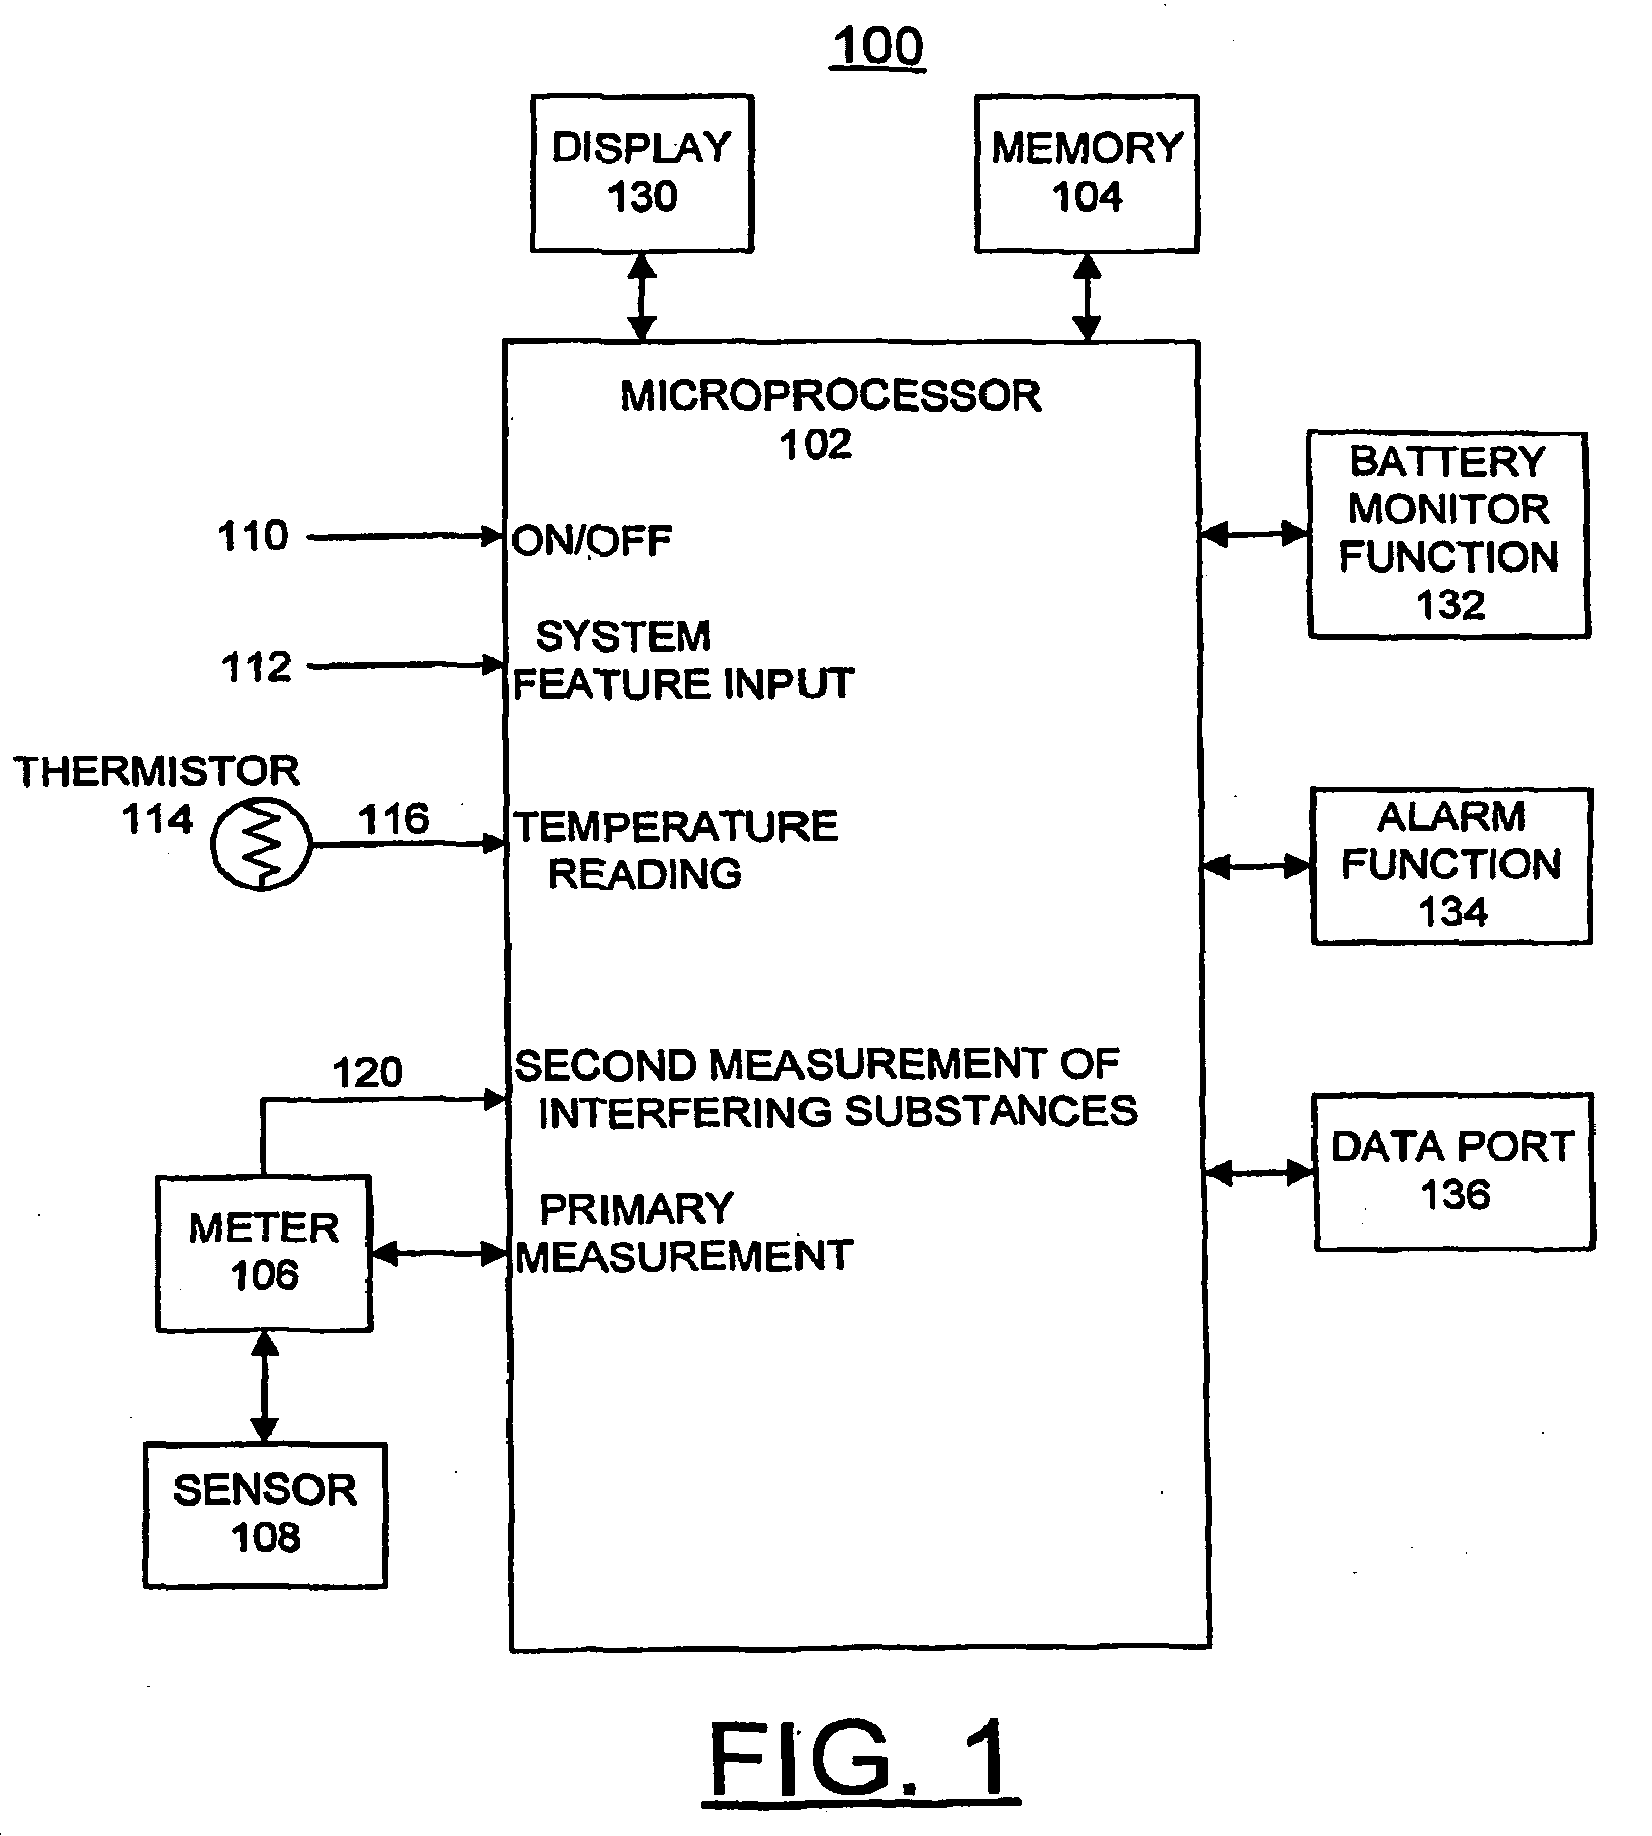
[0020] FIG. 1 is a block diagram representation of biosensor system in accordance with the present invention;
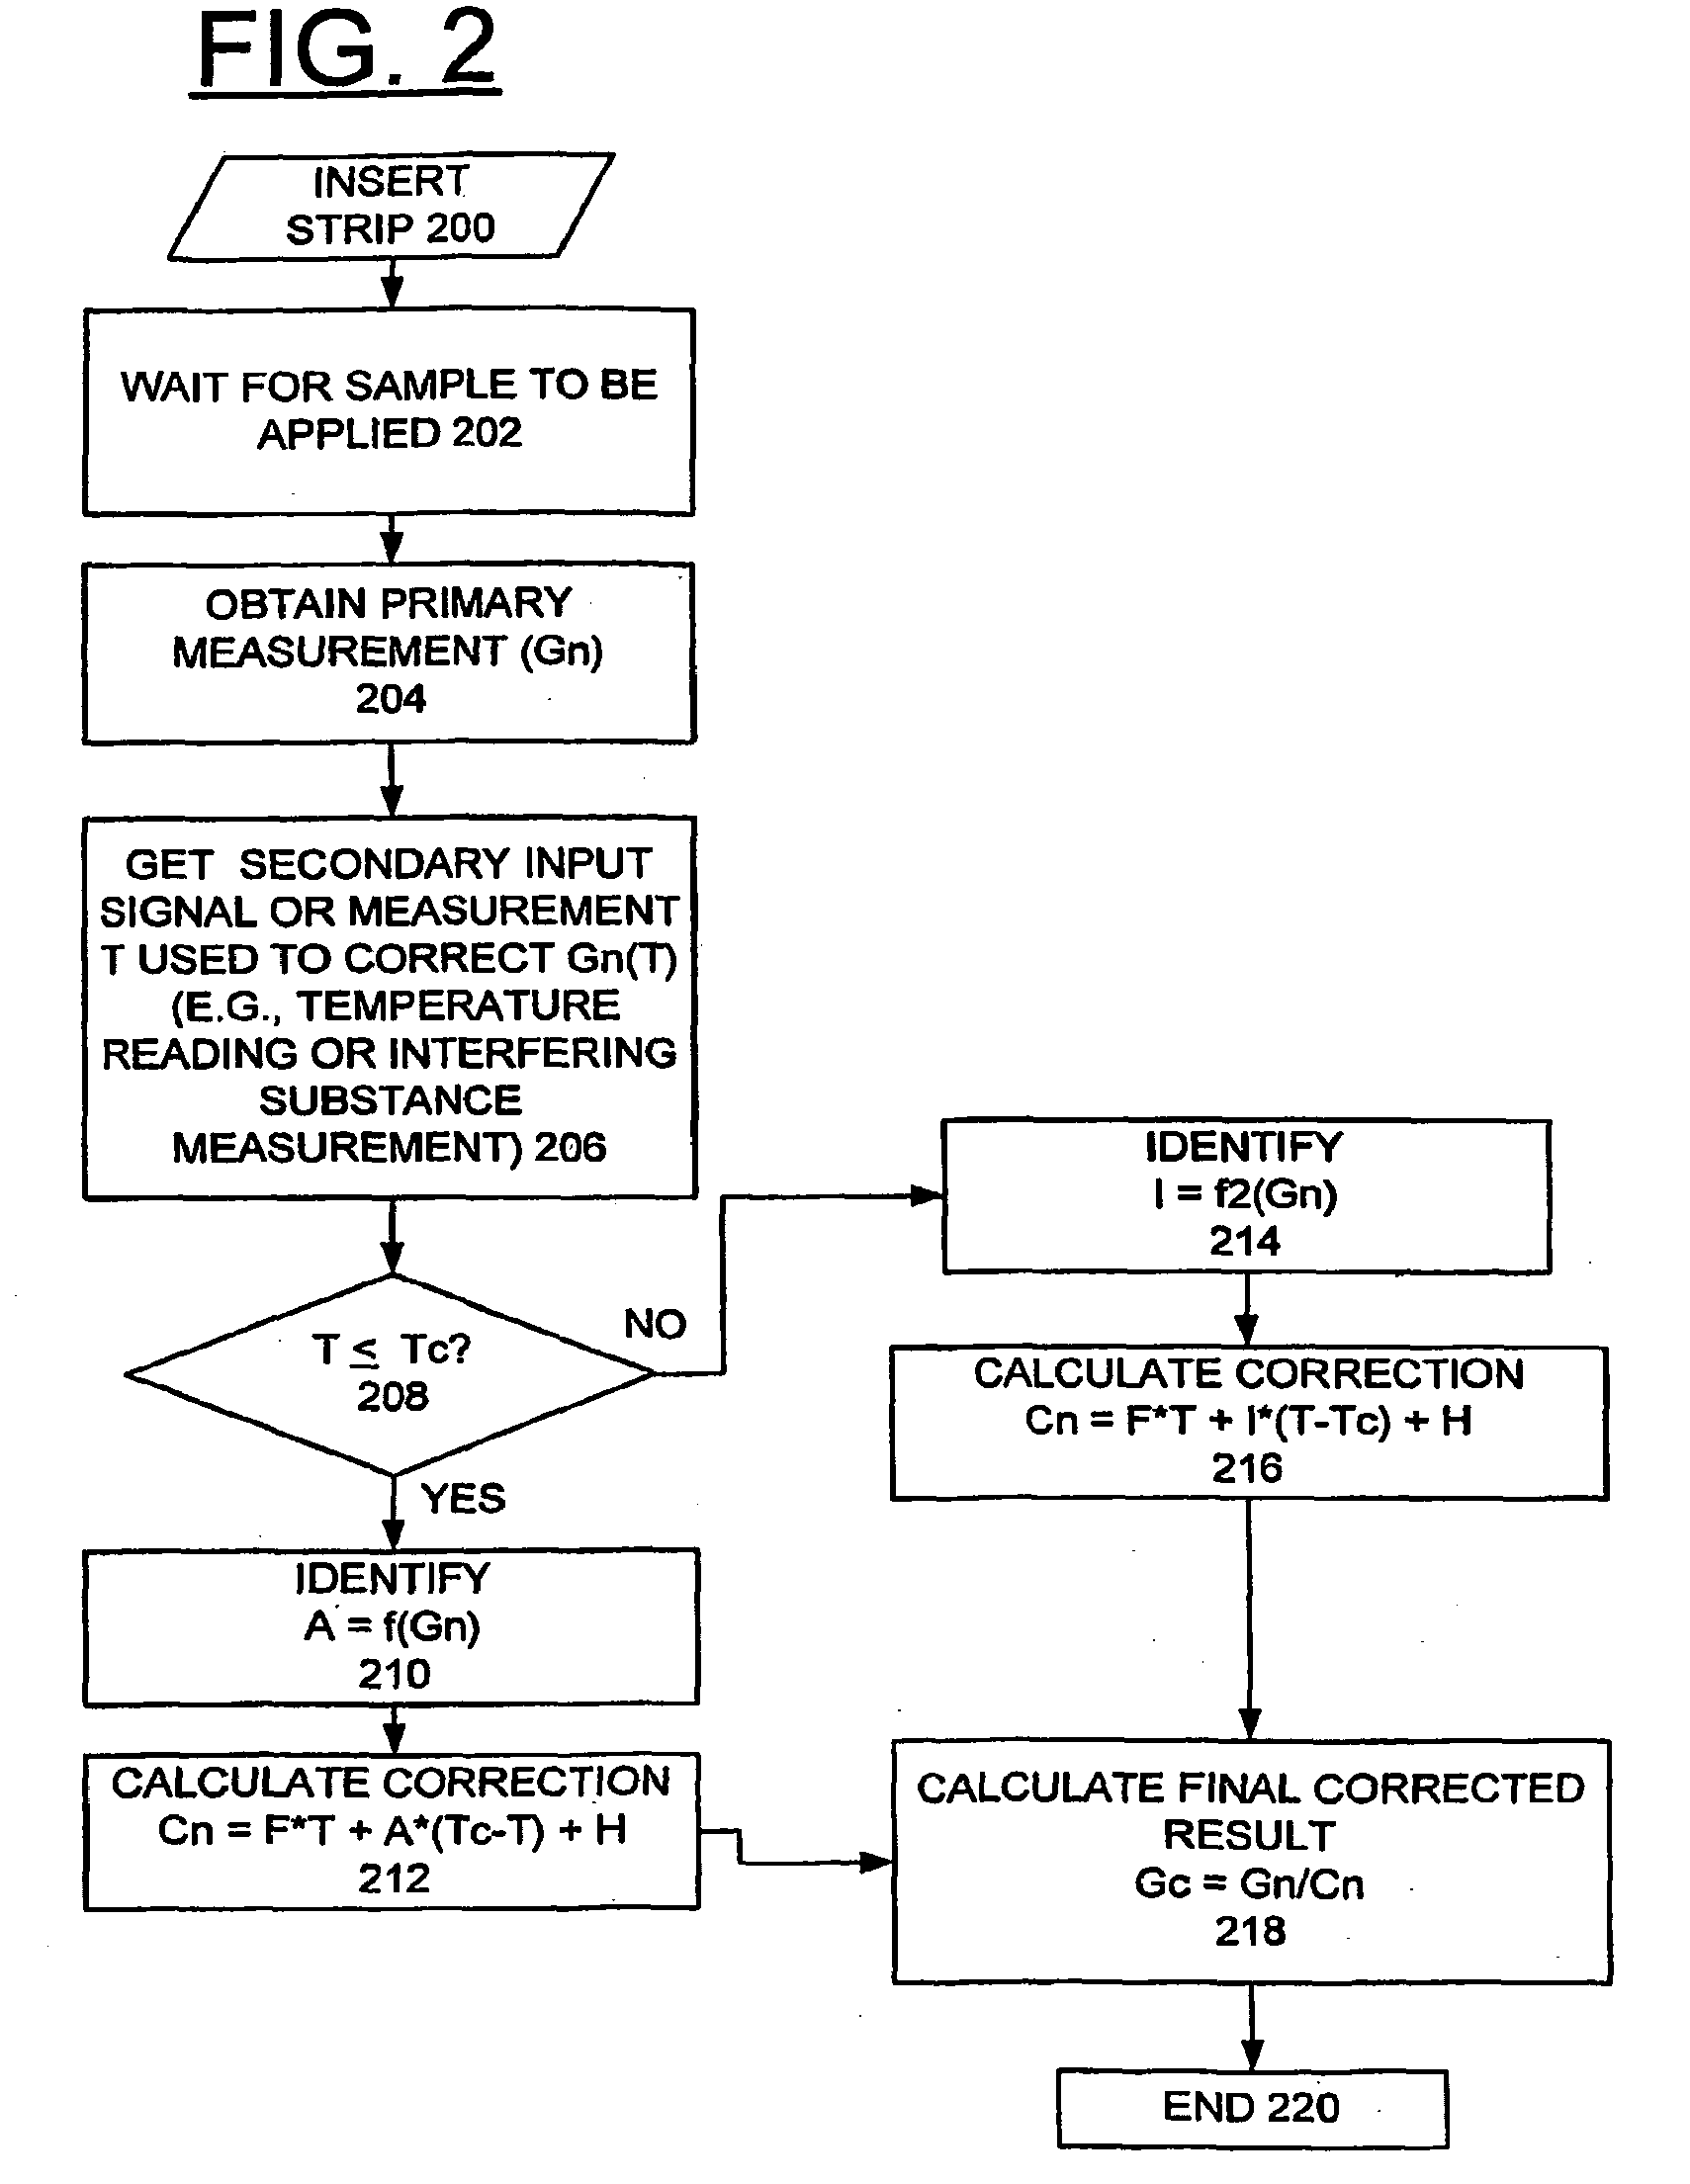
[0021] FIG. 2 is a flow chart illustrating exemplary logical steps performed in accordance with the present invention of the method for implementing threshold based correction of secondary effects, such as correcting ambient temperature effect, in the biosensor system of FIG. 1; and
[0022] FIGS. 3 and 4 are graphs of exemplary stored correction curves illustrating corrections characteristics in accordance with the present invention.
DETAILED DESCRIPTION OF THE PREFERRED EMBODIMENTS
[0023] Having reference now to the drawings, in FIG. 1 there is shown a block diagram representation of biosensor system designated as a whole by the reference character 100 and arranged in accordance with principles of the present invention. Biosensor system 100 includes a microprocessor 102 together with an associated memory 104 for storing program and user data and correction curves for implementing threshold based correction of secondary effects in accordance with the present invention. A meter function 106 coupled to a biosensor 108 is operatively controlled by the microprocessor 102 for recording test values, such as blood glucose test values. An ON/OFF input at a line 110 responsive to the user ON/OFF input operation is coupled to the microprocessor 102 for performing the blood test sequence mode of biosensor system 100. A system features input at a line 112 responsive to a user input operation is coupled to the microprocessor 102 for selectively performing the system features mode of biosensor 100. A thermistor 114 provides a temperature signal input indicated at a line 116 is coupled to the microprocessor 102 for detecting interfering effects, for example, the temperature information for the sensor 108 in accordance with the invention. A signal input indicated at a line 120 is coupled to the microprocessor 102 for a second measure of interfering substances, for example, Hemoglobin, optionally provided by the meter function 106.
[0024] A display 130 is coupled to the microprocessor 102 for displaying information to the user including test results. A battery monitor function 132 is coupled to the microprocessor 102 for detecting a low or dead battery condition. An alarm function 134 is coupled to the microprocessor 102 for detecting predefined system conditions and for generating alarm indications for the user of biosensor system 100. A data port or communications interface 136 is provided for coupling data to and from a connected computer (not shown). Microprocessor 102 contains suitable programming to perform the methods of the invention as illustrated in FIG. 2.
[0025] Biosensor system 100 is shown in simplified form sufficient for understanding the present invention. The illustrated biosensor system 100 is not intended to imply architectural or functional limitations. The present invention can be used with various hardware implementations and systems.
[0026] In accordance with the invention, biosensor system 100 performs a correction method of the preferred embodiment, for example, to reduce the temperature bias having a general form as shown in the following TABLE 1 and as illustrated and described with respect to FIG. 2. This invention provides an algorithmic correction method that advantageously improves the accuracy of diagnostic chemistry tests by correcting for secondary effects, such as interfering substances or temperature effects.
[0027] It should be understood that the present invention can be applied to any system, electrochemical or optical, that measures an analyte concentration as a primary measurement and then uses a second measure of interfering substances, for example, Hemoglobin, or interfering effects for example, temperature, to compensate for the secondary effect and improve the accuracy of the reported result.
[0028] It is also desirable to minimize the interference from hematocrit or volume fraction of erythrocytes on the accuracy of the reported results. The conductivity or impedance of whole blood is dependent on the concentration of hematocrit. Meter function 120 can be used to measure the resistance of the sample fluid at signal input line 120 and the measured value advantageously used to correct for the effect of hematocrit on the reported result. For example, the measured resistance advantageously is used to estimate the concentration of hematocrit of a blood sample and then to correct the measurement for hematocrit effect for determining the concentration of a substance of interest in blood. This invention provides an algorithmic correction method that advantageously improves the accuracy of diagnostic chemistry tests by correcting for secondary effects including interference from hematocrit and temperature effects.
[0029] In accordance with the invention, the algorithmic correction method uses correction curves, for example, as illustrated and described with respect to FIGS. 3 and 4, that can be tailored to correct for any well-defined interference effect. The correction curves can be linear or non-linear. The algorithmic correction method has characteristics that can be modified by changing only the equation coefficients as follows. First, different correction functions can be provided above and below a threshold. Second, the correction functions may be dependent or independent of the primary measurement that is being corrected. Third, functions used for correction may be either linear or nonlinear.
TABLE-US-00001 TABLE 1 General Correction Algorithm Form Step 1. Obtain primary measurement (G.sub.n). Step 2. Obtain secondary measurement used to correct G.sub.n(T) Step3A If T.ltoreq. T.sub.c then: 1. A = f(G.sub.n) 2. C.sub.n = F * T + A * (T.sub.c - T) + H Step 3B If T > T.sub.c then: 3. I = f.sub.2(G.sub.N) 4. C.sub.n = F*T + I*(T-T.sub.c) + H 5. G.sub.c = (G.sub.N / C.sub.n) Where: G.sub.n = Uncorrected measurement of analyte concentration; T = Secondary measurement used to correct primary measurement; T.sub.c = Decision point or threshold, secondary measurements greater of less than threshold advantageously can use different correction functions; G.sub.c = Final corrected result; and A, I, F, H, are coefficients that control magnitude of correction lines or define correction curves.
[0030] Referring now to FIG. 2, there are shown exemplary logical steps performed in accordance with the present invention of the method for implementing threshold based correction of secondary effects, such as correcting ambient temperature effect, in the biosensor system 100. A strip is inserted as indicated in a block 200 and then waiting for a sample to be applied is performed as indicated in a block 202. A primary measurement Gn is obtained as indicated in a block 204. Then a secondary measurement T to be used for correction Gn(T) is obtained as indicated in a block 206. The secondary measurement T is compared with the threshold value Tc as indicated in a decision block 208. If the secondary measurement T is less than or equal to the threshold value Tc, then a coefficient A to control magnitude of the correction is identified as indicated in a block 210, where A=f(Gn). Then a correction Cn is calculated as indicated in a block 210, where C.sub.n=F*T+A*(T.sub.c-T)+H. Otherwise If the secondary measurement T is greater than the threshold value Tc, then a coefficient I to control magnitude of the correction is identified as indicated in a block 214, where I=f2(Gn). Then a correction Cn is calculated as indicated in a block 216, where C.sub.n=F*T+I*(T-T.sub.c)+H. A final corrected result Gc is calculated as indicated in a block 218, where Gc=Gn/Cn to complete the correction algorithm as indicated in a block 220.
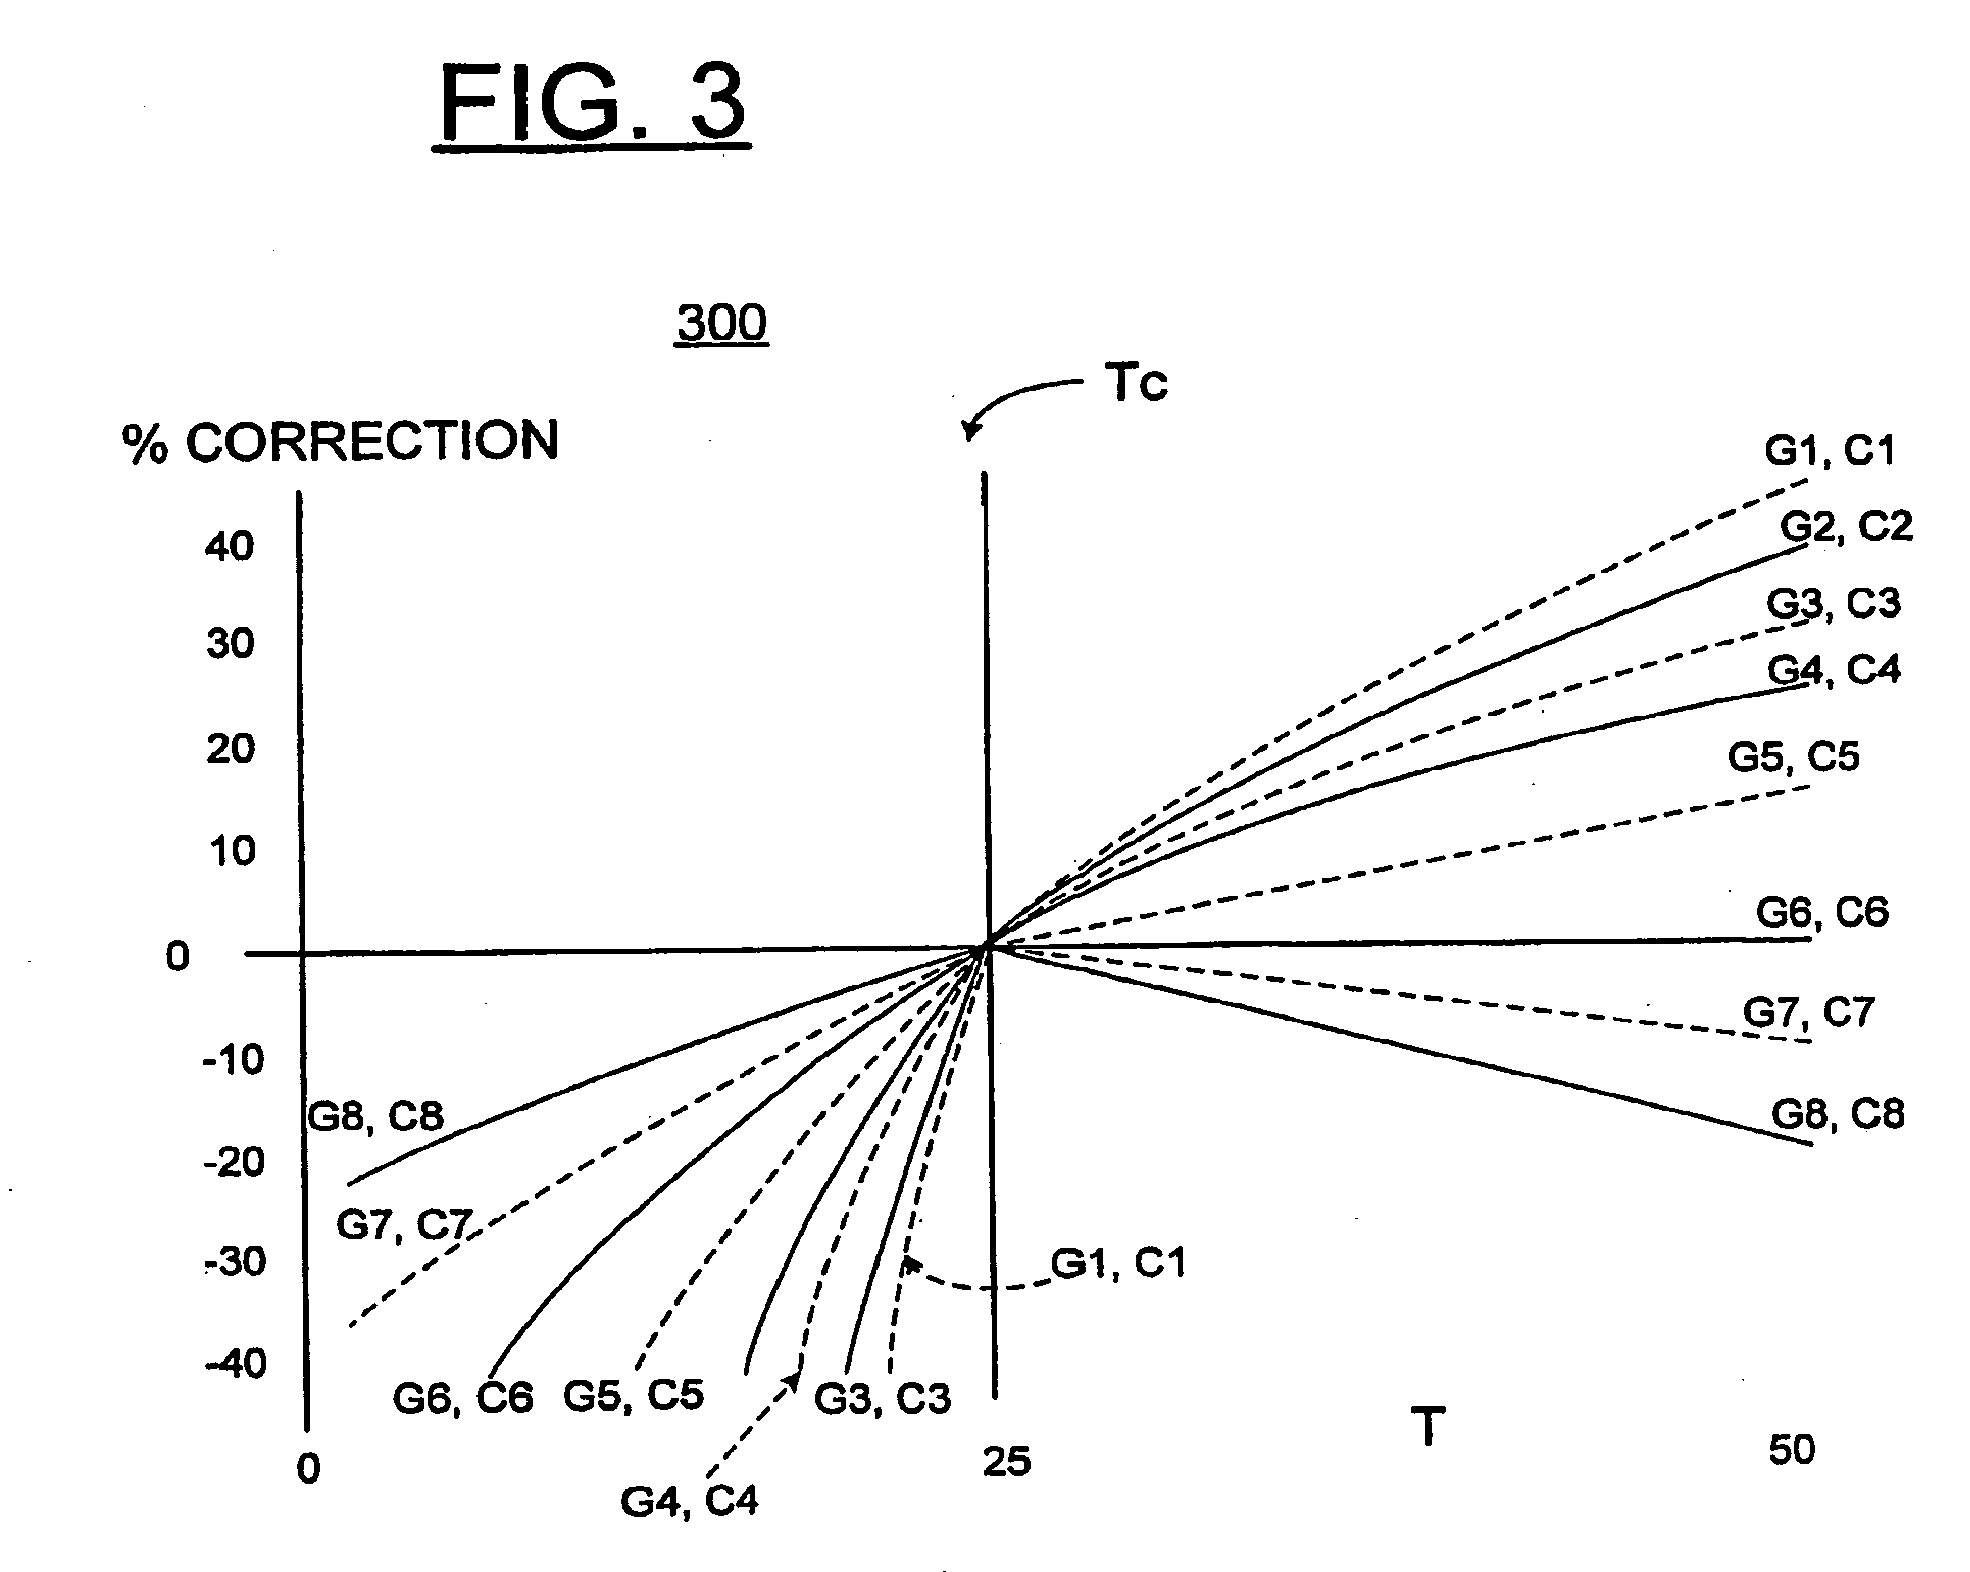
[0031] Referring now to FIGS. 3 and 4, there are shown respective first and second examples generally designated by reference characters 300 and 400 illustrating exemplary theoretical lines of correction. In FIGS. 3 and 4, a percentage (%) correction is illustrated relative to a vertical axis and a secondary measurement T is illustrated relative to a horizontal axis. A threshold value Tc is indicated by a line labeled Tc.
[0032] FIG. 3 illustrates isometric correction lines at different primary measurement concentrations Gn where the correction is dependent on the primary measurement concentrations Gn. As shown in the example 300 in FIG. 3, the magnitude of the correction Cn changes with analyte concentration Gn when the secondary measurement T is above or below the threshold Tc. FIG. 4 illustrates isometric correction lines at different primary measurement concentrations Gn where the correction is dependent on the primary measurement concentrations Gn above the threshold value Tc and is constant and independent of the primary measurement concentrations Gn below and equal to the threshold value Tc.
[0033] While the present invention has been described with reference to the details of the embodiments of the invention shown in the drawing, these details are not intended to limit the scope of the invention as claimed in the appended claims.
* * * * *
D00000
D00001
D00002
D00003
D00004
XML
uspto.report is an independent third-party trademark research tool that is not affiliated, endorsed, or sponsored by the United States Patent and Trademark Office (USPTO) or any other governmental organization. The information provided by uspto.report is based on publicly available data at the time of writing and is intended for informational purposes only.
While we strive to provide accurate and up-to-date information, we do not guarantee the accuracy, completeness, reliability, or suitability of the information displayed on this site. The use of this site is at your own risk. Any reliance you place on such information is therefore strictly at your own risk.
All official trademark data, including owner information, should be verified by visiting the official USPTO website at www.uspto.gov. This site is not intended to replace professional legal advice and should not be used as a substitute for consulting with a legal professional who is knowledgeable about trademark law.