Treatment Of Urea Cycle Disorders In Neonates And Infants
SCHARSCHMIDT; Bruce ; et al.
U.S. patent application number 16/128140 was filed with the patent office on 2019-03-14 for treatment of urea cycle disorders in neonates and infants. The applicant listed for this patent is Horizon Therapeutics, LLC. Invention is credited to Masoud MOKHTARANI, Bruce SCHARSCHMIDT.
| Application Number | 20190076386 16/128140 |
| Document ID | / |
| Family ID | 65630148 |
| Filed Date | 2019-03-14 |


| United States Patent Application | 20190076386 |
| Kind Code | A1 |
| SCHARSCHMIDT; Bruce ; et al. | March 14, 2019 |
TREATMENT OF UREA CYCLE DISORDERS IN NEONATES AND INFANTS
Abstract
Nitrogen scavenging drugs such as glycerol phenylbutyrate can be administered safely to infants and toddlers with urea cycle disorders by adjusting the dosage based on one or more biomarkers selected from the group consisting of urinary-PAGN and plasma PAA:PAGN ratio.
| Inventors: | SCHARSCHMIDT; Bruce; (San Francisco, CA) ; MOKHTARANI; Masoud; (Walnut Creek, CA) | ||||||||||
| Applicant: |
|
||||||||||
|---|---|---|---|---|---|---|---|---|---|---|---|
| Family ID: | 65630148 | ||||||||||
| Appl. No.: | 16/128140 | ||||||||||
| Filed: | September 11, 2018 |
Related U.S. Patent Documents
| Application Number | Filing Date | Patent Number | ||
|---|---|---|---|---|
| 62628252 | Feb 8, 2018 | |||
| 62556698 | Sep 11, 2017 | |||
| Current U.S. Class: | 1/1 |
| Current CPC Class: | A61K 31/216 20130101; G01N 2800/708 20130101; G01N 2800/52 20130101; A61K 9/0053 20130101; G01N 33/84 20130101; A61K 9/0095 20130101 |
| International Class: | A61K 31/216 20060101 A61K031/216; A61K 9/00 20060101 A61K009/00; G01N 33/84 20060101 G01N033/84 |
Claims
1. (canceled)
2. (canceled)
3. A method of treating a urea cycle disorder (UCD) in a patient under 2 years of age comprising administering glycerol phenylbutyrate to said patient at an initial daily dose which is administered at an initial frequency of administration; and if after said administration, said patient exhibits neurological symptoms, normal ammonia levels, and a ratio of plasma PAA to plasma PAGN of >2.5 or a level of plasma PAA of >500 .mu.g/mL, then administering said glycerol phenylbutyrate to said patient at a reduced daily dose while maintaining said initial frequency of administration.
4. A method of treating a urea cycle disorder (UCD) in a patient under 2 years of age comprising administering glycerol phenylbutyrate to said patient at an initial daily dose which is administered at an initial frequency of administration; and if after said administration said patient exhibits neurological symptoms, normal ammonia levels, and a ratio of plasma PAA to plasma PAGN of >2.5 or a level of plasma PAA of >500 .mu.g/mL, then administering said glycerol phenylbutyrate to said patient at a lower dose or increased frequency of administration while maintaining said daily dose.
5. A method of treating a urea cycle disorder (UCD) in a patient under 2 years of age comprising administering glycerol phenylbutyrate to said patient at an initial daily dose which is administered at an initial frequency of administration; and if after said administration said patient exhibits neurological symptoms, normal ammonia levels, and a ratio of plasma PAA to plasma PAGN of <2.5, then said glycerol phenylbutyrate to said patient should continue to be administered at the same dose and frequency and the patient evaluated for other causes of his or her neurological symptoms.
6. (canceled)
7. (canceled)
8. The method of claim 3, wherein the initial frequency of administration is 3 to 6 times daily.
9. The method of claim 3, wherein said patient is in a hyperammonemic crisis and said initial daily dose is 11.2 mL/m.sup.2/day.
10. The method of claim 3, wherein said patient is not in a hyperammonemic crisis and said initial daily dose is 8.5 mL/m.sup.2/day.
11. The method of claim 3, wherein said patient previously had been administered NaPBA or NaBz and said initial daily dose is equal to 0.81 times the total number of grams of NaPBA powder the patient was receiving, or 0.86 times the total number of grams of in NaPBA tablet form the patient was receiving, or 0.5 times the total number of grams of in NaBz the patient was receiving.
12. The method of claim 3, wherein said patient is less than about one month of age.
13. The method of claim 3, wherein said patient is from 1 month to two years of age.
14. The method of claim 3, wherein said neurological symptoms include headache, confusion, vomiting, lethargy, or any combination thereof.
15. The method of claim 4, wherein the initial frequency of administration is 3 to 6 times daily.
16. The method of claim 4, wherein said patient is in a hyperammonemic crisis and said initial daily dose is 11.2 mL/m.sup.2/day.
17. The method of claim 4, wherein said patient is not in a hyperammonemic crisis and said initial daily dose is 8.5 mL/m.sup.2/day.
18. The method of claim 4, wherein said patient previously had been administered NaPBA or NaBz and said initial daily dose is equal to 0.81 times the total number of grams of NaPBA powder the patient was receiving, or 0.86 times the total number of grams of in NaPBA tablet form the patient was receiving, or 0.5 times the total number of grams of in NaBz the patient was receiving.
19. The method of claim 4, wherein said patient is less than about one month of age.
20. The method of claim 4, wherein said patient is from 1 month to two years of age.
21. The method of claim 4, wherein said neurological symptoms include headache, confusion, vomiting, lethargy, or any combination thereof.
22. The method of claim 5, wherein the initial frequency of administration is 3 to 6 times daily.
23. The method of claim 5, wherein said patient is in a hyperammonemic crisis and said initial daily dose is 11.2 mL/m.sup.2/day.
24. The method of claim 5, wherein said patient is not in a hyperammonemic crisis and said initial daily dose is 8.5 mL/m.sup.2/day.
25. The method of claim 5, wherein said patient previously had been administered NaPBA or NaBz and said initial daily dose is equal to 0.81 times the total number of grams of NaPBA powder the patient was receiving, or 0.86 times the total number of grams of in NaPBA tablet form the patient was receiving, or 0.5 times the total number of grams of in NaBz the patient was receiving.
26. The method of claim 5, wherein said patient is less than about one month of age.
27. The method of claim 5, wherein said patient is from 1 month to two years of age.
28. The method of claim 5, wherein said neurological symptoms include headache, confusion, vomiting, lethargy, or any combination thereof.
Description
[0001] This application claims priority to U.S. Provisional Application No. 62/556,698, filed Sep. 11, 2017, and U.S. Provisional Application No. 62/628,252, filed Feb. 8, 2018, each of which is incorporated by reference in its entirety for all purposes.
BACKGROUND
[0002] Urea cycle disorders (UCD) are inborn errors of metabolism caused by a deficiency in one of six enzymes or two mitochondrial transport proteins involved in the production of urea, resulting in accumulation of toxic levels of ammonia in the blood (hyperammonemia). UCD subtypes include those caused by an X-linked mutation and corresponding deficiency in ornithine transcarbamylase (OTC) and those caused by autosomal recessive mutations with corresponding deficiencies in argininosuccinate synthetase (ASS), carbamyl phosphate synthetase (CPS), argininosuccinate lyase (ASL), arginase (ARG), N-acetylglutamate synthetase (NAGS), ornithine translocase (HHH), and aspartate glutamate transporter (CITRIN). These are rare diseases, with an overall estimated incidence in the United States of approximately 1 in every 35,000 live births. UCD is suspected when a subject experiences a hyperammonemic event with an ammonia level >100 .mu.mol/L accompanied by signs and symptoms compatible with hyperammonemia in the absence of other obvious causes and generally confirmed by genetic testing.
[0003] The severity and timing of UCD presentation vary according to the severity of the deficiency, which may range from minor to extreme depending on the specific enzyme or transporter deficiency, and the specific mutation in the relevant gene. UCD patients may present in the early neonatal period with a catastrophic illness, or at any point in childhood, or even adulthood, after a precipitating event such as infection, trauma, surgery, pregnancy/delivery, or change in diet. Acute hyperammonemic episodes at any age carry the risk of encephalopathy and resulting neurologic damage, sometimes fatal, but even chronic, sub-critical hyperammonemia can result in impaired cognition. UCDs are therefore associated with a significant incidence of neurological abnormalities and intellectual and developmental disabilities over all ages. UCD patients with neonatal-onset disease are especially likely to suffer cognitive impairment and death compared with patients who present later in life.
[0004] Management of acute hyperammonemic crises may require hemodialysis and/or intravenous (IV) administration of sodium phenylacetate (NaPAA) and sodium benzoate (NaBz) (the admixture is marketed in the U.S. as AMMONUL.RTM.). Orthotopic liver transplantation may also be considered for patients with severe disease that manifests itself in the neonatal period. Long-term UCD management is directed toward prevention of hyperammonemia and includes restriction of dietary protein; arginine and citrulline supplementation, which can enhance waste nitrogen excretion for certain UCDs; and oral, ammonia-scavenging drug therapy that provides an alternate path for waste nitrogen removal (RAVICTI.RTM. (glycerol phenylbutyrate, GPB) Oral Liquid or sodium phenylbutyrate (NaPBA; marketed in the U.S. as BUPHENYL.RTM. and in the European Union (EU) as AMMONAPS.RTM.)).
[0005] RAVICTI.RTM., formerly HPN-100, a prodrug of PBA and a pre-prodrug of the active compound phenylacetate (PAA), has been approved in the U.S. for use as a nitrogen-binding agent for chronic management of adult and pediatric patients .gtoreq.2 years of age with UCDs who cannot be managed by dietary protein restriction and/or amino acid supplementation alone. RAVICTI.RTM. is glycerol phenylbutyrate, a triglyceride containing 3 molecules of PBA linked to a glycerol backbone, the chemical name of which is benzenebutanoic acid, 1',1''-(1,2,3-propanetriyl) ester.
[0006] Glycerol phenylbutyrate is used with dietary protein restriction and, in some cases, dietary supplements (e.g., essential amino acids, arginine, citrulline, protein-free calorie supplements). RAVICTI.RTM. is not indicated for the treatment of acute hyperammonemia in patients with UCDs, and the safety and efficacy of RAVICTI.RTM. for the treatment of NAGS deficiency has not been established. The RAVICTI.RTM. Package Insert states the drug is contraindicated in patients less than 2 months of age, stating that children less than 2 months of age may have immature pancreatic exocrine function, which could impair hydrolysis of RAVICTI.RTM., leading to impaired absorption of phenylbutyrate and hyperammonemia; and in patients with known hypersensitivity to phenylbutyrate (signs include wheezing, dyspnea, coughing, hypotension, flushing, nausea, and rash).
[0007] While the U.S. approval of RAVICTI.RTM. was based on its evaluation in 6 clinical trials involving over 100 adult and pediatric UCD patients aged 2 months old and above, only 7 patients aged 2 months to 2 years were enrolled in these studies. Among the 4 patients aged 2 months to 2 years who participated in an open label, fixed-sequence switch-over comparison of RAVICTI.RTM. to NaPBA, mean ammonia exposure assessed at 24-hour area under the curve was non-inferior on RAVICTI.RTM.. PAA exposure, also assessed as 24-hour area under the curve, was very similar. However, the number of patients in this age group studied at the time of RAVICTI's approval was small and considerable patient-to-patient variability was observed.
[0008] Children less than 2 months of age may have immature pancreatic exocrine function, which could impair hydrolysis of glycerol phenylbutyrate leading to impaired absorption of PBA and potentially hyperammonemia. While the limited data available suggest that pancreatic enzymes present in newborns include pancreatic lipase-related protein and bile salt-stimulated lipase (which digest triglycerides present in human breast milk), both of which hydrolyze glycerol phenylbutyrate in vitro, it is not known whether pancreatic function in newborns is sufficiently mature to digest glycerol phenylbutyrate. In addition, the metabolism of PAA is known to vary with body size, and given that body size changes dramatically during the first two years of life, there has been significant uncertainty how glycerol phenylbutyrate or NaPBA could be used in these patient populations from birth to two years of age.
[0009] Dosing of UCD patients less than 2 years of age is particularly difficult. In contrast to patients detected based on The Newborn Screen who may be mildly affected, patients less than 2 years of age presumably have little to no endogenous urea cycle activity. That is, patients less than 2 years of age presenting in crisis presumably have little or no `innate` ability to convert ammonia to urea, such that they may be totally dependent on the drug to rid the body of waste nitrogen (including ammonia) via the alternate pathway. Thus there is little to no room for error since there is no endogenous capacity to buffer drug `underdosing`. Patients less than 2 years of age are also particularly susceptible to overdosing because of their slower clearance of PAA.
[0010] There is a significant, unmet need for a nitrogen scavenging drug that can be used in UCD patients less than 2 years of age. Further, for the purposes of dose monitoring, frequent blood draws are difficult in neonates and children under two years of age and a non-invasive measure is needed. The present disclosure meets these needs.
SUMMARY
[0011] Provided is the use of glycerol phenylbutyrate as a nitrogen-binding agent for chronic management of pediatric patients with a UCD under 2 years in age.
[0012] Also provided is a method of treating a UCD in a patient under 2 years of age comprising administering glycerol phenylbutyrate to said patient at an initial daily dose which is administered at an initial frequency of administration; and if after said administration, said patient exhibits a urinary phenylacetylglutamine (PAGN) .gtoreq.9000 .mu.g/mL and a ratio of plasma PAA to plasma PAGN of .ltoreq.2.5, then administering said glycerol phenylbutyrate to said patient at an increased daily dose while maintaining said initial frequency of administration. In some embodiments, the patient exhibits elevated blood ammonia levels. In some embodiments, the compliance and effectiveness of drug delivery by the patients' parent(s), guardian(s), or health care provider(s) is also assessed. In some embodiments, urinary PAGN concentration is measured using a filter paper-type test. In some embodiments, urinary PAGN concentration is measured from urine collected directly from a diaper or via the blood-spot technology commonly used for The Newborn Screen (NBS).
[0013] Also provided is a method of treating a UCD in a patient under 2 years of age comprising administering glycerol phenylbutyrate to said patient at an initial daily dose which is administered at an initial frequency of administration; and if after said administration, said patient exhibits a urinary PAGN .gtoreq.9000 .mu.g/mL and a ratio of plasma PAA to plasma PAGN of >2.5, then administering said glycerol phenylbutyrate to said patient at a lower dose or an increased frequency of administration while maintaining said daily dose. In some embodiments, the patient exhibits elevated blood ammonia levels. In some embodiments, the compliance and effectiveness of drug delivery by the patients' parent(s), guardian(s), or health care provider(s) is also assessed. In some embodiments, urinary PAGN concentration is measured using a filter paper-type test. In some embodiments, urinary PAGN concentration is measured from urine collected directly from a diaper or via the blood-spot technology commonly used for the NBS.
[0014] Also provided is a method of treating a UCD in a patient under 2 years of age comprising administering glycerol phenylbutyrate to said patient at an initial daily dose which is administered at an initial frequency of administration; and if after said administration, said patient exhibits a ratio of plasma PAA to plasma PAGN of >2.5 or a level of plasma PAA of >500 .mu.g/mL, then administering said glycerol phenylbutyrate to said patient at a reduced daily dose while maintaining said initial frequency of administration. In some embodiments, the patient exhibits neurological symptoms such as vomiting, headache, lethargy, and/or somnolence. In some embodiments, the patient exhibits normal blood ammonia levels. In some embodiments, the compliance and effectiveness of drug delivery by the patients' parent(s), guardian(s), or health care provider(s) is also assessed. In some embodiments, urinary PAGN concentration is measured using a filter paper-type test. In some embodiments, urinary PAGN concentration is measured from urine collected directly from a diaper or via the blood-spot technology commonly used for the NBS.
[0015] Also provided is a method of treating a UCD in a patient under 2 years of age comprising administering glycerol phenylbutyrate to said patient at an initial daily dose which is administered at an initial frequency of administration; and if after said administration, said patient exhibits a ratio of plasma PAA to plasma PAGN of >2.5 or a level of plasma PAA of >500 .mu.g/mL, then administering said glycerol phenylbutyrate to said patient at a lower dose or an increased frequency of administration while maintaining said daily dose. In some embodiments, the patient exhibits neurological symptoms. In some embodiments, the patient exhibits normal blood ammonia levels. In some embodiments, the compliance and effectiveness of drug delivery by the patients' parent(s), guardian(s), or health care provider(s) is also assessed. In some embodiments, urinary PAGN concentration is measured using a filter paper-type test. In some embodiments, urinary PAGN concentration is measured from urine collected directly from a diaper or via the blood-spot technology commonly used for the NBS.
[0016] Also provided is a method of treating a UCD in a patient under 2 years of age comprising administering glycerol phenylbutyrate to said patient at an initial daily dose which is administered at an initial frequency of administration; and if after said administration said patient exhibits neurological symptoms, normal ammonia levels, and a ratio of plasma PAA to plasma PAGN of <2.5, then said glycerol phenylbutyrate to said patient should continue to be administered at the same dose and frequency and the patient evaluated for other causes of his or her neurological symptoms. In some embodiments, the patient exhibits neurological symptoms. In some embodiments, the patient exhibits normal blood ammonia levels. In some embodiments, the compliance and effectiveness of drug delivery by the patients' parent(s), guardian(s), or health care provider(s) is also assessed. In some embodiments, urinary PAGN concentration is measured using a filter paper-type test. In some embodiments, urinary PAGN concentration is measured from urine collected directly from a diaper or via the blood-spot technology commonly used for the NBS.
[0017] Also provided is a method of treating a UCD in a patient under 2 years of age comprising administering glycerol phenylbutyrate to said patient at an initial daily dose which is administered at an initial frequency of administration; and if after said administration, said patient exhibits elevated ammonia levels, a urinary PAGN <9000 .mu.g/mL, a ratio of plasma PAA to plasma PAGN of .ltoreq.2.5, and compliance with initial daily dosing is confirmed, then administering said glycerol phenylbutyrate to said patient at an increased dose while maintaining frequency of administration. In some embodiments, the patient exhibits elevated blood ammonia levels. In some embodiments, the compliance and effectiveness of drug delivery by the patients' parent(s), guardian(s), or health care provider(s) is also assessed. In some embodiments, urinary PAGN concentration is measured using a filter paper-type test. In some embodiments, urinary PAGN concentration is measured from urine collected directly from a diaper or via the blood-spot technology commonly used for the NBS.
[0018] Also provided is a method of treating a UCD in a patient under 2 years of age comprising administering glycerol phenylbutyrate to said patient at an initial daily dose which is administered at an initial frequency of administration; and if after said administration, said patient exhibits elevated ammonia levels, a urinary PAGN <9000 .mu.g/mL, and a ratio of plasma PAA to plasma PAGN of >2.5, then administering said glycerol phenylbutyrate to said patient at an increased dose frequency while maintaining the said daily dose. In some embodiments, the patient exhibits elevated blood ammonia levels. In some embodiments, the compliance and effectiveness of drug delivery by the patients' parent(s), guardian(s), or health care provider(s) is also assessed. In some embodiments, urinary PAGN concentration is measured using a filter paper-type test. In some embodiments, urinary PAGN concentration is measured from urine collected directly from a diaper or via the blood-spot technology commonly used for the NBS.
[0019] These and other embodiments of the disclosure are described in detail below.
BRIEF DESCRIPTION OF THE DRAWINGS
[0020] FIG. 1 shows mean.+-.SE blood ammonia values for a 24-hour period following 7 days of treatment with NaPBA and HPN-100 in pediatric UCD subjects (N=11).
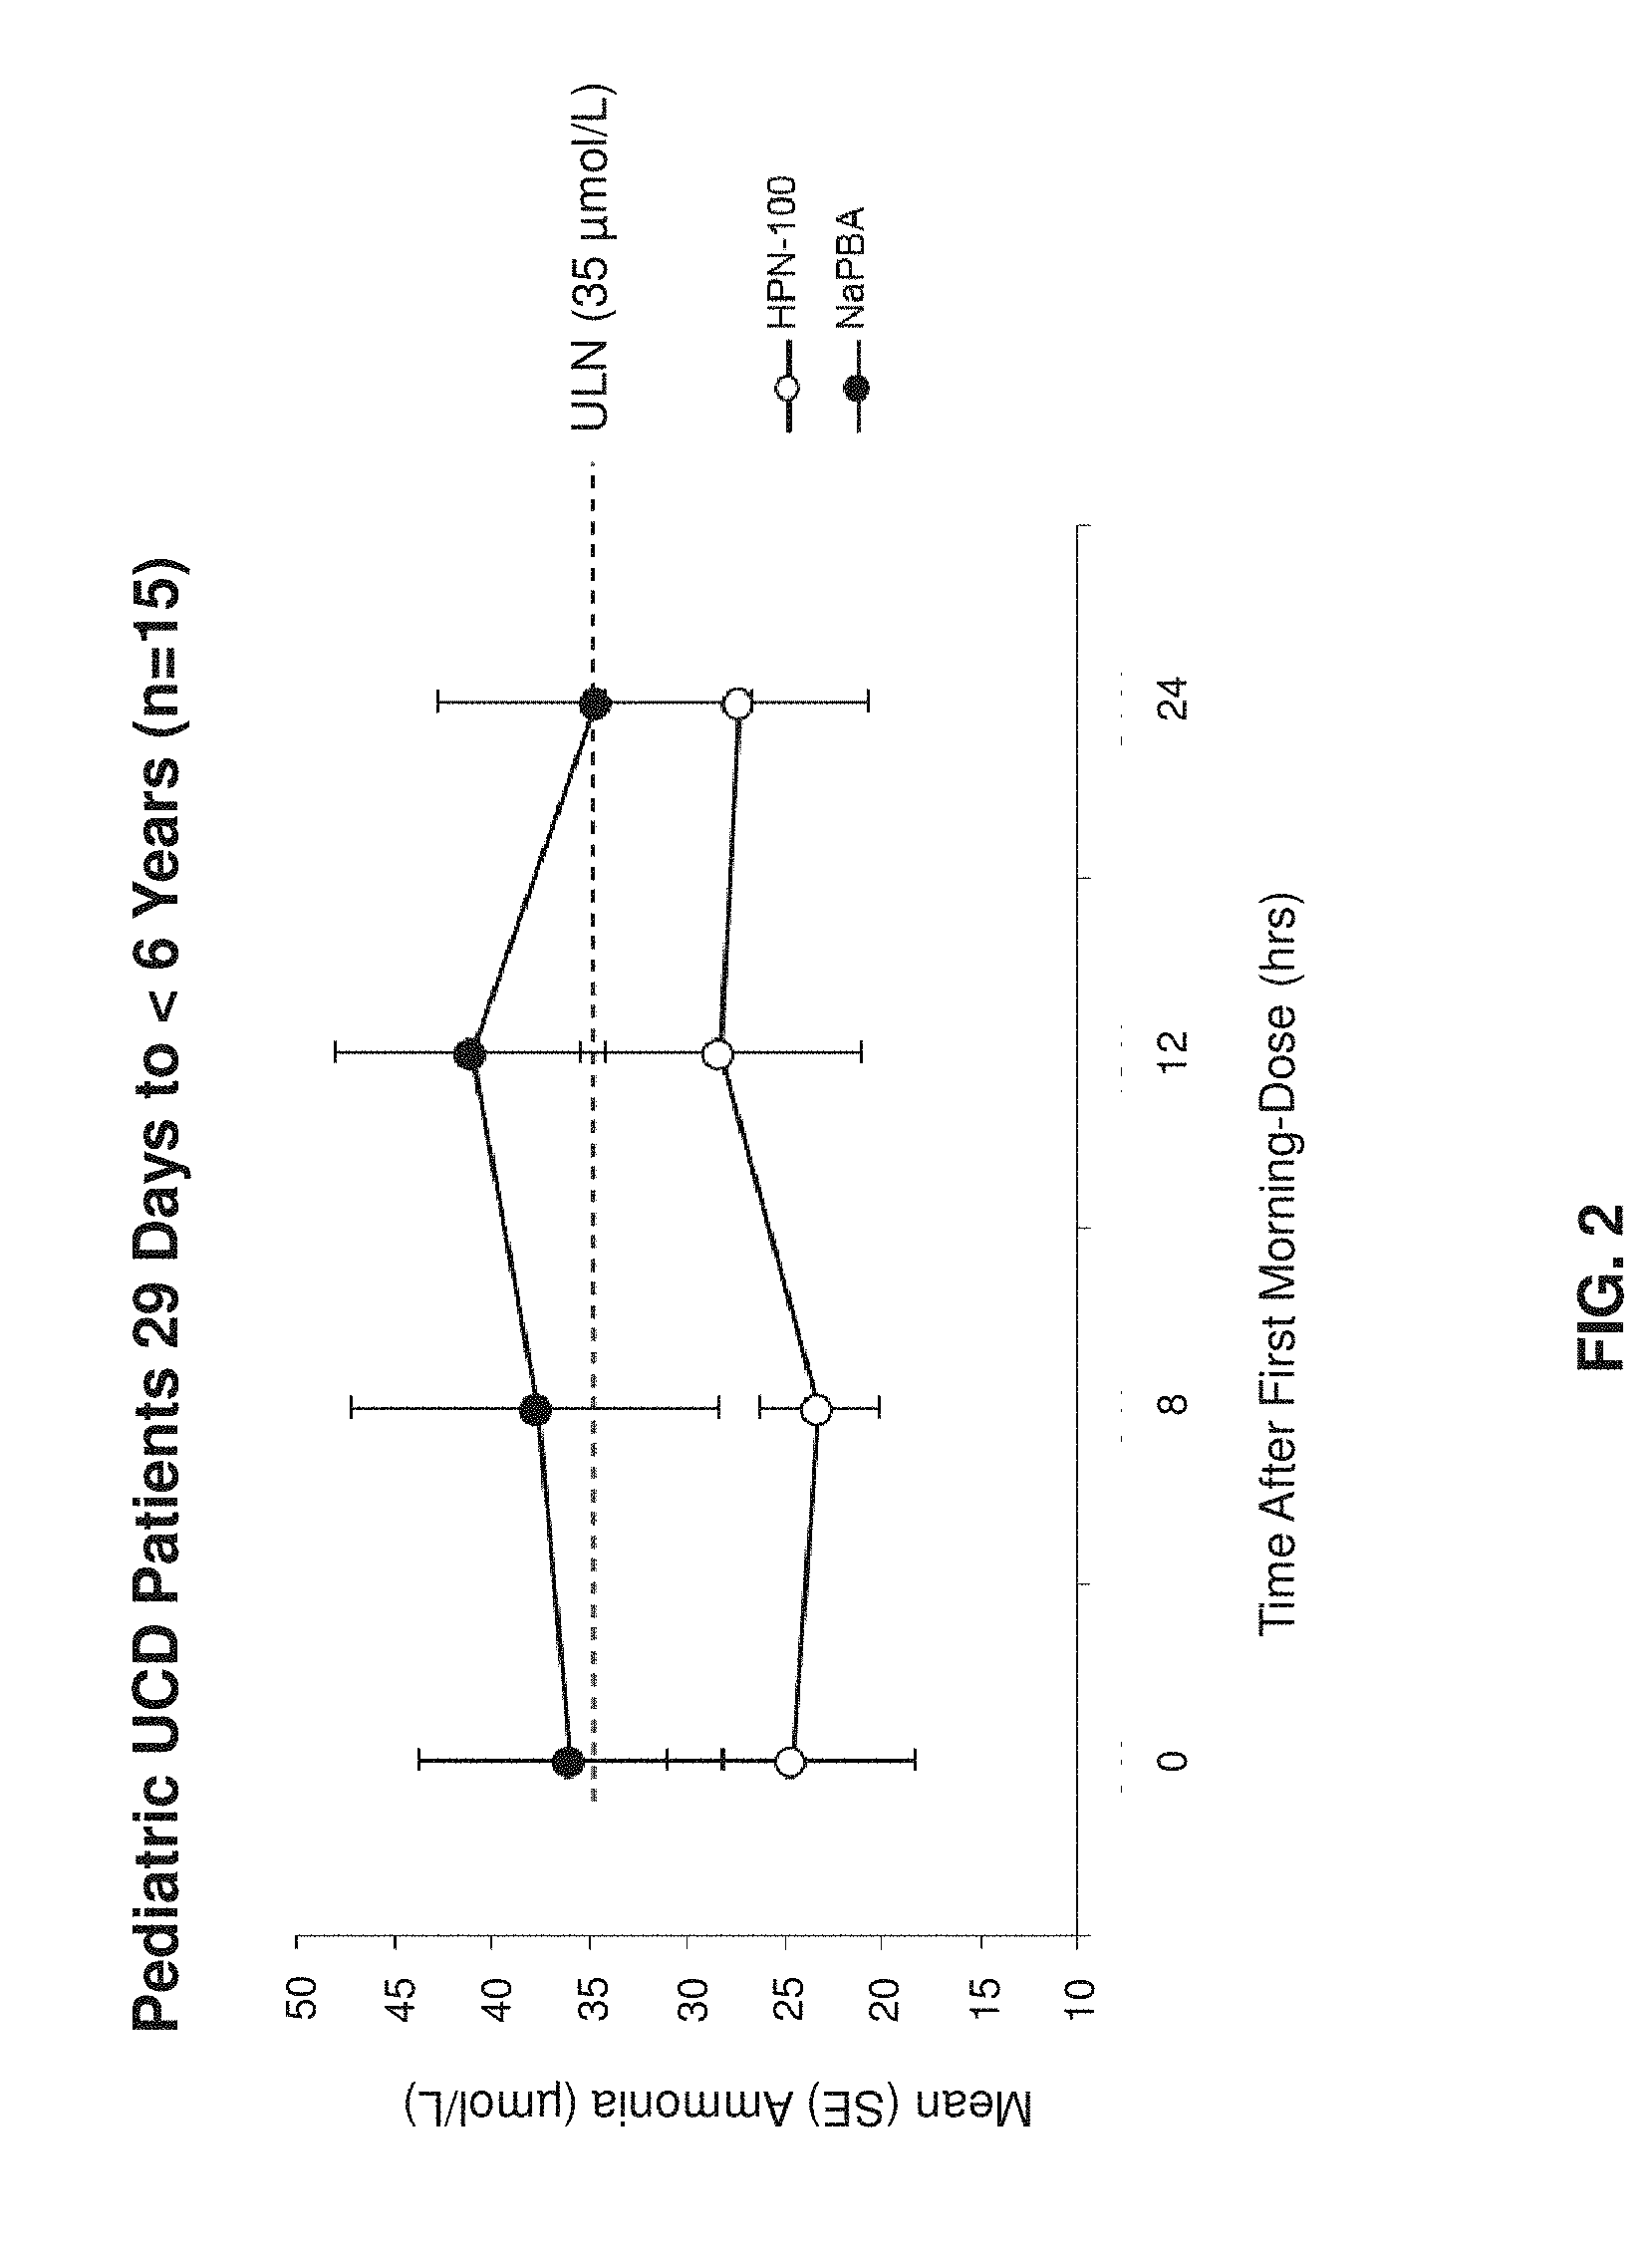
[0021] FIG. 2 shows mean blood ammonia over 24-h after treatment with NaPBA or HPN-100 (ITT Population). HPN-100=glycerol phenylbutyrate; ITT=intent-to-treat; NaPBA=sodium phenylbutyrate; SE=standard error; UCD=urea cycle disorder; ULN=upper limit of normal.
[0022] FIG. 3 shows a flow chart for dosing based on PAA:PAGN ratio in infants and toddlers presenting with neurological symptoms and normal ammonia levels.
[0023] FIG. 4 shows a flow chart for dosing based on U-PAGN ratio and plasma PAA:PAGN ratio in infants and toddlers with elevated ammonia.
[0024] FIG. 5 shows a chart with UCD patient information relating to patient presentation and contributors of delayed- and mis-diagnosis.
[0025] FIG. 6 shows a chart with the spectrum of UCD signs and symptoms beyond hyperammonemic (HA) crises.
[0026] FIG. 7 shows a chart with UCD patient symptom and disease progression information.
DETAILED DESCRIPTION
[0027] As used in this specification and the appended claims, the singular forms "a," "an" and "the" include plural referents unless the context clearly dictates otherwise. Thus, for example, "an active agent" refers not only to a single active agent but also to a combination of two or more different active agents, "a dosage form" refers to a combination of dosage forms as well as to a single dosage form, and the like.
[0028] Unless defined otherwise, all technical and scientific terms used herein have the meaning commonly understood by one of ordinary skill in the art to which the disclosure pertains. Specific terminology of particular importance to the description of the present disclosure is defined below.
[0029] The terms "treating" and "treatment" as used herein refer to reduction in severity and/or frequency of symptoms, elimination of symptoms and/or underlying cause, and improvement or remediation of damage. In certain aspects, the term "treating" and "treatment" as used herein refer to the prevention of the occurrence of symptoms. In other aspects, the term "treating" and "treatment" as used herein refer to the prevention of the underlying cause of symptoms associated with obesity, excess weight, and/or a related condition. The phrase "administering to a patient" refers to the process of introducing a composition or dosage form into the patient via an art-recognized means of introduction.
[0030] By the terms "effective amount" and "therapeutically effective amount" of an agent, compound, drug, composition or combination which is nontoxic and effective for producing some desired therapeutic effect upon administration to a subject or patient (e.g., a human subject or patient).
[0031] By "pharmaceutically acceptable" is meant a material that is not biologically or otherwise undesirable, i.e., the material may be incorporated into a pharmaceutical composition administered to a patient without causing any undesirable biological effects or interacting in a deleterious manner with any of the other components of the composition in which it is contained. When the term "pharmaceutically acceptable" is used to refer to a pharmaceutical carrier or excipient, it is implied that the carrier or excipient has met the required standards of toxicological and manufacturing testing or that it is included on the Inactive Ingredient Guide prepared by the U.S. Food and Drug administration. "Pharmacologically active" (or simply "active") as in a "pharmacologically active" (or "active") derivative or analog, refers to a derivative or analog having the same type of pharmacological activity as the parent compound and approximately equivalent in degree. The term "pharmaceutically acceptable salts" include acid addition salts which are formed with inorganic acids such as, for example, hydrochloric or phosphoric acids, or such organic acids as acetic, oxalic, tartaric, mandelic, and the like. Salts formed with the free carboxyl groups can also be derived from inorganic bases such as, for example, sodium, potassium, ammonium, calcium, or ferric hydroxides, and such organic bases as isopropylamine, trimethylamine, histidine, procaine and the like.
[0032] As used herein, "subject" or "individual" or "patient" refers to any patient for whom or which therapy is desired, and generally refers to the recipient of the therapy.
[0033] With regards to "patients under 2 years of age", the International Conference on Harmonisation (ICH) categorizes the pediatric population as follows: newborn (birth to 1 month), infants/toddlers (1 month to <24 months), children (2 years to <12 years), and adolescents (12 years to <16 years).
[0034] As used herein, the term "normal ammonia levels" refers to a patient's blood plasma ammonia concentration less than 35 .mu.mon. As used herein, the term "elevated ammonia levels" refers to refers to a patient's blood plasma ammonia concentration equal to or greater than 35 .mu.mon. In some embodiments, the ULN is normalized to 35 .mu.mon in blood plasma. To this effect, ULN can vary based on testing methodology (e.g., enzymatic versus colorimetric, .mu.mol/L versus .mu.g/mL) and from laboratory to laboratory. Two units, .mu.mol/L and .mu.g/dL, can be used for the ammonia data. The conversion formula is .mu.g/dL.times.0.5872=.mu.mol/L. Ammonia values from different labs can be normalized to 9-35 .mu.mol/L.
[0035] Collection and measurement of a patient's blood plasma ammonia levels are known to those of skill in the art. Notably, fasting blood plasma ammonia levels demonstrate the least variability and offer a practical means for predicting the risk and frequency of an HA crisis. In some embodiments, the patient's blood plasma ammonia levels are assayed after fasting. In some embodiments, a patient's blood plasma ammonia level is assayed using venous blood samples. However, for the purposes of this disclosure, additional, standardized methods of blood plasma ammonia collection and measurement, such as by finger prick, may also be suitable.
[0036] Where a range of values is provided, it is understood that each intervening value, to the tenth of the unit of the lower limit unless the context clearly dictates otherwise, between the upper and lower limit of that range and any other stated or intervening value in that stated range, is encompassed within the disclosure. The upper and lower limits of these smaller ranges may independently be included in the smaller ranges, and are also encompassed within the disclosure, subject to any specifically excluded limit in the stated range. Where the stated range includes one or both of the limits, ranges excluding either or both of those included limits are also included in the disclosure.
[0037] Unless defined otherwise, all technical and scientific terms used herein have the same meaning as commonly understood by one of ordinary skill in the art to which this disclosure belongs. Although any methods and materials similar or equivalent to those described herein can also be used in the practice or testing of the present disclosure, the preferred methods and materials are now described. All publications mentioned herein are incorporated herein by reference to disclose and describe the methods and/or materials in connection with which the publications are cited. The publications discussed herein are provided solely for their disclosure prior to the filing date of the present application. Nothing herein is to be construed as an admission that the present disclosure is not entitled to antedate such publication by virtue of prior disclosure. Further, the dates of publication provided may be different from the actual publication dates which may need to be independently confirmed.
[0038] Provided is a method of treating a UCD in a patient under 2 years of age comprising administering glycerol phenylbutyrate to said patient at an initial daily dose which is administered at an initial frequency of administration; and if after said administration, said patient exhibits a urinary PAGN .gtoreq.9000 .mu.g/mL and a ratio of plasma PAA to plasma PAGN of .ltoreq.2.5, then administering said glycerol phenylbutyrate to said patient at an increased daily dose while maintaining said initial frequency of administration.
[0039] Also provided is a method of treating a UCD in a patient under 2 years of age comprising administering glycerol phenylbutyrate to said patient at an initial daily dose which is administered at an initial frequency of administration; and if after said administration, said patient exhibits a urinary PAGN .gtoreq.9000 .mu.g/mL and a ratio of plasma PAA to plasma PAGN of >2.5, then administering said glycerol phenylbutyrate to said patient at an increased frequency of administration while maintaining said daily dose.
[0040] Also provided is a method of treating a UCD in a patient under 2 years of age comprising administering glycerol phenylbutyrate to said patient at an initial daily dose which is administered at an initial frequency of administration; and if after said administration, said patient exhibits a ratio of plasma PAA to plasma PAGN of >2.5 or a level of plasma PAA of >500 .mu.g/mL, then administering said glycerol phenylbutyrate to said patient at a reduced daily dose while maintaining said initial frequency of administration.
[0041] Also provided is a method of treating a UCD in a patient under 2 years of age comprising administering glycerol phenylbutyrate to said patient at an initial daily dose which is administered at an initial frequency of administration; and if after said administration, said patient exhibits a ratio of plasma PAA to plasma PAGN of >2.5 or a level of plasma PAA of >500 .mu.g/mL, then administering said glycerol phenylbutyrate to said patient at a lower dose or an increased frequency of administration while maintaining said daily dose.
[0042] Also provided is a method of treating a UCD in a patient under 2 years of age comprising administering glycerol phenylbutyrate to said patient at an initial daily dose which is administered at an initial frequency of administration; and if after said administration said patient exhibits neurological symptoms, normal ammonia levels, and a ratio of plasma PAA to plasma PAGN of <2.5, then said glycerol phenylbutyrate to said patient should continue to be administered at the same dose and frequency and the patient evaluated for other causes of his or her neurological symptoms.
[0043] Also provided is a method of treating a UCD in a patient under 2 years of age comprising administering glycerol phenylbutyrate to said patient at an initial daily dose which is administered at an initial frequency of administration; and if after said administration, said patient exhibits elevated ammonia levels, a urinary PAGN <9000 .mu.g/mL, a ratio of plasma PAA to plasma PAGN of .ltoreq.2.5, and compliance with initial daily dosing is confirmed, then administering said glycerol phenylbutyrate to said patient at an increased dose while maintaining frequency of administration.
[0044] Also provided is a method of treating a UCD in a patient under 2 years of age comprising administering glycerol phenylbutyrate to said patient at an initial daily dose which is administered at an initial frequency of administration; and if after said administration, said patient exhibits elevated ammonia levels, a urinary PAGN <9000 .mu.g/mL, and a ratio of plasma PAA to plasma PAGN of >2.5, then administering said glycerol phenylbutyrate to said patient at an increased dose frequency while maintaining the said daily dose.
[0045] The methods disclosed herein presume that the patient is effectively receiving all of the prescribed dose. Some parents have difficult delivering a liquid drug to newborns and, therefore, in some embodiments, the compliance and effectiveness of drug delivery by the patients' parent(s), guardian(s), or health care provider(s) can also be assessed.
[0046] In some embodiments, neurological symptoms include headache, confusion, vomiting, lethargy, or any combination thereof.
[0047] In some embodiments, the UCD is any subtype. In some embodiments, the UCD is not N-acetyl glutamate synthetase deficiency.
[0048] In some embodiments, the patient is a newborn, i.e., from birth to one month of age. In some embodiments, the patient is an infant/toddler, i.e., from 1 month to two years of age.
[0049] In some embodiments, the patient is treated for at least one month. In some embodiments, the patient is treated for at least six months. In some embodiments, the patient is treated for up to 24 months. In some embodiments, the patient is treated for more than 24 months. In some embodiments, the patient is treated for the rest of the patient's life. In some embodiments, the patient treated with the glycerol phenylbutyrate on a relatively continuous daily basis for at least 6 months or longer. In some embodiments, the patient receives a liver transplant and the treatment is terminated.
[0050] In some embodiments, the glycerol phenylbutyrate is administered orally. In some embodiments, the glycerol phenylbutyrate is administered via oral syringe. In some embodiments, the glycerol phenylbutyrate is administered via a gastric or nasogastric tube.
[0051] In some embodiments, the glycerol phenylbutyrate is administered just prior to breastfeeding or intake of formula or food.
[0052] In some embodiments, the patient is not being treated with carglumic acid.
[0053] In some embodiments, the patient is in a hyperammonemic crisis and the initial daily dose is 11.2 mL/m.sup.2/day. In some embodiments, the patient is not in a hyperammonemic crisis and said initial daily dose is 8.5 mL/m.sup.2/day.
[0054] In some embodiments, the patient previously had been administered NaPBA or NaBz and said initial daily dose is equal to 0.81 times the total number of grams of NaPBA powder the patient was receiving, or 0.86 times the total number of grams of in NaPBA tablet form the patient was receiving, or 0.5 times the total number of grams of in NaBz the patient was receiving.
[0055] In some embodiments, the initial frequency of administration is 3 to 6 times daily.
[0056] In some embodiments, if the initial frequency of administration is 3 times a day, then the increased frequency of administration is 4, 5, or 6 times a day. In some embodiments, if the initial frequency of administration is 3 times a day, then the increased frequency of administration is 4 times a day. In some embodiments, if the initial frequency of administration is 3 times a day, then the increased frequency of administration is 5 times a day. In some embodiments, if the initial frequency of administration is 3 times a day, then the increased frequency of administration is 6 times a day.
[0057] In some embodiments, if the initial frequency of administration is 4 times a day, then the increased frequency of administration is 5 or 6 times a day. In some embodiments, if the initial frequency of administration is 4 times a day, then the increased frequency of administration is 5 times a day. In some embodiments, if the initial frequency of administration is 4 times a day, then the increased frequency of administration is 6 times a day.
[0058] In some embodiments, if the initial frequency of administration is 5 times a day, then the increased frequency of administration is 6 times a day.
[0059] In some embodiments, the patient is less than about one month of age.
[0060] In some embodiments, the patient is from 1 month to two years of age.
[0061] In some embodiments, patient compliance with dosing is checked if U-PAGN is less than 9000 .mu.g/mL and the patient experiences hyperammonemia. See FIGS. 3 and 4.
[0062] In some embodiments, the glycerol phenylbutyrate is provided as RAVICTI.RTM. product.
[0063] In some embodiments, the method further comprises restricting dietary protein, including amino acids and protein formula/supplements. The diet prescribed for each individual depends on developmental needs, age and residual enzyme activity.
[0064] In some embodiments, the method further comprises sampling the patient's urine and/or plasma.
[0065] In some embodiments, the method further comprises determining the effectiveness of intestinal hydrolysis of the glycerol phenylbutyrate.
[0066] In some embodiments, the method further comprises determining the rate at which the patient converts PBA to urinary PAGN.
[0067] In some embodiments, the method further comprises determining the efficiency of conjugation of PAA and glutamine.
[0068] In some embodiments, the daily dose or frequency of administration is selected and/or adjusted based at least in part on plasma ammonia level, ratio of PAA:PAGN and/or U-PAGN level.
[0069] A morning ammonia level less than half the upper limit of normal (the upper limit of normal (ULN) is 35 .mu.mon in blood plasma) increases the likelihood that the average daily ammonia will be within normal limits and is associated with a decreased risk and frequency of hyperammonemic crises. In some embodiments, satisfactory ammonia control is defined as: no signs and symptoms of hyperammonemia and blood plasma ammonia values <100 .mu.mon. In some embodiments, patient dosing is maintained at an initial dose so long as the patient's blood plasma ammonia level is less than half the ULN (i.e., 35 .mu.mol/L). In some embodiments, the ULN is normalized to 35 .mu.mon in blood plasma. To this effect, ULN can vary based on testing methodology and from laboratory to laboratory.
[0070] In some embodiments, the samples are collected prior to the first dose of the day.
[0071] In some embodiments, the duration of ammonia monitoring will vary depending on the patient's age and their presenting conditions, as shown below. Patients less than 2 months of age will in some embodiments have ammonia levels monitored for a total of 72 hours (including 48 hours after the first full dose of glycerol phenylbutyrate) prior to the physician making the judgment that the patient has recovered (no signs and symptoms of hyperammonemia and ammonia <100 .mu.mon); patients aged 2 months and older following a hyperammonemic crisis will in some embodiments have ammonia levels monitored for a total of 48 hours (including 24 hours after their first full dose of glycerol phenylbutyrate); and patients aged 2 months and older who are newly diagnosed and stable or are already stable on NaPBA or NaBz will initiate or transition to glycerol phenylbutyrate and have their ammonia levels monitored in some embodiments for 24 hours. A monitoring period of 48-72 hours, depending on the age of the patient, may in some embodiments involve evaluations of ammonia levels at a minimum of every 12 hours.
TABLE-US-00001 TABLE 1 Determination of duration for ammonia monitoring period. Age of Patient HA Crisis Ammonia Monitoring Period <2 months Yes 72 hours No* 72 hours .gtoreq.2 months Yes 48 hours No* 24 hours *Stable Patient: defined as patients not in HA crisis who are diagnosed through newborn screening or patients currently on NaPBA or NaBz.
[0072] Population pharmacokinetic (PK) modeling and dosing simulations have demonstrated that body surface area is a determinant of the rate at which patients convert PAA to PAGN for both NaPBA and RAVICTI.RTM.. Very young patients are more likely than older patients to experience elevated PAA levels (i.e., in the range associated with generally reversible adverse events among cancer patients receiving PAA intravenously (nausea, vomiting, sweating, headache)). Measuring the plasma ratio of PAA to PAGN (the ratio of precursor to product, both in .mu.g/mL) is clinically useful in that it represents an inherent measure of the efficiency with which PAA is converted to PAGN in an individual patient. A PAA:PAGN concentration ratio .ltoreq.2.5 indicates efficient conversion of PAA to PAGN and suggests that the dose of NaPBA or GPB phenylbutyrate could be increased, if necessary.
[0073] Among all populations and doses studied, a ratio greater than 2.5, when both PAA and PAGN are expressed in .mu.g/mL, is associated with probabilities of PAA levels exceeding 400 .mu.g/mL ranging from approximately 25% to 36%, whereas a ratio less than or equal to 2.5 is associated with an approximately 1% risk of a PAA value >400 .mu.g/mL. Thus, a PAA to PAGN ratio >2.5 in a patient with unexplained neurological symptoms and normal ammonia provides guidance that cautious changes to dose or dosing regimen should be considered while maintaining the same daily dose. Neurological symptoms commonly associated with UCD are known to those of skill in the art and can include somnolence, headaches, lethargy, and confusion. Gastrointestinal symptoms commonly associated with UCD are also known to those of skill in the art and can include vomiting and loss of appetite.
[0074] U-PAGN measurements are used to help guide RAVICTI.RTM. dosing. Each gram of U-PAGN excreted over 24 hours covers waste nitrogen generated from 1.4 grams of dietary protein. Urinary PAGN has been shown to correlate directly and strongly with the dose of PBA administered, either as RAVICTI.RTM. or NaPBA, and the conversion of PBA to U-PAGN is generally between 60-75%. In young pediatric patients, even where complete urine collection is not possible, use of U-PAGN concentration is useful as a marker of compliance/effective drug delivery. Based on analysis of data obtained from all patients in RAVICTI.RTM. clinical trials and using the lower 25 percentile as a cutoff, the patient's caretaker should assess compliance and/or effectiveness of drug administration if the U-PAGN is <9000 .mu.g/mL for patients under 2 years of age who exhibit unexplained hyperammonemia during treatment with glycerol phenylbutyrate.
[0075] In some embodiments, the patient's desired growth and development and/or body surface area (BSA) is also considered. For example, if the patient's weight/BSA, metabolic needs and/or dietary protein intake have increased, the RAVICTI.RTM. dose may be increased accordingly; each additional gram of daily protein can be covered by 0.6 mL/day of additional RAVICTI.RTM..
[0076] Because plasma/urine PK results may not be available for real-time dose adjustment decisions, i.e. until after the patient's visit for sampling to be done, the present methods can also be practiced so as to guide dosing by providing a way to evaluate retrospectively dose adjustments already made based on ammonia levels and determine whether further adjustment is appropriate and what it should be, if so. Generally, samples for measurements of PAA and PAGN (plasma) and PAGN (urine) are collected at the time of each dose adjustment (in the retrospective mode; alternatively, samples can be taken and evaluated, and the dose adjustment, if any, implemented after the evaluation results are considered and used to guide dose adjustment, as provided herein).
EXAMPLES
[0077] Examples of embodiments of the present disclosure are provided in the following examples. The following examples are presented only by way of illustration and to assist one of ordinary skill in using the disclosure. The examples are not intended in any way to otherwise limit the scope of the disclosure.
Example 1
[0078] HPN-100-012 was an open-label, fixed sequence, switch-over study of the safety, PK and efficacy of HPN-100 compared to NaPBA in patients with UCDs, with a 12-month safety extension part. The switch-over part of the study and the 12-month safety extension are complete. The switch-over part was conducted at 7 U.S. centers and enrolled 15 pediatric UCD patients between 29 days and <6 year of age, all of whom completed the study. After review of all the safety data by the DSMB, 8 additional subjects were enrolled in the study after the switch-over phase was completed. The primary efficacy endpoint was the 24-hour AUC (area under the curve) for blood ammonia on Day 1 compared with Day 10. Results of this analysis demonstrated that HPN-100 was effective and non-inferior to NaPBA in controlling blood ammonia in pediatric patients with UCDs aged 29 days to <6 years (upper 90% CI of 1.002 and 95% CI of 1.055 based on the original scale, both well below the predefined non-inferiority upper margin of 1.25). The mean ammonia AUC was lower on HPN-100 than on NaPBA (median difference between treatments of -37.84 .mu.mol/L*h); the corresponding p-value was 0.075 using the paired t-test and 0.033 using the nonparametric Wilcoxon rank-sum test.
[0079] Mean blood ammonia levels following an overnight fast were normal at pre-dose and 24 hours post dose after treatment with NaPBA and HPN-100. See FIG. 2. At any given time point postprandially, blood ammonia levels were directionally lower during treatment with HPN-100 (Day 10) than with NaPBA (Day 1). Mean blood ammonia values were highest for both treatments at the 12-hour time point (28.24 .mu.mol/L on HPN-100 and 41.03 .mu.mol/L on NaPBA) and were lowest for HPN-100 treatment at the 8-h time point (23.20 .mu.mol/L) and 24-hour time point on NaPBA (34.66 .mu.mol/L).
[0080] Pooled ammonia analyses from short term studies were also conducted. In the pooled analyses, 24 hour ammonia was significantly lower on HPN-100 vs. NaPBA (mean [SD] AUC.sub.0-24: 627 [302] vs. 872 [516] .mu.mon; p=0.008) with significantly fewer abnormal values (15% on GPB vs. 35% on NaPBA; p=0.02).
[0081] The pharmacokinetics of the short term studies can be summarized as follows. Mean exposure levels of HPN-100 metabolites PBA, PAA, and PAGN after doses of HPN-100 and NaPBA with meals (TID) in pediatric (29 days to 17 years of age) UCD patients in HPN-100-005 and HPN-100-012 studies are summarized below. The mean exposure to PBA, the parent metabolite, and mean exposure to PAGN, the terminal metabolite, show no systematic variation across age groups, while PAA exposure tended to decrease with increasing age, a finding consistent with those from population PK modeling which indicate that the rate of clearance/metabolism of PAA varies directly with body size. While systemic metabolite exposure, assessed as peak plasma concentration (C.sub.max) or AUC, is generally similar for HPN-100 and NaPBA, the minimum concentration (C.sub.min-ss) was higher--and/or percent-fluctuation less--for plasma PAGN, a finding consistent with slower gastrointestinal absorption of PBA when administered orally as HPN-100.
TABLE-US-00002 TABLE 2 Pharmacokinetics of HPN-100 and NaPBA in pediatric patients with UCDs. Pediatric UCD Patients (29 days-17 years) HPN-100-005 (N = 11) HPN-100-012 (N = 15) PK Variable.sup.a HPN-100 NaPBA HPN-100 NaPBA Mean (SD) Dose 11.04 (3.859) 10.94 (3.873) 5.16 (2.316) 5.27 (2.453) Plasma PBA AUC.sub.0-24 (.mu.g h/mL) 631 (44.9) 236 (105.2) 255 (54.5) 483 (146.0) C.sub.max-ss (.mu.g/mL) 95.6 (42.0) 37.4 (101.6) 36.8 (59.0) 60.4 (128.3) C.sub.min-ss (.mu.g/mL) 1.50 (99.8) 0.37 (171.3) 0.750 (192.7) 0.993 (227.3) T.sub.max-ss (h).sup.b 12.00 12.00 8.00 8.30 (3.82, 15.90) (8.00, 13.58) (0.00, 12.00) (7.33-12.17) CLss/F (mL/min) 20545 (47.2) 145463 (123.4) 22610 (48.6) 112093 (136.4) % Fluctuation 5690 (56.8) 1979 (123.7) 1781 (84.6) 5102 (75.9) Plasma PAA AUC.sub.0-24 (.mu.g h/mL) 964 (63.6) 773 (73.3) 1096 (214.0) 1458 (211.3) C.sub.max-ss (.mu.g/mL) 90.5 (69.1) 75.1 (64.4) 84.7 (148.3) 98.0 (152.1) C.sub.min-ss (.mu.g/mL) 2.99 (122.1) 0.674 (130.5) 26.1 (360.8) 49.2 (287.2) T.sub.max-ss (h) 11.92 12.00 8.00 8.00 (7.75, 23.83) (8.00, 12.02) (7.42, 12.00) (6.50-12.17) CLss/F (mL/min) 15082 (101.4) 34391 (162.5) 25538 (116.8) 94249 (243.7) % Fluctuation 3483 (51.5) 3931 (85.1) 2141 (145.0) 1289 (102.8) Plasma PAGN AUC.sub.0-24 (.mu.g h/mL) 1378 (40.2) 1015 (44.7) 1131 (71.2) 946 (75.5) C.sub.max-ss (.mu.g/mL) 105 (33.5) 74.8 (37.3) 85.5 (53.7) 74.4 (61.3) C.sub.min-ss (.mu.g/mL) 13.1 (64.9) 4.6 (66.4) 19.9 (173.4) 17.7 (159.6) T.sub.max-ss (h) 12.00 12.00 7.92 8.00 (7.75, 23.83) (7.73, 12.25) (0.00, 12.00) (0.00-12.17) CLss/F (mL/min) 14237 (36.8) 19739 (44.3) 10830 (85.6) 14360 (93.0) % Fluctuation 1001 (84.5) 1917 (54.8) 907 (116.7) 1459 (74.1) U-PAGN Ae (.mu.g) 12501037 (56.9) 12512426 (51.3) NA.sup.c NA.sup.c Ae.sub.0-12 (.mu.g) 5611719 (74.7) 7098020 (47.5) NA.sup.c NA.sup.c Ae.sub.12-24 (.mu.g) 6889318 (50.1) 5414406 (71.9) NA.sup.c NA.sup.c Fe % dose 66.4 (23.9) 69.0 (23.9) NA.sup.c NA.sup.c Fe.sub.0-12 (%) 28.9 (42.1) 39.6 (30.0) NA.sup.c NA.sup.c Fe.sub.12-24 (%) 37.4 (32.3) 29.3 (52.8) NA.sup.c NA.sup.c .sup.aUnless otherwise noted, data shown are arithmetic mean (coefficient of variation %). .sup.bMedian (minimum, maximum). .sup.cTimed urine collections were not feasible among children under 6 participating in protocol HPN-100-012 and therefore recovery of PBA as urinary PAGN could not be calculated. Concentration of PAGN or the PAGN/creatinine ratio was measured/calculated from urine samples, and the results are summarized above.
Example 2
[0082] HPN-100-009 is an open-label study consisting of a transition period to HPN-100, followed by a safety extension period for at least 6 months and up to 24 months of treatment with HPN-100, depending on age at enrollment. It is designed to capture information important for evaluating safety, pharmacokinetics and efficacy in young children. Subjects eligible for this study included patients ranging from newborn to <2 years of age with either a diagnosed or clinically suspected UCD. Ten infant and toddler (28 days to 23 months) subjects were enrolled in this study.
[0083] Subjects aged 2 months to <2 years received RAVICTI.RTM. Oral Liquid administered just prior to breastfeeding or intake of formula or food. The recommended dosing regimen is 3-6 times per day depending on feeding schedule and at the discretion of the Investigator. The starting dose of RAVICTI.RTM. was based on UCD status (newly diagnosed, or already stable on sodium phenylbutyrate [NaPBA] and/or sodium benzoate [NaBz]) and whether a hyperammonemic crisis is present. Subsequently, the dose was adjusted based on clinical and/or ammonia results, according to an algorithm provided in the protocol.
TABLE-US-00003 TABLE 3 Study subjects. RAVICTI .RTM.: Age 2 Months to <2 Years. Group Value Number Started 10.sup.a Completed 1 Not Completed: 9 Stopping Rule: Liver Transplant 2 Adverse Event, Non-Fatal 1 Ongoing in Study 6 Age (months).sup.b 9.9 (.+-.5.53) Female 5 Male 5 .sup.aOverall in study = 10. .sup.bArithmetic mean (standard deviation).
Percentage of Subjects with Successful Transition to RAVICTI.RTM. with Controlled Ammonia (i.e. No Clinical Symptoms and Ammonia <100 .mu.Mol/L).
[0084] End point description. The percentage of subjects with successful transition was based on Investigator response to the question, "Has transition to 100% RAVICTI.RTM. been successful with controlled ammonia?" For subjects 2 months of age and older, after a minimum of 24 hours of ammonia monitoring following the first full dose of RAVICTI.RTM. alone, the subject was effectively transitioned when following conditions were met: no signs and symptoms of hyperammonemia; ammonia level less than 100 .mu.mol/L (without normalization of ammonia, i.e., without conversion of values from local laboratories with varying normal ranges to standardized values); and eligible for discharge per Investigator judgment. Safety population: all enrolled subjects who received any amount of study medication. End point timeframe: up to Day 4.
Rate of Hyperammonemic Crises (HACs) During the First 6 Months on RAVICTI.RTM..
[0085] End point description. A HAC was defined having signs and symptoms consistent with hyperammonemia (such as but not limited to frequent vomiting, nausea, headache, lethargy, irritability, combativeness, somnolence) associated with high blood ammonia and requiring medical intervention. Rate of HACs prior to enrollment was calculated as sum of (number of HAC)/sum of (subject age in days at the time of enrollment or 365 days, whichever was less) across all subjects in the corresponding group. Rate of HACs per 6 months during the safety extension was calculated as sum of (number of HAC)/sum of (days during first 6 months starting on Day 8 or number days on RAVICTI.RTM., whichever was less) across all subjects in the corresponding group. Safety population: all enrolled subjects who received any amount of study medication. End point timeframe: up to 365 days prior to enrollment, Days 1-7, Day 8 up to Month 6.
TABLE-US-00004 TABLE 4 Rate of HACs. RAVICTI .RTM.: Age 2 Months to <2 Years. End Point Value Number Subjects Analyzed 10.sup.a Rate Ratio HACs Prior to Enrollment (n = 10) 0.11 HACs During Transition (Days 1-7) (n = 10) 0 HACs During Safety Extension (n = 9) 0.006 .sup.aSubjects with an assessment at given time point.
Number of Subjects with Treatment-Emergent Adverse Events (TEAEs), Serious TEAEs, Deaths, and Discontinuations Due to TEAEs.
[0086] End point description. An adverse event (AE) was any untoward medical occurrence, whether or not the event is considered related to the study drug. A serious AE was any AE that: results in death; was life threatening; requires hospitalization or prolongation of existing hospitalization; resulted in disability/incapacity; was a congenital anomaly/birth defect; was an important medical event. TEAEs were defined as AEs with an onset date on or after the first dose of study medication until study discontinuation. The Investigator assessed the causal relationship of each TEAE to the study drug as not related, possibly related, or probably related. Safety population: all enrolled subjects who received any amount of study medication. End point timeframe: up to 370 days.
TABLE-US-00005 TABLE 5 Subjects with TEAEs. RAVICTI .RTM.: Age 2 Months to <2 Years. End Point Value Number Subjects Analyzed 10 Subjects .gtoreq.1 TEAE 10 .gtoreq.1 Related TEAE 4 .gtoreq.1 Serious TEAE 6 .gtoreq.1 Serious Related TEAE 0 Fatal Outcome TEAE 1 .gtoreq.1 TEAE Leading to 1 Study Discontinuation
Amino Acid Assessment: Baseline and Change from Baseline in Glutamate, Glutamine, and Sum of Glutamate and Glutamine Up to Month 9.
[0087] End point description. Safety population: all enrolled subjects who received any amount of study medication and had an assessment. End point timeframe: Baseline, Day 7, Month 2, Month 3, Month 4, Month 5, Month 6, Month 9.
TABLE-US-00006 TABLE 6 Amino acid assessment. RAVICTI .RTM.: Age 2 Months to <2 Years. Glutamate Glutamine Sum End Point Value (.mu.mol/L).sup.b (.mu.mol/L).sup.b (.mu.mol/L).sup.b Subjects Analyzed 7.sup.a 7.sup.a 7.sup.a Baseline (n = 7) 122.4 (.+-.118.62) 750.4 (.+-.309) 872.9 (.+-.381) Change from Baseline at Day 7 -54.5 (.+-.92.63) -184.3 (.+-.168.66) -238.8 (.+-.203.57) (n = 6) Change from Baseline at Month 2 7.8 (.+-.25.65) -174.6 (.+-.318.25) -166.8 (.+-.332.42) (n = 5) Change from Baseline at Month 3 2 (.+-.32.53) -134.5 (.+-.136.47) -132.5 (.+-.169) (n = 2) Change from Baseline at Month 4 -32.7 (.+-.5.51) -292 (.+-.384.81) -324.7 (.+-.389.32) (n = 3) Change from Baseline at Month 5 -10 (.+-.n/a).sup.c -240 (.+-.n/a).sup.c -250 (.+-.n/a).sup.c (n = 1) Change from Baseline at Month 6 -3.3 (.+-.48.69) -114.7 (.+-.734.14) -118 (.+-.772.5) (n = 3) Change from Baseline at Month 9 -23 (.+-.n/a).sup.c -859 (.+-.n/a).sup.c -836 (.+-.n/a).sup.c (n = 1) .sup.aSubjects with an assessment at given time point. .sup.bArithmetic mean (standard deviation). .sup.cStandard deviation not applicable (1 subject in group). Amino Acid Assessment: Baseline and Change from Baseline in Isoleucine, Leucine, and Valine Up to Month 9.
[0088] End point description. Safety population: all enrolled subjects who received any amount of study medication and had an assessment. End point timeframe: Baseline, Day 7, Month 2, Month 3, Month 4, Month 5, Month 6, Month 9.
TABLE-US-00007 TABLE 7 Amino acid assessment. RAVICTI .RTM.: Age 2 Months to <2 Years. Isoleucine Leucine Valine End Point Value (.mu.mol/L).sup.b (.mu.mol/L).sup.b (.mu.mol/L).sup.b Subjects Analyzed 7.sup.a 7.sup.a 7.sup.a Baseline (n = 7) 54.9 (.+-.19.5) 90.9 (.+-.29.25) 171.4 (.+-.42.89) Change from Baseline at Day 7 2.7 (.+-.19.16) -0.8 (.+-.32.76) 4 (.+-.24.13) (n = 6) Change from Baseline at Month 2 4.2 (.+-.45.86) 9.8 (.+-.65.97) 40.6 (.+-.90.06) (n = 5) Change from Baseline at Month 3 -30.5 (.+-.20.51) -35 (.+-.35.36) -45.5 (.+-.27.58) (n = 2) Change from Baseline at Month 4 -12.7 (.+-.16.62) -21.7 (.+-.19.22) -17 (.+-.8.19) (n = 3) Change from Baseline at Month 5 -19 (.+-.n/a).sup.c -32 (.+-.n/a).sup.c -29 (.+-.n/a).sup.c (n = 1) Change from Baseline at Month 6 -20.7 (.+-.9.07) -30.3 (.+-.11.59) -33.7 (.+-.10.21) (n = 3) Change from Baseline at Month 9 8 (.+-.n/a).sup.c -26 (.+-.n/a).sup.c 70 (.+-.n/a).sup.c (n = 1) .sup.aSubjects with an assessment at given time point. .sup.bArithmetic mean (standard deviation). .sup.cStandard deviation not applicable (1 subject in group).
Assessment of Growth and Development: Baseline and Change from Baseline in Body Mass Index (BMI) Z-Score and Body Surface Area (BSA) Z-Score Up to Month 9.
[0089] End point description. To assess any effect of study drug treatment on growth, Z-scores were calculated to express the deviation from a reference population for BMI and BSA. The BMI Z-scores are based on the World Health Organization's Child Growth Standards charts. The BSA Z-Scores are based on weight-for-length charts. Negative Z-scores indicate lower than typical for age and gender while positive scores indicate higher than typical for age and gender. Safety population: all enrolled subjects who received any amount of study medication and had an assessment. End point timeframe: Baseline, Day 7, Month 2, Month 3, Month 4, Month 5, Month 6, Month 9.
TABLE-US-00008 TABLE 8 Assessment of growth and development. RAVICTI .RTM.: Age 2 Months to <2 Years. End Point Value BMI (.mu.mol/L).sup.b BSA (.mu.mol/L).sup.b Subjects Analyzed 10.sup.a 10.sup.a Baseline (n = 10) 0.7947 (.+-.2.17872) 0.6861 (.+-.2.12644) Change from Baseline at Day 7 (n = 9) -0.2108 (.+-.0.76495) -0.1847 (.+-.0.7249) Change from Baseline at Month 2 (n = 7) 0.0021 (.+-.0.74892) -0.0437 (.+-.0.70353) Change from Baseline at Month 3 (n = 7) 0.2129 (.+-.0.84159) 0.1192 (.+-.0.68159) Change from Baseline at Month 4 (n = 6) 0.4696 (.+-.1.03769) 0.3808 (.+-.0.85271) Change from Baseline at Month 5 (n = 3) 0.164 (.+-.1.15709) 0.1979 (.+-.0.86261) Change from Baseline at Month 6 (n = 3) 0.4695 (.+-.1.34487) 0.3981 (.+-.1.06263) Change from Baseline at Month 9 (n = 1) 9.5444 (.+-.n/a).sup.c 9.4565 (.+-.n/a).sup.c .sup.aSubjects with an assessment at given time point. .sup.bArithmetic mean (standard deviation). .sup.cStandard deviation not applicable (1 subject in group).
Plasma Phenylbutyrate/Phenylbutyric Acid (PB A) 1) Maximum Plasma Concentration (Cmax); 2) Minimum Plasma Concentration (Cmin); 3) Area Under the Curve from Time Zero to the Time of Last Quantifiable Concentration (AUC[0-Last]); and 4) Time to Cmax (Tmax) on the First Full Day of RAVICTI.RTM. Dosing.
[0090] End point description. Pharmacokinetic (PK) Evaluable Population: all subjects from the safety population with individual concentration-time profiles that allow computation of meaningful PK parameter values. End point timeframe: Hour 0 and between 4 and 6 hours, 8 hours, and between 12 and 24 hours after the first dose of the day on Day 1 for stable subjects and on Day 2 for subjects in HAC.
TABLE-US-00009 TABLE 9 Plasma PBA PK parameters. RAVICTI .RTM.: Age 2 Months to <2 Years; 10 Subjects Analyzed. Plasma PBA End Point Value.sup.a C.sub.max 42.44 (.+-.36.715) (.mu.g/mL) C.sub.min 1.697 (.+-.2.254) (.mu.g/mL) AUC.sub.[0-last] 280.936 (.+-.293.553) (.mu.g * hr/mL) T.sub.max 8.383 (.+-.4.564) (hrs) .sup.aArithmetic mean (standard deviation).
Plasma Phenylacetate/Phenylacetic Acid (PAA) 1) Maximum Plasma Concentration (Cmax); 2) Minimum Plasma Concentration (Cmin); 3) Area Under the Curve from Time Zero to the Time of Last Quantifiable Concentration (AUC[0-Last]); and 4) Time to Cmax (Tmax) on the First Full Day of RAVICTI.RTM. Dosing.
[0091] End point description. PK Evaluable Population: all subjects from the safety population with individual concentration-time profiles that allow computation of meaningful PK parameter values. End point timeframe: Hour 0 and between 4 and 6 hours, 8 hours, and between 12 and 24 hours after the first dose of the day on Day 1 for stable subjects and on Day 2 for subjects in HAC.
TABLE-US-00010 TABLE 10 Plasma PAA PK parameters. RAVICTI .RTM.: Age 2 Months to <2 Years; 10 Subjects Analyzed. Plasma PAA End Point Value.sup.a C.sub.max 36.52 (.+-.31.784) (.mu.g/mL) C.sub.min 4.197 (.+-.6.434) (.mu.g/mL) AUC.sub.[0-last] 246.126 (.+-.238.547) (.mu.g * hr/mL) T.sub.max 7.422 (.+-.7.351) (hrs) .sup.aArithmetic mean (standard deviation).
Plasma Phenylacetylglutamine (PAGN) 1) Maximum Plasma Concentration (Cmax); 2) Minimum Plasma Concentration (Cmin); 3) Area Under the Curve from Time Zero to the Time of Last Quantifiable Concentration (AUC[0-Last]); and 4) Time to Cmax (Tmax) on the First Full Day of RAVICTI.RTM. Dosing.
[0092] End point description. PK Evaluable Population: all subjects from the safety population with individual concentration-time profiles that allow computation of meaningful PK parameter values. End point timeframe: Hour 0 and between 4 and 6 hours, 8 hours, and between 12 and 24 hours after the first dose of the day on Day 1 for stable subjects and on Day 2 for subjects in HAC.
TABLE-US-00011 TABLE 11 Plasma PAGN PK parameters. RAVICTI .RTM.: Age 2 Months to <2 Years; 10 Subjects Analyzed. Plasma PAGN End Point Value.sup.a C.sub.max 62.45 (.+-.27.281) (.mu.g/mL) C.sub.min 20.62 (.+-.14.529) (.mu.g/mL) AUC.sub.[0-last] 583.835 (.+-.285.241) (.mu.g * hr/mL) T.sub.max 6.573 (.+-.7.181) (hrs) .sup.aArithmetic mean (standard deviation).
Assessment of Urinary PAGN Concentrations on the First Full Day of RAVICTI.RTM. Dosing.
[0093] End point description. Urinary PAGN concentration was measured through urine collection. PK Evaluable Population: all subjects from the safety population with individual concentration-time profiles that allow computation of meaningful PK parameter values. End point timeframe: Hour 0 and between 0.5 and 1 hour, 1.5 and 2.5 hours, 4 and 6 hours, 7.5 and 8.5 hours, and between 12 and 24 hours after the first dose of the day on Day 1 for stable subjects and on Day 2 for subjects in HAC.
TABLE-US-00012 TABLE 12 Urinary PAGN assessment. RAVICTI .RTM.: Age 2 Months to <2 Years. End Point Value Number Subjects Analyzed 9.sup.a (.mu.g/mL).sup.b Hour 0 (n = 6) 3478.3 (.+-.1775.4) Hour 0.5 to 1 (n = 6) 4140.2 (.+-.4398.8) Hour 1.5 to 2.5 (n = 9) 3145.2 (.+-.5044.5) Hour 4 to 6 (n = 9) 5201.6 (.+-.4546.6) Hour 7.5 to 8.5 (n = 7) 4290 (.+-.3147.2) Hour 12 to 24 (n = 9) 7561.1 (.+-.6955.7) .sup.aSubjects with an assessment at given time point. .sup.bArithmetic mean (standard deviation).
Adverse Events Information.
[0094] Timeframe for reporting adverse events: From first dose of study treatment up to 370 days (data cutoff); median (full range) duration of treatment was 4.68 (0.2 to 10.9) months. Adverse event reporting additional description: TEAEs (defined as AEs with an onset date on or after the first dose of study medication until study discontinuation) are presented.
TABLE-US-00013 TABLE 13 Serious adverse events. RAVICTI .RTM.: Age 2 Months to <2 Years. End Point Value Number Total Subjects Affected Subjects Affected/Exposed 6/10 (60%) Number of Deaths (All Causes) 1 Number of Deaths Resulting from AEs Deaths Subjects Occurrences Causally Affected/ Causally Related Related to Exposed to Treatment/All Treatment/All Respiratory, Thoracic and Mediastinal 1/10 (10%) 0/2 0/0 Disorders (Apnoeic Attack) General Disorders and Administration 1/10 (10%) 0/1 0/1 Site Conditions (Pneumatosis) Hepatobiliary Disorders 4/10 (40%) 0/8 0/0 (Hyperammonaemia) Infections and Infestations (Gastroenteritis) 1/10 (10%) 0/1 0/0 (Croup) 1/10 (10%) 0/1 0/0 (Viral) 1/10 (10%) 0/1 0/0 (Urinary Tract) 1/10 (10%) 0/1 0/0
TABLE-US-00014 TABLE 14 Non-serious adverse events.sup.a. RAVICTI .RTM.: Age 2 Months to <2 Years. Subjects Occurrences End Point Value Affected/Exposed (All) Total Subjects Affected 10/10 (100%) Vascular Disorders (Deep Vein Thrombosis) 1/10 (10%) 1 Injury, Poisoning, and Procedural Complications (Stoma Site Reaction) 1/10 (10%) 1 (Tibia Fracture) 1/10 (10%) 1 Respiratory, Thoracic, and Mediastinal Disorders (Cough) 1/10 (10%) 1 (Rhinorrhoea) 1/10 (10%) 1 (Apnoeic Attack) 1/10 (10%) 1 Blood and Lymphatic System Disorders (Anaemia) 1/10 (10%) 1 Nervous System Disorders (Gross Motor Delay) 1/10 (10%) 1 Gastrointestinal Disorders (Diarrhoea) 1/10 (10%) 1 (Vomiting) 2/10 (20%) 3 (Teething) 1/10 (10%) 1 Renal and Urinary Disorders (Vesicoureteric Reflux) 1/10 (10%) 1 Skin and Subcutaneous Tissue Disorders (Nail Ridging) 1/10 (10%) 1 (Rash) 2/10 (20%) 2 Metabolism and Nutrition Disorders (Metabolic Acidosis) 1/10 (10%) 1 (Hypophagia) 1/10 (10%) 1 Infections and Infestations (Gastroenteritis) 1/10 (10%) 1 (Upper Respiratory Tract) 3/10 (30%) 4 (Urinary Tract) 1/10 (10%) 1 (Viral) 1/10 (10%) 1 (Nasopharyngitis) 1/10 (10%) 1 .sup.aFrequency threshold for reporting non-serious adverse events = 0%.
Example 3
[0095] Sixteen newborn infants aged 0 to 27 days, and 10 infants and toddlers aged 28 days to 23 months received RAVICTI Oral Liquid administered just prior to breastfeeding or intake of formula or food. The recommended dosing regimen was 3-6 times per day depending on feeding schedule.
TABLE-US-00015 TABLE 15 Number of subjects in study period. RAVICTI: RAVICTI: Age 2 months Age 0 to <2 years to <2 months (mean 9.87 (mean 0.83 months .+-. 5.529) months .+-. 0.697) Started 10 (5 females, 16 (7 females, 5 males) 9 males) Completed 6 10 Not Completed 4 6 Withdrawal by parent/guardian 0 0 Stopping rule: Liver transplant 2 4 Adverse event 1 1 Lost to follow-up 1 1
The number of subjects reported to be in the baseline period are not the same as the worldwide number enrolled in the trial. It is expected that these numbers will be the same. One subject enrolled in the study and prior to taking study drug the parents decided not to be dosed.
[0096] The starting dose of RAVICTI was based on UCD status (newly diagnosed, or already stable on sodium phenylbutyrate [NaPBA] and/or sodium benzoate [NaBz]) and whether a hyperammonemic crisis was present. Subsequently, the dose may have been adjusted based on clinical and/or ammonia results, according to an algorithm provided in the protocol. One subject enrolled in the study, and prior to taking study drug the parents decided not to be dosed. Percentage of Subjects with Successful Transition to RAVICTI With Controlled Ammonia (i.e., No Clinical Symptoms and Ammonia <100 .mu.mol/L)
[0097] For subjects 2 months of age and older, after a minimum of 24 hours of ammonia monitoring following the first full dose of RAVICTI alone, the subject was effectively transitioned when following conditions were met: no signs and symptoms of hyperammonemia; ammonia level less than 100 .mu.mol/L (without normalization of ammonia, i.e., without conversion of values from local laboratories with varying normal ranges to standardized values); and eligible for discharge.
[0098] For subjects 0 to <2 months of age, after a minimum of 24 hours of ammonia monitoring following the first full dose of RAVICTI alone, the subject was effectively transitioned when following conditions were met: no signs and symptoms of hyperammonemia; ammonia level less than 100 .mu.mol/L (without normalization of ammonia, i.e., without conversion of values from local laboratories with varying normal ranges to standardized values); and eligible for discharge.
Rate of Hyperammonemic Crises (HACs)
[0099] Hyperammonemic crisis (HAC) was defined as having signs and symptoms consistent with hyperammonemia (such as, but not limited to, frequent vomiting, nausea, headache, lethargy, irritability, combativeness, and/or somnolence) associated with high blood ammonia and requiring medical intervention. Rate of HACs prior to enrollment was calculated as sum of (number of HAC)/sum of (subject age in days at the time of enrollment or 365 days, whichever was less) across all subjects in the corresponding group. Rate of HACs per 6 months during the safety extension was calculated as sum of (number of HAC)/sum of (days during first 6 months starting on Day 8 or number days on RAVICTI, whichever is less) across all subjects in the corresponding group.
[0100] For subjects aged 2 months and up to 2 years, 6 subjects were assessed for HACs, and HACs were identified at a ratio of 0.005.
[0101] For subjects aged 1 to less than 2 months, 16 subjects were assessed for HACs, and HACs were identified at a ratio of 0.003.
Number of Subjects with Treatment-Emergent Adverse Events (TEAEs), Serious TEAEs, Deaths, and Discontinuations Due to TEAEs
[0102] An adverse event (AE) is any untoward medical occurrence, whether or not the event is considered related to the study drug. A serious AE is any AE that: results in death; is life threatening; requires hospitalization or prolongation of existing hospitalization; results in disability/incapacity; is a congenital anomaly/birth defect; is an important medical event. TEAEs are defined as AEs with an onset date on or after the first dose of study medication until study discontinuation. The Investigator assessed the causal relationship of each TEAE to the study drug as not related, possibly related, or probably related. From the first dose of study treatment through 30 days after the final dose (mean [SD] duration of treatment was 9.13 [6.838] months).
[0103] For subjects aged 2 months and up to 2 years, of the 10 subjects analyzed, all 10 experienced one or more TEAE. Four subjects experienced one or more related TEAE; 6 experienced one or more serious TEAE, and no subjects experienced serious related TEAEs. One subject experienced a fatal outcome TEAE, and one subject experienced a TEAE leading to study discontinuation.
[0104] For subjects aged 0 to 2 months, of the 16 subjects analyzed, all 16 experienced one or more TEAE. Ten subjects experienced one or more related TEAE; 11 experienced one or more serious TEAE, and no subjects experienced serious related TEAEs. There were no fatal outcome TEAEs, and one subject experienced a TEAE leading to study discontinuation.
[0105] Baseline and Change from Baseline in Glutamate Up to Month 24
[0106] Glutamate measurements were taken on day 7, month 2, month 3, month 4, month 5, month 6, month 9, month 12, month 15, and month 24.
TABLE-US-00016 TABLE 16 Glutamate baseline and changes (.mu.mol/L). RAVICTI: RAVICTI: Age 2 months Age 0 to <2 years to <2 months Number of subjects analyzed 10 16 Baseline 122.43 (.+-.118.620); 84.97 (.+-.52.086); n = 7 n = 15 Day 7 change from -54.50 (.+-.92.626); 26.81 (.+-.76.417); baseline n = 6 n = 14 Month 2 change from 7.80 (.+-.25.646); 25.16 (.+-.64.474); Baseline n = 5 n = 14 Month 3 change from -16.33 (.+-.39.209); 50.05 (.+-.73.988); Baseline n = 3 n = 14 Month 4 change from -13.00 (.+-.39.590); 18.77 (.+-.67.561); Baseline n = 4 n = 11 Month 5 change from 0.25 (.+-.13.426); 57.43 (.+-.98.550); Baseline n = 4 n = 10 Month 6 change from -2.20 (.+-.34.463); 43.65 (.+-.140.985); Baseline m = 5 n = 8 Month 9 change from 30.80 (.+-.17.092); 33.41 (.+-.150.273); Baseline n = 3 n = 8 Month 12 change from 22.20 (.+-.23.506); 8.75 (.+-.97.329); Baseline n = 3 n = 4 Month 15 change from 39.00 (.+-.00000); 25.75 (.+-.62.660); Baseline n = 1 n = 4 Month 18 change from -- 2.50 (.+-.21.920); Baseline n = 2 Month 24 change from 48.00 (.+-.53.740); 16.10 (.+-.95.461); Baseline n = 2 n = 8 n = subjects with an assessment at given time point; 00000 = not applicable (1 subject assessed).
Baseline and Change from Baseline in Glutamine Up to Month 24
[0107] Glutamine measurements were taken on day 7, month 2, month 3, month 4, month 5, month 6, month 9, month 12, month 15, month 18, and month 24.
TABLE-US-00017 TABLE 17 Glutamine baseline and changes (.mu.mol/L). RAVICTI: RAVICTI: Age 2 months Age 0 to <2 years to <2 months Number of subjects analyzed 10 16 Baseline 750.43 (.+-.309.000); 508.83 (.+-.337.175); n = 7 n = 15 Day 7 change from -184.33 (.+-.168.657); 21.04 (.+-.260.500); baseline n = 6 n = 14 Month 2 change from -174.60 (.+-.318.249); -27.62 (.+-.379.796); Baseline n = 5 n = 14 Month 3 change from -374.00 (.+-.425.903); -15.09 (.+-.352.471); Baseline n = 3 n = 14 Month 4 change from -252.75 (.+-.323.852); -113.98 (.+-.230.855); Baseline n = 4 n = 11 Month 5 change from -370.25 (.+-.377.222); -99.82 (.+-.305.674); Baseline n = 4 n = 10 Month 6 change from -113.20 (.+-.519.710); -138.16 (.+-.349.269); Baseline n = 5 n = 8 Month 9 change from -446.53 (.+-.360.457); -56.08 (.+-.269.288); Baseline n = 3 n = 8 Month 12 change from -450.50 (.+-.386.699); -181.50 (.+-.118.604); Baseline; n = 3 n = 4 Month 15 change from -149.00 (.+-.00000); -103.75 (.+-.328.583); Baseline n = 1 n = 4 Month 18 change from -- -184.00 (.+-.80.610); Baseline n = 2 Month 24 change from 195.00 (.+-.554.372); -219.93 (.+-.279.815); Baseline n = 2 n = 8 n = subjects with an assessment at given time point; 00000 = not applicable (1 subject assessed).
Baseline and Change from Baseline in Sum of Glutamine and Glutamate Up to Month 24
[0108] Measurements were taken on day 7, month 2, month 3, month 4, month 5, month 6, month 9, month 12, month 15, month 18, and month 24.
TABLE-US-00018 TABLE 18 Sum of glutamine and glutamate baseline and changes (.mu.mol/L). RAVICTI: RAVICTI: Age 2 months Age 0 to <2 years to <2 months Number of subjects analyzed 10 16 Baseline 872.86 (.+-.381.005); 593.80 (.+-.333.657); n = 7 n = 15 Day 7 change from -238.83 (.+-.203.567); 47.85 (.+-.230.343); baseline n = 6 n = 14 Month 2 change from -166.80 (.+-.332.421); -2.46 (.+-.402.919); Baseline n = 5 n = 14 Month 3 change from -390.33 (.+-.462.292); 34.96 (.+-.371.522); Baseline n = 3 n = 14 Month 4 change from -265.75 (.+-.339.015); -95.21 (.+-.238.136); Baseline n = 4 n = 11 Month 5 change from -370.00 (.+-.379.884); -42.39 (.+-.288.782); Baseline n = 4 n = 10 Month 6 change from -115.40 (.+-.546.796); -94.51 (.+-.297.378); Baseline n = 5 n = 8 Month 9 change from -415.73 (.+-.365.419); -22.66 (.+-.318.034); Baseline n = 3 n = 8 Month 12 change from -428.30 (.+-.404.351); -172.75 (.+-.210.202); Baseline n = 3 n = 4 Month 15 change from -110.00 (.+-.00000); -78.00 (.+-.297.410); Baseline n = 1 n = 4 Month 18 change from -- -181.50 (.+-.102.530); Baseline n = 2 Month 24 change from 243.00 (.+-.608.112); -203.83 (.+-.255.810); Baseline n = 2 n = 8 n = subjects with an assessment at given time point; 00000 = not applicable (1 subject assessed).
Baseline and Change from Baseline in Isoleucine Up to Month 24
[0109] Isoleucine measurements were taken on day 7, month 2, month 3, month 4, month 5, month 6, month 9, month 12, month 15, month 18, and month 24.
TABLE-US-00019 TABLE 19 Isoleucine baseline and changes (.mu.mol/L). RAVICTI: RAVICTI: Age 2 months Age 0 to <2 years to <2 months Number of subjects analyzed 10 16 Baseline 54.86 (.+-.19.497); 142.68 (.+-.222.694); n = 7 n = 15 Day 7 change from 2.67 (.+-.19.159); -49.09 (.+-.198.730); baseline n = 6 n = 14 Month 2 change from 4.20 (.+-.45.861); -1.62 (.+-.233.754); Baseline n = 5 n = 14 Month 3 change from -25.67 (.+-.16.743); -20.46 (.+-.216.885); Baseline n = 3 n = 14 Month 4 change from -20.25 (.+-.20.353); -67.32 (.+-.173.564); Baseline n = 4 n = 11 Month 5 change from -20.00 (.+-.36.341); -75.45 (.+-.221.845); Baseline n = 4 n = 10 Month 6 change from -16.40 (.+-.12.137); -35.94 (.+-.78.367); Baseline n = 5 n = 8 Month 9 change from -6.73 (.+-.13.342); -73.09 (.+-.245.051); Baseline n = 3 n = 8 Month 12 change from -13.33 (.+-.15.885); -178.50 (.+-.335.538); Baseline n = 3 n = 4 Month 15 change from -18.00 (.+-.00000); -139.50 (.+-.359.287); Baseline n = 1 n = 4 Month 18 change from -- 1.00 (.+-.45.255); Baseline n = 2 Month 24 change from 1.50 (.+-.10.607); -55.31 (.+-.217.209); Baseline n = 2 n = 8 n = subjects with an assessment at given time point; 00000 = not applicable (1 subject assessed).
Baseline and Change from Baseline in Leucine Up to Month 24
[0110] Leucine measurements were taken on day 7, month 2, month 3, month 4, month 5, month 6, month 9, month 12, month 15, month 18, and month 24.
TABLE-US-00020 TABLE 20 Leucine baseline and changes (.mu.mol/L). RAVICTI: RAVICTI: Age 2 months Age 0 to <2 years to <2 months Number of subjects analyzed 10 16 Baseline 90.86 (.+-.29.249' 133.67 (.+-.253.829); n = 7 n = 15 Day 7 change from -0.83 (.+-.32.762); -81.91 (.+-.273.127); baseline n = 6 n = 14 Month 2 change from 9.80 (.+-.65.975); -60.80 (.+-.278.083); Baseline n = 5 n = 14 Month 3 change from -33.00 (.+-.25.239); -51.66 (.+-.269.558); Baseline n = 3 n = 14 Month 4 change from -31.25 (.+-.24.771); -82.82 (.+-.224.269); Baseline n = 4 n = 11 Month 5 change from -39.50 (.+-.61.136); -118.55 (.+-.311.125); Baseline n = 4 n = 10 Month 6 change from -25.40 (.+-.13.594); -11.85 (.+-.40.693); Baseline n = 5 n = 8 Month 9 change from -19.13 (.+-.39.322); -115.09 (.+-.338.186); Baseline n = 3 n = 8 Month 12 change from -34.37 (.+-.23.283); -249.50 (.+-.483.776); Baseline n = 3 n = 4 Month 15 change from -40.00 (.+-.00000); -195.75 (.+-.496.313); Baseline n = 1 n = 4 Month 18 change from -- 6.00 (.+-.62.225); Baseline n = 2 Month 24 change from -1.50 (.+-.31.820); -82.54 (.+-.228.107). Baseline n = 2 n = 8 n = subjects with an assessment at given time point; 00000 = not applicable (1 subject assessed).
Baseline and Change from Baseline in Valine Up to Month 24
[0111] Valine measurements were taken on day 7, month 2, month 3, month 4, month 5, month 6, month 9, month 12, month 15, month 18, and month 24.
TABLE-US-00021 TABLE 21 Valine baseline and changes (.mu.mol/L). RAVICTI: RAVICTI: Age 2 months Age 0 to <2 years to <2 months Number of subjects analyzed 10 16 Baseline 171.43 (.+-.42.887); 181.49 (.+-.257.948); n = 7 n = 15 Day 7 change from 4.00 (.+-.24.133); -63.96 (.+-.290.312); baseline n = 6 n = 14 Month 2 change from 40.60 (.+-.90.057); -39.04 (.+-.297.634); Baseline n = 5 n = 14 Month 3 change from -27.33 (.+-.37.018); -23.86 (.+-.290.128); Baseline n = 3 n = 14 Month 4 change from -31.50 (.+-.29.760); -74.41 (.+-.233.538); Baseline n = 4 n = 11 Month 5 change from -56.00 (.+-.75.939); -98.67 (.+-.326.300); Baseline n = 4 n = 10 Month 6 change from -21.60 (.+-.18.202); 2.64 (.+-.77.843); Baseline n = 5 n = 8 Month 9 change from -11.90 (.+-.71.753); -90.40 (.+-.355.316); Baseline n = 3 n = 8 Month 12 change from -48.87 (.+-.51.644); -238.25 (.+-.506.435); Baseline n = 3 n = 4 Month 15 change from -46.00 (.+-.0000); -137.00 (.+-.519.042); Baseline n = 1 n = 4 Month 18 change from -- 38.00 (.+-.67.882); Baseline n = 2 Month 24 change from 5.00 (.+-.55.154); -72.78 (.+-.258.710); Baseline n = 2 n = 8 n = subjects with an assessment at given time point; 00000 = not applicable (1 subject assessed).
Baseline and Change from Baseline in Body Mass Index (BMI) Z-Score Up to Month 24
[0112] To assess any effect of study drug treatment on growth, Z-scores were calculated to express the deviation from a reference population for BMI. The Z-scores are based on the World Health Organization's Child Growth Standards charts. Negative Z-scores indicate lower than typical for age and gender while positive scores indicate higher than typical for age and gender. BMI measurements were taken on month 1, month 2, month 3, month 4, month 5, month 6, month 9, month 12, month 15, month 18, and month 24.
TABLE-US-00022 TABLE 22 Z-Score baseline and changes. RAVICTI: RAVICTI: Age 2 months Age 0 to <2 years to <2 months Number of subjects analyzed 10 16 Baseline 0.8107 (.+-.2.17017); -0.0544 (.+-.1.26821); n = 10 n = 16 Month 1 change from -0.2385 (.+-.0.77830); -0.2158 (.+-.1.35960); baseline n = 9 n = 16 Month 2 change from -0.0249 (.+-.0.74861); -0.2598 (.+-.1.19544); Baseline n = 7 n = 15 Month 3 change from 0.1815 (.+-.0.86056); -0.1617 (.+-.1.02572); Baseline n = 7 n = 15 Month 4 change from 0.4434 (.+-.0.94854); -0.0264 (.+-.1.68215); Baseline n = 7 n = 12 Month 5 change from 0.1484 (.+-.0.76293); 0.0828 (.+-.1.14206); Baseline n = 6 n = 11 Month 6 change from 0.2497 (.+-.0.80923); 0.0136 (.+-.1.72106); Baseline n = 7 n = 10 Month 9 change from 0.6407 (.+-.0.98695); 0.4614 (.+-.1.25343); Baseline n = 5 n = 9 Month 12 change from 0.4164 (.+-.0.80674); 0.6646 (.+-.0.95334); Baseline n = 4 n = 6 Month 15 change from -0.2997 (.+-.0.16959); 0.6830 (.+-.0.55703); Baseline n = 2 n = 4 Month 18 change from -0.2038 (.+-.00000); 0.3308 (.+-.0.27572); Baseline n = 1 n = 3 Month 24 change from 0.5581 (.+-.1.23993); 0.7743 (.+-.0.64962); Baseline n = 4 n = 10 n = subjects with an assessment at given time point; 00000 = not applicable (1 subject assessed).
Baseline and Change from Baseline in Body Surface Area (BSA) Z-Score Up to Month 24
[0113] To assess any effect of study drug treatment on growth, Z-scores were calculated to express the deviation from a reference population for BSA. The Z-scores are based on weight-for-length charts. Negative Z-scores indicate lower than typical for age and gender while positive scores indicate higher than typical for age and gender. BMI measurements were taken on month 1, month 2, month 3, month 4, month 5, month 6, month 9, month 12, month 15, month 18, and month 24.
TABLE-US-00023 TABLE 23 Z-Score baseline and changes. RAVICTI: RAVICTI: Age 2 months Age 0 to <2 years to <2 months Number of subjects analyzed 10 16 Baseline 0.7143 (.+-.2.14922); -0.1980 (.+-.2.11774); n = 10 n = 16 Month 1 change from -0.2105 (.+-.0.74135); 0.2336 (.+-.1.95603); baseline n = 9 n = 16 Month 2 change from -0.0704 (.+-.0.70393); 0.2006 (.+-.1.72135); Baseline n = 7 n = 15 Month 3 change from 0.1065 (.+-.0.70165); 0.2684 (.+-.1.37517); Baseline n = 7 n = 15 Month 4 change from 0.3365 (.+-.0.77672); 0.2372 (.+-.2.30831); Baseline n = 7 n = 12 Month 5 change from 0.1043 (.+-.0.56747); 0.1810 (.+-.1.70024); Baseline n = 6 n = 11 Month 6 change from 0.1842 (.+-.0.62205); 0.2902 (.+-.2.05956); Baseline n = 7 n = 10 Month 9 change from 0.4875 (.+-.0.86137); 0.1679 (.+-.1.32407); Baseline n = 5 n = 9 Month 12 change from 0.2944 (.+-.0.75133); 0.1308 (.+-.0.50371); Baseline n = 4 n = 6 Month 15 change from -0.3661 (.+-.0.00932); 0.1595 (.+-.0.75833); Baseline n = 2 n = 4 Month 18 change from -0.2214 (.+-.00000); 0.1050 (.+-.0.73521); Baseline n = 1 n = 3 Month 24 change from 0.4310 (.+-.1.13140); 0.7341 (.+-.1.35582); Baseline n = 4 n = 10 n = subjects with an assessment at given time point; 00000 = not applicable (1 subject assessed).
Plasma Phenylbutyrate/Phenylbutyric Acid (PB A) Maximum Plasma Concentration (Cmax) on the First Full Day of RAVICTI Dosing
[0114] Pharmacokinetic (PK) Evaluable Population: all subjects from the safety population with individual concentration-time profiles that allow computation of meaningful PK parameter values. Measurements were taken at hour 0, between 4 and 6 hours, 8 hours, and between 12 and 24 hours after the first dose of the day on day 1 for stable subjects and on day 2 for subjects in HAC.
[0115] For subjects aged 2 months and up to 2 years, of the 10 subjects analyzed, the mean Cmax was 42.11 (.+-.36.715) .mu.g/mL.
[0116] For subjects aged 0 to 2 months, of the 16 subjects analyzed, the mean Cmax was 46.2 (.+-.49.8) .mu.g/mL.
Plasma PBA Minimum Plasma Concentration (Cmin) on the First Full Day of RAVICTI Dosing
[0117] PK Evaluable Population: all subjects from the safety population with individual concentration-time profiles that allow computation of meaningful PK parameter values. Measurements were taken at hour 0, between 4 and 6 hours, 8 hours, and between 12 and 24 hours after the first dose of the day on day 1 for stable subjects and on day 2 for subjects in HAC.
[0118] For subjects aged 2 months and up to 2 years, of the 10 subjects analyzed, the mean Cmin was 1.697 (.+-.2.254) .mu.g/mL.
[0119] For subjects aged 0 to 2 months, of the 7 subjects analyzed, the mean Cmin was 4.8 (.+-.4.2) .mu.g/mL.
Plasma PBA Area Under the Curve from Time Zero to the Time of Last Quantifiable
Concentration (AUC[0-Last]) on the First Full Day of RAVICTI Dosing
[0120] PK Evaluable Population: all subjects from the safety population with individual concentration-time profiles that allow computation of meaningful PK parameter values. Measurements were taken at hour 0, between 4 and 6 hours, 8 hours, and between 12 and 24 hours after the first dose of the day on day 1 for stable subjects and on day 2 for subjects in HAC.
[0121] For subjects aged 2 months and up to 2 years, of the 10 subjects analyzed, the mean AUC[0-last]) was 280.936 (.+-.293.553).mu.g*hr/mL.
[0122] For subjects aged 0 to 2 months, of the 16 subjects analyzed, the mean AUC[0-last]) was 374.53 (.+-.390.48).mu.g*hr/mL.
Plasma PBA Time to Cmax (Tmax) on the First Full Day of RAVICTI Dosing
[0123] PK Evaluable Population: all subjects from the safety population with individual concentration-time profiles that allow computation of meaningful PK parameter values. Measurements were taken at hour 0, between 4 and 6 hours, 8 hours, and between 12 and 24 hours after the first dose of the day on day 1 for stable subjects and on day 2 for subjects in HAC.
[0124] For subjects aged 2 months and up to 2 years, of the 10 subjects analyzed, the mean Tmax was 8.383 (.+-.4.564) hr.
[0125] For subjects aged 0 to 2 months, of the 16 subjects analyzed, the mean Tmax was 9.39 (.+-.7.41) hr.
Plasma Phenylacetate/Phenylacetic Acid (PAA) Cmax on the First Full Day of RAVICTI Dosing
[0126] PK Evaluable Population: all subjects from the safety population with individual concentration-time profiles that allow computation of meaningful PK parameter values. Measurements were taken at hour 0, between 4 and 6 hours, 8 hours, and between 12 and 24 hours after the first dose of the day on day 1 for stable subjects and on day 2 for subjects in HAC.
[0127] For subjects aged 2 months and up to 2 years, of the 10 subjects analyzed, the mean plasma PAA Cmax was 36.52 (.+-.31.784) .mu.g/mL.
[0128] For subjects aged 0 to 2 months, of the 16 subjects analyzed, the mean plasma PAA Cmax was 115.3 (.+-.102.0) .mu.g/mL.
Plasma PAA Cmin on the First Full Day of RAVICTI Dosing
[0129] PK Evaluable Population: all subjects from the safety population with individual concentration-time profiles that allow computation of meaningful PK parameter values. Measurements were taken at hour 0, between 4 and 6 hours, 8 hours, and between 12 and 24 hours after the first dose of the day on day 1 for stable subjects and on day 2 for subjects in HAC.
[0130] For subjects aged 2 months and up to 2 years, of the 10 subjects analyzed, the mean plasma PAA Cmin was 4.197 (.+-.6.434) .mu.g/mL.
[0131] For subjects aged 0 to 2 months, of the 10 subjects analyzed, the mean plasma PAA Cmin was 98.98 (.+-.122.07) .mu.g/mL.
Plasma PAA AUC(0-Last) on the First Full Day of RAVICTI Dosing
[0132] PK Evaluable Population: all subjects from the safety population with individual concentration-time profiles that allow computation of meaningful PK parameter values. Measurements were taken at hour 0, between 4 and 6 hours, 8 hours, and between 12 and 24 hours after the first dose of the day on day 1 for stable subjects and on day 2 for subjects in HAC.
[0133] For subjects aged 2 months and up to 2 years, of the 10 subjects analyzed, the mean plasma PAA AUC(0-last) was 246.126 (.+-.238.547).mu.g*hr/mL.
[0134] For subjects aged 0 to 2 months, of the 16 subjects analyzed, the mean plasma PAA AUC(0-last) was 1321.18 (.+-.1220.52).mu.g*hr/mL.
Plasma PAA Tmax on the First Full Day of RAVICTI Dosing
[0135] PK Evaluable Population: all subjects from the safety population with individual concentration-time profiles that allow computation of meaningful PK parameter values. Measurements were taken at hour 0, between 4 and 6 hours, 8 hours, and between 12 and 24 hours after the first dose of the day on day 1 for stable subjects and on day 2 for subjects in HAC.
[0136] For subjects aged 2 months and up to 2 years, of the 10 subjects analyzed, the mean plasma PAA Tmax was 7.422 (.+-.7.351) hr.
[0137] For subjects aged 0 to 2 months, of the 16 subjects analyzed, the mean plasma PAA Tmax was 9.85 (.+-.9.26) hr.
Plasma Phenylacetylglutamine (PAGN) Cmax on the First Full Day of RAVICTI Dosing
[0138] PK Evaluable Population: all subjects from the safety population with individual concentration-time profiles that allow computation of meaningful PK parameter values. Measurements were taken at hour 0, between 4 and 6 hours, 8 hours, and between 12 and 24 hours after the first dose of the day on day 1 for stable subjects and on day 2 for subjects in HAC.
[0139] For subjects aged 2 months and up to 2 years, of the 10 subjects analyzed, the mean PAGN Cmax was 62.45 (.+-.27.281) .mu.g/mL.
[0140] For subjects aged 0 to 2 months, of the 16 subjects analyzed, the mean PAGN Cmax was 102.1 (.+-.48.6) .mu.g/mL.
Plasma Phenylacetylglutamine (PAGN) Cmin on the First Full Day of RAVICTI Dosing
[0141] PK Evaluable Population: all subjects from the safety population with individual concentration-time profiles that allow computation of meaningful PK parameter values. Measurements were taken at hour 0, between 4 and 6 hours, 8 hours, and between 12 and 24 hours after the first dose of the day on day 1 for stable subjects and on day 2 for subjects in HAC.
[0142] For subjects aged 2 months and up to 2 years, of the 10 subjects analyzed, the mean PAGN Cmin was 20.62 (.+-.14.529) .mu.g/mL.
[0143] For subjects aged 0 to 2 months, of the 13 subjects analyzed, the mean PAGN Cmin was 69.39 (.+-.54.03) .mu.g/mL.
Plasma PAGN AUC(0-Last) on the First Full Day of RAVICTI Dosing
[0144] PK Evaluable Population: all subjects from the safety population with individual concentration-time profiles that allow computation of meaningful PK parameter values. Measurements were taken at hour 0, between 4 and 6 hours, 8 hours, and between 12 and 24 hours after the first dose of the day on day 1 for stable subjects and on day 2 for subjects in HAC.
[0145] For subjects aged 2 months and up to 2 years, of the 10 subjects analyzed, the mean PAGN AUC(0-last) was 583.835 (.+-.285.241).mu.g*hr/mL.
[0146] For subjects aged 0 to 2 months, of the 16 subjects analyzed, the mean PAGN AUC(0-last) was 1384.12 (.+-.1141.03).mu.g*hr/mL.
Plasma PAGN Tmax on the First Full Day of RAVICTI Dosing
[0147] PK Evaluable Population: all subjects from the safety population with individual concentration-time profiles that allow computation of meaningful PK parameter values. Measurements were taken at hour 0, between 4 and 6 hours, 8 hours, and between 12 and 24 hours after the first dose of the day on day 1 for stable subjects and on day 2 for subjects in HAC.
[0148] For subjects aged 2 months and up to 2 years, of the 10 subjects analyzed, the mean PAGN Tmax was 6.573 (.+-.7.181) hr.
[0149] For subjects aged 0 to 2 months, of the 16 subjects analyzed, the mean PAGN Tmax was 11.72 (.+-.8.24) hr.
Urinary PAGN Concentrations on the First Full Day of RAVICTI Dosing
[0150] PK Evaluable Population: all subjects from the safety population with individual concentration-time profiles that allow computation of meaningful PK parameter values. Measurements were taken at hour 0, between 0.5 and 1.5 hours, between 1.5 and 2.5 hours, between 4 and 6 hours, between 7.5 and 8.5 hours, and between 12 and 24 hours after the first dose of the day on day 1 for stable subjects and on day 2 for subjects in HAC.
TABLE-US-00024 TABLE 24 Urinary PAGN Concentrations (.mu.g/mL). RAVICTI: RAVICTI: Age 2 months Age 0 to <2 years to <2 months Number of subjects analyzed 10 16 Hour 0 3273 (.+-.1993); 3530.43 (.+-.3600.4); n = 6 n = 6 0.5 to 1.5 hours 4140 (.+-.4399); 1828 (.+-.2862); n = 6 n = 8 1.5 to 2.5 hours 3145 (.+-.5045); 1746 (.+-.1464); n = 9 n = 9 4 to 6 hours 5202 (.+-.4547); 2260 (.+-.1472); n = 9 n = 11 7.5 to 8.5 hours 3950 (.+-.3068); 3530.43 (.+-.3600.4), n = 8 n = 14 12 to 24 hours 7561 (.+-.6956); 4404 (.+-.3766); n = 9 n = 16
Urinary PAGN Concentrations Up to End of Trial
[0151] PK Evaluable Population: all subjects from the safety population with individual concentration-time profiles that allow computation of meaningful PK parameter values. Measurements were taken at day 7, month 1, month 2, month 3, month 4, month 5, month 6, month 9, month 12, month 15, month 18, month 24, and at the end of the trial.
TABLE-US-00025 TABLE 25 Urinary PAGN Concentrations (.mu.g/mL). RAVICTI: RAVICTI: Age 2 months Age 0 to <2 years to <2 months Number of subjects analyzed 10 16 Day 7 8859 (.+-.10500); 4643 (.+-.2506); n = 8 n = 10 Month 1 6274 (.+-.4802); 4517 (.+-.2485), n = 8 n = 11 Month 2 7386 (.+-.6419); 4116 (.+-.3137); n = 5 n = 12 Month 3 11456 (.+-.14471); 7037 (.+-.4493); n = 6 n = 9 Month 4 21416 (.+-.33695); 2826 (.+-.1543); n = 3 n = 9 Month 5 6129 (.+-.8024); 6973 (.+-.3682); n = 5 n = 8 Month 6 5347 (.+-.3153); 5883 (.+-.3128); n = 3 n = 3 Month 9 9357 (.+-.7286); 7006 (.+-.4289); n = 3 n = 7 Month 12 2580 (.+-.286); 5847 (.+-.2992); n = 3 n = 3 Month 15 6400 (.+-.00000); 3915 (.+-.2584); n = 1 n = 4 Month 18 5250 (.+-.00000); -- n = 1 End of trial 25333 (.+-.21324); 6939 (.+-.6581); n = 3 n = 8
Plasma PAGN Tmax on the First Full Day of RAVICTI Dosing
[0152] PK Evaluable Population: all subjects from the safety population with individual concentration-time profiles that allow computation of meaningful PK parameter values. Measurements were taken at hour 0, between 4 and 6 hours, 8 hours, and between 12 and 24 hours after the first dose of the day on day 1 for stable subjects and on day 2 for subjects in HAC.
[0153] For subjects aged 2 months and up to 2 years, of the 10 subjects analyzed, the mean PAGN Tmax was 6.573 (.+-.7.181) hr.
Urinary PAA Concentrations on the First Full Day of RAVICTI Dosing
[0154] PK Evaluable Population: all subjects from the safety population with individual concentration-time profiles that allow computation of meaningful PK parameter values. Measurements were taken at hour 0, between 0.5 and 1.5 hours, between 1.5 and 2.5 hours, between 4 and 6 hours, between 7.5 and 8.5 hours, and between 12 and 24 hours after the first dose of the day on day 1 for stable subjects and on day 2 for subjects in HAC.
TABLE-US-00026 TABLE 26 Urinary PAA Concentrations (.mu.g/mL). RAVICTI: RAVICTI: Age 2 months Age 0 to <2 years to <2 months Number of subjects analyzed 10 16 Hour 0 18.78 (.+-.27.33); 11.1 (.+-.10.4); n = 3 n = 3 0.5 to 1.5 hours 6.50 (.+-.3.39); 46.2 (.+-.58.6); n = 4 n = 4 1.5 to 2.5 hours 7.29 (.+-.4.10); 62.5 (.+-.42.8), n = 4 n = 4 4 to 6 hours 2.60 (.+-.2.18); 34.6 (.+-.56.2); n = 6 n = 9 7.5 to 8.5 hours 4.48 (.+-.4.38); 22.8 (.+-.25.3); n = 4 n = 11 12 to 24 hours 4.31 (.+-.2.33); 35.2 (.+-.51.0); n = 4 n = 12
Urinary PAA Concentrations Up to End of Trial
[0155] PK Evaluable Population: all subjects from the safety population with individual concentration-time profiles that allow computation of meaningful PK parameter values. Measurements were taken at day 7, month 1, month 2, month 3, month 4, month 5, month 6, month 9, month 12, month 15, month 18, month 24, and at the end of the trial.
TABLE-US-00027 TABLE 27 Urinary PAA Concentrations (.mu.g/mL). RAVICTI: RAVICTI: Age 2 months Age 0 to <2 years to <2 months Number of subjects analyzed 10 16 Day 7 5.82 (.+-.2.21); 23.7 (.+-.31.2); n = 2 n = 9 Month 1 4.44 (.+-.4.61); 14.6 (.+-.17.2); n = 6 n = 8 Month 2 3.69 (.+-.1.82); 12.3 (.+-.13.3); n = 3 n = 8 Month 3 4.65 (.+-.0.49); 14.4 (.+-.10.7); n = 2 n = 7 Month 4 7.14 (.+-.00000); 6.4 (.+-.7.1); n = 1 n = 6 Month 5 3.27 (.+-.1.96); 13.2 (.+-.14.0); n = 2 n = 6 Month 6 1.59 (.+-.00000); 5.5 (.+-.00000); n = 1 n = 1 Month 9 4.10 (.+-.1.65); 11.8 (.+-.8.5); n = 3 n = 7 Month 12 -- 6.0 (.+-.3.8); n = 3 Month 15 2.04 (.+-.00000); 4.9 (.+-.0.3); n = 1 n = 2 Month 18 1.64 (.+-.00000); -- n = 1 End of trial 7.0 (.+-.5.16); 11.6 (.+-.9.0); n = 3 n = 5
TABLE-US-00028 TABLE 28 Serious adverse events. RAVICTI: RAVICTI: Age 2 Months Age 0 Serious Adverse Events to <2 Years to <2 Months Total Subjects Affected Subjects Affected/Exposed 6/10 (60%) 11/16 (68.75%) Number of Deaths (All Causes) 1 0 Number of Deaths Resulting from AEs Investigations (Ammonia Increased) Subjects Affected/Exposed 1/10 (10.00%) 0/16 (0.00%) Occurrences causally related to 0/1 0/0 treatment/all Deaths causally related to 0/0 0/0 treatment/all Cardiac Disorders (Cyanosis) Subjects Affected/Exposed 1/10 (10.00%) 0/16 (0.00%) Occurrences causally related to 0/2 0/0 treatment/all Deaths causally related to 0/0 0/0 treatment/all Blood and lymphatic system disorders (Neutropenia) Subjects Affected/Exposed 0/10 (0.00%) 1/16 (6.25%) Occurrences causally related to 0/0 0/1 treatment/all Deaths causally related to 0/0 0/0 treatment/all Respiratory, Thoracic and Mediastinal Disorders Apnoeic Attack Subjects Affected/Exposed 1/10 (10.00%) 0/16 (0.00%) Occurrences causally related to 0/2 0/0 treatment/all Deaths causally related to 0/0 0/0 treatment/all Asthma Subjects Affected/Exposed 1/10 (10.00%) 0/16 (0.00%) Occurrences causally related to 0/1 0/0 treatment/all Deaths causally related to 0/0 0/0 treatment/all Status asthmaticus Subjects Affected/Exposed 1/10 (10.00%) 0/16 (0.00%) Occurrences causally related to 0/1 0/0 treatment/all Deaths causally related to 0/0 0/0 treatment/all Atelectasis Subjects Affected/Exposed 0/10 (0.00%) 1/16 (6.25%) Occurrences causally related to 0/0 0/1 treatment/all Deaths causally related to 0/0 0/0 treatment/all Nervous System Disorders (Lethargy) Subjects Affected/Exposed 0/10 (0.00%) 1/16 (6.25%) Occurrences causally related to 0/0 0/1 treatment/all Deaths causally related to 0/0 0/0 treatment/all General Disorders and Administration Site Conditions (Pyrexia) Subjects Affected/Exposed 1/10 (10.00%) 0/16 (0.00%) Occurrences causally related to 0/1 0/0 treatment/all Deaths causally related to 0/0 0/0 treatment/all Gastrointestinal Disorders Pneumatosis intestinalis Subjects Affected/Exposed 1/10 (10.00%) 0/16 (0.00%) Occurrences causally related to 0/1 0/0 treatment/all Deaths causally related to 0/1 0/0 treatment/all Vomiting Subjects Affected/Exposed 0/10 (0.00%) 2/16 (12.50%) Occurrences causally related to 0/0 0/2 treatment/all Deaths causally related to 0/0 0/0 treatment/all Metabolism and nutrition disorders Hyperammonaemia Subjects Affected/Exposed 3/10 (30.00%) 5/16 (31.25%) Occurrences causally related to 0/7 0/7 treatment/all Deaths causally related to 0/0 0/0 treatment/all Dehydration Subjects Affected/Exposed 0/10 (0.00%) 1/16 (6.25%) Occurrences causally related to 0/0 0/1 treatment/all Deaths causally related to 0/0 0/0 treatment/all Feeding Disorder Subjects Affected/Exposed 0/10 (0.00%) 1/16 (6.25%) Occurrences causally related to 0/0 0/1 treatment/all Deaths causally related to 0/0 0/0 treatment/all Infections and Infestations Croup infectious Subjects Affected/Exposed 1/10 (10.00%) 1/16 (6.25%) Occurrences causally related to 0/1 0/1 treatment/all Deaths causally related to 0/0 0/0 treatment/all Gastroenteritis Subjects Affected/Exposed 1/10 (10.00%) 0/16 (0.00%) Occurrences causally related to 0/1 0/0 treatment/all Deaths causally related to 0/0 0/0 treatment/all Urinary tract infection Subjects Affected/Exposed 1/10 (10.00%) 1/16 (6.25%) Occurrences causally related to 0/1 0/1 treatment/all Deaths causally related to 0/0 0/0 treatment/all Viral infection Subjects Affected/Exposed 2/10 (20.00%) 1/16 (6.25%) Occurrences causally related to 0/2 0/1 treatment/all Deaths causally related to 0/0 0/0 treatment/all Influenza Subjects Affected/Exposed 1/10 (10.00%) 0/16 (0.00%) Occurrences causally related to 0/1 0/0 treatment/all Deaths causally related to 0/0 0/0 treatment/all Peritonitis Subjects Affected/Exposed 1/10 (10.00%) 0/16 (0.00%) Occurrences causally related to 0/1 0/0 treatment/all Deaths causally related to 0/1 0/0 treatment/all Rhinovirus infection Subjects Affected/Exposed 1/10 (10.00%) 0/16 (0.00%) Occurrences causally related to 0/1 0/0 treatment/all Deaths causally related to 0/0 0/0 treatment/all Viral upper respiratory tract infection Subjects Affected/Exposed 1/10 (10.00%) 0/16 (0.00%) Occurrences causally related to 0/1 0/0 treatment/all Deaths causally related to 0/0 0/0 treatment/all Bacteraemia Subjects Affected/Exposed 0/10 (0.00%) 1/16 (6.25%) Occurrences causally related to 0/0 0/1 treatment/all Deaths causally related to 0/0 0/0 treatment/all Cellulitis Subjects Affected/Exposed 0/10 (0.00%) 1/16 (6.25%) Occurrences causally related to 0/0 0/1 treatment/all Deaths causally related to 0/0 0/0 treatment/all Device related infection Subjects Affected/Exposed 0/10 (0.00%) 1/16 (6.25%) Occurrences causally related to 0/0 0/1 treatment/all Deaths causally related to 0/0 0/0 treatment/all Medical device site infection Subjects Affected/Exposed 0/10 (0.00%) 1/16 (6.25%) Occurrences causally related to 0/0 0/1 treatment/all Deaths causally related to 0/0 0/0 treatment/all Meningitis bacterial Subjects Affected/Exposed 0/10 (0.00%) 1/16 (6.25%) Occurrences causally related to 0/0 0/1 treatment/all Deaths causally related to 0/0 0/0 treatment/all Respiratory syncytial virus infection Subjects Affected/Exposed 0/10 (0.00%) 1/16 (6.25%) Occurrences causally related to 0/0 0/1 treatment/all Deaths causally related to 0/0 0/0 treatment/all Tracheitis Subjects Affected/Exposed 0/10 (0.00%) 1/16 (6.25%) Occurrences causally related to 0/0 0/1 treatment/all Deaths causally related to 0/0 0/0 treatment/all Upper respiratory tract infection Subjects Affected/Exposed 0/10 (0.00%) 1/16 (6.25%) Occurrences causally related to 0/0 0/1 treatment/all Deaths causally related to 0/0 0/0 treatment/all
TABLE-US-00029 TABLE 29 Non-serious adverse events. RAVICTI: RAVICTI: Age 2 Months Age 0 Non-Serious Adverse Events to <2 Years to <2 Months Total Subjects Affected Subjects Affected/Exposed 8/10 (80.00%) 16/16 (100.00%) Vascular disorders (Venous thrombosis limb) Subjects Affected/Exposed 1/10 (10.00%) 0/16 (0.00%) Occurrences (all) 2 0 Immune System Disorders (Seasonal allergy) Subjects Affected/Exposed 1/10 (10.00%) 0/16 (0.00%) Occurrences (all) 1 0 General disorders and administration site conditions Pyrexia Subjects Affected/Exposed 2/10 (20.00%) 2/16 (12.50%) Occurrences (all) 2 3 Catheter site rash Subjects Affected/Exposed 0/10 (0.00%) 1/16 (6.25%) Occurrences (all) 0 1 Device occlusion Subjects Affected/Exposed 0/10 (0.00%) 1/16 (6.25%) Occurrences (all) 0 1 Drug withdrawal syndrome Subjects Affected/Exposed 0/10 (0.00%) 1/16 (6.25%) Occurrences (all) 0 1 Medical device site haemorrhage Subjects Affected/Exposed 0/10 (0.00%) 1/16 (6.25%) Occurrences (all) 0 1 Psychiatric disorders Agitation Subjects Affected/Exposed 0/10 (0.00%) 1/16 (6.25%) Occurrences (all) 0 1 Irritability Subjects Affected/Exposed 0/10 (0.00%) 1/16 (6.25%) Occurrences (all) 0 1 Injury, poisoning and procedural complications Stoma site reaction Subjects Affected/Exposed 1/10 (10.00%) 1/16 (6.25%) Occurrences (all) 1 1 Tibia fracture Subjects Affected/Exposed 1/10 (10.00%) 0/16 (0.00%) Occurrences (all) 1 0 Arthropod bite Subjects Affected/Exposed 0/10 (0.00%) 1/16 (6.25%) Occurrences (all) 0 1 Investigations Amino acid level decreased Subjects Affected/Exposed 1/10 (10.00%) 1/16 (6.25%) Occurrences (all) 1 1 Ammonia increased Subjects Affected/Exposed 1/10 (10.00%) 1/16 (6.25%) Occurrences (all) 1 1 Carbon dioxide decreased Subjects Affected/Exposed 1/10 (10.00%) 1/16 (6.25%) Occurrences (all) 1 2 Hepatic enzyme increased Subjects Affected/Exposed 0/10 (0.00%) 2/16 (12.50%) Occurrences (all) 0 2 Alanine aminotransferase increased Subjects Affected/Exposed 0/10 (0.00%) 1/16 (6.25%) Occurrences (all) 0 1 Amino acid level increased Subjects Affected/Exposed 0/10 (0.00%) 1/16 (6.25%) Occurrences (all) 0 2 Anion gap increased Subjects Affected/Exposed 0/10 (0.00%) 1/16 (6.25%) Occurrences (all) 0 1 Aspartate aminotransferase increased Subjects Affected/Exposed 0/10 (0.00%) 1/16 (6.25%) Occurrences (all) 0 1 Blood bicarbonate decreased Subjects Affected/Exposed 0/10 (0.00%) 1/16 (6.25%) Occurrences (all) 0 1 Blood urea decreased Subjects Affected/Exposed 0/10 (0.00%) 1/16 (6.25%) Occurrences (all) 0 1 Body height below normal Subjects Affected/Exposed 0/10 (0.00%) 1/16 (6.25%) Occurrences (all) 0 1 Gamma-glutamyltransferase increased Subjects Affected/Exposed 0/10 (0.00%) 1/16 (6.25%) Occurrences (all) 0 1 Platelet count increased Subjects Affected/Exposed 0/10 (0.00%) 1/16 (6.25%) Occurrences (all) 0 1 Transaminases increased Subjects Affected/Exposed 0/10 (0.00%) 1/16 (6.25%) Occurrences (all) 0 1 Weight decreased Subjects Affected/Exposed 0/10 (0.00%) 1/16 (6.25%) Occurrences (all) 0 1 Cardiac disorders (Tachycardia) Subjects Affected/Exposed 0/10 (0.00%) 1/16 (6.25%) Occurrences (all) 0 1 Congenital, familial and genetic disorders Dacryostenosis congenital Subjects Affected/Exposed 1/10 (10.00%) 0/16 (0.00%) Occurrences (all) 1 0 Plagiocephaly Subjects Affected/Exposed 0/10 (0.00%) 2/16 (12.50%) Occurrences (all) 0 2 Blood and lymphatic system disorders Anaemia Subjects Affected/Exposed 1/10 (10.00%) 3/16 (18.75%) Occurrences (all) 1 3 Neutropenia Subjects Affected/Exposed 0/10 (0.00%) 1/16 (6.25%) Occurrences (all) 0 1 Thrombocytopenia Subjects Affected/Exposed 0/10 (0.00%) 2/16 (12.50%) Occurrences (all) 0 2 Thrombocytosis Subjects Affected/Exposed 0/10 (0.00%) 2/16 (12.50%) Occurrences (all) 0 2 Leukocytosis Subjects Affected/Exposed 0/10 (0.00%) 1/16 (6.25%) Occurrences (all) 0 1 Lymphocytosis Subjects Affected/Exposed 0/10 (0.00%) 1/16 (6.25%) Occurrences (all) 0 1 Microcytic anaemia Subjects Affected/Exposed 0/10 (0.00%) 1/16 (6.25%) Occurrences (all) 0 1 Respiratory, thoracic and mediastinal disorders Cough Subjects Affected/Exposed 2/10 (20.00%) 4/16 (25.00%) Occurrences (all) 2 5 Rhinorrhoea Subjects Affected/Exposed 1/10 (10.00%) 0/16 (0.00%) Occurrences (all) 1 0 Apnoea Subjects Affected/Exposed 1/10 (10.00%) 0/16 (0.00%) Occurrences (all) 1 0 Nasal congestion Subjects Affected/Exposed 1/10 (10.00%) 2/16 (12.50%) Occurrences (all) 1 2 Respiratory disorder Subjects Affected/Exposed 1/10 (10.00%) 0/16 (0.00%) Occurrences (all) 1 0 Oropharyngeal pain Subjects Affected/Exposed 0/10 (0.00%) 2/16 (12.50%) Occurrences (all) 0 2 Pneumothorax Subjects Affected/Exposed 0/10 (0.00%) 1/16 (6.25%) Occurrences (all) 0 1 Tachypnoea Subjects Affected/Exposed 0/10 (0.00%) 1/16 (6.25%) Occurrences (all) 0 1 Use of accessory respiratory muscles Subjects Affected/Exposed 0/10 (0.00%) 1/16 (6.25%) Occurrences (all) 0 1 Nervous system disorders Gross motor delay Subjects Affected/Exposed 1/10 (10.00%) 0/16 (0.00%) Occurrences (all) 1 0 Lethargy Subjects Affected/Exposed 0/10 (0.00%) 1/16 (6.25%) Occurrences (all) 0 1 Tremor Subjects Affected/Exposed 0/10 (0.00%) 1/16 (6.25%) Occurrences (all) 0 1 Eye disorders Eye discharge Subjects Affected/Exposed 0/10 (0.00%) 1/16 (6.25%) Occurrences (all) 0 1 Ocular hyperaemia Subjects Affected/Exposed 0/10 (0.00%) 1/16 (6.25%) Occurrences (all) 0 1 Ear and labyrinth disorders (Excessive cerumen production) Subjects Affected/Exposed 1/10 (10.00%) 0/16 (0.00%) Occurrences (all) 1 0 Gastrointestinal disorders Diarrhoea Subjects Affected/Exposed 1/10 (10.00%) 5/16 (31.25%) Occurrences (all) 1 6 Vomiting Subjects Affected/Exposed 4/10 (40.00%) 5/16 (31.25%) Occurrences (all) 5 12 Teething Subjects Affected/Exposed 1/10 (10.00%) 3/16 (18.75%) Occurrences (all) 1 3 Constipation Subjects Affected/Exposed 2/10 (20.00%) 2/16 (12.50%) Occurrences (all) 2 2 Gastrooesophageal reflux disease Subjects Affected/Exposed 0/10 (0.00%) 6/16 (37.50%) Occurrences (all) 0 6 Flatulence Subjects Affected/Exposed 0/10 (0.00%) 3/16 (18.75%) Occurrences (all) 0 3 Dysphagia Subjects Affected/Exposed 0/10 (0.00%) 1/16 (6.25%) Occurrences (all) 0 1 Post-tussive vomiting Subjects Affected/Exposed 0/10 (0.00%) 1/16 (6.25%) Occurrences (all) 0 1 Hepatobiliary disorders (Hepatic calcification) Subjects Affected/Exposed 0/10 (0.00%) 1/16 (6.25%) Occurrences (all) 0 1 Renal and urinary disorders Vesicoureteric reflux Subjects Affected/Exposed 1/10 (10.00%) 0/16 (0.00%) Occurrences (all) 1 0 Nephrolithiasis Subjects Affected/Exposed 0/10 (0.00%) 1/16 (6.25%) Occurrences (all) 0 1 Skin and subcutaneous tissue disorders Nail ridging Subjects Affected/Exposed 1/10 (10.00%) 0/16 (0.00%) Occurrences (all) 1 0 Rash Subjects Affected/Exposed 2/10 (20.00%) 5/16 (31.25%) Occurrences (all) 3 6 Dermatitis diaper Subjects Affected/Exposed 1/10 (10.00%) 6/16 (37.50%) Occurrences (all) 1 6 Eczema Subjects Affected/Exposed 1/10 (10.00%) 1/16 (6.25%) Occurrences (all) 1 2 Red man syndrome Subjects Affected/Exposed 0/10 (0.00%) 1/16 (6.25%) Occurrences (all) 0 1 Seborrhoeic dermatitis Subjects Affected/Exposed 1/10 (10.00%) 1/16 (6.25%) Occurrences (all) 1 2 Musculoskeletal and connective tissue Disorders (Torticollis) Subjects Affected/Exposed 0/10 (0.00%) 1/16 (6.25%) Occurrences (all) 0 1 Metabolism and nutrition disorders Metabolic acidosis Subjects Affected/Exposed 2/10 (20.00%) 2/16 (12.50%) Occurrences (all) 2 2 Hypophagia Subjects Affected/Exposed 2/10 (20.00%) 1/16 (6.25%) Occurrences (all) 3 1 Hyperammonaemia Subjects Affected/Exposed 0/10 (0.00%) 2/16 (12.50%) Occurrences (all) 0 3 Dehydration Subjects Affected/Exposed 0/10 (0.00%) 2/16 (12.50%) Occurrences (all) 0 4 Decreased appetite Subjects Affected/Exposed 0/10 (0.00%) 1/16 (6.25%) Occurrences (all) 0 2 Feeding disorder of infancy or early childhood Subjects Affected/Exposed 0/10 (0.00%) 1/16 (6.25%) Occurrences (all) 0 1
Protein deficiency Subjects Affected/Exposed 0/10 (0.00%) 1/16 (6.25%) Occurrences (all) 0 2 Infections and infestations Gastroenteritis Subjects Affected/Exposed 1/10 (10.00%) 1/16 (6.25%) Occurrences (all) 2 1 Upper respiratory tract infection Subjects Affected/Exposed 4/10 (40.00%) 5/16 (31.25%) Occurrences (all) 6 7 Urinary tract infection Subjects Affected/Exposed 1/10 (10.00%) 2/16 (12.50%) Occurrences (all) 1 2 Viral infection Subjects Affected/Exposed 1/10 (10.00%) 1/16 (6.25%) Occurrences (all) 1 1 Nasopharyngitis Subjects Affected/Exposed 2/10 (20.00%) .sup. 4/16 (25.00% Occurrences (all) 2 7 Croup infectious Subjects Affected/Exposed 1/10 (10.00%) 1/16 (6.25%) Occurrences (all) 1 2 Otitis media Subjects Affected/Exposed 2/10 (20.00%) 1/16 (6.25%) Occurrences (all) 2 1 Conjunctivitis Subjects Affected/Exposed 1/10 (10.00%) 0/16 (0.00%) Occurrences (all) 1 0 Pharyngitis Subjects Affected/Exposed 1/10 (10.00%) 0/16 (0.00%) Occurrences (all) 1 0 Pneumonia Subjects Affected/Exposed 1/10 (10.00%) 0/16 (0.00%) Occurrences (all) 1 0 Sinusitis Subjects Affected/Exposed 1/10 (10.00%) 1/16 (6.25%) Occurrences (all) 2 1 Ear infection Subjects Affected/Exposed 0/10 (0.00%) 3/16 (18.75%) Occurrences (all) 0 3 Oral candidiasis Subjects Affected/Exposed 0/10 (0.00%) 2/16 (12.50%) Occurrences (all) 0 2 Respiratory syncytial virus infection Subjects Affected/Exposed 0/10 (0.00%) 1/16 (6.25%) Occurrences (all) 0 1 Angular cheilitis Subjects Affected/Exposed 0/10 (0.00%) 1/16 (6.25%) Occurrences (all) 0 2 Candida infection Subjects Affected/Exposed 0/10 (0.00%) 1/16 (6.25%) Occurrences (all) 0 2 Gastrointestinal viral infection Subjects Affected/Exposed 0/10 (0.00%) 1/16 (6.25%) Occurrences (all) 0 1 Lower respiratory tract infection Subjects Affected/Exposed 0/10 (0.00%) 1/16 (6.25%) Occurrences (all) 0 1 Otitis media acute Subjects Affected/Exposed 0/10 (0.00%) 1/16 (6.25%) Occurrences (all) 0 1 Rhinovirus infection Subjects Affected/Exposed 0/10 (0.00%) 1/16 (6.25%) Occurrences (all) 0 1
* * * * *
D00000
D00001
D00002
D00003
D00004
D00005
D00006
D00007
XML
uspto.report is an independent third-party trademark research tool that is not affiliated, endorsed, or sponsored by the United States Patent and Trademark Office (USPTO) or any other governmental organization. The information provided by uspto.report is based on publicly available data at the time of writing and is intended for informational purposes only.
While we strive to provide accurate and up-to-date information, we do not guarantee the accuracy, completeness, reliability, or suitability of the information displayed on this site. The use of this site is at your own risk. Any reliance you place on such information is therefore strictly at your own risk.
All official trademark data, including owner information, should be verified by visiting the official USPTO website at www.uspto.gov. This site is not intended to replace professional legal advice and should not be used as a substitute for consulting with a legal professional who is knowledgeable about trademark law.