Method And Apparatus For Reducing Myopiagenic Effect Of Electronic Displays
Fertik; Michael Benjamin Selkowe ; et al.
U.S. patent application number 16/070765 was filed with the patent office on 2019-02-21 for method and apparatus for reducing myopiagenic effect of electronic displays. The applicant listed for this patent is WAVESHIFT LLC. Invention is credited to Thomas W. Chalberg, Jr., Michael Benjamin Selkowe Fertik, David William Olsen.
| Application Number | 20190057673 16/070765 |
| Document ID | / |
| Family ID | 59314567 |
| Filed Date | 2019-02-21 |


View All Diagrams
| United States Patent Application | 20190057673 |
| Kind Code | A1 |
| Fertik; Michael Benjamin Selkowe ; et al. | February 21, 2019 |
METHOD AND APPARATUS FOR REDUCING MYOPIAGENIC EFFECT OF ELECTRONIC DISPLAYS
Abstract
A method and an apparatus for modifying initial image data for a frame based on a relative level of stimulation of cones in a viewer's eye are disclosed, wherein the modified image data results in reduced contrast between neighboring cones in the viewer's eye.
| Inventors: | Fertik; Michael Benjamin Selkowe; (Palo Alto, CA) ; Chalberg, Jr.; Thomas W.; (Menlo Park, CA) ; Olsen; David William; (Fremont, CA) | ||||||||||
| Applicant: |
|
||||||||||
|---|---|---|---|---|---|---|---|---|---|---|---|
| Family ID: | 59314567 | ||||||||||
| Appl. No.: | 16/070765 | ||||||||||
| Filed: | January 18, 2017 | ||||||||||
| PCT Filed: | January 18, 2017 | ||||||||||
| PCT NO: | PCT/US2017/013969 | ||||||||||
| 371 Date: | July 17, 2018 |
Related U.S. Patent Documents
| Application Number | Filing Date | Patent Number | ||
|---|---|---|---|---|
| 62279954 | Jan 18, 2016 | |||
| Current U.S. Class: | 1/1 |
| Current CPC Class: | G06T 7/0014 20130101; G06T 2207/30041 20130101; G09G 2380/14 20130101; G09G 2354/00 20130101; G09G 2320/0271 20130101; G06F 3/04847 20130101; G09G 2320/0242 20130101; G06F 3/0483 20130101; G09G 5/02 20130101; G09G 2320/066 20130101; G09G 2320/08 20130101; G09G 2320/0693 20130101; G06F 3/04842 20130101; G09G 2340/06 20130101; G09G 2380/08 20130101; H04N 9/646 20130101; G09G 2320/0666 20130101 |
| International Class: | G09G 5/02 20060101 G09G005/02 |
Claims
1. A method, comprising: receiving, by a processing device, initial image data for a frame f.sup.i comprising a plurality of pixels, wherein data for each pixel in the frame f.sup.i is received sequentially over a respective clock cycle of the processing device and comprises a value, r.sup.i, for a first color, a value, g.sup.i, for a second color, and a value, b.sup.i, for a third color; producing, by the processing device, modified image data for a frame f.sup.m corresponding to the frame f.sup.i, by concurrently performing operations of a sequence of operations on data for a subset of the pixels, wherein a different operation of the sequence is performed per clock cycle on data for a different pixel of the subset, and the operations of the sequence are performed sequentially on data for each pixel over corresponding sequential clock cycles, wherein the operations of the sequence comprise determining, for each pixel in the subset, a relative level of stimulation of cones in a viewer's eye based, at least, on the value, r.sup.i, for the first color and the value, g.sup.i, for the second color; and modifying, based, at least, on the determined relative level of stimulation of cones in a viewer's eye by the pixel, the initial image data for the frame f.sup.i, the modified image data for the frame f.sup.m comprising a value, r.sup.m, for the first color and a value, g.sup.m, for the second color for the pixel; and transmitting, by the processing device, the modified image data for the frame f.sup.m to an electronic display, wherein data for each pixel in the frame f.sup.m is transmitted sequentially over a respective clock cycle.
2. The method of claim 1, wherein the values r.sup.i, g.sup.i, and b.sup.i included in the frame f.sup.i are received in decimal format, and the method further comprises converting the received values r.sup.i, g.sup.i, and b.sup.i to integer format prior to performing the operations of the sequence.
3. The method of claim 1, wherein there are as many operations in the sequence as pixels in the subset.
4. The method of claim 3, wherein there are fewer pixels in the subset than in the frame f.sup.i.
5. The method of claim 1, wherein the operations of the sequence are performed on data of the subset of the pixels in the frame f.sup.i while receiving image data for later ones from among the pixels in the frame f.sup.i, and transmitting modified image data for earlier ones of the pixels in the frame f.sup.m.
6. The method of claim 1, wherein determining a relative level of stimulation of cones comprises determining a relative level of stimulation of neighboring cones in the viewer's eye.
7. The method of claim 1, wherein, when viewed on the electronic display, f.sup.m results in reduced contrast between neighboring cones in a viewer's eye compared to f.sup.i.
8. The method of claim 1, wherein determining the relative level of stimulation comprises comparing the value, r.sup.i, for the first color to the value, g.sup.i, for the second color.
9. The method of claim 8, wherein, for at least some of the plurality of pixels, r.sup.m/g.sup.m<r.sup.i/g.sup.i when g.sup.i.ltoreq.r.sup.i.
10. The method of claim 9, wherein r.sup.m/g.sup.m=r.sup.i/g.sup.i when g.sup.i>r.sup.i.
11. The method of claim 9, wherein, when g.sup.i.ltoreq.r.sup.i, r.sup.m/g.sup.m=ar.sup.i/g.sup.i, where 0<a<1 and the value of a depends on a number of frames in of a sequence of frames preceding f.sup.i.
12. The method of claim 11, wherein a increases as the number of frames in the sequence of frames preceding f.sup.i increases.
13. The method of claim 1, wherein f.sup.m comprises at least one pixel for which r.sup.m=r.sup.i and g.sup.m=g.sup.i.
14. The method of claim 13, wherein, for the pixel in f.sup.m for which r.sup.m=r.sup.i and g.sup.m=g.sup.i, g.sup.i>r.sup.i.
15. The method of claim 1, wherein b.sup.m.noteq.b.sup.i for at least one pixel in f.sup.m.
16. The method of claim 1, wherein determining the relative level of stimulation comprises determining coordinates in a universal chromaticity space representative of the color of the first pixel.
17. The method of claim 16, wherein the chromaticity space is the 1931 x, y CIE chromaticity space or the CIE XYZ chromaticity space, or the 1964 or 1976 CIE chromaticity space.
18. The method of claim 1, wherein the relative level of stimulation is based on a relative spectral sensitivity of L-cones and M-cones in the viewer's eye.
19. The method of claim 18, wherein the relative level of stimulation is further based on a relative spectral sensitivity of S-cones in the viewer's eye.
20. The method of claim 18, wherein the relative level of stimulation is further based on a relative proportion of L-cones to M-cones in the viewer's eye.
21. The method of claim 18, wherein the relative level of stimulation is further based on a pixel/cone ratio of the frame when viewed.
22. The method of claim 1, wherein the first, second, and third colors are red, green, and blue, respectively.
23. The method of claim 1, wherein the first, second, and third colors are cyan, magenta, and yellow.
24. The method of claim 1, wherein the relative level of stimulation is determined based on L, M, and S values determined based on at least some of the pixel's in f.sup.i.
25. An apparatus, comprising: an electronic processing module comprising a receiver device, a transmitter device and a processing device coupled between the receiver device and the transmitter device, wherein the receiver device is configured to receive initial image data for a frame f.sup.i comprising a plurality of pixels, wherein data for each pixel in the frame f.sup.i comprises a value, r.sup.i, for a first color, a value, g.sup.i, for a second color, and a value, b.sup.i, for a third color, and transmit data for each pixel in the frame f.sup.i to the processing device, sequentially over a respective clock cycle of the processing device; the processing device configured to produce modified image data for a frame f.sup.m corresponding to the frame f.sup.i, by concurrently performing operations of a sequence of operations on data for a subset of the pixels, wherein a different operation of the sequence is performed per clock cycle on data for a different pixel of the subset, and the operations of the sequence are performed sequentially on data for each pixel over corresponding sequential clock cycles, wherein the operations of the sequence comprise determine, for each pixel in the subset, a relative level of stimulation of cones in a viewer's eye based, at least, on the value, r.sup.i, for the first color and the value, g.sup.i, for the second color; and modify, based, at least, on the determined relative level of stimulation of cones in a viewer's eye by the pixel, the initial image data for the frame f.sup.i, the modified image data for the frame f.sup.m comprising a value, r.sup.m, for the first color and a value, g.sup.m, for the second color for the pixel; and the transmitter device configured to receive the modified image data for the frame f.sup.m from the processing device, wherein data for each pixel in the frame f.sup.m is received sequentially over a respective clock cycle, and transmit the modified image data for the frame f.sup.m to an electronic display.
26. The apparatus of claim 25, wherein the values r.sup.i, g.sup.i, and b.sup.i included in the frame f.sup.i are received by the receiver device in decimal format, and either the receiver device is configured to convert the values r.sup.i, g.sup.i, and b.sup.i to integer format prior to transmission to the processing device, or the processing device is configured to convert the values r.sup.i, g.sup.i, and b.sup.i to integer format prior to performing the operations of the sequence.
27. The apparatus of claim 25, wherein the processing device is an FPGA device.
28. The apparatus of claim 27, wherein the FPGA device is configured to perform the sequence of operations that has as many operations as pixels in the subset.
29. The apparatus of claim 28, wherein there are fewer pixels in the subset than in the frame f.sup.i.
30. The apparatus of claim 25, wherein the processing device is configured to perform the operations of the sequence on data of the subset of the pixels in the frame f while receiving from the receiver device image data for later ones from among the pixels in the frame f.sup.i, and transmitting to the transmitter device modified image data for earlier ones of the pixels in the frame f.sup.m.
31. The apparatus of claim 25, wherein the processing device is configured to modify the received image data based on a relative level of stimulation of neighboring cones in the viewer's eye.
32. The apparatus of claim 25, wherein the processing device is configured to determine the relative level of stimulation based, at least, on the corresponding values of r.sup.i and g.sup.i and b.sup.i for at least some of the plurality of pixels in f.sup.i.
33. The apparatus of claim 25, further comprising an electronic display panel configured to receive the modified image data from the output and display the sequence of frames based on the modified image data.
34. The apparatus of claim 25, wherein the electronic display is a display selected from the group comprising a liquid crystal display, a digital micromirror display, an organic light emitting diode display, a projection display, quantum dot display, and a cathode ray tube display.
35. The apparatus of claim 25, wherein the processing device is an ASIC device.
36. The apparatus of claim 25, wherein the receiver device, the processing device and the transmitter device are integrated as an ASIC device.
37. The apparatus of claim 25, wherein the apparatus is a semiconductor chip or a circuit board comprising a semiconductor chip.
38. A set top box comprising the apparatus of claim 25.
39. The set top box of claim 38 configured to receive the input from another set top box, a DVD player, a video game console, or an internet connection.
40. A flat panel display comprising the apparatus of claim 25.
41. A television comprising the apparatus of claim 25.
42. A mobile device comprising the apparatus of claim 25.
43. A wearable computer comprising the apparatus of claim 25.
44. A projection display comprising the apparatus of claim 25.
45. A video game console comprising the apparatus of claim 25.
46. A dongle comprising the apparatus of claim 25.
Description
CROSS-REFERENCE TO RELATED APPLICATIONS
[0001] This application claims benefit of the Provisional Application No. 62/279,954, entitled "Evaluating and reducing myopiagenic effects of electronic displays," filed on Jan. 18, 2016. The entire content of this priority application is hereby incorporated by reference.
BACKGROUND
[0002] Electronic displays are ubiquitous in today's world. For example, mobile devices such as smartphones and tablet computers commonly use a liquid crystal display (LCD) or an organic light emitting diode (OLED) display. LCDs and OLED displays are both examples of flat panel displays, and are also used in desktop monitors, TVs, and automotive and aircraft displays.
[0003] Many color displays, including many LCD and OLED displays, spatially synthesize color. In other words, each pixel is composed of three sub-pixels that provide a different color. For instance, each pixel can have a red, green, or blue sub-pixel, or a cyan, magenta, or yellow sub-pixel. The color of the pixel, as perceived by a viewer, depends upon the relative proportion of light from each of the three sub-pixels.
[0004] Color information for a display is commonly encoded as an RGB signal, whereby the signal is composed of a value for each of the red, green, and blue components of a pixel color for each signal in each frame. A so-called gamma correction is used to convert the signal into an intensity or voltage to correct for inherent non-linearity in a display, such that the intended color is reproduced by the display.
[0005] In the field of color science when applied to information display, colors are often specified by their chromaticity, which is an objective specification of a color regardless of its luminance. Chromaticity consists of two independent parameters, often specified as hue (h) and saturation (s). Color spaces (e.g., the 1931 CIE XYZ color space or the CIELUV color space) are commonly used to quantify chromaticity. For instance, when expressed as a coordinate in a color space, a pixel's hue is the angular component of the coordinate relative to the display's white point, and its saturation is the radial component. Once color coordinates are specified in one color space, it is possible to transform them into other color spaces.
[0006] Humans perceive color in response to signals from photoreceptor cells called cone cells, or simply cones. Cones are present throughout the central and peripheral retina, being most densely packed in the fovea centralis, a 0.3 mm diameter rod-free area in the central macula. Moving away from the fovea centralis, cones reduce in number towards the periphery of the retina. There are about six to seven million cones in a human eye.
[0007] Humans normally have three types of cones, each having a response curve peaking at a different wavelength in the visible light spectrum. FIG. 1A shows the response curves for each cone type. Here, the horizontal axis shows light wavelength (in nm) and the vertical scale shows the responsivity. In this plot, the curves have been scaled so that the area under each cone is equal, and adds to 10 on a linear scale. The first type of cone responds the most to light of long wavelengths, peaking at about 560 nm, and is designated L for long. The spectral response curve for L cones is shown as curve A. The second type responds the most to light of medium-wavelength, peaking at 530 nm, and is abbreviated M for medium. This response curve is curve B in FIG. 1A. The third type responds the most to short-wavelength light, peaking at 420 nm, and is designated S for short, shown as curve C. The three types have typical peak wavelengths near 564-580 nm, 534-545 nm, and 420-440 nm, respectively; the peak and absorption spectrum varies among individuals. The difference in the signals received from the three cone types allows the brain to perceive a continuous range of colors, through the opponent process of color vision.
[0008] In general, the relative number of each cone type can vary. Whereas S-cones usually represent between 5-7% of total cones, the ratio of L and M cones can vary widely among individuals, from as low as 5% L/95% M to as high as 95% L/5% M. The ratio of L and M cones also can vary, on average, between members of difference races, with Asians believed to average close to 50/50 L:M and Caucasians believed to average close to 63% L cones (see, for example, U.S. Pat. No. 8,951,729). Color vision disorders also impact the proportion of L and M cones; protonopes have 0% L cones and deuteranopes have 0% M cones. Referring to FIG. 1B, cones are generally arranged in a mosaic on the retina. In this example, L and M cones are distributed in approximately equal numbers, with fewer S cones. Accordingly, when viewing an image on an electronic display, the response of the human eye to a particular pixel will depend on the color of that pixel and where on the retina the pixel is imaged.
SUMMARY
[0009] It is known in the art that exposure to outdoor sunlight is not a risk factor for myopia (see, for example Jones, L. A. et al. Invest. Ophthalmol. Vis. Sci. 48, 3524-3532 (2007)). Sunlight is considered an equal energy (EE) illuminant because it does not trigger the opponent color visual system (i.e., sunlight is neither red nor green, and neither blue nor yellow). The EE illuminant represents a `white point` in the CIE 1931 color space diagram, which is shown in FIG. 1C. As opposed to visual exposure to EE illumination like sunlight, it was recently described that excessive stimulation of L cones relative to M cones can lead to asymmetric growth in a developing human eye, leading to myopia (see, for example, patent application WO 2012/145672 A1). This has significant implications for electronic displays, which are conventionally optimized to display images with deeply saturated colors, including reds, and high contrast. It is believed that the myopiagenic effect of displays may be reduced by reducing the saturation of red-hued pixels in an image, or reducing the relative amount of red to green in a pixel's color, particularly in those pixels where the amount of red exceeds the amount of green.
[0010] A more recent discovery stipulates that overall contrast between neighboring cones stimulates asymmetric growth of the eye, leading to myopia. This could be, for example, excessive stimulation of L cones over M cones, but is not limited to that type of contrast alone. The discovery further stipulates that difference in stimulation in neighboring cones is critical, as opposed to the overall ratio of L vs. M over the entire retina.
[0011] The instant invention builds upon both recent biological discoveries to describe new methods, algorithms, and devices that can determine the level of myopiagenicity and reduce it, relative to current methods familiar to skilled artisans. Accordingly, among other aspects, the present disclosure features ways to characterize and/or reduce myopiagenic effects of displays while minimizing the viewer's perception of the correction on the image, and characterize and/or reduce contrast between neighboring cones in the retina.
[0012] In general, the myopiagenic reduced techniques described may be implemented in a variety of ways. For example, the techniques may be implemented in TV sets via a stand-alone set top box, or via hardware (e.g., as an image processing chip) and/or software integration with the TV set itself, the cable box, or other product that interfaces with a TV set. In addition to TV sets, the techniques may be implemented in computer monitors, mobile devices, automobile display, aviation displays, wearable displays, and other applications using color displays.
[0013] In some embodiments, the color scheme of content can be modified before delivery to an end user so that the end user gets the benefit of the myopiagenia reduction without the use of any additional hardware or software. For example, myopiagenia reduced content can be delivered to the end user via the internet or from a cable provider.
[0014] Techniques for quantifying the myopiagenic effect of a stimulus are also disclosed. Such techniques allow for comparison of different myopiagenia reducing algorithms on a stimulus. Implementations also account for both chromatic (e.g., how much red is in an image) and spatial (e.g., how much high-contrast high spatial frequency content there exists in an image) contributions of a stimulus to myopiagenia.
[0015] Various aspects of the invention are summarized below.
[0016] In general, in a first aspect, the invention features a method that includes receiving, by a processing device, initial image data for a frame f.sup.i including a plurality of pixels, where data for each pixel in the frame f.sup.i is received sequentially over a respective clock cycle of the processing device and includes a value, r.sup.i, for a first color, a value, g.sup.i, for a second color, and a value, b.sup.i, for a third color; producing, by the processing device, modified image data for a frame f.sup.m corresponding to the frame f.sup.i, by concurrently performing operations of a sequence of operations on data for a subset of the pixels, where a different operation of the sequence is performed per clock cycle on data for a different pixel of the subset, and the operations of the sequence are performed sequentially on data for each pixel over corresponding sequential clock cycles, where the operations of the sequence include (i) determining, for each pixel in the subset, a relative level of stimulation of cones in a viewer's eye based, at least, on the value, r.sup.i, for the first color and the value, g.sup.i, for the second color; and (ii) modifying, based, at least, on the determined relative level of stimulation of cones in a viewer's eye by the pixel, the initial image data for the frame f.sup.i, the modified image data for the frame f.sup.m including a value, r.sup.m, for the first color and a value, g.sup.m, for the second color for the pixel; and transmitting, by the processing device, the modified image data for the frame f.sup.m to an electronic display, where data for each pixel in the frame f.sup.m is transmitted sequentially over a respective clock cycle.
[0017] Implementations of the method can include one or more of the following features and/or features of other aspects. In some implementations, the values r.sup.i, g.sup.i, and b.sup.i included in the frame f.sup.i can be received in decimal format. In such cases, the method further includes converting the received values r.sup.i, g.sup.i, and b.sup.i to integer format prior to performing the operations of the sequence.
[0018] In some implementations, there can be as many operations in the sequence as pixels in the subset. In some such implementations, there can be fewer pixels in the subset than in the frame f.sup.i.
[0019] In some implementations, The operations of the sequence can be performed on data of the subset of the pixels in the frame f.sup.i while receiving image data for later ones from among the pixels in the frame f.sup.i, and transmitting modified image data for earlier ones of the pixels in the frame f.sup.m.
[0020] In some implementations, determining a relative level of stimulation of cones can include determining a relative level of stimulation of neighboring cones in the viewer's eye. In some implementations, when viewed on the electronic display, f.sup.m can result in reduced contrast between neighboring cones in a viewer's eye compared to f.sup.i.
[0021] In some implementations, determining the relative level of stimulation can include comparing the value, r.sup.i, for the first color to the value, g.sup.i, for the second color. For example, for at least some of the plurality of pixels, r.sup.m/g.sup.m<r.sup.i/g.sup.i when g.sup.i.ltoreq.r.sup.i. In some cases, r.sup.m/g.sup.m=r.sup.i/g.sup.i when g.sup.i.gtoreq.r.sup.i. In some cases, when g.sup.i.ltoreq.r.sup.i, r.sup.m/g.sup.m=ar.sup.i/g.sup.i, where 0<a<1 and the value of a depends on a number of frames in of a sequence of frames preceding f.sup.i. Here, a can increase as the number of frames in the sequence of frames preceding f.sup.i increases.
[0022] In some implementations, f.sup.m includes at least one pixel for which r.sup.m=r.sup.i and g.sup.m=g.sup.i. For example, for the pixel in f.sup.m for which r.sup.m=r.sup.i and g.sup.m=g.sup.i, g.sup.i>r.sup.i. In some implementations, b.sup.m.noteq.b.sup.i for at least one pixel in f.sup.m.
[0023] In some implementations, determining the relative level of stimulation can include determining coordinates in a universal chromaticity space representative of the color of the first pixel. For example, the chromaticity space can be the 1931 x, y CIE chromaticity space or the CIE XYZ chromaticity space, or the 1964 or 1976 CIE chromaticity space.
[0024] In some implementations, the relative level of stimulation can be based on a relative spectral sensitivity of L-cones and M-cones in the viewer's eye. For example, the relative level of stimulation can be further based on a relative spectral sensitivity of S-cones in the viewer's eye. As another example, the relative level of stimulation can be further based on a relative proportion of L-cones to M-cones in the viewer's eye. As yet another example, the relative level of stimulation can be further based on a pixel/cone ratio of the frame when viewed.
[0025] In some implementations, the first, second, and third colors can be red, green, and blue, respectively. In some implementations, the first, second, and third colors can be cyan, magenta, and yellow.
[0026] In some implementations, the relative level of stimulation can be determined based on L, M, and S values determined based on at least some of the pixel's in f.sup.i.
[0027] In general, in another aspect, the invention features an apparatus that includes an electronic processing module including a receiver device, a transmitter device and a processing device coupled between the receiver device and the transmitter device. Here, the receiver device is configured to (i) receive initial image data for a frame f.sup.i including a plurality of pixels, where data for each pixel in the frame f.sup.i includes a value, r.sup.i, for a first color, a value, g.sup.i, for a second color, and a value, b.sup.i, for a third color, and (ii) transmit data for each pixel in the frame f.sup.i to the processing device, sequentially over a respective clock cycle of the processing device. Further, the processing device is configured to produce modified image data for a frame f.sup.m corresponding to the frame f.sup.i, by concurrently performing operations of a sequence of operations on data for a subset of the pixels, where a different operation of the sequence is performed per clock cycle on data for a different pixel of the subset, and the operations of the sequence are performed sequentially on data for each pixel over corresponding sequential clock cycles. The operations of the sequence include (i) determine, for each pixel in the subset, a relative level of stimulation of cones in a viewer's eye based, at least, on the value, r.sup.i, for the first color and the value, g.sup.i, for the second color; and (ii) modify, based, at least, on the determined relative level of stimulation of cones in a viewer's eye by the pixel, the initial image data for the frame f.sup.i, the modified image data for the frame f.sup.m including a value, r.sup.m, for the first color and a value, g.sup.m, for the second color for the pixel. Additionally, the transmitter device configured to (i) receive the modified image data for the frame f.sup.m from the processing device, where data for each pixel in the frame f.sup.m is received sequentially over a respective clock cycle, and (ii) transmit the modified image data for the frame f.sup.m to an electronic display.
[0028] Implementations of the method can include one or more of the following features and/or features of other aspects. In some implementations, the values r.sup.i, g.sup.i, and b.sup.i included in the frame f.sup.i can be received by the receiver device in decimal format. Here, either the receiver device is configured to convert the values r.sup.i, g.sup.i, and b.sup.i to integer format prior to transmission to the processing device, or the processing device is configured to convert the values r.sup.i, g.sup.i, and b.sup.i to integer format prior to performing the operations of the sequence.
[0029] In some implementations, the processing device can be an FPGA device. Here, the FPGA device can be configured to perform the sequence of operations that has as many operations as pixels in the subset. In some cases, there are fewer pixels in the subset than in the frame f.sup.i.
[0030] In some implementations, the processing device can be configured to perform the operations of the sequence on data of the subset of the pixels in the frame f.sup.i while receiving from the receiver device image data for later ones from among the pixels in the frame f.sup.i, and transmitting to the transmitter device modified image data for earlier ones of the pixels in the frame f.sup.m.
[0031] In some implementations, the processing device can be configured to modify the received image data based on a relative level of stimulation of neighboring cones in the viewer's eye. In some implementations, the processing device can be configured to determine the relative level of stimulation based, at least, on the corresponding values of r.sup.i and g.sup.i and b.sup.i for at least some of the plurality of pixels in f.sup.i.
[0032] In some implementations, the apparatus can include an electronic display panel configured to receive the modified image data from the output and display the sequence of frames based on the modified image data.
[0033] In some implementations, the electronic display can be a display selected from the group including a liquid crystal display, a digital micromirror display, an organic light emitting diode display, a projection display, quantum dot display, and a cathode ray tube display.
[0034] In some implementations, the processing device can be an ASIC device. In some implementations, the receiver device, the processing device and the transmitter device can be integrated as an ASIC device. In some implementations, the apparatus can be a semiconductor chip or a circuit board including a semiconductor chip.
[0035] In some implementations, a set top box can include the disclosed apparatus. Here, the set top box can be configured to receive the input from another set top box, a DVD player, a video game console, or an internet connection.
[0036] In some implementations, a flat panel display can include the disclosed apparatus.
[0037] In some implementations, a television can include the disclosed apparatus. In some implementations, a mobile device can include the disclosed apparatus. In some implementations, a wearable computer can include the disclosed apparatus. In some implementations, a projection display can include the disclosed apparatus. In some implementations, a video game console can include the disclosed apparatus. In some implementations, a dongle can include the disclosed apparatus.
BRIEF DESCRIPTION OF THE DRAWINGS
[0038] FIG. 1A is a plot showing normalized responsivity spectra of human cone cells, S, M, and L types.
[0039] FIG. 1B shows an example of cone mosaic on a retina.
[0040] FIG. 1C is CIE 1931 chromaticity diagram showing equal energy illuminant points CIE-E, CIE-D65, and CIE-C.
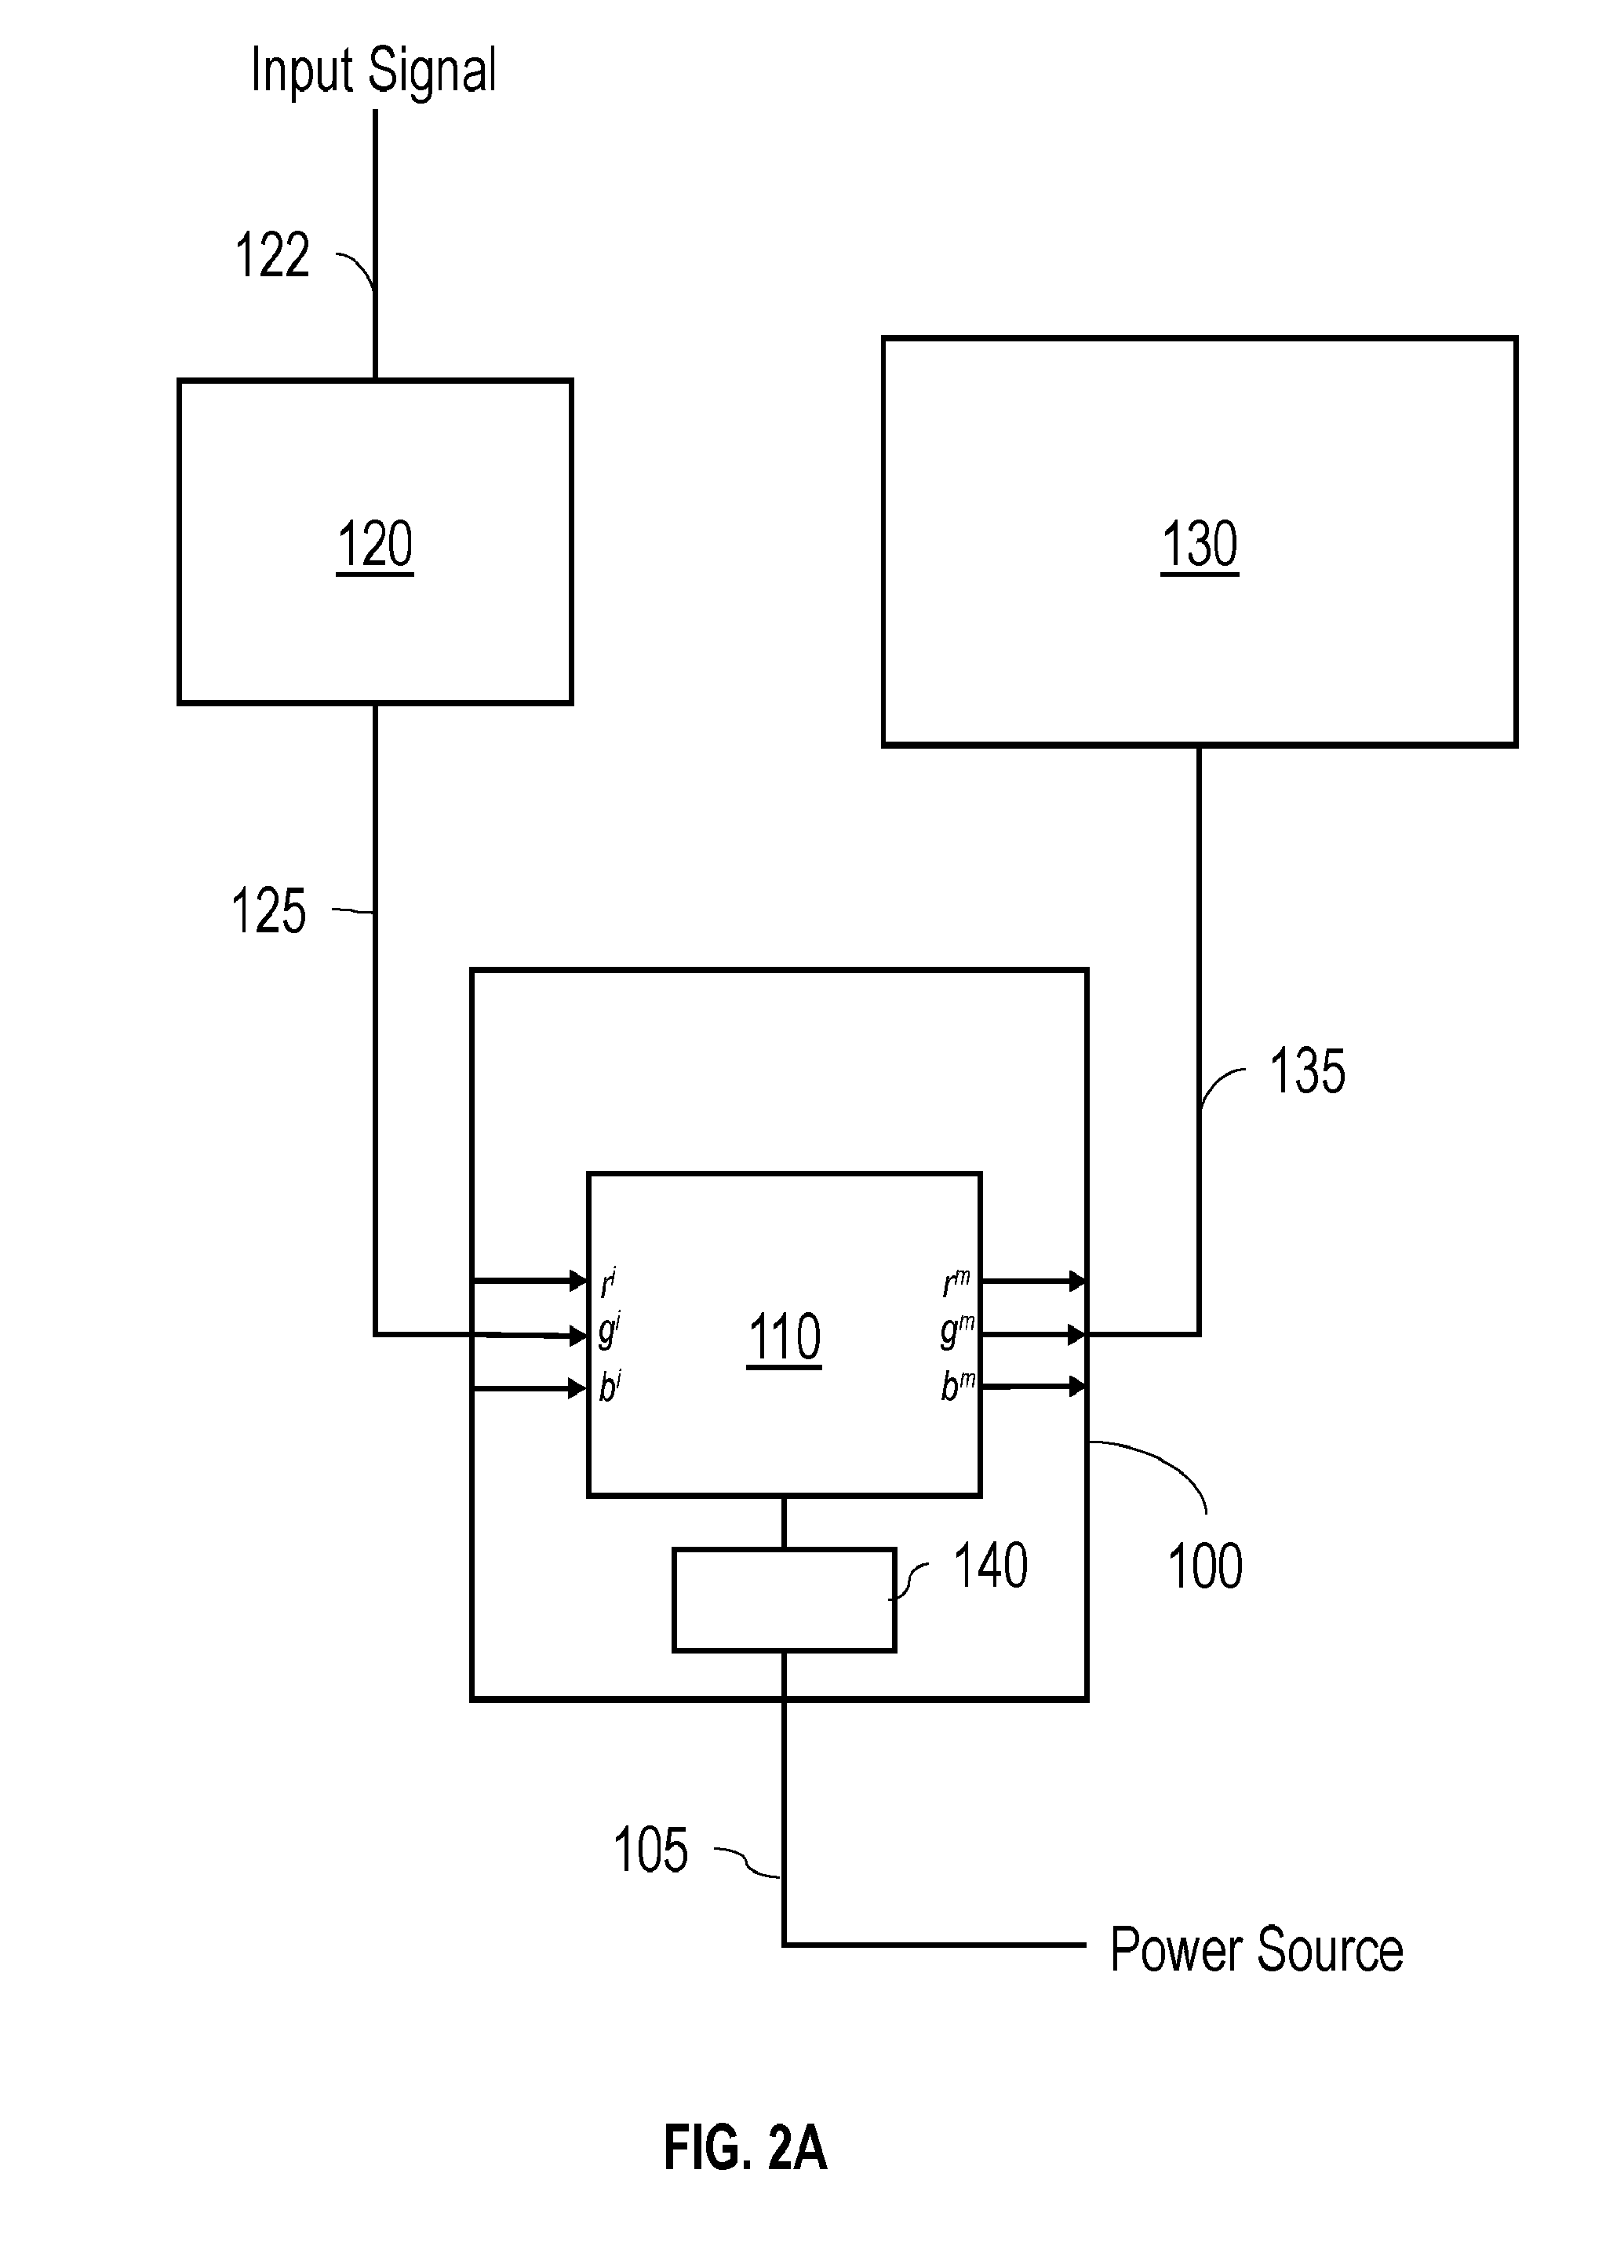
[0041] FIG. 2A shows an embodiment of a system including a set top box for reducing the myopiagenic effect of a TV set.
[0042] FIG. 2B shows an embodiment of a system including a dongle for reducing the myopiagenic effect of a TV set.
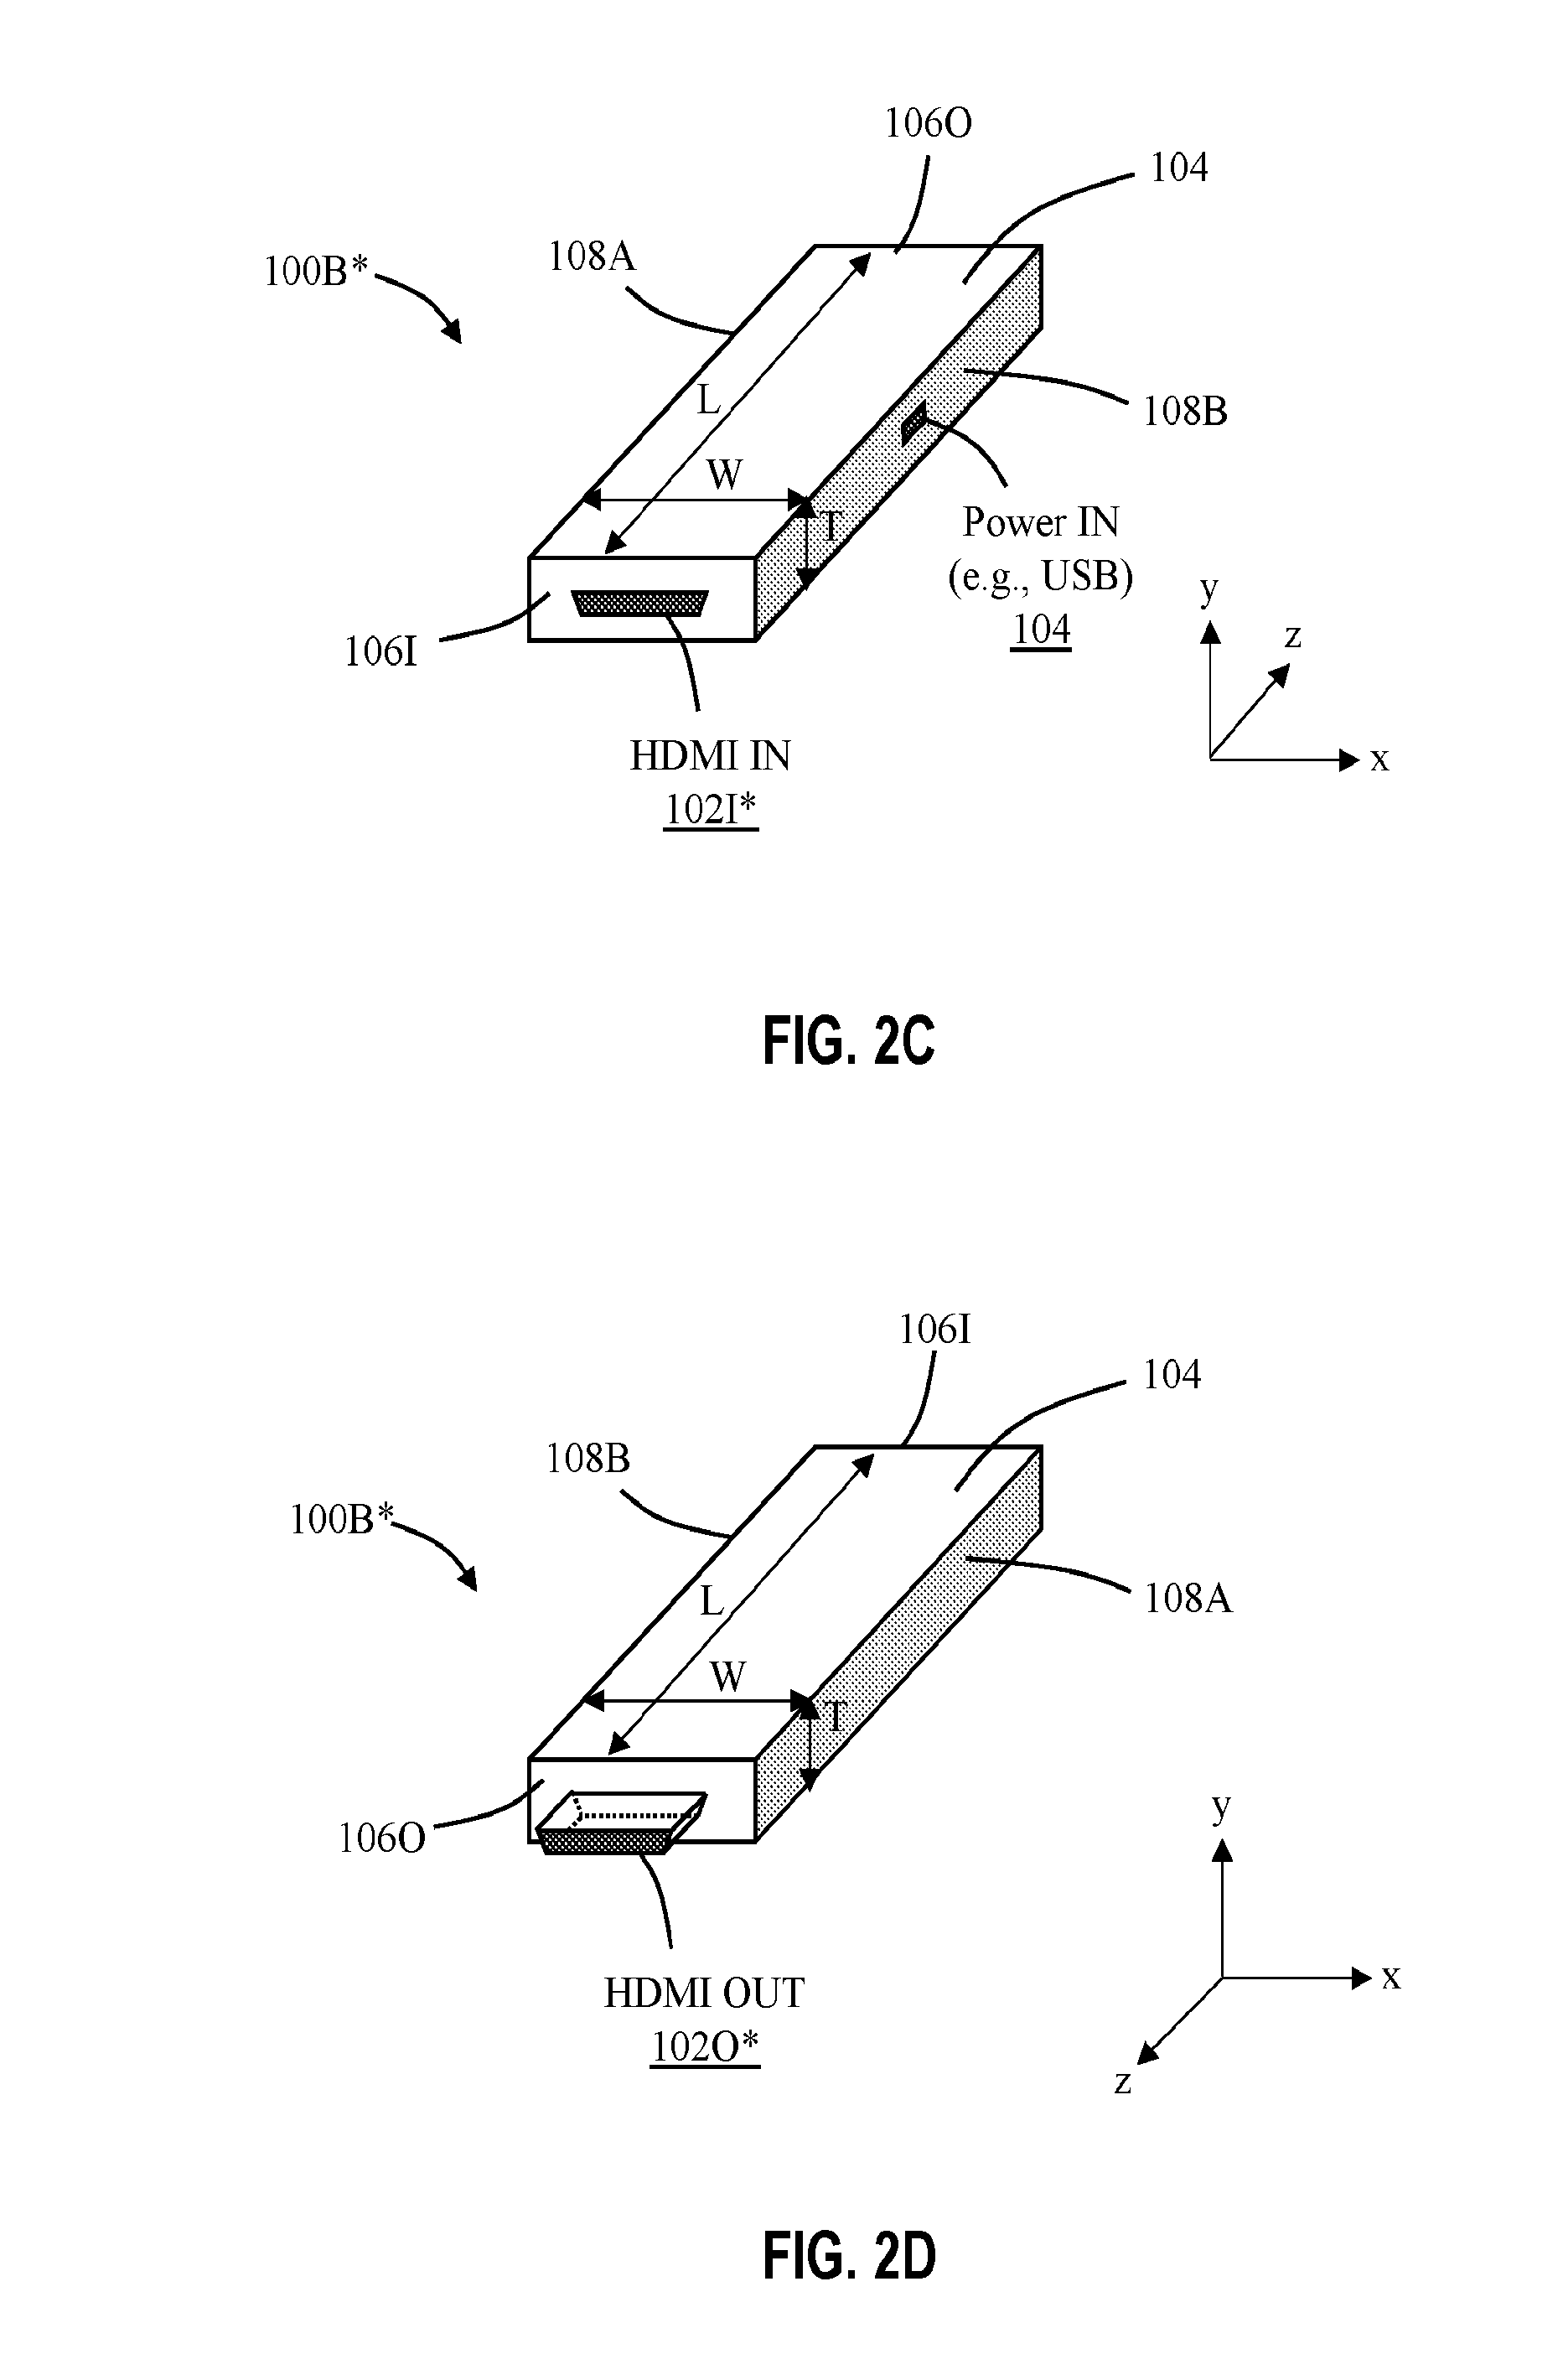
[0043] FIGS. 2C-2D show aspects of an embodiment of the dongle from FIG. 2B.
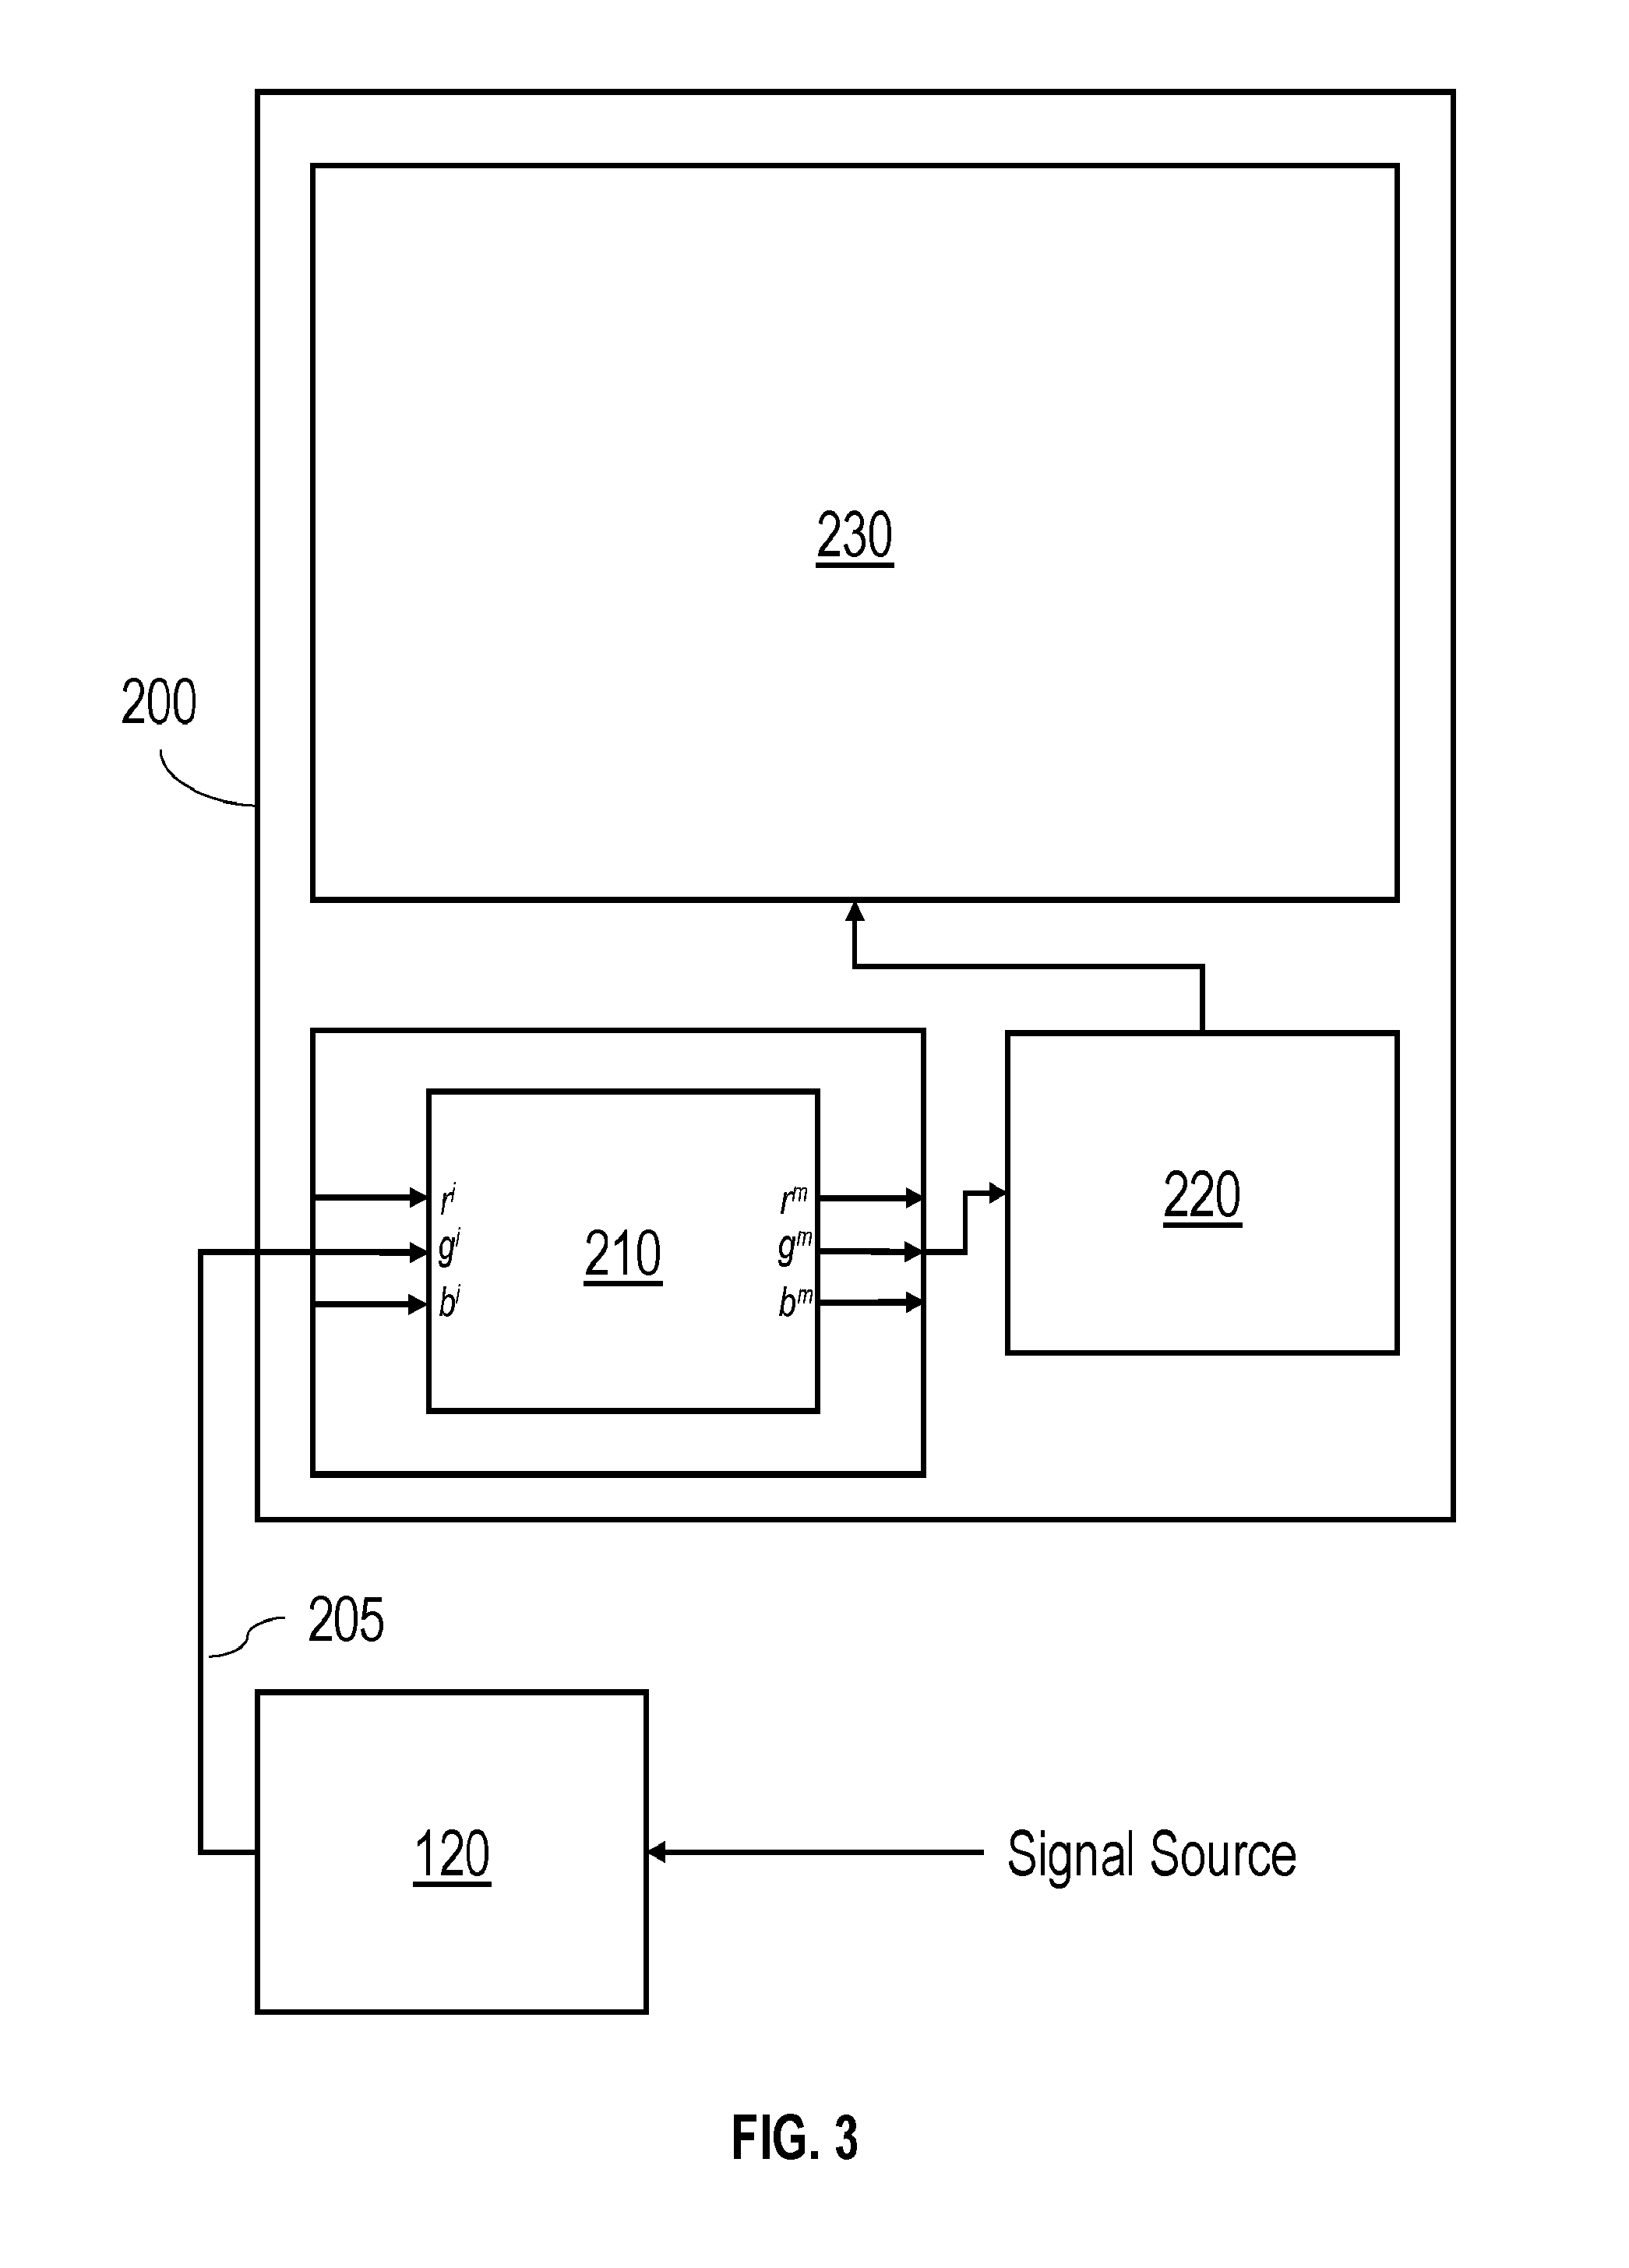
[0044] FIG. 3 shows another embodiment of a system including a set top box for reducing the myopiagenic effect of a TV set.
[0045] FIG. 4 shows an embodiment of a local area network including a server for delivering content for which the myopiagenic effect has been reduced.
[0046] FIGS. 4B-4C show side cross-sections of a myopic eye and a normal eye, respectively.
[0047] FIG. 5A shows a stimulus composed of a black and white checkerboard array.
[0048] FIG. 5B shows a distribution of L, M, and S cones in a simulated retina.
[0049] FIG. 5C shows a level of stimulation of the cones in the simulated retina shown in FIG. 5B by the stimulus shown in FIG. 5A.
[0050] FIG. 6A shows a stimulus composed of an array of red pixels.
[0051] FIG. 6B shows a distribution of L, M, and S cones in a simulated retina.
[0052] FIG. 6C shows a level of stimulation of the cones in the simulated retina shown in FIG. 6B by the stimulus shown in FIG. 6A.
[0053] FIG. 7A shows a flowchart of an algorithm for producing a modified video signal for reducing the myopiagenic effect of a display.
[0054] FIGS. 7B-7C show aspects of an image rendering system configured to perform the algorithm of FIG. 7A.
[0055] FIG. 8A shows a stimulus for which the watercolor effect has been used to reduce the myopiagenic effect of the image.
[0056] FIG. 8B shows a stimulus for which the Cornsweet effect has been used to reduce the myopiagenic effect of the image.
[0057] FIG. 9 is a flowchart showing an algorithm for determining a cone stimulation level in a simulated retina.
[0058] FIG. 10 is a flowchart showing an algorithm for quantifying the myopiagenic effect of a stimulus.
[0059] FIGS. 11A and 11B show possible arrangements of cones in a simulated retina.
[0060] FIG. 12A is a schematic diagram showing the relationship between viewing distance and cone separation at maximal retinal resolution.
[0061] FIG. 12B is a schematic diagram illustrating a cone to pixel mapping for a 1080P 60'' display.
[0062] FIG. 13 is a three-dimensional plot of calculated myopiagenic scale values as a function of different text and background colors.
[0063] FIG. 14A is a table listing calculated myopiagenic scale values and readability values for different text and background color combinations.
[0064] FIG. 14B is another table listing calculated myopiagenic scale values and readability values for different text and background color combinations.
[0065] FIG. 15A is a further table listing calculated myopiagenic scale values and readability values for two text and background color combinations.
[0066] FIG. 15B is a plot showing calculated cone stimulation from a strip of text between two strips of background for the color combination specified in the first row of the table in FIG. 15A.
[0067] FIG. 15C is a plot showing calculated cone stimulation from a strip of text between two strips of background for the color combination specified in the second row of the table in FIG. 15A.
[0068] FIG. 16A is another table listing calculated myopiagenic scale values and readability values for two additional text and background color combinations.
[0069] FIG. 16B is a plot showing calculated cone stimulation from a strip of text between two strips of background for the color combination specified in the first row of the table in FIG. 16A.
[0070] FIG. 16C is a plot showing calculated cone stimulation from a strip of text between two strips of background for the color combination specified in the second row of the table in FIG. 16A.
DETAILED DESCRIPTION
[0071] Referring to FIG. 2A, a set top box 100 for reducing the myopiagenic effect of a television (TV) set 130 is connected between a cable box 120 and TV set 130. A cable 125 connects an output port of cable box 120 to an input port of set top box 100, and another cable 135 connects an output port of set top box 100 to an input port of TV set 130. Cables 125 and 135 are cables capable of carrying a video signal, including analogue video cables (e.g., composite video cables, S-video cables, component video cables, SCART cables, VGA cables) and digital video cables (e.g., serial digital interface (SDI) cables, digital visual interface (DVI) cables, high-definition multimedia interface (HDMI.RTM.) cables, DisplayPort cables).
[0072] Set top box 100 includes an electronic processing module 110 and an internal power supply 140. Electronic processing module 110 includes one or more electronic processors programmed to receive an input video signal from the input port of set top box 100 and output a modified video signal to the output port. In general, a variety of electronic processors can be used, such as an application-specific integrated circuit (ASIC) or a general purpose integrated circuit (e.g., a field programmable gate array or FPGA) programmed appropriately. Electronic processing module 110 may include other integrated circuit components (e.g., one or more memory blocks) and/or electronic components.
[0073] Internal power supply 140 is connected to a power port, to which a power supply cable 105 is connected. The power supply cable 105 connects set top box 100 to an external power source, such as a standard plug socket. Power supply 140 is configured to receive electrical power from the external power source and convert that power to power appropriate for powering electronic processing module 110 (e.g., AC-to-DC conversion at suitable current and voltage levels). Internal wiring connects power supply 140 to electronic processing module 110.
[0074] TV set 130 may include any appropriate color display including, for example, a light emitting diode display (LEDs), liquid crystal displays (LCD), a LED-backlit LCD, an organic light emitting diode (OLED) display, a color projector displays, a quantum dot display, a cathode ray tube (CRT), or a MEMS-based display, such as a digital micromirror device (DMD). TV set 130 may be a direct view display or a projection display (e.g., a front or rear projection display).
[0075] During operation, cable box 120 receives an input signal, including a video signal, from a source via cable 122. In general, cable 122 can be any of a variety of cables capable of carrying a video signal, such as an Ethernet cable, a co-axial cable, a DSL line. The input signal source can be a satellite dish, a cable TV and/or broadband internet provider, or a VHF or UHF antenna. Furthermore, the input signal can include content in addition to video signals, such as audio signals, internet web pages, interactive video games, etc.
[0076] Cable box 120 directs an input RGB video signal to set top box 100 via cable 125. The input video signal includes a sequence of image frames. Each frame is composed of a series of rows and columns of pixels, possibly arranged as a pixel array, and the input video signal includes information about the color of each pixel in each frame. In general, the input RGB video signal includes, for each pixel in each frame, a value for red, r.sup.i, and value for green, g.sup.i, and a value for blue, b.sup.i. Typically, the higher the value for each color, the higher the intensity of the primary contributing to the pixel color. The range of values for each color depends on the number of bits, or color depth, of the signal. For 24-bit color, for example, each component color has a value in a range from 0 to 255, yielding 256.sup.3 possible color combinations. Other color depths 8-bit color, 12-bit color, 30-bit color, 36-bit color, and 48-bit color.
[0077] More generally, alternative forms for color coding in video signals to RGB may be used (e.g., Y'CbCr, Y'UV) and algorithms for transforming RGB signals to other color signal formats and back are known.
[0078] The electronic processing module 110 generates an output RGB video signal based on the input video signal so that the corresponding image displayed using TV 130 produces either (i) a reduced level of differential stimulation between L cones and M cones in a viewer's eye and/or (ii) a reduced level of differential stimulation between neighboring cones, compared with the viewing an image produced using the input video signal. The electronic processing modules achieves this by outputting a video signal that includes, for each pixel in each frame, having a value for red, r.sup.m, a value for green, g.sup.m, and a value for blue, b.sup.m, based on at least the respective values r.sup.i, g.sup.i, and b.sup.i for the corresponding pixel in the corresponding frame in the input video signal. In order to provide reduced myopiagenia in the displayed image, for certain pixels either r.sup.m.noteq.r.sup.i, g.sup.m.noteq.g.sup.i, and/or b.sup.m.noteq.b.sup.i. In general, the video signal modification can vary depending on the factors that include, e.g., settings on TV 130, content being viewed, viewing time, viewer's retinal composition, viewer's age, viewer's race or ethnicity, viewer's color vision status, etc. Exemplary algorithms for video signal modification are described below.
[0079] While set top box 100 includes an internal power supply 140, other configurations are also possible. For example, in some embodiments, an external power supply is used. Alternatively, or additionally, set top box 100 can draw power from batteries or from cable box 120 via cable 125 or a separate cable connecting the two components. Set top box 100 can include additional components, such as memory buffers for buffering input signals before processing them, or modified signals after processing them before sending them to TV set 130. Memory buffers may reduce latency during operation.
[0080] Moreover, while the components depicted in FIG. 2A are connected to each other via physical cables, in some implementations, one or more of the connections can be wireless connections (e.g., Wi-Fi connections or Bluetooth). In some implementations, one or more of the connections can be direct, i.e., plug-in, connections. Such examples are shown in FIGS. 2B-2D.
[0081] Referring to FIG. 2B, an embodiment 110B of the electronic processing module for reducing the myopiagenic effect is housed in a dongle 100B (also referred to as a stick) that has an input port 102I and an output port 102O. One or both of the input port 102I and the output port 102O can be implemented as HDMI connectors. In this example, the dongle 100B is used to reduce the myopiagenic effect in an entertainment system that includes an audio visual receiver (AVR) 120B (e.g., a Denon.TM. multi-channel home theater receiver or similar device from another manufacturer), a TV set 130B, and N.gtoreq.2 media sources, e.g., satellite/cable box, media player (e.g., Apple TV, Amazon stick, etc.), blue ray player, video game console, Bluetooth device (e.g., Air Play-connected tablet), etc. The media sources are connected to respective inputs of the AVR 120B. The AVR 120B is configured to transmit, from its HDMI output, a high definition multimedia signal (that can include RGB data r.sup.i, g.sup.i, b.sup.i) to an HDMI input of the TV set 130, such that a source of media content to be presented on the TV set can be selected based on user input from the AVR's user interface. In the example illustrated in FIG. 2B, the HDMI input 102I of the dongle 100B is connected to the HDMI output of the AVR 120 via an HDMI cable 125B, and the HDMI output 102O of the dongle 100B is plugged into the HDMI input of the TV set 130B. In this manner, the dongle 100B receives, via the HDMI cable 125B, RGB data r.sup.i, g.sup.i, b.sup.i from the HDMI output of the AVR 120B, transforms it based on algorithm 400, and outputs the transformed RGB data r.sup.m, g.sup.m, b.sup.m directly to the HDMI input of the TV set 130B.
[0082] FIGS. 2C-2D show aspects of an embodiment 100B* of the dongle shown schematically in FIG. 2B. The dongle 100B* uses a housing 104 to enclose the electronic processing module 110B for reducing the myopiagenic effect and other electronic components. The housing 104 extends from an input end wall 106I to an output end wall 106O over a length L (e.g., along the z-axis). The length L can be 1'', 2'', 3'' or 4'', for instance. The housing 104 has a first side wall 108A and a second side wall 108B separated from each other by a width W. The width W can be 0.2'', 0.5'', 1'', 1.2'' or 1.5'', for instance. Also, the housing 104 has a pair of bases that support the walls there-between and are separated by a thickness T. The thickness T can be 0.05'', 0.1'', 1'', 0.2'' or 0.5'', for instance.
[0083] In the examples shown in FIGS. 2C-2D, the dongle 100B* includes an input HDMI connector 102I* (e.g., female) disposed on the input end wall 106I and an output HDMI connector 102O* (e.g., male) disposed on the output end wall 106O. Further in these examples, the dongle 100B* includes an input power connector 104 disposed on one of the side walls, e.g., on the second side wall 108B. In some implementations, the input power connector 104 can be a USB connector.
[0084] Referring again to FIG. 2B, in some embodiments, a dongle for reducing the myopiagenic effect can be plugged directly into the AVR 120B rather than in the TV set 130B as described above. For instance, an HDMI input of the dongle can be plugged into the HDMI output of the AVR 120B, and an HDMI output of the dongle can be connected to the HDMI input of the TV set 130B via an HDMI cable (e.g., 135). In this manner, the dongle 100B can receive RGB data r.sup.i, g.sup.i, b.sup.i directly from the HDMI output of the AVR 120B, transform it based on algorithm 400, and output the transformed RGB data r.sup.m, g.sup.m, b.sup.m for transmission via the HDMI cable to the HDMI input of the TV set 130B.
[0085] In yet other embodiments, the electronic processing module 110B for reducing the myopiagenic effect can be housed in the AVR 120B itself, rather than in a separate dongle as described above. In this manner, the electronic processing module 110B can intercept RGB data r.sup.i, g.sup.i, b.sup.i prior to its reaching the HDMI output of the AVR 120B, transform the intercepted data based on algorithm 400, and output the transformed RGB data r.sup.m, g.sup.m, b.sup.m to the HDMI output of the AVR. As such, an HDMI cable (e.g., 135) can transmit the transformed RGB data r.sup.m, g.sup.m, b.sup.m from the HDMI output of the AVR 120B the HDMI input of the TV set 130B.
[0086] Referring to FIG. 3, in some embodiments, the electronic processing module for reducing the myopiagenic effect is housed in the TV set itself, rather than as a separate set top box as previously described. Here, a TV set 200 includes an electronic processing module 210 in addition to a display panel 230 and display driver 220. A cable 205 connects cable box 120 to TV set 200.
[0087] Electronic processing module 210 operates in a similar way as electronic processing module 110 described above in that it receives an input video signal from cable box 120 and outputs a modified video signal for reduced myopiagenia. Electronic processing module 210 directs the modified video signal to display driver 220, which in turn directs drive signals to display panel 230 to display the modified images.
[0088] Furthermore, while the foregoing examples described in FIGS. 2 and 3 receive digital video signals from a cable box, the video signals can be from other sources. For example, video signals may be supplied from a video game console or television set top box instead of (or in addition to) a cable box. For instance, video signals from commercially-available set top box (such as Roku, Apple TV, Amazon Fire, etc.) or digital video recording (DVR) device such as TiVO or similar, video game consoles, such as X-box consoles (from Microsoft Corp., Redmond Wash.), PlayStation consoles (from Sony Corp., New York, N.Y.), or Wii consoles (from Nintendo, Redmond, Wash.), can be modified.
[0089] Other implementations are also possible. For example, referring to FIG. 4, in some embodiments, a modified video signal is provided by a networked server 320 via a WAN 310 (e.g., the internet) to one or more end users 340-344 and no additional hardware is required by the end user. The original (unmodified) video signal may be received by networked server 320 from either a networked provider 330 or via broadcast signal (e.g., VHF, UHF, or satellite signal) from a broadcaster 350.
[0090] While the foregoing examples relate to modifying color in a TV set, the concepts disclosed herein may be generally applied to other devices that contain a color display. For example, the concepts may be implemented in computer monitors, digital signage displays, mobile devices (e.g., smart phones, tablet computers, e-readers), and/or wearable displays (e.g., head-mounted displays such as virtual reality and augmented reality headsets, Google glass, and smart watches).
[0091] Moreover, while the foregoing examples utilize a dedicated electronic processing module for modifying display signals, other implementations are also possible. For example, in some embodiments, video signal modification can be applied via software solutions alone. In other words, video signals can be modified using software solutions installed on existing hardware (e.g., using a display's video card or a computer's or mobile device's processor).
[0092] In some embodiments, video signals are modified using an app downloaded, e.g., from the internet. For instance, on a mobile device (e.g., running Google's Android operating system or Apple's iOS operating system) signal modification may be implemented using a downloaded app.
[0093] More generally, versions of a system for reducing the myopiagenic effect can be implemented in software, in middleware, in firmware, in digital electronic circuitry, or in computer hardware, or in combinations of them. The system can include a computer program product tangibly embodied in a machine-readable storage device for execution by a programmable processor, and method steps can be performed by a programmable processor executing a program of instructions to perform functions by operating on input data and generating output. The system can be implemented in one or more computer programs that are executable on a programmable system including at least one programmable processor coupled to receive data and instructions from, and to transmit data and instructions to, a data storage system, at least one input device, and at least one output device. Each computer program can be implemented in a high-level procedural or object-oriented programming language, or in assembly or machine language if desired; and in any case, the language can be a compiled or interpreted language. Suitable processors include, by way of example, both general and special purpose microprocessors. Generally, a processor will receive instructions and data from a read-only memory and/or a random access memory. Generally, a computer will include one or more mass storage devices for storing data files; such devices include magnetic disks, such as internal hard disks and removable disks; magneto-optical disks; and optical disks. Storage devices suitable for tangibly embodying computer program instructions and data include all forms of non-volatile memory, including by way of example semiconductor memory devices, such as EPROM, EEPROM, and flash memory devices; magnetic disks such as internal hard disks and removable disks; magneto-optical disks; and CD-ROM disks. Any of the foregoing can be supplemented by, or incorporated in, ASICs (application-specific integrated circuits).
[0094] The Myopiagenic Effect
[0095] Before discussing algorithms for modifying video signals, it is instructive to consider the cause of the myopiagenic effect of electronic displays. Myopia--or nearsightedness--is a refractive effect of the eye in which light entering the eye produces image focus in front of the retina, as shown in FIG. 4B for a myopic eye, rather than on the retina itself, as shown in FIG. 4C for a normal eye. Without wishing to be bound by theory, it is believed that television, reading, indoor lighting, video games, and computer monitors all cause progression of myopia, particularly in children, because those displays produce stimuli that cause uneven excitation of L and M cones (for example stimulating L cones more than M cones) and/or uneven excitation of neighboring cones in the retina. During childhood (approximately age 8), adolescence (before age 18), and young adulthood (until age 25 years or age 30 years), these factors of differential stimulation result in abnormal elongation of the eye, which consequently prevents images from be focused on the retina.
[0096] There are two factors in an image that can result in a high degree of retinal cone contrast: one spatial and one chromatic. The spatial factor refers to the degree to which an image contains high spatial frequency, high contrast features. Fine contrast or detail, such as black text on a white page, form a high contrast stimulation pattern on the retinal cone mosaic. The chromatic factor refers to how uniform blocks of highly saturated colors stimulate cone types asymmetrically, and therefore form a high contrast pattern on the retina. For example, red stimulates L cones more than M cones, whereas green light stimulates M cones more than L cones. Shorter wavelength light, such as blue, stimulates S cones more than either L or M cones. The degree of color can refer to either the number of pixels of that color as well as their saturation levels, or both. Here, for example, red pixels may be identified as pixels for which r is greater than g and/or b by a threshold amount or a percentage amount. Alternatively, or additionally, red pixels may be identified as pixels that have a red hue in the 1931 or 1976 CIE color space. Similarly, green pixels could be identified as pixels for which g is greater than r and/or b by a threshold or percentage amount; or green pixels may be identified as pixels that have a green hue in the 1931 or 1976 CIE color space. Similarly, blue pixels could be identified as pixels for which b is greater than r or g by a threshold amount or a percentage amount; or blue pixels could be identified as pixels that have a blue hue in the 1931 and 1976 CIE color space.
[0097] Referring to FIGS. 5A-5C and 6A-6C, the spatial and chromatic effects can be explained as follows. Each figure shows a hexagonal mosaic, corresponding to the spatial mosaic of cones on a retina. The arrangement of cones is depicted in FIGS. 5B and 6B, where the L cones are colored red, the M cones are colored green, and the S cones are colored blue. FIGS. 5A and 6A show two different types of stimuli at the retina and FIGS. 5C and 6C depict the cone responses due to the respective stimuli.
[0098] The stimuli in FIG. 5A corresponds to a high frequency, high contrast checkerboard pattern of white and black across the retina. The spatial frequency here is half the spatial frequency of the cones so, on a row by row basis, every alternate cone has a high response (due to stimulation by white light) and the adjacent cones see no response (because there is no incident light at all). This response is depicted in FIG. 5C and the result is a high degree of differential stimulation in the cone mosaic, including between at least some of the L cones and some of the M cones. The response is shown on a scale from 0 to 1, where 0 is no stimulus and 1 is maximum stimulus. A legend showing the grayscale ranges on this scale is provided.
[0099] The stimuli in FIG. 6A corresponds to homogeneous red light of uniform intensity across the retina. As depicted in FIG. 6C, there is a low response by the M and S cones (depicted by black squares in the mosaic) and some response by the L cones (depicted as grey squares). Accordingly, the red stimulus results in a differential stimulation of cones within the retina, particularly L cones compared to M cones.
[0100] Prior approaches to addressing the myopiagenic effect of displays focused on excess stimulation of L cones compared to M cones (see, e.g., WO 2012/145672 A1). In other words, the prior approach focused on reducing the saturation of red pixels in an image. The focus on L and M cones is also understandable, because together they make up .about.95% of cones in the human eye. The focus on red wavelengths in particular is also understandable for two reasons: (1) red wavelengths stimulate L and M cones at a high differential (.about.4.5:1) compared to green light (.about.1:1:5) or blue light (.about.1:1); and (2) artificial light from screens, for example from video games and animation, contains abundant red light in comparison with sources of red in the outdoor world, where it is found sparingly. However, the present disclosure further recognizes that high spatial frequency, high contrast images can similarly result in a similar myopiagenic response and a more comprehensive solution should account for the effect of such images. For example, if one considers only the amount of red in an image when applying a correction, the myopiagenic effect of a red image (e.g., that has L>M) is reduced, e.g., by introducing a green ring around the image and/or reducing saturation of the red image by decreasing the red level and/or increasing green. However, such as approach would not apply any improvement to an image on the basis of neighboring cone contrast. Similarly, a black and white checkerboard would not be improvable under the prior approach, because each black and each white pixel approximates an equal energy illuminant, and therefore would not be subject to an improved L/M ratio. However, such a black/white checkerboard would be subject to improvement in the present disclosure, because it creates high neighboring cone contrast; methods to improve such images are disclosed and described herein. Accordingly, algorithms that account for high spatial frequency effects are disclosed which can be used either alone or in combination with algorithms which reduce red saturation.
[0101] Algorithms for Myopia Reduction
[0102] Turning now to algorithms for reducing the myopiagenic effect of displayed images, in general, the color of each pixel in each frame can be modified based on one or more of the following parameters: (i) the color of the pixel in the frame itself; (ii) the location of the pixel in the frame, such as the proximity of the pixel to the edge of the frame; (iii) the color of another pixel in the frame, such as a neighboring pixel; (iv) the color of that same pixel in another frame, such as the preceding frame; and/or (v) the color of a different pixel in a different frame.
[0103] Implementations may reduce saturation of red pixels in an image, reduce contrast between adjacent pixels, or both. FIG. 7A is a flow chart of an example of an algorithm 400 for reducing the myopiagenic effect of displayed images. In some implementations, the algorithm 400 can be performed by the electronic processing module 110 of the set top box 100, or the electronic processing module 110B of the dongle 100B, or the electronic processing module 210 of the TV set 200 described above. In some implementations, the algorithm 400 can be performed by an electronic processing module distributed over two or more computing resources of a computing system.
[0104] Referring to FIG. 7A, in step 410, an initial video signal is received by an electronic processing module. The received video signal includes image information for a series of n initial frames, f.sub.1.sup.i, f.sub.2.sup.i, . . . , f.sub.n.sup.i. Each frame is composed of k pixels, p.sub.1, p.sub.2, . . . , p.sub.k. Each pixel is composed of three color component values, r.sup.i, g.sup.i, and b.sup.i, corresponding to values for red, green, and blue, respectively.
[0105] In step 420, a relative level of stimulation of L cones, M cones, and/or S cones is determined, by the electronic processing module, for each pixel in each frame based on the values r.sup.i, g.sup.i, and b.sup.i. For example, this step may simply involve comparing the value of r.sup.i to the value of g.sup.i and/or b.sup.i for a pixel. Alternatively, or additionally, XYZ tristimulus values, LMS values, or other ways to measure cone stimulation may be calculated, by the electronic processing module, from the RGB values.
[0106] Next, in step 430, one or more pixels are identified, by the electronic processing module, for color modification based on the relative level of L, M, and/or S cone stimulation by each pixel. For example, in some embodiments, red pixels are identified by comparing the RGB values or based on a hue of each pixel. In other embodiments, pixels are chosen because of high levels of color contrast with other neighboring pixels. In still other embodiments, pixels are chosen because of high differences in cone stimulation levels among neighboring cones.
[0107] In some embodiments, pixels are identified based on the color of other pixels in the frame. For example, groups of adjacent red pixels (e.g., corresponding to red objects in an image) are identified for modification but lone red pixels are left unmodified. Alternatively, or additionally, pixels may be identified for color modification based on the color of the same pixel in other frames. For example, in some embodiments, red pixels that persist for more than one frame (e.g., for one or several seconds, or more) may be identified for color modification, but those red pixels that exist for only one or just a few frames (e.g., a<1 second, <0.1 seconds, or <0.01 seconds) may be left unmodified.
[0108] In step 440, modified image data is generated, by the electronic processing module, based on the relative level of stimulation of L cones to M cones, or the level of adjacent cone contrast, and, in some cases, other factors (e.g., user preferences and/or aesthetic factors). A variety of modification functions may be used. In general, the modification will reduce the level of red saturation in a pixel's color and/or reduce the contrast level between adjacent pixels or adjacent groups of pixels.
[0109] In some embodiments, for those pixels identified for color modification, modified image data is generated by scaling r.sup.i, g.sup.i, and/or b.sup.i, e.g., by a corresponding scale factor .alpha., .beta., .gamma., defined below in EQ. (1).
[0110] In other words:
r.sup.m=.alpha.r.sup.i,
g.sup.m=.beta.g.sup.i, and/or
b.sup.m=.gamma.b.sup.i. (1)
[0111] In general, the scale factors .alpha., .beta., and/or .gamma. for each pixel may vary depending on a variety of factors, such as, for example r.sup.i, g.sup.i, and/or b.sup.i for that pixel, r.sup.i, g.sup.i, and/or b.sup.i of another pixel in the same frame, r.sup.i, g.sup.i, and/or b.sup.i of the same pixel in a different frame, r.sup.i, g.sup.i, and/or b.sup.i of a different pixel in a different frame, and/or other factors.
[0112] For example, in some embodiments, where r.sup.i>g.sup.i and r.sup.i>b.sup.i in a pixel, r.sup.i may be decreased for that pixel by some amount (i.e., 0<.alpha.<1) and/or g.sup.i may be increased for that pixel by some fractional amount (i.e., 1<.beta.). b.sup.i may be unchanged (i.e., .gamma.=1), or can be increased or decreased. In certain implementations, .alpha. and/or .beta. are functions of the difference between r.sup.i and g.sup.i. For instance, scale factors can be established so that the larger the difference between r.sup.i and g.sup.i, the more the red value in the modified signal is reduced relative to the initial signal and/or the more the green value in the modified signal is increased. By way of example, one simple mathematical formulation for this type of scale is:
.alpha.=k.sub..alpha.(r.sup.i-g.sup.i)+c.sub..alpha., and
.beta.=k.sub..beta.(r.sup.i-g.sup.i)+c.sub..alpha.. (2)
[0113] In EQ. (2), k.sub..alpha. and kg are proportionality constants and c.sub..alpha. and c.sub..beta. are constant offsets. k.sub..alpha. is negative so that a larger difference between r.sup.i and g.sup.i results in a smaller value for .alpha.. Conversely, k.sub..beta. is positive so that .beta. increases proportionally to the difference between r.sup.i and g.sup.i. The proportionality constants and constant offsets may be determined empirically.
[0114] Generally, in implementations where 0<.alpha.<1 and .beta.=.gamma.=1, red pixels in the modified image will appear darker than in the initial image. In implementations where .alpha.=.gamma.=1 and 1<.beta., red pixels in the modified image will appear lighter than in the initial image. In both cases, the degree of red saturation in the red pixels will decrease as the amount of red decreases relative to green.
[0115] In yet another embodiment, matrix multipliers may be used that create a linear transformation, e.g., as in EQ. (3):
[ r m m b m ] = [ .alpha. .beta. .gamma. ] [ r i i b i r i i b i r i i b i ] . ( 3 ) ##EQU00001##
[0116] In some embodiments, values for r.sup.m, g.sup.m, and b.sup.m are derived from linear combinations of their corresponding initial values and the difference between r and g. To illustrate an example that is not meant to bound the invention, e.g., as in EQ. (4):
r.sup.m=r.sup.i+.alpha.(r.sup.i-g.sup.i)
g.sup.m=g.sup.i+.beta.(r.sup.i-g.sup.i)
b.sup.m=b.sup.i+.gamma.(r.sup.i-g.sup.i). (4)
In one embodiment of EQ. (4), -1<a<0 and .beta. and .gamma. are both values between 0 and 1. More specifically, where .beta.=.gamma.=-.alpha./2, the transformation given in terms of EQ. (4) results in a final pixel that is equiluminant to the initial pixel. The condition of equiluminance is satisfied when (r.sup.m+g.sup.m+b.sup.m)=(r.sup.i+g.sup.i+b.sup.i).
[0117] While the modification of each component color described above is proportional to the input component color value, non-linear scaling is also possible (e.g., involving more than one scale factor and one or more additional higher order terms in the input component color value).
[0118] Finally, in step 450, a modified video signal is output, by the electronic processing module, containing image information for a series of n modified frames, f.sub.1.sup.m, f.sub.2.sup.m, . . . , f.sub.n.sup.m, each containing the same number of pixels, k, as the initial frames. For at least a subset of pixels, the RGB values are modified from the input signal. The other pixels may be unchanged from the input signal. For example, the color of all the red pixels may be modified, while the color of the pixels that are not red are left unchanged.
[0119] As noted previously, in some embodiments, a pixel's color is modified based on the color of a different pixel in the same frame. For example, the algorithm 400 can include adjacent red pixels (e.g., corresponding red objects in an image), and reduce r.sup.i-g.sup.i for those pixels by a certain amount, while leaving isolated red pixels unchanged or reducing r.sup.i-g.sup.i by a different (e.g., lesser) amount.
[0120] By basing a pixel's color modification on the color of a different pixel in the same frame, the effect of color modification perceived by a viewer's visual processing in the brain may be reduced, e.g., using perceptual illusions such as the so-called watercolor effect or so-called Cornsweet effect. In the watercolor effect, a red object may appear to be more saturated than it actually is when the edge of the object is more saturated than the interior. The watercolor effect may be used when modifying the color of objects in a frame, particularly when they are bordered by pixels that have chromaticies in opposite direction in color space or much darker pixels. See, e.g., http://www.scholarpedia.org/article/Watercolor_illusion.
[0121] Referring to FIG. 8A, the watercolor effect is illustrated for a red circle against a black background. The initial image features a highly saturated, uniformly red circle. The modified image, as shown, maintains the highly saturated red pixels (R=255, G=0, B=0) at the boundary of the circle, but reduces red saturation towards the interior of the circle (R=177, G=57, B=55). There is a radial gradient toward the center, where the gradient occurs on the outer 1/2 to 1/3 of the circle, avoiding the appearance of an annular discontinuity of the circle color.
[0122] The Cornsweet effect is an optical illusion where the gradient within a central line or section creates the impression that one side of the image appears darker than it actually is in reality. This effect may be utilized to reduce the brightness of red objects that border other red objects, for example, to allow a reduction in myopiagenic contrast while preserving an impression to the viewer that the image is highly saturated.
[0123] FIG. 8B shows an example of the Cornsweet effect. Here, the left most side of figure appears to be a brighter red than the right hand side. In reality, both sides have the same brightness. The illusion is created by the dark to bright gradient between the two sides when viewed from left to right. Using the Cornsweet effect it may be possible to reduce the saturation of certain red objects adjacent less saturated red objects with minimal change perceived by the viewer by introducing a light to dark gradient between the two objects.
[0124] Implementations that use illusions like the watercolor effect and Cornsweet effect may include additional image processing steps, such as identifying red objects in an image that may be candidates for the effect. Establishing candidacy of objects for these effects can be done based on factors such as the size and shape of the red object, uniformity of the red color of the object, and/or the nature of the bordering color.
[0125] In some embodiments, the modification to a red pixel's color can be modified based on the location of the pixel in a frame. For example, if a pixel located closer to an edge of the frame may be modified, while a pixel of the same color located closer to the middle of the frame is unchanged or modified to a lesser degree.
[0126] In other embodiments, the modification to a red pixel's color can be modified based on the type of object that the pixels represent. Certain objects may be deemed to be important to preserve in their original colors. One example might be a company logo or branded product where the colors are very recognizable. Using image analysis, those objects could be identified by comparison to an image database, and flagged for differential treatment in the algorithm 400.
[0127] Alternatively, or additionally, the color of a pixel in one frame may be modified based on the color of that pixel in another frame. For example, the color of colored objects that persist over a series of frames may be modified so that the degree of saturation of the reds in the object decrease over time. The time scale and rate of color change may be sufficient so that the effect is not easily noticeable to a viewer, but effectively reduces color saturation or overall retinal contrast.
[0128] In another example, the degree to which red pixels are modified may increase over time. Accordingly, the longer the viewer views the display during a particular viewing session, the greater the degree of modification of the red pixels.
[0129] Example implementations of electronic processing modules configured to perform the algorithm 400 are described next in connection with FIGS. 7B-7C. Referring to FIG. 7B, a processing module 710 has an input port 702A and an output port 702B. In this example, the processing module 710 includes a processing device 720, a receiver device (RX) 730 coupled with the processing device and the input port 702A, and a transmitter device (TX) 740 coupled with the processing device and the output port 702B.
[0130] In operation, the processing module 710 receives, at the input port 702A in accordance with step 410 of algorithm 400, serialized input RGB data 701--in which initial (non-modified) values r.sup.i, g.sup.i, and b.sup.i are provided from a video source in a serial manner. RX 730 receives the serialized input RGB data 701 from the input port 702A, de-serializes it, and transmits parallelized input RGB data 703 to the processing device 720. The processing device 720 receives the parallelized input RGB data 703--in which the initial values r.sup.i, g.sup.i, and b.sup.i are provided from RX 730 in a parallel manner, and modifies it in accordance with steps 420, 430 and 440 of algorithm 400. The processing device 720 produces parallelized output RGB data 707--in which modified values r.sup.m, g.sup.m, and b.sup.m are transmitted to TX 740 in a parallel manner. TX 740 serializes the parallelized output RGB data 707 and transmits serialized output RGB data 709 to the output port 702B. The processing module 710 outputs, at the output port 702B in accordance with step 450 of algorithm 400, serialized output RGB data 709--in which the modified values r.sup.m, g.sup.m, and b.sup.m are provided to a display device in a serial manner.
[0131] In some implementations, RX 730 can include an integrated circuit configured as an HDMI receiver, e.g., a low power 165 MHz HDMI receiver ADV7611 fabricated by Analog Devices.TM.. In some implementations, TX 740 can include an integrated circuit configured as an HDMI transmitter, e.g., a 225 MHz HDMI transmitter ADV7511 fabricated by Analog Devices.TM..
[0132] In some implementations, the input port 702A of the processing module 710 can be coupled with the HDMI input 102I/102I* of the dongle 100B/100B*, which in turn is coupled with an HDMI output of a video source. For example, the video source can be a computer, a video camera or any other of the video sources described above in connection with FIGS. 2A-2B, 3 and 4. Any one of these examples of video sources can controllably generate video data (e.g., RGB, YUV, or other conventional representations of video data) to be processed by the processing module 710. In some implementations, the output port 702B of the processing module 710 can be coupled with the HDMI output 102O/102O* of the dongle 100B/100B*, which in turn is coupled with an HDMI input of a display device. For example, the display device can be a computer monitor, a TV set, or any other of the display devices described above in connection with FIGS. 2A-2B, 3 and 4. Note that, in some cases, at least some of the foregoing examples of video sources can provide the serialized input RGB data 701 as encrypted, high-definition content protection (HDCP) data. In such cases, RX 730 is configured to decrypt the HDPC data, such that the parallelized input RGB data 703 to be processed by the processing device 720 in accordance with algorithm 400 is decrypted data. Also in such cases, TX 740 is configured to re-encrypt the data processed by the processing device 720 in accordance with algorithm 400 and to output the serialized output RGB data 709 as encrypted data.
[0133] In some implementations, the processing device 720 can include an integrated circuit configured as an FPGA device, in which case the electronic processing module 710 is implemented as an FPGA board that supports the FPGA device. Note that RX 730 and TX 740 can be disposed directly on the FPGA board or on respective daughter cards, each connected to the FPGA board. Further in this case, a high speed parallel data bus of the FPGA board 710 (represented by triple lines in FIG. 7B) can be used by the FPGA device 720 to receive the parallelized input RGB data 703 and transmit the parallelized output RGB data 707. Furthermore, a high speed serial data bus of the FPGA board 710 (represented in FIG. 7B by thick solid lines) can be used by RX 730 to receive the serialized input RGB data 701 and by TX 740 to transmit the serialized output RGB data 709.
[0134] Also, an inter-integrated circuit (I2C) communications bus (represented in FIG. 7B by thin solid lines) can be used by the FPGA device 720 to exchange instructions and/or commands with each of RX 730 and TX 740. Alternatively, at least some such instructions/commands can be stored in flash memory 760 disposed on the FPGA board 710, so the FPGA device 720, RX 730 and TX 740 can use it to configure themselves upon boot-up.
[0135] In the example illustrated in FIG. 7B, the FPGA device 720 includes a data path block 722 and a processor subsystem 724 (also referred to as a control plane). The processor subsystem 724 can communicate with the data path block 722 through a port 726 using a master-slave interface.
[0136] The data path block 722 can be configured to process the parallelized input RGB data 703 in accordance with the algorithm 400. The processor subsystem 724 includes a micro-controller and two or more registers to store processing parameters. The processor subsystem 724 is used to set bits and/or registers that trigger and/or control the processing of parallelized input RGB data 703. In the example shown in FIG. 7B, a first register of the processor subsystem 724 stores a value of a first processing parameter t that determines whether transformation of the parallelized input RGB data 703 is to be performed by the data path block 722. In some cases, the first processing parameter t, also referred to as a threshold parameter, can be set to 0. Also in this example, a second register stores a value of a second processing parameter p, also referred to as a scale parameter, used by the data path block 722 to calculate, e.g., in accordance with EQ. (2), a scale that determines power reduction of the initial value r.sup.i or increase of the initial values g.sup.i and b.sup.i of the parallelized input RGB data 703. A supervisor agent (e.g., a user, a supervisor device or a supervisor process) can access the set of parameter values {t, p}725 stored in the first and second registers and modify them.
[0137] Note that in some implementations, the processor subsystem 724 need not be local to the FPGA device 720, instead the processor subsystem can be implemented as part of a remote device that provides the set of parameter values {t, p} 725 to the data path block 722 in a wireless manner, e.g., through a WiFi chip 750. Note that the WiFi chip 750 can be disposed directly on the FPGA board 710 or on a daughter card coupled with the FPGA board. In such implementations, an initial instance of the set of parameter values {t, p} 725--to be loaded to the port 726 of the data path block 722 upon boot-up of the FPGA board 710--can be stored in the flash memory 760 disposed on the FPGA board 710. Subsequent changes in the values {t, p} of the parameter set 725 can be received wirelessly via the WiFi chip 750, for instance.
[0138] In the example illustrated in FIG. 7B, the data path block 722 of the FPGA device 720 is configured to (i) determine, in accordance with step 420 of algorithm 400, a relative level of stimulation of different cones based on initial values r.sup.i, g.sup.i, and b.sup.i of the parallelized input RGB data 703, e.g., based on a difference between the initial values r.sup.i and g.sup.i; (ii) identify, in accordance with step 430 of algorithm 400, whether the parallelized input RGB data 703 associated with respective pixels are to be modified; and (iii) transform, in accordance with step 440 of algorithm 400, the parallelized input RGB data 703 associated with the identified pixels, based on EQ. (2) and EQ. (4) and using the difference between the initial values r.sup.i and g.sup.i determined in step 420, to produce modified values r.sup.m, g.sup.m, and b.sup.m of the parallelized output RGB data 707. The operations performed by the data path block 722 of the FPGA device 720 are described below.
[0139] A first operation Op1, that corresponds to step 420 of algorithm 400, is performed by the data path block 722 to calculate, based on EQ. (2), a difference between initial values r.sup.i and g.sup.i:
d=r.sup.i-g.sup.i. (Op1)
[0140] A second operation Op2, that corresponds to step 430 of algorithm 400, is performed by the data path block 722 to compare the calculated difference with the threshold parameter t:
d > t ? . ( Op2 ) ##EQU00002##
[0141] If the calculated difference exceeds the threshold parameter t, then a modification sequence that corresponds to step 440 of algorithm 400 is performed next. As a first operation of the modification sequence (and a third overall operation Op3), the calculated difference is scaled by the scale parameter p:
tmp=p.times.d. (Op3)
[0142] As a second operation of the modification sequence (and the fourth overall operation Op4), a first modification term is determined to be used, based on EQ. (4), to modify the initial value r.sup.i:
tmp 1 = tmp 2 . ( Op4 ) ##EQU00003##
[0143] As a third operation of the modification sequence (and the fifth overall operation Op5), a second modification term is determined to be used, based on EQ. (4), to modify both initial values g.sup.i and b.sup.i:
tmp 2 = tmp 1 2 . ( Op5 ) ##EQU00004##
[0144] As a fourth operation of the modification sequence (and the sixth overall operation Op6), modified values r.sup.m, g.sup.m, and b.sup.m are produced, in accordance with EQ. (4), in the following manner:
r.sup.m=r.sup.i-tmp.sub.1
g.sup.m=g.sup.i+tmp.sub.2
b.sup.m=b.sup.i+tmp.sub.2. (Op6)
[0145] In this example, the modification performed based on operations (1)-(6) is equiluminant, as the amount of power subtracted from an initial value r.sup.i is added to initial values g.sup.i and b.sup.i. E.g., half of the amount of power subtracted from the initial value r.sup.i is added to the initial value g.sup.i and the other half to the initial value b.sup.i, because
tmp 2 = tmp 1 2 . ##EQU00005##
By comparing Op6 to EQ. (4), the following equivalencies hold true relative to the calculated modification terms:
tmp 1 = - p .times. ( r i - i ) 2 = .alpha. ( r i - i ) ; and tmp 2 = p .times. ( r i - i ) 4 = .beta. ( r i - i ) or .gamma. ( r i - i ) . ##EQU00006##
This is equivalent to
.alpha. = - p 2 , and .beta. = .gamma. = p 4 , ##EQU00007##
as required for a transformation that is equiluminant.
[0146] For example, operations (1)-(6) used, in conjunction with a first instance of the set of processing parameters {t=0, p=0.8} 725, to modify initial values [255, 0, 0] of the parallelized input RGB data 703 result in final values of [153, 51, 51] of the parallelized output RGB data 707. As another example, operations (1)-(6) used, in conjunction with a second instance of the set of processing parameters {t=0, p=0.4} 725, to modify initial values [240, 121, 44] of the parallelized input RGB data 703 result in final values of [216, 133, 56] of the parallelized output RGB data 707.
[0147] FIG. 7C shows that the data path block 722 of the FPGA device 720 uses N.gtoreq.2 parallel instances of a data pipeline 780 to perform, on a one-pixel-at-a-time basis, N operations required to carry out a particular portion of algorithm 400. The data pipeline 780 includes N operations, where N=2, 3, 4, 5, 6, 7, 8, 9, 10, 12, 15, 20, 50, 100 or more operations depending on the complexity of particular portions of algorithm 400.
[0148] During a given clock cycle, the initial values r.sup.i, g.sup.i, and b.sup.i of input RGB data 703(p.sub.j;0) corresponding to pixel p.sub.j of an unmodified video frame f.sup.i are input, through an input switch 728A, into the data pipeline 780. Note that the index 0 used here for the input RGB data 703(p.sub.j;0) denotes the fact that zero operations have been performed on this data prior to pipeline processing. For the next N clock cycles, the RGB data 705(p.sub.j;k) corresponding to pixel p.sub.j is being processed on a one-operation-per-clock-cycle basis, where k is the operation index, k=1 . . . N. In FIG. 7C, operations of the data pipeline 780 that have been already performed are represented using the symbol "x", and operations of the data pipeline remaining to be performed are represented using the symbol "o". During the (N+1).sup.th clock cycle, the modified values r.sup.m, g.sup.m, and b.sup.m of output RGB data 707(p.sub.j;N) corresponding to pixel p.sub.j are output, through an output switch 728B, from the data pipeline 780. Note that the index N used here for the output RGB data 707(p.sub.j;N) denotes the fact that N operations have been performed on this data as part of processing through the data pipeline 780.
[0149] In the example shown in FIG. 7C, N=6 corresponding to operations (1)-(6) used to carry out steps 420, 430 and 440 of algorithm 400, as described above. Moreover, FIG. 7C shows a snapshot of RGB data through the data path block 722 for a current clock cycle. Here, RGB data 705(p.sub.j;6) corresponding to pixel p.sub.j has been launched into the 1.sup.st instance of the pipeline 780[1] 6 clock cycles ago; it has been processed through operations (1)-(5) on a one-clock-cycle-at-a-time basis; and it is now being processed at operation 6. RGB data 705(p.sub.j+1;5) corresponding to next pixel p.sub.j+1 has been launched into the 2.sup.nd instance of the pipeline 780[2] 5 clock cycles ago; it has been processed through operations (1)-(4) on a one-clock-cycle-at-a-time basis; and it is now being processed at operation 5. RGB data 705(p.sub.j+2;4) corresponding to 2.sup.nd-next pixel p.sub.j+2 has been launched into the 3.sup.rd instance of the pipeline 780[3] 4 clock cycles ago; it has been processed through operations (1)-(3) on a one-clock-cycle-at-a-time basis; and it is now being processed at operation 4. And so on and so forth to RGB data 705(p.sub.j+5;1) corresponding to 5.sup.th-next pixel p.sub.j+5 that has been launched into the 6.sup.th instance of the pipeline 780[6] during the current clock cycle; and it is being processed at operation 1. Further during the current clock cycle, input RGB data 703(p.sub.j+6;0) corresponding to pixel p.sub.j+6 has been queued upstream with respect to the input switch 728A of the data path block 722 to be launched in the 1.sup.st instance of the pipeline 780[1] during the next clock cycle. Zero operations have been performed on the input RGB data 703(p.sub.j+6;0) and on later input RGB data, e.g., input RGB data 703(p.sub.j+7;0), etc., until the current clock cycle. Also during the current clock cycle, output RGB data 707(p.sub.j-1;6) corresponding to previous pixel p.sub.j-1 has been queued downstream with respect to the output switch 728B of the data path block 722 to be transmitted away from there. Six operations have been performed on the output RGB data 707(p.sub.j-1;6) and on earlier output RGB data, e.g., output RGB data 707(p.sub.j-2;6), etc., until the current clock cycle.
[0150] In general, FIG. 7C shows that RGB data items, that correspond to a sequence of N pixels of an unmodified video frame f.sup.i, are received in a serial manner on a main data pipeline of the data path block 722; then they are processed on N parallel instances of a portion of the main data pipeline, the portion including N operations through which each RGB data item advances, by one operation per clock cycle, as the RGB data items are staggered with respect to each other by one operation; finally, the processed RGB data items converge back in a serial manner to the main data pipeline. A data processing speed at which the data path block 722 processes the RGB data is determined by a value of the clock cycle, i.e., a short clock cycle corresponds to a large data processing speed. In some implementations, the clock cycle is set using an oscillator disposed on the FPGA board 710. For instance, the onboard oscillator can control the input switch 728A and the output switch 728B of the data path block 722 to determine a rate at which the RGB data items are launched on respective instances of the data pipeline and extracted therefrom after N cycles. In order to modify the input RGB data 703 in real time, without having to buffer it, the processing speed of the data path block 722 must equal the data rate of the input RGB data.
[0151] For example, for video data having a refresh rate of 60 frames per second (FPS) and a pixel resolution of 1920.times.1080, its data rate is about 148.5 MHz. In this case, the data path block 722 having a clock cycle associated with a 148.5 MHz oscillator can modify input RGB data 703 in real time, without having to buffer it. As another example, for video data having a refresh rate of 120FPS and the same pixel resolution of 1920.times.1080, its data rate is about 297 MHz. In this case, the data path block 722 having a clock cycle associated with a 297 MHz oscillator can modify input RGB data 703 in real time, without having to buffer it. As neither of the above examples requires caching of input RGB data 701/703, the processing device 720 could beneficially modify a movie without having to first cache it locally. Such caching, sometimes done overnight, could run a viewer's experience.
[0152] Note that to operate the data path block 722 using the above-noted clock cycle values and without having to buffer the input RGB data 703, it has been assumed that each of the operations (1)-(N) can be performed within a single clock cycle. If a longer clock cycle is needed to perform any of the operations (1)-(N), then the data processing speed has to be appropriately reduced. As such, if the data processing speed is reduced below the video data rate, then some appropriate video data buffering would be performed ahead of data path block 722.
[0153] In some implementation, to speed up execution of each of the operations (1)-(N), the operations (1)-(N) are implemented as integer operations, as opposed to decimal operations. As operations performed on integer values tend to be performed faster than operations performed on decimal values, the initial values r.sup.i, g.sup.i, and b.sup.i of input RGB data 703 and the values of the set of processing parameters {t,p} 725 are converted from decimal format to integer (i.e., fixed-point) format, e.g., prior to insertion into the data path block 722. Moreover, the modified values r.sup.m, g.sup.m, and b.sup.m of output RGB data 707 are converted from integer format to decimal format, e.g., once they are output from the data path block 722. In the example illustrated in FIG. 7C, a decimal-to-integer converter 792 of the FPGA device 720 is disposed upstream from the data path block 722, and an integer-to-decimal converter 794 is disposed downstream from the data path block. For example, the decimal-to-integer converter 792 can be implemented as logic to multiply the initial values r.sup.i, g.sup.i, and b.sup.i and the values of {t,p} received in decimal format by 2.sup.16, and the integer-to-decimal converter 794 can be implemented as logic to divide the modified values r.sup.m, g.sup.m, and b.sup.m of output in integer format by 2.sup.16. Note that in the example illustrated in FIG. 7C, the gains in processing speed far outweigh potential loss of precision when performing the modification of the input RGB data in accordance with operations (1)-(N) implemented as integer operations as opposed to the operations (1)-(N) implemented as decimal operations.
[0154] In some other implementations, the operations (1)-(N) associated with algorithm 400 can be performed in parallel on K.times.N RGB data items, that correspond to K sequences of N pixels of an unmodified video frame f.sup.i, received in a serial manner on a data pipeline 780 of a data path block. The received K.times.N RGB data items can be processed on K.times.N parallel instances of a portion of the data pipeline 780, the portion including N operations through which each RGB data item advances, by one operation per clock cycle, as the RGB data items are staggered with respect to each other by one operation. In this manner, at least a portion of algorithm 400 will be processed, by the data path block configured with K.times.N instances of the data pipeline 780, K times faster, where K=2, 5, 10, 12, 15, 20 or other multipliers, compared to the data path block 722 configured with N instances of the pipeline 780.
[0155] As the technologies described above in connection with FIG. 7C do not require buffering of the input RGB data 703, the following techniques can be used to modify differently initial values r.sup.i, g.sup.i, and b.sup.i of pixels from different regions of an unmodified video frame f.sup.i. In some implementations, to modify the initial values r.sup.i, g.sup.i, and b.sup.i of a first set of adjacent pixels (e.g., in a first window presented in a GUI) of the video frame f.sup.i using a first instance of the set of processing parameters {t,p} 725, and a second set of adjacent pixels (e.g., in a second window presented in the GUI) of the video frame f.sup.i using a second instance of the set of processing parameters {t.sub.2,p.sub.2}, one or more counters can be configured as part of the FPGA device 720. Such counter(s) can be used to track whether the next N pixels to be processed in parallel through the N instances of the data pipeline 780 belong to the same region of the video frame as the N pixels that are currently processed, and if not so, update the set of processing parameters currently in use to the other set of processing parameters to be used when processing the next N pixels.
[0156] Referring back to FIG. 7B, in some implementations when the processing module 710 is included in the dongle 100B/100B*, the processing module can be configured to operate based on M predetermined settings, each of the predetermined settings associated with a respective instance of the parameter set {t.sub.j,p.sub.j} 725, j=1 . . . M, and corresponding to a predetermined modification level, e.g., 5%, 10%, 15%, . . . , M.sup.th% reduction in the initial value of r.sup.i, for instance. In some implementations, the predetermined settings can be set, and/or selected, by a user of the dongle 100B/100B*, e.g., via user-input. In other implementations, an appropriate one of the predetermined settings can be automatically selected, e.g., based on properties of a current image frame of a movie. The properties can be contrast, color saturation, etc. In the example illustrated in FIG. 7B, the processing module 710 includes K.gtoreq.2 buttons 770 used to toggle between respective values of the first processing parameterp (e.g., p.sub.lo, p.sub.hi, etc., up to K settings), t (e.g., t.sub.lo, t.sub.hi, etc., up to K settings). The buttons 770 can be used by the user to set a desired combination of values for the processing parameter set {t,p} 725 to cause the dongle 100B/100B* to perform a custom modification of the initial values r.sup.i, g.sup.i, and b.sup.i of the input RGB data 703.
[0157] In some implementations when the processing module 710 is included in the dongle 100B/100B*, the processing module 710 can include a power management module for managing power provided by a power source, that is external to the dongle, to the various components of the processing module, e.g., the processing device 720, RX 730, TX 740, WiFi chip 750, flash memory 760 and buttons 770. Power for performing the technologies described in connection with FIG. 7C is to be provided to the dongle 100B/100B* over a USB connection 104, as power provided over HDMI connections 102I*/102O* may be insufficient.
[0158] In other implementations, the processing device 720 can be replaced with an ASIC to be part of the processing module 710 along with RX 730, TX 740, WiFi chip 750, flash memory 760 and buttons 770. In some other implementations, the processing device 720 and RX 730 and/or TX 740 can be integrated in an ASIC to be part of the processing module 710 along with the remaining components. Either of these or other ASIC implementations of the disclosed technologies can reduce the number of pipeline stages and increase processing speed. Fab technologies to fabricate such an ASIC could be of the inexpensive variety.
[0159] In general, the algorithm 400 may implement one or more techniques to improve computation efficiency and avoid, for example, issues with latency when delivering images to a display. For example, in some embodiments, only a subset of the pixels and/or frames are evaluated for modification. For example, for purposes of computational efficiency, not every frame is evaluated (e.g., only every other frame, or fewer, is evaluated). Such sampling may improve latency of the algorithm 400 when executed in real time.
[0160] In some embodiments, not every pixel is evaluated in every frame. For example, only those pixels proximate to the center of the frame (e.g., where the viewer is more likely to focus) are evaluated. Alternatively, only those pixels distant from the center of the frame, where the viewer is less likely to notice changes, are evaluated. Alternatively, or additionally, image analysis techniques can be applied to identify which portions of a frame are in focus (and therefore likely to be focused on by the viewer) and apply color modification only to those pixels in the focused portions.
[0161] In some implementations, the algorithm 400 periodically samples pixels in each frame in order to decide whether to evaluate other pixels. For example, the algorithm 400 can check the color of every 2.sup.nd or fewer pixels (e.g., every 3.sup.rd pixel or fewer, every 5.sup.th pixel, every 10.sup.th pixel or fewer, every 20.sup.th pixel). In the event that this initial sampling detects a pixel that is a candidate for modification, the algorithm 400 can apply color modification to the identified pixel. Pixels in between the sampled areas can either be left unmodified or further sampled to determine if they are candidates for modification. Alternatively, they could be modified by the same linear transformation as the initially sampled pixel, or interpolated values in between sampled pixels could be used to determine the final pixel values. Such sampling techniques may be useful to improve speed of the algorithm 400, so that it is not necessary to evaluate every pixel in every frame.
[0162] Compression techniques used for encoding images may also be used to improve efficiency. For example, in some embodiments, Chroma subsampling may be used. Examples of Chroma subsampling include 4:2:2, 4:2:1, 4:1:1, and 4:2:0 subsampling. This subsampling may also be useful to improve speed of the algorithm 400, so that it is not necessary to evaluate every pixel in every frame. Using these techniques, the resolution of color pixels generally is reduced so that pixel rendering of color becomes easier without being readily noticeable to viewers. Alternatively, the resolution could be kept the same as in the initial image, and in-between pixels would be derived from interpolated values or linear transformation based upon the sampled pixels. Note that buffering could be implemented, if at least some of the above intermediate processes are to be performed on an entire frame of video, before starting, or after completing, the algorithm 400. For instance, to go from YUV 4:2:2 to YUV 4:4:4 (i.e. compressed--or "sub-sampled"- to uncompressed YUV data) would require real-time buffering for the interpolation. Likewise, to go from YUV 4:4:4 to YUV 4:2:2 for decimation would also require buffering. The foregoing examples of intermediate processing buffering can be handled by RX 730 and/or TX 740, for instance.
[0163] Input from additional hardware components can also be used to modify the color modification algorithm described above. In some embodiments, the system can include an eye-tracking module in order to follow which location on the display a user is viewing. Subsequently, color modification is applied to only the location on the display being viewed. Alternatively, color modification is applied to only the locations on the display that are not being viewed. Commercially-available eye tracking solutions may be used for this purpose. An example of a commercially-available solution is the Tobii EyeX Controller, available from Tobii AB (Danderyd, Sweden).
[0164] In some embodiments, the algorithm 400 modifies those portions of an image that are not the focus of the viewer, but leaves the portion of the image that is focused on unchanged. In this way, the impact of the modification on the viewing experience is reduced because the modified pixels are in the viewer's periphery.
[0165] Such an approach may be especially useful in applications which render text, such as in e-readers and word processing software. Text is often displayed in high-contrast black and white which, for reasons discussed previously, can elicit a particularly acute myopiagenic response even though these images typically contain no red pixels. In some embodiments, text can be rendered in high contrast only within a portion of the image (e.g., a viewing bubble) and text outside of this area can be display with reduced contrast and/or with a blurred effect. In some embodiments, there can be a gradient between the defocused/low contrast portion of the image and the viewing bubble. In order to facilitate reading, the bubble can be moved over the text or the text can be moved through a stationary bubble. The speed of relative movement may be selected according to a preferred reading speed of the user (e.g., 20 words per minute or more, 50 words per minute or more, 80 words per minute or more, 100 words per minute or more, 150 words per minute or more, 200 words per minute or more, 250 words per minute or more, 300 words per minute or more, 350 words per minute or more, 400 words per minute or more, 450 words per minute or more, 500 words per minute or more, up to about 800 words per minute).
[0166] The size and shape of the viewing bubble can also vary as desired. The viewing bubble can correspond to an angle of about 20.degree. or less in a user's field of view (e.g., 15.degree. or less, 10.degree. or less, 5.degree. or less) in the horizontal and/or vertical viewing directions. The viewing bubble can be elliptical, round, or some other shape. In some embodiments, the user can set the size and/or shape of the viewing bubble.
[0167] In some embodiments, the viewing bubble can track the user's finger as it traces across lines of text. Devices may utilize a touch screen for finger tracking. Alternatively, the bubble can be moved by tracing a, stylus, mouse, or other indicator of attention.
[0168] A variety of techniques for establishing the viewer's focus can be used depending on the implementation. For example, eye-tracking technology can be used to follow the location on the display a user is viewing. The algorithm 400 can use information from an eye-tracking camera to identify pixels for modification in real time. Those pixels away from the viewed location are modified while the area of focus is unmodified (or modified to a lesser extent). Eye-tracking may be particularly useful in mobile devices (e.g., using the front facing camera), computer monitors (e.g., using a video-conferencing camera), and/or with video game consoles, for example.
[0169] Alternative Cone Stimulation Determinations and Myopia Scales
[0170] Rather than simply compare the r.sup.i, g.sup.i, and/or b.sup.i values in order to assess whether a pixel will differentially stimulate cones, including L and M cones, in the retina, in some embodiments the algorithm 400 calculates other quantifiable measures of cone stimulation by the image. In some embodiments, these measures include only L cones and M cones. In other embodiments, the contributions of S cones are also included. In some embodiments, calculating cone stimulation first involves translating RGB values for each pixel to a color space that quantitatively links the spectral content of the pixel to the physiologically perceived colors in human vision. One example of such a color space is the CIE 1931 XYZ color space, discussed previously. This color space defines the XYZ tristimulus values analogously to the LMS cone responses of the human eye. Thus, rather than compare r.sup.i and g.sup.i in order to assess which pixels require color modification, algorithms can compare X and Y (or X, Y, and Z, if desired). For example, in some case, color modification is applied to those pixels for which X>Y and Z, but not for pixels where X<Y and/or Z.
[0171] Alternatively, or additionally, cone stimulation values in LMS color space can be calculated from the XYZ tristimulus values (see, e.g., https://wn.wikipedia.org/wiki/LMS_color_space). Algorithms for performing such calculations are known (see, e.g., the xyz2lms program, available at www.imageval.com/ISET-Manual-201506/iset/color/transforms/xyz21ms.html). With LMS values, color modification can be applied to candidate pixels, for example those whose L values are above a certain threshold and/or those pixels for which L>M (e.g., L>M and S).
[0172] Alternatively, cone stimulation can be calculated directly using the physical properties of light. Light intensity and wavelength from each of R, G, and B can be measured from a device such as a television, computer, or tablet. The intensity of each wavelength that passes through the eye and reaches the retina can be calculated. These values can then be translated into stimulation of L, M, and S cones, for example by using the Smith-Pokomy cone fundamentals (1992) or the cone fundamentals as modified by Stockman and Sharpe (2000).
[0173] While the foregoing techniques may be useful for modifying displayed images to reduce their myopiagenic effects, these techniques are based solely on the image information and do not account for variations between people's retina or conditions under which the images are viewed.
[0174] It is also possible to account for varying ratios of different cones a viewer's eyes and/or varying spatial distributions of cones. This is important because different individuals are known to have different proportions of L cones to M cones. In addition, different population groups, on average, have different proportions of L cones to M cones. Caucasians, for example, have approximately 63% L cones on average, while Asians have equal numbers of L to M cones on average. Accordingly, the myopiagenic effect of a particular stimulus can differ for different population groups.
[0175] The effects of a stimulus on differing retina may be calculated based on retina models (or `simulated retina`), for example. Referring to FIG. 9, an exemplary algorithm 900 for determining cone stimulation levels by an RGB formatted stimulus on a simulated retina is as follows. Algorithm 900 starts (901) by establishing a simulated retina (920). Generally, this involves establishing a relative number of L, M, and S cones, and establishing their arrangement pattern. FIG. 6B shows an example of a simulated retina. Here, different numbers of L, M, and S cones are randomly arranged with hexagonal packing (i.e., on a brickwall-patterned grid).
[0176] Algorithm 900 receives the stimulus pattern in RGB format (910). The RGB stimulus pattern corresponds to the colors of a pixel array, as discussed previously. In general, the pixel array can correspond to a single image frame or a portion of an image frame, for example. Generally, where an input video file is being analyzed, each frame will correspond to a separate RGB stimulus pattern. FIG. 6A shows an example of a stimulus pattern.
[0177] In step 930, the RGB values for each element of the stimulus pattern are converted into a corresponding set of XYZ tristimulus values. Such transformations are well-known. See, e.g., "Colour Space Conversions," by Adrian Ford (ajoecl@wmin.ac.uk <defunct>) and Alan Roberts (Alan.Roberts@rd.bbc.co.uk), Aug. 11, 1998, available at http://www.poynton.com/PDFs/coloureq.pdf. Next, in step 940, LMS values are calculated from each of the XYZ tristimulus values using, e.g., xyz2lms.
[0178] In step 950, the stimulus pattern is then mapped onto the simulated retina. In this example, the elements of the stimulus pattern are in a 1:1 correspondence with the cones of the simulated retina and the mapping results in the selection of the L, M, or S value at each element of the stimulus pattern depending on whether the cone at the corresponding retina location is an L cone, an M cone, or an S cone, respectively.
[0179] A stimulation level at each cone is determined from the mapping (step 960). In some implementations, this determination simply involves assigning each cone the L, M, or S value based on the mapping. In certain cases, the LMS value is scaled to fall within a particular range or the LMS value is weighted to increase or decrease a contribution due to certain portions of the spectrum or other factors.
[0180] The algorithm ends (999) after outputting (970) the cone stimulation levels.
[0181] Implementations may involve variations of algorithm 900. For example, while algorithm 900 involves a 1:1 pixel to cone mapping, higher or lower mapping ratios may be used. For example, in some instances, cone stimulation can be calculated for stimuli where more than one pixel is imaged to a single cone. This may occur, for example, in high resolution displays or where a display is viewed from relatively far away. In such arrangements, the algorithm can include an additional step of averaging the color of groups of pixels to provide a stimulus pattern having the same resolution and grid shape as the simulated retina. The number of pixels per cone may vary. 2 or more pixels per cone may be used (e.g., 3 or more pixels per cone, 4 or more pixels/cone, 5 or more pixels per cone, 6 or more pixels per cone, 7 or more pixels per cone, 8 or more pixels per cone, 9 or more pixels per cone, or 10 pixels per cone).
[0182] In some cases, the algorithm may account for fewer than one pixel being imaged to each cone (e.g., 2 or more cones per pixel, 3 or more cones per pixel, 4 or more cones per pixel, 5 or more cones per pixel, 6 more cones per pixel, 7 or more cones per pixel, 8 or more cones per pixel, 9 or more cones per pixel, up to 10 cones per pixel). This is the case with lower resolution displays, or when displays are viewed from a closer distance. In such cases, a pixel can be assigned to more than one grid point in a stimulus pattern having the same resolution and grid shape as the simulated retina.
[0183] Some implementations can include calculating (i.e., accounting for) the number of pixels per cone for a specific display and/or user. For example, referring to FIGS. 12A and 12B, the number of pixels per cone may be calculated from the pixel density for a display as follows. First, the typical maximum retinal resolution, .theta., of 1 arc minute, is assumed, as well as a viewing distance, d, that is typically .apprxeq.2.5 times the display's diagonal dimension (i.e., a 60'' TV is viewed from 12.5' away, and a 5.5'' iPhone 6 is viewed from a foot away). The calculation can be adjusted for other viewing distances, as desired. Accordingly, knowing a screen's size and resolution (e.g., 1,920.times.1,080 for a 1080p 60'' TV set, 1,334.times.750 for the 5.5'' Apple iPhone 6), one can compare the number of pixels per square area of screen and the number of cones per square area of screen. The ratio of these numbers gives the number of pixels per cone (or the reciprocal). This illustrated for a 60'' 1080P TV in FIG. 12B, for which the screen area per cone equals 0.24 mm.sup.2.
[0184] Apply this calculation for a 60'' 1080P TV and iPhone 6, the pixels per cone are 0.49 and 0.24, respectively.
[0185] In some embodiments, the point spread function of light can be used to map the light coming from the pixels to cones in the retina. As understood by skilled artisans, the point spread function of light is due to imperfect optics of the human eye, and effects how incident light strikes the retinal cone mosaic.
[0186] In some embodiments, the equal area cone fundamentals from FIG. 1B are used to calculate the relative excitation of L, M, and S cones. Other implementations using other representations of the cone fundamentals are possible. These include cone fundamentals based on quanta, those corrected to energy terms, and those that have been normalized to peak values. Cone fundamentals for either a two-degree or ten-degree observer could be used, or any other observer for which cone fundamental data is available can be used. In addition, these calculations can be adjusted and made specific for a person's age, macular pigmentation, cone mosaic composition, and/or other factors.
[0187] In some embodiments, the equal energy illuminant D65 is used for conversions between RGB, XYZ, and LMS. In other embodiments, other illuminants can be used, such as CIE-A (incandescent lamps), CIE-C, or CIE-E.
[0188] In some embodiments, the CIECAM02 matrix is used to convert between XYZ values and LMS values. In other embodiments, other matrices are used to perform linear transformations. Any acceptable transformation matrix (or none at all, if XYZ values are used directly) can be used in this respect.
[0189] By calculating a quantifiable value for LMS cone stimulation by a stimulus pattern, it is possible to quantify the degree to which a given stimulus will differentially stimulate cones, including L cones and M cones. This quantification allows for the scoring of a stimulus (e.g., a particular image, a video file), which in turn--by comparing scores--allows for the objective comparison of the myopiagenic effect of different media.
[0190] Referring to FIG. 10, an algorithm 1000 for scoring a digital video file is as follows. This algorithm, or similar algorithms, may be applied to other media, such as image files. The algorithm starts (1001) by receiving (or generating) cone stimulus values for a simulated retina stimulated by a frame of the digital video file (step 1010). The cone stimulus values may be determined using algorithm 900 shown in FIG. 9, for example.
[0191] For each cone, the algorithm calculates (1020) an average x of the LMS stimulus values for that cone (c) and each of its neighbors (n.sub.i). For m-nearest neighbors, x is calculated as shown in EQ. (5):
x _ = 1 m + 1 ( .SIGMA. i = 1 m n i + c ) . ( 5 ) ##EQU00008##
[0192] In general, the number of neighbors will depend on the cone pattern in the stimulated retina and how many neighbors are included for each cone. In one embodiment, only the nearest neighbors are considered. For example, in a grid pattern, a cone has eight nearest neighbors. Such a pattern is illustrated in FIG. 11A. With hexagonal packing, each cone has six nearest neighbors as shown in FIG. 11B.
[0193] In steps 1030 and 1040, the difference between the neighbor stimulus values, n.sub.i, and the average, x, is calculated, and squared, and divided by x: (n.sub.i-x).sup.2/x. This provides a measure of the relative difference in stimulation between the cone, c, and each of its nearest neighbors. At 1050, these values are summed, in accordance with EQ. (6), providing a value for the Neighbor Sum of Squares (NSS) for cone, c:
NSS = .SIGMA. i = 1 m ( n i - x _ ) 2 x _ . ( 6 ) ##EQU00009##
[0194] This value provides a quantitative measured of the level of stimulation of cone, c, relative to its nearest neighbors. It is believed that a relatively high NSS value represents a large differential response and corresponds to a larger myopiagenic response from cone, c, than a lower NSS value.
[0195] While the sum of squares is used in this case to calculate a measure of relative cone stimulation, other approaches are possible. For example, the sum of absolute values of the difference between n.sub.i and x may be used instead. Alternatively, the relative absolute value |n.sub.i-x|/x or the overall range |n.sub.max-n.sub.min| may be used. Other alternatives include calculate a variance of the values or a standard deviation.
[0196] NSS values are calculated for each cone in the stimulated retina (1060) and then the NSS values can be averaged over the entire frame (1070). This process is repeated for each frame (1080) and then the NSS values averaged over all frames (1090).
[0197] Finally, the frame-averaged NSS value is scaled (1095) to a desired range (e.g., a percentage) and/or the media file is scored based on the frame-averaged NSS value.
[0198] Table 1, below, provides exemplary results of such a calculation for varying stimuli. The first column, "Frame", lists the stimulus for each experiment. A 100.times.100 pixel array was used ("pixel count"), and a 1:1 cone-to-pixel mapping assumed. The percentage of L-to-M-to-S cones varied as indicated in columns 2-4. The results of each calculation is provided in column 6 ("Raw Scale"). The score is quoted raw, un-normalized to any particular value.
TABLE-US-00001 TABLE 1 Exemplary Myopiagenic Scale Scores % % % Pixel Raw Frame L S M Count Scale Comment R = G = 100 63 5 32 100 .times. 100 4.123 R = 100 63 5 32 100 .times. 100 10.08 R = 255 63 5 32 100 .times. 100 79.4 G = 255 63 5 32 100 .times. 100 61.39 R = 255 48 5 48 100 .times. 100 97.96 Asian ratio R = 100 48 5 48 100 .times. 100 12.61 Asian ratio R = G = B = 100 63 5 32 100 .times. 100 0.217 R = G = B = 75 63 5 32 100 .times. 100 0.12 R = G = B = 255 63 5 32 100 .times. 100 1.71 R = G = B = 0 63 5 32 100 .times. 100 0 R = 255 0 5 95 100 .times. 100 1.3215 protanope R = 255 95 5 0 100 .times. 100 14.7700 deuteranope BW Checker 63 5 32 100 .times. 100 438.04 BW Checker 48 5 48 100 .times. 100 444.014 BW Checker 0 5 95 100 .times. 100 460.9 protanope BW Checker 95 5 0 100 .times. 100 425.4 deuteranope
[0199] In general, the myopiagenic value can be normalized to a scale or assigned some other identifier indicative of the contents myopiagenic effect. For example, the value can be presented as a value in a range (e.g., from 1 to 10), as a percentage, or by some other alphanumeric identifier (e.g., as a letter grade), color scale, or description.
[0200] Myopiagenic scales for content, such as the scale described above, may be useful in many ways. For example, a scale allows one to rate content (e.g., movies or other video files) as to its myopiagenic effect on a viewer.
[0201] A scale also provides an objective way to measure algorithms that modify images, including changing colors of images. They can be used to rate efficacy of algorithms designed to increase or decrease neighboring cone contrast. They can also be used to rate efficacy of algorithms designed to increase or decrease myopiagenicity. For example, one can compare algorithms by comparing the score of a common video file after it is modified using a respective algorithm. In some embodiments, one can compare the effect on myopiagenic reduction of algorithms having differing computational efficiencies using the scale. For instance, one can evaluate the tradeoff between an algorithm that modifies every frame in a video file, versus one that modifies fewer frames (e.g., every other frame, every third frame, etc.). Similarly, one can evaluate the tradeoff between algorithms that evaluate every pixel versus sampling pixels within frames.
[0202] While the examples herein describe electronic images and videos, the skilled artisan will appreciate that such a scale may be useful in the non-digital world, for example to rate the neighboring cone contrast or myopiagenicity of printed media, including books, newspapers, board games, etc. Light reflected from such physical media could be measured and retinal stimulation could be calculated in the manner set forth above.
[0203] E-Readers and Word Processors Designed Using a Myopiagenic Scale
[0204] Quantitative myopiagenic scales may be useful in the design of products in addition to evaluating media. For example, myopiagenic scales can be used to evaluate combinations of colors in certain types of displays and identify those color combinations rating favorably on the myopiagenic scale.
[0205] Such color combinations are useful when displaying text, in particular, which is commonly displayed using black text on a white background at the maximum contrast allowed by the display. However, it is believed that the high level of contrast between the text and background produces high levels of contrast at a viewer's retina, which in turn leads myopia. Accordingly, it is believed that the myopiagenic effects of reading may be reduced by selecting a color combination offering relatively low overall cone contrast. This may be useful in displaying text in various settings, including but not limited to e-book hardware, e-book software, word processing software, and the like.
[0206] Accordingly, a myopiagenic scale, such as the one described above, may be useful for selecting color combinations for displaying text. This can be accomplished by evaluating, using the scale, different combinations of colors for text and background.
[0207] By way of example, an exemplary evaluation was performed for a series of color combinations modeled using a 100.times.100 checkerboard of candidate text and background colors, with varying contrast edges. This pattern provides a stimulus with 50% text color and 50% background color. Other patterns providing different ratios between text and background colors can be used, which may be more representative of certain fonts, spacing, and margins (for example, approximately 5% text color, approximately 10% text color, approximately 15% text color, approximately 20% text color, approximately 25% text color, approximately 30% text color, approximately 35% text color, approximately 40% text color, or approximately 45% text color).
[0208] A simulated retina was used having a 100.times.100 cone pattern in linear row and column grid, and a 1:1 ratio of pixels to cones was used.
[0209] For purposes of the example, 8-bit color was assumed. Accordingly, each color was selected with values from 0-255 for each RGB. The available color space was sampled using every color in steps of 50 (6.sup.3 values for each of text and background), resulting in a total of 6.sup.6 or 46,656 combinations in total.
[0210] Referring to FIG. 13, a three-dimensional plot shows the results of the experiment. The vertical scale gives the unscaled myopiagenic score. The horizontal axes give the respective Text Color and Background Color. Note that the values on the horizontal scales are expressed in hexadecimal, where the 0-255 RGB values is converted to hex and the colors reported as RRGGBB.
[0211] Results range from myopiagenic scores of 0 (white text on white background and black text on black background) to 419.34 (black text on white backgound). Accordingly, color combinations that provide a reduced myopiagenic score (e.g., light green on cyan, with a score of 155) may be selected for use when displaying text.
[0212] Obviously, the lowest scores (white on white, black on black) are impractical because they provide no contrast between text and background and cannot be read. However, generally, color combinations with low but non-zero scores can be selected. In some cases, there is a tradeoff in the readability of the text due to low color contrast between the text and background. Accordingly, additional criteria may be considered when selecting e-reader color combinations. For example, an objective index for readability may be considered. Highest readability is expected to occur when the color system can differentiate best between text and background colors (e.g., when L and M values are most different between text and background). This is different from the myopiagenic scale which assumes that the highest myopiagenic effect occurs when adjacent cones have highest differential stimulation. In other words, the myopiagenic effect comes from both differences between text and background (which improves readability but increases myopia), but also from within text and background (which does not improve readability but increases myopia).
[0213] By way of example, readability (R) may be scored by surveying respondents.
[0214] Alternatively, it can be scored based on color contrast between text and background using the LMS system or another color system. Such differences may be quantified using a formula such as the following:
R = .alpha. R ( ( L 1 - L 2 ) 2 1 2 ( L 1 + L 2 ) ) + .beta. R ( ( M 1 - M 2 ) 2 1 2 ( M 1 + M 2 ) ) + .gamma. R ( ( S 1 - S 2 ) 2 1 2 ( S 1 + S 2 ) ) . ( 7 ) ##EQU00010##
[0215] In EQ. (7), L, M, and S are the values described above for which the subscript 1 refers to the text color and 2 refers to the background color. .alpha..sub.R, .beta..sub.R, and .gamma..sub.R are weighting factors for weighing the relative contributions of cone systems. These factors can be determined empirically. In this example, equal area functions were used for L, M, and S, and values of .alpha..sub.R=0.17, .beta.=0.84, .gamma..sub.R=0.01 were determined for a population of four observers (three trichromatic females and one male protanope), to use an example.
[0216] Readability can also be scored in other ways, for example the distance between the two colors in CIELAB space .DELTA.E*ab. This measure of color differentiation was described by Brainard and Stockman (Vision and Vision Optics, 2009, "Chapter 10: Colorimetry") and is given here in EQ. (8):
.DELTA.E*.sub.ab= {square root over ((.DELTA.L*).sup.2+(.DELTA.a*).sup.2+(.DELTA.b*).sup.2)}. (8)
[0217] Referring to FIGS. 14A and 14B, results of several color combinations from an experiment are tabulated. In each table, columns 1, 2, and 3 are the RGB values for the background color (each from 0-255), columns 4-6 are the corresponding X, Y, Z tristimulus values, and columns 7-9 the corresponding LMS values. Columns 10, 11, and 12 are the RGB values for the text color (each from 0-255), columns 13-15 are the corresponding X, Y, Z tristimulus values, and columns 16-18 the corresponding LMS values. The calculated myopiagenic scale score based on a 100.times.100 checkerboard grid with 50% text/50% background is given in column 19 and the % reduction in score relative to black text on white background (row 1) is given in column 20. An example of the color scheme is shown in column 21. The next four columns (22-25) give values related to the readability score. In particular, column 22 gives the values for
( ( L 1 - L 2 ) 2 1 2 ( L 1 + L 2 ) ) , ( ( M 1 - M 2 ) 2 1 2 ( M 1 + M 2 ) ) , and ( ( S 1 - S 2 ) 2 1 2 ( S 1 + S 2 ) ) , ##EQU00011##
respectively. Column 25 gives the readability score, R, where the values .alpha..sub.R=0.17, .beta.=0.84, .gamma..sub.R=0.01 are used. Column 26 provides a composite score that consists of the ratio readability/myopia score.
[0218] It is instructive to consider certain examples to illustrate the importance of considering readability when identifying text/background color combinations for text rendering. For example, consider a first color combination having RGB values of (200, 150, 150) for background and (100, 150, 200) for text, respectively, and a second color combination having RGB values of (250, 150, 100) for background and (250, 150, 150) for text, respectively. FIG. 15A shows a table in which columns 1, 2, and 3 are the RGB values for the background color, columns 4-6 are the corresponding X, Y, Z tristimulus values, and columns 7-9 the corresponding LMS values. Columns 10, 11, and 12 are the RGB values for the text color, columns 13-15 are the corresponding X, Y, Z tristimulus values, and columns 16-18 the corresponding LMS values. Column 19 shows the myopiagenic scale score and column 20 shows the percent reduction (as a decimal) from black text on white background; column 21 shows an example of text rendered using the color combination. Columns 22-24 give the same parameters as columns 22-24 in FIG. 14, and column 25 gives the readability score. Accordingly, using the scale described above, the myopia scores for the first and second combinations are similar (both .about.18). As is evident (at least anecdotally) from the example text in column 21, the first color combination is easier to read than the second color combination. This is borne out by their relative readability scores, which are approximately 2.0 and 0.1, respectively.
[0219] This is further illustrated in the plots shown in FIGS. 15B and 15C, respectively, which simulate cone stimulation for a stripe of text between two stripes of background across three rows having 33 cones each. FIG. 15B shows simulated cone stimulation for the first color combination. In general, the text and cones have different levels of stimulation with text stimulation levels varying approximately within a range from 32 to 40. With the exception of a few peaks of high stimulation (in this example, resulting from simulated S cones), the background stimulation levels vary within a lower, largely non-overlapping range approximately from 22 to 30.
[0220] FIG. 15C shows cone stimulation levels for the second color combination. Here, variance within text and background is similar to variance between text and background. Both text and background have larger variance compared to the first color combination (ranging from approximately 35 to 55, with the exception of a few cones having lower stimulation values due to background, in this example from simulated S cones). Cone stimulation of text overlaps with cone stimulation of background.
[0221] FIGS. 16A-16C illustrate the same principle for two further color combination examples. Referring to FIG. 16A, the first color combination has RGB values (150, 150, 150) for background and (150, 50, 50) for text. The second color combination has RGB values (250, 100, 250) for background and (150, 150, 200) for text. Again, anecdotally, the first color combination is significantly more readable than the second color combination. Columns 1-26 shows the same parameters as columns 1-26 in FIG. 15A.
[0222] FIG. 16B show a plot of cone stimulation for a stripe of text between two stripes of background for the first color combination. The text and background have significantly different levels of stimulation and variance for within the text and within the background are low compared to variance between text and background levels.
[0223] FIG. 16C show a plot of cone stimulation for a stripe of text between two stripes of background for the second color combination. Variance within text and background is similar to variance between text and background. Both text and background have larger variance compared to the first color combination and cone stimulation of text overlaps with cone stimulation of background.
[0224] While commercially-available e-readers include modes of operation that display text in color combinations other than black and white that may have a reduced myopiagenic effect compared to black text on a white background, it is believed that the disclosed implementations provide color combinations offering substantially greater reductions. For example, the NookColor offers "color text modes" such as "Night," "Gray," "Butter," "Mocha," and "Sepia" in addition to "Day" (basic black text against white background (see, e.g., http://www.dummies.com/how-to/content/noot-tablet-text-and-brightness-too- ls.html). However, it is believed that such m odes offer a lowest myopia score of about 133 (as calculated using the scale described above which yields a score of about 438 for black (0, 0, 0) text on white (255, 255, 255) background) and a readability/myopia score ratio in a range from about 0.48 to 0.60. However, as is evident from the tables shown in FIGS. 14A and 14B, color combinations having a myopia score of less than about 130 are possible (e.g., about 120 or less, about 110 or less, about 100 or less, about 90 or less, about 80 or less, about 70 or less, about 60 or less, about 50 or less, about 40 or less, about 30 or less, such as from about 20 to about 30). Compared to black and white text, such colors can offer an improvement in myopia reduction of about 65% or more (e.g., about 70% or more, about 75% or more, about 80% or more, about 85% or more, about 90% or more, about 95% or more). Color combinations having a composite readability/myopia score of 0.80 or more are possible (e.g., 0.85 or more, 0.90 or more, 0.95 or more, 1.00 or more, 1.05 or more, 1.10 or more, 1.15 or more, 1.20 or more, 1.25 or more, 1.30 or more, 1.35 or more, 1.40 or more, such as 1.45).
[0225] In general, e-reader or word processing solutions based on the above may be implemented in a variety of ways. For example, in an e-reader with a color display or an e-reader application on a mobile device, color combinations with favorable myopiagenic scores and readability scores may be selected by the user as an option. For example, during setup, the e-reader can present the user with a variety of color combination options, from which the user can selected a desirable choice. This is advantageous because preferred color combinations are expected to vary from user to user and providing a selection of choices will allow each user to use a color combination most desirable to them. By analogy, word processing solutions could be determined in a similar fashion.
[0226] Monochrome e-readers, on the other hand, such as those using electrophoretic displays, may be used having color combinations have reduced myopiagenic scores and relatively good readability based on scales such as the those described above.
[0227] Other embodiments are in the following claims.
* * * * *
References
D00000
D00001
D00002
D00003
D00004
D00005
D00006
D00007
D00008
D00009
D00010
D00011
D00012

D00013

D00014

D00015

D00016

D00017

D00018

D00019

D00020

D00021

D00022

D00023

D00024

D00025

D00026
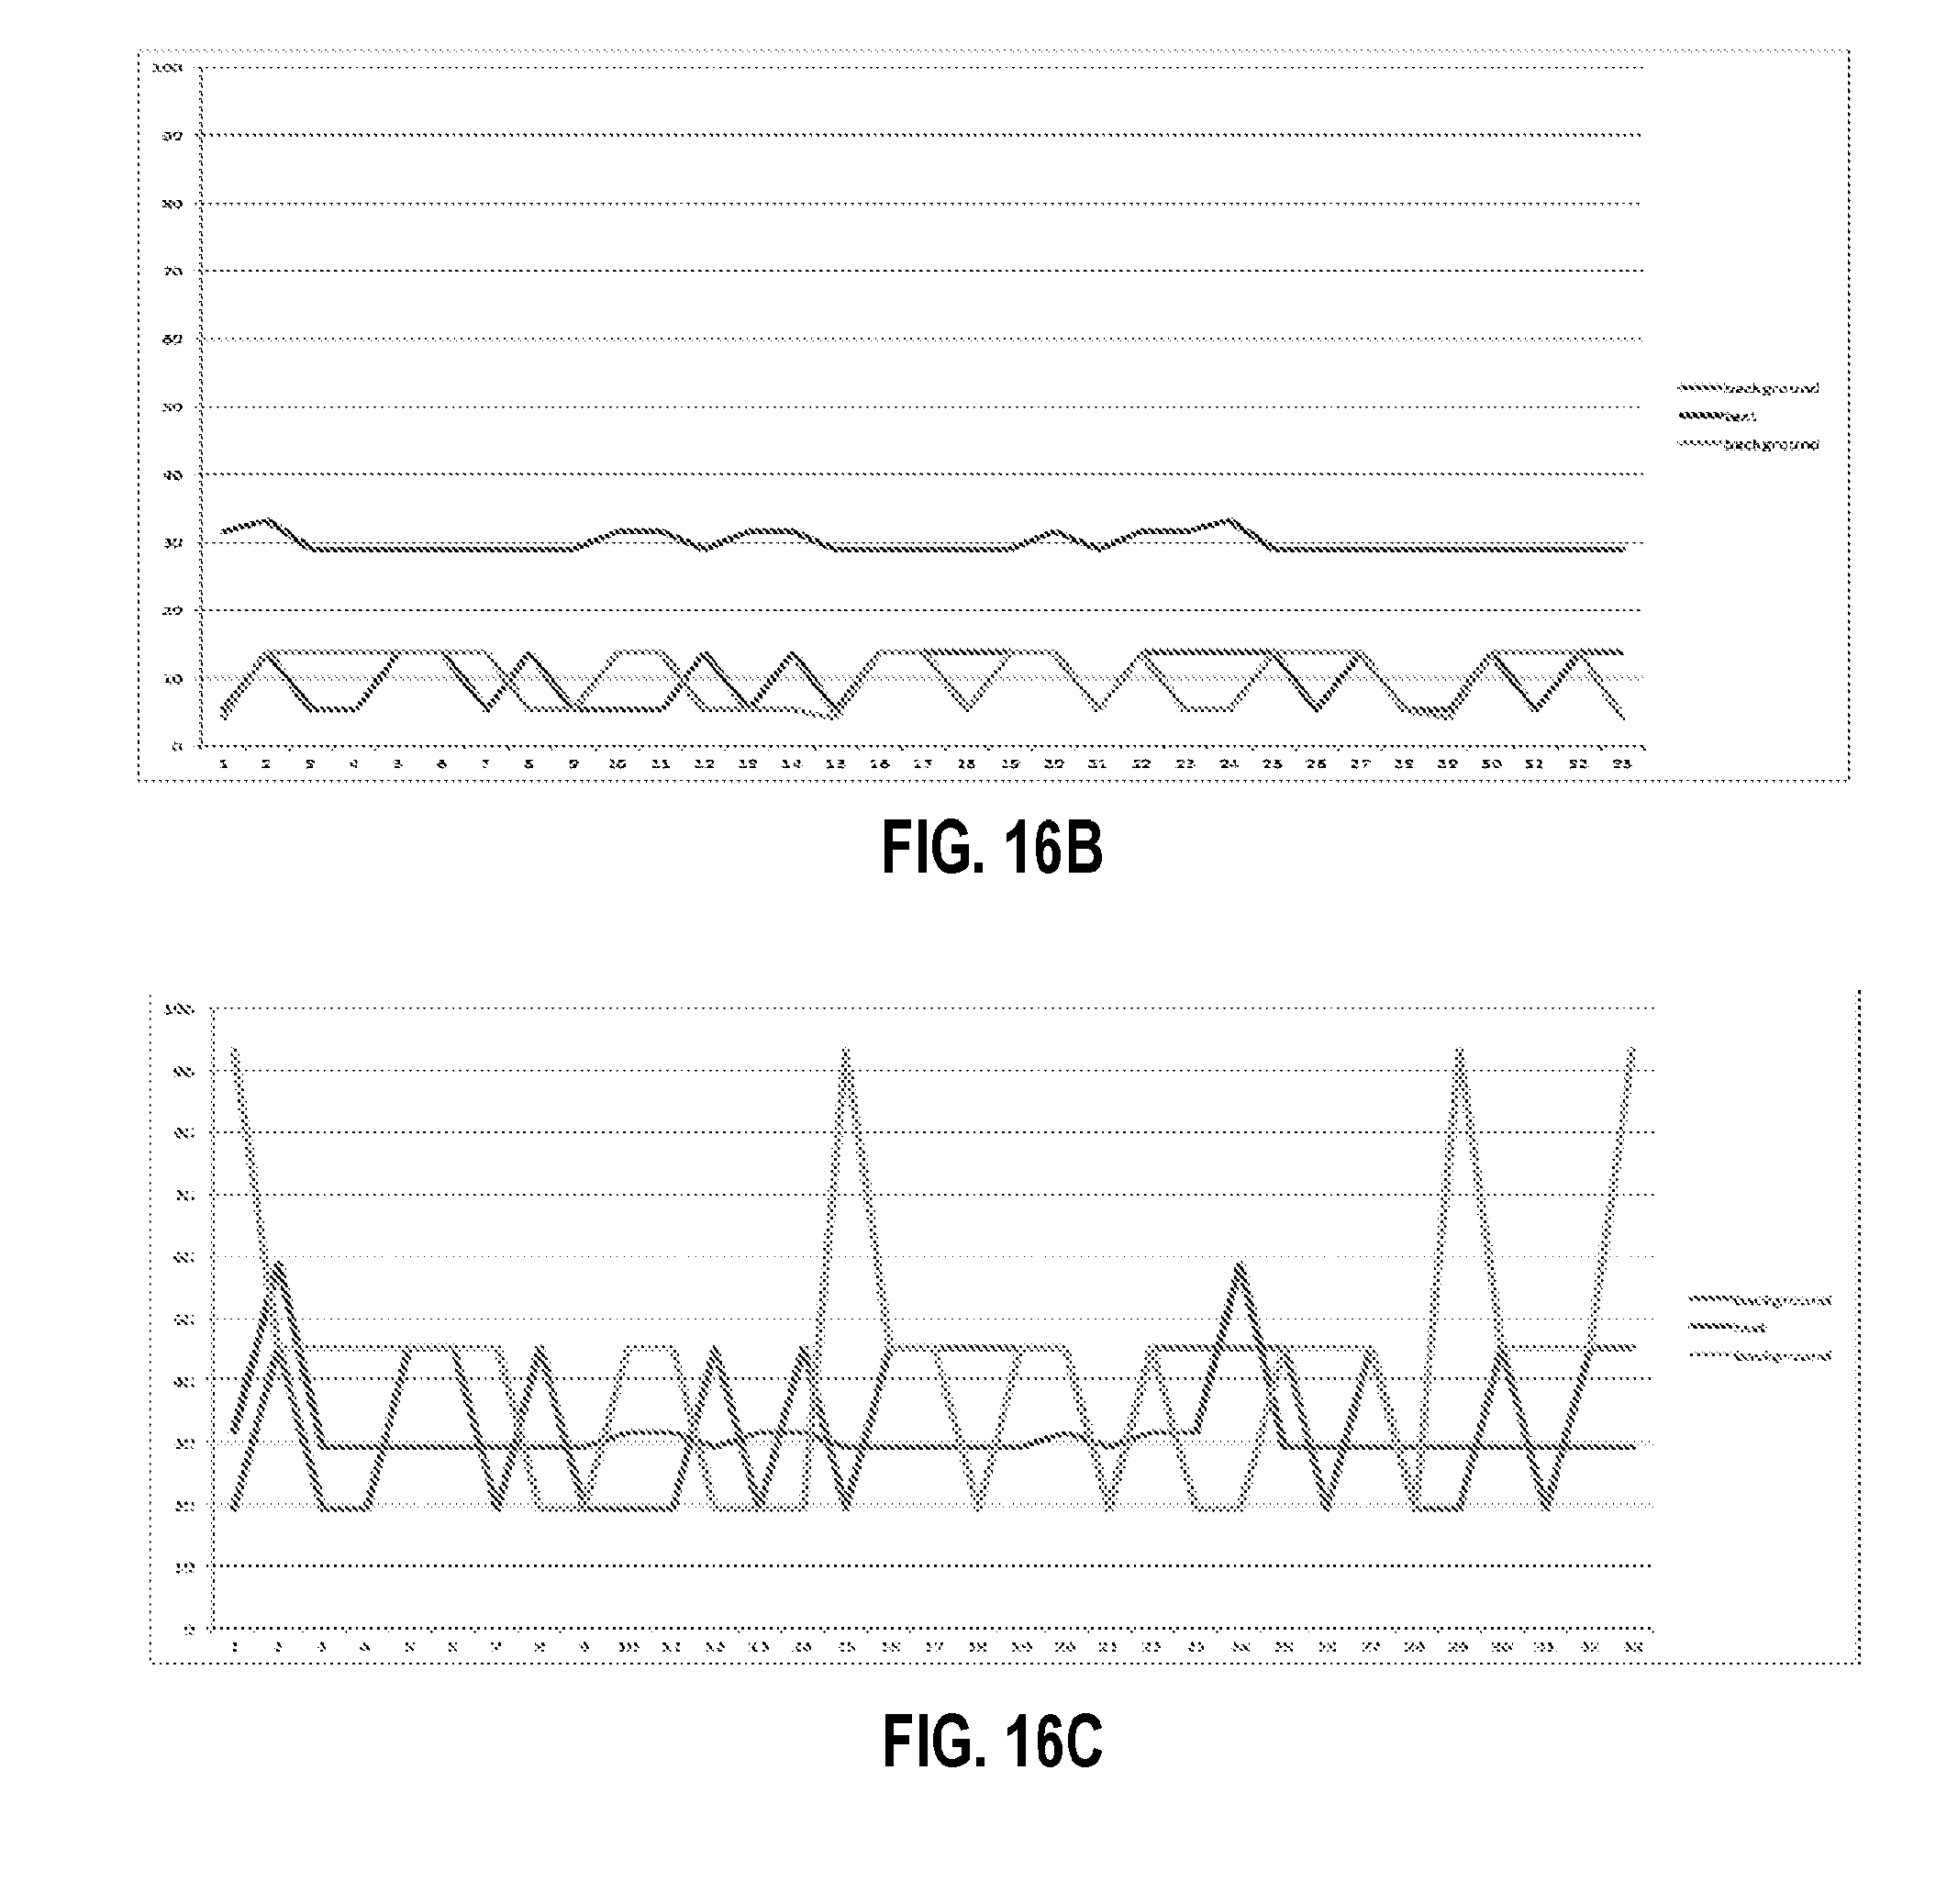


XML
uspto.report is an independent third-party trademark research tool that is not affiliated, endorsed, or sponsored by the United States Patent and Trademark Office (USPTO) or any other governmental organization. The information provided by uspto.report is based on publicly available data at the time of writing and is intended for informational purposes only.
While we strive to provide accurate and up-to-date information, we do not guarantee the accuracy, completeness, reliability, or suitability of the information displayed on this site. The use of this site is at your own risk. Any reliance you place on such information is therefore strictly at your own risk.
All official trademark data, including owner information, should be verified by visiting the official USPTO website at www.uspto.gov. This site is not intended to replace professional legal advice and should not be used as a substitute for consulting with a legal professional who is knowledgeable about trademark law.