Genetic Marker For Early Breast Cancer Prognosis Prediction And Diagnosis, And Use Thereof
SHIN; Young Kee ; et al.
U.S. patent application number 16/155220 was filed with the patent office on 2019-02-07 for genetic marker for early breast cancer prognosis prediction and diagnosis, and use thereof. The applicant listed for this patent is GENCURIX INC.. Invention is credited to Sang Rea CHO, Jun Young CHOI, Young-Deug KIM, En Sel OH, Young Kee SHIN.
| Application Number | 20190040473 16/155220 |
| Document ID | / |
| Family ID | 65229178 |
| Filed Date | 2019-02-07 |


View All Diagrams
| United States Patent Application | 20190040473 |
| Kind Code | A1 |
| SHIN; Young Kee ; et al. | February 7, 2019 |
GENETIC MARKER FOR EARLY BREAST CANCER PROGNOSIS PREDICTION AND DIAGNOSIS, AND USE THEREOF
Abstract
The present invention relates to a gene for predicting or diagnosing the prognosis of early-stage breast cancer and to a use thereof, and more specifically relates to a genetic marker for predicting or diagnosing the prognosis of breast cancer, including TRBC1 (T cell receptor beta constant 1), BTN3A2 (butyrophilin, subfamily 3, member A2) or HLA-DPA1 (major histocompatibility complex, class II, DP alpha 1) for providing information necessary for predicting or diagnosing the prognosis of a breast cancer patient. The genetic marker of the present invention allows the prediction or diagnosis of the prognosis of a breast cancer patient, and can therefore advantageously be used for the purpose of providing a direction as to the future course of breast cancer treatment, including a decision on whether anticancer therapy is necessary.
| Inventors: | SHIN; Young Kee; (Seoul, KR) ; KIM; Young-Deug; (Incheon, KR) ; OH; En Sel; (Seoul, KR) ; CHOI; Jun Young; (Gwangmyeong-si, KR) ; CHO; Sang Rea; (Seoul, KR) | ||||||||||
| Applicant: |
|
||||||||||
|---|---|---|---|---|---|---|---|---|---|---|---|
| Family ID: | 65229178 | ||||||||||
| Appl. No.: | 16/155220 | ||||||||||
| Filed: | October 9, 2018 |
Related U.S. Patent Documents
| Application Number | Filing Date | Patent Number | ||
|---|---|---|---|---|
| 14886948 | Oct 19, 2015 | |||
| 16155220 | ||||
| PCT/KR2014/003384 | Apr 18, 2014 | |||
| 14886948 | ||||
| Current U.S. Class: | 1/1 |
| Current CPC Class: | C12Q 2600/166 20130101; C12Q 1/6886 20130101; C12Q 2600/158 20130101; C12Q 2600/118 20130101 |
| International Class: | C12Q 1/6886 20060101 C12Q001/6886 |
Foreign Application Data
| Date | Code | Application Number |
|---|---|---|
| Apr 18, 2013 | KR | 10-2013-0043160 |
Claims
1. A method for diagnosing a prognosis of breast cancer and treating breast cancer in a breast cancer patient, the method comprising the steps of: collecting a sample from the breast cancer patient; isolating mRNA from the sample of the breast cancer patient; measuring a first mRNA expression level for the mRNA of at least one i-gene selected from the group consisting of BTN3A2 (butyrophilin, subfamily 3, member A2), T cell receptor beta constant 1 (TRBC1), and major histocompatibility complex, class II, DP alpha 1 (HLA-DPA1), and a second mRNA expression level for the mRNA of at least one p-gene selected from the group consisting of the p-genes of the following Table 1; normalizing the first and second mRNA expression levels to determine a normalized value; diagnosing the prognosis of breast cancer patient by using the determined normalized value of the first and second mRNA expression levels, wherein an overexpression of the i-gene indicates a good prognosis of breast cancer, while an overexpression of the p-gene indicates a poor prognosis of breast cancer; and treating the diagnosed breast cancer patient by administering at least one of an anti-cancer agent, a surgery and a radiation therapy. TABLE-US-00008 TABLE 1 List of p-genes No. Gene ID Gene Name 1 APITD1 apoptosis-inducing, TAF9-like domain 1 2 BID BH3 interacting domain death agonist 3 BUB1B BUB1 mitotic checkpoint serine/threonine kinase B 4 BUB1 BUB1 mitotic checkpoint serine/threonine kinase 5 CKS1B CDC28 protein kinase regulatory subunit 1B 6 CKS2 CDC28 protein kinase regulatory subunit 2 7 DLGAP5 discs, large (Drosophila) homolog-associated protein 5 8 POLA1 polymerase (DNA directed), alpha 1, catalytic subunit 9 POLA2 polymerase (DNA directed), alpha 2, accessory subunit 10 DSCC1 DNA replication and sister chromatid cohesion 1 11 DNA2 DNA replication helicase/nuclease 2 12 E2F8 E2F transcription factor 8 13 ERCC6L excision repair cross-complementation group 6-like 14 FBXO5 F-box protein 5 15 FANCI Fanconi anemia, complementation group I 16 GADD45GIP1 growth arrest and DNA-damage-inducible, gamma interacting protein 1 17 GINS1 GINS complex subunit 1 (Psf1 homolog) 18 GINS2 GINS complex subunit 2 (Psf2 homolog) 19 MAD2L1 MAD2 mitotic arrest deficient-like 1 (yeast) 20 MAD2L1BP MAD2L1 binding protein 21 MIS18A MIS18 kinetochore protein A 22 MYBL2 v-myb avian myeloblastosis viral oncogene homolog-like 2 23 NAA50 N(alpha)-acetyltransferase 50, NatE catalytic subunit 24 NEK2 NIMA-related kinase 2 25 NSL1 NSL1, MIS12 kinetochore complex component 26 PBK PDZ binding kinase 27 RAB11A RAB11A, member RAS oncogene family 28 RAD51C RAD51 paralog C 29 RAD54B RAD54 homolog B (S. cerevisiae) 30 RANBP1 RAN binding protein 1 31 RALA v-ral simian leukemia viral oncogene homolog A (ras related) 32 RACGAP1 Rac GTPase activating protein 1 33 SSNA1 Sjogren syndrome nuclear autoantigen 1 34 STAMBP STAM binding protein 35 SSSCA1 Sjogren syndrome/scleroderma autoantigen 1 36 TAF2 TAF2 RNA polymerase II, TATA box binding protein (TBP)-associated factor, 150 kDa 37 TIPIN TIMELESS interacting protein 38 TIPRL TOR signaling pathway regulator 39 TRIAP1 TP53 regulated inhibitor of apoptosis 1 40 TTK TTK protein kinase 41 ZWINT ZW10 interacting kinetochore protein 42 ASPM asp (abnormal spindle) homolog, microcephaly associated (Drosophila) 43 AURKA aurora kinase A 44 AURKB aurora kinase B 45 BRD7 bromodomain containing 7 46 CSNK2A1 casein kinase 2, alpha 1 polypeptide 47 CDC20 cell division cycle 20 48 CDC25C cell division cycle 25C 49 CENPA centromere protein A 50 CENPE centromere protein E, 312 kDa 51 CENPF centromere protein F, 350/400 kDa 52 CENPI centromere protein I 53 CENPM centromere protein M 54 CENPN centromere protein N 55 CENPU centromere protein U 56 CEP55 centrosomal protein 55 kDa 57 CHEK1 checkpoint kinase 1 58 CDT1 chromatin licensing and DNA replication factor 1 59 C11orf80 chromosome 11 open reading frame 80 60 CCNA2 cyclin A2 61 CCNB1 cyclin B1 62 CCNB2 cyclin B2 63 CCNE2 cyclin E2 64 CDK1 cyclin-dependent kinase 1 65 CDKN3 cyclin-dependent kinase inhibitor 3 66 CKAP5 cytoskeleton associated protein 5 67 DTL denticleless E3 ubiquitin protein ligase homolog (Drosophila) 68 DCTN2 dynactin 2 (p50) 69 DYNLT1 dynein, light chain, Tctex-type 1 70 ECD ecdysoneless homolog (Drosophila) 71 ECT2 epithelial cell transforming 2 72 EIF4G1 eukaryotic translation initiation factor 4 gamma, 1 73 EIF4EBP1 eukaryotic translation initiation factor 4E binding protein 1 74 EZR ezrin 75 FEN1 flap structure-specific endonuclease 1 76 FOXM1 forkhead box M1 77 GSK3B glycogen synthase kinase 3 beta 78 HMGN5 high mobility group nucleosome binding domain 5 79 INTS7 integrator complex subunit 7 80 KIF11 kinesin family member 11 81 KIF14 kinesin family member 14 82 KIF20A kinesin family member 20A 83 KIF23 kinesin family member 23 84 KIF2C kinesin family member 2C 85 KIF4A kinesin family member 4A 86 KIFC1 kinesin family member C1 87 MIF macrophage migration inhibitory factor (glycosylation-inhibiting factor) 88 MELK maternal embryonic leucine zipper kinase 89 MED 1 mediator complex subunit 1 90 MCM10 minichromosome maintenance complex component 10 91 MCM2 minichromosome maintenance complex component 2 92 MCM6 minichromosome maintenance complex component 6 93 MAP2K1 mitogen-activated protein kinase kinase 1 94 MSH6 mutS homolog 6 95 MLF1 myeloid leukemia factor 1 96 NCAPG non-SMC condensin I complex, subunit G 97 NUSAP1 nucleolar and spindle associated protein 1 98 NUP155 nucleoporin 155 kDa 99 NUP93 nucleoporin 93 kDa 100 ORC4 origin recognition complex, subunit 4 101 ORC5 origin recognition complex, subunit 5 102 PIN1 peptidylprolyl cis/trans isomerase, NIMA-interacting 1 103 PIK3R4 phosphoinositide-3-kinase, regulatory subunit 4 104 PTTG1 pituitary tumor-transforming 1 105 PTTG3P pituitary tumor-transforming 3, pseudogene 106 PLK1 polo-like kinase 1 107 PLK4 polo-like kinase 4 108 PRIM1 primase, DNA, polypeptide 1 (49 kDa) 109 PA2G4 proliferation-associated 2G4, 38 kDa 110 LEPREL4 leprecan-like 4 111 PSMC3 proteasome (prosome, macropain) 26S subunit, ATPase, 3 112 PSMC6 proteasome (prosome, macropain) 26S subunit, ATPase, 6 113 PSMD10 proteasome (prosome, macropain) 26S subunit, non-ATPase, 10 114 PSMD12 proteasome (prosome, macropain) 26S subunit, non-ATPase, 12 115 PSMD14 proteasome (prosome, macropain) 26S subunit, non-ATPase, 14 116 PSMD2 proteasome (prosome, macropain) 26S subunit, non-ATPase, 2 117 PSMD3 proteasome (prosome, macropain) 26S subunit, non-ATPase, 3 118 PSMD4 proteasome (prosome, macropain) 26S subunit, non-ATPase, 4 119 PSMD6 proteasome (prosome, macropain) 26S subunit, non-ATPase, 6 120 PSMD7 proteasome (prosome, macropain) 26S subunit, non-ATPase, 7 121 PSMA1 proteasome (prosome, macropain) subunit, alpha type, 1 122 PSMA2 proteasome (prosome, macropain) subunit, alpha type, 2 123 PSMA3 proteasome (prosome, macropain) subunit, alpha type, 3 124 PSMA4 proteasome (prosome, macropain) subunit, alpha type, 4 125 PSMA6 proteasome (prosome, macropain) subunit, alpha type, 6 126 PSMA7 proteasome (prosome, macropain) subunit, alpha type, 7 127 PSMB3 proteasome (prosome, macropain) subunit, beta type, 3 128 PSMB5 proteasome (prosome, macropain) subunit, beta type, 5 129 PSMB7 proteasome (prosome, macropain) subunit, beta type, 7 130 PRMT1 protein arginine methyltransferase 1 131 PPP2R3B protein phosphatase 2, regulatory subunit B'', beta 132 PPP3CA protein phosphatase 3, catalytic subunit, alpha isozyme 133 PRC1 protein regulator of cytokinesis 1 134 RRM2 ribonucleotide reductase M2 135 RPS6KB1 ribosomal protein S6 kinase, 70 kDa, polypeptide 1 136 SPAG5 sperm associated antigen 5 137 SKA1 spindle and kinetochore associated complex subunit 1 138 STMN1 stathmin 1 139 SLBP stem-loop binding protein 140 SMC2 structural maintenance of chromosomes 2 141 SMC4 structural maintenance of chromosomes 4 142 SMC5 structural maintenance of chromosomes 5 143 TERF1 telomeric repeat binding factor (NIMA- interacting) 1 144 TXNL4A thioredoxin-like 4A 145 TRIP13 thyroid hormone receptor interactor 13 146 TOP2A topoisomerase (DNA) II alpha 170 kDa 147 TFDP2 transcription factor Dp-2 (E2F dimerization partner 2) 148 TACC3 transforming, acidic coiled-coil containing protein 3 149 TUBB3 tubulin, beta 3 class III 150 TUBB4B tubulin, beta 4B class IVb 151 TUBB tubulin, beta class I 152 TSG101 tumor susceptibility 101 153 UBE2C ubiquitin-conjugating enzyme E2C 154 UBE2L3 ubiquitin-conjugating enzyme E2L 3 155 UBE2S ubiquitin-conjugating enzyme E2S 156 USP9X ubiquitin specific peptidase 9, X-linked 157 VRK1 vaccinia related kinase 1 158 ZFHX3 zinc finger homeobox 3 159 ZWILCH zwilch kinetochore protein 160 MMP11 Matrix Metallopeptidase 11
2. The method of claim 1, wherein the i-gene is BTN3A2 (butyrophilin, subfamily 3, member A2).
3. The method of claim 1, wherein the p-gene is selected from the group consisting of AURKA (Aurora Kinase A), CCNB2 (Cyclin B2), FOXM1 (Forkhead box protein M1), MMP11 (Matrix Metallopeptidase 11), PTTG1 (Pituitary Tumor-Transforming 1), RACGAP1 (Rac GTPase Activating Protein 1), RRM2 (Ribonucleotide Reductase M2), TOP2A (Topoisomerase II Alpha) and UBE2C (Ubiquitin-Conjugating Enzyme E2C).
4. The method of claim 1, wherein the step of measuring the expression levels is conducted through PCR amplification of a target gene.
5. The method of claim 1, wherein the sample is a formalin-fixed paraffin-embedded (FFPE) sample of tissue containing cancer cells of the breast cancer patient.
6. The method of claim 1, wherein the step of normalizing is conducted by calculating a ratio of a mean expression level of the gene with a mean expression level of at least one standard gene selected from the group consisting of CTBP1 (C-terminal-binding protein 1), TBP (TATA-binding protein), HMBS (hydroxymethylbilane synthase), CUL1 (cullin 1), and UBQLN1 (ubiquilin-1).
7. A method for determining a predictive value of the prognosis of breast cancer to provide information necessary for predicting or diagnosing the prognosis of a breast cancer patient, the method comprising the steps of: isolating mRNA from a sample of the breast cancer patient; measuring a first mRNA expression level for the mRNA of at least one i-gene selected from the group consisting of BTN3A2 (butyrophilin, subfamily 3, member A2), T cell receptor beta constant 1 (TRBC1), and major histocompatibility complex, class II, DP alpha 1 (HLA-DPA1), and a second mRNA expression level for the mRNA of at least one p-gene selected from the group consisting of the p-genes of the Table 1; normalizing the first and second mRNA expression levels to obtain normalized values; inserting the normalized values into a pre-determined calculation formula to obtain a numerical predictive value; and determining the prognosis of breast cancer as being good or poor depending on the numerical predictive value.
8. The method of claim 7, wherein the i-gene is BTN3A2 (butyrophilin, subfamily 3, member A2).
9. The method of claim 7, wherein the p-gene is selected from the group consisting of AURKA (Aurora Kinase A), CCNB2 (Cyclin B2), FOXM1 (Forkhead box protein M1), MMP11 (Matrix Metallopeptidase 11), PTTG1 (Pituitary Tumor-Transforming 1), RACGAP1 (Rac GTPase Activating Protein 1), RRM2 (Ribonucleotide Reductase M2), TOP2A (Topoisomerase II Alpha) and UBE2C (Ubiquitin-Conjugating Enzyme E2C).
10. The method of claim 7, wherein an overexpression of the i-gene indicates a good prognosis of breast cancer, while an overexpression of the p-gene indicates a poor prognosis of breast cancer.
11. The method of claim 7, wherein the step of measuring the expression levels is conducted through PCR amplification of a target gene.
12. The method of claim 7, wherein the sample is a formalin-fixed paraffin-embedded (FFPE) sample of a tissue containing cancer cells of a patient.
13. The method of claim 7, wherein the step of normalizing is conducted by calculating a ratio of a mean expression level of the gene with a mean expression level of at least one standard gene selected from the group consisting of CTBP1 (C-terminal-binding protein 1), TBP (TATA-binding protein), HMBS (hydroxymethylbilane synthase), CUL1 (cullin 1), and UBQLN1 (ubiquilin-1).
14. The method of claim 7, wherein the breast cancer patient determined as poor prognosis is treated by administering at least one of an anti-cancer agent, a surgery and a radiation therapy.
15. A method for predicting or diagnosing the prognosis of breast cancer in a breast cancer patient, the method comprising a step of using a plurality of primer pairs, wherein the plurality of the primer pairs comprises a primer pair for at least one i-gene selected from the group consisting of BTN3A2 (butyrophilin, subfamily 3, member A2), T cell receptor beta constant 1 (TRBC1), and major histocompatibility complex, class II, DP alpha 1 (HLA-DPA1), and a primer pair for at least one p-gene selected from the group consisting of the p-genes of the Table 1, wherein the primer pairs are selected to amplify the at least one i-gene and the at least one p-gene through PCR amplification.
16. The method of claim 15, wherein the i-gene is BTN3A2 (butyrophilin, subfamily 3, member A2).
17. The method of claim 15, wherein the p-gene is selected from the group consisting of AURKA (Aurora Kinase A), CCNB2 (Cyclin B2), FOXM1 (Forkhead box protein M1), MMP11 (Matrix Metallopeptidase 11), PTTG1 (Pituitary Tumor-Transforming 1), RACGAP1 (Rac GTPase Activating Protein 1), RRM2 (Ribonucleotide Reductase M2), TOP2A (Topoisomerase II Alpha) and UBE2C (Ubiquitin-Conjugating Enzyme E2C).
18. The method of claim 15, wherein the breast cancer patient diagnosed as poor prognosis is treated by administering at least one of an anti-cancer agent, a surgery and a radiation therapy.
Description
CROSS-REFERENCE TO RELATED APPLICATIONS
[0001] This application is a continuation-in-part of U.S. application Ser. No. 14/886,948, filed on Oct. 19, 2015, which is a continuation of International Application PCT/KR2014/003384, filed on Apr. 18, 2014, which claims priority from and the benefit of Korean Patent Application No. 10-2013-0043160, filed on Apr. 18, 2013, which is hereby incorporated by reference for all purposes as if fully set forth herein.
BACKGROUND
1. Field
[0002] The present invention relates to a gene for early-stage breast cancer prognosis prediction and diagnosis and a use thereof, and more specifically, to a genetic marker for early-stage breast cancer prognosis prediction and diagnosis, of TRBC1 (T cell receptor beta constant 1), BTN3A2 (butyrophilin, subfamily 3, member A2), or HLA-DPA1 (major histocompatibility complex, class II, DP alpha 1), for providing information necessary for the prognosis prediction and diagnosis of a breast cancer patient, and to a use thereof.
2. Discussion of the Background
[0003] As human genome information has been actively utilized, cancer research has focused on the establishment of mechanisms at the genome level. Particularly, cancer cell characteristics can be identified in a macroscopic view, based on information about expression patterns of tens of thousands of genes or on the increase or decrease in the number of genes using microarrays. This analysis of the genome-level information is very innovative in understanding organic and complicated life phenomena, and will be more commonly used. Specifically, in cases of complex diseases such as cancer, the analysis of a small number of particular genes is likely to obtain narrow results, and it is important to capture large behavior patterns with respect to the occurrence and development of cancer, and thus genome information analysis is absolutely necessary. As described above, most of the genome information that is a basis for cancer research is created using genome chips such as a microarray, and technologies that can obtain a lot of information at once are evolving day by day. In spite of the disadvantages of high costs, research using microarrays is being actively developed, so the amount of related information is explosively increasing. Since the mid-2000s, such genome information has started to be collected and made into a database, and secondary and tertiary analysis using the information thus obtained is becoming a focal point for the research of life phenomena.
[0004] Tens of thousands of probes indicating approximately 20,000 to 30,000 genes are embedded in general expression gene chips, and more than one million probes are often embedded in microarrays that measure precise information, such as SNP. Methods using these microarrays are very efficient since they are relatively simple and standardized and a large amount of information can be obtained at once in a short time, but analyzing the obtained results is a key point as well as being a difficult bottleneck. Comprehensive analysis for tens of thousands of genes incomparable to existing analysis for a small number of genes must be supported by a broad knowledge of the genome as well as statistical analysis techniques, so useful information can be eventually obtained. Besides, high-performance computing equipment capable of storing and analyzing large amounts of information are needed, and the related computational techniques are also needed. Meanwhile, it is difficult to perform for the researchers who are familiar with conventional biological research ranges and experimental methods, and thus, the methods cannot be favorably utilized even though genome information increases at an extraordinary rate in Korea. Considering the domestic situation with respect to capital and technology research that are insufficient compared with North America and Europe, actively utilizing known genome information should be at the head of bioinformatics. Genome analysis has been actively introduced in the research of, particularly, cancers, and a considerable amount of related-information has been accumulated.
[0005] Breast cancer is frequently detected in the early stage since self-diagnosis is possible and the importance of self-diagnosis is highly publicized. It was difficult to determine whether early-stage breast cancer patients should be allowed to receive anticancer treatments after surgery. It is possible to roughly predict a prognosis through pathological observation, but the observation result is difficult to normalize and quantify, and the reliability on prognosis prediction is low, and thus, most of early-stage breast cancer patients are recommended to receive anticancer treatments in actual clinical practice. Due to the nature of anticancer treatments, they are very expensive, while the patients suffer from very serious pains. It is estimated that more than half of early-stage breast cancer patients do not need to receive anticancer treatments. Therefore, if unnecessary anticancer treatments are reduced by analyzing the characteristics of the early-stage breast cancer to predict prognosis of patient, it may be a great help to increase the quality of life of the patients. As the information about tens of thousands of breast cancer gene expression patterns is obtained at once using microarrays, research for classifying breast cancer types at the molecular level and establishing mechanisms of cancer occurrence and development are being actively conducted. It is important to predict the prognosis of the early-stage breast cancer patients in clinical practice. The work of identifying genes for prognosis prediction using microarrays has already started in the early 2000s. Although research that uses microarrays is expensive, a significant number of breast cancer tissue expression profiles have been produced and available to researchers. Starting from the identifying of 70 prognosis prediction genes by analyzing the early-stage breast cancer tissues and survival data of 78 patients followed up for 10 years in 2002, a dozen genes for prognosis prediction genes were then published, and among these genes, several genes have already been commercialized and used in clinical practice (Chang, H. Y., et al., Gene expression signature of fibroblast serum response predicts human cancer progression: similarities between tumors and wounds. PLoSBiol 2(2): p. E7(2004); van de Vijver, M. J., et al., A gene-expression signature as a predictor of survival in breast cancer. N Engl J Med 347(25):1999-2009(2002); van 't Veer, L. J., et al., Gene expression profiling predicts clinical outcome of breast cancer. Nature 415(6871): 530-536(2002); Wang, Y., et al., Gene-expression profiles to predict distant metastasis of lymph-node-negative primary breast cancer. Lancet 365(9460): 671-679(2005); Buyse, M., et al., Validation and clinical utility of a 70-gene prognostic signature for women with node-negative breast cancer. J Natl Cancer Inst, 98(17):1183-92(2006); Paik, S., Development and clinical utility of a 21-gene recurrence score prognostic assay in patients with early-stage breast cancer treated with tamoxifen. Oncologist 12(6):631-635(2007); Paik, S., et al., A multigene assay to predict recurrence of tamoxifen-treated, node-negative breast cancer. N Engl J Med 351(27):2817-2826(2004); Sotiriou, C., et al., Gene expression profiling in breast cancer: understanding the molecular basis of histologic grade to improve prognosis. J Natl Cancer Inst 98(4):262-72(2006); Pawitan, Y., et al., Gene expression profiling spares early-stage breast cancer patients from adjuvant therapy: derived and validated in two population-based cohorts. Breast Cancer Res 7(6):R953-964(2005); Miller, L. D., et al., An expression signature for p53 status in human breast cancer predicts mutation status, transcriptional effects, and patient survival. Proc Natl Acad Sci USA, 102(38):13550-13555(2005); Bild, A. H., et al., Oncogenic pathway signatures in human cancers as a guide to targeted therapies. Nature 439(7074):353-357(2006); Teschendorff, A. E., et al., A consensus prognostic gene expression classifier for ER positive breast cancer. Genome Biol 7(10):R101(2006); Desmedt, C., et al., Strong time dependence of the 76-gene prognostic signature for node-negative breast cancer patients in the TRANSBIG multicenter independent validation series. Clin Cancer Res 13(11): 3207-3214(2007)). Representative examples thereof are MammaPrint (Agendia) and Oncotype DX (Genomic Health), which are being currently used in clinical practice. However, they have been used as one of the references for prognosis (van de Vijver, M. J., et al., A gene-expression signature as a predictor of survival in breast cancer. N Engl J Med 347(25):1999-2009(2002); Paik, S., et al., A multigene assay to predict recurrence of tamoxifen-treated, node-negative breast cancer. N Engl J Med 351(27):2817-2826(2004)).
[0006] Throughout the entire specification, many research papers and patent documents are referenced and their citations are disclosed. The disclosure of cited papers and patent documents are entirely incorporated by reference into the present specification, and the level of the technical field within which the present invention falls, and details of the present invention are explained more clearly.
SUMMARY
[0007] The present inventors have endeavored to develop a gene diagnosis system capable of predicting the prognosis of the early-stage breast cancer patient and determining whether anticancer treatment is performed on the early-stage breast cancer patient by using an FFPE sample of the tissue containing cancer cells of the patient. As a result, the present inventors have identified genes associated with prognosis prediction by collecting and analyzing microarray data and clinical information, which are obtained from the early-stage breast cancer tissue; selected genes and sets thereof, which are suitable for the application to the FFPE sample, among the identified genes; and validated utility of the selected genes and gene sets, thereby completing the present invention.
[0008] Therefore, an aspect of the present invention is to provide a genetic marker for predicting or diagnosing the prognosis of a breast cancer patient, and a use thereof.
[0009] Another aspect of the present invention is to provide a novel method for predicting or diagnosing the prognosis of a breast cancer patient.
[0010] Still another aspect of the present invention is to provide a kit for predicting or diagnosing the prognosis of a breast cancer patient.
[0011] Still another aspect of the present invention is to provide a method for calculating a breast cancer prognosis predictive value in order to provide information necessary for predicting or diagnosing the prognosis of a breast cancer patient, the method comprising isolating mRNA from a patient sample, measuring the gene expression level, normalizing the gene expression level, and calculating a predictive value.
[0012] In accordance with an aspect of the present invention, there is provided a genetic marker for predicting or diagnosing the prognosis of a breast cancer patient and a use thereof.
[0013] In accordance with another aspect of the present invention, there is provided a novel method for predicting or diagnosing the prognosis of a breast cancer patient.
[0014] In accordance with still another aspect of the present invention, there is provided a kit for predicting or diagnosing the prognosis of a breast cancer patient.
[0015] In accordance with still another aspect of the present invention, there is provided a method for calculating a predictive value of the prognosis of breast cancer to provide information necessary for predicting or diagnosing the prognosis of a breast cancer patient, the method comprising isolating mRNA from a patient sample, measuring a gene expression level, normalizing the gene expression level, and calculating a predictive value.
[0016] In accordance with still another aspect of the present invention, there is provided a primer pair for at least one gene selected from the group consisting of T cell receptor beta constant 1 (TRBC1), butyrophilin, subfamily 3, member A2 (BTN3A2), and major histocompatibility complex, class II, DP alpha 1 (HLA-DPA1), wherein the primer pair is capable of amplifying a target gene through PCR amplification.
[0017] In accordance with still another aspect of the present invention, there is provided a use of a primer pair for preparing an agent for predicting the prognosis of breast cancer, wherein the primer pair is for at least one gene selected from the group consisting of TRBC1, BTN3A2, and HLA-DPA1, and wherein the primer pair is capable of amplifying a target gene through PCR amplification.
[0018] In accordance with further aspect of the present invention, there is provided a method for diagnosing a prognosis of breast cancer and treating breast cancer in a breast cancer patient, the method comprising the steps of:
[0019] collecting a sample from the breast cancer patient;
[0020] isolating mRNA from the sample of the breast cancer patient;
[0021] measuring a first mRNA expression level for the mRNA of at least one i-gene selected from the group consisting of BTN3A2 (butyrophilin, subfamily 3, member A2), T cell receptor beta constant 1 (TRBC1), and major histocompatibility complex, class II, DP alpha 1 (HLA-DPA1), and a second mRNA expression level for the mRNA of at least one p-gene selected from the group consisting of the p-genes of the following Table 1;
[0022] normalizing the first and second mRNA expression levels to determine a normalized value;
[0023] diagnosing the prognosis of breast cancer patient by using the determined normalized value of the first and second mRNA expression levels, wherein an overexpression of the i-gene indicates a good prognosis of breast cancer, while an overexpression of the p-gene indicates a poor prognosis of breast cancer; and
[0024] treating the diagnosed breast cancer patient by administering at least one of an anti-cancer agent, a surgery and a radiation therapy.
TABLE-US-00001 TABLE 1 List of p-genes No. Gene ID Gene Name 1 APITD1 apoptosis-inducing, TAF9-like domain 1 2 BID BH3 interacting domain death agonist 3 BUB1B BUB1 mitotic checkpoint serine/threonine kinase B 4 BUB1 BUB1 mitotic checkpoint serine/threonine kinase 5 CKS1B CDC28 protein kinase regulatory subunit 1B 6 CKS2 CDC28 protein kinase regulatory subunit 2 7 DLGAP5 discs, large (Drosophila) homolog-associated protein 5 8 POLA1 polymerase (DNA directed), alpha 1, catalytic subunit 9 POLA2 polymerase (DNA directed), alpha 2, accessory subunit 10 DSCC1 DNA replication and sister chromatid cohesion 1 11 DNA2 DNA replication helicase/nuclease 2 12 E2F8 E2F transcription factor 8 13 ERCC6L excision repair cross-complementation group 6-like 14 FBXO5 F-box protein 5 15 FANCI Fanconi anemia, complementation group I 16 GADD45GIP1 growth arrest and DNA-damage-inducible, gamma interacting protein 1 17 GINS1 GINS complex subunit 1 (Psf1 homolog) 18 GINS2 GINS complex subunit 2 (Psf2 homolog) 19 MAD2L1 MAD2 mitotic arrest deficient-like 1 (yeast) 20 MAD2L1BP MAD2L1 binding protein 21 MIS18A MIS18 kinetochore protein A 22 MYBL2 v-myb avian myeloblastosis viral oncogene homolog-like 2 23 NAA50 N(alpha)-acetyltransferase 50, NatE catalytic subunit 24 NEK2 NIMA-related kinase 2 25 NSL1 NSL1, MIS12 kinetochore complex component 26 PBK PDZ binding kinase 27 RAB11A RAB11A, member RAS oncogene family 28 RAD51C RAD51 paralog C 29 RAD54B RAD54 homolog B (S. cerevisiae) 30 RANBP1 RAN binding protein 1 31 RALA v-ral simian leukemia viral oncogene homolog A (ras related) 32 RACGAP1 Rac GTPase activating protein 1 33 SSNA1 Sjogren syndrome nuclear autoantigen 1 34 STAMBP STAM binding protein 35 SSSCA1 Sjogren syndrome/scleroderma autoantigen 1 36 TAF2 TAF2 RNA polymerase II, TATA box binding protein (TBP)-associated factor, 150 kDa 37 TIPIN TIMELESS interacting protein 38 TIPRL TOR signaling pathway regulator 39 TRIAP1 TP53 regulated inhibitor of apoptosis 1 40 TTK TTK protein kinase 41 ZWINT ZW10 interacting kinetochore protein 42 ASPM asp (abnormal spindle) homolog, microcephaly associated (Drosophila) 43 AURKA aurora kinase A 44 AURKB aurora kinase B 45 BRD7 bromodomain containing 7 46 CSNK2A1 casein kinase 2, alpha 1 polypeptide 47 CDC20 cell division cycle 20 48 CDC25C cell division cycle 25C 49 CENPA centromere protein A 50 CENPE centromere protein E, 312 kDa 51 CENPF centromere protein F, 350/400 kDa 52 CENPI centromere protein I 53 CENPM centromere protein M 54 CENPN centromere protein N 55 CENPU centromere protein U 56 CEP55 centrosomal protein 55 kDa 57 CHEK1 checkpoint kinase 1 58 CDT1 chromatin licensing and DNA replication factor 1 59 C11orf80 chromosome 11 open reading frame 80 60 CCNA2 cyclin A2 61 CCNB1 cyclin B1 62 CCNB2 cyclin B2 63 CCNE2 cyclin E2 64 CDK1 cyclin-dependent kinase 1 65 CDKN3 cyclin-dependent kinase inhibitor 3 66 CKAP5 cytoskeleton associated protein 5 67 DTL denticleless E3 ubiquitin protein ligase homolog (Drosophila) 68 DCTN2 dynactin 2 (p50) 69 DYNLT1 dynein, light chain, Tctex-type 1 70 ECD ecdysoneless homolog (Drosophila) 71 ECT2 epithelial cell transforming 2 72 EIF4G1 eukaryotic translation initiation factor 4 gamma, 1 73 EIF4EBP1 eukaryotic translation initiation factor 4E binding protein 1 74 EZR ezrin 75 FEN1 flap structure-specific endonuclease 1 76 FOXM1 forkhead box M1 77 GSK3B glycogen synthase kinase 3 beta 78 HMGN5 high mobility group nucleosome binding domain 5 79 INTS7 integrator complex subunit 7 80 KIF11 kinesin family member 11 81 KIF14 kinesin family member 14 82 KIF20A kinesin family member 20A 83 KIF23 kinesin family member 23 84 KIF2C kinesin family member 2C 85 KIF4A kinesin family member 4A 86 KIFC1 kinesin family member C1 87 MIF macrophage migration inhibitory factor (glycosylation-inhibiting factor) 88 MELK maternal embryonic leucine zipper kinase 89 MED1 mediator complex subunit 1 90 MCM10 minichromosome maintenance complex component 10 91 MCM2 minichromosome maintenance complex component 2 92 MCM6 minichromosome maintenance complex component 6 93 MAP2K1 mitogen-activated protein kinase kinase 1 94 MSH6 mutS homolog 6 95 MLF1 myeloid leukemia factor 1 96 NCAPG non-SMC condensin I complex, subunit G 97 NUSAP1 nucleolar and spindle associated protein 1 98 NUP155 nucleoporin 155 kDa 99 NUP93 nucleoporin 93 kDa 100 ORC4 origin recognition complex, subunit 4 101 ORC5 origin recognition complex, subunit 5 102 PIN1 peptidylprolyl cis/trans isomerase, NIMA-interacting 1 103 PIK3R4 phosphoinositide-3-kinase, regulatory subunit 4 104 PTTG1 pituitary tumor-transforming 1 105 PTTG3P pituitary tumor-transforming 3, pseudogene 106 PLK1 polo-like kinase 1 107 PLK4 polo-like kinase 4 108 PRIM1 primase, DNA, polypeptide 1 (49 kDa) 109 PA2G4 proliferation-associated 2G4, 38 kDa 110 LEPREL4 leprecan-like 4 111 PSMC3 proteasome (prosome, macropain) 26S subunit, ATPase, 3 112 PSMC6 proteasome (prosome, macropain) 26S subunit, ATPase, 6 113 PSMD10 proteasome (prosome, macropain) 26S subunit, non-ATPase, 10 114 PSMD12 proteasome (prosome, macropain) 26S subunit, non-ATPase, 12 115 PSMD14 proteasome (prosome, macropain) 26S subunit, non-ATPase, 14 116 PSMD2 proteasome (prosome, macropain) 26S subunit, non-ATPase, 2 117 PSMD3 proteasome (prosome, macropain) 26S subunit, non-ATPase, 3 118 PSMD4 proteasome (prosome, macropain) 26S subunit, non-ATPase, 4 119 PSMD6 proteasome (prosome, macropain) 26S subunit, non-ATPase, 6 120 PSMD7 proteasome (prosome, macropain) 26S subunit, non-ATPase, 7 121 PSMA1 proteasome (prosome, macropain) subunit, alpha type, 1 122 PSMA2 proteasome (prosome, macropain) subunit, alpha type, 2 123 PSMA3 proteasome (prosome, macropain) subunit, alpha type, 3 124 PSMA4 proteasome (prosome, macropain) subunit, alpha type, 4 125 PSMA6 proteasome (prosome, macropain) subunit, alpha type, 6 126 PSMA7 proteasome (prosome, macropain) subunit, alpha type, 7 127 PSMB3 proteasome (prosome, macropain) subunit, beta type, 3 128 PSMB5 proteasome (prosome, macropain) subunit, beta type, 5 129 PSMB7 proteasome (prosome, macropain) subunit, beta type, 7 130 PRMT1 protein arginine methyltransferase 1 131 PPP2R3B protein phosphatase 2, regulatory subunit B'', beta 132 PPP3CA protein phosphatase 3, catalytic subunit, alpha isozyme 133 PRC1 protein regulator of cytokinesis 1 134 RRM2 ribonucleotide reductase M2 135 RPS6KB1 ribosomal protein S6 kinase, 70 kDa, polypeptide 1 136 SPAG5 sperm associated antigen 5 137 SKA1 spindle and kinetochore associated complex subunit 1 138 STMN1 stathmin 1 139 SLBP stem-loop binding protein 140 SMC2 structural maintenance of chromosomes 2 141 SMC4 structural maintenance of chromosomes 4 142 SMC5 structural maintenance of chromosomes 5 143 TERF1 telomeric repeat binding factor (NIMA-interacting) 1 144 TXNL4A thioredoxin-like 4A 145 TRIP13 thyroid hormone receptor interactor 13 146 TOP2A topoisomerase (DNA) II alpha 170 kDa 147 TFDP2 transcription factor Dp-2 (E2F dimerization partner 2) 148 TACC3 transforming, acidic coiled-coil containing protein 3 149 TUBB3 tubulin, beta 3 class III 150 TUBB4B tubulin, beta 4B class IVb 151 TUBB tubulin, beta class I 152 TSG101 tumor susceptibility 101 153 UBE2C ubiquitin-conjugating enzyme E2C 154 UBE2L3 ubiquitin-conjugating enzyme E2L 3 155 UBE2S ubiquitin-conjugating enzyme E2S 156 USP9X ubiquitin specific peptidase 9, X-linked 157 VRK1 vaccinia related kinase 1 158 ZFHX3 zinc finger homeobox 3 159 ZWILCH zwilch kinetochore protein 160 MMP11 Matrix Metallopeptidase 11
[0025] In another aspect of the present invention, there is provided the above method wherein the i-gene is BTN3A2 (butyrophilin, subfamily 3, member A2).
[0026] In still another aspect of the present invention, there is provided the above method wherein the p-gene is selected from the group consisting of AURKA (Aurora Kinase A), CCNB2 (Cyclin B2), FOXM1 (Forkhead box protein M1), MMP11 (Matrix Metallopeptidase 11), PTTG1 (Pituitary Tumor-Transforming 1), RACGAP1 (Rac GTPase Activating Protein 1), RRM2 (Ribonucleotide Reductase M2), TOP2A (Topoisomerase II Alpha) and UBE2C (Ubiquitin-Conjugating Enzyme E2C).
[0027] In another aspect of the present invention, there is provided the above method wherein the step of measuring the expression levels is conducted through PCR amplification of a target gene.
[0028] In still another aspect of the present invention, there is provided the above method wherein the sample is a formalin-fixed paraffin-embedded (FFPE) sample of tissue containing cancer cells of the breast cancer patient.
[0029] In still further aspect of the present invention, there is provided the above method wherein the step of normalizing is conducted by calculating a ratio of a mean expression level of the gene with a mean expression level of at least one standard gene selected from the group consisting of CTBP1 (C-terminal-binding protein 1), TBP (TATA-binding protein), HMBS (hydroxymethylbilane synthase), CUL1 (cullin 1), and UBQLN1 (ubiquilin-1).
[0030] In accordance with further aspect of the present invention, there is provided a method for determining a predictive value of the prognosis of breast cancer to provide information necessary for predicting or diagnosing the prognosis of a breast cancer patient, the method comprising the steps of:
[0031] isolating mRNA from a sample of the breast cancer patient;
[0032] measuring a first mRNA expression level for the mRNA of at least one i-gene selected from the group consisting of BTN3A2 (butyrophilin, subfamily 3, member A2), T cell receptor beta constant 1 (TRBC1), and major histocompatibility complex, class II, DP alpha 1 (HLA-DPA1), and a second mRNA expression level for the mRNA of at least one p-gene selected from the group consisting of the p-genes of the Table 1;
[0033] normalizing the first and second mRNA expression levels to obtain normalized values;
[0034] inserting the normalized values into a pre-determined calculation formula to obtain a numerical predictive value; and
[0035] determining the prognosis of breast cancer as being good or poor depending on the numerical predictive value.
[0036] In another aspect of the present invention, there is provided the above method wherein the i-gene is BTN3A2 (butyrophilin, subfamily 3, member A2).
[0037] In still another aspect of the present invention, there is provided the above method wherein the p-gene is selected from the group consisting of AURKA (Aurora Kinase A), CCNB2 (Cyclin B2), FOXM1 (Forkhead box protein M1), MMP11 (Matrix Metallopeptidase 11), PTTG1 (Pituitary Tumor-Transforming 1), RACGAP1 (Rac GTPase Activating Protein 1), RRM2 (Ribonucleotide Reductase M2), TOP2A (Topoisomerase II Alpha) and UBE2C (Ubiquitin-Conjugating Enzyme E2C).
[0038] In further another aspect of the present invention, there is provided the above method wherein an overexpression of the i-gene indicates a good prognosis of breast cancer, while an overexpression of the p-gene indicates a poor prognosis of breast cancer.
[0039] In still further aspect of the present invention, there is provided the above method wherein the step of measuring the expression levels is conducted through PCR amplification of a target gene.
[0040] In further aspect of the present invention, there is provided the above method wherein the sample is a formalin-fixed paraffin-embedded (FFPE) sample of a tissue containing cancer cells of a patient.
[0041] In another aspect of the present invention, there is provided the above method wherein the step of normalizing is conducted by calculating a ratio of a mean expression level of the gene with a mean expression level of at least one standard gene selected from the group consisting of CTBP1 (C-terminal-binding protein 1), TBP (TATA-binding protein), HMBS (hydroxymethylbilane synthase), CUL1 (cullin 1), and UBQLN1 (ubiquilin-1).
[0042] In still another aspect of the present invention, there is provided the above method wherein the breast cancer patient determined as poor prognosis is treated by administering at least one of an anti-cancer agent, a surgery and a radiation therapy.
[0043] In accordance with further aspect of the present invention, there is provided a method for predicting or diagnosing the prognosis of breast cancer in a breast cancer patient, the method comprising a step of using a plurality of primer pairs, wherein the plurality of the primer pairs comprises a primer pair for at least one i-gene selected from the group consisting of BTN3A2 (butyrophilin, subfamily 3, member A2), T cell receptor beta constant 1 (TRBC1), and major histocompatibility complex, class II, DP alpha 1 (HLA-DPA1), and a primer pair for at least one p-gene selected from the group consisting of the p-genes of the Table 1, wherein the primer pairs are selected to amplify the at least one i-gene and the at least one p-gene through PCR amplification.
[0044] In another aspect of the present invention, there is provided the above method wherein the i-gene is BTN3A2 (butyrophilin, subfamily 3, member A2).
[0045] In still another aspect of the present invention, there is provided the above method wherein the p-gene is selected from the group consisting of AURKA (Aurora Kinase A), CCNB2 (Cyclin B2), FOXM1 (Forkhead box protein M1), MMP11 (Matrix Metallopeptidase 11), PTTG1 (Pituitary Tumor-Transforming 1), RACGAP1 (Rac GTPase Activating Protein 1), RRM2 (Ribonucleotide Reductase M2), TOP2A (Topoisomerase II Alpha) and UBE2C (Ubiquitin-Conjugating Enzyme E2C).
[0046] In still further aspect of the present invention, there is provided the above method wherein the breast cancer patient diagnosed as poor prognosis is treated by administering at least one of an anti-cancer agent, a surgery and a radiation therapy.
[0047] Unless defined otherwise, all technical and scientific terms used herein have the same meanings as are commonly understood by a person skilled in the art. The following reference documents provide one of skills that have general definitions of many terms used herein: Singleton et al., DICTIONARY OF MICROBIOLOGY AND MOLECULAR BIOLOTY (2ded.1994); THE CAMBRIDGE DICTIONARY OF SCIENCE AND TECHNOLOGY (Walkered., 1988); and Hale & Marham, THE HARPER COLLINS DICTIONARY OF BIOLOGY
BRIEF DESCRIPTION OF THE DRAWINGS
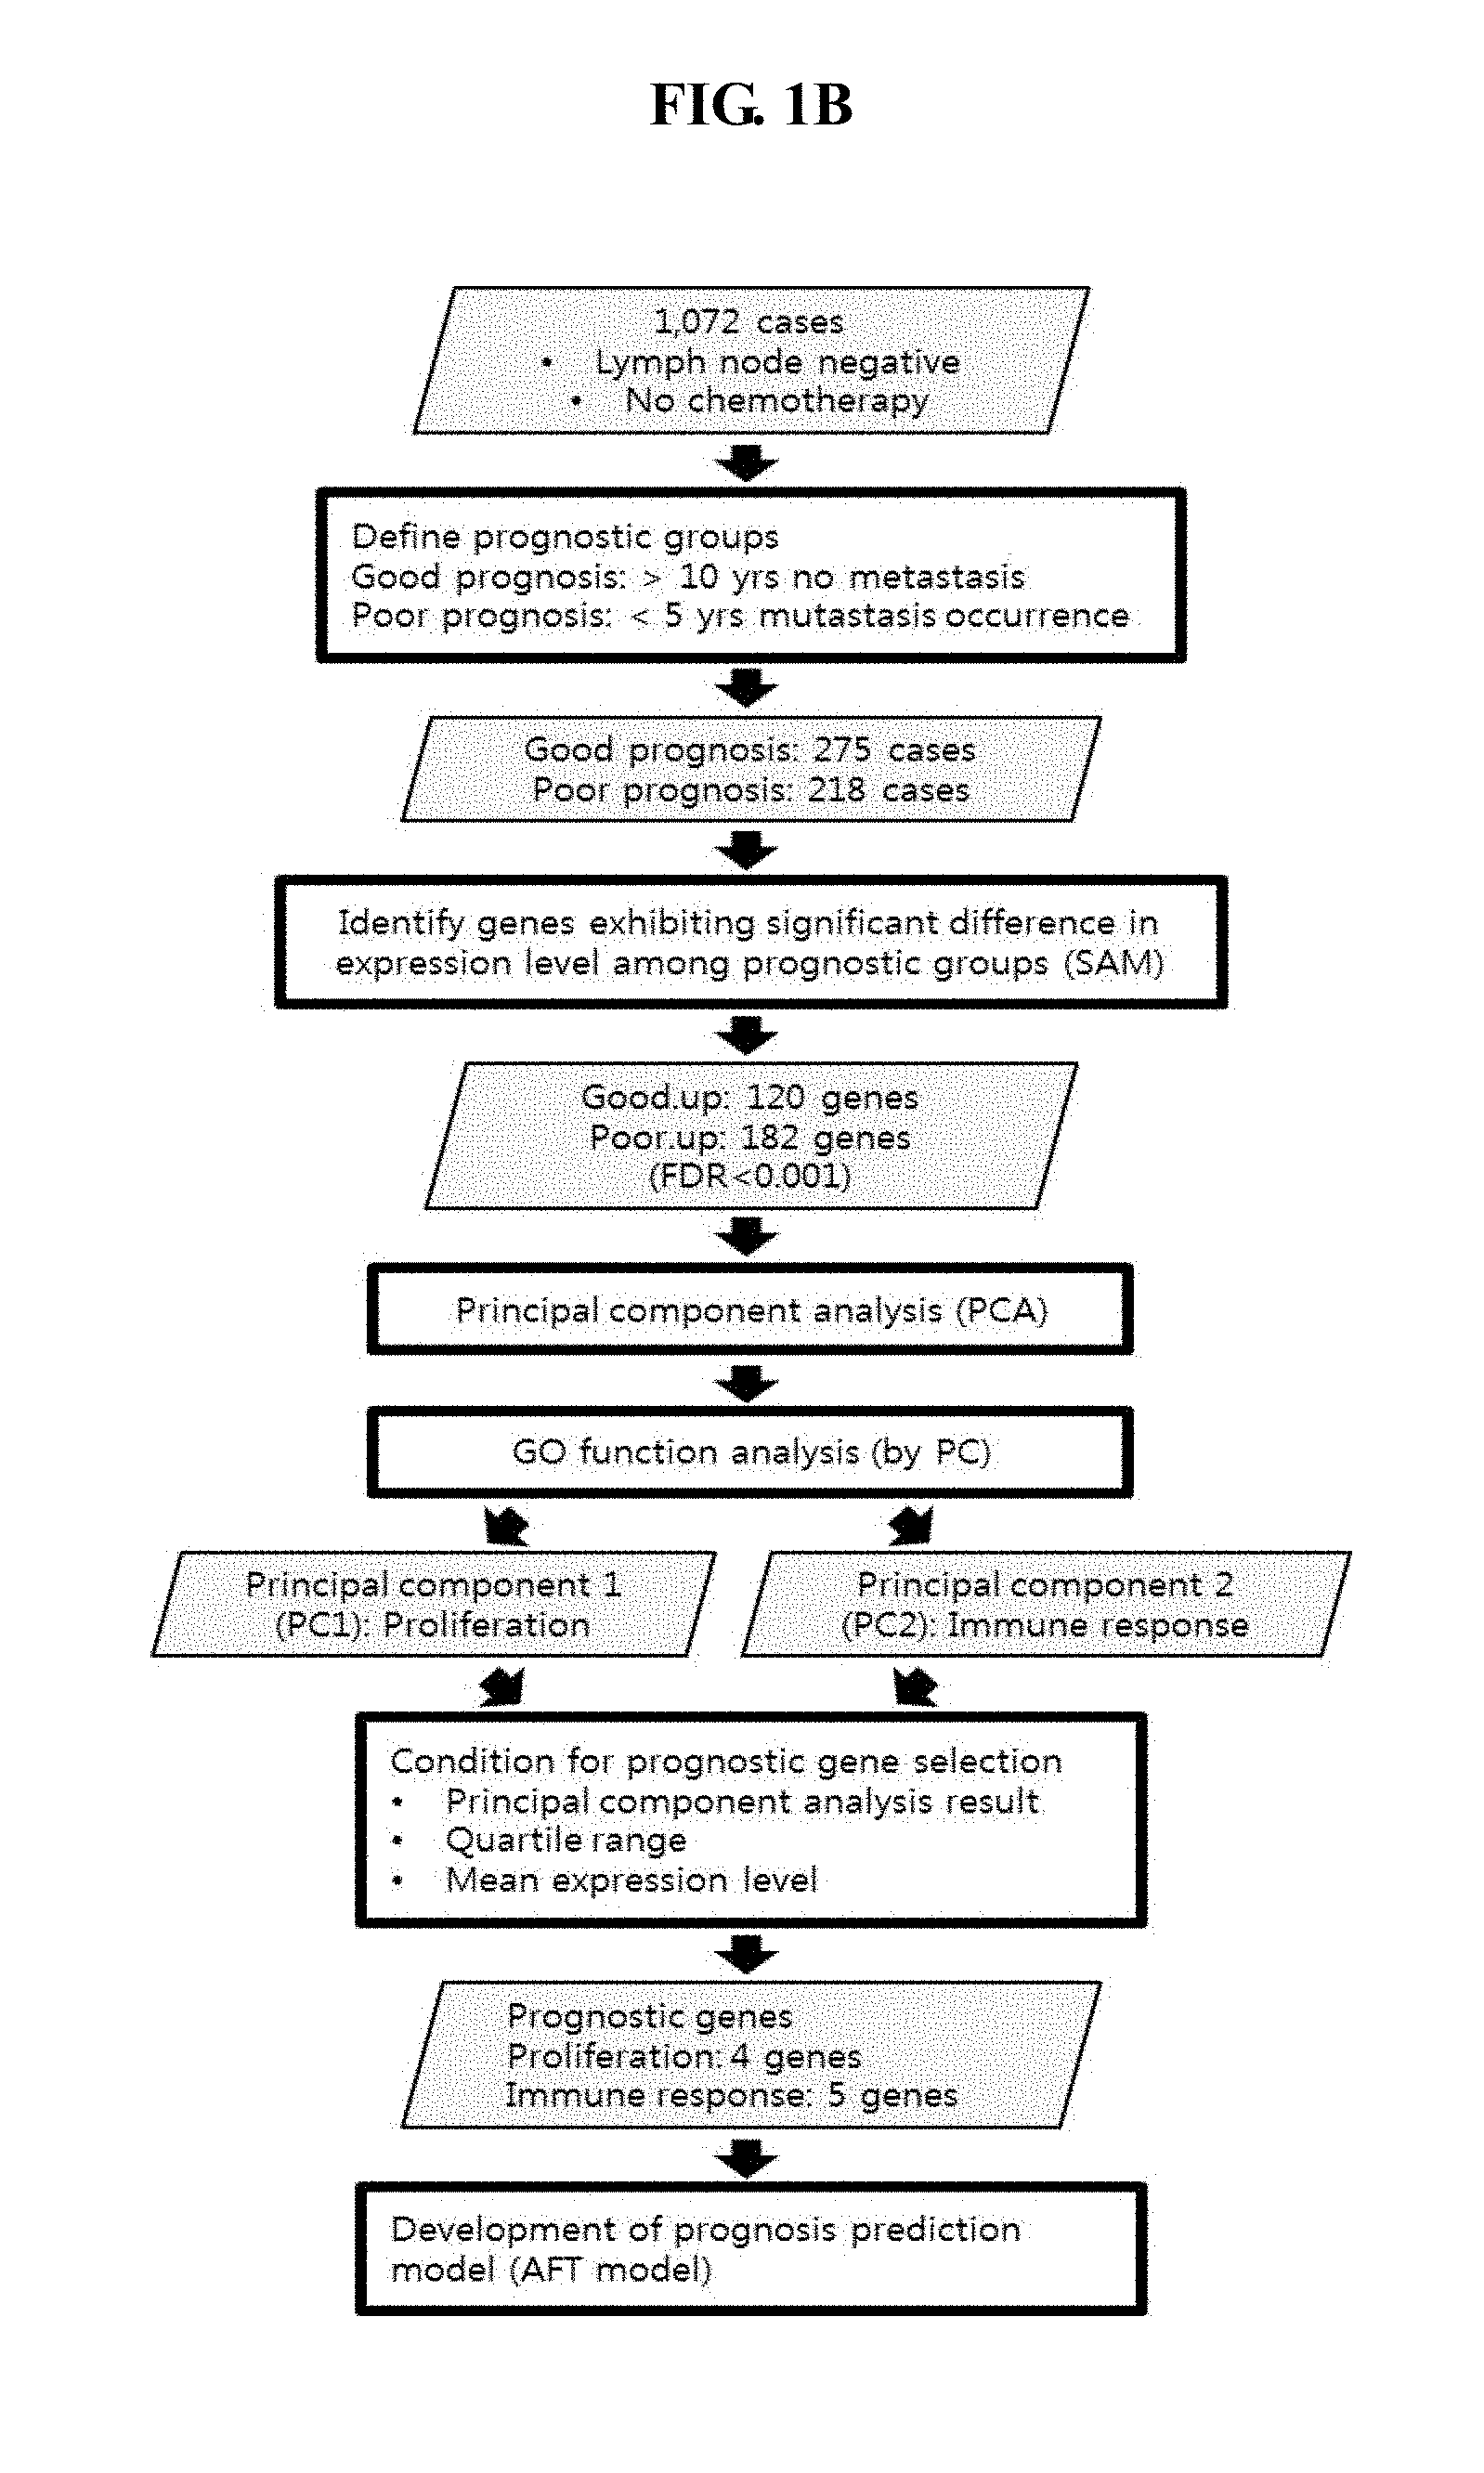
[0048] FIG. 1A schematically shows a normalization procedure by curation and pre-processing of microarray data of breast cancer tissue. FIG. 1B schematically shows an identification procedure of prognostic genes in the discovery dataset.
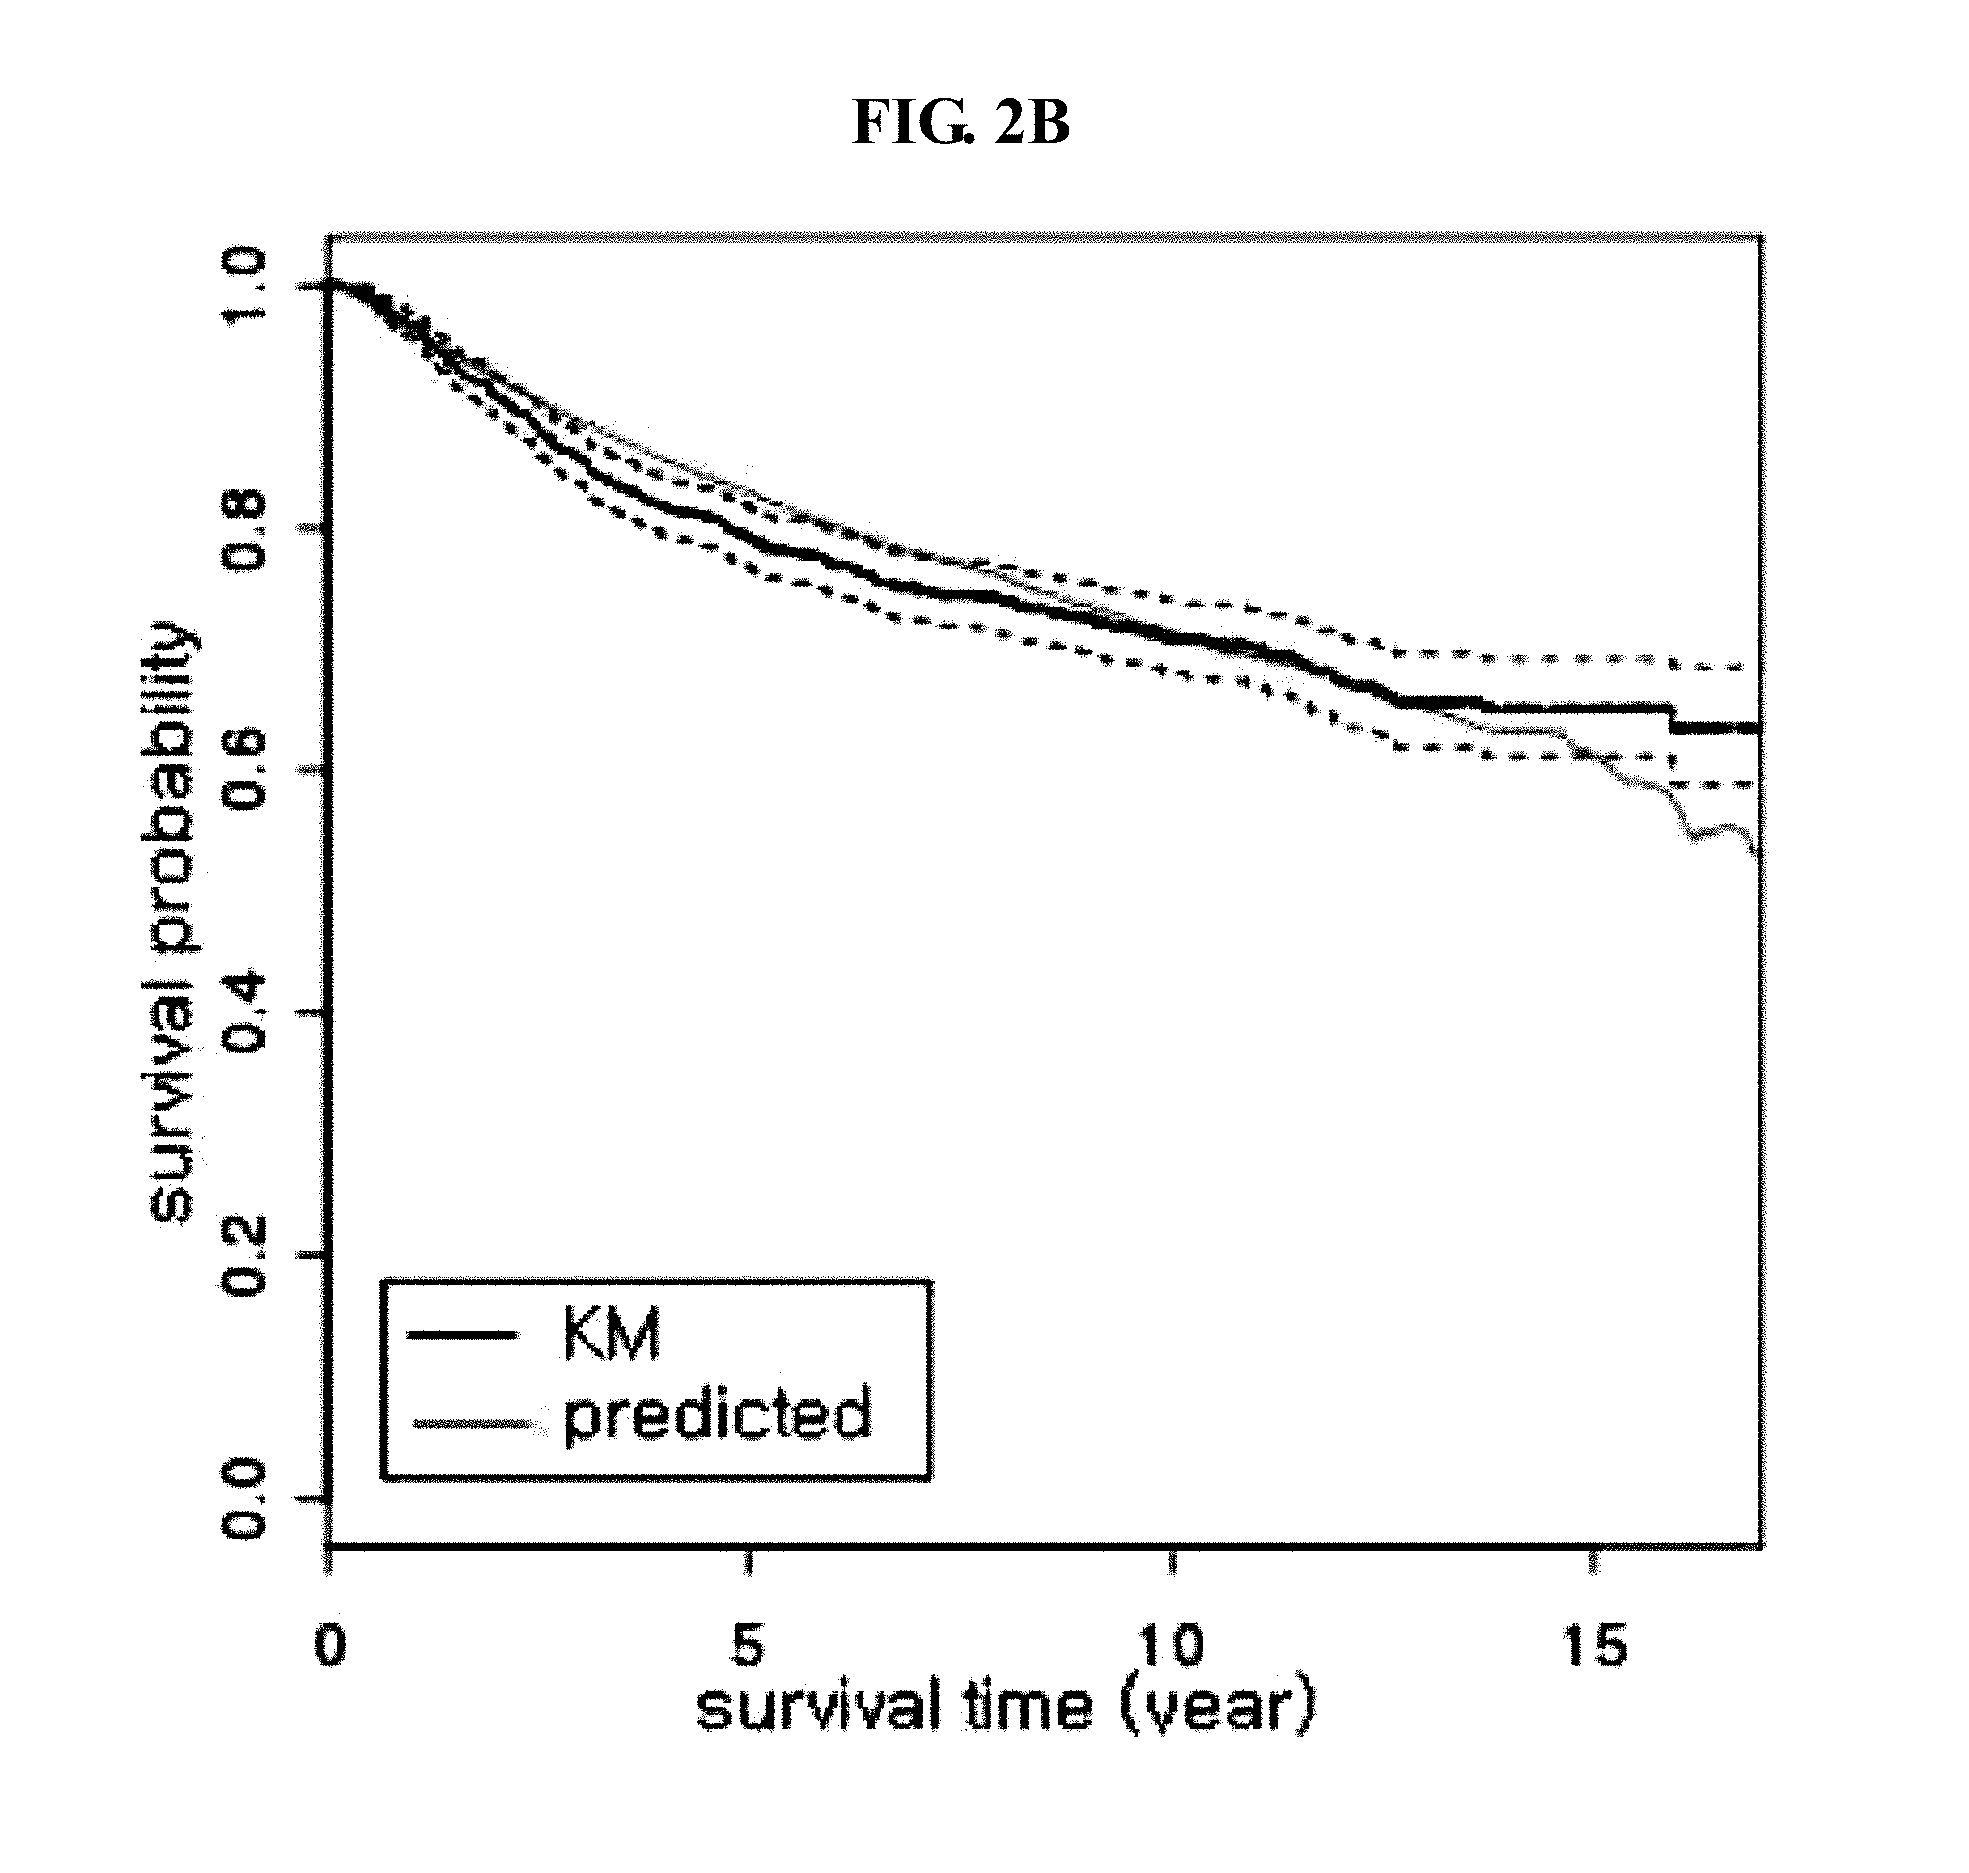
[0049] FIGS. 2A-2D show validation results of the prognostic model (frozen samples) in the discovery dataset. FIG. 2A shows that prognostic indexes of all patients using the prognostic model (frozen samples) were divided into four and classified into four prognostic groups, and the separation of the observed survival probability of each prognostic group was verified. The observed survival probability was compared with the predicted survival probability. FIG. 2B shows that observed survival probabilities were compared with predicted survival probabilities using the prognostic models in overall patients. FIG. 2C shows that overall patients were divided into four groups with respect to the most influential p.mean, and then the concurrence between the observed survival probability and the predicted survival probability by the prognostic model (frozen samples) in each group was verified. FIG. 2D shows that the concurrence between the observed survival probability and the predicted survival probability with respect to 5-year survival probability was verified.
[0050] FIGS. 3A-3C show validation results of the prognostic model (frozen samples) in validation set 1. The validation method was the same as that in the discovery dataset. FIG. 3A shows validation results on the determination, and FIG. 3B shows validation results on the calibration of the overall time period of observation. FIG. 3C shows validation results on the calibration of 5-year survival probability.
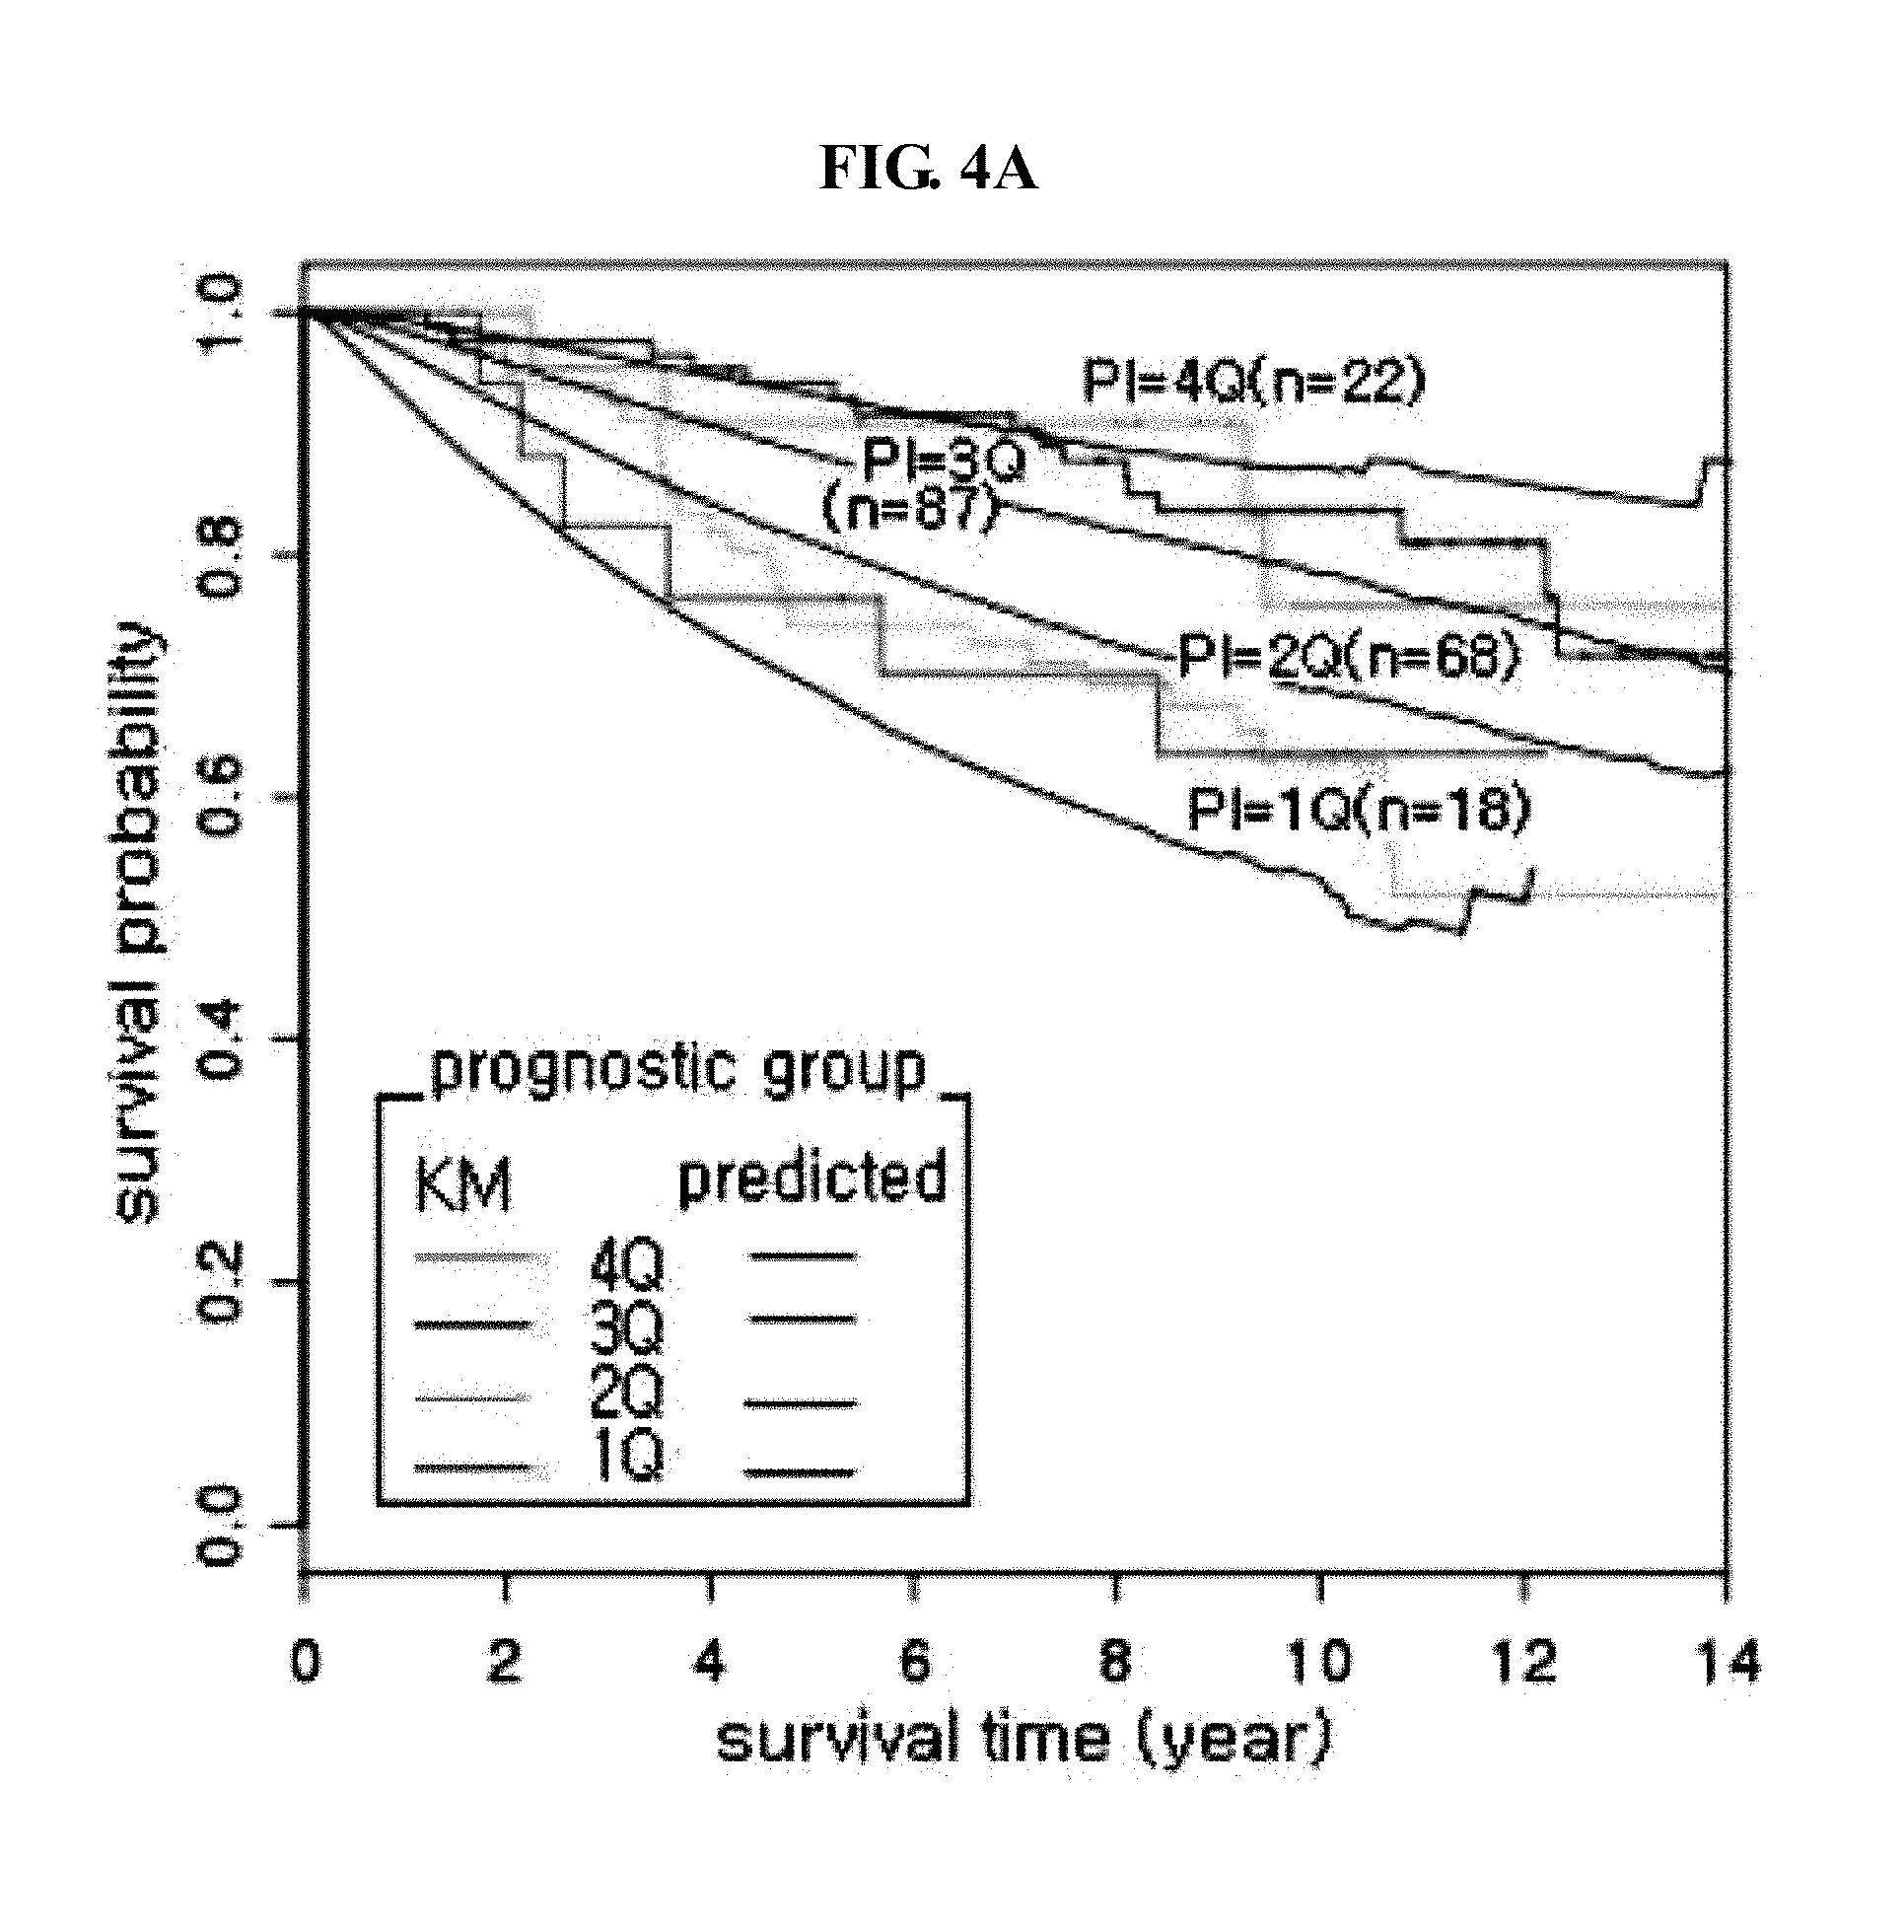
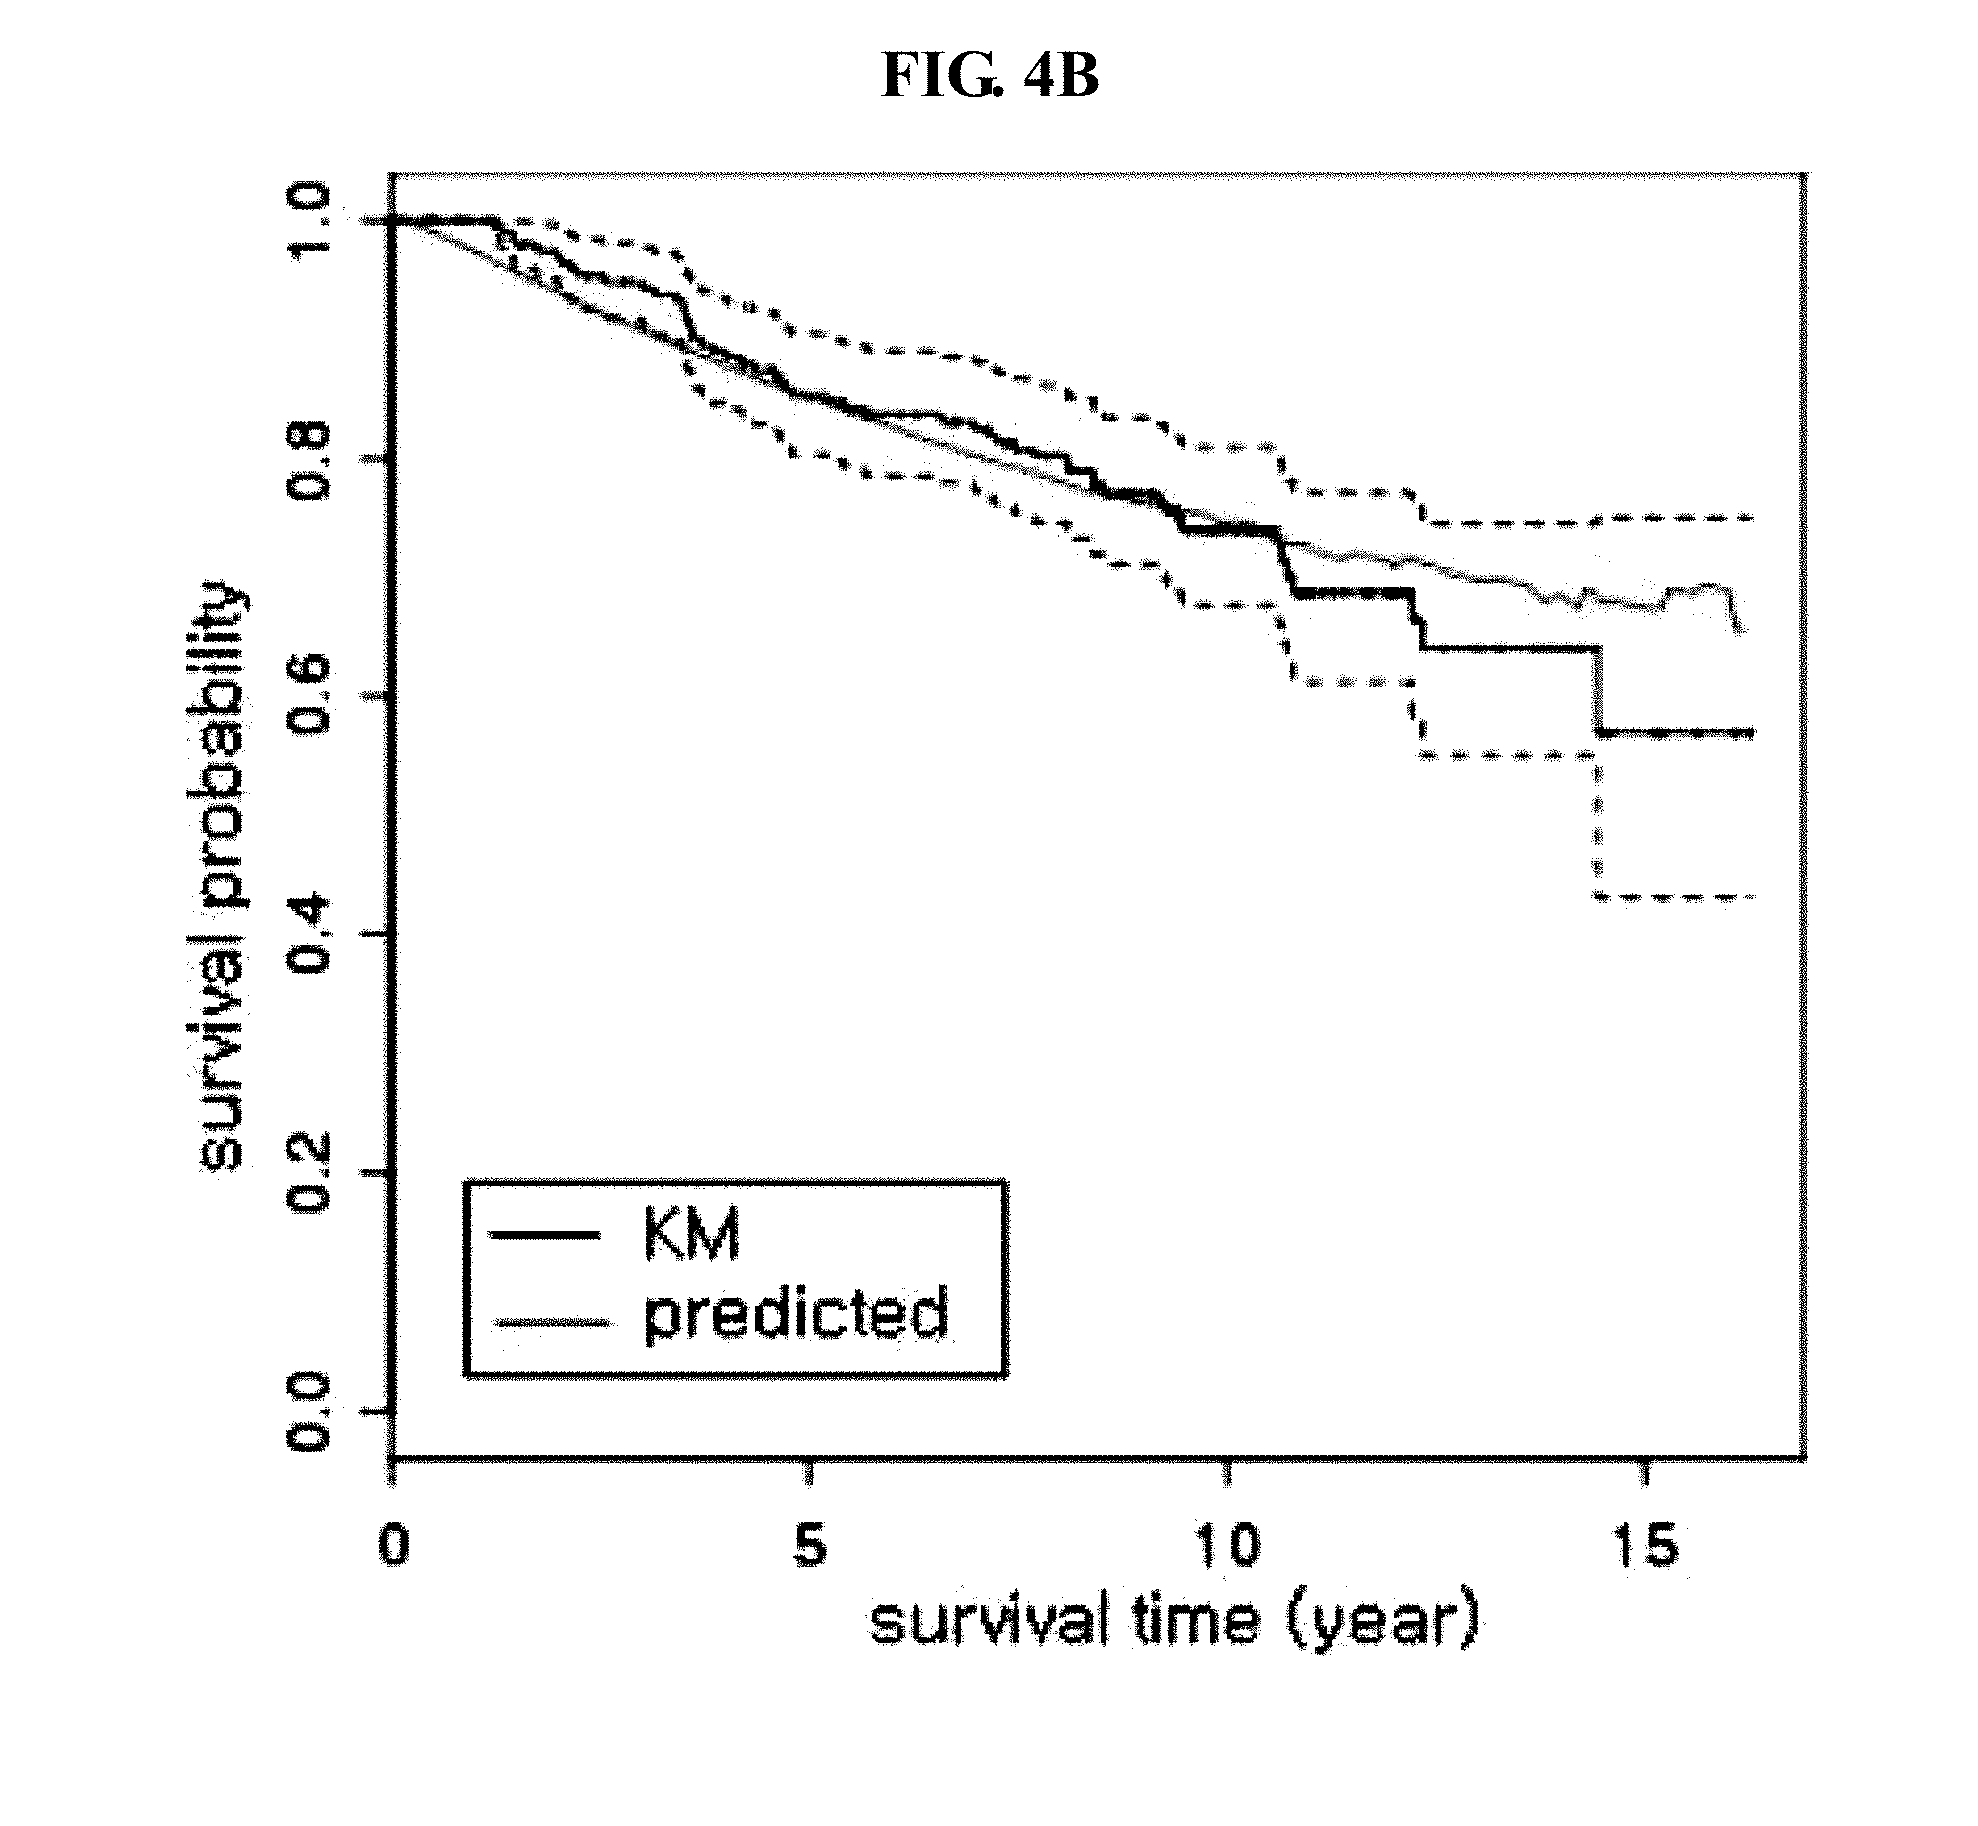
[0051] FIGS. 4A-4C show validation results of the prognostic model (frozen samples) in validation set 2. The validation method was the same as that in the discovery dataset. FIG. 4A shows validation results on determination, and FIG. 4B shows validation results on calibration of the overall time period of observation. FIG. 4C shows validation results on the calibration of 5-year survival probability.
[0052] FIG. 5 shows validation results of the prognostic model (frozen samples) in validation set 3. The validation method was the same as that in the discovery dataset.
[0053] FIGS. 6A-6I show correlation measurement results between FFPE sample (siemens, vertical axis)/frozen sample (horizontal axis) with respect to selected p-gene, and gene names and correlation values (cor) are shown, respectively.
[0054] FIGS. 7A-7F show correlation measurement results between FFPE sample (siemens, vertical axis)/frozen sample (horizontal axis) with respect to selected i-gene, and gene names and correlation values (cor) are shown, respectively.
[0055] FIG. 8 shows a Kaplan-Meier plot of DIMES (Distant Metastasis Free Survival) over the course of 15 years for ER+ breast cancer patients who had been treated with tamoxifen for 5 years after surgery.
[0056] FIG. 9 shows the C-indices of BTN3A2, RRM2, and the combination of BTN3A2 and RRM2, respectively.
DETAILED DESCRIPTION OF THE ILLUSTRATED EMBODIMENTS
[0057] The present invention will be described in more detail.
[0058] The present invention provides a genetic marker for predicting or diagnosing the prognosis of a breast cancer patient and a use thereof. More specifically, the present invention provides a genetic marker of T cell receptor beta constant 1 (TRBC1), butyrophilin, subfamily 3, member A2 (BTN3A2), or major histocompatibility complex, class II, DP alpha 1 (HLA-DPA1), for predicting or diagnosing the prognosis of breast cancer, especially, early-stage breast cancer. In addition, the present invention provides a method for predicting the prognosis of breast cancer, the method comprising: (a) isolating mRNA from a sample; (b) measuring the mRNA expression level of at least one gene selected from the group consisting of T cell receptor beta constant 1 (TRBC1), butyrophilin, subfamily 3, member A2 (BTN3A2), and major histocompatibility complex, class II, DP alpha 1 (HLA-DPA1); and (c) normalizing the mRNA expression level of the gene, wherein the overexpression of the gene is determined as indicating good prognosis.
[0059] Herein, T cell receptor beta constant 1 (TRBC1), butyrophilin, subfamily 3, member A2 (BTN3A2), or major histocompatibility complex, class II, DP alpha 1 (HLA-DPA1) may serve as a genetic marker in the present invention. They may be used for predicting or diagnosing the prognosis of early-stage breast cancer by being independently selected, or by a combination of two or three genes. Each gene may be a sequence thereof known in the art or a sequence of the synonym thereof, and preferably a sequence thereof derived from a human being. More preferably, TRBC1 may be Genbank Accession No. BC030533.1; BTN3A2 may be Genbank Accession No. NM_007047.3; and HLA-DPA1 may be Genbank Accession No. NM_001242524.1, NM_001242525.1, or NM_033554.3. The synonym and the sequence of each gene may be searched in Genbank or Swissprot.
[0060] Herein, the breast cancer may be an invasive breast cancer, or breast cancer stage I, II, or III. Herein, the breast cancer may be estrogen receptor positive (ER+).
[0061] As used herein, the term "prognosis" refers to symptoms in the future or prospects of progress determined by disease diagnose. The prognosis in cancer patients generally means whether or not the cancer is metastatic within a certain period or the survival period after the occurrence of cancer or the surgical procedure. The prediction of prognosis (or the diagnosis of prognosis) presents clues for future direction of breast cancer treatment, especially, including whether chemotherapy treatment is performed on early-stage breast cancer patients, and thus is a very important clinical challenge. The prediction of prognosis includes predictions of the response of patients to disease therapeutic agents and therapeutic progress.
[0062] Herein, the sample may be a breast cancer tissue of a breast cancer patient. The breast cancer tissue may contain some normal cells, and may preferably be a formalin-fixed paraffin-embedded (FFPE) sample of the breast cancer tissue including cancer cells of the patient.
[0063] The marker for predicting or diagnosing the prognosis of breast cancer according to the present invention may be detected through polymerase chain reaction (PCR) amplification of a target gene. The detection of the target gene according to the present invention is preferably a detection of the expression level of the target gene, and more preferably a quantitative detection of the expression level of the target gene. For the detection of the expression level, the isolation of mRNA in the sample tissue and the synthesis of cDNA from the mRNA may be needed. For the isolation of mRNA, the isolation methods of mRNA from a sample, which are known in the art, may be employed, and since the sample is preferably an FFPE sample, the isolation methods of mRNA, which are appropriate for the FFPE sample, may be employed. For the synthesis of cDNA, the cDNA synthesis methods using mRNA as a template, which are known in the art, may be employed. Preferably, the detection of the marker for predicting or diagnosing the prognosis of breast cancer according to the present invention is a quantitative detection of the mRNA expression in the FFPE sample, and thus may be the detection by the isolation method of mRNA and the reverse transcription quantitative polymerase chain reaction (RT-qPCR) method with respect to the FFPE sample.
[0064] Herein, the detection may be a measurement of the mRNA expression level. The measurement of the expression level may be conducted using the methods known in the art, but may be conducted by an optical quantitative analysis system using a probe labeled with a reporter fluorescent dye and/or a quencher fluorescent dye. The measurement may be conducted using a commercially available system, for example, ABI PRISM 7700.TM. Sequence Detection System.TM., Roche Molecular BiochemicalsLightcycler, and an operating system affiliated therewith, such as software. The measurement data may be expressed as a measurement value or a threshold cycle (Ct or Cp). The point in which the measured fluorescent value is first recorded as being statistically significant is defined as the threshold cycle. The threshold cycle is inversely proportional to the value at the beginning in which targets of detection are present as a template of PCR, and thus the lower threshold cycle value indicates the presence of the quantitatively increased targets of detection.
[0065] Meanwhile, the present invention provides a composition for predicting or diagnosing the prognosis of breast cancer, the composition comprising a primer pair as an active ingredient, wherein the primer pair is for at least one gene selected from the group consisting of TRBC1, BTN3A2, and HLA-DPA1, and wherein the primer pair is capable of amplifying a target gene through PCR amplification.
[0066] As used herein, the term "primer" refers to an oligonucleotide, and the primer may act as an initial point of synthesis in the condition where the synthesis of the primer extension products that are complementary to a nucleic acid chain (template) is induced, that is, the presence of nucleotides and polymerases such as DNA polymerases, and appropriate temperature and pH. Preferably, the primer is deoxyribonucleotide, and has a single chain. The primer used herein may include naturally occurring dNMPs (that is, dAMP, dGMP, dCMP, and dTMP), modified nucleotides, or non-naturally occurring nucleotides. Also, the primer may include ribonucleotides.
[0067] The primer of the present invention may be an extension primer that is annealed to a target nucleic acid to form a sequence complementary to the target nucleic acid by template-dependent nucleic acid polymerase. The extension primer is extended to a site at which an immobilized probe is annealed, and thus occupies the site at which the probe is annealed.
[0068] The extension primer used herein includes a hybrid nucleotide sequence complementary to the first site of the target nucleic acid. The term "complementary" refers to being sufficiently complementary such that primers or probes are selectively hybridized with the target nucleic acid sequence under predetermined annealing or hybridizing conditions, encompassing the terms "substantially complementary" and "perfectly complementary", and means preferably "perfectly complementary". As used herein, the term "substantially complementary sequence" in conjunction with the primer sequence, means including the sequence that is partially un-identical to the sequence of the comparative target within the range in which the sequence is annealed to a particular sequence to serve as a primer, as well as the perfectly identical sequence.
[0069] The primer needs to be long enough to prime the synthesis of extension products in the presence of polymerases. The appropriate length of the primer varies depending on several factors, such as temperature, field of application, and primer source, but the primer generally has 15.about.30 nucleotides. Short primer molecules generally require lower temperatures in order to form sufficiently stable hybrid complexes together with templates. The term "annealing" or "priming" refers to the apposition of oligodeoxynucleotide or nucleic acid to the template nucleic acid, and the apposition enables the polymerase to polymerize nucleotides to form a nucleic acid molecule, which is complementary to the template nucleic acid or a portion thereof.
[0070] The sequences of primers do not need to have a perfectly complementary sequence to some sequences of templates. The primers are good enough so long as they have sufficient complementarity within the scope in which they can perform their inherent actions through hybridization with the template. Therefore, the primer of the present invention does not need to have a perfectly complementary sequence to the foregoing nucleotide sequence as a template. The primers are good enough so long as they have sufficient complementarity within the scope in which they can perform their actions through hybridization with the gene sequence. This design of the primers may be easily carried out by a person skilled in the art with reference to the foregoing nucleotide sequences. For instance, the design of the primers may be carried out using computer programs for primer design (e.g., PRIMER 3 program).
[0071] The present invention provides a kit for predicting or diagnosing the prognosis of breast cancer, the kit comprising the primer pair. The kit of the present invention may further comprise tools and/or reagents known in the art which are used for PCR, RNA separation in samples, and cDNA synthesis, in addition to primer pairs allowing PCR amplification of TRBC1, BTN3A2, and/or HLA-DPA1. The kit of the present invention may further comprise, if necessary, tubes which are to be used to mix respective components, well plates, instruction manuals describing how to use, or the like.
[0072] The present invention provides a method for calculating a predictive value of the prognosis of breast cancer to provide information necessary for predicting or diagnosing the prognosis of a breast cancer patient, the method comprising:
[0073] (a) isolating mRNA from a sample;
[0074] (b) measuring the mRNA expression level of at least one gene selected from the group consisting of T cell receptor beta constant 1 (TRBC1), butyrophilin, subfamily 3, member A2 (BTN3A2), and major histocompatibility complex, class II, DP alpha 1 (HLA-DPA1);
[0075] (c) normalizing the mRNA expression level of the gene;
[0076] (d) inserting the normalized value into a predetermined calculation formula to calculate a numerical value; and
[0077] (e) determining the breast cancer prognosis as being good(favorable) or poor(unfavorable) depending on the numerical value.
[0078] The present invention also provides a method for calculating a predictive value of the prognosis of breast cancer to provide information necessary for predicting or diagnosing the prognosis of a breast cancer patient, the method comprising:
[0079] (a) isolating mRNA from a sample of the breast cancer patient;
[0080] (b) measuring the mRNA expression level of at least one gene selected from the i-gene group consisting of TRBC1 (T cell receptor beta constant 1), BTN3A2 (butyrophilin, subfamily 3, member A2), and HLA-DPA1 (major histocompatibility complex, class II, DP alpha 1), and the mRNA expression level of at least one gene selected from the p-gene group consisting of AURKA (Aurora Kinase A), CCNB2 (Cyclin B2), FOXM1 (Forkhead box protein M1), MMP11 (Matrix Metallopeptidase 11), PTTG1 (Pituitary Tumor-Transforming 1), RACGAP1 (Rac GTPase Activating Protein 1), RRM2 (Ribonucleotide Reductase M2), TOP2A (Topoisomerase II Alpha) and UBE2C (Ubiquitin-Conjugating Enzyme E2C);
[0081] (c) normalizing the mRNA expression level of the gene; and
[0082] (d) calculating a predictive value of the prognosis of breast cancer by combining the normalized value of the gene,
[0083] wherein the predictive value indicates the prognosis of breast cancer as being good or poor.
[0084] Herein, the expression level of the target gene for detection needs to be normalized since the overall gene expression level may vary depending on the target patient or sample. The normalization is made through the difference in the expression of the gene, which can indicate the difference from the basic expression level, and preferably, the normalization may be carried out by measuring the expression levels of one to five genes selected from C-terminal-binding protein 1 (CTBP1), TATA-binding protein (TBP), hydroxymethylbilane synthase (HMBS), cullin 1 (CUL1), and ubiquilin-1 (UBQLN1) (or the mean of expression levels of selected multiple genes), and calculating the ratio thereof.
[0085] Meanwhile, the present invention provides a method for breast cancer prognosis prediction and diagnosis, the method comprising a step of using a primer pair to measure the mRNA expression level of a selected gene from a sample of a breast cancer patient,
[0086] wherein the primer pair is for at least one gene selected from the group consisting of TRBC1, BTN3A2, and HLA-DPA1 and
[0087] wherein the primer pair is capable of amplifying a target gene through PCR amplification.
[0088] Furthermore, the present invention provides a primer pair for at least one gene selected from the group consisting of TRBC1, BTN3A2, and HLA-DPA1, wherein the primer pair is capable of amplifying a target gene through PCR amplification.
[0089] Still furthermore, the present invention provides a use of a primer pair for preparing a preparation for predicting the prognosis of breast cancer, wherein the primer pair is for at least one gene selected from the group consisting of TRBC1, BTN3A2, and HLA-DPA1, and wherein the primer pair is capable of amplifying a target gene through PCR amplification.
[0090] Some embodiments of the present invention provide a method for diagnosing a prognosis of breast cancer and treating breast cancer in a breast cancer patient, the method comprising the steps of:
[0091] collecting a sample from the breast cancer patient;
[0092] isolating mRNA from the sample of the breast cancer patient;
[0093] measuring a first mRNA expression level for the mRNA of at least one i-gene selected from the group consisting of BTN3A2 (butyrophilin, subfamily 3, member A2), T cell receptor beta constant 1 (TRBC1), and major histocompatibility complex, class II, DP alpha 1 (HLA-DPA1), and a second mRNA expression level for the mRNA of at least one p-gene selected from the group consisting of the p-genes of the following Table 1;
[0094] normalizing the first and second mRNA expression levels to determine a normalized value;
[0095] diagnosing the prognosis of breast cancer patient by using the determined normalized value of the first and second mRNA expression levels, wherein an overexpression of the i-gene indicates a good prognosis of breast cancer, while an overexpression of the p-gene indicates a poor prognosis of breast cancer; and
[0096] treating the diagnosed breast cancer patient by administering at least one of an anti-cancer agent, a surgery and a radiation therapy.
TABLE-US-00002 TABLE 1 List of p-genes No. Gene ID Gene Name 1 APITD1 apoptosis-inducing, TAF9-like domain 1 2 BID BH3 interacting domain death agonist 3 BUB1B BUB1 mitotic checkpoint serine/threonine kinase B 4 BUB1 BUB1 mitotic checkpoint serine/threonine kinase 5 CKS1B CDC28 protein kinase regulatory subunit 1B 6 CKS2 CDC28 protein kinase regulatory subunit 2 7 DLGAP5 discs, large (Drosophila) homolog-associated protein 5 8 POLA1 polymerase (DNA directed), alpha 1, catalytic subunit 9 POLA2 polymerase (DNA directed), alpha 2, accessory subunit 10 DSCC1 DNA replication and sister chromatid cohesion 1 11 DNA2 DNA replication helicase/nuclease 2 12 E2F8 E2F transcription factor 8 13 ERCC6L excision repair cross-complementation group 6-like 14 FBXO5 F-box protein 5 15 FANCI Fanconi anemia, complementation group I 16 GADD45GIP1 growth arrest and DNA-damage-inducible, gamma interacting protein 1 17 GINS1 GINS complex subunit 1 (Psf1 homolog) 18 GINS2 GINS complex subunit 2 (Psf2 homolog) 19 MAD2L1 MAD2 mitotic arrest deficient-like 1 (yeast) 20 MAD2L1BP MAD2L1 binding protein 21 MIS18A MIS18 kinetochore protein A 22 MYBL2 v-myb avian myeloblastosis viral oncogene homolog-like 2 23 NAA50 N(alpha)-acetyltransferase 50, NatE catalytic subunit 24 NEK2 NIMA-related kinase 2 25 NSL1 NSL1, MIS12 kinetochore complex component 26 PBK PDZ binding kinase 27 RAB11A RAB11A, member RAS oncogene family 28 RAD51C RAD51 paralog C 29 RAD54B RAD54 homolog B (S. cerevisiae) 30 RANBP1 RAN binding protein 1 31 RALA v-ral simian leukemia viral oncogene homolog A (ras related) 32 RACGAP1 Rac GTPase activating protein 1 33 SSNA1 Sjogren syndrome nuclear autoantigen 1 34 STAMBP STAM binding protein 35 SSSCA1 Sjogren syndrome/scleroderma autoantigen 1 36 TAF2 TAF2 RNA polymerase II, TATA box binding protein (TBP)-associated factor, 150 kDa 37 TIPIN TIMELESS interacting protein 38 TIPRL TOR signaling pathway regulator 39 TRIAP1 TP53 regulated inhibitor of apoptosis 1 40 TTK TTK protein kinase 41 ZWINT ZW10 interacting kinetochore protein 42 ASPM asp (abnormal spindle) homolog, microcephaly associated (Drosophila) 43 AURKA aurora kinase A 44 AURKB aurora kinase B 45 BRD7 bromodomain containing 7 46 CSNK2A1 casein kinase 2, alpha 1 polypeptide 47 CDC20 cell division cycle 20 48 CDC25C cell division cycle 25C 49 CENPA centromere protein A 50 CENPE centromere protein E, 312 kDa 51 CENPF centromere protein F, 350/400 kDa 52 CENPI centromere protein I 53 CENPM centromere protein M 54 CENPN centromere protein N 55 CENPU centromere protein U 56 CEP55 centrosomal protein 55 kDa 57 CHEK1 checkpoint kinase 1 58 CDT1 chromatin licensing and DNA replication factor 1 59 C11orf80 chromosome 11 open reading frame 80 60 CCNA2 cyclin A2 61 CCNB1 cyclin B1 62 CCNB2 cyclin B2 63 CCNE2 cyclin E2 64 CDK1 cyclin-dependent kinase 1 65 CDKN3 cyclin-dependent kinase inhibitor 3 66 CKAP5 cytoskeleton associated protein 5 67 DTL denticleless E3 ubiquitin protein ligase homolog (Drosophila) 68 DCTN2 dynactin 2 (p50) 69 DYNLT1 dynein, light chain, Tctex-type 1 70 ECD ecdysoneless homolog (Drosophila) 71 ECT2 epithelial cell transforming 2 72 EIF4G1 eukaryotic translation initiation factor 4 gamma, 1 73 EIF4EBP1 eukaryotic translation initiation factor 4E binding protein 1 74 EZR ezrin 75 FEN1 flap structure-specific endonuclease 1 76 FOXM1 forkhead box M1 77 GSK3B glycogen synthase kinase 3 beta 78 HMGN5 high mobility group nucleosome binding domain 5 79 INTS7 integrator complex subunit 7 80 KIF11 kinesin family member 11 81 KIF14 kinesin family member 14 82 KIF20A kinesin family member 20A 83 KIF23 kinesin family member 23 84 KIF2C kinesin family member 2C 85 KIF4A kinesin family member 4A 86 KIFC1 kinesin family member C1 87 MIF macrophage migration inhibitory factor (glycosylation-inhibiting factor) 88 MELK maternal embryonic leucine zipper kinase 89 MED1 mediator complex subunit 1 90 MCM10 minichromosome maintenance complex component 10 91 MCM2 minichromosome maintenance complex component 2 92 MCM6 minichromosome maintenance complex component 6 93 MAP2K1 mitogen-activated protein kinase kinase 1 94 MSH6 mutS homolog 6 95 MLF1 myeloid leukemia factor 1 96 NCAPG non-SMC condensin I complex, subunit G 97 NUSAP1 nucleolar and spindle associated protein 1 98 NUP155 nucleoporin 155 kDa 99 NUP93 nucleoporin 93 kDa 100 ORC4 origin recognition complex, subunit 4 101 ORC5 origin recognition complex, subunit 5 102 PIN1 peptidylprolyl cis/trans isomerase, NIMA-interacting 1 103 PIK3R4 phosphoinositide-3-kinase, regulatory subunit 4 104 PTTG1 pituitary tumor-transforming 1 105 PTTG3P pituitary tumor-transforming 3, pseudogene 106 PLK1 polo-like kinase 1 107 PLK4 polo-like kinase 4 108 PRIM1 primase, DNA, polypeptide 1 (49 kDa) 109 PA2G4 proliferation-associated 2G4, 38 kDa 110 LEPREL4 leprecan-like 4 111 PSMC3 proteasome (prosome, macropain) 26S subunit, ATPase, 3 112 PSMC6 proteasome (prosome, macropain) 26S subunit, ATPase, 6 113 PSMD10 proteasome (prosome, macropain) 26S subunit, non-ATPase, 10 114 PSMD12 proteasome (prosome, macropain) 26S subunit, non-ATPase, 12 115 PSMD14 proteasome (prosome, macropain) 26S subunit, non-ATPase, 14 116 PSMD2 proteasome (prosome, macropain) 26S subunit, non-ATPase, 2 117 PSMD3 proteasome (prosome, macropain) 26S subunit, non-ATPase, 3 118 PSMD4 proteasome (prosome, macropain) 26S subunit, non-ATPase, 4 119 PSMD6 proteasome (prosome, macropain) 26S subunit, non-ATPase, 6 120 PSMD7 proteasome (prosome, macropain) 26S subunit, non-ATPase, 7 121 PSMA1 proteasome (prosome, macropain) subunit, alpha type, 1 122 PSMA2 proteasome (prosome, macropain) subunit, alpha type, 2 123 PSMA3 proteasome (prosome, macropain) subunit, alpha type, 3 124 PSMA4 proteasome (prosome, macropain) subunit, alpha type, 4 125 PSMA6 proteasome (prosome, macropain) subunit, alpha type, 6 126 PSMA7 proteasome (prosome, macropain) subunit, alpha type, 7 127 PSMB3 proteasome (prosome, macropain) subunit, beta type, 3 128 PSMB5 proteasome (prosome, macropain) subunit, beta type, 5 129 PSMB7 proteasome (prosome, macropain) subunit, beta type, 7 130 PRMT1 protein arginine methyltransferase 1 131 PPP2R3B protein phosphatase 2, regulatory subunit B'', beta 132 PPP3CA protein phosphatase 3, catalytic subunit, alpha isozyme 133 PRC1 protein regulator of cytokinesis 1 134 RRM2 ribonucleotide reductase M2 135 RPS6KB1 ribosomal protein S6 kinase, 70 kDa, polypeptide 1 136 SPAG5 sperm associated antigen 5 137 SKA1 spindle and kinetochore associated complex subunit 1 138 STMN1 stathmin 1 139 SLBP stem-loop binding protein 140 SMC2 structural maintenance of chromosomes 2 141 SMC4 structural maintenance of chromosomes 4 142 SMC5 structural maintenance of chromosomes 5 143 TERF1 telomeric repeat binding factor (NIMA- interacting) 1 144 TXNL4A thioredoxin-like 4A 145 TRIP13 thyroid hormone receptor interactor 13 146 TOP2A topoisomerase (DNA) II alpha 170 kDa 147 TFDP2 transcription factor Dp-2 (E2F dimerization partner 2) 148 TACC3 transforming, acidic coiled-coil containing protein 3 149 TUBB3 tubulin, beta 3 class III 150 TUBB4B tubulin, beta 4B class IVb 151 TUBB tubulin, beta class I 152 TSG101 tumor susceptibility 101 153 UBE2C ubiquitin-conjugating enzyme E2C 154 UBE2L3 ubiquitin-conjugating enzyme E2L 3 155 UBE2S ubiquitin-conjugating enzyme E2S 156 USP9X ubiquitin specific peptidase 9, X-linked 157 VRK1 vaccinia related kinase 1 158 ZFHX3 zinc finger homeobox 3 159 ZWILCH zwilch kinetochore protein 160 MMP11 Matrix Metallopeptidase 11
[0097] In some exemplary embodiments of the present invention, the i-gene may be BTN3A2 (butyrophilin, subfamily 3, member A2).
[0098] In another exemplary embodiments of the present invention, the p-gene may be selected from the group consisting of AURKA (Aurora Kinase A), CCNB2 (Cyclin B2), FOXM1 (Forkhead box protein M1), MMP11 (Matrix Metallopeptidase 11), PTTG1 (Pituitary Tumor-Transforming 1), RACGAP1 (Rac GTPase Activating Protein 1), RRM2 (Ribonucleotide Reductase M2), TOP2A (Topoisomerase II Alpha) and UBE2C (Ubiquitin-Conjugating Enzyme E2C).
[0099] The steps of measuring mRNA expression levels of target genes and normalizing the measured mRNA expression levels are described above and well known in the art, while the step of treating the diagnosed breast cancer patient may be conducted by administering at least one of an anti-cancer agent, a surgery and a radiation therapy which is considered appropriate by one skilled in a cancer therapy.
[0100] The following references are made in the above-mentioned nucleotide and protein works (Maniatis et al., Molecular Cloning: A Laboratory Manual, Cold Spring Harbor Laboratory, Cold Spring Harbor, N.Y. (1982); Sambrook et al., Molecular Cloning: A Laboratory Manual, 2d Ed., Cold Spring Harbor Laboratory Press(1989); Deutscher, M., Guide to Protein Purification Methods Enzymology, vol. 182. Academic Press. Inc., San Diego, Calif. (1990); Ausubel et al., Current Protocols of Molecular Biology, John Wiley and Sons (1997); Rupp and Locker, Lab Invest. 56: A67 (1987); De Andres et al., BioTechniques 18: 42044 (1995); Held et al., Genome Research 6:986-994 (1996); T. E. Godfrey et al. J. Molec. Diagnostics 2: 84-91 (2000); K. Specht et al., Am. J. Pathol. 158: 419-29 (2001)).
[0101] Accordingly, the present invention provides a genetic marker for predicting or diagnosing the prognosis of early-stage breast cancer. The genetic marker of the present invention enables the prediction or diagnosis of the prognosis of a breast cancer patient, and thus can be favorably used to present clues for the future direction of breast cancer treatment, including the determination on whether anticancer treatment is needed.
[0102] Hereinafter, the present invention will be described in detail with reference to the following examples.
[0103] However, the following examples are merely for illustrating the present invention and are not intended to limit the scope of the present invention.
[0104] For examples in the present specification, the disclosures of Korean Patent Application Publication No. 10-2012-0079295 and PCT Publication No. WO2012093821A2 are entirely incorporated into the present specification by reference, and the level of the technical field to which the present pertain and the details of the present invention are explained more clearly.
[0105] Methods
[0106] Collection of Expression Profile in Early-Stage Breast Cancer Tissue
[0107] Expression profiles and clinical information obtained using frozen cancer tissues of early-stage breast cancer patients were collected from open database GEO (http://www.ncbi.nlm.nih.gov/geo). Each of a total nine independent expression profile sets was a relatively big dataset composed of 100 or more samples, and was made in order to conduct researches on prognosis of early-stage breast cancer patients (2, 4, 9, 10, 13, 25, 32, 33). Of these, eight datasets were made using microarray platform, Affymetrix U133A, and the other one dataset was manufactured using Agilent Hu25K. In most cases, important clinical information (age, sex, cancer size, cancer metastasis state, and degree of cancer differentiation) and survival information of patients were collected together. Of the eight datasets made by Affymetrix U133A, six datasets included survival information about distant metastasis (distant metastasis free survival), and the other two datasets included survival information about overall survival. Agilent data included survival information about distant metastasis. Survival analysis on the base of whether distant metastasis occurred or not was performed based on the facts that distant metastasis is the most decisive event in deciding prognosis, the distant metastasis is determined by unique characteristics of cancer, and the largest number of patients had information on the distant metastasis in the collected data. Through comparision of the collected information of all patients, the expression profiles of duplicated 186 cases were removed, and a total of 1,861 unique cases were researched. With respect to seven datasets made by the same platform (Affymetrix U133A), raw files (.CEL) of the expression profiles of corresponding patients were combined together, and then normalized. The normalization was conducted by the rma method (background correction: rma, normalization: quantile, summarization: medianpolish). For the normalization, custom CDF (http://brainarray.mbni.med.umich.edu/Brainarray/) ENTREZG version 13 developed by Manhong Dai et al., was used (34). After the normalization, the expression level of each probe was converted from the one-color expression level into, for example, the two-color expression level by subtracting the mean value of each probe in the discovery dataset. Of the total eight normalized dataset, five datasets were combined together, and then used as the discovery dataset, while two datasets were separately combined, and then used as validation dataset 1, and the other dataset was used as validation dataset 2. Agilent dataset was also used as validation dataset 3.
[0108] Prognosis of Patients and Definition of ER Status
[0109] In order to identify genes associated with prognosis of patients, the collected patients were classified into a good (favorable) prognostic group and a poor (unfavorable) prognostic group. In general clinical practice, five-year survival or metastasis information is used for such a classification. In other words, the prognosis is poor if metastasis or death occurs within five years, and the prognosis is good if metastasis or death does not occur within five years. The distribution of survival times of metastatic patients was investigated using patient information in the discovery dataset. About 73% or more of the metastatic patients had metastasis within 5 years, and less than 7% of them had metastasis after 10 years. Based on this fact, among patients in the discovery dataset, 217 patients who had metastasis within five years were classified as the "poor prognostic group", while 281 patients who had no metastasis for ten years or longer were classified as the "good prognostic group". As a result of classification, the median survival time of the good prognostic group was 2.4 years, while the median survival time of the poor prognostic group was 12.9 years. Error due to unreliable survival information could be minimized by clearly dividing the poor prognostic group and the good prognostic group. The expression or not of the estrogen receptor (ER) is the most commonly used criterion when breast cancer patients are classified by subtypes. In clinical practice, the breast cancer patients are classified into ER+ and ER- through ER immunohistochemistry (IHC) readout results by pathologists. Considering that about 200 patients had no ER IHC information in the collected discovery dataset, and the determination of ER IHC was made for each of five datasets constituting the discovery dataset, independently, the ER status was determined using the mRNA expression level of ESR1 gene in the expression profile for each patient. For the patients having ER IHC information, region of convergence (ROC) analysis was conducted using the ER IHC information and the ERS1 mRNA expression level. Through a comparison between the ER IHC results and the ERS1 mRNA expression level, the cutoff for ER status was determined at the point where the accuracy was highest (accuracy=0.88). The cases showing higher expression levels than the cutoff were classified as ER+, and the cases showing lower expression levels than the cutoff were classified as ER-. In the discovery dataset, 864 patients were designated as ER+ and 240 patients as ER-.
[0110] Selection of Prognostic Genes
[0111] The good prognosis group was defined as ER+, and the poor prognosis group was defined as ER- in the discovery dataset. 275 patients had good prognosis, while 218 patients had poor prognosis. Through significant analysis of microarray (SAM), genes showing a difference in the expression level among the prognostic groups were investigated. By using the q-value of the SAM analysis results, overexpressed genes in the good prognosis group and the poor prognosis group were selected. As a result of combining the selected genes, a total of 302 gene sets that were not duplicated have been made, and a cluster analysis for identifying expression patterns of these genes was conducted using the principal component analysis (PCA) method. Two principal components were selected, and in order to investigate biological functions related to each principal component, GO function analysis was performed for each cluster.
[0112] As a result of GO analysis, principal component 1 was shown to concentrate on the proliferation, whereas principal component 2 was shown to concentrate on the immune response. From genes belonging to two principal components involved in the proliferation and the immune response, genes showing the highest expression level between two prognosis groups were selected, respectively. The genes of the respective gene sets are named as p-gene in view of representing expression patterns of the proliferation and i-gene in view of representing expression patterns of the immune response, respectively.
[0113] Configuration of Prognostic Model Using Parametric Survival Analysis
[0114] Regression analysis in which expression levels of p-gene and i-gene were covariates was performed using the accelerated failure time (AFT) model of parametric survival models. Four p-genes were converted into p.mean by calculating the mean value for each patient, and five i-genes were also converted into i.mean by calculating the mean value of each patient before application. AFT model is specified as:
T.sub.i=T.sub.0exp(.beta..sub.1.chi..sub.1+.beta..sub.2.chi..sub.2+ . . . +.beta..sub.q.chi..sub.q).epsilon..sub.i Equation 1
[0115] wherein, T.sub.i is the survival time of the i-th object; T.sub.0 is the baseline survival time; .chi..sub.i is the vector of the covariates (j=1, 2, . . . , q); .beta. is the coefficient of corresponding covariates; and .epsilon. is the error. In this model, the covariates synergistically influence the baseline survival time, and thus this model is called the accelerated failure time (AFT) model in the industries in which this model is frequently used. The synergistic effect on the survival time, .PHI.=.beta..sub.1.chi..sub.1.chi..sub.1+.beta..sub.2.chi..sub.2+ . . . +.beta..sub.q.chi..sub.q is called the acceleration factor. Where the natural logarithm in Equation (1) is calculated,
log T.sub.i=log T.sub.0+.beta..sub.1.chi..sub.1+.beta..sub.2.chi..sub.2+ . . . +.beta..sub.q.chi..sub.q+.epsilon.* Equation 2
[0116] Thus, the AFT model has the same form as the general linear regression model. However, since the dependent variable log T does not normally distribute and the survival analysis data always includes censored cases, which are not permitted in the linear regression model, Equation (2) cannot be processed like in the linear regression model. Since the distribution of .epsilon.* of Equation (2) may vary for different datasets, unlike where the normal distribution is assumed in the linear regression model, the practical statistical processing is inconvenient. In order to overcome this, log T.sub.0 and .epsilon.* are modified, and expressed as follows:
log T.sub.i=log T.sub.0+.beta..sub.1.chi..sub.i+.beta..sub.2.chi..sub.2+ . . . +.beta..sub.q.chi..sub.q+.sigma.W Equation 3
[0117] wherein W follows the distribution of log T, and the variance thereof is fixed as the value of the normalized distribution. Here, .sigma. is the constant as the scale parameter, and the value thereof is determined depending on the dataset.
[0118] Various candidate prognostic models were fit to Weibull, loglogistic, and lognormal distributions, using AFT model, and then the most appropriate model was selected. For the risk distribution for AFT model, the hazard function, which can be obtained by creating the generation life table of survival information in the discovery dataset, was used. Since the hazard function obtained by the generation life table is shown to have a unimodal form, it was predicted that the Weibull, loglogistic, and lognormal distributions would be well appropriate. The final model was selected in consideration of Akaike's information criterion (AIC) and the R square (R2).
[0119] Validation of Prognostic Model
[0120] The performances of the selected model were assessed according to their "calibration" and "discrimination" aspects. "Calibration" is the degree of concurrence between the predicted survival probability produced by the prognostic model and the actually observed survival probability, and "Discrimination" is the ability of the prognostic model to correctly separate the given patient group into different prognostic groups. Herein, the actually observed survival probability refers to the value obtained by Kaplan-Meier method. The AFT-based prognostic model was used to obtain survival probabilities of all time zones for each patient. The survival probability predicted by the model was compared with the survival probability by Kaplan-Meier method. In order to obtain the predicted survival probabilities for the overall time period like in Kaplan-Meier, survival probability curves of all patients were obtained by calculating the mean survival probability for each time zone from 0 to 25 years by the 0.1 year unit. Together with the comparison of survival probability for the overall survival time, the 5-year survival probability was also compared. The 5-year predicted survival probability of patients produced by using the prognostic model in the given dataset was compared with, as the observed value, the 5-year survival probability calculated by using Hare which is the hazard regression analysis.
[0121] For "discrimination", the prognostic indexes of all patients in the given dataset were divided into four sections, and survival probabilities of patients for the respective sections were compared by the KM graph. The prognostic index is the dependent variable in the survival model. The more clearly the KM graphs of the four prognostic groups are separated, the better the discrimination power of the model.
[0122] Both "calibration" and "determination" for the discovery dataset and three independent validation datasets were investigated.
[0123] Important R packages used in statistical analysis are as below:
[0124] affy: pre-processing of .CEL files using rma algorithm
[0125] samr: identifying genes showing the difference in the expression level between prognostic groups
[0126] GOstats: investigating function associated with selected gene set
[0127] KMsurv: creating a life table using survival data of the discovery dataset
[0128] rma: estimating coefficients of prognostic model using AFT model and conducting calibration on the model.
[0129] Selection of Gene Sets Applicable to FFPE Sample
[0130] RNA extracted from formalin-fixed paraffin embedded (FFPE) tissues and samples has not been accepted in the expression analysis due to many procedures causing the obstruction to RNA stability, such as immobilization causing cross-linking between tissues in the treatment process of tissues or samples. Herein, in order to develop a method for breast cancer prognosis prediction, suitable for FFPE samples, based on the actual breast cancer treatment procedure, gene sets were selected by placing a higher priority on genes having higher interqurtile ranges (IQR) and genes having higher mean expression levels in the order of higher degree of contribution, from p-genes (proliferation-related gene set) representing the expression pattern of proliferation and i-genes (immune response-related gene set) representing the expression pattern of the immune response, which were obtained according to the principal component analysis and function analysis with respect to the principal component analysis (GO function analysis or GO analysis).
[0131] As used herein, several genes having the same pattern in p-gene and i-gene were selected since the microarray data has a limitation in measuring accurate expression levels and the mean expression level for several genes rather than the expression level of one gene representing the pattern can represent the actual expression pattern better.
[0132] Measurement of Gene Correlation Between FFPE Sample and Frozen Sample and Selection of Genes
[0133] 27 types of FFPE and frozen samples collected from the same patients were secured, and RNA was extracted from the FFPE or frozen samples by the RNA extraction method. The expression levels of 32 types of genes selected were measured by using the extracted RNA as a template.
[0134] The gene expression levels need to be normalized due to the difference thereof between individuals. Therefore, the expression levels of five genes selected as a normalization gene, that is, of C-terminal-binding protein 1 (CTBP1), TATA-binding protein (TBP), hydroxymethylbilane synthase (HMBS), cullin 1 (CUL1), and ubiquilin-1 (UBQLN1), were normalized, and then the gene expression correlation between FFPE sample and frozen sample was measured.
[0135] Based on the correlation measurement results and the expression level results for each gene, the genes that have a high correlation rate and various gene expression distributions between samples were finally selected as highly reliable genes for early-stage breast cancer prognosis prediction.
[0136] Results
[0137] Selection of Prognostic Genes for Prognostic Model
[0138] Five independent breast cancer datasets composed of expression profiles of early-stage breast cancer tissue were pooled into a discovery dataset of 1,104 samples. All patients did not receive chemotherapy, while most of them have little metastasis to axillary lymph nodes (N0 or N-), or have early-stage breast cancer (1st stage or 2nd stage). Among them, 1072 patients with information about distant metastasis were subjected to statistical analysis. In order to find genes associated with prognosis, expression profiles of the good prognostic group (having no metastasis for more than 10 years) and the poor prognostic group (having metastasis within 5 years) were compared. 182 genes showing high expression levels were selected from the good prognostic group, and 120 genes showing high expression levels were selected from the poor prognostic group (results not shown, FDR<0.001).
[0139] Principal component analysis was performed on the expression levels of the selected 302 genes. GO function analysis was performed on principal component 1 and principal component 2. Principal component 1 was definitely associated with the proliferation, while principal component 2 was strongly associated with the immune response. Based on this result, genes belonging to principal components 1 and 2 were selected, respective, and thus the prognostic model was allowed to reflect the two expression patterns.
[0140] Nine genes that were not only associated with the prognosis but also had the largest expression difference among the groups were selected. The gene selected from principal component 1 representing the proliferation is named p-gene, and the gene selected from principal 2 representing the immune response is named i-gene.
[0141] Comparison between ER+ Breast Cancer and ER- Breast Cancer
[0142] It is known that the expression or not of the estrogen receptor (ER) is closely associated with the occurrence and development of breast cancer. Two functions shown in the genes selected in association with prognosis, that is, proliferation and immune response are interestingly noticed in the mechanism of cancer. ER- breast cancer was compared with ER+ breast cancer using the selected 16 genes (p-genes and i-genes). In order to display the intensity of each function, the p-genes and i-genes were stratified into three stages (p1, p2, p3 or i1, i2, i3) according to the expression level. Here, p1 was a p-gene group showing the lowest expression level, and was assumed to make the slowest proliferation; p3 was a p-gene group showing the highest expression level, and was assumed to make the highest proliferation; and p2 was a p-gene group showing a moderate expression level, and was assumed to make a moderate level of proliferation. As used herein, it was an i-gene group showing the lowest expression level, and was assumed to make the weakest immune response; i3 was an i-gene group showing the highest expression level, and was assumed to make the strongest immune response; and i2 was considered to show a moderate expression level, and was assumed to do a moderate level of activity.
[0143] 1,072 cases in the discovery dataset were classified according to the expression levels of p-gene and i-gene, and the intensity of each function according to the ER status was investigated. The proportion of p3 type indicating very active proliferation was higher in ER- breast cancer than in ER+ breast cancer. About 62% of ER- breast cancer cases showed very high p-gene expression levels (p3), while only 18% of ER+ breast cancer cases showed high p-gene expression levels, which supported the previously reported fact that ER- breast cancer tends to be more aggressive than ER+ breast cancer. About 35% of ER+ breast cancer cases showed weak p-genes (p1), while the proportion of p1 was only 9% in ER- breast cancer cases. The active immune response function is another characteristic of ER- breast cancer, and 38% or more of ER- breast cancer cases showed very high i-gene expression levels (i3). Whereas, only 21% of ER+ breast cancer cases showed high i-gene expression levels. It was observed that more active proliferation led to more active immune response in both ER+ and ER-, while ER- breast cancer showed a much more active immune response.
[0144] Besides, it was observed that the differentiation grade of the breast cancer was also closely related with the proliferation. Generally, poorly differentiated breast cancer (G3) showed a fast proliferation, whereas well-differentiated breast cancer (G1) showed a slow proliferation. It was observed that the prognosis of patients was also correlated with the proliferation. It was observed that more poor prognostic patients having metastasis within five years were concentrated in the group with a fast proliferation.
[0145] In summary, it was found that ER- breast cancer was more active than ER+ breast cancer in view of both the proliferation and the immune response, and it was supposed that the expression level of ER influences the mechanisms of occurrence and development of breast cancer.
[0146] Establishment of Prognostic Model
[0147] The AFT prognostic model of early-stage breast cancer patient metastasis was created using survival information of the discovery dataset and the selected p-genes and i-genes.
[0148] The generation life table on a yearly basis was created using the survival information of the discovery dataset, and the degree of hazard was roughly calculated.
[0149] Since the probability of death obtained by the generation life table is shown to have a unimodal form, it was predicted that the Weibull, loglogistic, and lognormal distributions would be well appropriate. The covariates to be included in the prognostic model are p.mean and i.mean. p.mean is the mean in the p-genes, and i.mean is the mean in the i-genes.
[0150] As a result of applying three models to the Weibull, loglogistic and lognormal distributions, the lognormal distribution was most appropriate. The final model following the lognormal distribution was selected using Akaikes information criterion (AIC).
log(T)=-0.689.times.p.mean+0.274.times.i.mean+3.219 Equation 4
[0151] According to the above estimated model, the p.mean, that is, the proliferation has a negative correlation (-0.689, p value=2.47.times.e.sup.-17) with the survival time (T), and thus, more active proliferation shortens the survival time. On the contrary, the i.mean has a positive correlation (0.274, p value=3.69.times.e.sup.-11) with the survival time, which indicates that a more active immune response lengthens the survival time. It could be concluded from the above estimated factors that proliferation plays a decisive role in the breast cancer prognosis, and more active proliferation leads to poor prognosis, while the immune response acts as a defense mechanism against fast proliferation.
[0152] Validation of Prognostic Model
[0153] The performances of the prognostic model, which was created using expression profiles for 1,072 early-stage breast cancer patients in the discovery dataset, were validated according to "calibration" and "discrimination" aspects. Here, the "calibration" is the degree of concurrence between the predicted survival probability produced through the model and the actually observed survival probability. The actually observed survival probability refers to the survival probability obtained using the Kaplan-Meier method. In addition, the "discrimination" is the ability of the model to correctly separate the patients into different prognostic groups. Validations for the two performances were performed on the discovery dataset developing the model and three independent validation datasets.
[0154] In the discovery dataset developing the prognostic model, the prognostic indexes (PI) were divided into four and classified into four prognostic groups. The survival probabilities observed in the four prognostic groups classified by the prognostic index were compared using the KM graph. As a result, it could be seen that four prognostic groups were very well classified, and the predicted survival probability corresponded well with the observed survival probability for each prognostic group.
[0155] The KM survival probability and the predicted survival probability produced by the prognostic model were compared with each other using the graph. The survival probabilities for all time zones of all patients were obtained in the prognostic model, and thus, in order to obtain the survival probability curve for the overall time period like the survival curve of KM, survival probability curves were drawn using the mean survival probability for each time zone (from 0 to 25 year, 0.1-year interval) of each patient. The predicted survival probability was slightly higher than the KM survival probability, but they are similar as a whole. In addition to the comparison of survival probability for the overall survival time, the comparison of 5-year survival probability was also conducted. The 5-year survival probability predicted by the model was similar to the actually observed 5-year survival probability. Particularly, as the predicted survival probability was higher, the concurrence between the predicted probability and the observed survival probability was stronger.
[0156] For more objective validation, the prognostic model was validated using three independent validation datasets. The first validation dataset was obtained by combining two datasets generated by Affymetrix U133A platform. The second validation dataset was the dataset generated by Affymetric U133A platform, and all were ER+ patients taking tamoxifen for five years. The third validation dataset was the dataset that was used to identify and validate 70 prognostic genes (currently, commercialized as MammaPrint) and generated by Agilent Hu25K platform. Validation datasets 1 and 2 were generated by the same platform as in the discovery dataset, Affymetrix U133A, and the expression levels thereof were normalized together with the discovery dataset. Validation datasets 1 and 2 were assessed in terms of calibration and discrimination aspects, while validation datasets 3 was assessed in terms of only the discrimination aspect due to the normalization of expression levels.
[0157] Selection of Gene Sets Applicable to FFPE Sample
[0158] 32 types of genes were selected by placing a higher priority on genes having higher interqurtile ranges (IQR) and genes having higher mean expression levels in the order of higher degree of contribution, from 182 genes showing high expression levels in the good prognostic group and 120 genes showing high expression levels in the poor prognostic group in the discovery dataset of 1,104 samples.
[0159] Measurement of Gene Correlation Between FFPE Sample and Frozen Sample and Selection of Genes
[0160] For the measurement of correlation between FFPE sample and frozen sample, samples that secure both FFPE sample and frozen sample from patients or their cancer tissues are needed. With respect to 27 pairs of FFPE and frozen samples thus obtained, the expression levels of 32 types of the selected genes and the correlation between FFPE and frozen samples were measured. Based on the measurement results, genes that have a high correlation rate and various gene expression distributions among samples were found 12 types in p-genes and 15 types in i-genes, which were selected as highly reliable genes for early-stage breast cancer prognosis prediction.
[0161] Among the selected genes above, 9 types of p-genes and 6 types of i-genes were selected as genes to be included in the kit for prognosis prediction.
[0162] The correlation measurement results for the respective genes are shown in FIGS. 6A-6I and 7A-7F. In each drawing, the solid line represents the equivalent value of the horizontal axis and the vertical axis (slope: 1, that is, the line that connects values of which the horizontal axis value is identical to the vertical axis value).
[0163] Meanwhile, among the respective genes, the expression levels of TRBC1, BTN3A2, and HLA-DPA1 were significantly different between the good prognostic group and the poor prognostic group. Through the above analysis, it could be concluded that the expression of TRBC1, BTN3A2, and HLA-DPA1 was significantly increased in the good prognostic group, verifying that their increased expression (overexpression) indicated good breast cancer prognosis.
[0164] Improvement in Predicting Prognosis of Breast Cancer Through Gene Combinations
[0165] The prognosis of each breast cancer patient is different among breast cancer patients, and the accurate prediction of the prognosis helps the patient to decide an appropriate treatment if needed. The purpose of this study was to investigate the gene expression in tissues of breast cancer patients after surgery so as to find a method for predicting a more accurate prognosis. For this purpose, the gene expression data collected from cancer tissues of early breast cancer patients (a total of 298 patients) was obtained from a public database GEO (http://www.ncbi.nlm.nih.gov/geo). The gene expression dataset as used in this experiment was obtained through microarray from 298 patients with ER+ breast cancer who had been treated with tamoxifen for 5 years after surgery.
[0166] For this purpose, RNA was extracted from cancer tissues of each patient and microarray experiment was performed according to the protocol of oligonucleotide microarray (U133A GeneChip; Affymetrix). The raw intensity values of the measured genes were normalized using MAS 5.0 (R/Bioconductor, www.bioconductor.org) and transformed into log 2 values. This dataset derived from this procedures was used to select a combination of genes which is capable of increasing a predictive performance of breast cancer prognosis through the combination of one of the i-genes, BTN3A2 gene and at least another prognostic genes.
[0167] Since the distant metastasis of breast cancer has a significant effect on the selection of the type of cancer therapy in comparison with its local or regional recurrence, Distant Metastasis Free Survival (DMFS) was designated as a primary endpoint in this analysis. As used herein, DMFS (Distant Metastasis Free Survival) means an interval between the surgery of a breast cancer patient and the diagnosis of a distant metastasis or death from any cause.
[0168] As shown in FIG. 8, it was found that the overall probability rate of DMFS (Distant Metastasis Free Survival) as determined by Kaplan-Meier estimation was 85.1% (81.0%-89.4%) within 5 years and 74.0% (68.5%-79.9%) within 10 years, respectively.
[0169] The C-index (concordance index) is an index for evaluating the accuracy of prediction in which the C-index of being closer to 1 is defined as being more accurate in prediction. The predictive accuracy of BTN3A2 gene for distant metastasis was found to be 0.55 through survival analysis.
[0170] Another prognosis-predictive indicator is a hazard ratio (HR) calculated via Cox's proportional hazard model. As for the risk of distant metastasis, when the hazard ratio is greater than 1, the risk of distant metastasis increases as the expression level of a target gene increases. On the contrary, when the hazard ratio is less than 1, the risk of distant metastasis decreases as the expression level of a target gene increases. With regard to BTN3A2 gene, its hazard ratio was found to be 0.82 (0.67-1.00), indicating that an increased expression of BTN3A2 gene is associated with a good prognosis.
TABLE-US-00003 TABLE 2 Prognostic Values of BTN3A2 gene Hazard Ratio (HR) Gene Name C-Index HR (95% C.I.) p-value BTN3A2 0.55 0.82 (0.67-1.00) 0.046
[0171] Since BTN3A2 is known to be an immune-related gene, BTN3A2 gene was named `i-gene` in this analysis. As shown in Table 2, these results suggest that BTN3A2 gene is a prognostic gene which can provide a statistically significant prognostic value.
[0172] Although BTN3A2 gene alone may provide a statistically significant prognostic value, the present inventors had sought to find a combination of BT3A2 gene and one or more another genes which leads to a more accurate prognosis prediction.
[0173] To determine the prognostic significance of another genes in combination with BTN3A2 gene, bivariate Cox analysis was conducted on BTN3A2 and a total of 13,268 another genes for predicting the probability of distant metastasis, respectively. Bivariate Cox analysis is used to determine whether each of two prognostic factors is an independent prognostic factor when the two prognostic factors are combined. Therefore, when each is confirmed as a significant (p-value<0.05) prognostic factor, the combination of the two factors is considered as a combination which may increase a prediction accuracy.
[0174] As a result of such bivariate Cox analysis, a total of 1,673 genes were found to be statistically significant (p-value<0.05) for predicting the probability of distant metastasis when used together with BTN3A2 gene. As used herein, those statistically significant genes are named as `prognostic gene` as described above.
[0175] Further, among the prognostic 1,673 genes, a total of 1,635 genes as indicated in the following Table 3 were found to have a higher c-index (i.e., higher prediction accuracy) when used in combination with BTN3A2, in comparison with their single use.
[0176] Out of the 1,635 genes which have a higher c-index when used in combination with BTN3A2, a total of 848 genes were showed to be associated with a poor prognosis as their hazard ratio was greater than 1 in bivariate Cox analysis. Conversely, the hazard ratio of the remaining 786 genes was smaller than 1, respectively, indicating that they are associated with a good prognosis. For all of its combinations with each of the 1,635 genes, the hazard ratio of BTN3A2 was smaller than 1, indicating that BTN3A2 is associated with a good prognosis.
TABLE-US-00004 TABLE 3 1,635 prognostic genes for use in combination with BTN3A2 gene prognostic BTN3A2 gene Gene GENE p- p- No. Symbol ID Gene Name HR value HR value 1 A2M 2 alpha-2-macroglobulin 0.81 0.044 0.56 0.003 2 AAMDC 28971 adipogenesis associated, Mth938 0.79 0.025 1.33 0.014 domain containing 3 AATF 26574 apoptosis antagonizing transcription 0.82 0.047 1.80 0.021 factor 4 ABAT 18 4-aminobutyrate aminotransferase 0.77 0.007 0.58 0.000 5 ABCA1 19 ATP-binding cassette, sub-family A 0.79 0.015 1.89 0.005 (ABC1), member 1 6 ABCA7 10347 ATP-binding cassette, sub-family A 0.79 0.026 0.63 0.028 (ABC1), member 7 7 ABCB1 5243 ATP-binding cassette, sub-family B 0.78 0.014 0.53 0.000 (MDR/TAP), member 1 8 ABCC1 4363 ATP-binding cassette, sub-family C 0.80 0.031 0.47 0.006 (CFTR/MRP), member 1 9 ABCD4 5826 ATP-binding cassette, sub-family D 0.81 0.039 0.35 0.000 (ALD), member 4 10 ABCE1 6059 ATP-binding cassette, sub-family E 0.77 0.012 2.41 0.002 (OABP), member 1 11 ABCG1 9619 ATP-binding cassette, sub-family G 0.80 0.022 1.50 0.043 (WHITE), member 1 12 ACACB 32 acetyl-CoA carboxylase beta 0.78 0.017 0.60 0.005 13 ACADVL 37 acyl-CoA dehydrogenase, very long 0.77 0.014 0.51 0.004 chain 14 ACAT2 39 acetyl-CoA acetyltransferase 2 0.78 0.011 2.01 0.004 15 ACBD3 64746 acyl-CoA binding domain containing 3 0.78 0.010 1.94 0.004 16 ACBD4 79777 acyl-CoA binding domain containing 4 0.78 0.006 0.52 0.001 17 ACO1 48 aconitase 1, soluble 0.80 0.020 0.39 0.000 18 ACOT13 55856 acyl-CoA thioesterase 13 0.76 0.009 2.62 0.002 19 ACOX1 51 acyl-CoA oxidase 1, palmitoyl 0.77 0.009 1.66 0.022 20 ACTB 60 actin, beta 0.77 0.011 0.52 0.010 21 ACTG1 71 actin, gamma 1 0.74 0.004 0.50 0.006 22 ACTL6A 86 actin-like 6A 0.81 0.042 2.28 0.003 23 ACTR10 55860 actin-related protein 10 homolog (S. 0.78 0.019 1.87 0.041 cerevisiae) 24 ADAM2 2515 ADAM metallopeptidase domain 2 0.79 0.023 1.22 0.021 25 ADAMTS5 11096 ADAM metallopeptidase with 0.81 0.036 0.74 0.044 thrombospondin type 1 motif, 5 26 ADCY9 115 adenylate cyclase 9 0.81 0.020 0.51 0.001 27 ADIPOR1 51094 adiponectin receptor 1 0.81 0.040 2.14 0.002 28 ADRA2A 150 adrenoceptor alpha 2A 0.80 0.011 0.50 0.000 29 ADSL 158 adenylosuccinate lyase 0.77 0.011 2.67 0.004 30 AGAP10 119016 ArfGAP with GTPase domain, ankyrin 0.76 0.010 0.60 0.030 repeat and PH domain 10 31 AGAP11 119016 ankyrin repeat and GTPase domain Arf 0.76 0.007 0.56 0.006 GTPase activating protein 11 32 AGBL2 79841 ATP/GTP binding protein-like 2 0.79 0.015 0.59 0.020 33 AGL 178 amylo-alpha-1, 6-glucosidase, 4-alpha- 0.79 0.022 1.28 0.035 glucanotransferase 34 AHNAK 79026 AHNAK nucleoprotein 0.76 0.005 0.60 0.009 35 AHNAK2 113146 AHNAK nucleoprotein 2 0.79 0.022 0.77 0.047 36 AHSA2 130872 AHA1, activator of heat shock 90 kDa 0.78 0.016 0.74 0.010 protein ATPase homolog 2 (yeast) 37 AHSG 197 alpha-2-HS-glycoprotein 0.77 0.012 1.50 0.001 38 AK4 205 adenylate kinase 4 0.80 0.028 0.67 0.016 39 AK5 26289 adenylate kinase 5 0.78 0.014 0.75 0.001 40 AKAP11 11215 A kinase (PRKA) anchor protein 11 0.81 0.043 0.56 0.010 41 AKR7A2 8574 aldo-keto reductase family 7, member 0.81 0.023 0.48 0.004 A2 (aflatoxin aldehyde reductase) 42 ALDH18A1 5832 aldehyde dehydrogenase 18 family, 0.78 0.018 1.61 0.046 member A1 43 ALDH1A2 8854 aldehyde dehydrogenase 1 family, 0.79 0.020 0.80 0.010 member A2 44 ALDH6A1 4329 aldehyde dehydrogenase 6 family, 0.80 0.021 0.50 0.019 member A1 45 ALMS1 7840 Alstrom syndrome 1 0.78 0.011 0.72 0.048 46 AMOTL2 51421 angiomotin like 2 0.79 0.018 0.55 0.018 47 AMT 275 aminomethyltransferase 0.78 0.013 0.71 0.031 48 ANGEL1 23357 angel homolog 1 (Drosophila) 0.77 0.016 0.59 0.039 49 ANGPTL7 10218 angiopoietin-like 7 0.78 0.017 0.78 0.038 50 ANKRD10-IT1 100505494 ANKRD10 intronic transcript 1 (non- 0.76 0.007 0.62 0.008 protein coding) 51 ANKRD40 91369 ankyrin repeat domain 40 0.77 0.014 1.26 0.048 52 ANXA2 302 annexin A2 0.77 0.012 1.93 0.018 53 ANXA8 653145 annexin A8 0.75 0.009 0.67 0.022 54 AP1B1 162 adaptor-related protein complex 1, beta 0.79 0.021 1.63 0.045 1 subunit 55 AP1M2 10053 adaptor-related protein complex 1, mu 0.82 0.048 1.57 0.024 2 subunit 56 AP5M1 55745 adaptor-related protein complex 5, mu 0.78 0.011 1.69 0.020 1 subunit 57 APITD1 378708 apoptosis-inducing, TAF9-like domain 0.81 0.041 1.86 0.027 1 58 APLP2 334 amyloid beta (A4) precursor-like 0.81 0.024 0.67 0.033 protein 2 59 APOC1 341 apolipoprotein C-I 0.76 0.008 1.34 0.026 60 APOC3 345 apolipoprotein C-III 0.77 0.015 1.62 0.000 61 APOO 79135 apolipoprotein O 0.74 0.007 2.27 0.000 62 AQP1 358 aquaporin 1 (Colton blood group) 0.81 0.041 0.63 0.004 63 AQP9 366 aquaporin 9 0.77 0.007 1.33 0.001 64 ARF1 375 ADP-ribosylation factor 1 0.78 0.016 1.88 0.025 65 ARGLU1 55082 arginine and glutamate rich 1 0.79 0.026 0.58 0.001 66 ARHGEF4 50649 Rho guanine nucleotide exchange 0.77 0.014 0.59 0.020 factor (GEF) 4 67 ARHGEF5 7984 Rho guanine nucleotide exchange 0.82 0.049 0.76 0.040 factor (GEF) 5 68 ARID4B 23029 AT rich interactive domain 4B (RBP1- 0.78 0.011 1.57 0.029 like) 69 ARIH2 10425 ariadne RBR E3 ubiquitin protein 0.78 0.014 0.52 0.048 ligase 2 70 ARMC1 55156 armadillo repeat containing 1 0.81 0.043 1.75 0.001 71 ARMC2-AS1 9551 ARMC2 antisense RNA 1 0.80 0.026 1.83 0.043 72 ARPC3 10094 actin related protein 2/3 complex, 0.78 0.012 1.60 0.039 subunit 3, 21 kDa 73 ARPC4 10093 actin related protein 2/3 complex, 0.78 0.014 0.68 0.003 subunit 4, 20 kDa 74 ARPC5L 81873 actin related protein 2/3 complex, 0.81 0.021 2.21 0.002 subunit 5-like 75 ARPIN 348110 actin-related protein 2/3 complex 0.82 0.036 0.73 0.035 inhibitor 76 ASAH1 427 N-acylsphingosine amidohydrolase 0.79 0.025 0.65 0.017 (acid ceramidase) 1 77 ASAP1 50807 ArfGAP with SH3 domain, ankyrin 0.80 0.020 2.14 0.002 repeat and PH domain 1 78 ASCC3 10973 activating signal cointegrator 1 0.75 0.007 1.53 0.021 complex subunit 3 79 ASH2L 9070 ash2 (absent, small, or homeotic)-like 0.81 0.037 1.80 0.003 (Drosophila) 80 ASIC2 40 acid-sensing (proton-gated) ion 0.82 0.046 1.24 0.045 channel 2 81 ASIC4 55515 acid-sensing (proton-gated) ion 0.81 0.035 1.64 0.001 channel family member 4 82 ASL 435 argininosuccinate lyase 0.80 0.024 1.67 0.030 83 ASPM 259266 asp (abnormal spindle) homolog, 0.79 0.011 1.32 0.002 microcephaly associated (Drosophila) 84 ASRGL1 80150 asparaginase like 1 0.82 0.048 1.25 0.042 85 ATAD2 29028 ATPase family, AAA domain 0.80 0.022 1.39 0.004 containing 2 86 ATF6 22926 activating transcription factor 6 0.80 0.022 1.76 0.018 87 ATG101 60673 autophagy related 101 0.80 0.038 1.84 0.035 88 ATG5 9474 autophagy related 5 0.74 0.003 2.16 0.002 89 ATM 472 ATM serine/threonine kinase 0.79 0.032 0.41 0.000 90 ATOH1 474 atonal homolog 1 (Drosophila) 0.82 0.045 1.34 0.026 91 ATP2A2 488 ATPase, Ca++ transporting, cardiac 0.82 0.050 1.99 0.008 muscle, slow twitch 2 92 ATP5A1 498 ATP synthase, H+ transporting, 0.81 0.034 0.46 0.008 mitochondrial F1 complex, alpha subunit 1, cardiac muscle 93 ATP5C1 509 ATP synthase, H+ transporting, 0.79 0.016 1.94 0.014 mitochondrial F1 complex, gamma polypeptide 1 94 ATP5H 10476 ATP synthase, H+ transporting, 0.79 0.026 1.62 0.034 mitochondrial Fo complex, subunit d 95 ATP6V0B 533 ATPase, H+ transporting, lysosomal 0.81 0.047 1.52 0.028 21 kDa, V0 subunit b 96 ATP6V1E1 529 ATPase, H+ transporting, lysosomal 0.78 0.014 1.58 0.022 31 kDa, V1 subunit E1 97 ATP7B 540 ATPase, Cu++ transporting, beta 0.77 0.012 0.68 0.030 polypeptide 98 ATP8B1 5205 ATPase, aminophospholipid 0.78 0.013 0.72 0.009 transporter, class I, type 8B, member 1 99 AURKA 6790 aurora kinase A 0.80 0.024 1.59 0.002 100 AURKB 9212 aurora kinase B 0.81 0.029 1.26 0.044 101 AZGP1 563 alpha-2-glycoprotein 1, zinc-binding 0.79 0.020 0.80 0.031 102 AZGP1 563 alpha-2-glycoprotein 1, zinc-binding 0.78 0.018 0.81 0.040 103 AZIN1 51582 antizyme inhibitor 1 0.79 0.024 1.86 0.000 104 B3GALT4 8705 UDP-Gal:betaGlcNAc beta 1,3- 0.81 0.035 1.50 0.035 galactosyltransferase, polypeptide 4 105 BANP 54971 BTG3 associated nuclear protein 0.78 0.024 0.39 0.006 106 BAP1 8314 BRCA1 associated protein-1 (ubiquitin 0.77 0.010 0.50 0.010 carboxy-terminal hydrolase) 107 BARX2 8538 BARX homeobox 2 0.78 0.019 0.74 0.004 108 BBOX1 8424 butyrobetaine (gamma), 2-oxoglutarate 0.81 0.043 0.86 0.029 dioxygenase (gamma-butyrobetaine hydroxylase) 1 109 BBS1 582 Bardet-Biedl syndrome 1 0.81 0.018 0.51 0.026 110 BCAM 4059 basal cell adhesion molecule (Lutheran 0.77 0.008 0.64 0.013 blood group) 111 BCAP29 55973 B-cell receptor-associated protein 29 0.81 0.030 1.60 0.013 112 BCAS2 10286 breast carcinoma amplified sequence 2 0.79 0.017 1.64 0.034 113 BCCIP 56647 BRCA2 and CDKN1A interacting 0.77 0.013 1.37 0.017 protein 114 BCHE 590 butyrylcholinesterase 0.79 0.016 0.84 0.043 115 BET1 10282 Bet1 golgi vesicular membrane 0.80 0.026 1.66 0.047 trafficking protein 116 BICC1 80114 BicC family RNA binding protein 1 0.80 0.026 0.52 0.025 117 BID 637 BH3 interacting domain death agonist 0.77 0.007 1.72 0.011 118 BIK 638 BCL2-interacting killer (apoptosis- 0.79 0.027 1.26 0.018 inducing) 119 BIN3 55909 bridging integrator 3 0.77 0.012 0.44 0.001 120 BIN3-IT1 80094 BIN3 intronic transcript 1 (non-protein 0.81 0.031 0.67 0.001 coding) 121 RDH5 100528022 retinol dehydrogenase 5 (11-cis/9-cis) 0.80 0.033 0.62 0.000 122 BLZF1 8548 basic leucine zipper nuclear factor 1 0.79 0.022 1.52 0.028 123 BNC1 646 basonuclin 1 0.77 0.012 0.83 0.041 124 BOLA2 552900 bolA family member 2 0.81 0.037 1.48 0.017 125 BRD7 29117 bromodomain containing 7 0.76 0.007 1.54 0.021 126 BRIX1 55299 BRX1, biogenesis of ribosomes, 0.80 0.028 1.45 0.044 homolog (S. cerevisiae) 127 BSDC1 55108 BSD domain containing 1 0.80 0.027 0.46 0.029 128 BTF3 689 basic transcription factor 3 0.78 0.014 0.46 0.003 129 BTN1A1 696 butyrophilin, subfamily 1, member A1 0.78 0.012 0.83 0.018 130 BUB1 699 BUB1 mitotic checkpoint 0.78 0.014 1.73 0.005 serine/threonine kinase 131 BUB1B 701 BUB1 mitotic checkpoint 0.80 0.031 1.71 0.002 serine/threonine kinase B 132 BUD31 8896 BUD31 homolog (S. cerevisiae) 0.80 0.018 1.88 0.037 133 BYSL 705 bystin-like 0.76 0.009 1.51 0.017 134 BZW1 9689 basic leucine zipper and W2 domains 1 0.82 0.042 1.59 0.048 135 BZW2 28969 basic leucine zipper and W2 domains 2 0.82 0.048 1.58 0.006 136 C11orf48 79081 chromosome 11 open reading frame 48 0.77 0.010 1.56 0.018 137 C11orf57 55216 chromosome 11 open reading frame 57 0.77 0.013 0.44 0.037 138 C11orf58 10944 chromosome 11 open reading frame 58 0.79 0.023 1.86 0.036 139 C11orf63 79864 chromosome 11 open reading frame 63 0.79 0.019 0.74 0.001 140 C11orf80 79703 chromosome 11 open reading frame 80 0.82 0.039 1.31 0.004 141 C12orf29 91298 chromosome 12 open reading frame 29 0.81 0.033 1.42 0.026 142 C14orf132 56967 chromosome 14 open reading frame 0.80 0.024 0.74 0.040 132 143 C16orf59 80178 chromosome 16 open reading frame 59 0.81 0.034 1.29 0.021 144 C16orf80 29105 chromosome 16 open reading frame 80 0.76 0.008 1.58 0.037 145 C17orf75 64149 chromosome 17 open reading frame 75 0.79 0.024 1.33 0.020 146 C18orf32 6139 chromosome 18 open reading frame 32 0.81 0.044 0.58 0.015 147 C19orf53 28974 chromosome 19 open reading frame 53 0.78 0.017 1.72 0.025
148 C19orf54 284325 chromosome 19 open reading frame 54 0.80 0.029 0.54 0.000 149 C1GALT1 56913 core 1 synthase, glycoprotein-N- 0.81 0.030 1.63 0.016 acetylgalactosamine 3-beta- galactosyltransferase 1 150 C1orf21 81563 chromosome 1 open reading frame 21 0.83 0.048 0.85 0.039 151 C20orf24 55969 chromosome 20 open reading frame 24 0.80 0.027 1.85 0.004 152 C2orf43 60526 chromosome 2 open reading frame 43 0.80 0.026 0.49 0.048 153 TOMM7 201725 translocase of outer mitochondrial 0.80 0.025 0.44 0.002 membrane 7 homolog (yeast) 154 C5AR1 728 complement component 5a receptor 1 0.80 0.023 1.44 0.032 155 C7orf63 79846 chromosome 7 open reading frame 63 0.79 0.024 0.82 0.018 156 C9orf114 51490 chromosome 9 open reading frame 114 0.80 0.023 1.72 0.029 157 CA4 762 carbonic anhydrase IV 0.78 0.013 0.68 0.012 158 CACNA1C 775 calcium channel, voltage-dependent, L 0.82 0.047 0.76 0.020 type, alpha 1C subunit 159 CACNA1D 776 calcium channel, voltage-dependent, L 0.79 0.013 0.59 0.001 type, alpha 1D subunit 160 CACNB2 783 calcium channel, voltage-dependent, 0.81 0.030 0.72 0.028 beta 2 subunit 161 CACNG1 786 calcium channel, voltage-dependent, 0.83 0.043 1.45 0.000 gamma subunit 1 162 CACYBP 27101 calcyclin binding protein 0.82 0.045 1.73 0.008 163 CADM3-AS1 100131825 CADM3 antisense RNA 1 0.78 0.011 0.68 0.031 164 CADPS2 93664 Ca++-dependent secretion activator 2 0.80 0.032 0.66 0.031 165 CALCOCO1 57658 calcium binding and coiled-coil 0.77 0.007 0.60 0.013 domain 1 166 CALML3 810 calmodulin-like 3 0.73 0.006 0.65 0.003 167 CAMKMT 79823 calmodulin-lysine N-methyltransferase 0.81 0.036 0.73 0.037 168 CAMKV 79012 CaM kinase-like vesicle-associated 0.76 0.010 0.69 0.004 169 CAMSAP1 157922 calmodulin regulated spectrin- 0.82 0.036 2.34 0.031 associated protein 1 170 CAMSAP2 23271 calmodulin regulated spectrin- 0.81 0.040 1.67 0.021 associated protein family, member 2 171 CAMTA2 23125 calmodulin binding transcription 0.80 0.021 0.37 0.003 activator 2 172 CAND1 55832 cullin-associated and neddylation- 0.80 0.022 1.71 0.014 dissociated 1 173 CAPN10 11132 calpain 10 0.81 0.028 0.67 0.000 174 CAPN15 6650 calpain 15 0.80 0.038 0.59 0.026 175 CAPRIN2 65981 caprin family member 2 0.81 0.036 0.52 0.009 176 CARD10 29775 caspase recruitment domain family, 0.79 0.018 0.64 0.004 member 10 177 CASC1 55259 cancer susceptibility candidate 1 0.80 0.024 0.75 0.003 178 CASK 8573 calcium/calmodulin-dependent serine 0.82 0.044 1.54 0.034 protein kinase (MAGUK family) 179 CASP2 835 caspase 2, apoptosis-related cysteine 0.76 0.009 0.60 0.032 peptidase 180 CASP3 836 caspase 3, apoptosis-related cysteine 0.77 0.008 2.03 0.016 peptidase 181 CASP5 838 caspase 5, apoptosis-related cysteine 0.80 0.038 1.26 0.044 peptidase 182 CAST 831 calpastatin 0.81 0.046 0.59 0.022 183 CATSPER2 117155 cation channel, sperm associated 2 0.79 0.017 0.72 0.003 184 CBX7 23492 chromobox homolog 7 0.81 0.040 0.74 0.014 185 CCBL1 883 cysteine conjugate-beta lyase, 0.76 0.007 0.61 0.027 cytoplasmic 186 CCDC101 112869 coiled-coil domain containing 101 0.81 0.034 0.49 0.035 187 CCDC132 55610 coiled-coil domain containing 132 0.80 0.024 0.79 0.031 188 CCDC176 80127 coiled-coil domain containing 176 0.76 0.011 0.48 0.002 189 CCDC59 29080 coiled-coil domain containing 59 0.77 0.008 2.26 0.002 190 CCNA2 890 cyclin A2 0.82 0.043 1.70 0.006 191 CCNB1 891 cyclin B1 0.79 0.021 1.58 0.004 192 CCNB2 9133 cyclin B2 0.77 0.007 1.67 0.001 193 CCNC 892 cyclin C 0.80 0.021 1.68 0.043 194 CCNE2 9134 cyclin E2 0.80 0.027 2.07 0.000 195 CCNO 10309 cyclin O 0.80 0.026 0.80 0.027 196 CCR6 1235 chemokine (C-C motif) receptor 6 0.81 0.042 0.75 0.011 197 CCT3 7203 chaperonin containing TCP1, subunit 3 0.76 0.010 2.35 0.001 (gamma) 198 CCT5 22948 chaperonin containing TCP1, subunit 5 0.79 0.015 1.73 0.008 (epsilon) 199 CCT6A 908 chaperonin containing TCP1, subunit 0.78 0.010 2.45 0.000 6A (zeta 1) 200 CD55 1604 CD55 molecule, decay accelerating 0.78 0.027 1.43 0.039 factor for complement (Cromer blood group) 201 CDC14B 8555 cell division cycle 14B 0.74 0.006 0.48 0.004 202 CDC20 991 cell division cycle 20 0.78 0.011 1.32 0.019 203 CDC25C 995 cell division cycle 25C 0.80 0.038 1.70 0.011 204 CDIPT 10423 CDP-diacylglycerol--inositol 3- 0.79 0.028 0.63 0.012 phosphatidyltransferase 205 CDK1 983 cyclin-dependent kinase 1 0.76 0.005 1.56 0.001 206 CDK2AP2 10263 cyclin-dependent kinase 2 associated 0.78 0.014 1.43 0.019 protein 2 207 CDK5RAP3 80279 CDK5 regulatory subunit associated 0.78 0.015 0.63 0.023 protein 3 208 CDKN1C 1028 cyclin-dependent kinase inhibitor 1C 0.83 0.044 0.51 0.001 (p57, Kip2) 209 CDKN3 1033 cyclin-dependent kinase inhibitor 3 0.81 0.037 2.26 0.000 210 CDO1 1036 cysteine dioxygenase type 1 0.81 0.035 0.66 0.006 211 CDT1 81620 chromatin licensing and DNA 0.78 0.015 1.32 0.040 replication factor 1 212 CELA2A 51032 chymotrypsin-like elastase family, 0.81 0.031 1.27 0.038 member 2A 213 CELSR2 1952 cadherin, EGF LAG seven-pass G-type 0.78 0.014 0.68 0.013 receptor 2 214 CENPA 1058 centromere protein A 0.73 0.002 2.00 0.000 215 CENPBD1P1 65996 CENPBD1 pseudogene 1 0.78 0.016 1.33 0.047 216 CENPE 1062 centromere protein E, 312 kDa 0.78 0.012 1.33 0.001 217 CENPF 1063 centromere protein F, 350/400 kDa 0.79 0.016 1.64 0.002 218 CENPI 2491 centromere protein I 0.81 0.030 1.50 0.040 219 CENPM 79019 centromere protein M 0.75 0.005 1.39 0.001 220 CENPN 55839 centromere protein N 0.78 0.006 1.50 0.001 221 CENPU 79682 centromere protein U 0.79 0.025 1.77 0.000 222 CEP164 22897 centrosomal protein 164 kDa 0.74 0.003 0.51 0.002 223 CEP55 55165 centrosomal protein 55 kDa 0.75 0.007 1.48 0.001 224 CFHR4 10877 complement factor H-related 4 0.79 0.020 1.40 0.014 225 CFHR5 81494 complement factor H-related 5 0.79 0.024 0.71 0.041 226 CH25H 9023 cholesterol 25-hydroxylase 0.81 0.042 0.77 0.027 227 CHAC1 79094 ChaC, cation transport regulator 0.81 0.043 1.45 0.033 homolog 1 (E. coli) 228 CHD3 1107 chromodomain helicase DNA binding 0.73 0.003 0.39 0.001 protein 3 229 CHEK1 1111 checkpoint kinase 1 0.80 0.024 1.75 0.016 230 CHL1 10752 cell adhesion molecule L1-like 0.81 0.041 0.86 0.040 231 CHN1 1123 chimerin 1 0.78 0.010 1.44 0.010 232 CHRNB2 1141 cholinergic receptor, nicotinic, beta 2 0.78 0.022 1.39 0.017 (neuronal) 233 CHRNB4 1143 cholinergic receptor, nicotinic, beta 4 0.79 0.016 0.83 0.032 (neuronal) 234 CIC 23152 capicua transcriptional repressor 0.78 0.015 0.65 0.023 235 CIDEC 63924 cell death-inducing DFFA-like effector 0.82 0.037 0.61 0.009 c 236 CILP 8483 cartilage intermediate layer protein, 0.81 0.042 0.80 0.026 nucleotide pyrophosphohydrolase 237 CIRBP 1153 cold inducible RNA binding protein 0.75 0.004 0.47 0.000 238 CKAP5 9793 cytoskeleton associated protein 5 0.78 0.020 2.12 0.022 239 CKS1B 1163 CDC28 protein kinase regulatory 0.78 0.013 1.52 0.027 subunit 1B 240 CKS2 1164 CDC28 protein kinase regulatory 0.79 0.023 1.55 0.002 subunit 2 241 CLCN7 1186 chloride channel, voltage-sensitive 7 0.78 0.014 0.62 0.029 242 CLDN8 9073 claudin 8 0.82 0.038 0.64 0.000 243 CLIP2 7461 CAP-GLY domain containing linker 0.82 0.039 0.68 0.016 protein 2 244 CLK4 57396 CDC-like kinase 4 0.80 0.023 0.56 0.005 245 CLPB 81570 ClpB caseinolytic peptidase B 0.78 0.016 1.19 0.048 homolog (E. coli) 246 CLPP 8192 caseinolytic mitochondrial matrix 0.77 0.013 1.48 0.015 peptidase proteolytic subunit 247 CLPS 1208 colipase, pancreatic 0.80 0.035 1.28 0.048 248 CLUAP1 23059 clusterin associated protein 1 0.82 0.027 0.43 0.010 249 CLUHP3 100132341 clustered mitochondria (cluA/CLU1) 0.82 0.046 0.61 0.000 homolog pseudogene 3 250 CMC2 56942 C-x(9)-C motif containing 2 0.68 0.000 2.37 0.000 251 CNIH4 29097 cornichon family AMPA receptor 0.77 0.011 1.73 0.002 auxiliary protein 4 252 CNKSR1 10256 connector enhancer of kinase 0.80 0.035 0.45 0.001 suppressor of Ras 1 253 CNN3 1266 calponin 3, acidic 0.83 0.045 0.64 0.002 254 CNPY2 10330 canopy FGF signaling regulator 2 0.75 0.007 1.73 0.025 255 CNR1 1268 cannabinoid receptor 1 (brain) 0.75 0.008 0.63 0.005 256 COL16A1 1307 collagen, type XVI, alpha 1 0.82 0.039 0.62 0.002 257 COL17A1 1308 collagen, type XVII, alpha 1 0.81 0.031 0.73 0.005 258 COL19A1 1310 collagen, type XIX, alpha 1 0.77 0.014 1.28 0.038 259 COL4A6 1288 collagen, type IV, alpha 6 0.78 0.014 0.61 0.002 260 COL7A1 1294 collagen, type VII, alpha 1 0.81 0.035 0.76 0.048 261 COMMD8 54951 COMM domain containing 8 0.79 0.014 1.53 0.037 262 COPB1 1315 coatomer protein complex, subunit beta 0.80 0.024 2.57 0.005 1 263 COPB2 9276 coatomer protein complex, subunit beta 0.76 0.004 1.96 0.001 2 (beta prime) 264 COPS3 8533 COP9 signalosome subunit 3 0.80 0.025 1.63 0.034 265 COPS4 51138 COP9 signalosome subunit 4 0.79 0.035 2.32 0.009 266 COQ2 27235 coenzyme Q2 4-hydroxybenzoate 0.79 0.013 1.67 0.013 polyprenyltransferase 267 COQ3 51805 coenzyme Q3 methyltransferase 0.81 0.026 3.03 0.001 268 CORO1C 23603 coronin, actin binding protein, 1C 0.74 0.003 1.78 0.003 269 COX17 10063 COX17 cytochrome c oxidase copper 0.78 0.017 1.75 0.001 chaperone 270 COX6B1 1340 cytochrome c oxidase subunit VIb 0.77 0.010 2.22 0.002 polypeptide 1 (ubiquitous) 271 COX7B 1349 cytochrome c oxidase subunit VIIb 0.78 0.013 1.81 0.014 272 CPEB1 64506 cytoplasmic polyadenylation element 0.81 0.039 0.64 0.025 binding protein 1 273 CPNE3 8895 copine III 0.80 0.031 2.00 0.000 274 CPSF6 11052 cleavage and polyadenylation specific 0.77 0.010 2.50 0.008 factor 6, 68 kDa 275 CREB3L2 64764 cAMP responsive element binding 0.82 0.045 0.54 0.032 protein 3-like 2 276 CRELD1 78987 cysteine-rich with EGF-like domains 1 0.82 0.044 0.54 0.042 277 CRIM1 51232 cysteine rich transmembrane BMP 0.80 0.025 0.73 0.028 regulator 1 (chordin-like) 278 CRIPT 9419 cysteine-rich PDZ-binding protein 0.78 0.016 1.42 0.024 279 CRISP3 10321 cysteine-rich secretory protein 3 0.79 0.019 1.08 0.043 280 CRNKL1 51340 crooked neck pre-mRNA splicing 0.80 0.033 1.50 0.041 factor 1 281 CROT 54677 carnitine O-octanoyltransferase 0.79 0.024 0.60 0.002 282 CRTAP 10491 cartilage associated protein 0.78 0.012 0.39 0.001 283 CRTC3 64784 CREB regulated transcription 0.80 0.030 0.52 0.042 coactivator 3 284 CRYBA2 1412 crystallin, beta A2 0.79 0.018 1.51 0.008 285 CSAD 51380 cysteine sulfinic acid decarboxylase 0.77 0.009 0.76 0.021 286 CSH1 1442 chorionic somatomammotropin 0.80 0.037 1.45 0.007 hormone 1 (placental lactogen) 287 CSNK1G2 1455 casein kinase 1, gamma 2 0.77 0.008 0.47 0.009 288 CSNK2A1 1457 casein kinase 2, alpha 1 polypeptide 0.75 0.004 2.13 0.002 289 CSNK2B 1460 casein kinase 2, beta polypeptide 0.78 0.016 1.62 0.044 290 CSRP1 1465 cysteine and glycine-rich protein 1 0.80 0.021 0.60 0.011 291 CSTF1 1477 cleavage stimulation factor, 3' pre- 0.76 0.007 1.63 0.005 RNA, subunit 1, 50 kDa 292 CTDSP1 58190 CTD (carboxy-terminal domain, RNA 0.78 0.013 0.49 0.006 polymerase II, polypeptide A) small phosphatase 1 293 CTDSPL 10217 CTD (carboxy-terminal domain, RNA 0.80 0.014 0.54 0.005 polymerase II, polypeptide A) small phosphatase-like 294 CTNNB1 1499 catenin (cadherin-associated protein), 0.80 0.016 0.64 0.028 beta 1, 88 kDa 295 CTNNBL1 56259 catenin, beta like 1 0.78 0.013 1.64 0.021 296 CTNND1 1500 catenin (cadherin-associated protein), 0.81 0.024 0.47 0.008 delta 1 297 CTNS 1497 cystinosin, lysosomal cystine 0.81 0.041 0.35 0.003 transporter 298 CTSA 5476 cathepsin A 0.79 0.022 1.63 0.030 299 CTSG 1511 cathepsin G 0.79 0.024 0.78 0.028 300 CTSV 1515 cathepsin V 0.82 0.042 1.35 0.047 301 CXCL10 3627 chemokine (C-X-C motif) ligand 10 0.74 0.004 1.29 0.027 302 CXCL11 6373 chemokine (C-X-C motif) ligand 11 0.72 0.001 1.42 0.003 303 CXCL9 4283 chemokine (C-X-C motif) ligand 9 0.75 0.004 1.20 0.036 304 CXorf40A 91966 chromosome X open reading frame 0.80 0.031 1.44 0.022 40A 305 CXorf40A 91966 chromosome X open reading frame 0.80 0.030 1.64 0.005
40A 306 CXorf40B 541578 chromosome X open reading frame 0.80 0.029 1.42 0.033 40B 307 CXXC1 30827 CXXC finger protein 1 0.76 0.006 0.52 0.007 308 CYCS 54205 cytochrome c, somatic 0.82 0.032 1.80 0.005 309 CYP4A11 1579 cytochrome P450, family 4, subfamily 0.77 0.010 0.76 0.014 A, polypeptide 11 310 CYP4F8 11283 cytochrome P450, family 4, subfamily 0.78 0.025 0.89 0.019 F, polypeptide 8 311 CYR61 3491 cysteine-rich, angiogenic inducer, 61 0.82 0.041 0.79 0.026 312 CYSLTR2 57105 cysteinyl leukotriene receptor 2 0.77 0.010 0.80 0.024 313 DAAM1 23002 dishevelled associated activator of 0.81 0.036 1.90 0.002 morphogenesis 1 314 DAD1 1603 defender against cell death 1 0.80 0.038 1.77 0.037 315 DARS2 55157 aspartyl-tRNA synthetase 2, 0.82 0.050 1.75 0.024 mitochondrial 316 DBT 1629 dihydrolipoamide branched chain 0.76 0.008 0.69 0.016 transacylase E2 317 DCK 1633 deoxycytidine kinase 0.77 0.007 1.70 0.004 318 DCTN2 10540 dynactin 2 (p50) 0.77 0.012 1.85 0.015 319 DCUN1D1 54165 DCN1, defective in cullin neddylation 0.77 0.010 2.50 0.003 1, domain containing 1 320 DDX17 10521 DEAD (Asp-Glu-Ala-Asp) box 0.77 0.009 0.55 0.013 helicase 17 321 DDX23 9416 DEAD (Asp-Glu-Ala-Asp) box 0.76 0.009 1.70 0.006 polypeptide 23 322 DDX39A 10212 DEAD (Asp-Glu-Ala-Asp) box 0.80 0.017 1.92 0.005 polypeptide 39A 323 DDX49 54555 DEAD (Asp-Glu-Ala-Asp) box 0.78 0.015 1.76 0.032 polypeptide 49 324 DDX5 1655 DEAD (Asp-Glu-Ala-Asp) box 0.79 0.022 0.59 0.030 helicase 5 325 DERL1 79139 derlin 1 0.74 0.003 1.89 0.000 326 DGAT1 8694 diacylglycerol O-acyltransferase 1 0.81 0.033 1.33 0.040 327 DGKA 1606 diacylglycerol kinase, alpha 80 kDa 0.79 0.029 0.51 0.010 328 DHCR24 1718 24-dehydrocholesterol reductase 0.79 0.015 0.66 0.013 329 DHCR7 1717 7-dehydrocholesterol reductase 0.80 0.030 1.40 0.011 330 DHPS 1725 deoxyhypusine synthase 0.78 0.018 1.47 0.017 331 DHX9 1660 DEAH (Asp-Glu-Ala-His) box helicase 0.80 0.028 2.07 0.025 9 332 DIEXF 27042 digestive organ expansion factor 0.82 0.049 2.16 0.013 homolog (zebrafish) 333 DKC1 1736 dyskeratosis congenita 1, dyskerin 0.81 0.040 1.78 0.026 334 OBSCN 84033 obscurin, cytoskeletal calmodulin and 0.77 0.010 0.76 0.005 titin-interacting RhoGEF 335 DLGAP5 9787 discs, large (Drosophila) homolog- 0.75 0.004 1.76 0.000 associated protein 5 336 DNA2 1763 DNA replication helicase/nuclease 2 0.81 0.034 1.49 0.047 337 DNAAF1 123872 dynein, axonemal, assembly factor 1 0.81 0.026 0.77 0.021 338 DNAJB14 79982 DnaJ (Hsp40) homolog, subfamily B, 0.80 0.019 1.37 0.036 member 14 339 DNAJC9 23234 DnaJ (Hsp40) homolog, subfamily C, 0.79 0.017 2.17 0.001 member 9 340 DNM1 1759 dynamin 1 0.80 0.028 0.77 0.043 341 DOCK3 1795 dedicator of cytokinesis 3 0.79 0.023 1.38 0.010 342 DPP3 10072 dipeptidyl-peptidase 3 0.77 0.015 1.35 0.017 343 DPY19L4 286148 dpy-19-like 4 (C. elegans) 0.81 0.047 1.83 0.003 344 LRRC37A2 474170 leucine rich repeat containing 37, 0.81 0.028 0.65 0.049 member A2 345 DRG1 4733 developmentally regulated GTP 0.78 0.018 2.02 0.007 binding protein 1 346 DSC3 1825 desmocollin 3 0.77 0.017 0.68 0.019 347 DSCC1 79075 DNA replication and sister chromatid 0.80 0.021 1.93 0.000 cohesion 1 348 DSERG1 751816 Down syndrome encephalopathy 0.79 0.018 0.77 0.040 related protein 1 349 DSG1 1828 desmoglein 1 0.76 0.014 0.82 0.027 350 DST 667 dystonin 0.80 0.036 0.64 0.016 351 DTL 51514 denticleless E3 ubiquitin protein ligase 0.80 0.023 1.47 0.003 homolog (Drosophila) 352 DTX2 113878 deltex 2, E3 ubiquitin ligase 0.80 0.030 0.66 0.003 353 DUSP6 1848 dual specificity phosphatase 6 0.81 0.040 0.71 0.031 354 DYNC2H1 79659 dynein, cytoplasmic 2, heavy chain 1 0.82 0.041 0.52 0.004 355 DYNLRBl 83658 dynein, light chain, roadblock-type 1 0.81 0.035 1.62 0.017 356 DYNLT1 6993 dynein, light chain, Tctex-type 1 0.77 0.010 2.21 0.003 357 DYRK2 8445 dual-specificity tyrosine-(Y)- 0.78 0.009 1.91 0.008 phosphorylation regulated kinase 2 358 E2F8 79733 E2F transcription factor 8 0.81 0.025 1.46 0.004 359 EAF2 55840 ELL associated factor 2 0.79 0.013 1.30 0.036 360 EBAG9 9166 estrogen receptor binding site 0.79 0.022 1.48 0.008 associated, antigen, 9 361 ECD 11319 ecdysoneless homolog (Drosophila) 0.75 0.007 1.70 0.036 362 ECHDC2 55268 enoyl CoA hydratase domain 0.76 0.007 0.49 0.000 containing 2 363 ECT2 1894 epithelial cell transforming 2 0.79 0.022 1.69 0.001 364 EEF1A1 1915 eukaryotic translation elongation factor 0.74 0.005 0.47 0.003 1 alpha 1 365 EEF1E1 9521 eukaryotic translation elongation factor 0.78 0.015 2.06 0.004 1 epsilon 1 366 EEF1G 1937 eukaryotic translation elongation factor 0.79 0.019 0.48 0.002 1 gamma 367 EEF2 1938 eukaryotic translation elongation factor 0.74 0.006 0.41 0.000 2 368 EFCAB14 9813 EF-hand calcium binding domain 14 0.79 0.023 0.46 0.026 369 EFNA5 1946 ephrin-A5 0.75 0.006 0.59 0.002 370 EFR3A 23167 EFR3 homolog A (S. cerevisiae) 0.80 0.033 1.59 0.037 371 EFR3B 22979 EFR3 homolog B (S. cerevisiae) 0.79 0.018 0.68 0.015 372 EGF 1950 epidermal growth factor 0.80 0.029 0.82 0.032 373 EGFL8 9374 EGF-like-domain, multiple 8 0.79 0.020 0.63 0.019 374 EGFR 1956 epidermal growth factor receptor 0.81 0.050 0.56 0.005 375 EGR1 1958 early growth response 1 0.79 0.019 0.67 0.001 376 EGR3 1960 early growth response 3 0.79 0.016 0.54 0.000 377 EI24 9538 etoposide induced 2.4 0.77 0.010 0.59 0.026 378 EIF2S2 8894 eukaryotic translation initiation factor 0.76 0.008 1.54 0.018 2, subunit 2 beta, 38 kDa 379 EIF3J 8669 eukaryotic translation initiation factor 0.79 0.022 1.70 0.028 3, subunit J 380 EIF3L 51386 eukaryotic translation initiation factor 0.81 0.035 0.62 0.026 3, subunit L 381 EIF4B 1975 eukaryotic translation initiation factor 0.80 0.021 0.54 0.012 4B 382 EIF4E2 9470 eukaryotic translation initiation factor 0.76 0.009 1.74 0.033 4E family member 2 383 EIF4EBP1 1978 eukaryotic translation initiation factor 0.77 0.010 1.45 0.003 4E binding protein 1 384 EIF4G1 1981 eukaryotic translation initiation factor 0.82 0.043 1.70 0.033 4 gamma, 1 385 EIF6 3692 eukaryotic translation initiation factor 0.80 0.028 1.56 0.037 6 386 ELAC1 55520 elaC ribonuclease Z 1 0.81 0.035 0.73 0.028 387 ELMO2 63916 engulfment and cell motility 2 0.78 0.017 1.57 0.044 388 ELOVL5 60481 ELOVL fatty acid elongase 5 0.76 0.015 0.55 0.000 389 EMC2 9694 ER membrane protein complex subunit 0.80 0.035 2.07 0.000 2 390 EMC9 51016 ER membrane protein complex subunit 0.76 0.012 1.22 0.027 9 391 EMG1 10436 EMG1 N1-specific pseudouridine 0.79 0.020 1.72 0.024 methyltransferase 392 EML3 256364 echinoderm microtubule associated 0.79 0.019 0.51 0.002 protein like 3 393 ENOPH1 58478 enolase-phosphatase 1 0.79 0.014 2.12 0.000 394 ENOSF1 55556 enolase superfamily member 1 0.79 0.020 0.67 0.028 395 ENY2 56943 enhancer of yellow 2 homolog 0.75 0.008 1.91 0.000 (Drosophila) 396 EP400 57634 E1A binding protein p400 0.80 0.027 0.40 0.023 397 EPB41L2 2037 erythrocyte membrane protein band 0.81 0.047 0.57 0.016 4.1-like 2 398 EPRS 2058 glutamyl-prolyl-tRNA synthetase 0.77 0.006 1.87 0.002 399 ERBB2 2064 v-erb-b2 avian erythroblastic leukemia 0.81 0.048 1.30 0.024 viral oncogene homolog 2 400 ERBB4 2066 v-erb-b2 avian erythroblastic leukemia 0.77 0.013 0.75 0.016 viral oncogene homolog 4 401 ERCC6L 54821 excision repair cross-complementation 0.74 0.003 1.44 0.000 group 6-like 402 ERO1L 30001 ERO1-like (S. cerevisiae) 0.79 0.019 1.41 0.032 403 ESRP1 54845 epithelial splicing regulatory protein 1 0.80 0.024 1.77 0.002 404 ETFA 2108 electron-transfer-flavoprotein, alpha 0.77 0.011 1.50 0.041 polypeptide 405 ETV3 2117 ets variant 3 0.80 0.021 0.71 0.044 406 EXOC7 23265 exocyst complex component 7 0.80 0.025 0.52 0.023 407 EXOSC1 51013 exosome component 1 0.80 0.027 0.83 0.033 408 EXOSC4 54512 exosome component 4 0.80 0.037 1.47 0.023 409 EXT1 2131 exostosin glycosyltransferase 1 0.74 0.004 2.05 0.001 410 EZH1 2145 enhancer of zeste 1 polycomb 0.79 0.017 0.39 0.001 repressive complex 2 subunit 411 EZR 7430 ezrin 0.82 0.041 1.73 0.011 412 F8 2157 coagulation factor VIII, procoagulant 0.81 0.043 0.57 0.033 component 413 FABP1 2168 fatty acid binding protein 1, liver 0.81 0.037 1.34 0.036 414 FABP6 2172 fatty acid binding protein 6, ileal 0.79 0.017 1.18 0.016 415 FABP7 2173 fatty acid binding protein 7, brain 0.80 0.028 0.73 0.016 416 FADD 8772 Fas (TNFRSF6)-associated via death 0.78 0.021 1.57 0.005 domain 417 FAM120A 23196 family with sequence similarity 120A 0.79 0.018 0.53 0.019 418 FAM129A 116496 family with sequence similarity 129, 0.81 0.035 0.78 0.034 member A 419 FAM131B 9715 family with sequence similarity 131, 0.80 0.024 0.78 0.018 member B 420 FAM136A 84908 family with sequence similarity 136, 0.80 0.027 1.83 0.048 member A 421 FAM160B2 64760 family with sequence similarity 160, 0.78 0.014 0.58 0.032 member B2 422 FAM163A 148753 family with sequence similarity 163, 0.80 0.025 1.46 0.004 member A 423 FAM171A1 221061 family with sequence similarity 171, 0.80 0.040 0.55 0.005 member A1 424 FAM189A1 23359 family with sequence similarity 189, 0.80 0.020 0.74 0.015 member A1 425 FAM189A2 9413 family with sequence similarity 189, 0.79 0.019 0.63 0.016 member A2 426 FAM193B 54540 family with sequence similarity 193, 0.77 0.015 0.65 0.030 member B 427 FAM47E 8987 family with sequence similarity 47, 0.81 0.034 2.15 0.002 member E 428 FAM49B 51571 family with sequence similarity 49, 0.73 0.003 2.04 0.001 member B 429 FAM63A 55793 family with sequence similarity 63, 0.77 0.010 0.65 0.017 member A 430 FAM96B 51647 family with sequence similarity 96, 0.79 0.018 1.75 0.035 member B 431 FAM98A 25940 family with sequence similarity 98, 0.74 0.004 1.87 0.016 member A 432 FANCI 55215 Fanconi anemia, complementation 0.81 0.032 1.49 0.049 group I 433 FARP2 9855 FERM, RhoGEF and pleckstrin 0.76 0.007 0.46 0.005 domain protein 2 434 FAU 2197 Finkel-Biskis-Reilly murine sarcoma 0.82 0.045 0.59 0.035 virus (FBR-MuSV) ubiquitously expressed 435 FBP2 8789 fructose-1,6-bisphosphatase 2 0.81 0.041 1.38 0.037 436 FBXO5 26271 F-box protein 5 0.74 0.005 1.49 0.012 437 FCGBP 8857 Fc fragment of IgG binding protein 0.79 0.016 0.82 0.006 438 FDPS 2224 famesyl diphosphate synthase 0.80 0.022 1.66 0.024 439 FEN1 2237 flap structure-specific endonuclease 1 0.77 0.012 1.77 0.003 440 FGB 2244 fibrinogen beta chain 0.78 0.020 1.27 0.023 441 FGF14 2259 fibroblast growth factor 14 0.81 0.036 0.77 0.012 442 FGF9 2254 fibroblast growth factor 9 0.80 0.025 0.81 0.048 443 FH 2271 fumarate hydratase 0.80 0.032 1.74 0.013
444 FIGF 2277 c-fos induced growth factor (vascular 0.80 0.028 0.83 0.044 endothelial growth factor D) 445 FJX1 24147 four jointed box 1 (Drosophila) 0.80 0.027 1.25 0.042 446 FKBP4 2288 FK506 binding protein 4, 59 kDa 0.80 0.036 2.11 0.000 447 FLJ42627 645644 uncharacterized LOC645644 0.78 0.011 0.63 0.030 448 FLNA 2316 filamin A, alpha 0.81 0.032 0.72 0.027 449 FLRT2 23768 fibronectin leucine rich transmembrane 0.81 0.043 0.67 0.022 protein 2 450 FLT3 2322 fms-related tyrosine kinase 3 0.79 0.019 0.78 0.039 451 FMO2 2327 flavin containing monooxygenase 2 0.79 0.031 0.54 0.000 (non-functional) 452 FMO5 2330 flavin containing monooxygenase 5 0.79 0.015 0.64 0.000 453 FOCAD 54914 focadhesin 0.82 0.044 0.59 0.032 454 FOXI1 2299 forkhead box I1 0.77 0.010 0.73 0.001 455 FOXM1 2305 forkhead box M1 0.78 0.015 1.42 0.002 456 FPGS 2356 folylpolyglutamate synthase 0.79 0.016 0.65 0.039 457 FPR3 2359 formyl peptide receptor 3 0.76 0.009 1.57 0.044 458 FST 10468 follistatin 0.80 0.029 0.68 0.024 459 FTH1P5 2509 ferritin, heavy polypeptide 1 0.81 0.036 0.62 0.023 pseudogene 5 460 FUBP3 8939 far upstream element (FUSE) binding 0.81 0.033 1.62 0.044 protein 3 461 FUT2 2524 fucosyltransferase 2 (secretor status 0.78 0.017 0.55 0.033 included) 462 FZD10 11211 frizzled class receptor 10 0.77 0.012 0.69 0.002 463 FZD4 8322 frizzled class receptor 4 0.77 0.010 0.54 0.013 464 G3BP2 9908 GTPase activating protein (SH3 0.80 0.032 2.37 0.005 domain) binding protein 2 465 GAA 2548 glucosidase, alpha; acid 0.81 0.027 0.56 0.015 466 GABRA1 2554 gamma-aminobutyric acid (GABA) A 0.81 0.046 1.49 0.022 receptor, alpha 1 467 GABRB2 2561 gamma-aminobutyric acid (GABA) A 0.80 0.026 0.77 0.041 receptor, beta 2 468 GABRB3 2562 gamma-aminobutyric acid (GABA) A 0.79 0.021 0.84 0.031 receptor, beta 3 469 GABRD 2563 gamma-aminobutyric acid (GABA) A 0.79 0.021 1.43 0.004 receptor, delta 470 GABRP 2568 gamma-aminobutyric acid (GABA) A 0.81 0.032 0.81 0.001 receptor, pi 471 GADD45GIP1 90480 growth arrest and DNA-damage- 0.77 0.008 1.64 0.002 inducible, gamma interacting protein 1 472 GAREM 64762 GRB2 associated, regulator of MAPK1 0.81 0.032 1.28 0.027 473 GARS 2617 glycyl-tRNA synthetase 0.81 0.025 2.24 0.005 474 GAS2 2620 growth arrest-specific 2 0.80 0.024 0.83 0.017 475 GATA3 2625 GATA binding protein 3 0.78 0.013 0.77 0.017 476 GATAD1 57798 GATA zinc finger domain containing 1 0.79 0.018 0.52 0.033 477 GCH1 2643 GTP cyclohydrolase 1 0.76 0.003 1.55 0.004 478 GDF10 2662 growth differentiation factor 10 0.78 0.015 0.79 0.019 479 GFPT1 2673 glutamine-fructose-6-phosphate 0.81 0.032 1.56 0.026 transaminase 1 480 GGA2 23062 golgi-associated, gamma adaptin ear 0.77 0.008 0.40 0.002 containing, ARF binding protein 2 481 GGCX 2677 gamma-glutamyl carboxylase 0.81 0.032 2.53 0.001 482 GHITM 27069 growth hormone inducible 0.82 0.044 2.52 0.005 transmembrane protein 483 GINS1 9837 GINS complex subunit 1 (Psf1 0.82 0.044 1.42 0.014 homolog) 484 GINS2 51659 GINS complex subunit 2 (Psf2 0.78 0.018 1.18 0.033 homolog) 485 GLB1L 79411 galactosidase, beta 1-like 0.80 0.023 0.57 0.004 486 GLI2 2736 GLI family zinc finger 2 0.81 0.044 0.56 0.006 487 GLI3 2737 GLI family zinc finger 3 0.77 0.012 0.70 0.047 488 GLO1 2739 glyoxalase I 0.81 0.040 1.84 0.003 489 GLRX2 51022 glutaredoxin 2 0.77 0.018 2.32 0.001 490 GLRX5 51218 glutaredoxin 5 0.77 0.017 1.30 0.042 491 GLUL 2752 glutamate-ammonia ligase 0.74 0.006 0.61 0.014 492 GLYR1 84656 glyoxylate reductase 1 homolog 0.79 0.010 0.55 0.017 (Arabidopsis) 493 GMFB 2764 glia maturation factor, beta 0.80 0.035 1.90 0.036 494 GMNN 51053 geminin, DNA replication inhibitor 0.77 0.010 1.52 0.013 495 GMPS 8833 guanine monphosphate synthase 0.79 0.020 1.64 0.009 496 GNA11 2767 guanine nucleotide binding protein (G 0.80 0.026 0.49 0.028 protein), alpha 11 (Gq class) 497 GNAZ 2781 guanine nucleotide binding protein (G 0.81 0.047 1.69 0.038 protein), alpha z polypeptide 498 GNB2L1 10399 guanine nucleotide binding protein (G 0.82 0.047 0.56 0.013 protein), beta polypeptide 2-like 1 499 GNG12 55970 guanine nucleotide binding protein (G 0.81 0.033 0.61 0.002 protein), gamma 12 500 GNL1 2794 guanine nucleotide binding protein-like 0.80 0.027 0.68 0.046 1 501 GNL2 29889 guanine nucleotide binding protein-like 0.80 0.022 1.60 0.042 2 (nucleolar) 502 GNPTAB 79158 N-acetylglucosamine-1-phosphate 0.79 0.014 1.66 0.033 transferase, alpha and beta subunits 503 GNRH1 2796 gonadotropin-releasing hormone 1 0.78 0.009 0.74 0.000 (luteinizing-releasing hormone) 504 GOLGA6L4 374650 golgin A6 family-like 4 0.78 0.017 0.73 0.018 505 GOLGA8A 23015 golgin A8 family, member A 0.79 0.018 0.79 0.017 506 GOLGA8A 23015 golgin A8 family, member A 0.79 0.015 0.66 0.002 507 GOLT1B 51026 golgi transport 1B 0.73 0.002 2.94 0.000 508 GON4L 54856 gon-4-like (C. elegans) 0.76 0.009 0.37 0.005 509 GORASP1 64689 golgi reassembly stacking protein 1, 0.80 0.030 0.46 0.018 65 kDa 510 GOT1 2805 glutamic-oxaloacetic transaminase 1, 0.76 0.010 1.48 0.017 soluble 511 GPN1 11321 GPN-loop GTPase 1 0.78 0.011 1.86 0.016 512 GPR153 387509 G protein-coupled receptor 153 0.75 0.007 0.66 0.029 513 GPR22 2845 G protein-coupled receptor 22 0.81 0.039 0.80 0.025 514 GPR35 2859 G protein-coupled receptor 35 0.80 0.023 0.75 0.029 515 GPRASP1 9737 G protein-coupled receptor associated 0.79 0.022 0.64 0.017 sorting protein 1 516 GPRC5C 55890 G protein-coupled receptor, class C, 0.79 0.020 1.41 0.034 group 5, member C 517 GPRIN2 9721 G protein regulated inducer of neurite 0.75 0.006 0.68 0.005 outgrowth 2 518 GPX4 2879 glutathione peroxidase 4 0.80 0.029 0.52 0.023 519 GREB1L 80000 growth regulation by estrogen in breast 0.80 0.023 0.82 0.049 cancer-like 520 GRK6 2870 G protein-coupled receptor kinase 6 0.80 0.021 1.75 0.020 521 GRSF1 2926 G-rich RNA sequence binding factor 1 0.78 0.016 2.08 0.009 522 GRWD1 83743 glutamate-rich WD repeat containing 1 0.80 0.033 1.65 0.026 523 GSK3B 2932 glycogen synthase kinase 3 beta 0.79 0.017 1.99 0.003 524 GSTM2 2946 glutathione S-transferase mu 2 0.79 0.016 0.75 0.047 (muscle) 525 GSTM4 2948 glutathione S-transferase mu 4 0.78 0.012 0.60 0.041 526 GTF2A2 2958 general transcription factor IIA, 2, 0.79 0.017 1.73 0.041 12 kDa 527 GTF2E1 2960 general transcription factor II E, 0.79 0.026 1.91 0.036 polypeptide 1, alpha 56 kDa 528 GTF2H5 404672 general transcription factor IIH, 0.80 0.028 2.02 0.011 polypeptide 5 529 GTF2IRD2B 389524 GTF2I repeat domain containing 2B 0.77 0.011 0.67 0.010 530 GTPBP4 23560 GTP binding protein 4 0.79 0.017 2.05 0.007 531 GUF1 60558 GUF1 GTPase homolog (S. cerevisiae) 0.82 0.046 2.03 0.009 532 GUK1 2987 guanylate kinase 1 0.79 0.017 1.77 0.016 533 GYS2 2998 glycogen synthase 2 (liver) 0.77 0.014 0.84 0.030 534 GZMB 3002 granzyme B (granzyme 2, cytotoxic T- 0.77 0.005 1.36 0.019 lymphocyte-associated serine esterase 1) 535 H2AFV 94239 H2A histone family, member V 0.80 0.015 3.04 0.000 536 H2AFZ 3015 H2A histone family, member Z 0.77 0.009 2.23 0.001 537 HAB1 55547 B1 for mucin 0.82 0.039 1.53 0.037 538 HAO1 54363 hydroxyacid oxidase (glycolate 0.76 0.008 0.81 0.015 oxidase) 1 539 HAUS2 55142 HAUS augmin-like complex, subunit 2 0.75 0.008 0.76 0.033 540 HCCS 3052 holocytochrome c synthase 0.80 0.034 2.95 0.003 541 HCFC2 29915 host cell factor C2 0.80 0.024 1.79 0.033 542 HCG18 414777 HLA complex group 18 (non-protein 0.79 0.018 0.82 0.022 coding) 543 HDAC2 3066 histone deacetylase 2 0.79 0.015 1.44 0.039 544 HDAC5 10014 histone deacetylase 5 0.80 0.021 0.72 0.043 545 HDAC7 51564 histone deacetylase 7 0.78 0.016 0.71 0.039 546 HDDC2 51020 HD domain containing 2 0.77 0.010 1.89 0.008 547 HEATR6 63897 HEAT repeat containing 6 0.78 0.015 1.79 0.001 548 HFE 3077 hemochromatosis 0.76 0.007 0.48 0.005 549 HGD 3081 homogentisate 1,2-dioxygenase 0.81 0.028 1.32 0.030 550 HIP1 3092 huntingtin interacting protein 1 0.81 0.038 0.49 0.005 551 HIST1H1C 3006 histone cluster 1, H1c 0.79 0.023 1.25 0.031 552 HIST1H2AG 8329 histone cluster 1, H2ag 0.77 0.011 1.36 0.017 553 HIST1H2AJ 8331 histone cluster 1, H2aj 0.79 0.024 1.47 0.046 554 HIST1H2BB 3018 histone cluster 1, H2bb 0.77 0.008 1.35 0.007 555 HIST1H3C 8352 histone cluster 1, H3c 0.80 0.023 1.61 0.001 556 HIST1H4H 8365 histone cluster 1, H4h 0.79 0.020 1.28 0.046 557 HIST3H2A 92815 histone cluster 3, H2a 0.81 0.034 1.28 0.027 558 HJURP 55355 Holliday junction recognition protein 0.79 0.023 1.36 0.049 559 HK2 3099 hexokinase 2 0.78 0.015 0.75 0.005 560 HLTF 6596 helicase-like transcription factor 0.82 0.038 1.79 0.005 561 HMBOX1 79618 homeobox containing 1 0.79 0.020 0.66 0.002 562 HMGB2 3148 high mobility group box 2 0.80 0.024 1.39 0.027 563 HMGN5 79366 high mobility group nucleosome 0.83 0.048 1.50 0.040 binding domain 5 564 HMHB1 57824 histocompatibility (minor) HB-1 0.82 0.047 1.71 0.010 565 HN1 51155 hematological and neurological 0.76 0.011 1.35 0.039 expressed 1 566 HNRNPA1 3178 heterogeneous nuclear 0.79 0.026 0.52 0.007 ribonucleoprotein A1 567 HNRNPA1 3178 heterogeneous nuclear 0.79 0.026 0.41 0.005 ribonucleoprotein A1 568 HNRNPDL 9987 heterogeneous nuclear 0.80 0.023 0.63 0.031 ribonucleoprotein D-like 569 HOXA10 3206 homeobox A10 0.81 0.046 0.75 0.026 570 HOXA4 3201 homeobox A4 0.78 0.015 0.74 0.011 571 HOXA5 3202 homeobox A5 0.80 0.032 0.65 0.000 572 HP 3240 haptoglobin 0.80 0.036 0.78 0.023 573 HPRT1 3251 hypoxanthine 0.77 0.009 1.83 0.003 phosphoribosyltransferase 1 574 HS2ST1 9653 heparan sulfate 2-O-sulfotransferase 1 0.77 0.012 1.48 0.042 575 HSBP1 3281 heat shock factor binding protein 1 0.77 0.011 1.65 0.021 576 HSD17B10 3028 hydroxysteroid (17-beta) 0.80 0.030 1.56 0.044 dehydrogenase 10 577 HSDL2 84263 hydroxysteroid dehydrogenase like 2 0.79 0.022 1.51 0.030 578 HSPA13 6782 heat shock protein 70 kDa family, 0.79 0.017 1.34 0.048 member 13 579 HSPH1 10808 heat shock 105 kDa/110 kDa protein 1 0.78 0.015 1.62 0.005 580 HTATIP2 10553 HIV-1 Tat interactive protein 2, 30 kDa 0.74 0.002 1.91 0.000 581 HTATSF1 27336 HIV-1 Tat specific factor 1 0.80 0.022 1.58 0.033 582 HTR1E 3354 5-hydroxytryptamine (serotonin) 0.77 0.016 0.77 0.007 receptor IE, G protein-coupled 583 HTR3B 9177 5-hydroxytryptamine (serotonin) 0.77 0.013 0.80 0.013 receptor 3B, ionotropic 584 HUWE1 10075 HECT, UBA and WWE domain 0.73 0.004 0.46 0.000 containing 1, E3 ubiquitin protein ligase 585 HYPK 10169 huntingtin interacting protein K 0.78 0.019 1.93 0.003 586 IARS 3376 isoleucyl-tRNA synthetase 0.82 0.036 1.84 0.014 587 ICMT 23463 isoprenylcysteine carboxyl 0.80 0.025 2.03 0.043 methyltransferase 588 ICT1 3396 immature colon carcinoma transcript 1 0.77 0.015 1.83 0.003 589 ID4 3400 inhibitor of DNA binding 4, dominant 0.81 0.039 0.75 0.009 negative helix-loop-helix protein 590 IDH2 3418 isocitrate dehydrogenase 2 (NADP+), 0.75 0.008 1.45 0.017 mitochondrial 591 IDH3A 3419 isocitrate dehydrogenase 3 (NAD+) 0.79 0.022 1.82 0.019 alpha 592 IDI1 3422 isopentenyl-diphosphate delta 0.78 0.010 2.00 0.000 isomerase 1 593 IDO1 3620 indoleamine 2,3-dioxygenase 1 0.73 0.003 1.43 0.009 594 IDUA 3425 iduronidase, alpha-L- 0.77 0.011 0.66 0.044 595 IER2 9592 immediate early response 2 0.81 0.033 0.56 0.002 596 IFIH1 64135 interferon induced with helicase C 0.76 0.006 1.34 0.029 domain 1 597 IFIT5 24138 interferon-induced protein with 0.77 0.012 1.48 0.037 tetratricopeptide repeats 5 598 IFT46 56912 intraflagellar transport 46 homolog 0.81 0.015 0.35 0.000 (Chlamydomonas) 599 IGH 3492 immunoglobulin heavy locus 0.82 0.037 1.63 0.023 600 IKBKB 3551 inhibitor of kappa light polypeptide 0.76 0.007 0.63 0.010 gene enhancer in B-cells, kinase beta 601 IKZF1 10320 IKAROS family zinc finger 1 (Ikaros) 0.81 0.046 0.66 0.042 602 IKZF2 22807 IKAROS family zinc finger 2 (Helios) 0.79 0.016 0.83 0.030 603 IL11RA 3590 interleukin 11 receptor, alpha 0.80 0.025 0.77 0.023 604 IL1A 3552 interleukin 1, alpha 0.77 0.011 0.59 0.008 605 IL1RL2 8808 interleukin 1 receptor-like 2 0.78 0.023 1.40 0.006 606 IL5 3567 interleukin 5 0.82 0.047 1.25 0.019 607 IL6ST 3572 interleukin 6 signal transducer 0.78 0.013 0.69 0.003 608 ILF2 3608 interleukin enhancer binding factor 2 0.76 0.007 1.75 0.012 609 IMPA1 3612 inositol(myo)-1(or 4)- 0.78 0.013 1.58 0.008 monophosphatase 1 610 INADL 10207 InaD-like (Drosophila) 0.79 0.021 0.66 0.000
611 INPP5D 3635 inositol polyphosphate-5-phosphatase, 0.79 0.030 0.70 0.042 145 kDa 612 INPP5K 51763 inositol polyphosphate-5-phosphatase 0.83 0.046 0.40 0.019 K 613 INTS6 26512 integrator complex subunit 6 0.78 0.012 1.46 0.041 614 INTS7 25896 integrator complex subunit 7 0.75 0.007 1.61 0.014 615 INTS8 55656 integrator complex subunit 8 0.78 0.016 1.54 0.012 616 INTS9 55756 integrator complex subunit 9 0.78 0.018 0.47 0.007 617 IPO7 10527 importin 7 0.80 0.023 1.94 0.026 618 IQCK 124152 IQ motif containing K 0.82 0.038 0.51 0.008 619 IRAK3 11213 interleukin-1 receptor-associated 0.80 0.037 0.81 0.024 kinase 3 620 IRF2BP1 26145 interferon regulatory factor 2 binding 0.81 0.025 0.77 0.043 protein 1 621 ISG20 3669 interferon stimulated exonuclease gene 0.76 0.004 1.48 0.018 20 kDa 622 ISOC2 79763 isochorismatase domain containing 2 0.81 0.039 1.80 0.031 623 ITGA10 8515 integrin, alpha 10 0.77 0.011 0.67 0.047 624 ITGA2 3673 integrin, alpha 2 (CD49B, alpha 2 0.81 0.043 0.68 0.034 subunit of VLA-2 receptor) 625 ITGA7 3679 integrin, alpha 7 0.81 0.045 0.85 0.044 626 ITGA9 3680 integrin, alpha 9 0.81 0.031 0.73 0.028 627 ITIH4 3700 inter-alpha-trypsin inhibitor heavy 0.76 0.007 0.72 0.015 chain family, member 4 628 IVD 3712 isovaleryl-CoA dehydrogenase 0.83 0.049 0.56 0.030 629 IVNS1ABP 10625 influenza virus NS1A binding protein 0.79 0.015 1.79 0.017 630 JADE2 23338 jade family PHD finger 2 0.80 0.035 0.44 0.003 631 JAG2 3714 jagged 2 0.76 0.011 0.60 0.037 632 JAM2 58494 junctional adhesion molecule 2 0.82 0.041 0.62 0.022 633 JMJD6 23210 jumonji domain containing 6 0.77 0.010 2.24 0.005 634 JMJD7-PLA2G4B 8681 JMJD7-PLA2G4B readthrough 0.75 0.005 0.70 0.015 635 JUN 3725 jun proto-oncogene 0.82 0.042 0.61 0.002 636 JUP 3728 junction plakoglobin 0.78 0.024 0.78 0.011 637 KANK1 23189 KN motif and ankyrin repeat domains 0.79 0.027 0.51 0.003 1 638 KANK2 25959 KN motif and ankyrin repeat domains 0.80 0.028 0.63 0.044 2 639 KANSL1L 151050 KAT8 regulatory NSL complex 0.80 0.019 1.38 0.017 subunit 1-like 640 KANSL2 54934 KAT8 regulatory NSL complex 0.75 0.011 2.50 0.004 subunit 2 641 KCMF1 56888 potassium channel modulatory factor 1 0.77 0.005 3.20 0.002 642 KCNC4 3749 potassium voltage-gated channel, 0.78 0.013 0.79 0.029 Shaw-related subfamily, member 4 643 KCNG1 3755 potassium voltage-gated channel, 0.79 0.019 1.23 0.050 subfamily G, member 1 644 KCNK1 3775 potassium channel, subfamily K, 0.81 0.040 1.23 0.022 member 1 645 KCNMB1 3779 potassium large conductance calcium- 0.79 0.018 0.61 0.007 activated channel, subfamily M, beta member 1 646 KCNS3 3790 potassium voltage-gated channel, 0.80 0.033 0.68 0.016 delayed-rectifier, subfamily S, member 3 647 KDELR2 11014 KDEL (Lys-Asp-Glu-Leu) 0.80 0.031 1.71 0.019 endoplasmic reticulum protein retention receptor 2 648 KEAP1 9817 kelch-like ECH-associated protein 1 0.79 0.016 1.72 0.030 649 KHDRBS3 10656 KH domain containing, RNA binding, 0.80 0.023 1.35 0.043 signal transduction associated 3 650 KIAA0101 9768 KIAA0101 0.78 0.012 1.56 0.004 651 KIAA0391 5687 KIAA0391 0.76 0.008 1.67 0.027 652 KIAA0485 57235 uncharacterized LOC57235 0.80 0.022 0.73 0.002 653 KIAA0556 23247 KIAA0556 0.73 0.003 0.48 0.006 654 KIAA0753 9851 KIAA0753 0.76 0.004 0.47 0.001 655 KIAA0754 643314 KIAA0754 0.80 0.023 0.84 0.004 656 KIAA1024 23251 KIAA1024 0.77 0.008 1.31 0.007 657 KIF11 3832 kinesin family member 11 0.78 0.012 1.61 0.003 658 KIF13B 23303 kinesin family member 13B 0.77 0.012 0.59 0.002 659 KIF14 9928 kinesin family member 14 0.78 0.013 1.73 0.001 660 KIF20A 10112 kinesin family member 20A 0.76 0.011 1.46 0.005 661 KIF23 9493 kinesin family member 23 0.79 0.021 1.22 0.028 662 KIF2C 11004 kinesin family member 2C 0.78 0.009 1.90 0.003 663 KIF4A 24137 kinesin family member 4A 0.79 0.016 1.73 0.003 664 KIF5B 3799 kinesin family member 5B 0.80 0.022 1.77 0.033 665 KIFC1 3833 kinesin family member C1 0.78 0.015 1.35 0.003 666 KIT 3815 v-kit Hardy-Zuckerman 4 feline 0.79 0.023 0.77 0.010 sarcoma viral oncogene homolog 667 KLF13 51621 Kruppel-like factor 13 0.80 0.037 0.81 0.019 668 KLF2 10365 Kruppel-like factor 2 0.80 0.034 0.63 0.028 669 KLHL7 55975 kelch-like family member 7 0.78 0.010 1.57 0.036 670 KMT2A 4297 lysine (K)-specific methyltransferase 0.81 0.048 0.33 0.000 2A 671 KMT2A 4297 lysine (K)-specific methyltransferase 0.81 0.029 0.79 0.020 2A 672 KPNA2 3838 karyopherin alpha 2 (RAG cohort 1, 0.79 0.021 1.44 0.038 importin alpha 1) 673 KPTN 11133 kaptin (actin binding protein) 0.80 0.027 0.74 0.046 674 KRAS 3845 Kirsten rat sarcoma viral oncogene 0.82 0.047 1.87 0.016 homolog 675 KRR1 11103 KRR1, small subunit (SSU) 0.81 0.039 1.87 0.001 processome component, homolog (yeast) 676 KRT14 3861 keratin 14 0.78 0.024 0.89 0.014 677 KRT15 3866 keratin 15 0.80 0.025 0.88 0.002 678 KRT23 25984 keratin 23 (histone deacetylase 0.79 0.014 0.85 0.015 inducible) 679 KRT5 3852 keratin 5 0.73 0.006 0.75 0.000 680 KRT6B 3854 keratin 6B 0.76 0.018 0.77 0.023 681 LAGE3 8270 L antigen family, member 3 0.79 0.022 1.47 0.010 682 LAMA1 284217 laminin, alpha 1 0.78 0.014 0.77 0.020 683 LAMA3 3909 laminin, alpha 3 0.81 0.027 0.81 0.002 684 LAMB2 3913 laminin, beta 2 (laminin S) 0.78 0.011 0.55 0.001 685 LAMP1 3916 lysosomal-associated membrane 0.78 0.018 0.59 0.031 protein 1 686 LANCL1 10314 LanC lantibiotic synthetase component 0.82 0.050 0.60 0.042 C-like 1 (bacterial) 687 LAPTM4A 9741 lysosomal protein transmembrane 4 0.77 0.010 0.35 0.001 alpha 688 LAPTM4B 55353 lysosomal protein transmembrane 4 0.80 0.036 1.34 0.012 beta 689 LDLR 3949 low density lipoprotein receptor 0.79 0.019 1.60 0.002 690 LDLRAP1 26119 low density lipoprotein receptor 0.80 0.044 0.50 0.002 adaptor protein 1 691 LEPR 3953 leptin receptor 0.81 0.036 0.54 0.008 692 LEPREL1 55214 leprecan-like 1 0.79 0.024 0.77 0.008 693 LEPREL4 10609 leprecan-like 4 0.79 0.029 1.30 0.046 694 LEPROT 54741 leptin receptor overlapping transcript 0.82 0.044 0.42 0.002 695 LETMD1 25875 LETM1 domain containing 1 0.77 0.006 0.44 0.001 696 LGR4 55366 leucine-rich repeat containing G 0.80 0.021 1.32 0.015 protein-coupled receptor 4 697 LGR5 8549 leucine-rich repeat containing G 0.81 0.034 0.77 0.027 protein-coupled receptor 5 698 LHFP 10186 lipoma HMGIC fusion partner 0.81 0.047 0.59 0.003 699 LHX1 3975 LIM homeobox 1 0.79 0.024 1.27 0.024 700 LINC00472 79940 long intergenic non-protein coding 0.79 0.014 0.73 0.000 RNA 472 701 LINC00965 349196 long intergenic non-protein coding 0.80 0.031 0.78 0.022 RNA 965 702 LMAN1 3998 lectin, mannose-binding, 1 0.78 0.014 1.41 0.012 703 LMBR1L 55716 limb development membrane protein 0.77 0.013 0.50 0.018 1-like 704 LMF1 64788 lipase maturation factor 1 0.77 0.009 0.58 0.013 705 LMO7 4008 LIM domain 7 0.78 0.015 0.75 0.000 706 LOC100129361 100129361 chromosome X open reading frame 69- 0.77 0.010 1.60 0.016 like 707 LOC100505498 100505498 uncharacterized LOC100505498 0.74 0.004 0.62 0.002 708 LOC100505915 100505915 uncharacterized LOC100505915 0.80 0.021 0.74 0.002 709 LOC100506282 100506282 uncharacterized LOC100506282 0.78 0.011 0.76 0.005 710 LOC100506469 100506469 uncharacterized LOC100506469 0.75 0.004 0.57 0.003 711 LONP2 100507577 Ion peptidase 2, peroxisomal 0.78 0.019 0.48 0.000 712 SIAH1 100507577 siah E3 ubiquitin protein ligase 1 0.78 0.017 0.71 0.004 713 SNORD14B 100508408 small nucleolar RNA, C/D box 14B 0.81 0.040 0.42 0.004 714 ZNF44 101060181 zinc finger protein 44 0.76 0.008 0.58 0.017 715 NPIPB5 101929910 nuclear pore complex interacting 0.77 0.007 0.76 0.003 protein family, member B5 716 POLR3E 101060521 polymerase (RNA) III (DNA directed) 0.81 0.022 0.43 0.001 polypeptide E (80 kD) 717 LOC101927792 101927792 uncharacterized LOC101927792 0.80 0.028 1.22 0.041 718 RSRP1 101928189 arginine/serine-rich protein 1 0.79 0.027 0.69 0.024 719 MFAP3L 101928198 microfibrillar-associated protein 3-like 0.82 0.045 1.30 0.043 720 SLC19A1 101928717 solute carrier family 19 (folate 0.79 0.023 1.46 0.033 transporter), member 1 721 TPT1 101928826 tumor protein, translationally- 0.74 0.005 0.46 0.001 controlled 1 722 SNX29 101929304 sorting nexin 29 0.82 0.031 0.72 0.019 723 RIF1 101929336 replication timing regulatory factor 1 0.79 0.014 1.59 0.011 724 SULT1A4 101929857 sulfotransferase family, cytosolic, 1A, 0.76 0.007 0.59 0.008 phenol-preferring, member 4 725 NPIPB5 101929910 nuclear pore complex interacting 0.80 0.020 0.73 0.005 protein family, member B5 726 PKD1P1 102724993 polycystic kidney disease 1 (autosomal 0.78 0.013 0.65 0.002 dominant) pseudogene 1 727 PKD1P1 101930075 polycystic kidney disease 1 (autosomal 0.79 0.018 0.70 0.016 dominant) pseudogene 1 728 PKD1 101930075 polycystic kidney disease 1 (autosomal 0.76 0.007 0.61 0.014 dominant) 729 PPP2R3B 102725016 protein phosphatase 2, regulatory 0.83 0.049 1.24 0.022 subunit B'', beta 730 LOC155060 155060 AI894139 pseudogene 0.79 0.012 0.65 0.019 731 LOC157562 157562 uncharacterized LOC157562 0.77 0.015 1.38 0.004 732 LOC202181 202181 SUMO-interacting motifs containing 1 0.79 0.018 0.83 0.015 pseudogene 733 PDE4C 729966 phosphodiesterase 4C, cAMP-specific 0.76 0.008 0.81 0.038 734 LONRF1 91694 LON peptidase N-terminal domain and 0.79 0.020 0.70 0.006 ring finger 1 735 LPCAT4 254531 lysophosphatidylcholine 0.80 0.027 0.43 0.002 acyltransferase 4 736 LPPR2 64748 lipid phosphate phosphatase-related 0.77 0.025 1.55 0.027 protein type 2 737 LRIG1 26018 leucine-rich repeats and 0.81 0.020 0.65 0.004 immunoglobulin-like domains 1 738 LRRC1 55227 leucine rich repeat containing 1 0.80 0.027 1.50 0.028 739 LRRC17 10234 leucine rich repeat containing 17 0.83 0.049 0.71 0.016 740 LRRC48 83450 leucine rich repeat containing 48 0.81 0.030 0.54 0.003 741 LRRC59 55379 leucine rich repeat containing 59 0.78 0.013 1.78 0.001 742 LRRFIP1 9208 leucine rich repeat (in FLII) interacting 0.79 0.019 0.73 0.048 protein 1 743 LRRN3 54674 leucine rich repeat neuronal 3 0.80 0.028 0.68 0.044 744 LRRTM2 26045 leucine rich repeat transmembrane 0.82 0.044 0.79 0.022 neuronal 2 745 LSM1 27257 LSM1, U6 small nuclear RNA 0.80 0.034 1.90 0.000 associated 746 LSM3 27258 LSM3 homolog, U6 small nuclear 0.75 0.007 1.68 0.019 RNA associated (S. cerevisiae) 747 LTBP3 4054 latent transforming growth factor beta 0.79 0.026 0.55 0.000 binding protein 3 748 LTBP4 8425 latent transforming growth factor beta 0.79 0.022 0.66 0.028 binding protein 4 749 LYRM4 57128 LYR motif containing 4 0.74 0.007 1.70 0.027 750 MAB21L1 4081 mab-21-like 1 (C. elegans) 0.82 0.046 0.79 0.010 751 MACF1 23499 microtubule-actin crosslinking factor 1 0.79 0.027 0.48 0.000 752 MAD2L1 4085 MAD2 mitotic arrest deficient-like 1 0.77 0.009 1.57 0.001 (yeast) 753 MAD2L1BP 9587 MAD2L1 binding protein 0.79 0.017 2.01 0.021 754 MAFK 7975 v-maf avian musculoaponeurotic 0.77 0.011 1.29 0.015 fibrosarcoma oncogene homolog K 755 MAGED1 9500 melanoma antigen family D, 1 0.78 0.012 1.56 0.014 756 MAGOHB 55110 mago-nashi homolog B (Drosophila) 0.78 0.016 1.23 0.031 757 MAK 4117 male germ cell-associated kinase 0.81 0.039 0.85 0.044
758 MAN1C1 57134 mannosidase, alpha, class 1C, member 0.80 0.022 0.56 0.018 1 759 MAN2C1 4123 mannosidase, alpha, class 2C, member 0.80 0.018 0.55 0.026 1 760 MAOA 4128 monoamine oxidase A 0.80 0.028 0.71 0.001 761 MAOB 4129 monoamine oxidase B 0.81 0.041 0.89 0.048 762 MAP2K1 5604 mitogen-activated protein kinase 0.77 0.014 1.99 0.016 kinase 1 763 MAP3K12 7786 mitogen-activated protein kinase 0.77 0.008 0.61 0.004 kinase kinase 12 764 MAP3K13 9175 mitogen-activated protein kinase 0.79 0.018 1.27 0.049 kinase kinase 13 765 MAP7D3 79649 MAP7 domain containing 3 0.76 0.010 0.72 0.027 766 MAPK1 5594 mitogen-activated protein kinase 1 0.77 0.016 1.75 0.015 767 MARCH2 51257 membrane-associated ring finger 0.83 0.039 0.51 0.005 (C3HC4) 2, E3 ubiquitin protein ligase 768 MARCH5 54708 membrane-associated ring finger 0.79 0.017 2.06 0.033 (C3HC4) 5 769 MARCH8 220972 membrane-associated ring finger 0.81 0.033 0.55 0.002 (C3HC4) 8, E3 ubiquitin protein ligase 770 MARS 4141 methionyl-tRNA synthetase 0.77 0.008 3.44 0.000 771 MAST4 375449 microtubule associated 0.81 0.031 0.74 0.043 serine/threonine kinase family member 4 772 MBD3 53615 methyl-CpG binding domain protein 3 0.79 0.020 0.58 0.049 773 MCAT 27349 malonyl CoA:ACP acyltransferase 0.79 0.021 1.84 0.015 (mitochondrial) 774 MCL1 4170 myeloid cell leukemia 1 0.81 0.045 0.59 0.021 775 MCM10 55388 minichromosome maintenance 0.79 0.016 1.39 0.001 complex component 10 776 MCM2 4171 minichromosome maintenance 0.81 0.028 1.53 0.012 complex component 2 777 MCM6 4175 minichromosome maintenance 0.77 0.013 1.63 0.020 complex component 6 778 MCUR1 63933 mitochondrial calcium uniporter 0.76 0.004 1.95 0.002 regulator 1 779 ME3 10873 malic enzyme 3, NADP(+)-dependent, 0.78 0.020 0.69 0.002 mitochondrial 780 MEA1 4201 male-enhanced antigen 1 0.80 0.030 1.66 0.044 781 MED1 5469 mediator complex subunit 1 0.78 0.012 1.40 0.003 782 MED31 51003 mediator complex subunit 31 0.80 0.020 0.66 0.022 783 MELK 9833 maternal embryonic leucine zipper 0.78 0.010 1.54 0.003 kinase 784 METTL2A 55798 methyltransferase like 2A 0.80 0.027 1.44 0.040 785 METTL5 29081 methyltransferase like 5 0.79 0.019 2.03 0.012 786 MGC12488 84786 uncharacterized protein MGC12488 0.78 0.010 0.78 0.002 787 MGP 4256 matrix Gla protein 0.81 0.027 0.81 0.007 788 MGRN1 23295 mahogunin ring finger 1, E3 ubiquitin 0.80 0.029 0.56 0.035 protein ligase 789 MIF 4282 macrophage migration inhibitory factor 0.78 0.026 1.67 0.003 (glycosylation-inhibiting factor) 790 MINK1 50488 misshapen-like kinase 1 0.80 0.035 0.53 0.005 791 NELFE 100302242 negative elongation factor complex 0.74 0.005 1.68 0.009 member E 792 UCK2 100500832 uridine-cytidine kinase 2 0.75 0.007 1.69 0.004 793 STMN1 100500808 stathmin 1 0.74 0.005 1.82 0.010 794 PDCD4 100616113 programmed cell death 4 (neoplastic 0.82 0.046 0.81 0.026 transformation inhibitor) 795 NDUFS8 102465669 NADH dehydrogenase (ubiquinone) 0.80 0.031 1.67 0.003 Fe--S protein 8, 23 kDa (NADH- coenzyme Q reductase) 796 NEAT1 693197 nuclear paraspeckle assembly 0.77 0.010 0.81 0.040 transcript 1 (non-protein coding) 797 NEIL1 693216 nei endonuclease VIII-like 1 (E. coli) 0.80 0.030 0.72 0.043 798 PFDN6 102465501 prefoldin subunit 6 0.80 0.037 2.05 0.006 799 SEMA3B 102465526 sema domain, immunoglobulin domain 0.80 0.023 0.84 0.030 (Ig), short basic domain, secreted, (semaphorin) 3B 800 QARS 102465536 glutaminyl-tRNA synthetase 0.77 0.013 0.36 0.002 801 MIS18A 54069 MIS18 kinetochore protein A 0.81 0.029 1.86 0.033 802 MKL2 57496 MKL/myocardin-like 2 0.80 0.020 0.57 0.025 803 MKNK2 2872 MAP kinase interacting 0.75 0.007 0.49 0.000 serine/threonine kinase 2 804 MLF1 4291 myeloid leukemia factor 1 0.80 0.027 1.39 0.041 805 MLLT10 8028 myeloid/lymphoid or mixed-lineage 0.75 0.010 0.52 0.049 leukemia; translocated to, 10 806 MLLT11 10962 myeloid/lymphoid or mixed-lineage 0.79 0.019 1.42 0.023 leukemia; translocated to, 11 807 MLLT3 4300 myeloid/lymphoid or mixed-lineage 0.78 0.018 0.55 0.006 leukemia; translocated to, 3 808 MLPH 79083 melanophilin 0.76 0.008 0.73 0.013 809 MMP1 4312 matrix metallopeptidase 1 (interstitial 0.74 0.004 1.22 0.000 collagenase) 810 MMP11 4320 matrix metallopeptidase 11 0.81 0.048 1.18 0.050 (stromelysin 3) 811 MNT 4335 MAX network transcriptional repressor 0.80 0.032 0.40 0.006 812 MOK 5891 MOK protein kinase 0.76 0.005 0.39 0.000 813 MOSPD1 56180 motile sperm domain containing 1 0.79 0.023 2.16 0.005 814 MPRIP 23164 myosin phosphatase Rho interacting 0.79 0.024 0.55 0.029 protein 815 MR1 3140 major histocompatibility complex, 0.79 0.029 0.53 0.033 class I-related 816 MRPL13 28998 mitochondrial ribosomal protein L13 0.78 0.017 1.72 0.000 817 MRPL15 29088 mitochondrial ribosomal protein L15 0.79 0.025 1.90 0.000 818 MRPL17 63875 mitochondrial ribosomal protein L17 0.76 0.008 2.05 0.002 819 MRPL18 29074 mitochondrial ribosomal protein LI8 0.77 0.011 2.21 0.001 820 MRPL22 29093 mitochondrial ribosomal protein L22 0.79 0.017 1.75 0.031 821 MRPL23 6150 mitochondrial ribosomal protein L23 0.79 0.022 1.51 0.025 822 MRPL3 11222 mitochondrial ribosomal protein L3 0.74 0.004 2.34 0.000 823 MRPL35 51318 mitochondrial ribosomal protein L35 0.73 0.005 1.21 0.022 824 MRPL40 64976 mitochondrial ribosomal protein L40 0.79 0.023 1.36 0.049 825 MRPL41 64975 mitochondrial ribosomal protein L41 0.83 0.050 1.28 0.049 826 MRPL48 51642 mitochondrial ribosomal protein L48 0.78 0.019 2.51 0.000 827 MRPS10 55173 mitochondrial ribosomal protein S10 0.81 0.038 1.96 0.010 828 MRPS11 64963 mitochondrial ribosomal protein S11 0.71 0.003 1.86 0.006 829 MRPS12 6183 mitochondrial ribosomal protein S12 0.77 0.015 1.48 0.028 830 MRPS14 63931 mitochondrial ribosomal protein S14 0.79 0.022 1.85 0.021 831 MRPS16 51021 mitochondrial ribosomal protein S16 0.75 0.006 1.65 0.007 832 MRPS17 51373 mitochondrial ribosomal protein S17 0.76 0.013 3.13 0.000 833 MRPS18A 55168 mitochondrial ribosomal protein S18A 0.81 0.035 1.87 0.019 834 MRPS18C 51023 mitochondrial ribosomal protein S18C 0.81 0.031 1.46 0.004 835 MRPS22 56945 mitochondrial ribosomal protein S22 0.79 0.015 5.21 0.000 836 MRPS28 28957 mitochondrial ribosomal protein S28 0.81 0.039 1.33 0.029 837 MRPS33 51650 mitochondrial ribosomal protein S33 0.79 0.017 1.65 0.027 838 MRPS7 51081 mitochondrial ribosomal protein S7 0.79 0.021 2.07 0.003 839 MRS2 57380 MRS2 magnesium transporter 0.78 0.011 2.22 0.004 840 MS4A5 64232 membrane-spanning 4-domains, 0.78 0.013 1.46 0.024 subfamily A, member 5 841 MSH6 2956 mutS homolog 6 0.76 0.008 2.86 0.001 842 MSMO1 6307 methylsterol monooxygenase 1 0.79 0.022 1.36 0.046 843 MSR1 4481 macrophage scavenger receptor 1 0.77 0.013 1.46 0.040 844 MSRA 4482 methionine sulfoxide reductase A 0.80 0.025 0.43 0.003 845 MST1 4485 macrophage stimulating 1 (hepatocyte 0.76 0.006 0.69 0.008 growth factor-like) 846 MTA1 9112 metastasis associated 1 0.79 0.015 0.50 0.001 847 MTA2 9219 metastasis associated 1 family, member 0.79 0.033 0.73 0.033 2 848 MTCH2 23788 mitochondrial carrier 2 0.75 0.005 2.43 0.002 849 MTERF3 51001 mitochondrial transcription termination 0.82 0.049 1.58 0.003 factor 3 850 MTFR1 9650 mitochondrial fission regulator 1 0.80 0.026 1.50 0.004 851 MTG1 92170 mitochondrial ribosome-associated 0.80 0.034 0.49 0.003 GTPase 1 852 MTHFD2 10797 methylenetetrahydrofolate 0.76 0.005 2.59 0.000 dehydrogenase 2, methenyltetrahydrofolate cyclohydrolase 853 MTHFS 10588 5,10-methenyltetrahydrofolate 0.78 0.015 1.61 0.048 synthetase 854 MTM1 4534 myotubularin 1 0.78 0.016 1.43 0.042 855 MTMR2 8898 myotubularin related protein 2 0.78 0.017 1.57 0.050 856 MTPAP 55149 mitochondrial poly(A) polymerase 0.80 0.028 2.25 0.022 857 MTSS1 9788 metastasis suppressor 1 0.82 0.032 1.86 0.001 858 MTX1 4580 metaxin 1 0.79 0.027 1.52 0.044 859 MTX2 10651 metaxin 2 0.79 0.022 1.82 0.049 860 MUC7 4589 mucin 7, secreted 0.78 0.016 0.82 0.044 861 MUM1 84939 melanoma associated antigen (mutated) 0.82 0.037 0.52 0.001 1 862 MUT 4594 methylmalonyl CoA mutase 0.78 0.011 2.20 0.003 863 MXD1 4084 MAX dimerization protein 1 0.81 0.036 1.28 0.043 864 MYBL2 4605 v-myb avian myeloblastosis viral 0.77 0.012 1.26 0.010 oncogene homolog-like 2 865 MYH6 4624 myosin, heavy chain 6, cardiac muscle, 0.79 0.019 1.24 0.001 alpha 866 MYL12B 103910 myosin, light chain 12B, regulatory 0.78 0.015 0.69 0.036 867 MYL6 4637 myosin, light chain 6, alkali, smooth 0.76 0.007 0.47 0.017 muscle and non-muscle 868 MYNN 55892 myoneurin 0.80 0.026 1.76 0.036 869 MYO15B 80022 myosin XVB pseudogene 0.76 0.009 0.55 0.010 870 MYO1C 4641 myosin IC 0.75 0.006 0.62 0.014 871 MYO5A 4644 myosin VA (heavy chain 12, myoxin) 0.79 0.017 2.02 0.012 872 MYO5C 55930 myosin VC 0.80 0.019 0.63 0.038 873 MYOF 26509 myoferlin 0.80 0.021 0.61 0.013 874 MYOZ2 51778 myozenin 2 0.82 0.040 1.30 0.006 875 MZF1 7593 myeloid zinc finger 1 0.76 0.010 0.48 0.007 876 NAA10 8260 N(alpha)-acetyltransferase 10, NatA 0.79 0.016 1.89 0.014 catalytic subunit 877 NAA15 80155 N(alpha)-acetyltransferase 15, NatA 0.81 0.027 1.68 0.009 auxiliary subunit 878 NAA40 79829 N(alpha)-acetyltransferase 40, NatD 0.77 0.007 0.57 0.018 catalytic subunit 879 NAA50 80218 N(alpha)-acetyltransferase 50, NatE 0.81 0.030 1.60 0.037 catalytic subunit 880 NAA60 79903 N(alpha)-acetyltransferase 60, NatF 0.78 0.014 0.55 0.036 catalytic subunit 881 NAALAD2 10003 N-acetylated alpha-linked acidic 0.80 0.024 0.72 0.000 dipeptidase 2 882 NAB1 4664 NGFI-A binding protein 1 (EGR1 0.81 0.047 0.49 0.009 binding protein 1) 883 NACA 4666 nascent polypeptide-associated 0.77 0.010 0.37 0.003 complex alpha subunit 884 NANS 54187 N-acetylneuraminic acid synthase 0.79 0.013 1.59 0.016 885 NAP1L2 4674 nucleosome assembly protein 1-like 2 0.80 0.029 0.81 0.038 886 NAPG 8774 N-ethylmaleimide-sensitive factor 0.79 0.015 2.48 0.004 attachment protein, gamma 887 NARF 26502 nuclear prelamin A recognition factor 0.79 0.018 1.48 0.041 888 NAV2 89797 neuron navigator 2 0.82 0.043 0.75 0.045 889 NBPF1 55672 neuroblastoma breakpoint family, 0.81 0.041 0.66 0.050 member 1 890 NBPF10 25832 neuroblastoma breakpoint family, 0.81 0.034 0.62 0.015 member 10 891 NBR2 10230 neighbor of BRCA1 gene 2 (non- 0.78 0.015 0.79 0.017 protein coding) 892 NCAPG 64151 non-SMC condensin I complex, 0.76 0.005 1.98 0.000 subunit G 893 NCOA1 8648 nuclear receptor coactivator 1 0.77 0.008 0.41 0.003 894 NCOR1 9611 nuclear receptor corepressor 1 0.82 0.043 0.48 0.007 895 NCSTN 23385 nicastrin 0.78 0.019 0.52 0.021 896 NDE1 54820 nudE neurodevelopment protein 1 0.78 0.013 0.62 0.011 897 NDP 4693 Norrie disease (pseudoglioma) 0.77 0.011 0.78 0.014 898 NDRG2 57447 NDRG family member 2 0.76 0.009 0.64 0.004 899 NDST2 8509 N-deacetylase/N-sulfotransferase 0.82 0.047 0.74 0.023 (heparan glucosaminyl) 2 900 NDUFA3 4696 NADH dehydrogenase (ubiquinone) 1 0.78 0.017 1.60 0.010 alpha subcomplex, 3, 9 kDa 901 NDUFA6 4700 NADH dehydrogenase (ubiquinone) 1 0.76 0.010 1.80 0.002 alpha subcomplex, 6, 14 kDa 902 NDUFA7 4701 NADH dehydrogenase (ubiquinone) 1 0.80 0.032 1.30 0.023 alpha subcomplex, 7, 14.5 kDa 903 NDUFA8 4702 NADH dehydrogenase (ubiquinone) 1 0.73 0.002 2.26 0.000 alpha subcomplex, 8, 19 kDa 904 NDUFB3 4709 NADH dehydrogenase (ubiquinone) 1 0.79 0.018 4.97 0.000 beta subcomplex, 3, 12 kDa 905 NDUFB5 4711 NADH dehydrogenase (ubiquinone) 1 0.74 0.004 2.54 0.001 beta subcomplex, 5, 16 kDa 906 NDUFS1 4719 NADH dehydrogenase (ubiquinone) 0.78 0.012 2.31 0.000
Fe--S protein 1, 75 kDa 907 NDUFS3 4722 NADH dehydrogenase (ubiquinone) 0.79 0.019 1.93 0.014 Fe--S protein 3, 30 kDa 908 NEK2 4751 NIMA-related kinase 2 0.80 0.026 1.45 0.003 909 NEK3 4752 NIMA-related kinase 3 0.80 0.035 0.61 0.043 910 NEK9 91754 NIMA-related kinase 9 0.83 0.043 0.42 0.001 911 NELL1 4745 NEL-like 1 (chicken) 0.80 0.034 1.36 0.003 912 NEU2 4759 sialidase 2 (cytosolic sialidase) 0.78 0.017 1.41 0.008 913 NFATC2IP 84901 nuclear factor of activated T-cells, 0.76 0.013 0.42 0.001 cytoplasmic, calcineurin-dependent 2 interacting protein 914 NFE2L1 4779 nuclear factor, erythroid 2-like 1 0.77 0.013 0.49 0.006 915 NFIB 4781 nuclear factor I/B 0.81 0.041 0.79 0.037 916 NFRKB 4798 nuclear factor related to kappaB 0.76 0.007 0.37 0.000 binding protein 917 NFX1 4799 nuclear transcription factor, X-box 0.79 0.016 0.30 0.001 binding 1 918 NHLH1 4807 nescient helix loop helix 1 0.82 0.048 1.42 0.041 919 NINL 22981 ninein-like 0.79 0.014 0.55 0.010 920 NIPSNAP3B 55335 nipsnap homolog 3B (C. elegans) 0.78 0.013 0.76 0.038 921 NISCH 11188 nischarin 0.77 0.016 0.52 0.002 922 NIT2 56954 nitrilase family, member 2 0.80 0.026 1.71 0.037 923 NKX2-5 1482 NK2 homeobox 5 0.82 0.044 1.35 0.016 924 NME1 4830 NME/NM23 nucleoside diphosphate 0.80 0.034 1.66 0.002 kinase 1 925 NME5 8382 NME/NM23 family member 5 0.79 0.018 0.73 0.022 926 NMT2 9397 N-myristoyltransferase 2 0.82 0.048 0.55 0.043 927 NOL11 25926 nucleolar protein 11 0.79 0.019 1.66 0.021 928 NOL7 51406 nucleolar protein 7, 27 kDa 0.81 0.030 2.23 0.003 929 NOL9 79707 nucleolar protein 9 0.82 0.047 0.44 0.037 930 NOP10 55505 NOP10 ribonucleoprotein 0.72 0.002 2.63 0.001 931 NOP16 51491 NOP16 nucleolar protein 0.77 0.011 1.64 0.005 932 NOS1 4842 nitric oxide synthase 1 (neuronal) 0.77 0.011 0.69 0.038 933 NOTCH2 4853 notch 2 0.81 0.040 0.56 0.029 934 NOTCH2NL 388677 notch 2 N-terminal like 0.82 0.044 0.79 0.040 935 NOV 4856 nephroblastoma overexpressed 0.77 0.011 0.63 0.015 936 NPAS2 4862 neuronal PAS domain protein 2 0.81 0.032 0.70 0.035 937 NPC1L1 29881 NPC1-like 1 0.78 0.024 1.48 0.001 938 NPEPPS 9520 aminopeptidase puromycin sensitive 0.81 0.027 0.57 0.022 939 NPIPA1 9284 nuclear pore complex interacting 0.78 0.015 0.59 0.004 protein family, member A1 940 NPIPA1 9284 nuclear pore complex interacting 0.78 0.011 0.79 0.005 protein family, member A1 941 NPL 80896 N-acetylneuraminate pyruvate lyase 0.74 0.001 1.32 0.003 (dihydrodipicolinate synthase) 942 NPR3 4883 natriuretic peptide receptor 3 0.82 0.045 1.41 0.038 943 NPY1R 4886 neuropeptide Y receptor Y1 0.82 0.034 0.88 0.011 944 NPY5R 4889 neuropeptide Y receptor Y5 0.77 0.009 0.80 0.011 945 NQO1 1728 NAD(P)H dehydrogenase, quinone 1 0.79 0.020 1.35 0.009 946 NRAS 4893 neuroblastoma RAS viral (v-ras) 0.78 0.012 1.58 0.050 oncogene homolog 947 NRDE2 55051 NRDE-2, necessary for RNA 0.81 0.019 0.50 0.000 interference, domain containing 948 NRN1 51299 neuritin 1 0.80 0.027 0.56 0.011 949 NRXN1 9378 neurexin 1 0.77 0.009 0.68 0.012 950 NSDHL 50814 NAD(P) dependent steroid 0.78 0.016 1.59 0.015 dehydrogenase -like 951 NSFL1C 55968 NSFL1 (p97) cofactor (p47) 0.79 0.018 1.81 0.024 952 NSL1 25936 NSL1, MIS12 kinetochore complex 0.78 0.015 1.96 0.020 component 953 NT5DC3 51559 5'-nucleotidase domain containing 3 0.76 0.007 0.57 0.013 954 NT5E 4907 5'-nucleotidase, ecto (CD73) 0.76 0.011 1.30 0.045 955 NTRK2 4915 neurotrophic tyrosine kinase, receptor, 0.80 0.022 0.48 0.000 type 2 956 NUDT21 11051 nudix (nucleoside diphosphate linked 0.75 0.005 1.66 0.016 moiety X)-type motif 21 957 NUMA1 4926 nuclear mitotic apparatus protein 1 0.78 0.022 0.56 0.002 958 NUP155 9631 nucleoporin 155 kDa 0.80 0.031 1.50 0.048 959 NUP93 9688 nucleoporin 93 kDa 0.75 0.005 1.17 0.028 960 NUS1 11049 nuclear undecaprenyl pyrophosphate 0.79 0.019 1.59 0.028 synthase 1 homolog (S. cerevisiae) 961 NUS1P3 11049 nuclear undecaprenyl pyrophosphate 0.74 0.010 1.35 0.034 synthase 1 homolog (S. cerevisiae) pseudogene 3 962 NUSAP1 51203 nucleolar and spindle associated 0.79 0.016 1.73 0.000 protein 1 963 NVL 4931 nuclear VCP-like 0.76 0.009 1.20 0.038 964 NXF1 10482 nuclear RNA export factor 1 0.79 0.025 0.43 0.003 965 NXF3 56000 nuclear RNA export factor 3 0.81 0.038 1.26 0.033 966 NXT2 55916 nuclear transport factor 2-like export 0.79 0.019 1.80 0.013 factor 2 967 OGT 8473 O-linked N-acetylglucosamine 0.78 0.017 0.56 0.002 (GlcNAc) transferase 968 OMD 4958 osteomodulin 0.80 0.024 0.74 0.038 969 OR5I1 10798 olfactory receptor, family 5, subfamily 0.78 0.014 0.79 0.035 I, member 1 970 OR7E47P 26628 olfactory receptor, family 7, subfamily 0.79 0.025 1.27 0.030 E, member 47 pseudogene 971 ORAI3 93129 ORAI calcium release-activated 0.77 0.006 0.46 0.002 calcium modulator 3 972 ORC4 5000 origin recognition complex, subunit 4 0.78 0.013 1.55 0.036 973 ORC5 5001 origin recognition complex, subunit 5 0.77 0.011 1.86 0.021 974 ORMDL2 29095 ORMDL sphingolipid biosynthesis 0.77 0.010 2.27 0.000 regulator 2 975 OS9 10956 osteosarcoma amplified 9, endoplasmic 0.80 0.032 0.53 0.037 reticulum lectin 976 OSBPL10 114884 oxysterol binding protein-like 10 0.81 0.046 0.57 0.022 977 OXR1 55074 oxidation resistance 1 0.82 0.044 1.50 0.012 978 P2RY2 5029 purinergic receptor P2Y, G-protein 0.80 0.031 1.19 0.049 coupled, 2 979 PA2G4 5036 proliferation-associated 2G4, 38 kDa 0.82 0.043 2.15 0.007 980 PAFAH1B3 5050 platelet-activating factor 0.77 0.012 1.98 0.000 acetylhydrolase 1b, catalytic subunit 3 (29 kDa) 981 PALM 5064 paralemmin 0.79 0.013 0.55 0.031 982 PALMD 54873 palmdelphin 0.81 0.045 0.74 0.041 983 PANX1 24145 pannexin 1 0.78 0.011 2.19 0.021 984 PARL 55486 presenilin associated, rhomboid-like 0.78 0.014 2.17 0.016 985 PARPBP 55010 PARP1 binding protein 0.79 0.022 1.45 0.017 986 PAX7 5081 paired box 7 0.77 0.014 1.60 0.004 987 PBK 55872 PDZ binding kinase 0.78 0.012 1.55 0.001 988 PCDHB17 54661 protocadherin beta 17 pseudogene 0.80 0.027 1.32 0.027 989 PCNXL2 80003 pecanex-like 2 (Drosophila) 0.81 0.049 0.53 0.006 990 PCSK1N 27344 proprotein convertase subtilisin/kexin 0.80 0.026 1.22 0.032 type 1 inhibitor 991 PCSK5 5125 proprotein convertase subtilisin/kexin 0.81 0.038 0.66 0.037 type 5 992 PCTP 58488 phosphatidylcholine transfer protein 0.77 0.011 1.17 0.046 993 PDAP1 11333 PDGFA associated protein 1 0.82 0.040 1.77 0.036 994 PDCD10 11235 programmed cell death 10 0.81 0.033 1.80 0.029 995 PDCD5 9141 programmed cell death 5 0.78 0.010 2.16 0.001 996 PDCL 5082 phosducin-like 0.77 0.014 2.29 0.008 997 PDE2A 5138 phosphodiesterase 2A, cGMP- 0.79 0.025 0.77 0.012 stimulated 998 PDE6D 5147 phosphodiesterase 6D, cGMP-specific, 0.78 0.013 1.38 0.039 rod, delta 999 PDGFD 80310 platelet derived growth factor D 0.81 0.031 0.60 0.003 1000 PDHA1 5160 pyruvate dehydrogenase (lipoamide) 0.77 0.009 3.34 0.001 alpha 1 1001 PDHX 8050 pyruvate dehydrogenase complex, 0.80 0.025 1.60 0.032 component X 1002 PDLIM1 9124 PDZ and LIM domain 1 0.75 0.010 0.69 0.005 1003 PDZK1 5174 PDZ domain containing 1 0.80 0.027 0.86 0.018 1004 PEX13 5194 peroxisomal biogenesis factor 13 0.77 0.015 1.33 0.039 1005 PEX5L 51555 peroxisomal biogenesis factor 5-like 0.80 0.028 0.80 0.020 1006 PFDN1 5201 prefoldin subunit 1 0.76 0.013 2.20 0.007 1007 PFDN2 5202 prefoldin subunit 2 0.76 0.008 1.94 0.002 1008 PFDN4 5203 prefoldin subunit 4 0.80 0.029 1.48 0.025 1009 PGAM1 5223 phosphoglycerate mutase 1 (brain) 0.80 0.032 1.74 0.048 1010 PGK1 5230 phosphoglycerate kinase 1 0.79 0.020 2.35 0.001 1011 PGM3 5238 phosphoglucomutase 3 0.79 0.016 1.50 0.031 1012 PHB 5245 prohibitin 0.78 0.015 1.53 0.016 1013 PHF20L1 51105 PHD finger protein 20-like 1 0.81 0.034 1.84 0.011 1014 PHKA2 5256 phosphorylase kinase, alpha 2 (liver) 0.80 0.022 0.48 0.021 1015 PHKG2 5261 phosphorylase kinase, gamma 2 (testis) 0.78 0.009 0.56 0.009 1016 PHTF2 57157 putative homeodomain transcription 0.79 0.014 1.68 0.011 factor 2 1017 PI15 51050 peptidase inhibitor 15 0.79 0.015 0.76 0.006 1018 PIGL 9487 phosphatidylinositol glycan anchor 0.77 0.009 0.62 0.042 biosynthesis, class L 1019 PIK3CA 5290 phosphatidylinositol-4,5-bisphosphate 0.79 0.015 1.48 0.027 3-kinase, catalytic subunit alpha 1020 PIK3CB 5291 phosphatidylinositol-4,5-bisphosphate 0.79 0.019 1.80 0.009 3-kinase, catalytic subunit beta 1021 PIK3R4 30849 phosphoinositide-3-kinase, regulatory 0.78 0.015 1.90 0.019 subunit 4 1022 PIN1 5300 peptidylprolyl cis/trans isomerase, 0.75 0.006 1.26 0.010 NIMA-interacting 1 1023 PIN1P1 5301 peptidylprolyl cis/trans isomerase, 0.78 0.013 1.31 0.013 NIMA-interacting 1 pseudogene 1 1024 PIN4 5303 protein (peptidylprolyl cis/trans 0.79 0.025 2.08 0.012 isomerase) NIMA-interacting, 4 (parvulin) 1025 PIP 5304 prolactin-induced protein 0.80 0.035 0.87 0.003 1026 PIP4K2C 79837 phosphatidylinositol-5-phosphate 4- 0.79 0.023 1.79 0.011 kinase, type II, gamma 1027 PIPOX 51268 pipecolic acid oxidase 0.81 0.036 1.45 0.030 1028 PIR 8544 pirin (iron-binding nuclear protein) 0.78 0.012 1.47 0.004 1029 PITRM1 10531 pitrilysin metallopeptidase 1 0.80 0.019 1.93 0.030 1030 PITX1 5307 paired-like homeodomain 1 0.80 0.031 1.15 0.046 1031 PKP4 8502 plakophilin 4 0.80 0.028 0.54 0.020 1032 PLA2G12A 81579 phospholipase A2, group XIIA 0.81 0.049 2.68 0.000 1033 PLA2G7 7941 phospholipase A2, group VII (platelet- 0.76 0.004 1.39 0.012 activating factor acetylhydrolase, plasma) 1034 PLAA 9373 phospholipase A2-activating protein 0.77 0.012 1.61 0.028 1035 PLAT 5327 plasminogen activator, tissue 0.82 0.045 0.81 0.050 1036 PLAUR 5329 plasminogen activator, urokinase 0.79 0.022 1.53 0.031 receptor 1037 PLEKHF2 79666 pleckstrin homology domain 0.80 0.035 1.57 0.003 containing, family F (with FYVE domain) member 2 1038 PLEKHG3 26030 pleckstrin homology domain 0.82 0.036 0.60 0.018 containing, family G (with RhoGef domain) member 3 1039 PLIN2 123 perilipin 2 0.75 0.005 1.43 0.006 1040 PLK1 5347 polo-like kinase 1 0.81 0.037 1.53 0.020 1041 PLK4 10733 polo-like kinase 4 0.78 0.021 1.34 0.048 1042 PLLP 51090 plasmolipin 0.79 0.021 0.60 0.041 1043 PLSCR3 57048 phospholipid scramblase 3 0.77 0.012 0.55 0.009 1044 PLSCR4 57088 phospholipid scramblase 4 0.82 0.047 0.52 0.000 1045 PMEL 6490 premelanosome protein 0.77 0.010 0.71 0.008 1046 PMP22 5376 peripheral myelin protein 22 0.82 0.043 0.71 0.011 1047 PMS2P8 729299 postmeiotic segregation increased 2 0.77 0.011 0.62 0.017 pseudogene 8 1048 PNISR 25957 PNN-interacting serine/arginine-rich 0.80 0.036 0.69 0.021 protein 1049 PNLIPRP1 5407 pancreatic lipase-related protein 1 0.77 0.013 0.74 0.022 1050 PNMA2 10687 paraneoplastic Ma antigen 2 0.78 0.014 0.67 0.010 1051 PODNL1 79883 podocan-like 1 0.77 0.009 0.74 0.002 1052 PODXL2 50512 podocalyxin-like 2 0.77 0.007 1.38 0.000 1053 POLA1 5422 polymerase (DNA directed), alpha 1, 0.79 0.017 1.91 0.018 catalytic subunit 1054 POLA2 23649 polymerase (DNA directed), alpha 2, 0.74 0.006 1.41 0.010 accessory subunit 1055 POLD4 57804 polymerase (DNA-directed), delta 4, 0.76 0.008 1.37 0.002 accessory subunit 1056 POLR2A 5430 polymerase (RNA) II (DNA directed) 0.80 0.028 0.55 0.009 polypeptide A, 220 kDa 1057 POLR2B 5431 polymerase (RNA) II (DNA directed) 0.79 0.021 2.50 0.011 polypeptide B, 140 kDa 1058 POLR2J4 84820 polymerase (RNA) II (DNA directed) 0.80 0.019 0.61 0.038 polypeptide J4, pseudogene 1059 POLR2K 5440 polymerase (RNA) II (DNA directed) 0.78 0.017 1.85 0.000 polypeptide K, 7.0 kDa 1060 POM121L9P 29774 POM121 transmembrane nucleoporin- 0.81 0.034 0.79 0.047 like 9, pseudogene 1061 POMP 51371 proteasome maturation protein 0.81 0.033 2.13 0.022 1062 PON2 5445 paraoxonase 2 0.77 0.017 0.66 0.045 1063 POP1 10940 processing of precursor 1, ribonuclease 0.81 0.036 1.54 0.012 P/MRP subunit (S. cerevisiae) 1064 POP7 10248 processing of precursor 7, ribonuclease 0.81 0.030 2.40 0.000 P/MRP subunit (S. cerevisiae)
1065 POU2F3 25833 POU class 2 homeobox 3 0.78 0.014 0.79 0.010 1066 PP14571 100130449 uncharacterized LOC100130449 0.81 0.045 1.18 0.033 1067 PPA2 27068 pyrophosphatase (inorganic) 2 0.78 0.017 1.58 0.046 1068 PPEF1 5475 protein phosphatase, EF-hand calcium 0.82 0.050 1.55 0.035 binding domain 1 1069 PPIEL 728448 peptidylprolyl isomerase E-like 0.81 0.030 0.71 0.011 pseudogene 1070 PPL 5493 periplakin 0.76 0.006 0.64 0.001 1071 PPP1CA 5499 protein phosphatase 1, catalytic 0.76 0.010 1.45 0.008 subunit, alpha isozyme 1072 PPP1R12B 4660 protein phosphatase 1, regulatory 0.78 0.015 0.42 0.004 subunit 12B 1073 PPP1R14B 26472 protein phosphatase 1, regulatory 0.79 0.022 1.73 0.009 (inhibitor) subunit 14B 1074 PPP1R2 5504 protein phosphatase 1, regulatory 0.79 0.021 1.60 0.044 (inhibitor) subunit 2 1075 PPP2R3C 55012 protein phosphatase 2, regulatory 0.78 0.014 1.91 0.033 subunit B'', gamma 1076 PPP3CA 5530 protein phosphatase 3, catalytic 0.82 0.039 1.52 0.020 subunit, alpha isozyme 1077 PPP3CB 5532 protein phosphatase 3, catalytic 0.80 0.024 1.69 0.048 subunit, beta isozyme 1078 PPRC1 23082 peroxisome proliferator-activated 0.81 0.031 1.95 0.020 receptor gamma, coactivator-related 1 1079 PQLC1 80148 PQ loop repeat containing 1 0.79 0.016 0.45 0.002 1080 PRAME 23532 preferentially expressed antigen in 0.82 0.049 1.21 0.032 melanoma 1081 PRC1 9055 protein regulator of cytokinesis 1 0.79 0.019 1.82 0.000 1082 PRDM10 56980 PR domain containing 10 0.79 0.011 0.42 0.020 1083 PRDX4 10549 peroxiredoxin 4 0.78 0.010 2.00 0.000 1084 PREP 5550 prolyl endopeptidase 0.79 0.016 2.04 0.005 1085 PRH1 5554 proline-rich protein HaeIII subfamily 1 0.76 0.011 1.79 0.003 1086 PRICKLE4 29964 prickle homolog 4 (Drosophila) 0.79 0.024 1.91 0.019 1087 PRIM1 5557 primase, DNA, polypeptide 1 (49 kDa) 0.80 0.035 2.44 0.000 1088 PRKCD 5580 protein kinase C, delta 0.79 0.024 1.38 0.022 1089 PRKCI 5584 protein kinase C, iota 0.79 0.014 2.45 0.003 1090 PRMT1 3276 protein arginine methyltransferase 1 0.80 0.029 1.64 0.044 1091 PRO2012 55478 uncharacterized protein PRO2012 0.77 0.011 0.86 0.045 1092 PROC 5624 protein C (inactivator of coagulation 0.79 0.019 0.73 0.042 factors Va and VIIIa) 1093 PROL1 58503 proline rich, lacrimal 1 0.81 0.032 0.74 0.010 1094 PRPF18 8559 pre-mRNA processing factor 18 0.82 0.037 2.09 0.017 1095 PRPF4 9128 pre-mRNA processing factor 4 0.74 0.008 1.81 0.025 1096 PRR14 78994 proline rich 14 0.80 0.021 0.51 0.029 1097 PSMA1 5682 proteasome (prosome, macropain) 0.77 0.009 2.33 0.005 subunit, alpha type, 1 1098 PSMA2 5683 proteasome (prosome, macropain) 0.78 0.010 1.94 0.010 subunit, alpha type, 2 1099 PSMA3 5684 proteasome (prosome, macropain) 0.75 0.005 1.74 0.010 subunit, alpha type, 3 1100 PSMA4 5685 proteasome (prosome, macropain) 0.78 0.007 2.27 0.009 subunit, alpha type, 4 1101 PSMA7 5688 proteasome (prosome, macropain) 0.79 0.020 1.69 0.006 subunit, alpha type, 7 1102 PSMB3 5691 proteasome (prosome, macropain) 0.80 0.033 1.70 0.003 subunit, beta type, 3 1103 PSMB5 5693 proteasome (prosome, macropain) 0.77 0.016 2.13 0.002 subunit, beta type, 5 1104 PSMB7 5695 proteasome (prosome, macropain) 0.78 0.010 1.93 0.011 subunit, beta type, 7 1105 PSMC3 5702 proteasome (prosome, macropain) 26S 0.82 0.032 1.56 0.022 subunit, ATPase, 3 1106 PSMC3IP 29893 PSMC3 interacting protein 0.78 0.018 0.69 0.039 1107 PSMC6 5706 proteasome (prosome, macropain) 26S 0.78 0.016 1.58 0.031 subunit, ATPase, 6 1108 PSMD10 5716 proteasome (prosome, macropain) 26S 0.77 0.007 2.27 0.001 subunit, non-ATPase, 10 1109 PSMD12 5718 proteasome (prosome, macropain) 26S 0.79 0.018 1.93 0.003 subunit, non-ATPase, 12 1110 PSMD14 10213 proteasome (prosome, macropain) 26S 0.78 0.012 2.24 0.005 subunit, non-ATPase, 14 1111 PSMD2 5708 proteasome (prosome, macropain) 26S 0.80 0.025 2.42 0.001 subunit, non-ATPase, 2 1112 PSMD3 5709 proteasome (prosome, macropain) 26S 0.78 0.015 1.34 0.012 subunit, non-ATPase, 3 1113 PSMD4 5710 proteasome (prosome, macropain) 26S 0.80 0.025 1.79 0.032 subunit, non-ATPase, 4 1114 PSMD6 9861 proteasome (prosome, macropain) 26S 0.80 0.019 2.09 0.013 subunit, non-ATPase, 6 1115 PSMD7 5713 proteasome (prosome, macropain) 26S 0.78 0.010 2.22 0.003 subunit, non-ATPase, 7 1116 PTBP3 9991 polypyrimidine tract binding protein 3 0.81 0.033 1.59 0.035 1117 PTCH1 5727 patched 1 0.81 0.035 0.58 0.013 1118 PTGER3 5733 prostaglandin E receptor 3 (subtype 0.81 0.026 0.73 0.020 EP3) 1119 PTK2 5747 protein tyrosine kinase 2 0.81 0.043 1.50 0.021 1120 PTN 5764 pleiotrophin 0.78 0.012 0.64 0.002 1121 PTPN18 26469 protein tyrosine phosphatase, non- 0.82 0.042 0.55 0.050 receptor type 18 (brain-derived) 1122 PTPRD 5789 protein tyrosine phosphatase, receptor 0.80 0.033 0.62 0.013 type, D 1123 PTPRF 5792 protein tyrosine phosphatase, receptor 0.78 0.013 0.62 0.040 type, F 1124 PTPRT 11122 protein tyrosine phosphatase, receptor 0.82 0.047 0.85 0.041 type, T 1125 PTPRZ1 5803 protein tyrosine phosphatase, receptor- 0.79 0.021 0.83 0.014 type, Z polypeptide 1 1126 PTRF 284119 polymerase I and transcript release 0.81 0.030 0.73 0.043 factor 1127 PTRH2 51651 peptidyl-tRNA hydrolase 2 0.77 0.015 1.66 0.001 1128 PTS 5805 6-pyruvoyltetrahydropterin synthase 0.80 0.026 1.89 0.022 1129 PTTG1 9232 pituitary tumor-transforming 1 0.80 0.017 2.08 0.000 1130 PTTG3P 26255 pituitary tumor-transforming 3, 0.76 0.012 1.50 0.002 pseudogene 1131 PURA 5813 purine-rich element binding protein A 0.81 0.045 0.59 0.041 1132 PURG 29942 purine-rich element binding protein G 0.79 0.023 0.80 0.013 1133 PWP1 11137 PWP1 homolog (S. cerevisiae) 0.79 0.020 2.10 0.022 1134 PYCRL 65263 pyrroline-5-carboxylate reductase-like 0.80 0.031 1.19 0.032 1135 QPCT 25797 glutaminyl-peptide cyclotransferase 0.82 0.029 1.36 0.002 1136 RAB11A 8766 RAB11A, member RAS oncogene 0.80 0.022 1.79 0.046 family 1137 RAB11FIP1 80223 RAB11 family interacting protein 1 0.81 0.042 1.27 0.018 (class I) 1138 RAB26 25837 RAB26, member RAS oncogene 0.77 0.009 0.65 0.043 family 1139 RABIF 5877 RAB interacting factor 0.79 0.030 2.38 0.002 1140 RACGAP1 29127 Rac GTPase activating protein 1 0.77 0.013 1.75 0.000 1141 RAD23A 5886 RAD23 homolog A (S. cerevisiae) 0.79 0.014 1.96 0.002 1142 RAD23B 5887 RAD23 homolog B (S. cerevisiae) 0.76 0.009 1.84 0.016 1143 RAD51AP1 10635 RAD51 associated protein 1 0.80 0.015 1.46 0.007 1144 RAD51C 5889 RAD51 paralog C 0.77 0.015 1.42 0.047 1145 RAD54B 25788 RAD54 homolog B (S. cerevisiae) 0.78 0.021 1.63 0.001 1146 RAG2 5897 recombination activating gene 2 0.81 0.034 0.88 0.027 1147 RAI2 10742 retinoic acid induced 2 0.82 0.043 0.82 0.037 1148 RALA 5898 v-ral simian leukemia viral oncogene 0.77 0.007 2.50 0.000 homolog A (ras related) 1149 RAMP3 10268 receptor (G protein-coupled) activity 0.82 0.044 0.72 0.049 modifying protein 3 1150 RANBP1 5902 RAN binding protein 1 0.79 0.021 1.53 0.033 1151 RANBP9 10048 RAN binding protein 9 0.82 0.043 1.59 0.033 1152 RAP1GDS1 5910 RAP1, GTP-GDP dissociation 0.78 0.018 1.57 0.009 stimulator 1 1153 RAP2A 5911 RAP2A, member of RAS oncogene 0.78 0.011 1.65 0.020 family 1154 RASL12 51285 RAS-like, family 12 0.80 0.032 0.58 0.003 1155 RASSF9 9182 Ras association (RalGDS/AF-6) 0.81 0.040 0.78 0.017 domain family (N-terminal) member 9 1156 RBM3 5935 RNA binding motif (RNP1, RRM) 0.78 0.016 0.48 0.012 protein 3 1157 RBM5 10181 RNA binding motif protein 5 0.80 0.029 0.47 0.001 1158 RBPMS 11030 RNA binding protein with multiple 0.77 0.008 0.62 0.002 splicing 1159 RBX1 9978 ring-box 1, E3 ubiquitin protein ligase 0.76 0.012 1.57 0.018 1160 RC3H2 54542 ring finger and CCCH-type domains 2 0.76 0.003 2.46 0.000 1161 RECQL4 9401 RecQ protein-like 4 0.81 0.040 1.28 0.003 1162 RELN 5649 reelin 0.78 0.017 0.72 0.003 1163 REPS1 85021 RALBP1 associated Eps domain 0.82 0.036 0.79 0.020 containing 1 1164 RERE 473 arginine-glutamic acid dipeptide (RE) 0.78 0.016 0.47 0.008 repeats 1165 RFC2 5982 replication factor C (activator 1) 2, 0.78 0.012 1.74 0.014 40 kDa 1166 RFC4 5984 replication factor C (activator 1) 4, 0.78 0.014 1.83 0.019 37 kDa 1167 RFC5 5985 replication factor C (activator 1) 5, 0.80 0.027 1.91 0.012 36.5 kDa 1168 RFNG 5986 RFNG O-fucosylpeptide 3-beta-N- 0.78 0.014 0.47 0.008 acetylglucosaminyltransferase 1169 RGL1 23179 ral guanine nucleotide dissociation 0.79 0.032 0.56 0.010 stimulator-like 1 1170 RGPD3 84220 RANBP2-like and GRIP domain 0.80 0.029 0.54 0.008 containing 3 1171 RGS5 8490 regulator of G-protein signaling 5 0.81 0.046 0.75 0.021 1172 RHBDD3 25807 rhomboid domain containing 3 0.82 0.043 1.75 0.045 1173 RHBDF1 64285 rhomboid 5 homolog 1 (Drosophila) 0.77 0.005 0.59 0.010 1174 RHOA 387 ras homolog family member A 0.81 0.042 0.48 0.003 1175 RIC3 79608 RIC3 acetylcholine receptor chaperone 0.78 0.014 0.75 0.006 1176 RIOK3 8780 RIO kinase 3 0.79 0.019 0.67 0.029 1177 RIPK2 8767 receptor-interacting serine-threonine 0.80 0.027 1.78 0.022 kinase 2 1178 RIT1 6016 Ras-like without CAAX 1 0.75 0.006 1.91 0.005 1179 RITA1 84934 RBPJ interacting and tubulin 0.76 0.015 1.47 0.037 associated 1 1180 RLN2 6019 relaxin 2 0.77 0.008 0.60 0.000 1181 RMDN1 51115 regulator of microtubule dynamics 1 0.82 0.050 1.61 0.006 1182 RMI1 80010 RecQ mediated genome instability 1 0.81 0.030 1.70 0.009 1183 RNASEH2A 10535 ribonuclease H2, subunit A 0.79 0.022 1.69 0.012 1184 RNASEL 6041 ribonuclease L (2',5'-oligoisoadenylate 0.78 0.019 0.70 0.015 synthetase-dependent) 1185 RNF13 11342 ring finger protein 13 0.75 0.006 2.76 0.001 1186 RNF139 11236 ring finger protein 139 0.77 0.016 2.62 0.000 1187 RNF40 9810 ring finger protein 40, E3 ubiquitin 0.79 0.015 0.52 0.014 protein ligase 1188 RNF41 10193 ring finger protein 41, E3 ubiquitin 0.78 0.015 1.24 0.041 protein ligase 1189 RNF6 6049 ring finger protein (C3H2C3 type) 6 0.80 0.020 1.49 0.050 1190 RNF7 9616 ring finger protein 7 0.78 0.025 2.00 0.014 1191 RNU86 6122 RNA, U86 small nucleolar 0.79 0.020 0.55 0.014 1192 ROBO1 6091 roundabout, axon guidance receptor, 0.79 0.014 1.28 0.048 homolog 1 (Drosophila) 1193 ROPN1B 152015 rhophilin associated tail protein 1B 0.80 0.026 0.80 0.035 1194 RORC 6097 RAR-related orphan receptor C 0.80 0.020 0.67 0.033 1195 RPA2 6118 replication protein A2, 32 kDa 0.76 0.013 0.47 0.009 1196 RPAP3 79657 RNA polymerase II associated protein 0.78 0.015 1.68 0.016 3 1197 SNORA70 26778 small nucleolar RNA, H/ACA box 70 0.80 0.026 0.49 0.006 1198 RPL12 6136 ribosomal protein L12 0.81 0.043 0.58 0.018 1199 SNORD68 606500 small nucleolar RNA, C/D box 68 0.80 0.034 0.61 0.023 1200 RPL13AP5 26816 ribosomal protein L13a pseudogene 5 0.77 0.014 0.41 0.001 1201 RPL13A 23521 ribosomal protein L13a 0.81 0.046 0.62 0.008 1202 RPL17 6139 ribosomal protein L17 0.81 0.036 0.76 0.010 1203 RPL22 6146 ribosomal protein L22 0.78 0.018 0.59 0.033 1204 RPL23A 6147 ribosomal protein L23a 0.76 0.007 0.52 0.006 1205 SNORD42A 26809 small nucleolar RNA, C/D box 42A 0.75 0.006 0.36 0.001 1206 RPL27 6155 ribosomal protein L27 0.70 0.001 0.27 0.000 1207 SNORA45A 619562 small nucleolar RNA, H/ACA box 45A 0.78 0.016 0.36 0.001 1208 RPL29 6159 ribosomal protein L29 0.79 0.020 0.48 0.005 1209 RPL3 6122 ribosomal protein L3 0.75 0.008 0.42 0.000 1210 RPL31 6160 ribosomal protein L31 0.78 0.021 0.39 0.000
1211 RPL32 6161 ribosomal protein L32 0.80 0.027 0.40 0.002 1212 RPL34 6164 ribosomal protein L34 0.82 0.043 0.56 0.003 1213 RPL36 25873 ribosomal protein L36 0.82 0.047 0.59 0.010 1214 RPL37A 6168 ribosomal protein L37a 0.72 0.003 0.39 0.001 1215 RPL38 6169 ribosomal protein L38 0.77 0.008 0.45 0.006 1216 RPL39 6170 ribosomal protein L39 0.74 0.005 0.26 0.000 1217 RPL41 6171 ribosomal protein L41 0.72 0.003 0.29 0.000 1218 SNORD21 6125 small nucleolar RNA, C/D box 21 0.78 0.018 0.53 0.004 1219 RPL6 6128 ribosomal protein L6 0.76 0.009 0.42 0.004 1220 RPL7 6129 ribosomal protein L7 0.78 0.012 0.55 0.013 1221 SNORD36B 26820 small nucleolar RNA, C/D box 36B 0.80 0.029 0.49 0.005 1222 RPL9 6133 ribosomal protein L9 0.75 0.006 0.46 0.004 1223 RPLP0 6175 ribosomal protein, large, P0 0.78 0.014 0.55 0.028 1224 RPLP1 6176 ribosomal protein, large, P1 0.76 0.010 0.32 0.000 1225 SNORA52 619565 small nucleolar RNA, H/ACA box 52 0.81 0.034 0.42 0.000 1226 RPP21 56658 ribonuclease P/MRP 21 kDa subunit 0.78 0.017 2.31 0.004 1227 RPP40 10799 ribonuclease P/MRP 40 kDa subunit 0.79 0.022 2.20 0.012 1228 RPS10 6204 ribosomal protein S10 0.79 0.020 0.56 0.012 1229 RPS11 6205 ribosomal protein S11 0.81 0.040 0.34 0.001 1230 RPS14 6208 ribosomal protein S14 0.77 0.016 0.29 0.000 1231 RPS15 6209 ribosomal protein S15 0.80 0.028 0.39 0.001 1232 RPS16 6217 ribosomal protein S16 0.81 0.038 0.45 0.004 1233 RPS18 6222 ribosomal protein S18 0.75 0.007 0.40 0.001 1234 RPS2 6187 ribosomal protein S2 0.76 0.007 0.34 0.000 1235 RPS20 6224 ribosomal protein S20 0.77 0.012 0.56 0.019 1236 RPS21 6227 ribosomal protein S21 0.79 0.019 0.54 0.014 1237 RPS23 6228 ribosomal protein S23 0.72 0.002 0.24 0.000 1238 RPS24 6229 ribosomal protein S24 0.79 0.022 0.56 0.037 1239 RPS25 6230 ribosomal protein S25 0.80 0.042 0.30 0.000 1240 RPS27 6232 ribosomal protein S27 0.78 0.014 0.34 0.000 1241 RPS27A 6233 ribosomal protein S27a 0.80 0.035 0.47 0.000 1242 RPS28 6234 ribosomal protein S28 0.74 0.004 0.51 0.001 1243 RPS29 6235 ribosomal protein S29 0.78 0.023 0.31 0.000 1244 RPS2P45 80052 ribosomal protein S2 pseudogene 45 0.78 0.009 0.83 0.008 1245 RPS3 6188 ribosomal protein S3 0.79 0.017 0.61 0.006 1246 RPS3A 6189 ribosomal protein S3A 0.74 0.006 0.38 0.000 1247 RPS4X 6191 ribosomal protein S4, X-linked 0.75 0.007 0.42 0.001 1248 RPS6 6194 ribosomal protein S6 0.75 0.009 0.43 0.000 1249 RPS6KA2 6196 ribosomal protein S6 kinase, 90 kDa, 0.79 0.030 0.59 0.044 polypeptide 2 1250 RPS6KB1 6198 ribosomal protein S6 kinase, 70 kDa, 0.81 0.029 1.45 0.048 polypeptide 1 1251 RPS6KC1 26750 ribosomal protein S6 kinase, 52 kDa, 0.78 0.008 3.11 0.000 polypeptide 1 1252 RPS 6202 ribosomal protein S8 0.74 0.006 0.58 0.004 1253 RRM2 6241 ribonucleotide reductase M2 0.77 0.010 1.50 0.004 1254 RRN3P1 730092 RNA polymerase I transcription factor 0.79 0.014 0.60 0.005 homolog (S. cerevisiae) pseudogene 1 1255 RRP15 51018 ribosomal RNA processing 15 0.76 0.010 1.61 0.009 homolog (S. cerevisiae) 1256 RRP7A 27341 ribosomal RNA processing 7 homolog 0.77 0.015 1.43 0.034 A (S. cerevisiae) 1257 RRP7B 91695 ribosomal RNA processing 7 homolog 0.76 0.008 0.53 0.002 B (S. cerevisiae) 1258 RSAD2 91543 radical S-adenosyl methionine domain 0.74 0.003 1.40 0.007 containing 2 1259 RSF1 51773 remodeling and spacing factor 1 0.81 0.035 1.35 0.032 1260 RTCA 8634 RNA 3'-terminal phosphate cyclase 0.77 0.010 1.50 0.036 1261 RUFY1 80230 RUN and FYVE domain containing 1 0.78 0.016 0.40 0.028 1262 RUFY2 55680 RUN and FYVE domain containing 2 0.80 0.024 0.73 0.005 1263 RUNX1T1 862 runt-related transcription factor 1; 0.77 0.014 0.61 0.019 translocated to, 1 (cyclin D-related) 1264 S100P 6286 S100 calcium binding protein P 0.81 0.028 1.24 0.000 1265 SAFB2 9667 scaffold attachment factor B2 0.80 0.031 0.55 0.034 1266 SALL2 6297 spalt-like transcription factor 2 0.79 0.017 0.63 0.029 1267 SAMHD1 25939 SAM domain and HD domain 1 0.74 0.003 1.46 0.022 1268 SAR1B 51128 secretion associated, Ras related 0.78 0.011 1.46 0.024 GTPase 1B 1269 SCFD1 23256 sec1 family domain containing 1 0.75 0.004 3.31 0.000 1270 SCN4A 6329 sodium channel, voltage-gated, type 0.81 0.029 1.34 0.036 IV, alpha subunit 1271 SCUBE2 57758 signal peptide, CUB domain, EGF-like 0.82 0.033 0.87 0.043 2 1272 SDF2L1 23753 stromal cell-derived factor 2-like 1 0.77 0.013 1.49 0.033 1273 SDS 10993 serine dehydratase 0.81 0.038 1.59 0.026 1274 SEC24D 9871 SEC24 family member D 0.75 0.007 1.95 0.005 1275 SEC31B 25956 SEC31 homolog B (S. cerevisiae) 0.78 0.013 0.72 0.027 1276 SEC61G 23480 Sec61 gamma subunit 0.78 0.019 1.94 0.009 1277 SEC62 7095 SEC62 homolog (S. cerevisiae) 0.77 0.008 2.22 0.001 1278 SELP 6403 selectin P (granule membrane protein 0.75 0.009 0.42 0.000 140 kDa, antigen CD62) 1279 SEMA3G 56920 sema domain, immunoglobulin domain 0.77 0.010 0.41 0.000 (Ig), short basic domain, secreted, (semaphorin) 3G 1280 SEMA6D 80031 sema domain, transmembrane domain 0.76 0.006 0.63 0.001 (TM), and cytoplasmic domain, (semaphorin) 6D 1281 SERPINB8 5271 serpin peptidase inhibitor, clade B 0.80 0.022 1.51 0.023 (ovalbumin), member 8 1282 SESN1 27244 sestrin 1 0.81 0.035 0.38 0.000 1283 SF3B1 23451 splicing factor 3b, subunit 1, 155 kDa 0.79 0.026 0.50 0.023 1284 SFI1 9814 Sfi1 homolog, spindle assembly 0.80 0.018 0.57 0.014 associated (yeast) 1285 SFRP1 6422 secreted frizzled-related protein 1 0.81 0.041 0.64 0.000 1286 SGCB 6443 sarcoglycan, beta (43 kDa dystrophin- 0.78 0.012 1.77 0.006 associated glycoprotein) 1287 SGK2 10110 serum/glucocorticoid regulated kinase 0.73 0.003 0.55 0.003 2 1288 SGSM2 9905 small G protein signaling modulator 2 0.76 0.006 0.54 0.007 1289 SH2B1 25970 SH2B adaptor protein 1 0.72 0.002 0.50 0.000 1290 SH2D3A 10045 SH2 domain containing 3A 0.75 0.007 0.58 0.029 1291 SHC2 25759 SHC (Src homology 2 domain 0.78 0.012 0.61 0.012 containing) transforming protein 2 1292 SHH 6469 sonic hedgehog 0.82 0.048 0.76 0.013 1293 SHMT2 6472 serine hydroxymethyltransferase 2 0.81 0.038 1.63 0.038 (mitochondrial) 1294 SIK3 23387 SIK family kinase 3 0.82 0.049 0.53 0.004 1295 SIN3B 23309 SIN3 transcription regulator family 0.78 0.016 0.48 0.003 member B 1296 SIX1 6495 SIX homeobox 1 0.80 0.028 1.26 0.008 1297 SKA1 220134 spindle and kinetochore associated 0.79 0.025 1.35 0.012 complex subunit 1 1298 SKP1 6500 S-phase kinase-associated protein 1 0.76 0.007 0.46 0.014 1299 SLBP 7884 stem-loop binding protein 0.80 0.036 2.56 0.001 1300 SLC10A3 8273 solute carrier family 10, member 3 0.77 0.012 1.19 0.044 1301 SLC13A1 6561 solute carrier family 13 (sodium/sulfate 0.81 0.038 0.82 0.019 symporter), member 1 1302 SLC19A3 80704 solute carrier family 19 (thiamine 0.79 0.025 0.77 0.015 transporter), member 3 1303 SLC1A5 6510 solute carrier family 1 (neutral amino 0.80 0.024 1.48 0.030 acid transporter), member 5 1304 SLC22A18 5002 solute carrier family 22, member 18 0.80 0.024 0.66 0.012 1305 SLC22A18AS 5003 solute carrier family 22 (organic cation 0.81 0.040 0.71 0.020 transporter), member 18 antisense 1306 SLC22A5 6584 solute carrier family 22 (organic 0.75 0.007 0.51 0.021 cation/camitine transporter), member 5 1307 SLC25A1 6576 solute carrier family 25 (mitochondrial 0.81 0.033 1.57 0.028 carrier; citrate transporter), member 1 1308 SLC25A12 8604 solute carrier family 25 0.81 0.043 0.48 0.011 (aspartate/glutamate carrier), member 12 1309 SLC25A23 79085 solute carrier family 25 (mitochondrial 0.78 0.021 1.54 0.016 carrier; phosphate carrier), member 23 1310 SLC25A32 81034 solute carrier family 25 (mitochondrial 0.81 0.033 1.81 0.004 folate carrier), member 32 1311 SLC25A37 51312 solute carrier family 25 (mitochondrial 0.79 0.016 0.47 0.000 iron transporter), member 37 1312 SLC26A2 1836 solute carrier family 26 (anion 0.80 0.024 1.36 0.045 exchanger), member 2 1313 SLC2A10 81031 solute carrier family 2 (facilitated 0.81 0.036 1.37 0.023 glucose transporter), member 10 1314 SLC2A6 11182 solute carrier family 2 (facilitated 0.77 0.010 1.24 0.035 glucose transporter), member 6 1315 SLC30A9 10463 solute carrier family 30 (zinc 0.78 0.023 2.24 0.005 transporter), member 9 1316 SLC33A1 9197 solute carrier family 33 (acetyl-CoA 0.79 0.020 1.97 0.008 transporter), member 1 1317 SLC35A5 55032 solute carrier family 35, member A5 0.78 0.016 1.55 0.036 1318 SLC35B1 10237 solute carrier family 35, member B1 0.80 0.032 1.85 0.003 1319 SLC35E1 79939 solute carrier family 35, member E1 0.77 0.010 0.78 0.041 1320 SLC35E2 9906 solute carrier family 35, member E2 0.79 0.019 0.53 0.004 1321 SLC35E3 55508 solute carrier family 35, member E3 0.81 0.042 1.37 0.026 1322 SLC35F2 54733 solute carrier family 35, member F2 0.78 0.016 0.60 0.021 1323 SLC37A4 2542 solute carrier family 37 (glucose-6- 0.81 0.035 0.49 0.011 phosphate transporter), member 4 1324 SLC44A1 23446 solute carrier family 44 (choline 0.81 0.034 0.83 0.035 transporter), member 1 1325 SLC4A1AP 22950 solute carrier family 4 (anion 0.80 0.026 2.41 0.034 exchanger), member 1, adaptor protein 1326 SLC6A10P 6535 solute carrier family 6 0.79 0.021 1.25 0.039 (neurotransmitter transporter), member 10, pseudogene 1327 SLC6A5 9152 solute carrier family 6 0.76 0.011 0.78 0.017 (neurotransmitter transporter), member 5 1328 SLC7A10 56301 solute carrier family 7 (neutral amino 0.78 0.018 0.79 0.047 acid transporter light chain, asc system), member 10 1329 SLC7A2 6542 solute carrier family 7 (cationic amino 0.81 0.030 0.85 0.040 acid transporter, y+ system), member 2 1330 SLC7A5 8140 solute carrier family 7 (amino acid 0.81 0.028 1.30 0.015 transporter light chain, L system), member 5 1331 SLC8B1 80024 solute carrier family 8 0.80 0.026 0.59 0.001 (sodium/lithium/calcium exchanger), member B1 1332 SLC9A3 6550 solute carrier family 9, subfamily A 0.77 0.019 1.77 0.002 (NHE3, cation proton antiporter 3), member 3 1333 SLCO2A1 6578 solute carrier organic anion transporter 0.80 0.031 0.57 0.036 family, member 2A1 1334 SMARCA2 6595 SWI/SNF related, matrix associated, 0.79 0.028 0.45 0.002 actin dependent regulator of chromatin, subfamily a, member 2 1335 SMARCE1 6605 SWI/SNF related, matrix associated, 0.81 0.046 1.59 0.032 actin dependent regulator of chromatin, subfamily e, member 1 1336 SMC2 10592 structural maintenance of 0.78 0.011 1.95 0.004 chromosomes 2 1337 SMC4 10051 structural maintenance of 0.80 0.019 1.67 0.007 chromosomes 4 1338 SMC5 23137 structural maintenance of 0.83 0.046 1.77 0.015 chromosomes 5 1339 SMG7-AS1 284649 SMG7 antisense RNA 1 0.77 0.018 1.48 0.009 1340 SMG8 55181 SMG8 nonsense mediated mRNA 0.81 0.037 1.66 0.041 decay factor 1341 SMS 6611 spermine synthase 0.78 0.019 2.13 0.000 1342 SNAI1 6615 snail family zinc finger 1 0.81 0.036 1.34 0.015 1343 SNAP29 9342 synaptosomal-associated protein, 0.80 0.028 1.66 0.020 29 kDa 1344 SNAPC5 10302 small nuclear RNA activating complex, 0.75 0.007 2.12 0.011 polypeptide 5, 19 kDa 1345 TCP1 677812 t-complex 1 0.78 0.014 1.93 0.002 1346 TBRG4 677795 transforming growth factor beta 0.75 0.003 1.37 0.003
regulator 4 1347 SNRNP70 6625 small nuclear ribonucleoprotein 70 kDa 0.76 0.007 0.57 0.005 (U1) 1348 SNRPB2 6629 small nuclear ribonucleoprotein 0.78 0.019 2.17 0.003 polypeptide B 1349 SNRPC 6631 small nuclear ribonucleoprotein 0.78 0.017 2.21 0.007 polypeptide C 1350 SNRPD3 6634 small nuclear ribonucleoprotein D3 0.79 0.024 1.45 0.027 polypeptide 18 kDa 1351 SNX16 64089 sorting nexin 16 0.80 0.029 1.36 0.042 1352 SNX29P2 440352 sorting nexin 29 pseudogene 2 0.79 0.018 0.80 0.000 1353 SON 6651 SON DNA binding protein 0.81 0.045 0.48 0.022 1354 SORBS1 10580 sorbin and SH3 domain containing 1 0.78 0.010 0.54 0.004 1355 SORBS3 10174 sorbin and SH3 domain containing 3 0.80 0.025 0.63 0.048 1356 SORL1 6653 sortilin-related receptor, L(DLR class) 0.80 0.032 0.56 0.005 A repeats containing 1357 SOSTDC1 25928 sclerostin domain containing 1 0.76 0.012 0.76 0.001 1358 SPAG5 10615 sperm associated antigen 5 0.80 0.028 1.34 0.031 1359 SPAG9 9043 sperm associated antigen 9 0.82 0.047 1.85 0.048 1360 SPANXB1 728695 SPANX family, member B1 0.79 0.023 1.15 0.046 1361 SPATA6 54558 spermatogenesis associated 6 0.82 0.037 0.55 0.019 1362 SPEF1 25876 sperm flagellar 1 0.78 0.012 0.61 0.021 1363 SPEN 23013 spen family transcriptional repressor 0.78 0.017 0.29 0.000 1364 SPG11 80208 spastic paraplegia 11 (autosomal 0.81 0.031 0.55 0.020 recessive) 1365 SPG20 23111 spastic paraplegia 20 (Troyer 0.80 0.037 0.57 0.012 syndrome) 1366 SPPL2B 56928 signal peptide peptidase like 2B 0.78 0.012 0.74 0.037 1367 SPSB3 90864 splA/ryanodine receptor domain and 0.74 0.005 0.55 0.012 SOCS box containing 3 1368 SPTA1 6708 spectrin, alpha, erythrocytic 1 0.77 0.010 0.75 0.017 1369 SPTSSA 171546 serine palmitoyltransferase, small 0.80 0.029 1.65 0.027 subunit A 1370 SRP14 6727 signal recognition particle 14 kDa 0.75 0.003 0.24 0.000 (homologous Alu RNA binding protein) 1371 SRP19 6728 signal recognition particle 19 kDa 0.80 0.027 1.97 0.030 1372 SRP54 6729 signal recognition particle 54 kDa 0.79 0.018 1.70 0.029 1373 SRP72 6731 signal recognition particle 72 kDa 0.80 0.036 2.79 0.002 1374 SRPK2 6733 SRSF protein kinase 2 0.82 0.049 1.64 0.029 1375 SRPRB 58477 signal recognition particle receptor, B 0.82 0.046 1.75 0.040 subunit 1376 SRRD 402055 SRR1 domain containing 0.78 0.017 1.57 0.047 1377 SRRM1 10250 serine/arginine repetitive matrix 1 0.82 0.046 0.40 0.004 1378 SRRM2 23524 serine/arginine repetitive matrix 2 0.74 0.004 0.72 0.014 1379 SRSF11 9295 serine/arginine-rich splicing factor 11 0.78 0.017 0.64 0.020 1380 SRSF5 6430 serine/arginine-rich splicing factor 5 0.77 0.008 0.48 0.000 1381 SRSF8 10929 serine/arginine-rich splicing factor 8 0.77 0.011 0.37 0.001 1382 SSB 6741 Sjogren syndrome antigen B 0.79 0.019 2.10 0.009 (autoantigen La) 1383 SSBP1 6742 single-stranded DNA binding protein 0.77 0.013 1.78 0.041 1, mitochondrial 1384 SSNA1 8636 Sjogren syndrome nuclear autoantigen 0.82 0.050 1.86 0.016 1 1385 SSSCA1 10534 Sjogren syndrome/scleroderma 0.76 0.012 1.43 0.005 autoantigen 1 1386 STAG3L3 442578 stromal antigen 3-like 3 0.78 0.011 0.72 0.003 1387 STAMBP 10617 STAM binding protein 0.81 0.035 3.38 0.001 1388 STARD13 90627 StAR-related lipid transfer (START) 0.81 0.034 0.63 0.026 domain containing 13 1389 STARD3 10948 StAR-related lipid transfer (START) 0.77 0.013 1.30 0.035 domain containing 3 1390 STAT5B 6777 signal transducer and activator of 0.76 0.008 0.32 0.001 transcription 5B 1391 STAT6 6778 signal transducer and activator of 0.77 0.016 0.53 0.006 transcription 6, interleukin-4 induced 1392 STAU2 27067 staufen double-stranded RNA binding 0.82 0.048 1.43 0.039 protein 2 1393 STC2 8614 stanniocalcin 2 0.77 0.006 0.81 0.003 1394 STIP1 10963 stress-induced phosphoprotein 1 0.75 0.005 1.52 0.004 1395 STK25 10494 serine/threonine kinase 25 0.80 0.025 0.57 0.039 1396 STK3 6788 serine/threonine kinase 3 0.76 0.012 1.33 0.021 1397 STMN1 3925 stathmin 1 0.78 0.013 1.51 0.041 1398 STRAP 11171 serine/threonine kinase receptor 0.80 0.027 2.50 0.009 associated protein 1399 STXBP1 6812 syntaxin binding protein 1 0.80 0.027 0.66 0.007 1400 SUGCT 79783 succinyl-CoA:glutarate-CoA 0.79 0.022 1.37 0.005 transferase 1401 SULT1A2 6799 sulfotransferase family, cytosolic, 1A, 0.76 0.008 0.63 0.042 phenol-preferring, member 2 1402 SULT4A1 25830 sulfotransferase family 4A, member 1 0.79 0.020 0.80 0.045 1403 SUMO3 6612 small ubiquitin-like modifier 3 0.77 0.009 2.15 0.006 1404 SUPT4H1 6827 suppressor of Ty 4 homolog 1 (S. cerevisiae) 0.79 0.026 1.44 0.042 1405 SUV420H1 51111 suppressor of variegation 4-20 0.82 0.047 1.91 0.008 homolog 1 (Drosophila) 1406 SYNM 23336 synemin, intermediate filament protein 0.81 0.039 0.78 0.032 1407 SYNPO 11346 synaptopodin 0.80 0.030 0.65 0.003 1408 SYT17 51760 synaptotagmin XVII 0.82 0.042 0.85 0.035 1409 SZT2 23334 seizure threshold 2 homolog (mouse) 0.76 0.011 0.55 0.019 1410 TAC1 6863 tachykinin, precursor 1 0.81 0.030 0.84 0.026 1411 TACC3 10460 transforming, acidic coiled-coil 0.75 0.005 1.25 0.013 containing protein 3 1412 TAF1B 9014 TATA box binding protein (TBP)- 0.81 0.036 1.77 0.015 associated factor, RNA polymerase I, B, 63 kDa 1413 TAF1C 9013 TATA box binding protein (TBP)- 0.79 0.026 0.70 0.000 associated factor, RNA polymerase I, C, 110 kDa 1414 TAF2 6873 TAF2 RNA polymerase II, TATA box 0.80 0.027 1.70 0.007 binding protein (TBP)-associated factor, 150 kDa 1415 TAGLN2 8407 transgelin 2 0.82 0.037 1.51 0.019 1416 TALDO1 6888 transaldolase 1 0.77 0.010 1.53 0.024 1417 TARS 6897 threonyl-tRNA synthetase 0.76 0.006 1.77 0.006 1418 TAT 6898 tyrosine aminotransferase 0.77 0.017 0.85 0.032 1419 TAZ 6901 tafazzin 0.78 0.012 0.60 0.042 1420 TBC1D30 23329 TBC1 domain family, member 30 0.81 0.047 1.93 0.011 1421 TBC1D31 93594 TBC1 domain family, member 31 0.77 0.009 1.64 0.006 1422 TBC1D9B 23061 TBC1 domain family, member 9B 0.78 0.014 0.47 0.038 (with GRAM domain) 1423 TBCC 6903 tubulin folding cofactor C 0.76 0.007 1.59 0.022 1424 TBCE 6905 tubulin folding cofactor E 0.82 0.036 1.89 0.005 1425 TBK1 29110 TANK-binding kinase 1 0.81 0.041 2.02 0.043 1426 TBL2 26608 transducin (beta)-like 2 0.80 0.026 1.61 0.049 1427 TBX5 6910 T-box 5 0.81 0.028 0.75 0.040 1428 TCEA1 6917 transcription elongation factor A (SII), 0.81 0.046 1.52 0.025 1 1429 TCEAL2 140597 transcription elongation factor A (SII)- 0.80 0.022 0.81 0.043 like 2 1430 TCEB1 6921 transcription elongation factor B (SIII), 0.80 0.030 1.80 0.000 polypeptide 1 (15 kDa, elongin C) 1431 TCF7 6932 transcription factor 7 (T-cell specific, 0.79 0.020 0.66 0.015 HMG-box) 1432 TCF7L1 83439 transcription factor 7-like 1 (T-cell 0.80 0.023 0.57 0.005 specific, HMG-box) 1433 TCN1 6947 transcobalamin I (vitamin B12 binding 0.80 0.026 0.84 0.037 protein, R binder family) 1434 TCTN1 79600 tectonic family member 1 0.82 0.028 0.59 0.014 1435 TDP2 51567 tyrosyl-DNA phosphodiesterase 2 0.76 0.007 1.61 0.035 1436 TELO2 9894 telomere maintenance 2 0.77 0.009 0.55 0.015 1437 TENC1 23371 tensin like C1 domain containing 0.72 0.002 0.44 0.000 phosphatase (tensin 2) 1438 TERF1 7013 telomeric repeat binding factor 0.82 0.038 1.59 0.030 (NIMA-interacting) 1 1439 TFB2M 64216 transcription factor B2, mitochondrial 0.79 0.016 1.83 0.009 1440 TFDP2 7029 transcription factor Dp-2 (E2F 0.78 0.019 1.51 0.034 dimerization partner 2) 1441 TFEC 22797 transcription factor EC 0.76 0.004 1.43 0.038 1442 TFIP11 24144 tuftelin interacting protein 11 0.76 0.012 1.67 0.042 1443 TFPT 29844 TCF3 (E2A) fusion partner (in 0.75 0.007 1.56 0.011 childhood Leukemia) 1444 TGFB3 7043 transforming growth factor, beta 3 0.80 0.024 0.59 0.011 1445 TGFBR3 7049 transforming growth factor, beta 0.81 0.032 0.63 0.000 receptor III 1446 TGFBRAP1 9392 transforming growth factor, beta 0.81 0.039 0.44 0.030 receptor associated protein 1 1447 TGOLN2 10618 trans-golgi network protein 2 0.78 0.018 0.40 0.007 1448 THNSL2 55258 threonine synthase-like 2 (S. 0.79 0.016 0.56 0.002 cerevisiae) 1449 THSD4 79875 thrombospondin, type I, domain 0.77 0.006 0.72 0.002 containing 4 1450 TIMM17A 10440 translocase of inner mitochondrial 0.77 0.008 2.17 0.001 membrane 17 homolog A (yeast) 1451 TIMM23 100287932 translocase of inner mitochondrial 0.76 0.008 1.78 0.018 membrane 23 homolog (yeast) 1452 TIMM44 10469 translocase of inner mitochondrial 0.78 0.014 1.82 0.026 membrane 44 homolog (yeast) 1453 TIMP2 7077 TIMP metallopeptidase inhibitor 2 0.72 0.007 1.33 0.044 1454 TIPIN 54962 TIMELESS interacting protein 0.79 0.015 1.32 0.010 1455 TIPRL 261726 TOR signaling pathway regulator 0.77 0.010 2.03 0.000 1456 TK1 7083 thymidine kinase 1, soluble 0.80 0.034 1.41 0.030 1457 TLE2 7089 transducin-like enhancer of split 2 0.78 0.012 0.67 0.034 1458 TLE6 79816 transducin-like enhancer of split 6 0.81 0.031 0.64 0.000 1459 TLN2 83660 talin 2 0.82 0.048 0.59 0.044 1460 TLR6 10333 toll-like receptor 6 0.81 0.029 0.79 0.035 1461 TM2D1 83941 TM2 domain containing 1 0.80 0.025 0.53 0.011 1462 TM9SF1 10548 transmembrane 9 superfamily member 0.76 0.012 2.13 0.007 1 1463 TM9SF3 56889 transmembrane 9 superfamily member 0.80 0.023 2.44 0.003 3 1464 TMEM100 55273 transmembrane protein 100 0.81 0.033 0.74 0.003 1465 TMEM106B 54664 transmembrane protein 106B 0.79 0.025 1.53 0.026 1466 TMEM132A 54972 transmembrane protein 132A 0.79 0.033 1.44 0.028 1467 TMEM14A 28978 transmembrane protein 14A 0.78 0.012 1.61 0.022 1468 TMEM165 55858 transmembrane protein 165 0.80 0.028 1.55 0.037 1469 TMEM183A 92703 transmembrane protein 183A 0.77 0.013 2.12 0.002 1470 TMEM184C 55751 transmembrane protein 184C 0.78 0.016 1.79 0.040 1471 TMEM187 8269 transmembrane protein 187 0.80 0.028 1.78 0.009 1472 TMEM194A 23306 transmembrane protein 194A 0.80 0.022 1.59 0.036 1473 TMEM259 91304 transmembrane protein 259 0.80 0.027 0.64 0.038 1474 TMEM33 55161 transmembrane protein 33 0.78 0.014 2.04 0.005 1475 TMEM70 54968 transmembrane protein 70 0.79 0.024 1.72 0.003 1476 TMEM97 27346 transmembrane protein 97 0.80 0.040 1.51 0.004 1477 TMPO 7112 thymopoietin 0.78 0.013 1.62 0.006 1478 TMPRSS3 64699 transmembrane protease, serine 3 0.80 0.036 0.82 0.020 1479 TMPRSS6 164656 transmembrane protease, serine 6 0.78 0.014 0.63 0.009 1480 TMUB2 79089 transmembrane and ubiquitin-like 0.80 0.019 0.52 0.015 domain containing 2 1481 TNFAIP2 7127 tumor necrosis factor, alpha-induced 0.78 0.017 0.70 0.034 protein 2 1482 TNFRSF25 8718 tumor necrosis factor receptor 0.78 0.016 0.66 0.044 superfamily, member 25 1483 TNIK 23043 TRAF2 and NCK interacting kinase 0.80 0.033 0.63 0.040 1484 TNS1 7145 tensin 1 0.77 0.015 0.57 0.001 1485 TNXA 7146 tenascin XA (pseudogene) 0.80 0.028 0.76 0.005 1486 TOMM70A 9868 translocase of outer mitochondrial 0.79 0.036 3.41 0.000 membrane 70 homolog A (S. cerevisiae) 1487 TOP2A 7153 topoisomerase (DNA) II alpha 170 kDa 0.80 0.029 1.51 0.000 1488 TOR1B 27348 torsin family 1, member B (torsin B) 0.79 0.016 3.10 0.001 1489 TP53 7157 tumor protein p53 0.82 0.043 0.58 0.025 1490 TP63 8626 tumor protein p63 0.74 0.006 0.56 0.001 1491 TP73-AS1 57212 TP73 antisense RNA 1 0.79 0.026 0.39 0.003 1492 TPCN1 53373 two pore segment channel 1 0.76 0.009 0.64 0.024 1493 TPRKB 51002 TP53RK binding protein 0.78 0.011 1.77 0.027 1494 TRA2A 29896 transformer 2 alpha homolog 0.78 0.013 0.61 0.035 (Drosophila) 1495 TRAF2 7186 TNF receptor-associated factor 2 0.81 0.032 1.29 0.035 1496 TRAK1 22906 trafficking protein, kinesin binding 1 0.80 0.028 0.57 0.023 1497 TRAM1 23471 translocation associated membrane 0.80 0.035 1.61 0.045 protein 1 1498 TRAPPC2 6399 trafficking protein particle complex 2 0.77 0.012 1.67 0.005
1499 TRIAP1 51499 TP53 regulated inhibitor of apoptosis 1 0.81 0.040 2.38 0.019 1500 TRIM13 10206 tripartite motif containing 13 0.80 0.028 0.44 0.025 1501 TRIM29 23650 tripartite motif containing 29 0.75 0.012 0.70 0.002 1502 TRIP13 9319 thyroid hormone receptor interactor 13 0.80 0.026 1.79 0.003 1503 TRMT12 55039 tRNA methyltransferase 12 homolog 0.80 0.037 2.76 0.000 (S. cerevisiae) 1504 TROVE2 6738 TROVE domain family, member 2 0.80 0.016 2.24 0.001 1505 TRPM2 7226 transient receptor potential cation 0.81 0.042 1.81 0.014 channel, subfamily M, member 2 1506 TSC2 7249 tuberous sclerosis 2 0.79 0.024 0.52 0.000 1507 TSFM 10102 Ts translation elongation factor, 0.82 0.042 1.78 0.029 mitochondrial 1508 TSG101 7251 tumor susceptibility 101 0.78 0.015 1.84 0.021 1509 TSKU 25987 tsukushi, small leucine rich 0.78 0.027 1.24 0.040 proteoglycan 1510 TSPAN7 7102 tetraspanin 7 0.80 0.028 0.73 0.007 1511 TSPYL2 64061 TSPY-like 2 0.78 0.019 0.70 0.018 1512 TSR1 55720 TSR1, 20S rRNA accumulation, 0.78 0.015 0.61 0.013 homolog (S. cerevisiae) 1513 TSSK2 23617 testis-specific serine kinase 2 0.82 0.048 1.66 0.030 1514 TTC12 54970 tetratricopeptide repeat domain 12 0.81 0.041 0.45 0.001 1515 TTC19 54902 tetratricopeptide repeat domain 19 0.78 0.017 0.52 0.022 1516 TTC26 79989 tetratricopeptide repeat domain 26 0.80 0.022 1.47 0.008 1517 TTC28 23331 tetratricopeptide repeat domain 28 0.77 0.009 0.39 0.002 1518 TTI1 9675 TELO2 interacting protein 1 0.80 0.044 1.50 0.035 1519 TTK 7272 TTK protein kinase 0.77 0.006 1.59 0.000 1520 TTLL4 9654 tubulin tyrosine ligase-like family, 0.78 0.016 0.69 0.040 member 4 1521 TUBA4B 80086 tubulin, alpha 4b (pseudogene) 0.76 0.008 0.59 0.001 1522 TUBB 203068 tubulin, beta class I 0.78 0.018 1.75 0.047 1523 TUBB3 10381 tubulin, beta 3 class III 0.81 0.038 1.71 0.022 1524 TUBB4B 10383 tubulin, beta 4B class IVb 0.80 0.026 1.87 0.013 1525 TUBD1 51174 tubulin, delta 1 0.77 0.009 1.64 0.018 1526 TUBG2 27175 tubulin, gamma 2 0.79 0.012 0.59 0.007 1527 TXN 7295 thioredoxin 0.79 0.015 2.82 0.000 1528 TXNDC9 10190 thioredoxin domain containing 9 0.79 0.016 2.97 0.002 1529 TXNL4A 10907 thioredoxin-like 4A 0.79 0.019 1.67 0.033 1530 TXNRD1 7296 thioredoxin reductase 1 0.78 0.013 1.75 0.002 1531 UAP1 6675 UDP-N-acteylglucosamine 0.80 0.030 1.46 0.044 pyrophosphorylase 1 1532 UBA2 10054 ubiquitin-like modifier activating 0.78 0.012 1.93 0.018 enzyme 2 1533 UBB 7314 ubiquitin B 0.82 0.049 0.48 0.033 1534 UBC 7316 ubiquitin C 0.79 0.018 0.42 0.016 1535 UBE2A 7319 ubiquitin-conjugating enzyme E2A 0.82 0.050 1.69 0.048 1536 UBE2C 11065 ubiquitin-conjugating enzyme E2C 0.81 0.041 1.99 0.000 1537 UBE2D3 7323 ubiquitin-conjugating enzyme E2D 3 0.79 0.021 2.52 0.020 1538 UBE2J1 51465 ubiquitin-conjugating enzyme E2, J1 0.77 0.007 1.71 0.050 1539 UBE2K 3093 ubiquitin-conjugating enzyme E2K 0.76 0.006 1.80 0.006 1540 UBE2L3 7332 ubiquitin-conjugating enzyme E2L 3 0.75 0.007 2.67 0.000 1541 UBE2N 7334 ubiquitin-conjugating enzyme E2N 0.79 0.022 2.21 0.001 1542 UBE2S 27338 ubiquitin-conjugating enzyme E2S 0.76 0.008 1.44 0.002 1543 UBE2V2 7336 ubiquitin-conjugating enzyme E2 0.81 0.035 2.11 0.000 variant 2 1544 UBE4B 10277 ubiquitination factor E4B 0.79 0.025 0.48 0.032 1545 UBFD1 56061 ubiquitin family domain containing 1 0.77 0.015 1.71 0.038 1546 UBL4A 8266 ubiquitin-like 4A 0.80 0.024 1.69 0.015 1547 UBL5 59286 ubiquitin-like 5 0.78 0.017 1.86 0.004 1548 UBP1 7342 upstream binding protein 1 (LBP-1a) 0.79 0.017 0.46 0.007 1549 UBQLN2 29978 ubiquilin 2 0.80 0.023 1.83 0.045 1550 UBQLN4 56893 ubiquilin 4 0.74 0.003 0.60 0.002 1551 UBR4 23352 ubiquitin protein ligase E3 component 0.79 0.031 0.44 0.010 n-recognin 4 1552 UCHL1 7345 ubiquitin carboxyl-terminal esterase L1 0.82 0.049 1.38 0.038 (ubiquitin thiolesterase) 1553 UCHL3 7347 ubiquitin carboxyl-terminal esterase L3 0.77 0.007 1.47 0.014 (ubiquitin thiolesterase) 1554 UFD1L 7353 ubiquitin fusion degradation 1 like 0.75 0.005 1.75 0.004 (yeast) 1555 UIMC1 51720 ubiquitin interaction motif containing 1 0.79 0.016 0.34 0.012 1556 UMPS 7372 uridine monophosphate synthetase 0.79 0.021 2.60 0.004 1557 UQCRC2 7385 ubiquinol-cytochrome c reductase core 0.81 0.025 0.47 0.012 protein II 1558 URB2 9816 URB2 ribosome biogenesis 2 homolog 0.81 0.041 1.66 0.024 (S. cerevisiae) 1559 USO1 8615 USO1 vesicle transport factor 0.80 0.023 1.61 0.049 1560 USP18 11274 ubiquitin specific peptidase 18 0.76 0.008 1.29 0.045 1561 USP32 84669 ubiquitin specific peptidase 32 0.77 0.010 1.83 0.002 1562 USP34 9736 ubiquitin specific peptidase 34 0.78 0.013 0.70 0.032 1563 USP46 64854 ubiquitin specific peptidase 46 0.80 0.036 1.75 0.026 1564 USP9X 8239 ubiquitin specific peptidase 9, X-linked 0.79 0.012 2.71 0.007 1565 UTP18 51096 UTP18 small subunit (SSU) 0.79 0.017 1.49 0.034 processome component homolog (yeast) 1566 UTP3 57050 UTP3, small subunit (SSU) 0.79 0.018 1.47 0.033 processome component, homolog (S. cerevisiae) 1567 VAMP1 6843 vesicle-associated membrane protein 1 0.78 0.015 0.58 0.003 (synaptobrevin 1) 1568 VAMP2 6844 vesicle-associated membrane protein 2 0.78 0.015 0.52 0.006 (synaptobrevin 2) 1569 VAMP7 6845 vesicle-associated membrane protein 7 0.80 0.023 1.98 0.011 1570 VBP1 7411 von Hippel-Lindau binding protein 1 0.76 0.006 1.83 0.001 1571 VDAC1 7416 voltage-dependent anion channel 1 0.80 0.033 1.79 0.021 1572 VDAC2 7417 voltage-dependent anion channel 2 0.79 0.016 1.81 0.010 1573 VIM 7431 vimentin 0.81 0.039 0.70 0.018 1574 VIP 7432 vasoactive intestinal peptide 0.80 0.026 0.84 0.035 1575 VIPAS39 63894 VPS33B interacting protein, apical- 0.77 0.010 0.30 0.005 basolateral polarity regulator, spe-39 homolog 1576 VIPR1 7433 vasoactive intestinal peptide receptor 1 0.78 0.010 0.67 0.003 1577 VPS11 55823 vacuolar protein sorting 11 homolog 0.81 0.024 0.46 0.025 (S. cerevisiae) 1578 VPS51 738 vacuolar protein sorting 51 homolog 0.81 0.036 0.64 0.047 (S. cerevisiae) 1579 VPS53 55275 vacuolar protein sorting 53 homolog 0.79 0.017 0.71 0.028 (S. cerevisiae) 1580 VRK1 7443 vaccinia related kinase 1 0.80 0.020 1.47 0.011 1581 VWA1 64856 von Willebrand factor A domain 0.80 0.027 1.32 0.040 containing 1 1582 WASF2 10163 WAS protein family, member 2 0.80 0.038 0.50 0.002 1583 WBSCR22 114049 Williams Beuren syndrome 0.81 0.032 1.84 0.042 chromosome region 22 1584 WDR19 57728 WD repeat domain 19 0.82 0.039 0.60 0.013 1585 WDR26 80232 WD repeat domain 26 0.81 0.030 1.97 0.012 1586 WDR3 10885 WD repeat domain 3 0.80 0.022 1.84 0.029 1587 WDR73 84942 WD repeat domain 73 0.80 0.023 0.53 0.048 1588 WDR78 79819 WD repeat domain 78 0.78 0.014 0.65 0.033 1589 WDTC1 23038 WD and tetratricopeptide repeats 1 0.75 0.005 0.54 0.006 1590 WDYHV1 55093 WDYHV motif containing 1 0.80 0.027 1.81 0.004 1591 WISP3 8838 WNT1 inducible signaling pathway 0.80 0.021 0.84 0.021 protein 3 1592 WSB2 55884 WD repeat and SOCS box containing 2 0.77 0.007 2.73 0.000 1593 XDH 7498 xanthine dehydrogenase 0.76 0.009 0.63 0.009 1594 XPC 7508 xeroderma pigmentosum, 0.78 0.020 0.48 0.010 complementation group C 1595 XPOT 11260 exportin, tRNA 0.76 0.009 1.97 0.001 1596 YIF1A 10897 Yip1 interacting factor homolog A (S. 0.81 0.031 1.63 0.016 cerevisiae) 1597 YIPF6 286451 Yip1 domain family, member 6 0.78 0.018 1.54 0.010 1598 YKT6 10652 YKT6 v-SNARE homolog (S. 0.75 0.009 1.34 0.048 cerevisiae) 1599 YLPM1 56252 YLP motif containing 1 0.80 0.038 0.40 0.016 1600 YTHDF3 253943 YTH domain family, member 3 0.81 0.037 1.91 0.003 1601 ZBTB11 27107 zinc finger and BTB domain 0.78 0.015 1.96 0.017 containing 11 1602 ZBTB16 7704 zinc finger and BTB domain 0.78 0.018 0.73 0.001 containing 16 1603 ZBTB17 7709 zinc finger and BTB domain 0.82 0.046 0.44 0.027 containing 17 1604 ZBTB25 7597 zinc finger and BTB domain 0.78 0.015 0.66 0.048 containing 25 1605 ZC3H15 55854 zinc finger CCCH-type containing 15 0.79 0.010 2.67 0.000 1606 ZFHX3 463 zinc finger homeobox 3 0.79 0.026 1.26 0.028 1607 ZFHX4 79776 zinc finger homeobox 4 0.80 0.031 0.60 0.027 1608 ZFP2 80108 ZFP2 zinc finger protein 0.81 0.029 0.81 0.011 1609 ZFP36L1 677 ZFP36 ring finger protein-like 1 0.77 0.010 0.63 0.001 1610 ZFYVE9 9372 zinc finger, FYVE domain containing 0.79 0.016 0.52 0.009 9 1611 ZNF141 7700 zinc finger protein 141 0.79 0.021 0.85 0.044 1612 ZNF148 7707 zinc finger protein 148 0.80 0.027 1.73 0.022 1613 ZNF160 90338 zinc finger protein 160 0.77 0.008 0.76 0.015 1614 ZNF184 7738 zinc finger protein 184 0.76 0.009 1.44 0.020 1615 ZNF202 7753 zinc finger protein 202 0.81 0.035 0.48 0.042 1616 ZNF204P 7754 zinc finger protein 204, pseudogene 0.80 0.027 0.77 0.006 1617 ZNF213-AS1 100507458 ZNF213 antisense RNA 1 (head to 0.82 0.046 0.79 0.008 head) 1618 ZNF236 7776 zinc finger protein 236 0.73 0.004 0.57 0.018 1619 ZNF286A 57335 zinc finger protein 286A 0.77 0.011 0.79 0.022 1620 ZNF322 79692 zinc finger protein 322 0.75 0.009 1.68 0.031 1621 ZNF385D 79750 zinc finger protein 385D 0.82 0.043 0.82 0.011 1622 ZNF423 23090 zinc finger protein 423 0.82 0.048 0.71 0.017 1623 ZNF446 55663 zinc finger protein 446 0.78 0.012 0.73 0.014 1624 ZNF468 90333 zinc finger protein 468 0.80 0.026 1.54 0.046 1625 ZNF480 147657 zinc finger protein 480 0.80 0.034 1.45 0.047 1626 ZNF500 26048 zinc finger protein 500 0.77 0.005 0.54 0.006 1627 ZNF562 54811 zinc finger protein 562 0.76 0.007 0.52 0.013 1628 ZNF606 80095 zinc finger protein 606 0.80 0.024 1.93 0.005 1629 ZNF611 81856 zinc finger protein 611 0.76 0.008 0.71 0.019 1630 ZNF623 9831 zinc finger protein 623 0.80 0.035 1.94 0.000 1631 ZNF629 23361 zinc finger protein 629 0.76 0.008 0.37 0.010 1632 ZNF706 51123 zinc finger protein 706 0.80 0.030 1.72 0.001 1633 ZNF767P 79970 zinc finger family member 767, 0.77 0.010 0.59 0.031 pseudogene 1634 ZWILCH 55055 zwilch kinetochore protein 0.75 0.006 1.43 0.010 1635 ZWINT 11130 ZW10 interacting kinetochore protein 0.82 0.042 1.46 0.033
[0177] Evaluation on Biological Functions of Prognostic Genes with Increased Prediction Accuracy Through Gene Combinations
[0178] Gene Ontology (GO) analysis was used to investigate any association of the above selected 1,635 genes, which were found to improve such prediction accuracy through their combinatory use with BTN3A2 gene, with biological processes. As a result of GO analysis using relevant GO terms (such as mitotic cell cycle, cell cycle process, mitotic cell cycle phase transition, and so on), it was verified that those 1,635 genes are particularly involved in cell proliferation, as shown in the following Table 4.
TABLE-US-00005 TABLE 4 Gene Ontology (GO) analysis GO Terms--Biological process Nos. of Genes Adjusted p-value mitotic cell cycle 170 8.80E-17 cell cycle process 213 3.90E-16 establishment of protein localization 129 5.70E-16 to organelle ribosome biogenesis 82 2.00E-15 mitotic cell cycle phase transition 106 7.10E-15
[0179] Further, among the 213 cell-proliferation-related genes, it was confirmed via bivariate Cox analysis that a total of 159 genes (159/213, 74.6%), which are named p-genes as described above, were associated with a poor prognosis of breast as shown in the following Table 5, suggesting that each of these 159 p-genes may be used in combination with BTN3A2 gene to increase the accuracy of prognosis prediction of a cancer, particularly a breast cancer.
TABLE-US-00006 TABLE 5 Bivariate Cox analysis on p-genes and BTN3A2 BTN3A2 p-gene Gene p- p- No Symbol Gene ID Gene Name HR value HR value 1 APITD1 378708 apoptosis-inducing, TAF9-like 0.81 0.041 1.86 0.027 domain 1 2 BID 637 BH3 interacting domain death agonist 0.77 0.007 1.72 0.011 3 BUB1B 701 BUB1 mitotic checkpoint 0.80 0.031 1.71 0.002 serine/threonine kinase B 4 BUB1 699 BUB1 mitotic checkpoint 0.78 0.014 1.73 0.005 serine/threonine kinase 5 CKS1B 1163 CDC28 protein kinase regulatory 0.78 0.013 1.52 0.027 subunit 1B 6 CKS2 1164 CDC28 protein kinase regulatory 0.79 0.023 1.55 0.002 subunit 2 7 DLGAP5 9787 discs, large (Drosophila) homolog- 0.75 0.004 1.76 0.000 associated protein 5 8 POLA1 5422 polymerase (DNA directed), alpha 1, 0.79 0.017 1.91 0.018 catalytic subunit 9 POLA2 23649 polymerase (DNA directed), alpha 2, 0.74 0.006 1.41 0.010 accessory subunit 10 DSCC1 79075 DNA replication and sister chromatid 0.80 0.021 1.93 0.000 cohesion 1 11 DNA2 1763 DNA replication helicase/nuclease 2 0.81 0.034 1.49 0.047 12 E2F8 79733 E2F transcription factor 8 0.81 0.025 1.46 0.004 13 ERCC6L 54821 excision repair cross- 0.74 0.003 1.44 0.000 complementation group 6-like 14 FBXO5 26271 F-box protein 5 0.74 0.005 1.49 0.012 15 FANCI 55215 Fanconi anemia, complementation 0.81 0.032 1.49 0.049 group I 16 GADD45GIP1 90480 growth arrest and DNA-damage- 0.77 0.008 1.64 0.002 inducible, gamma interacting protein 1 17 GINS1 9837 GINS complex subunit 1 (Psf1 0.82 0.044 1.42 0.014 homolog) 18 GINS2 51659 GINS complex subunit 2 (Psf2 0.78 0.018 1.18 0.033 homolog) 19 MAD2L1 4085 MAD2 mitotic arrest deficient-like 1 0.77 0.009 1.57 0.001 (yeast) 20 MAD2L1BP 9587 MAD2L1 binding protein 0.79 0.017 2.01 0.021 21 MIS18A 54069 MIS18 kinetochore protein A 0.81 0.029 1.86 0.033 22 MYBL2 4605 v-myb avian myeloblastosis viral 0.77 0.012 1.26 0.010 oncogene homolog-like 2 23 NAA50 80218 N(alpha)-acetyltransferase 50, NatE 0.81 0.030 1.60 0.037 catalytic subunit 24 NEK2 4751 NIMA-related kinase 2 0.80 0.026 1.45 0.003 25 NSL1 25936 NSL1, MIS12 kinetochore complex 0.78 0.015 1.96 0.020 component 26 PBK 55872 PDZ binding kinase 0.78 0.012 1.55 0.001 27 RAB11A 8766 RAB11A, member RAS oncogene 0.80 0.022 1.79 0.046 family 28 RAD51C 5889 RAD51 paralog C 0.77 0.015 1.42 0.047 29 RAD54B 25788 RAD54 homolog B (S. cerevisiae) 0.78 0.021 1.63 0.001 30 RANBP1 5902 RAN binding protein 1 0.79 0.021 1.53 0.033 31 RALA 5898 v-ral simian leukemia viral oncogene 0.77 0.007 2.50 0.000 homolog A (ras related) 32 RACGAP1 29127 Rac GTPase activating protein 1 0.77 0.013 1.75 0.000 33 SSNA1 8636 Sjogren syndrome nuclear 0.82 0.050 1.86 0.016 autoantigen 1 34 STAMBP 10617 STAM binding protein 0.81 0.035 3.38 0.001 35 SSSCA1 10534 Sjogren syndrome/scleroderma 0.76 0.012 1.43 0.005 autoantigen 1 36 TAF2 6873 TAF2 RNA polymerase II, TATA 0.80 0.027 1.70 0.007 box binding protein (TBP)-associated factor, 150 kDa 37 TIPIN 54962 TIMELESS interacting protein 0.79 0.015 1.32 0.010 38 TIPRL 261726 TOR signaling pathway regulator 0.77 0.010 2.03 0.000 39 TRIAP1 51499 TP53 regulated inhibitor of apoptosis 1 0.81 0.040 2.38 0.019 40 TTK 7272 TTK protein kinase 0.77 0.006 1.59 0.000 41 ZWINT 11130 ZW10 interacting kinetochore protein 0.82 0.042 1.46 0.033 42 ASPM 259266 asp (abnormal spindle) homolog, 0.79 0.011 1.32 0.002 microcephaly associated (Drosophila) 43 AURKA 6790 aurora kinase A 0.80 0.024 1.59 0.002 44 AURKB 9212 aurora kinase B 0.81 0.029 1.26 0.044 45 BRD7 29117 bromodomain containing 7 0.76 0.007 1.54 0.021 46 CSNK2A1 1457 casein kinase 2, alpha 1 polypeptide 0.75 0.004 2.13 0.002 47 CDC20 991 cell division cycle 20 0.78 0.011 1.32 0.019 48 CDC25C 995 cell division cycle 25C 0.80 0.038 1.70 0.011 49 CENPA 1058 centromere protein A 0.73 0.002 2.00 0.000 50 CENPE 1062 centromere protein E, 312 kDa 0.78 0.012 1.33 0.001 51 CENPF 1063 centromere protein F, 350/400 kDa 0.79 0.016 1.64 0.002 52 CENPI 2491 centromere protein I 0.81 0.030 1.50 0.040 53 CENPM 79019 centromere protein M 0.75 0.005 1.39 0.001 54 CENPN 55839 centromere protein N 0.78 0.006 1.50 0.001 55 CENPU 79682 centromere protein U 0.79 0.025 1.77 0.000 56 CEP55 55165 centrosomal protein 55 kDa 0.75 0.007 1.48 0.001 57 CHEK1 1111 checkpoint kinase 1 0.80 0.024 1.75 0.016 58 CDT1 81620 chromatin licensing and DNA 0.78 0.015 1.32 0.040 replication factor 1 59 C11orf80 79703 chromosome 11 open reading frame 0.82 0.039 1.31 0.004 80 60 CCNA2 890 cyclin A2 0.82 0.043 1.70 0.006 61 CCNB1 891 cyclin B1 0.79 0.021 1.58 0.004 62 CCNB2 9133 cyclin B2 0.77 0.007 1.67 0.001 63 CCNE2 9134 cyclin E2 0.80 0.027 2.07 0.000 64 CDK1 983 cyclin-dependent kinase 1 0.76 0.005 1.56 0.001 65 CDKN3 1033 cyclin-dependent kinase inhibitor 3 0.81 0.037 2.26 0.000 66 CKAP5 9793 cytoskeleton associated protein 5 0.78 0.020 2.12 0.022 67 DTL 51514 d.enticleless E3 ubiquitin protein 0.80 0.023 1.47 0.003 ligase homolog (Drosophila) 68 DCTN2 10540 dynactin 2 (p50) 0.77 0.012 1.85 0.015 69 DYNLT1 6993 dynein, light chain, Tctex-type 1 0.77 0.010 2.21 0.003 70 ECD 11319 ecdysoneless homolog (Drosophila) 0.75 0.007 1.70 0.036 71 ECT2 1894 epithelial cell transforming 2 0.79 0.022 1.69 0.001 72 EIF4G1 1981 eukaryotic translation initiation factor 0.82 0.043 1.70 0.033 4 gamma, 1 73 EIF4EBP1 1978 eukaryotic translation initiation factor 0.77 0.010 1.45 0.003 4E binding protein 1 74 EZR 7430 ezrin 0.82 0.041 1.73 0.011 75 FEN1 2237 flap structure-specific endonuclease 1 0.77 0.012 1.77 0.003 76 FOXM1 2305 forkhead box M1 0.78 0.015 1.42 0.002 77 GSK3B 2932 glycogen synthase kinase 3 beta 0.79 0.017 1.99 0.003 78 HMGN5 79366 high mobility group nucleosome 0.83 0.048 1.50 0.040 binding domain 5 79 INTS7 25896 integrator complex subunit 7 0.75 0.007 1.61 0.014 80 KIF11 3832 kinesin family member 11 0.78 0.012 1.61 0.003 81 KIF14 9928 kinesin family member 14 0.78 0.013 1.73 0.001 82 KIF20A 10112 kinesin family member 20A 0.76 0.011 1.46 0.005 83 KIF23 9493 kinesin family member 23 0.79 0.021 1.22 0.028 84 KIF2C 11004 kinesin family member 2C 0.78 0.009 1.90 0.003 85 KIF4A 24137 kinesin family member 4A 0.79 0.016 1.73 0.003 86 KIFC1 3833 kinesin family member C1 0.78 0.015 1.35 0.003 87 MIF 4282 macrophage migration inhibitory 0.78 0.026 1.67 0.003 factor (glycosylation-inhibiting factor) 88 MELK 9833 maternal embryonic leucine zipper 0.78 0.010 1.54 0.003 kinase 89 MED1 5469 mediator complex subunit 1 0.78 0.012 1.40 0.003 90 MCM10 55388 minichromosome maintenance 0.79 0.016 1.39 0.001 complex component 10 91 MCM2 4171 minichromosome maintenance 0.81 0.028 1.53 0.012 complex component 2 92 MCM6 4175 minichromosome maintenance 0.77 0.013 1.63 0.020 complex component 6 93 MAP2K1 5604 mitogen-activated protein kinase 0.77 0.014 1.99 0.016 kinase 1 94 MSH6 2956 mutS homolog 6 0.76 0.008 2.86 0.001 95 MLF1 4291 myeloid leukemia factor 1 0.80 0.027 1.39 0.041 96 NCAPG 64151 non-SMC condensin I complex, 0.76 0.005 1.98 0.000 subunit G 97 NUSAP1 51203 nucleolar and spindle associated 0.79 0.016 1.73 0.000 protein 1 98 NUP155 9631 nucleoporin 155 kDa 0.80 0.031 1.50 0.048 99 NUP93 9688 nucleoporin 93 kDa 0.75 0.005 1.17 0.028 100 ORC4 5000 origin recognition complex, subunit 4 0.78 0.013 1.55 0.036 101 ORC5 5001 origin recognition complex, subunit 5 0.77 0.011 1.86 0.021 102 PIN1 5300 peptidylprolyl cis/trans isomerase, 0.75 0.006 1.26 0.010 NIMA-interacting 1 103 PIK3R4 30849 phosphoinositide-3-kinase, regulatory 0.78 0.015 1.90 0.019 subunit 4 104 PTTG1 9232 pituitary tumor-transforming 1 0.80 0.017 2.08 0.000 105 PTTG3P 26255 pituitary tumor-transforming 3, 0.76 0.012 1.50 0.002 pseudogene 106 PLK1 5347 polo-like kinase 1 0.81 0.037 1.53 0.020 107 PLK4 10733 polo-like kinase 4 0.78 0.021 1.34 0.048 108 PRIM1 5557 primase, DNA, polypeptide 1 0.80 0.035 2.44 0.000 (49 kDa) 109 PA2G4 5036 proliferation-associated 2G4, 38 kDa 0.82 0.043 2.15 0.007 110 LEPREL4 10609 leprecan-like 4 0.79 0.029 1.30 0.046 111 PSMC3 5702 proteasome (prosome, macropain) 0.82 0.032 1.56 0.022 26S subunit, ATPase, 3 112 PSMC6 5706 proteasome (prosome, macropain) 0.78 0.016 1.58 0.031 26S subunit, ATPase, 6 113 PSMD10 5716 proteasome (prosome, macropain) 0.77 0.007 2.27 0.001 26S subunit, non-ATPase, 10 114 PSMD12 5718 proteasome (prosome, macropain) 0.79 0.018 1.93 0.003 26S subunit, non-ATPase, 12 115 PSMD14 10213 proteasome (prosome, macropain) 0.78 0.012 2.24 0.005 26S subunit, non-ATPase, 14 116 PSMD2 5708 proteasome (prosome, macropain) 0.80 0.025 2.42 0.001 26S subunit, non-ATPase, 2 117 PSMD3 5709 proteasome (prosome, macropain) 0.78 0.015 1.34 0.012 26S subunit, non-ATPase, 3 118 PSMD4 5710 proteasome (prosome, macropain) 0.80 0.025 1.79 0.032 26S subunit, non-ATPase, 4 119 PSMD6 9861 proteasome (prosome, macropain) 0.80 0.019 2.09 0.013 26S subunit, non-ATPase, 6 120 PSMD7 5713 proteasome (prosome, macropain) 0.78 0.010 2.22 0.003 26S subunit, non-ATPase, 7 121 PSMA1 5682 proteasome (prosome, macropain) 0.77 0.009 2.33 0.005 subunit, alpha type, 1 122 PSMA2 5683 proteasome (prosome, macropain) 0.78 0.010 1.94 0.010 subunit, alpha type, 2 123 PSMA3 5684 proteasome (prosome, macropain) 0.75 0.005 1.74 0.010 subunit, alpha type, 3 124 PSMA4 5685 proteasome (prosome, macropain) 0.78 0.007 2.27 0.009 subunit, alpha type, 4 125 PSMA6 9692 proteasome (prosome, macropain) 0.76 0.008 1.67 0.027 subunit, alpha type, 6 126 PSMA7 5688 proteasome (prosome, macropain) 0.79 0.020 1.69 0.006 subunit, alpha type, 7 127 PSMB3 5691 proteasome (prosome, macropain) 0.80 0.033 1.70 0.003 subunit, beta type, 3 128 PSMB5 5693 proteasome (prosome, macropain) 0.77 0.016 2.13 0.002 subunit, beta type, 5 129 PSMB7 5695 proteasome (prosome, macropain) 0.78 0.010 1.93 0.011 subunit, beta type, 7 130 PRMT1 3276 protein arginine methyltransferase 1 0.80 0.029 1.64 0.044 131 PPP2R3B 102725016 protein phosphatase 2, regulatory 0.83 0.049 1.24 0.022 subunit B'', beta 132 PPP3CA 5530 protein phosphatase 3, catalytic 0.82 0.039 1.52 0.020 subunit, alpha isozyme 133 PRC1 9055 protein regulator of cytokinesis 1 0.79 0.019 1.82 0.000 134 RRM2 6241 ribonucleotide reductase M2 0.77 0.010 1.50 0.004 135 RPS6KB1 6198 ribosomal protein S6 kinase, 70 kDa, 0.81 0.029 1.45 0.048 polypeptide 1 136 SPAG5 10615 sperm associated antigen 5 0.80 0.028 1.34 0.031 137 SKA1 220134 spindle and kinetochore associated 0.79 0.025 1.35 0.012 complex subunit 1 138 STMN1 3925 stathmin 1 0.78 0.013 1.51 0.041 139 SLBP 7884 stem-loop binding protein 0.80 0.036 2.56 0.001 140 SMC2 10592 structural maintenance of 0.78 0.011 1.95 0.004 chromosomes 2 141 SMC4 10051 structural maintenance of 0.80 0.019 1.67 0.007 chromosomes 4 142 SMC5 23137 structural maintenance of 0.83 0.046 1.77 0.015 chromosomes 5 143 TERF1 7013 telomeric repeat binding factor 0.82 0.038 1.59 0.030 (NIMA-interacting) 1 144 TXNL4A 10907 thioredoxin-like 4A 0.79 0.019 1.67 0.033 145 TRIP13 9319 thyroid hormone receptor interactor 0.80 0.026 1.79 0.003 13 146 TOP2A 7153 topoisomerase (DNA) II alpha 0.80 0.029 1.51 0.000 170 kDa 147 TFDP2 7029 transcription factor Dp-2 (E2F 0.78 0.019 1.51 0.034 dimerization partner 2) 148 TACC3 10460 transforming, acidic coiled-coil 0.75 0.005 1.25 0.013 containing protein 3 149 TUBB3 10381 tubulin, beta 3 class III 0.81 0.038 1.71 0.022 150 TUBB4B 10383 tubulin, beta 4B class IVb 0.80 0.026 1.87 0.013 151 TUBB 203068 tubulin, beta class I 0.78 0.018 1.75 0.047 152 TSG101 7251 tumor susceptibility 101 0.78 0.015 1.84 0.021 153 UBE2C 11065 ubiquitin-conjugating enzyme E2C 0.81 0.041 1.99 0.000 154 UBE2L3 7332 ubiquitin-conjugating enzyme E2L 3 0.75 0.007 2.67 0.000 155 UBE2S 27338 ubiquitin-conjugating enzyme E2S 0.76 0.008 1.44 0.002 156 USP9X 8239 ubiquitin specific peptidase 9, X- 0.79 0.012 2.71 0.007 linked 157 VRK1 7443 vaccinia related kinase 1 0.80 0.020 1.47 0.011 158 ZFHX3 463 zinc finger homeobox 3 0.79 0.026 1.26 0.028 159 ZWILCH 55055 zwilch kinetochore protein 0.75 0.006 1.43 0.010 160 MMP11 4320 matrix metallopeptidase 11 0.81 0.048 1.18 0.050
(stromelysin 3)
[0180] Combinatory Use of BTN3A2 and RRM2 gene for Prognosis Prediction
[0181] Following is the description of the combinatory use of one of the p-genes, i.e. RRM2 (Ribonucleotide Reductase M2) and BTN3A2 for the prognosis prediction of breast cancer. As shown in Table 6 below, bivariate Cox analysis indicates that BTN3A2 and RRM2 are an independent prognostic factor associated with the prognosis of breast cancer, respectively. In particular, it was confirmed that BTN3A2 is correlated with a good prognosis of breast cancer (HR<1), whereas RRM2 with a poor prognosis (HR>1).
TABLE-US-00007 TABLE 6 Results of Bivariate Cox analysis on BTN3A2 and RRM2 genes HR (Hazard Gene Ratio) 95% C.I. p-value BTN3A2 0.77 0.64 to 0.94 0.010 RRM2 1.50 1.14 to 1.98 0.004
[0182] Further, as shown in FIG. 9, it was found that C-index (0.63) of the combination of BTN3A2 and RRM2 was larger than that of either BTN3A2 (0.55) or RRM2 (0.61) alone, suggesting that the combinatory use of the i-gene BTN3A2 and at least one p-gene would lead to an improved accuracy of the prognosis prediction.
[0183] In conclusion, these results suggest that the combinatory use of the i-genes (such as BTN3A2) with various genes may improve its prognostic performance. Particularly, such a combinatory use of the i-gene and the proliferation-related p-gene (such as RRM2) may significantly increase the prediction accuracy of survival probabilities in a breast cancer patient.
[0184] As set forth above, the present invention provides a genetic marker for early-stage breast cancer prognosis prediction and diagnosis. The genetic marker of the present invention can enable the prediction or diagnosis of the prognosis of a breast cancer patient, and thus can be favorably used to present clues for the future direction of breast cancer treatment, including the determination on whether anticancer treatment is needed.
[0185] It will be apparent to those skilled in the art that various modifications and variations can be made in the present invention without departing from the spirit or scope of the invention. Thus, it is intended that the present invention cover the modifications and variations of this invention provided they come within the scope of the appended claims and their equivalents.
* * * * *
References
D00000
D00001
D00002
D00003
D00004
D00005
D00006
D00007
D00008
D00009
D00010
D00011
D00012

D00013

D00014

D00015
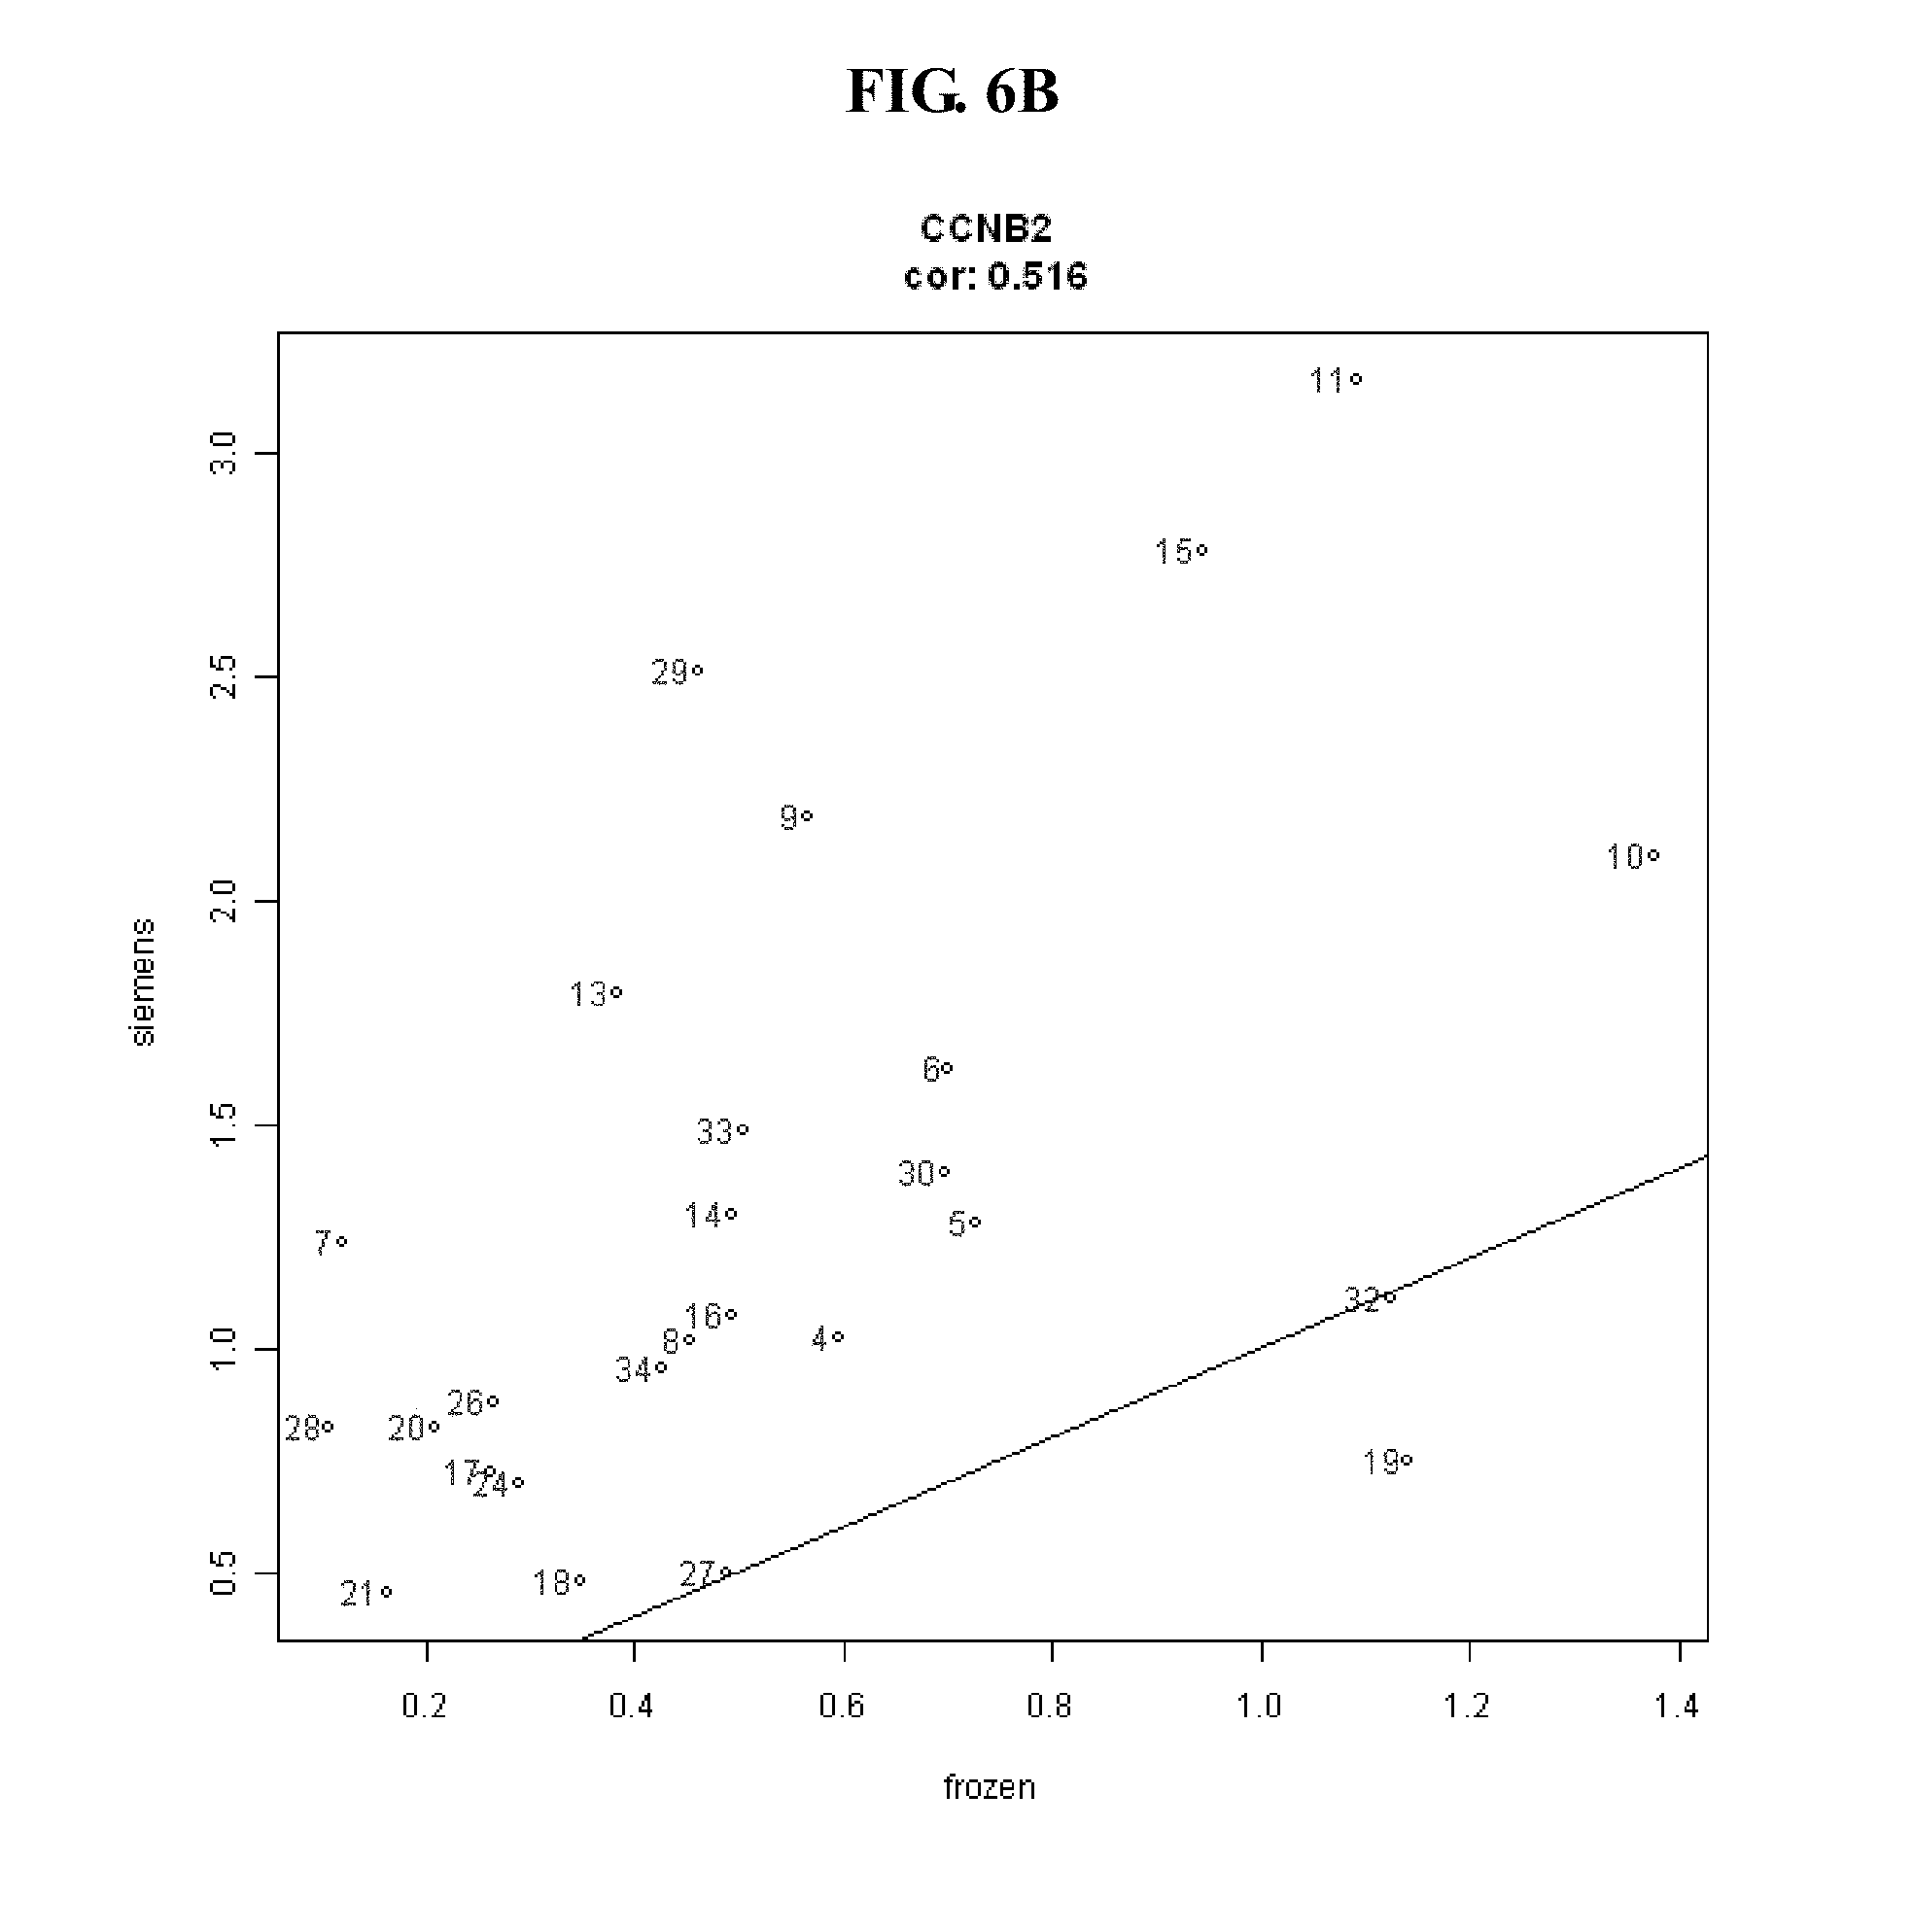
D00016

D00017

D00018

D00019

D00020

D00021

D00022
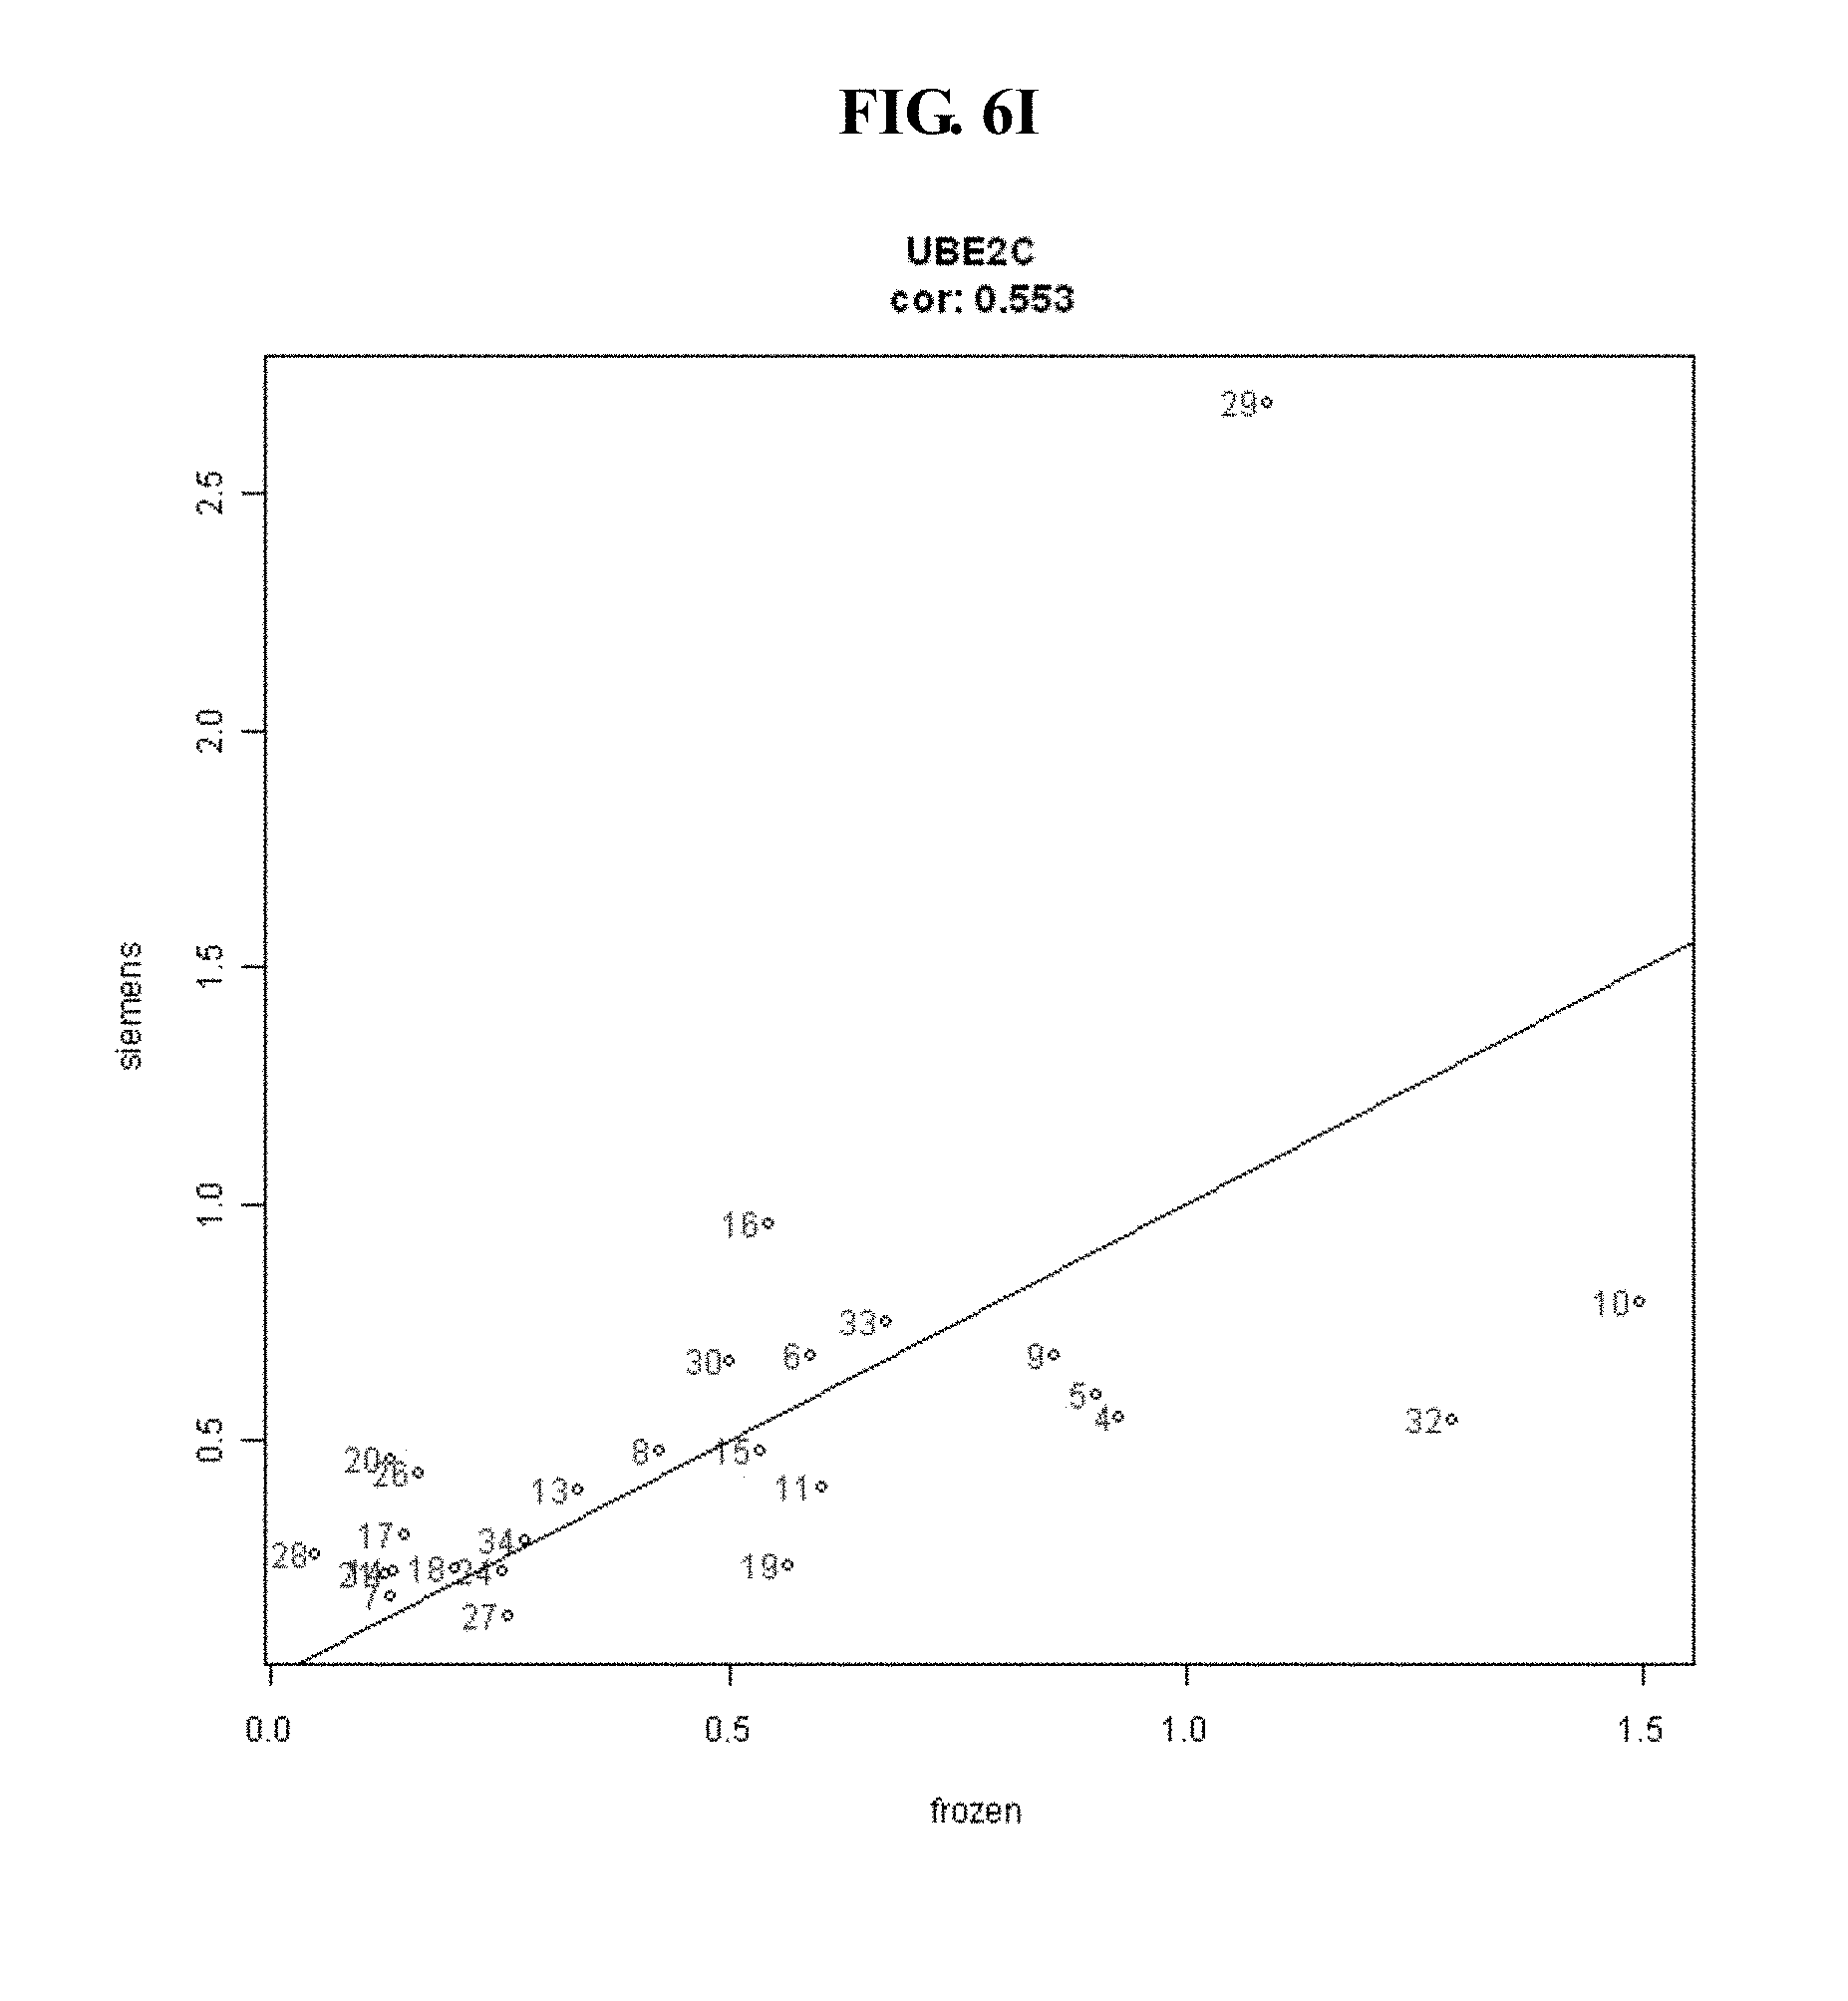
D00023

D00024

D00025

D00026
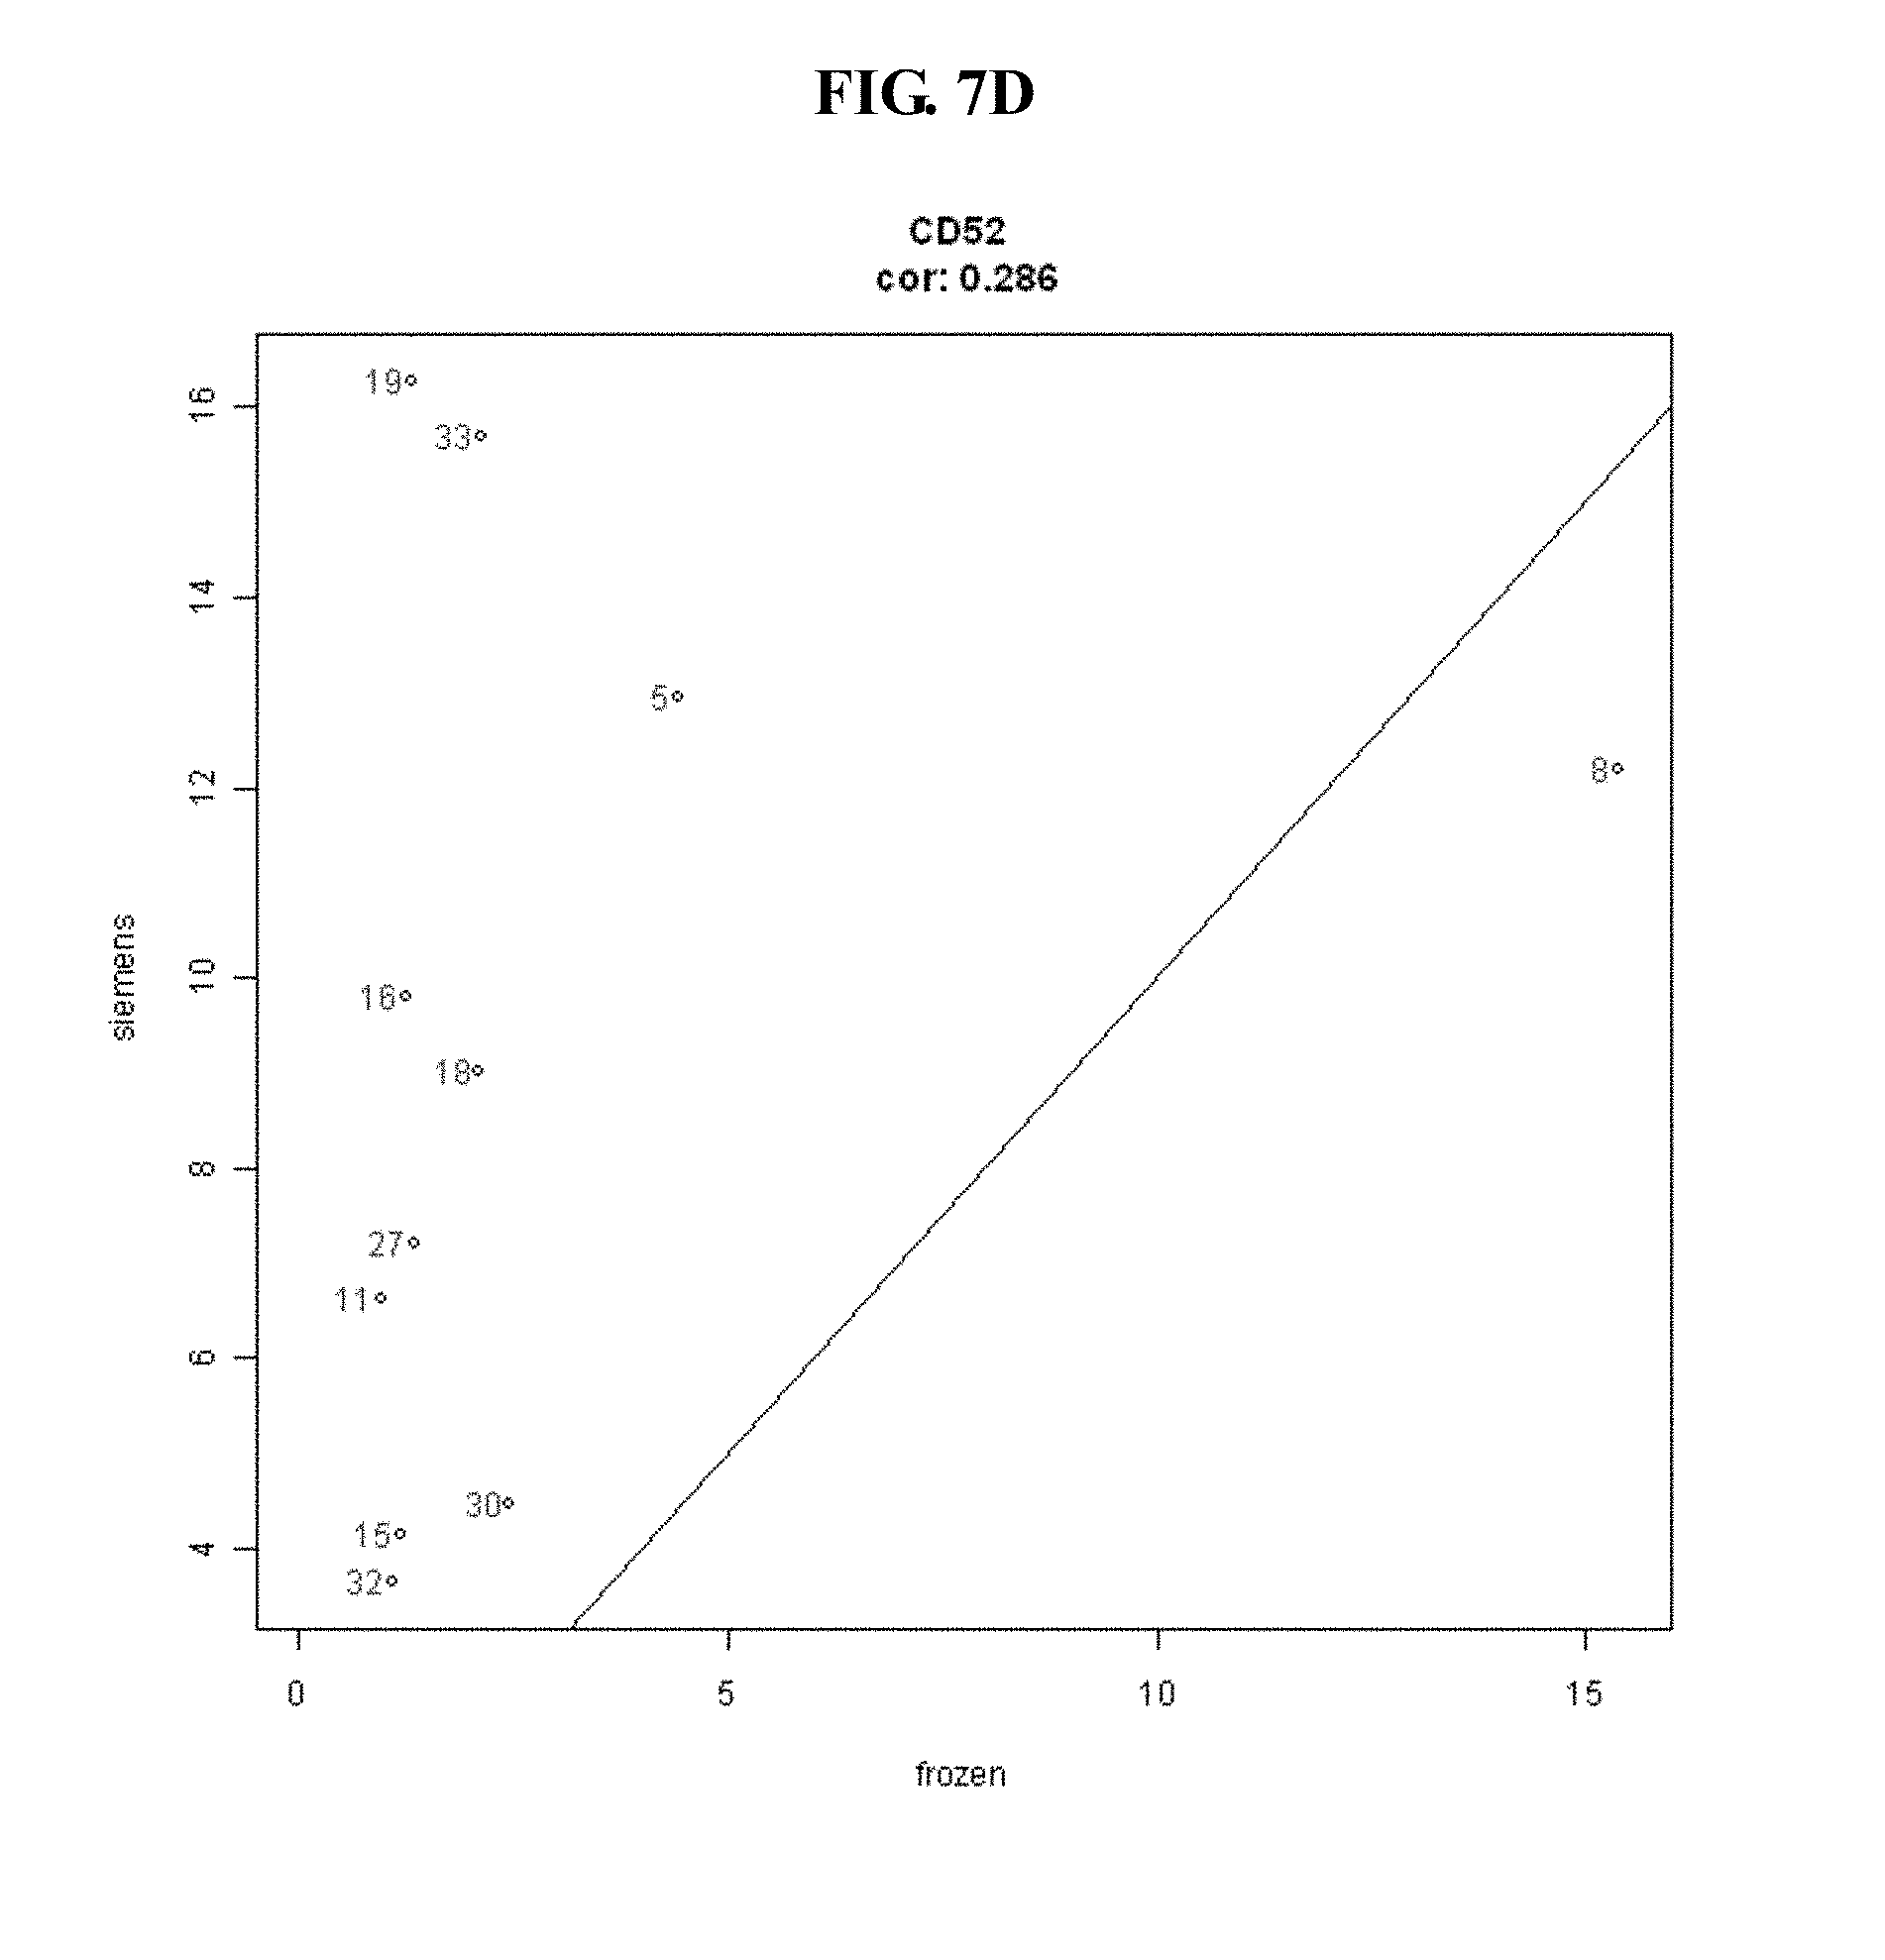
D00027

D00028

D00029

D00030
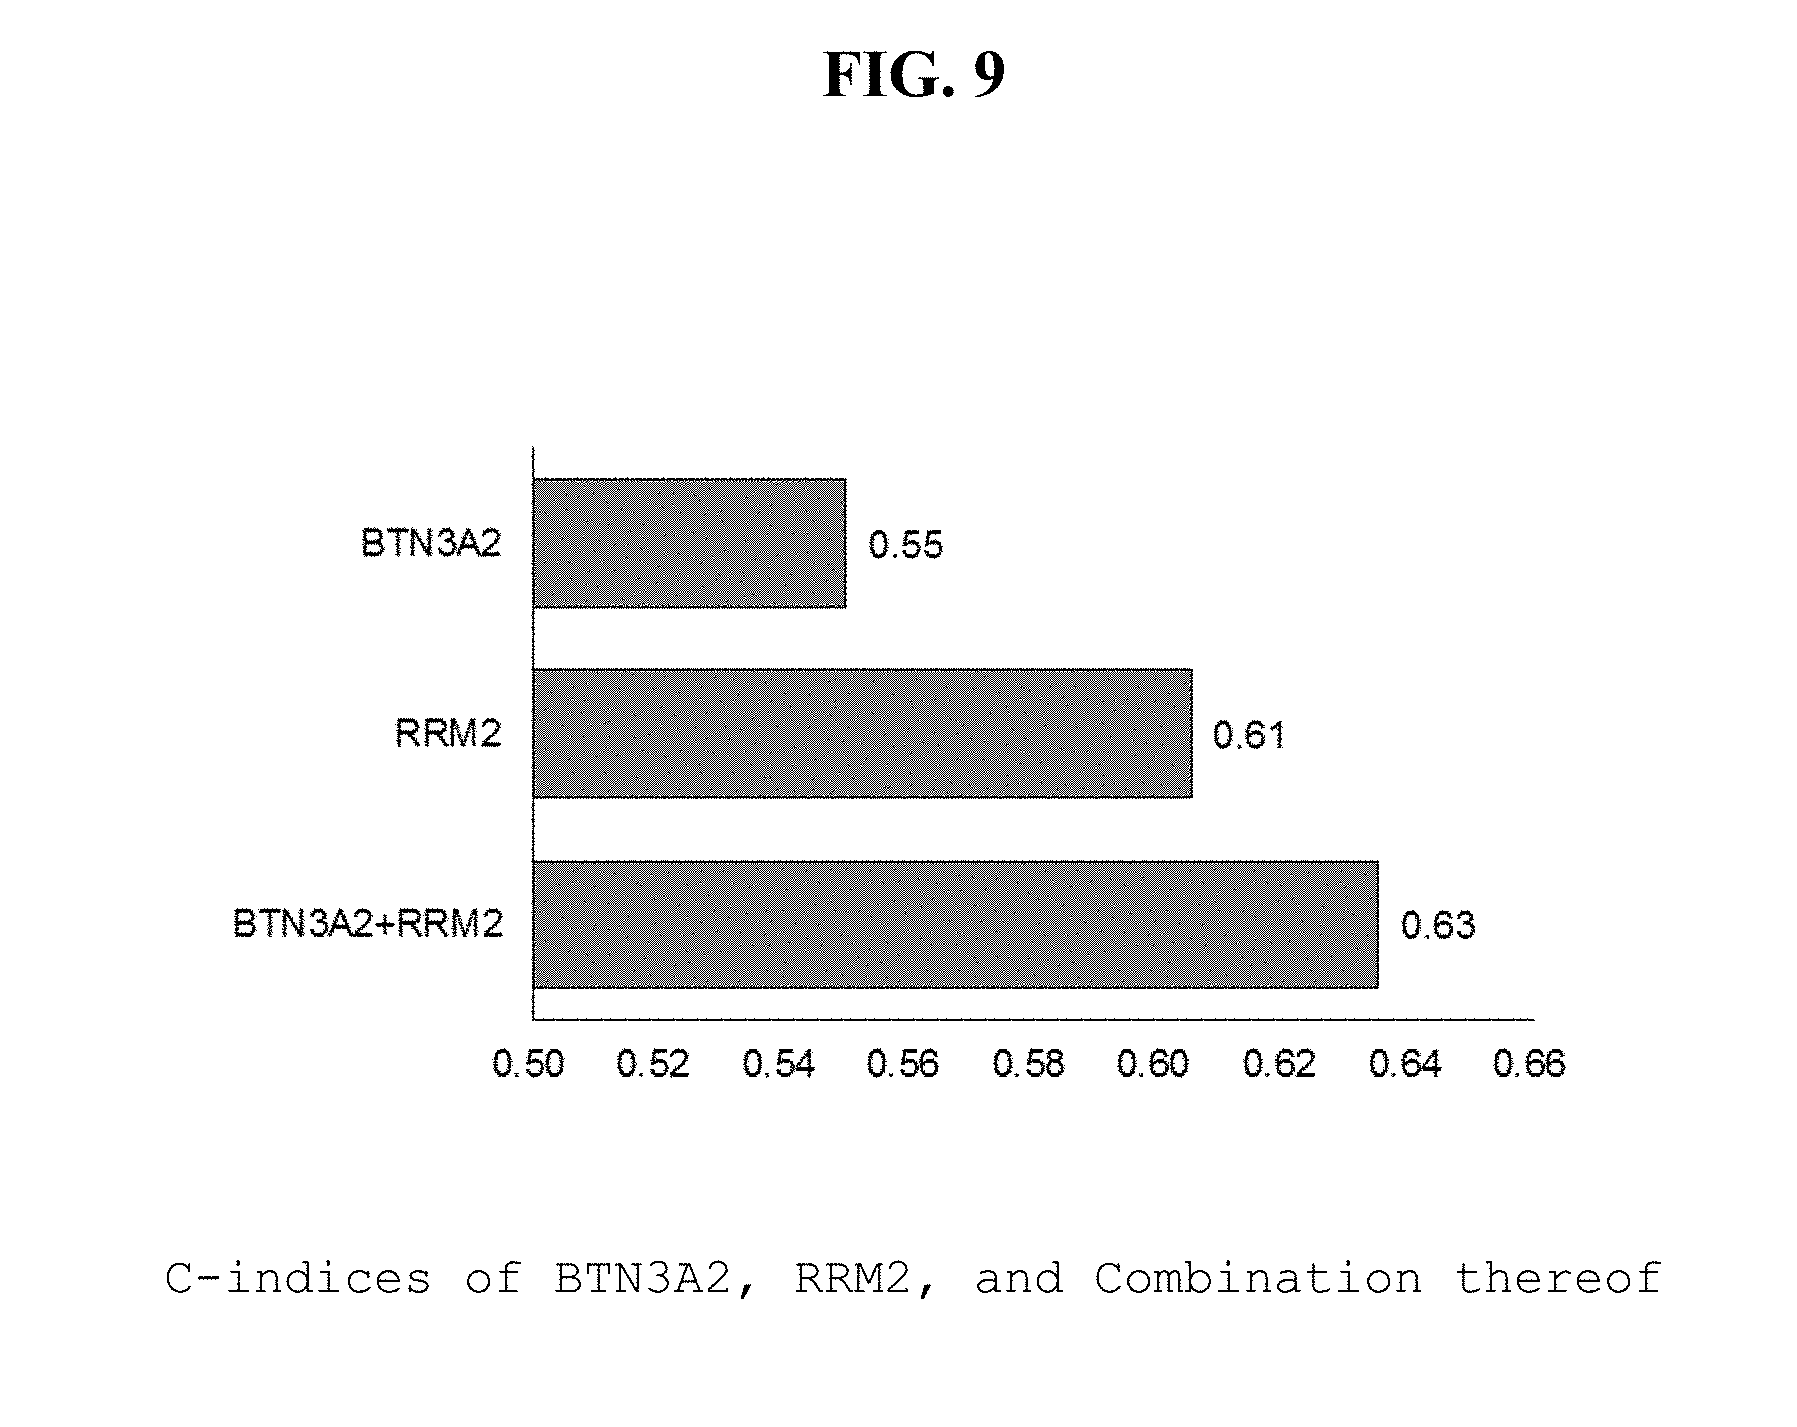
XML
uspto.report is an independent third-party trademark research tool that is not affiliated, endorsed, or sponsored by the United States Patent and Trademark Office (USPTO) or any other governmental organization. The information provided by uspto.report is based on publicly available data at the time of writing and is intended for informational purposes only.
While we strive to provide accurate and up-to-date information, we do not guarantee the accuracy, completeness, reliability, or suitability of the information displayed on this site. The use of this site is at your own risk. Any reliance you place on such information is therefore strictly at your own risk.
All official trademark data, including owner information, should be verified by visiting the official USPTO website at www.uspto.gov. This site is not intended to replace professional legal advice and should not be used as a substitute for consulting with a legal professional who is knowledgeable about trademark law.