Process for In Vitro Diagnosis of Hepatic Disorders
Brun; Virginie ; et al.
U.S. patent application number 16/069362 was filed with the patent office on 2019-01-31 for process for in vitro diagnosis of hepatic disorders. This patent application is currently assigned to Commissariat a l'Energie Atomique et aux Energies Alternatives. The applicant listed for this patent is Centre Hospitalier Universitaire, Commissariat a l'Energie Atomique et aux Energies Alternatives, Inserm, Universite Grenoble Alpes, Universite Paris Sud. Invention is credited to Christophe Bruley, Virginie Brun, Jamila Faivre, Jerome Garin, Vincent Leroy, Jean-Pierre Zarski.
| Application Number | 20190033324 16/069362 |
| Document ID | / |
| Family ID | 58098653 |
| Filed Date | 2019-01-31 |


View All Diagrams
| United States Patent Application | 20190033324 |
| Kind Code | A1 |
| Brun; Virginie ; et al. | January 31, 2019 |
Process for In Vitro Diagnosis of Hepatic Disorders
Abstract
Process for in vitro diagnosis and/or monitoring and/or prognosis and/or theranosis of hepatic disorders from a biological sample originating from a subject, in which process the presence and/or the concentration of the marker ADH1B (SEQ ID NO.2) and/or the presence and/or the concentration of the combination of the markers ADH1B (SEQ ID NO.2) and ADH1A(SEQ ID NO.1) is determined.
| Inventors: | Brun; Virginie; (Seyssins, FR) ; Garin; Jerome; (Corenc, FR) ; Bruley; Christophe; (Le Gua, FR) ; Faivre; Jamila; (Paris, FR) ; Zarski; Jean-Pierre; (St. Nazaire les Eymes, FR) ; Leroy; Vincent; (Claix, FR) | ||||||||||
| Applicant: |
|
||||||||||
|---|---|---|---|---|---|---|---|---|---|---|---|
| Assignee: | Commissariat a l'Energie Atomique
et aux Energies Alternatives Paris FR Centre Hospitalier Universitaire La Tronche FR Universite Grenoble Alpes Saint Martin d'Here FR INSERM Paris FR Universite Paris Sud Orsay FR |
||||||||||
| Family ID: | 58098653 | ||||||||||
| Appl. No.: | 16/069362 | ||||||||||
| Filed: | January 16, 2017 | ||||||||||
| PCT Filed: | January 16, 2017 | ||||||||||
| PCT NO: | PCT/FR2017/050089 | ||||||||||
| 371 Date: | July 11, 2018 |
| Current U.S. Class: | 1/1 |
| Current CPC Class: | G01N 33/6848 20130101; G01N 2333/978 20130101; G01N 33/6893 20130101; G01N 33/68 20130101; G01N 2333/904 20130101; G01N 2333/91177 20130101; G01N 2800/08 20130101; G01N 33/576 20130101; G01N 2333/91188 20130101; G01N 2800/085 20130101; G01N 2333/4742 20130101; G01N 2333/91005 20130101; G01N 2333/91017 20130101 |
| International Class: | G01N 33/68 20060101 G01N033/68 |
Foreign Application Data
| Date | Code | Application Number |
|---|---|---|
| Jan 15, 2016 | FR | 1600081 |
| Mar 11, 2016 | FR | 1652087 |
Claims
1-15. (canceled)
16. A method of determining the presence and/or concentration of a protein ADH1B (SEQ ID NO: 2) or a combination of proteins ADH1A (SEQ ID NO: 1) and ADH1B (SEQ ID NO: 2) in a subject, comprising: obtaining a biological sample from the subject; and determining the presence and/or concentration of said protein(s) in the sample using one or more signature peptides comprising a signature peptide of SEQ ID NO: 17 for the protein ADH1B and a signature peptide of SEQ ID NO: 15 or SEQ ID NO: 16 for the combination of proteins ADH1A and ADH1B.
17. The method according to claim 16, which further comprises determining the presence and/or concentration of one or more additional proteins selected from the group consisting of: ADH4 (SEQ ID NO: 3, SEQ ID NO: 4), BHMT1 (SEQ ID NO: 5), BHMT2 (SEQ ID NO: 6, SEQ ID NO: 7), ARG1 (SEQ ID NO: 8, SEQ ID NO: 9, SEQ ID NO: 10), FABP1 (SEQ ID NO: 11), GSTA1 (SEQ ID NO: 12) and ALT1 (SEQ ID NO: 13).
18. The method according to claim 16, which further comprises determining the presence and/or concentration of one or more additional proteins selected from the group consisting of: ADH4 (SEQ ID NO: 3, SEQ ID NO: 4), BHMT1 (SEQ ID NO: 5) and BHMT2 (SEQ ID NO: 6, SEQ ID NO: 7).
19. The method according to claim 16, which comprises determining the presence and/or concentration of the protein ADH1B or the combination of the proteins ADH1B and ADH1A; the protein ADH4 (SEQ ID NO: 3, SEQ ID NO: 4); and the protein BHMT1 (SEQ ID NO: 5) and/or BHMT2 (SEQ ID NO: 6, SEQ ID NO: 7).
20. The method according to claim 17, which comprises the determination of the protein BHMT1 (SEQ ID NO: 5), the protein BHMT2 (SEQ ID NO: 6 and SEQ ID NO: 7) or both said proteins.
21. The method according to claim 16, which further comprises determining the presence and/or concentration of the protein CK18.
22. The method according to claim 16, wherein said signature peptide is generated from said protein by an enzymatic digestion process.
23. The method according to claim 17, wherein the presence and/or concentration of said additional proteins is determined using one or more signature peptides selected from the group consisting of: SEQ ID NO: 20, SEQ ID NO: 18 and SEQ ID NO: 19 for the protein ADH4; SEQ ID NO: 25, SEQ ID NO: 24 and SEQ ID NO: 26 for the protein ARG1; SEQ ID NO: 21, SEQ ID NO: 23 and SEQ ID NO: 22 for the protein BHMT; SEQ ID NO: 21 for the protein BHMT1; SEQ ID NO: 23 and SEQ ID NO: 22 for the combination of proteins BHMT1 and BHMT2, ASEQ ID NO: 27, SEQ ID NO: 28 and SEQ ID NO: 29 for the protein FABP1; SEQ ID NO: 30 for the protein GSTA1; and SEQ ID NO: 34, SEQ ID NO: 35 and SEQ ID NO: 36 for the ALT1 protein.
24. The method according to claim 17, wherein the presence and/or concentration of ALT1 protein is determined using the signature peptide SEQ ID NO: 34 or SEQ ID NO: 35.
25. The method according to claim 16, wherein the subject has or is suspected of having a liver disorder chosen from acute liver injury, hepatic steatosis and steatohepatitis.
26. The method according to claim 16, wherein the subject has or is suspected of having a non-alcoholic steatohepatitis.
27. The method according to claim 16, which is for assessing the toxicity of molecules previously administered to the subject.
28. A method of determining the presence and/or concentration of a protein ADH1B (SEQ ID NO: 2) or a combination of proteins ADH1A (SEQ ID NO: 1) and ADH1B (SEQ ID NO: 2) in a subject, using at least one signature peptide characteristic of the selected protein(s), comprising the steps: (a) obtaining a biological sample taken from a subject at the time to, (b) adding a known quantity of an isotopically labelled protein homologous to the selected protein(s), in the biological sample obtained in step a), (c) treating the sample to extract at least a portion of the abundant proteins or at least a portion of the glycoproteins, (d) treating the sample after extracting at least a portion of the abundant proteins or glycoproteins to generate proteolytic peptides including the signature peptides of said selected protein(s), (e) quantitative assay by mass spectrometry of at least one signature peptide generated from the selected protein(s), (f) determining a ratio of the abundance of the isotopically labelled signature peptide, from the standard, added in step b), to the abundance of the non-labelled signature peptide from the biological sample, (g) computing the concentration of said selected protein(s) in the sample based on the ratio obtained in step f) and on the known quantity of said isotopically labelled protein added in step b).
29. The method according to claim 28, wherein step (c) is performed by glycodepletion.
30. The method according to claim 28, wherein the method is performed at a time t.sub.0 and at a time t.sub.1 greater than t.sub.0, and comprises after step (g) the comparison of the concentration of the selected protein(s) in the sample between t.sub.1 and t.sub.0.
31. The method according to claims 28, wherein step (d) is performed by enzymatic digestion using trypsin or a mixture of EndolysC and trypsin.
32. The method according to claim 28, wherein the subject has or is suspected of having a liver disorder chosen from acute liver injury, hepatic steatosis and steatohepatitis.
33. The method according to claim 28, wherein the subject has or is suspected of having a non-liver steatohepatitis.
34. The method according to claim 28, which is for assessing the toxicity of molecules previously administered to the subject.
Description
FIELD OF THE INVENTION
[0001] The invention belongs to the field of hepatology (medicine of the liver) and relates to the use of biomarkers for diagnosing liver disorders. More specifically, this invention relates to methods for in vitro diagnosis and/or monitoring and/or in vitro prognosis of hepatic disorders such as acute liver injury and failure or steatohepatitis by the detection and/or assay of certain biomarkers.
STATE OF THE RELATED ART
[0002] Hepatic disorders include a multitude of diseases affecting the liver chronically (such as cirrhosis) or acutely (this is referred to as acute liver injury). The causes thereof are varied and include alcoholism, hepatitis A, B, C and E viruses, genetic disorders (Wilson's disease) or immune disorders (autoimmune hepatitis), drug poisoning or excess fat associated with obesity.
[0003] Acute Liver Injury (abbreviated herein as ALI) or Acute Liver Failure (abbreviated herein as ALF) occur suddenly in patients with no pre-existing liver disease. The causes thereof are varied: medicinal products (including paracetamol), viruses, autoimmune disease. Acute liver injuries are characterised by the death of liver cells (hepatocytes) in a necrotic and/or apoptotic mode and result in a reduction in functional liver mass. These hepatic disorders are associated with blood clotting disorders and modification in clinico-biological investigation parameters of the liver (increase in transaminase and serum CK18). In the most severe form thereof (fulminant hepatitis or ALF), encephalopathy is also present. Acute liver disorders may result in the patient's death without suitable medical care.
[0004] Non-Alcoholic Fatty Liver Diseases (known as the acronym NAFLD) are very frequent liver diseases. They encompass a wide range of diseases such as isolated steatosis (known as the acronym NAFL--"Non-Alcoholic Fatty Liver"), non-alcoholic steatohepatitis (NASH) and cirrhosis. They are associated with an abnormal accumulation of fat in the liver. They are linked with increase in the prevalence of diabetes and obesity. Non-alcoholic steatohepatitis (NASH) is a potentially serious disease which can progress to cirrhosis and induce chronic or acute liver injury and/or hepatocellular carcinoma.
[0005] Hepatic disorders may be diagnosed by the detection or assay in the blood of certain specific molecules (biomarkers). Cytolysis (hepatocyte necrosis) is assessed by the detection of proteins, contained in liver cells, and which are discharged into the bloodstream following liver cell necrosis (mechanistic biomarkers): this is the case of transaminases which reflect liver cell lysis. However, transaminases are not specific to the liver and the blood concentrations thereof may increase following disorders in other organs (heart, muscle). These may also consist of molecules synthesised by the liver, the function whereof is impacted by the decrease in the synthesis thereof (functional biomarkers): this is the case of the prothrombin index which investigates the clotting factors I, II, V, VII and X synthesised by the liver. However, due to the half-life in the blood of a few hours of clotting factors, clotting disorders are not immediate.
[0006] With respect to non-alcoholic and alcoholic hepatic steatosis, formal diagnosis is usually carried out on a liver biopsy from the patient; as such, it is possible to assess the liver tissue lesions and determine the severity of the disease. A biopsy is an invasive test, associated with bleeding risks, and requires hospital care; therefore, it is a costly test. It would be preferable to be able to detect liver disorders and monitor the progression thereof using non-invasive methods, preferably using a biological fluid, for example obtained from a mere blood sample.
[0007] In recent years, a number of non-invasive methods for assessing liver lesions have been proposed, particularly for detecting alcoholic and non-alcoholic steatohepatitis. By way of example, US 2006/0 172 286 describes a non-invasive process for diagnosing non-alcoholic or alcoholic steatohepatitis in a patient, comprising the measurement of the three biochemical markers ApoAI, ALT and AST in a serum or plasma sample. WO 2010/058 295 describes a process for quantifying a patient's liver lesions via the assay of one or a plurality of biomarkers (of which ALT). Zhiyuan Hu et al. (Theranostics, 2014, 4, 215-228) and Beger et al. (Arch. Toxicol., 2015, 89, 1497-1552) describe biomarkers of acute liver lesions induced by paracetamol including the conventional marker transaminase (ALT1), as well as other markers such as BHMT, particularly BHMT1. WO 2015/071 669 describes a method for the diagnosis, prognosis or monitoring of a liver tumour in a subject via the detection or quantification or one or a plurality of markers present in particular in the blood; the list of markers is extremely large and particularly comprises the proteins ADH1A, ADH1B, GSTA1, FABP1, ARG1, GPT1 (corresponding to ALT1), BHMT and ADH4.
[0008] In any case, absolute quantification, i.e. the determination of the concentration of proteins or peptides present in a liquid sample, particularly a blood sample may be a relatively complex process.
[0009] It is observed that diagnosing hepatic disorders at an early stage and predicting the progression of these disorders has become a major health challenge, in particular for non-alcoholic steatohepatitis, the prevalence whereof increases with obesity.
[0010] The present invention seeks to propose a process for in vitro diagnosis of hepatic disorders, more particularly a novel non-invasive diagnostic test of hepatic disorders more accurate than the diagnosis processes according to the prior art.
Subject Matter of the Invention
[0011] The present invention relates to a process for in vitro diagnosis and/or monitoring and/or prognosis and/or theranostics of hepatic disorders from a biological sample originating from a subject, in which process the presence and/or concentration of the marker ADH1B (SEQ ID NO. 2) and/or the presence and/or concentration of the combination of the markers ADH1B (SEQ ID NO. 2) and ADH1A (SEQ ID NO. 1) is determined.
[0012] The invention also relates to the use of at least one marker ADH1B (SEQ ID NO. 2) and/or of at least the combination of the markers ADH1B (SEQ ID NO. 2) and ADH1A (SEQ ID NO. 1) for in vitro diagnosis, monitoring, prognosis and/or theranostics of hepatic disorders from a biological sample originating from a subject; in which use the presence and/or concentration of said marker is determined.
[0013] In one embodiment of the process or of the use above, the presence and/or concentration of at least one additional marker, preferentially of at least two additional markers, and even more preferentially of at least three additional markers is determined, said markers being selected in the group consisting of: ADH4 (SEQ ID NO. 3 & SEQ ID NO. 4), BHMT (SEQ ID NO. 5, SEQ ID NO. 6 & SEQ ID NO. 7), ARG1 (SEQ ID NO. 8, SEQ ID NO. 9 & SEQ ID NO. 10), FABP1 (SEQ ID NO. 11), GSTA1 (SEQ ID NO. 12) and ALT1 (SEQ ID NO. 13).
[0014] In one embodiment of the process or of the use above, at least the presence and/or concentration of at least one additional marker selected among ADH4 (SEQ ID NO. 3 & SEQ ID NO. 4) and BHMT (SEQ ID NO. 5, SEQ ID NO. 6 & SEQ ID NO. 7) is determined.
[0015] In one embodiment of the process or of the use above, at least the presence and/or concentration of the marker ADH1B (SEQ ID NO. 2) or of the combination of the markers ADH1B (SEQ ID NO. 2) and ADH1A (SEQ ID NO. 1), on one hand, and of the markers ADH4 (SEQ ID NO. 3 & SEQ ID NO. 4) and BHMT (SEQ ID NO. 5, SEQ ID NO. 6 & SEQ ID NO. 7), on the other, is determined.
[0016] In one advantageous embodiment of the process or of the use above, the marker BHMT is the sequence variant BHMT1 (SEQ ID NO. 5) and/or the combination of the sequence variants BHMT1 (SEQ ID NO. 5) and BHMT2 (SEQ ID NO. 6 & SEQ ID NO. 7).
[0017] In one embodiment of the process or of the use described above, the presence and/or concentration of the marker CK18 is further determined.
[0018] In one embodiment of the process or of the use described above, signature peptides present in said markers are used for said determination of the presence and/or concentration of said markers.
[0019] In one advantageous embodiment of the process or of the use described above, said signature peptides are generated from said markers by a digestion process, preferably enzymatic.
[0020] In one embodiment of the process or of the use described above, the presence and/or concentration:
[0021] a. of the combination of the markers ADH1A (SEQ ID NO. 1) and ADH1B (SEQ ID NO. 2), if it is selected, is determined by the presence of at least one signature peptide chosen among INEGFDLLHSK (SEQ ID NO. 16) and FSLDALITHVLPFEK (SEQ ID NO. 15),
[0022] b. of the marker ADH1B (SEQ ID NO. 2), if it is selected, is determined by the presence of the signature peptide AAVLWEVK (SEQ ID NO. 17),
[0023] c. of the marker ADH4 (SEQ ID NO. 3 & SEQ ID NO. 4), if it is selected, is determined by the presence of at least one signature peptide chosen among FNLDALVTHTLPFDK (SEQ ID NO. 20), IDDDANLER (SEQ ID NO. 18) or IIGIDINSEK (SEQ ID NO. 19),
[0024] d. of the marker ARG1 (SEQ ID NO. 8, SEQ ID NO. 9 & SEQ ID NO. 10), if it is selected, is determined by the presence of at least one signature peptide chosen among DVDPGEHYILK (SEQ ID NO. 25), TIGIIGAPFSK (SEQ ID NO. 24) or EGLYITEEIYK (SEQ ID NO. 26),
[0025] e. of the marker BHMT (SEQ ID NO. 5, SEQ ID NO. 6 & SEQ ID NO. 7), if it is selected, is determined by the presence of at least one signature peptide chosen among EATTEQQLK (SEQ ID NO. 21), AIAEELAPER (SEQ ID NO. 23) or EAYNLGVR (SEQ ID NO. 22),
[0026] f. of the marker BHMT1 (SEQ ID NO. 5), if it is selected, is determined by the presence of the signature peptide EATTEQQLK (SEQ ID NO. 21),
[0027] g. of the combination of the markers BHMT1 (SEQ ID NO. 5) and BHMT2 (SEQ ID NO. 6 & SEQ ID NO. 7), if it is selected, is determined by the presence of at least one signature peptide chosen among AIAEELAPER (SEQ ID NO. 23) or EAYNLGVR (SEQ ID NO. 22),
[0028] h. of the marker FABP1 (SEQ ID NO. 11), if it is selected, is determined by the presence of at least one signature peptide chosen among AIGLPEELIQK (SEQ ID NO. 27), FTITAGSK (SEQ ID NO. 28) or TVVQLEGDNK (SEQ ID NO. 29),
[0029] i. of the marker GSTA1 (SEQ ID NO. 12), if it is selected, is determined by the presence of the signature peptide LHYFNAR (SEQ ID NO. 30),
[0030] j. of the marker ALT1 (SEQ ID NO. 13), if it is selected, is determined by the presence of at least one signature peptide chosen among ALELEQELR (SEQ ID NO. 34), LLVAGEGHTR (SEQ ID NO. 35) or KPFTEVIR (SEQ ID NO. 36), in the knowledge that ALT1 (SEQ ID NO. 13), if it is selected, is more particularly determined by the presence of the signature peptide ALELEQELR (SEQ ID NO. 34) or LLVAGEGHTR (SEQ ID NO. 35).
[0031] In one advantageous embodiment of the process of use described above, the process of use, wherein at least one of said markers (referred to as "selected marker"), of which at least one marker ADH1B (SEQ ID NO. 2) and/or of the combination of the markers ADH1B (SEQ ID NO. 2) and ADH1A (SEQ ID NO. 1), is assayed by means of at least one signature peptide characteristic of said marker, comprises the following steps:
[0032] a) obtaining a biological sample taken from a subject at the time to,
[0033] b) adding a known quantity of an isotopically labelled homologous protein (referred to as "standard") of the selected marker in the biological sample obtained in step a),
[0034] c) treating the sample to extract at least a portion of the abundant proteins or at least a portion of the glycoproteins,
[0035] d) treating the sample after extracting at least a portion of the abundant proteins or glycoproteins to generate proteolytic peptides, preferably by digestion, it being understood that the proteolytic proteins obtained include the signature peptides of the selected markers,
[0036] e) quantitative assay by mass spectrometry of at least one signature peptide generated from the selected marker,
[0037] f) determining a ratio of the abundance of the isotopically labelled signature peptide, from the standard, added in step b), to the abundance of the non-labelled signature peptide from the biological sample,
[0038] g) computing based on the ratio obtained in step f) and on the known quantity of said isotopically labelled protein added in step b), the concentration of said selected marker in the sample.
[0039] In one advantageous embodiment, step c) of the process or of the use described above is performed by depletion and preferentially by glycodepletion.
[0040] In one advantageous embodiment, step c) of the process or of the use described above is followed by a biological sample electrophoresis step.
[0041] In one advantageous embodiment, the process is performed at a time t.sub.0 and at a time t.sub.1 greater than t.sub.0, and comprises after step g) the comparison of the concentration of the selected marker in the sample between t.sub.1 and t.sub.0.
[0042] In one advantageous embodiment, step d) of the process described above is performed by enzymatic digestion, preferably by using trypsin or a mixture of EndolysC and trypsin.
[0043] In one advantageous embodiment, the liver disorder is acute liver injury, liver steatosis or steatohepatitis, preferably, acute liver injury or steatohepatitis. The acute hepatitis is particularly viral hepatitis, alcoholic hepatitis, drug-induced hepatitis, poisoning-related hepatitis, for example due to fungi or vitamins, autoimmune hepatitis or Wilson's disease; preferably, it consists of non-alcoholic hepatitis, such as in particular drug-induced hepatitis, for example due to paracetamol or another medicinal product. The liver steatosis is in particular non-alcoholic steatosis, such as isolated steatosis (NAFL for "Non-Alcoholic Fatty Liver"). The steatohepatitis is in particular non-alcoholic steatohepatitis (NASH for "Non-Alcoholic SteatoHepatitis"). Further subject matter of the invention relates to a use of the process for assessing the toxicity of molecules (candidate medicinal products, medicinal products, xenobiotic) previously administered to the subject from whom said biological sample originates.
DESCRIPTION OF THE FIGURES
[0044] FIGS. 1 to 8 illustrate certain aspects of the invention.
[0045] FIG. 1 describes the principle of plasma protein glycodepletion for the assay of non-glycosylated biomarkers (such as hepatocytic lysis proteins).
[0046] The plasma proteome is composed (by weight) of 50% glycosylated proteins and 50% non-glycosylated proteins. The glycosylated proteins may be captured on magnetic beads functionalised with hydrazide via covalent bond formation. The non-glycosylated proteins are subsequently eluted with urea suitable for breaking the protein/protein interactions.
[0047] FIG. 2 shows the calibration curves obtained for ADH1B, ARG1, BHMT1 and GSTA1 in plasma after immunodepletion. These calibration curves are suitable for assessing the analytical performances of the assay method.
[0048] FIG. 3 shows the calibration curves obtained for ADH4, BHMT1, FABP1 and ALT1 in plasma after glycodepletion.
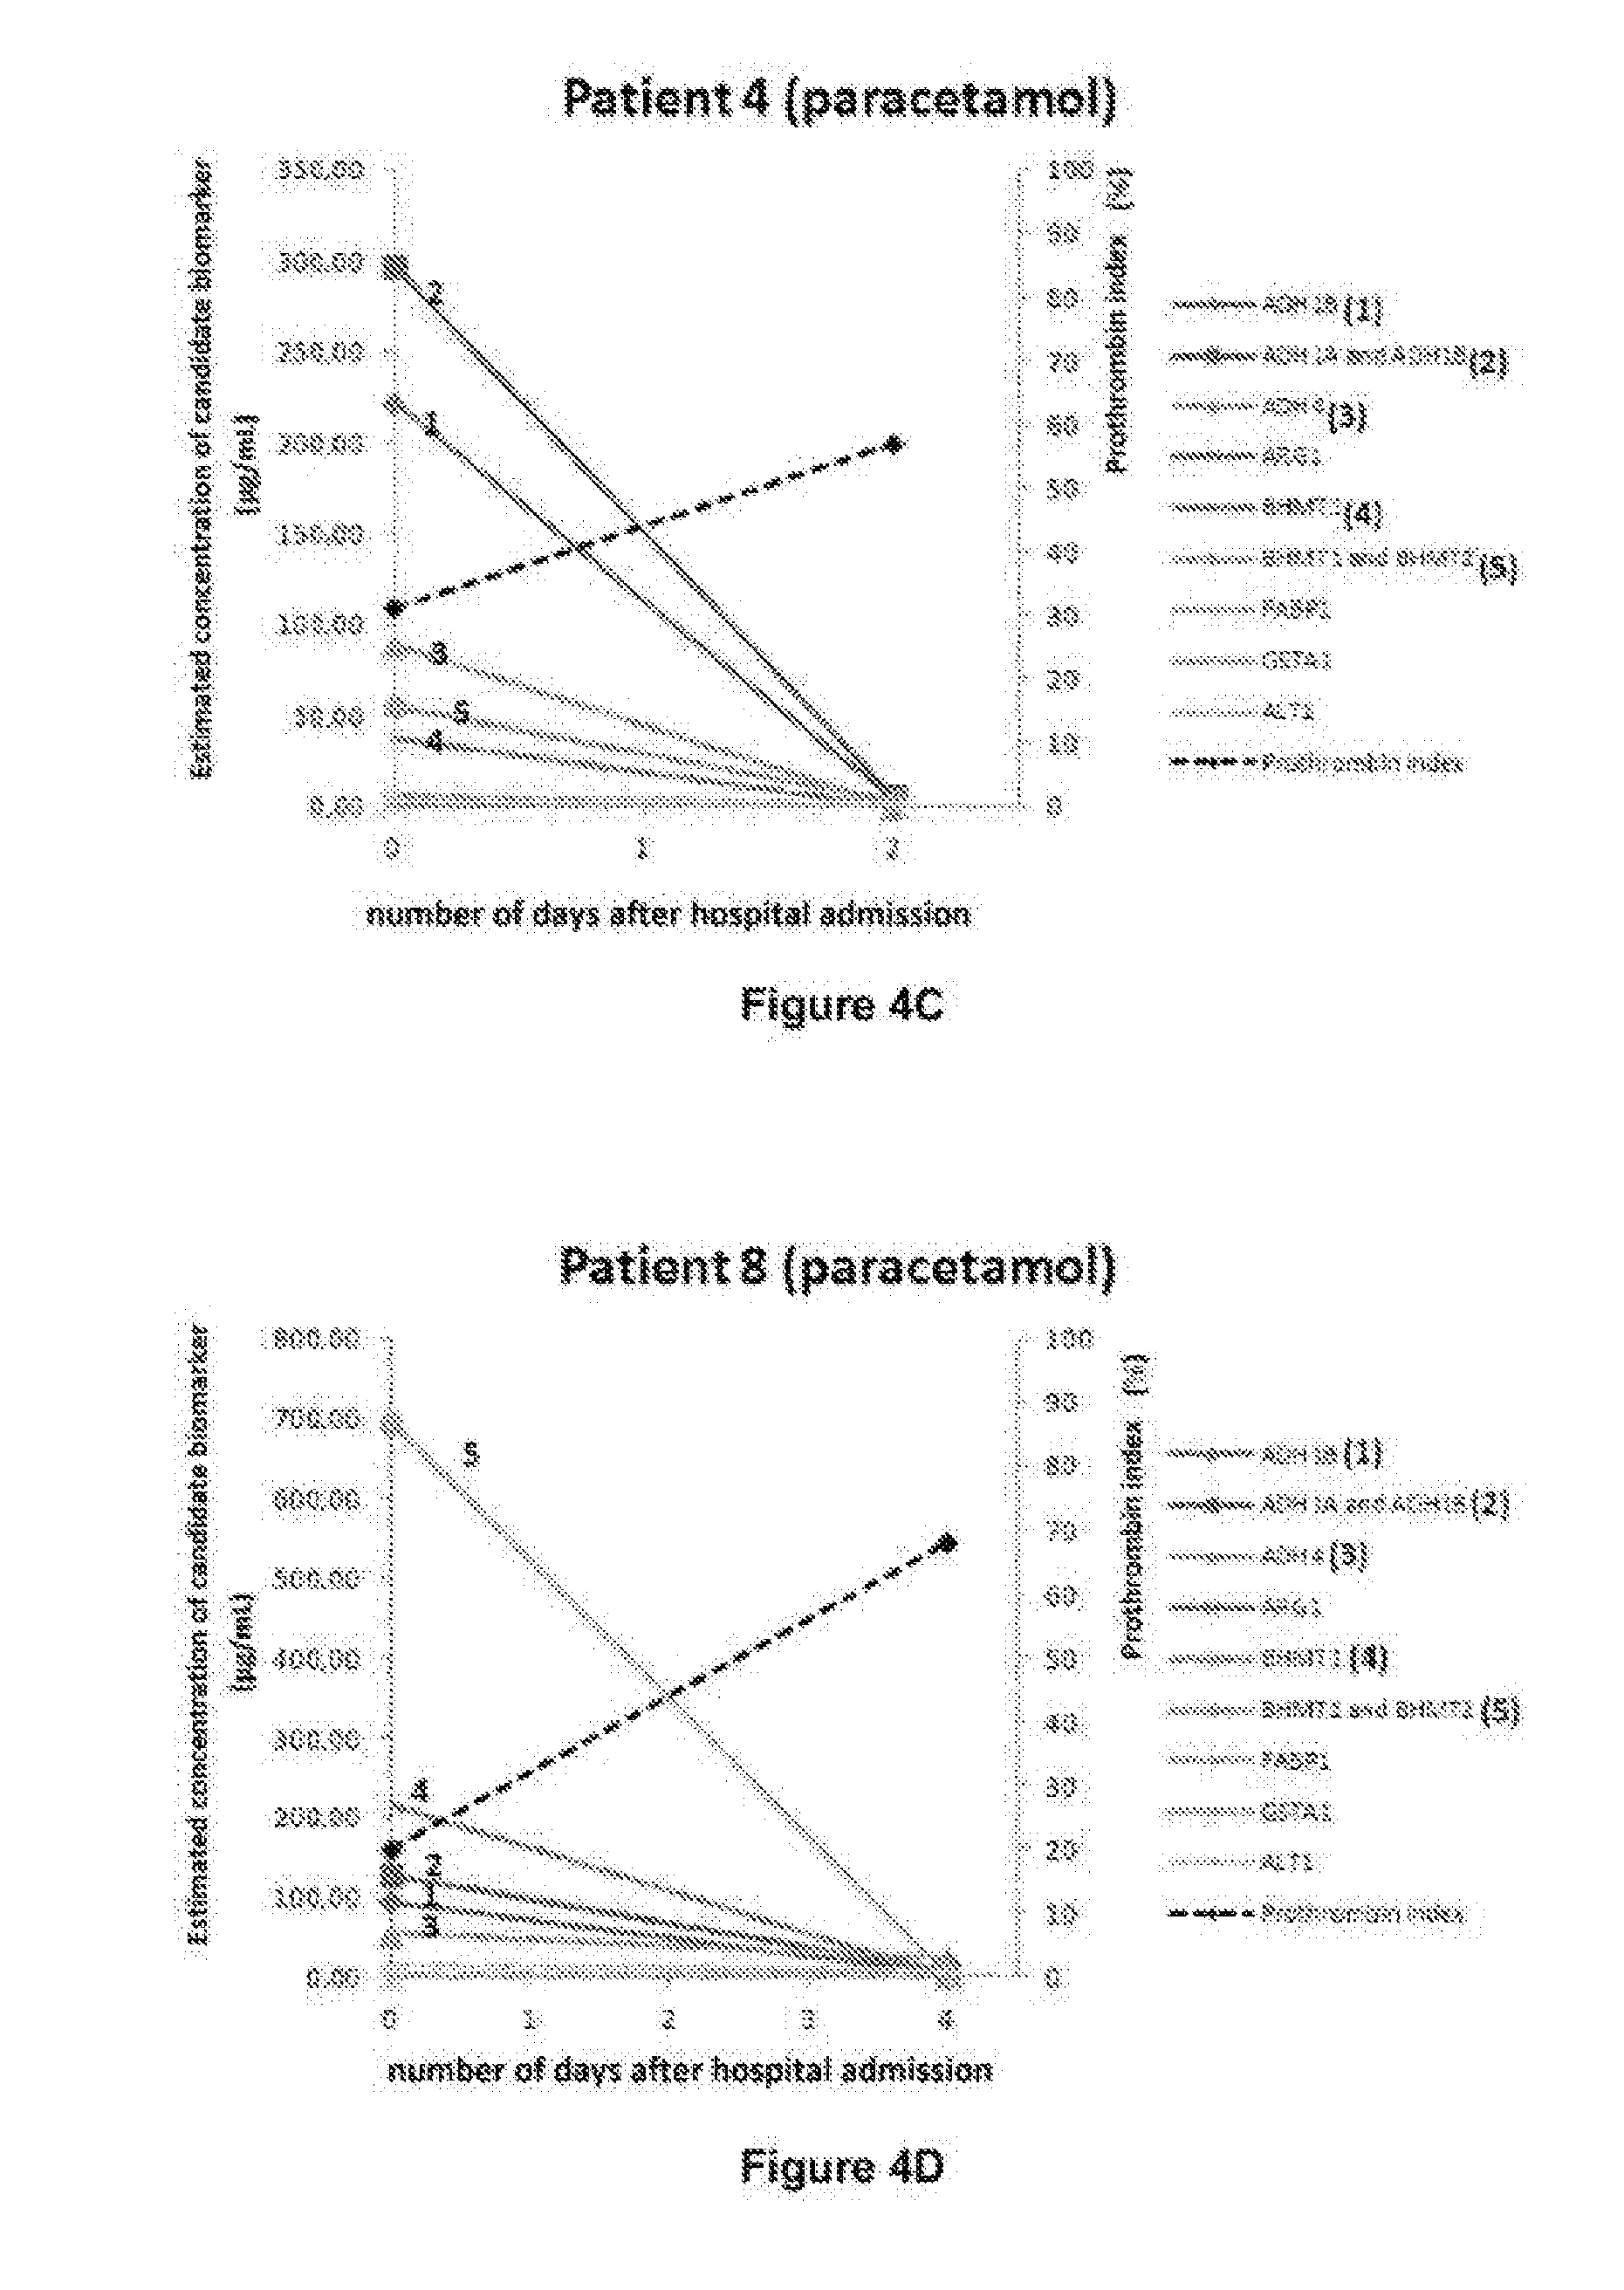
[0049] FIGS. 4 (A to G) describe the analysis of biomarkers in biological samples originating from patients having paracetamol-induced liver injury. The concentrations of the target biomarkers were determined using PSAQ.TM. standards after serum pre-fractionation by LC-SRM. The prothrombin index is mentioned as an indicator of clotting disorders and of an ALI or ALF hepatic disorder.
[0050] FIGS. 5 (A to F) describe the analysis of biomarkers in biological samples originating from patients having an ALI or ALF hepatic disorder induced by a cause other than paracetamol. The concentrations of the target biomarkers were determined using PSAQ.TM. standards (WO 2008/145 763 A1) after serum pre-fractionation and LC-SRM analysis. The prothrombin index is mentioned as an indicator of clotting disorders and of an ALI/ALF hepatic disorder.
[0051] FIG. 6 describes the sample standardisation, preparation and analysis method. Panel A corresponds to the standardisation and preparation procedure. Panels B and C correspond to the signals of the various signature peptides obtained by LC-SRM analysis.
[0052] FIG. 7 shows the plasma concentrations of BHMT1 (see FIG. 7a) and the plasma concentrations of ADH1 variants A and B (see FIG. 7b) in patients suffering from non-alcoholic steatohepatitis (NASH) compared to healthy donors paired by age and sex (n=11 subjects in each group). The plasma concentrations are mentioned on the y-axis in .mu.g/ml. A Mann-Whitney statistical test was applied with p<0.05 as the level of significance.
[0053] FIG. 8 shows the peptide sequences of the proteins ADH1A (SEQ ID NO. 1), ADH1B (SEQ ID NO. 2), ADH4 (SEQ ID NO. 3 & SEQ ID NO. 4), BHMT1 (SEQ ID NO. 5), BHMT2 (SEQ ID NO. 6 & SEQ ID NO. 7), ARG1 (SEQ ID NO. 8, SEQ ID NO. 9 & SEQ ID NO. 10), FABP1 (SEQ ID NO. 11), GSTA1 (SEQ ID NO. 12) and ALT1 (SEQ ID NO. 13). The analysed peptides of these target proteins are outlined in the protein peptide sequence. These peptides are peptides obtained from the digestion of the target proteins and serve as substitutes for the analysis of these proteins in mass spectrometry.
DETAILED DESCRIPTION
[0054] In the present invention, the term "hepatic disorders" or "liver disorders" or "liver lesions" denotes viral hepatitis, alcoholic hepatitis, drug-induced hepatitis, poisoning-related hepatitis such as that due to fungi or vitamins, autoimmune hepatitis, liver steatosis (NAFLD), steatohepatitis (NASH), cirrhosis and Wilson's disease, with the exclusion of hepatocarcinoma.
[0055] Within the scope of the present invention, the proteins may be assayed by any technique conventionally used by those skilled in the art such as immunological assay methods using specific antibodies or methods based on mass spectrometry. Among the assay methods based on mass spectrometry, mention may be made of AQUA technology (Gerber et al, "Absolute quantification proteins and phosphoproteins from cell lysates by tandem MS" Proc Natl Acad Sci USA. (2003) 100(12):6940-6945) or PSAQ.TM. (Protein Standard Absolute Quantification) technology described in the application WO 2008/145 763.
[0056] The method according to the invention is based on the detection and assay of certain biomarkers obtained from liver cell lysis; these biomarkers are proteins. According to one preferred embodiment of the invention, the assay is performed by mass spectrometry via PSAQ.TM. technology. According to this method, the absolute quantification of a protein by mass spectrometry requires a standard. In the present invention, the term PSAQ.TM. protein or PSAQ.TM. standard or standard protein denotes any isotopically labelled recombinant whole protein, chemically equivalent to the native protein to be assayed. The principle of the PSAQ.TM. method according to the invention is based on the introduction into a biological sample of a known quantity of an isotopically labelled recombinant whole standard protein, identical or equivalent (i.e. structurally similar, it may differ for example by the addition of a purification tag) to the native protein to be assayed. Unlike other absolute quantification methods, a known quantity of the standard protein is injected directly into the biological sample prior to any pre-treatment of this sample. The method according to the invention makes it possible to determine, in biological fluids such as plasma, serum, cerebrospinal fluid or urine, the concentrations of certain target proteins for which they constitute labelled analogues.
[0057] The process according to the invention is advantageously performed on a biological sample originating from a liquid specimen taken from a subject.
[0058] The process according to the invention may particularly by performed on biological fluids such as blood, serum, plasma, urine, cerebrospinal fluid, saliva, tear fluids, preferably on blood, plasma and/or serum.
PSAQ.TM. Standards--Standard Proteins
[0059] Numerous proteins are involved in the metabolic functions of the liver. According to the invention, the proteins suitable for characterising liver lesions are chosen according to the predominant hepatic expression thereof and the high detectability thereof in plasma, i.e. ADH1A and ADH1B, ADH4, ARG1, BHMT (sequence variants 1 and 2), FABP1, GSTA1 and ALT1.
[0060] Alcohol dehydrogenases (ADH) are oxidoreductases involved in detoxifying the body by eliminating toxic alcohols. A plurality of types of ADH exist (variants or isoforms). In respect of ADH1, there are three variants: ADH1A, ADH1B and ADH1C. These variants have been studied genetically. Duell et al. demonstrated the influence of certain genetic mutations of ADH, particularly on susceptibility to alcoholism and the risks of gastric cancer in subjects carrying these genetic mutations ("Genetic variation in alcohol dehydrogenase (ADH1A, ADH1B, ADH1C, ADH7) and aldehyde dehydrogenase (ALDH2), alcohol consumption and gastric cancer risk in the European prospective investigation into cancer and nutrition (EPIC) cohort", Carcinogenesis vol. 33, no. 2, p 361-367 (2012)).
[0061] ADH1A (SEQ ID NO. 1) and ADH1B (SEQ ID NO. 2) are involved in the oxidation of ethanol and play a major role in the catabolism of ethanol. ADH4 is involved in the oxidation of aliphatic alcohols and/or aromatic alcohols. ADH4 exists in the form of two isoforms (SEQ ID NO. 3 & SEQ ID NO. 4). In the study, the inventors looked at ADH1B but also at the mixture of the variants ADH1A and ADH1B.
[0062] BHMT (Betaine-homocysteine-methyltransferase) is a zinc-based metalloenzyme which is involved in the metabolism of homocysteine, glycine, serine, threonine and also methionine. This term BHMT denotes the sequence variants BHMT1 (SEQ ID NO. 5), BHMT2, as well as the isoforms of BHMT2 (SEQ ID NO. 6 & SEQ ID NO. 7).
[0063] Arginase ARG1 is a hydrolase; this manganese-based hepatic metalloenzyme is involved in the urea cycle. The term ARG1 denotes the three isoforms of arginase 1 (SEQ ID NO. 8, SEQ ID NO. 9 & SEQ ID NO. 10).
[0064] FABP1 ("Fatty acid-binding protein, Liver"; SEQ ID NO. 11) is liver-specific fatty acid-binding protein used to transport fatty acids from cell membranes to the mitochondria.
[0065] Glutathione S-transferases (GSTA) are enzymes which catalyse conjugation reactions of reduced glutathione (GSH) with xenobiotics in order to detoxify same. In this study, the inventors studied the variant GSTA1 (SEQ ID NO. 12) but also the pool of a plurality of variants in particular the pool of the variants GSTA1, GSTA2, GSTA3 and the pool of the 4 variants GSTA1, GSTA2, GSTA3 and GSTA5.
[0066] Cytosolic alanine aminotransaminase 1 or ALT1 (SEQ ID NO. 13), also known as glutamate-pyruvate transaminase 1, is an enzyme belonging to the transaminases playing an essential role in the intermediate metabolism of glucose. This protein is known as a biomarker of liver lesions induced by certain medicinal products, alcohol, and by steatosis.
[0067] Table 1 summarises certain properties of these proteins.
[0068] The proteins ADH1A and ADH1B, ADH4, ARG1, BHMT (variants 1 and 2), FABP1, GSTA1 and ALT1 are essentially expressed in the liver. In a healthy subject, these proteins are essentially present in the liver (hepatocytes) and in some other different cell types. This is the case, for example, of the protein ADH1B which is detectable in merely three different cell types among the 80 analysed (see table 1, human protein atlas). By way of comparison and according to the human protein atlas, in healthy tissue (www.proteinatlas.org), ALT1 which is a routine marker of liver lesions is expressed in 29 cell types among the 78 analysed. The proteins ADH1A and ADH1B, ADH4, ARG1, BHMT (variants 1 and 2), FABP1, GSTA1 are therefore more liver-specific than ALT1.
TABLE-US-00001 TABLE 1 Biomarkers selected in the process according to the invention for monitoring hepatic disorders Number of cell types in healthy tissue in Protein (SEQ Uniprot which protein is Molecular Biochemical ID NO.) ID detected (a) mass [Da] function ADH1B (SEQ P00325 3 out of 80 analysed 39,855 Xenobiotic ID NO. 2) metabolism ADH1A (SEQ P07327 Hepatocytes 39859 Xenobiotic ID NO. 1) metabolism ADH4 (SEQ P08319 6 out of 83 analysed 40,222 Xenobiotic ID NO. 3 & metabolism SEQ ID NO. 4) ARG1 (SEQ P05089 2 out of 83 analysed 34,735 Nitrogen ID NO. 8, metabolism SEQ ID NO. 9 and urea & SEQ ID cycle NO. 10) BHMT1 (SEQ Q93088 3 out of 83 analysed 44,998 Homo- ID NO. 5) cysteine metabolism FABP1 (SEQ P07148 7 out of 83 analysed 14,208 Lipid ID NO. 11) metabolism and lipid transport GSTA1 (SEQ P08263 16 out of 81 25,631 Xenobiotic ID NO. 12) analysed and glutathione metabolism (a) Source: The Human Protein Atlas (www.proteinatlas.org)
[0069] According to the invention, further biomarkers such as the protein cytokeratin 18 (CK18) may be used as a supplementary analysis in order to confirm a liver disorder and establish a diagnosis. Indeed, when hepatocytes are exposed chronically to oxidative stress and to toxic substances, they swell, store fat and exhibit disruption in the keratin filament network, and form Mallory bodies, i.e. residual clusters of microfilaments. A Mallory body is made up of abnormally phosphorylated and cross-linked keratins, such as the cytokeratin CK18. It is known that hepatocytes containing Mallory bodies are sensitive to apoptosis, inducing a significant release of CK18 proteins and Mallory bodies into the blood. The publication by Maher et al. publication de Maher et al. "Cytokeratin 18 as a non invasive marker in diagnosis of NASH and its usefulness in correlation with disease severity in Egyptian patients" published in The Egyptian Journal of Medical Human Genetics (2015) 16, p. 41 to 46, describes CK18 as a non-invasive marker suitable for correlating the concentration thereof with the degree of NASH severity. Indeed, when CK18 protein is released in the blood in whole form (M65 form), it indicates a necrotic phenomenon. When it is released in truncated form (M30 form), it indicates an apoptotic phenomenon. Generally, the blood concentrations of CK18 are measured in these two forms and the ratio between these two forms is computed. CK18 is not expressed specifically in hepatocytes, it is present in glandular epithelia.
Role of Biomarkers
[0070] In the serum or plasma of healthy patients, the proteins ADH1 (variant B or isoforms A and B) and ADH4 are present in concentrations less than 2 .mu.g/ml, ARG1 at concentrations less than 0.3 .mu.g/ml, FABP1 at concentrations less than 1 .mu.g/ml, GSTA1, GSTA2, GSTA2 and GSTA5 at concentrations less than 1 .mu.g/ml, BHMT (variants or isoforms 1 and 2) at concentrations less than 2 .mu.g/ml and ALT1 at concentrations less than 1 .mu.g/ml (these threshold concentrations were assessed after sample analysis according to the protocol described in FIG. 6).
[0071] The Applicant observed that the serum or plasma concentration of the proteins ADH1B, ADH1A and B, ADH4, ARG1, BHMT1 and BHMT1 and 2, FABP1, GSTA1 and ALT1 changes according to the hepatic disorder and the severity thereof.
[0072] According to the observations of the Applicant, the concentration of the proteins ADH1B, ADH1A and ADH1B, ADH4, ARG1, FABP1, GSTA1, BHMT1 and BHMT (variants 1 and 2) increase during the acute phases of liver injury induced by xenobiotics such as paracetamol, and then falls to very low levels during the liver recovery/regeneration period. These kinetics are closely correlated with those of the biological characteristics of this disease such as the prothrombin index. Some of these proteins are expressed more in the liver than others and are therefore more readily quantifiable; this is the case of the proteins ADH4, BHMT (variants 1 and 2), ADH1 (variants ADH1A and ADH1B) which may be advantageously used, individually or combined, as biomarkers for the diagnosis, monitoring and prognosis of ALI or ALF. The protein ARG1 exhibits less pronounced modifications of the plasma or serum concentration thereof, but correlated with the stage of the disorder (acute phase/recovery phase).
[0073] The markers ADH1 (ADH1B only or combination of ADH1B and ADH1A), ADH4 and BHMT (variant 1 only or combination of both variants 1 and 2) may enable early identification of liver lesions induced by medicinal products such as paracetamol, so as to adapt the patient's medical care (in particular recourse to a liver transplant). Furthermore, unlike transaminase markers (of which ALT1) and CK18 wherein the concentrations may remain elevated, these ADH1 markers (ADH1B only or combination of ADH1B and ADH1A), ADH4 and BHMT (variant 1 only or combination of both variants 1 and 2) exhibit low serum levels during spontaneous liver regeneration.
[0074] In the case of liver disorders not induced by medicinal products, a modification of the plasma/serum concentrations of the biomarkers, particularly of the proteins ADH1 (ADH1B and/or ADH1B and ADH1A), ADH4 and BHMT (variant 1 only or combination of both variants 1 and 2) is observed at lower levels than with paracetamol but it is consistent with the patient's clinical status.
[0075] According to one embodiment of the invention, the markers ADH1 (ADH1B and/or (ADH1B and ADH1A)), ADH4, ARG1, FABP1, GSTA1, ALT1 and BHMT (variant 1 and/or the mixture of both variants 1 and 2) may be used for the detection of a liver lesion.
[0076] The detection of a liver lesion may be demonstrated by the detection and/or quantification of the marker ADH1, preferably the marker ADH1B and/or the pool of ADH1A and ADH1B.
[0077] The detection of a liver lesion may be demonstrated by the detection and/or quantification of the marker ADH1 ((ADH1B and/or (ADH1B and ADH1A)) and at least one additional marker, at least two additional markers, at least three additional markers, at least four additional markers, at least five additional markers or at least six additional markers chosen among: ADH4, BHMT (variant 1 and/or combination of both variants 1 and 2), ARG1, FABP1, GSTA1 and ALT1.
[0078] The detection of a liver lesion may be demonstrated by the detection and/or quantification of two biomarkers specifically, such as ADH1 ((ADH1B and/or (ADH1B and ADH1A)) and ADH4; ADH1 (ADH1B and/or (ADH1B and ADH1A)) and BHMT (variant1 and/or a mixture of both variants 1 and 2); ADH1 (ADH1B and/or (ADH1B and ADH1A)) and ARG1; ADH1 (ADH1B and/or (ADH1B and ADH1A)) and FABP1; ADH1 (ADH1B and/or (ADH1B and ADH1A)) and GSTA1 or of the 2 biomarkers ADH1 (ADH1B and/or (ADH1B and ADH1A)) and ALT1.
[0079] The detection of a liver lesion may be demonstrated by the detection and/or quantification of three biomarkers specifically, such as ADH1 (ADH1B and/or (ADH1B and ADH1A)), ADH4 and BHMT (variant 1 and/or a mixture of both variants 1 and 2); ADH1 (ADH1B and/or (ADH1B and ADH1A)), ADH4 and ARG1; ADH1 (ADH1B and/or (ADH1B and ADH1A)), ADH4 and FABP1; ADH1 (ADH1B and/or (ADH1B and ADH1A)), ADH4 and GSTA1; ADH1 (ADH1B and/or (ADH1B and ADH1A)), ADH4 and ALT1; ADH1 (ADH1B and/or (ADH1B and ADH1A)), BHMT (variant 1 and/or a mixture of both variants 1 and 2) and ARG1; ADH1 (ADH1B and/or (ADH1B and ADH1A)), BHMT (variant 1 and/or a mixture of both variants 1 and 2) and FABP1; ADH1 (ADH1B and/or (ADH1B and ADH1A)), BHMT (variant 1 and/or a mixture of both variants 1 and 2) and GSTA1; ADH1 (ADH1B and/or (ADH1B and ADH1A)), BHMT (variant 1 and/or a mixture of both variants 1 and 2) and ALT1; ADH1 (ADH1B and/or (ADH1B and ADH1A)), ARG1 and FABP1; ADH1 (ADH1B and/or (ADH1B and ADH1A)), ARG1 and GSTA1; ADH1 (ADH1B and/or (ADH1B and ADH1A)), ARG1 and ALT1; ADH1 (ADH1B and/or (ADH1B and ADH1A)), FABP1 and GSTA1; ADH1 (ADH1B and/or (ADH1B and ADH1A)), FABP1 and ALT1 or of the 3 biomarkers ADH1 (ADH1B and/or (ADH1B and ADH1A)), GSTA1 and ALT1.
[0080] The detection of a liver lesion may be demonstrated by the detection and/or quantification of four biomarkers specifically, such as ADH1 (ADH1B and/or (ADH1B and ADH1A)), ADH4, BHMT (variant 1 and/or a mixture of both variants 1 and 2) and ARG1; ADH1 (ADH1B and/or (ADH1B and ADH1A)), ADH4, BHMT (variant 1 and/or a mixture of both variants 1 and 2) and FABP1; ADH1 (ADH1B and/or (ADH1B and ADH1A)), ADH4, BHMT (variant 1 and/or a mixture of both variants 1 and 2) and GSTA1; ADH1 (ADH1B and/or (ADH1B and ADH1A)), ADH4, BHMT (variant 1 and/or a mixture of both variants 1 and 2) and ALT1; ADH1 (ADH1B and/or (ADH1B and ADH1A)), ADH4, ARG1 and FABP1; ADH1 (ADH1B and/or (ADH1B and ADH1A)), ADH4, ARG1 and GSTA1; ADH1 (ADH1B and/or (ADH1B and ADH1A)), ADH4, ARG1 and ALT1; ADH1 (ADH1B and/or (ADH1B and ADH1A)), ADH4, FABP1 and GSTA1; ADH1 (ADH1B and/or (ADH1B and ADH1A)), ADH4, FABP1 and ALT1; ADH1 (ADH1B and/or (ADH1B and ADH1A)), ADH4, GSTA1 and ALT1; ADH1 (ADH1B and/or (ADH1B and ADH1A)), BHMT (variant 1 and/or a mixture of both variants 1 and 2), ARG1 and FABP1; ADH1 (ADH1B and/or (ADH1B and ADH1A)), BHMT (variant 1 and/or a mixture of both variants 1 and 2), ARG1 and GSTA1; ADH1 (ADH1B and/or (ADH1B and ADH1A)), BHMT (variant 1 and/or a mixture of both variants 1 and 2), ARG1 and ALT1; ADH1 (ADH1B and/or (ADH1B and ADH1A)), BHMT (variant 1 and/or a mixture of both variants 1 and 2), FABP1 and GSTA1; ADH1 (ADH1B and/or (ADH1B and ADH1A)), BHMT (variant 1 and/or a mixture of both variants 1 and 2), FABP1 and ALT1; ADH1 (ADH1B and/or (ADH1B and ADH1A)), BHMT (variant 1 and/or a mixture of both variants 1 and 2), GSTA1 and ALT1; ADH1 (ADH1B and/or (ADH1B and ADH1A)), ARG1, FABP1 and GSTA1; ADH1 (ADH1B and/or (ADH1B and ADH1A)), ARG1, FABP1 and ALT1; ADH1 (ADH1B and/or (ADH1B and ADH1A)), ARG1, GSTA1 and ALT1 or of the four markers ADH1 (ADH1B and/or (ADH1B and ADH1A)), FABP1, GSTA1 and ALT1.
[0081] The detection of a liver lesion may be demonstrated by the detection and/or quantification of five biomarkers specifically, such as ADH1 (ADH1B and/or (ADH1B and ADH1A)), ADH4, BHMT (variant 1 and/or a mixture of both variants 1 and 2), ARG1 and FABP1; ADH1 (ADH1B and/or (ADH1B and ADH1A)), ADH4, BHMT (variant 1 and/or a mixture of both variants 1 and 2), ARG1 and GSTA1; ADH1 (ADH1B and/or (ADH1B and ADH1A)), ADH4, BHMT (variant 1 and/or a mixture of both variants 1 and 2), ARG1 and ALT1; ADH1 (ADH1B and/or (ADH1B and ADH1A)), ADH4, BHMT (variant 1 and/or a mixture of both variants 1 and 2), FABP1 and GSTA1; ADH1 (ADH1B and/or (ADH1B and ADH1A)), ADH4, BHMT (variant 1 and/or a mixture of both variants 1 and 2), FABP1 and ALT1; ADH1 (ADH1B and/or (ADH1B and ADH1A)), ADH4, BHMT (variant 1 and/or a mixture of both variants 1 and 2), GSTA1 and ALT1; ADH1 (ADH1B and/or (ADH1B and ADH1A)), ADH4, ARG1, FABP1 and GSTA1; ADH1 (ADH1B and/or (ADH1B and ADH1A)), ADH4, ARG1, FABP1 and ALT1; ADH1 (ADH1B and/or (ADH1B and ADH1A)), ADH4, ARG1, GSTA1 and ALT1; ADH1 (ADH1B and/or (ADH1B and ADH1A)), ADH4, FABP1, GSTA1 and ALT1; ADH1 (ADH1B and/or (ADH1B and ADH1A)), BHMT (variant 1 and/or a mixture of both variants 1 and 2), ARG1, FABP1 and GSTA1; ADH1 (ADH1B and/or (ADH1B and ADH1A)), BHMT (variant 1 and/or a mixture of both variants 1 and 2), ARG1, FABP1 and ALT1; ADH1 (ADH1B and/or (ADH1B and ADH1A)), BHMT (variant 1 and/or a mixture of both variants 1 and 2), ARG1, GSTA1 and ALT1; ADH1 (ADH1B and/or (ADH1B and ADH1A)), BHMT (variant 1 and/or a mixture of both variants 1 and 2), FABP1, GSTA1 and ALT1 or the five biomarkers ADH1 (ADH1B and/or (ADH1B and ADH1A)), ARG1, FABP1, GSTA1 and ALT1.
[0082] The detection of a liver lesion may be demonstrated by the detection and/or quantification of six biomarkers specifically, such as ADH1 (ADH1B and/or (ADH1B and ADH1A)), ADH4, BHMT (variant 1 and/or a mixture of both variants 1 and 2), ARG1, FABP1 and GSTA1; ADH1 (ADH1B and/or (ADH1B and ADH1A)), ADH4, BHMT (variant 1 and/or a mixture of both variants 1 and 2), ARG1, FABP1 and ALT1; ADH1 (ADH1B and/or (ADH1B and ADH1A)), ADH4, BHMT (variant 1 and/or a mixture of both variants 1 and 2), ARG1, GSTA1 and ALT1; ADH1 (ADH1B and/or (ADH1B and ADH1A)), ADH4, BHMT (variant 1 and/or a mixture of both variants 1 and 2), FABP1, GSTA1 and ALT1; ADH1 (ADH1B and/or (ADH1B and ADH1A)), ADH4, ARG1, FABP1, GSTA1 and ALT1 or the six biomarkers ADH1 (ADH1B and/or (ADH1B and ADH1A)), BHMT (variant 1 and/or a mixture of both variants 1 and 2), ARG1, FABP1, GSTA1 and ALT1;
[0083] The detection of a liver lesion may be demonstrated by the detection and/or quantification of seven biomarkers specifically i.e. ADH1 (ADH1B and/or (ADH1B and ADH1A)), ADH4, BHMT (variant 1 and/or a mixture of both variants 1 and 2), ARG1, FABP1, GSTA1 and ALT1.
[0084] In one particular embodiment, in addition to the marker ADH1 (ADH1B and/or ADH1A)), the marker ADH4 and/or BHMT will be preferentially used; in the case of liver lesions, the plasma/serum concentration of ADH4 and that of BHMT is elevated and readily quantifiable.
[0085] In one preferred embodiment, the detection of a liver lesion is demonstrated by the detection and/or quantification of the three biomarkers ADH1 (ADH1B and/or ADH1A)), ADH4 and BHMT (variant 1 and/or a mixture of both variants 1 and 2).
[0086] In a preferred embodiment, the liver lesions may be detected by analysing three biomarkers among the proteins: ADH1 (ADH1B and/or ADH1A)), ADH4, ARG1, FABP1, GSTA1, ALT1 and BHMT (variant 1 and/or combination of both variants 1 and 2).
[0087] Advantageously, the more the detection of a liver lesion involves biomarkers, the more the analysis of the liver disorder will be enhanced.
Process for the Specific Detection and Absolute Quantification of Protein Biomarkers
[0088] The specific detection and absolute quantification of protein biomarkers in biological fluids may be carried out in different ways. In a medical testing laboratory, biomarkers are routinely detected and quantified using immunological processes. This infers the availability of an antibody binding specifically with the protein to be assayed. Mass spectrometry makes it possible to detect and assay molecules, and more particularly peptides, directly and without having an antibody. As such mass spectrometry techniques have been developed over the last decade, particularly methods known as the acronyms SRM ("Selected Reaction Monitoring") and MRM ("Multiple Reaction Monitoring") making it possible to quantify one or a plurality of target molecules in a complex biological sample.
[0089] However, absolute quantification (i.e. the determination of the concentration of the target molecules) by mass spectrometry requires quantification standards. It is possible to use different types of quantification standards which may correspond to isotopically labelled peptides, labelled peptide concatemers, isotopically labelled protein fragments or isotopically labelled whole proteins (see the publications Brun et al, "Isotope dilution strategies for absolute quantitative proteomics." Journal of Proteomics (2009) 72(5) pages 740-749 and Zeiler et al, "A Protein Epitope Signature Tag (PrEST) library allows SILAC-based absolute quantification and multiplexed determination of protein copy numbers in cell lines." Molecular and Cellular Proteomics (2012) 11(3):0111.009613). In any case, the standards generate or correspond to signature peptides which are peptides obtained from the digestion of the target proteins and which serve as substitutes for the analysis of these proteins in mass spectrometry (the preparation and analysis of the signature peptides are described hereinafter). Among these quantification approaches, and as mentioned in the document WO 2008/145 763 A1, the combined use of mass spectrometry in SRM or MRM mode and of standard proteins, isotopically labelled analogues of the target biomarkers (PSAQ.TM. standards) and introduced in a known quantity into a sample, makes it possible to specifically detect and accurately and precisely quantify, in this sample, the target biomarkers.
[0090] The term "homologous isotopically labelled protein of the targeted marker or target biomarker" or "standard protein" denotes any protein possessing the same amino acid sequence as the native protein that it is sought to assay and certain atoms whereof are replaced by atoms labelled with stable isotopes. Advantageously, certain specific amino acids may be isotopically labelled, such as arginine and lysine. In this case, the arginine and lysine residues of the standard proteins are uniformly labelled with carbon and nitrogen isotopes, i.e. .sup.13C and .sup.15N. According to the invention, advantageously, the standard is introduced into the biological sample such that the final concentration thereof in the biological sample is between 0.5 and 5 .mu.g/mL, for acute liver diseases such as ALI or ALF. In the case of non-alcoholic or alcoholic steatohepatitis, the standard is introduced at a concentration between 20 and 200 ng/mL. According to the nature of the targeted protein, optimal concentrations for calibration have been determined for each of the standard proteins and presented hereinafter in table 2.
TABLE-US-00002 TABLE 2 Optimal concentration (.mu.g/mL) of standard protein in biological sample by standard protein type (case of ALI/ALF acute hepatic disorders) Standard protein Optimal concentration (.mu.g/mL) of (PSAQ .TM. standard) standard protein in biological sample ARG1 1 BHMT1 2 GSTA1 1 ADH1B 3 ADH4 2 FABP1 1 ALT1 3
[0091] In one preferred embodiment of the invention, the biomarkers are not detected directly but by means of peptide subunits, referred to as "signature peptides". The term "signature peptide" denotes herein any peptide having an amino acid sequence between 5 and 30 amino acids, which is included in the sequence of the marker to be analysed, suitable for specifically identifying in a biological sample the presence of said marker. Advantageously, these signature peptides are generated by enzymatic or chemical digestion of the sample or of a fraction thereof, as explained in more detail hereinafter. More particularly, the selected biomarkers are identified by detecting proteolytic peptides obtained after digesting proteins contained in the biological sample, i.e. signature peptides suitable for quantifying the markers in the biological sample, as mentioned in the document WO 2008/145 763 A1. These signature peptides are suitable for monitoring these biomarkers and in particular the predominant isoforms thereof in the liver. Indeed, certain signature peptides (see FIG. 8) are shared between a plurality of isoforms, such as ADH1 where the signature peptide INEGFDLLHSGK is suitable for monitoring both ADH1B and ADH1A, such as BHMT with the isoforms BHMT1 and BHMT2 or GSTA with the isoforms GSTA1, GSTA2, GSTA3 or GSTA5 (see table 3, FIG. 8).
TABLE-US-00003 TABLE 3 Signature peptides of the biomarkers used in the process according to the invention and generated by digestion with trypsin or a mixture of trypsin and endolysC Biomarker Signature peptide Peptide sequence Peptide specificity of of marker of identification with respect to interest interest (SEQ ID NO.) biomarker ADH1B AAVLWEVK SEQ ID NO. 17 specific ADH1B INEGFDLLHSGK SEQ ID NO. 16 peptide present in ADH1A and ADH1B ADH1B FSLDALITHVLPFEK SEQ ID NO. 15 peptide present in ADH1A and ADH1B ADH1B IDAASPLEK SEQ ID NO. 14 peptide present in ADH1A, ADH1B, ADH1C and ADH1G ADH4 FNLDALVTHTLPFDK SEQ ID NO. 20 specific ADH4 IDDDANLER SEQ ID NO. 18 specific ADH4 IIGIDINSEK SEQ ID NO. 19 specific ARG1 DVDPGEHYILK SEQ ID NO. 25 specific ARG1 TIGIIGAPFSK SEQ ID NO. 24 specific ARG1 EGLYITEEIYK SEQ ID NO. 26 specific BHMT1 EATTEQQLK SEQ ID NO. 21 specific BHMT1 AIAEELAPER SEQ ID NO. 23 peptide present in BHMT1 and BHMT2 BHMT1 EAYNLGVR SEQ ID NO. 22 peptide present in BHMT1 and BHMT2 FABP1 AIGLPEELIQK SEQ ID NO. 27 specific FABP1 FTITAGSK SEQ ID NO. 28 specific FABP1 TVVQLEGDNK SEQ ID NO. 29 specific GSTA1 LHYFNAR SEQ ID NO. 30 specific GSTA1 SHGQDYLVGNK SEQ ID NO. 31 peptide present in GSTA1. GSTA2 and GSTA3 GSTA1 ISNLPTVK SEQ ID NO. 33 peptide present in GSTA1, GSTA2, GSTA3 and GSTA5 GSTA1 AILNYIASK SEQ ID NO. 32 peptide present in GSTA1, GSTA2, GSTA3 and GSTA5 ALT1 ALELEQELR SEQ ID NO. 34 specific ALT1 LLVAGEGHTR SEQ ID NO. 35 specific ALT1 KPFTEVIR SEQ ID NO. 36 peptide present in ALT1 and ALT2
[0092] After introduction into a biological sample of a known quantity of PSAQ.TM. standard protein, identical or structurally very similar to the native protein that it is sought to assay, a digestion step, enzymatic or chemical, may be carried out so as to obtain the proteolytic peptides of the proteins initially present in the sample including the signature peptides of the target biomarkers readily identifiable and quantifiable by LC-MS in SRM or MRM mode. It is also possible to use, instead of the PSAQ standards, isotopically labelled peptide standards (referred to as AQUA peptides for "Absolute quantification" or SIL peptides for "Stable Isotope Labelling"). These labelled standard peptides have an identical sequence to the signature peptides monitored and they are added into the sample immediately before or immediately after the protein digestion step. These standards enable absolute quantification of the target proteins but which is frequently less accurate than quantification using the PSAQ method.
[0093] Advantageously, the digestion of the proteins is performed enzymatically, and more particularly in the presence of a trypsin solution or indeed a mixture of trypsin and EndolysC. The quantity of enzyme used for digestion corresponds generally to an enzyme/protein ratio (by weight) of 1:100 to 1:10. After adding the enzyme sample into the biological sample and incubating at 37.degree. C., so as to generate the proteolytic peptides, the digestion is stopped by adding at least a sufficient quantity of formic acid into the biological sample. The term "proteolytic peptide" denotes any peptide or amino acid sequence obtained from the degradation of a polypeptide, particularly by enzymatic or chemical digestion of said polypeptide.
[0094] The proteolytic peptides (including the signature peptides and isotopically labelled peptides) obtained in this way are subsequently analysed by LC-MS. Note that it is possible to use different types of enzymes to carry out protein digestion. According to the cleavage specificity of the selected enzyme, the signature peptides suitable for detecting and quantifying the target proteins will be different. These signature peptides may be predicted by performing in silico digestion of the target proteins (the amino acid sequence whereof is known). The detectability in mass spectrometry thereof is subsequently verified experimentally. Table 3 lists signature peptides obtained and monitored after digestion with trypsin or a mixture of trypsin and endolysC. EndolysC is an endoproteinase Lys-C.
[0095] So as to facilitate the isolation and identification of the proteins present in the biological samples, a pre-treatment step of the biological sample may advantageously be carried out. Indeed, this step makes it possible to remove at least partially the non-targeted abundant proteins present in the biological sample and thereby increase the sensitivity of detection of the target biomarkers while retaining the integrity of the PSAQ.TM. standard (standard protein) and of the target biomarker.
[0096] So as to retain, in the course of the process, the integrity of the target biomarkers and of the PSAQ.TM. standards, a plurality of pre-treatment modes may be used, such as the depletion of abundant proteins using an affinity chromatography device (immunodepletion), a chemical reagent having an affinity for albumin (cibacron blue type) or a process for glycodepletion of the biological sample (see FIG. 1). These pre-treatment methods are known per se.
[0097] Abundant protein depletion is an affinity method suitable for extracting at least partially the majority proteins from serum, i.e. abundant proteins such as albumin, IgG, transferrin or IgA.
[0098] Glycodepletion is a method suitable for capturing and extracting at least partially the glycoproteins present in the biological sample so as to leave in the biological sample the other proteins such as the target biomarkers which are not glycosylated. In the process which is the subject of the diagram according to FIG. 1, the glycoproteins are captured by magnetic beads functionalised with hydrazide.
[0099] In order to avoid performing a sensitive detection and an exact quantification of the target biomarkers, a suitable sample pre-treatment mode for each biomarker is chosen. As such, the proteins ARG1, ADH1 (variant A and B), BHMT (variants 1 and 2) and GSTA1 will be preferentially treated by abundant protein depletion by affinity chromatography and the proteins ADH4, FABP1, ALT1 and BHMT by glycodepletion.
[0100] After treating the biological sample, an additional biological sample treatment step may be performed by electrophoresis. This step makes it possible to refine the extraction of the proteins of interest. This electrophoresis step may be performed on acrylamide gel. In this case, the enzymatic digestion is also performed in gel.
[0101] An additional enrichment step of the target peptides by immunoaffinity prior to any analysis by LC-MS in SRM or MRM mode may advantageously be carried out. This helps facilitate the detection and quantification of these peptides by mass spectrometry.
[0102] The proteolytic peptides are subsequently analysed by LC-MS in SRM mode. Calibration curves were produced for each biomarker so as to assess the analytical performances of the assay and ensure the reliability of the quantification of the target biomarkers in the biological sample. The calibration curves were produced using samples containing an increasing quantity of non-labelled protein and a constant quantity of PSAQ.TM. standard protein, these samples having undergone the same treatments as the biological sample wherein it is sought to detect and quantify a target biomarker, i.e. pre-treatments and/or a digestion. Blanks containing merely endogenous proteins are also produced. All the calibration points are performed several times for reproducibility purposes (see FIGS. 2 and 3).
[0103] The quantification results obtained for the various signature peptides of each target biomarker are consistent and demonstrate that the process according to the invention makes it possible to detect and quantify target biomarkers with precision. The quantification results are shown hereinafter in table 4 for each biomarker and for each signature peptide obtained after immunodepletion or glycodepletion. Table 4 shows the lower limit of detection (LLD) of the various proteins determined by the calibration curves described above and the lower limit of quantification (LLQ) defined as being equal to 3 times the LLD.
[0104] The LC-SRM analyses were carried out on a QTRAP type mass spectrometer in a range from 400 to 1000 m/z. Prior to any analysis, the proteolytic peptides may be concentrated on a pre-column and separated on a liquid chromatography column in gradient mode so as to facilitate the subsequent analysis.
[0105] The identification of the peaks of each peptide was carried out using Skyline software, known to mass spectrometry specialists. In addition to the evaluation of the peptide signal (composite signal), all the transitions are inspected individually and excluded if they are deemed unsuitable for quantification (poor signal-to-noise ratio, obvious interferences). The ratios of the peak areas relative to the labelled and non-labelled peptides are computed for each SRM transition. These ratios are subsequently used to determine the corresponding mean ratio, and finally the mean ratio of the abundance of the target protein is computed on the basis of the ratios obtained for the various signature peptides. The concentration of the biomarkers was subsequently computed on the basis of the mean ratio obtained for each of the proteins. The lower limit of detection (LLD) was determined according to the calibration curve method and the lower limit of quantification (LLQ) is defined as being equal to 3 times the LLD. L'. For each patient, the concentration of the target biomarkers is determined at different times t during their hospitalisation.
TABLE-US-00004 TABLE 4 Analytical performance of the test for each target biomarker (limit of detection). Tested concen- Bio- tration Pre- Precision chemical range cision LLD LLQ at LLQ Protein Signature peptide method [ug/ml] [%] [.mu.g/ml] [.mu.g/ml] (CV in %) ADH1B INEGFDLLHSGK MARS 0.81-73.5 79 10.66 31.99 41 IDAASPLEK 95 0.72 2.17 22-26 FSLDALITHVLPFEK 97 0.77 2.30 ND AAVLWEVK 112 2.01 2.30 3-13 ARG1 DVDPGEHYILK MARS 0.04-1.50 146 0.31 0.94 9 TIGIIGAPFSK 118 0.30 0.90 4-8 EGLYITEEIYK 138 0.31 0.92 6.15 BHMIT1 AIAEELAPER MARS 1.50-145.8 114 1.38 4.15 12-19 EAYNLGVR 88 3.49 10.48 15-40 EATTEQQLK 83 2.04 6.11 6-15 GSTA1 ISNLPTVK MARS 0.09-3.43 121 0.30 0.91 6-10 LHYFNAR 132 0.32 0.97 10-14 AILNYIASK 124 0.29 0.87 7-10 SHGQDYLVGNK 125 0.41 1.24 9-11 ADH4 FNLDALVTHTLPFDK Glyco- 0.25-24.8 139 1.59 4.77 9-16 IDDDANLER depletion 148 1.75 5.25 8-10 IIGIDINSEK 136 1.60 4.81 0-8 BHMT1 AIAEELAPER Glyco- 0.60-79.5 143 6.53 19.58 8 EAYNLGVR depletion 151 4.15 12.45 NA EATTEQQLK 136 6.17 18.52 2-6 FABP1 AIGLPEELIQK Glyco- 0.18-3.69 110 0.71 2.13 2-13 FTITAGSK depletion 114 0.64 1.91 5-14 TVVQLEGDNK 108 0.66 1.99 1-8 ALT1 ALELEQELR Glyco- 0.40-8.10 96 1.21 3.62 6-14 LLVAGEGHTR depletion 92 1.10 3.29 15 KPFTEVIR 117 2.17 6.52 9-10
[0106] In patients suffering from acute liver injury (ALI) or failure (ALF), serum concentrations of biomarkers (in particular ADH1B, ADH1A and ADH1B, ADH4 and BHMT1, BHMT1 and BHMT2) rise rapidly during the acute phase and fall to very low levels during liver regeneration (FIGS. 4 and 5). These serum kinetics are correlated with the progression of conventional biological monitoring parameters (clotting parameters, transaminases, and CK18) but the concentrations of the biomarkers ADH1B, ADH and ADH1A, ADH4, BHMT1, BHMT1 and BHMT2 are restored earlier. These results suggest that these biomarkers may be very useful for enhancing the biological monitoring of the patient, assessing the prognosis earlier (liver regeneration or worsening) and assisting with the liver transplant decision. In the case of paracetamol-induced acute or fulminant hepatitis, the rapid and strong increases in the serum concentrations of the biomarkers may be useful for the early identification of the aetiology, which is decisive for the rapid administration of treatment and a favourable prognosis.
[0107] These biomarkers may also be used for assessing the toxicity of chemical molecules (candidate medicinal products), medicinal products (pharmacovigilance) or other xenobiotics on humans or on animal models, or on in vitro models (liver cell line cultures). In humans and animals, the assay may be performed on biological fluids. In the case of in vitro models, this assay will be performed using the culture medium.
EXAMPLES
[0108] The invention is illustrated hereinafter by examples which however do not restrict the invention. These examples relate to a method for in vitro diagnosis of hepatic disorders from a biological sample and the use thereof, particularly for detecting acute liver injury or non-alcoholic steatohepatitis in a patient.
Standard Protein Preparation
[0109] Non-labelled recombinant proteins were purchased from Abcam. Isotopically labelled proteins (PSAQ.TM. standards) were synthesised using: either an acellular protein expression system in the presence of [.sup.13C.sub.6, I.sup.5N.sub.2] L-lysine and [.sup.13C.sub.6, .sup.15N.sub.4] L-arginine (Eurisotop, Saint Aubin, France), as described in the publication by Lebert et al., "Production and use of stable isotope-labelled proteins for absolute quantitative proteomics" published in Methods in Molecular Biology vol. 753, p. 93-115 (2011), i.e. an expression system corresponding to an Escherichia coli strain auxotrophic for lysine and arginine as described in the article by Picard et al., "PSAQ.TM. standards for accurate MS-based quantification of proteins: from the concept to biomedical applications" J Mass Spectrom. 2012; 47(10), p. 1353-1363.
[0110] The purity of the standard proteins was verified (>95% purity) and quantified by amino acid analysis as described in the publication by Louwagie et al. "Introducing AAA-MS, a rapid and sensitive method for amino acid analysis using isotope dilution and high-resolution mass spectrometry" published in Journal of Proteome Research vol. 11, p 3929-3936 (2012). For this purpose, the PSAQ.TM. proteins were hydrolysed in an acid process in the presence of a known quantity of a reference protein bovine serum albumin supplied by the National Institute of Standards and Technology (United States). The amino acids originating from the PSAQ.TM. proteins were quantified by high-resolution mass spectrometry by comparing the signals emitted by the labelled amino acids originating from the PSAQ.TM. protein and the non-labelled analogues thereof originating from the bovine serum albumin. The incorporation of isotopically labelled amino acids, as determined by LC-MS and LC-SRM (liquid chromatography-mass spectrometry in selected reaction monitoring mode), was greater than 99%.
Preparation of a Biological Sample
[0111] Thirteen patients with acute liver injury (ALI) were recruited at the hepatology department of Hopital Paul Brousse (Villejuif, France). The acute liver injury of these patients was detected by elevated transaminase activity reflecting the active liver cell lysis present in these patients' blood, clotting disorders with an INR (International Normalised Ratio)>1.5 and by the absence in these patients of pre-existing liver disease.
[0112] Among these patients, four presented with hepatic encephalopathy (grade>=1) in less than 26 weeks after the onset of the symptoms and were categorised as ALF patients (see table 5). Serum samples from these patients were supplied by the Biological Resources Centre of the Paris-Sud Faculty of Medicine, France (accreditation number: 2011/39938). Etablissement Francais du Sang (Etablissement Francais du Sang, La Tranche, France) supplied seven anonymous serum samples from healthy donors. These serum samples were subsequently collected in untreated tubes (BD Biosciences, Le Pont de Claix, France) and were centrifuged at 1000 g for 15 min to obtain the serum. Serum samples were aliquoted and immediately frozen at -80.degree. C. prior to any subsequent use. For each patient, multiple serum samples were taken at multiple sampling days during hospitalisation. Analyses were conducted on each patient so as to ensure that these patients did not suffer from hepatitis A, B and/or C virus. All the patients were screened for hepatitis A, B and C virus (HAV, HBV, HCV) and were found to be negative for all these viruses. The biological parameters of the liver injury (INR, prothrombin time (PT), transaminase, bilirubin, platelet and creatinine levels) were determined using standard methods. The levels of soluble CK18 protein and of cleaved caspase-cytokeratin 18 protein (CK18Asp396) present in the serum were measured using ELISA M65 and M30Apoptosense kits (Peviva, Sweden). The calibration curves were determined using human plasma purchased from Sigma Aldrich (Saint Quentin Fallavier, France).
TABLE-US-00005 TABLE 5 Clinical and biological characteristics of patients suffering from ALI (Acute liver injury) or ALF Sample collection ALT CK18 Patient at x d after Age activity PI* ALI or CK18 Asp396 number hospitalisation Aetiology Sex (years) (U/L) (%) INR ** ALF ** Outcome (U/L) (U/L) 1 0 Paracetamol F 20 1489 9 16 ALI Alive 13800 3333 10 402 59 1.42 1048 944 2 0 Paracetamol F 29 634 19 4.8 ALF Alive N/A N/A 2 4565 17 5.45 N/A N/A 3 8118 18 4.73 N/A N/A 3 0 Paracetamol F 24 6410 21 3.82 ALI Alive 22243 5691 3 2295 66 1.31 1618 479 4 0 Paracetamol F 18 2653 31 2.6 ALI Alive 19806 7212 2 1900 57 1.45 1618 479 5 0 Paracetamol M 25 173 41 1.99 ALI Alive N/A N/A 2 2571 26 3.21 N/A N/A 6 683 75 1.2 N/A N/A 6 0 Paracetamol F 23 770 39 2.06 ALI Alive 5138 1379 1 7165 18 4.8 23088 8938 5 1831 89 1.07 956 529 7 0 Medication + M 24 7300 13 7.47 ALI Alive 12138 5350 7 alcohol 481 100 0.89 631 338 8 0 Paracetamol F 16 15480 20 4.17 ALI Alive 21363 533 4 NA 68 1.3 600 254 9 0 Paracetamol + M 57 2710 16 5.53 ALF Deceased 23025 15288 2 alcohol NA 42 1.97 (sepsis) 9956 1117 7 NA 51 1.65 2000 421 10 0 autoimmune F 58 2224 17 5.76 ALF Alive 15638 9933 2 disease 1861 11 10.69 15013 7275 5 NA 66 1.3 1275 450 11 0 autoimmune M 56 2170 31 2.52 ALI Alive 23056 15117 2 disease 1119 16 5.59 6400 2417 12 NA 85 1.11 2256 617 12 0 Herpes F 22 1383 14 6.52 ALF Alive 11669 4863 5 simplex 153 40 2.07 11388 4029 15 virus 133 56 1.1 1088 229 13 0 Medication F 32 892 28 2.8 ALI Alive 14781 7458 2 984 54 1.58 3463 938 3 589 80 1.15 1856 375
Process for In Vitro Diagnosis of Liver Disorders by the Presence and Quantification of a Marker of Interest
[0113] The PSAQ.TM. standard protein is injected directly into the biological sample (serum) prior to any pre-treatment. This approach makes it possible to determine, in biological fluids such as plasma, serum, spinal fluid or urine, the concentrations of certain target proteins such as biomarkers of diseases for which they constitute labelled analogues. A number of pre-treatment methods such as abundant protein depletion (by immunoaffinity or affinity with a chemical reagent) and glycodepletion of the biological sample were envisaged as to retain, during the process, the integrity of the PSAQ.TM. proteins. As such, the proteins ARG1, ADH1B, BHMT1 and GSTA were subjected to abundant protein depletion according to Agilent Technologies MARSX technology and the proteins ADH4, FABP1, ALT1 and BHMT1 to glycodepletion.
Abundant Protein Depletion
[0114] Prior to any pre-treatment, defined quantities of PSAQ.TM. protein (see table 2) were added to 14 .mu.l of serum or plasma previously sampled from a subject, whether they were a carrier of acute liver injury or a healthy donor so as to be able to quantify the presence of the proteins in the subject's serum. The serum-PSAQ.TM. solution was then left incubated for 1 hour at 4.degree. C. under gentle stirring.
[0115] The sample comprising serum (or plasma) and the PSAQ.TM. proteins were deposited on an affinity column suitable for extracting the six most abundant proteins (Albumin, IgG, Transferrin, IgA, haptoglobin and antitrypsin) in serum (MARS technology, spin cartridge from Agilent Technologies, Les Ulis, France) according to the manufacturer's instructions. This method is suitable for extracting almost 85 to 90% of all of the proteins present in serum.
[0116] Following the passage of the serum (or plasma) on the MARS affinity column, the serum samples thereby free from albumin, IgG, transferrin, IgA, haptoglobin and antitrypsin were concentrated up to a volume of 50 .mu.l on an ultrafiltration device having an exclusion limit of 3000 Da (Merck Milliport, Molsheim, France). A solution of 4 M urea and of NH.sub.4HCO.sub.3 at 50 mM was deposited on the sample in the ultrafiltration device so as to exchange the buffer.
[0117] The resulting low-abundance protein concentrates were subsequently subjected to an enzymatic digestion step.
Glycodepletion
[0118] Prior to any pre-treatment, defined quantities of PSAQ.TM. protein (see table 2) were added to 18 .mu.l of serum or plasma previously sampled from a subject, whether they were a carrier of acute liver injury or a healthy donor so as to be able to quantify the presence of this protein in the subject's serum. The serum-PSAQ.TM. solution was then left incubated for 1 hour at 4.degree. C. under gentle stirring.
[0119] The sample of serum or plasma previously taken from a patient, whether they were a carrier of acute liver injury or a healthy donor, and supplemented with PSAQ standards, was mixed with 11 .mu.l of a 0.1 M sodium meta-periodate solution in order to oxidise the glycoproteins and convert the cis-diol groups of the sugars into aldehydes. The sample including glycoproteins bearing aldehyde groups and non-glycosylated proteins was introduced on an affinity column of the Life Technologies GlycoLink kit according to the manufacturer's instructions. The affinity column used comprises an UltraLink resin functionalised with hydrazide. The resin functionalised in this way will be suitable for extracting the glycoproteins present in the serum by creating stable bonds between the hydrazide of the resin and the aldehydes of the previously modified glycoproteins. The non-glycosylated proteins were subsequently eluted by centrifugation in the presence of 400 .mu.l of urea at a concentration of 8M. The sample was concentrated up to 50 .mu.l on an ultrafiltration device having an exclusion limit of 3000 Da and then was subjected to digestion.
Calibration Curves
[0120] In order to be able to quantify the presence of a target protein in a human serum sample, calibration curves were produced after the biological sample pre-treatment steps (FIGS. 2 and 3). For each curve, 5 calibration points were produced by adding an increasing quantity of non-labelled protein and a constant quantity of PSAQ.TM. standard protein to the plasma samples. The quantity of non-labelled proteins added was adjusted so as to cover all the most extreme serum/plasma concentrations in the disease studied. Blanks containing only endogenous biomarkers were also produced. For the 2 lowest calibration points, 4 replicas were produced. These calibration curves made it possible to assess the analytical performances of the assay (linearity of response, precision, accuracy, sensitivity). As demonstrated in FIGS. 2 and 3, the target protein assay has a high performance and may be applied to conventional sample analysis.
Proteolysis
[0121] A digestion solution was prepared using a mixture of EndolysC and trypsin (Promega, Charbonnieres-les-Bains, France) at a protein/enzyme ratio of 1:30 by mass in a solution of 4 M urea and of NH.sub.4HCO.sub.3 at 50 mM at 37.degree. C.
[0122] After 3 hours of incubation, the samples were diluted four times and incubated overnight at 37.degree. C. Digestion was stopped by adding formic acid (0.1% in final concentration). The samples were purified on a SinColumns macro C18 column (Harvard Apparatus, Les Ulis, France) and dried by vacuum centrifugation. The pellets were resolubilised in 15 .mu.l of a solution containing 2% by volume of acetonitrile, formic acid at 0.1% by volume.
[0123] 6 .mu.l of this solution was injected onto the liquid chromatography-mass spectrometer system in SRM mode (LC-SRM).
LC-SRM Analysis
[0124] The LC-SRM analyses were carried out on a 6500 QTrap type mass spectrometer (AB Sciex, Les Ulis, France) equipped with a TurboV source and controlled by Analyst software (version 1.6.1, AB Sciex) in a range from 400 to 1000 m/z. The instrument was coupled with an Ultima 3000 LC chromatography system (Thermo Scientific, Courtaboeuf, France). The chromatography of the samples was carried out using a system combining 2 solvents, solvent A (2% acetonitrile and formic acid at 0.1%) and solvent B (80% acetonitrile, formic acid 0.1%). The proteolytic peptides were concentrated on a 1.times.15 mm C18 PepMap pre-column (Thermo Scientific) and then were separated on a Kinetex XB-C18 column (2.1.times.100 mm, 1.7 .mu.m, 100 .ANG.; Phenomenex, Le Pecq, France) in gradient mode. As such, the graduation elution was carried out so as to modify the concentration of the initial solution from B at 3% to 35% in 30 minutes, then from 35% to 90% in 10 minutes, at a flow rate of 50 .mu.l/min.
[0125] The LC-SRM data analysis and identification of the peaks of each peptide was subsequently carried out using Skyline software. In addition to the assessment of the peptide signal (composite signal originating from multiple transitions), all the transitions were inspected individually and excluded if they were deemed unsuitable for quantification (poor signal-to-noise ratio, obvious interferences). The ratios of the peak areas relative to the labelled and non-labelled peptides were computed for each SRM transition. These ratios were subsequently used to determine the corresponding mean ratio, and finally the mean ratio of the abundance of the target protein was computed on the basis of the ratios obtained for the various signature peptides. The concentration of the biomarkers was subsequently computed on the basis of the mean ratio obtained for each of the proteins. The lower limit of detection (LLD) was determined according to the calibration curve method and the lower limit of quantification (LLQ) is defined as being equal to 3 times the LLD. For each patient, the concentration of the target biomarkers was determined at different times t. FIGS. 4 and 5 show the longitudinal monitoring of the serum concentrations of the different biomarkers in patients suffering from ALI or ALF and for whom the aetiology is either paracetamol (FIG. 4) or another cause (FIG. 5). (see FIGS. 4 and 5). This monitoring is analysed in parallel with the standard clinico-biological parameters (transaminase levels, clotting parameters). In patients with paracetamol-induced ALI/ALF (FIG. 4), the serum concentrations of the biomarkers increase with the progression of the hepatic disorder, in particular the biomarkers ADH1B, ADH1B and ADH1A, BHMT1, BHMT1 and BHMT2, and ADH4 which reach very elevated circulatory concentrations. The concentrations fall while the clinical status and the conventional clinico-biological parameters improve. For patients suffering from ALI/ALF of varied aetiologies, these modifications may also be observed but the serum levels detected are globally lower. FIG. 7 relates to patients suffering from NASH. In these patients, the assay of the target biomarkers in the acute phase of the disease exhibits significantly higher serum concentrations of BHMT1, ADH1A and ADH1B than in healthy donors. This observation demonstrates that the target biomarkers are of interest in NASH diagnosis.
Sequence CWU 1
1
361375PRTHomo sapiens 1Met Ser Thr Ala Gly Lys Val Ile Lys Cys Lys
Ala Ala Val Leu Trp 1 5 10 15 Glu Leu Lys Lys Pro Phe Ser Ile Glu
Glu Val Glu Val Ala Pro Pro 20 25 30 Lys Ala His Glu Val Arg Ile
Lys Met Val Ala Val Gly Ile Cys Gly 35 40 45 Thr Asp Asp His Val
Val Ser Gly Thr Met Val Thr Pro Leu Pro Val 50 55 60 Ile Leu Gly
His Glu Ala Ala Gly Ile Val Glu Ser Val Gly Glu Gly 65 70 75 80 Val
Thr Thr Val Lys Pro Gly Asp Lys Val Ile Pro Leu Ala Ile Pro 85 90
95 Gln Cys Gly Lys Cys Arg Ile Cys Lys Asn Pro Glu Ser Asn Tyr Cys
100 105 110 Leu Lys Asn Asp Val Ser Asn Pro Gln Gly Thr Leu Gln Asp
Gly Thr 115 120 125 Ser Arg Phe Thr Cys Arg Arg Lys Pro Ile His His
Phe Leu Gly Ile 130 135 140 Ser Thr Phe Ser Gln Tyr Thr Val Val Asp
Glu Asn Ala Val Ala Lys 145 150 155 160 Ile Asp Ala Ala Ser Pro Leu
Glu Lys Val Cys Leu Ile Gly Cys Gly 165 170 175 Phe Ser Thr Gly Tyr
Gly Ser Ala Val Asn Val Ala Lys Val Thr Pro 180 185 190 Gly Ser Thr
Cys Ala Val Phe Gly Leu Gly Gly Val Gly Leu Ser Ala 195 200 205 Ile
Met Gly Cys Lys Ala Ala Gly Ala Ala Arg Ile Ile Ala Val Asp 210 215
220 Ile Asn Lys Asp Lys Phe Ala Lys Ala Lys Glu Leu Gly Ala Thr Glu
225 230 235 240 Cys Ile Asn Pro Gln Asp Tyr Lys Lys Pro Ile Gln Glu
Val Leu Lys 245 250 255 Glu Met Thr Asp Gly Gly Val Asp Phe Ser Phe
Glu Val Ile Gly Arg 260 265 270 Leu Asp Thr Met Met Ala Ser Leu Leu
Cys Cys His Glu Ala Cys Gly 275 280 285 Thr Ser Val Ile Val Gly Val
Pro Pro Asp Ser Gln Asn Leu Ser Met 290 295 300 Asn Pro Met Leu Leu
Leu Thr Gly Arg Thr Trp Lys Gly Ala Ile Leu 305 310 315 320 Gly Gly
Phe Lys Ser Lys Glu Cys Val Pro Lys Leu Val Ala Asp Phe 325 330 335
Met Ala Lys Lys Phe Ser Leu Asp Ala Leu Ile Thr His Val Leu Pro 340
345 350 Phe Glu Lys Ile Asn Glu Gly Phe Asp Leu Leu His Ser Gly Lys
Ser 355 360 365 Ile Arg Thr Ile Leu Met Phe 370 375 2375PRTHomo
sapiens 2Met Ser Thr Ala Gly Lys Val Ile Lys Cys Lys Ala Ala Val
Leu Trp 1 5 10 15 Glu Val Lys Lys Pro Phe Ser Ile Glu Asp Val Glu
Val Ala Pro Pro 20 25 30 Lys Ala Tyr Glu Val Arg Ile Lys Met Val
Ala Val Gly Ile Cys Arg 35 40 45 Thr Asp Asp His Val Val Ser Gly
Asn Leu Val Thr Pro Leu Pro Val 50 55 60 Ile Leu Gly His Glu Ala
Ala Gly Ile Val Glu Ser Val Gly Glu Gly 65 70 75 80 Val Thr Thr Val
Lys Pro Gly Asp Lys Val Ile Pro Leu Phe Thr Pro 85 90 95 Gln Cys
Gly Lys Cys Arg Val Cys Lys Asn Pro Glu Ser Asn Tyr Cys 100 105 110
Leu Lys Asn Asp Leu Gly Asn Pro Arg Gly Thr Leu Gln Asp Gly Thr 115
120 125 Arg Arg Phe Thr Cys Arg Gly Lys Pro Ile His His Phe Leu Gly
Thr 130 135 140 Ser Thr Phe Ser Gln Tyr Thr Val Val Asp Glu Asn Ala
Val Ala Lys 145 150 155 160 Ile Asp Ala Ala Ser Pro Leu Glu Lys Val
Cys Leu Ile Gly Cys Gly 165 170 175 Phe Ser Thr Gly Tyr Gly Ser Ala
Val Asn Val Ala Lys Val Thr Pro 180 185 190 Gly Ser Thr Cys Ala Val
Phe Gly Leu Gly Gly Val Gly Leu Ser Ala 195 200 205 Val Met Gly Cys
Lys Ala Ala Gly Ala Ala Arg Ile Ile Ala Val Asp 210 215 220 Ile Asn
Lys Asp Lys Phe Ala Lys Ala Lys Glu Leu Gly Ala Thr Glu 225 230 235
240 Cys Ile Asn Pro Gln Asp Tyr Lys Lys Pro Ile Gln Glu Val Leu Lys
245 250 255 Glu Met Thr Asp Gly Gly Val Asp Phe Ser Phe Glu Val Ile
Gly Arg 260 265 270 Leu Asp Thr Met Met Ala Ser Leu Leu Cys Cys His
Glu Ala Cys Gly 275 280 285 Thr Ser Val Ile Val Gly Val Pro Pro Ala
Ser Gln Asn Leu Ser Ile 290 295 300 Asn Pro Met Leu Leu Leu Thr Gly
Arg Thr Trp Lys Gly Ala Val Tyr 305 310 315 320 Gly Gly Phe Lys Ser
Lys Glu Gly Ile Pro Lys Leu Val Ala Asp Phe 325 330 335 Met Ala Lys
Lys Phe Ser Leu Asp Ala Leu Ile Thr His Val Leu Pro 340 345 350 Phe
Glu Lys Ile Asn Glu Gly Phe Asp Leu Leu His Ser Gly Lys Ser 355 360
365 Ile Arg Thr Val Leu Thr Phe 370 375 3380PRTHomo sapiens 3Met
Gly Thr Lys Gly Lys Val Ile Lys Cys Lys Ala Ala Ile Ala Trp 1 5 10
15 Glu Ala Gly Lys Pro Leu Cys Ile Glu Glu Val Glu Val Ala Pro Pro
20 25 30 Lys Ala His Glu Val Arg Ile Gln Ile Ile Ala Thr Ser Leu
Cys His 35 40 45 Thr Asp Ala Thr Val Ile Asp Ser Lys Phe Glu Gly
Leu Ala Phe Pro 50 55 60 Val Ile Val Gly His Glu Ala Ala Gly Ile
Val Glu Ser Ile Gly Pro 65 70 75 80 Gly Val Thr Asn Val Lys Pro Gly
Asp Lys Val Ile Pro Leu Tyr Ala 85 90 95 Pro Leu Cys Arg Lys Cys
Lys Phe Cys Leu Ser Pro Leu Thr Asn Leu 100 105 110 Cys Gly Lys Ile
Ser Asn Leu Lys Ser Pro Ala Ser Asp Gln Gln Leu 115 120 125 Met Glu
Asp Lys Thr Ser Arg Phe Thr Cys Lys Gly Lys Pro Val Tyr 130 135 140
His Phe Phe Gly Thr Ser Thr Phe Ser Gln Tyr Thr Val Val Ser Asp 145
150 155 160 Ile Asn Leu Ala Lys Ile Asp Asp Asp Ala Asn Leu Glu Arg
Val Cys 165 170 175 Leu Leu Gly Cys Gly Phe Ser Thr Gly Tyr Gly Ala
Ala Ile Asn Asn 180 185 190 Ala Lys Val Thr Pro Gly Ser Thr Cys Ala
Val Phe Gly Leu Gly Gly 195 200 205 Val Gly Leu Ser Ala Val Met Gly
Cys Lys Ala Ala Gly Ala Ser Arg 210 215 220 Ile Ile Gly Ile Asp Ile
Asn Ser Glu Lys Phe Val Lys Ala Lys Ala 225 230 235 240 Leu Gly Ala
Thr Asp Cys Leu Asn Pro Arg Asp Leu His Lys Pro Ile 245 250 255 Gln
Glu Val Ile Ile Glu Leu Thr Lys Gly Gly Val Asp Phe Ala Leu 260 265
270 Asp Cys Ala Gly Gly Ser Glu Thr Met Lys Ala Ala Leu Asp Cys Thr
275 280 285 Thr Ala Gly Trp Gly Ser Cys Thr Phe Ile Gly Val Ala Ala
Gly Ser 290 295 300 Lys Gly Leu Thr Ile Phe Pro Glu Glu Leu Ile Ile
Gly Arg Thr Ile 305 310 315 320 Asn Gly Thr Phe Phe Gly Gly Trp Lys
Ser Val Asp Ser Ile Pro Lys 325 330 335 Leu Val Thr Asp Tyr Lys Asn
Lys Lys Phe Asn Leu Asp Ala Leu Val 340 345 350 Thr His Thr Leu Pro
Phe Asp Lys Ile Ser Glu Ala Phe Asp Leu Met 355 360 365 Asn Gln Gly
Lys Ser Val Arg Thr Ile Leu Ile Phe 370 375 380 4399PRTHomo sapiens
4Met Leu Val Arg Gly Pro His Phe Glu Leu Gln Arg Cys Lys Thr His 1
5 10 15 Leu Phe Ser Ser Asn Tyr Leu Thr Gln Val Ile Lys Cys Lys Ala
Ala 20 25 30 Ile Ala Trp Glu Ala Gly Lys Pro Leu Cys Ile Glu Glu
Val Glu Val 35 40 45 Ala Pro Pro Lys Ala His Glu Val Arg Ile Gln
Ile Ile Ala Thr Ser 50 55 60 Leu Cys His Thr Asp Ala Thr Val Ile
Asp Ser Lys Phe Glu Gly Leu 65 70 75 80 Ala Phe Pro Val Ile Val Gly
His Glu Ala Ala Gly Ile Val Glu Ser 85 90 95 Ile Gly Pro Gly Val
Thr Asn Val Lys Pro Gly Asp Lys Val Ile Pro 100 105 110 Leu Tyr Ala
Pro Leu Cys Arg Lys Cys Lys Phe Cys Leu Ser Pro Leu 115 120 125 Thr
Asn Leu Cys Gly Lys Ile Ser Asn Leu Lys Ser Pro Ala Ser Asp 130 135
140 Gln Gln Leu Met Glu Asp Lys Thr Ser Arg Phe Thr Cys Lys Gly Lys
145 150 155 160 Pro Val Tyr His Phe Phe Gly Thr Ser Thr Phe Ser Gln
Tyr Thr Val 165 170 175 Val Ser Asp Ile Asn Leu Ala Lys Ile Asp Asp
Asp Ala Asn Leu Glu 180 185 190 Arg Val Cys Leu Leu Gly Cys Gly Phe
Ser Thr Gly Tyr Gly Ala Ala 195 200 205 Ile Asn Asn Ala Lys Val Thr
Pro Gly Ser Thr Cys Ala Val Phe Gly 210 215 220 Leu Gly Gly Val Gly
Leu Ser Ala Val Met Gly Cys Lys Ala Ala Gly 225 230 235 240 Ala Ser
Arg Ile Ile Gly Ile Asp Ile Asn Ser Glu Lys Phe Val Lys 245 250 255
Ala Lys Ala Leu Gly Ala Thr Asp Cys Leu Asn Pro Arg Asp Leu His 260
265 270 Lys Pro Ile Gln Glu Val Ile Ile Glu Leu Thr Lys Gly Gly Val
Asp 275 280 285 Phe Ala Leu Asp Cys Ala Gly Gly Ser Glu Thr Met Lys
Ala Ala Leu 290 295 300 Asp Cys Thr Thr Ala Gly Trp Gly Ser Cys Thr
Phe Ile Gly Val Ala 305 310 315 320 Ala Gly Ser Lys Gly Leu Thr Ile
Phe Pro Glu Glu Leu Ile Ile Gly 325 330 335 Arg Thr Ile Asn Gly Thr
Phe Phe Gly Gly Trp Lys Ser Val Asp Ser 340 345 350 Ile Pro Lys Leu
Val Thr Asp Tyr Lys Asn Lys Lys Phe Asn Leu Asp 355 360 365 Ala Leu
Val Thr His Thr Leu Pro Phe Asp Lys Ile Ser Glu Ala Phe 370 375 380
Asp Leu Met Asn Gln Gly Lys Ser Val Arg Thr Ile Leu Ile Phe 385 390
395 5406PRTHomo sapiens 5Met Pro Pro Val Gly Gly Lys Lys Ala Lys
Lys Gly Ile Leu Glu Arg 1 5 10 15 Leu Asn Ala Gly Glu Ile Val Ile
Gly Asp Gly Gly Phe Val Phe Ala 20 25 30 Leu Glu Lys Arg Gly Tyr
Val Lys Ala Gly Pro Trp Thr Pro Glu Ala 35 40 45 Ala Val Glu His
Pro Glu Ala Val Arg Gln Leu His Arg Glu Phe Leu 50 55 60 Arg Ala
Gly Ser Asn Val Met Gln Thr Phe Thr Phe Tyr Ala Ser Glu 65 70 75 80
Asp Lys Leu Glu Asn Arg Gly Asn Tyr Val Leu Glu Lys Ile Ser Gly 85
90 95 Gln Glu Val Asn Glu Ala Ala Cys Asp Ile Ala Arg Gln Val Ala
Asp 100 105 110 Glu Gly Asp Ala Leu Val Ala Gly Gly Val Ser Gln Thr
Pro Ser Tyr 115 120 125 Leu Ser Cys Lys Ser Glu Thr Glu Val Lys Lys
Val Phe Leu Gln Gln 130 135 140 Leu Glu Val Phe Met Lys Lys Asn Val
Asp Phe Leu Ile Ala Glu Tyr 145 150 155 160 Phe Glu His Val Glu Glu
Ala Val Trp Ala Val Glu Thr Leu Ile Ala 165 170 175 Ser Gly Lys Pro
Val Ala Ala Thr Met Cys Ile Gly Pro Glu Gly Asp 180 185 190 Leu His
Gly Val Pro Pro Gly Glu Cys Ala Val Arg Leu Val Lys Ala 195 200 205
Gly Ala Ser Ile Ile Gly Val Asn Cys His Phe Asp Pro Thr Ile Ser 210
215 220 Leu Lys Thr Val Lys Leu Met Lys Glu Gly Leu Glu Ala Ala Arg
Leu 225 230 235 240 Lys Ala His Leu Met Ser Gln Pro Leu Ala Tyr His
Thr Pro Asp Cys 245 250 255 Asn Lys Gln Gly Phe Ile Asp Leu Pro Glu
Phe Pro Phe Gly Leu Glu 260 265 270 Pro Arg Val Ala Thr Arg Trp Asp
Ile Gln Lys Tyr Ala Arg Glu Ala 275 280 285 Tyr Asn Leu Gly Val Arg
Tyr Ile Gly Gly Cys Cys Gly Phe Glu Pro 290 295 300 Tyr His Ile Arg
Ala Ile Ala Glu Glu Leu Ala Pro Glu Arg Gly Phe 305 310 315 320 Leu
Pro Pro Ala Ser Glu Lys His Gly Ser Trp Gly Ser Gly Leu Asp 325 330
335 Met His Thr Lys Pro Trp Val Arg Ala Arg Ala Arg Lys Glu Tyr Trp
340 345 350 Glu Asn Leu Arg Ile Ala Ser Gly Arg Pro Tyr Asn Pro Ser
Met Ser 355 360 365 Lys Pro Asp Gly Trp Gly Val Thr Lys Gly Thr Ala
Glu Leu Met Gln 370 375 380 Gln Lys Glu Ala Thr Thr Glu Gln Gln Leu
Lys Glu Leu Phe Glu Lys 385 390 395 400 Gln Lys Phe Lys Ser Gln 405
6363PRTHomo sapiens 6Met Ala Pro Ala Gly Arg Pro Gly Ala Lys Lys
Gly Ile Leu Glu Arg 1 5 10 15 Leu Glu Ser Gly Glu Val Val Ile Gly
Asp Gly Ser Phe Leu Ile Thr 20 25 30 Leu Glu Lys Arg Gly Tyr Val
Lys Ala Gly Leu Trp Thr Pro Glu Ala 35 40 45 Val Ile Glu His Pro
Asp Ala Val Arg Gln Leu His Met Glu Phe Leu 50 55 60 Arg Ala Gly
Ser Asn Val Met Gln Thr Phe Thr Phe Ser Ala Ser Glu 65 70 75 80 Asp
Asn Met Glu Ser Lys Trp Glu Asp Val Asn Ala Ala Ala Cys Asp 85 90
95 Leu Ala Arg Glu Val Ala Gly Lys Gly Asp Ala Leu Val Ala Gly Gly
100 105 110 Ile Cys Gln Thr Ser Ile Tyr Lys Tyr Gln Lys Asp Glu Ala
Arg Ile 115 120 125 Lys Lys Leu Phe Arg Gln Gln Leu Glu Val Phe Ala
Trp Lys Asn Val 130 135 140 Asp Phe Leu Ile Ala Glu Tyr Phe Glu His
Val Glu Glu Ala Val Trp 145 150 155 160 Ala Val Glu Val Leu Lys Glu
Ser Asp Arg Pro Val Ala Val Thr Met 165 170 175 Cys Ile Gly Pro Glu
Gly Asp Met His Asp Ile Thr Pro Gly Glu Cys 180 185 190 Ala Val Arg
Leu Val Lys Ala Gly Ala Ser Ile Val Gly Val Asn Cys 195 200 205 Arg
Phe Gly Pro Asp Thr Ser Leu Lys Thr Met Glu Leu Met Lys Glu 210 215
220 Gly Leu Glu Trp Ala Gly Leu Lys Ala His Leu Met Val Gln Pro Leu
225 230 235 240 Gly Phe His Ala Pro Asp Cys Gly Lys Glu Gly Phe Val
Asp Leu Pro 245 250 255 Glu Tyr Pro Phe Gly Leu Glu Ser Arg Val Ala
Thr Arg Trp Asp Ile 260 265 270 Gln Lys Tyr Ala Arg Glu Ala Tyr Asn
Leu Gly Val Arg Tyr Ile Gly 275 280 285 Gly Cys Cys Gly Phe Glu Pro
Tyr His Ile Arg Ala Ile Ala Glu Glu 290 295 300 Leu Ala Pro Glu Arg
Gly Phe Leu Pro Pro Ala Ser Glu Lys His Gly 305 310 315 320 Ser Trp
Gly Ser Gly Leu Asp Met His Thr Lys Pro Trp Ile Arg Ala 325 330 335
Arg Ala Arg Arg Glu Tyr Trp Glu Asn Leu Leu Pro Ala Ser Gly Arg 340
345 350 Pro Phe Cys Pro Ser Leu Ser Lys Pro
Asp Phe 355 360 7 299PRTHomo sapiens 7Met Ala Pro Ala Gly Arg Pro
Gly Ala Lys Lys Gly Ile Leu Glu Arg 1 5 10 15 Leu Glu Ser Gly Glu
Val Val Ile Gly Asp Gly Ser Phe Leu Ile Thr 20 25 30 Leu Glu Lys
Arg Gly Tyr Val Lys Ala Gly Leu Trp Thr Pro Glu Ala 35 40 45 Val
Ile Glu His Pro Asp Ala Val Arg Gln Leu His Met Glu Phe Leu 50 55
60 Arg Ala Gly Ser Asn Val Met Gln Thr Phe Thr Phe Ser Ala Ser Glu
65 70 75 80 Asp Asn Met Glu Ser Lys Tyr Phe Glu His Val Glu Glu Ala
Val Trp 85 90 95 Ala Val Glu Val Leu Lys Glu Ser Asp Arg Pro Val
Ala Val Thr Met 100 105 110 Cys Ile Gly Pro Glu Gly Asp Met His Asp
Ile Thr Pro Gly Glu Cys 115 120 125 Ala Val Arg Leu Val Lys Ala Gly
Ala Ser Ile Val Gly Val Asn Cys 130 135 140 Arg Phe Gly Pro Asp Thr
Ser Leu Lys Thr Met Glu Leu Met Lys Glu 145 150 155 160 Gly Leu Glu
Trp Ala Gly Leu Lys Ala His Leu Met Val Gln Pro Leu 165 170 175 Gly
Phe His Ala Pro Asp Cys Gly Lys Glu Gly Phe Val Asp Leu Pro 180 185
190 Glu Tyr Pro Phe Gly Leu Glu Ser Arg Val Ala Thr Arg Trp Asp Ile
195 200 205 Gln Lys Tyr Ala Arg Glu Ala Tyr Asn Leu Gly Val Arg Tyr
Ile Gly 210 215 220 Gly Cys Cys Gly Phe Glu Pro Tyr His Ile Arg Ala
Ile Ala Glu Glu 225 230 235 240 Leu Ala Pro Glu Arg Gly Phe Leu Pro
Pro Ala Ser Glu Lys His Gly 245 250 255 Ser Trp Gly Ser Gly Leu Asp
Met His Thr Lys Pro Trp Ile Arg Ala 260 265 270 Arg Ala Arg Arg Glu
Tyr Trp Glu Asn Leu Leu Pro Ala Ser Gly Arg 275 280 285 Pro Phe Cys
Pro Ser Leu Ser Lys Pro Asp Phe 290 295 8322PRTHomo sapiens 8 Met
Ser Ala Lys Ser Arg Thr Ile Gly Ile Ile Gly Ala Pro Phe Ser 1 5 10
15 Lys Gly Gln Pro Arg Gly Gly Val Glu Glu Gly Pro Thr Val Leu Arg
20 25 30 Lys Ala Gly Leu Leu Glu Lys Leu Lys Glu Gln Glu Cys Asp
Val Lys 35 40 45 Asp Tyr Gly Asp Leu Pro Phe Ala Asp Ile Pro Asn
Asp Ser Pro Phe 50 55 60 Gln Ile Val Lys Asn Pro Arg Ser Val Gly
Lys Ala Ser Glu Gln Leu 65 70 75 80 Ala Gly Lys Val Ala Glu Val Lys
Lys Asn Gly Arg Ile Ser Leu Val 85 90 95 Leu Gly Gly Asp His Ser
Leu Ala Ile Gly Ser Ile Ser Gly His Ala 100 105 110 Arg Val His Pro
Asp Leu Gly Val Ile Trp Val Asp Ala His Thr Asp 115 120 125 Ile Asn
Thr Pro Leu Thr Thr Thr Ser Gly Asn Leu His Gly Gln Pro 130 135 140
Val Ser Phe Leu Leu Lys Glu Leu Lys Gly Lys Ile Pro Asp Val Pro 145
150 155 160 Gly Phe Ser Trp Val Thr Pro Cys Ile Ser Ala Lys Asp Ile
Val Tyr 165 170 175 Ile Gly Leu Arg Asp Val Asp Pro Gly Glu His Tyr
Ile Leu Lys Thr 180 185 190 Leu Gly Ile Lys Tyr Phe Ser Met Thr Glu
Val Asp Arg Leu Gly Ile 195 200 205 Gly Lys Val Met Glu Glu Thr Leu
Ser Tyr Leu Leu Gly Arg Lys Lys 210 215 220 Arg Pro Ile His Leu Ser
Phe Asp Val Asp Gly Leu Asp Pro Ser Phe 225 230 235 240 Thr Pro Ala
Thr Gly Thr Pro Val Val Gly Gly Leu Thr Tyr Arg Glu 245 250 255 Gly
Leu Tyr Ile Thr Glu Glu Ile Tyr Lys Thr Gly Leu Leu Ser Gly 260 265
270 Leu Asp Ile Met Glu Val Asn Pro Ser Leu Gly Lys Thr Pro Glu Glu
275 280 285 Val Thr Arg Thr Val Asn Thr Ala Val Ala Ile Thr Leu Ala
Cys Phe 290 295 300 Gly Leu Ala Arg Glu Gly Asn His Lys Pro Ile Asp
Tyr Leu Asn Pro 305 310 315 320 Pro Lys 9330PRTHomo sapiens 9Met
Ser Ala Lys Ser Arg Thr Ile Gly Ile Ile Gly Ala Pro Phe Ser 1 5 10
15 Lys Gly Gln Pro Arg Gly Gly Val Glu Glu Gly Pro Thr Val Leu Arg
20 25 30 Lys Ala Gly Leu Leu Glu Lys Leu Lys Glu Gln Val Thr Gln
Asn Phe 35 40 45 Leu Ile Leu Glu Cys Asp Val Lys Asp Tyr Gly Asp
Leu Pro Phe Ala 50 55 60 Asp Ile Pro Asn Asp Ser Pro Phe Gln Ile
Val Lys Asn Pro Arg Ser 65 70 75 80 Val Gly Lys Ala Ser Glu Gln Leu
Ala Gly Lys Val Ala Glu Val Lys 85 90 95 Lys Asn Gly Arg Ile Ser
Leu Val Leu Gly Gly Asp His Ser Leu Ala 100 105 110 Ile Gly Ser Ile
Ser Gly His Ala Arg Val His Pro Asp Leu Gly Val 115 120 125 Ile Trp
Val Asp Ala His Thr Asp Ile Asn Thr Pro Leu Thr Thr Thr 130 135 140
Ser Gly Asn Leu His Gly Gln Pro Val Ser Phe Leu Leu Lys Glu Leu 145
150 155 160 Lys Gly Lys Ile Pro Asp Val Pro Gly Phe Ser Trp Val Thr
Pro Cys 165 170 175 Ile Ser Ala Lys Asp Ile Val Tyr Ile Gly Leu Arg
Asp Val Asp Pro 180 185 190 Gly Glu His Tyr Ile Leu Lys Thr Leu Gly
Ile Lys Tyr Phe Ser Met 195 200 205 Thr Glu Val Asp Arg Leu Gly Ile
Gly Lys Val Met Glu Glu Thr Leu 210 215 220 Ser Tyr Leu Leu Gly Arg
Lys Lys Arg Pro Ile His Leu Ser Phe Asp 225 230 235 240 Val Asp Gly
Leu Asp Pro Ser Phe Thr Pro Ala Thr Gly Thr Pro Val 245 250 255 Val
Gly Gly Leu Thr Tyr Arg Glu Gly Leu Tyr Ile Thr Glu Glu Ile 260 265
270 Tyr Lys Thr Gly Leu Leu Ser Gly Leu Asp Ile Met Glu Val Asn Pro
275 280 285 Ser Leu Gly Lys Thr Pro Glu Glu Val Thr Arg Thr Val Asn
Thr Ala 290 295 300 Val Ala Ile Thr Leu Ala Cys Phe Gly Leu Ala Arg
Glu Gly Asn His 305 310 315 320 Lys Pro Ile Asp Tyr Leu Asn Pro Pro
Lys 325 330 10236PRTHomo sapiens 10 Met Ser Ala Lys Ser Arg Thr Ile
Gly Ile Ile Gly Ala Pro Phe Ser 1 5 10 15 Lys Gly Gln Pro Arg Gly
Gly Val Glu Glu Gly Pro Thr Val Leu Arg 20 25 30 Lys Ala Gly Leu
Leu Glu Lys Leu Lys Glu Gln Glu Cys Asp Val Lys 35 40 45 Asp Tyr
Gly Asp Leu Pro Phe Ala Asp Ile Pro Asn Asp Ser Pro Phe 50 55 60
Gln Ile Val Lys Asn Pro Arg Ser Val Gly Lys Ala Ser Glu Gln Leu 65
70 75 80 Ala Gly Lys Val Ala Glu Val Lys Lys Asn Gly Arg Ile Ser
Leu Val 85 90 95 Leu Gly Gly Asp His Ser Leu Ala Ile Gly Ser Ile
Ser Gly His Ala 100 105 110 Arg Val His Pro Asp Leu Gly Val Ile Trp
Val Asp Ala His Thr Asp 115 120 125 Ile Asn Thr Pro Leu Thr Thr Thr
Ser Gly Asn Leu His Gly Gln Pro 130 135 140 Val Ser Phe Leu Leu Lys
Glu Leu Lys Gly Lys Ile Pro Asp Val Pro 145 150 155 160 Gly Phe Ser
Trp Val Thr Pro Cys Ile Ser Ala Lys Asp Ile Val Tyr 165 170 175 Ile
Gly Leu Arg Asp Val Asp Pro Gly Glu His Tyr Ile Leu Lys Thr 180 185
190 Leu Gly Ile Lys Tyr Phe Ser Met Thr Glu Val Thr Arg Thr Val Asn
195 200 205 Thr Ala Val Ala Ile Thr Leu Ala Cys Phe Gly Leu Ala Arg
Glu Gly 210 215 220 Asn His Lys Pro Ile Asp Tyr Leu Asn Pro Pro Lys
225 230 235 11127PRTHomo sapiens 11 Met Ser Phe Ser Gly Lys Tyr Gln
Leu Gln Ser Gln Glu Asn Phe Glu 1 5 10 15 Ala Phe Met Lys Ala Ile
Gly Leu Pro Glu Glu Leu Ile Gln Lys Gly 20 25 30 Lys Asp Ile Lys
Gly Val Ser Glu Ile Val Gln Asn Gly Lys His Phe 35 40 45 Lys Phe
Thr Ile Thr Ala Gly Ser Lys Val Ile Gln Asn Glu Phe Thr 50 55 60
Val Gly Glu Glu Cys Glu Leu Glu Thr Met Thr Gly Glu Lys Val Lys 65
70 75 80 Thr Val Val Gln Leu Glu Gly Asp Asn Lys Leu Val Thr Thr
Phe Lys 85 90 95 Asn Ile Lys Ser Val Thr Glu Leu Asn Gly Asp Ile
Ile Thr Asn Thr 100 105 110 Met Thr Leu Gly Asp Ile Val Phe Lys Arg
Ile Ser Lys Arg Ile 115 120 125 12222PRTHomo sapiens 12Met Ala Glu
Lys Pro Lys Leu His Tyr Phe Asn Ala Arg Gly Arg Met 1 5 10 15 Glu
Ser Thr Arg Trp Leu Leu Ala Ala Ala Gly Val Glu Phe Glu Glu 20 25
30 Lys Phe Ile Lys Ser Ala Glu Asp Leu Asp Lys Leu Arg Asn Asp Gly
35 40 45 Tyr Leu Met Phe Gln Gln Val Pro Met Val Glu Ile Asp Gly
Met Lys 50 55 60 Leu Val Gln Thr Arg Ala Ile Leu Asn Tyr Ile Ala
Ser Lys Tyr Asn 65 70 75 80 Leu Tyr Gly Lys Asp Ile Lys Glu Arg Ala
Leu Ile Asp Met Tyr Ile 85 90 95 Glu Gly Ile Ala Asp Leu Gly Glu
Met Ile Leu Leu Leu Pro Val Cys 100 105 110 Pro Pro Glu Glu Lys Asp
Ala Lys Leu Ala Leu Ile Lys Glu Lys Ile 115 120 125 Lys Asn Arg Tyr
Phe Pro Ala Phe Glu Lys Val Leu Lys Ser His Gly 130 135 140 Gln Asp
Tyr Leu Val Gly Asn Lys Leu Ser Arg Ala Asp Ile His Leu 145 150 155
160 Val Glu Leu Leu Tyr Tyr Val Glu Glu Leu Asp Ser Ser Leu Ile Ser
165 170 175 Ser Phe Pro Leu Leu Lys Ala Leu Lys Thr Arg Ile Ser Asn
Leu Pro 180 185 190 Thr Val Lys Lys Phe Leu Gln Pro Gly Ser Pro Arg
Lys Pro Pro Met 195 200 205 Asp Glu Lys Ser Leu Glu Glu Ala Arg Lys
Ile Phe Arg Phe 210 215 220 13496PRTHomo sapiens 13 Met Ala Ser Ser
Thr Gly Asp Arg Ser Gln Ala Val Arg His Gly Leu 1 5 10 15 Arg Ala
Lys Val Leu Thr Leu Asp Gly Met Asn Pro Arg Val Arg Arg 20 25 30
Val Glu Tyr Ala Val Arg Gly Pro Ile Val Gln Arg Ala Leu Glu Leu 35
40 45 Glu Gln Glu Leu Arg Gln Gly Val Lys Lys Pro Phe Thr Glu Val
Ile 50 55 60 Arg Ala Asn Ile Gly Asp Ala Gln Ala Met Gly Gln Arg
Pro Ile Thr 65 70 75 80 Phe Leu Arg Gln Val Leu Ala Leu Cys Val Asn
Pro Asp Leu Leu Ser 85 90 95 Ser Pro Asn Phe Pro Asp Asp Ala Lys
Lys Arg Ala Glu Arg Ile Leu 100 105 110 Gln Ala Cys Gly Gly His Ser
Leu Gly Ala Tyr Ser Val Ser Ser Gly 115 120 125 Ile Gln Leu Ile Arg
Glu Asp Val Ala Arg Tyr Ile Glu Arg Arg Asp 130 135 140 Gly Gly Ile
Pro Ala Asp Pro Asn Asn Val Phe Leu Ser Thr Gly Ala 145 150 155 160
Ser Asp Ala Ile Val Thr Val Leu Lys Leu Leu Val Ala Gly Glu Gly 165
170 175 His Thr Arg Thr Gly Val Leu Ile Pro Ile Pro Gln Tyr Pro Leu
Tyr 180 185 190 Ser Ala Thr Leu Ala Glu Leu Gly Ala Val Gln Val Asp
Tyr Tyr Leu 195 200 205 Asp Glu Glu Arg Ala Trp Ala Leu Asp Val Ala
Glu Leu His Arg Ala 210 215 220 Leu Gly Gln Ala Arg Asp His Cys Arg
Pro Arg Ala Leu Cys Val Ile 225 230 235 240 Asn Pro Gly Asn Pro Thr
Gly Gln Val Gln Thr Arg Glu Cys Ile Glu 245 250 255 Ala Val Ile Arg
Phe Ala Phe Glu Glu Arg Leu Phe Leu Leu Ala Asp 260 265 270 Glu Val
Tyr Gln Asp Asn Val Tyr Ala Ala Gly Ser Gln Phe His Ser 275 280 285
Phe Lys Lys Val Leu Met Glu Met Gly Pro Pro Tyr Ala Gly Gln Gln 290
295 300 Glu Leu Ala Ser Phe His Ser Thr Ser Lys Gly Tyr Met Gly Glu
Cys 305 310 315 320 Gly Phe Arg Gly Gly Tyr Val Glu Val Val Asn Met
Asp Ala Ala Val 325 330 335 Gln Gln Gln Met Leu Lys Leu Met Ser Val
Arg Leu Cys Pro Pro Val 340 345 350 Pro Gly Gln Ala Leu Leu Asp Leu
Val Val Ser Pro Pro Ala Pro Thr 355 360 365 Asp Pro Ser Phe Ala Gln
Phe Gln Ala Glu Lys Gln Ala Val Leu Ala 370 375 380 Glu Leu Ala Ala
Lys Ala Lys Leu Thr Glu Gln Val Phe Asn Glu Ala 385 390 395 400 Pro
Gly Ile Ser Cys Asn Pro Val Gln Gly Ala Met Tyr Ser Phe Pro 405 410
415 Arg Val Gln Leu Pro Pro Arg Ala Val Glu Arg Ala Gln Glu Leu Gly
420 425 430 Leu Ala Pro Asp Met Phe Phe Cys Leu Arg Leu Leu Glu Glu
Thr Gly 435 440 445 Ile Cys Val Val Pro Gly Ser Gly Phe Gly Gln Arg
Glu Gly Thr Tyr 450 455 460 His Phe Arg Met Thr Ile Leu Pro Pro Leu
Glu Lys Leu Arg Leu Leu 465 470 475 480 Leu Glu Lys Leu Ser Arg Phe
His Ala Lys Phe Thr Leu Glu Tyr Ser 485 490 495 149PRTHomo sapiens
14Ile Asp Ala Ala Ser Pro Leu Glu Lys 1 5 1515PRTHomo sapiens 15Phe
Ser Leu Asp Ala Leu Ile Thr His Val Leu Pro Phe Glu Lys 1 5 10 15
1612PRTHomo sapiens 16Ile Asn Glu Gly Phe Asp Leu Leu His Ser Gly
Lys 1 5 10 178PRTHomo sapiens 17Ala Ala Val Leu Trp Glu Val Lys 1 5
189PRTHomo sapiens 18Ile Asp Asp Asp Ala Asn Leu Glu Arg 1 5
1910PRTHomo sapiens 19Ile Ile Gly Ile Asp Ile Asn Ser Glu Lys 1 5
10 2015PRTHomo sapiens 20Phe Asn Leu Asp Ala Leu Val Thr His Thr
Leu Pro Phe Asp Lys 1 5 10 15 219PRTHomo sapiens 21Glu Ala Thr Thr
Glu Gln Gln Leu Lys 1 5 228PRTHomo sapiens 22Glu Ala Tyr Asn Leu
Gly Val Arg 1 5 2310PRTHomo sapiens 23Ala Ile Ala Glu Glu Leu Ala
Pro Glu Arg 1 5 10 2411PRTHomo sapiens 24Thr Ile Gly Ile Ile Gly
Ala Pro Phe Ser Lys 1 5 10 2511PRTHomo sapiens 25Asp Val Asp Pro
Gly Glu His Tyr Ile Leu Lys 1 5 10 2611PRTHomo sapiens 26Glu Gly
Leu Tyr Ile Thr Glu Glu Ile Tyr Lys 1 5 10 2711PRTHomo sapiens
27Ala Ile Gly Leu Pro Glu Glu Leu Ile Gln Lys 1 5 10 288PRTHomo
sapiens 28Phe Thr Ile Thr Ala Gly Ser Lys 1 5 2910PRTHomo sapiens
29Thr Val Val Gln Leu Glu Gly Asp Asn Lys 1 5 10 307PRTHomo sapiens
30Leu His Tyr Phe Asn Ala Arg 1 5 3111PRTHomo sapiens 31Ser His Gly
Gln Asp Tyr Leu Val Gly Asn Lys 1 5 10 329PRTHomo sapiens 32Ala
Ile
Leu Asn Tyr Ile Ala Ser Lys 1 5 338PRTHomo sapiens 33Ile Ser Asn
Leu Pro Thr Val Lys 1 5 349PRTHomo sapiens 34Ala Leu Glu Leu Glu
Gln Glu Leu Arg 1 5 3510PRTHomo sapiens 35Leu Leu Val Ala Gly Glu
Gly His Thr Arg 1 5 10 368PRTHomo sapiens 36Lys Pro Phe Thr Glu Val
Ile Arg 1 5
D00000
D00001
D00002
D00003
D00004
D00005
D00006
D00007
D00008
D00009
D00010
D00011
D00012

D00013
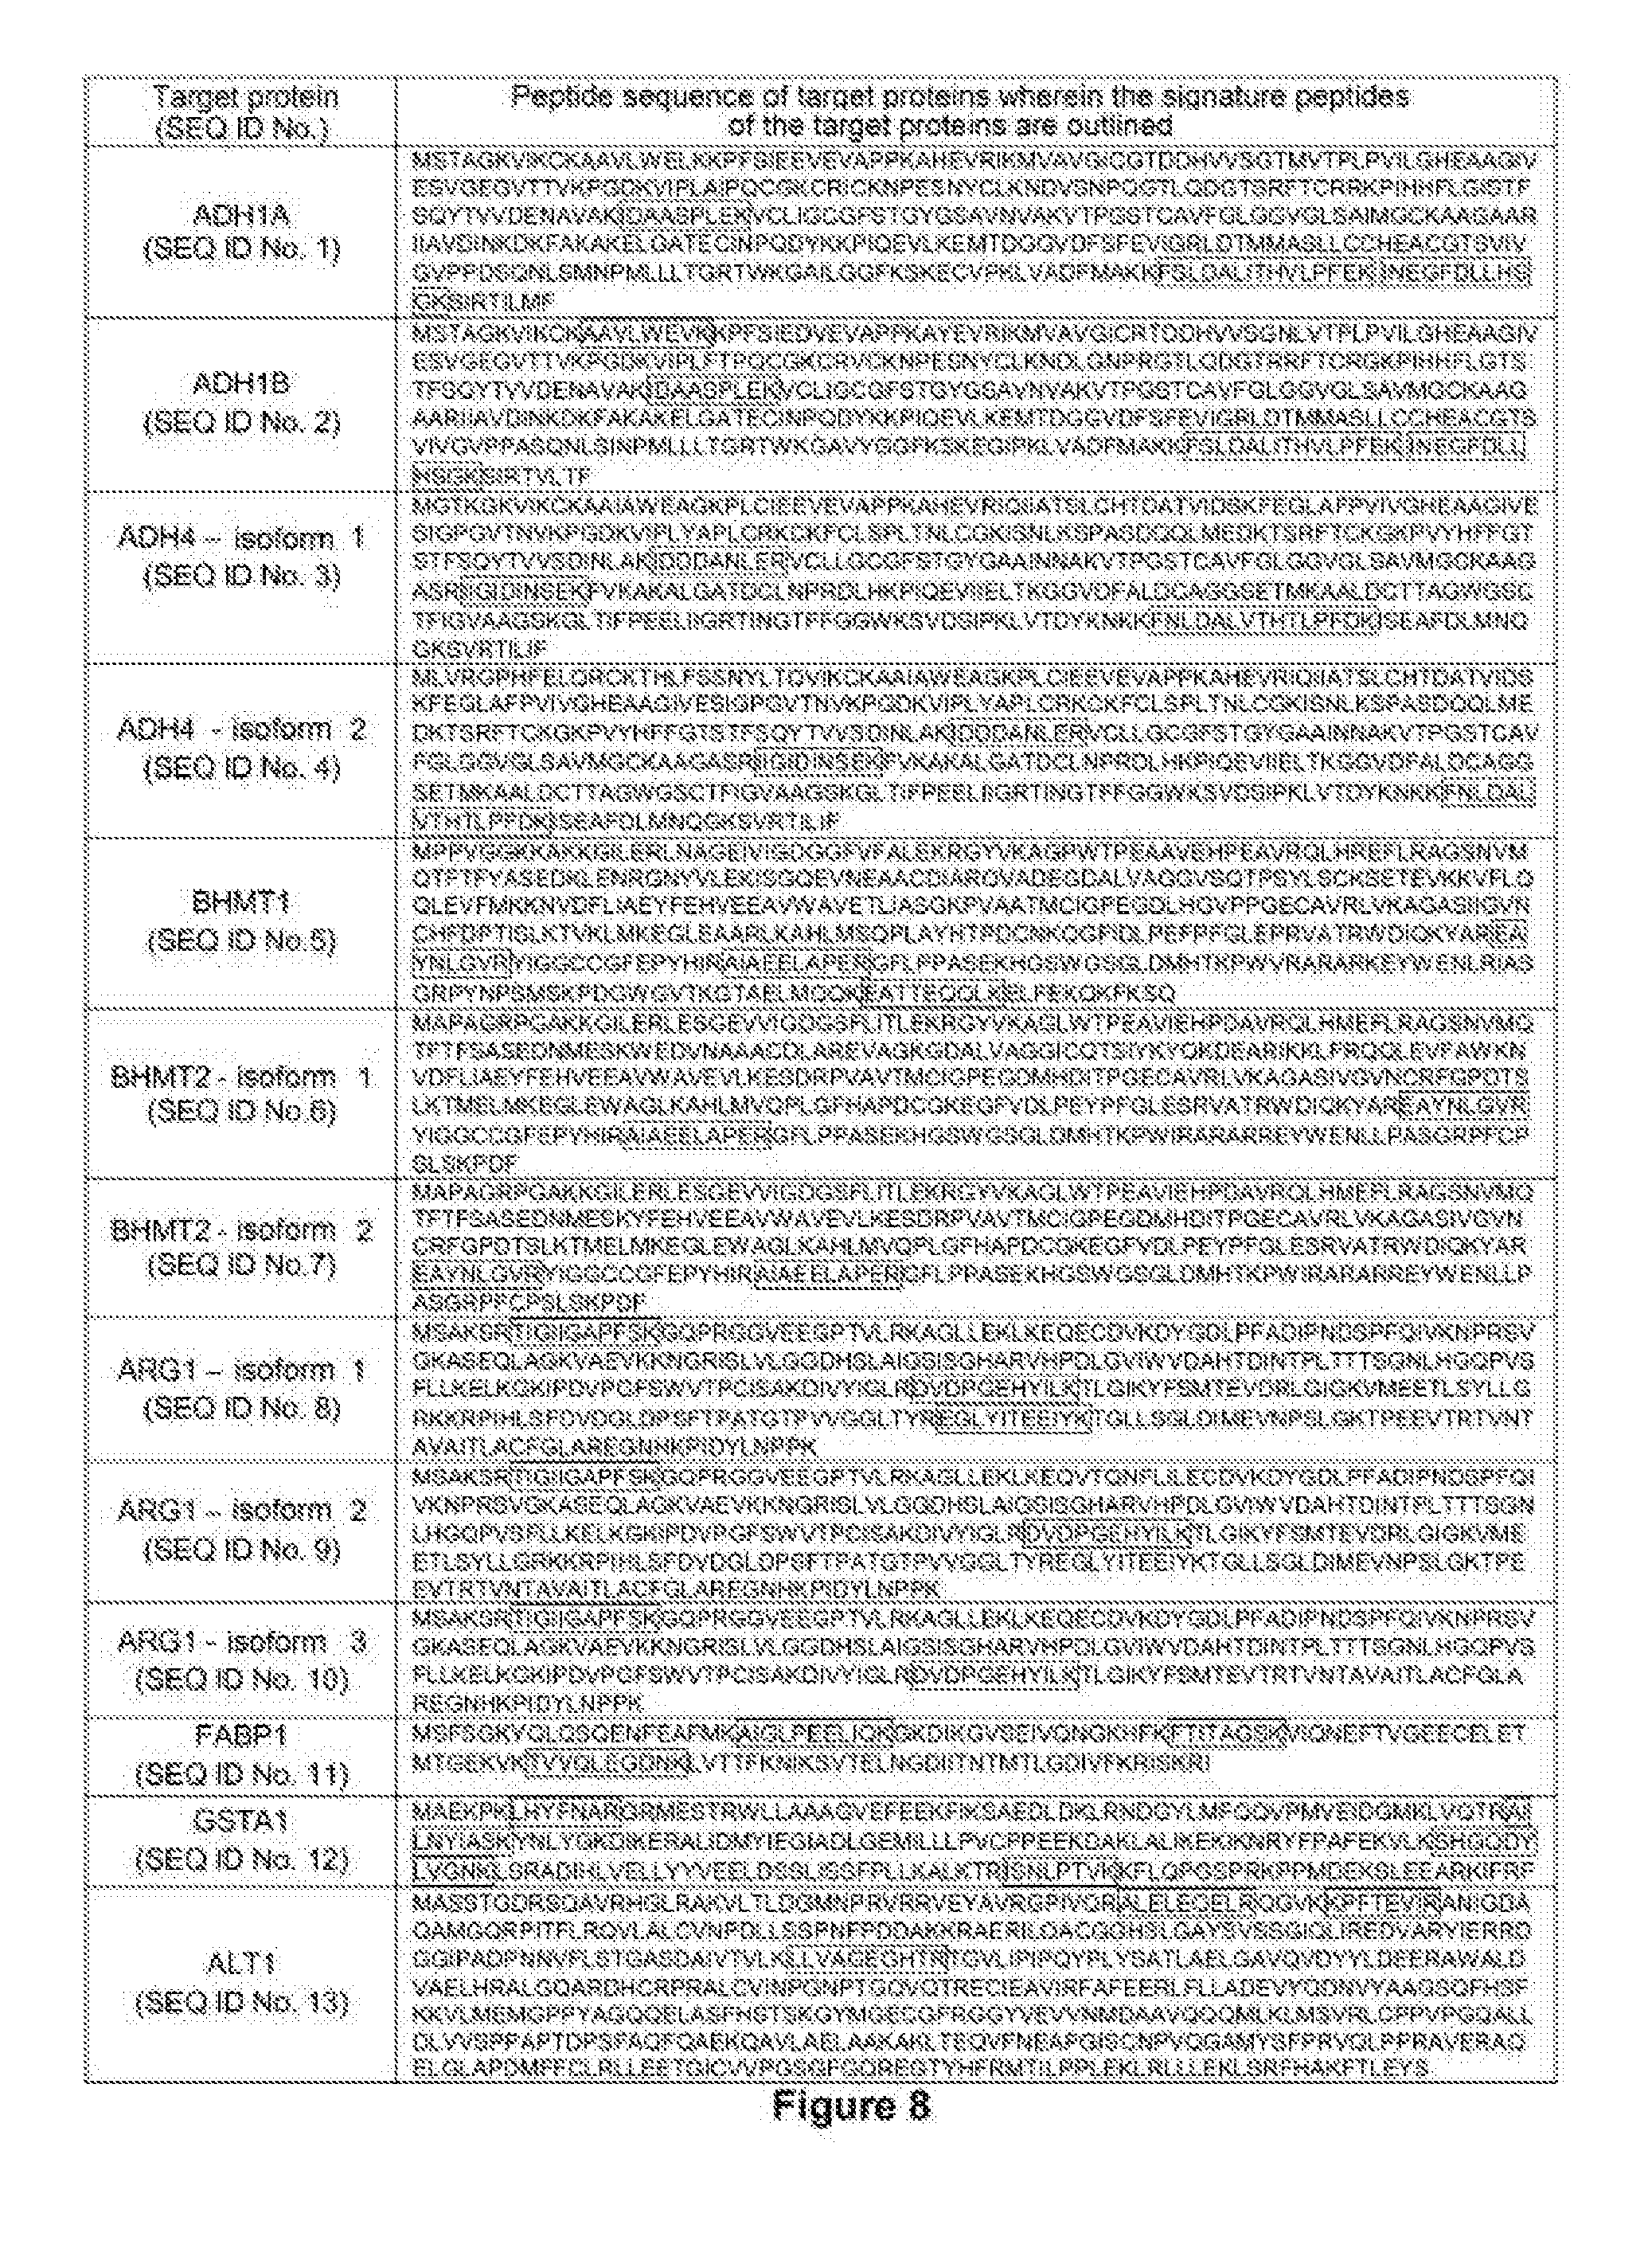
S00001
XML
uspto.report is an independent third-party trademark research tool that is not affiliated, endorsed, or sponsored by the United States Patent and Trademark Office (USPTO) or any other governmental organization. The information provided by uspto.report is based on publicly available data at the time of writing and is intended for informational purposes only.
While we strive to provide accurate and up-to-date information, we do not guarantee the accuracy, completeness, reliability, or suitability of the information displayed on this site. The use of this site is at your own risk. Any reliance you place on such information is therefore strictly at your own risk.
All official trademark data, including owner information, should be verified by visiting the official USPTO website at www.uspto.gov. This site is not intended to replace professional legal advice and should not be used as a substitute for consulting with a legal professional who is knowledgeable about trademark law.