Measurement of Total Reactive Nitrogen, NOy, together with NO2, NO, and O3 via Cavity Ring-down Spectroscopy
Brown; Steven S. ; et al.
U.S. patent application number 14/722214 was filed with the patent office on 2015-12-31 for measurement of total reactive nitrogen, noy, together with no2, no, and o3 via cavity ring-down spectroscopy. This patent application is currently assigned to The United States of America, represented by the Secretary of Commerce. The applicant listed for this patent is The United States of America, represented by the Secretary of Commerce. Invention is credited to Steven S. Brown, William P. Dube, Robert J. Wild.
| Application Number | 20150377850 14/722214 |
| Document ID | / |
| Family ID | 54930211 |
| Filed Date | 2015-12-31 |


| United States Patent Application | 20150377850 |
| Kind Code | A1 |
| Brown; Steven S. ; et al. | December 31, 2015 |
Measurement of Total Reactive Nitrogen, NOy, together with NO2, NO, and O3 via Cavity Ring-down Spectroscopy
Abstract
A sensitive, compact detector measures total reactive nitrogen (NO.sub.y), as well as NO.sub.2, NO, and O.sub.3. In all channels, NO.sub.2 is directly detected by laser diode based cavity ring-down spectroscopy (CRDS) at 405 nm. Ambient O.sub.3 is converted to NO.sub.2 in excess NO for the O.sub.3 measurement channel. Likewise, ambient NO is converted to NO.sub.2 in excess O.sub.3. Ambient NO.sub.y is thermally dissociated at 700C to form NO.sub.2 or NO in a heated quartz inlet. Any NO present in ambient air or formed from thermal dissociation of other reactive nitrogen compounds is converted to NO.sub.2 in excess O.sub.3 after the thermal converter. The precision and accuracy of this instrument make it a versatile alternative to standard chemiluminescence-based NO.sub.y instruments.
| Inventors: | Brown; Steven S.; (Boulder, CO) ; Dube; William P.; (Wheat Ridge, CO) ; Wild; Robert J.; (Boulder, CO) | ||||||||||
| Applicant: |
|
||||||||||
|---|---|---|---|---|---|---|---|---|---|---|---|
| Assignee: | The United States of America,
represented by the Secretary of Commerce Silver Spring MD |
||||||||||
| Family ID: | 54930211 | ||||||||||
| Appl. No.: | 14/722214 | ||||||||||
| Filed: | May 27, 2015 |
Related U.S. Patent Documents
| Application Number | Filing Date | Patent Number | ||
|---|---|---|---|---|
| 62017298 | Jun 26, 2014 | |||
| Current U.S. Class: | 436/116 ; 422/83; 422/93 |
| Current CPC Class: | Y02A 50/20 20180101; G01N 33/0037 20130101; Y02A 50/245 20180101; G01N 33/0016 20130101 |
| International Class: | G01N 33/00 20060101 G01N033/00 |
Goverment Interests
STATEMENT OF GOVERNMENT INTEREST
[0002] The research that led to the development of the present invention was sponsored by the National Oceanic and Atmospheric Administration's (NOAA's) Chemical Sciences Division, Earth System Research Laboratory. NOAA is a part of the U.S. Department of Commerce, a component of the U.S. Federal government. The United States Government has certain rights in this invention.
Claims
1. An instrument for measuring at least reactive nitrogen (NO.sub.y) content in a gas sample, comprising: an inlet for receiving the gas sample; a heater, coupled to the inlet receiving the gas sample and heating the gas sample, decomposing reactive nitrogen in the gas sample into nitrogen oxides to output a decomposed gas sample; a first reactor, coupled to the heater and an ozone supply, receiving the decomposed gas sample and ozone and reacting nitrogen oxide in the decomposed gas sample into nitrogen dioxide to produce a decomposed and reacted gas sample; and a first cavity ring-down spectrometer, coupled to the first reactor and receiving the decomposed and reacted gas sample, measuring the nitrogen dioxide content of the decomposed reacted gas sample, and outputting a first output signal proportional to the nitrogen dioxide content in the decomposed reacted gas sample; wherein the nitrogen dioxide content in the decomposed reacted gas sample is proportional to the reactive nitrogen content (NO.sub.y) in the gas sample and the output signal is proportional to the reactive nitrogen content (NO.sub.y) in the gas sample.
2. The instrument of claim 1, further comprising: a data processing system, receiving the first output signal and calculating reactive nitrogen content in the gas sample as a function of the first output signal.
3. The instrument of claim 2, wherein the gas sample comprises an atmospheric air sample.
4. The instrument of claim 3, wherein the heater heats the gas sample to substantially 650.degree. C. to 750.degree. C. to decompose reactive nitrogen NO.sub.y into nitrogen into nitrogen oxides NO and NO.sub.2.
5. The instrument of claim 4, wherein the heater comprises a quartz tube wrapped with nichrome wire.
6. The instrument of claim 5, wherein the first cavity ring-down spectrometer comprises an elongated optical cavity with minors at each end, and a substantially 405 nm laser beam traversing the optical cavity between the minors, and a photomultiplier tube located at one end of the optical cavity, such that when the laser beam is turned off, measurement is made by the photomultiplier tube of how long it takes for the light to decay to 1/e of its initial intensity to calculate the concentration of the nitrogen oxide in the optical cavity.
7. The instrument of claim 1, further comprising an instrument for measuring ambient nitrogen dioxide in the gas sample, comprising: an inlet for receiving the gas sample; a second cavity ring-down spectrometer, coupled to the inlet and receiving the gas sample, measuring the nitrogen dioxide content of the gas sample, and outputting an second output signal proportional to the ambient nitrogen dioxide content gas sample.
8. The instrument of claim 7, further comprising an instrument for measuring ambient nitrogen oxides (NO.sub.x) content in the gas sample, comprising: an inlet for receiving the gas sample; a second reactor, coupled to the inlet and to the ozone supply, receiving the gas sample and ozone and reacting nitrogen oxide (NO) in the gas sample into nitrogen dioxide (NO.sub.2) to produce a second reacted gas sample; and a third cavity ring-down spectrometer, coupled to the second reactor and receiving the second reacted gas sample, measuring the nitrogen dioxide content of the second reacted gas sample, and outputting an output signal proportional to the nitrogen dioxide content in the second reacted gas sample; wherein the nitrogen dioxide content in the second reacted gas sample is proportional to the ambient nitrogen oxides (NO.sub.x) content in the gas sample and the third output signal is proportional to the ambient nitrogen oxides (NO.sub.x) content in the gas sample.
9. The instrument of claim 8, wherein the data processing system subtracts a measured ambient nitrogen dioxide content value as measured by the instrument for measuring ambient nitrogen dioxide from a measured ambient nitrogen oxides (NO.sub.x) content value as measured by the instrument for measuring ambient nitrogen oxides (NO.sub.x) to calculate nitrogen oxide (NO) in the gas sample.
10. The instrument of claim 8, wherein the data processing system subtracts a measured ambient nitrogen oxides (NO.sub.x) content value as measured by the instrument for measuring ambient nitrogen oxides (NO.sub.x) from an reactive nitrogen content (NO.sub.y) value as measured by the instrument for measuring at least reactive nitrogen (NO.sub.y), to calculate oxidized reactive nitrogen (NO.sub.z) in the gas sample.
11. The instrument of claim 8, further comprising an instrument for measuring ozone in the gas sample, comprising: an inlet for receiving the gas sample; a third reactor, coupled to the inlet and an nitrogen oxide (NO) supply, receiving the gas sample and nitrogen oxide and reacting ozone in the gas sample with nitrogen oxide into nitrogen dioxide to produce a third reacted gas sample; and a fourth cavity ring-down spectrometer, coupled to the third reactor and receiving the third reacted gas sample, measuring the nitrogen dioxide content of the third reacted gas sample, and outputting an output signal proportional to the nitrogen dioxide content in the third reacted gas sample; wherein the nitrogen dioxide content in the third reacted gas sample is proportional to the ozone content in the gas sample and the output signal is proportional to the ozone content in the gas sample.
12. The instrument of claim 11, further comprising: a laser, providing a substantially 405 nm laser beam; an optical splitter, for splitting the substantially 405 nm laser beam into four beams, such that each of the four laser beams are fed to a corresponding one of the first cavity ring-down spectrometer. the second cavity ring-down spectrometer, the third cavity ring-down spectrometer, and the fourth cavity ring-down spectrometer.
13. A method of measuring at least reactive nitrogen content in a gas sample, comprising the steps of: receiving the gas sample in an inlet; heating the gas sample in a heater coupled to the inlet, to decompose reactive nitrogen in the gas sample into nitrogen oxides outputting a decomposed gas sample; reacting the decomposed gas sample with ozone in a first reactor coupled to the heater and an ozone supply, to react nitrogen oxide in the decomposed gas sample with the ozone, into nitrogen dioxide to produce a decomposed and reacted gas sample; measuring nitrogen dioxide content in the decomposed and reacted gas sample in a cavity first ring-down spectrometer coupled to the reactor; and outputting from the first cavity ring-down spectrometer, an output signal proportional to the nitrogen dioxide content in the decomposed reacted gas sample; wherein the nitrogen dioxide content in the decomposed reacted gas sample is proportional to the reactive nitrogen content in the gas sample and the output signal is proportional to the reactive nitrogen content in the gas sample.
14. The method of claim 13, wherein the gas sample comprises an atmospheric air sample.
15. The method of claim 14, wherein the step of heating the gas sample comprises the step of heating the gas sample to substantially 650.degree. C. to 750.degree. C. to decompose reactive nitrogen NO.sub.y into nitrogen into nitrogen oxides NO and NO.sub.2.
16. The method of claim 15, wherein the heater comprises a quartz tube wrapped with nichrome wire.
17. The method of claim 16, wherein the cavity ring-down spectrometer comprises an elongated optical cavity with minors at each end, and a substantially 405 nm laser beam traversing the optical cavity between the minors, and a photomultiplier tube located at one end of the optical cavity, wherein the step of measuring nitrogen dioxide content in the decomposed and reacted gas sample comprises the steps of: measuring with photomultiplier tube of how long it takes for the light to decay to 1/e of its initial intensity when the laser beam is turned off; and calculating concentration of the nitrogen oxide in the optical cavity as a function of how long it takes for the light to decay to 1/e of its initial intensity when the laser beam is turned off.
18. The method of claim 13, further comprising the steps of measuring ambient nitrogen dioxide in the gas sample, comprising: receiving the gas sample in an inlet; measuring, in a second cavity ring-down spectrometer coupled to the inlet and receiving the gas sample, the nitrogen dioxide content of the gas sample; and outputting an second output signal proportional to the ambient nitrogen dioxide content gas sample.
19. The method of claim 18, further comprising the steps of measuring ambient nitrogen oxides (NO.sub.x) content in the gas sample, comprising: receiving the gas sample in an inlet; reacting in a second reactor coupled to the inlet and to the ozone supply, the gas sample and ozone and reacting nitrogen oxide (NO) in the gas sample into nitrogen dioxide (NO.sub.2) to produce a second reacted gas sample; and measuring, in a third cavity ring-down spectrometer coupled to the second reactor and receiving the second reacted gas sample, the nitrogen dioxide content of the second reacted gas sample; and outputting an output signal proportional to the nitrogen dioxide content in the second reacted gas sample; wherein the nitrogen dioxide content in the second reacted gas sample is proportional to the ambient nitrogen oxides (NO.sub.x) content in the gas sample and the third output signal is proportional to the ambient nitrogen oxides (NO.sub.x) content in the gas sample.
20. The method of claim 19, further comprising the steps of: subtracting, in a data processing system, a measured ambient nitrogen dioxide content value from a measured ambient nitrogen oxides (NO.sub.x) content value to calculate nitrogen oxide (NO) in the gas sample.
21. The method of claim 19, further comprising the steps of: subtracting in a data processing system, a measured ambient nitrogen oxides (NO.sub.x) content vale from a measured reactive nitrogen content (NO.sub.y) in the gas sample to calculate oxidized reactive nitrogen (NO.sub.z) in the gas sample.
22. The method of claim 19, further comprising the step of measuring ozone in the gas sample, comprising: receiving the gas sample in an inlet; reacting in a third reactor coupled to the inlet and an nitrogen oxide (NO) supply, ozone in the gas sample with nitrogen oxide into nitrogen dioxide to produce a third reacted gas sample; measuring in a fourth cavity ring-down spectrometer coupled to the third reactor and receiving the third reacted gas sample, the nitrogen dioxide content of the third reacted gas sample; and outputting an output signal proportional to the nitrogen dioxide content in the third reacted gas sample; wherein the nitrogen dioxide content in the third reacted gas sample is proportional to the ozone content in the gas sample and the output signal is proportional to the ozone content in the gas sample.
23. The method of claim 22 further comprising: generating, using a laser, a substantially 405 nm laser beam; and splitting, with an optical splitter, the substantially 405 nm laser beam into four beams, such that each of the four laser beams are fed to a corresponding one of the first cavity ring-down spectrometer. the second cavity ring-down spectrometer, the third cavity ring-down spectrometer, and the fourth cavity ring-down spectrometer.
Description
CROSS-REFERENCE TO RELATED APPLICATIONS
[0001] The present application claims priority from Provisional U.S. Patent Application No. 62/017,298 filed on Jun. 26, 2014, and incorporated herein by reference.
FIELD OF THE INVENTION
[0003] The present invention relates to a new method and apparatus for detection of NO.sub.y as part of a compact system that measures NO, NO.sub.2, NO.sub.y and O.sub.3 based on Cavity Ring-Down Spectroscopy (CRDS).
BACKGROUND OF THE INVENTION
[0004] Measurement of oxides of nitrogen is important in studying air pollution and its effects on the atmosphere. Combustion processes, such as from coal-fired power plants, automobiles, and the like, may produce oxides of nitrogen as a byproduct, typically as NO. In the atmosphere, NO may react with other chemicals, notably ozone (O.sub.3) to produce NO.sub.2. Combined, NO.sub.2 and NO may be referred to as "Nitrogen Oxides" or NO.sub.x. Nitrogen Oxides may combine with other chemicals in the atmosphere to produce other nitrogen compounds, which may be referred to as reactive nitrogen or NO.sub.y. Studying the effect of NO.sub.y on the atmosphere as well as its concentration levels, as well as ozone (O.sub.3) levels requires an instrument or instruments to measure the level of these chemicals in the atmosphere.
[0005] Reactive nitrogen compounds play a central role in atmospheric chemistry. Nitrogen oxides (NO.sub.x.ident.NO+NO.sub.2) strongly affect the oxidative capacity of the atmosphere through the catalytic cycle that produces ozone (O.sub.3) in the lower atmosphere. Total reactive nitrogen (NO.sub.y) includes NO.sub.x and all its reservoirs:
NO.sub.y.ident.NO+NO.sub.2+NO.sub.3+2N.sub.2O.sub.5+HNO.sub.3+HONO+HO.su- b.2NO.sub.2+PAN (peroxy acetyl nitrates)+aerosol nitrates+organic nitrates+ . . .
[0006] Reactive nitrogen compounds (NO.sub.y) have been identified as precursors for both ozone and fine particulate matter (PM.sub.2.5). The EPA's National Ambient Air Monitoring Strategy (NAAMS) calls for deployment of NO.sub.y monitors at approximately 75 locations. The EPA Office of Air Quality Planning and Standards (OAQPS) began an effort to gain knowledge and experience with NO.sub.y monitoring in order to resolve a number of technical issues that have been identified with NO.sub.y monitoring, as well as to be prepared to provide support to State and Local monitoring agencies as they begin to purchase, install, and operate NO.sub.y monitors. (See, e.g., McClenny, W. A., et al., Preparing to measure the effects of the NO.sub.x SIP Call--Methods for ambient air monitoring of NO, NO.sub.2, NO.sub.y, and individual NO.sub.z species, Journal of the Air & Waste Management Association 2002, 52, 542-562, incorporated herein by reference).
[0007] NO.sub.y consists of all oxides of nitrogen in which the oxidation state of the N atom is +2 or greater, i.e., the sum of all reactive nitrogen oxides including NO.sub.x (NO+NO.sub.2) and other nitrogen oxides referred to as NO.sub.z. The major components of NO.sub.z include nitrous acids [nitric acid (HNO.sub.3), and nitrous acid (HONO)], peroxy nitrates [peroxyl acetyl nitrate (PAN), methyl peroxyl acetyl nitrate (MPAN), and peroxyl propionyl nitrate, (PPN)], organic nitrates [alkyl nitrates of one or more carbon atoms and multi-functional nitrate species], and particulate nitrates.
NO+NO.sub.2+NO.ident.NO.sub.y
[0008] One Prior Art method of measuring NO.sub.y is the use of a thermal catalytic converter to convert reactive nitrogen species to NO followed by detection of NO by its chemiluminescence reaction with an excess of O.sub.3. NO is measured by bypassing the converter. The combination of NO.sub.2 and NO.sub.z can be then determined by the difference. This procedure is similar to the Prior Art methodology used to measure NO.sub.x, however, the catalytic converter temperature is higher in order to more completely convert NO.sub.z species, and the converter has been moved to very near the sample inlet to avoid line losses of "sticky" NO.sub.y species such as HNO.sub.3.
[0009] The NO.sub.x measurement produced by this method is not considered accurate by the research community, although it is still currently used by the regulatory community. This converter operates through reduction of NO.sub.y to NO in a heated molybdenum catalyst. When the molybdenum catalyst is operated at somewhat lower temperature, the measurement is interpreted as being NO.sub.x and not NO.sub.y (i.e., only the NO.sub.2 is supposedly converted to NO at the lower temperature). The NO.sub.y measurement may be acceptable if the heated molybdenum converter is placed very close to the end of the inlet, but the NO.sub.x measurement generally includes some fraction of the NO.sub.y compounds and is therefore considered only an upper limit to the actual NO.sub.x.
[0010] Knowledge of the abundance of this chemical family, as well as NO, NO.sub.2, and the related compound O.sub.3, is a useful indicator of total nitrogen emissions, air mass age, competition between different chemical processes, and the efficiency of ozone production associated with particular emission sources. Again, standard measurements of NO.sub.y rely on catalytic decomposition of NO.sub.y to NO, followed by NO detection using chemiluminescence (See, e.g., Fahey, D. et al., Evaluation of a catalytic reduction technique for the measurement of total reactive odd-nitrogen NO.sub.y in the atmosphere, Journal of Atmospheric Chemistry 1985, 3, 435-468, incorporated herein by reference).
[0011] The most commonly used materials for conversion are gold and molybdenum. However, catalytic converters are prone to deterioration, affecting conversion efficiencies. As a result, they require frequent calibrations and need to be "reconditioned" or cleaned periodically, depending on the history of exposure (See, e.g., Crosley, D. R., NO.sub.y Blue Ribbon panel. Journal of Geophysical Research, Atmospheres 1996, 101, 2049-2052, incorporated herein by reference).
[0012] Additionally, the chemical processes involved in the catalytic conversion are not fully understood, as illustrated by Kliner, D. A. V. et al., Laboratory investigation of the catalytic reduction technique for measurement of atmospheric NO.sub.y, Journal of Geophysical Research: Atmospheres 1997, 102, 10759-10776, also incorporated herein by reference.
[0013] Inlet design can also play a major role, as some NO.sub.y species, notably HNO.sub.3, can suffer significant losses on inlet surfaces as described by Williams, E. J. et al., Intercomparison of ground-based NO.sub.y measurement techniques, Journal of Geophysical Research: Atmospheres 1998, 103, 22261-22280, and Neuman, J. A. et al., Study of Inlet Materials for Sampling Atmospheric Nitric Acid, Environmental Science & Technology 1999, 33, 1133-1136, both which are incorporated herein by reference.
[0014] Thus it remains a requirement in the art to provide a compact and efficient instrument for measuring NO.sub.y, NO.sub.2, NO, and O.sub.3 concentrations in the atmosphere.
BRIEF SUMMARY OF THE INVENTION
[0015] The present invention provides a new method and apparatus for detection of NO.sub.y as part of a compact system that uses four channels to simultaneously measure NO, NO.sub.2, NO.sub.y and O.sub.3 based on cavity ring-down spectroscopy (CRDS). Similar to direct absorption spectroscopy, CRDS is an absolute measurement of trace gas concentration, with an accuracy limited only by knowledge of the absorption cross section, inlet sampling losses, and potential interfering absorbers.
[0016] The instrument has lower power, size, weight, and vacuum requirements than a chemiluminescence-based instrument while approaching its sensitivity, precision and time response. In the NO.sub.y CRDS instrument of the present invention, NO.sub.y and its components are converted into NO.sub.2 by thermal decomposition (TD) in a fused silica inlet (henceforth referred to as quartz, following convention), followed by the addition of ozone to convert NO to NO.sub.2. NO.sub.2 is then measured using a cavity ring-down spectroscopy instrument, utilizing a nominally 405 nm laser. The device may comprise four parallel channels, each driven by the same laser, to measure NO, NO.sub.2, NO.sub.y and O.sub.3, respectively, such that overall NO.sub.y may be measured, as well as its components NO, NO.sub.2, as well as ozone (O.sub.3).
[0017] The successful use of TD has been demonstrated for various individual NO.sub.y compounds. Dube, W. P. et al., demonstrated the successful use of TD for N.sub.2O.sub.5 in Aircraft instrument for simultaneous, in situ measurement of NO.sub.3 and N.sub.2O.sub.5 via pulsed cavity ring-down spectroscopy, Review of Scientific Instruments 2006, 77, incorporated herein by reference.
[0018] The successful use of TD for peroxy nitrates has been demonstrated, for example, by Wooldridge, P. J. et al., Total Peroxy Nitrates (.SIGMA. PNs) in the atmosphere: the Thermal Dissociation-Laser Induced Fluorescence (TD-LIF) technique and comparisons to speciated PAN measurements, Atmospheric Measurement Techniques 2010, 3, 593-607, and Di Carlo, P.; et al., Aircraft based four-channel thermal dissociation laser induced fluorescence instrument for simultaneous measurements of NO.sub.2, total peroxy nitrate, total alkyl nitrate, and HNO.sub.3. Atmospheric Measurement Techniques 2013, 6, 971-980, both of which are incorporated herein by reference.
[0019] The successful use of TD for HONO has been demonstrated by Perez, I. M.; Wooldridge, P. J.; Cohen, R. C. Laboratory evaluation of a novel thermal dissociation chemiluminescence method for in situ detection of nitrous acid, Atmospheric Environment 2007, 41, 3993-4001, incorporated herein by reference.
[0020] The successful use of TD for ClNO.sub.2 has been demonstrated by Thaler, R. D.; Mielke, L. H.; Osthoff, H. D. Quantification of Nitryl Chloride at Part Per Trillion Mixing Ratios by Thermal Dissociation Cavity Ring-Down Spectroscopy, Analytical Chemistry 2011, 83, 2761-2766, incorporated herein by reference.
[0021] The successful use of TD for alkyl nitrates and HNO.sub.3 has been demonstrated by Day, D. A.; Wooldridge, P. J.; Dillon, M. B.; Thornton, J. A.; Cohen, R. C., A thermal dissociation laser-induced fluorescence instrument for in situ detection of NO.sub.2, peroxy nitrates, alkyl nitrates, and HNO.sub.3, Journal of Geophysical Research: Atmospheres 2002, 107, ACH 4-1-ACH 4-14, incorporated herein by reference.
[0022] However, the combination of thermal dissociation and ozone is a new method to determine total NO.sub.y. Combined with existing techniques for measuring NO, NO.sub.2, and O.sub.3, the present invention allows all four of these important and related species to be measured simultaneously in a single four-channel instrument, with precision, accuracy, and time response sufficient for their measurement in ambient air across a range of environments and measurement platforms, including measurements from moving vehicles.
[0023] The instrument and method of the present invention, all of the NO.sub.y is converted to NO.sub.2 (not NO) using a much hotter oven (quartz at substantially 650.degree. C. to 750.degree. C.) than the Prior Art, with no catalyst. The NO is then converted NO.sub.2 using the addition of ozone, and the NO.sub.2 measured by cavity ring down spectroscopy. The NO.sub.y and NO.sub.x channels are thus more accurate than the Prior Art techniques (using catalytic converters and chemiluminescence) for measuring NO.sub.z. This instrument may be used in a stand-alone mode, or in a four-channel embodiment to measure O.sub.3, NO.sub.x, NO.sub.2, and NO.sub.y.
[0024] In one preferred embodiment, four channels are provided, to measure O.sub.3, NO.sub.x, NO.sub.2, and NO.sub.y using the same 405 nm laser. All four channels use measurement of NO.sub.2 to infer or calculate levels of O.sub.3, NO.sub.y, NO.sub.2, and NO.sub.y. The same laser, suitably divided, may be used for all four channels, or separate lasers provided. Using a single laser may be preferable, as the same frequency of light is assured between channels, thus elimination this variation from cross-channel calibration. A single cavity ring-down spectrometer (CRDS), suitably plumbed, may sequentially take measurements for all four channels. In the preferred embodiment, separate cavity ring-down spectrometers are provided for each channel.
[0025] The NO.sub.2 channel is relatively straightforward. An atmospheric sample is acquired and a "blank volume" is used to provide the same residence time as in the other channels, as the NO.sub.2 channel does not use a reactor vessel as with the other channels. This ambient NO.sub.2 may then be measured in by a cavity ring-down spectrometer (CRDS). The resultant measurement will be proportional to the amount of ambient NO.sub.2 in the atmospheric sample. This value may be used by itself, in atmospheric science studies, but may also be used to determine the baseline amount of ambient NO.sub.2 to subtract this value out from other channel data as will be discussed below.
[0026] The NO (and NO.sub.y) channel reacts an atmospheric sample with a supply of O.sub.3 in a reactor vessel. The resultant reaction combines the ambient NO with the O.sub.3 in the vessel to form NO.sub.2. The resultant sample now has both ambient NO.sub.2 along with NO.sub.2 converted from NO. Since the amount of NO in the original sample has been converted to a similar amount of NO.sub.2, measuring the overall NO.sub.2 will provide a measurement of NO along with ambient NO.sub.2. This combined sample may then be measured in by a cavity ring-down spectrometer (CRDS). The resultant measurement will be proportional to the amount of NO and ambient NO.sub.2 in the atmospheric sample, which yields the value for NO.sub.x. Since the amount of ambient NO.sub.2 is measured by the NO.sub.2 channel, this value can be subtracted out by the data acquisition system, thus yielding a measurement of NO in the atmospheric sample as well.
[0027] The O.sub.3 channel reacts an atmospheric sample with a supply of NO in a reactor vessel. Note that this is exactly the reverse of how the NO channel operates, where O.sub.3 is added to the NO, however the reaction is the same. The resultant reaction combines the ambient O.sub.3 in the vessel with NO to form NO.sub.2, which then may be measured in by a cavity ring-down spectrometer (CRDS). The resultant measurement will be proportional to the amount of O.sub.3 and ambient NO.sub.2 in the atmospheric sample. Since the amount of ambient NO.sub.2 is measured by the NO.sub.2 channel, this value can be subtracted out by the data acquisition system, thus yielding a measurement of O.sub.3 in the atmospheric sample.
[0028] The NO.sub.y channel first decomposes all reactive nitrogen compounds in the atmospheric sample in a substantially 650.degree. C. to 750.degree. C. quartz oven, as will be described below in more detail. In the oven, the NO.sub.y breaks down into NO and NO.sub.2. The sample containing the combined NO and NO.sub.2 is then fed into a reactor, where, as in the NO channel, the NO in the sample reacts with a supply of O.sub.3 in the reactor vessel. The resultant reaction converts the ambient NO in the vessel to NO.sub.2. The amount of NO and NO.sub.2 in the decomposed sample will be proportional to the amount of NO.sub.y, and since the NO has been converted to a similar amount of NO.sub.2, measuring the overall NO.sub.2 will provide a measurement of overall NO.sub.y. The decomposed and reacted sample may then be measured in by a cavity ring-down spectrometer (CRDS). The resultant measurement will be proportional to the amount of NO.sub.y in the atmospheric sample. Since the amount of ambient NO.sub.2 is measured by the NO.sub.2 channel and the amount of NO and NO.sub.x is measured by the NO channel, other values, such as NO.sub.z can be calculated (NO.sub.y--NO.sub.x) by the data acquisition system.
[0029] By using the same reaction of O.sub.3 and NO, three of the four channels can measure different atmospheric components using the same or similar hardware. With the addition of the heater oven, NO.sub.y can be measured as proportion to the resultant NO.sub.2 after decomposition and reaction. Thus, the present invention provides measurement of the four basic compounds of interest to atmospheric scientists (O.sub.3, NO.sub.y, NO.sub.2, and NO.sub.y) with improved accuracy, in a robust and compact instrument.
BRIEF DESCRIPTION OF THE SEVERAL VIEWS OF THE DRAWINGS
[0030] FIG. 1 is a schematic of the custom cage system housing all the optical components.
[0031] FIG. 2 depicts a conceptual drawing of the NO.sub.y converter and associated components as connected to the optical cavity.
[0032] FIG. 3A is an expanded conceptual drawing of the NO.sub.y converter of FIG. 2 showing the optical cavity for the first channel of the measurement system.
[0033] FIG. 3B is a diagram illustrating the main components of the NO.sub.2 channel of the measurement system.
[0034] FIG. 3C is a diagram illustrating the main components of the NO (and NO.sub.y) channel of the measurement system.
[0035] FIG. 3D is a diagram illustrating the main components of the O.sub.3 channel of the measurement system.
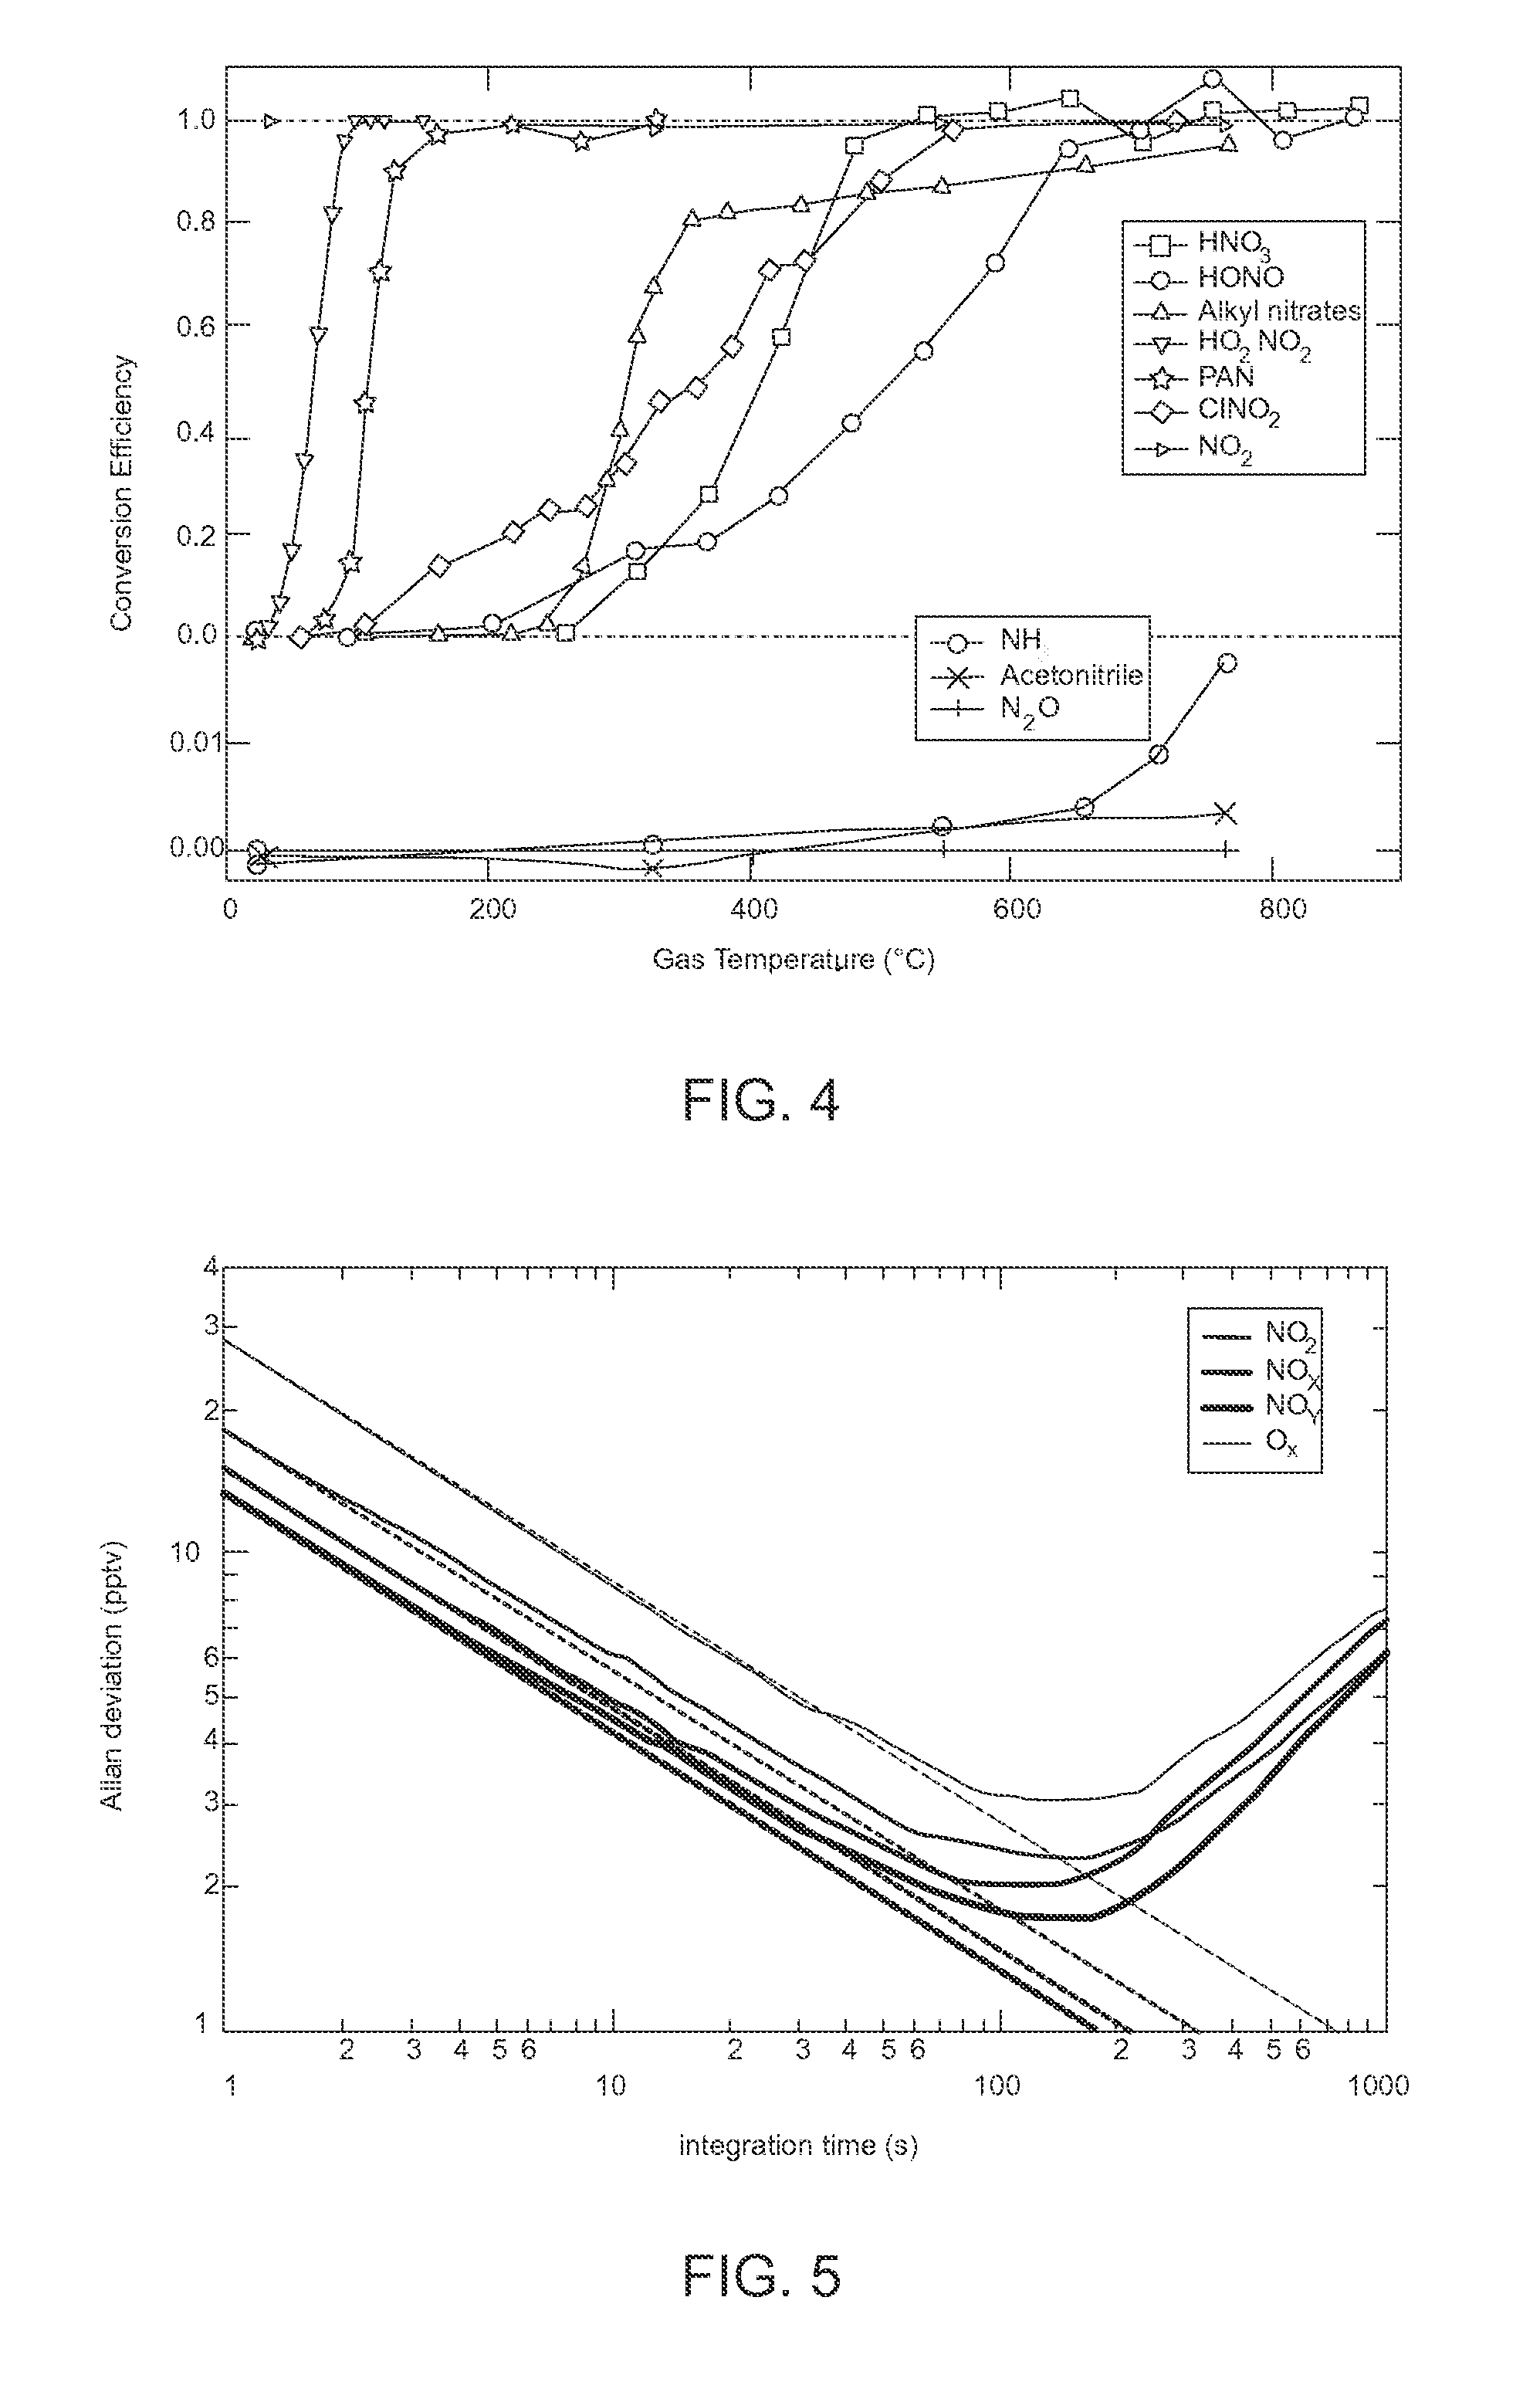
[0036] FIG. 4 is a graph where the upper plot shows temperature profiles of several of the most abundant components of NO.sub.y, HNO.sub.3, and alkyl nitrates compared to a known standard, and the other compounds are scaled to unity at high temperature, and where the lower plot shows temperature profiles from known quantities of possible interference compounds.
[0037] FIG. 5 is a graph illustrating the dependence of 1.sigma. precision on integration time (Allan deviation plots) for the four channels measuring NO.sub.2 in zero air under laboratory conditions. The dashed lines show the expected trend for statistically random noise.
[0038] FIG. 6 is a representative time series showing several days of measurement comparing the total NO.sub.y as measured by the instrument of the present invention with the sum of NO.sub.y components during a February/March UBWOS field campaign, during which NO.sub.x contributed 28% to NO.sub.y.
[0039] FIG. 7 is a correlation plot of NO.sub.y to the sum of components for the entire campaign.
[0040] FIG. 8 is a time series comparing the total NO.sub.y measured by TD to total NO.sub.y measured by a Mo catalytic converter during the June/July SOAS field campaign, during which NO.sub.x contributed 43% to NO.sub.y.
[0041] FIG. 9 is a correlation plot for the two methods for the entire campaign.
DETAILED DESCRIPTION OF THE INVENTION
[0042] The instrument of the present invention is based on the detection of NO.sub.2 via cavity ring-down spectroscopy. General concepts in cavity ring-down spectroscopy are described in Mazurenka, M. I.; Fawcett, B. L.; Elks, J. M.; Shallcross, D. E.; Orr-Ewing, A. J. 410-nm diode laser cavity ring-down spectroscopy for trace detection of NO, Chemical Physics Letters 2003, 367, 1-9, Wada, R.; Orr-Ewing, A. J. Continuous wave cavity ring-down spectroscopy measurement of NO.sub.2 mixing ratios in ambient air, Analyst 2005, 130, 1595-1600, Hargrove, J.; Wang, L.; Muyskens, K.; Muyskens, M.; Medina, D.; Zaide, S.; Zhang, J. Cavity Ring-Down Spectroscopy of Ambient NO.sub.2 with Quantification and Elimination of Interferences, Environmental Science & Technology 2006, 40, 7868-7873, and Castellanos, P.; Luke, W. T.; Kelley, P.; Stehr, J. W.; Ehrman, S. H.; Dickerson, R. R. Modification of a commercial cavity ring-down spectroscopy NO.sub.2 detector for enhanced sensitivity, Review of Scientific Instruments 2009, 80, all of which are incorporated herein by reference.
[0043] The working principle of CRDS, as well as the conversion of O.sub.3 and NO to NO.sub.2, has been described in detail, for example by Fuchs, H.; Dube, W. P.; Lerner, B. M.; Wagner, N. L.; Williams, E. J.; Brown, S. S. A Sensitive and Versatile Detector for Atmospheric NO.sub.2 and NO.sub.x Based on Blue Diode Laser Cavity Ring-Down Spectroscopy, Environmental Science & Technology 2009, 43, 7831-7836, PMID: 19921901, and Washenfelder, R. A.; Wagner, N. L.; Dube, W. P.; Brown, S. S. Measurement of Atmospheric Ozone by Cavity Ring-down Spectroscopy, Environmental Science & Technology 2011, 45, 2938-2944, both of which are incorporated herein by reference, and will only be summarized here with emphasis on the design improvements. In the present invention, an 80 mW laser diode centered at 405 nm and modulated with a 2 kHz square wave provides light for the four measurement channels.
[0044] Cavity Ring-Down Spectroscopy (CRDS) is a highly sensitive optical spectroscopic technique that enables measurement of absolute optical extinction by samples that scatter and absorb light. It has been widely used to study gaseous samples which absorb light at specific wavelengths, and in turn to determine mole fractions down to the parts per trillion level. The technique is also known as Cavity Ring-down Laser Absorption Spectroscopy (CRLAS).
[0045] A typical CRDS setup consists of a substantially 405 nm laser that is used to illuminate a high-finesse optical cavity, which in its simplest form consists of two highly reflective mirrors. When the laser is in resonance with a cavity mode, intensity builds up in the cavity due to constructive interference. The laser is then turned off in order to allow the measurement of the exponentially decaying light intensity leaking from the cavity. During this decay, light is reflected back and forth thousands of times between the mirrors giving an effective path length for the extinction on the order of a few kilometers. The frequency of substantially 405 nm was chosen as it is optimized for detecting NO.sub.2 in a gas sample. Other frequencies may be used within the spirit and scope of the invention, and indeed, the laser itself may be prone to frequency drift. Periodic zeroing of the apparatus helps compensate for this drift, as well as variations in the output of the photomultiplier tube detector.
[0046] If something that absorbs light is placed in the cavity, the amount of light decreases faster--it makes fewer bounces before it is all gone. A CRDS setup measures how long it takes for the light to decay to 1/e of its initial intensity, and this "ringdown time" can be used to calculate the concentration of the absorbing substance in the gas mixture in the cavity.
[0047] A Faraday optical isolator provides protection from optical feedback into the laser. When the light is modulated off, the intensity inside the optical cavities decreases exponentially as measured by four photomultiplier tubes (PMT; one for each channel of a four-channel embodiment of the present invention) that detect the light intensity transmitted through the rear minors. The exponential decays are co-added and fitted once per second to extract the time constant with (.tau.) and without (.tau..sub.0) the absorber present. The number density of the absorber is then given by:
[ N O 2 ] = 1 c .sigma. NO 2 ( 1 .tau. - 1 .tau. 0 ) ( 1 ) ##EQU00001##
where c is the speed of light and .sigma..sub.NO2 is the NO.sub.2 absorption cross section. Previous 405 nm CRDS instruments from this group have included purge volumes adjacent to the minors to maintain their cleanliness. Purge volumes require a multiplicative factor, RL=d/l in equation 1, where d is the minor separation and l is the length over which the sample is present. This factor may have had a dependence on pressure that introduces uncertainties into the measurement as described, for example, by Wagner, N. L.; Dube, W. P.; Washenfelder, R. A.; Young, C. J.; Pollack, I. B.; Ryerson, T. B.; Brown, S. S. Diode laser-based cavity ring-down instrument for NO.sub.3, N.sub.2O.sub.5, NO, NO.sub.2 and O.sub.3 from aircraft, Atmospheric Measurement Techniques 2011, 4, 1227-1240, incorporated herein by reference. The instrument of the present invention does not currently include mirror purge volumes, which simplifies the calibrations and eliminates a possible source of error. However, such purge volumes could be provided without departing from the spirit and scope of the present invention.
[0048] FIG. 1 is a schematic of the custom cage system that houses all the optical components for a four-channel embodiment of the present invention. A large section of the framework has been cut out of the Figure, for ease of illustration. The laser paths 130 are shown in dark lines, and the optical system components have been left in place. The combination of aluminum plates 120 and carbon fiber rods 110 give the system high mechanical rigidity, helping to achieve a measurement precision of a few pptv on a minute timescale.
[0049] Referring to FIG. 1, the optical system is mounted in a custom designed cage system with 1/2 inch carbon fiber rods 110 providing stability against mechanical and thermal stress. A single laser 150 may be used for all four channels of the system. The beam 130 from laser 150, which may comprise a 405 nm laser, may be divided by divider(s) 160 into four separate paths. Mirrors 140 may be used to divert the path of the beam 130 into four parallel paths as illustrated. The beams 130 are then fed into optical cavities 310, of which only two are shown in this cutaway drawing.
[0050] The instrument as a whole is compact and requires low power and maintenance. It measures approximately 110 cm high with a 50 by 70 cm footprint, and consumes 300 W of power at its peak. It weighs 95 kg, which includes the sample pump, a zero air generator, and the data acquisition system. The data acquisition system, however, has not been designed for low weight and currently contributes 15 kg, a figure which could be substantially reduced.
[0051] The instrument may also require a cylinder (or other source) of 02 (not shown) and a cylinder (or other source) of NO (2000 ppm in Nitrogen) also not illustrated in this Figure. These additions can be contained in 1.2 L cylinders mounted directly in the instrument rack and last for about one week of continuous operation. Standard large cylinders would provide more than 120 days of continuous operation.
[0052] In the preferred embodiment, four channels are provided to measure NO, NO.sub.2, NO.sub.y and O.sub.3. NO.sub.2 is directly measured in all channels via equation 1, whereas NO, O.sub.3, and NO.sub.y are quantitatively converted to NO.sub.2 prior to measurement as will be described in more detail below. Atmospheric NO is converted to NO.sub.2 via reaction with excess O.sub.3, created by flowing O.sub.2 over a Hg Pen-Ray.RTM. Model 3SC-9 lamp (185 nm) from UVP, LLC of Upland California.
[0053] As described in detail by Fuchs et al., cited above, the added O.sub.3 results in a small percentage (<1%) of NO.sub.2 conversion to NO.sub.3, which subsequently reacts with NO.sub.2 to form N.sub.2O.sub.5. Similarly, O.sub.3 is converted to NO.sub.2 via the same reaction by addition of excess NO as described by Washenfelder et al., cited above, but without the N.sub.2O.sub.5 interference because NO+NO.sub.3.fwdarw.2NO.sub.2. Conversion of the NO.sub.y species is performed via gas-phase thermal dissociation in a quartz inlet, chosen for its high melting point and because it is relatively unreactive.
[0054] FIG. 2 depicts a conceptual drawing of the NO.sub.y converter and associated components as connected to the optical cavity for one of the four channels of the apparatus of FIG. 1. The remaining three channels will be described in more detail below. The other channels use similar components as the NO.sub.y channel, however with fewer components. The thermal heater 270 described in FIGS. 2 and 3A is only required for the NO.sub.y channel, but not for the O.sub.3, NO, or NO.sub.2 channels. The reactor 210 is not required for the NO.sub.2 channel. For the sake of brevity, the same reference numerals are used to describe common components for each channel, as each channel contains the same or similar core components.
[0055] For the NO.sub.y channel, an atmospheric sample is obtained through the inlet of heater 270. NO.sub.y and its components are first converted in the NO.sub.y heater 270 into NO.sub.2 by thermal decomposition (TD). The heated section 270 comprises a nichrome wire wrapped around a quartz tube. It is thermally insulated with fiberglass insulation and encased in a metal shell ending in a cone, protecting the quartz and conducting heat to the tip. A profile of air temperature as a function of position inside the heater 290 with a flow of 1.5 standard liters per minute at atmospheric pressure is shown in FIG. 2 (with set point higher than normal operation). The total residence time in the heated section is about 48 ms.
[0056] The metal shell of heated section 270 ends in a cone-shaped inlet nozzle to ensure that the quartz is heated to the inlet end in order to minimize losses of HNO.sub.3, which can be significant on colder surfaces, especially quartz. After the heated section 270, NO.sub.y components have been converted to NO.sub.2 (and possibly some NO), which can be transported to the CRDS measurement cell through an arbitrary length of Teflon tubing without significant losses. A cooling region 260 may cool the converted sample, and particle filter 240 may remove large particle impurities from the converted sample.
[0057] Zero air addition 250 is used for a periodic measurement of .tau..sub.0 to calibrate, or more precisely, zero the device. Periodically (on the order of minutes) during operation, zero air 250 from an air source having no NO components, is fed into the system and the resultant value from the photomultiplier tube (PMT) measured by the data acquisition system. This value then represents the "zero" level of NO.sub.2 and is then used as a baseline for subsequent measurements. Frequent calibration or zeroing insures that subsequent measurements are accurate and compensates for drift or other deviations in the measuring system, due to variations in the operation of the photomultiplier tubes, instruments, or even mirror degradation. The required frequency would depend on operational environment. Zeros may be run as infrequently as every 30 minutes, and it may be done as infrequently as every hour if desired.
[0058] To zero the instrument (i.e. measure To in equation 1) the inlets are overflowed with zero air 250 generated in situ (or supplied by a cylinder when necessary). Zero air 250 may be generated, for example, by pumping filtered ambient air through a NO.sub.x and O.sub.3 scrubber. Overflow is achieved using an annular inlet (i.e. with zero air added through a large diameter tube that surrounds and extends just beyond the sample inlet) for the NO, NO.sub.2, and O.sub.3 channels, and a simple tee fitting 250, as shown in FIG. 2, is used for the separate NO.sub.y inlet. The overflow during the zeros creates a pressure change of <0.2 hPa (0.03%) for the annular inlet, and a change of 4 hPa (0.5%) in the NO.sub.y inlet.
[0059] The change in pressure for the NO.sub.y zero changes the Rayleigh scattering of the air sample, requiring a correction of approximately 60 pptv equivalent NO.sub.2, which is based on well-known Rayleigh cross sections and is accurate to well within 3 pptv. Each channel is zeroed approximately every 7 minutes during mobile platform operations, but this time may be increased to 15 to 30 minutes or longer for stationary settings. A zeroing may take on the order of between 10 and 30 seconds, depending on the length of the inlet.
[0060] As illustrated in FIG. 2, just prior to a sample entering the optical cavity, excess O.sub.3 230 is added to convert any NO to NO.sub.2 in reactor 210. As a result, all of the NO.sub.y components have been converted to NO.sub.2 220 and the resultant measured NO.sub.2 provides an indicia of the overall NO.sub.y, in one channel of the system. Other channels measure the amount of NO.sub.2 or NO.sub.x. Subtraction of NO.sub.x from NO.sub.y provides NO.sub.z, if desired.
[0061] During normal operations, the front half of a quartz tube (heater 270) is heated such that the sample air reaches a temperature of approximately 700.degree. C. The inset 290 in FIG. 2 illustrates a typical temperature profile of the gas in heater 270 (set to heat the gas to 750.degree. C.), measured by insertion of a thermocouple probe in the gas flow during ambient air sampling. As illustrated in the inset 290, the actual sample temperature varies as the air sample flows through heater 270. In practice, heater 270 is set to substantially 750.degree. C. Decomposition of the reactive nitrogen NO.sub.y into NO.sub.x occurs between approximately 650.degree. C. and 750.degree. C. Other temperature values may be used within the spirit and scope of the present invention, provided that the temperature used breaks down the NO.sub.y into NO.sub.x so that it can be measured. For a 1.5 slpm flow, the plug flow residence time in the heated section 270 is approximately 48 ms. The Reynolds number is <1000 for the given range of temperatures, well in the laminar flow regime.
[0062] Since the converter 270 itself functions as the inlet, particulate sampling operates with a high efficiency and includes particulate nitrate in the NO.sub.y budget. See, e.g., Rollins, A. W.; Smith, J. D.; Wilson, K. R.; Cohen, R. C. Real Time In Situ Detection of Organic Nitrates in Atmospheric Aerosols, Environmental Science & Technology 2010, 5540-5545, incorporated herein by reference.
[0063] Particulate nitrate entering the converter 270 should evaporate rapidly, eliminating inertial loss normally associated with particulate sampling. The thermal conversion process produces mainly NO.sub.2, although some compounds, such as HONO, may dissociate to NO. A small fraction of the NO.sub.2 may also be reduced to NO by reaction with atomic oxygen in the converter. Finally, the thermal converter is not designed to convert NO to NO.sub.2. Any NO in the air sample after the heating and cooling process is converted to NO.sub.2 via addition of excess O.sub.3 230 just prior to the CRDS measurement cell (in reactor 210), as in the NO.sub.x channel.
[0064] The O.sub.3 230 may be generated from the same Pen-Ray lamp source and split evenly between the two channels (NO.sub.y and NO.sub.y) using a pair of critical orifices to divide the flow.
[0065] FIG. 3A is an expanded conceptual drawing of the NO.sub.y converter of FIG. 2 showing the optical cavity and measurement system. NO.sub.2 from reactor 210 is fed to optical cavity 310. To increase stability and compactness over previous designs, the distance between cavity mirrors 240 in optical cavity 310 has been reduced from 1 m to 50 cm. Cavity mirrors 240 with 1 m radius of curvature are reused, and have found to have minimal loss of sensitivity. The corresponding ring down time constant (.tau..sub.0), determined by a combination of mirror reflectivity and Rayleigh scattering losses at ambient pressure, is approximately 30 .mu.s, with a precision (1.sigma., 1 s) of 6 ns.
[0066] As noted above with regard to equation (1), a Faraday optical isolator provides protection from optical feedback into the laser. When the light is modulated off, the intensity inside the optical cavities decreases exponentially as measured by photomultiplier tube (PMT) that detects the light intensity transmitted through the rear mirror. The signal from photomultiplier tube PMT is fed to a data acquisition system 350 which may include a digitizer, such as the National Instruments M-series multifunction DAQ, manufactured by National Instruments, of Austin, Tex. Data acquisition system 350 may also include a personal computer, laptop or other computer device known in the art, capable of receiving digitized data from the digitizer, and storing, manipulating, and displaying data results.
[0067] The embodiments of FIGS. 2 and 3A illustrate all of the components of one channel of the apparatus of the present invention, namely the NO.sub.y channel. This instrument may be used in a stand-alone mode, or in a four-channel embodiment to measure O.sub.3, NO.sub.y, NO.sub.2, and NO.sub.y. In one preferred embodiment, four channels are provided, to measure O.sub.3, NO.sub.y, NO.sub.2, and NO.sub.y using the same 405 nm laser. All four channels use measurement of NO.sub.2 to infer or calculate levels of O.sub.3, NO.sub.x, NO.sub.2, and NO.sub.y. The same laser, suitably divided, may be used for all four channels, or separate lasers provided. Using a single laser may be preferable, as the same frequency of light is assured between channels. A single cavity ring-down spectrometer (CRDS), suitably plumbed, may sequentially take measurements for all four channels. In the preferred embodiment, separate cavity ring-down spectrometers are provided for each channel. Note that for the sake of clarity, the zero air addition of FIG. 2 is not illustrated in FIGS. 3A-D. However, such a zero air addition may be provided for all four channels, in order to zero or calibrate the devices.
[0068] FIGS. 2 and 3A illustrate all of the components of the NO.sub.y channel. The other three channels contain fewer components and are illustrated in FIGS. 3B-3D. These channels will be described below in terms of the components used in those channels, which, having the same or similar components, may use the same reference numerals.
[0069] FIG. 3B is a diagram illustrating the main components of the NO.sub.2 channel. The NO.sub.2 channel is relatively straightforward. Heater 270 is not used for the NO.sub.2 channel, nor is reactor 230. An atmospheric sample is acquired and a "blank volume" 275 is used to provide the same residual time as the other channels, as the NO.sub.2 channel does not use a reactor vessel as with the other channels or a heater as with the NO.sub.y channel. The NO.sub.2 channel essentially comprises the optical cavity 310 and a suitable blank volume of tubing to emulate the amount of plumbing in the other channels. The ambient NO.sub.2 from the atmospheric sample may then be measured by a cavity ring-down spectrometer (CRDS) in optical cavity 310 using photo multiplier tube PMT. The resultant measurement stored in data acquisition system 350 will be proportional to the amount of ambient NO.sub.2 in the atmospheric sample. This value may be used by itself, in atmospheric science studies, but may also be used to determine the baseline amount of ambient NO.sub.2 to subtract this value out from other channel data as will be discussed below.
[0070] FIG. 3C is a diagram illustrating the main components of the NO (and NO.sub.y) channel. For the NO (and NO.sub.y) channel, heater 270 is not used but reactor 210 is. The NO (and NO.sub.y) channel reacts an atmospheric sample with a supply of O.sub.3 230 in a reactor vessel 210. The resultant reaction combines the ambient NO with the O.sub.3 230 in reactor vessel 210 to form NO.sub.2. The resultant sample now has both ambient NO.sub.2 along with NO.sub.2 converted from NO. Since the amount of NO in the original sample has been converted to a similar amount of NO.sub.2, measuring the overall NO.sub.2 will provide a measurement of NO along with ambient NO.sub.2. This combined sample may then be measured by a cavity ring-down spectrometer (CRDS) 310. The resultant measurement will be proportional to the amount of NO and ambient NO.sub.2 in the atmospheric sample, which yields the value for NO.sub.x. Since the amount of ambient NO.sub.2 is measured by the NO.sub.2 channel, this value can be subtracted out by the data acquisition system 350, thus yielding a measurement of NO in the atmospheric sample as well.
[0071] FIG. 3D is a diagram illustrating the main components of the O.sub.3 channel. The O.sub.3 channel reacts an atmospheric sample with a supply of NO 235 in a reactor vessel 230. Instead of adding O.sub.3 230, as illustrated in FIGS. 2 and 3, NO 235 is added to the sample to react with the ambient O.sub.3. Note that this is the reverse of how the NO channel operates, where O.sub.3 is added to the NO, however the reaction is the same. The resultant reaction combines the ambient O.sub.3 in the vessel 210 with NO to form NO.sub.2, which then may be measured by a cavity ring-down spectrometer (CRDS) 310. The resultant measurement will be proportional to the amount of O.sub.3 and ambient NO.sub.2 in the atmospheric sample. Since the amount of ambient NO.sub.2 is measured by the NO.sub.2 channel, this value can be subtracted out by the data acquisition system 350, thus yielding a measurement of O.sub.3 in the atmospheric sample.
[0072] The NO.sub.y channel of FIG. 3A uses all of the components of FIGS. 2 and 3. The NO.sub.y channel first decomposes all reactive nitrogen compounds in the atmospheric sample in a substantially 650.degree. C. to 750.degree. C. quartz oven 270, as described above. In the oven 270, the NO.sub.y breaks down into NO and NO.sub.2. The sample containing the combined NO and NO.sub.2 is then fed into a reactor 210, where, as in the NO channel, the NO in the sample reacts with a supply of O.sub.3 230 in the reactor vessel 210. The resultant reaction converts the ambient NO in the vessel to NO.sub.2. The amount of NO and NO.sub.2 in the decomposed sample will be proportional to the amount of NO.sub.y, and since the NO has been converted to a similar amount of NO.sub.2, measuring the overall NO.sub.2 will provide a measurement of overall NO.sub.y. The decomposed and reacted sample may then be measured by a cavity ring-down spectrometer (CRDS) 310. The resultant measurement will be proportional to the amount of NO.sub.y in the atmospheric sample. Since the amount of ambient NO.sub.2 is measured by the NO.sub.2 channel and the amount of NO and NO.sub.x is measured by the NO channel, other values, such as NO.sub.z can be calculated (NO.sub.y--NO.sub.x) by the data acquisition system 350.
[0073] By using the same reaction of O.sub.3 and NO, three of the four channels can measure different atmospheric components using the same or similar hardware. With the addition of the heater 270, NO.sub.y can be measured as proportion to the resultant NO.sub.2 after decomposition and reaction. Thus, the present invention provides measurement of the four basic compounds of interest to atmospheric scientists (O.sub.3, NO.sub.y, NO.sub.2, and NO.sub.y) with improved accuracy, in a robust and compact instrument. Since the four channels use the same basic cavity ring-down spectrometer (CRDS) 310 and three of the channels use the same (or similar) reactor 210, there is an economy of components and a symmetry in the measuring system which helps insure accurate measurement and simplifies construction and maintenance.
[0074] FIG. 4 is a graph where the upper plot shows temperature profiles of several of the most abundant components of NO.sub.y, HNO.sub.3, and alkyl nitrates compared to a known standard, and the other compounds are scaled to unity at high temperature, and where the lower plot shows temperature profiles from known quantities of possible interference compounds. NH.sub.3 in dry air resulted in the only measurable interference of <1% at 700.degree. C. The interference was less than 0.1% for air with relative humidity of 10% or greater.
[0075] To illustrate the conversion of the various NO.sub.y components, measured temperature profiles of the signal from several NO.sub.y species are shown in FIG. 4. Many of these conversions have been previously demonstrated with heated quartz, as previously discussed, and here, tests have been repeated for the compounds that were readily available. For most samples the output concentration was uncalibrated and scaled to unity in FIG. 4, but a leveling off at high temperature strongly suggests unit conversion. Conversion of NO.sub.3 was not explicitly tested, but it is expected that full conversion will take place at operating temperature. See, e.g., Johnston, H. S.; Cantrell, C. A.; Calvert, J. G., Unimolecular decomposition of NO.sub.3 to form NO and O.sub.2 and a review of N.sub.2O.sub.5/NO.sub.3 kinetics, Journal of Geophysical Research: Atmospheres 1986, 91, 5159-5172, incorporated herein by reference.
[0076] Measurements of HNO.sub.3 and PAN were directly compared to that of a heated Mo catalytic converter, and full conversion was achieved at the operating temperature of 700.degree. C. The alkyl nitrates (a mix of methyl, ethyl, i-propyl, n-propyl, i-pentyl, and i-butyl nitrate from a calibration cylinder) show a rapid conversion to NO.sub.2 up to 300.degree. C., then a slower increase up to 800.degree. C., where we see full conversion to within the cylinder specifications (.+-.10%). The slower conversion at higher temperature differs from previously reported temperature profiles for organic nitrates, and may be due to the temperature profile specific to the inlet of the present invention. Since the design goal is total rather than speciated NO.sub.y, the behavior of organic nitrates at intermediate temperatures does not significantly affect the performance of the total NO.sub.y measurement.
[0077] Some nitrogen-containing gases that are not products of NO.sub.x oxidation and therefore not components of NO.sub.y as traditionally defined could conceivably be converted to NO.sub.x at high temperatures. If they are present at mixing ratios comparable to or larger than NO.sub.y in the atmosphere, as can be the case for NH.sub.3, N.sub.2O and nitriles, these compounds could represent a significant interference for an NO.sub.y measurement based on thermal conversion to NO.sub.2.
[0078] Known standards of NH.sub.3, N.sub.2O, and acetonitrile were sampled with the thermal converter, as shown in the lower plot of FIG. 4. Ammonia resulted in the only non-zero interference, reaching about 1% conversion at our working sample temperature of 700.degree. C. However, this interference was only present in dry air from a cylinder (<1 ppm water vapor mixing ratio). A relative humidity of 10% was enough to suppress the NH.sub.3 conversion to NO.sub.2 to below 0.1%, such that it can be considered a negligible interference in nearly all field situations.
[0079] As with Day et al., cited previously, the apparatus of the present invention is not expected to be sensitive to aromatic nitro compounds. Furthermore, they are not typically expected to be a large fraction of NO.sub.y. Reports of particle bound nitro-PAHs in Los Angeles, for example, have an equivalent gas phase 170 concentration <0.1 pptv. See. e.g., Reisen, F.; Arey, J., Atmospheric Reactions Influence Seasonal PAH and Nitro-PAH Concentrations in the Los Angeles Basin, Environmental Science & Technology 2005, 39, 64-73, incorporated herein by reference.
[0080] Other interferences to NO.sub.2 detection using 405 nm CRDS have been described before. A water vapor interference results from the change in Rayleigh scattering, which was measured by Fuchs, et al., cited above, and results in a small correction to the data. Absorbing gases other than NO.sub.2, such as .alpha.-dicarbonyls, are a direct interference but constitute a small percentage of NO.sub.x in most scenarios. However, since these compounds require a higher dissociation temperature than the NO.sub.y converter provides, they only represent an error in the NO.sub.2 baseline.
[0081] The subtractive measurements of NO, O.sub.3, and NO.sub.z(.ident.NO.sub.y--NO.sub.y) are therefore unaffected by .alpha.-dicarbonyls. Direct absorption by ambient O.sub.3 in the NO and NO.sub.2 channels represents a negligible interference because the absorption cross-section of O.sub.3 at 405 nm is 1.5.times.10.sup.-23 cm2 (.about.4.times.10.sup.4 times smaller than that of NO.sub.2). See, e.g., Axson, J. L.; Washenfelder, R. A.; Kahan, T. F.; Young, C. J.; Vaida, V.; Brown, S. S., Absolute ozone absorption cross section in the Huggins Chappuis minimum (350-470 nm) at 296 K, Atmospheric Chemistry and Physics 2011, 11, 11581-11590, incorporated herein by reference.
[0082] For 50 ppbv (parts per billion, volume) of O.sub.3, the optical extinction is 1:9.times.10.sup.-11 cm.sup.-1, or equivalent to approximately 1 pptv of NO.sub.2. The optical extinction due to the added 30 ppmv O.sub.3 in the NO.sub.x and NO.sub.y channels is measurable, but this signal is constant across instrument zeros and thus does not contribute to the measurement. However, it provides a convenient means to measure the added O.sub.3 by switching the O.sub.3 addition on and off during periods of zero air sampling.
[0083] FIG. 5 is a graph illustrating the dependence of 1.sigma. precision on integration time (Allan deviation plots) for the four channels measuring NO.sub.2 in zero air under laboratory conditions. The dashed lines show the expected trend for statistically random noise. The NO.sub.2 calibrations for the four channels have also been described by Washenfelder and Fuchs, cited previously. O.sub.3 may be measured by a commercial UV absorption O.sub.3 instrument and then quantitatively converted to NO.sub.2 in excess NO. The NO.sub.2 is then measured by CRDS in the four channels.
[0084] The system of the present invention thus provides four measurements (channels) of the effective absorption cross-section, .sigma..sub.NO2, which differ by less than 2% between the channels. The day-to-day variability of these measurements is less than 1%. FIG. 5 shows a typical plot showing the relation between integration time and 1.sigma. precision (Allan deviation plot) for the four channels during sampling of zero air. The dashed lines indicate the expected square root relationship for statistically random noise. All channels follow a nearly statistical noise distribution out to 100 s integration time, resulting in a maximum sensitivity of a few pptv (parts per trillion per volume). Any uncertainties of the NO.sub.2 measurement in the four channels may be due to calibration uncertainties and result in a 3% uncertainty in the base measurement. Conversion of NO.sub.2 to N.sub.2O5 in the two channels that add excess O.sub.3 (NO.sub.x and NO.sub.y) increases the uncertainty of NO.sub.x measurements up to 5%.
[0085] The uncertainty of the NO.sub.y measurement must include the conversion efficiency uncertainties for the different NO.sub.y compounds. The comparisons to known concentrations (HNO.sub.3, PAN, and alkyl nitrates) showed full conversion to within the uncertainty of the standards (approximately 10%, from the uncertainty in conversion efficiency of the Mo converter and the alkyl nitrate cylinder mixing ratio). But for the other compounds quantitative conversion was implied by the temperature profile and uncertainties are unavailable. A total uncertainty was derived empirically by comparison of the thermal dissociation CRDS instrument to a standard NO.sub.y instrument under field conditions. The results of this comparison, discussed below, suggest a limiting uncertainty in the NO.sub.y measurement of 12%.
[0086] The new NO.sub.y detection method and apparatus of the present invention was quantitatively tested during two field comparisons in 2013. One was the Uintah Basin Winter Ozone Study (UBWOS) 2013, during which measurements from the present invention were compared to the sum of the separately measured NO.sub.y components. The other comparison occurred during the Southeast Oxidant and Aerosol Study (SOAS), where total NO.sub.y measurement from the present invention was directly compared to total NO.sub.y measured with a standard Mo catalytic converter.
[0087] FIG. 6 is a representative time series showing several days of measurement comparing the total NO.sub.y as measured by the instrument of the present invention with the sum of NO.sub.y components during a February/March UBWOS field campaign, during which NO contributed 28% to NO.sub.y. FIG. 7 is a correlation plot of NO.sub.y to the sum of components for the entire campaign. FIG. 8 is a time series comparing the total NO.sub.y measured by TD to total NO.sub.y measured by a Mo catalytic converter during the June/July SOAS field campaign, during which NO.sub.x contributed 43% to NO.sub.y. FIG. 9 is a correlation plot for the two methods for the entire campaign. All data shown are five minute averages.
[0088] The UBWOS 2013 campaign was a 4-week study in the Uintah Basin of Utah in February and March. The area is host to extensive oil and gas operations, and regularly experiences strong temperature inversions. This results in very high ozone events as well as elevated levels of NO.sub.z (.ident.NO.sub.y--NO.sub.y, averaging about 12 ppbv over the campaign), making it an ideal field test for the NO.sub.y converter.
[0089] In addition to measurement of total NO.sub.y and NO.sub.y, two chemical ionization mass spectrometers measured concentrations of HNO.sub.3, Cl NO.sub.2, HONO, and PAN. See, e.g., Slusher, D. L.; Huey, L. G.; Tanner, D. J.; Flocke, F. M.; Roberts, J. M., A thermal dissociation-chemical ionization mass spectrometry (TD-CIMS) technique for the simultaneous measurement of peroxyacyl nitrates and dinitrogen pentoxide, Journal of Geophysical Research: Atmospheres 2004, 109, and Roberts, J. M.; Veres, P.; Warneke, C.; Neuman, J. A.; Washenfelder, R. A.; Brown, S. S.; Baasandorj, M.; Burkholder, J. B.; Burling, I. R.; Johnson, T. J.; Yokelson, R. J.; de Gouw, J., Measurement of HONO, HNCO, and other inorganic acids by negative-ion proton-transfer chemical-ionization mass spectrometry (NI-PT-CIMS): application to biomass burning emissions, Atmospheric Measurement Techniques 2010, 981-990, both of which are incorporated herein by reference. A particle-into-liquid sampler measured particle phase inorganic nitrate, and a separate cavity ring-down system measured NO.sub.3 and N.sub.2O.sub.5.
[0090] FIGS. 6 and 7 illustrate the comparison between total NO.sub.y measurement and the sum of the NO.sub.y components as measured by different instruments (not including organic nitrates), for which NO.sub.x represents a 28% contribution to NO.sub.y. FIG. 6 shows a representative time series over a few days.
[0091] FIG. 7 plots the correlation between the NO.sub.y measurement and the sum of the components over the whole campaign. The data presented are 5-minute averages because inlets had small differences in location (several meters separation) at the field site, and because of frequent transient high NO.sub.x spikes that were inhomogeneously mixed. On average, the new NO instrument measured 0.9 ppbv (6%) higher NO.sub.y than the sum of components. This difference may be due to organic nitrates, for which data are not available in 2013, or simply from the combined uncertainties of the individual measurements.
[0092] The SOAS campaign was a 6-week study in central Alabama in June and July of 2013. The site is co-located with a SEARCH network monitoring station maintained by Atmospheric Research and Analysis, Inc. (ARA), which collects long-term measurements of a suite of gases, including total NO.sub.y. The ARA NO.sub.y measurement is performed using a standard Mo catalytic converter that converts NO.sub.y to NO, followed by chemiluminescent detection of NO. The SOAS campaign thus provided an opportunity for direct comparison between 250 the TD-CRDS NO.sub.y and a more conventional NO.sub.y instrument. The inlets were separated by about 110 meters horizontally and 15 meters vertically, with the ARA inlet positioned a few meters above ground. Although mirror purge volumes were also not used for this campaign, a hydrocarbon scrubber as in the UBWOS campaign was not required.
[0093] However, the high humidity of air sampled during summertime in Alabama required drying the sample air with a cold trap for all the channels (after the converter for the NO.sub.y channel) in order to avoid signal degradation due to water vapor condensation on the mirrors. This modification is similar to that used on commercial CRDS instruments that measure NO.sub.2 alone. The cold trap reduced the relative humidity to <15%, but did not measurably influence the transmission of NO.sub.2.
[0094] FIGS. 8 and 9 illustrate a comparison of the two measurements. In this case the average NO.sub.x contribution to NO.sub.y was 43% during the campaign. High concentration spikes tended to show poorer agreement, most likely due to the separation between the inlets. FIG. 8 plots a time series of the two instruments spanning two days with low occurrences of large concentration spikes. FIG. 9 is a correlation plot of all the data from the campaign. The slope is equal to unity to within a 5% measurement uncertainty, but there is an average offset of about 140 pptv. This offset may be caused by variation in the sensitivity to specific components of NO.sub.y, such as coarse aerosol nitrate, between the two instruments, a real difference in ambient NO.sub.y due to the separation of the inlets, a systematic error between the two instruments, or a combination of these. Nevertheless, the observed offset provides an upper limit estimate for our NO.sub.y measurement uncertainty (12%) relative to an accepted standard measurement method.
[0095] Thus, applicants have developed a new and useful, compact and robust CRDS instrument measuring NO, NO.sub.2, O.sub.3, and total NO.sub.y. Applicant has further demonstrated a new technique for measuring NO.sub.y using thermal decomposition to NO.sub.2 in a heated quartz inlet, followed by conversion of NO to NO.sub.2 in excess O.sub.3. Temperature profiles of individual components are consistent with unit conversion efficiency for every NO.sub.y component measured, and there are no significant interferences from other reduced nitrogen compounds. Instrument performance has been demonstrated with comparisons at two ground sites. These field tests show agreement both with the sum of NO.sub.y components measured by separate, independent instruments, and with a measurement of total NO.sub.y by a standard molybdenum catalytic converter to within <1% and an absolute offset of 140 pptv. The latter comparison allows for an empirical definition of an upper limit on the NO.sub.y measurement uncertainty of 12%, although the uncertainty may depend on the relative concentrations of NO.sub.y components. The instrument performance was equivalent while sampling from within a moving vehicle (instrumented van), and has been recently demonstrated from aircraft such as the National Science Foundation C-130 (February-March 2015) and the NOAA P-3 Orion.
[0096] While the preferred embodiment and various alternative embodiments of the invention have been disclosed and described in detail herein, it may be apparent to those skilled in the art that various changes in form and detail may be made therein without departing from the spirit and scope thereof.
[0097] For example, methods may be provided to prevent minor degradation without the need for drying the sample air or scrubbing it of hydrocarbons. Applicant is currently testing designs using smaller purge volumes that require smaller path length corrections than in previously reported instruments, as well as testing other methods to make the mirrors less susceptible to condensation effects. The present invention, while smaller than previously reported versions, can be further reduced in size to allow for more versatile deployments on mobile platforms.
* * * * *
D00000
D00001
D00002
D00003
D00004
D00005
D00006
D00007
D00008
D00009
XML
uspto.report is an independent third-party trademark research tool that is not affiliated, endorsed, or sponsored by the United States Patent and Trademark Office (USPTO) or any other governmental organization. The information provided by uspto.report is based on publicly available data at the time of writing and is intended for informational purposes only.
While we strive to provide accurate and up-to-date information, we do not guarantee the accuracy, completeness, reliability, or suitability of the information displayed on this site. The use of this site is at your own risk. Any reliance you place on such information is therefore strictly at your own risk.
All official trademark data, including owner information, should be verified by visiting the official USPTO website at www.uspto.gov. This site is not intended to replace professional legal advice and should not be used as a substitute for consulting with a legal professional who is knowledgeable about trademark law.