Aluminum-magnesium-lithium Alloys, And Methods For Producing The Same
Bovard; Francine ; et al.
U.S. patent application number 13/828571 was filed with the patent office on 2015-12-31 for aluminum-magnesium-lithium alloys, and methods for producing the same. The applicant listed for this patent is Alcoa Inc.. Invention is credited to Francine Bovard, Dirk C. Mooy, Roberto J. Rioja, Ralph R. Sawtell.
| Application Number | 20150376740 13/828571 |
| Document ID | / |
| Family ID | 51625146 |
| Filed Date | 2015-12-31 |


View All Diagrams
| United States Patent Application | 20150376740 |
| Kind Code | A1 |
| Bovard; Francine ; et al. | December 31, 2015 |
ALUMINUM-MAGNESIUM-LITHIUM ALLOYS, AND METHODS FOR PRODUCING THE SAME
Abstract
New aluminum-magnesium-lithium alloys, and methods for producing the same are disclosed. The alloys generally contain 2.0-3.9 wt. % Mg, 0.1-1.8 wt. % Li, up to 1.5 wt. % Cu, up to 2.0 wt. % Zn, up to 1.0 wt. % Ag, up to 1.5 wt. % Mn, up to 0.5 wt. % Si, up to 0.35 wt. % Fe, 0.05 to 0.50 wt. % of a grain structure control element, up to 0.10 wt. % Ti, and up to 0.10 wt. % of any other element, with the total of these other elements not exceeding 0.35 wt. %, the balance being aluminum.
| Inventors: | Bovard; Francine; (Monroeville, PA) ; Rioja; Roberto J.; (Murrysville, PA) ; Sawtell; Ralph R.; (Gibsonia, PA) ; Mooy; Dirk C.; (Bettendorf, IA) | ||||||||||
| Applicant: |
|
||||||||||
|---|---|---|---|---|---|---|---|---|---|---|---|
| Family ID: | 51625146 | ||||||||||
| Appl. No.: | 13/828571 | ||||||||||
| Filed: | March 14, 2013 |
| Current U.S. Class: | 420/532 ; 420/533; 420/541; 420/542 |
| Current CPC Class: | C22F 1/04 20130101; C22F 1/047 20130101; C22F 1/053 20130101; C22C 21/06 20130101 |
| International Class: | C22C 21/06 20060101 C22C021/06 |
Claims
1-27. (canceled)
28. An aluminum alloy consisting of: 2.0-3.9 wt. % Mg; 0.1-1.8 wt. % Li; 0.4 to 2.0 wt. % Zn; up to 1.5 wt. % Cu; up to 1.0 wt. % Ag; up to 1.5 wt. % Mn; up to 0.5 wt. % Si; up to 0.35 wt. % Fe; optionally at least one secondary element selected from the group consisting of Zr, Sc, Cr, Mn, Hf, V, Ti, and rare earth elements, and in the following amounts: up to 0.20 wt. % Zr; up to 0.30 wt. % Sc; up to 0.50 wt. % Cr; up to 1.0 wt. % Mn; up to 0.25 wt. % each of any of Hf, V, and rare earth elements; up to 0.10 wt. % Ti; and up to 0.10 wt. % of any other element, with the total of these other elements not exceeding 0.35 wt. %; the balance being aluminum.
29. An aluminum alloy consisting of: 2.5-3.9 wt. % Mg; 1.05-1.8 wt. % Li; up to 1.5 wt. % Cu; up to 2.0 wt. % Zn; up to 1.0 wt. % Ag; up to 1.5 wt. % Mn; up to 0.5 wt. % Si; up to 0.35 wt. % Fe; optionally at least one secondary element selected from the group consisting of Zr, Sc, Cr, Mn, Hf, V, Ti, and rare earth elements, and in the following amounts: up to 0.20 wt. % Zr; up to 0.30 wt. % Sc; up to 0.50 wt. % Cr; up to 1.0 wt. % Mn; up to 0.25 wt. % each of any of Hf, V, and rare earth elements; up to 0.10 wt. % Ti; and up to 0.10 wt. % of any other element, with the total of these other elements not exceeding 0.35 wt. %; the balance being aluminum.
30. The aluminum alloy of claim 28, wherein the aluminum alloy includes from 2.25 wt. % to 3.9 wt. % Mg.
31. The aluminum alloy of claim 28, wherein the aluminum alloy includes from 2.5 wt. % to 3.9 wt. % Mg.
32. The aluminum alloy of claim 28, wherein the aluminum alloy includes from 2.5 wt. % to 3.5 wt. % Mg.
33. The aluminum alloy of claim 30, wherein the aluminum alloy includes from 0.4 wt. % to 1.5 wt. % Li.
34. The aluminum alloy of claim 31, wherein the aluminum alloy includes from 0.8 wt. % to 1.45 wt. % Li.
35. The aluminum alloy of claim 32, wherein the aluminum alloy includes from 1.20 wt. % to 1.4 wt. % Li.
36. The aluminum alloy of claim 33, wherein the aluminum alloy includes from 0.4 wt. % to 1.5 wt. % Zn.
37. The aluminum alloy of claim 34, wherein the aluminum alloy includes from 0.5 wt. % to 1.0 wt. % Zn.
38. The aluminum alloy of claim 36, wherein the aluminum alloy includes not greater than 1.0 wt. % Cu.
39. The aluminum alloy of claim 36, wherein the aluminum alloy includes not greater than 0.9 wt. % Cu.
40. The aluminum alloy of claim 37, Wherein the aluminum alloy includes not greater than 0.5 wt. % Cu.
41. The aluminum alloy of claim 40, wherein the aluminum alloy includes at least 0.10 wt. % Cu.
42. The aluminum alloy of claim 29, wherein the aluminum alloy includes from 2.5 wt. % to 3.5 wt. % Mg.
43. The aluminum alloy of claim 42, wherein the aluminum alloy includes not greater than 1.5 wt. % Zn.
44. The aluminum alloy of claim 43, wherein the aluminum alloy includes not greater than 1.0 wt. % Cu.
45. The aluminum alloy of claim 43, wherein the aluminum alloy includes not greater than 0.9 wt. % Cu.
46. The aluminum alloy of claim 43, wherein the aluminum alloy includes not greater than 0.5 wt. % Cu.
47. The aluminum alloy of claim 47, wherein the aluminum alloy includes at least 0.10 wt. % Cu.
Description
BACKGROUND
[0001] Aluminum alloys are useful in a variety of applications. However, improving one property of an aluminum alloy without degrading another property is elusive. For example, it is difficult to increase the strength of an alloy without decreasing the toughness of an alloy. Other properties of interest for aluminum alloys include corrosion resistance and fatigue resistance, to name two.
SUMMARY OF THE DISCLOSURE
[0002] Broadly, the present patent application relates to new aluminum-magnesium-lithium alloys, and methods for producing the same. The alloys generally contain 2.0-3.9 wt. % Mg, 0.1-1.8 wt. % Li, up to 1.5 wt. % Cu, up to 2.0 wt. % Zn, up to 1.0 wt. % Ag, up to 1.5 wt. % Mn, up to 0.5 wt. % Si, up to 0.35 wt. % Fe, 0.05 to 0.50 wt. % of a grain structure control element (defined below), up to 0.10 wt. % Ti, and up to 0.10 wt. % of any other element, with the total of these other elements not exceeding 0.35 wt. %, the balance being aluminum.
[0003] The new aluminum-magnesium-lithium generally contain 2.0 to 3.9 wt. % Mg. Magnesium may help improve strength, but too much magnesium may degrade corrosion resistance. In one embodiment, the new alloys include at least 2.25 wt. % Mg. In another embodiment, the new alloys contain at least 2.5 wt. % Mg. In yet another embodiment, the new alloys include at least 2.75 wt. % Mg. In one embodiment, the new alloys include not greater than 3.75 wt. % Mg. In another embodiment, the new alloys include not greater than 3.5 wt. % Mg. In yet another embodiment, the new alloys include not greater than 3.25 wt. % Mg.
[0004] The new aluminum-magnesium-lithium generally contain 0.1 to 1.8 wt. % Li. Lithium helps reduce density and may help improve strength, but too much lithium may reduce ductility. In one embodiment, the new alloys include at least 0.4 wt. % Li. In another embodiment, the new alloys include at least 0.6 wt. % Li. In yet another embodiment, the new alloys include at least 0.8 wt. % Li. In another embodiment, the new alloys include at least 1.0 wt. % Li. In yet another embodiment, the new alloys include at least 1.05 wt. % Li. In another embodiment, the new alloys include at least 1.10 wt. % Li. In yet another embodiment, the new alloys include at least 1.20 wt. % Li. In one embodiment, the new alloys include not greater than 1.5 wt. % Li. In another embodiment, the new alloys include not greater than 1.45 wt. % Li. In yet another embodiment, the new alloys include not greater than 1.4 wt. % Li.
[0005] The new alloys may contain up to about 1.5 wt. % Cu. Copper may improve strength but increases density. In one embodiment, the new alloys contain not greater than 1.0 wt. % Cu. In another embodiment, the new alloys contain not greater than 0.9 wt. % Cu. In yet another embodiment, the new alloys contain not greater than 0.6 wt. % Cu. In another embodiment, the new alloys contain not greater than 0.5 wt. % Cu. In embodiments where copper is used, the new alloys generally contain at least 0.05 wt. % Cu. In one embodiment, the new alloys include at least 0.10 wt. % Cu. In embodiments where copper is not used, the new alloys include less than 0.05 wt. % Cu.
[0006] The new alloys may contain up to about 2.0 wt. % Zn. Zinc may improve strength, but increases density. In one embodiment, the new alloys contain not greater than 1.5 wt. % Zn. In another embodiment, the new alloys contain not greater than 1.0 wt. % Zn. In embodiments where zinc is used, the new alloys generally contain at least 0.20 wt. % Zn. In one embodiment, the new alloys contain at least 0.4 wt. % Zn. In another embodiment, the new alloys contain at least 0.5 wt. % Zn. In embodiments where zinc is not used, the new alloys include less than 0.20 wt. % Zn.
[0007] The new alloys may contain up to 1.5 wt. % Mn. Manganese may improve strength, but increases density. In one embodiment, the new alloys contain not greater than 1.0 wt. % Mn. In another embodiment, the new alloys contain not greater than 0.9 wt. % Mn. In yet another embodiment, the new alloys contain not greater than 0.7 wt. % Mn. In embodiments where manganese is used, the new alloys generally contain at least 0.05 wt. % Mn. In one embodiment, the new alloys include at least 0.20 wt. % Mn. In embodiments where manganese is not used, the new alloys include not greater than 0.04 wt. % Mn.
[0008] The new alloys may contain up to 1.0 wt. % Ag. Silver may improve strength, but silver decreases density and is expensive. In one embodiment, the new alloys contain not greater than 0.9 wt. % Ag. In another embodiment, the new alloys contain not greater than 0.6 wt. % Ag. In embodiments where silver is used, the new alloys generally contain at least 0.05 wt. % Ag. In one embodiment, the new alloys include at least 0.20 wt. % Ag. In embodiments where silver is not used, the new alloys include not greater than 0.04 wt. % Ag.
[0009] The new alloys may contain up to 0.5 wt. % Si. Silicon may improve corrosion resistance, but may decrease fracture toughness. In one embodiment, the new alloys contain not greater than 0.35 wt. % Si. In another embodiment, the new alloys contain not greater than 0.25 wt. % Si. In embodiments where silicon is used, the new alloys generally contain at least 0.10 wt. % Si. In embodiments where silicon is not used, the new alloys include not greater than 0.09 wt. % Si.
[0010] The new alloys may optionally include at least one secondary element selected from the group consisting of Zr, Sc, Cr, Hf, V, Ti, and rare earth elements. Such elements may be used, for instance, to facilitate the appropriate grain structure in the resultant aluminum alloy product. The secondary elements may optionally be present as follows: up to 0.20 wt. % Zr, up to 0.30 wt. % Sc, up to 0.50 wt. % of Cr, up to 0.25 wt. % each of any of Hf, V, and rare earth elements, and up to 0.10 wt. % Ti. Zirconium (Zr) and/or scandium are preferred for grain structure control. When zirconium is used, it is generally included in the new aluminum alloys at 0.05 to 0.20 wt. % Zr. In one embodiment, the new aluminum alloys include 0.07 to 0.16 wt. % Zr. Scandium (Sc) may be used in addition to, or as a substitute for zirconium, and, when present, is generally included in the new aluminum alloys at 0.05 to 0.30 wt. % Sc. In one embodiment, the new aluminum alloys include 0.07 to 0.25 wt. % Sc. Chromium (Cr) may also be used in addition to, or as a substitute for zirconium, and/or scandium, and when present is generally included in the new alloys at 0.05 to 0.50 wt. % Cr. In one embodiment, the new aluminum alloys include 0.05 to 0.35 wt. % Cr. In another embodiment, the new aluminum alloys include 0.05 to 0.25 wt. % Cr. In other embodiments, any of zirconium, scandium, and/or chromium may be included in the alloy as an impurity, and in these embodiments such elements would be included in the alloy at less than 0.05 wt. %.
[0011] Hf, V and rare earth elements may be included an in an amount of up to 0.25 wt. % each of any of Hf, V, and rare earth elements (0.25 wt. % each of any rare earth element may be included). In one embodiment, the new aluminum alloys include not greater than 0.05 wt. % each of Hf, V, and rare earth elements (.ltoreq.0.05 wt. % each of any rare earth element).
[0012] Titanium is preferred for grain refining during casting, and, when present is generally included in the new aluminum alloys at 0.005 to 0.10 wt. % Ti. In one embodiment, the new aluminum alloys include 0.01 to 0.05 wt. % Ti. In another embodiment, the aluminum alloys include 0.01 to 0.03 wt. % Ti.
[0013] The new alloys may include up to 0.35 wt. % Fe. In some embodiments, the iron content of the new aluminum alloys is not greater than about 0.25 wt. % Fe, or not greater than about 0.15 wt. % Fe, or not greater than about 0.10 wt. % Fe, or not greater than about 0.08 wt. % Fe, or not greater than 0.05 wt. % Fe, or less.
[0014] Aside from the above-listed elements, the balance (remainder) of the new aluminum alloys is generally aluminum and other elements, where the new aluminum alloys include not greater than 0.15 wt. % each of these other elements, and where the total of these other elements does not exceed 0.35 wt. %. As used herein, "other elements" includes any elements of the periodic table other than the above-identified elements, i.e., any elements other than Al, Mg, Li, Cu, Zn, Mn, Si, Fe, Zr, Sc, Cr, Ti, Hf, V, and rare earth elements. In one embodiment, the new aluminum alloys include not greater than 0.10 wt. % each of other elements, and with the total of these other elements not exceeding 0.25 wt. %. In another embodiment, the new aluminum alloys include not greater than 0.05 wt. % each of other elements, and with the total of these other elements not exceeding 0.15 wt. %. In yet another embodiment, the new aluminum alloys include not greater than 0.03 wt. % each of other elements, and with the total of these other elements not exceeding 0.10 wt. %.
[0015] Except where stated otherwise, the expression "up to" when referring to the amount of an element means that that elemental composition is optional and includes a zero amount of that particular compositional component. Unless stated otherwise, all compositional percentages are in weight percent (wt. %).
[0016] In one specific embodiment, an aluminum alloy includes zinc, and includes 2.0-3.9 wt. % Mg, 0.1-1.8 wt. % Li, 0.4 to 2.0 wt. % Zn, up to 1.5 wt. % Cu, up to 1.0 wt. % Ag, up to 1.5 wt. % Mn, up to 0.5 wt. % Si, up to 0.35 wt. % Fe, optionally at least one secondary element, as described above, up to 0.10 wt. % of any other element, with the total of these other elements not exceeding 0.35 wt. %, the balance being aluminum. This alloy may be modified to any of the above-described Mg, Li, Zn, Cu, Ag, Mn, Si, Fe, secondary elements and other elements amounts, described above.
[0017] In another specific embodiment, the aluminum alloy is a high-lithium alloy, and includes 2.5-3.9 wt. % Mg, 1.05-1.8 wt. % Li, up to 2.0 wt. % Zn, up to 1.5 wt. % Cu, up to 1.0 wt. % Ag, up to 1.5 wt. % Mn, up to 0.5 wt. % Si, up to 0.35 wt. % Fe, optionally at least one secondary element, as described above, up to 0.10 wt. % of any other element, with the total of these other elements not exceeding 0.35 wt. %, the balance being aluminum. This alloy may be modified to any of the above-described Mg, Li, Zn, Cu, Ag, Mn, Si, Fe, secondary elements and other elements amounts, described above.
[0018] In embodiments where the aluminum alloy is solution heat treated (described below), the total amount of magnesium, lithium, copper, zinc, silicon, iron, the secondary elements and the other elements should be chosen so that the aluminum alloy can be appropriately solutionized (e.g., to promote hardening while restricting the amount of constituent particles). In one embodiment, the aluminum alloy includes an amount of alloying elements that leaves the aluminum alloy free of, or substantially free of, soluble constituent particles after solutionizing. In one embodiment, the aluminum alloy includes an amount of alloying elements that leaves the aluminum alloy with low amounts of (e.g., restricted/minimized) insoluble constituent particles after solutionizing. In other embodiments, the aluminum alloy may benefit from controlled amounts of insoluble constituent particles.
[0019] The new aluminum alloys may be processed into a variety of wrought forms, such as in rolled form (sheet, plate), as an extrusion, or as a forging, and in a variety of tempers. In this regard, new aluminum alloys may be cast (e.g., direct chill cast or continuously cast), and then worked (hot and/or cold worked) into the appropriate product form (sheet, plate, extrusion, or forging). After working, the new aluminum alloys may be processed into one of an H temper, T temper or a W temper, as defined by the Aluminum Association.
[0020] For any of the H temper, T temper or W temper products, the aluminum alloy may be hot worked, such as by rolling, extruding and/or forging. In one embodiment, the hot working temperature is maintained below the recrystallization temperature of the alloy. In one embodiment, the hot working exit temperature is not greater than 600.degree. F. In another embodiment, the hot working exit temperature is not greater than 550.degree. F. In yet another embodiment, the hot working exit temperature is not greater than 500.degree. F. In another embodiment, the hot working exit temperature is not greater than 450.degree. F. In yet another embodiment, the hot working exit temperature is not greater than 400.degree. F.
[0021] In one embodiment, the new alloy is processed to an H temper. In these embodiments, the processing may include casting the new aluminum alloy, including any version of the aluminum alloy described above, after which the aluminum alloy is hot rolled to an intermediate gauge or final gauge. In instances where the alloy is hot rolled to an intermediate gauge, it will then be cold rolled to final gauge (e.g., cold rolled 2-25%), and then optionally stretched (e.g., 1-10%), for instance, for flatness and/or for stress relief. In instances where the alloy is hot rolled to final gauge, it may be stretched (e.g., 1-10%), for instance, for flatness and/or for stress relief.
[0022] In embodiments where the aluminum alloy is cold rolled and/or stretched, the aluminum alloy may be cooled to a temperature of not greater than 400.degree. F. prior to the cold rolling and/or the stretching. In one embodiment, the aluminum alloy is cooled to a temperature of not greater than 250.degree. F. prior to the cold rolling and/or the stretching. In another embodiment, the aluminum alloy is cooled to a temperature of not greater than 200.degree. F. prior to the cold rolling and/or the stretching. In yet another embodiment, the aluminum alloy is cooled to a temperature of not greater than 150.degree. F. prior to the cold rolling and/or the stretching. In yet another embodiment, the aluminum alloy is cooled to ambient temperature prior to the cold rolling and/or the stretching.
[0023] When producing the aluminum alloy in an H temper, it may be detrimental to anneal the product. Thus, in some H-temper embodiments, the process includes maintaining the aluminum alloy at a temperature below 400.degree. F. between the hot rolling step and any cold rolling and/or stretching step. In one H-temper embodiment, the process includes maintaining the aluminum alloy at a temperature of net 250.degree. F. between the hot rolling step and/or any cold rolling and/or stretching step. In another H-temper embodiment, the process includes maintaining the aluminum alloy at a temperature of net 200.degree. F. between the hot rolling step and/or any cold rolling and/or stretching step. In yet another H-temper embodiment, the process includes maintaining the aluminum alloy at a temperature of net 150.degree. F. between the hot rolling step and/or any cold rolling and/or stretching step. In another H-temper embodiment, the process includes maintaining the aluminum alloy at ambient temperature between the hot rolling step and/or any cold rolling and/or stretching step.
[0024] In some embodiments, when producing the aluminum alloy in an H temper, it may be detrimental to apply any thermal treatment to the product after any cold rolling and/or stretching step. Thus, in some embodiments, an H-temper processing method is absent of any thermal treatments after any cold rolling step and/or any stretching step. However, in other embodiments, one or more anneal steps could be used, such as before or after hot and/or cold rolling.
[0025] In some embodiments when cold rolling is used as a part of H-temper processing, the cold rolling may be restricted to so as to facilitate good strength, ductility and/or corrosion resistance. In one embodiment, the cold rolling comprises cold rolling the intermediate gauge product by 1-25%, i.e., the thickness of the intermediate gauge product is reduced by 1-25% by cold rolling. In one embodiment, the cold rolling is 2-22%, i.e., the thickness of the intermediate gauge product is reduced by 2-22% by cold rolling. In another embodiment, the cold rolling is 3-20%, i.e., the thickness of the intermediate gauge product is reduced by 3-20% by cold rolling.
[0026] In another embodiment, the new aluminum alloy is processed to a "T temper" (thermally treated). In this regard, during or after the hot working (as appropriate), the new aluminum alloys may be processed to any of a T1, T2, T3, T4, T5, T6, T7, T8 or T9 temper, as defined by the Aluminum Association. In one embodiment, the new aluminum alloys are processed to one of a T4, T6 or T7 temper, where the new aluminum alloys are solution heat treated, and then quenched, and then either naturally aged (T4) or artificially aged (T6 or T7). In one embodiment, the new aluminum alloys are processed to one of a T3 or T8 temper, where the new aluminum alloys are solution heat treated, and then quenched, and then cold worked, and then either naturally aged (T3) or artificially aged (T8). In another embodiment, the new aluminum alloy is processed to an "W temper" (solution heat treated), as defined by the Aluminum Association. In yet another embodiment, no solution heat treatment is applied after the hot working, and thus the new aluminum alloy may be processed to an "F temper" (as fabricated), as defined by the Aluminum Association. The alloys may also be processed with high cold work after the solution heat treatment and quench, e.g., 25% or more cold work, as described in commonly-owned U.S. Patent Publication No. 2012/0055590.
[0027] The new aluminum alloys may achieve an improved combination of properties. For example, the new aluminum alloys may achieve an improved combination of strength, corrosion resistance and/or ductility, among others.
[0028] In one approach, the new aluminum alloys are in an H-temper, are hot rolled, and then stretched 1-10%, (no cold rolling step) and realize a tensile yield strength (L) of at least 35 ksi (tested via ASTM E8 and B557). In one embodiment, the new aluminum alloys realize a tensile yield strength (L) of at least 36 ksi. In another embodiment, the new aluminum alloys realize a tensile yield strength (L) of at least 38 ksi. In yet another embodiment, the new aluminum alloys realize a tensile yield strength (L) of at least 40 ksi. In another embodiment, the new aluminum alloys realize a tensile yield strength (L) of at least 42 ksi. In yet another embodiment, the new aluminum alloys realize a tensile yield strength (L) of at least 44 ksi. In another embodiment, the new aluminum alloys realize a tensile yield strength (L) of at least 46 ksi. In yet another embodiment, the new aluminum alloys realize a tensile yield strength (L) of at least 48 ksi. In another embodiment, the new aluminum alloys realize a tensile yield strength (L) of at least 50 ksi. In yet another embodiment, the new aluminum alloys realize a tensile yield strength (L) of at least 51 ksi, or more. In these H-temper and stretching embodiments, the new aluminum alloys may realize an elongation (L) of at least 10% (tested via ASTM E8 and B557). In one embodiment, the new aluminum alloys realize an elongation (L) of at least 12%. In another embodiment, the new aluminum alloys realize an elongation (L) of at least 14%. In yet another embodiment, the new aluminum alloys realize an elongation (L) of at least 16%. In another embodiment, the new aluminum alloys realize an elongation (L) of at least 18%, or more. In these H-temper and stretching embodiments, the new aluminum alloys may realize a mass loss of not greater than 25 mg/cm.sup.2 (tested in accordance with ASMT G67, and with 1 week of exposure to 100.degree. C.). In one embodiment, the new aluminum alloys realize a mass loss of not greater than 15 mg/cm.sup.2. In these H-temper and stretching embodiments, the new aluminum alloys may realize an EXCO rating of at least EB (at T/10 and/or at surface, and as tested in accordance with ASMT G66, and with 1 week of exposure to 100.degree. C.). In one embodiment, the new aluminum alloys realize an EXCO rating of at least EA. In another embodiment, the new aluminum alloys realize an EXCO rating of at least PC. In yet another embodiment, the new aluminum alloys realize an EXCO rating of at least PB. In another embodiment, the new aluminum alloys realize an EXCO rating of at least PA.
[0029] In another approach, the new aluminum alloys are in an H-temper, are hot rolled, and then cold rolled 1-25% and realize a tensile yield strength (L) of at least 40 ksi (tested via ASTM E8 and B557). In one embodiment, the new aluminum alloys realize a tensile yield strength (L) of at least 42 ksi. In another embodiment, the new aluminum alloys realize a tensile yield strength (L) of at least 44 ksi. In yet another embodiment, the new aluminum alloys realize a tensile yield strength (L) of at least 46 ksi. In another embodiment, the new aluminum alloys realize a tensile yield strength (L) of at least 48 ksi. In yet another embodiment, the new aluminum alloys realize a tensile yield strength (L) of at least 50 ksi. In another embodiment, the new aluminum alloys realize a tensile yield strength (L) of at least 52 ksi. In yet another embodiment, the new aluminum alloys realize a tensile yield strength (L) of at least 54 ksi. In another embodiment, the new aluminum alloys realize a tensile yield strength (L) of at least 56 ksi. In yet another embodiment, the new aluminum alloys realize a tensile yield strength (L) of at least 58 ksi, or more. In these H-temper and cold rolling embodiments, the new aluminum alloys may realize an elongation (L) of at least 6% (tested via ASTM E8 and B557). In one embodiment, the new aluminum alloys realize an elongation (L) of at least 8%. In another embodiment, the new aluminum alloys realize an elongation (L) of at least 10%. In yet another embodiment, the new aluminum alloys realize an elongation (L) of at least 12%. In another embodiment, the new aluminum alloys realize an elongation (L) of at least 14%, or more. In these H-temper and cold rolling embodiments, the new aluminum alloys may realize a mass loss of not greater than 25 mg/cm.sup.2 (tested in accordance with ASMT G67, and with 1 week of exposure to 100.degree. C.). In these H-temper and cold rolling embodiments, the new aluminum alloys may realize a mass loss of not greater than 15 mg/cm.sup.2. In these H-temper and cold rolling embodiments, the new aluminum alloys may realize an EXCO rating of at least EB (at T/10 and/or at surface, and as tested in accordance with ASMT G66, and with 1 week of exposure to 100.degree. C.). In one embodiment, the new aluminum alloys realize an EXCO rating of at least EA. In another embodiment, the new aluminum alloys realize an EXCO rating of at least PC. In yet another embodiment, the new aluminum alloys realize an EXCO rating of at least PB. In another embodiment, the new aluminum alloys realize an EXCO rating of at least PA.
[0030] In yet another approach, the new aluminum alloys are in an T-temper, and realize a tensile yield strength (L) of at least 45 ksi (tested via ASTM E8 and B557). In one embodiment, the new aluminum alloys realize a tensile yield strength (L) of at least 46 ksi. In another embodiment, the new aluminum alloys realize a tensile yield strength (L) of at least 48 ksi. In yet another embodiment, the new aluminum alloys realize a tensile yield strength (L) of at least 50 ksi. In another embodiment, the new aluminum alloys realize a tensile yield strength (L) of at least 52 ksi. In yet another embodiment, the new aluminum alloys realize a tensile yield strength (L) of at least 54 ksi. In another embodiment, the new aluminum alloys realize a tensile yield strength (L) of at least 56 ksi. In yet another embodiment, the new aluminum alloys realize a tensile yield strength (L) of at least 58 ksi. In another embodiment, the new aluminum alloys realize a tensile yield strength (L) of at least 60 ksi. In yet another embodiment, the new aluminum alloys realize a tensile yield strength (L) of at least 62 ksi, or more. In these T-temper embodiments, new aluminum alloys may realize an elongation (L) of at least 6% (tested via ASTM E8 and B557). In one embodiment, the new aluminum alloys realize an elongation (L) of at least 8%. In another embodiment, the new aluminum alloys realize an elongation (L) of at least 10%. In yet another embodiment, the new aluminum alloys realize an elongation (L) of at least 12%. In another embodiment, the new aluminum alloys realize an elongation (L) of at least 14%, or more. In these T-temper embodiments, the new aluminum alloys may realize a mass loss of not greater than 25 mg/cm.sup.2 (tested in accordance with ASMT G67, and with 1 week of exposure to 100.degree. C.). In one embodiment, the new aluminum alloys realize mass loss of not greater than 15 mg/cm.sup.2. In these T-temper embodiments, the new aluminum alloys may realize an EXCO rating of at least EB (at T/10 and/or at surface, and as tested in accordance with ASMT G66, and with 1 week of exposure to 100.degree. C.). In one embodiment, the new aluminum alloys realize an EXCO rating of at least EA. In another embodiment, the new aluminum alloys realize an EXCO rating of at least PC. In yet another embodiment, the new aluminum alloys realize an EXCO rating of at least PB. In another embodiment, the new aluminum alloys realize an EXCO rating of at least PA.
[0031] The new aluminum alloys described herein may be used in a variety of applications, such as in automotive and/or aerospace applications, among others. In one embodiment, the new aluminum alloys are used in an aerospace application, such as wing skins (upper and lower) or stringers/stiffeners, fuselage skin or stringers, ribs, frames, spars, bulkheads, circumferential frames, empennage (such as horizontal and vertical stabilizers), floor beams, seat tracks, doors, and control surface components (e.g., rudders, ailerons) among others. In another embodiment, the new aluminum alloys are used in an automotive application, such as closure panels (e.g., hoods, fenders, doors, roofs, and trunk lids, among others), wheels, and critical strength applications, such as in body-in-white (e.g., pillars, reinforcements) applications, among others. In yet another embodiment, the new aluminum alloys are used in a marine application, such as for ships and boats (e.g., hulls, decks, masts, and superstructures, among others). In another embodiment, the new aluminum alloys are used in a munitions/ballistics/military application, such as in ammunition cartridges and armor, among others. Ammunition cartridges may include those used in small arms and cannons or for artillery or tank rounds. Other possible ammunition components would include sabots and fins. Artillery, fuse components are another possible application as are fins and control surfaces for precision guided bombs and missiles. Armor components could include armor plates or structural components for military vehicles.
BRIEF DESCRIPTION OF THE DRAWINGS
[0032] FIGS. 1-12 are graphs illustrating results of Example 1.
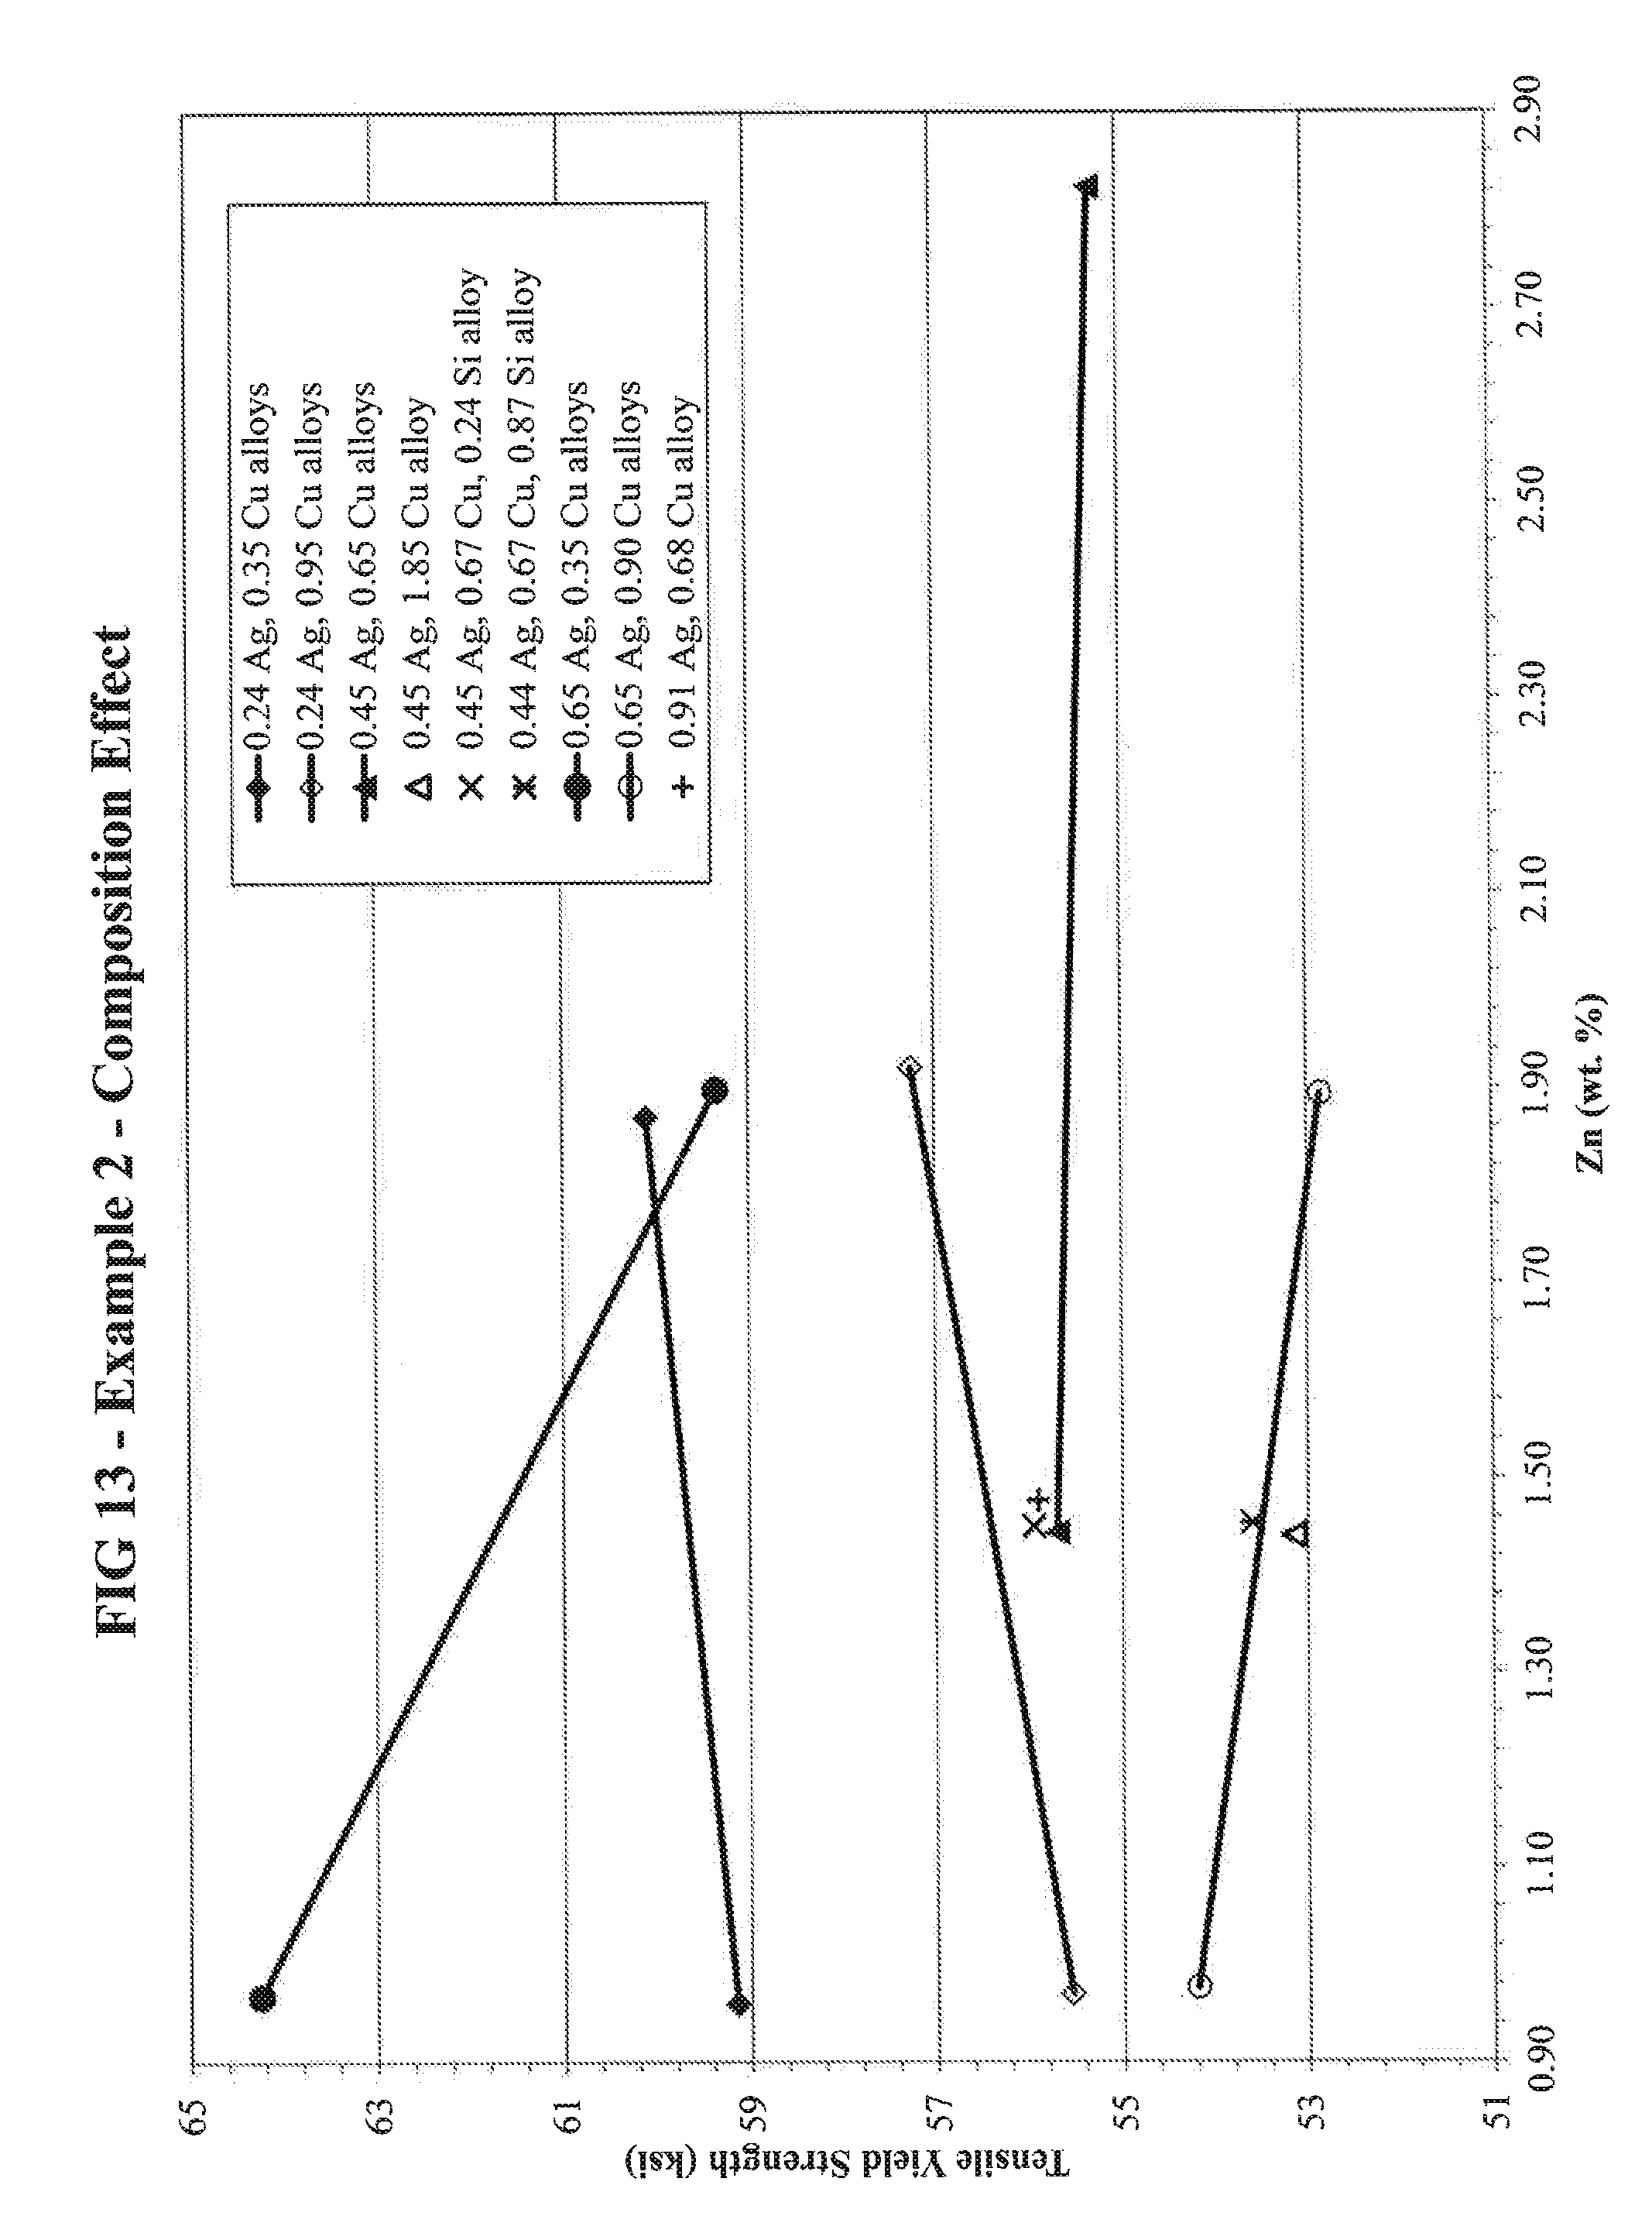
[0033] FIG. 13 is a graph illustrating results of Example 2.
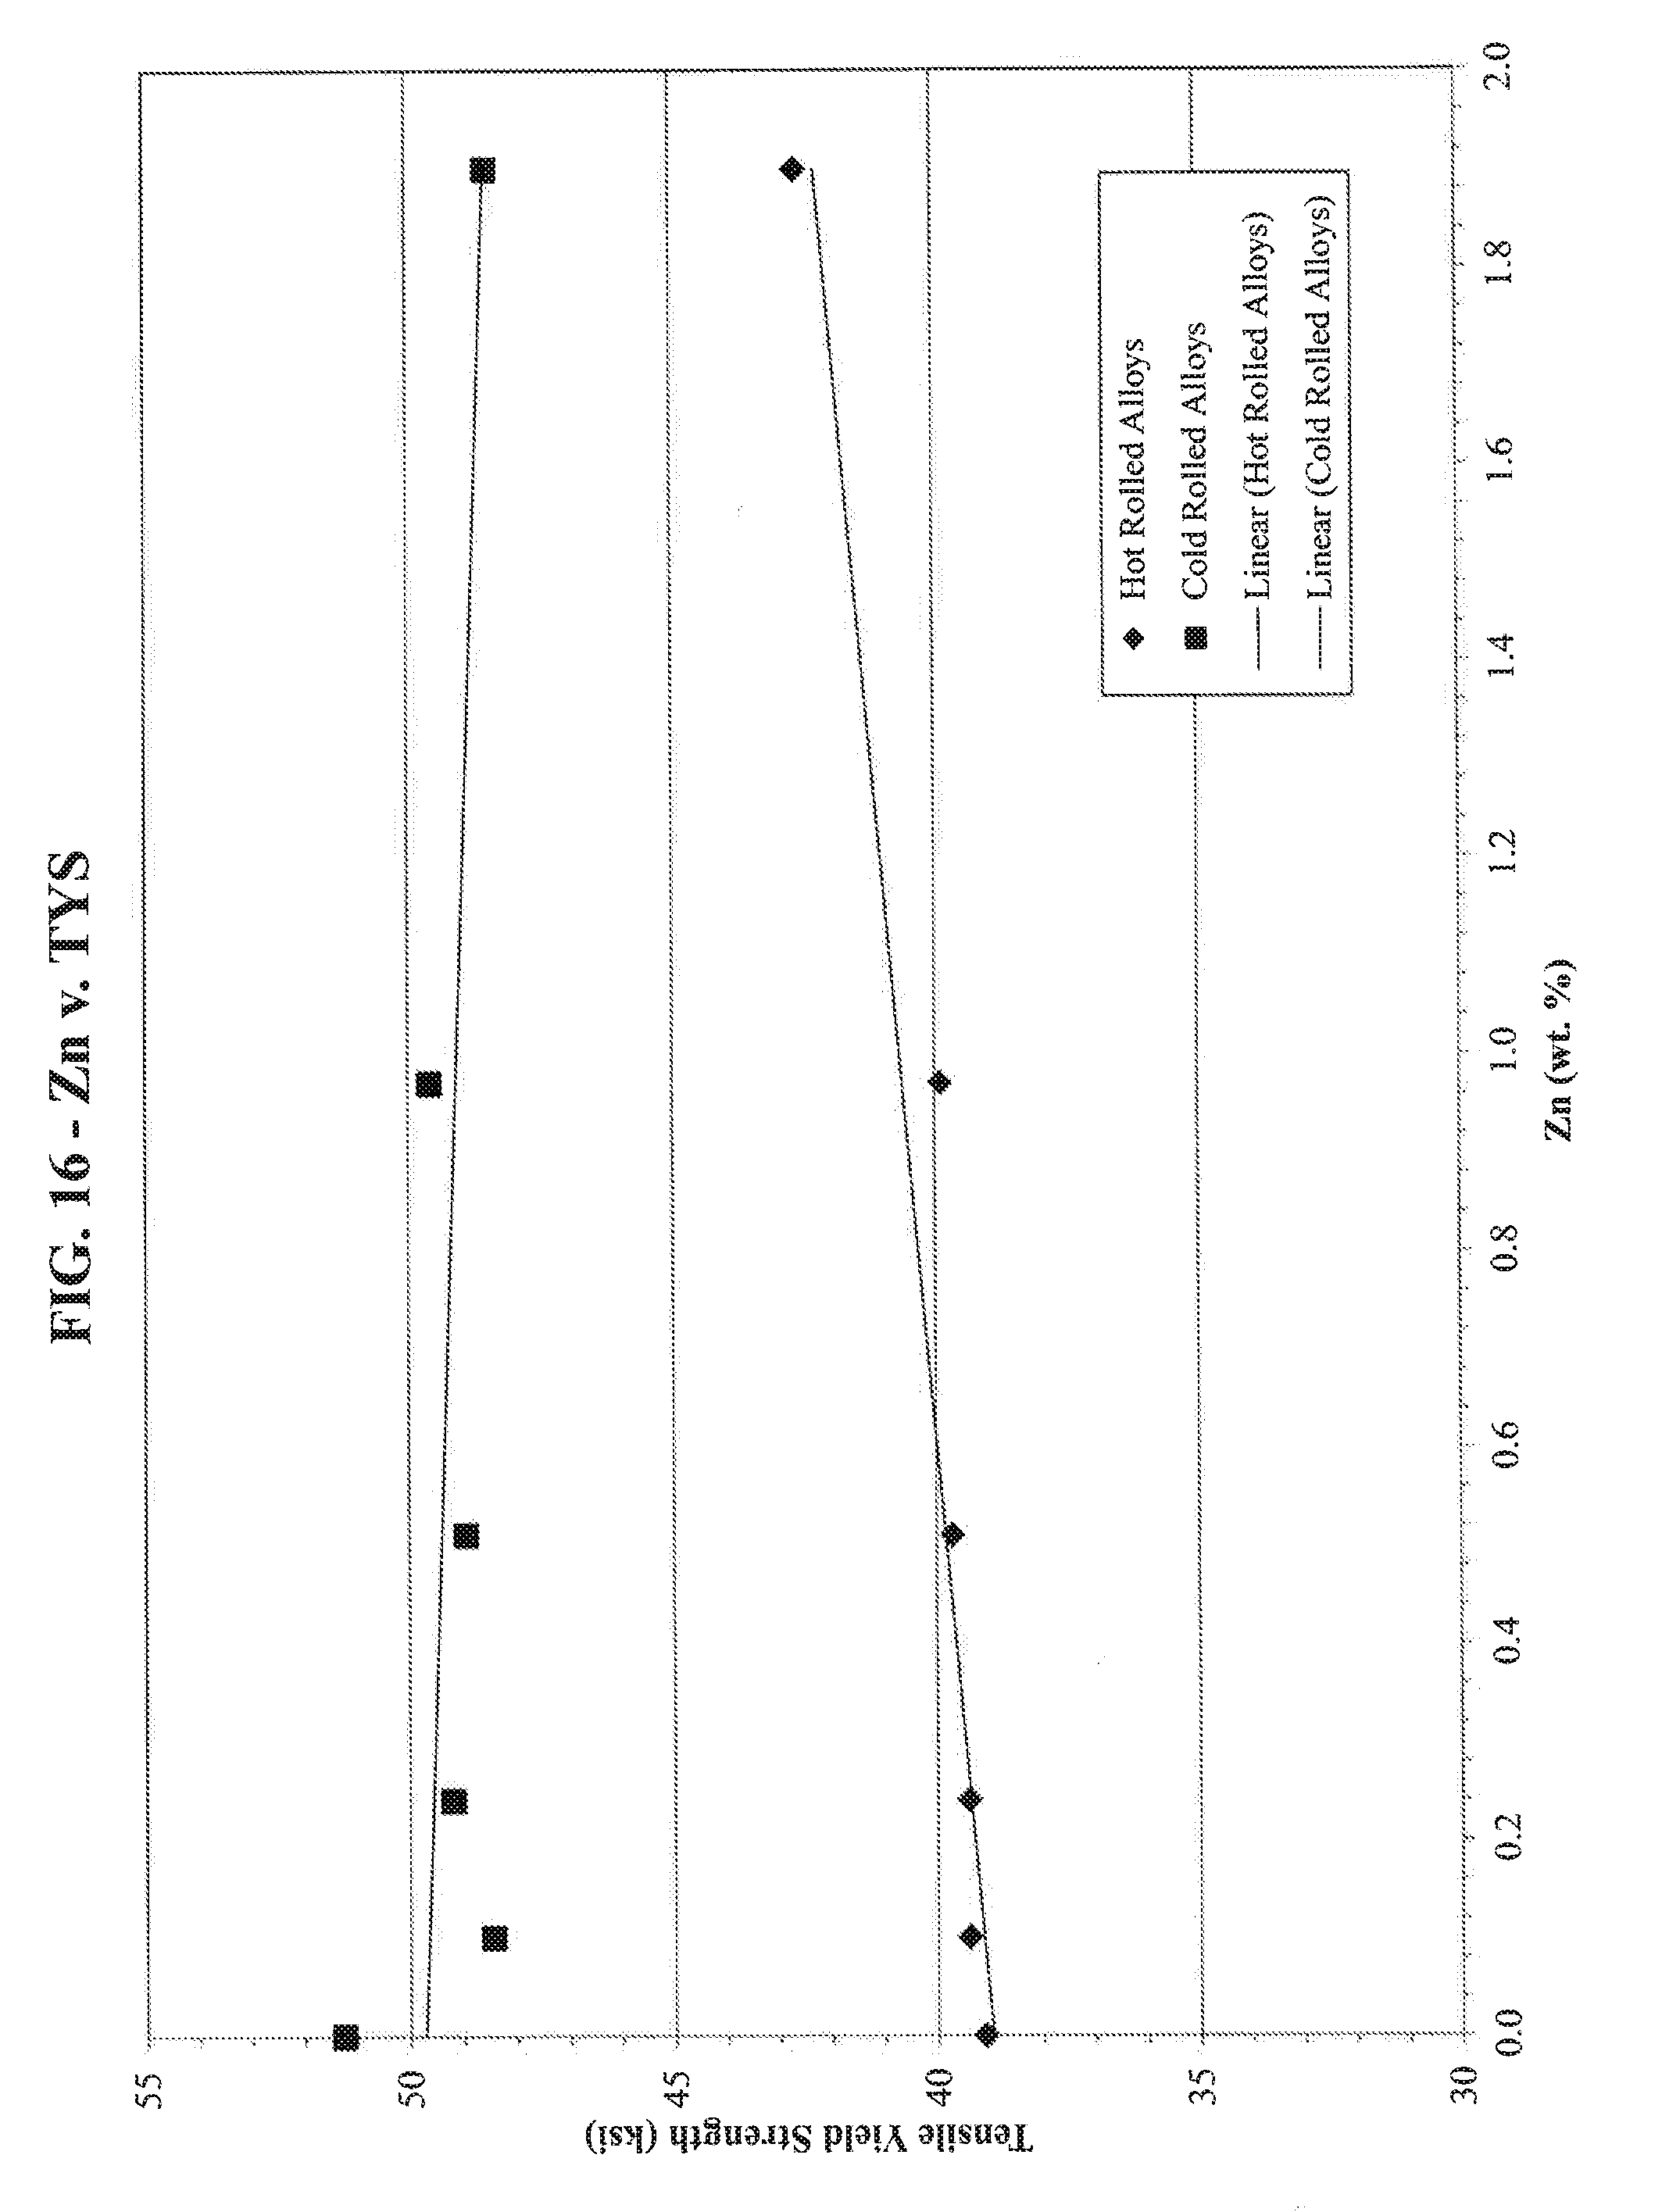
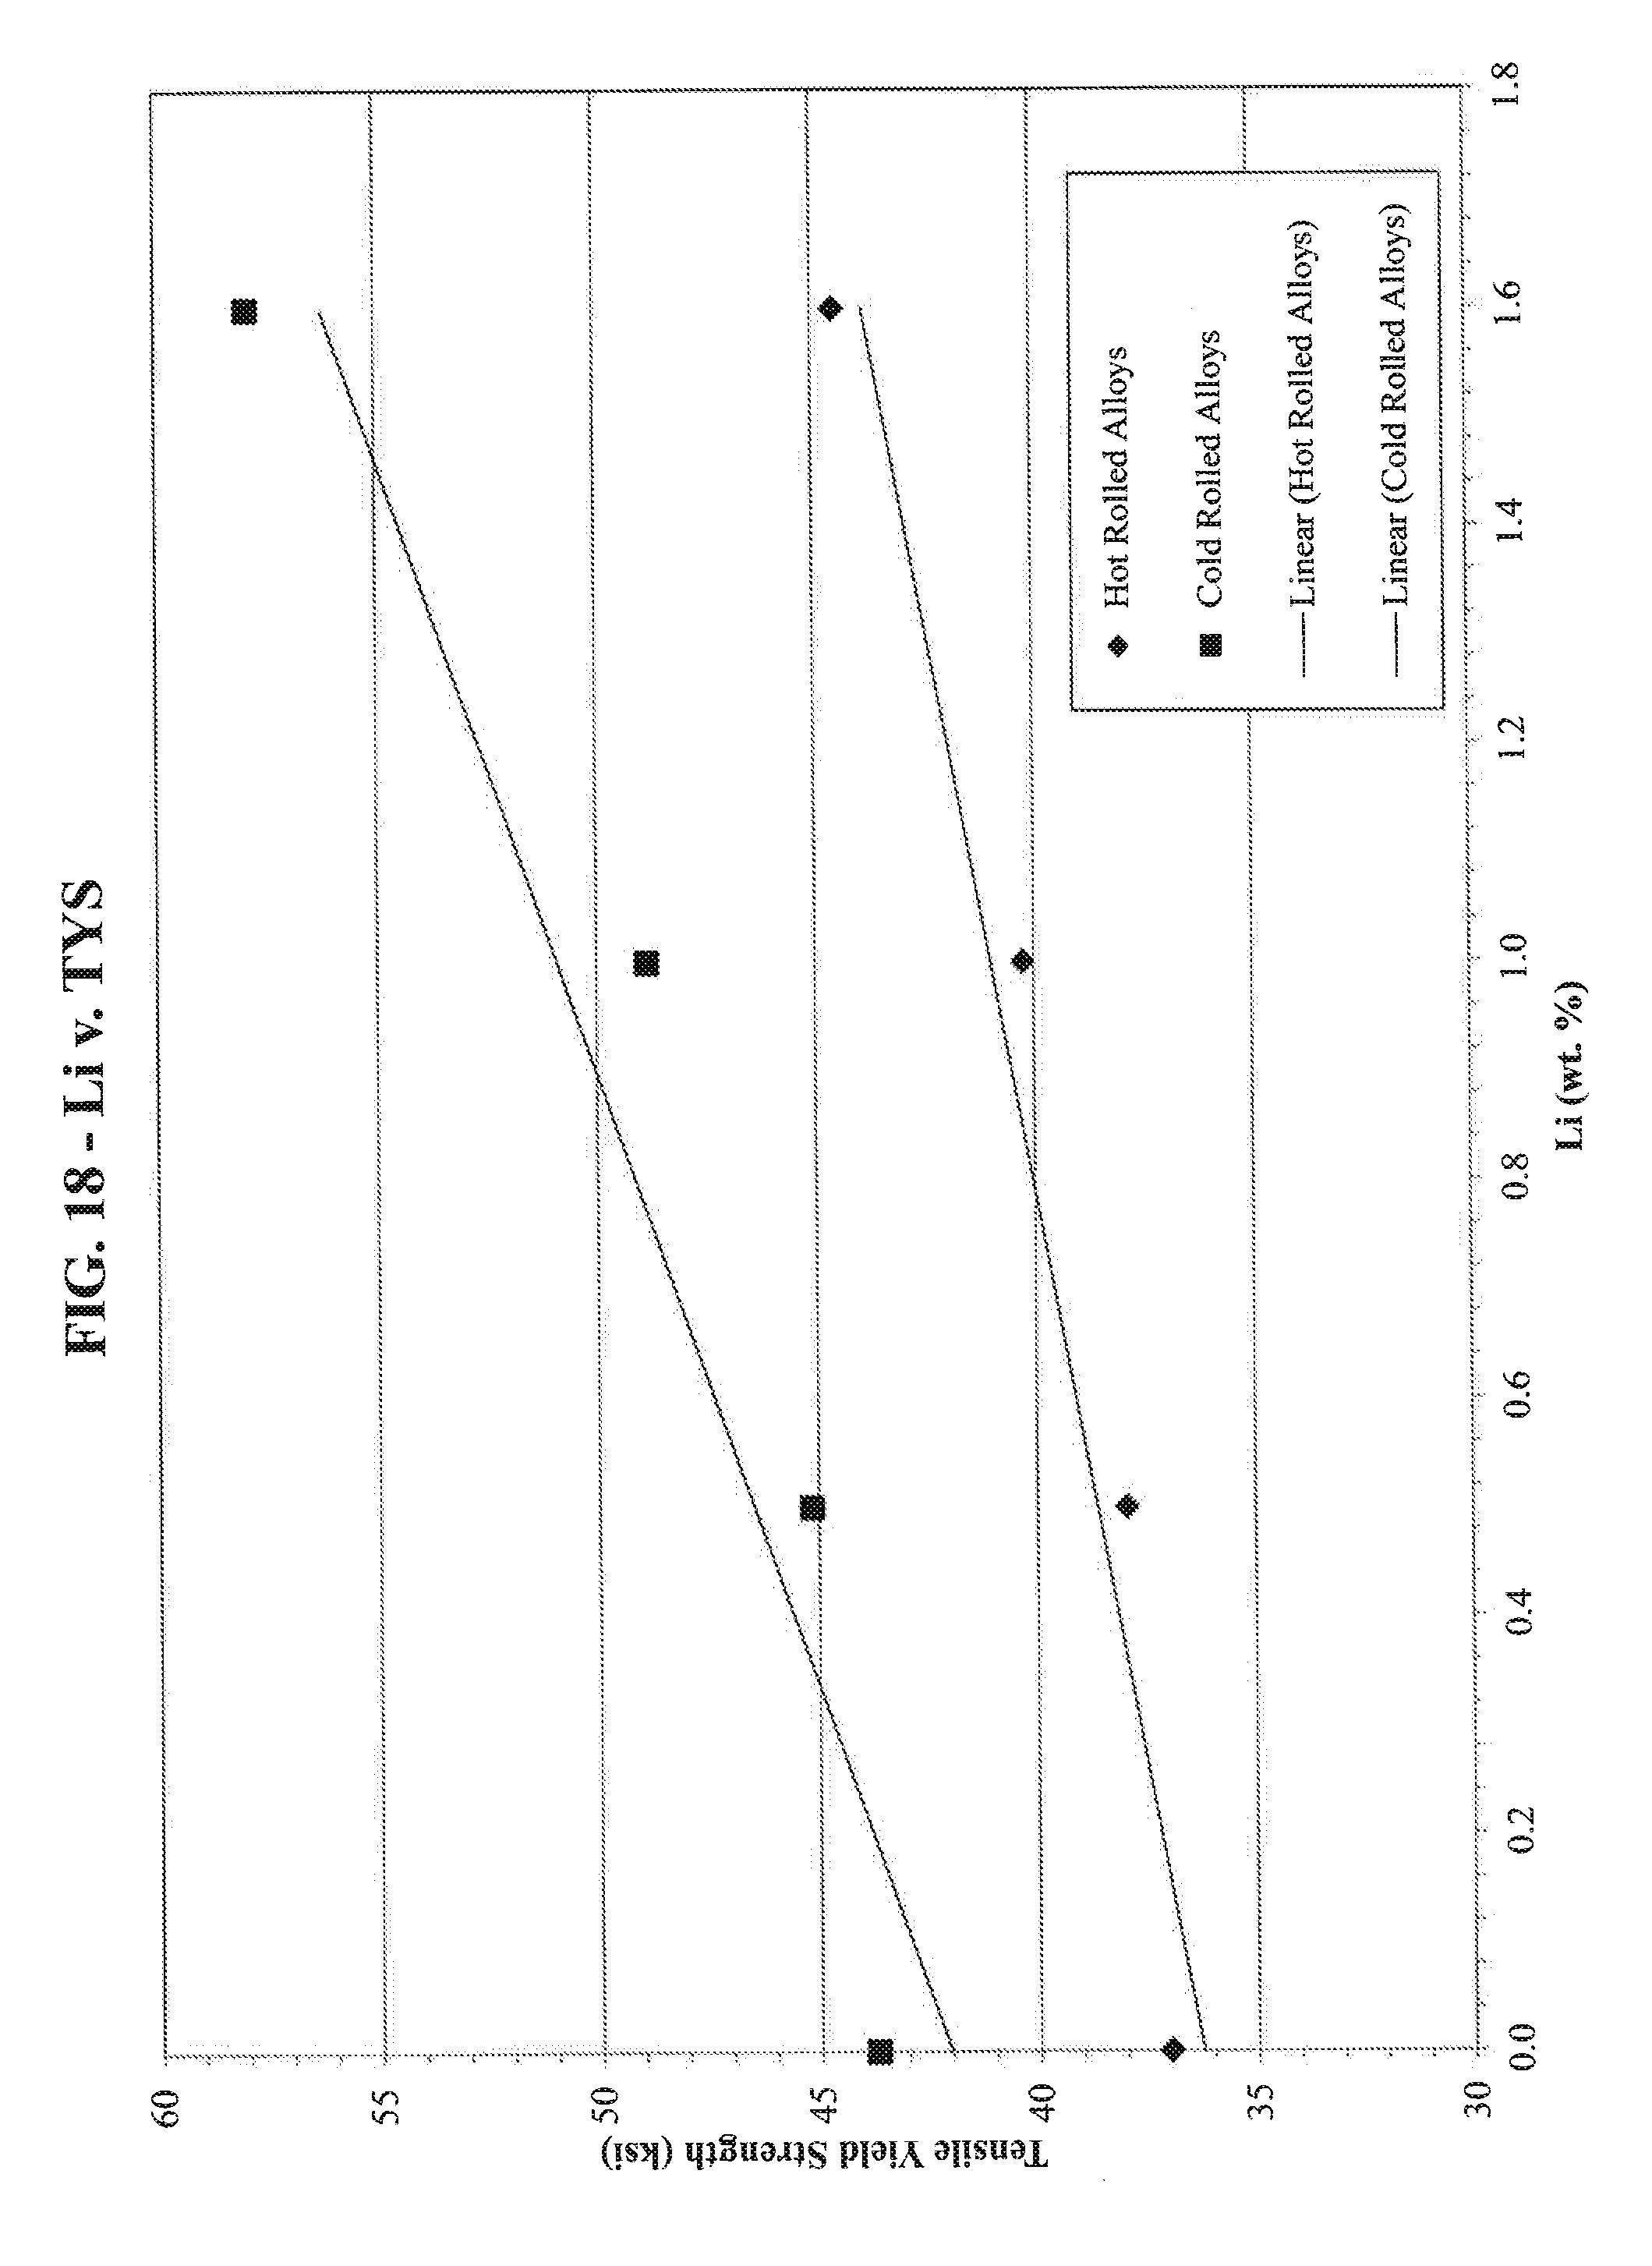
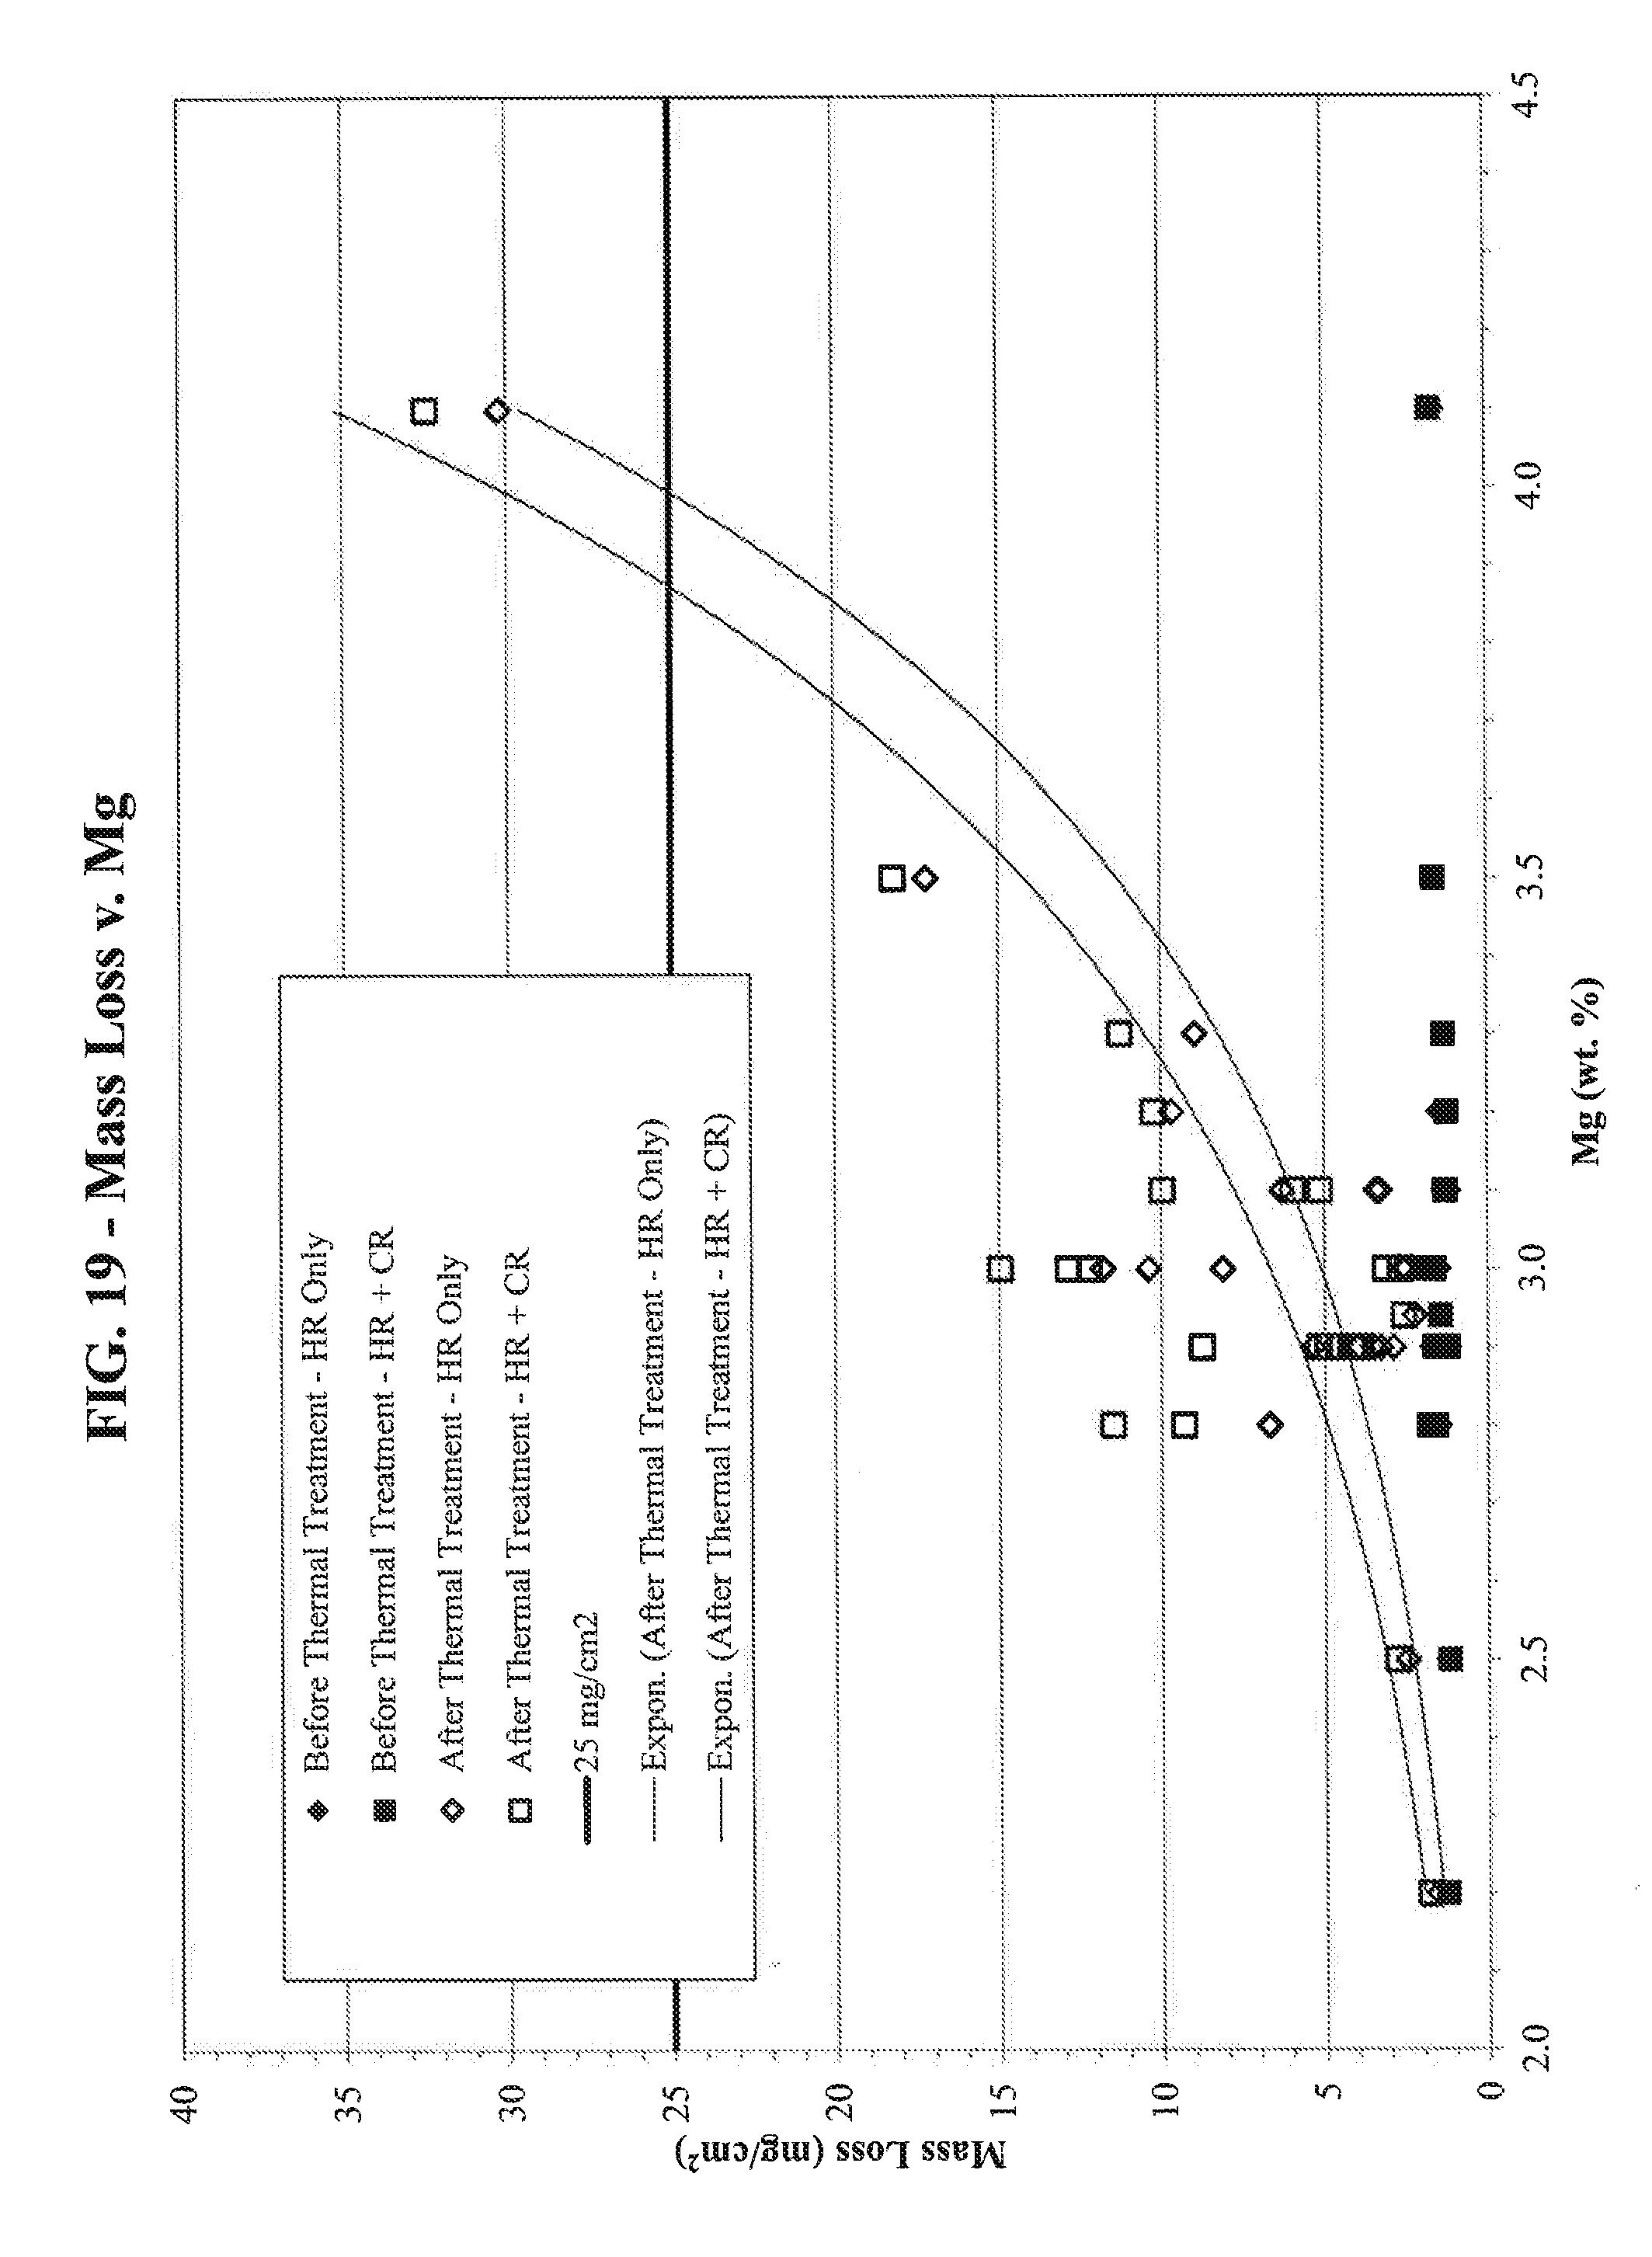
[0034] FIGS. 14-21 are graphs illustrating results of Example 3.
DETAILED DESCRIPTION
Example 1
[0035] Twelve book mold ingots were produced, the compositions of which are provided in Table 1, below (all values in weight percent).
TABLE-US-00001 TABLE 1 Example 1 Alloy Compositions Alloy Mg Li Cu Zn 1 2.89 0.00 0 0 2 2.80 0.21 0 0 3 2.90 0.87 0 0 4 2.80 1.20 0 0 5 2.70 1.60 0 0 6 5.03 0.00 0 0 7 4.75 0.23 0 0 8 4.75 0.87 0 0 9 4.55 1.20 0 0 10 5.55 0.85 0 0 11 5.04 0.00 0.19 0.54 12 4.50 0.86 0.18 0.46
[0036] Unless otherwise indicated, all alloys contained the listed elements, from about 0.10 to 0.13 wt. % Zr, about 0.60 wt. % Mn, not more than about 0.04 wt. % Fe, not more than 0.03 wt. % Si, about 0.02 wt. % Ti, the balance being aluminum and other elements, where the other elements did not exceed more than 0.05 wt. % each, and not more than 0.15 wt. % total of the other elements.
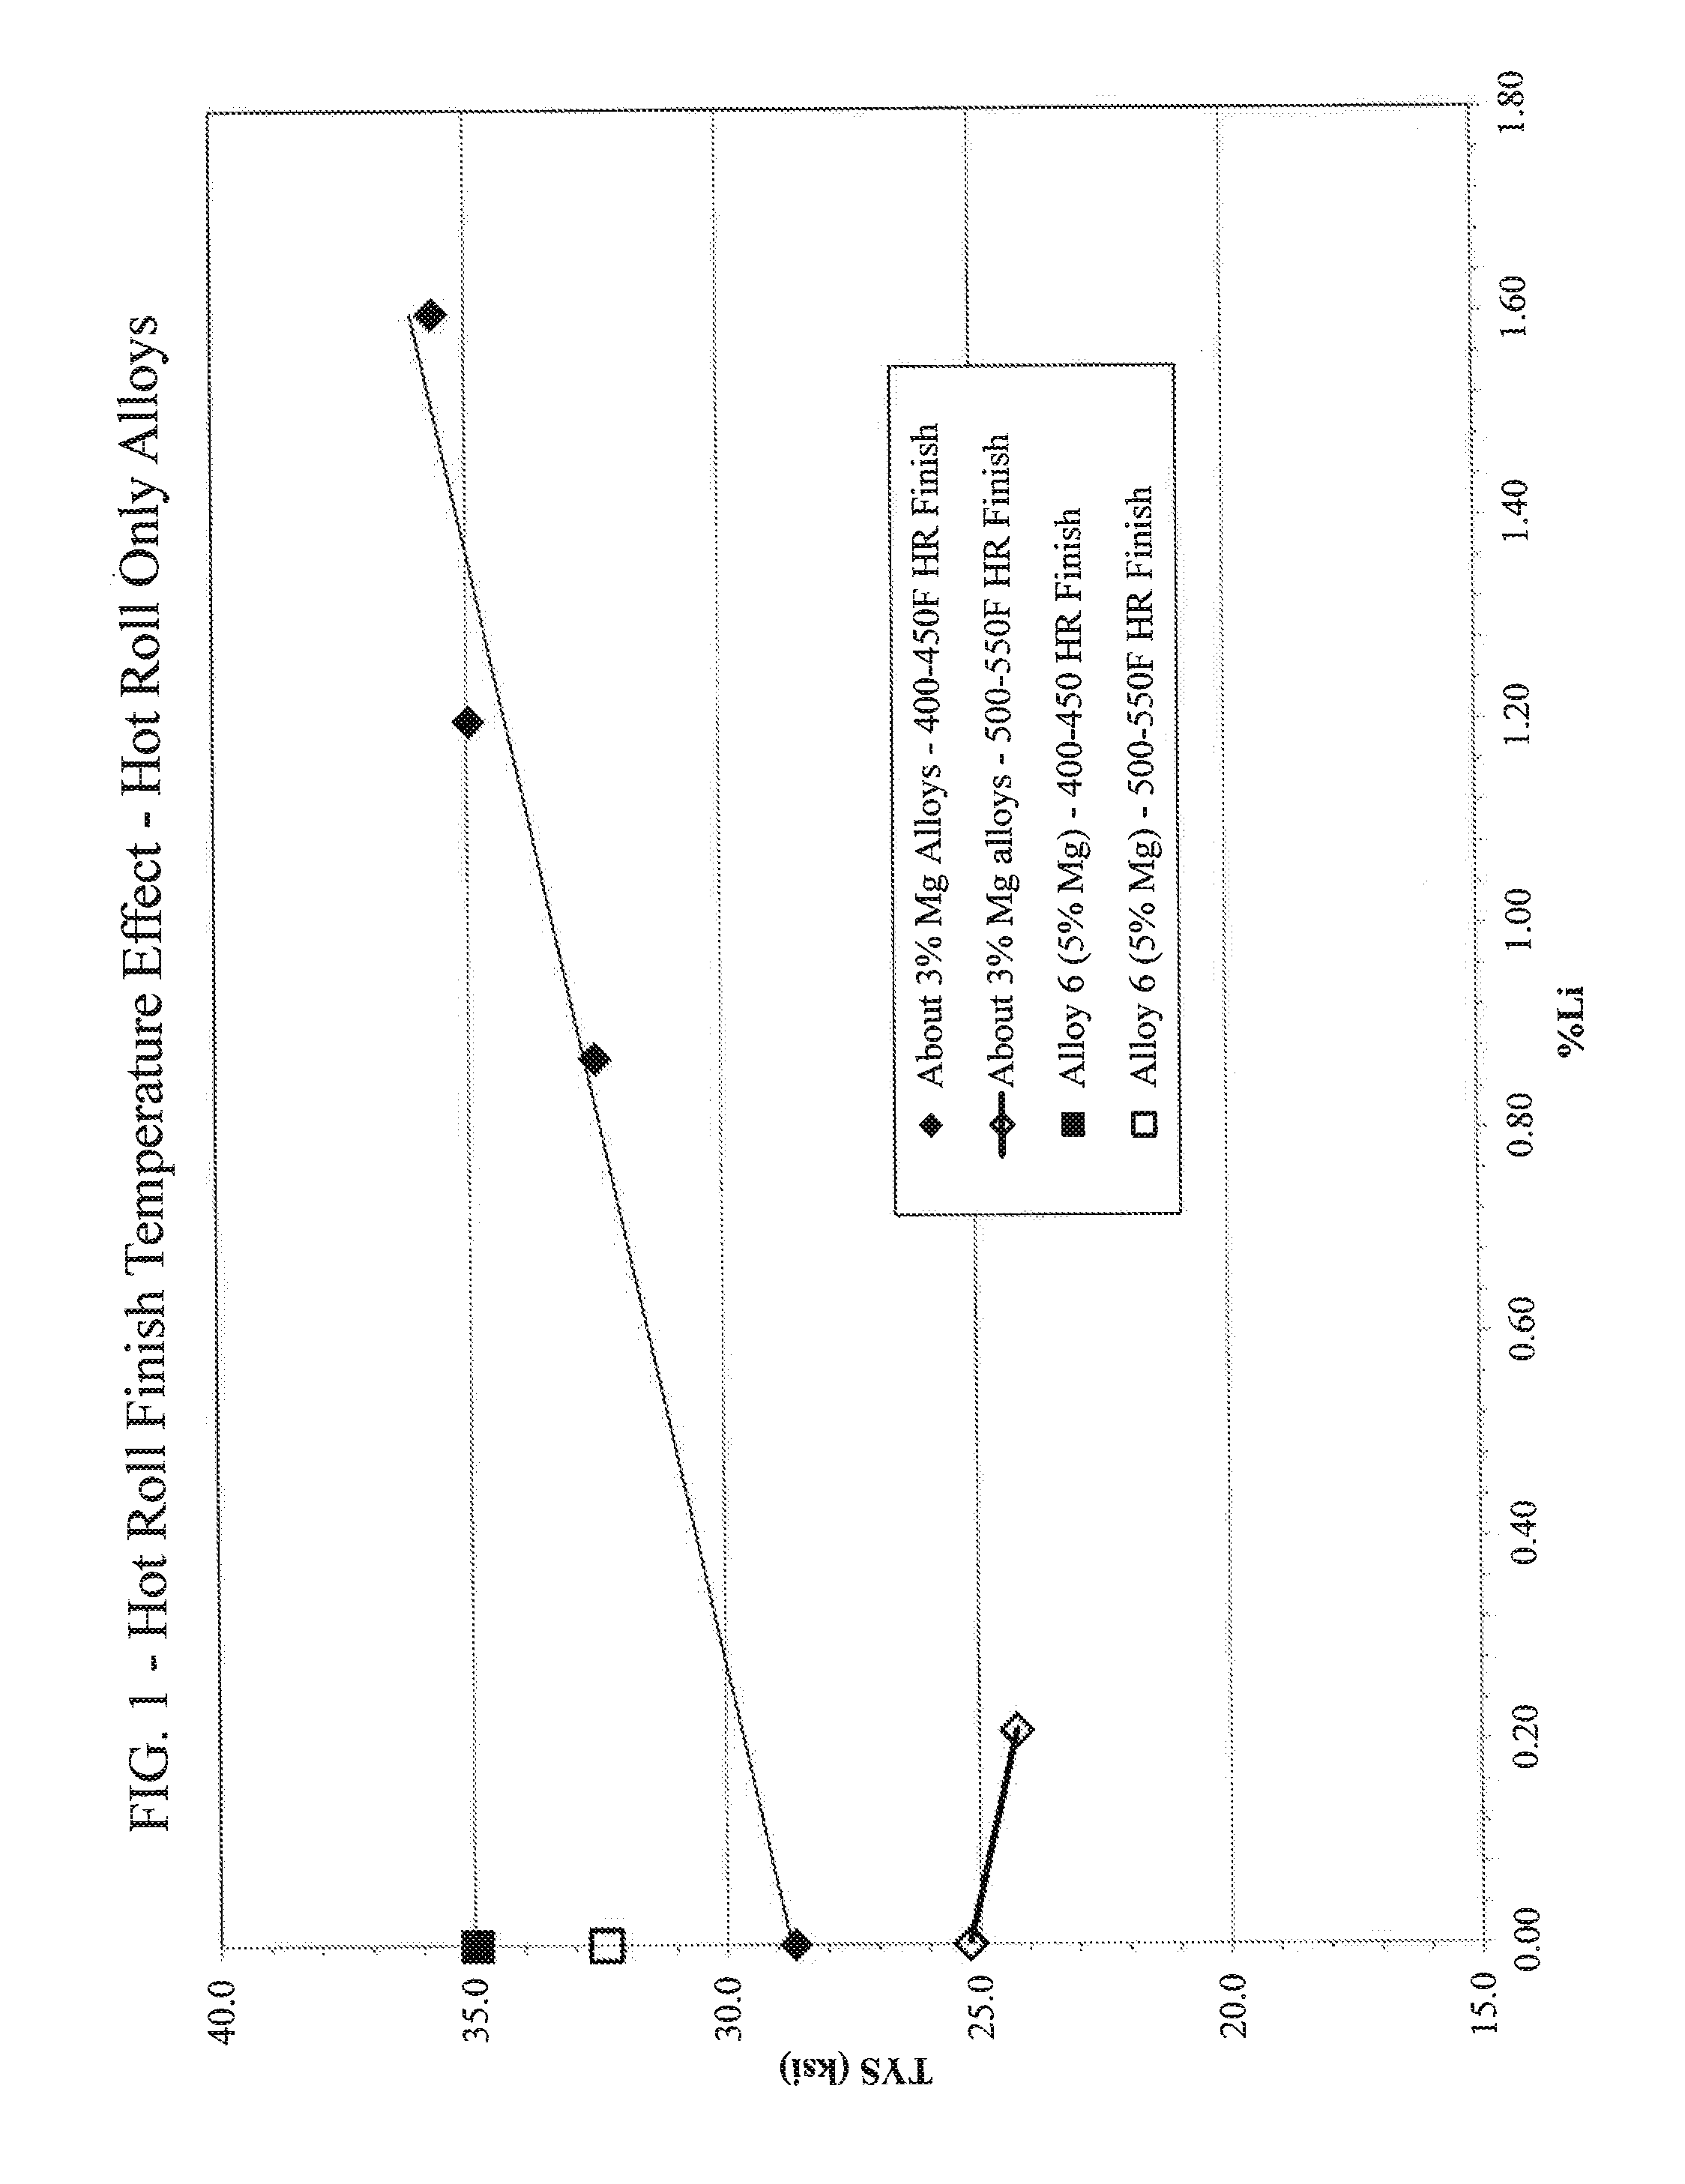
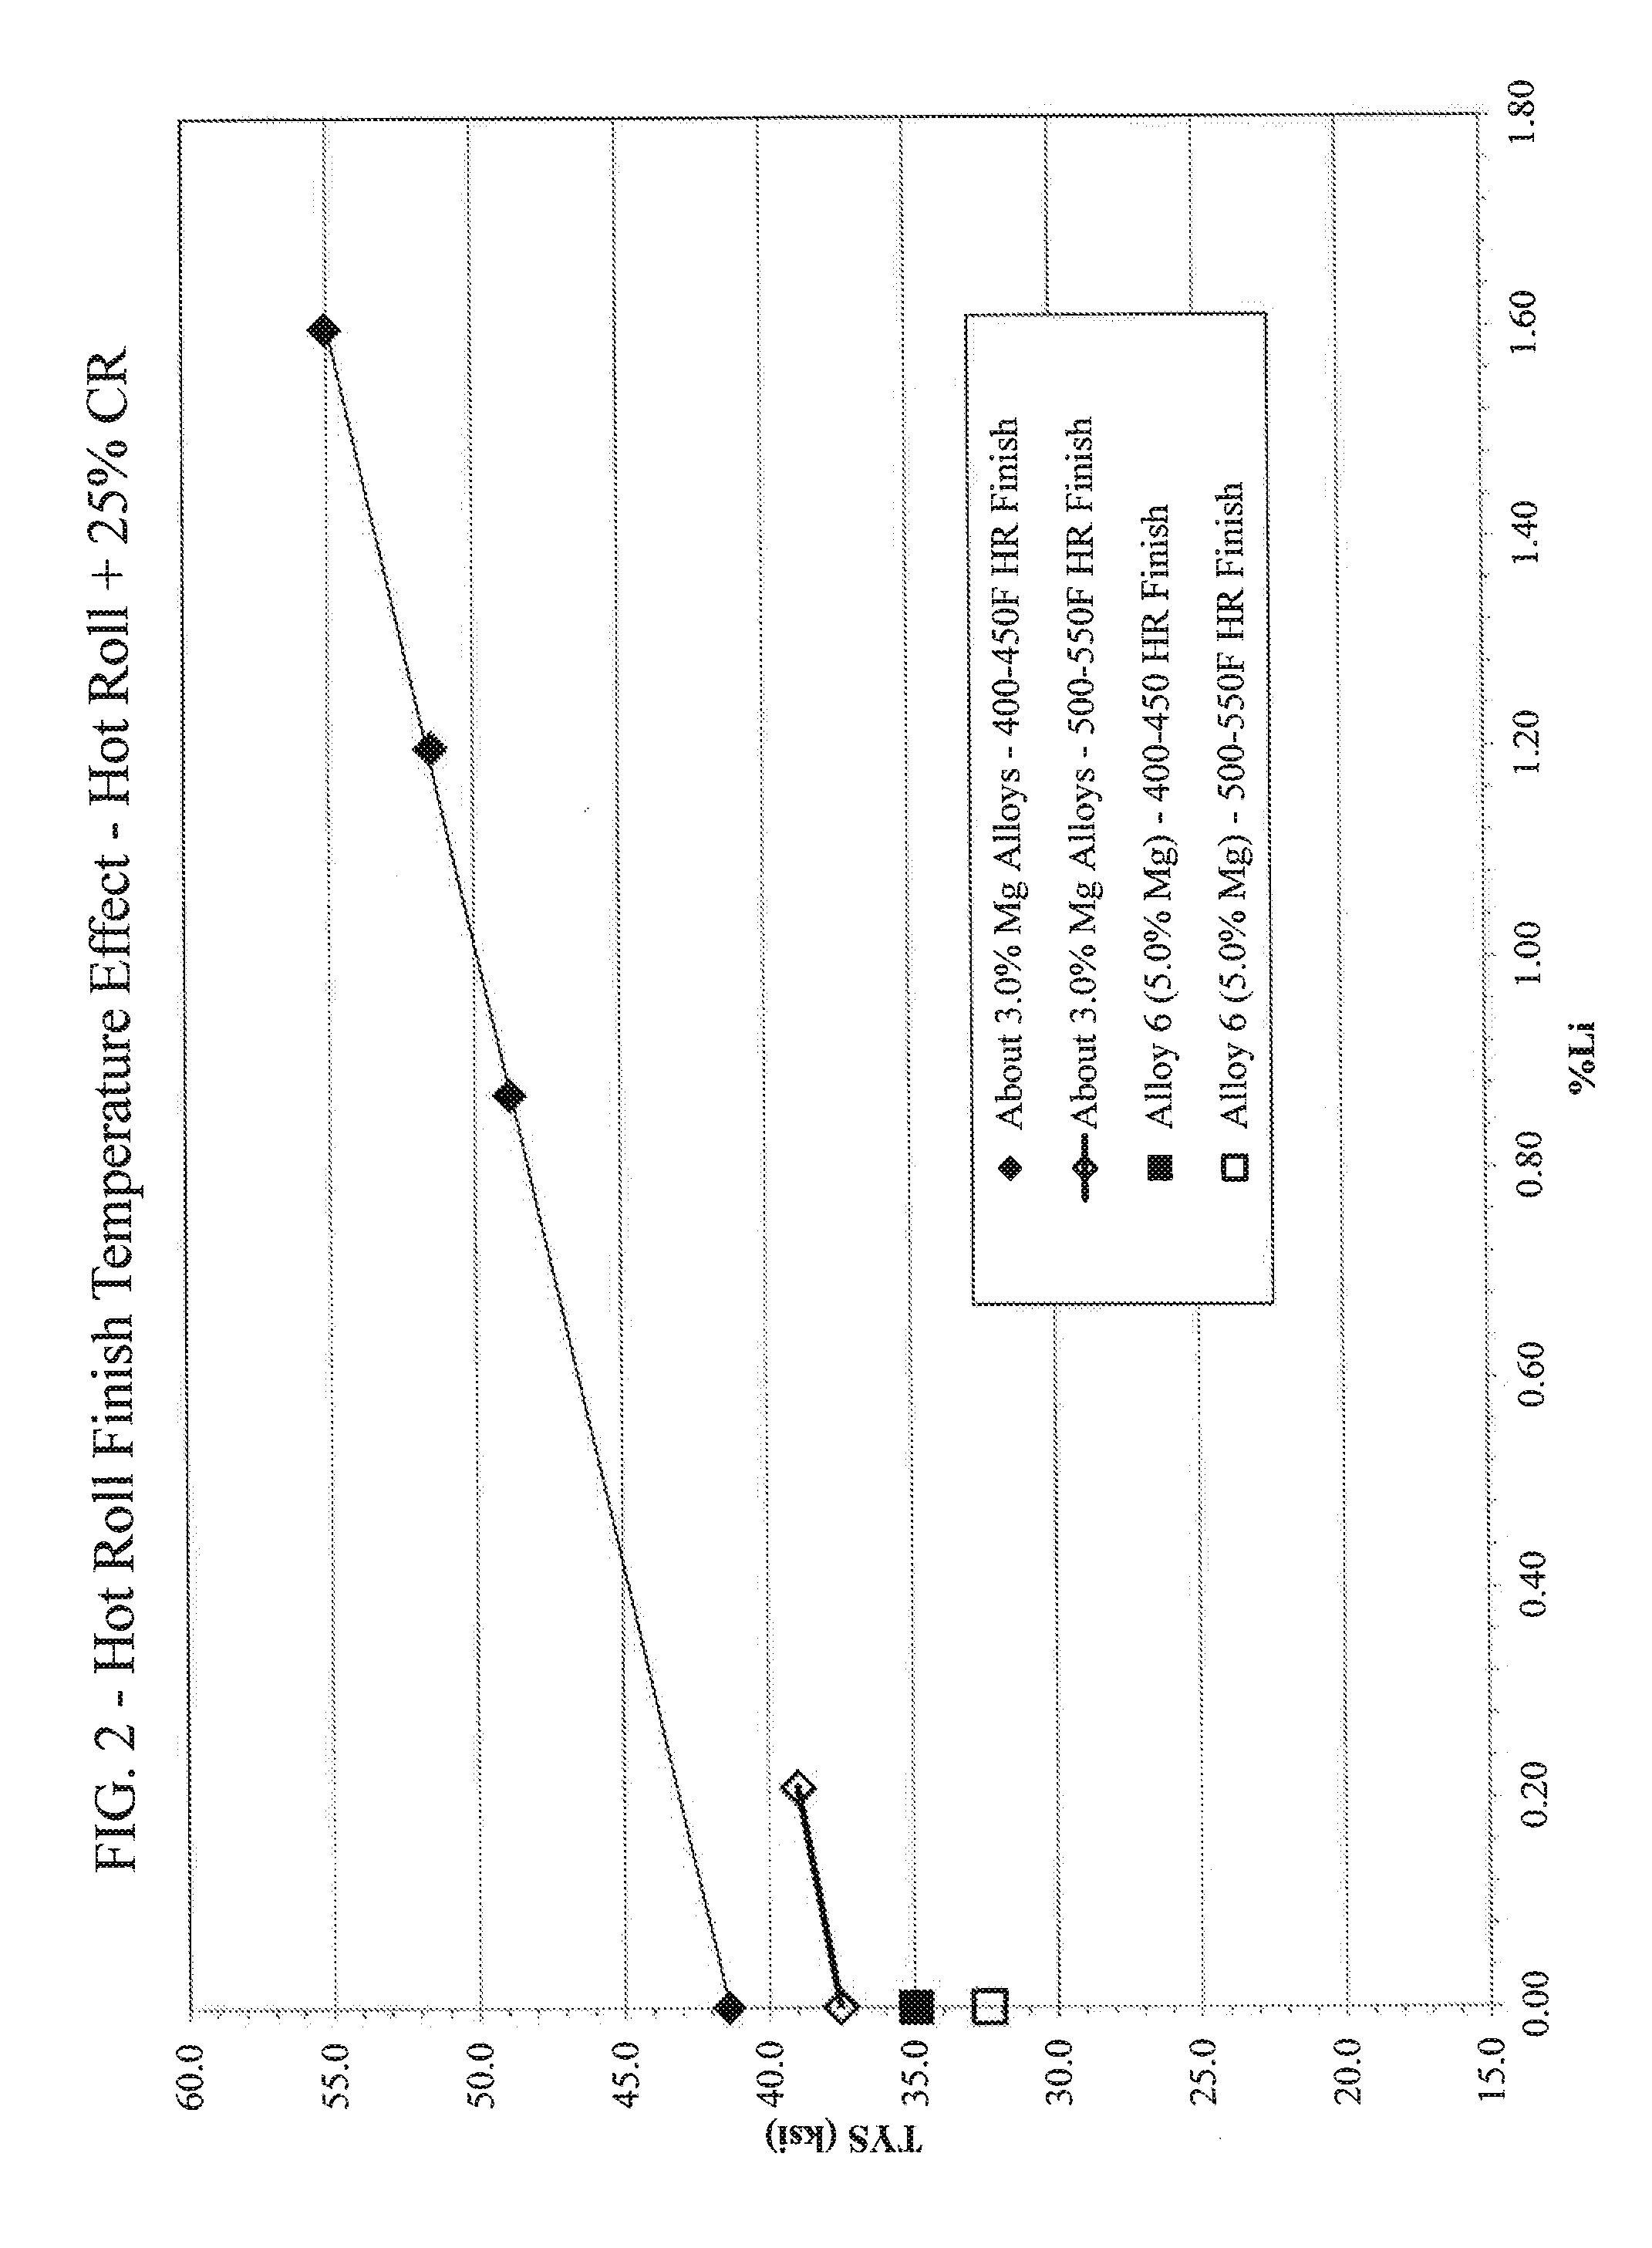
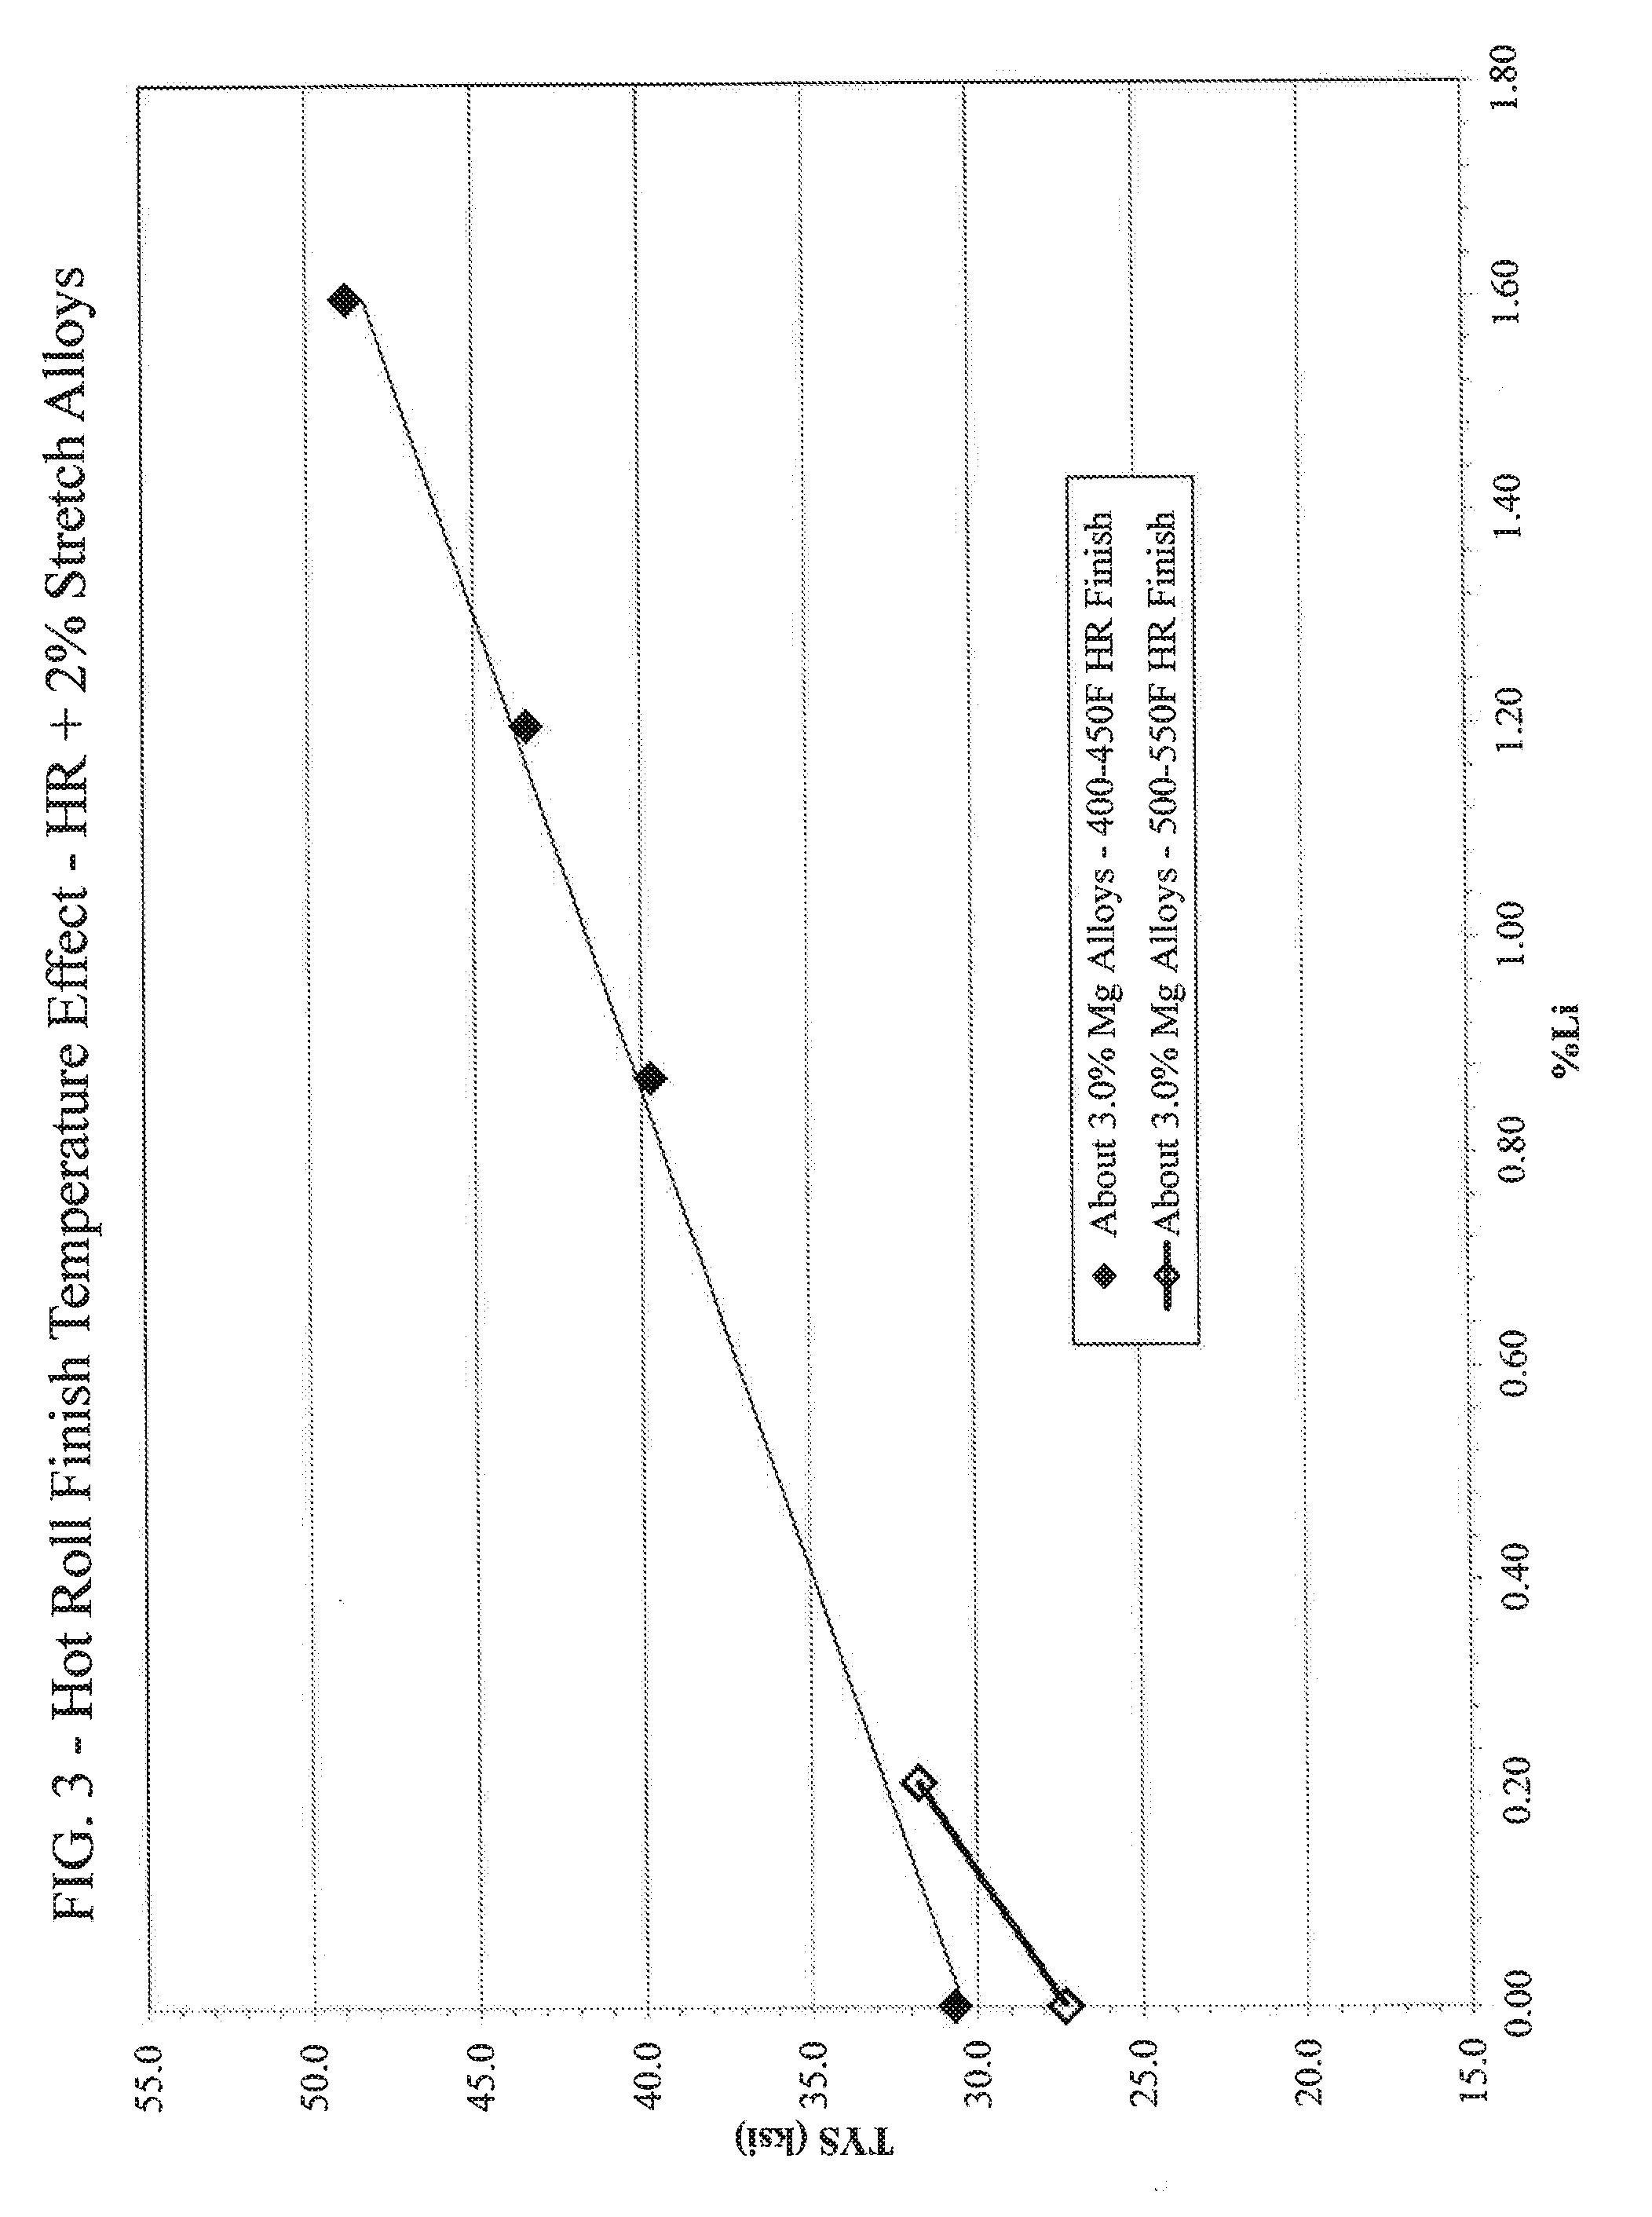
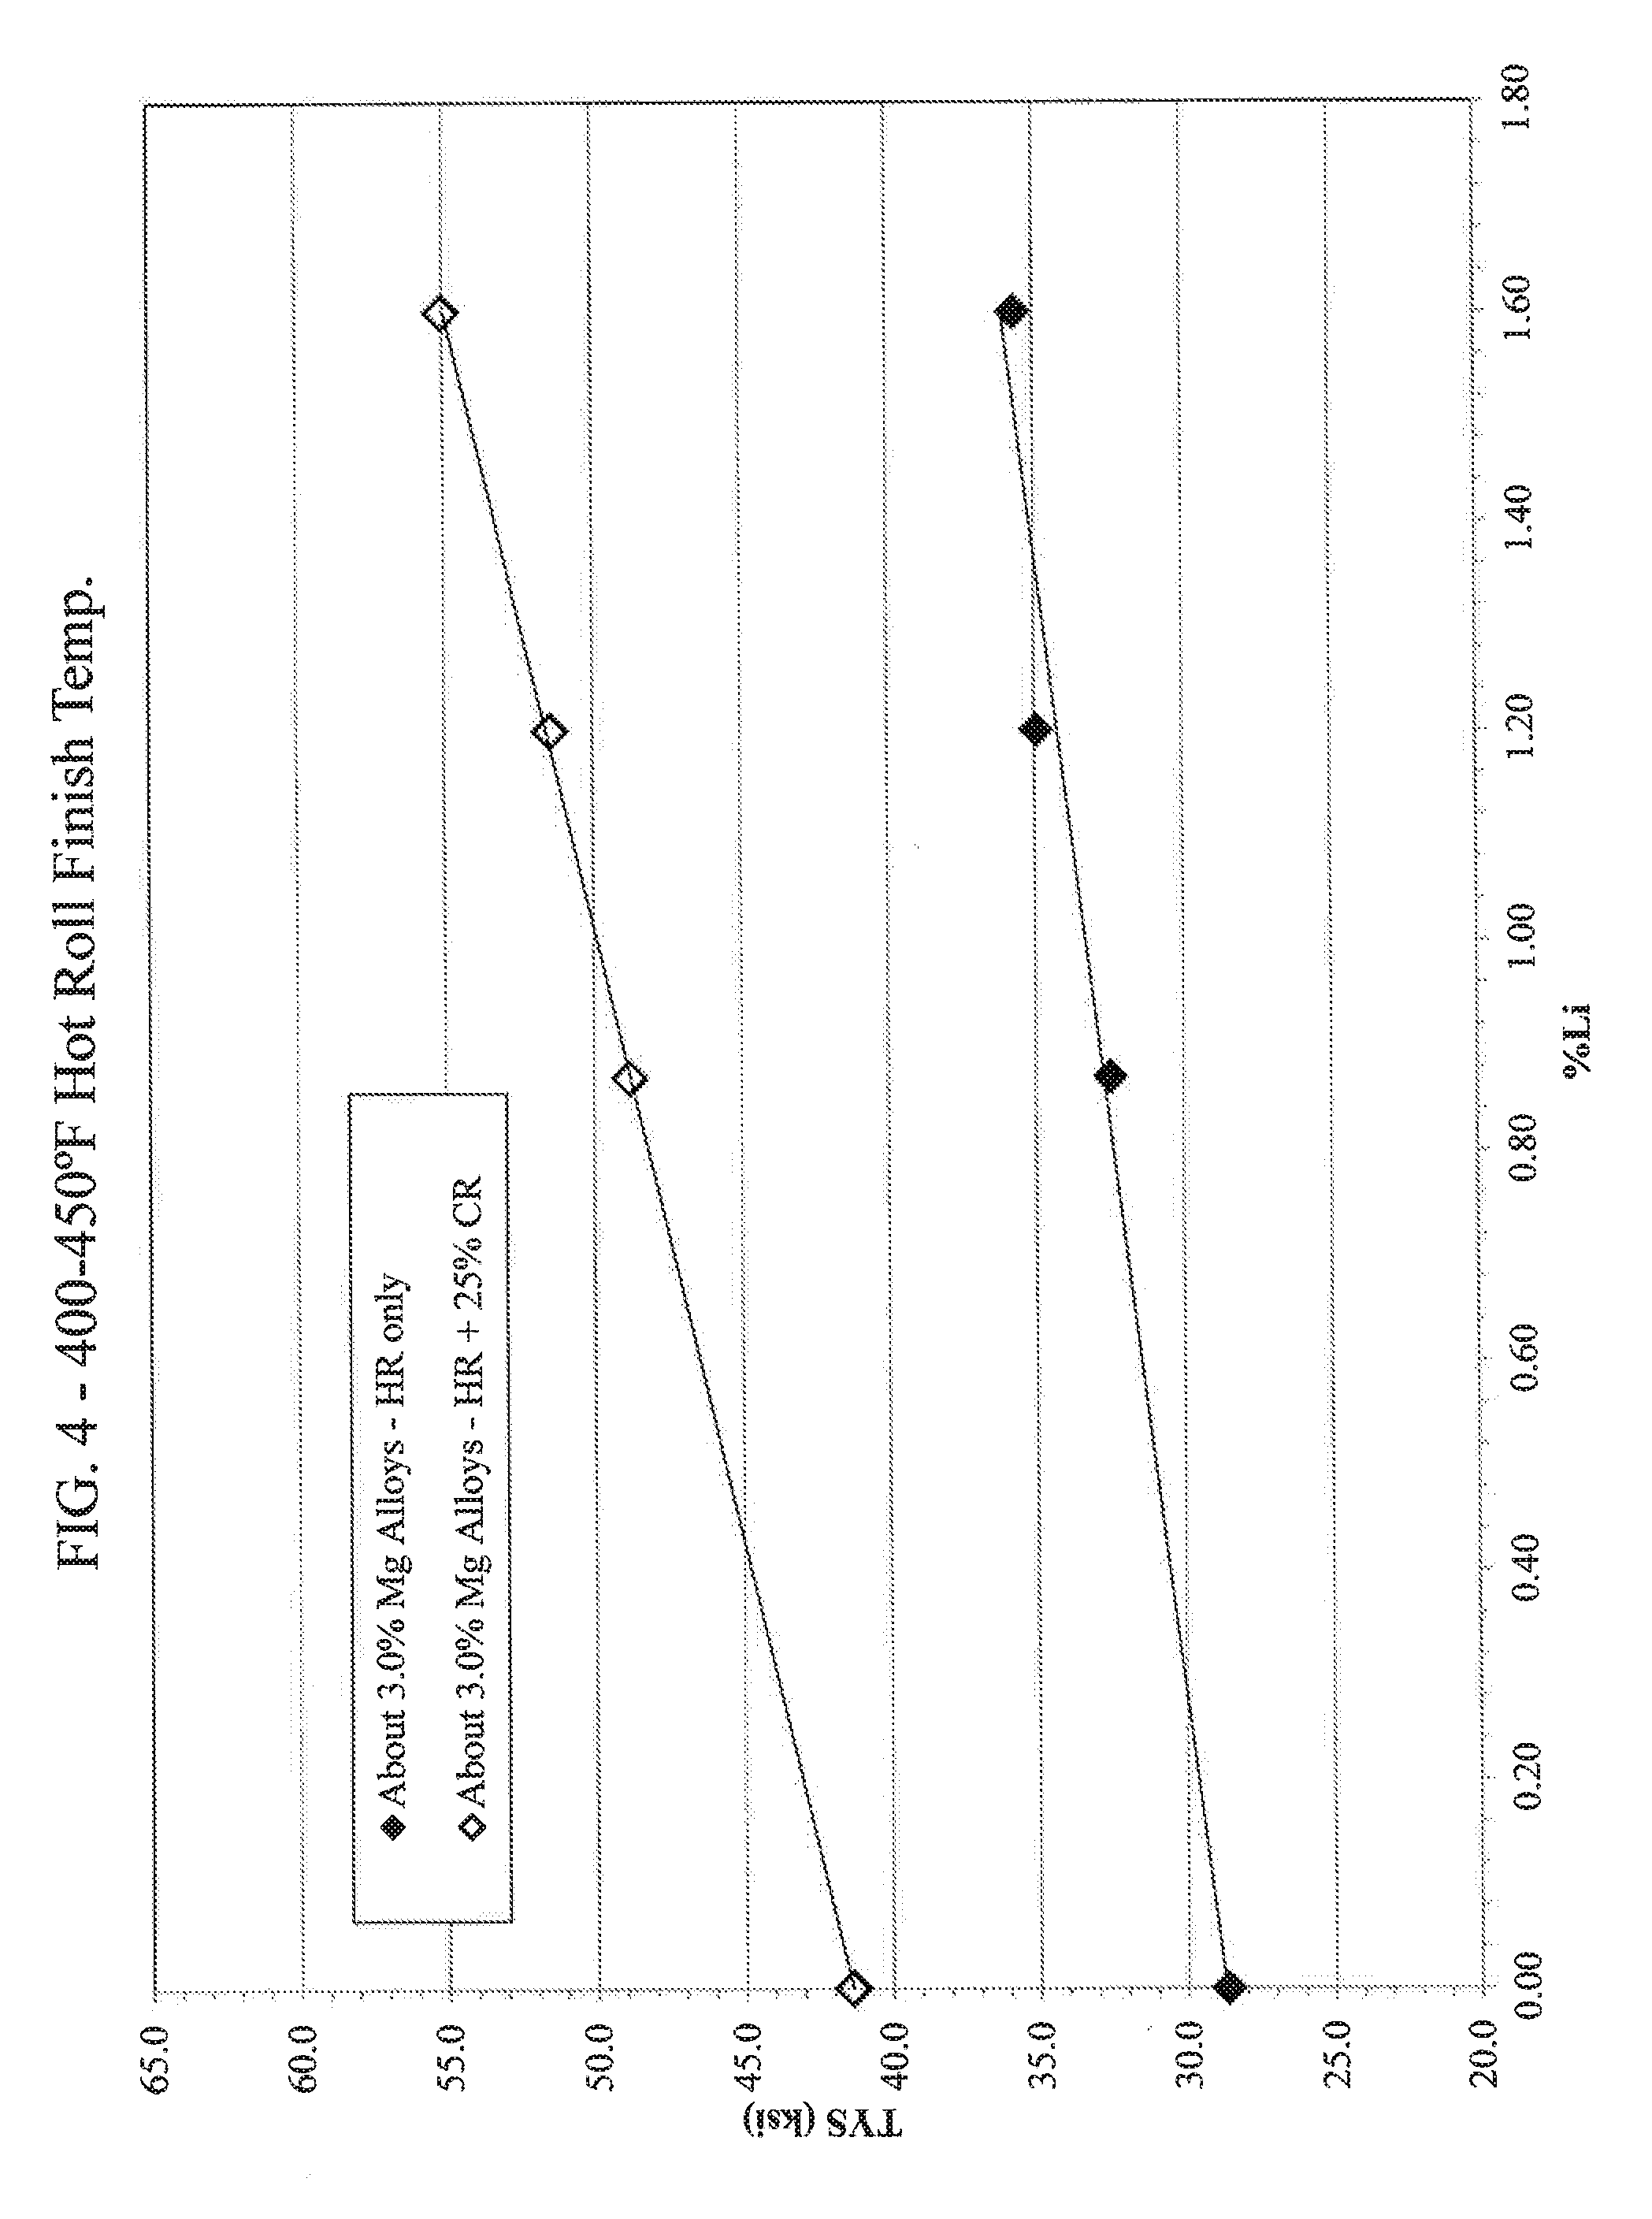
[0037] The alloys were cast as approximately 2.875 inch (ST).times.4.75 inch (LT).times.17 inch (L) ingots that were scalped (machined) to about 2 inches thick. Alloys 10-12 were then homogenized. Each ingot was then hot rolled to a gauge of about 0.25 inch. The finish hot rolling temperature varied as shown below (the starting hot rolling temperature was about 850.degree. F.). Part of these hot rolled pieces were then cold rolled to a gauge of about 0.1875 inch (about a 25% reduction in thickness). For Alloys 1-5, other parts of the hot rolled pieces were stretched about 2% for flatness. The mechanical properties of the as hot rolled (HR), the as cold rolled materials (CR) and hot rolled and 2% stretched material (HR-2% S) were then tested, the results of which are provided in Tables 2-4, below. Strength and elongation properties were measured in accordance with ASTM E8 and B557--all test values relative to the longitudinal (L) direction, unless otherwise indicated.
TABLE-US-00002 TABLE 2 Mechanical Properties of Hot Rolled (HR) Alloys Hot Rolling Finish Temp. TYS UTS Elong. Alloy (.degree. F.) (ksi) (ksi) (%) 1 500-550 25.2 35.8 28.4 1 400-450 28.7 38.3 26.1 2 500-550 24.3 37.9 24.9 3 400-450 32.5 46.2 15.2 4 400-450 35.0 48.5 12.9 5 400-450 35.7 53.0 11.8 6 400-450 35.0 50.0 24.1 6 500-550 32.4 49.7 23.2 7 400-450 36.8 53.2 17.0 8 500-550 31.5 51.8 23.5 9 400-450 38.3 55.8 19.1 10 400-450 39.0 57.5 18.9 11 400-450 40.4 56.5 17.5 12 400-450 39.1 56.8 16.4
TABLE-US-00003 TABLE 3 Mechanical Properties of HR + 25% CR Alloys Hot Rolling Finish Temp. TYS UTS Elong. Alloy (.degree. F.) (ksi) (ksi) (%) 1 500-550 37.6 41.9 14.1 1 400-450 41.4 43.7 10.7 2 500-550 39.0 42.6 13.5 3 400-450 48.8 50.4 7.2 4 400-450 51.5 53.2 5.7 5 400-450 55.1 57.7 5.0 6 400-450 51.2 57.9 11.6 6 500-550 48.9 57.4 12.2 7 400-450 53.3 60.5 8.0 8 500-550 51.0 59.0 11.0 9 400-450 56.2 64.4 7.7 10 400-450 60.4 67.1 8.8 11 400-450 56.5 63.7 8.5 12 400-450 59.3 66.4 6.8
TABLE-US-00004 TABLE 4 Mechanical Properties of HR + 2% Stretch Alloys Hot Rolling Finish Temp. TYS UTS Elong. Alloy (.degree. F.) (ksi) (ksi) (%) 1 500-550 27.4 35.5 24.3 1 400-450 30.7 37.8 23.9 2 500-550 31.8 38.4 22.5 3 400-450 39.8 44.9 15.4 4 400-450 43.4 47.9 12.6 5 400-450 48.8 53.2 10.3
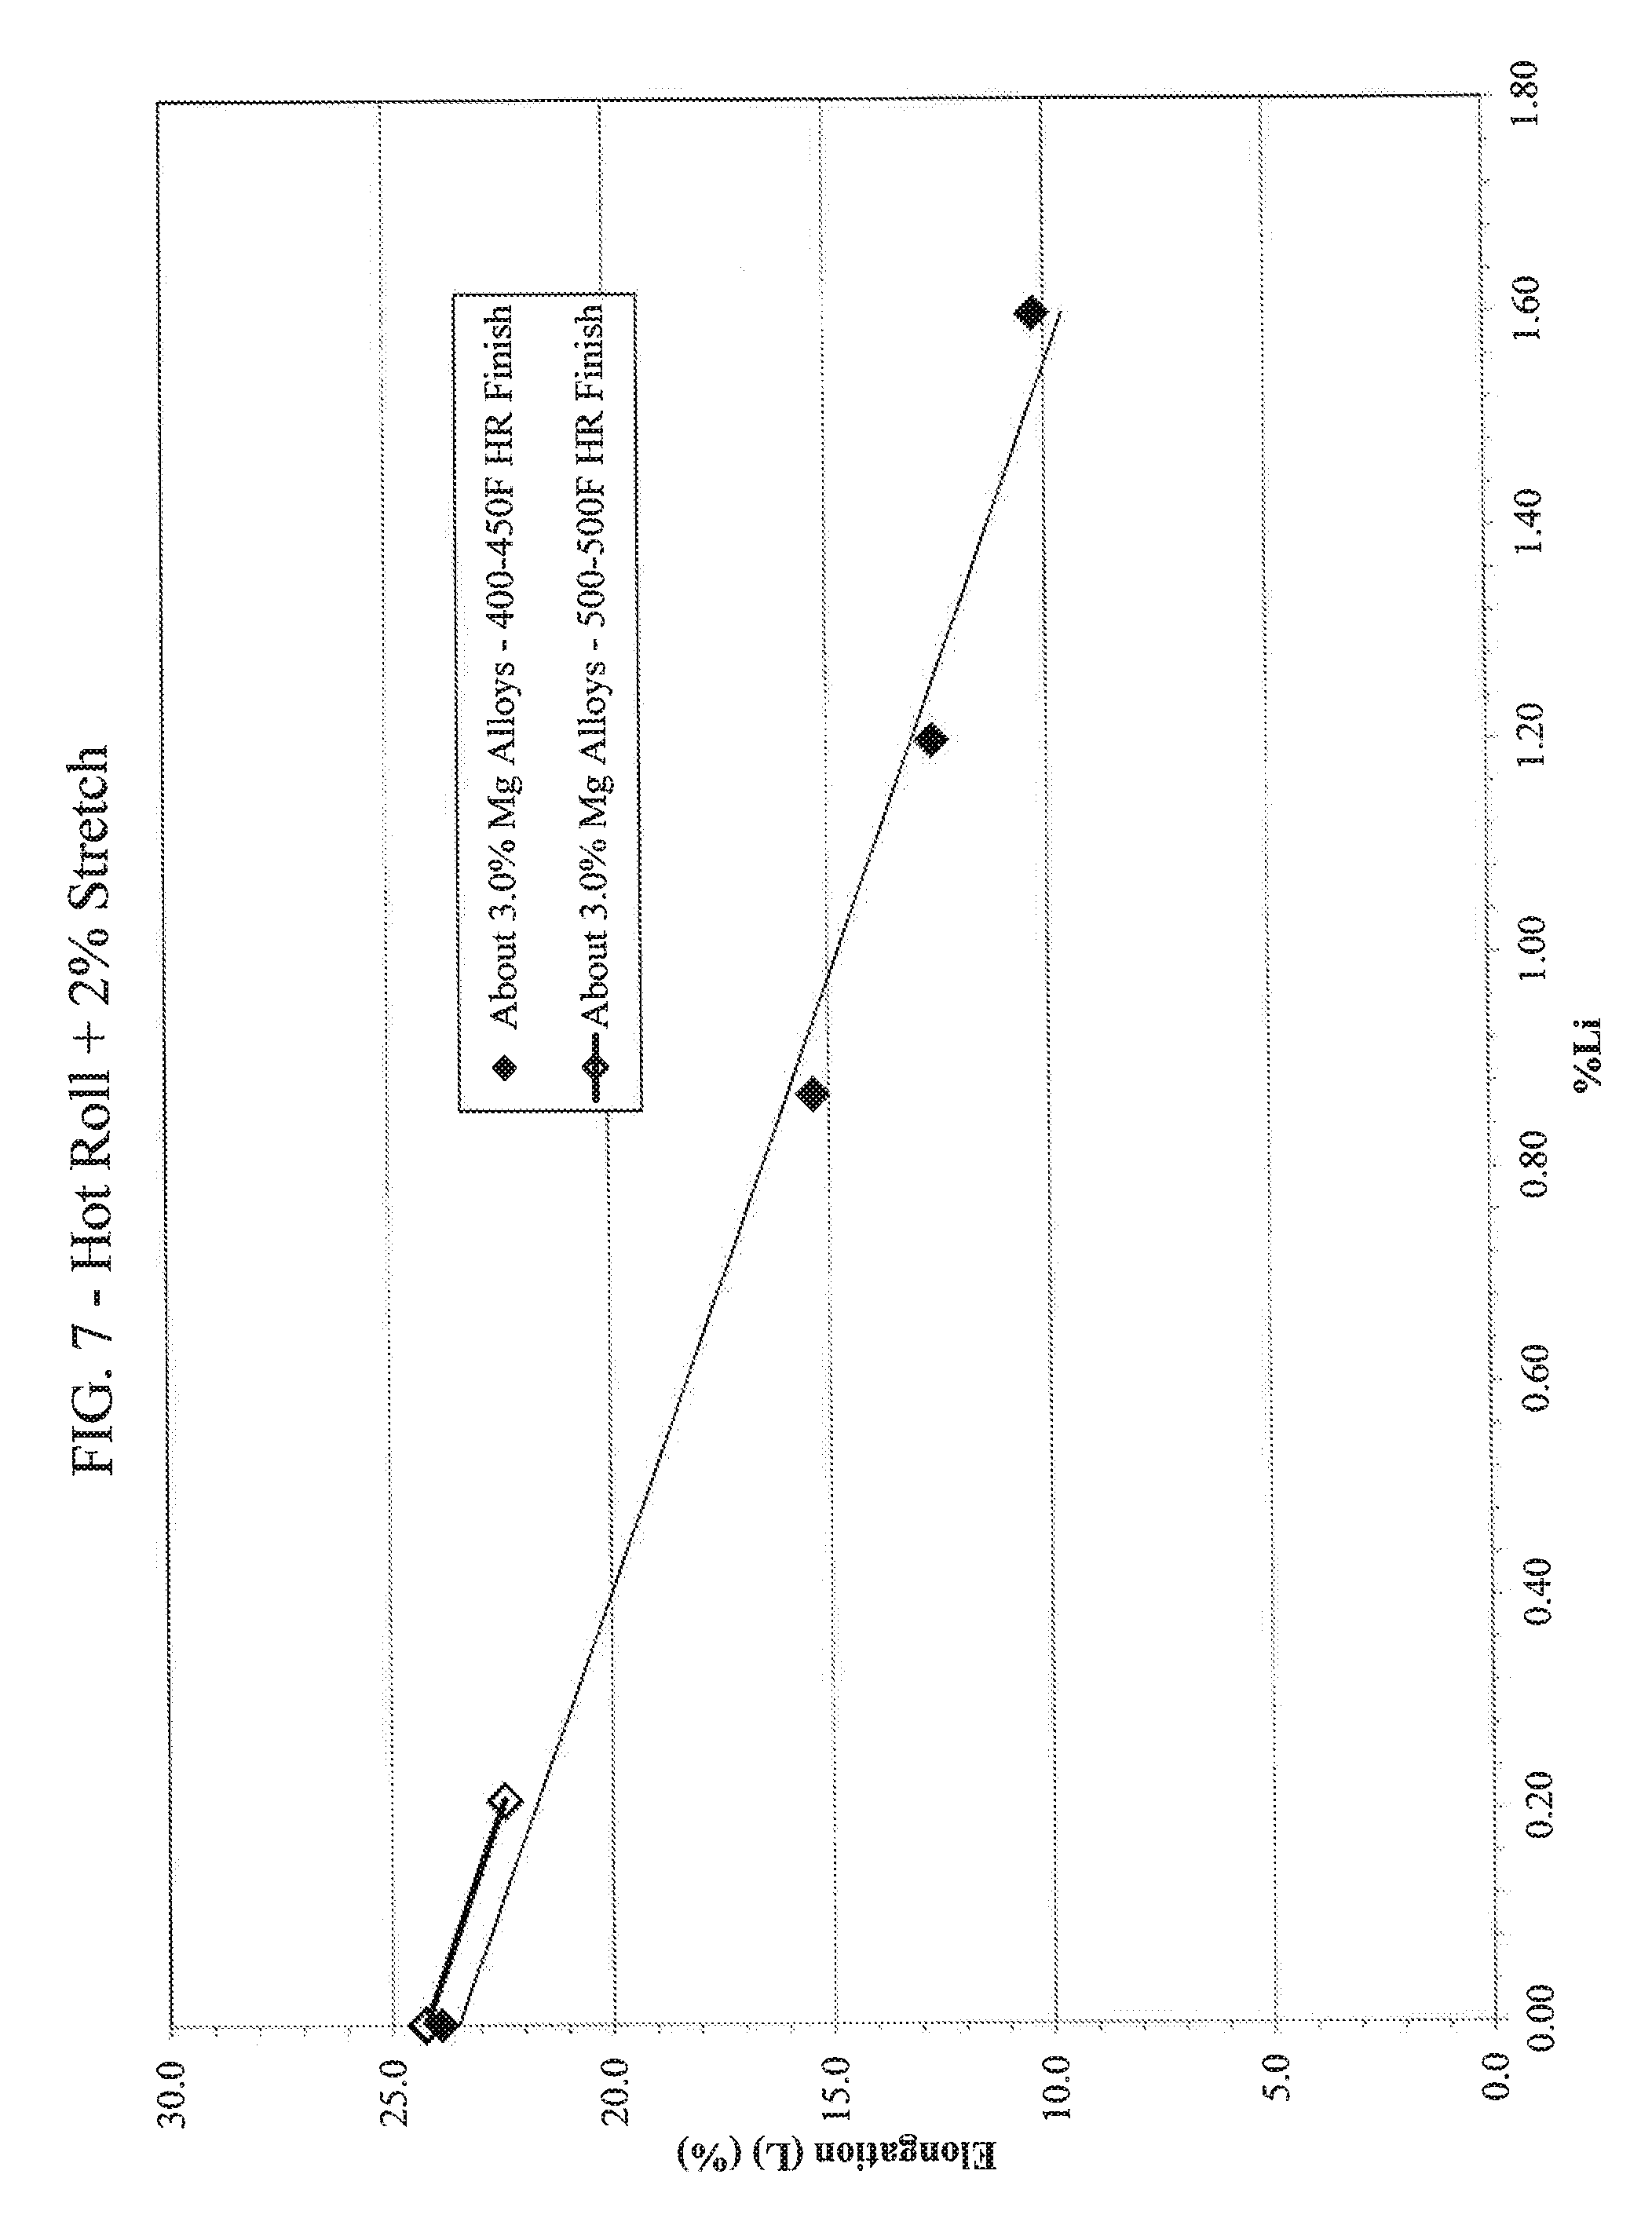
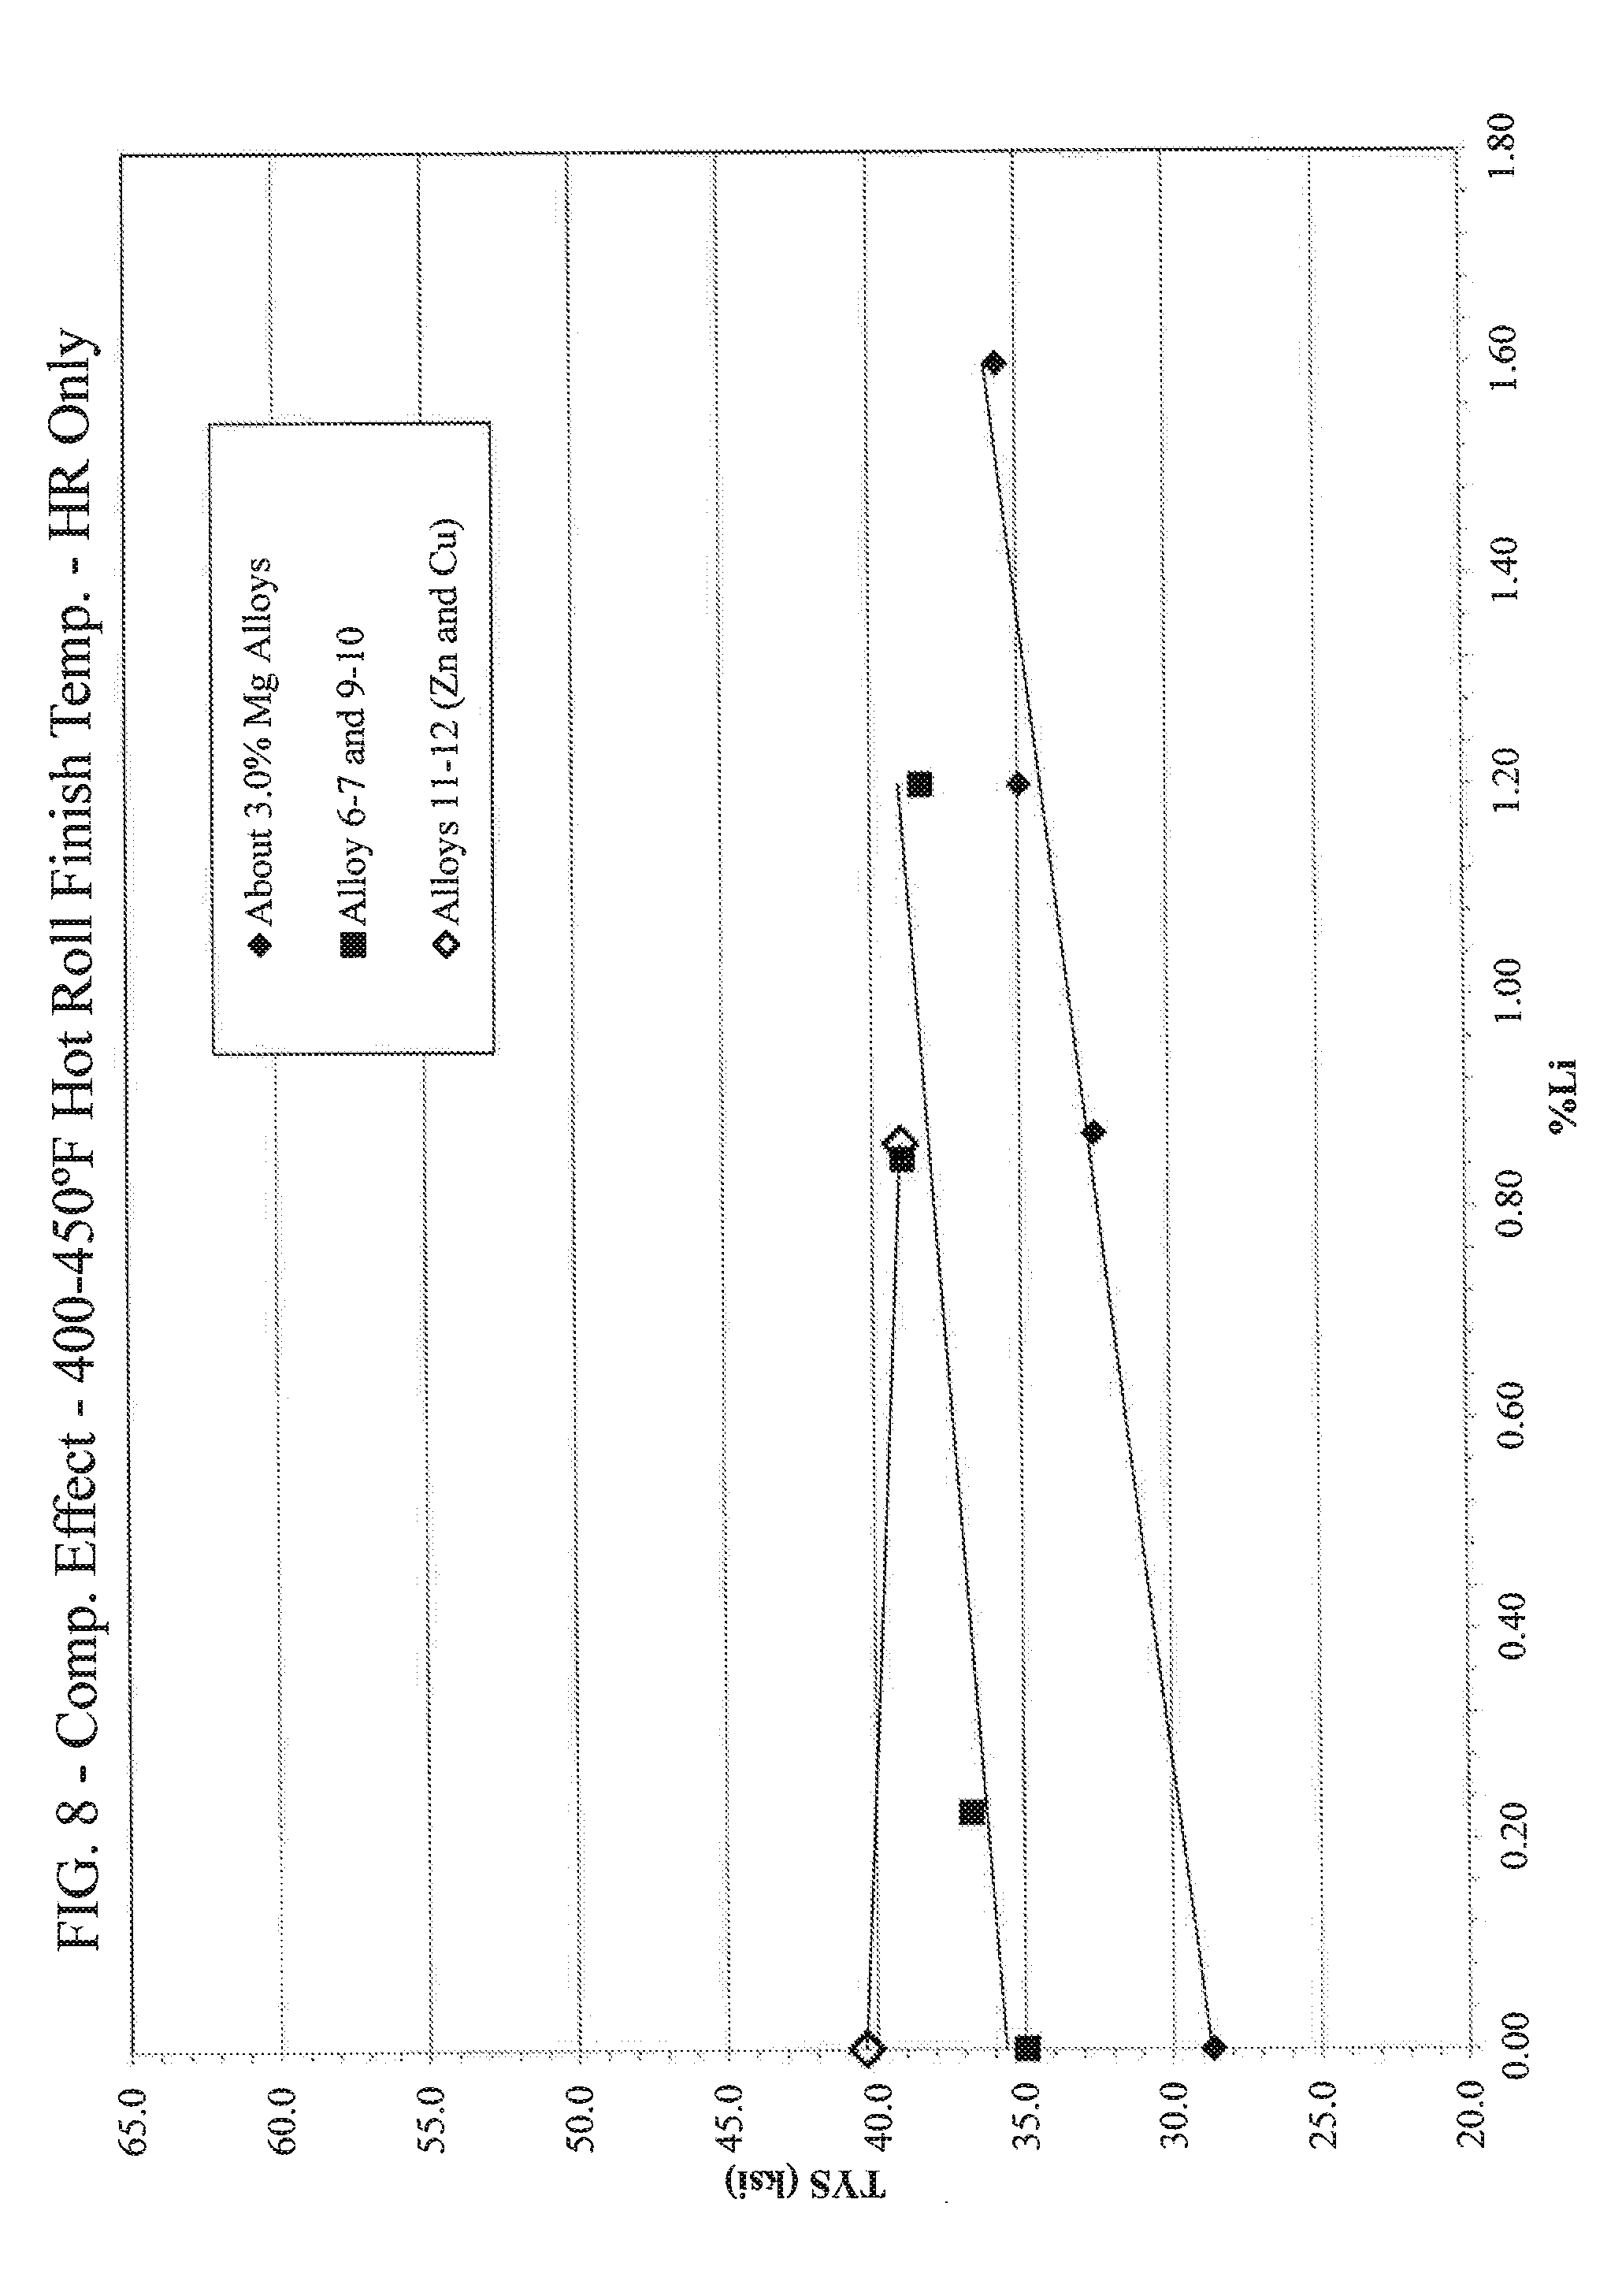
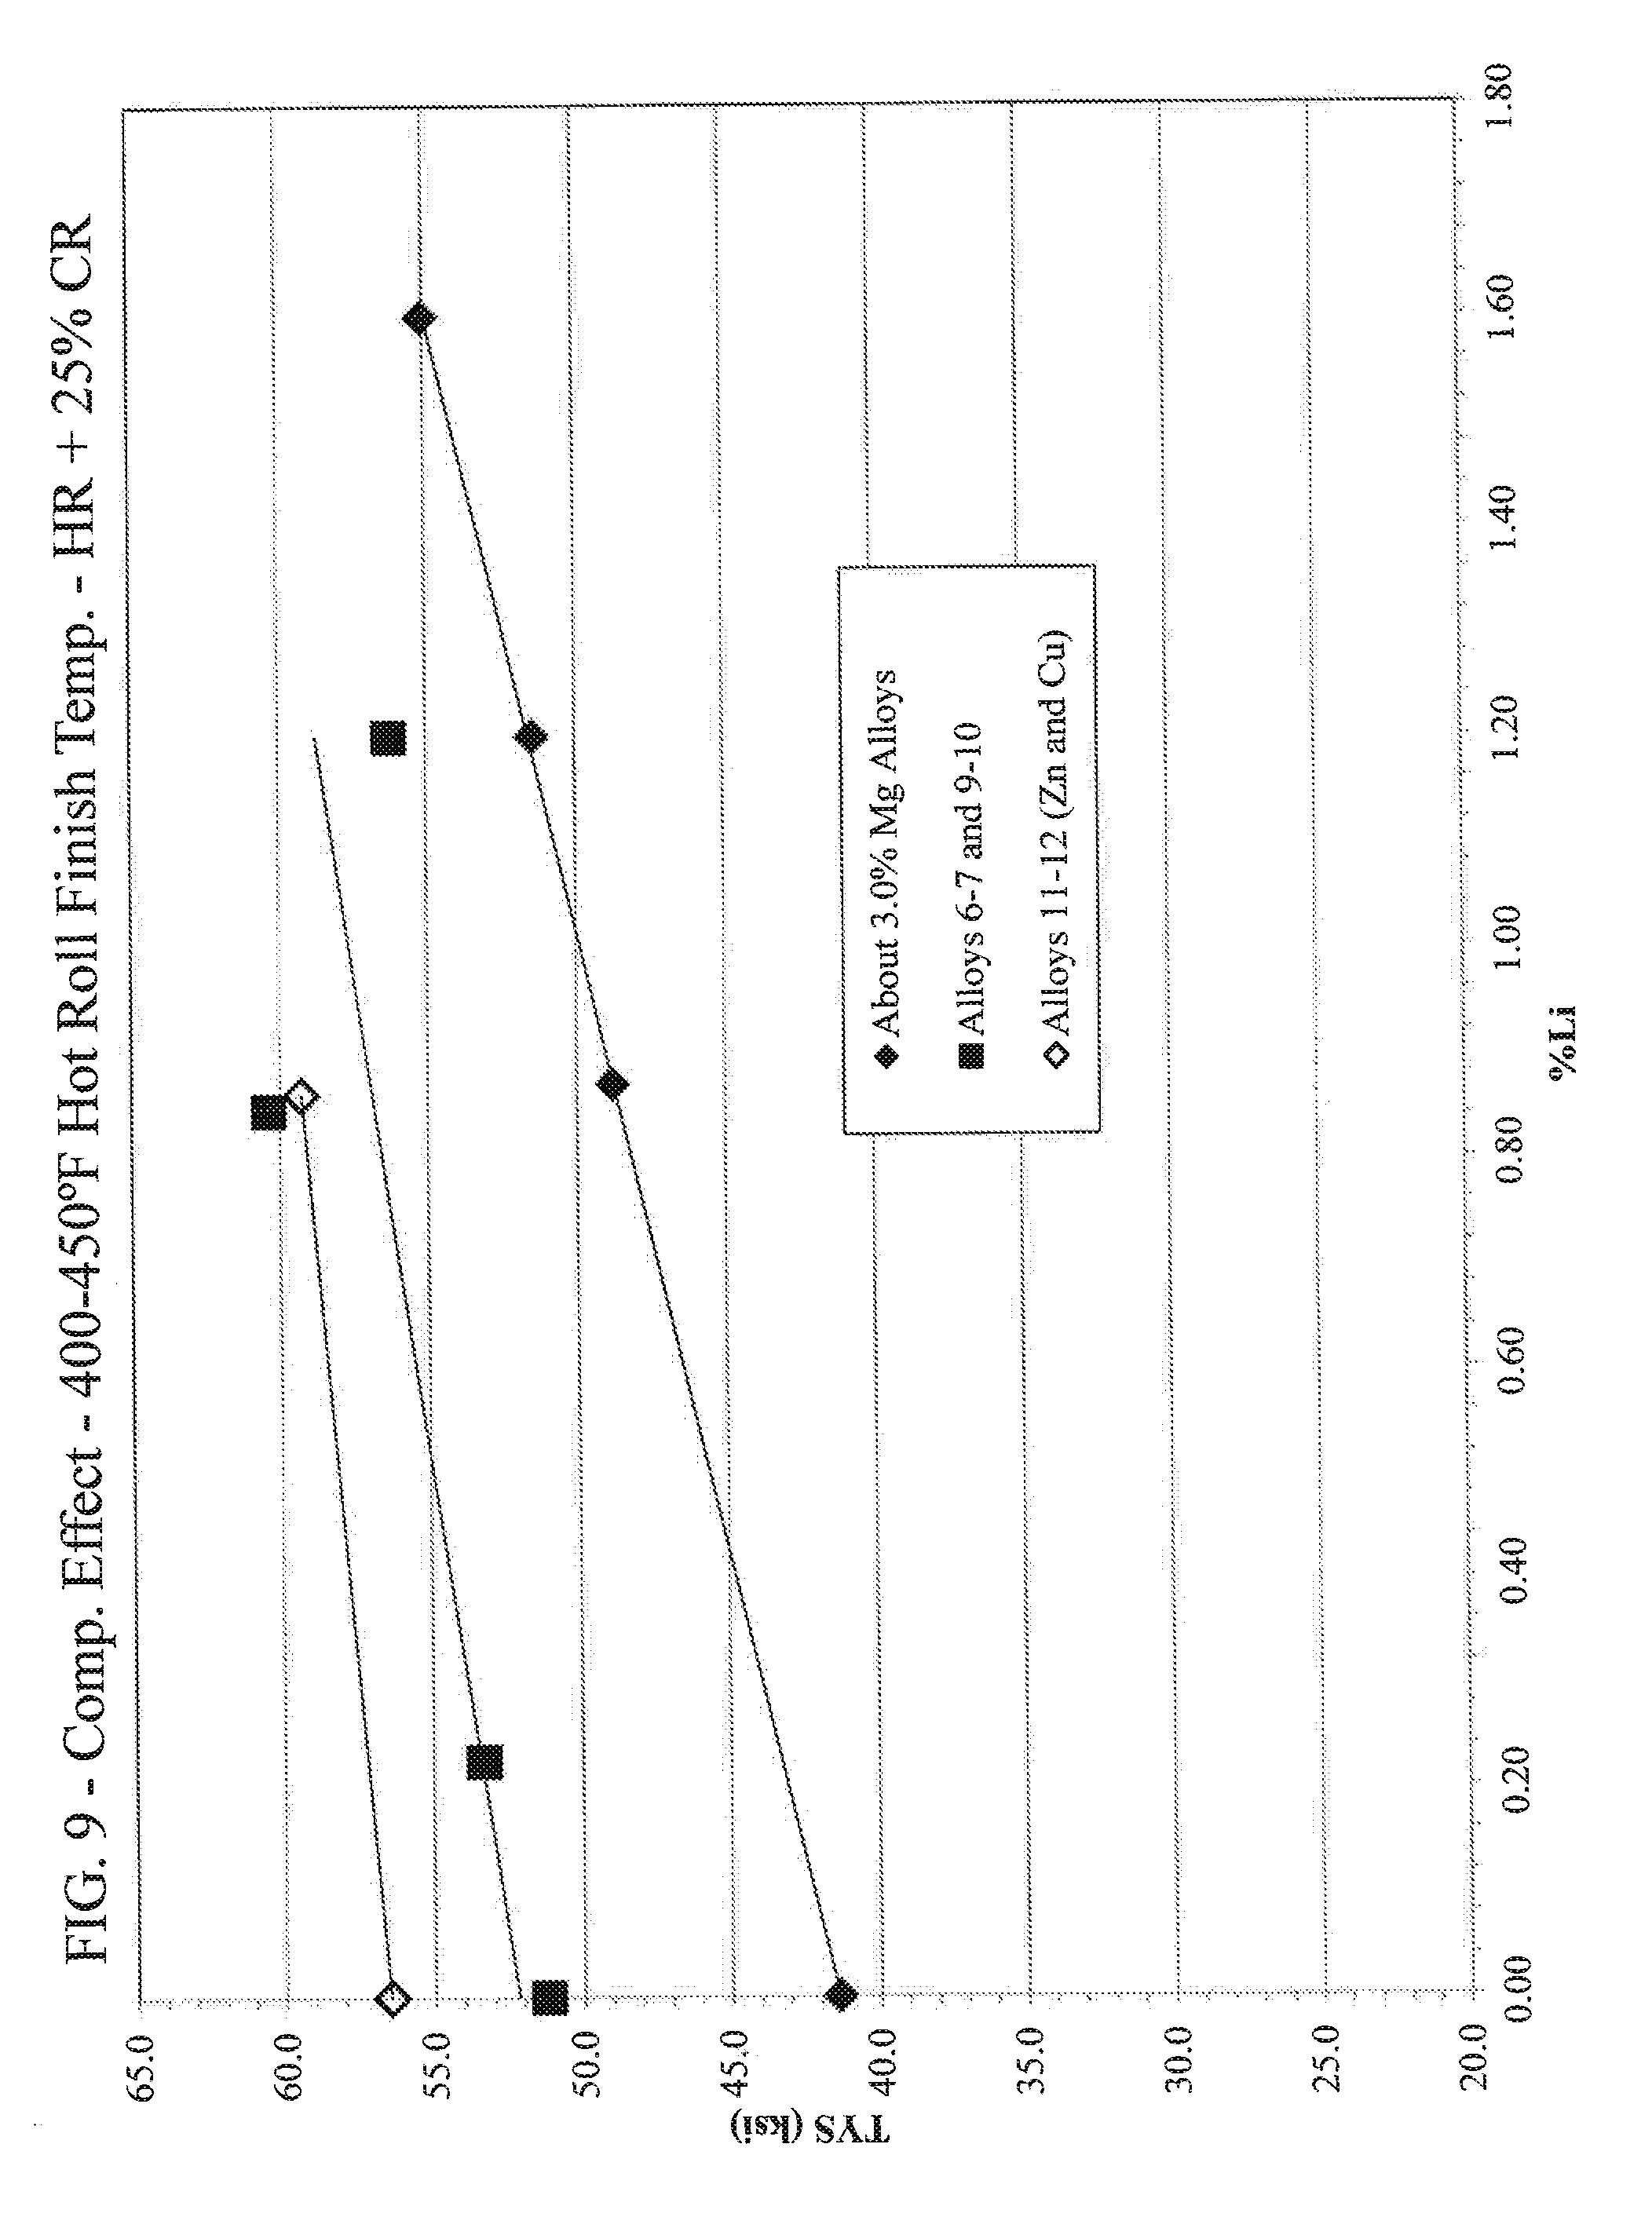
[0038] As shown in FIGS. 1-3, lower hot rolling exit temperatures resulted in better properties. As shown in FIGS. 4-5, the cold rolled alloys generally realize better strength than the hot-rolled only alloys. As shown in FIGS. 6-7, the hot rolled alloys without cold rolling generally realized good ductility at all lithium levels. As shown in FIGS. 8-9, higher levels of magnesium and lithium generally result in higher strengths.
[0039] The HR only alloys and the HR+25% CR alloys were also tested for corrosion resistance in accordance with ASTM G66 (exfoliation resistance) and G67 (mass loss). Specifically, the alloys were tested for corrosion resistance before and after exposure to a temperature of about 100.degree. C. for about 1 week. Alloys 1-5 that were hot rolled and then stretched 2% were also tested for corrosion resistance in accordance with ASTM G67 (mass loss). The corrosion resistance results are shown in Tables 5-7, below.
TABLE-US-00005 TABLE 5 Corrosion Resistance Results-Hot Rolled (HR) Alloys Before After Thermal Exposure Thermal Exposure Hot G67 G67 Rolling Mass G66 G66 Mass G66 G66 Finish Loss Rating Rating Loss Rating Rating Al- Temp. (mg/ @ @ (mg/ @ @ loy (.degree. F.) cm.sup.2) T/10 Surface cm.sup.2) T/10 Surface 1 500-550 1.11 PB PB 1.75 PB PB 1 400-450 1.47 PB PB 1.90 PB PB 2 500-550 1.26 PB PB 1.79 PB PB 3 400-450 1.38 PA PA 3.06 PB PB 4 400-450 1.21 PB PB 2.99 PB PB 5 400-450 1.64 PB PB 2.48 EA PB 6 400-450 1.74 PB PB 40.05 EA EC 6 500-550 1.90 PB PB 49.23 EA EC 6 400-450 1.30 PB PB 49.17 PB PB 7 400-450 1.65 PB PB 31.11 EB ED 7 400-450 1.66 PB PB 33.68 EB EB 8 500-550 2.36 PB PB 55.61 EB EB 9 400-450 3.55 EA EA 33.18 EC ED 9 400-450 2.31 PB PB 29.68 PB PB 10 400-450 7.70 PB PB 46.20 EB EC 10 400-450 6.84 PB PB 73.16 EA EA 11 400-450 2.00 EC EC 13.73 EC EC 11 400-450 1.72 EC EC 15.72 EC EC 12 400-450 2.20 EC EC 14.98 EC EC 12 400-450 2.31 EC EC 17.77 ED ED
TABLE-US-00006 TABLE 6 Corrosion Resistance Results-HR + 25% CR Alloys Before After Thermal Exposure Thermal Exposure Hot G67 G67 Rolling Mass G66 G66 Mass G66 G66 Finish Loss Rating Rating Loss Rating Rating Al- Temp. (mg/ @ @ (mg/ @ @ loy (.degree. F.) cm.sup.2) T/10 Surface cm.sup.2) T/10 Surface 1 500-550 1.16 PA PA 1.49 PA PA 1 400-450 1.55 PA PA 1.68 PA PA 2 500-550 1.33 PB PB 2.03 PA PA 3 400-450 1.26 PA PA 4.58 EA EA 4 400-450 1.25 PB PB 4.20 EA EA 5 400-450 1.37 PA PA 2.29 PA PA 6 400-450 1.48 PB PB 38.29 ED ED 6 500-550 1.34 PA PA 53.10 ED ED 6 400-450 1.37 PA PA 56.63 EA EA 7 400-450 1.49 PB PB 36.46 ED ED 7 400-450 1.76 PA PA 35.72 ED ED 8 500-550 2.08 PB PB 54.86 ED ED 9 400-450 2.70 EA EA 33.47 ED ED 9 400-450 2.08 PA PA 44.44 ED ED 10 400-450 5.01 PB EA 43.08 ED ED 10 400-450 4.11 PA PA 68.24 ED ED 11 400-450 1.77 EC EC 29.55 ED ED 11 400-450 1.63 EC EC 30.67 ED ED 12 400-450 2.31 EC EC 26.13 ED ED 12 400-450 2.25 EC EC 28.01 ED ED
TABLE-US-00007 TABLE 7 Corrosion Resistance Results - Hot Rolled (HR) + 2% Stretch Alloys Hot Rolling Before Thermal After Thermal Finish Temp. Exposure Exposure Alloy (.degree. F.) G67 Mass Loss (mg/cm.sup.2) 1 500-550 1.59 2.09 1 400-450 1.33 1.92 2 500-550 1.31 2.04 3 400-450 1.29 3.62 4 400-450 1.28 4.50 5 400-450 1.41 2.36
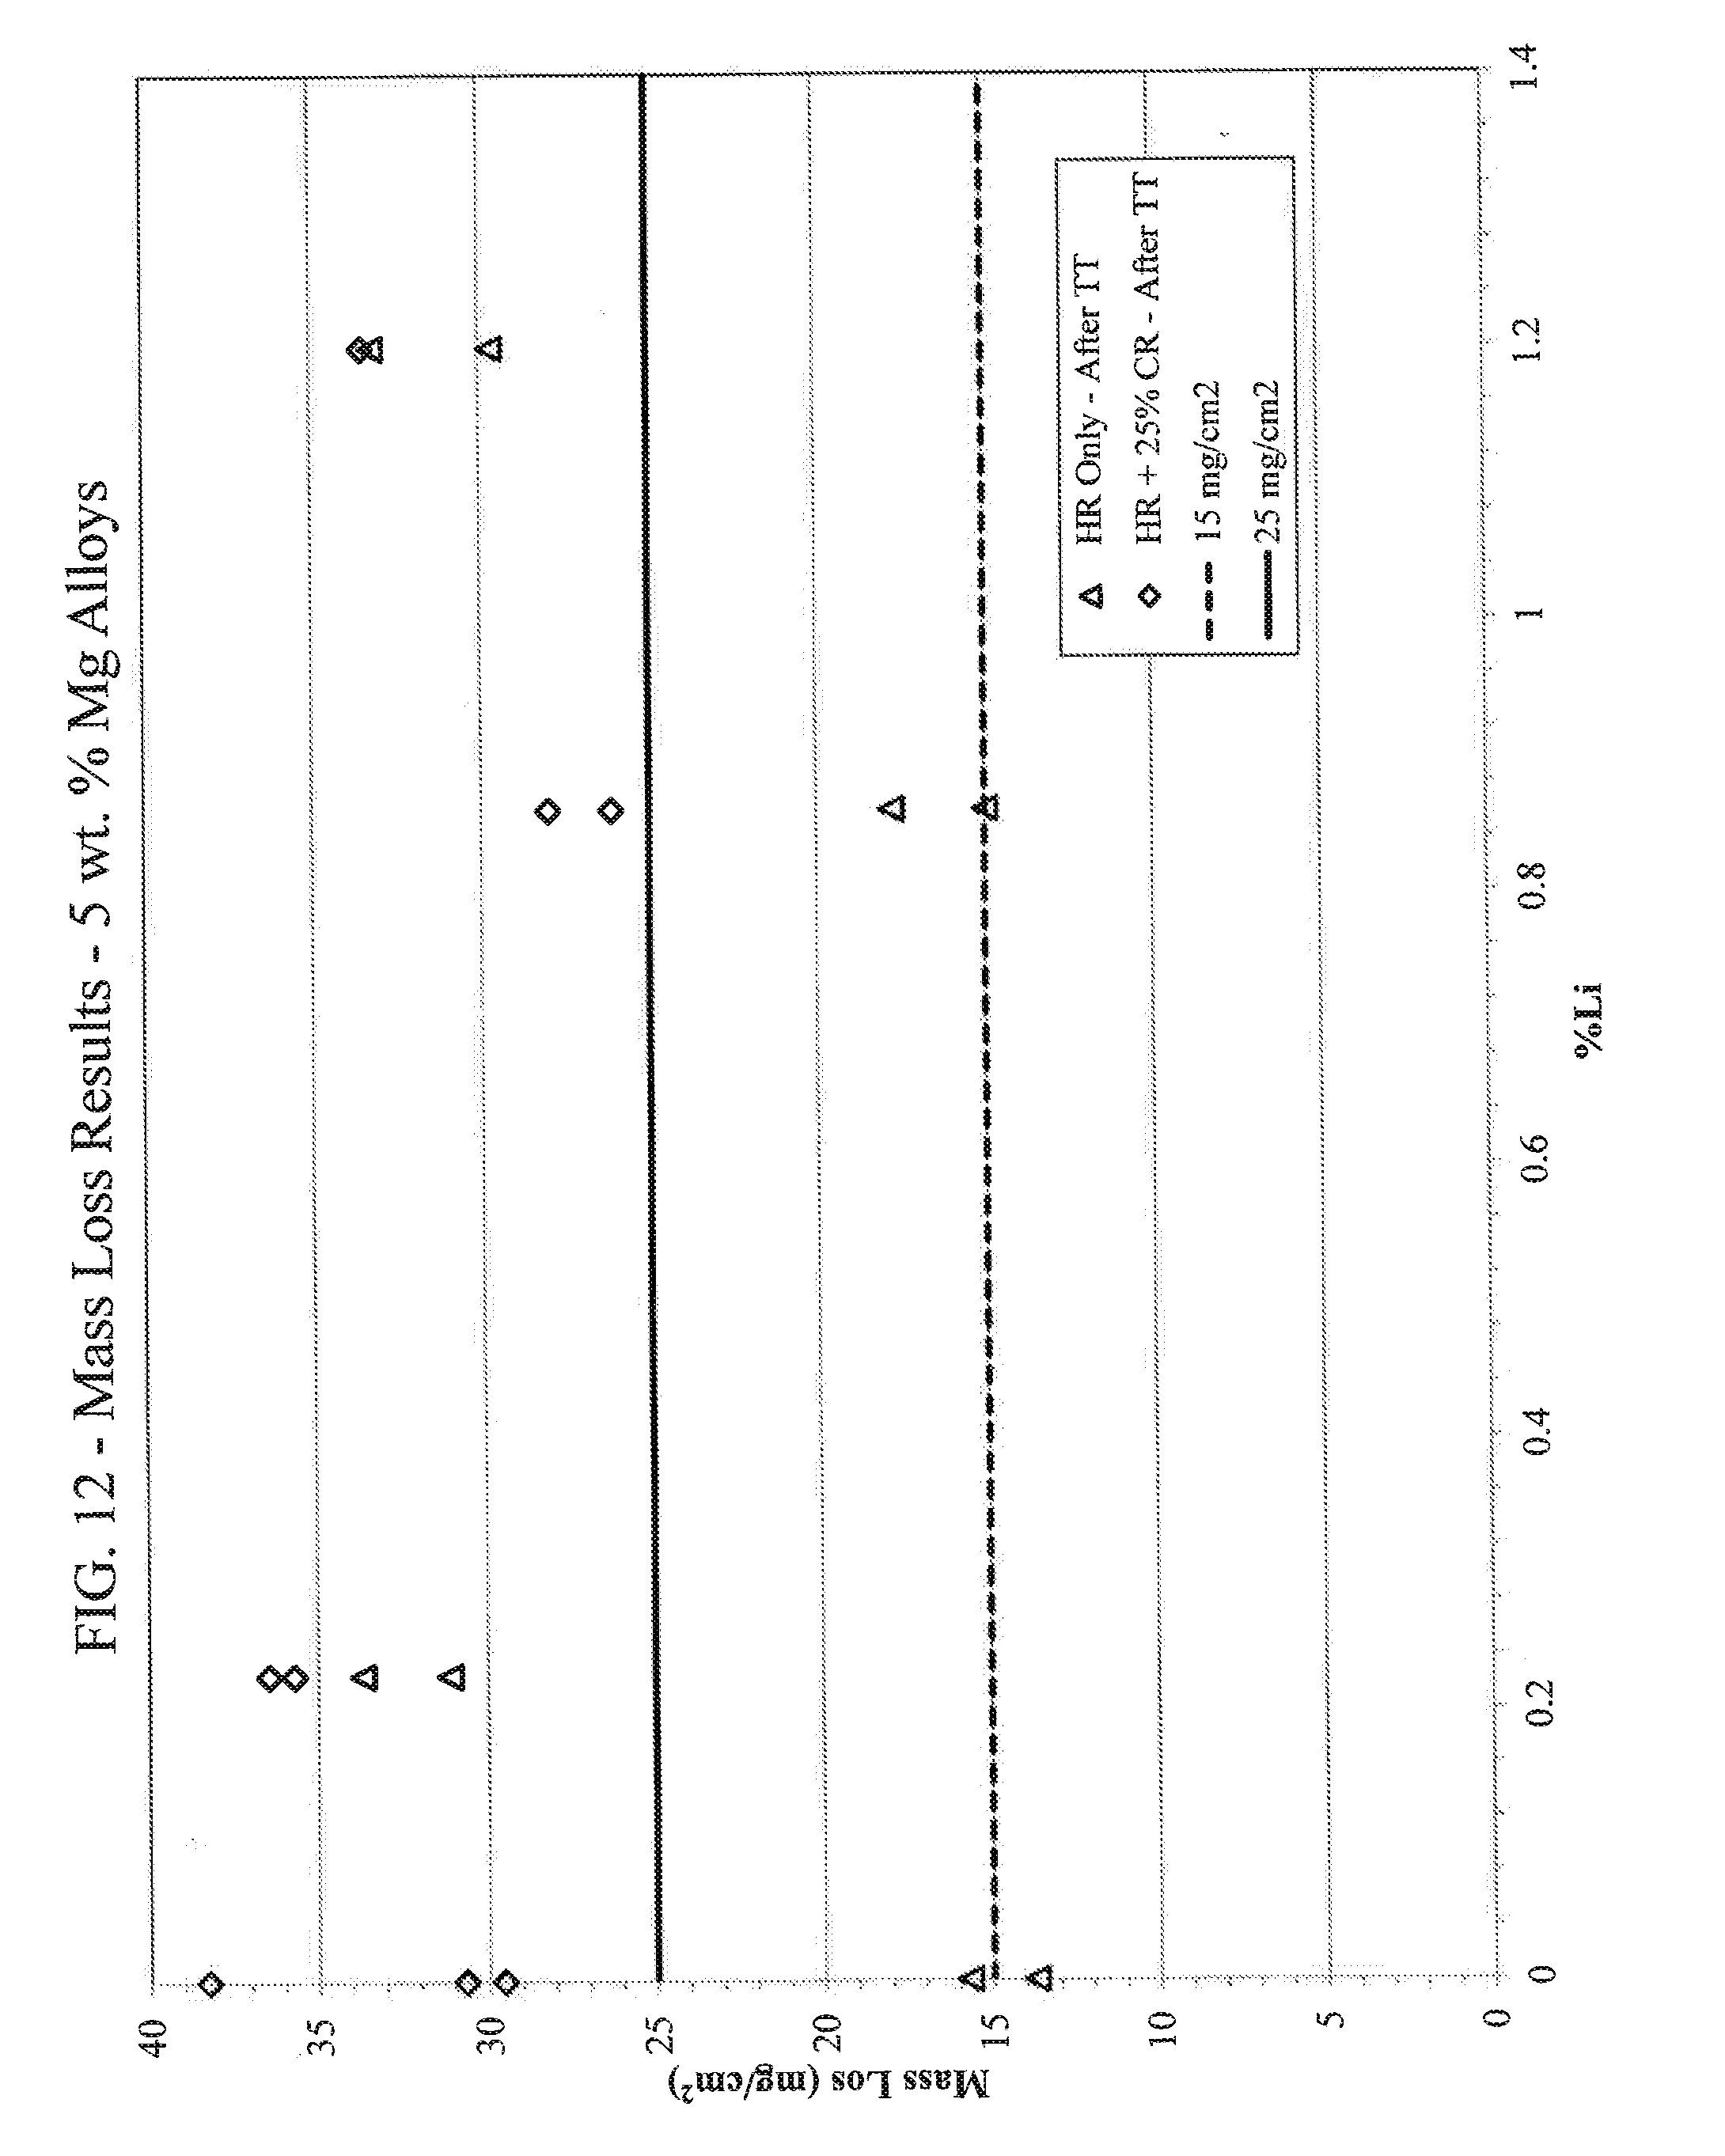
[0040] As shown in FIG. 10, all alloys realize low (good) mass loss prior to thermal exposure realizing less than 15 mg/cm.sup.2 mass loss during the ASTM G67 test. However, after thermal exposure, the about 3 wt. % Mg alloys realize low mass loss, but many of Alloys 6-12 with magnesium realize high mass loss (See, FIG. 11). FIG. 12 illustrates mass loss as a function of lithium for high magnesium alloys. As shown above, the higher magnesium alloys also realize worse exfoliation resistance.
Example 2
[0041] Fourteen book mold ingots were produced, the compositions of which are provided in Table 8, below (all values in weight percent).
TABLE-US-00008 TABLE 8 Example 2 Alloy Compositions Alloy Mg Li Zn Cu Ag 13 4.42 2.01 0.96 0.35 0.24 14 4.33 2.09 1.87 0.35 0.23 15 4.53 2.13 0.97 0.95 0.24 16 4.48 2.18 1.92 0.95 0.24 17 4.41 2.03 0.97 0.35 0.65 18 4.38 2.04 1.90 0.36 0.65 19 4.41 2.06 0.98 0.95 0.66 20 4.36 2.12 1.89 0.89 0.62 21 4.37 2.08 1.44 0.65 0.44 22 4.31 2.22 2.82 0.64 0.43 23 4.43 2.16 1.44 1.85 0.45 24 4.45 2.18 1.48 0.68 0.91 25 4.45 2.06 1.45 0.67 0.45 26 4.40 2.13 1.45 0.67 0.44
[0042] Unless otherwise indicated, all alloys contained the listed elements, from about 0.10 to 0.012 wt. % Zr, not more than about 0.03 wt. % Fe, not more than 0.04 wt. % Si, about 0.02 wt. % Mn, about 0.02 wt. % Ti, the balance being aluminum and other elements, where the other elements did not exceed more than 0.05 wt. % each, and not more than 0.15 wt. % total of the other elements. Alloy 25 contained about 0.24 wt. % Si. Alloy 26 contained about 0.87 wt. % Si.
[0043] The alloys were cast as approximately 2.875 inch (ST).times.4.75 inch (LT).times.17 inch (L) ingots that were scalped to about 2 inches thick, and then homogenized. After homogenization, each ingot was hot rolled to a gauge of about 0.25 inch, and then cold rolled about 25% (reduced in thickness by 25%) to a final gauge of about 0.1875 inch. Tensile yield strength and corrosion resistance properties were then tested, the results of which are provided in Tables 9a-9b, below. Tensile yield strength properties were measured in accordance with ASTM E8 and B557--all test values relative to the longitudinal (L) direction, unless otherwise indicated. Corrosion resistance was tested in accordance with ASTM G66 (exfoliation resistance) and G67 (mass loss)--the alloys were tested for corrosion resistance before and after exposure to a temperature of about 100.degree. C. for about 1 week.
TABLE-US-00009 TABLE 9a Mechanical Properties of Example 2 Alloys Alloy TYS (ksi) UTS (ksi) Elong. (%) 13 59.2 66.0 6.4 14 60.1 65.7 3.9 15 55.6 62.1 5.2 16 57.3 62.0 5.2 17 64.3 68.9 3.7 18 59.4 64.2 4.5 19 54.2 59.5 5.9 20 52.9 59.4 4.6 21 55.7 61.8 7.1 22 55.3 60.2 4.8 23 53.2 59.3 6.1 24 55.9 60.6 3.5 25 56.0 60.2 5.5 26 53.6 58.1 4.6
TABLE-US-00010 TABLE 9b Corrosion Resistance Properties of Example 2 Alloys Before Thermal Exposure After Thermal Exposure G67 Mass G66 G66 G67 Mass G66 G66 Loss Rating Rating @ Loss Rating Rating @ Alloy (mg/cm.sup.2) @ T/10 Surface (mg/cm.sup.2) @ T/10 Surface 13 1.64 PC PB 21.66 ED ED 14 2.26 PC PB 25.62 ED ED 15 2.43 PC PA 23.36 ED ED 16 2.48 PC PC 28.80 ED ED 17 2.14 PC PC 31.19 ED ED 18 2.72 PC PB 32.85 ED ED 19 3.71 PC PA 23.99 ED EC 20 2.99 PC EC 34.99 ED ED 21 2.48 PC PC 29.38 ED ED 22 3.31 PC PC 43.34 ED ED 23 4.09 PC PC 32.86 ED ED 24 3.41 PC PA 28.25 ED EC 25 2.40 PC PA 25.59 ED ED 26 3.41 PC PA 17.45 PC EC
[0044] As shown in FIG. 13, the strongest alloy contained about 1.0 wt. % Zn, 0.35 wt. % Cu and 0.65 wt. % Ag. In low silver alloys (.about.0.25 wt. % Ag), increasing copper from about 0.35 to 0.95 wt. % and/or increasing zinc did appear to benefit strength. In medium silver alloys (.about.0.45 wt. % Ag), increasing copper from about 0.65 to 1.85 wt. % decreased strength, and increasing zinc from about 1.45 to 2.82 wt. % had little effect on strength. In moderately-high silver alloys (.about.0.65 wt. % Ag), increasing copper from about 0.35 to about 0.90 wt. % decreased strength, and increasing zinc also decreased strength. Increasing silver from about 0.45 to 0.91 wt. % did not appear to materially affect strength. Increasing silicon from about 0.04 wt. % to 0.24 wt. % also did not appear to materially affect strength. Increasing silicon to about 0.89 wt. %, however, did affect strength.
[0045] Regarding ductility, all of the alloys have somewhat low elongation, indicating that less than 25% cold work may be required to achieve better ductility.
[0046] Regarding corrosion resistance, most of the alloys did not pass the mass loss test, all achieving a mass loss of more than 15 mg/cm.sup.2, and often a mass loss of more than 25 mg/cm.sup.2. Increasing the silicon level did appear to help with mass loss.
Example 3
[0047] Twenty-three book mold ingots were produced, the compositions of which are provided in Table 9, below (all values in weight percent).
TABLE-US-00011 TABLE 10 Example 1 Alloy Compositions Alloy Mg Li Mn Cu Zn 27 2.2 1.1 0.55 0.05 -- 28 2.5 1.0 0.58 -- -- 29 3.3 1.0 0.54 -- -- 30 3.5 1.1 0.56 -- -- 31 4.1 1.1 0.57 -- -- 32 2.9 1.1 0.54 -- -- 33 3.1 1.0 0.29 -- -- 34 3.2 1.1 -- 0.01 -- 35 3.0 1.0 1.10 -- -- 36 3.0 1.0 1.60 -- -- 37 3.0 1.0 0.56 -- 0.10 38 3.0 1.1 0.56 -- 0.24 39 2.9 1.1 0.57 -- 0.51 40 3.0 1.1 0.56 -- 0.97 41 3.0 1.1 0.56 -- 1.90 42 2.9 1.0 0.57 0.14 0.02 43 3.1 1.1 0.56 0.29 -- 44 2.9 1.1 0.56 0.48 -- 45 3.1 1.0 0.56 0.25 0.50 46 2.8 1.1 0.56 -- -- 47 2.94 -- 0.54 -- -- 48 2.9 0.50 0.57 -- -- 49 2.8 1.00 0.57 -- -- 50 2.9 1.60 0.57 -- --
Unless otherwise indicated, all alloys contained the listed elements, from about 0.10 to 0.14 wt. % Zr, not more than about 0.04 wt. % Fe, not more than 0.08 wt. % Si, the balance being aluminum and other elements, where the other elements did not exceed more than 0.05 wt. % each, and not more than 0.15 wt. % total of the other elements. Alloy 46 contained about 0.09 wt. % Zr, about 0.10 wt. % Fe and about 0.14 wt. % Si.
[0048] The alloys were cast as 2.875 inch (ST).times.4.75 inch (LT).times.17 inch (L) ingots that were scalped to 2 inches thick and then homogenized. After homogenization, each ingot was hot rolled to a gauge of about 0.25 inch (Alloy 36 could not be rolled due to too much manganese). Part of these hot rolled pieces were then cold rolled to a gauge of about 0.1875 inch (about 25% reduction in thickness). Other parts of the hot rolled pieces were stretched about 2% for flatness. The mechanical properties and corrosion resistance properties of the hot rolled and cold rolled materials were then tested, the results of which are provided in Tables 11-14, below. Strength and elongation properties were measured in accordance with ASTM E8 and B557--all test values relative to the longitudinal (L) direction, unless otherwise indicated. Corrosion resistance was tested in accordance with ASTM G67 (mass loss)--the alloys were tested for corrosion resistance before and after exposure to a temperature of about 100.degree. C. for about 1 week.
TABLE-US-00012 TABLE 11 Mechanical Properties of Hot Rolled + 2% Stretch Alloys Alloy TYS (ksi) UTS (ksi) Elong. (%) 27 38.3 41.3 13.5 28 38.1 42.6 15.0 29 45.5 15.0 15.0 30 40.3 46.7 15.5 31 40.7 47.4 14.5 32 39.1 43.6 14.0 33 37.3 41.3 16.0 34 35.7 40.5 16.0 35 42.6 47.9 13.0 37 39.4 44.7 15.5 38 39.4 44.9 15.5 39 39.7 45.0 15.0 40 39.9 45.5 15.5 41 42.6 49.3 15.0 42 41.7 46.3 15.0 43 44.9 50.4 13.0 44 49.4 53.3 10.0 45 42.5 48.4 15.0 46 40.1 44.8 15.5 47 37.0 41.0 18.5 48 38.0 42.7 15.0 49 40.3 44.7 15.5 50 44.5 49.9 14.0
TABLE-US-00013 TABLE 12 Mechanical Properties of Hot Rolled + Cold Rolled Alloys Alloy TYS (ksi) UTS (ksi) Elong. (%) 27 45.5 46.7 7.0 28 47.4 49.1 8.5 29 45.3 53.6 8.0 30 51.4 55.7 8.0 31 52.2 57.2 9.0 32 51.3 52.2 8.0 33 46.9 49.4 10.0 34 43.0 45.4 9.5 35 51.9 56.7 6.0 37 48.5 52.0 9.0 38 49.2 52.8 8.0 39 49.0 52.4 8.0 40 49.6 53.4 8.0 41 48.5 56.0 7.5 42 44.5 53.3 8.0 43 55.9 56.9 8.0 44 57.5 59.7 7.5 45 52.7 55.0 8.5 46 50.5 51.7 7.0 47 43.7 47.1 10.5 48 45.2 48.4 8.5 49 48.9 51.2 8.5 50 57.9 59.6 7.5
TABLE-US-00014 TABLE 13 Corrosion Resistance Results - Hot Rolled (HR) Alloys Before Thermal After Thermal Exposure Exposure Alloy G67 Mass Loss (mg/cm.sup.2) 27 1.29 1.57 28 1.25 2.48 29 1.32 8.96 30 1.66 17.2 31 1.59 30.23 32 1.28 5.34 33 1.37 6.29 34 1.51 9.68 35 1.49 8.12 37 1.62 11.8 38 1.73 10.39 39 1.53 2.9 40 1.72 2.52 41 1.87 2.61 42 1.18 3.5 43 1.17 3.41 44 1.5 3.51 45 1.29 3.3 46 1.77 6.68 47 1.46 2.24 48 1.72 3.28 49 1.47 6.71 50 1.73 3.97
TABLE-US-00015 TABLE 14 Corrosion Resistance Results - Hot Rolled (HR) + 25% CR Alloys Before Thermal After Thermal Exposure Exposure Alloy G67 Mass Loss (mg/cm.sup.2) 27 1.28 1.81 28 1.2 2.79 29 1.35 11.26 30 1.63 18.2 31 1.72 32.45 32 1.31 8.77 33 1.3 9.97 34 1.25 10.23 35 1.76 14.96 37 1.64 12.88 38 1.72 12.22 39 1.55 4.11 40 1.63 3.14 41 1.92 2.67 42 1.22 5.17 43 1.31 5.96 44 1.46 4.91 45 1.28 5.13 46 1.82 9.32 47 1.46 2.57 48 1.57 4.58 49 1.59 11.51 50 1.63 3.97
[0049] As shown in FIGS. 14-18, increasing levels of Mg, Li, Mn and Cu resulted in increased strength. Increasing zinc may increase strength in hot rolled only alloys. However, as shown in FIG. 19, poor corrosion resistance is realized in alloys having more than about 4.0 wt. % Mg, indicating that the alloys should include not greater than 3.9 wt. % Mg for good corrosion resistance. As shown in FIG. 20, higher levels of copper tend to improve corrosion. As shown in FIG. 21, higher levels of zinc (e.g., at or above 0.4 wt. % Zn) also tend to improve corrosion resistance. Manganese above about 1.0 wt. % tends to degrade corrosion resistance.
* * * * *
D00001
D00002
D00003
D00004
D00005
D00006
D00007
D00008
D00009
D00010
D00011
D00012
D00013
D00014

D00015

D00016
D00017

D00018
D00019
D00020

D00021

XML
uspto.report is an independent third-party trademark research tool that is not affiliated, endorsed, or sponsored by the United States Patent and Trademark Office (USPTO) or any other governmental organization. The information provided by uspto.report is based on publicly available data at the time of writing and is intended for informational purposes only.
While we strive to provide accurate and up-to-date information, we do not guarantee the accuracy, completeness, reliability, or suitability of the information displayed on this site. The use of this site is at your own risk. Any reliance you place on such information is therefore strictly at your own risk.
All official trademark data, including owner information, should be verified by visiting the official USPTO website at www.uspto.gov. This site is not intended to replace professional legal advice and should not be used as a substitute for consulting with a legal professional who is knowledgeable about trademark law.