System and Method for Processing Casino Table Games Yield Management Data
GURURAJAN; Prem ; et al.
U.S. patent application number 13/192238 was filed with the patent office on 2012-12-27 for system and method for processing casino table games yield management data. This patent application is currently assigned to TANGAM TECHNOLOGIES INC.. Invention is credited to Patrick Hermann DENIS, Maulin GANDHI, Prem GURURAJAN, Jason Robert JACKSON, Christopher TAYLOR.
| Application Number | 20120329537 13/192238 |
| Document ID | / |
| Family ID | 47362353 |
| Filed Date | 2012-12-27 |


View All Diagrams
| United States Patent Application | 20120329537 |
| Kind Code | A1 |
| GURURAJAN; Prem ; et al. | December 27, 2012 |
System and Method for Processing Casino Table Games Yield Management Data
Abstract
A system is provided for processing yield management and casino table data. The system provides a graphical presentation of each games table spread, and where the game is overspread or under spread, and by how much. The table spread opportunities can also be aggregated to determine whether what is observed is a trend so that the operator can act on that trend to remedy it. An interactive graphical representation of this data combined with an ability to drill down to the underlying data to verify trends makes it possible to find opportunities to close games, open games and add or remove tables to the gaming floor so as to improve profitability. Displaying graphically how pricing of tables could be changed is particularly useful so that managers can know where opportunities exist to change pricing in order to improve profitability. An ability to drill down to a floor view makes it possible for the manager to verify the casino floor and visually see how the players are seated on tables. Displaying graphically the time periods when an opportunity to price a game differently than the current pricing to improve profitability also helps the manager understand when this happens, how long it lasts and at which price points. Displaying graphically the time periods when an unmet demand exists also helps the manager understand when this happens, how long it lasts and for which price points.
| Inventors: | GURURAJAN; Prem; (Kitchener, CA) ; GANDHI; Maulin; (Kitchener, CA) ; DENIS; Patrick Hermann; (Kitchener, CA) ; JACKSON; Jason Robert; (Hamilton, CA) ; TAYLOR; Christopher; (Elmira, CA) |
| Assignee: | TANGAM TECHNOLOGIES INC. Waterloo CA |
| Family ID: | 47362353 |
| Appl. No.: | 13/192238 |
| Filed: | July 27, 2011 |
Related U.S. Patent Documents
| Application Number | Filing Date | Patent Number | ||
|---|---|---|---|---|
| 61499434 | Jun 21, 2011 | |||
| Current U.S. Class: | 463/1 ; 463/43 |
| Current CPC Class: | G07F 17/322 20130101; G07F 17/3234 20130101 |
| Class at Publication: | 463/1 ; 463/43 |
| International Class: | A63F 9/24 20060101 A63F009/24 |
Claims
1. A method, in a casino table game yield management data processing system, of providing table spread data for a casino environment, the method comprising: determining an actual number of open tables associated with a first game type for each of a plurality of time intervals; determining an ideal number of open tables at each of the time intervals; displaying a timeline comprising the time intervals, the timeline comprising, in association with each time interval, a first visual element indicative of the actual number of open tables during that time interval, and a second visual element indicative of whether the ideal number of open tables is above or below the actual number of open tables; and enabling further detail corresponding to a desired time interval to be displayed upon detecting selection of a corresponding portion of the timeline.
2. The method of claim 1, wherein the actual number of open tables and the ideal number of open tables are each aggregated over a plurality of time periods, wherein each time period comprises the plurality of time intervals.
3. The method of claim 2, further comprising enabling the timeline to correspond to either a single time period or the aggregate of the plurality of time periods.
4. The method of claim 2, further comprising enabling selection or de-selection of at least one time period to be included in the aggregation.
5. The method of claim 2, wherein the actual number of open tables and the ideal number of open tables are each aggregated to correspond to any one of an average, median, mean, weighted average, and percentile.
6. The method of claim 1, further comprising displaying a third visual element in association with at least one of the time intervals indicative of how pricing at particular open tables could be changed.
7. The method of claim 6, wherein the third visual element quantifies an opportunity to improve profitability during the respective time interval.
8. The method of claim 1, further comprising displaying a third visual element in association with at least one of the time intervals indicative of unmet customer demand at a particular price point.
9. The method of claim 1, wherein the ideal number of open tables is determined using a different optimal occupancy target for any one or more of different price points and different game types.
10. The method of claim 1, wherein the further detail is displayed using a third visual element in association with the desired time interval, the further detail comprising any one or more of player occupancy, number of players, number of seats occupied, number of open tables, and table occupancy.
11. The method according to claim 1, wherein upon detecting selection of the corresponding portion of the timeline, the further detail is displayed using a third visual element providing a floor view comprising data associated with at least one open table in an area of the gaming environment.
12. The method of claim 11, wherein the floor view displays any one or more of a visual depiction of each open table, players, and bets placed by the players.
13. The method of claim 1, wherein the first visual element provides a data point on a line graph at a respective time interval.
14. The method of claim 1, wherein the second visual element is varied to be indicative of the ideal number of open tables being either above the actual number of open tables or below the actual number of open tables.
15. The method of claim 14, wherein a threshold with respect to the ideal number of open tables is used to trigger variation of the second visual element.
16. A computer readable medium comprising computer executable instructions that when executed by a casino table game yield management data processing system, perform operations comprising: determining an actual number of open tables associated with a first game type for each of a plurality of time intervals; determining an ideal number of open tables at each of the time intervals; displaying a timeline comprising the time intervals, the timeline comprising, in association with each time interval, a first visual element indicative of the actual number of open tables during that time interval, and a second visual element indicative of whether the ideal number of open tables is above or below the actual number of open tables; and enabling further detail corresponding to a desired time interval to be displayed upon detecting selection of a corresponding portion of the timeline.
17. A casino table game yield management data processing system comprising the computer readable medium of claim 16.
18. A method, in a casino table game yield management data processing system, of providing table spread data for a casino environment, the method comprising: determining an actual number of open tables associated with a game type for each of a plurality of time intervals; determining an ideal number of open tables for the game type at each of the time intervals; and displaying a plurality of visual elements in a grid comparing the game type against the plurality of time intervals, each visual element being indicative of whether the ideal number of tables is above or below the actual number of tables.
19. The method of claim 18, wherein the ideal number of open tables is determined using a different optimal occupancy target for any one or more of different price points and different game types.
20. The method of claim 18, wherein the game type is arranged in the grid grouped by at least one time period, wherein the time period comprises the plurality of time intervals.
21. The method of claim 20, wherein the game type is arranged in the grid displayed in multiple instances, each instance being associated with one of a plurality of time periods, wherein the time period comprises the plurality of time intervals.
22. The method of claim 18, wherein the visual elements are varied in at least one characteristic to indicate whether the ideal number of open tables is above or below the actual number of open tables.
23. The method of claim 22, wherein the characteristic comprises any one or more of a numeric value, a colour, a shade, and a shape.
24. The method of claim 18, further comprising, upon detecting selection of one of the plurality of visual elements, displaying a timeline comprising the time intervals, the timeline comprising, in association with each time interval, a first visual element indicative of the actual number of open tables during that time interval, and a second visual element indicative of whether the ideal number of open tables is above or below the actual number of open tables.
25. The method of claim 24, wherein the actual number of open tables and the ideal number of open tables are each aggregated over a plurality of time periods, wherein each time period comprises the plurality of time intervals.
26. The method of claim 25, further comprising enabling selection or de-selection of at least one time period to be included in the aggregation.
27. The method of claim 18, wherein the visual elements depict any one or more of the actual number open tables, the ideal number of open tables, and the actual number of open tables being above or below the ideal number of open tables.
28. The method of claim 18, wherein the visual elements depict a duration or frequency that the actual number of open tables is above or below the ideal number of open tables.
29. The method of claim 18, wherein the visual elements depict a numerical currency value that represents any one or more of an improvement in profitability if the ideal number of tables had been opened for each time interval, and a total currency amount of the improvement in profitability if the ideal number of tables had been opened for a plurality of time intervals.
30. The method of claim 18, further comprising enabling further detail corresponding to a desired time interval to be displayed upon detecting selection of a corresponding portion of the grid.
31. The method of claim 30, wherein the further detail is displayed using a second visual element in association with the desired time interval, the further detail comprising any one or more of player occupancy, number of players, number of open tables, and table occupancy.
32. The method according to claim 30, wherein upon detecting selection of the corresponding portion of the grid, the further detail is displayed using a second visual element providing a floor view comprising data associated with at least one open table in an area of the gaming environment.
33. A computer readable medium comprising computer executable instructions that when executed by a casino table game yield management data processing system, perform operations comprising: determining an actual number of open tables associated with a game type for each of a plurality of time intervals; determining an ideal number of open tables for the game type at each of the time intervals; and displaying a plurality of visual elements in a grid comparing the game type against the plurality of time intervals, each visual element being indicative of whether the ideal number of tables is above or below the actual number of tables.
34. A casino table game yield management data processing system comprising the computer readable medium of claims 33.
35-50. (canceled)
Description
[0001] This application claims priority from U.S. Provisional Patent Application No. 61/499,434 filed on Jun. 21, 2011, the entire contents of which are incorporated herein by reference.
TECHNICAL FIELD
[0002] The following relates to systems and methods for processing casino table games yield management data.
DESCRIPTION OF THE RELATED ART
[0003] Yield management (also known as "revenue management") systems are used for determining the most profitable price for products and services in response to market demands. Hotel room pricing, airline tickets and car rentals are but some examples of industries that use yield management data processing systems.
[0004] In general, the conditions that a service or product should meet for yield management to be applicable are: (1) that there are a fixed amount of resources available for sale; (2) that there is a time limit to selling the resources, after which they may cease to be of value; and (3) that different customers are willing to pay different prices for using the same amount of resources.
[0005] In the context of a casino in which gaming tables are operated, it has been suggested that yield management can be applied, see "Table games revenue management: applying survival analysis" by Clayton Peister published in Cornell Hotel and Administration Quarterly, February 2007, and "Table Games: Optimal Utilization", by Andrew MacDonald and Bill Eadington, published in Global Gaming Business, volume 7, number 8, August, 2008.
[0006] These articles teach that occupancy of gaming tables affects the number of plays per hour, namely that more players at a table reduces the number of rounds per hour. While the number of bets made per hour can still be greater at a full table than a table that is half full, revenue can be adversely affected when players betting smaller amounts play at a table with players betting larger amounts. These articles teach that yield management analysis can be used to gain insight into more profitable or optimal utilization of table game resources in a casino.
[0007] Applicant's co-pending U.S. patent application Ser. No. 12/619,671 entitled "Casino Table Game Yield Management System" and published as US 2011/0118007 describes a data processing system that has a minimum bet change recommendation generator. The minimum bet change recommendation generator receives casino table occupancy and player betting data and generates recommendation data based on casino game operations model data and business rule data. A timing filter determines when recommendation data is to be presented to an operator and a quantification filter calculates revenue value data of implementing a minimum bet change and determining whether recommendation data is to be presented to an operator.
[0008] Such a system enables casino managers to balance a variety of player and house considerations when deciding on implementing a gaming table betting minimum change. The above-noted co-pending patent application thus recognizes that gaming table betting minimum change recommendations based on yield management principles are advantageously filtered to respect pre-established house rules defining, for example, betting minimums, and minimum numbers of tables operated at such betting minimums, and target occupancy levels for each betting level. Gaming table betting minimum change recommendations are also advantageously filtered to reduce either the frequency or number of changes implemented, or to avoid changes made in response to short-lived conditions. Moreover, the above-noted patent application recognizes that it is advantageous to calculate a financial value associated with gaming table betting minimum change recommendations to only display recommendations that are above a certain value threshold, or to help managers of casino table games decide on implementing a gaming table betting minimum change or to help managers of casino table games evaluate the financial impact of recommendations that were not implemented.
[0009] It would be a further advantage to visualize yield management data such as that calculated and provided in the system described in US 2011/0118007.
[0010] In the context of a casino, table spread and game mix statistics are also typically of interest to a casino manager. Currently, table spread and game mix statistics are generated and presented using static spreadsheets with some analysis. Current casino managers also strive to ascertain whether or not player segments for a game are being served, in order to improve profitability. Existing tools available to casino managers also lack the ability to provide interactive dashboards to measure or visualize if there was an opportunity to price games differently and further improve profitability.
[0011] Although static spreadsheets and other statistics exist or can be generated for a particular casino, the casino industry currently lacks a comprehensive yield management system, in particular, one that can be used for current or real-time data or on-demand analyses, let alone in a manner that can be understood without specialized knowledge.
[0012] It is an object of the following to address the above-noted disadvantages.
BRIEF DESCRIPTION OF THE DRAWINGS
[0013] Embodiments will now be described by way of example only with reference to the appended drawings wherein:
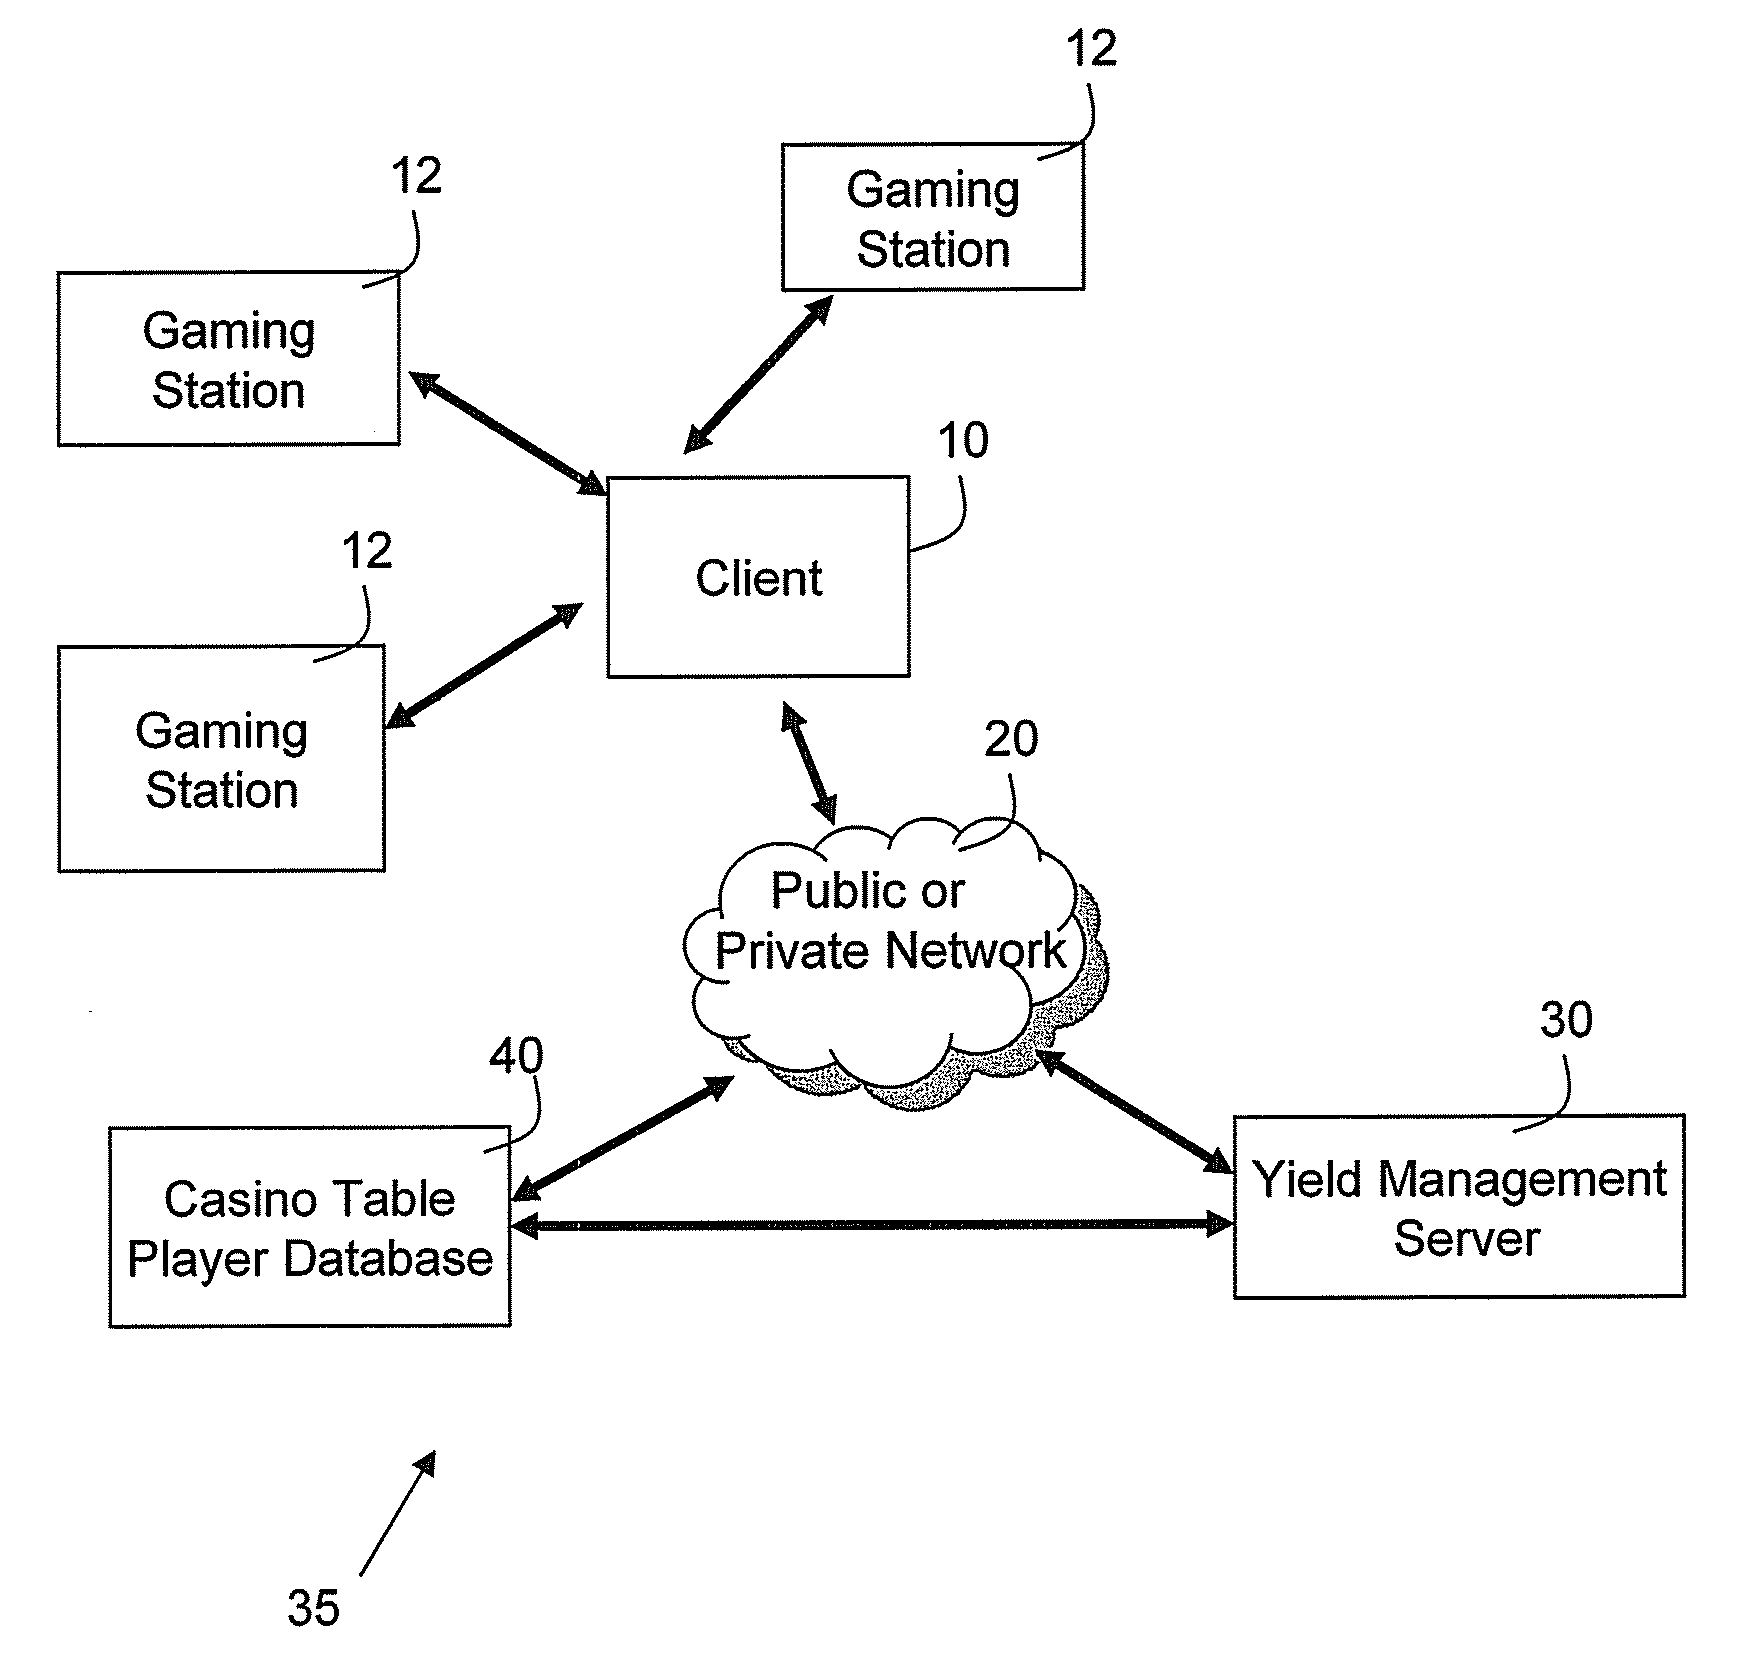
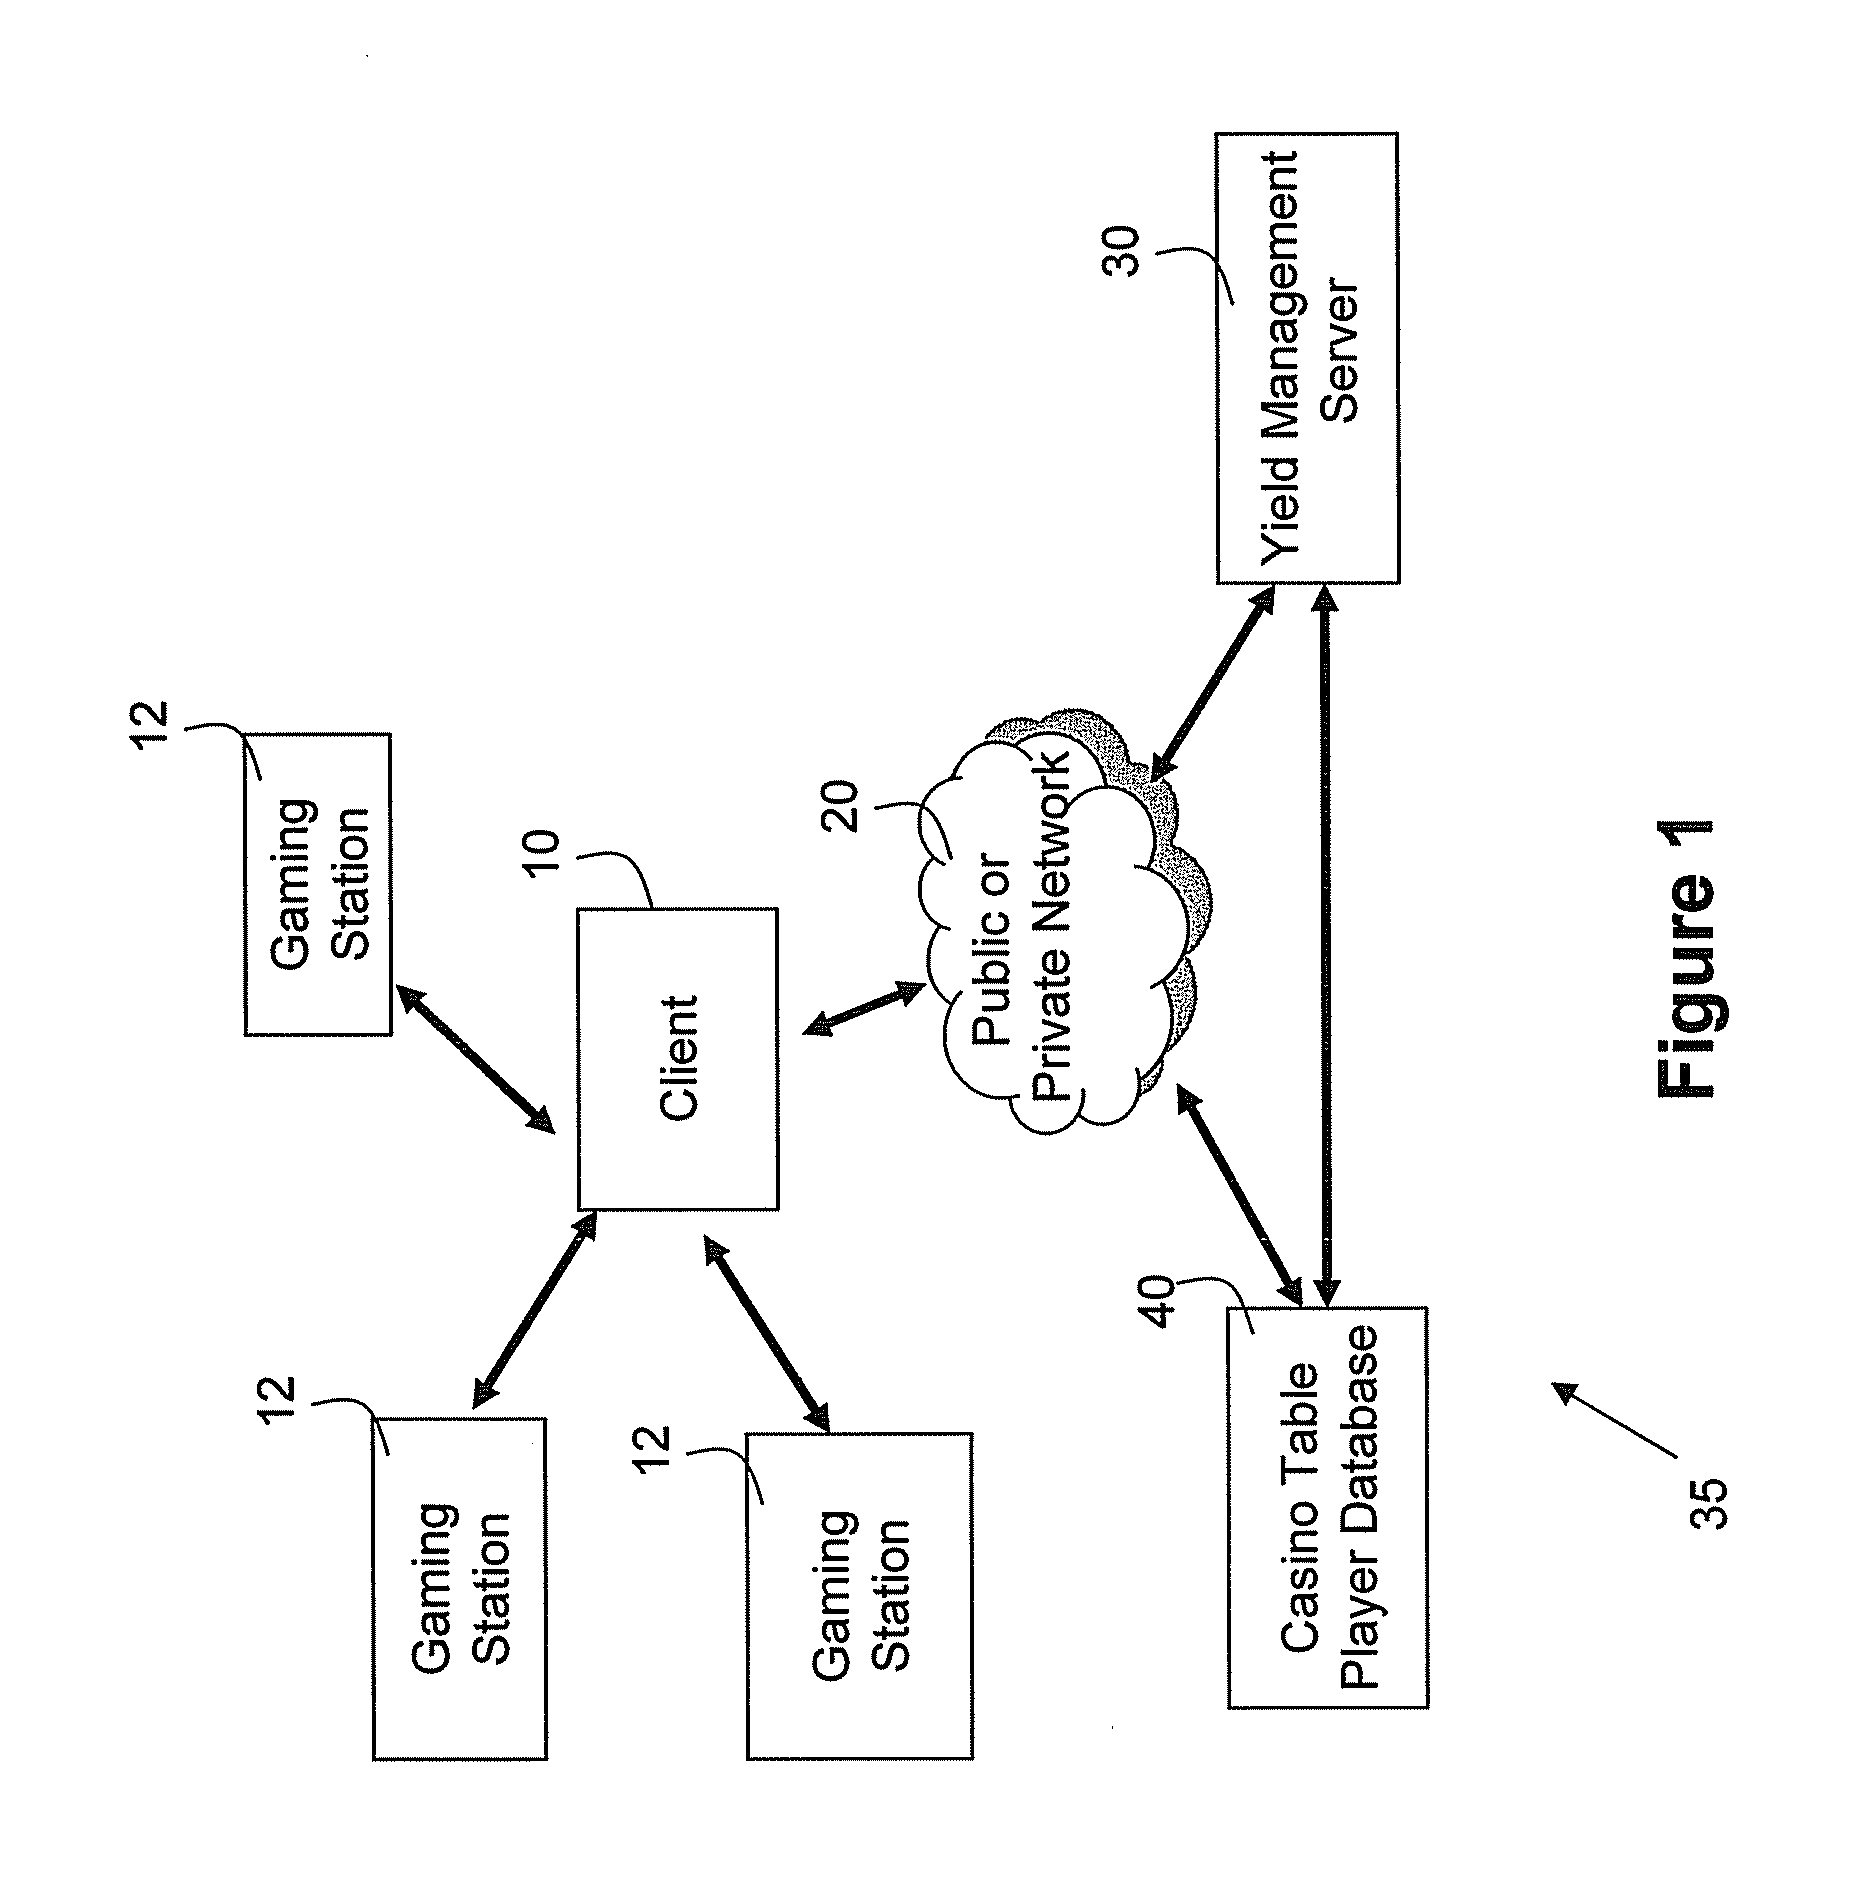
[0014] FIG. 1 is a block diagram illustrating an example casino management system in a networked system.
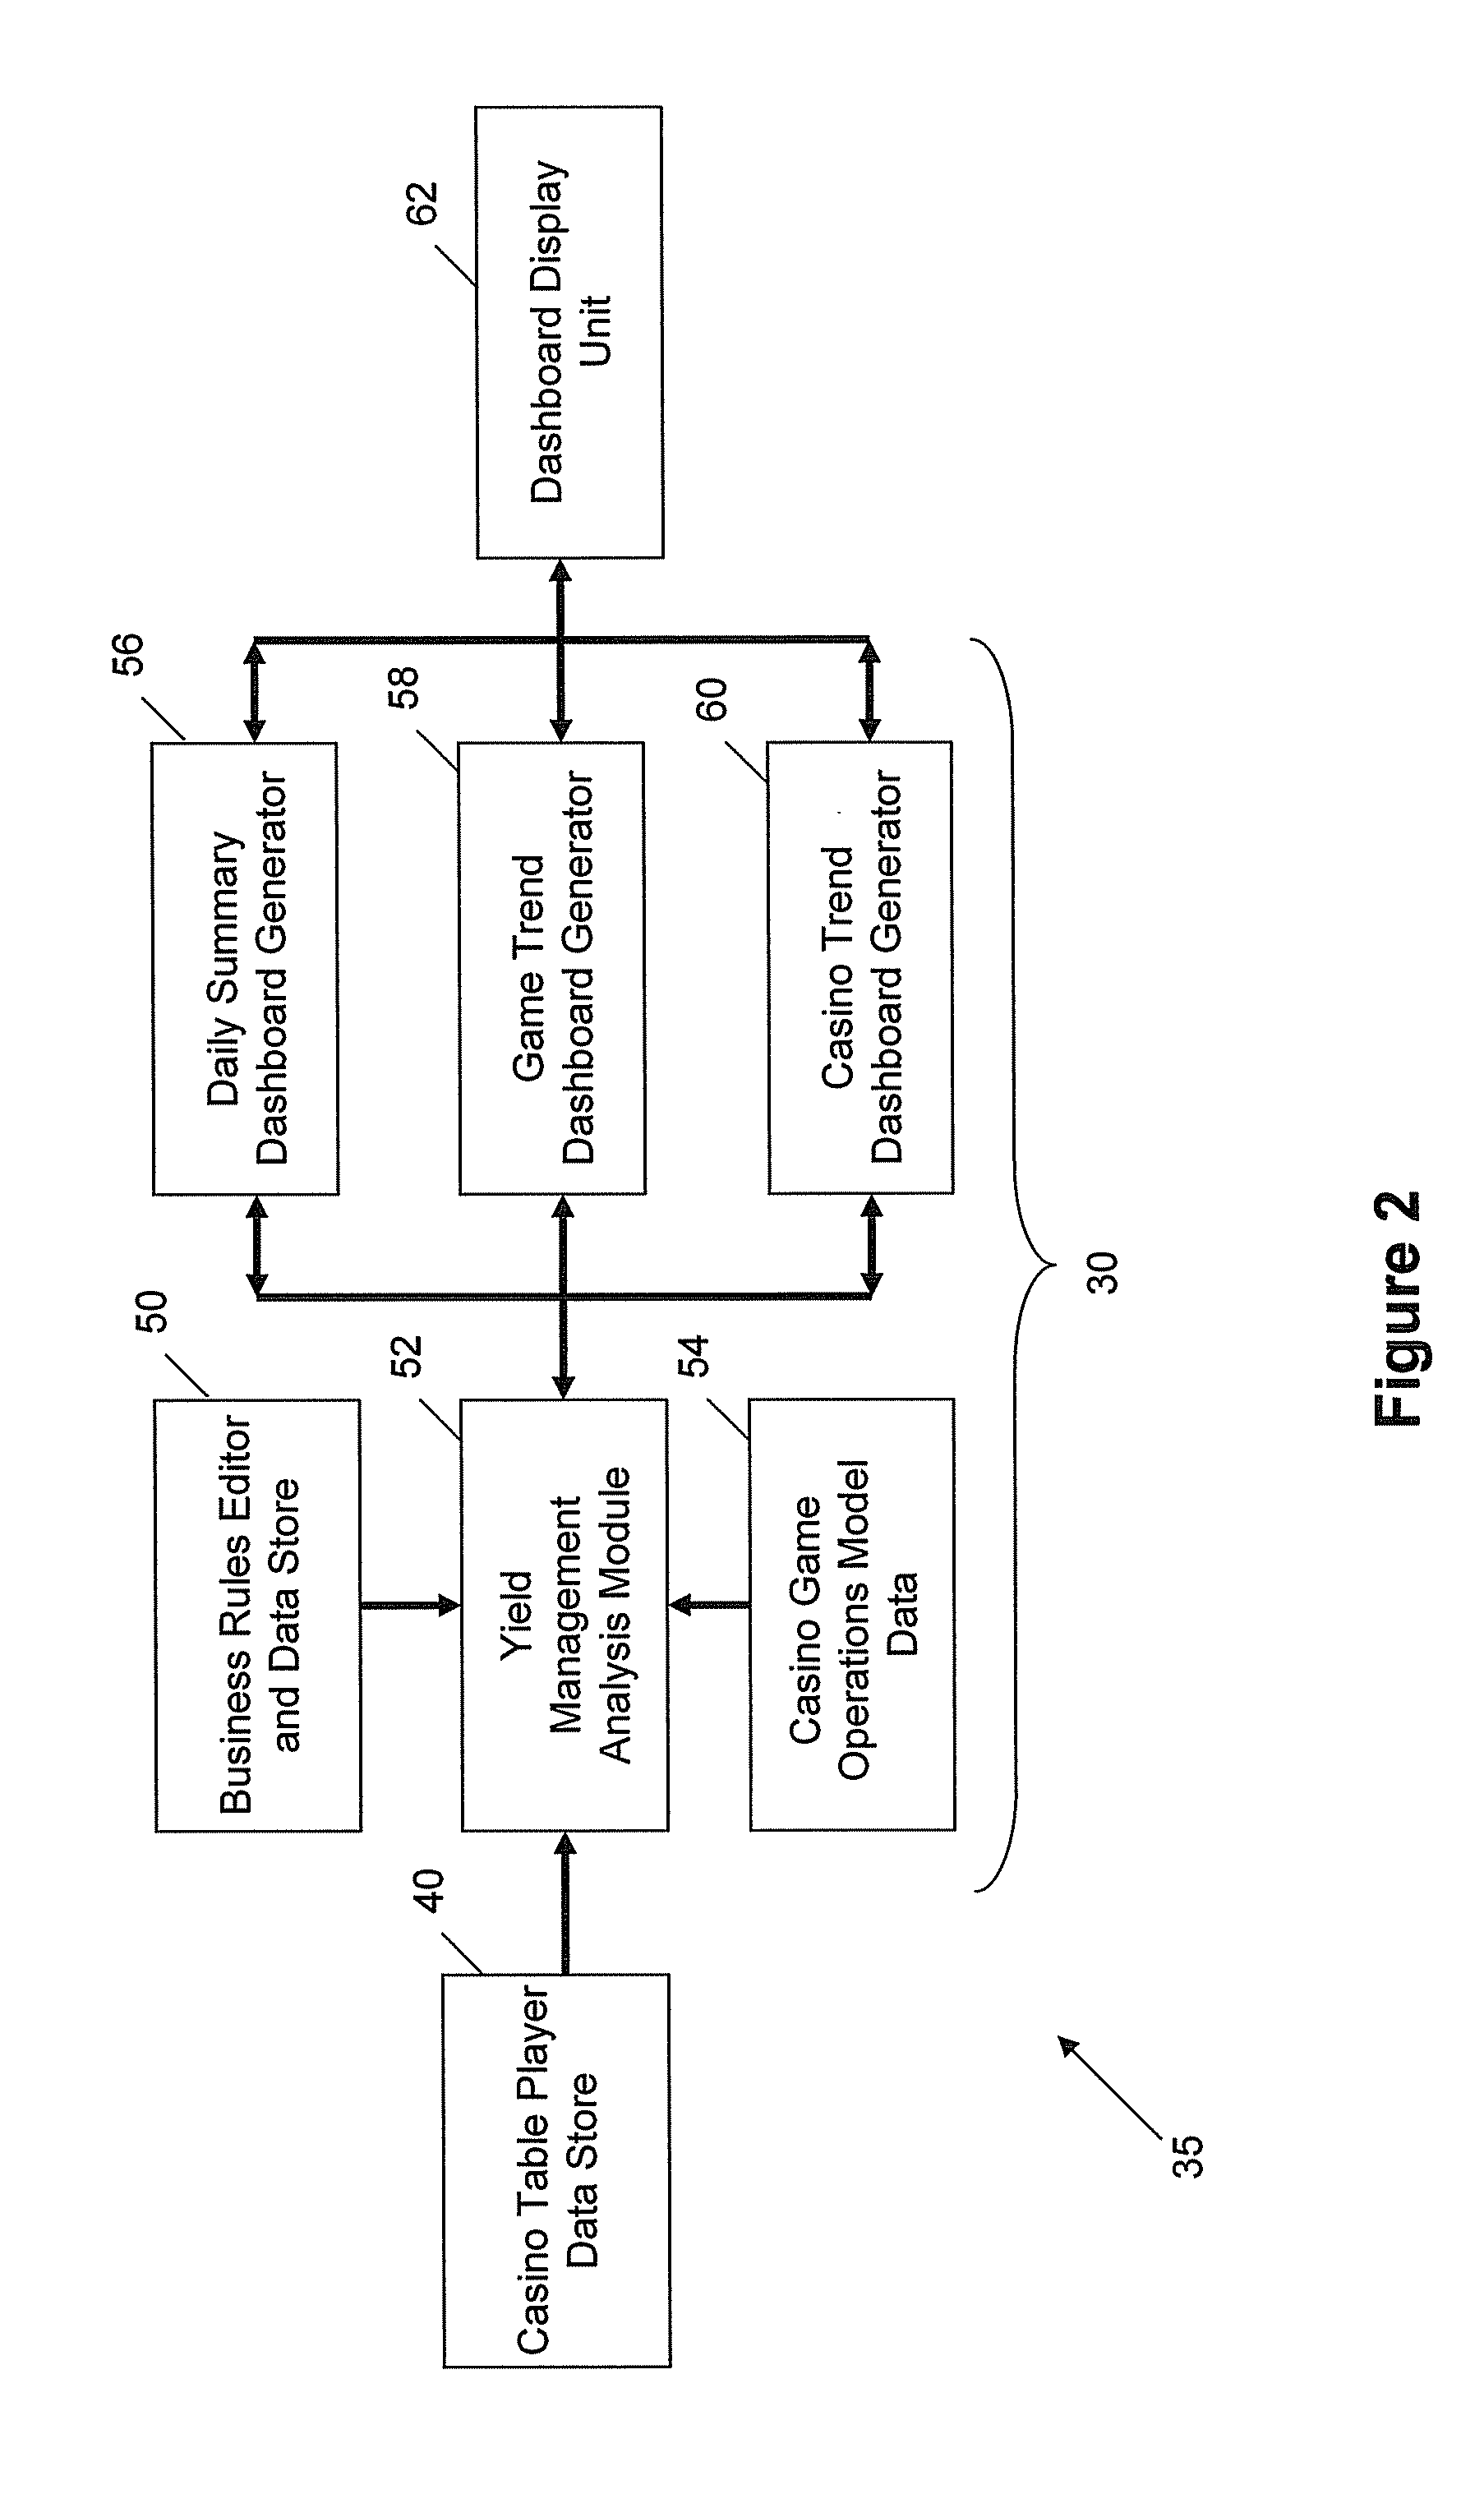
[0015] FIG. 2 is a block diagram illustrating an example of a configuration for the casino management system of FIG. 1.
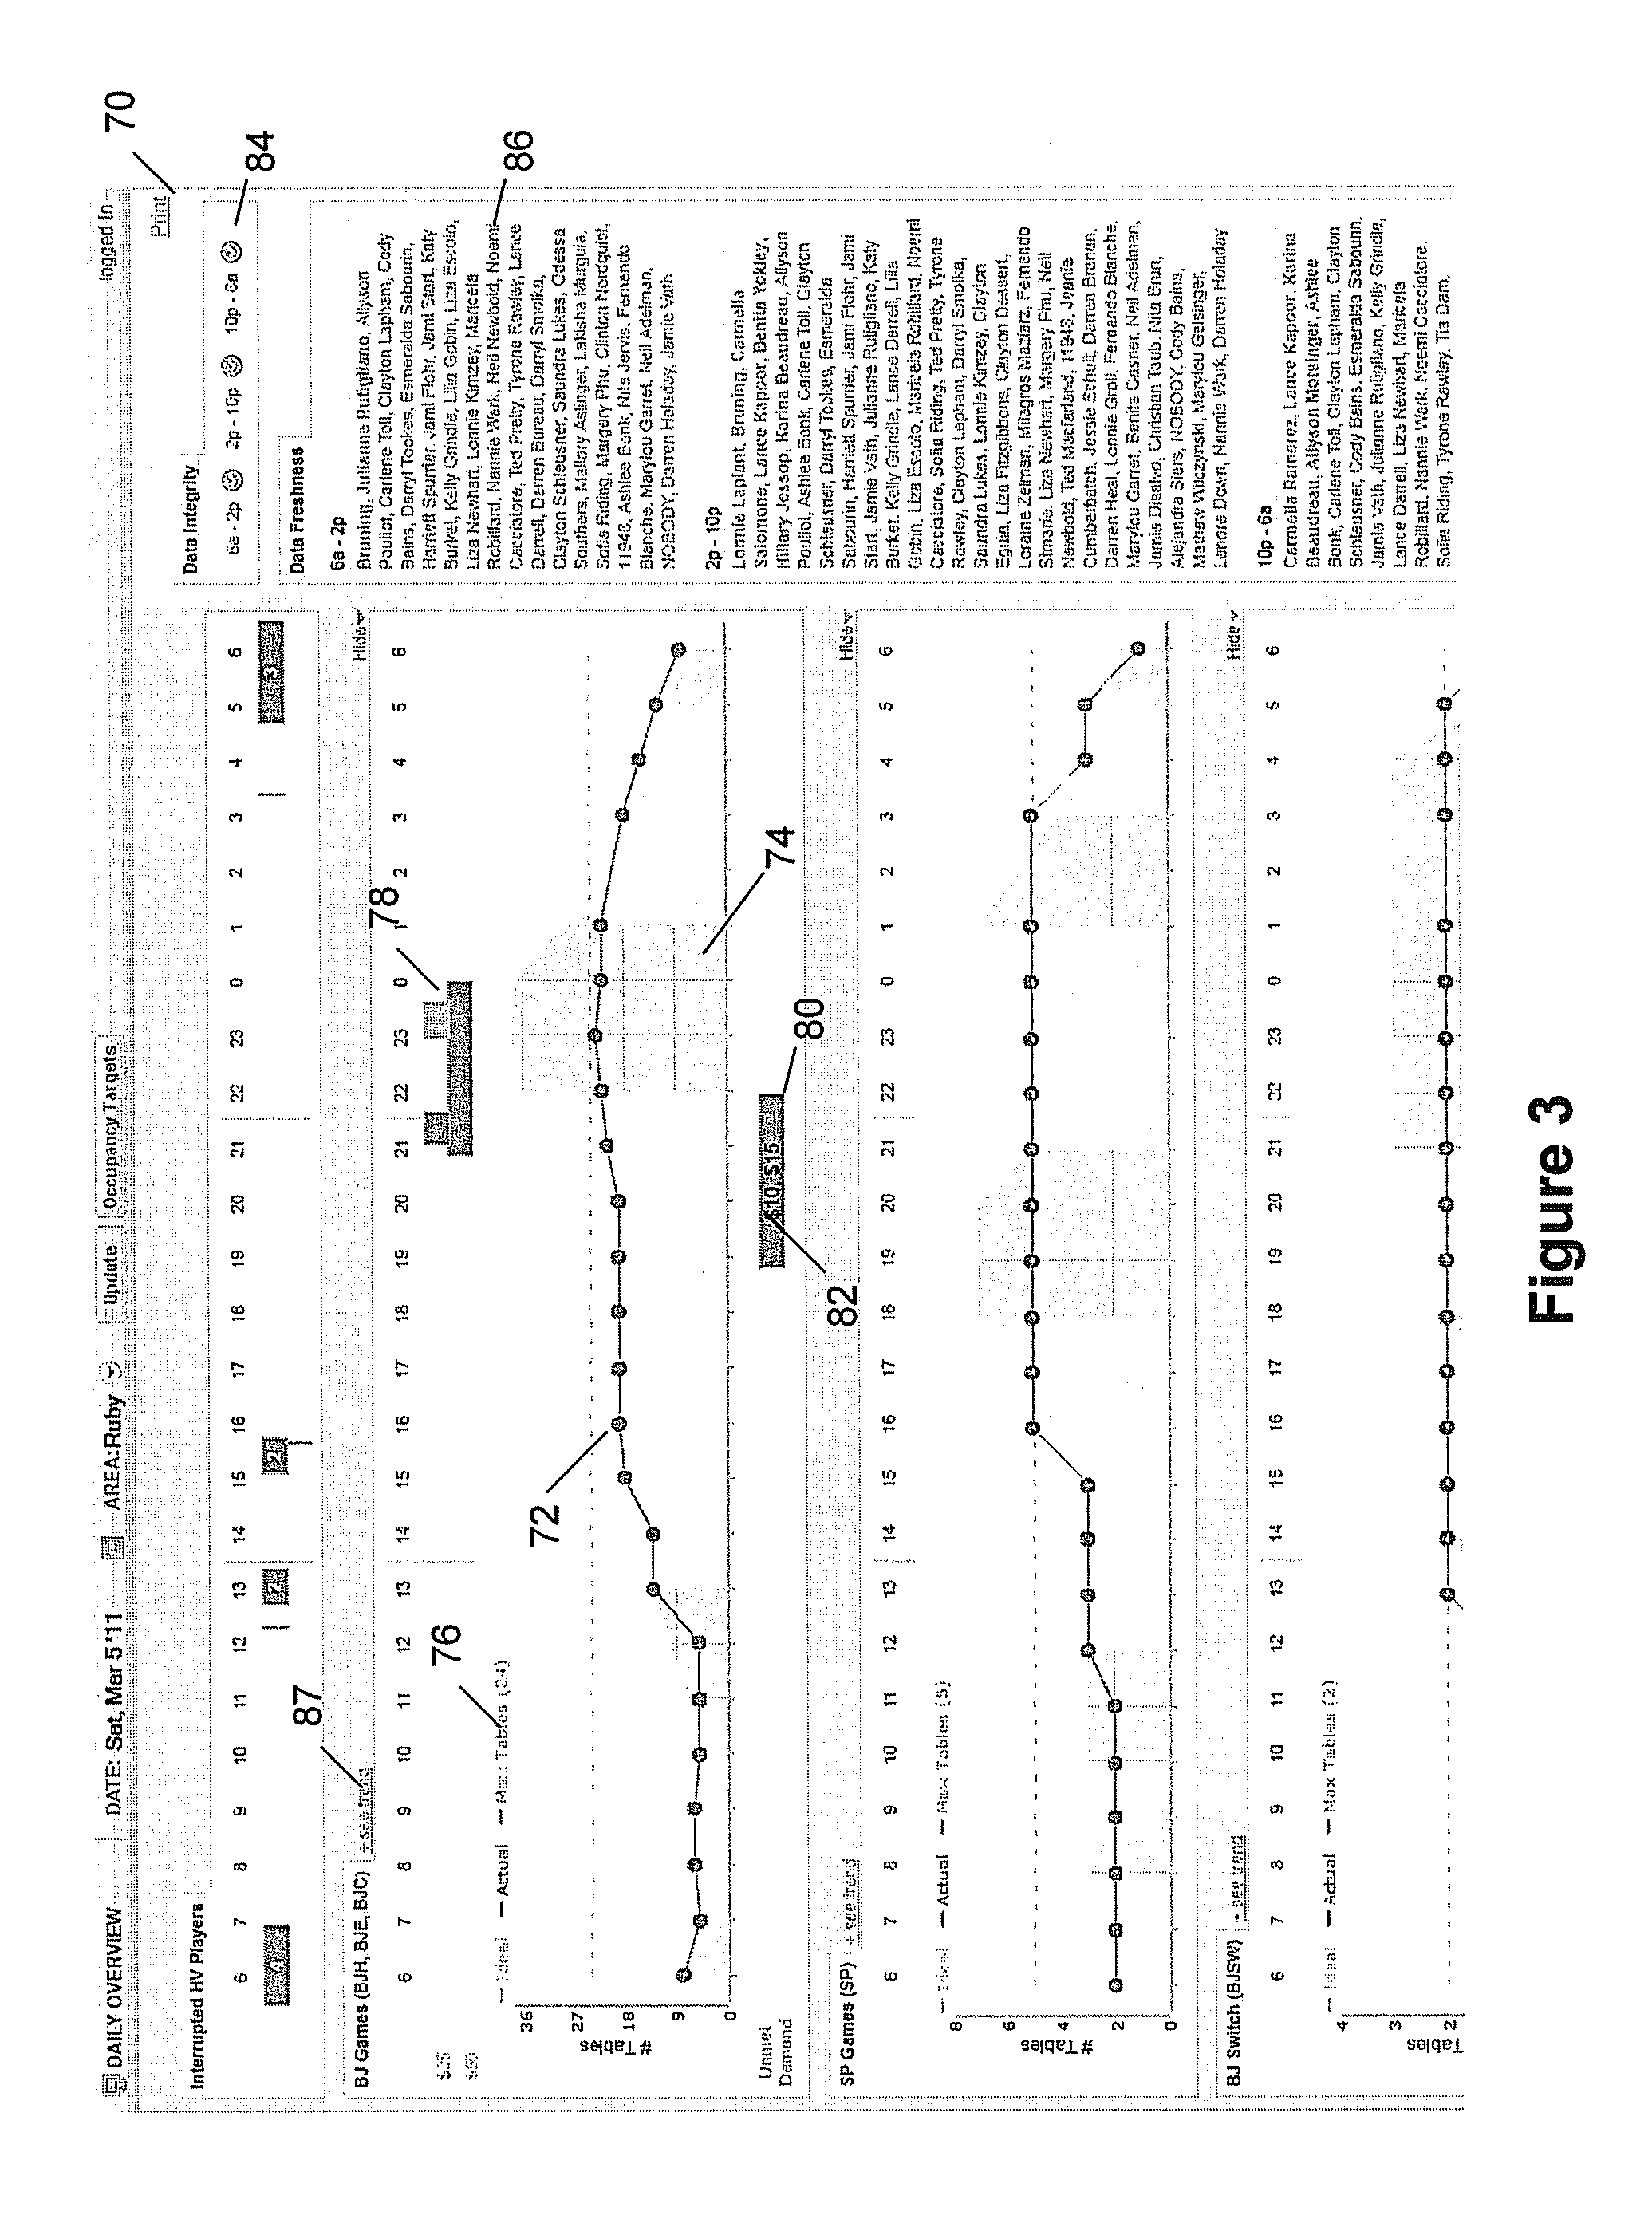
[0016] FIG. 3 is a screen shot of a daily overview UI.
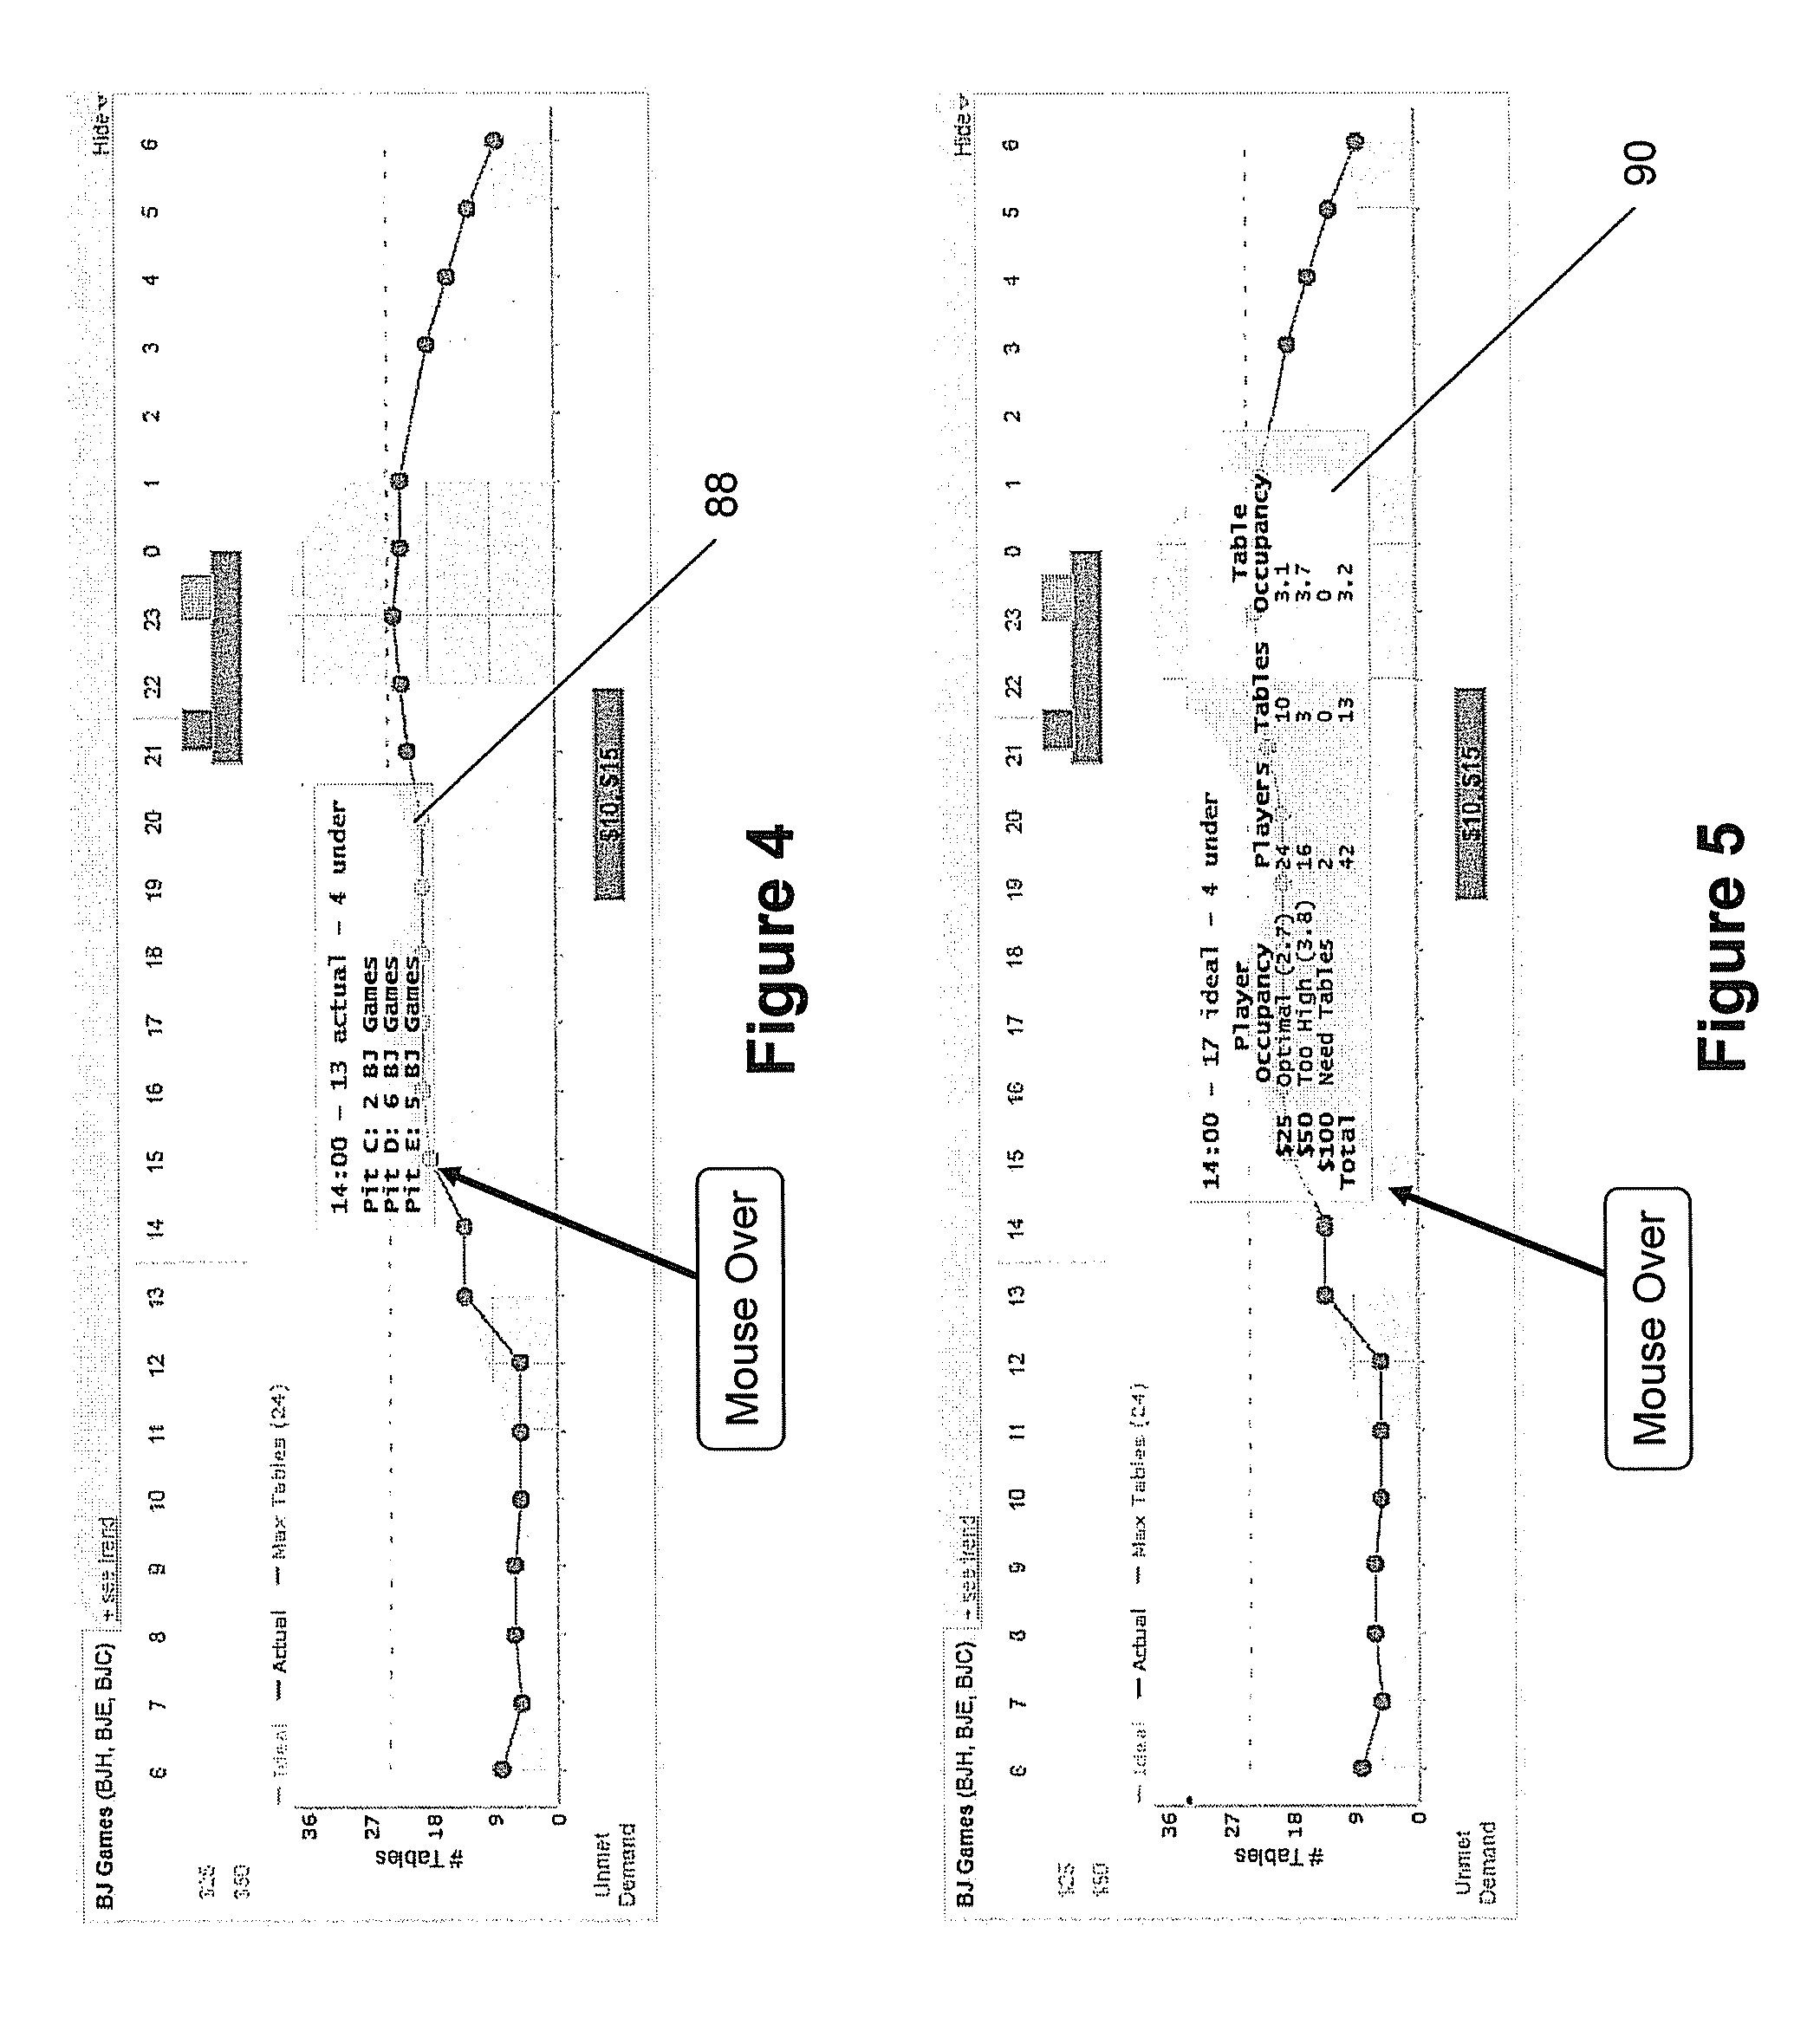
[0017] FIG. 4 is a screen shot showing a pop-up displayed upon detecting a mouse-over of the graph in FIG. 3.
[0018] FIG. 5 is a screen shot showing a pop-up displayed upon detecting a mouse-over of a shaded segment in FIG. 3.
[0019] FIG. 6 is a screen shot showing a pop-up displayed upon detecting a mouse-over of the upper bars in FIG. 3.
[0020] FIG. 7 is a screen shot showing a pop-up displayed upon detecting a mouse-over of the lower bars in FIG. 3.
[0021] FIG. 8 is a screen shot showing a table view.
[0022] FIG. 9 is a screen shot of a trends view.
[0023] FIG. 10 is a screen shot showing a pop-up displayed upon detecting a mouse-over of the graph in FIG. 9.
[0024] FIG. 11 is a screen shot showing a pop-up displayed upon detecting a mouse-over of the player segment bars in FIG. 9.
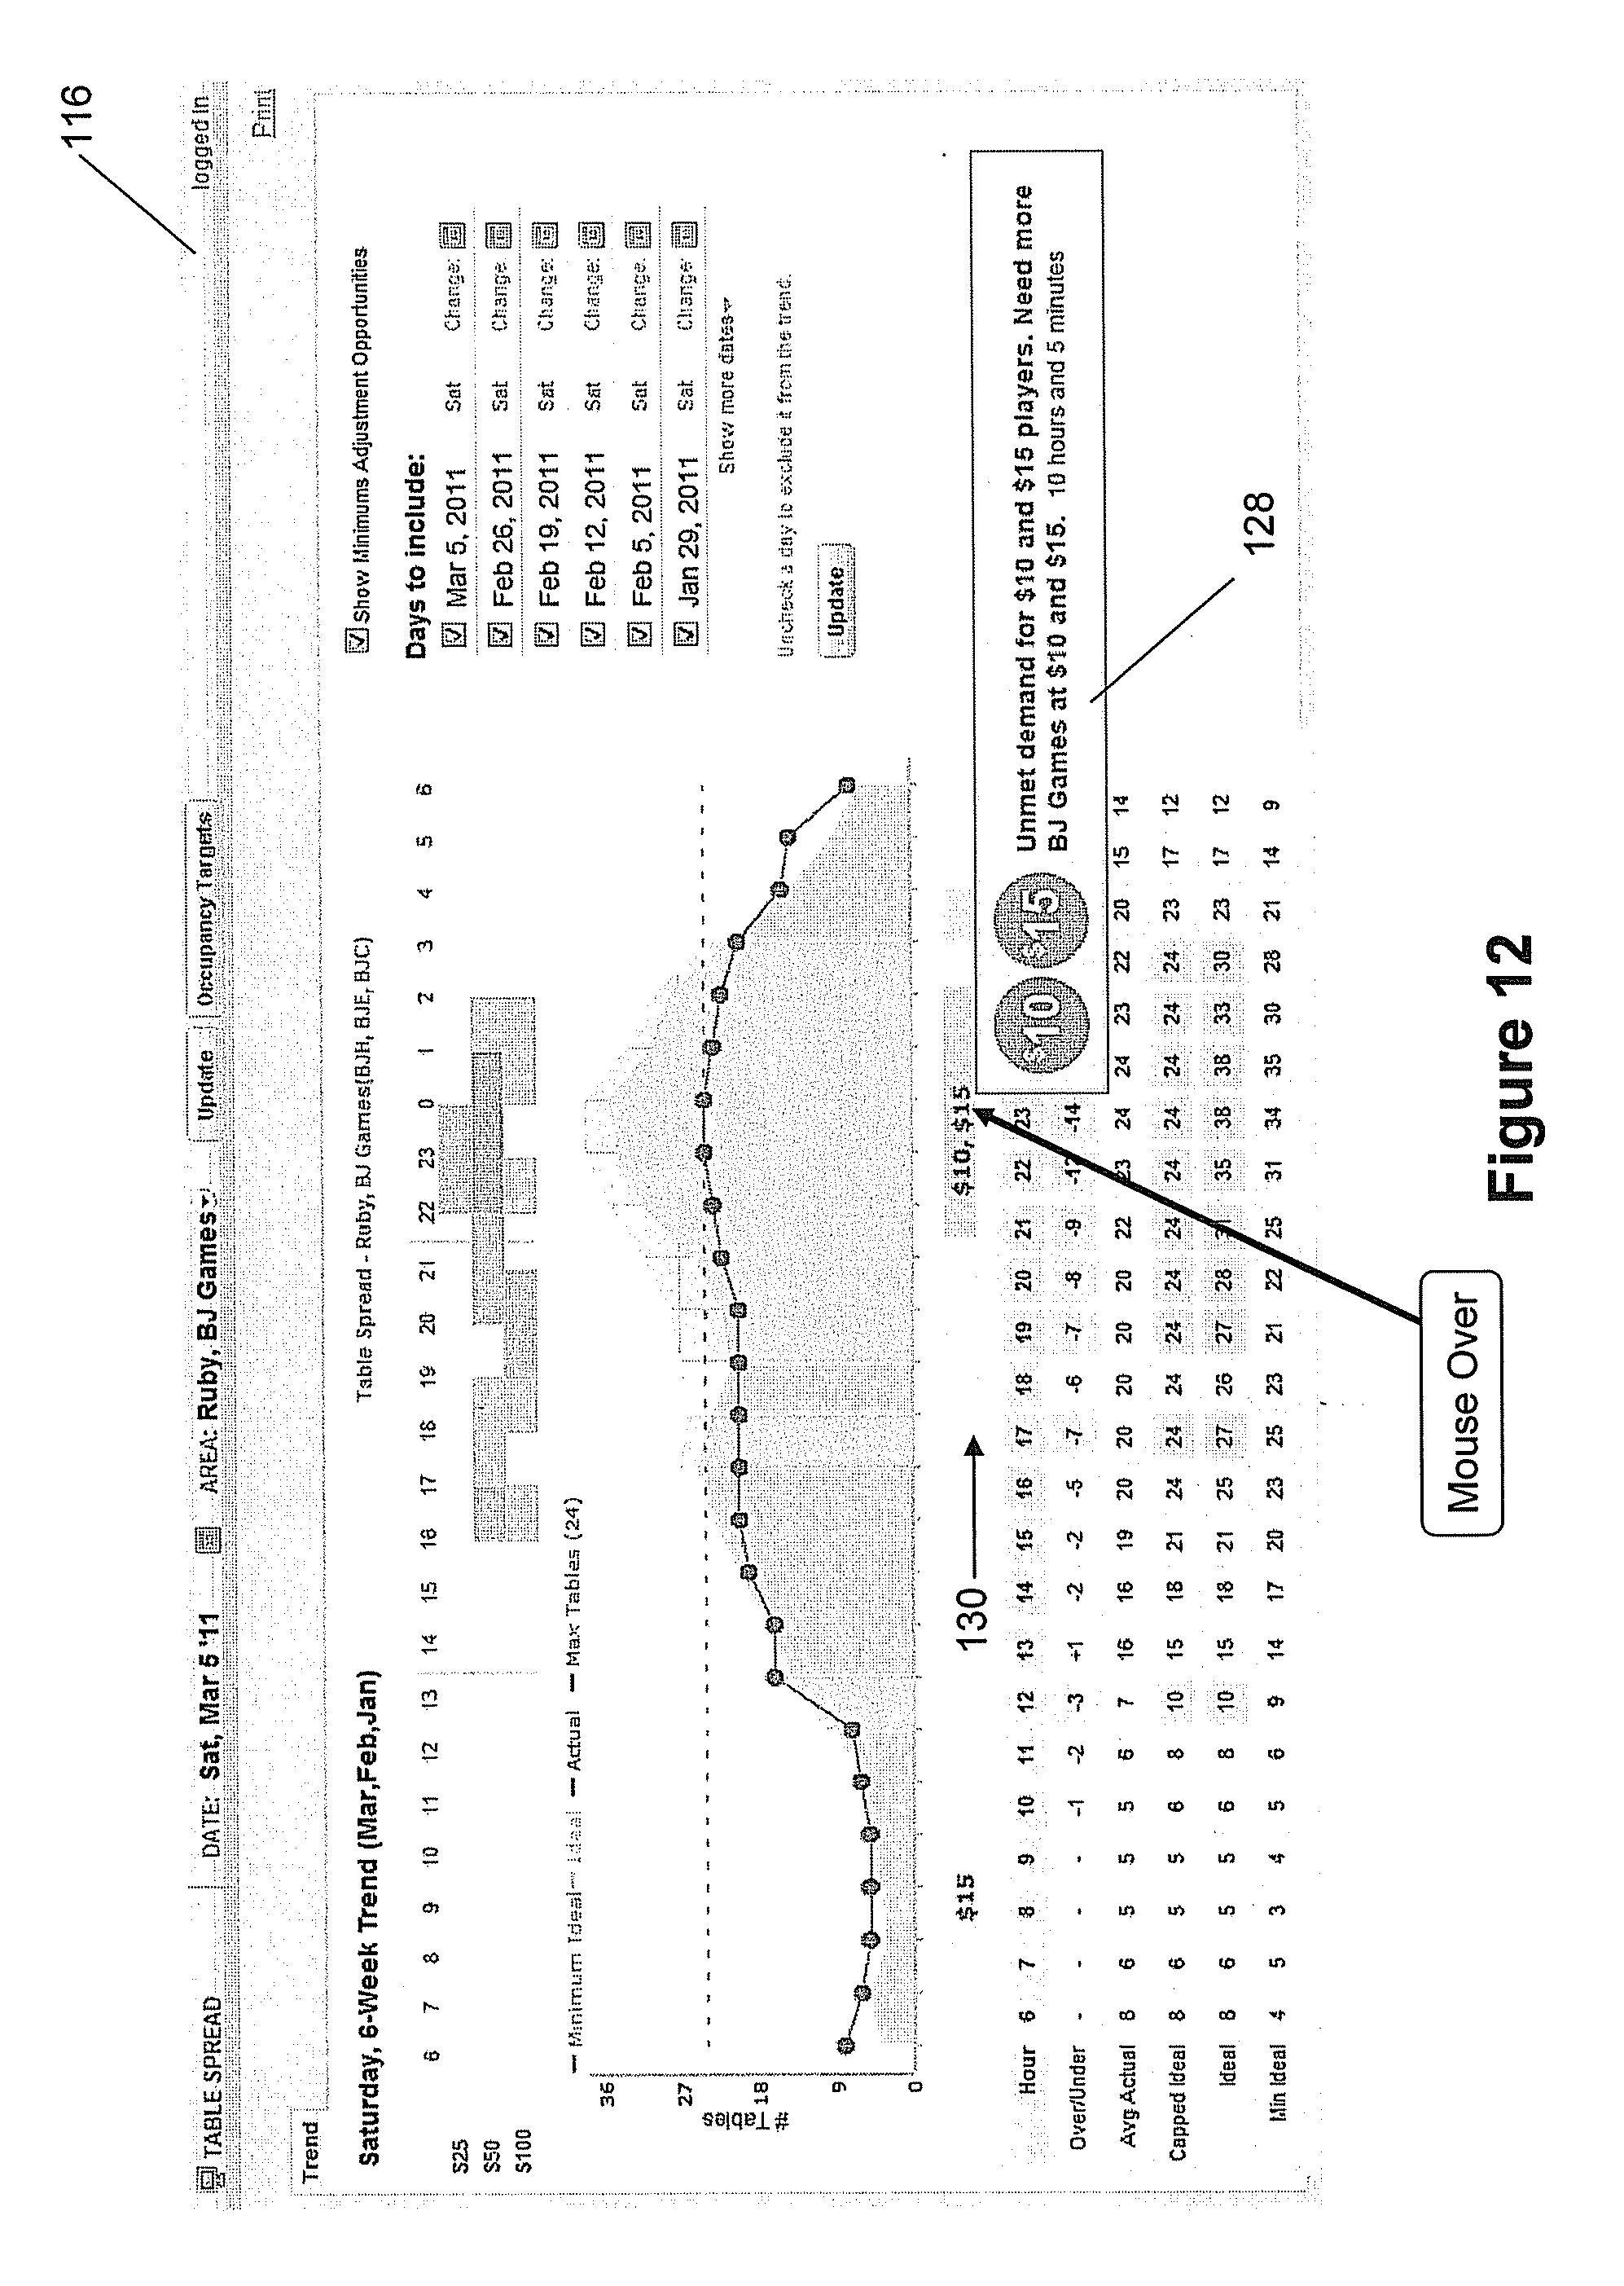
[0025] FIG. 12 is a screen shot showing a pop-up displayed upon detecting a mouse-over of the unmet demand bars in FIG. 9.
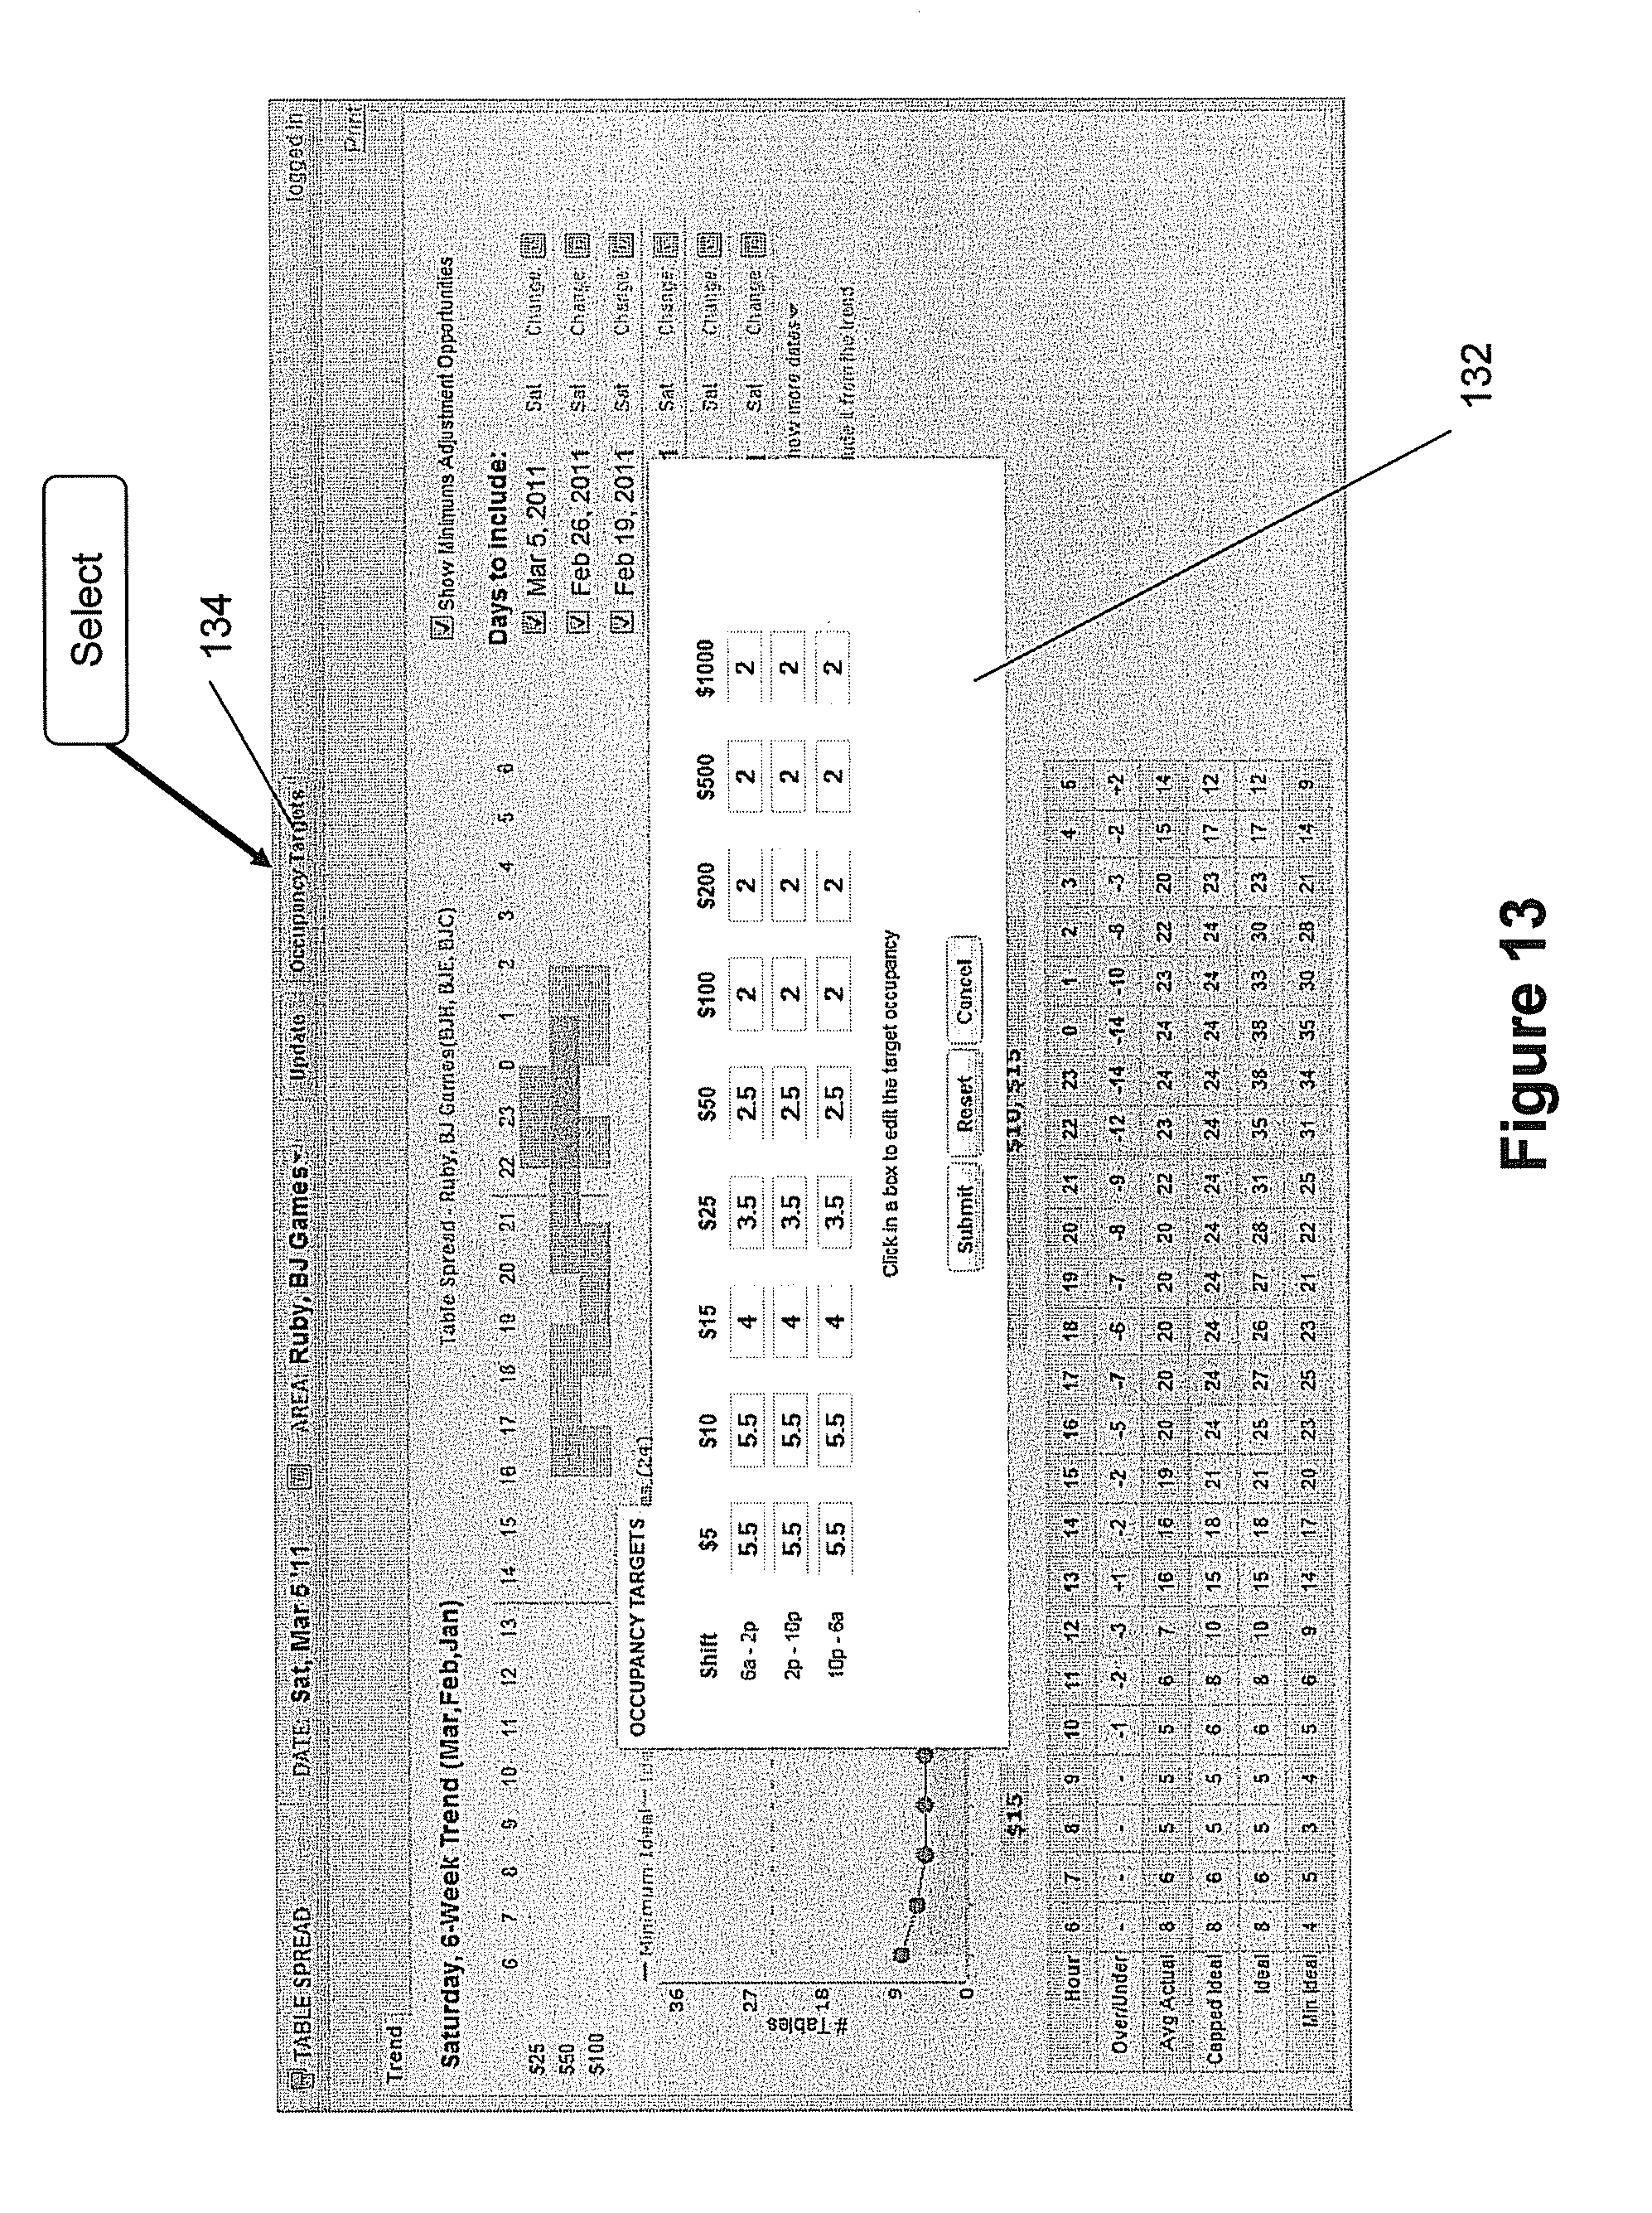
[0026] FIG. 13 is a screen shot showing an occupancy targets window.
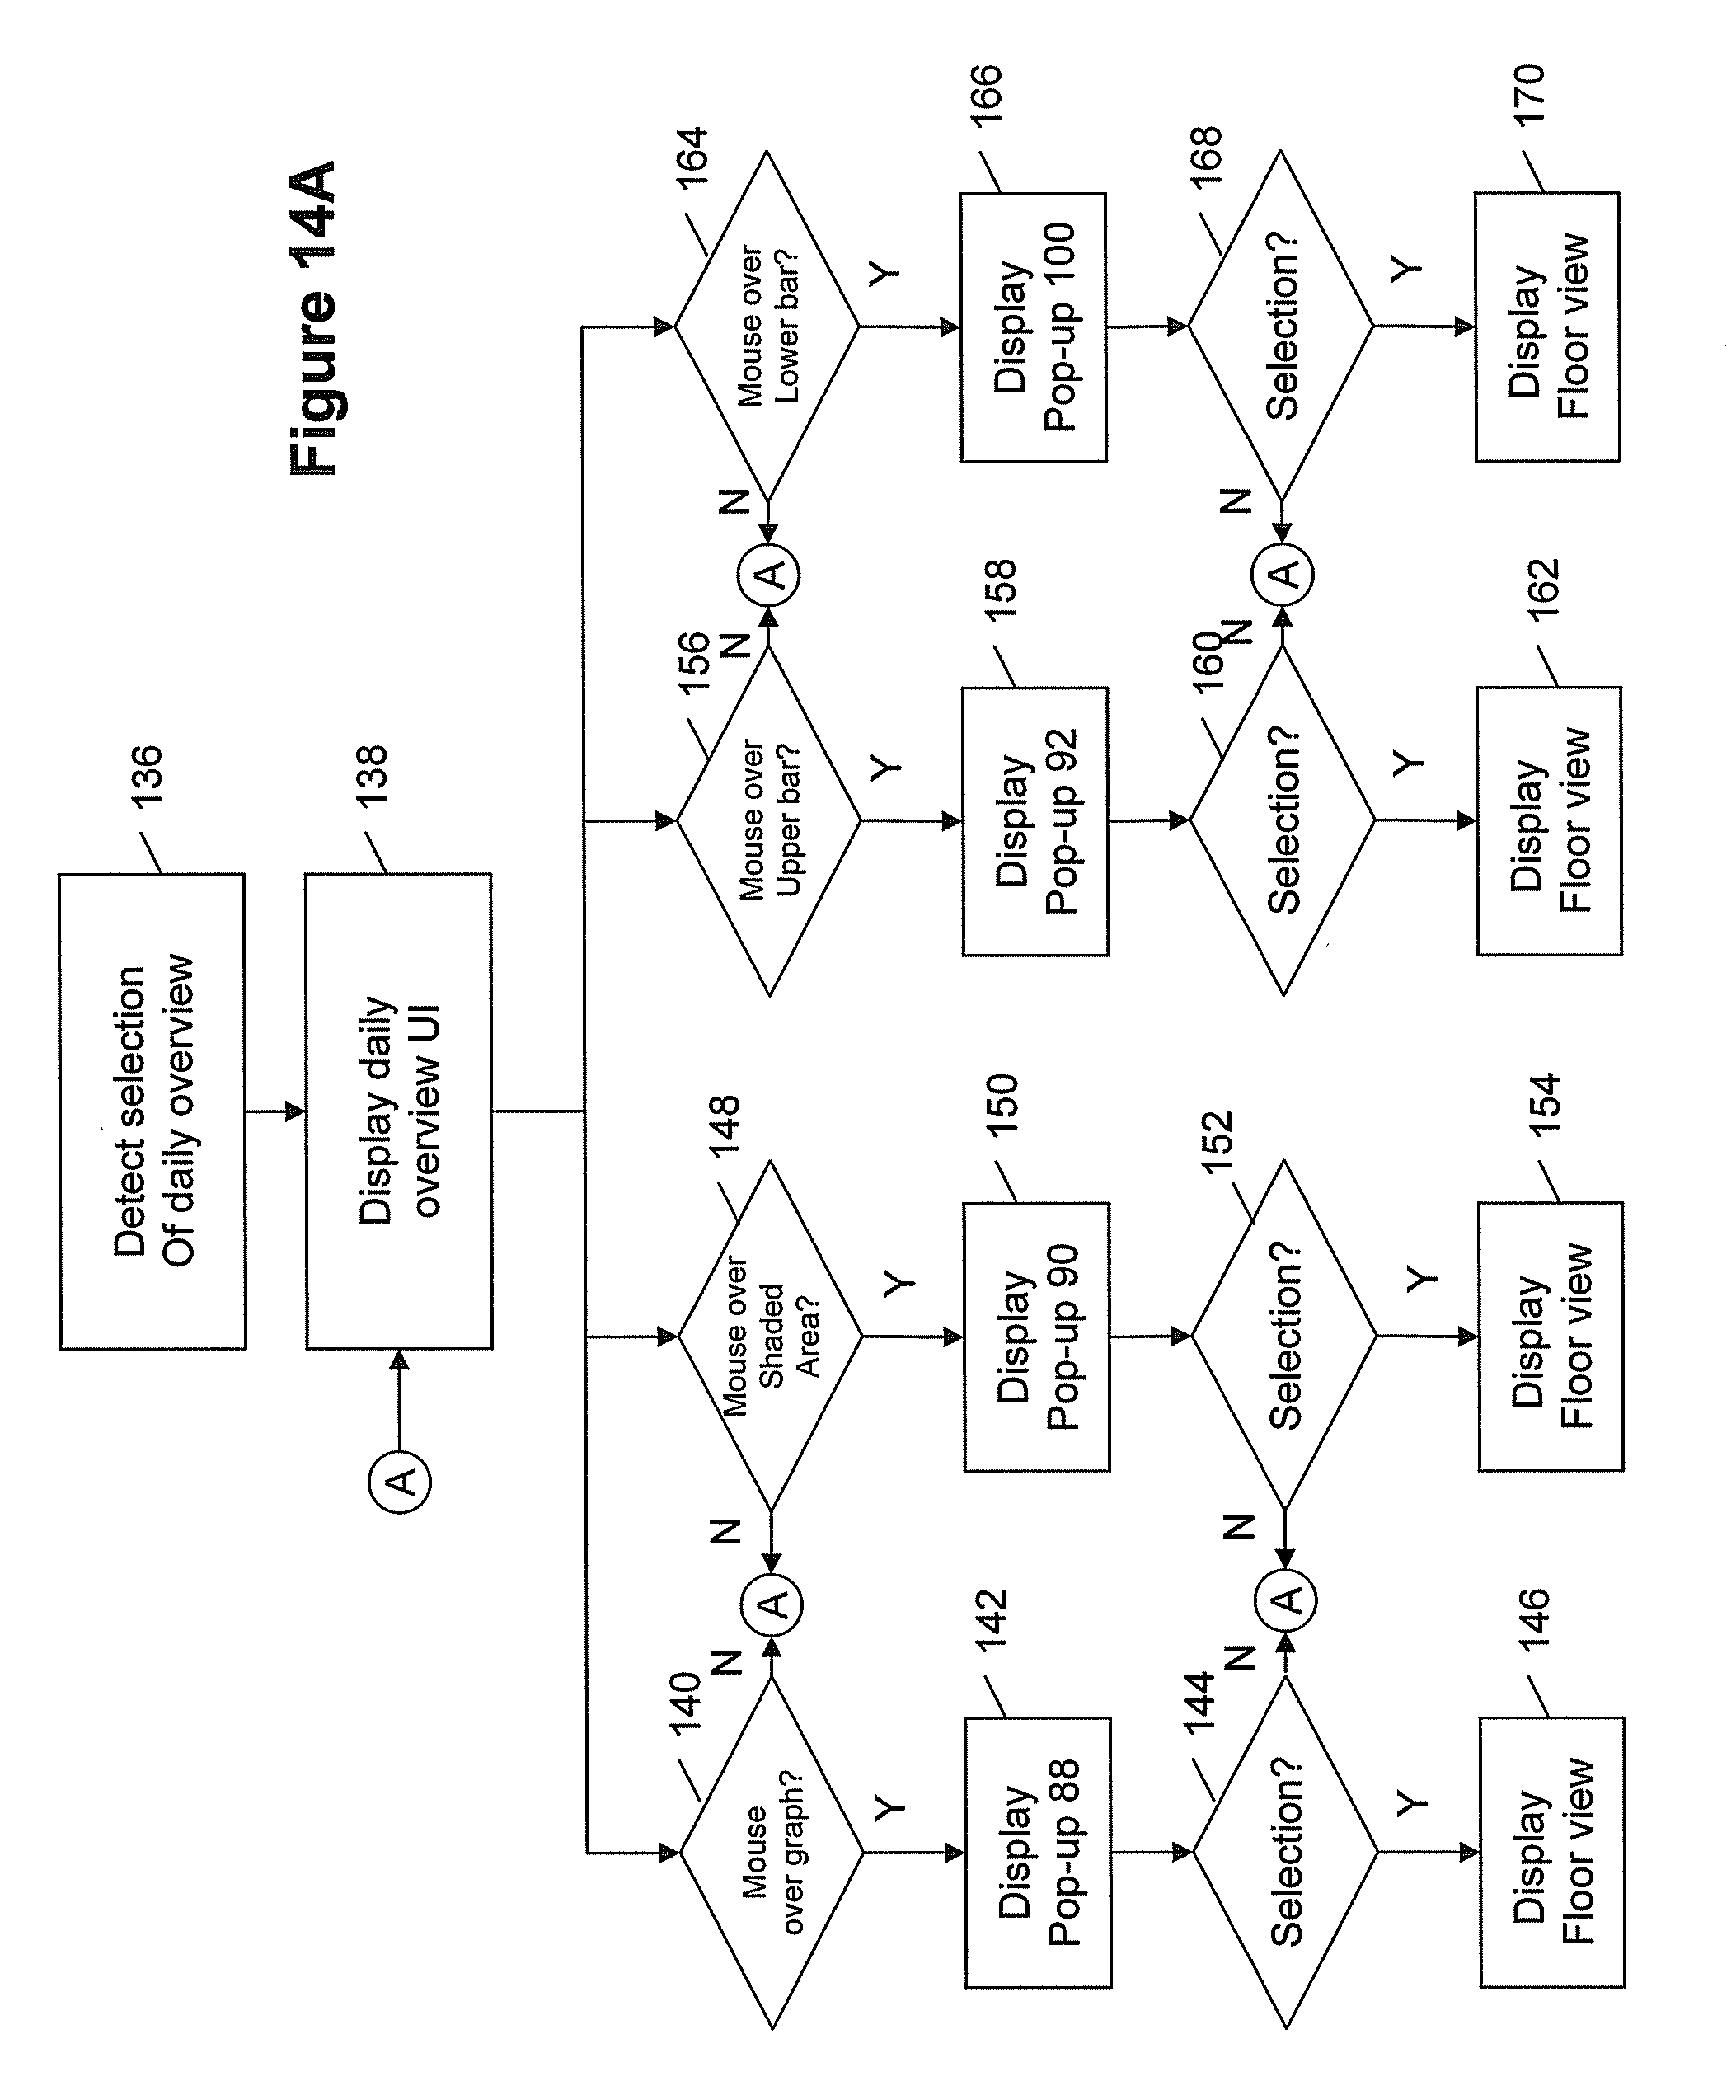
[0027] FIG. 14A is a flow chart showing a workflow for providing the screen shots in FIGS. 3-8.
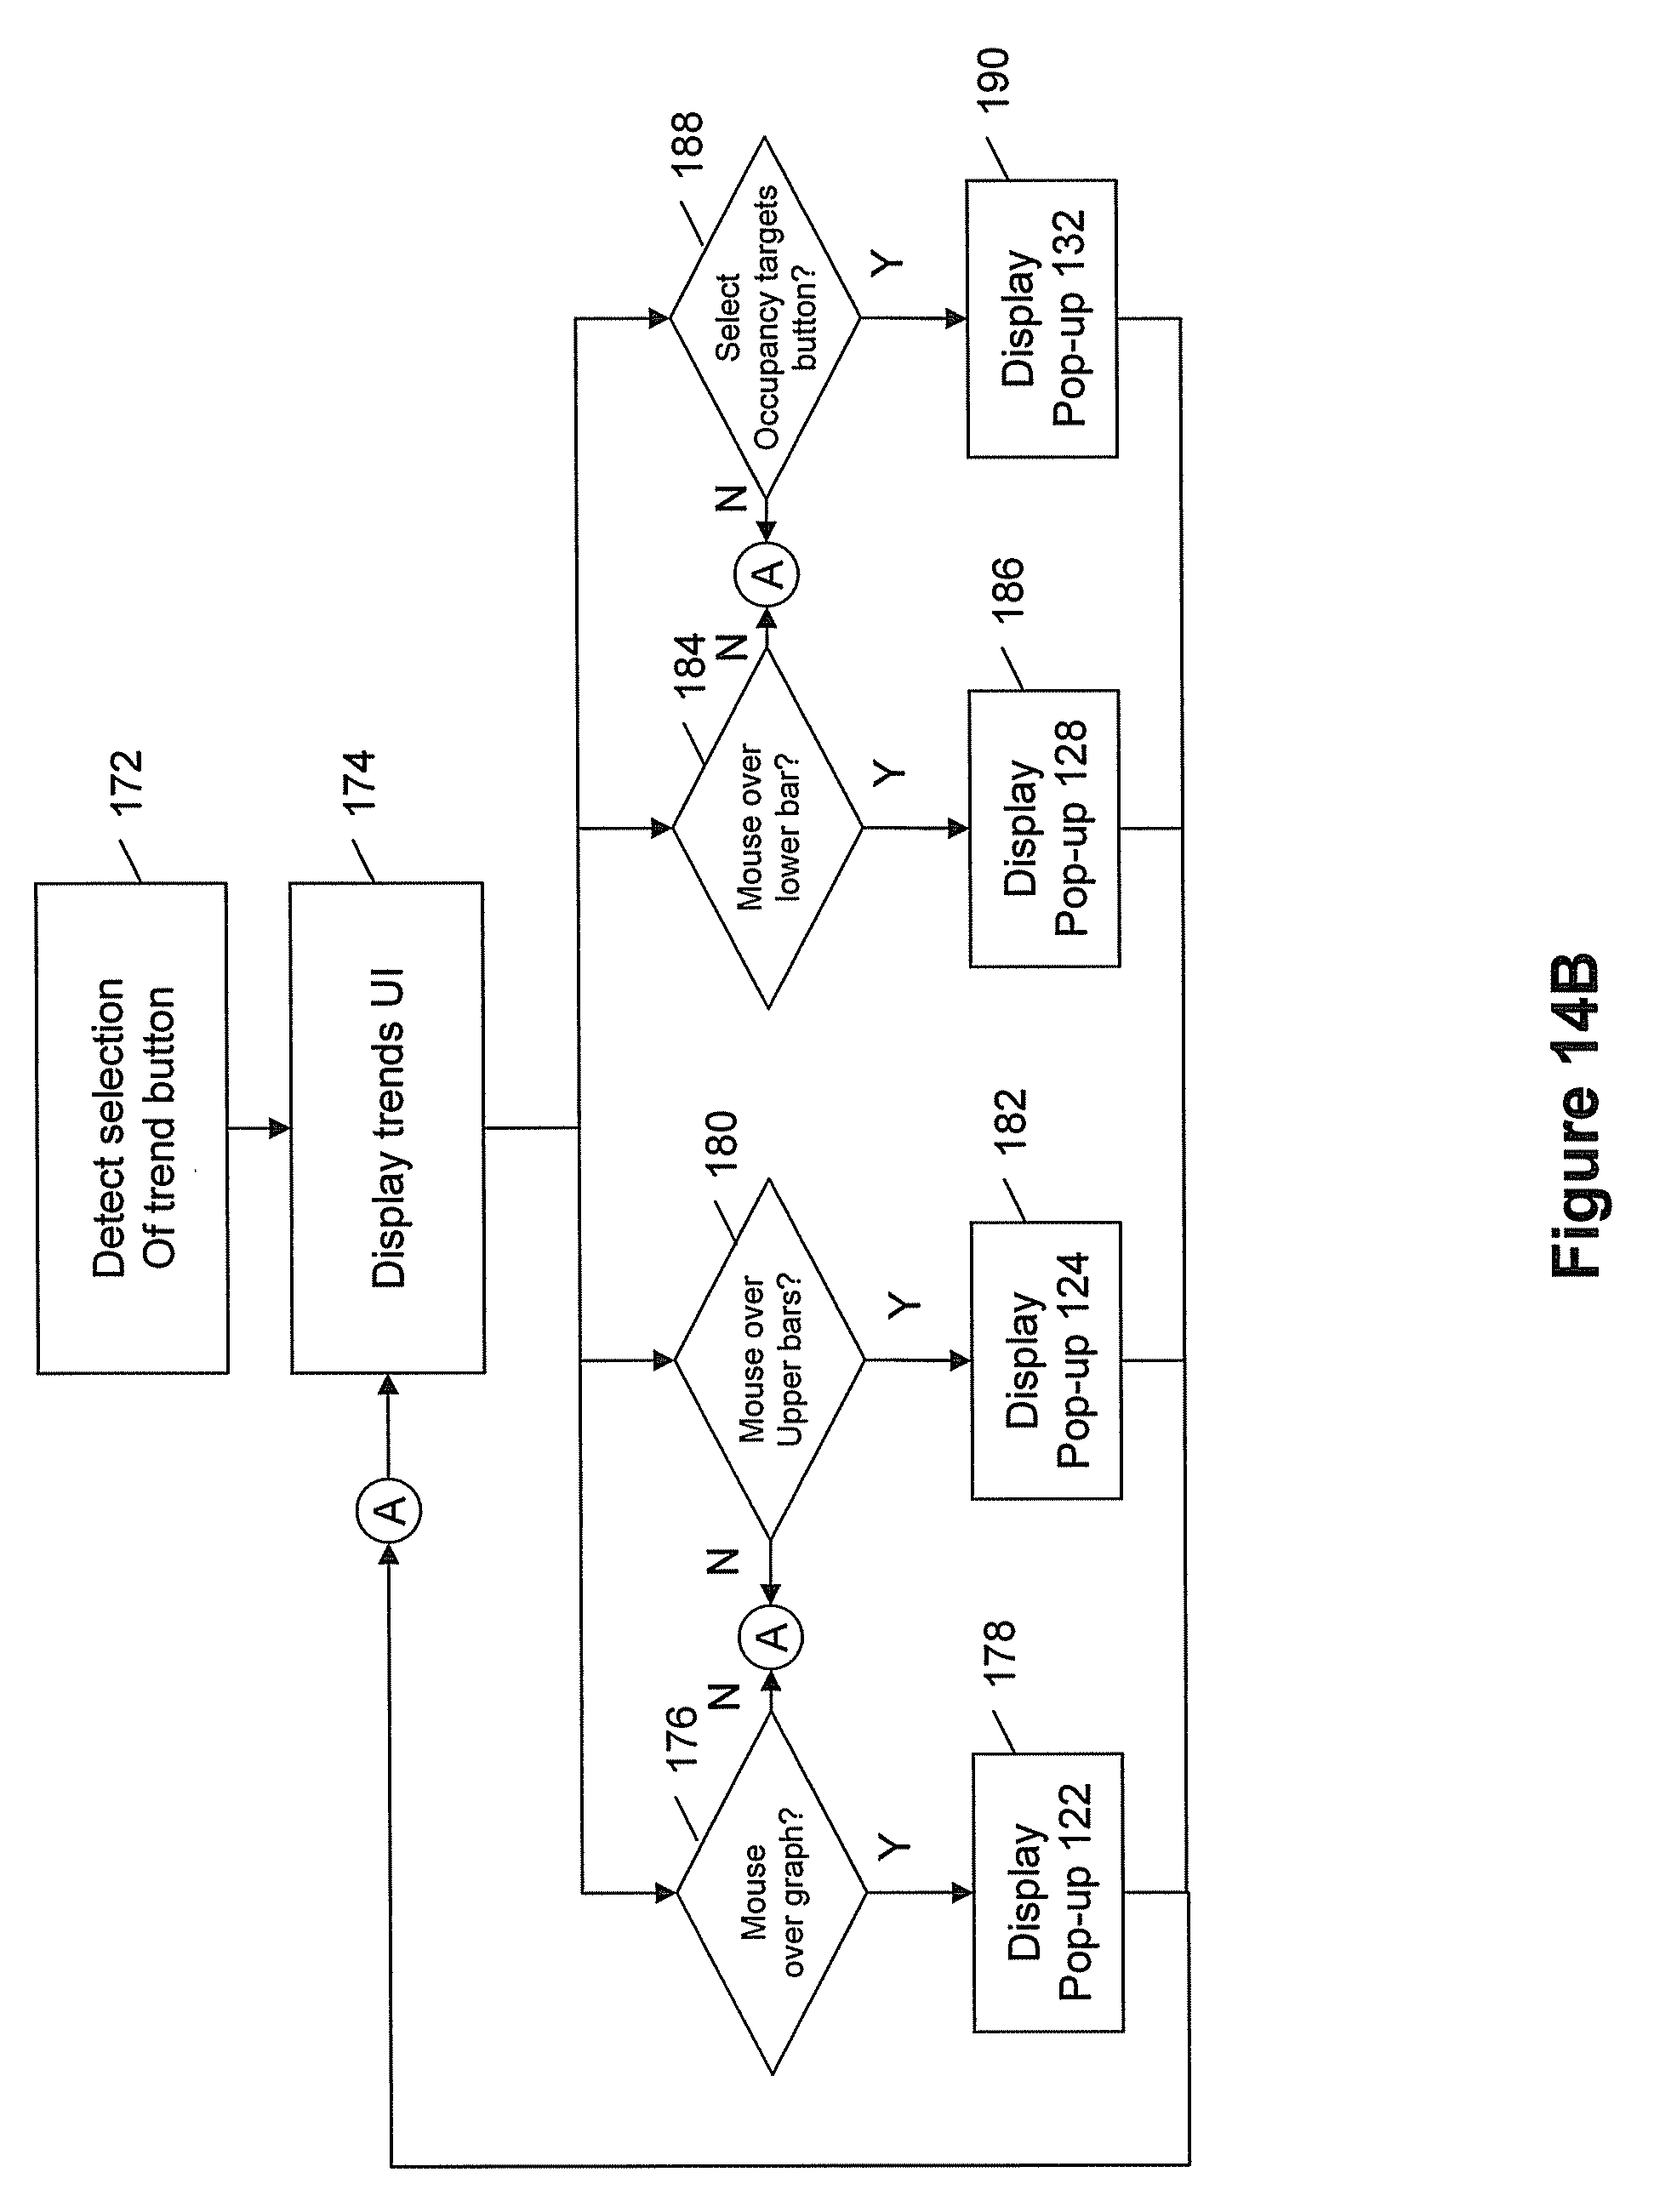
[0028] FIG. 14B is a flow chart showing a workflow for providing the screen shots in FIGS. 9-12.
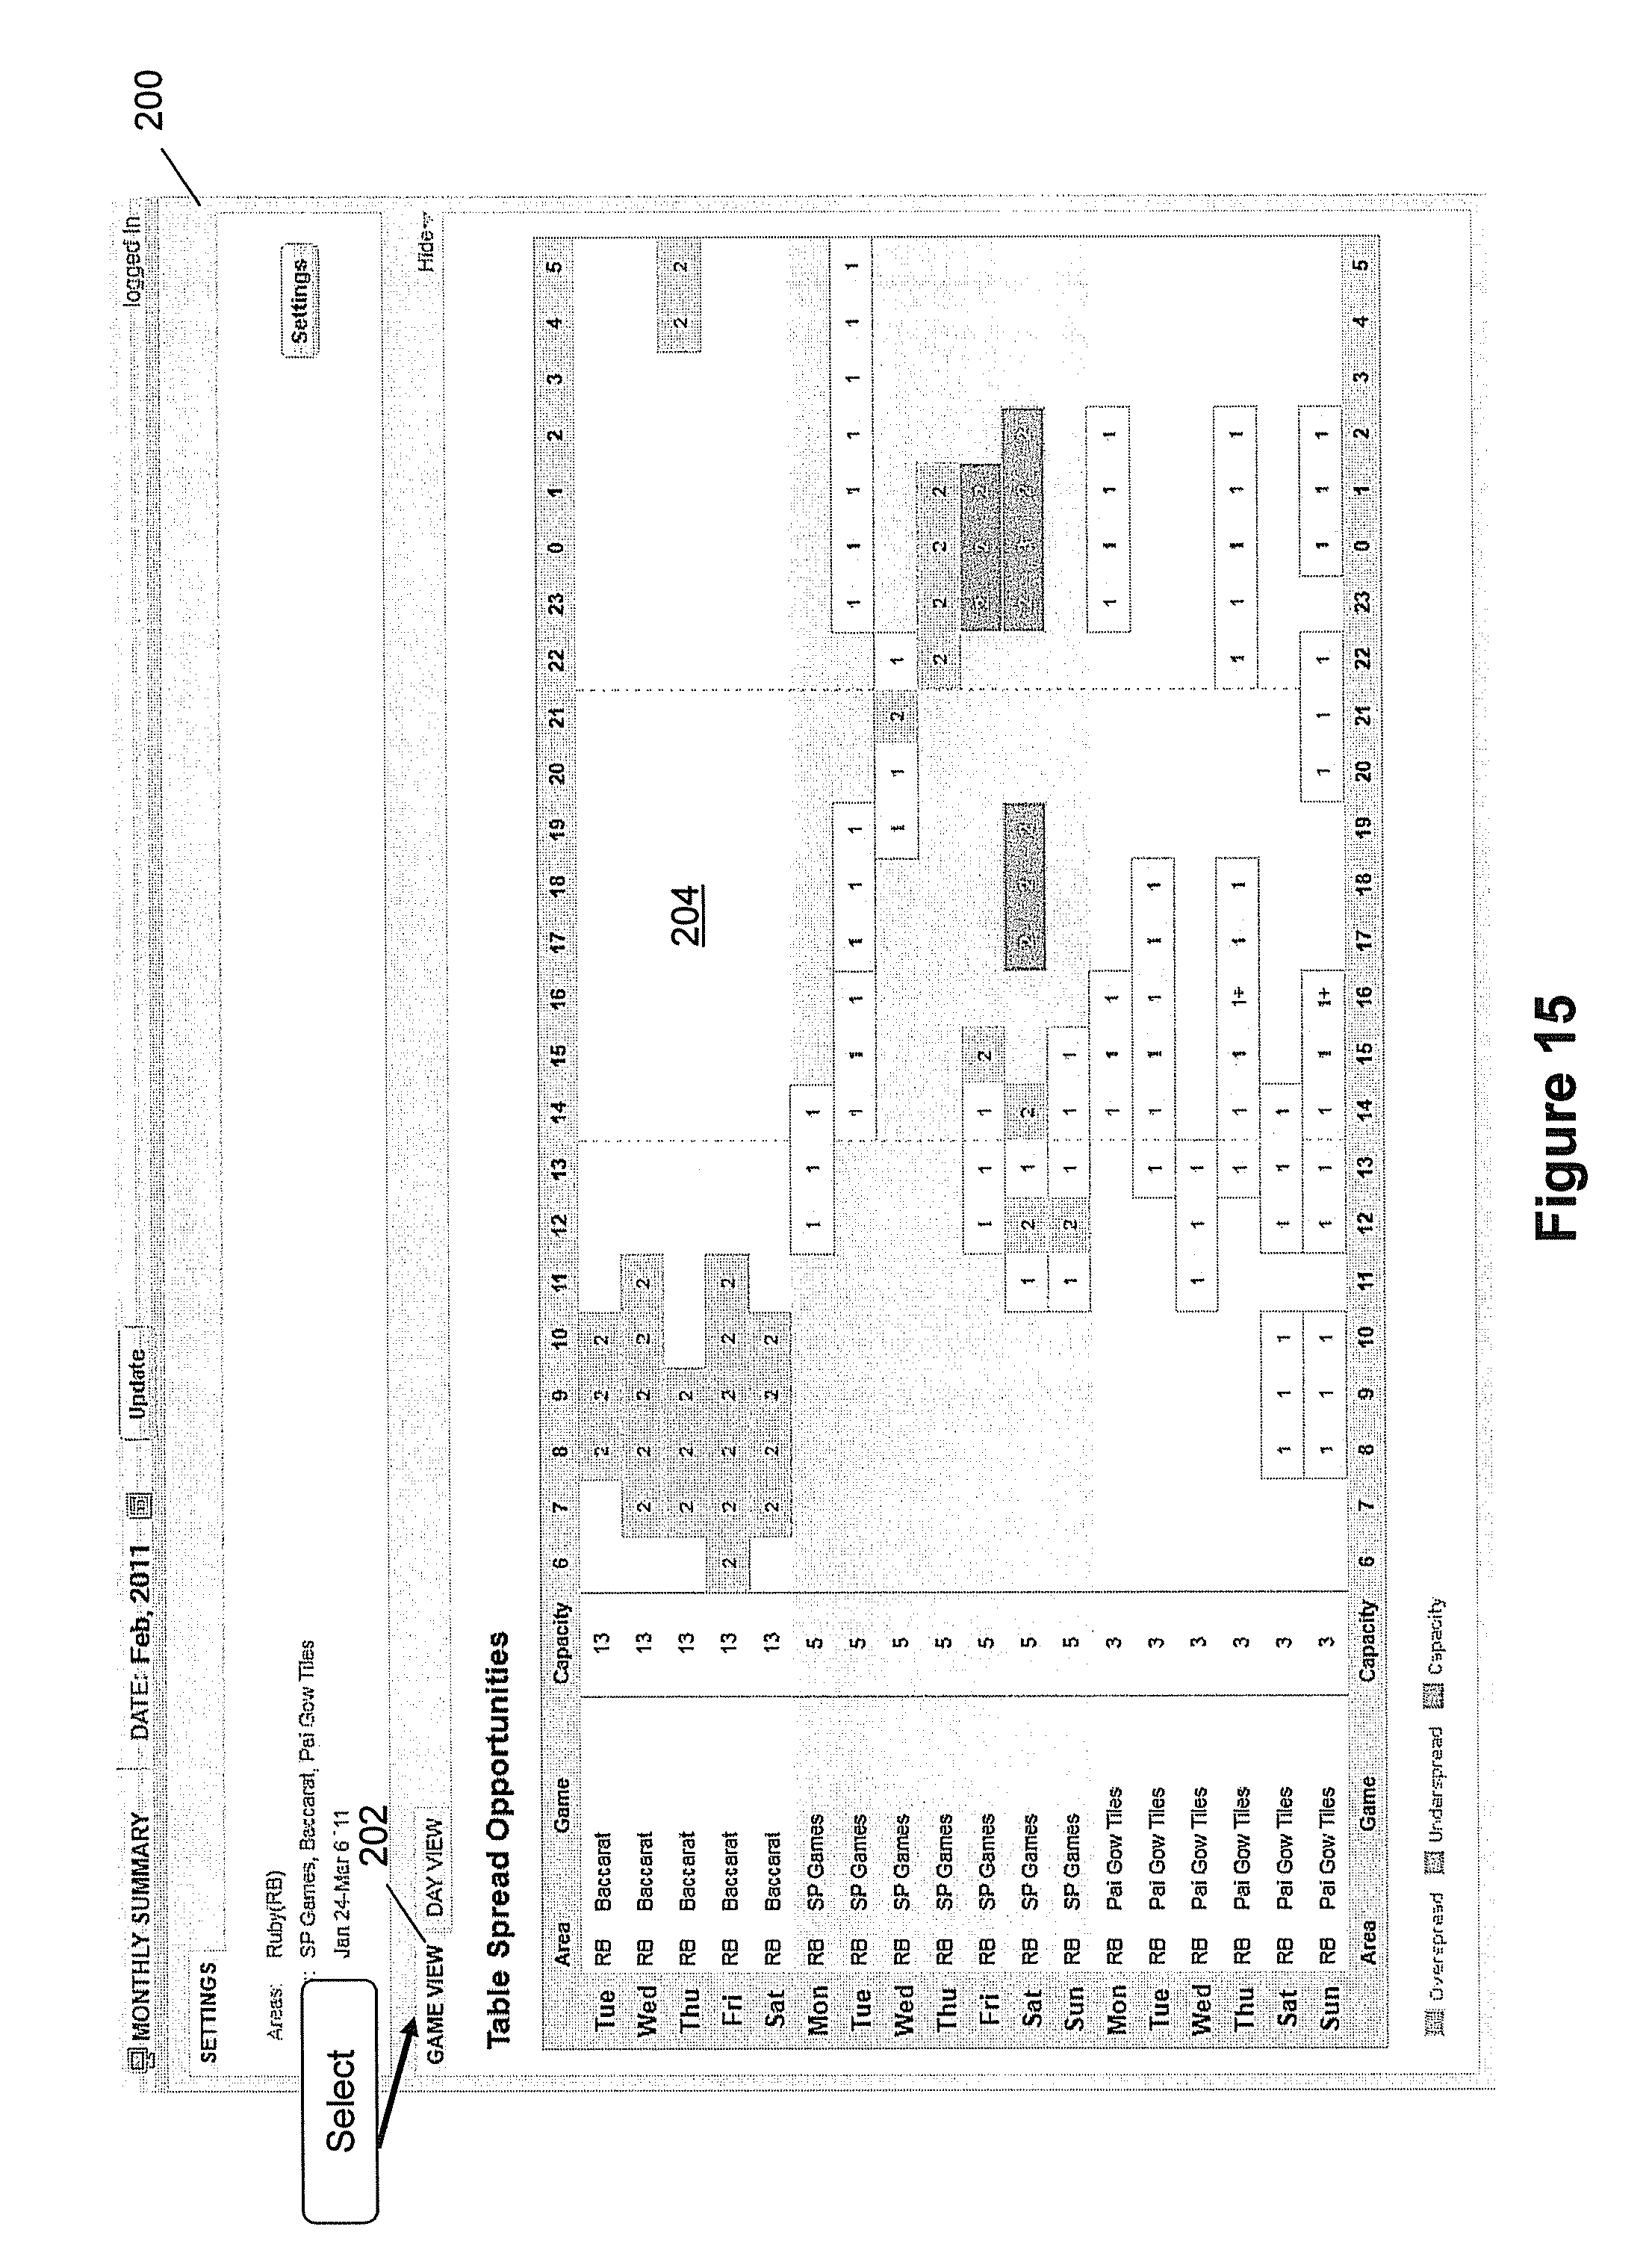
[0029] FIG. 15 is a screen shot showing table spread opportunities in a game view.
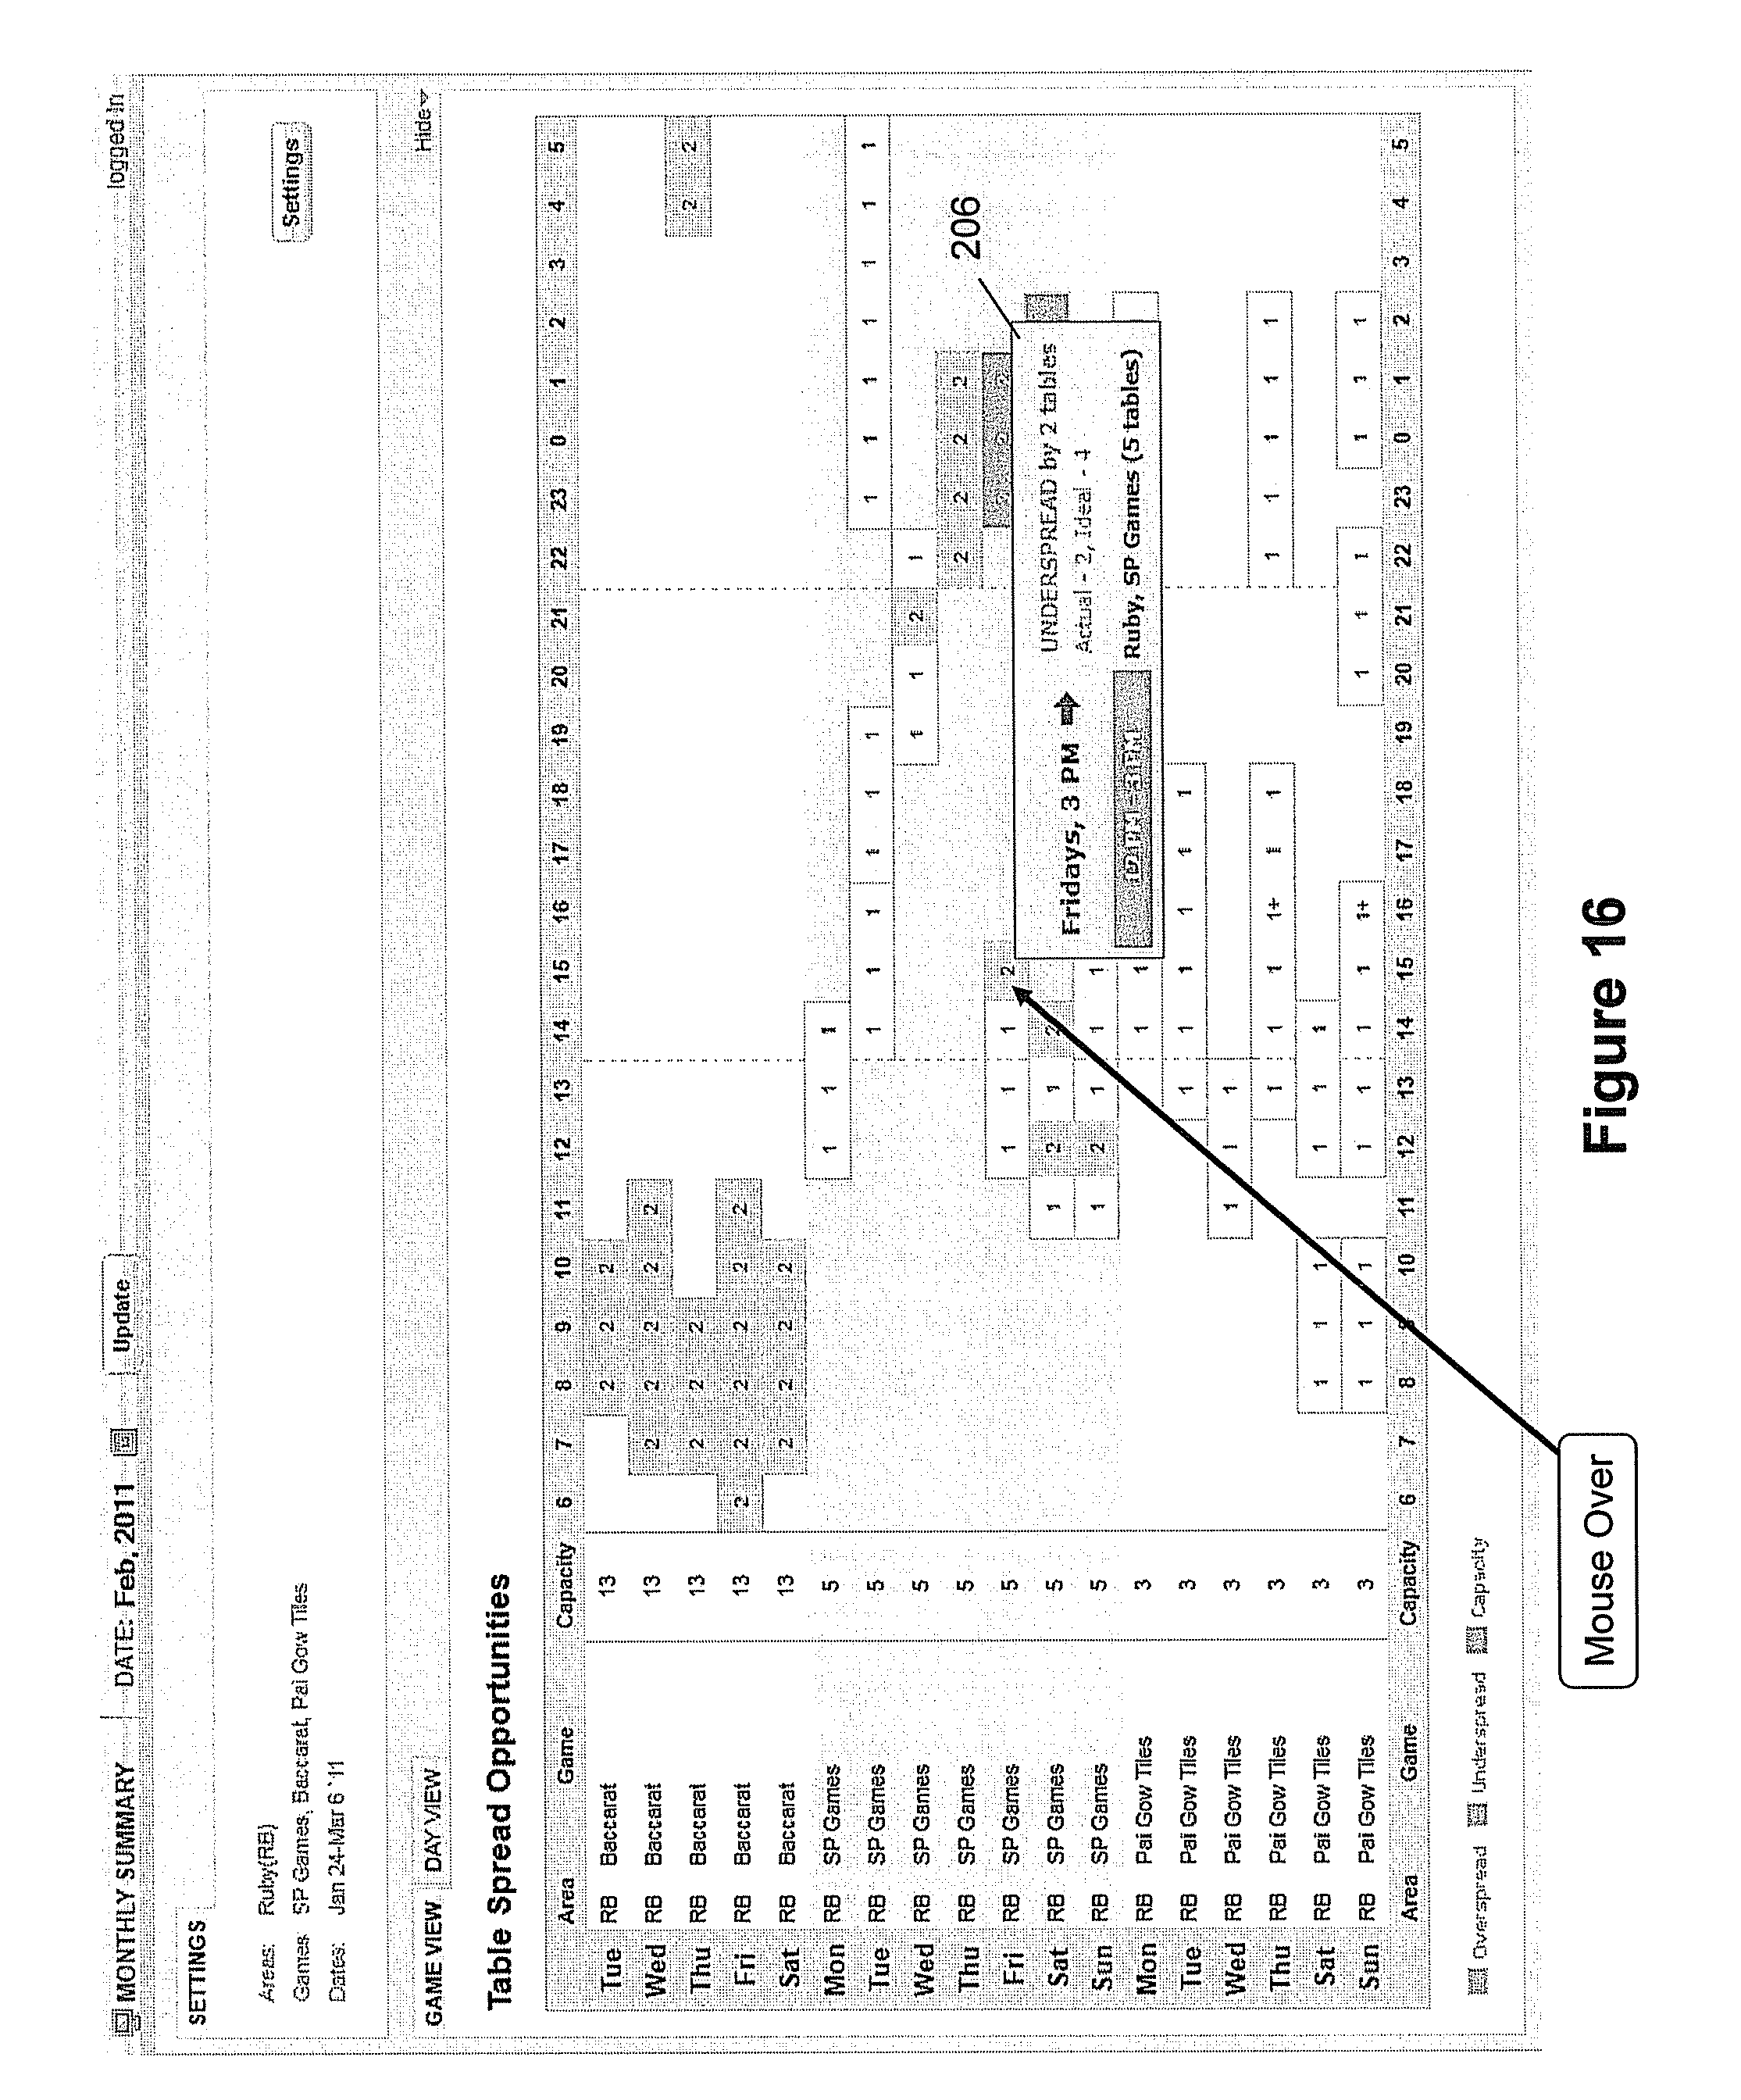
[0030] FIG. 16 is a screen shot showing a pop-up displayed upon detecting a mouse-over an under spread cell in FIG. 15.
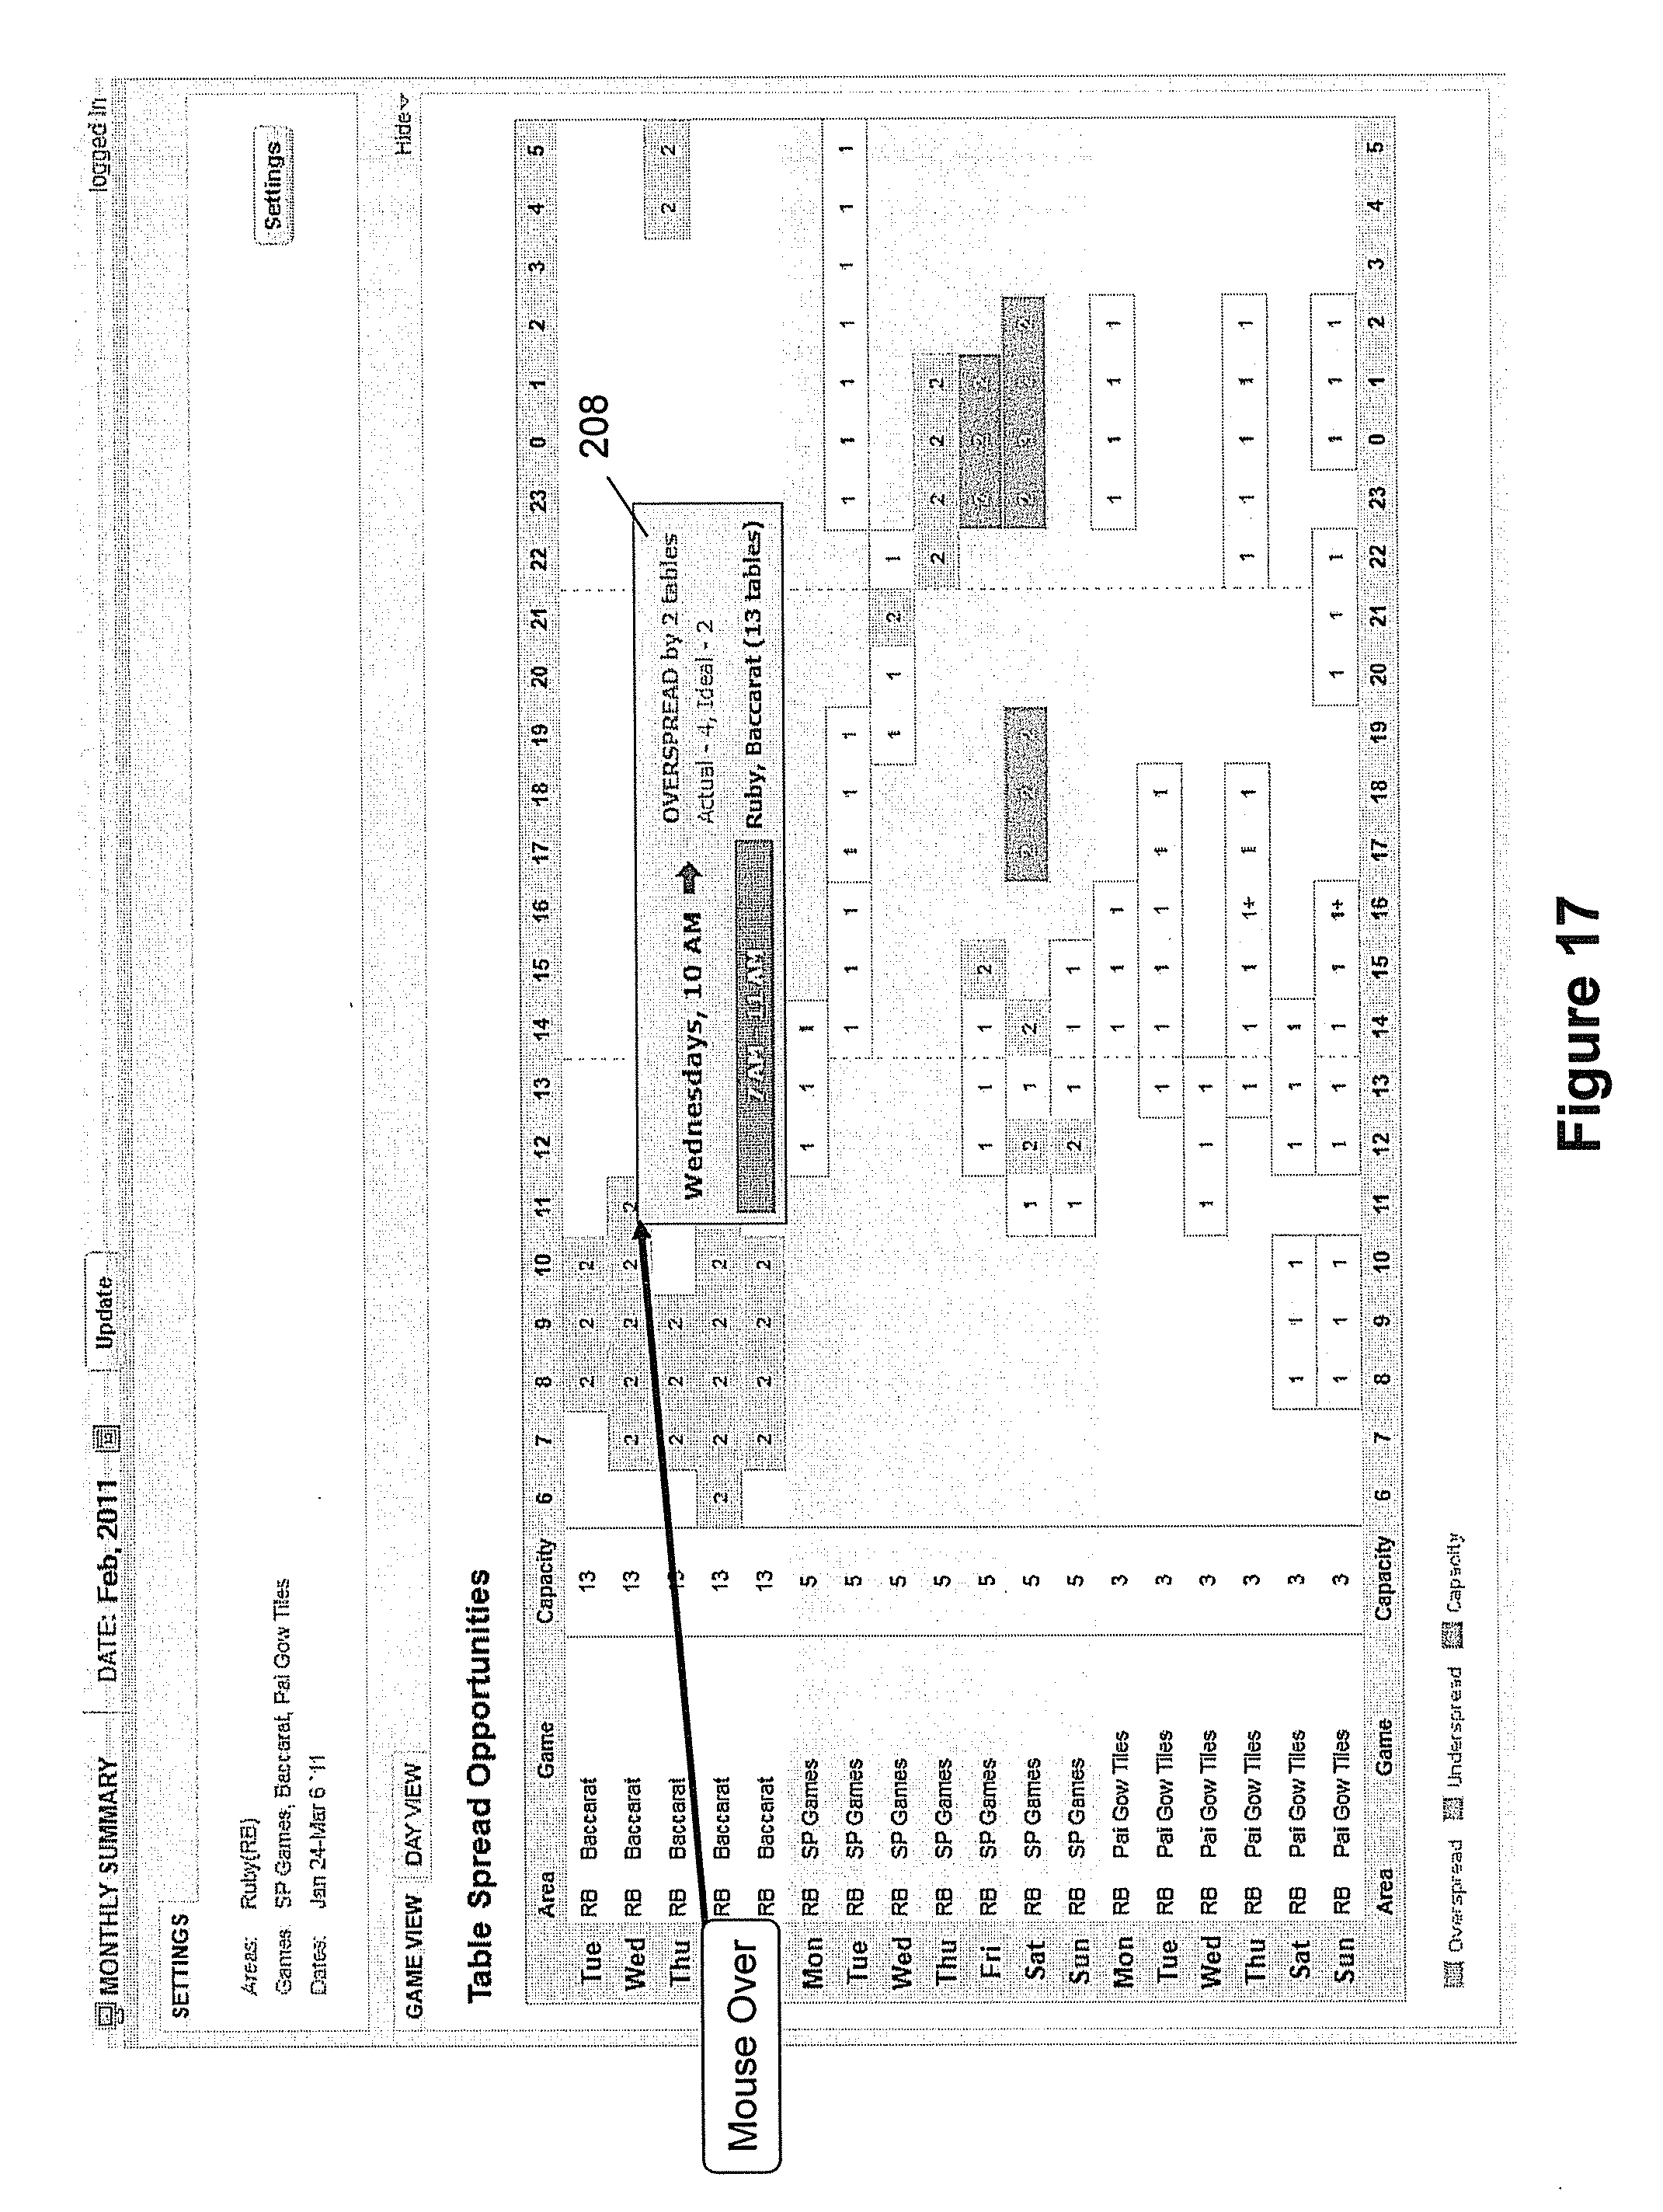
[0031] FIG. 17 is a screen shot showing a pop-up displayed upon detecting a mouse-over an over spread cell in FIG. 15.
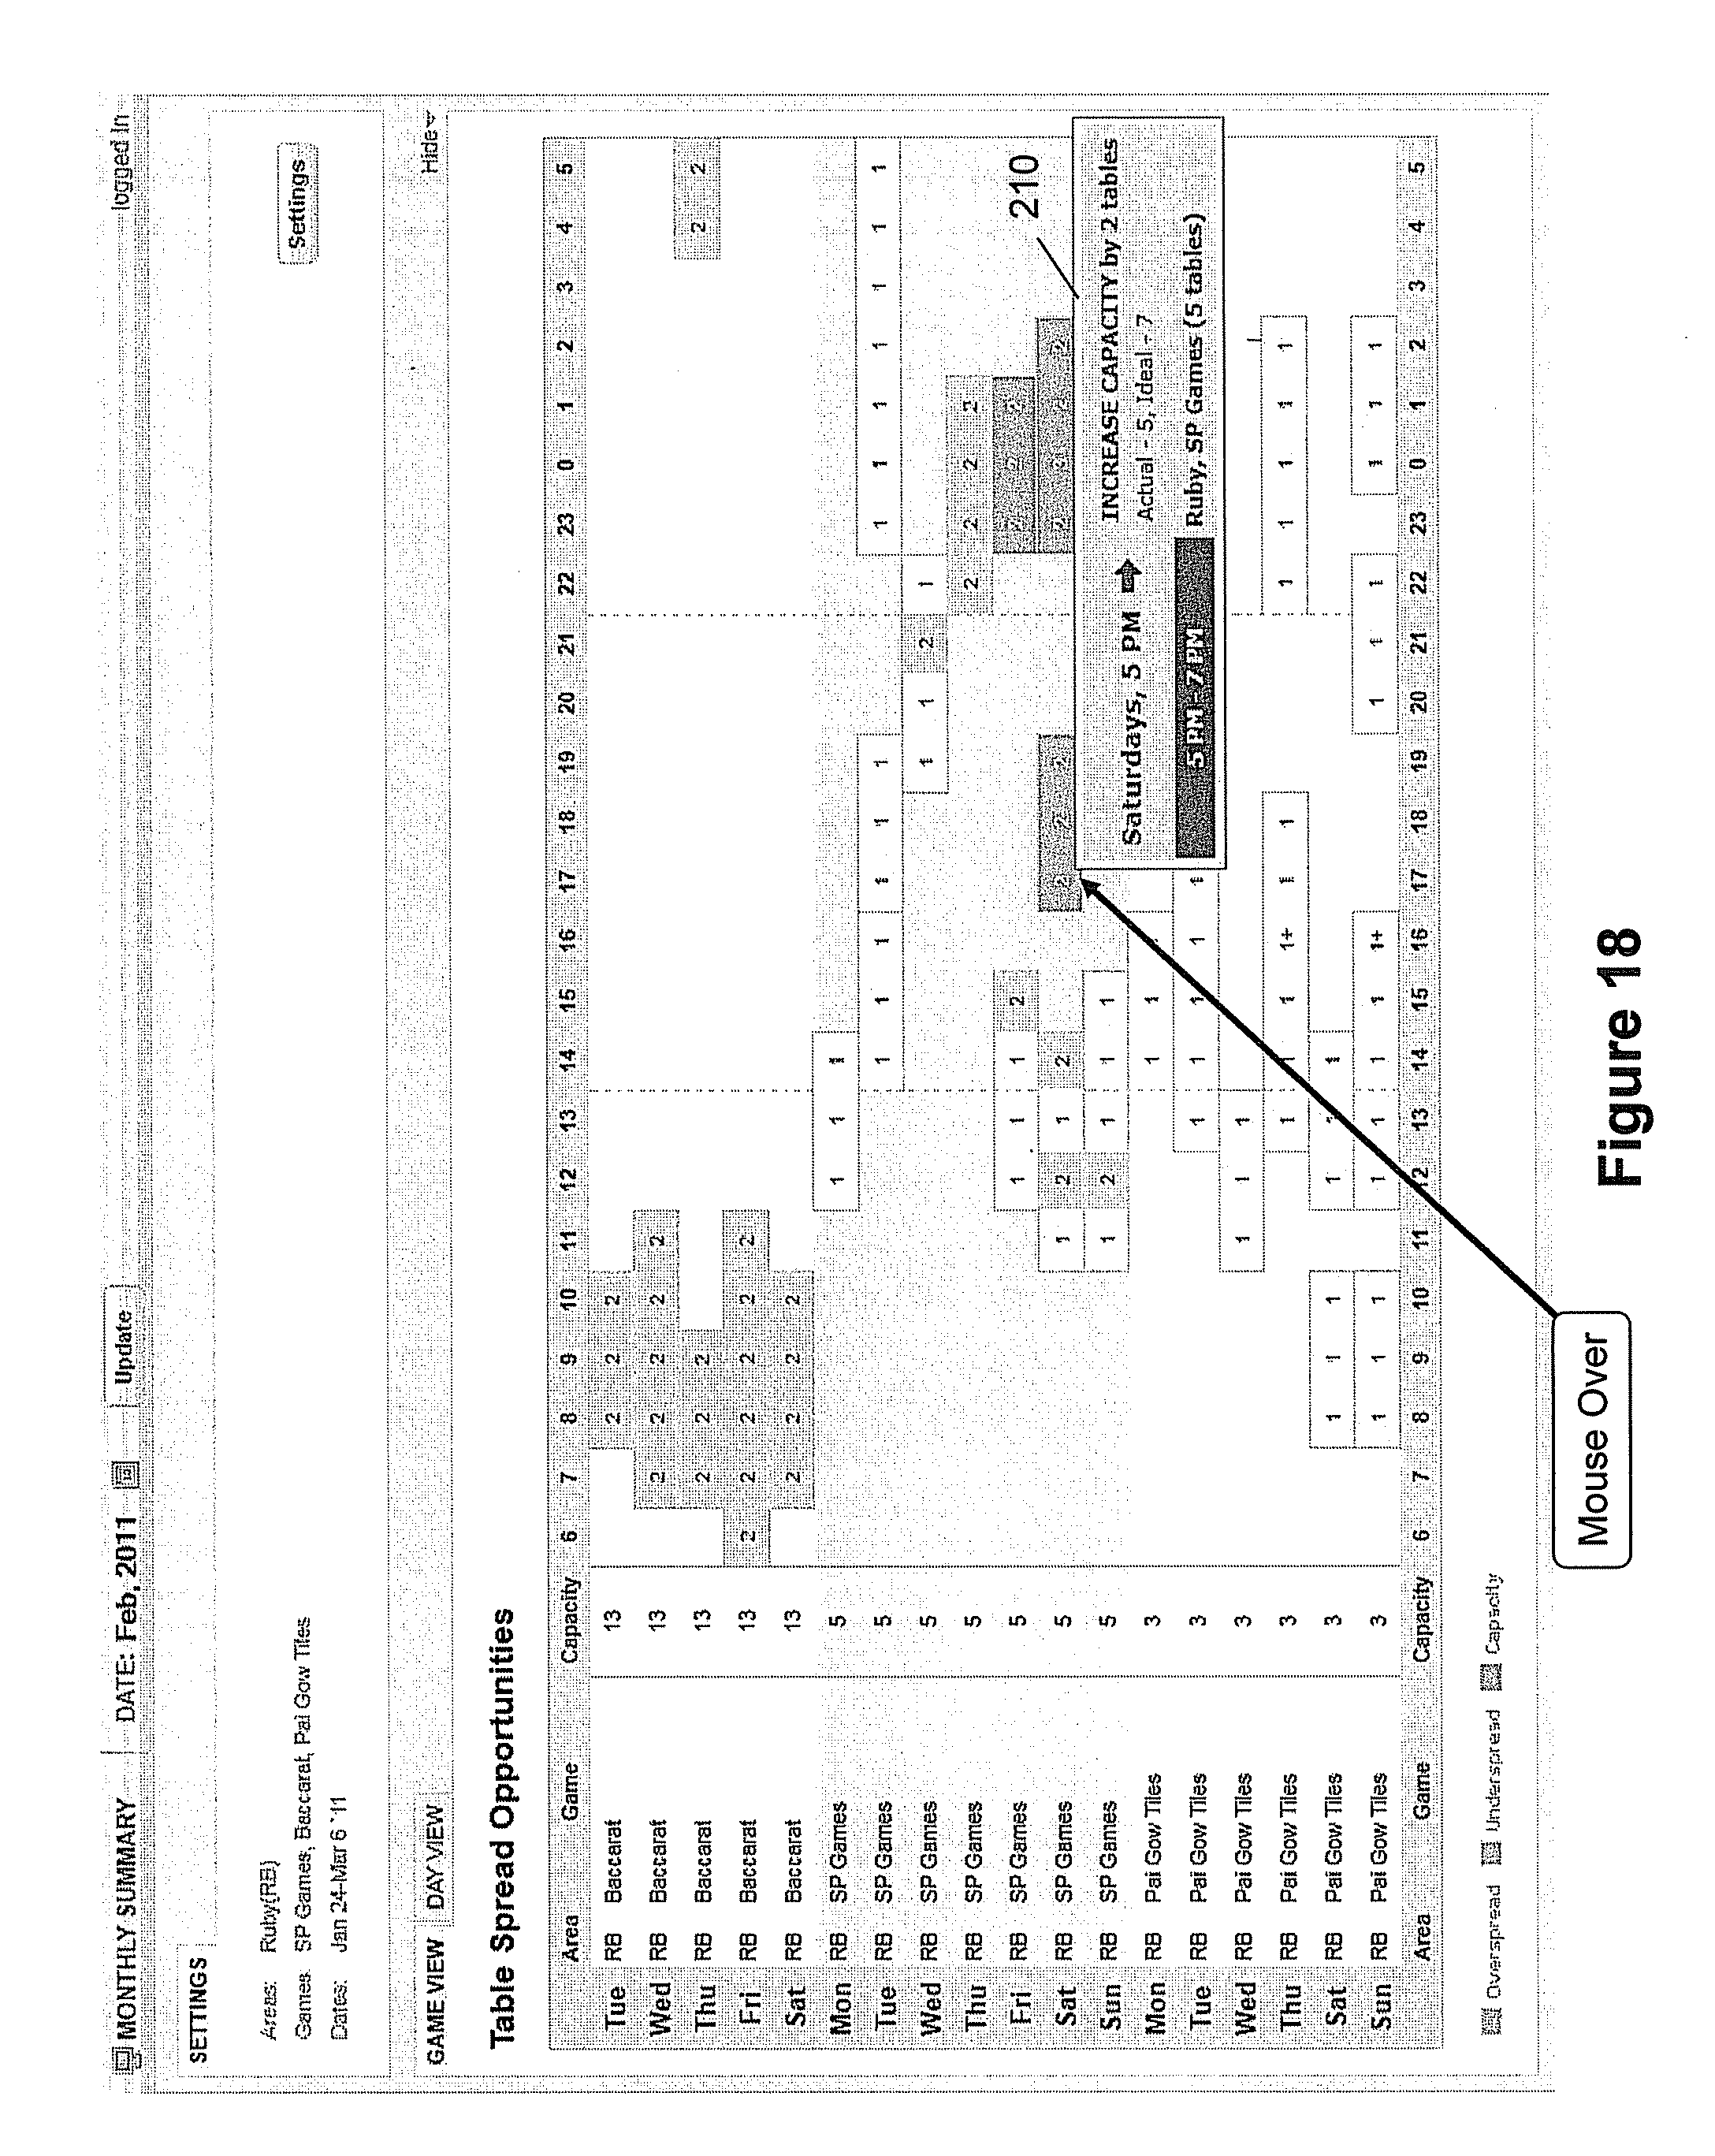
[0032] FIG. 18 is a screen shot showing a pop-up displayed upon detecting a mouse-over an at capacity cell in FIG. 15.
[0033] FIG. 19 is a screen shot showing table spread opportunities in a day view.
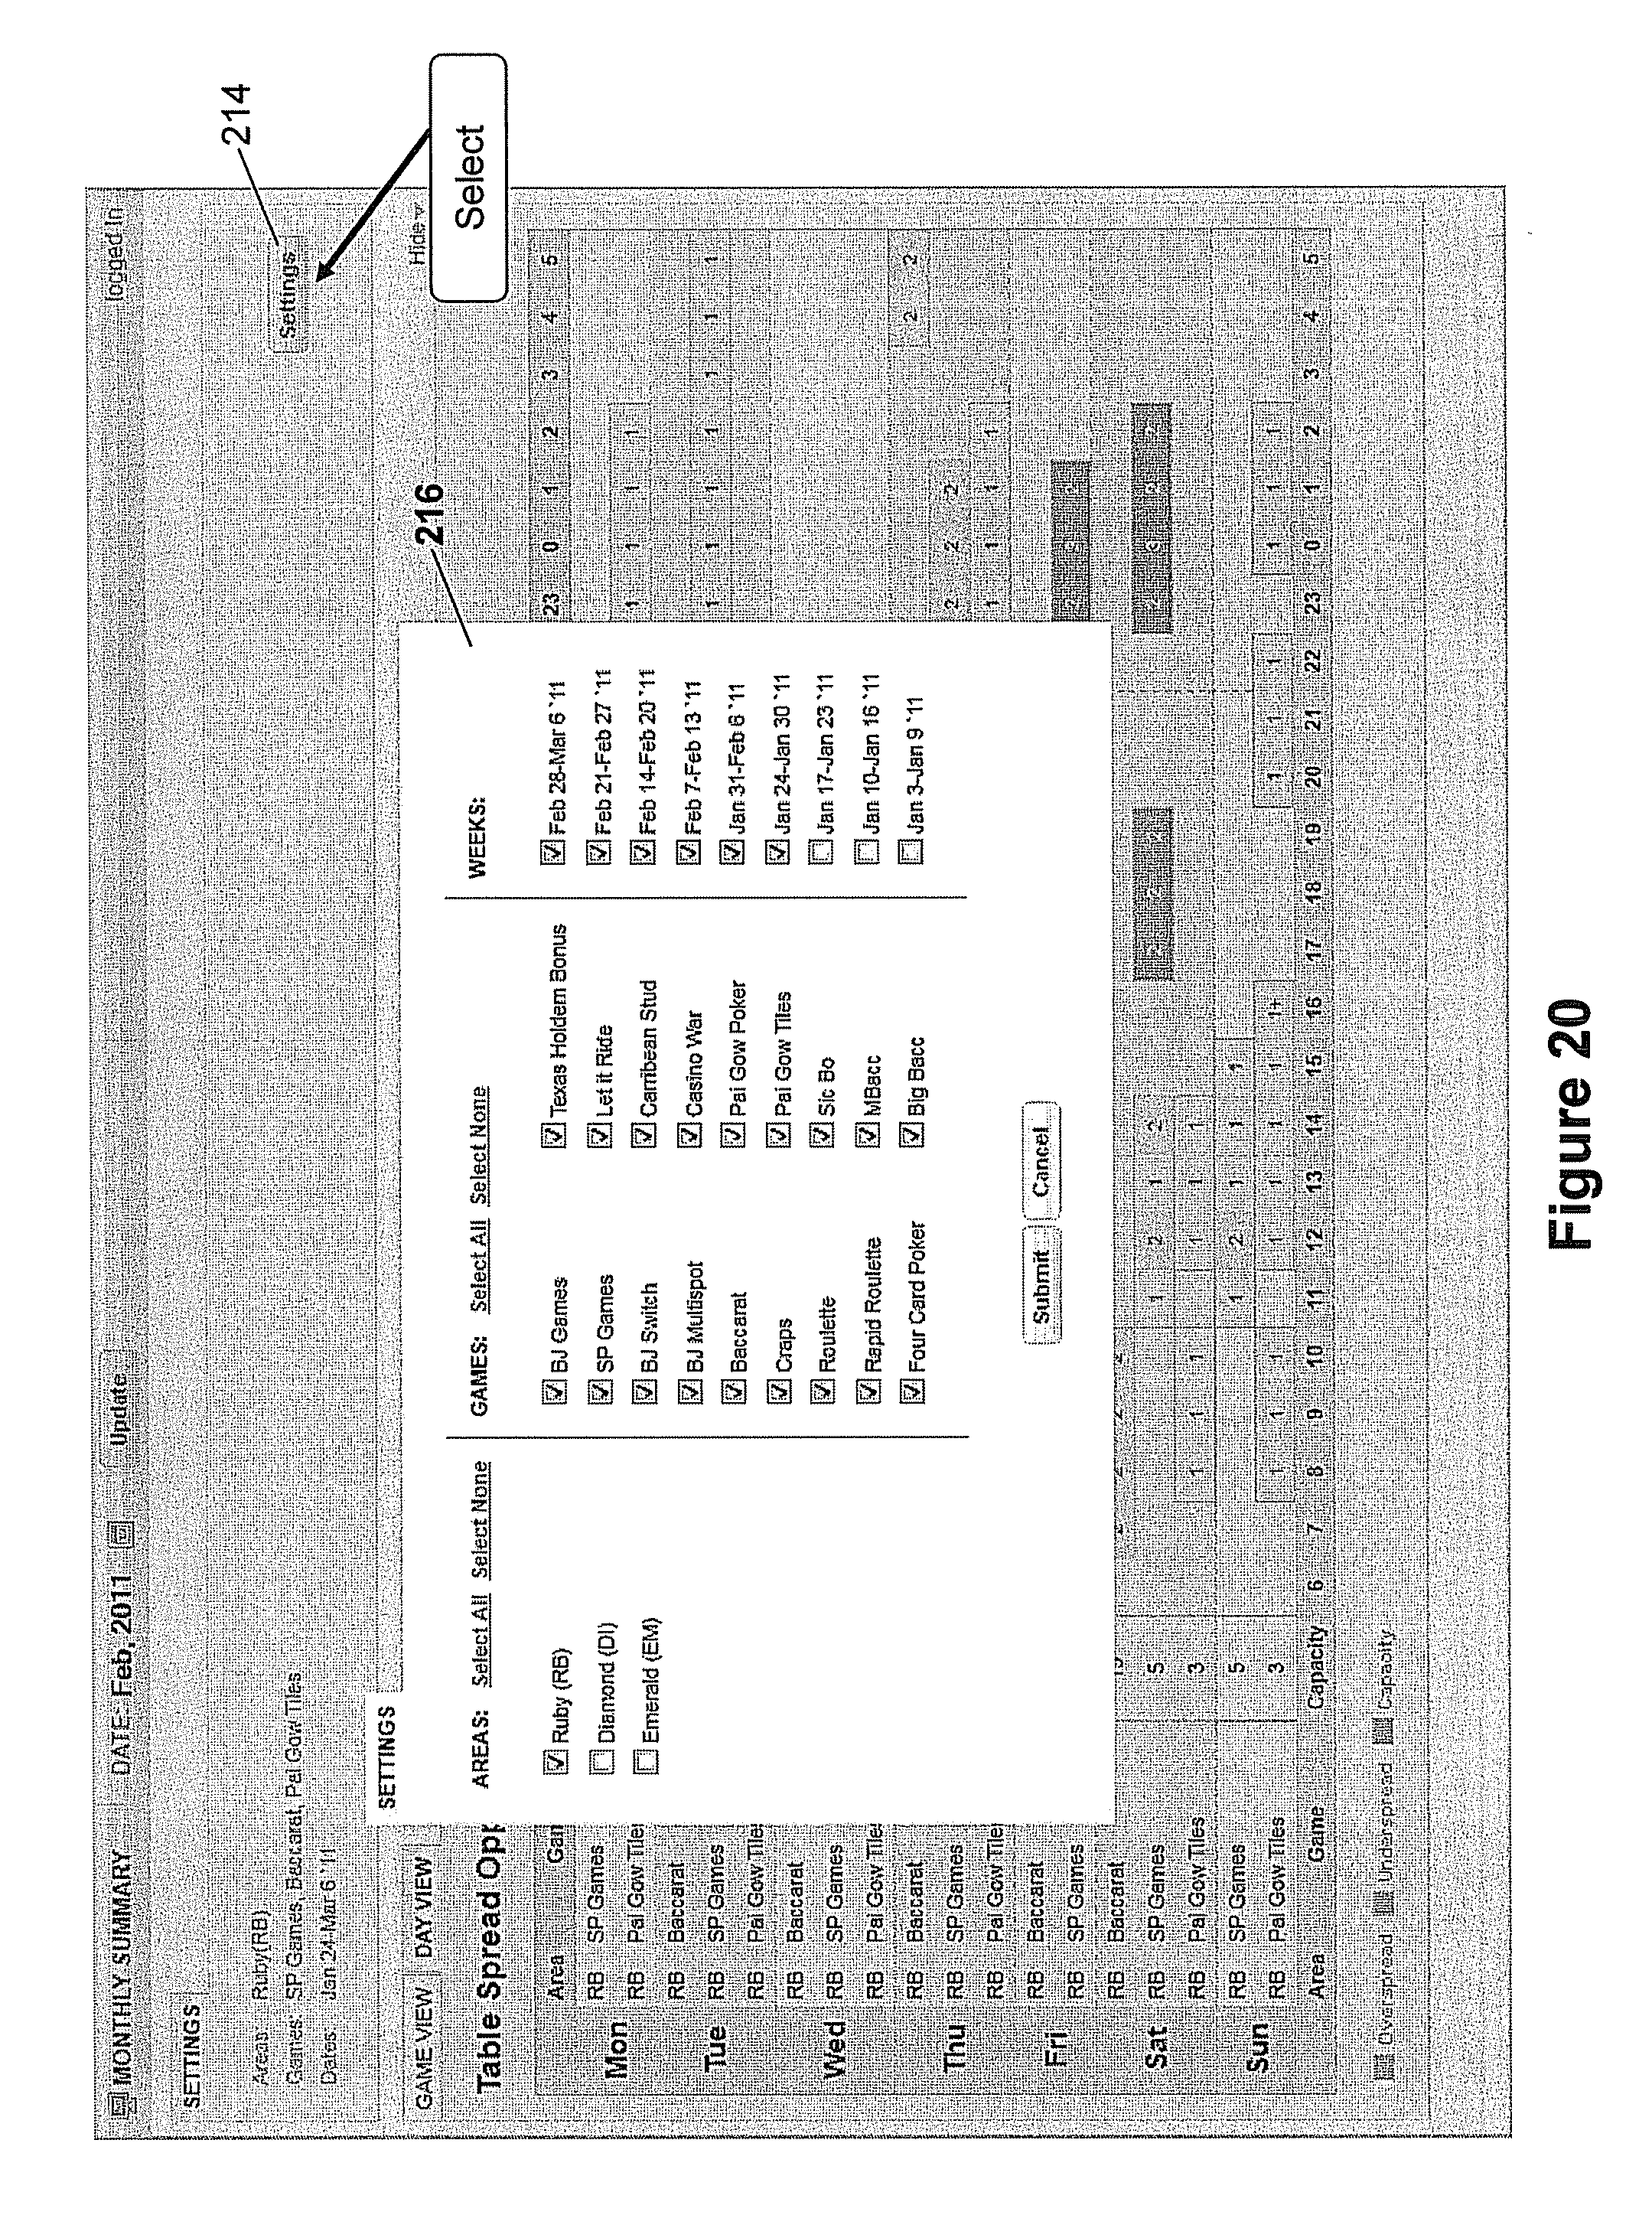
[0034] FIG. 20 is a screen shot showing a settings window.
[0035] FIG. 21 is a screen shot showing betting minimums opportunities in a game view.
[0036] FIG. 22 is a screen shot showing a pop-up displayed upon detecting a mouse-over a too high occupancy cell in FIG. 21.
[0037] FIG. 23 is a screen shot showing a pop-up displayed upon detecting a mouse-over a too low occupancy cell in FIG. 21.
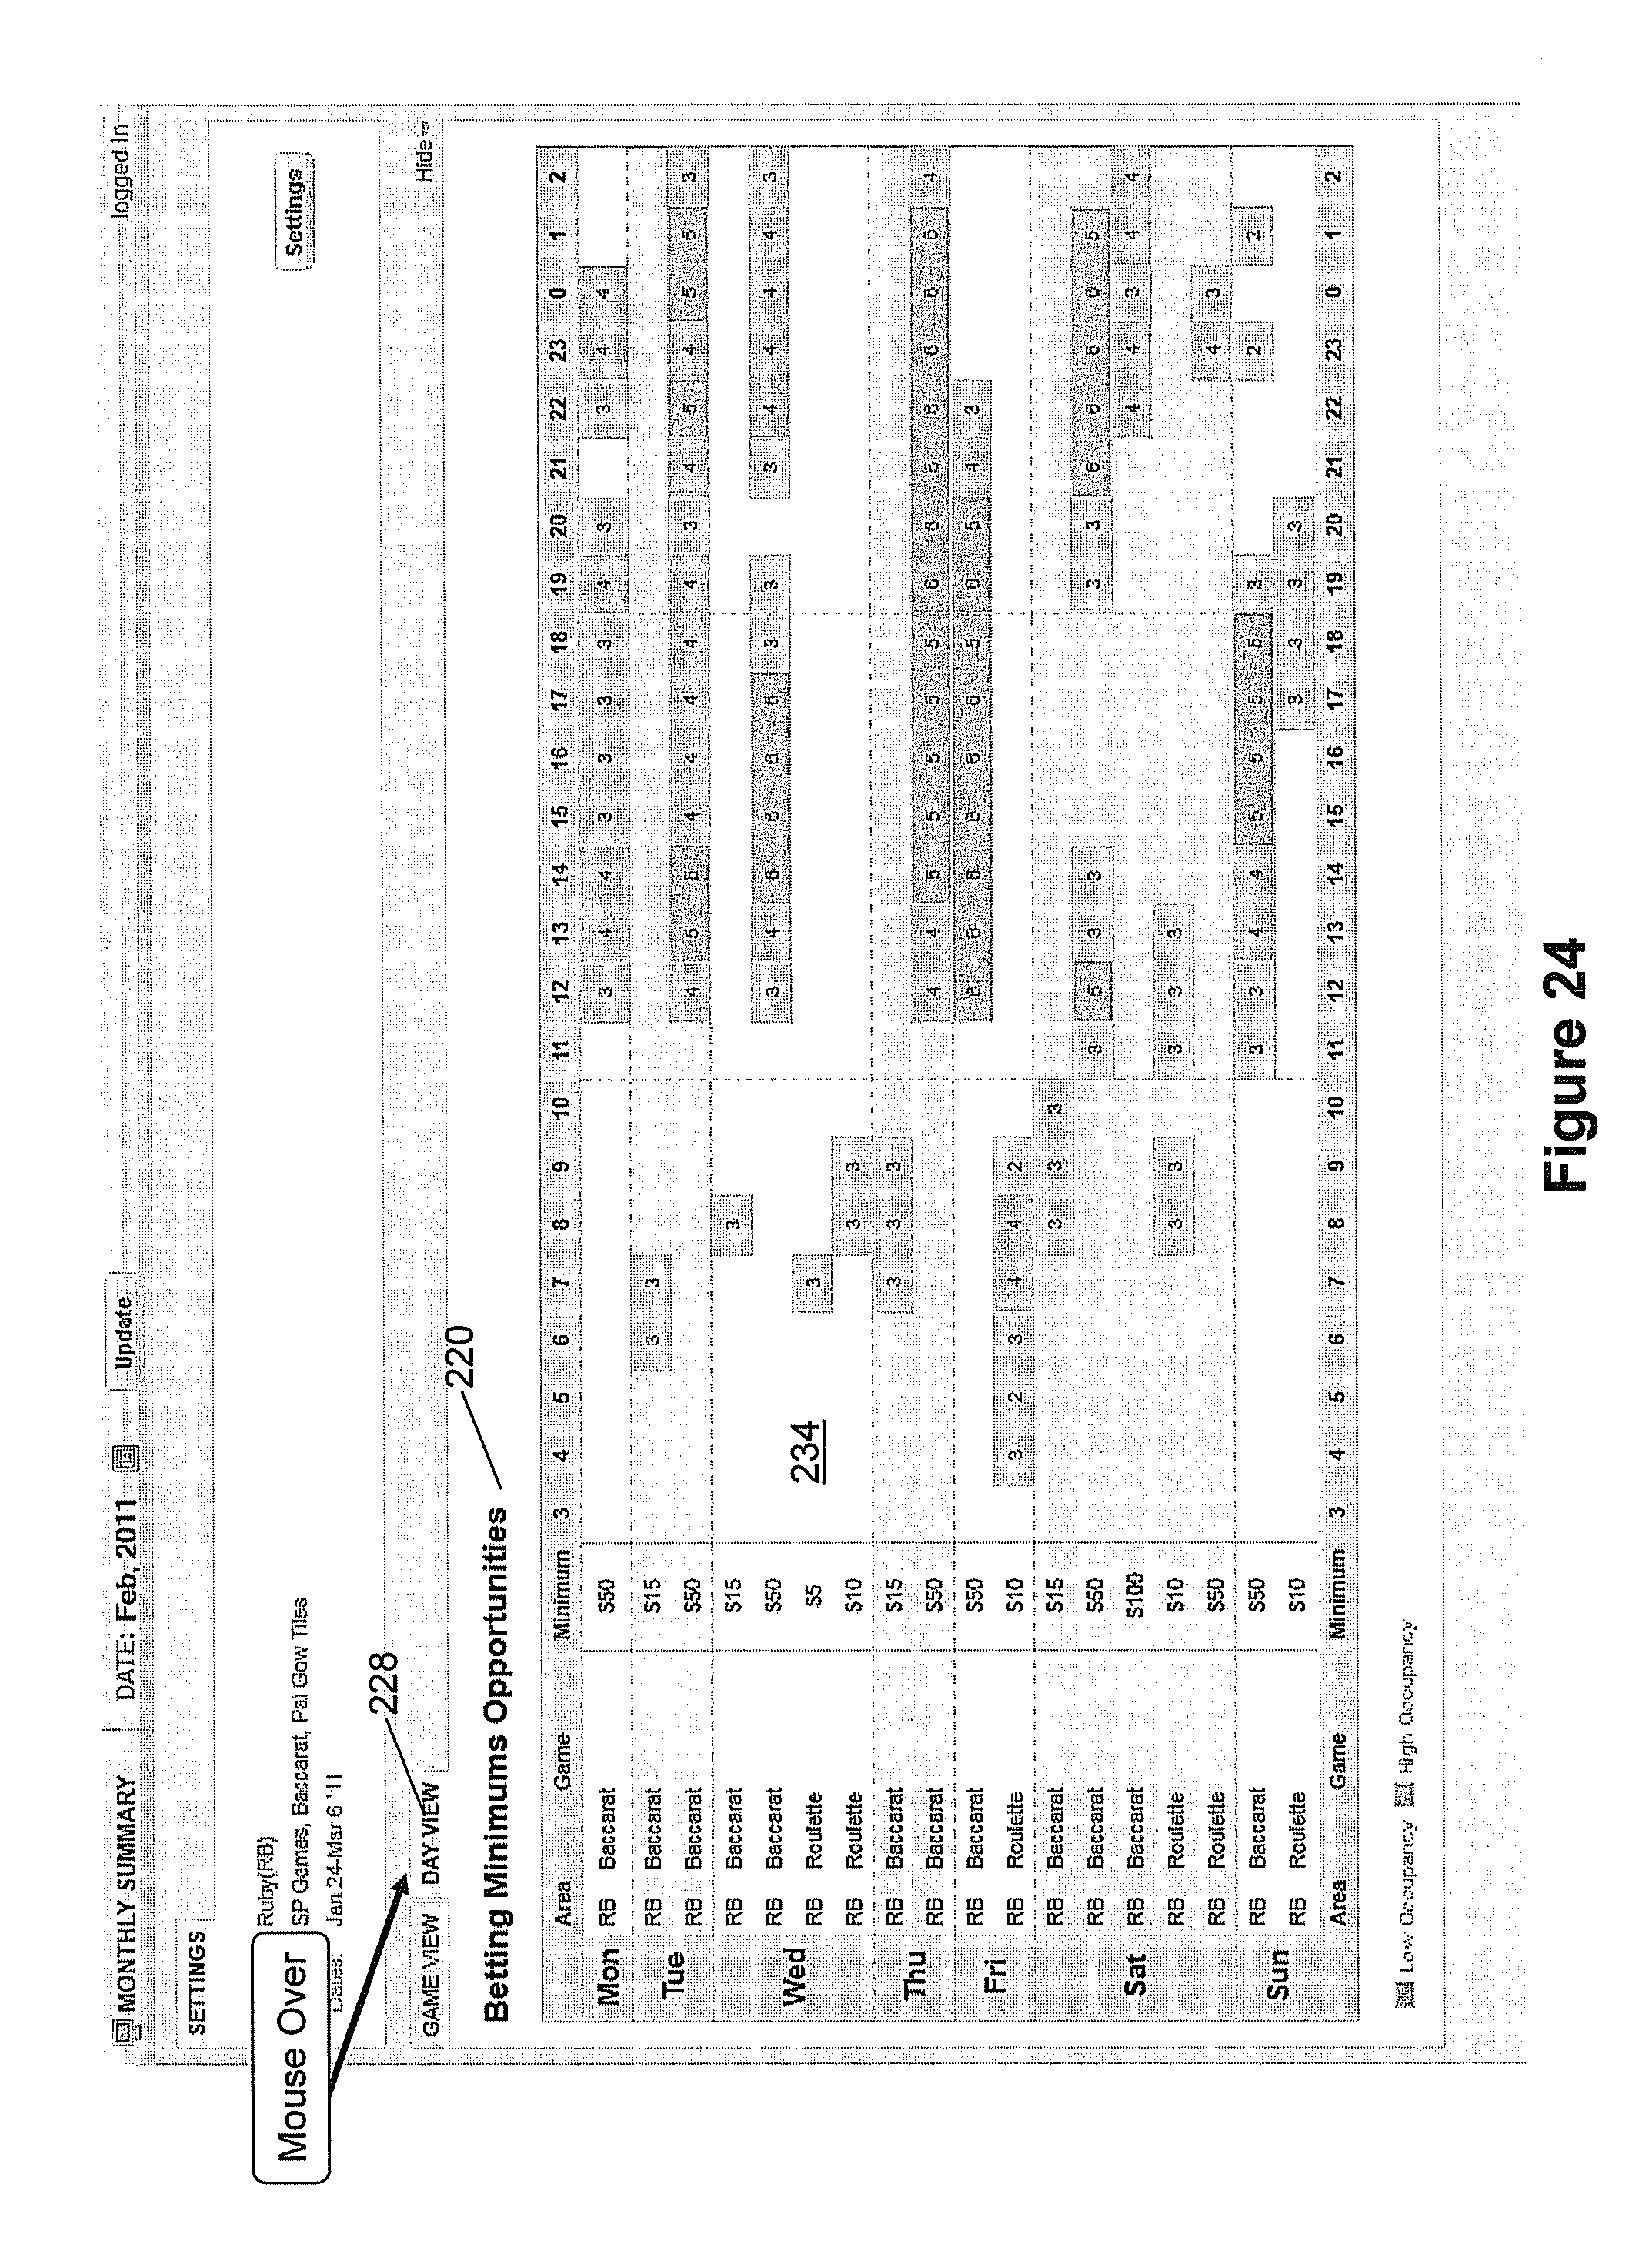
[0038] FIG. 24 is a screen shot showing betting minimums opportunities in a day view.
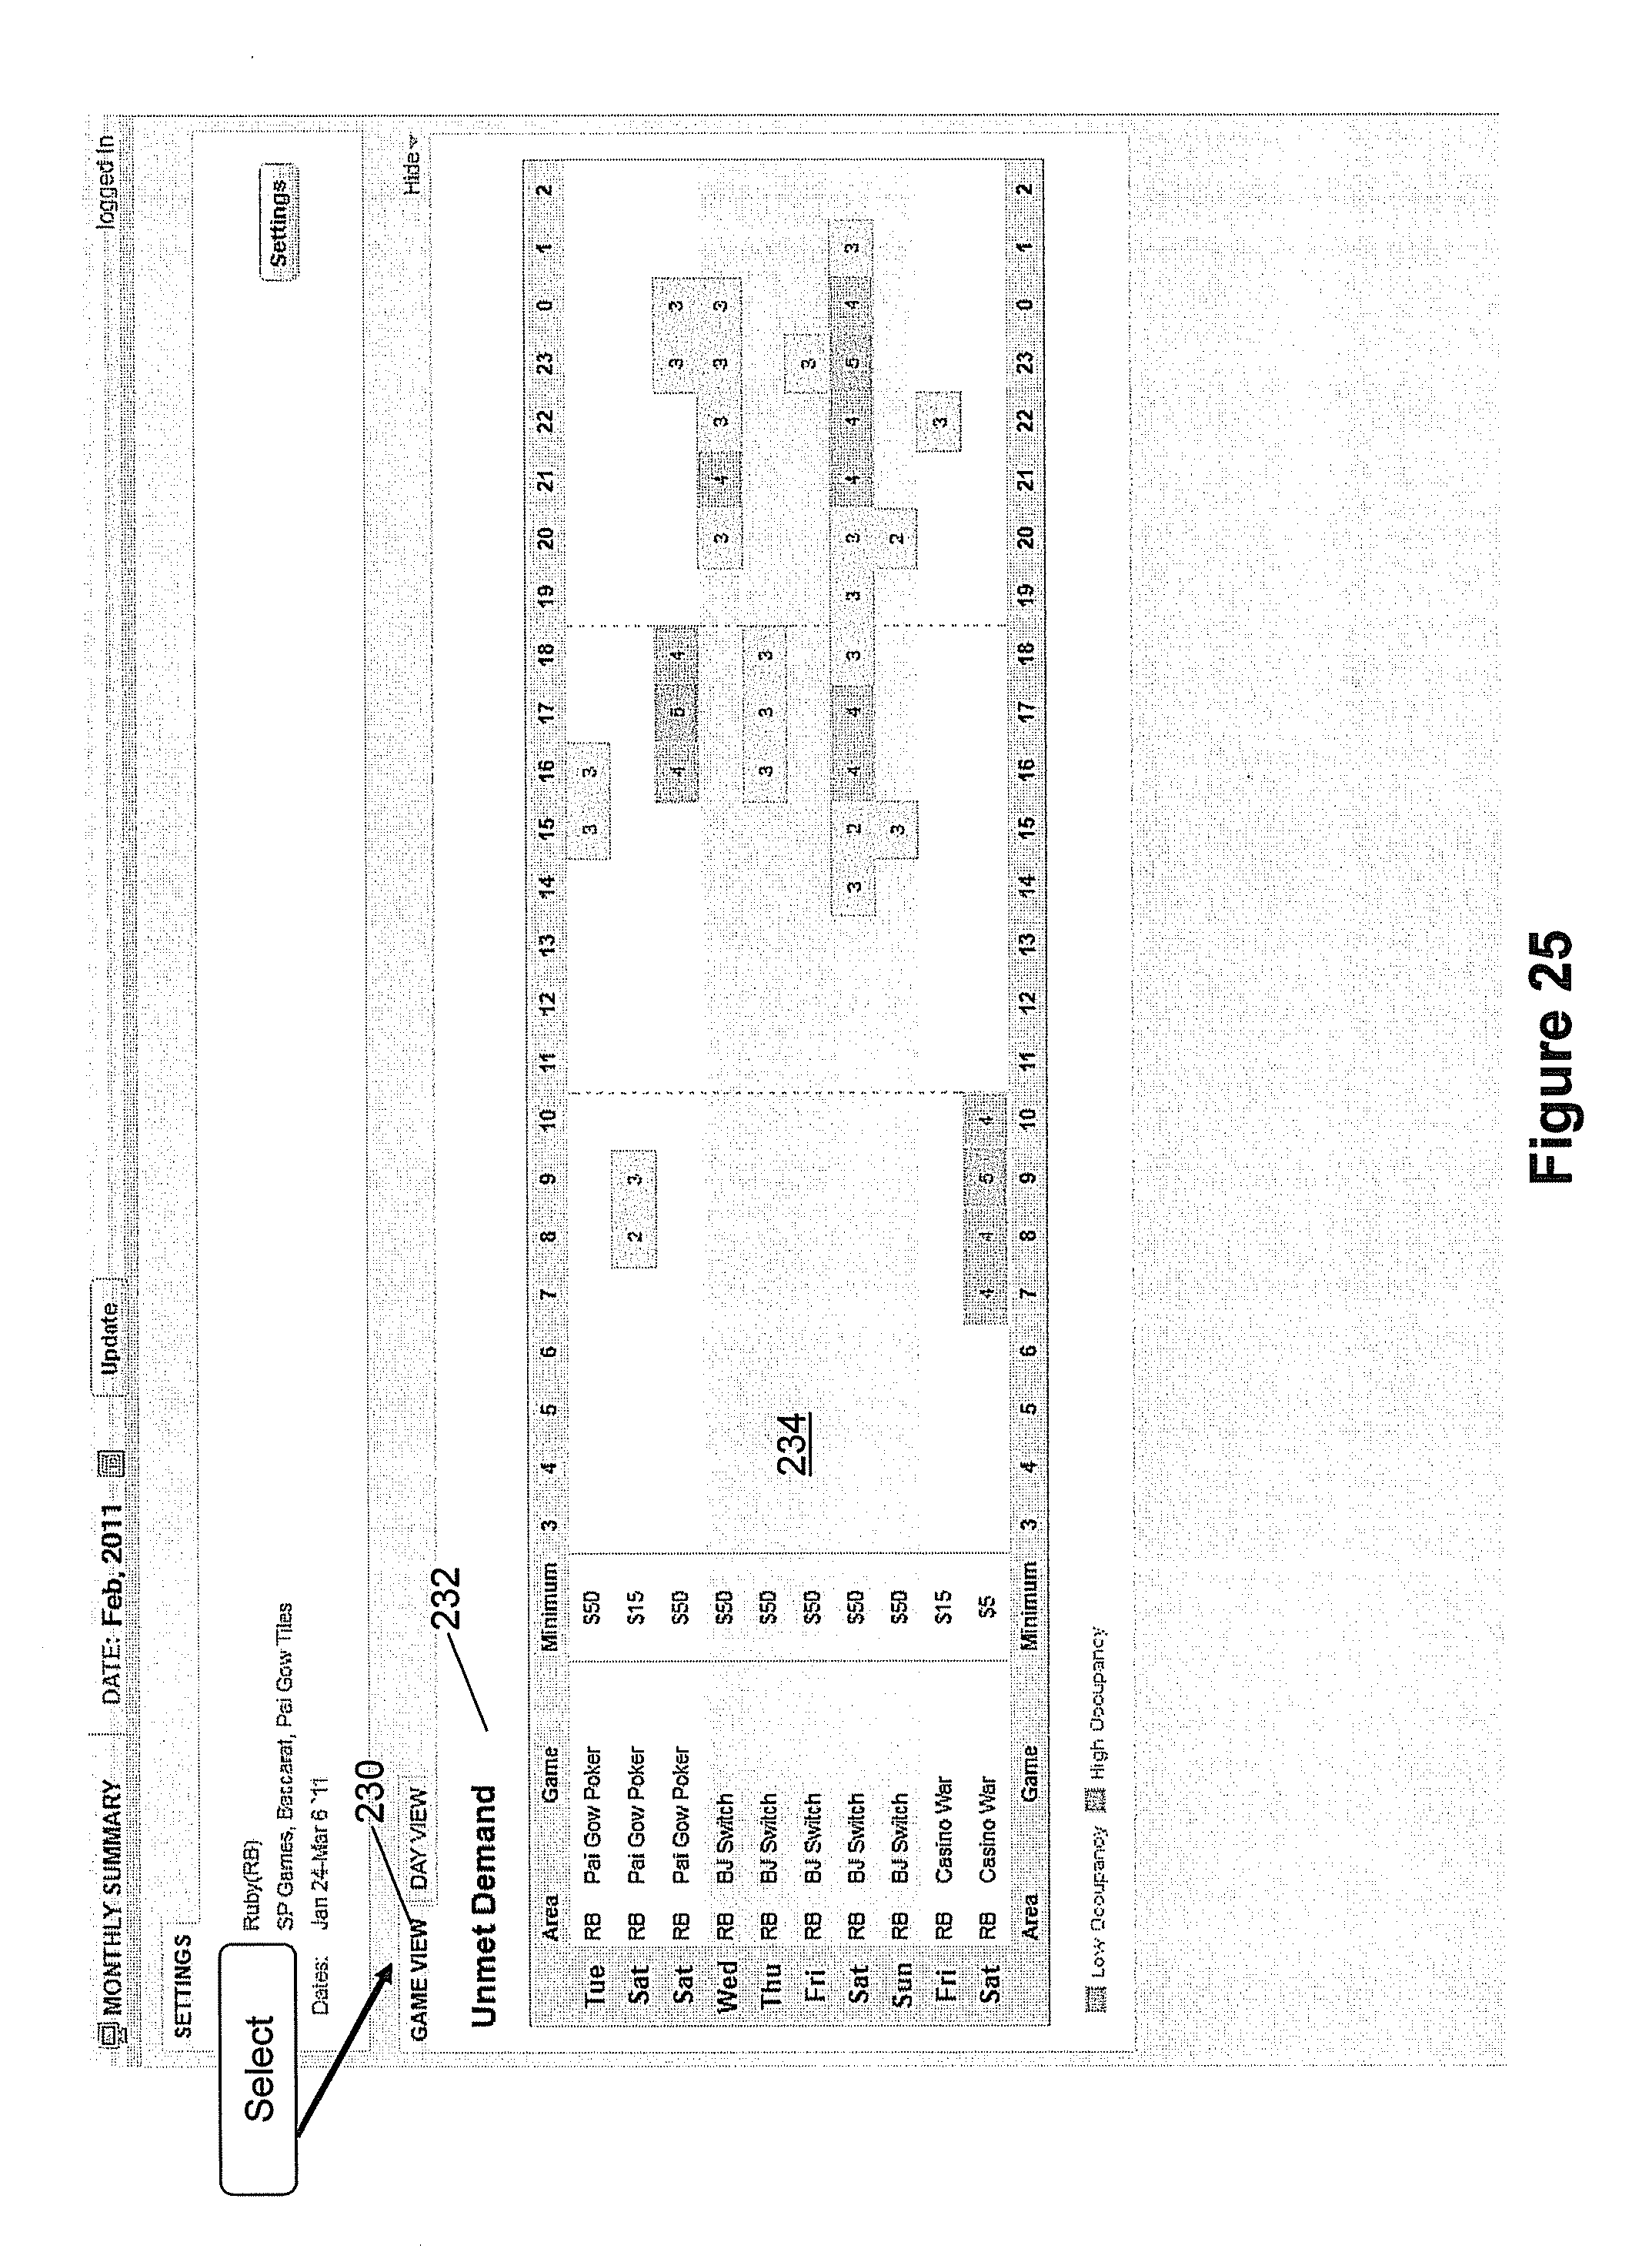
[0039] FIG. 25 is a screen shot showing unmet demand in a game view.
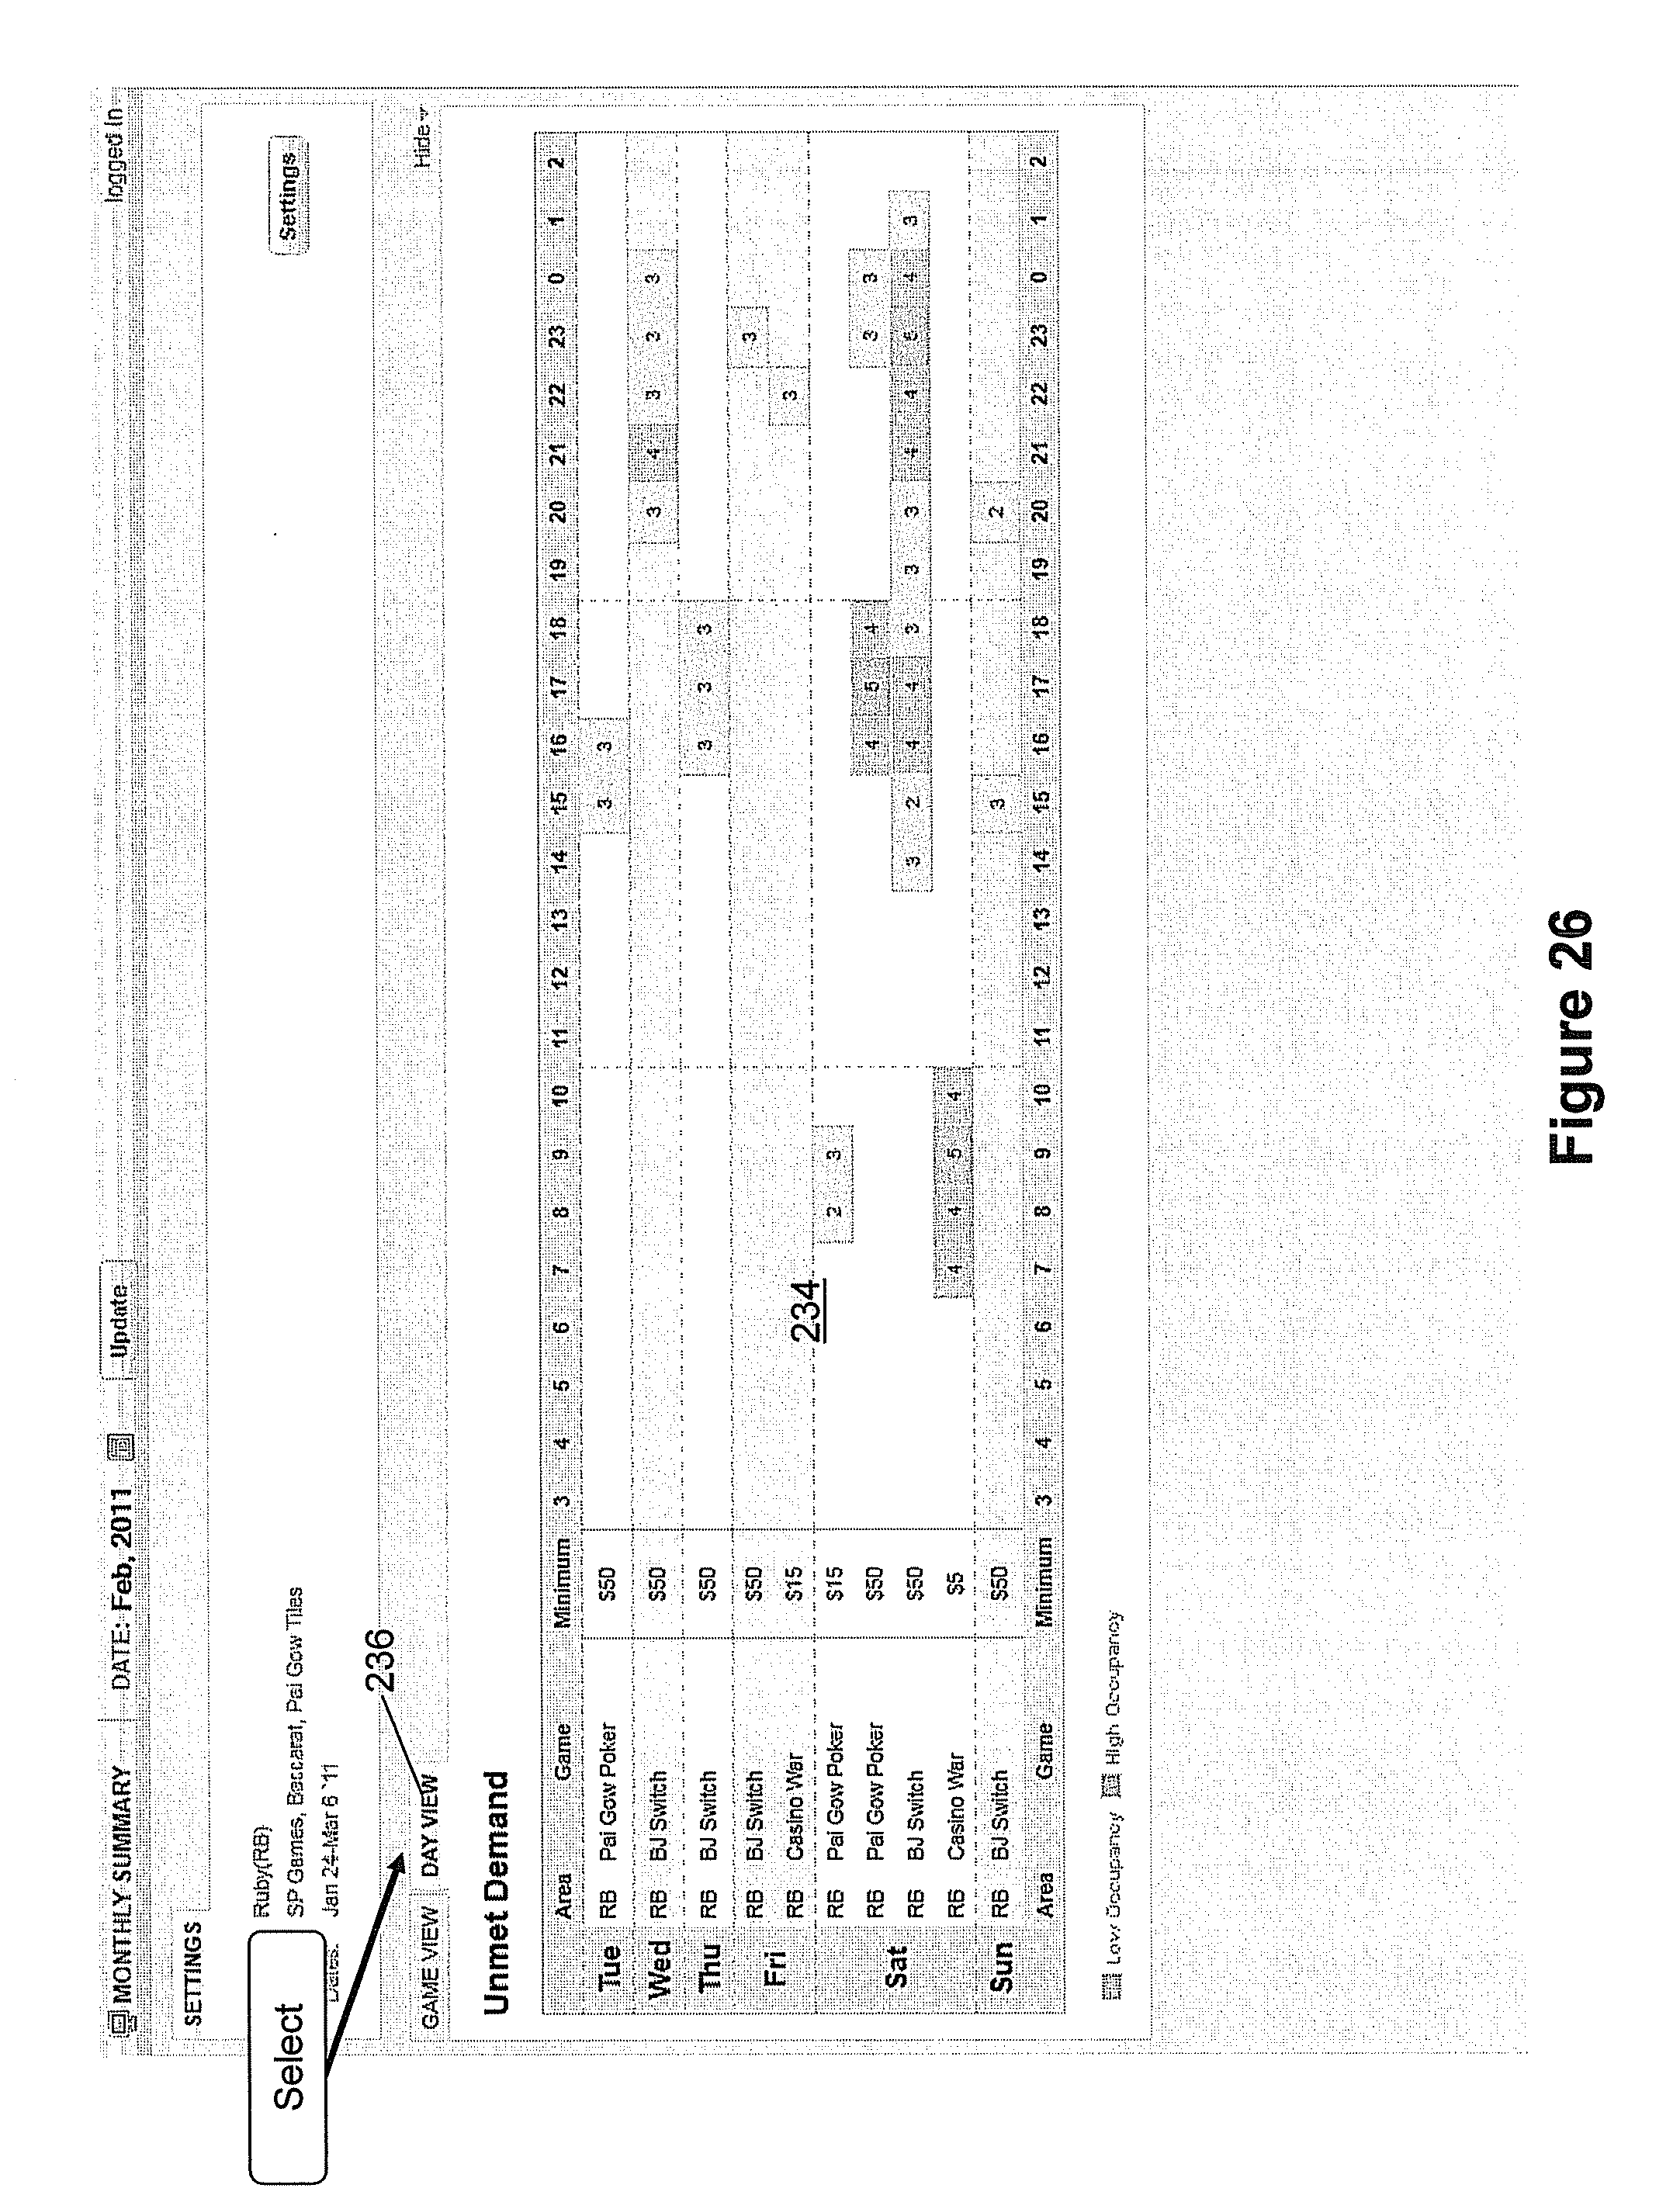
[0040] FIG. 26 is a screen shot showing unmet demand in a day view.
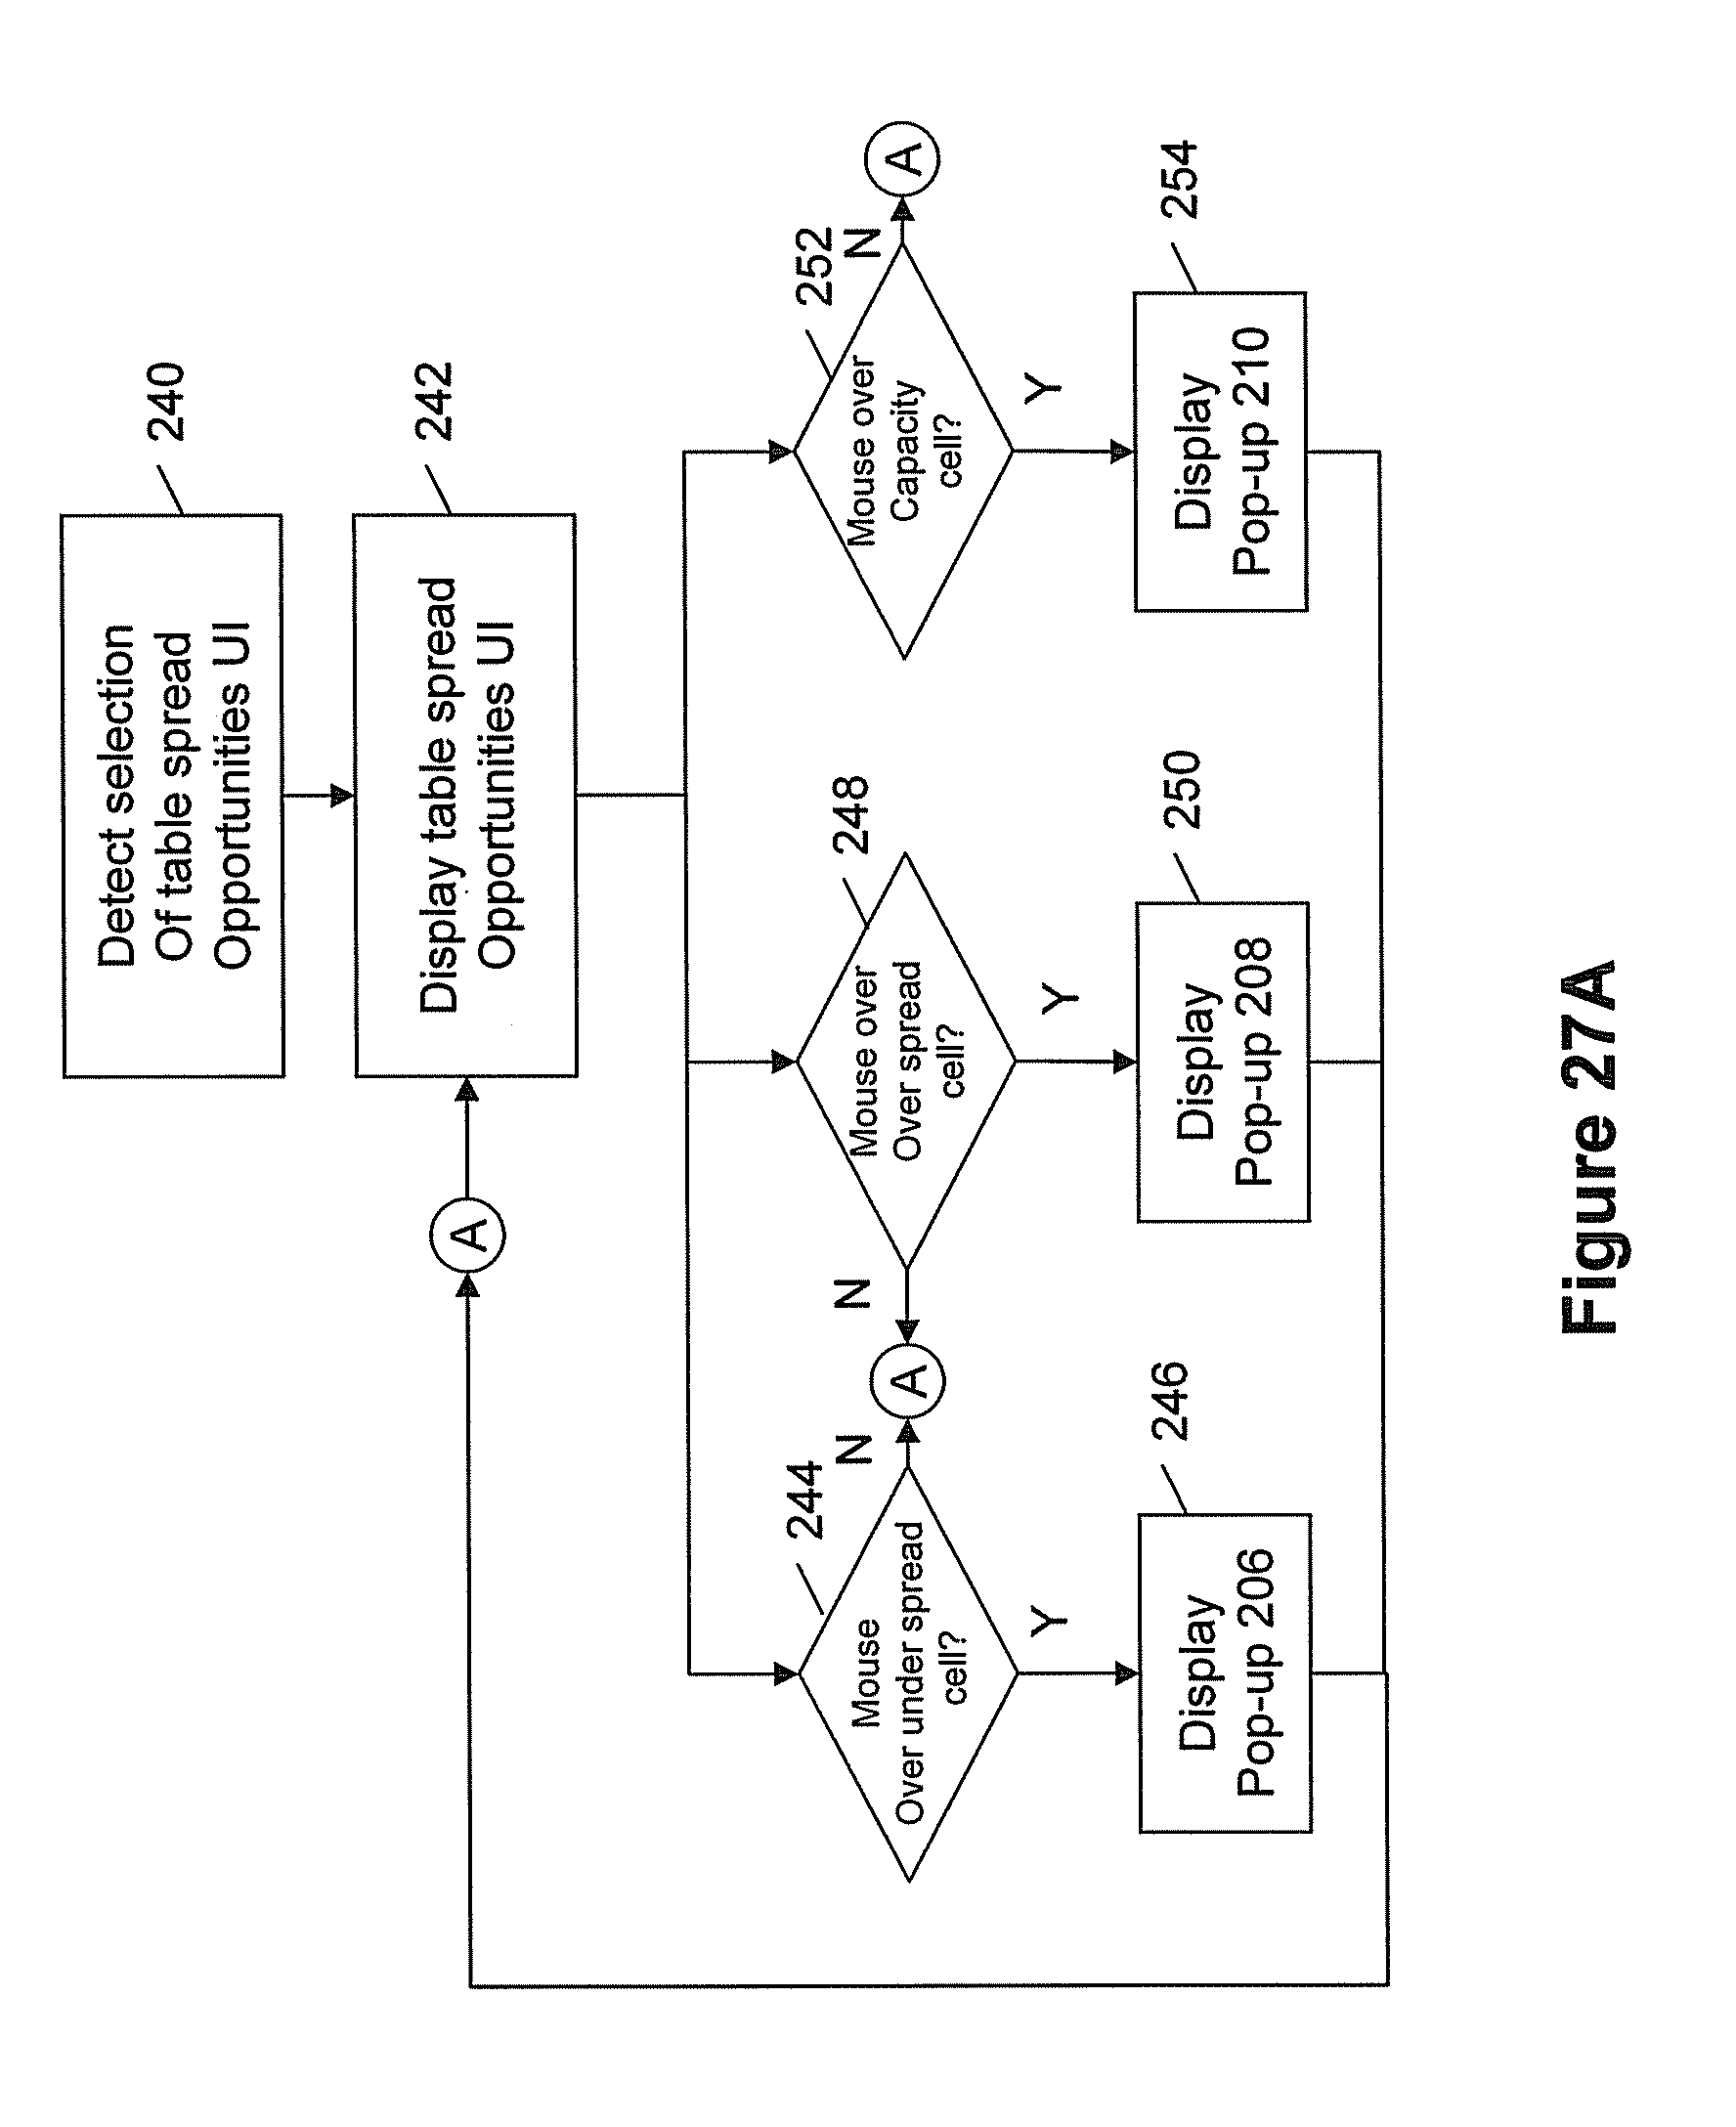
[0041] FIG. 27A is a flow chart showing a workflow for providing the screen shots in FIGS. 15-18.
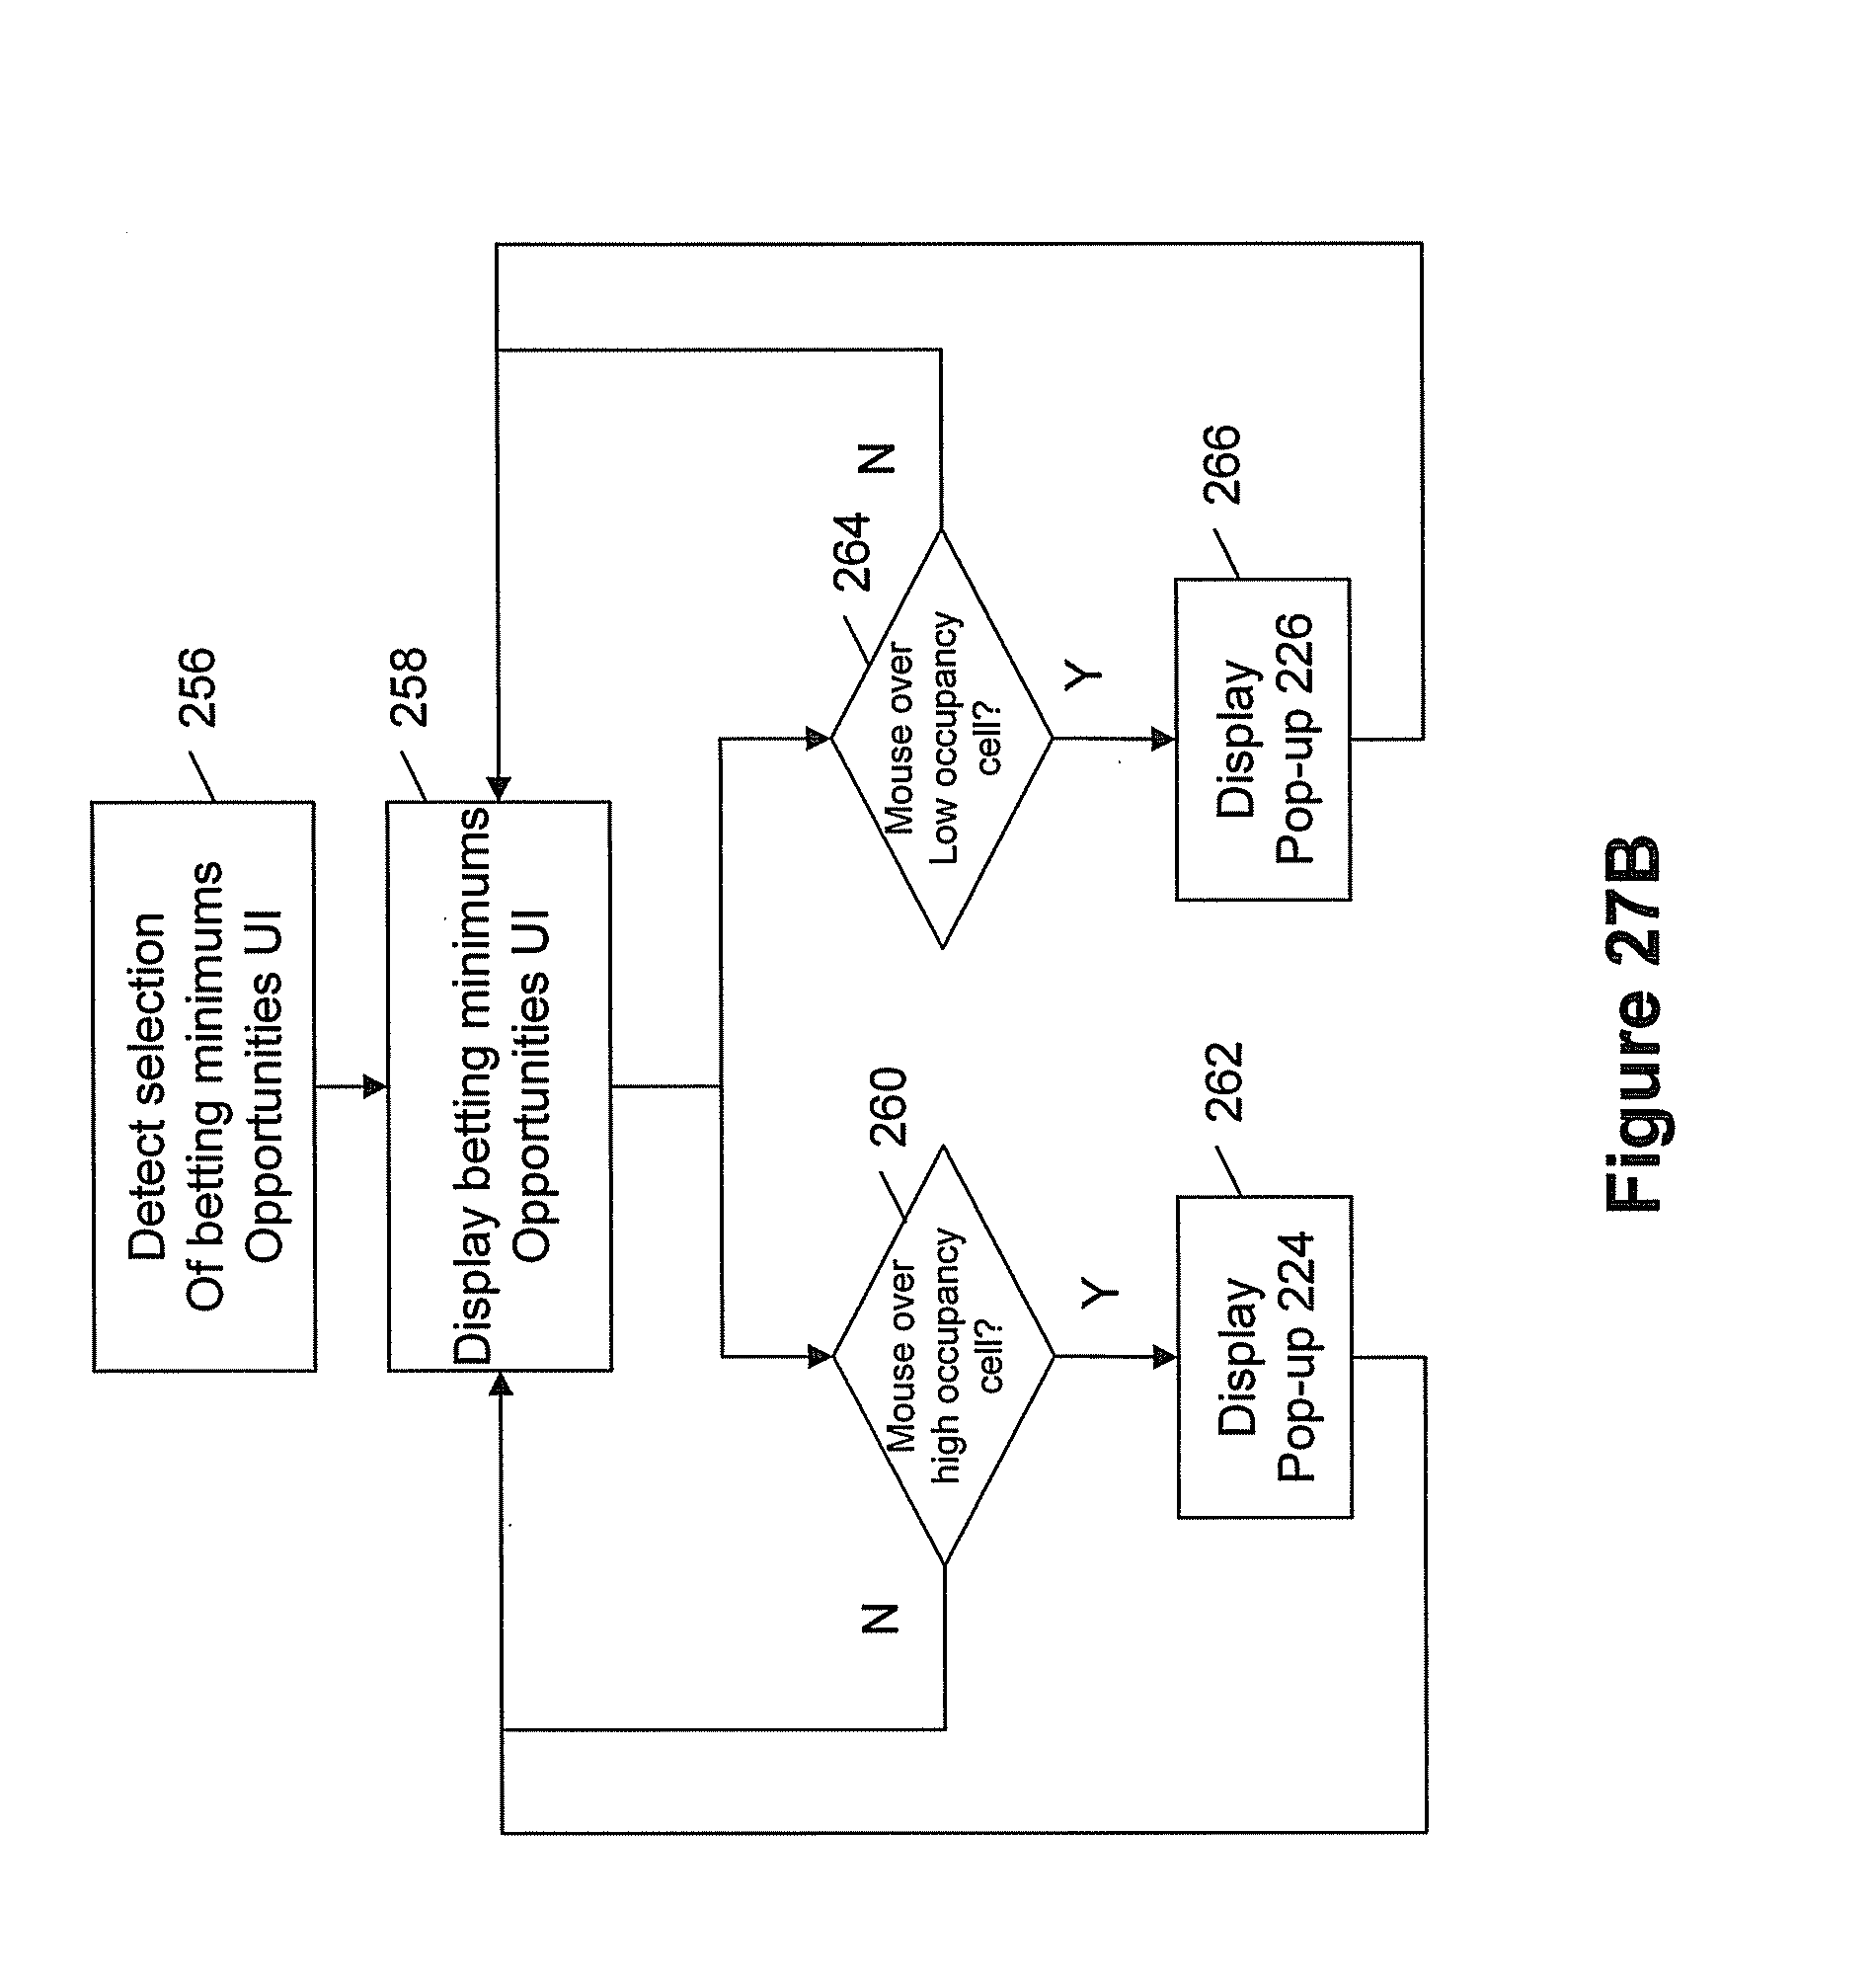
[0042] FIG. 27B is a flow chart showing a workflow for providing the screen shots in FIGS. 22-23.
DETAILED DESCRIPTION
[0043] It will be appreciated that for simplicity and clarity of illustration, where considered appropriate, reference numerals may be repeated among the figures to indicate corresponding or analogous elements. In addition, numerous specific details are set forth in order to provide a thorough understanding of the example embodiments described herein. However, it will be understood by those of ordinary skill in the art that the example embodiments described herein may be practised without these specific details. In other instances, well-known methods, procedures and components have not been described in detail so as not to obscure the example embodiments described herein. Also, the description is not to be considered as limiting the scope of the example embodiments described herein.
[0044] It has been found that current table spread data can be improved by providing intuitive data visualization, e.g., using graphical indications of where the actual number of open tables is significantly different from the ideal number of open tables. It has also been found that useful table spread information can be provided by enhancing interactivity and providing a drill down ability in order to allow users to dig deeper into the data provided beginning from high level and intuitive indications to raw data and statistics. By providing flexibility in enabling "what if" analyses and providing immediate results (e.g. by allowing days or weeks to be selectively excluded in the analysis), a user can explore various possibilities to better evaluate changes that could be made to improve profitability. By aggregating this data to show all of the opportunities in a single graphical visualization, an overall picture is provided, enhancing the decision making process.
[0045] It has also been found that there lacks an ability to measure if there was a player segment that was not being served, i.e., whether or not there is unmet or "censored" demand, which could improve profitability if this segment was being served. A system is therefore provided that graphically presents this information. The following embodiments also enable unmet or censored demand data to be aggregated over several weeks to determine whether what is found is a trend, such that the operator can act on that trend to remedy it. By presenting this aggregation in an interactive manner, the user is also provided with the ability to drill down to a detailed view.
[0046] The following embodiments also provide the ability to measure if there was an opportunity to price games differently and improve profitability. Provided is a graphical presentation of which player segments have betting minimums opportunities, and where the pricing can be adjusted. The betting minimums opportunities can also be aggregated to determine whether what is observed is a trend so that the operator can act on that trend to remedy it. By presenting this aggregation in an interactive manner, user is also provided with the ability to drill down to a detailed view.
[0047] It has been recognized that managers of casino table games often need to quickly determine which games and tables they need to close in order to save labour, and which games and tables they need to open in order to increase revenue. An interactive graphical representation of this data combined with an ability to drill down to the underlying data to verify trends makes it possible to find opportunities to close games, open games and add or remove tables to the gaming floor so as to improve profitability.
[0048] Displaying graphically how pricing of tables could be changed is particularly useful so that managers can know where opportunities exist to change pricing in order to improve profitability. An ability to drill down to a floor view makes it possible for the manager to verify the casino floor and visually see how the players are seated on tables.
[0049] Displaying graphically the time periods when an unmet demand exists helps the manager understand when this happens and for which price points. This helps them decide if they need to open more tables or add tables to meet the demand from this un-served player segment, thus improve profitability. An ability to drill down to the floor view makes it possible for the manager to verify the casino floor and visually see how the players are seated at the tables.
[0050] In some embodiments, the following system also provides a grid to show each day of the week and each game to determine how that game is spread. It is useful to have the ability to deselect certain games from the analysis, or certain days from the analysis to find out how the game is spread, compared to other games, or other days of the same game. It is also useful to know which games or time periods have the most opportunity to improve the spread by having a visual element that emphasizes this.
[0051] It is also useful to have a grid to show each day of the week and each game to determine how pricing can be changed. It is useful to have the ability to deselect certain games from the analysis, or certain days from the analysis to find out how the pricing for a game can be changed, compared to other games, or other days for the same game. It is useful to know which games or time periods have the most opportunity to change pricing and improve profitability by having a visual element that emphasizes this.
[0052] It is also useful to have a grid to show each day of the week and each game to determine where there are unmet customer segments. It is useful to have the ability to deselect certain games from the analysis, or certain days from the analysis to find out how the unmet customer segments are compared to other games, or other days for the same game. It is useful to know which games or time periods have the most opportunity to open more tables to serve the unmet customer segments and improve profitability by having a visual element that emphasizes this.
[0053] In one aspect, the following provides a method, in a casino table game yield management data processing system, of providing table spread data for a casino environment. The method comprises determining an actual number of open tables associated with a first game type for each of a plurality of time intervals; determining an ideal number of open tables at each of the time intervals; displaying a timeline comprising the time intervals, the timeline comprising, in association with each time interval, a first visual element indicative of the actual number of open tables during that time interval, and a second visual element indicative of whether the ideal number of open tables is above or below the actual number of open tables; and enabling further detail corresponding to a desired time interval to be displayed upon detecting selection of a corresponding portion of the timeline.
[0054] In another aspect, there is provided a computer readable medium comprising computer executable instructions that when executed by a casino table game yield management data processing system, perform operations comprising: determining an actual number of open tables associated with a first game type for each of a plurality of time intervals; determining an ideal number of open tables at each of the time intervals; displaying a timeline comprising the time intervals, the timeline comprising, in association with each time interval, a first visual element indicative of the actual number of open tables during that time interval, and a second visual element indicative of whether the ideal number of open tables is above or below the actual number of open tables; and enabling further detail corresponding to a desired time interval to be displayed upon detecting selection of a corresponding portion of the timeline.
[0055] In yet another aspect, there is provided a casino table game yield management data processing system comprising the computer readable medium above.
[0056] In yet another aspect, there is provided a method, in a casino table game yield management data processing system, of providing table spread data for a casino environment. The method comprises determining an actual number of open tables associated with a game type for each of a plurality of time intervals; determining an ideal number of open tables for the game type at each of the time intervals; and displaying a plurality of visual elements in a grid comparing the game type against the plurality of time intervals, each visual element being indicative of whether the ideal number of tables is above or below the actual number of tables.
[0057] In yet another aspect, there is provided a computer readable medium comprising computer executable instructions that when executed by a casino table game yield management data processing system, perform operations comprising: determining an actual number of open tables associated with a game type for each of a plurality of time intervals; determining an ideal number of open tables for the game type at each of the time intervals; and displaying a plurality of visual elements in a grid comparing the game type against the plurality of time intervals, each visual element being indicative of whether the ideal number of tables is above or below the actual number of tables.
[0058] In yet another aspect, there is provided a casino table game yield management data processing system comprising the computer readable medium above.
[0059] In yet another aspect, there is provided a method, in a casino table game yield management data processing system, of providing pricing data for open tables in a casino gaming environment. The method comprises determining, for each of a plurality of time intervals, that one or more open tables associated with a game type should be priced differently than a current pricing during that time interval; and displaying a plurality of visual elements in a grid comparing the game type against the plurality of time intervals, each visual element being indicative of whether the one or more open tables should be priced differently from the current pricing.
[0060] In yet another aspect, there is provided a computer readable medium comprising computer executable instructions that when executed by a casino table game yield management data processing system, perform operations comprising: determining, for each of a plurality of time intervals, that one or more open tables associated with a game type should be priced differently than a current pricing during that time interval; and displaying a plurality of visual elements in a grid comparing the game type against the plurality of time intervals, each visual element being indicative of whether the one or more open tables should be priced differently from the current pricing.
[0061] In yet another aspect, there is provided a casino table game yield management data processing system comprising the computer readable medium above.
[0062] In yet another aspect, there is provided a method, in a casino table game yield management data processing system, of providing pricing data for open tables in a casino gaming environment. The method comprises determining, for each of a plurality of time intervals, that there is unmet customer demand at one or more price points associated with a game type during that time interval; and displaying a plurality of visual elements in a grid comparing the game type against the plurality of time intervals, each visual element being indicative of unmet customer demand.
[0063] Turning now to the figures, a yield management system 35 is shown, which comprises a yield management server 30, which processes data stored in a casino table player database 40 as shown in FIG. 1. The processed data can be provided over a network 20 as also shown in FIG. 1. The casino table player database 40 stores information indexed by time, which can contain one or more of the following: minimum bet (or price point) of the open tables, the headcount at each of the open tables, and the average wager and seat position of each player at the open table. The data in the casino player database can come from a variety of sources and several sources at once, including but not limited to an existing casino player ratings system, manual data entry from a Tablet PC, automated data collection technologies such as RFID embedded casino chips or video analytics. The yield management server 30 processes the data and produces various user interface (UI) dashboards that can be viewed by a client 10 provided, e.g., at a gaming station 12. It can be appreciated that the dashboards can also be displayed at any computer, such as one that is located in a casino manger or executive's office and the gaming station 12 is shown in FIG. 1 for illustrative purposes only.
[0064] FIG. 2 is a block diagram showing an example of a configuration for the yield management data processing system 35 shown in FIG. 1. The casino table player database 40 is responsible for capturing and storing all of the information necessary to effectively analyze a casino game floor and improve the yield management. This information may include the set of current open tables and the players on these tables with their wagers. The information can include one or more of the following: the table minimum, the number of players at the tables, the number of spots being played, and the wager at each spot.
[0065] A business rules editor and data store 50 is shown for editing and storing business rules. The business rules correspond to data that contains information regarding how the gaming floor will be managed by a yield management analysis module 52. The business rules can function by storing the information in a file for easy access, and modifications by a user. Any basic text editor can be sufficient to access, edit and save the pertinent data. This file or data can be saved in a database indexed on the period of time that this information was applicable for. This allows a historical review of the casino state for any relevant time period.
[0066] The business rule data can be accessed on demand by the user, or by the yield management analysis module 52, to review, modify or access its content. Once created or modified, casino game operations model data 54 can be loaded automatically when the system is reset or initialized, or can be manually uploaded to override the current information.
[0067] The following describes sample information that a user can provide for the business rules. It can be appreciated that the following example is illustrative and should not be considered exhaustive.
[0068] The user can specify optimal occupancy levels (or target occupancy) for each price point. This is the desired average number of players seated on a table game at a specific price point. The target occupancy numbers are specified in the business rules and are used to determine the ideal number of tables that need to be opened for a given time period given the demand at that time period.
[0069] The casino game operations model data 54 is a file store that contains the representation of the casino floor and the data relevant to the efficiency in operating these resources. The casino game operations data functions by storing the information in a content centered manner for easy access, and modifications by a user. Any basic text editor is sufficient to access, edit and save the pertinent data. This file or data can be saved in a database indexed on the period of time that this information was applicable for. This allows a historical review of the casino state for any valid time period.
[0070] The casino game operations model data 54 may be accessed on demand by the user, or by the yield management analysis module 52, to review, modify or access its content. Once created or modified, the casino game operations model data 54 can be loaded automatically (or otherwise accessed) when the system is reset or initialized, or can be manually uploaded to override the current information.
[0071] Information that a user needs to provide for the casino game operations are the list of tables that will be managed by the yield management system 35, the number of spots available on each table, the game type of each table and the location of the table relative to a casino pit.
[0072] The purpose of the yield management analysis module 52 is to analyze the data from the player ratings system (e.g. the casino table player database 40) and use the casino game operations model data 54 to determine, for each time period, the aggregated actual number of open tables, the aggregated number of ideal open tables based on the player demand, how pricing for the open tables can be changed, and where there exists unmet demand for a particular game. The yield management analysis module 52 also has the capability to aggregate any of these data over several time periods.
[0073] A daily summary dashboard generator 56 is also provided, in order to prepare a summary of an individual day for at least one game in the casino. A graph can be generated for each game of the casino showing the actual number of open tables at each hour, the ideal number of open tables at each hour, and whether the actual number of open tables is above or below the ideal number of open tables during that hour. In addition to this, the daily summary dashboard generator can also be used to show graphically how the pricing at particular open tables could be changed, and where there exists unmet demand for a particular price point.
[0074] A game trend dashboard generator 58 is provided in order to prepare a summary of one game in the casino to show the trends for the same game at the same time period for a user defined selection of dates. A graph can be generated for the game in the casino for the selected dates showing the aggregated actual number of open tables during each hour, the aggregated ideal number of open tables during each hour, a graphic showing the aggregated pricing changes of open tables, and a graphic showing the aggregated unmet demand for a particular price point. The aggregation can be an average, median, mean, weighted average or percentile. The user can select any time period for the analysis and can exclude days such as holidays or special events that can skew the trends.
[0075] A casino trend dashboard generator 60 is provided to aggregate all the data from all the games for a user defined selection of dates in a grid. This module creates a grid that shows each game and day against each hour of the day. Each element in the grid can show whether the aggregated ideal number of tables is over or under the aggregated actual number of tables for that day and hour, the aggregated pricing changes for that game and hour, and the aggregated unmet demand for that game an hour. The casino trend dashboard generator 60 also allows the user to select/deselect games to show in the grid, and arrange the grid by each game, or by each day of the week, as will be shown in greater detail in the screen shots described below.
[0076] A dashboard display unit 62 is also provided to displays the dashboards generated by the daily summary dashboard generator 56, the game trend dashboard generator 58, and the casino trend dashboard generator 60. The dashboard display unit 62 sends the user selected information relevant to each of the dashboard generators 56, 58, 60, so that a particular dashboard generator 56, 58, 60 displays relevant information.
[0077] FIG. 3 shows a daily overview summary UI 70. The daily overview summary UI 70 includes, for one or more games, a first visual element 72 associated with each of a plurality of intervals, e.g. a portion of a line graph as illustrated, that shows the actual number of open tables during that time interval, and a second visual element 74 that is indicative of whether the actual number of open tables is above or below an ideal number of tables during that time interval. From the daily overview summary UI 70, the user can pick any day to populate the summary for each game in the casino. A chart is populated for each game in the casino, and the actual number of open tables and ideal number of open tables are plotted in each chart. For the purpose of this description, we use the Blackjack Games in the casino shown. An indication of the maximum capacity of each game 76 is also shown on the chart so that the user can quickly determine where they have capacity to open more games. The actual number of open tables are sampled at each time period, in this example, on the hour. The ideal number of open tables are determined from the average player supply for that hour in the casino and the optimal or target occupancies for each price point. The ideal number of tables for each price point are aggregated to determine the actual number of tables to open. The second visual element 74 in this example comprises shading of the chart, which changes for time periods when the ideal and actual number of tables are significantly different, so as to draw the attention of the user to these areas. The actual open and ideal open tables for the each game show the operator how they were spread for the day, and time periods where they were significantly over or under the actual number of open tables. The upper horizontal bars 78 above each chart show where the pricing of the open tables can be changed and the length of the bars indicate how long this lasted at the indicated price point. These bars help the operator determine how the open tables pricing was managed for the day, and how many changes the system 35 suggests. The lower horizontal bars 80 below each chart show where there exists unmet demand, and the numbers in the bars 82 show for which price points the unmet demand exists. The length of the bar 80 shows for how long the unmet demand lasted. This helps the operator determine where there exists opportunity to open more tables and capture un-served player segments the indicated price points. The data integrity 84 indicates the quality of the casino table player database, in this example, broken down by each eight hour shift of the casino. This helps the user determine how accurate or reliable their data is for each shift. The data freshness 86 shows the users who worked in each shift, and how the compared with the other users in the same shift. A different color can be used to highlight users who need improvement in collecting information for the casino table player data store 40. This helps the operator quickly determine the users to need to improve on data collection.
[0078] FIG. 4 shows an example of a pop-up 88 displayed when the user moves their mouse over any hour on the actual number of tables open graph, i.e. in association with a particular first visual element 72. The popup 88 shows the actual number of open tables for that hour, the number of open tables of that game type in each pit and the number of tables that the casino is over or under the ideal number of tables for that hour. In this example, at 14:00, the casino had 13 tables open in that hour, and was 4 under the ideal number of tables for that hour. This popup 88 helps the operator quickly determine where the open tables were located. If the user clicks on the pop-up 88, it takes them to a floor view UI 110 (see FIG. 8).
[0079] FIG. 5 shows an example of a pop-up 90 displayed if the user moves their mouse over any hour on the ideal number of tables open graph, i.e. in association with a particular one of the second visual elements 74, e.g. the shading for a particular hour interval. The popup 90 shown in FIG. 5 shows the ideal number of open tables for that hour and the number of tables that the casino is over or under the ideal number of tables for that hour. In this example, at 14:00, the casino required 17 tables open in that hour, and was 4 under the ideal number of tables for that hour. A chart of each price point, showing the average demand for that hour is also shown. A table showing the number of players, the player occupancy, the number of open tables and the table occupancy is shown for each price point. The total is also shown as the last row. This table gives the user a summary of all the price points for that hour and that game. If the user clicks on this item, it takes them to the floor view UI 110 (see FIG. 8) at this time.
[0080] FIG. 6 shows an example of a pop-up 92 displayed if the user moves their mouse over any of the upper horizontal bars 78 that show how the pricing could be changed for a particular price point. The popup 92 indicates a reason why the system suggested converting tables of that game type to the indicated price point. The description text 94 also shows how long the suggested change lasted. In addition to this, if available, the information on each user 96 who was managing those tables is shown, and their action if the suggestion was sent out to them at the time it happened. The suggested options to change the price of another open table to the current price point are also shown, with a graphic of the open table(s) 98. If the user clicks on this item, it takes them to the floor view UI 110 at this time (see FIG. 8).
[0081] FIG. 7 shows an example of a popup 100 displayed if the user moves their mouse over any of the lower horizontal bars 80 that show where there exists unmet demand. The popup 100 shows which price points have an unmet demand, and how long this unmet demand lasted for. The unmet demand is an indication that even if there are sufficient tables open for the current players, there may be players who are willing to play at a lower price point, which is profitable for the casino, but the casino does not have any tables that that price point to serve those players. If the user clicks on this item, it takes them to the floor view UI 110 at this time (see FIG. 8).
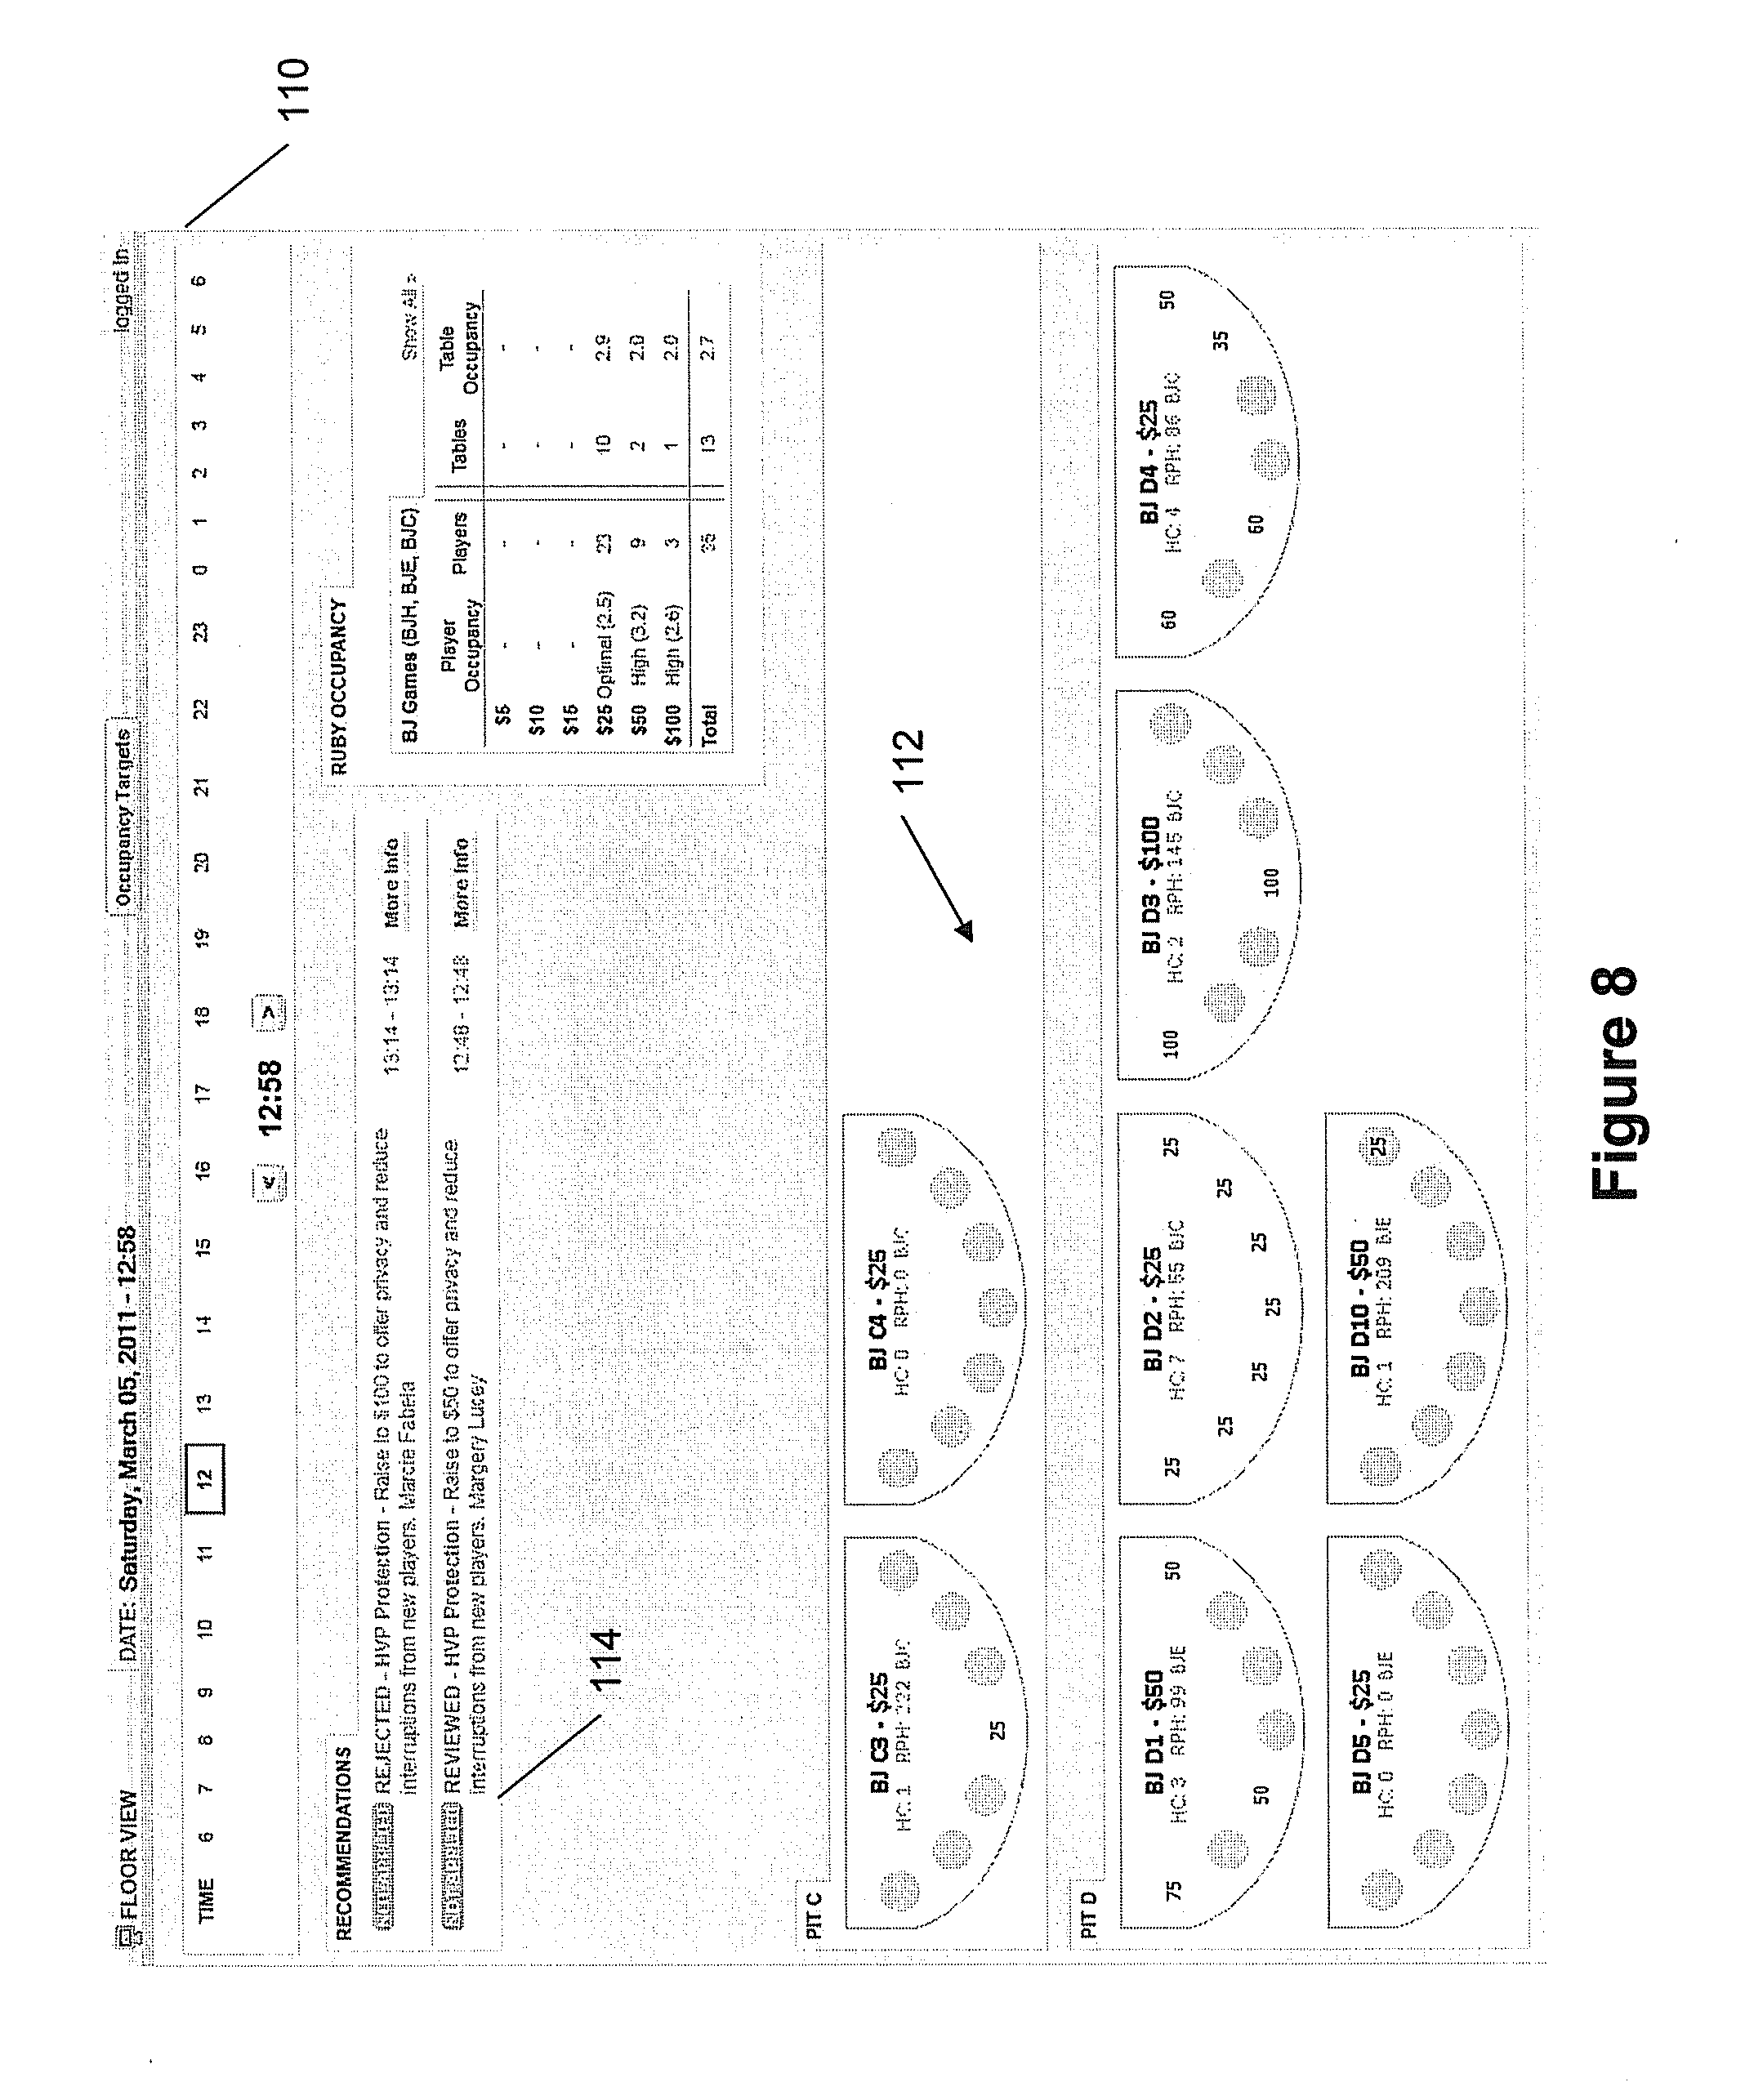
[0082] Returning to FIG. 3, by clicking at any point in the chart, the system 35 opens the floor view UI 110, showing the open tables 112 at that time at the casino, and how the players are seated on the tables 112. FIG. 8 shows a floor view UI 110 for 12:58 at this casino for the open Blackjack Games. Each open table 112 shows the price point (or minimum bet) of the table, how many spots are occupied, and fills it in with the average wager at each occupied spot. A list of price change suggestions or recommendations 114 applicable for that hour are also shown on this page. The floor view UI 110 is an indication of what the floor looks like at that time, and gives the operator the ability to verify and validate whether the ideal number of open tables is required, or if a pricing change is justified, or whether unmet demand really exists at that time.
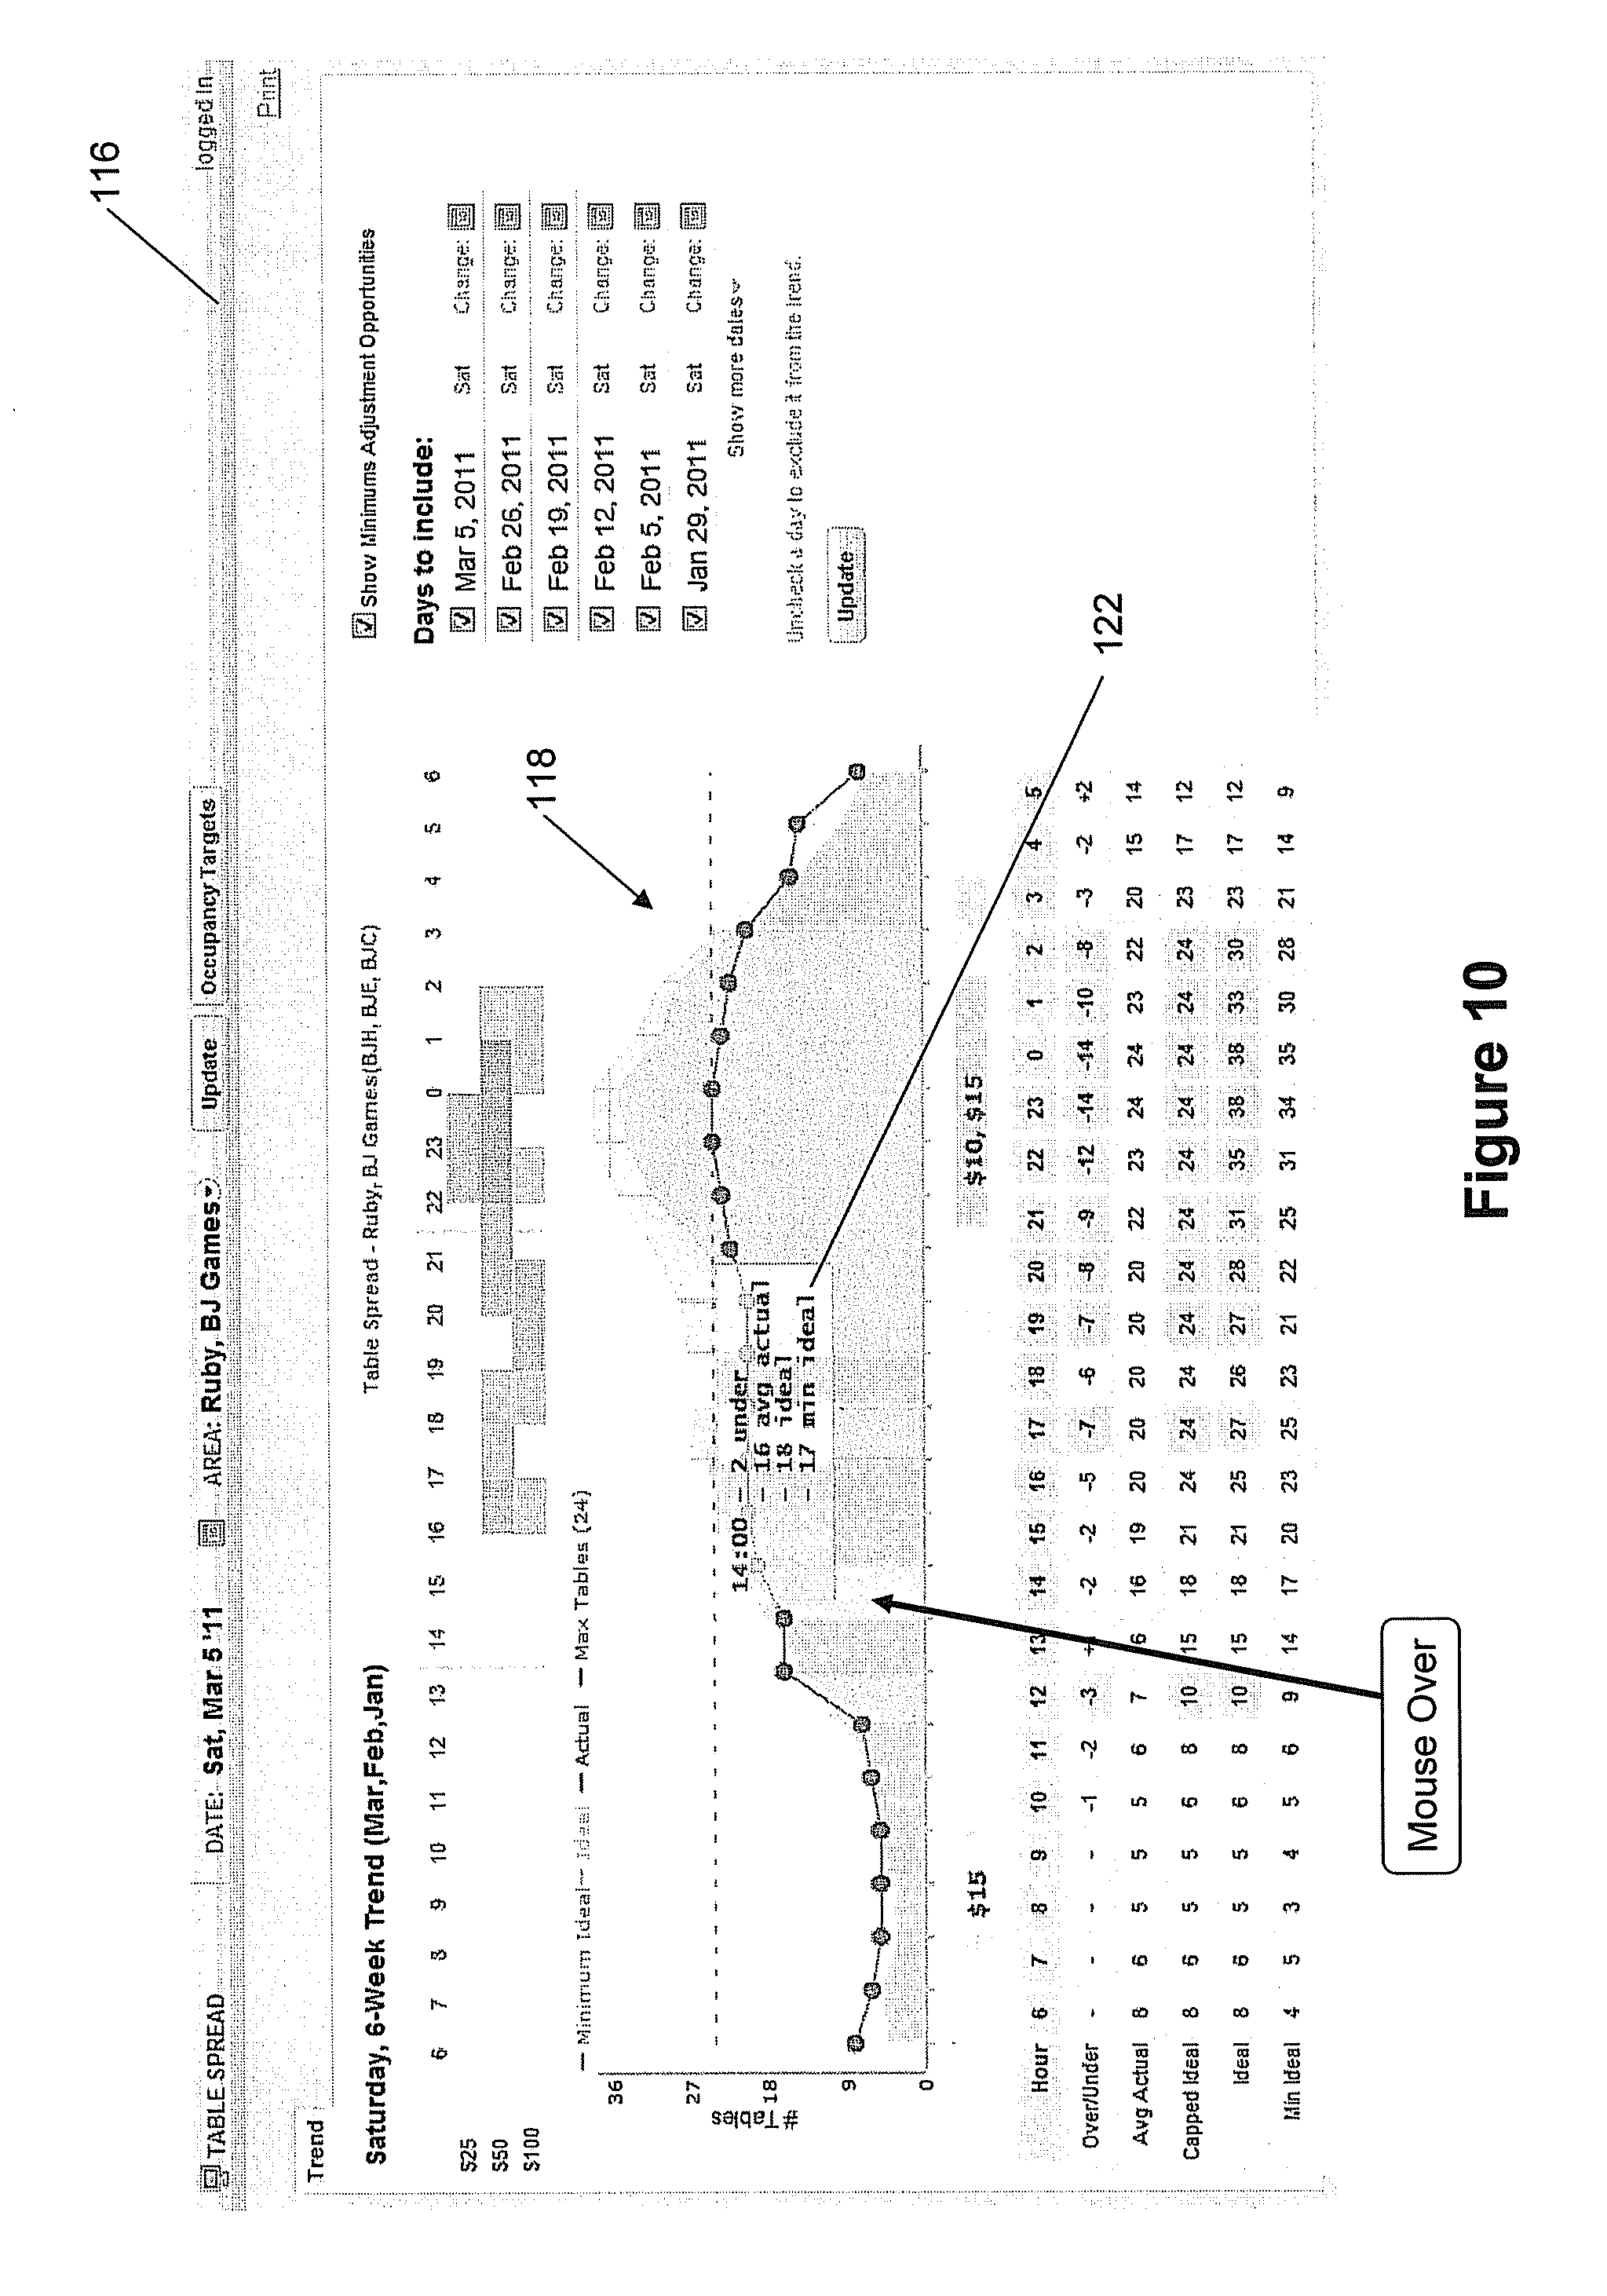
[0083] FIG. 9 shows a game trend summary UI 116 for an individual game at the casino, which may be displayed by selecting the trends button 87 shown in FIG. 3. The game trend summary UI 116 provides an analysis of several days of data and shows the information in a single chart 118. The user can pick any game and any day to analyze the charts 118 using a day selection portion 120. The user can also pick any other day to include or exclude from the analysis. This gives the operator the ability to exclude days from the analysis or compare different days in the same chart. In this example, 6 Saturdays are combined in to one game trend chart, and the user can quickly determine where the ideal number of tables is significantly different from the actual number of tables, where recurring pricing changes suggestions occur, and where recurring unmet demand opportunities exist. The single summary chart gives a quick snapshot of where there are opportunities to improve profitability.
[0084] FIG. 10 shows an example of a pop-up 122 displayed if the user moves their mouse over any hour on the aggregated graph 118. The popup 122 shows the aggregated actual number of open tables for that hour, the aggregated ideal number of tables to open for the hour, the number of tables that the casino is over or under the ideal number of tables for that hour, and the minimum number of ideal tables based on the demand. In this example, at 14:00, the casino had 16 tables open aggregated as an average for that hour, and was 2 under the ideal number of tables for that hour since there were 18 tables aggregated on average suggested ideally, and a minimum of 17 tables aggregated on average ideally open for the hour. This popup helps the operator quickly determine the trends for that hour of the day, compared to other selected days of the same game.
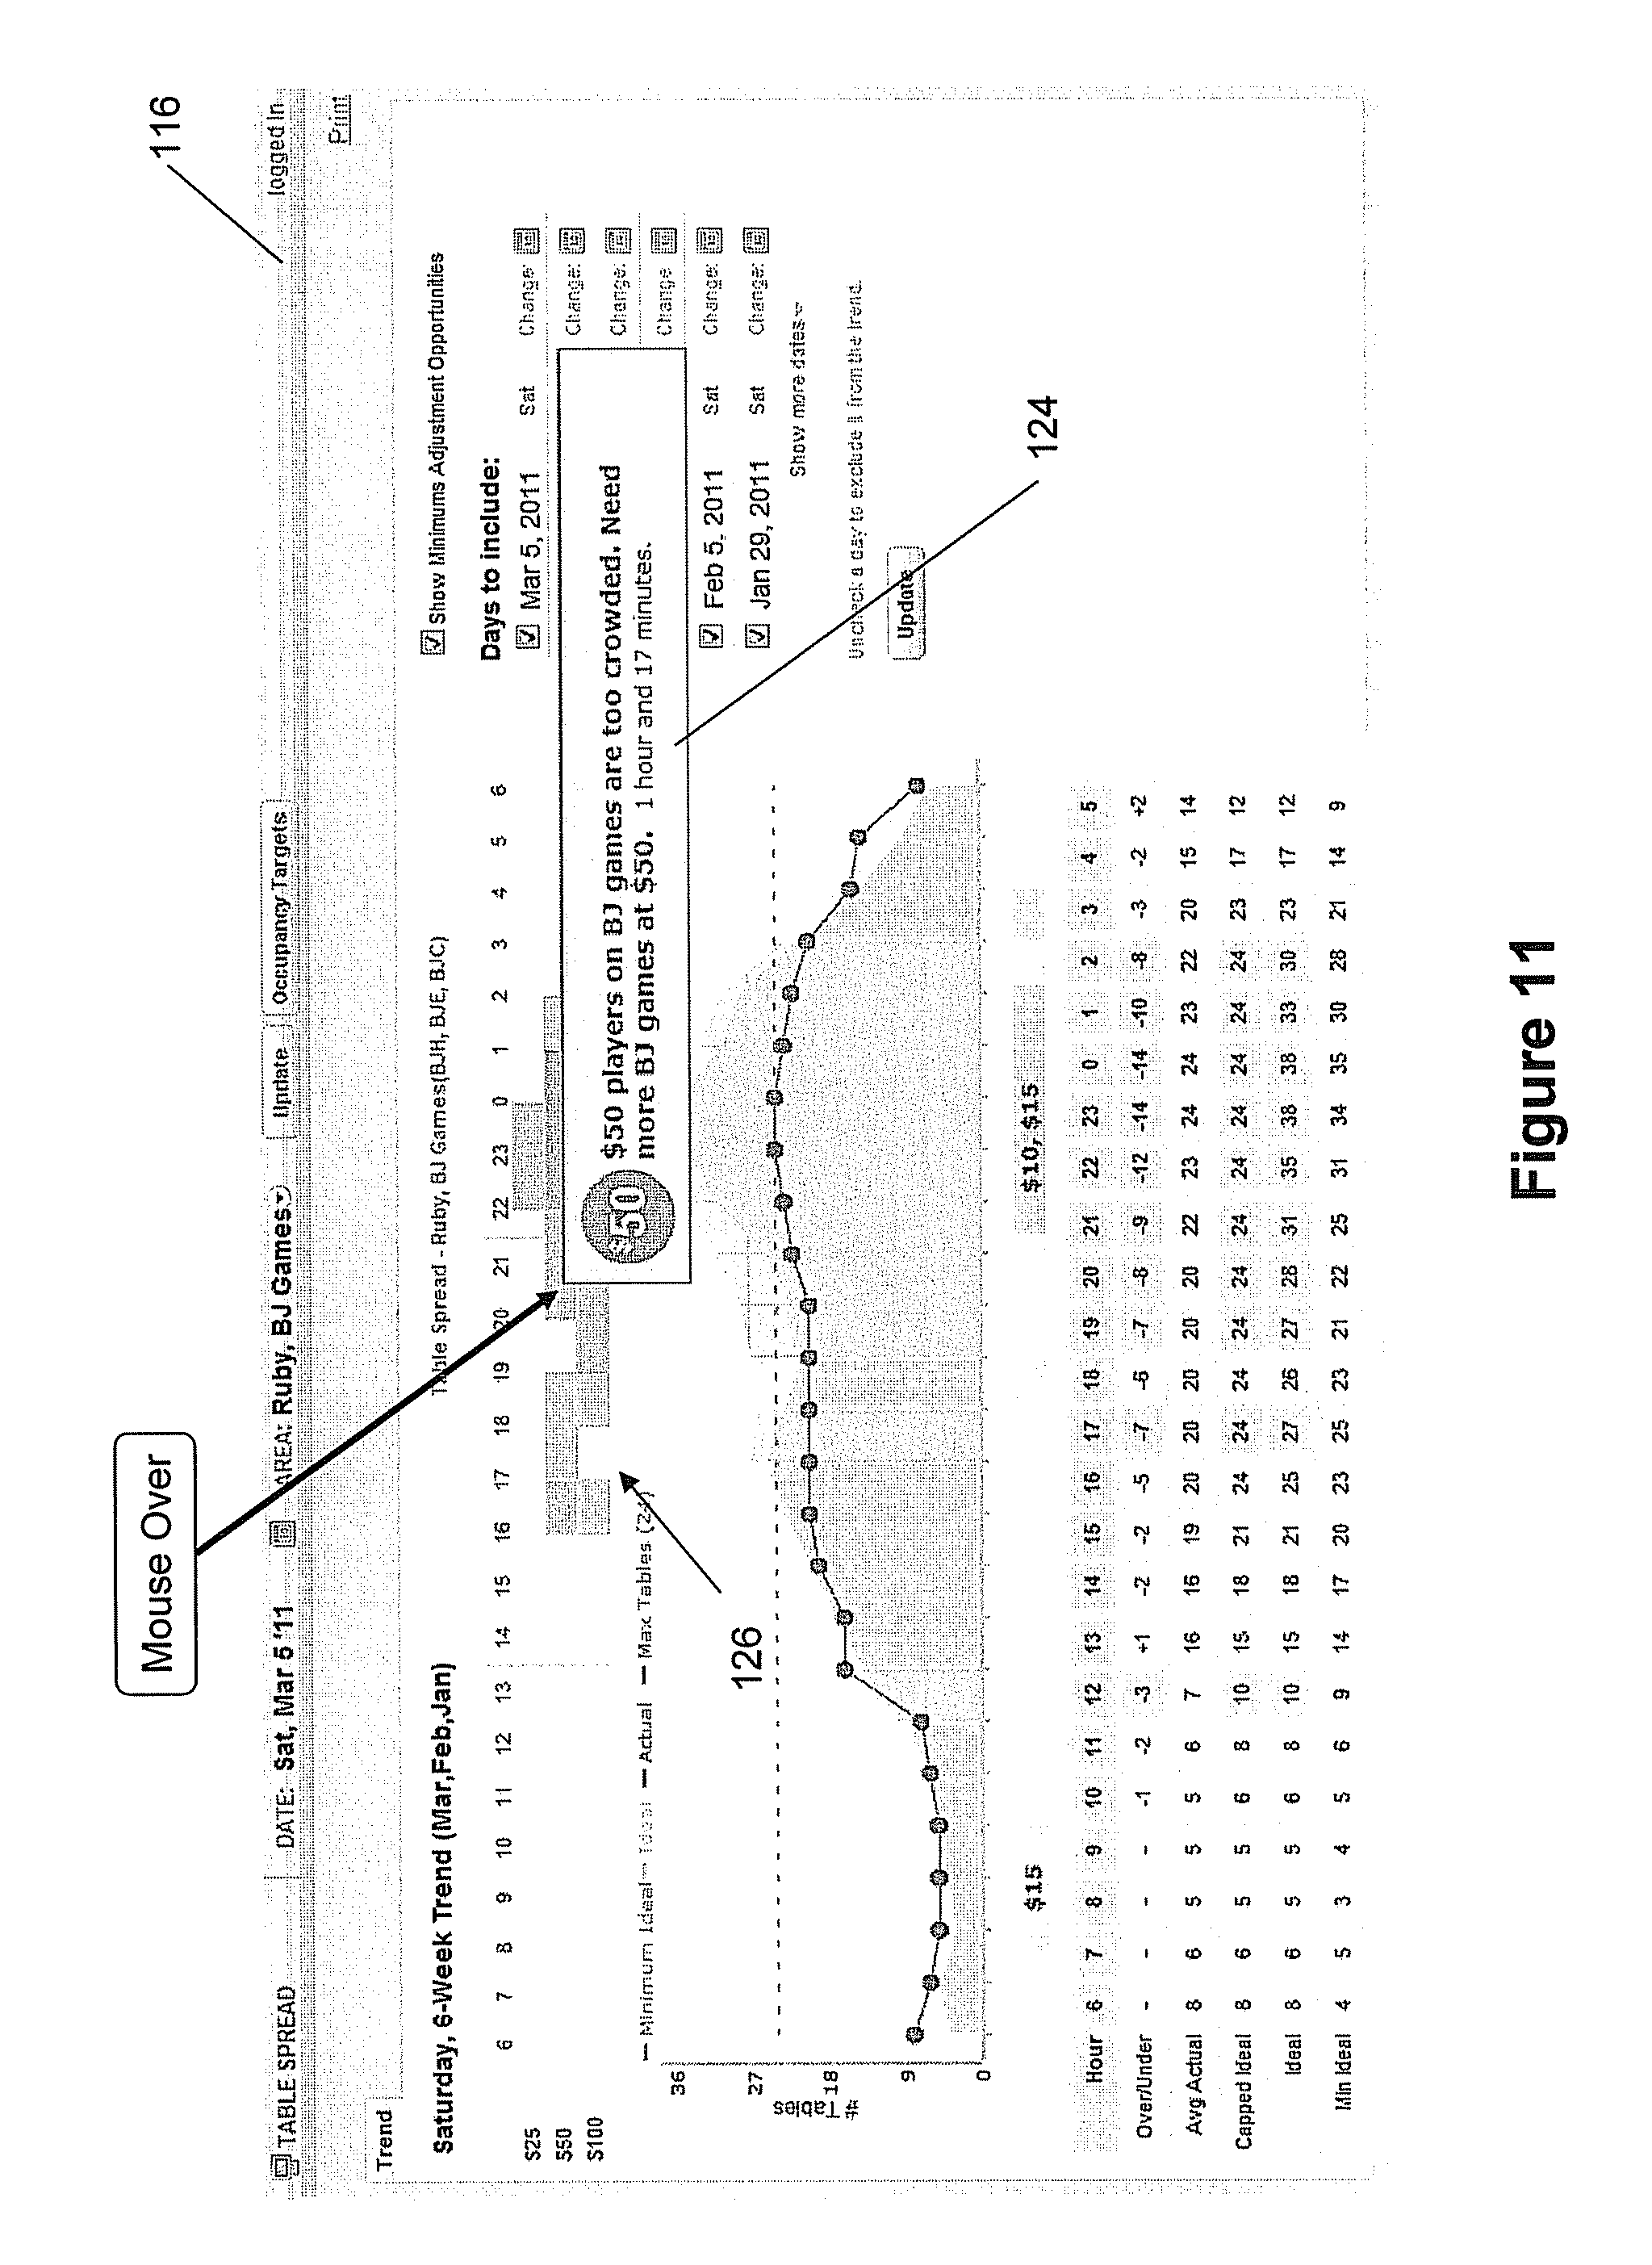
[0085] FIG. 11 shows an example of a pop-up 124 displayed if the user moves their mouse over the aggregated suggested pricing changes 126 at the indicated price point. Shading is used to determine the frequency of the occurrence of the suggested price change, and the length of the bar indicates the duration of the suggested price change. The popup 124 shows the price point that the system 35 is suggesting tables to be converted to, the actual duration of the suggestion, and optionally, the exact dates from the selected dates that had the issue. A threshold can be applied to hide any pricing changes that didn't occur in that hour for at least a certain number of dates from the selected dates.
[0086] FIG. 12 shows an example of a pop-up 128 displayed if the user moves their mouse over the aggregated unmet player demand 130 at the indicated price points. Shading is used to determine the frequency or severity of the occurrence of the unment demand, and the length of the bar indicates the duration of the unment demand. The popup 128 shows the price point that the system indicates that an unment demand exists, the actual duration of the unmet demand, and optionally, the exact dates from the selected dates that had the issue. A threshold can be applied to hide any unment demand that didn't happen in that hour for at least a certain number of days from the selected dates.
[0087] FIG. 13 shows an example of an optimal or target occupancies pop-up 132, when the user selects to view the optimal or target occupancies button 134. The information in the pop-up 132 gives the user an idea of what optimal player occupancies were used for each price point when determining the ideal number of tables.
[0088] FIG. 14A illustrates an example of a set of computer executable operations that may be executed in navigating between the views shown in FIGS. 3 through 8. After detecting selection of the daily overview at 136, the daily overview UI 70 is displayed at 138. While in the daily overview UI 70, several pop-ups may be displayed as discussed above. At 140, the system 35 determines if the user has performed a mouse over of a point on the graph 72. If so, the pop-up 88 is displayed at 142 and if not, the system continues to A. If the pop-up 88 is displayed, the system 35 then determines at 144 if the pop-up 88 has been selected. If so, the floor view 110 is displayed at 146 and if not, the system 35 continues to A. Similar workflow may be provided for detecting a mouse over of the shaded areas in each time interval at 148-154, for the upper bars 78 at 156-162, and for the lower bars 80 at 164-170.
[0089] FIG. 14B illustrates an example of a set of computer executable operations that may be executed in navigating between the views shown in FIGS. 9 through 12. At 172 the system 35 detects selection of the trends button 87 and displays the trends UI 116 at 174. While in the trends UI 116, several pop-ups may be displayed as discussed above. At 176, the system 35 determines if the user has performed a mouse over of the graph 118. If so, the pop-up 122 is displayed at 178 and if not, the system continues to A. Similar workflow may be provided for detecting a mouse over of the upper bars 126 at 180-182, for the lower bars 130 at 184-186, and for selection of the occupancy targets button 134 at 188-190.
[0090] FIG. 15 shows an example of a casino trend summary UI 200, which is aggregated for all games offered in the casino and every day of the week. In FIG. 15, the Game View tab 202 is selected which shows each game, and any recurring table spread opportunities for any day of the week. These opportunities are aggregated over a time period selected by the user, for a set of games also selected by the user. The capacity of the games is shown to give the user an idea of how many tables are present in the casino for that game type, and each column in the grid 204 is an hour in this example. There are three types of opportunities shown in this grid 204.
[0091] (1) Under spread opportunities: These are opportunities where the casino needed to open more games, because the aggregated ideal number of tables is significantly higher than the aggregated actual number of tables for the selected time period. In FIG. 15, these opportunities are shown in blue, which is reflected with a corresponding shade in the drawings (for example the cells containing 1 in the lower leftmost corner of grid 204).
[0092] (2) Overspread opportunities: These are opportunities where the casino needed to close tables, because the aggregated ideal number of tables is significantly lower than the aggregated actual number of tables for the selected time period. In FIG. 15, these opportunities are shown in orange, which is reflected with a corresponding shade in the drawings (for example see cells containing a 2 in the upper leftmost corner of the grid 204).
[0093] (3) Capacity opportunities: These are opportunities where the casino needed to open more games, because there is sufficient demand to open more tables of the game type, but there is no physical capacity on the casino floor to add this game. In FIG. 15, these opportunities are shown in grey, which is reflected with a different corresponding shade in the drawings when compared to those in orange (for example see cells containing a 2 and along SP games on Saturday in the grid 204). The advantage of presenting all the opportunities in this game view grid 204 is so that the user can immediately see how each game in the casino is performing, and which games have the most opportunity to improve the table spread. The user can also quickly determine where there is a recurring capacity issues for every day of the week, and whether they should add more games of this game type on the casino floor to meet the demand. If there is no opportunity to improve the table spread, then the row for the day and game can be omitted, for example there is no row for Mondays for the Baccarat game because there doesn't exist any opportunity to improve spread.
[0094] FIG. 16 shows an example of a pop-up 206 displayed if the user moves their mouse over any of the elements that indicate that the game is underspread. The number inside the cell shows how many tables this game is underspread by. In FIG. 16, the SP Games on Fridays are underspread as shown at 3 pm, and the popup 206 indicates how long this opportunity has lasted, in this example from 12 pm-3 pm. At the selected hour, it is underspread by 2 tables, and there were 2 aggregated actual tables open, and the system suggested having 4 ideal tables open. For convenience, the game type name and the capacity is also shown in the popup. This popup 206 gives the user an immediate view of how many tables were actually open at the selected time, and is easy to visualize. If the user clicks on this item, it takes them to the game trend summary UI 116 at this time (see FIG. 9) for the particular game and days included in the analysis.
[0095] FIG. 17 shows an example of a pop-up 208 displayed if the user moves their mouse over any of the elements that indicate that the game is overspread. The number inside the cell shows how many tables this game is overspread by. In FIG. 17, the Baccarat games on Wednesdays are overspread as shown at 10 pm, and the popup 208 indicates how long this opportunity has lasted, in this example from 7 am-11 am. At the selected hour, it is overspread by 2 tables, and there were 4 aggregated actual tables open, and the system 35 suggested having 2 ideal tables open. For convenience, the game type name and the capacity is also shown in the popup 208. If the user clicks on this item, it takes them to the game trend summary UI 116 at this time (see FIG. 9) for the particular game and days included in the analysis.
[0096] FIG. 18 shows an example of a pop-up 210 displayed if the user moves their mouse over any of the elements that indicate that the game requires additional capacity. The number inside the cell shows how many tables this game needs additional capacity. In FIG. 18, the SP games on Saturdays need additional capacity as shown at 5 pm, and the popup 210 indicates how long this opportunity has lasted, in this example from 5 pm-7 pm. At the selected hour, the game needs additional capacity of 2 tables, and there were 5 aggregated actual tables open, and the system suggested having 7 ideal tables open. The capacity for this game at the casino is 5 tables. For convenience, the game type name and the capacity is also shown in the popup 210. If the user clicks on this item, it takes them to the game trend summary UI 116 at this time (see FIG. 9) for the particular game and days included in the analysis.
[0097] FIG. 19 shows an example of selection of a day view tab 212, which represents the same data in the grid 204 as the game view, but this time arranged by each day of the week, rather than each game. This view 212 is useful to give the operator an indication of how each hour of each day is performing. It also can be used to allocate labour from one game that is overspread to another game that is underspread. For example, the casino can close a baccarat game that is overspread from 7 am-10 am on Saturdays, and allocated the dealer to Pai Gow Tiles at the same time. This view 212 enables the user to find opportunities where the staff can be reallocated.
[0098] FIG. 20 shows a settings window 214 which appears when a "settings" button 216 is clicked. The settings window 214 enables the user to analyze only certain games, certain areas, and include or exclude additional weeks of data to summarize in the grid 204. This helps filter out weeks that may have had special events which could skew the results, or select only certain games for analysis.
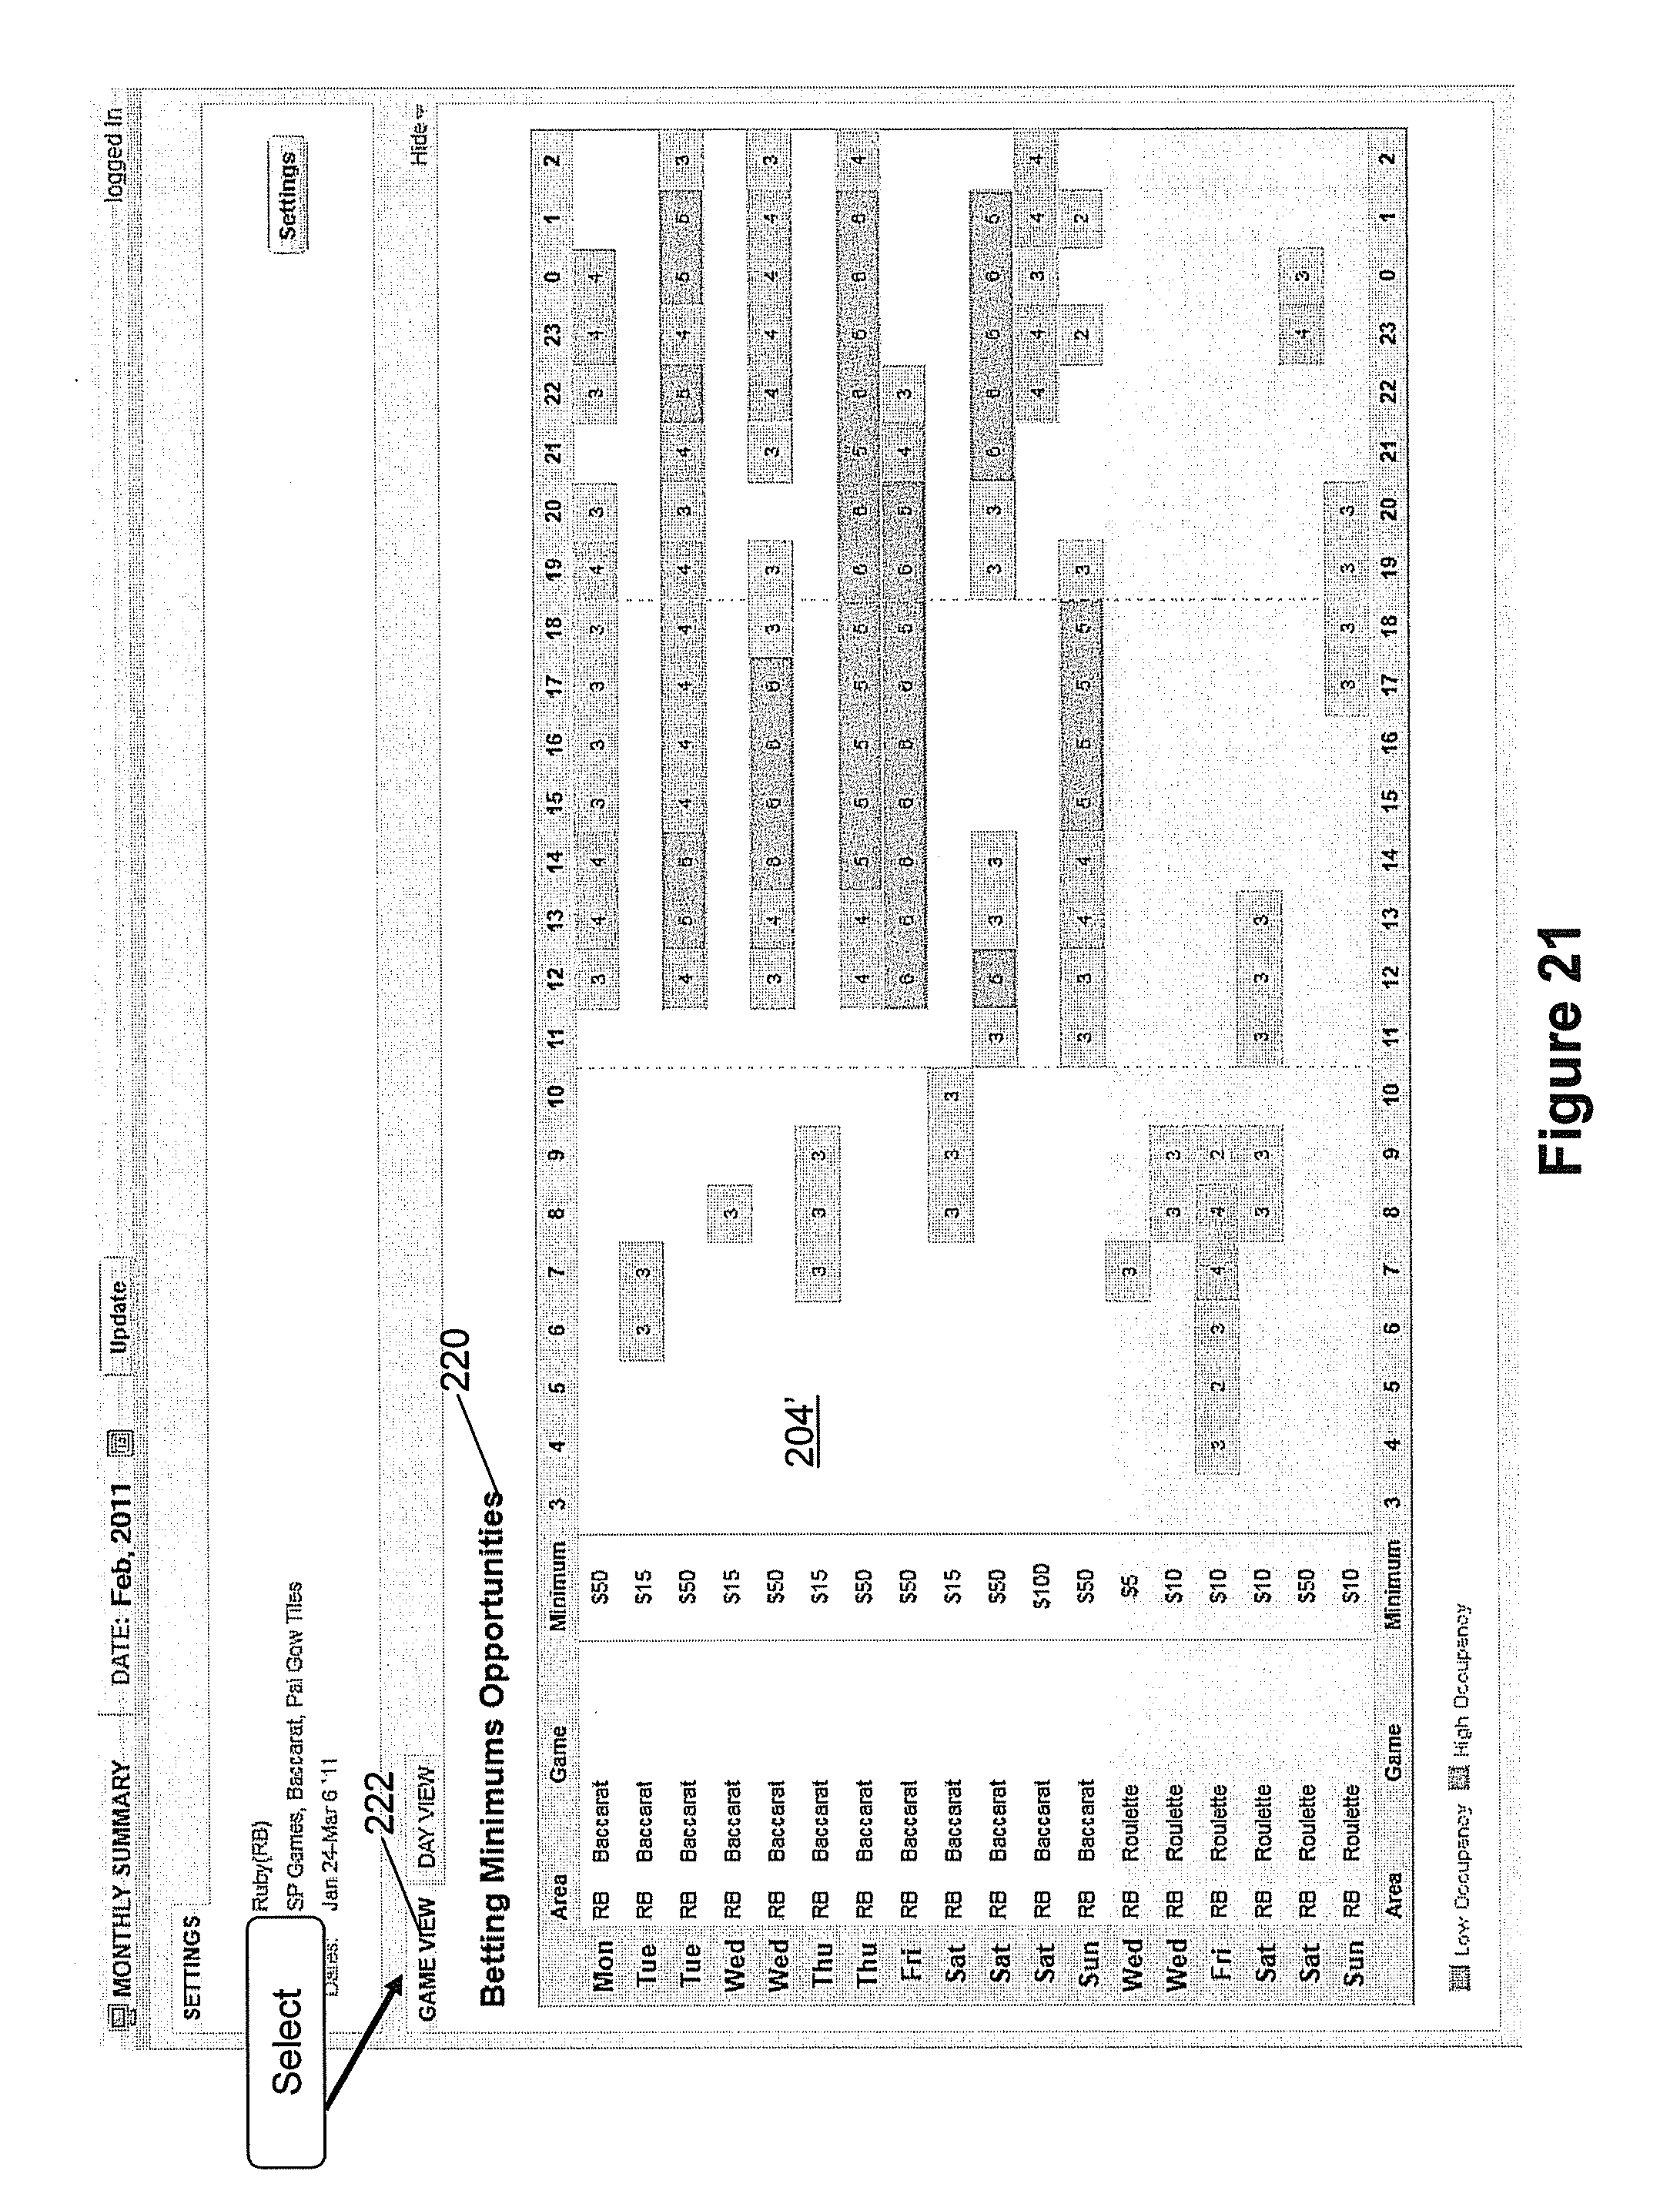
[0099] FIG. 21 shows a grid 204' with aggregated betting minimums opportunities 220. Each row is for a single price point and game at the casino. The game view 222 shows all the opportunities for each game type, and where the system 35 suggests to convert additional tables to the indicated price point. The number inside each cell indicates how many weeks the issue has been recurring for, and lower values can be filtered out to exclude on this page so as to only focus on the pricing changes that occur most frequently. The two types of betting minimums opportunities shown are:
[0100] (1) High Occupancy opportunities: These indicate where the players are experiencing higher than optimal occupancy and to convert some tables to the current minimum.
[0101] (2) Low Occupancy opportunities: These indicate where the players are experiencing lower than optimal occupancy, and to convert some games to the current minimum to entice other players to join the game. This view gives the user a very clear ideal of how the pricing can be changed to improve profitability for each game type, and when this happens during the week.
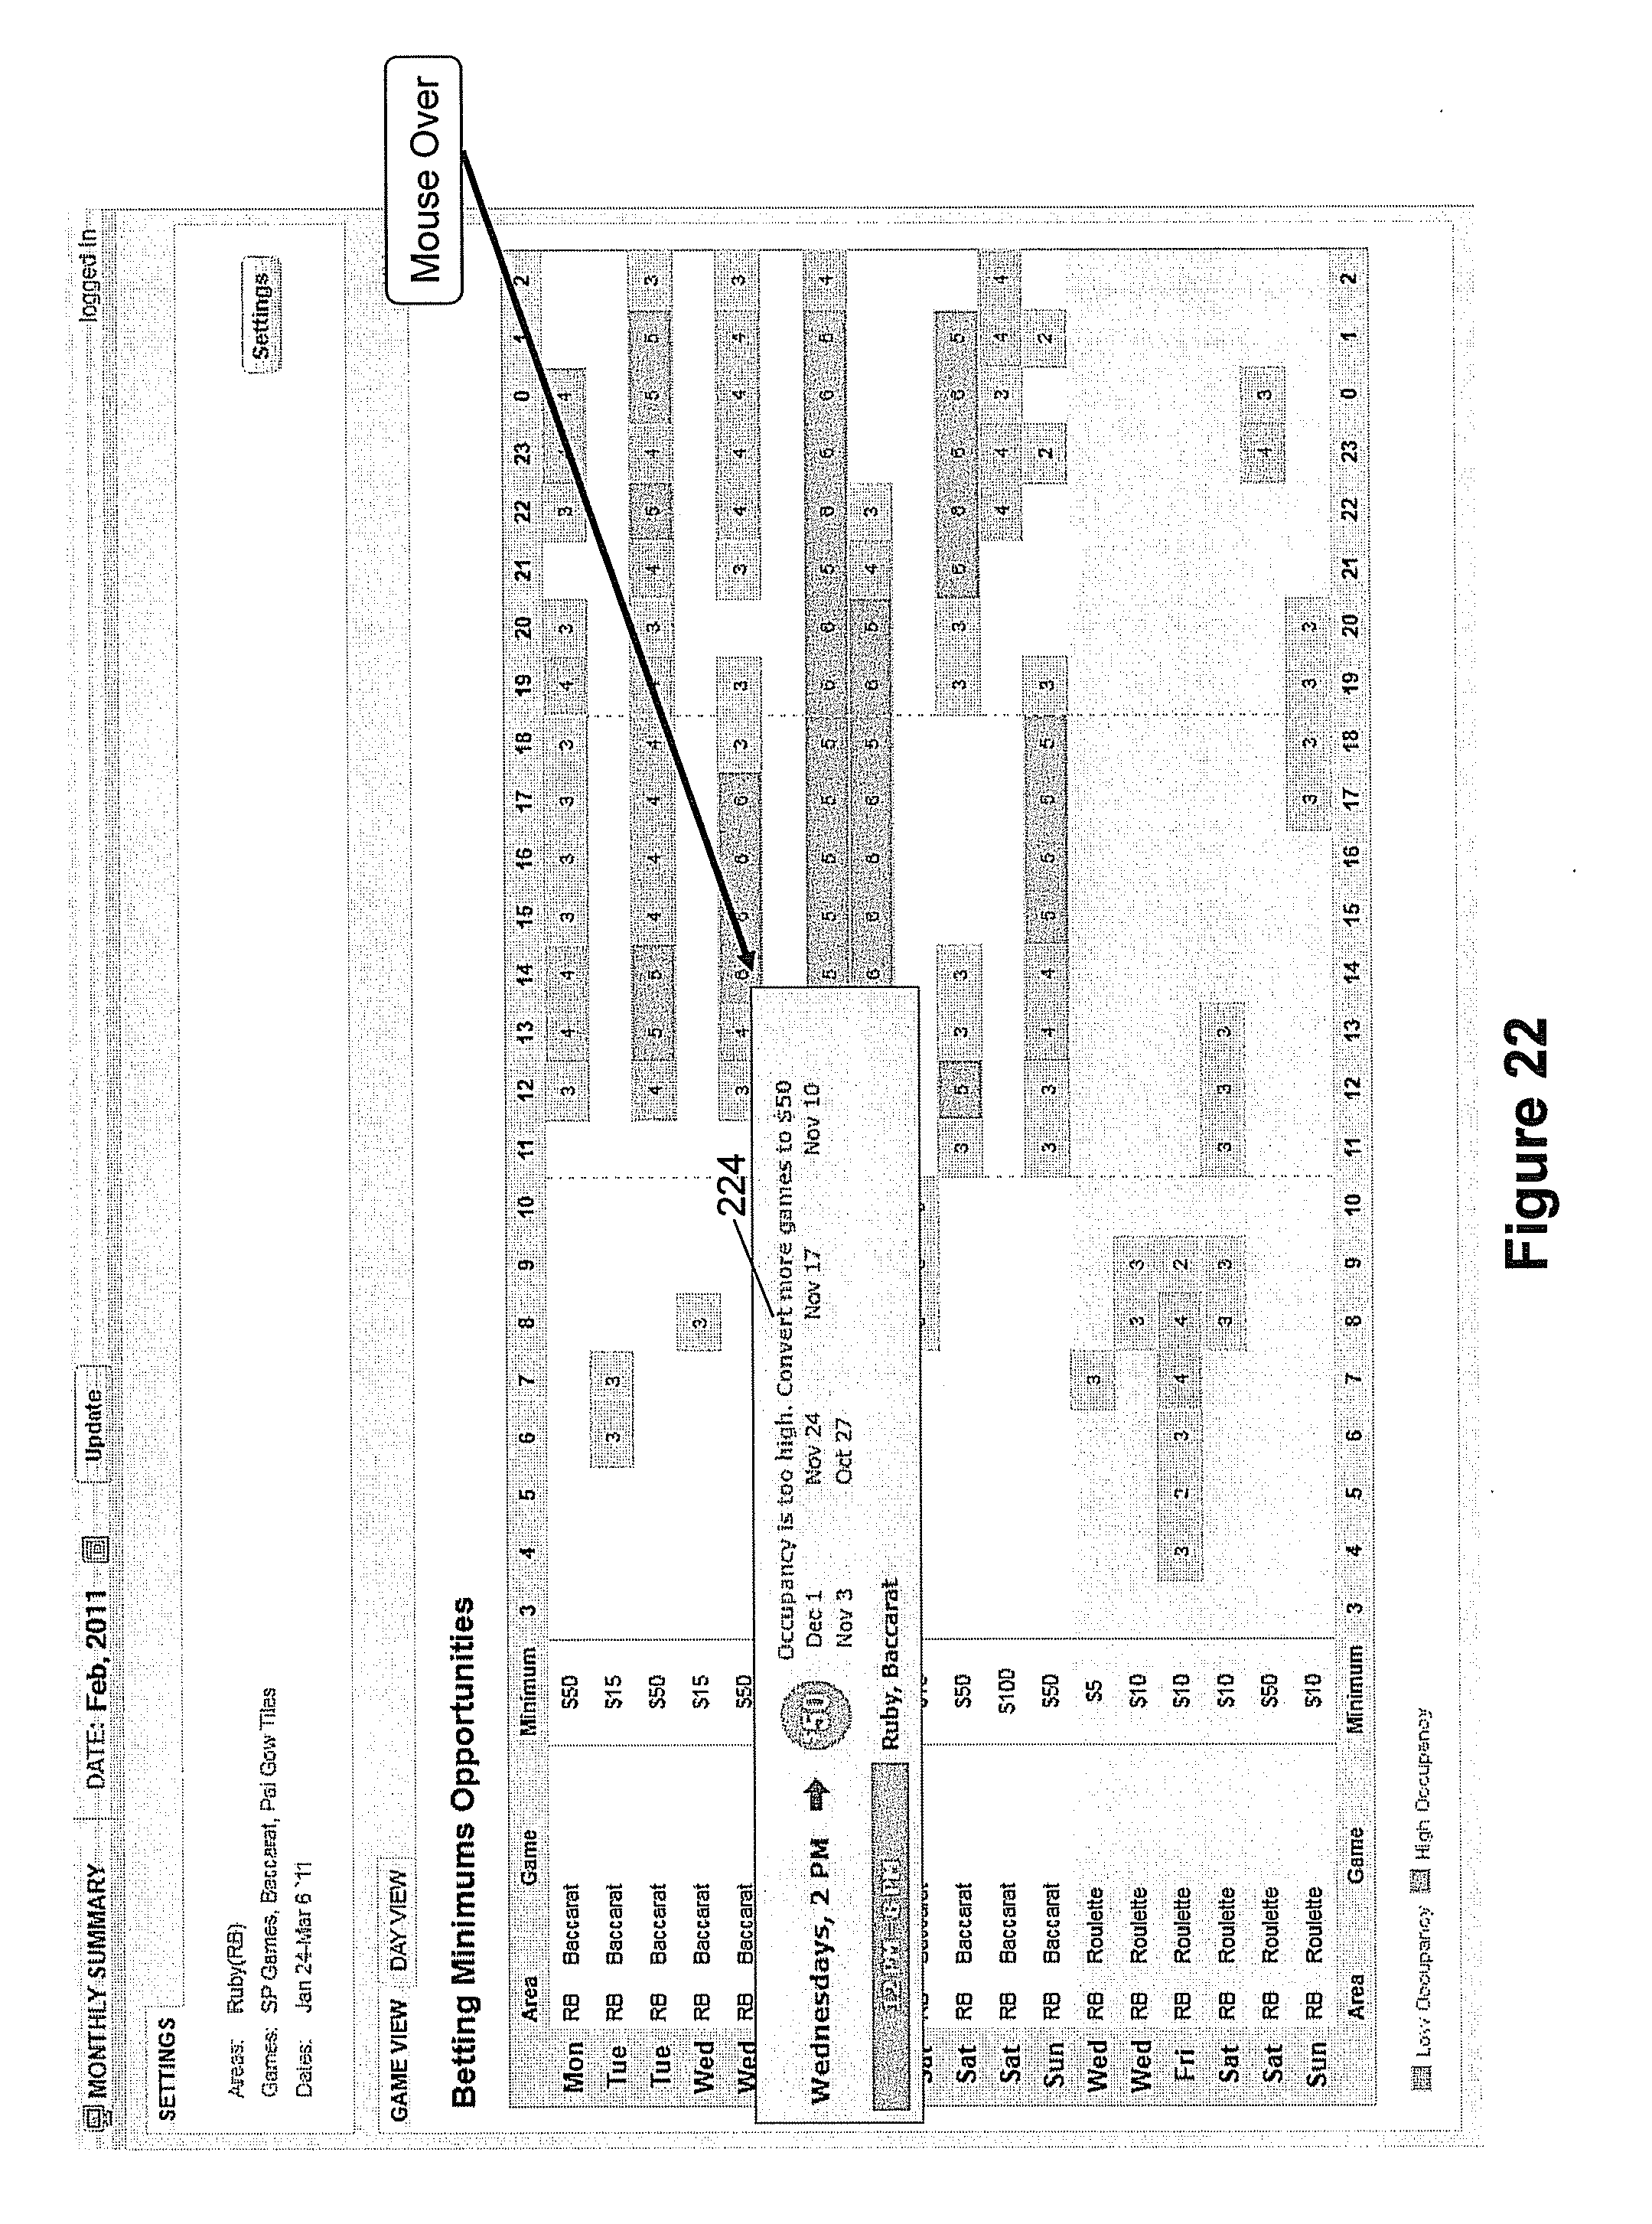
[0102] FIG. 22 shows an example of a pop-up 224 displayed if the user moves their mouse over any of the elements that indicate that the pricing needs to be changed due to the games being at high occupancy. The number inside the cell shows the frequency of this occurrence in the user selected weeks. In FIG. 22, the Baccarat Games at the $50 price point are at high occupancy and this has been recurring for 6 weeks as indicated in the cell. The popup indicates this opportunity has lasted from 12 pm-8 pm. At the selected hour, 2 pm, the system 35 suggested to convert more games to the $50 price point due to a high occupancy. Each prior date in the past where this change was suggested is shown in the popup 224. This popup 224 gives the user immediate information on the exact opportunity and when exactly in the past it occurred. If the user clicks on this item, it takes them to the game trend summary UI 116 at this time (see FIG. 9) for the particular game and days included in the analysis.
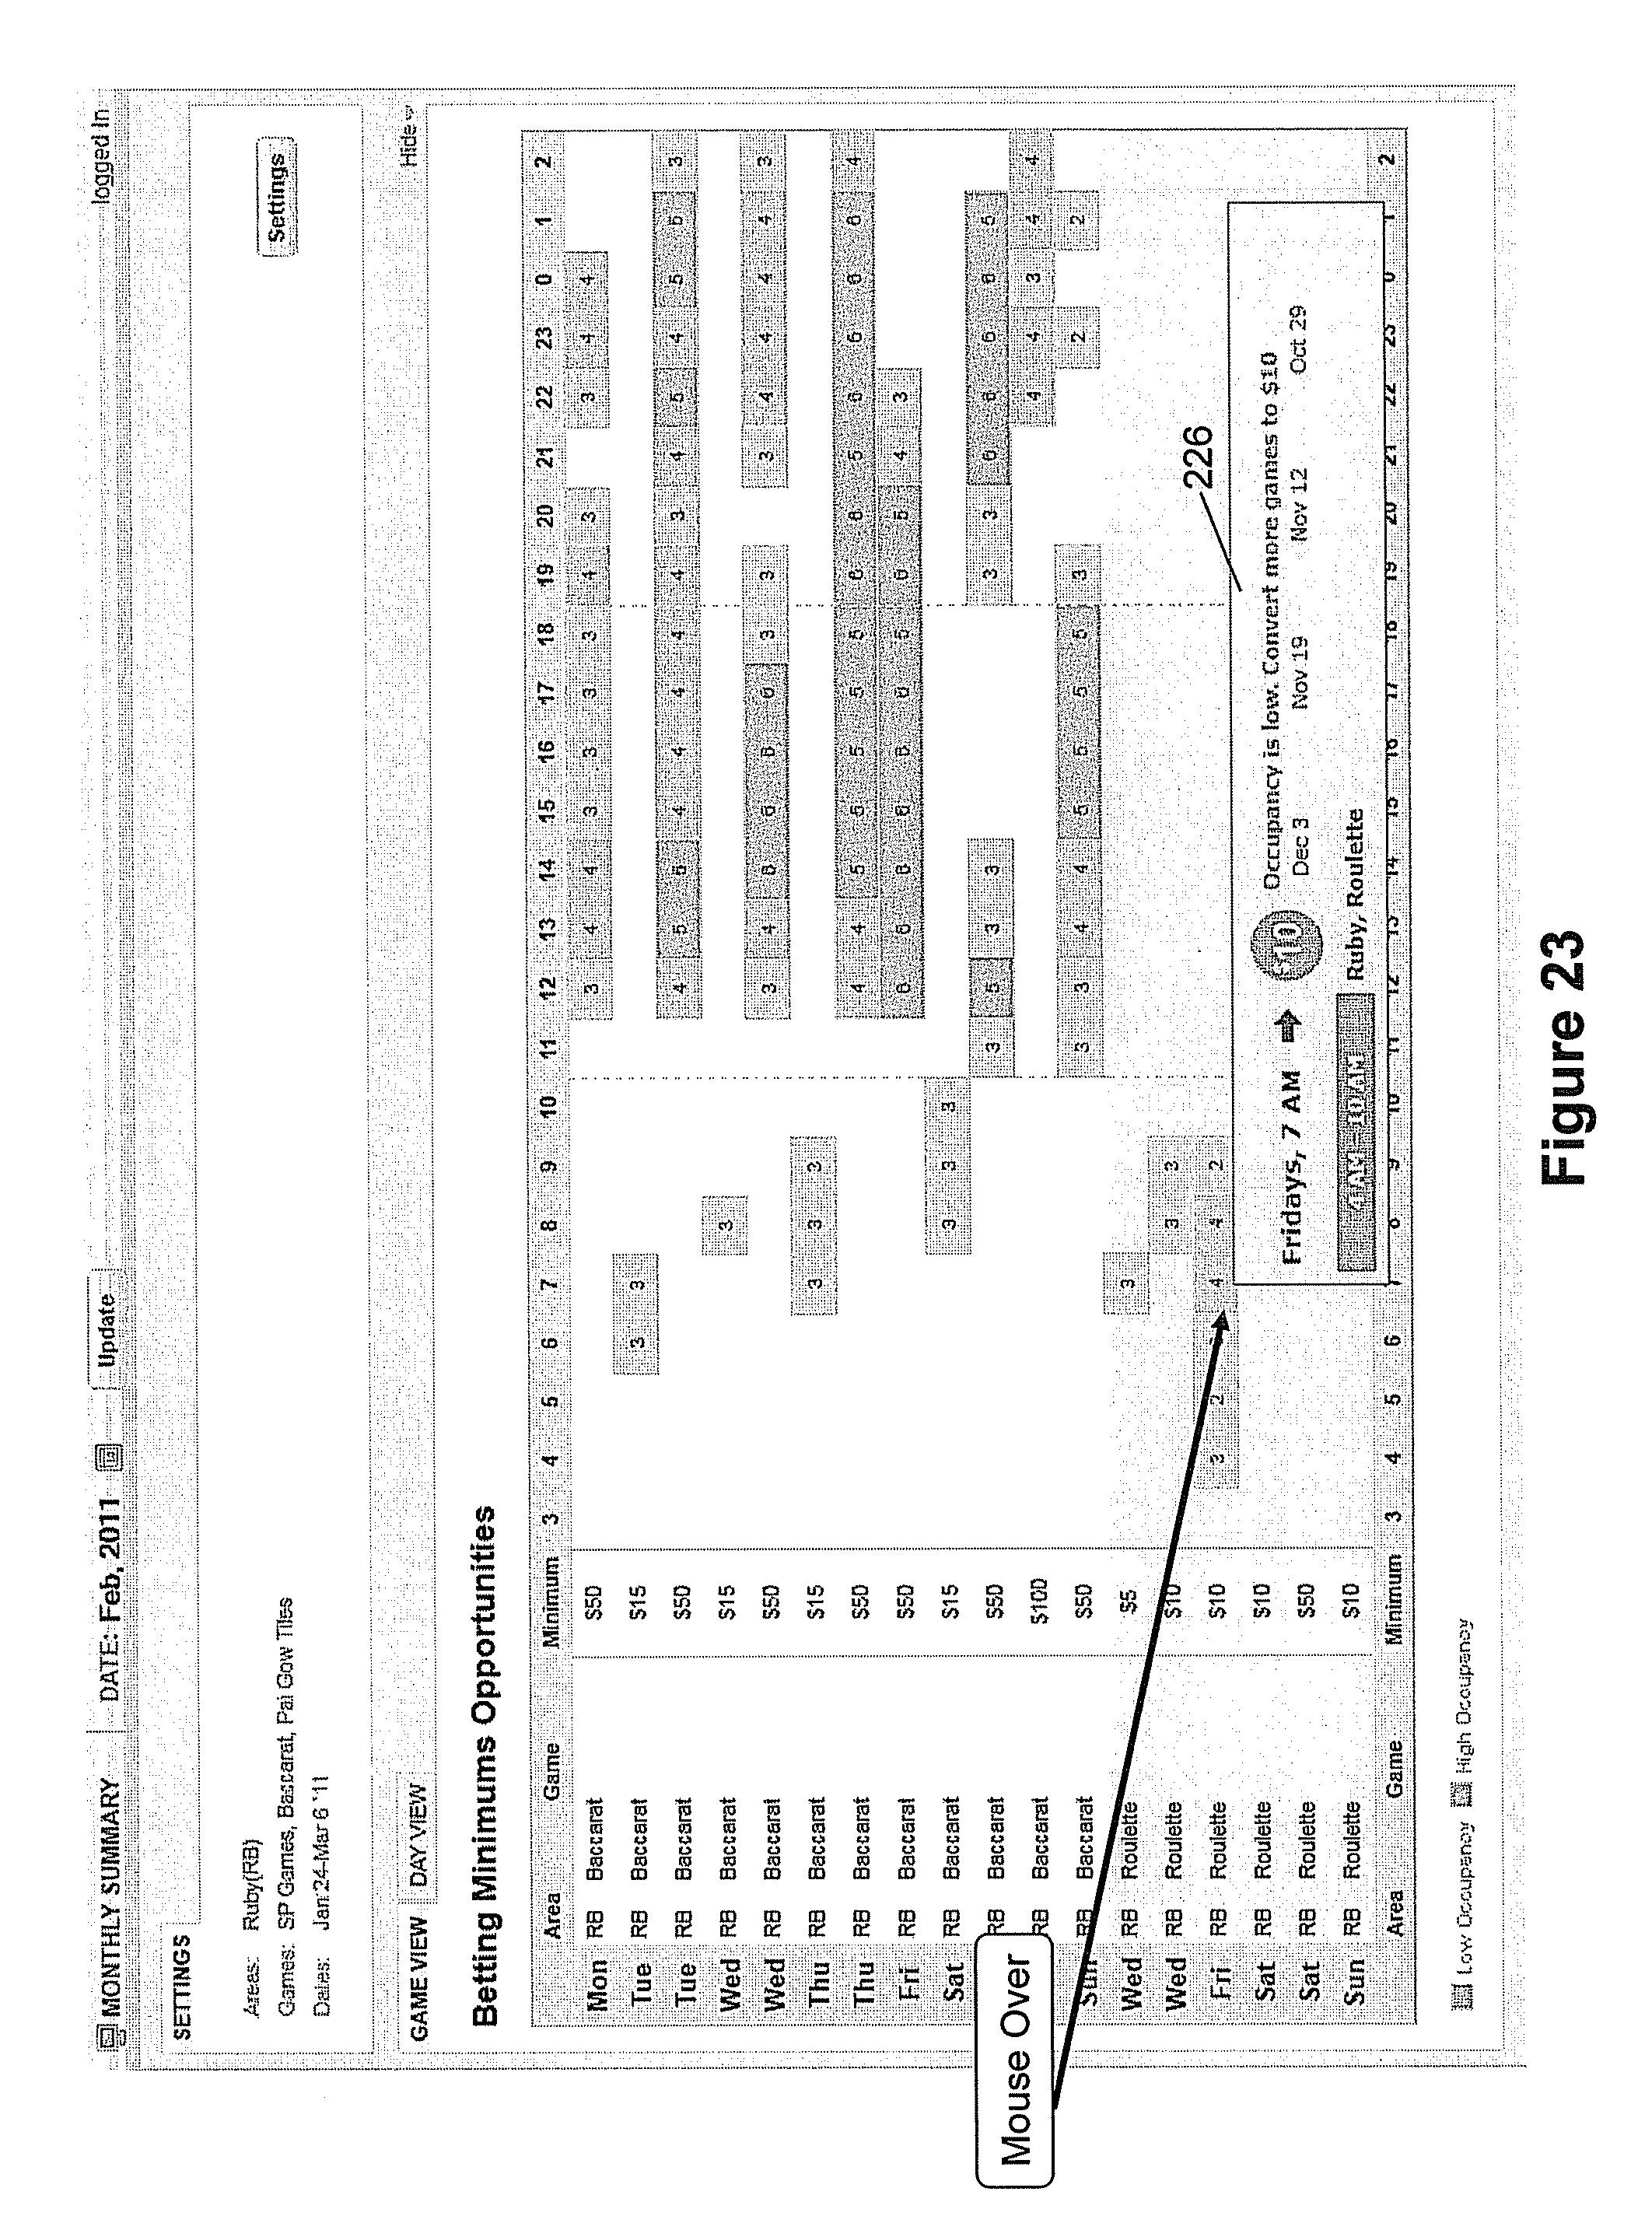
[0103] FIG. 23 shows an example of a pop-up 226 displayed if the user moves their mouse over any of the elements that indicate that the pricing needs to be changed due to the games being at low occupancy. The number inside the cell shows the frequency of this occurrence in the user selected weeks. In FIG. 23, the Roulette Games at are at low occupancy and this has been recurring for 4 weeks as indicated in the cell. The popup 226 indicates this opportunity has lasted from 4 am-10 am. At the selected hour, 7 pm, the system suggested to convert more games to the $10 price point due to a low occupancy. Each prior date in the past where this change was suggested is shown in the popup 226, in this case the 4 weeks. If the user clicks on this item, it takes them to the game trend summary UI 116 at this time (see FIG. 9) for the particular game and days included in the analysis.
[0104] FIG. 24 shows an example of the day view tab 228 for betting minimums opportunities 220, which represents the same data in the grid 204' as the game view from FIG. 21, but this time arranged by each day of the week, rather than each game. This view 228 is useful to give the operator an indication of how each hour of each day is performing and which days have the most opportunity to change pricing in order to improve profitability.
[0105] FIG. 25 shows a grid 234 with a game view 230 for aggregated unmet demand opportunities 232. Each row is for a single price point and game at the casino where there exists unmet demand. The game view 230 shows all the opportunities for each game type, and where the system 35 suggests to open additional tables at the indicated price point. The number inside each cell indicates how many weeks the issue has been recurring for, and lower values can be filtered out to exclude on this page so as to only focus on the pricing changes that occur most frequently. This view 230 gives the user a very clear idea of when the unmet demand occurs for each game type, and decide whether to open additional games at that time.
[0106] FIG. 26 shows an example of a day view 236, which represents the same data in the grid 234 as the game view from FIG. 25, but this time arranged by each day of the week, rather than each game. This view 236 is useful to give the operator an indication of how each hour of each day is performing and which days have the most opportunity to open tables and serve the unment demand at the indicated price points in order to improve profitability.
[0107] FIG. 27A illustrates an example of a set of computer executable operations that may be executed in navigating between the views shown in FIGS. 15 through 18. At 240 the system 35 detects selection of the table spreads opportunities UI 200 and displays the table spreads opportunities UI 120 at 242 (e.g. game view 202 as shown in FIG. 15 and used in the example shown in FIG. 27A). While in the table spread opportunities UI 200, several pop-ups may be displayed as discussed above. At 244, the system 35 determines if the user has performed a mouse over of an under spread cell. If so, the pop-up 206 is displayed at 246. If the pop-up 206 is displayed, the system 35 then determines at 258 if the pop-up 206 has been selected. If so, the game trend UI 116 is displayed at 250 and if not, the system 35 continues to A. Similar workflow may be provided for detecting a mouse over of an over spread cell at 252-258, and a cell at capacity at 2602-268.
[0108] FIG. 27B illustrates an example of a set of computer executable operations that may be executed in navigating between the views shown in FIGS. 21 through 23. At 270 the system 35 detects selection of the betting minimums opportunities UI 220 and displays the table spreads opportunities UI 220 at 2728 (e.g. game view 222 as shown in FIG. 21 and used in the example shown in FIG. 27B). While in the betting minimums opportunities UI 220, several pop-ups may be displayed as discussed above. At 274, the system 35 determines if the user has performed a mouse over of a cell showing an occupancy that is too high. If so, the pop-up 224 for that cell is displayed at 276. If the pop-up 224 is displayed, the system 35 then determines at 278 if the pop-up 224 has been selected. If so, the game trend UI 116 is displayed at 280 and if not, the system 35 returns to display of the UI 220. Similar workflow may be provided for detecting a mouse over of cell showing an occupancy that is too low at 282-288.
[0109] It will be appreciated that any module or component exemplified herein that executes instructions may include or otherwise have access to computer readable media such as storage media, computer storage media, or data storage devices (removable and/or non-removable) such as, for example, magnetic disks, optical disks, or tape. Computer storage media may include volatile and non-volatile, removable and non-removable media implemented in any method or technology for storage of information, such as computer readable instructions, data structures, program modules, or other data. Examples of computer storage media include RAM, ROM, EEPROM, flash memory or other memory technology, CD-ROM, digital versatile disks (DVD) or other optical storage, magnetic cassettes, magnetic tape, magnetic disk storage or other magnetic storage devices, or any other medium which can be used to store the desired information and which can be accessed by an application, module, or both. Any such computer storage media may be part of the system 35, client 20, gaming station 12, etc., or accessible or connectable thereto. Any application or module herein described may be implemented using computer readable/executable instructions that may be stored or otherwise held by such computer readable media.
[0110] It will be appreciated that the example embodiments and corresponding diagrams used herein are for illustrative purposes only. Different configurations and terminology can be used without departing from the principles expressed herein. For instance, components and modules can be added, deleted, modified, or arranged with differing connections without departing from these principles.
[0111] The steps or operations in the flow charts and diagrams described herein are just for example. There may be many variations to these steps or operations without departing from the spirit of the invention or inventions. For instance, the steps may be performed in a differing order, or steps may be added, deleted, or modified.
[0112] Although the above principles have been described with reference to certain specific example embodiments, various modifications thereof will be apparent to those skilled in the art as outlined in the appended claims.
* * * * *
D00000
D00001
D00002
D00003
D00004
D00005
D00006
D00007
D00008
D00009
D00010
D00011
D00012
D00013
D00014
D00015
D00016
D00017
D00018

D00019
D00020
D00021
D00022
D00023
D00024
D00025
D00026
D00027
XML
uspto.report is an independent third-party trademark research tool that is not affiliated, endorsed, or sponsored by the United States Patent and Trademark Office (USPTO) or any other governmental organization. The information provided by uspto.report is based on publicly available data at the time of writing and is intended for informational purposes only.
While we strive to provide accurate and up-to-date information, we do not guarantee the accuracy, completeness, reliability, or suitability of the information displayed on this site. The use of this site is at your own risk. Any reliance you place on such information is therefore strictly at your own risk.
All official trademark data, including owner information, should be verified by visiting the official USPTO website at www.uspto.gov. This site is not intended to replace professional legal advice and should not be used as a substitute for consulting with a legal professional who is knowledgeable about trademark law.