Methods For Noninvasively Measuring Analyte Levels In A Subject
Schurman; Matthew J. ; et al.
U.S. patent application number 13/229410 was filed with the patent office on 2011-12-29 for methods for noninvasively measuring analyte levels in a subject. This patent application is currently assigned to GLT ACQUISITION CORP.. Invention is credited to William Henry Bennett, Matthew J. Schurman, Walter J. Shakespeare.
| Application Number | 20110319731 13/229410 |
| Document ID | / |
| Family ID | 37495040 |
| Filed Date | 2011-12-29 |


View All Diagrams
| United States Patent Application | 20110319731 |
| Kind Code | A1 |
| Schurman; Matthew J. ; et al. | December 29, 2011 |
METHODS FOR NONINVASIVELY MEASURING ANALYTE LEVELS IN A SUBJECT
Abstract
A method for noninvasively measuring analytes such as blood glucose levels includes using a non-imaging OCT-based system to scan a two-dimensional area of biological tissue and gather data continuously during the scanning. Structures within the tissue where measured-analyte-induced changes to the OCT data dominate over changes induced by other analytes are identified by focusing on highly localized regions of the data curve produced from the OCT scan which correspond to discontinuities in the OCT data curve. The data from these localized regions then can be related to measured analyte levels.
| Inventors: | Schurman; Matthew J.; (Somerset, NJ) ; Shakespeare; Walter J.; (Macungie, PA) ; Bennett; William Henry; (Bethlehem, PA) |
| Assignee: | GLT ACQUISITION CORP. Irvine CA |
| Family ID: | 37495040 |
| Appl. No.: | 13/229410 |
| Filed: | September 9, 2011 |
Related U.S. Patent Documents
| Application Number | Filing Date | Patent Number | ||
|---|---|---|---|---|
| 11445631 | Jun 2, 2006 | 8036727 | ||
| 13229410 | ||||
| 10916236 | Aug 11, 2004 | 7254429 | ||
| 11445631 | ||||
| 60686721 | Jun 2, 2005 | |||
| Current U.S. Class: | 600/323 |
| Current CPC Class: | A61B 2560/0223 20130101; A61B 5/1455 20130101; A61B 5/14532 20130101; A61B 5/0066 20130101 |
| Class at Publication: | 600/323 |
| International Class: | A61B 5/1455 20060101 A61B005/1455 |
Claims
1. A physiological monitoring system for determining a hemoglobin level using an optical coherence tomography (OCT) sensor, the system comprising: a non-invasive OCT sensor configured to irradiate biological tissue using a beam of light; and a physiological monitor comprising at least one processor, the physiological monitor configured to: obtain measurements of light from the beam, the light attenuated by the biological tissue; identify portions of the measurements of the attenuated light corresponding to measurements taken within one or more blood vessels within the biological tissue; and estimate a hemoglobin level based at least partly on the measurements taken within the one or more blood vessels.
2. The system of claim 1, wherein the beam comprises at least two different wavelengths having measurably different scattering properties for hemoglobin-containing tissue.
3. The system of claim 2, wherein the physiological monitor is configured to estimate the hemoglobin level by identifying hemoglobin-containing tissue based at least partly on the different scattering properties of the at least two different wavelengths of the beam.
4. The system of claim 1, wherein the physiological monitor is configured to identify the portions of the measurements by: generating a first OCT scattering profile; identifying a localized region in the first scattering profile where measurement changes due to blood hemoglobin predominate; and selecting portions of the measurements of the attenuated light corresponding to the identified localized region.
5. The system of claim 4, wherein the physiological monitor is further configured to: generate a second OCT scattering profile; and compare the second OCT scattering profile with the first OCT scattering profile to identify a region where measurement changes due to blood hemoglobin predominate.
6. The system of claim 1, wherein the beam comprises at least one of infrared and near infrared light.
7. The system of claim 1, wherein the non-invasive OCT sensor is configured to generate a reference beam that is adjusted to constructively interfere with the attenuated light.
8. The system of claim 1, wherein the attenuated light includes light reflected from the biological tissue.
9. A physiological monitoring system for determining a hemoglobin level using an optical coherence tomography (OCT) sensor, the system comprising: a physiological monitor comprising at least one processor, the physiological monitor configured to: obtain measurements of attenuated light detected by a non-invasive OCT sensor for scanning biological tissue, the OCT sensor configured to 1) generate a beam of light comprising two or more wavelengths selected to differentiate hemoglobin cells from another biological constituent based on scattering properties of the beam and 2) illuminate biological tissue with the beam; generate OCT measurements based at least partly on the measurements of attenuated light; process the OCT measurements to determine a hemoglobin level of the biological tissue based at least partly on identifying the hemoglobin cells.
10. The system of claim 9, wherein the physiological monitor is configured to process the OCT measurements by identifying the hemoglobin cells based at least partly on the scattering properties of the beam.
11. The system of claim 9, wherein the non-invasive OCT sensor is configured to generate a reference beam that is adjusted to constructively interfere with the attenuated light from the illuminated biological tissue.
12. The system of claim 9, wherein the attenuated light includes light reflected from the illuminated biological tissue.
13. The system of claim 9, wherein the beam comprises at least two wavelengths, each having different absorption or scattering properties for hemoglobin-containing tissues from the other.
14. The system of claim 13, wherein the at least two wavelengths comprise wavelengths at about 1310 nm, and either about 1450 nm or about 820-960 nm.
15. The system of claim 13, wherein at least one of the two wavelengths of light is infrared or near infrared light.
16. The system of claim 13, wherein differences in the scattering properties produced by the at least two wavelengths indicates the presence of hemoglobin cells.
17. The system of claim 13, wherein differences in the absorption properties produced by the at least two wavelengths indicates the presence of hemoglobin cells.
18. A method of measuring hemoglobin concentration within biological tissue, the method comprising: generating a beam of light, the beam comprising two or more wavelengths selected to differentiate hemoglobin cells from another biological constituent based on scattering properties of the beam; and illuminating biological tissue with the beam; generating optical coherence tomography (OCT) measurements based at least partly on light from the beam attenuated by the illuminated biological tissue; and processing the OCT measurements to determine a hemoglobin level of the biological tissue based at least partly on identifying the hemoglobin cells based on the scattering properties of the beam.
19. The method of claim 18, further comprising generating a reference beam and interfering said reference beam with the light from the beam to generate OCT measurements.
20. The method of claim 18, wherein the beam comprises at least two wavelengths, each having different absorption or scattering properties for hemoglobin-containing tissues from the other.
21. The method of claim 20, wherein the at least two wavelengths comprise wavelengths at about 1310 nm, and either about 1450 nm or about 820-960 nm.
22. The method of claim 20, wherein at least one of the two wavelengths of light is infrared or near infrared light.
23. The method of claim 20, wherein differences in the scattering properties produced by the at least two wavelengths indicates the presence of hemoglobin cells.
24. The method of claim 20, wherein differences in the absorption properties produced by the at least two wavelengths indicates the presence of hemoglobin cells.
25. The method of claim 20, wherein the at least two wavelengths are selected to accentuate contrast between hemoglobin cells and one or more other biological constituents.
26. The method of claim 18, wherein the beam comprises at least three wavelengths, each having different absorption or scattering properties for hemoglobin-containing tissues from the other.
27. The method of claim 18, wherein the hemoglobin level is estimated based at least partly on identifying hemoglobin cells using OCT measurements corresponding to one or more blood vessels.
28. The method of claim 25, wherein the one or more other biological constituents are located around the hemoglobin cells.
29. The method of claim 18, wherein the light from the beam attenuated by the illuminated biological tissue includes light reflected from the illuminated biological tissue.
Description
CROSS-REFERENCE TO RELATED APPLICATIONS
[0001] This application is a continuation of U.S. application Ser. No. 11/445,631 entitled "Methods for Noninvasively Measuring Analyte Levels in a Subject" filed Jun. 2, 2006, which claims the benefit of U.S. Provisional Application No. 60/686,721 entitled "Method for Noninvasively Measuring Blood Glucose" filed Jun. 2, 2005, the entire contents of which are hereby incorporated herein by reference, and is a continuation-in-part of U.S. application Ser. No. 10/916,236, entitled "Method And Apparatus For Monitoring Glucose Levels In A Biological Tissue," filed Aug. 11, 2004, the entire contents of which are hereby incorporated herein by reference. This application is also related to U.S. Provisional Application No. 60/671,285, entitled "Method For Data Reduction And Calibration Of An OCT-Based Blood Glucose Monitor," filed Apr. 14, 2005, the entire contents of which are herein incorporated by reference.
BACKGROUND OF THE INVENTION
[0002] 1. Field of the Invention
[0003] The present invention relates generally to methods for noninvasively measuring blood glucose or other analyte levels in a subject by measuring localized changes in light scattering from skin or other biological tissue. For example, such a method can include identifying tissue structures where the effect of blood glucose concentrations or levels are high, and targeting localized regions within the identified structures to measure blood glucose concentrations.
[0004] 2. Description of the Related Art
[0005] Monitoring of blood glucose (blood sugar) levels has long been critical to the treatment of diabetes in humans. Current blood glucose monitors employ a chemical reaction between blood serum and a test strip, requiring an invasive extraction of blood via a lancet or pinprick to the finger. Although small handheld monitors have been developed to enable a patient to perform this procedure anywhere, at any time, the inconvenience associated with this procedure--specifically the blood extraction and the need for test strips--has led to a low level of compliance by diabetic patients. Such low compliance can lead to diabetic complications. Thus, a non-invasive method for monitoring blood glucose is needed.
[0006] Studies have shown that optical methods can be used to detect small changes in light scattering from biological tissue related to changes in levels of blood sugar. Although highly complex, a first order approximation of transmitting monochromatic light through biological tissue can be described by the following simplified equation:
I.sub.R=I.sub.O exp[-(.mu..sub.a+.mu..sub.s)L],
where I.sub.R is the intensity of light reflected from the skin, I.sub.0 is the intensity of the light illuminating the skin, .mu..sub.a is the absorption coefficient of the skin at the specific wavelength of the light, .mu..sub.s is the scattering coefficient of the skin at the specific wavelength of the light, and L is the total path traversed by the light. From this relationship, it can be seen that the intensity of the reflected light decays exponentially as either the absorption or the scattering by the tissue increases. The attenuation of light can be characterized by an attenuation coefficient, which is the sum of .mu..sub.s and .mu..sub.a.
[0007] It is well established that there is a difference in the index of refraction between blood serum/interstitial fluid (IF) and cell membranes (such as membranes of blood cells and skin cells). (See, R. C. Weast, ed., CRC Handbook of Chemistry and Physics, 70th ed., (CRC Cleveland, Ohio 1989).) This difference can produce characteristic scattering of transmitted light. Glucose, in its varying forms, is a major constituent of blood and IF. The variation in glucose levels in either blood or IF changes the refractive index of blood-perfused tissue, and thus the characteristic of scattering from such tissue. Further, glucose-induced changes to the refractive index are substantially greater than changes induced by variation of concentrations of other osmolytes in physiologically relevant ranges. In the near-infrared (NIR) wavelength range, blood glucose changes the scattering coefficient, .mu..sub.s, more than it changes the absorption coefficient, .mu..sub.a. Thus, optical scattering of the blood/IF and cell combination varies as the blood glucose level changes. Accordingly, there is the potential for non-invasive measurement of blood glucose levels.
[0008] Current non-invasive optical techniques being explored for blood glucose applications include polarimetry, Raman spectroscopy, near-infrared absorption, scattering spectroscopy, photoacoustics, and optoacoustics. Despite significant efforts, these techniques have shortcomings, such as low sensitivity (signal-to-noise ratio) for the glucose concentrations at clinically-relevant levels, low accuracy (less than that of current invasive home monitors), and insufficient specificity of glucose level measurement within a relevant physiological range of 1.7-27.8 mM/L or 30-500 (mg/dL). For example, diffuse reflectance, or diffuse scattering, has been explored as a technique for noninvasively measuring levels of blood glucose. M. Kohl, Optics Letters, 19(24) 2170-72 (1994); J. S. Maier, et al., Optics Letters, 19(24) 2062-64 (1994). Using diffuse reflectance, a glucose-induced change of around 0.2%-0.3% in the scattering coefficient per 18 mg/dL (or 1 mM/L) has been measured. This measured change is too small to be utilized efficiently for a blood-glucose monitor for home use. Additionally, glucose-induced changes to the scattering coefficient can be masked by changes induced by temperature, hydration, and/or other osmolytes. Accordingly, there is a need for a method to conveniently, accurately, and non-invasively monitor glucose levels in blood.
[0009] Optical coherence tomography, or OCT, is an optical imaging technique that uses light waves to produce high-resolution imagery of biological tissue. OCT produces images by interferometrically scanning, in depth, a linear succession of spots and measuring absorption and/or scattering at different depths at each successive spot. The data then is processed to present an image of the linear cross section. The key benefits of such a system in imaging applications include the ability to achieve a high resolution, e.g., better than 10 micrometers, and the ability to select the depth at which a sample can be imaged. For example, blood vessels beneath the surface of the skin can be imaged using such a system.
[0010] As discussed in U.S. application Ser. No. 10/916,236, and in R. O. Esenaliev, et al., Optics Letters, 26(13) 992-94 (2001), the entire disclosure of which is incorporated by reference, it has been proposed that OCT might be useful in measuring blood glucose. However, difficulties associated with this technique include the large number of scans required to reduce optical noise, or speckle, which arises from wavefront distortion when coherent light scatters from tissue. While an OCT imaging system can reduce speckle by averaging it out over many scans or measurements, this approach is time-consuming, which makes the use of a conventional OCT imaging system impractical for in-home monitoring of blood glucose levels. Additionally, an OCT imaging system requires complex processing to form a workable image and to analyze the image data sufficiently in order to determine glucose levels.
[0011] Accordingly, there is a need for enhanced OCT systems for measuring analytes such as blood glucose levels.
SUMMARY OF THE INVENTION
[0012] In accordance with the present invention, a method for non-invasively measuring glucose levels in blood is presented. Specifically, changes in a scattering profile produced from an OCT-based monitor are related to changes in blood glucose levels by focusing on highly localized regions of the scattering profile where changes to the scattering profile induced by temperature, hydration, and other osmolytes are negligible. Glucose-induced changes to the scattering coefficient measured from these localized regions range between about 2% and about 20% per 1 mM/L or 18 mg/dL, with an average value of about 12% per 18 mg/dL. These percentage values are significantly higher than those measured using other methods. Additionally, within the localized regions, effects to the scattering coefficient induced by temperature, hydration, and other osmolytes are negligible compared to the effects of glucose, and, accordingly, can be ignored. The changes in the scattering profile can be related to changes in glucose concentrations by one or more mathematical algorithms.
[0013] A method for noninvasively measuring blood glucose-levels in biological tissue is described herein. The method includes the steps of scanning a two-dimensional area of skin with a monitor based on non-imaging optical coherence tomography, collecting cross-sectional depth measurement data continuously during the scanning step, and identifying at least one localized region within the cross-sectional depth measurement data, wherein the at least one localized region corresponds to a structure within the skin where glucose-induced changes to the cross-sectional depth measurement data are prominent. Further, the method includes the step of relating the cross-sectional depth measurement data to blood glucose levels.
[0014] In one exemplary embodiment, a method for calibrating OCT measurements using multiple light wavelengths is described to identify a tissue for measurement. At least two OCT scattering profiles can be obtained from light attenuated by a subject's tissue as a function of tissue depth. Non-limiting types of tissue include vascular tissue (e.g., a blood vessel wall), at least one component of blood, dermal tissue surrounding the vascular tissue, or some combination of the aforementioned types. The OCT scattering profiles can be obtained at different wavelengths of light such that the tissue can exhibit a different attenuation coefficient for each wavelength. The attenuation of light can be based at least in part on the presence of an analyte associated with the tissue (e.g., water or hemoglobin). The wavelengths can also be chosen such that the tissue has a different absorption coefficient at the two wavelengths. The wavelengths can also be chosen such that the scattering coefficient is larger than the absorption coefficient at the first selected wavelength, and optionally the absorption coefficient at the second wavelength is larger than the absorption coefficient at the first wavelength. A localized region (e.g., one or more depths) can be identified corresponding to a tissue location of OCT measurement calibration. Such calibration can be based upon a differential comparison of the two OCT scattering profiles. A blood glucose measurement (e.g., some type of chemical blood analysis measurement) can be associated with each of the OCT scattering profiles for calibrating other OCT measurements (e.g., using the OCT scattering profiles and blood glucose measurements to make a calibration between attenuation coefficient and blood glucose concentration). In general, the localized region can have changing light attenuation coefficients based on the presence of blood glucose or other measurable analytes.
[0015] With respect to the exemplary method previously described, the OCT scattering profiles can be normalized prior to differential comparison, with a depth corresponding to a tissue location for OCT measurement calibration depending upon a differential comparison of normalized OCT profiles (e.g., subtracting one normalized profile from another at corresponding depth locations). Normalization can be performed by dividing the scattering data of a respective OCT profile by the profile's respective peak intensity value. One or more extrema points in the differential comparison of normalized OCT profiles can be identified, and subsequently correlated with the depth of the tissue location or some other measure of the localized region corresponding with the tissue location.
[0016] In general, an offset location and an interval can define a localized region of an OCT scattering profile that can be correlated with a particular attenuation coefficient. The offset can correspond with a depth of a tissue location, and the interval can be determined from the offset location and the OCT scattering profile. The offset location and interval can be used to define the region of the OCT scattering profile in which a slope measurement can be correlated with the attenuation coefficient (or the scattering coefficient when absorption effects are small).
[0017] Another exemplary embodiment is directed to a method of determining an absorption coefficient in OCT measurements using multiple light wavelengths. Two or more OCT scattering profiles can be obtained as a function of subject tissue depth at different wavelengths of light such that the tissue has a larger scattering coefficient than absorption coefficient at a first selected wavelength (e.g., the scattering coefficient being at least about 5 times greater than the absorption coefficient). A scattering coefficient can be determined from the first OCT scattering profile (e.g., by locating a slope in the first OCT scattering profile). An estimate of a scattering coefficient from the second OCT scattering profile can be obtained from the scattering coefficient of the first OCT scattering profile. Such an estimate can be obtained using scattering theory (e.g., Mie scattering). The absorption coefficient of the second OCT scattering profile can be determined using the estimate of the scattering coefficient at the second selected wavelength. A similar method can also be used to determine a scattering coefficient.
[0018] Another method consistent with an embodiment of the invention is directed to calibrating OCT measurements using multiple light wavelengths. Two or more OCT measurements can be obtained as a function of time using different wavelengths of light for each measurement. The wavelengths can be chosen such that the tissue has a larger absorption coefficient at a first selected wavelength relative to a second. Such an absorption coefficient can also depend upon the presence of an analyte (e.g., water) in or around the tissue. One wavelength can also be chosen such that the scattering coefficient exceeds the absorption coefficient by at least about a factor of five. A first OCT measurement can be converted into an analyte measurement as a function of time. The analyte measurement can be used to calibrate a scattering coefficient measurement as a function of time.
BRIEF DESCRIPTION OF THE DRAWINGS
[0019] The present invention will be more readily understood from the detailed description of the embodiment(s) presented below considered in conjunction with the attached drawings, of which:
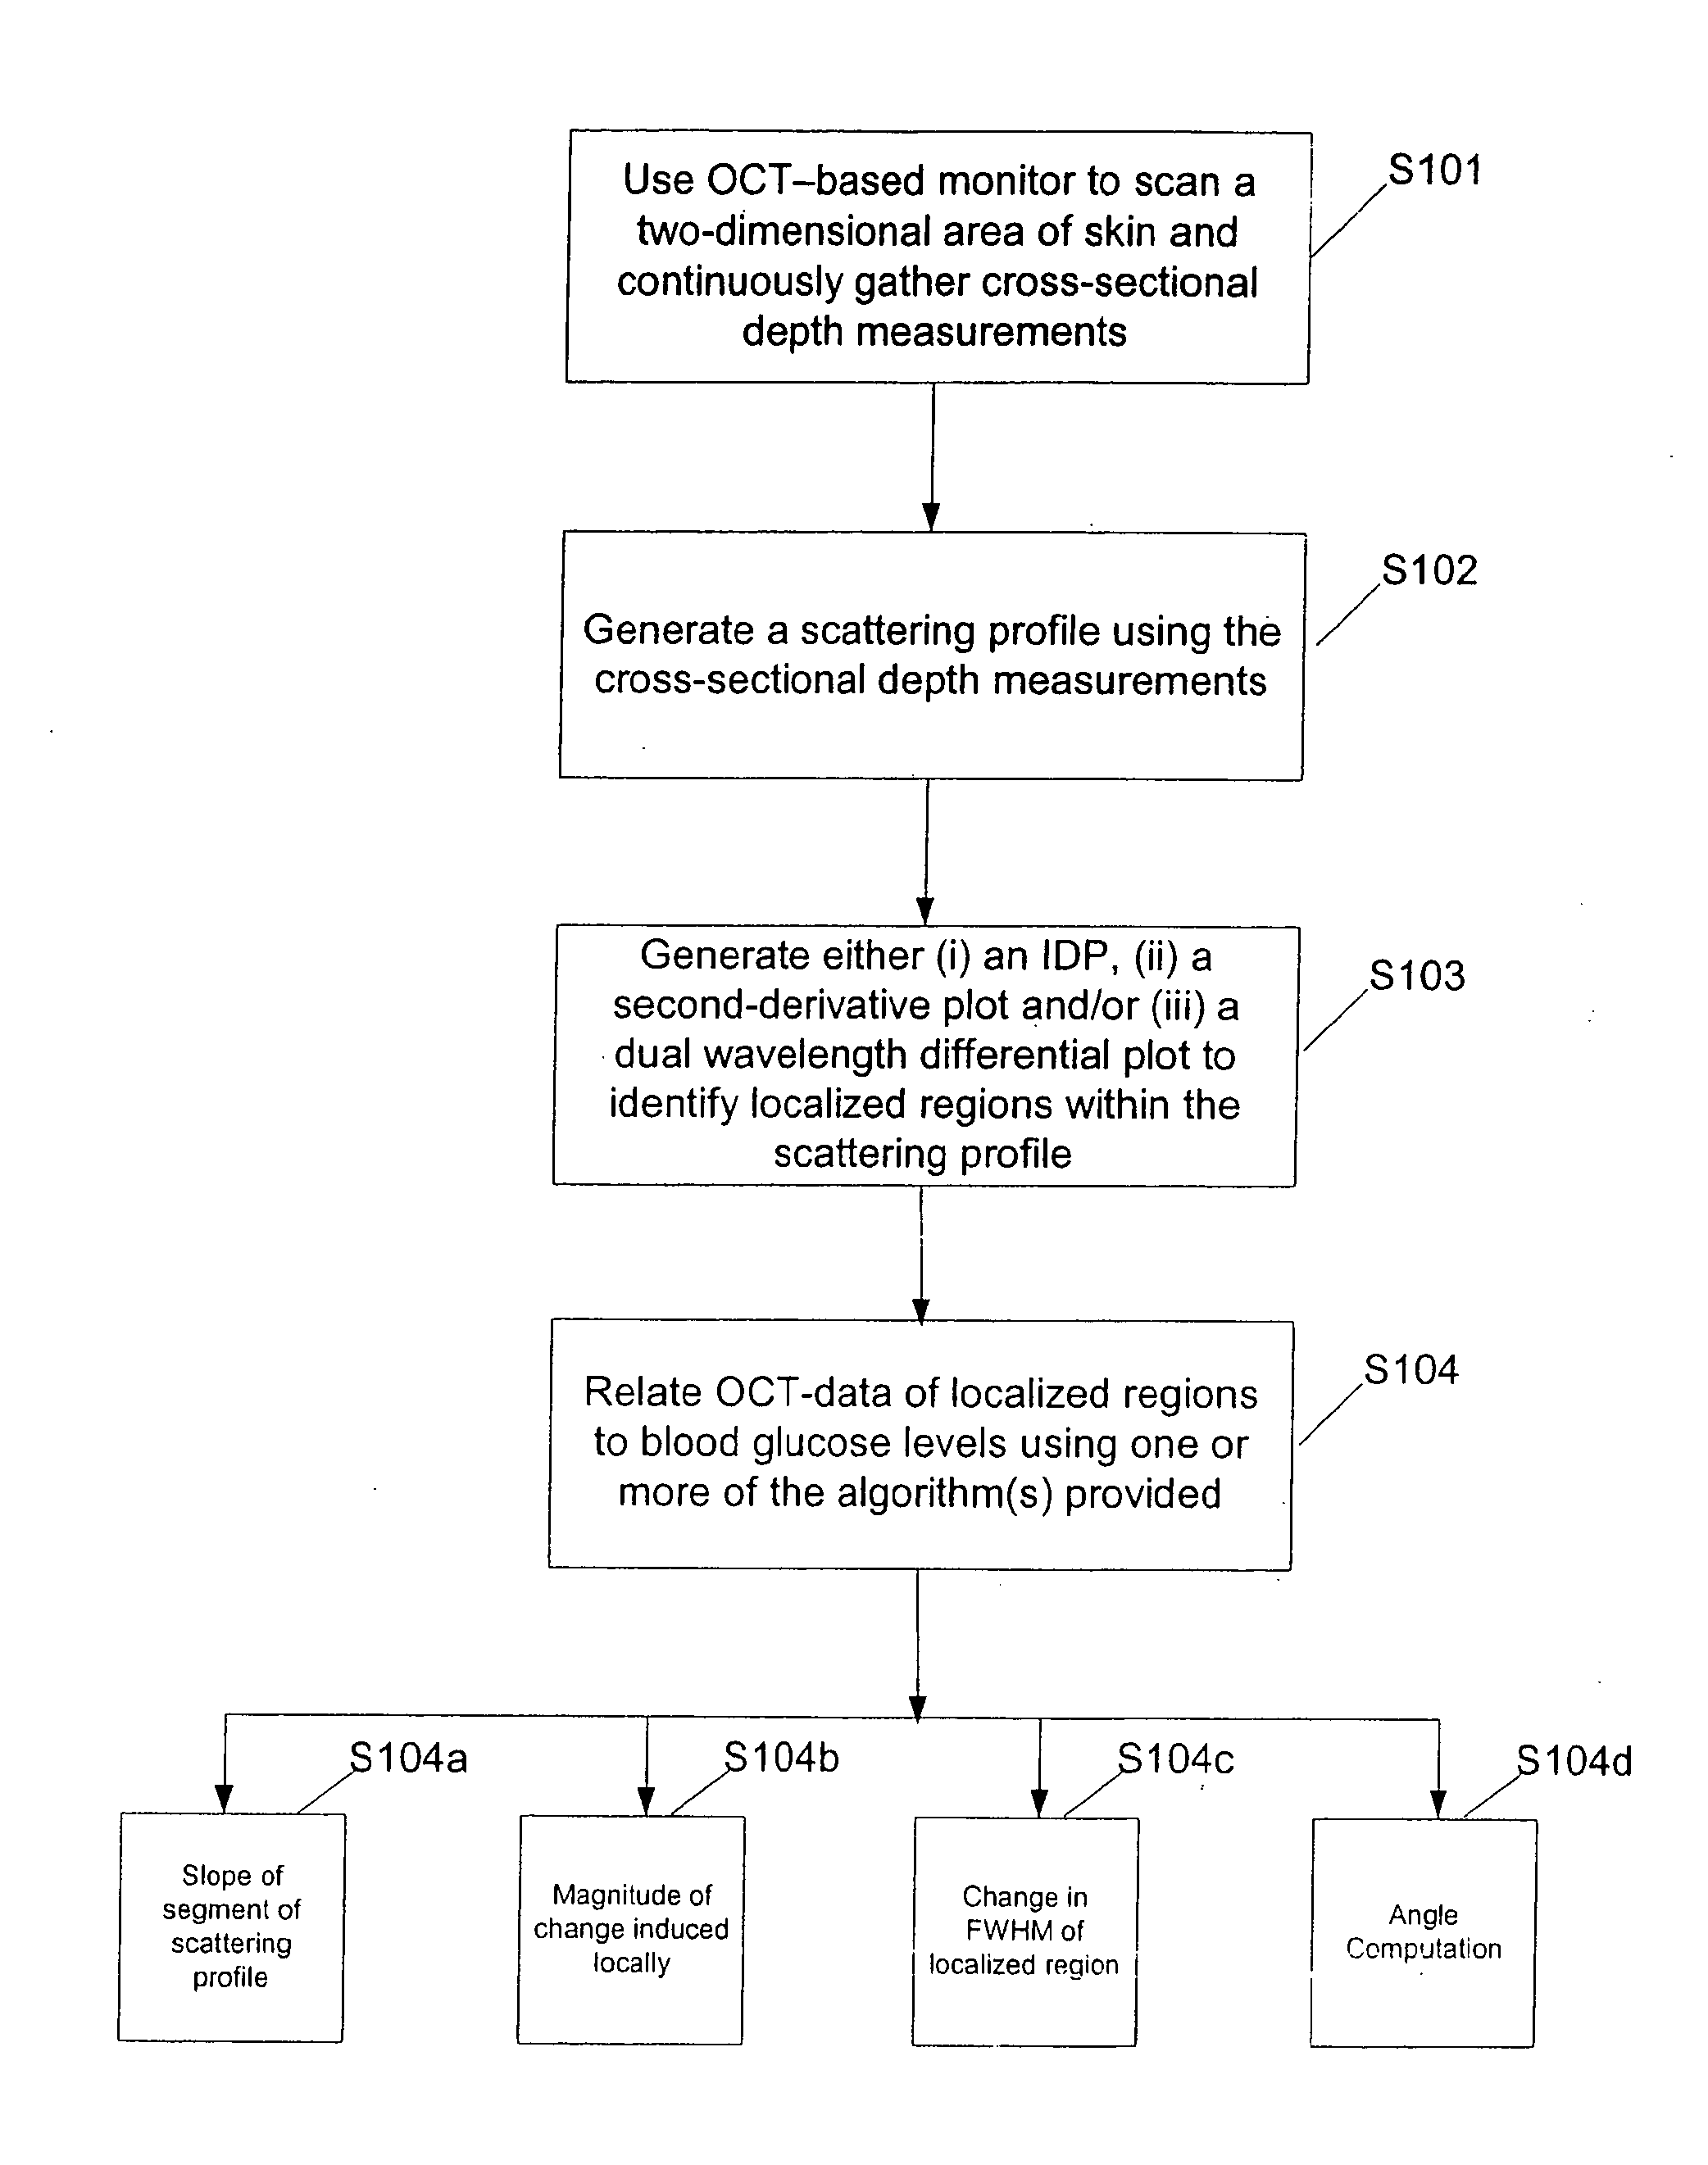
[0020] FIG. 1 illustrates a process flow of a method for measuring blood glucose;
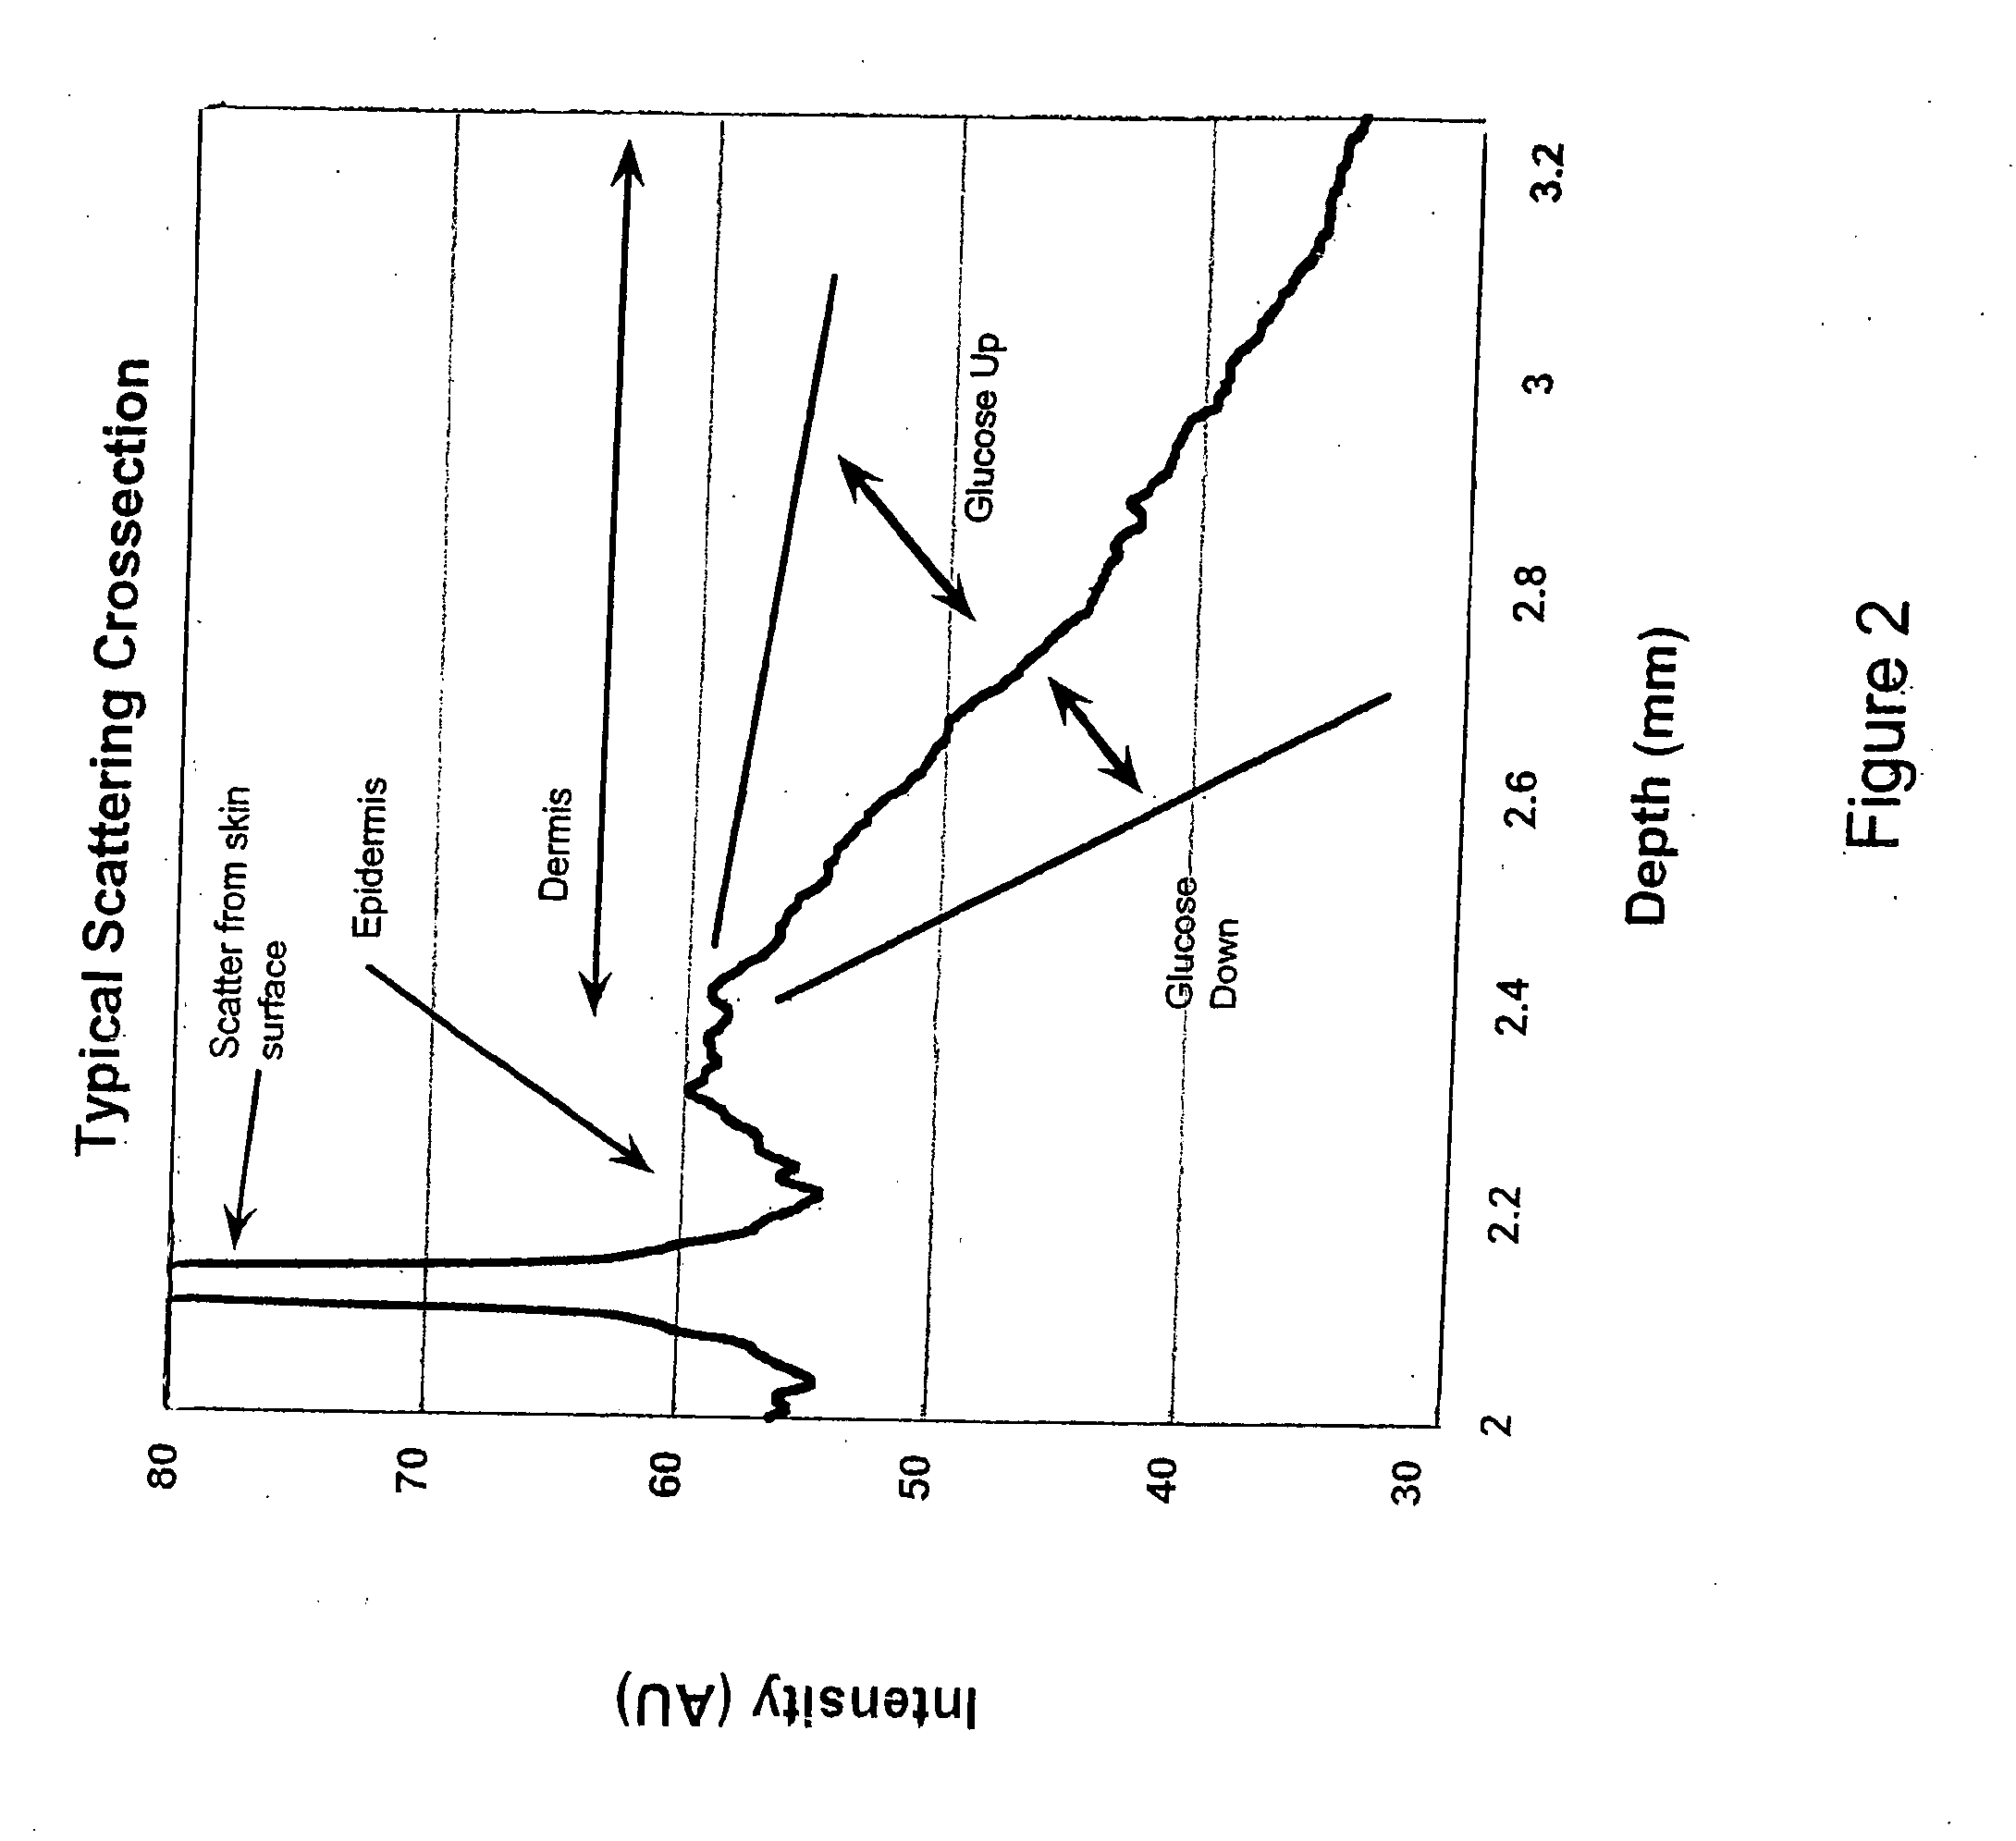
[0021] FIG. 2 is a graphical illustration of a typical scattering cross section from a patch of human skin measured using an OCT-based monitor;
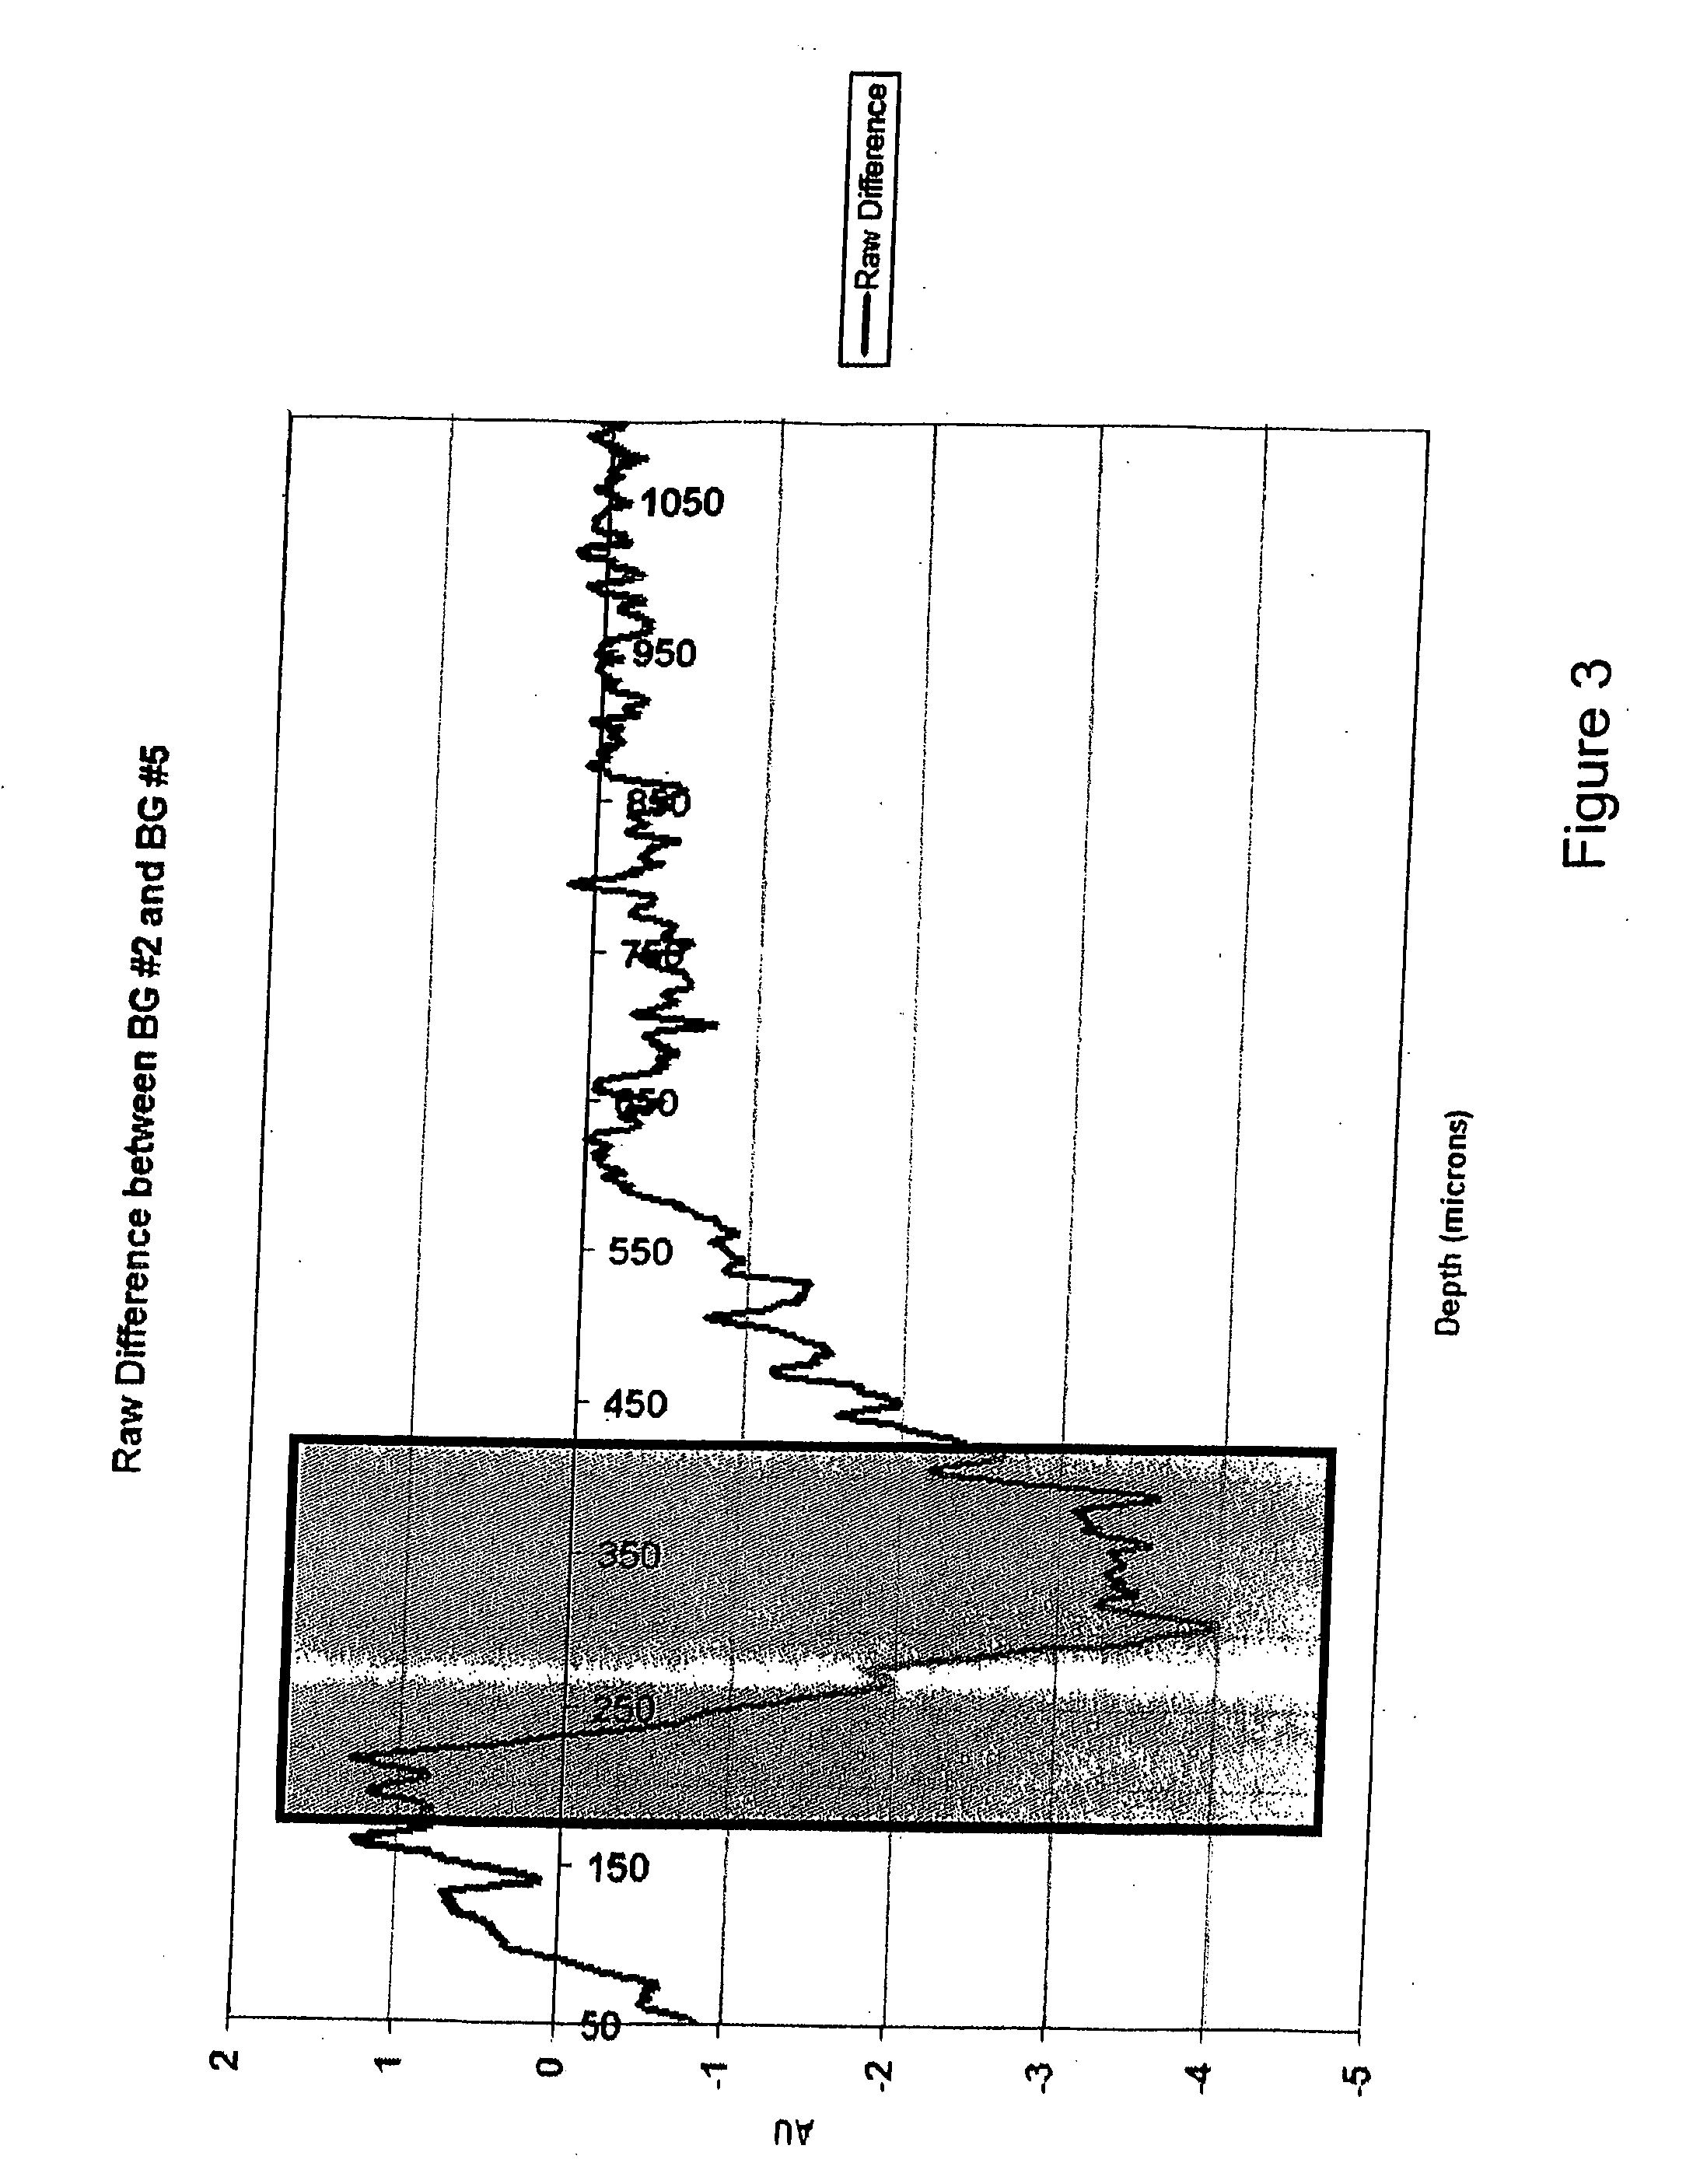
[0022] FIG. 3 is an example of an intensity difference plot, according to an embodiment of the present invention;
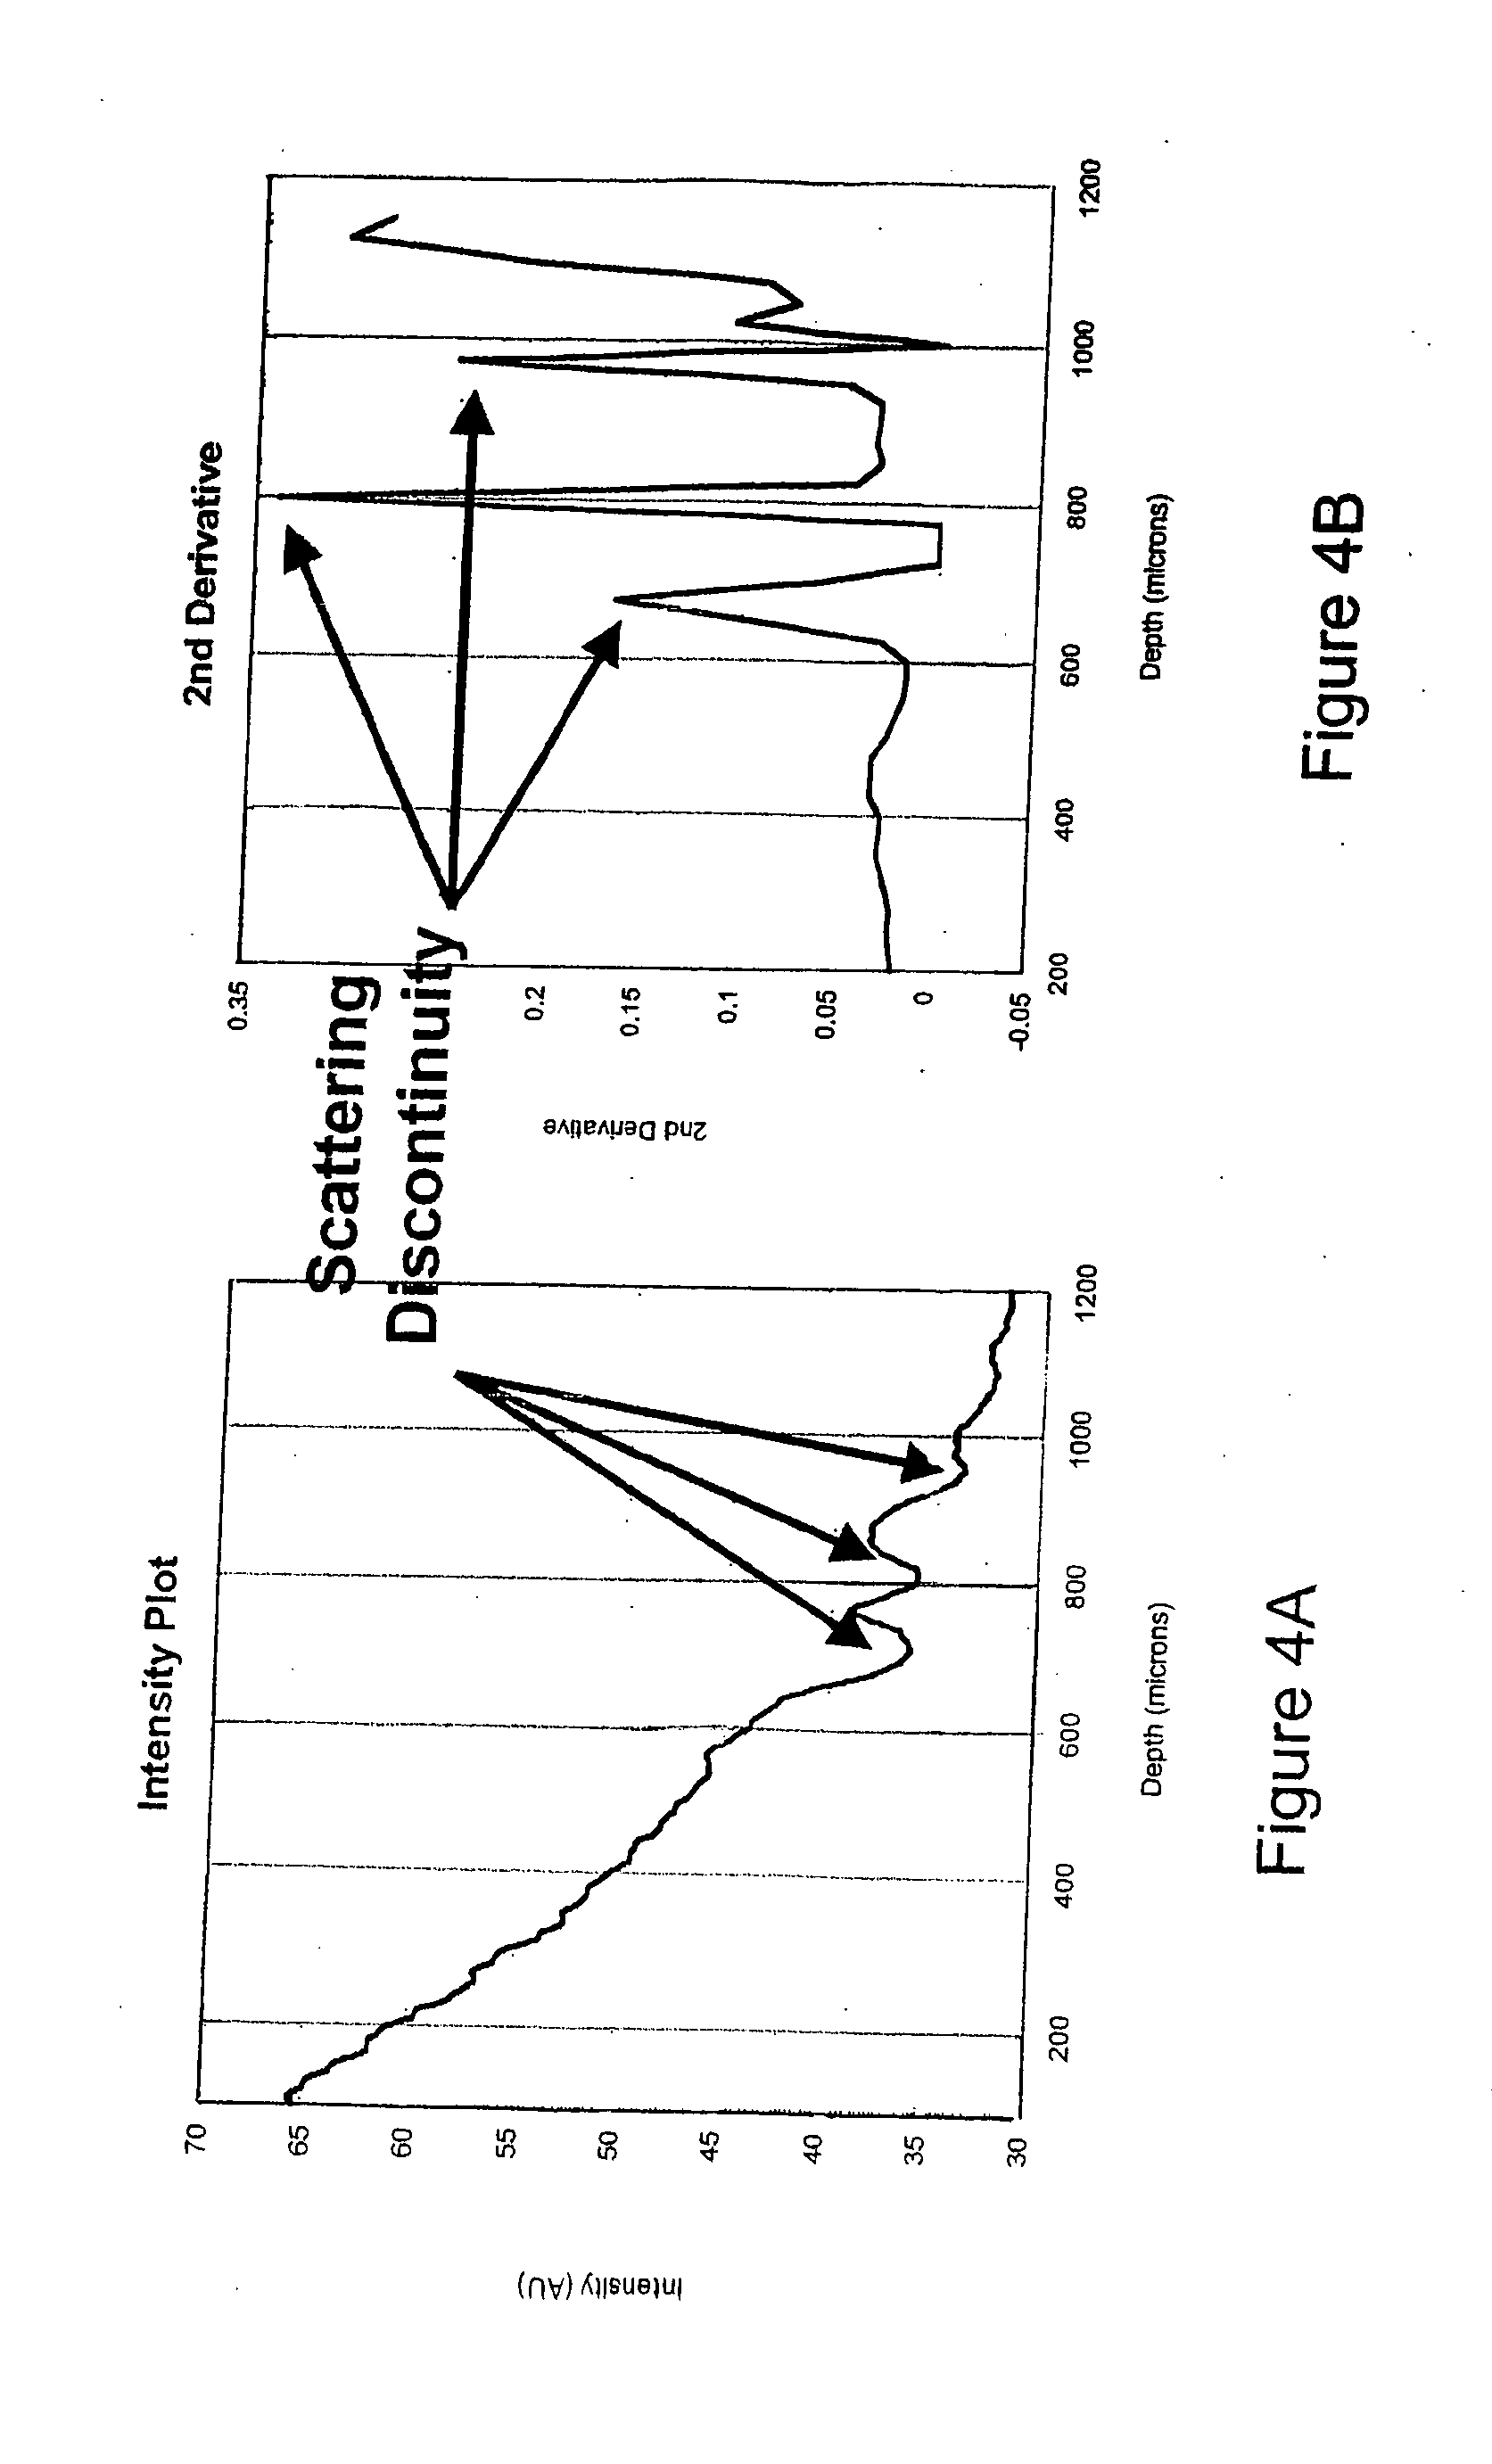
[0023] FIGS. 4A and 4B are graphical illustrations in which scattering discontinuities are identified according to an embodiment of the present invention; and
[0024] FIG. 5 is a graphical illustration of an absorption effect of water at multiple wavelengths, according to an embodiment of the present invention;
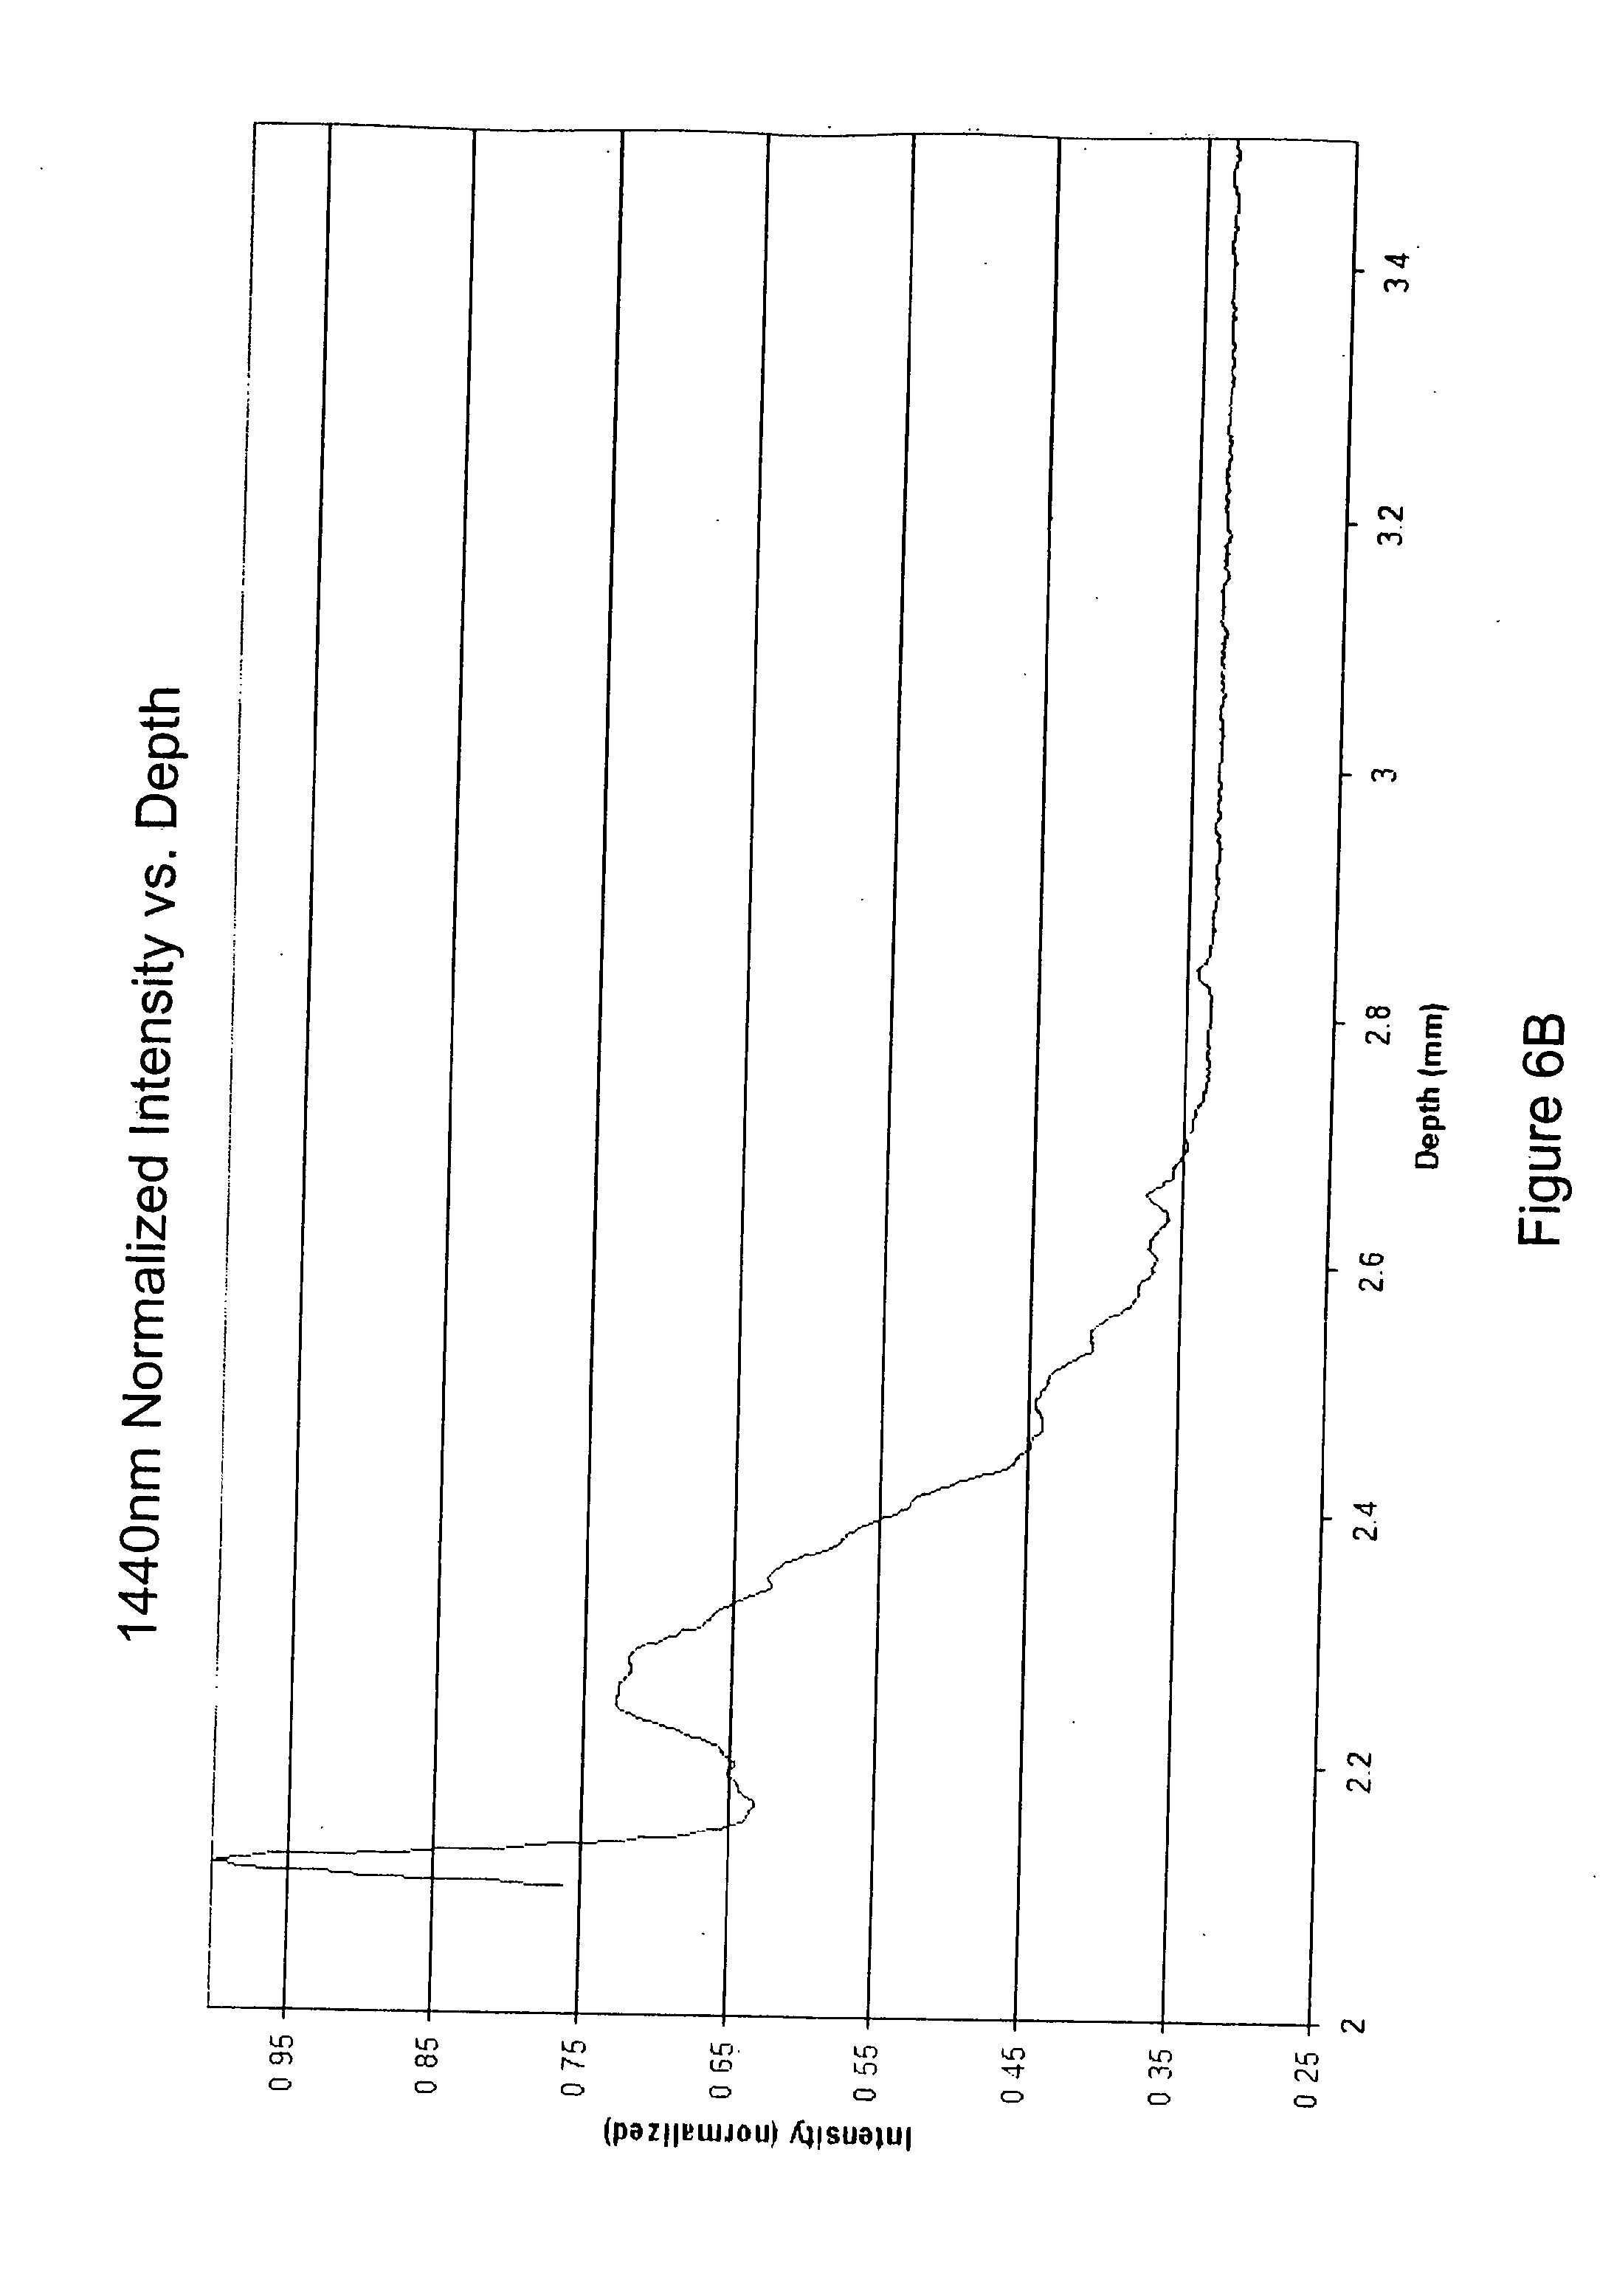
[0025] FIGS. 6A and 6B are examples of scattering profiles at wavelengths of 1310 nanometers and 1440 nanometers, respectively, according to an embodiment of the present invention; and
[0026] FIG. 7 is a graphical illustration of a differential data set scattering profile, according to an embodiment of the present invention.
[0027] FIG. 8 is a schematic diagram illustrating a method of blood glucose monitoring in accordance with the disclosure; and
[0028] FIG. 9 schematically illustrates an apparatus useful for practicing the method of FIG. 8.
DETAILED DESCRIPTION OF THE PREFERRED EMBODIMENT
[0029] According to an embodiment of the present invention, a method for measuring blood glucose levels includes the step of utilizing an OCT-based sensor to take scattering cross-sectional depth measurements on a small area of biological tissue or skin. The OCT-based sensor can be a non-imaging system such as that described in detail in U.S. application Ser. No. 10/916,236. In some embodiments, a two-dimensional area of the skin can be scanned, preferably either in a circular pattern, e.g., with a radius no greater than about 2 mm, or in a filled disk or filled rectangular pattern where the pattern is drawn randomly. As the OCT-based sensor scans the two-dimensional pattern continuously, the sensor continuously collects data corresponding to cross-sectional depth measurements within the biological tissue. Other embodiments can utilize an OCT-based sensor to obtain cross-sectional depth measurements with two-dimensional scanning.
[0030] By continuously acquiring a two-dimensional scan pattern and continuously taking cross-sectional depth measurements, the noise associated with OCT sensing, often referred to as "speckle," is reduced more efficiently than scanning tissue using a step-scan method, as described in A. Kholodnykh, et al., Applied Optics, 42(16) 3027-37 (2003). In Kholodnykh, a method proposed for an OCT-based system includes scanning a two-dimensional pattern using a step-scan process, where the OCT-based system light beam picks a spot on the skin and takes multiple depth scans. The OCT-based system then averages these depth scans to reduce speckle, and moves on to another spot on the skin, takes multiple depth scans, and averages the depth scans. The OCT-based system repeats this process until a two-dimensional pattern has been made.
[0031] In accordance with an embodiment of the present invention, the OCT-based monitor continuously scans an area of skin and continuously collects data. Using this method, fewer scans in less time are required to produce sufficient results. To further reduce speckle, a number of OCT scans can be averaged to produce an average OCT scan result. Thus, data associated with a particular OCT scan at a specific point in time is actually an averaged result of a group of OCT scans.
[0032] Using the cross-sectional depth measurements, an intensity profile, or scattering profile, can be generated. Within the scattering profile, localized regions where changes to the scattering profile are dominated by changes in blood glucose can be identified. To locate these regions, a second-derivative plot can be generated, as disclosed in U.S. Provisional Application No. 60/671,285. Using the second-derivative plot, discontinuities in the scattering profile are exaggerated and easily visualized. These discontinuities represent structures in the skin where changes in blood glucose levels dominate the scattering profile. Within these highly localized regions, changes to the scattering profile induced by temperature, hydration, and other osmolytes, such as sodium, potassium, and urea, are very small compared to the effects of glucose, and therefore, can be ignored.
[0033] By focusing on the localized regions identified in the intensity profile, there are multiple means that can be used to correlate efficiently the scattering profile to blood glucose levels. Upon identifying these localized regions, the data of the scattering profile can be related to blood glucose levels using one or more mathematical algorithms such as, for example, an algorithm relating the slope of a portion of the OCT data curve to blood glucose levels, where the portion of the OCT data curve corresponds to a discontinuity in the scattering profile. An example of such an algorithm is disclosed in detail in U.S. Provisional Application No. 60/671,285. Optionally, the scattering profile can be related to blood glucose levels by utilizing a magnitude of the glucose-induced localized change, either using a straight peak intensity measurement or using an integrated intensity measurement where each region integrated corresponds to a localized region identified in the second-derivative plot. Alternatively, the scattering profile can be related to blood glucose levels using a change in full width at half-maximum measurement of one or more of the localized regions identified in the second-derivative plot. In addition, the scattering profile can be related to blood glucose levels using an angle computation, where the angle corresponds to a peak change in a localized region and an arbitrary depth.
[0034] Another aspect of the embodiment of the present invention includes identifying localized regions of change in the scattering profile by utilizing an intensity difference plot (IDP), which is described in detail in U.S. Provisional Application No. 60/671,285. Although an IDP requires a significant change in glucose concentrations, such as, for example, the change caused by the subject ingesting food during the course of the testing time period while OCT scans are taken, one or more localized regions in the data curve that correspond to tissue structures where noticeable changes to the scattering profile were produced by changes in blood glucose levels can be identified. Once the localized regions are identified, the scattering profile from the localized regions can be related to blood glucose levels using the algorithms mentioned above.
[0035] Yet another aspect of the embodiment of the present invention includes using a multiple-wavelength method to identify localized regions of the scattering profile that correspond to tissue and/or tissue structures, such as blood, blood vessels, or other tissue, where changes in the scattering profile due to presence of one or more analytes, such as blood glucose levels, are detectable. The term "wavelength" is used herein to define a region of the electromagnetic radiation spectrum that is distinguishable from other regions. While laser sources with narrow linewidths can be preferable, other lower resolution, or even broadband light sources, can also be used. For example, the invention can be practiced with two wavelengths of light, one of which might be a multimode source spanning several nanometers, e.g., 1308-1312 nm or 1438-1442 nm.
[0036] As disclosed in U.S. application Ser. No. 10/916,236, the OCT-based monitor can be constructed such that multiple wavelengths of light are employed to illuminate the skin. Light from multiple wavelengths is absorbed differently by different biological constituents, which differentially reduces the intensity of the scattered light. Moreover, light reflected in and around tissue can be partially absorbed by a constituent for that wavelength. The constituent, in or around the tissue, for that wavelength absorbs some of the light according to the specific wavelength and/or the analyte level in or around the tissue. The differences in the scattering and absorption properties produced by multiple wavelengths interacting with different constituents provide for a determination of an optimal correlation between the scattered signal and a chosen analyte level. For example, light reflection and absorption in and around particular tissues and tissue structures can be correlated with the presence of glucose to provide a measurement of blood glucose levels. Potential tissues and tissue structures, whose light interaction can be correlated with blood glucose levels, include (but are not limited to) vascular tissue (e.g., blood vessel walls), blood and its components (e.g., cells), dermal tissue surround blood vessels, and any combination of the aforementioned tissues and/or tissue structures.
[0037] The wavelengths can be chosen to provide an optimal contrast between the absorption and scattering effects of blood and other biological constituents, such as water. For instance, the wavelengths can be chosen to accentuate contrast regarding the presence of a particular analyte that is a signature of the presence of a tissue or tissue structure desired to be targeted by OCT measurements (e.g., water being a signature of the presence of blood perfused tissue). A first wavelength of light emitted from the OCT-based monitor can be chosen such that there is minimum absorption of the light by water compared to the scattering effect, which makes the absorption effects corresponding to water negligible, i.e., the total attenuation coefficient (.mu..sub.s+.mu..sub.a) is dominated by the scattering coefficient contribution. In general, when one of the coefficients dominates another in the total attenuation coefficient, we can assume that the less dominant coefficient can be ignored. For example, we can say that .mu..sub.s>>.mu..sub.a when the scattering coefficient is at least about 5 times, or at least about 10 times, greater than the absorption coefficient. If a second wavelength is chosen to provide peak absorption of light by water, then the difference in light attenuation between the two wavelengths can be used to indicate the position in depth of a blood perfused tissue structure, such as a blood vessel. Clearly, three or more wavelengths of light can also be used to generate corresponding OCT profiles, with specific wavelength pairs utilized in a combination to generate a corresponding light attenuation difference.
[0038] According to this aspect of the embodiment of the present invention, OCT scans are taken at two different wavelengths of light, where the first wavelength is chosen such that the scattering effects are dominant over absorption effects of water, and the second wavelength is chosen such that there is substantial absorption by water. Preferably, the scattering data sets produced by scanning a two-dimensional area of the skin by the first and second wavelengths are normalized by finding the peak data point in each scattering data set and dividing all data points by the respective peak data point. Thus, each normalized scattering data set is now a set of decimal values with each peak data point having a value of 1.0.
[0039] The normalized scattering data set of the second wavelength can be subtracted from the normalized scattering data set of the first wavelength to produce a differential scattering data set over the depth of the OCT signal, for a specific point in time. As discussed in U.S. Provisional Application No. 60/671,285, there are two variables or parameters associated with fitting the OCT data to blood glucose levels in order to achieve the best correlation. These variables are an offset and an interval. An "offset" is the depth of the OCT data curve at which to begin correlating the OCT data to the blood glucose levels. An "interval" is a certain portion or segment of the OCT data curve that is measured from the offset. For each OCT data curve there are numerous potential combinations or pairs of offsets and intervals. By identifying a peak value in a differential scattering data set, an offset (depth) can be obtained that corresponds to tissue structures where glucose-induced changes are dominant. If a linear fit from the peak value to another data point of the differential data curve is generated, the linear fit corresponds to an offset and interval combination where the slope of the offset and interval combination is highly correlated to blood glucose levels, i.e., the offset and interval can define the localized region of an OCT data curve in which an appropriate attenuation coefficient can be identified and correlated with a blood glucose level. Thus, each linear fit can identify a localized region where glucose-induced changes to the scattering profile are predominant. In cases where the OCT data curve is generated using a wavelength of light in which .mu..sub.s>>.mu..sub.a, the attenuation coefficient reduces to a scattering coefficient.
[0040] As mentioned above, by focusing on these highly localized regions along the scattering profile, structures within the skin can be identified where changes to the scattering profile induced by glucose are high, which allows effects induced by temperature, hydration, and other osmolytes to be ignored.
[0041] This method focuses on the relative depths of certain structures within the skin, namely, capillaries where blood vessels are prevalent, and identifies the regions of the depth scan that correlate to these structures where glucose levels are known to fluctuate significantly. By focusing on these highly localized regions of a scattering profile, glucose-induced changes to the scattering coefficient of about 2% to about 20% per 18 mg/dL can be obtained, which is significantly higher than the 0.2%-0.3% obtained using other noninvasive optical scattering methods.
[0042] A method for measuring blood glucose levels noninvasively is summarized in the flow chart presented in FIG. 1. According to an embodiment of the present invention, at step S101, a non-imaging OCT-based monitor, or a "sensing" OCT-based monitor, can be utilized to take multiple scattering cross-sectional depth measurements on an area of skin. The OCT-based monitor continuously scans a two-dimensional area of skin, preferably scanning either a circle, a filled disk, or a filled rectangular pattern, where the filled pattern is drawn randomly. As the OCT-based monitor scans the skin, the monitor continuously collects cross-sectional depth measurements. As discussed above, continuously scanning a two-dimensional area of skin while continuously collecting data reduces speckle faster than previously known methods that use an OCT-based monitor. Additionally, fewer scans are required to average out speckle and thus, less time is required to take the scans.
[0043] At step S102, the cross-sectional depth measurements can be utilized to create a scattering profile in which the OCT data curve is plotted over time. FIG. 2 shows a scattering profile of light scattered from human skin as measured via an OCT-based monitor, according to an embodiment of the present invention. If an appropriate wavelength of light is chosen (e.g., around 1300 nanometers) where "an appropriate wavelength of light" is one in which the absorption coefficient of the light, .mu..sub.A, is small relative to the scattering coefficient, .mu.s, of the light by the skin. A change in the OCT signal (e.g., a change in the slope of a portion of an OCT profile) likely will be dominated by glucose-induced changes in the tissue scattering. Based on the wavelength of light chosen, the OCT data curve spikes at certain regions of the surface of the skin and then falls dramatically within the epidermis region of the skin. The OCT data curve also rises and slowly decreases within the dermis region as the depth of light in the skin increases. As shown in FIG. 2, the slope of the OCT data curve can increase or decrease relative to the blood glucose level. That is, the slope of the OCT data curve will change in response to glucose level changes in very small defined regions. Because most blood vessels are located in the dermis region, it is this portion of the OCT data curve that provides data for measuring blood glucose levels. To identify this region, one or more of the graphs described below can be generated.
[0044] At step S1103, an intensity difference plot (IDP) can be generated to highlight one or more regions of the OCT data curve that correspond to tissue structures where glucose-induced changes are dominant. An example of an intensity difference plot is illustrated in FIG. 3. As described in U.S. Provisional Application 60/671,285, two OCT scans are selected and the difference in the OCT data between the selected two OCT scans is computed. The differential data can then be plotted to produce an IDP, as shown in FIG. 3. From the IDP, one or more zero-crossing points can be identified as well as localized extrema surrounding the zero-crossing points, respectively. The IDP in FIG. 3 has one zero-crossing point, which is located at a depth of about 225 microns. A local maximum data point is located at around 200 microns and a local minimum point is located at around 350 microns. The region of the localized extrema represents a highly localized region where glucose-induced changes to the scattering coefficient are the dominant effect within a tissue structure, and is represented in FIG. 3 by a shaded box. To relate the OCT data to blood glucose levels, the highly localized region can be focused upon and data falling outside this region can be ignored. Within this region, effects due to temperature, hydration, and other osmolytes are negligible. Optionally, the box can be expanded to include potential offsets within a variance amount of the localized extrema. For example, in FIG. 3, the range of potential offsets includes offsets from 175 microns to 400 microns.
[0045] According to another aspect of the embodiment, at step S103, the scattering profile can be used to generate a second-derivative plot. As described in U.S. Provisional Application 60/671,285, discontinuities in the scattering profile represent structures in the skin where changes due to variations in blood-glucose levels are high relative to changes in the scattering profile induced by other analytes. The second-derivative plot enhances these discontinuities to help identify one or more highly localized regions where the scattering profile can be related to blood glucose levels.
[0046] FIGS. 4A and 4B graphically illustrate how a second-derivative plot enhances discontinuities in the scattering profile. In FIG. 4A, a scattering profile is plotted against the depth of the scanned area of skin. Discontinuities in the scattering profile are identified by circles in the graph, however, these discontinuities typically are difficult to visualize. In FIG. 4B, a square of a second derivative of the scattering profile is plotted against the depth of the scanned area of skin. The discontinuities in the scattering profile are enhanced by the second derivative computation, while calculating the square value of the second derivative removes any negative values that can exist. The discontinuities correspond to structures in the skin where changes in blood glucose levels are dominant, such as, for example, blood vessels. The scattering data corresponding to the identified localized regions can then be related to blood glucose levels.
[0047] Another aspect of the embodiment includes utilizing multiple wavelengths to identify tissue and/or tissue structures with a high degree of hydration or water content due to blood perfusion, such as blood vessels where changes in blood glucose levels are prevalent, at step S103. The localized regions of the scattering profile that correspond to these tissue structures then correlate well to blood glucose levels. As described above, the OCT-based monitor can utilize multiple wavelengths of light, where one wavelength is chosen that produces a minimum absorption of light by water in the interstitial fluid, and another wavelength is chosen that provides a substantial absorption of light by water. FIG. 5 illustrates the absorption of light by water at different wavelengths. For example, if a first wavelength of light at 1310 nanometers (nm), where the absorption effects of water are minimal, and a second wavelength of light at 1440 nanometers (nm), where the absorption effects of water are maximized, are chosen, the differential scattering data set produced from the OCT data of the two wavelengths can be used to determine tissue structures where hydration is high, such as a blood vessel. Of course, other analytes indicative of a tissue or tissue structure can also be detected by the choice of appropriate light wavelengths. For example, hemoglobin has a peak absorption at 660 nm when deoxygenated and 940 nm when oxygenated. Accordingly, either of these wavelengths can be useful to detect oxygen levels in tissue. It can also be advantageous to select light wavelengths such that the scattering due to the presence of a measured analyte (e.g., blood glucose or hemoglobin) does not differ a great deal in the two wavelengths, i.e., the difference in intensity of the two wavelengths is due mostly to the presence of water or some other analyte indicative of the presence of a blood vessel or other tissue structure.
[0048] The scattering profiles for each wavelength at a particular point in time can be plotted, as shown in FIGS. 6A and 6B, which represent exemplary scattering profiles for first and second wavelengths of 1310 nm and 1440 nm, respectively. In both FIGS. 6A and 6B, the scattering data set for each wavelength has been normalized using the respective peak intensity value. Thus, the peak intensity value for each scattering data set is 1.0, and each data point around the peak is less than 1.0. Because the sensitivity of the OCT-based monitor is different at the two wavelengths, the scattering profiles of the two wavelengths can not be compared directly. Normalization of the scattering data sets allows direct comparison of the scattering data sets from the two wavelengths.
[0049] Upon normalizing the data, the normalized scattering data set of the second wavelength can be subtracted from the normalized scattering data set of the first wavelength to produce a differential scattering data set. Using the exemplary wavelengths of 1310 nm and 1440 nm, a differential data curve plot can be produced, as shown in FIG. 7. The profile of the differential data curve suggests one or more offset and interval pairs that correspond to localized regions of the scattering profile where variations in blood glucose levels are the predominant effect. One or more peak data points identified in the differential data curve suggests one or more depths or offsets at which to begin correlating the OCT data to blood glucose levels. Using the peak data point(s), one or more intervals can be identified by choosing one or more data points on either side of the peak data point(s). The combination of the offset(s) and the one or more intervals produces offset and interval pairs that can be applied to the scattering profile produced by the first wavelength, e.g., 1310 nm, to identify localized regions where glucose-induced effects to the scattering profile are predominant.
[0050] Upon identifying one or more highly localized regions of the scattering profile where glucose-induced changes are prominent, one or more algorithms can be used to relate the scattering profile to blood glucose levels, at step S1104. At step S104a, the slope of portions or segments of the IDP data curve that correspond to the localized regions can be used to compute predicted blood glucose levels, as described in U.S. Provisional Application 60/671,285. Alternately, at step S104b, the scattering profile can be related to blood glucose levels using a magnitude value of a localized change, either using a straight peak intensity measurement or an integrated intensity measurement using the entire localized region. Another option is to use a change in the full-width at half-maximum measurement of one or more of the localized regions, at step S104c. Yet another option is to use an angle measurement calculation in relating the OCT data to blood glucose levels.
[0051] The description of using multiple wavelengths to locate tissue or tissue structures for glucose monitoring is not intended to limit the use of the technique to the particular application exemplified in the description. Indeed, beyond identifying the presence of water or hydration content of blood vessels, other analytes such as hemoglobin at varying oxygen content can also be utilized as a signature of a particular tissue or tissue structure (e.g., oxygenated tissue). As well, the types of tissue and tissue structures to which multiple wavelength OCT measurements can be used are not limited to blood vessels but can include other vascular tissue, blood (or particular constituents thereof such as cells), dermal tissue surround vascular tissue, and combinations of such exemplary tissues and tissue structures.
[0052] Furthermore, the technique is not limited to detecting blood glucose, but can be used to diagnose other conditions unrelated to blood glucose. In one instance, the technique of using of multiple wavelengths to determine tissue hydration levels can be applied in a variety of contexts including assessment and/or monitoring of congestive heart failure, management of fluid therapy for shock or surgery, management of fluid load in dialysis patients (e.g., peritoneal dialysis or hemodialysis), and management of tissue hydration in pulmonary disease and hypertension. For example, multiple wavelength OCT measurements can be used to monitoring clotting factors in blood. Since the scattering coefficient of blood is affected by hydration, use of the multiple wavelengths allows one to determine the contribution to the scattering coefficient that is substantially hydration independent by comparing scattering coefficients at wavelengths that absorb water strongly and weakly. The scattering coefficient at low water absorbing wavelengths can be related to the viscosity, and eventually the clotting factors of the blood. Such a measurement could be useful in post-surgical monitoring of patients who are administered blood thinning agents. The scattering coefficient at low water absorbing wavelengths can also be adjusted using the measurements at higher water absorbing wavelengths. When using any of the calibration methods encompassed by the present application, actual samples of the measured analyte (or other non-chemically oriented types of analyte measurements) can be utilized to aid in calibration (e.g., the use of blood glucose samples as described with reference to glucose monitoring herein).
[0053] In a further aspect of the embodiment, multiple wavelength OCT measurements can be utilized to provide an improved estimate of a scattering coefficient or an absorption coefficient from tissue measurements. Such an aspect can be utilized in conjunction with any of the potential applications of the present invention such as determining the viscosity of blood. The following description is with reference to estimating an absorption coefficient, though estimates of a scattering coefficient can also be obtained under analogously consistent conditions.
[0054] In one example, a pair of OCT scattering profiles are obtained, each profile corresponding to a measurement at a particular wavelength of light. With reference to the S101 and S102 of the flowchart of FIG. 1 and the corresponding description, the profiles can be obtained by scanning a two-dimensional area of skin to obtain measurements at a number of cross-sectional depths. In this particular example, one profile is obtained using light with a wavelength of about 1310 nm and another profile is obtained using 1440 nm light. The intensity of the reflected light at 1310 nm can be approximated by the following equation:
ln ( I R I O ) 1310 = - L [ .mu. s 1310 + .mu. a 1310 ] ##EQU00001##
where I.sub.R is the reflected light intensity at 1310 nm, I.sub.o is the initial light intensity at 1310 nm, L is the total light pathlength, .mu..sub.s.sup.1310 is the scattering coefficient of the tissue at 1310 nm, and .mu..sub.a.sup.1310 is the absorption coefficient of the tissue at 1310 nm.
[0055] In some instances, a wavelength can be selected such that one of the scattering or absorption coefficients is stronger than the other to the extent that the contribution of the weaker can be ignored (e.g., when one contribution is at least about 5 times greater or at least about 10 times greater than the other). When measuring hydration levels, the scattering coefficient .mu..sub.s.sup.1310 is stronger than the absorption coefficient .mu..sub.a.sup.1310 such that the contribution from .mu..sub.a.sup.1310 can be ignored; this allows the scattering coefficient .mu..sub.s.sup.1310 to be determined. Accordingly, a plot of ln(I.sub.R/I.sub.o) versus depth can yield a line with a slope that can be equated with .mu..sub.a.sup.1310.
[0056] The scattering coefficient at 1310 nm .mu..sub.s.sup.1310 can be used to provide a measure of the scattering coefficient at 1440 nm, .mu..sub.s.sup.1440. Various scattering theories, as known to those skilled in the art, can be used to relate the scattering coefficients at the two different wavelengths. For example, under Mie scattering, (0.7) .mu..sub.s.sup.1310.apprxeq..mu..sub.s.sup.1440. Using this estimate for .mu..sub.s.sup.440, an estimate of the absorption coefficient at 1440 nm can be found using:
ln ( I R I O ) 1440 = - L [ .mu. s 1440 + .mu. a 1440 ] ##EQU00002##
where I.sub.R is the reflected light intensity at 1440 nm, I.sub.o is the initial light intensity at 1440 nm, L is the total light pathlength, .mu..sub.s.sup.1440 is the scattering coefficient of the tissue at 1440 nm, and .mu..sub.a.sup.1440 the absorption coefficient of the tissue at 1440 nm. The OCT profile at 1440nm, along with the estimated scattering coefficient .mu..sub.s.sup.1440, can allow one to determine .mu..sub.a.sup.1440.
[0057] As previously mentioned, the outlined technique can also be used to determine scattering coefficients when a scattering profile utilizes a wavelength in which an absorption coefficient dominates (e.g., an absorption coefficient is measured using a wavelength where absorption dominates attenuation, followed by estimating an absorption coefficient at a second wavelength and determining the scattering coefficient at the second wavelength). Those skilled in the art will appreciate that the technique can also be applied with respect to other analytes besides water (e.g., hemoglobin) when appropriate wavelengths of light are chosen.
[0058] As discussed in U.S. application Ser. No. 10/916,236, the use of multiple wavelengths can also provide an additional sensor calibration technique. Using water detection as an exemplification of calibrating analyte effects on OCT measurements, the scattering coefficient of a first wavelength OCT measurement can drift even though the glucose concentration remains static because of the change in the scattering coefficient due to hydration changes. Thus, by measuring the skin hydration using a second wavelength in which the wavelength is selected such that the resulting scattering profile tracks hydration changes (e.g., the absorption coefficient at the second wavelength is high for water, and much higher relative to the absorption coefficient at the first wavelength), this drift can be compensated for and the OCT sensor can maintain calibration. Clearly, other analytes that can effect scattering coefficient measurements can also be compensated for using this technique.
[0059] FIG. 8 is a schematic block diagram of a method of measuring the blood glucose concentration on a human or animal subject. The first step, shown in Block A, is to provide light having scattering absorption or properties sensitive to glucose concentration within the tissue. Preferably the light provided comprises at least two different wavelengths. By different wavelengths is meant that the wavelengths should be sufficiently different that they have measurably different absorption and scatter properties for different levels of glucose and/or indicator components such as blood. Typically, the light is provided from multiple single wavelength sources, such as low coherence superluminescent diodes (SLEDs) at wavelengths in the red/near infrared range (RNIR). Alternatively, the light can be provided from a single broadband source appropriately notch filtered. Both wavelengths of light are advantageously directed in a single beam.
[0060] The next step, shown in Block B, is to split the single beam of light into a reference beam and a sample beam. The reference beam travels in an adjustable phase path denoted as the reference beam path (reference arm), and the sample beam travels in a sample beam path (sample arm) where it is directed onto the tissue to be monitored, e.g. the skin of a human diabetic. The light in the reference beam is directed over an adjustable phase path and will subsequently be interfered with sample light reflected from within the tissue.
[0061] In the third step, Block C, the sample beam is continuously or near continuously scanned over a two-dimensional area of the tissue while, at the same time, being interferometrically scanned in depth. Block D shows varying the phase (path length) of the reference beam so that light from the reference beam constructively interferes with reflected sample light from successively different depths of tissue. Block E shows the reflected light collected and interfered with the reference beam. As the interferometer sweeps in depth, the surface scan is also sweeping continuously. This "smears" out the scan and reduces the effect of speckle.
[0062] The next steps, Blocks F, G, and H are to process the resulting data to calculate glucose concentration. In essence, this is achieved by computing the scattering coefficient of glucose-containing tissue. Block F indicates the scanning data is input into a digital processor. Block G, which is optional, but advantageous, is to identify those scattering measurements that are from blood-profused tissue (in or near blood vessels). Such identification can be accomplished, for example, by providing light of two different wavelengths, at least one of which scatters from blood profused tissues in a characteristic manner. Finally, in Block H, the scattering coefficient of the glucose containing tissue is calculated, and the correlated glucose level in blood is determined.
[0063] FIG. 9 schematically shows advantageous apparatus 900 for practicing the method of FIG. 8. The apparatus 900 comprises a fiber optics based low coherence interferometer (LCI). A 2.times.2 fiber optic splitter 901 forms the basic interferometer. An optical input from light sources 906 is split between a sample beam 902 and a reference beam 904. Sample light in beam 902 is continuously scanned across a sample surface by scanner 908. Preferably, the end of the sample beam 902 can contain imaging optics 903 to tailor the spot size according to the area tissue being measured. Reference beam 904 is varied or adjusted in phase as by a moveable minor 905 which can be vibrated or oscillated to scan depth. Reflected signals from beams 902 and 904 interfere and are presented to photodetector 907 for measurement. Advantageously, imaging optics 903 can provide high coupling efficiency between the optical system and the tissue.
[0064] The tissue volume with which the light interacts (referred to as the interaction volume) is determined by the spot size of the imaging optics (surface area) and the coherence length of the light (depth) The reference beam 904 has a scanning reflector 905 (such as a mirror). The reflector 905 of the interferometer determines the phase shift applied to the reference beam 904 and thus, which reflected light from the reference beam 904 will constructively interfere with the reflected sample beam 903. The differences in phase of the beams determines the depth from which scattered light will be measured. This can permit a fixed depth, adjustable depth, or a scan of multiple depths within the tissue. LCI is thus sensitive to the intensity of the reflected light localized in a small volume of tissue. Determination of the depth and interaction volume permits a more accurate selection of regions of blood-profused tissue beneath the skin.
[0065] A photodetector 907 (such as a photodiode) can be used to measure the interference of the light from both the sample beam 902 and the reference beam 904. One or more photodetectors 907 may be used along with optical filters (not shown) designed for each of the different wavelength light sources 906 used in the measurement.
[0066] Preferably, the imaging optics 903 are beam focusing optics to reduce the beam cross section so as to minimize the region of optical interaction with the tissue. The use of these optics will enhance the selectivity of the signal while also reducing the effect of speckle.
[0067] Light passing through turbid biological tissue is subject to wavefront distortion that produces coherent noise or "speckle". The effect of speckle can be reduced by taking multiple scans from different locations on the tissue and then averaging these scans. This solution is impractical for the typical OCT imaging system, because the vast number of scans needed to reduce speckle would take too long and would produce a severe loss in the resolution of the image. However, for the present disclosure, the collection optics can be simpler. The present non-imaging system presents a practical solution to reducing coherent noise. Not only does the speckle effect significantly decrease, but the non-imaging system can continuously scan a two-dimensional area of tissue instead of being limited to a single scanning line. Area scans reduce speckle due to the diversity of tissue regions encompassed in the scan. They also maximize the coverage of blood-profused tissue. Thus, coherent noise is also further reduced.
[0068] An alternative solution is to use parallel optical processing where multiple spots on the subject tissue are measured together to create "boiling" speckle. Boiling speckle occurs where the sub-spot speckle is changing so quickly that the observed speckle is averaged out by the human eye, or the integration time of the optical receiver. This inventive system may be modified to create boiling speckle by replacing the scanner 908 with either a lenslet array or a diffractive optical element (DOE). If the lenslet or DOE is rapidly translated or rotated about the optical axis at an very high speed, the observed speckle will be averaged out. Additionally, such a system reduces the number of scans required due to the greater variety of speckle detected.
[0069] Since glucose is delivered to the interstitial fluid (IF) in skin via blood, determining the scatter coefficient in the dermis layer of the tissue, where blood vessels are plentiful, provides the closest correlation to variations in glucose concentration. Again, an area scan increases the volume of blood-profused tissue measured.
[0070] Area scanning could be achieved by a pair of rotating prisms that continuously move a sample beam spot over a circular area of the tissue surface. Advantageously, the spot would move a minimum of one spot diameter for each depth scan. Thus if the beam spot size is 12 microns and the depth scan is at a rate of 20 Hz, then the spot should advantageously be moved at a minimum rate of 240 microns per second and preferably much faster.
[0071] Spot diameters are typically in the range from about 10 microns to 100 microns and preferably 20 microns and higher.
[0072] The minimum area of the scan is defined by the number of spot diameters needed to move at the minimum depth scan rate. For the 12 micron spot and 20 Hz depth scan, the minimum area that would need scanning is about 2200 square microns, corresponding to a circular area of about 500 micron diameter. More preferably the system would be designed to cover an area corresponding to a diameter of 500 microns to 10,000 microns.
[0073] For speckle reduction using the boiling speckle method of noise reduction, the multiple spots would need to be moved quite rapidly. The spot should move at a minimum of one spot diameter in the integration time of the receiver. For individual spot sizes of about 10 microns and an integration time of about 4 microseconds, the spots would need to move at a minimum of 2.4.times.10.sup.5 microns/sec.
[0074] The light sources 906 can be light emitting diodes (LED) or super luminescent diodes (SLEDs), both of which are semiconductor based light emitters whose wavelengths can be chosen to give the best contrast between absorption and scatter of blood and other biological constituents, such as water. Typically these wavelengths are in the red/near infrared (RNIR) region of the spectrum, however, longer and shorter wavelengths can be used for enhanced sensitivity. For the glucose measurements, two or more light sources are advantageous and can share the same optical paths through the interferometer.
[0075] One of the wavelengths can be chosen to have minimum absorption compared to the scattering coefficient for water and blood constituents. If the other wavelength is chosen to have peak absorption for certain biological constituents, then the difference in light attenuation between the two wavelengths can indicate the position in depth of a relevant structure, such as a blood vessel. Light from the two wavelengths is differently absorbed by the different constituents. This differential absorption differentially reduces the intensity of the scattered (reflected) light. Light reflected off the cellular membrane is partially absorbed by the respective constituent for that wavelength. Where the term "light is reflected from the blood" is used, it is understood to refer to light reflected from the cells in and around the blood vessels, and the constituent in the blood absorbs some of the light according to the specific wavelength and glucose level of the blood. These differences in the scattering and absorption properties provide for an optimal correlation between the scattered signal and blood glucose data.
[0076] One exemplary application is a first wavelength of about 1310 nm and a second wavelength of about 820-960 nm. A first wavelength of 1310 nm is chosen because the scattering properties of water and blood and blood constituents is at a maximum compared to the absorption properties of these fluids. The second wavelength, 820-960 nm, is chosen because the absorption of light is very high in the presence of hemoglobin, a blood constituent, (compared to the first wavelength). If the signal of the second wavelength were to experience a rapid decrease at a particular depth in the interaction volume, this rapid decrease would indicate the presence of hemoglobin, and hence, the location of blood-profused tissue. It would thus indicate an optimal slope region for the scattering data of the first wavelength to be related to the glucose concentration.
[0077] A second example would be a first wavelength of about 1310 nm and a second wavelength of about 1450 nm. At this second wavelength, the scattering coefficients for blood and water are similar to those of the first wavelength. However, the absorption coefficient for water at this second wavelength is exponentially larger than that of the first wavelength. Thus, a differential measurement between these two wavelengths indicates changes in the hydration level of the tissue. Such changes can then be used to indicate an optimal slope region for measuring blood glucose. However, the use of these two specific wavelengths provides an additional benefit of sensor calibration. As the hydration level in the dermis layer varies, the scattering coefficient of the first wavelength may drift, even though the glucose concentration remains static. Thus, by measuring the skin hydration using the second wavelength, this drift can be compensated for and the OCT sensor can maintain calibration.
[0078] While the present invention has been described with respect to particular embodiments discussed herein, it is to be understood that the invention is not limited to the disclosed embodiments. To the contrary, the invention is intended to cover various modifications and equivalent arrangements included within the spirit and scope of the appended claims. The scope of the following claims is to be accorded the broadest interpretation so as to encompass all such modifications and equivalent structures and functions.
* * * * *
D00000
D00001
D00002
D00003
D00004
D00005
D00006
D00007
D00008
D00009
D00010

XML
uspto.report is an independent third-party trademark research tool that is not affiliated, endorsed, or sponsored by the United States Patent and Trademark Office (USPTO) or any other governmental organization. The information provided by uspto.report is based on publicly available data at the time of writing and is intended for informational purposes only.
While we strive to provide accurate and up-to-date information, we do not guarantee the accuracy, completeness, reliability, or suitability of the information displayed on this site. The use of this site is at your own risk. Any reliance you place on such information is therefore strictly at your own risk.
All official trademark data, including owner information, should be verified by visiting the official USPTO website at www.uspto.gov. This site is not intended to replace professional legal advice and should not be used as a substitute for consulting with a legal professional who is knowledgeable about trademark law.