Phytase-Containing Animal Food and Method
Webel; Douglas M. ; et al.
U.S. patent application number 13/154719 was filed with the patent office on 2011-12-29 for phytase-containing animal food and method. Invention is credited to Xingen Lei, Donald E. Orr, JR., Frank E. Ruch, JR., Douglas M. Webel.
| Application Number | 20110318449 13/154719 |
| Document ID | / |
| Family ID | 23311194 |
| Filed Date | 2011-12-29 |


| United States Patent Application | 20110318449 |
| Kind Code | A1 |
| Webel; Douglas M. ; et al. | December 29, 2011 |
Phytase-Containing Animal Food and Method
Abstract
A method is described for improving the nutritional value of a foodstuff comprising a source of myo-inositol hexakisphosphate by feeding the foodstuff in combination with a phytase expressed in yeast. The method comprises the step of feeding the animal the foodstuff in combination with a phytase expressed in yeast wherein the phytase can be selected from the group consisting of AppA1, AppA2 and a site-directed mutant of AppA. The invention also enables reduction of the feed to weight gain ratio and an increase bone mass and mineral content of an animal. A foodstuff and a feed additive comprising AppA2 or a site-directed mutant of AppA are also described.
| Inventors: | Webel; Douglas M.; (Noblesville, IN) ; Orr, JR.; Donald E.; (Noblesville, IN) ; Ruch, JR.; Frank E.; (Falmouth, ME) ; Lei; Xingen; (Ithaca, NY) |
| Family ID: | 23311194 |
| Appl. No.: | 13/154719 |
| Filed: | June 7, 2011 |
Related U.S. Patent Documents
| Application Number | Filing Date | Patent Number | ||
|---|---|---|---|---|
| 12946821 | Nov 15, 2010 | 7972805 | ||
| 13154719 | ||||
| 11963587 | Dec 21, 2007 | 7833743 | ||
| 12946821 | ||||
| 10284962 | Oct 31, 2002 | 7320876 | ||
| 11963587 | ||||
| 60335303 | Oct 31, 2001 | |||
| Current U.S. Class: | 426/2 |
| Current CPC Class: | A23K 20/26 20160501; A23K 20/189 20160501; Y02A 40/818 20180101; A23K 50/00 20160501; C12N 9/16 20130101; C12Q 1/48 20130101; A23K 50/75 20160501; C12Y 301/03008 20130101; A23K 50/80 20160501 |
| Class at Publication: | 426/2 |
| International Class: | A23K 1/16 20060101 A23K001/16; A23L 1/30 20060101 A23L001/30; A23K 1/18 20060101 A23K001/18 |
Claims
1. A method of improving the nutritional value of a foodstuff consumed by a monogastric animal by increasing the bioavailability of phosphate from phytate wherein the foodstuff comprises myo-inositol hexakisphosphate, the method comprising the step of feeding to the animal the foodstuff in combination with less than 1200 units of a phytase expressed in yeast per kilogram of the foodstuff, wherein the phytase is Escherichia coli-derived AppA2; and wherein the bioavailability of phosphate from phytate is increased by at least 2-fold compared to the bioavailability of phosphate from phytate obtained by feeding the foodstuff in combination with the same units of a phytase expressed in a non-yeast host cell.
2. The method of claim 1 wherein the animal is an avian species.
3. The method of claim 2 wherein the avian species is selected from the group consisting of a chicken, a turkey, a duck, and a pheasant.
4. The method of claim 1 wherein the animal a porcine species.
5. The method of claim 1 wherein the animal is a marine or a fresh water aquatic species.
6. The method of claim 1 wherein the animal is a domestic animal.
7. The method of claim 6 wherein the domestic animal is a canine species.
8. The method of claim 6 wherein the domestic animal is a feline species.
9. The method of claim 1 wherein the animal is a human.
10. The method of claim 4 wherein the foodstuff is pig feed.
11. The method of claim 3 wherein the foodstuff is poultry feed.
12. The method of claim 1 wherein the yeast is selected from the group consisting of Saccharomyces species, Pichia species, Kluyveromyces species, Hansenula species, and Candida species.
13. The method of claim 12 wherein the yeast is Saccharomyces cerevisiae.
14. The method of claim 12 wherein the yeast is Pichia pastoris.
15. The method of claim 1 wherein the animal is fed the foodstuff in combination with from about 50 to about 1000 units of the phytase expressed in yeast per kilogram of the foodstuff.
16. The method of claim 1 wherein the animal is fed the foodstuff in combination with from about 50 to about 700 units of the phytase expressed in yeast per kilogram of the foodstuff.
17. The method of claim 1 wherein the animal is fed the foodstuff in combination with from about 50 to about 500 units of the phytase expressed in yeast per kilogram of the foodstuff.
18. The method of claim 1 wherein the animal is fed the foodstuff in combination with from about 50 to about 200 units of the phytase expressed in yeast per kilogram of the foodstuff.
19. The method of claim 1 wherein the phytase has an optimal activity at a pH of less than about 4.
20. The method of claim 1 wherein the phytase expressed in yeast is cleaved with a protease to enhance the capacity of the phytase to increase the bioavailability of phosphate from phytate compared to intact yeast-expressed phytase.
21-96. (canceled)
Description
CROSS REFERENCE TO RELATED APPLICATIONS
[0001] This application claims priority under 35 U.S.C. .sctn.119(e) to U.S. Provisional Application Ser. No. 60/335,303, filed on Oct. 31, 2001.
FIELD OF THE INVENTION
[0002] The present invention is related to a method of improving the nutritional value of a foodstuff and to an improved foodstuff. More particularly, the invention relates to a method of improving the nutritional value of a foodstuff comprising myo-inositol hexakisphosphate by feeding the foodstuff to an animal in combination with a phytase expressed in yeast.
BACKGROUND AND SUMMARY OF THE INVENTION
[0003] Phytases are myo-inositol hexakisphosphate phosphohydrolases that catalyze the stepwise removal of inorganic orthophosphate from phytate (myo-inositol hexakisphosphate). Phytate is the major storage form of phosphate in plant feeds, including cereals and legumes. Because monogastric animals such as pigs, poultry, and humans have little phytase in their gastrointestinal tracts nearly all of the ingested phytate phosphate is indigestible. Accordingly, these animals require supplementation of their diets with phytase or inorganic phosphate. In contrast, ruminants have microorganisms in the rumen that produce phytases and these animals do not require phytase supplementation of their diets.
[0004] The unutilized phytate phosphate in monogastric animals creates additional problems. The unutilized phytate phosphate is excreted in manure and pollutes the environment. Furthermore, in monogastric animals phytate passes largely intact through the upper gastrointestinal tract where it chelates essential minerals (e.g., calcium and zinc), binds amino acids and proteins, and inhibits enzyme activities. Accordingly, phytase supplementation of the diets of monogastric animals not only decreases requirements for supplementation with inorganic phosphate, but also reduces pollution of the environment caused by phytate, diminishes the antinutritional effects of phytate, and increases the nutritional value of the feed.
[0005] There are two types of phytases including a 3-phytase (EC.3.1.3.8) which removes phosphate groups at the 1 and 3 positions of the myo-inositol ring, and a 6-phytase (EC.3.1.3.6) which first frees the phosphate at the 6-position of the ring. Plants usually contain 6-phytases and a broad range of microorganisms, including bacteria, filamentous fungi, and yeasts, produce 3-phytases. Two phytases, phyA and phyB from Aspergillus niger, have been cloned and sequenced. PhyA has been expressed in Aspergillus niger and the recombinant enzyme is available commercially for use in supplementing animal diets.
[0006] Phytase genes have also been isolated from Aspergillus terreus, Myceliophthora thermophila, Aspergillus fumigatus, Emericella nidulans, Talaromyces thermophilus, Escherichia coli (appA), and maize. Additionally, phytase enzymes have been isolated and/or purified from Bacillus sp., Enterobacter sp., Klebsiella terrigena, and Aspergillus ficum.
[0007] The high cost of phytase production has restricted the use of phytase in the livestock industry as phytase supplements are generally more expensive than the less environmentally desirable inorganic phosphorous supplements. The cost of phytase can be reduced by enhancing production efficiency and/or producing an enzyme with superior activity.
[0008] Yeast expression systems can be used to effectively produce enzymes, in part, because yeast are grown in simple and inexpensive media. Additionally, with a proper signal sequence, the expressed enzyme can be secreted into the culture medium for convenient isolation and purification. Some yeast expression systems are also accepted in the food industry as being safe for the production of food products unlike fungal expression systems which may in some cases be unsafe, for example, for human food manufacturing.
[0009] Thus, one aspect of this invention is a method of improving the nutritional value of a foodstuff by supplementing the foodstuff with a yeast-expressed phytase with superior capacity to release phosphate from phytate in foodstuffs. The invention is also directed to a foodstuff with improved nutritional value comprising the yeast-expressed phytase. The phytase can be efficiently and inexpensively produced because the yeast-expressed phytase of the present invention is suitable for commercial use in the feed and food industries with minimal processing.
[0010] In one embodiment, a method is provided of improving the nutritional value of a foodstuff consumed by a monogastric animal by increasing the bioavailability of phosphate from phytate wherein the foodstuff comprises myo-inositol hexakisphosphate. The method comprises the step of feeding to the animal the foodstuff in combination with less than 1200 units of a phytase expressed in yeast per kilogram of the foodstuff, wherein the phytase is Escherichia coli-derived AppA2, and wherein the bioavailability of phosphate from phytate is increased by at least 2-fold compared to the bioavailability of phosphate from phytate obtained by feeding the foodstuff in combination with the same units of a phytase expressed in a non-yeast host cell.
[0011] In another embodiment, a method is provided of reducing the feed to weight gain ratio of a monogastric animal by feeding the animal a foodstuff wherein the foodstuff comprises myo-inositol hexakisphosphate. The method comprises the step of feeding to the animal the foodstuff in combination with a phytase expressed in yeast, wherein the phytase is selected from the group consisting of Escherichia coli-derived AppA2 and a site-directed mutant of Escherichia coli-derived AppA, and wherein the feed to weight gain ratio of the animal is reduced.
[0012] In an alternate embodiment, a method of improving the nutritional value of a foodstuff consumed by a monogastric animal by increasing the bone mass and mineral content of the animal wherein the foodstuff comprises myo-inositol hexakisphosphate. The method comprises the step of feeding to the animal the foodstuff in combination with a phytase expressed in yeast wherein the phytase is selected from the group consisting of Escherichia coli-derived AppA2 and a site-directed mutant of Escherichia coli-derived AppA, and wherein the bone mass and mineral content of the animal is increased.
[0013] In yet another embodiment, a feed additive composition for addition to an animal feed is provided. The feed additive composition comprises a yeast-expressed phytase and a carrier for the phytase wherein the concentration of the phytase in the feed additive composition is greater than the concentration of the phytase in the final feed mixture.
[0014] In still another embodiment, a foodstuff is provided. The foodstuff comprises the above-described feed additive composition wherein the concentration of the phytase in the final feed mixture is less than 1200 units of the phytase per kilogram of the final feed mixture.
[0015] In another embodiment, a method is provided of improving the nutritional value of a foodstuff consumed by a monogastric animal wherein the foodstuff comprises myo-inositol hexakisphosphate. The method comprises the steps of spray drying a phytase selected from the group consisting of Escherichia coli-derived AppA2 and a site-directed mutant of Escherichia coli-derived AppA, mixing the phytase with a carrier for the phytase and, optionally, other ingredients to produce a feed additive composition for supplementing a foodstuff with the phytase, mixing the feed additive composition with the foodstuff, and feeding the animal the foodstuff supplemented with the feed additive composition.
[0016] In an alternate embodiment, a method is provided of improving the nutritional value of a foodstuff consumed by an avian species by increasing the bioavailability of phosphate from phytate wherein the foodstuff comprises myo-inositol hexakisphosphate. The method comprises the step of feeding to the avian species the foodstuff in combination with less than 1200 units of a phytase expressed in yeast per kilogram of the foodstuff, wherein the bioavailability of phosphate from phytate is increased by at least 1.5-fold compared to the bioavailability of phosphate from phytate obtained by feeding to a non-avian species the foodstuff in combination with the phytase expressed in yeast.
[0017] In yet another embodiment, a method is provided of reducing the feed to weight gain ratio of an avian species by feeding the avian species a foodstuff wherein the foodstuff comprises myo-inositol hexakisphosphate. The method comprises the step of feeding to the avian species the foodstuff in combination with a phytase expressed in yeast wherein the feed to weight gain ratio of the animal is reduced.
[0018] In still another embodiment, a method is provided of improving the nutritional value of a foodstuff consumed by an avian species by increasing the bone mass and mineral content of the avian species wherein the foodstuff comprises myo-inositol hexakisphosphate. The method comprises the step of feeding to the avian species the foodstuff in combination with a phytase expressed in yeast wherein the bone mass and mineral content of the avian species is increased.
[0019] In another embodiment, a method is provided of improving the nutritional value of a foodstuff consumed by an avian species wherein the foodstuff comprises myo-inositol hexakisphosphate. The method comprises the step of feeding to the avian species the foodstuff in combination with a phytase expressed in yeast wherein the number of eggs laid and the weight of the eggs laid by the avian species is increased.
BRIEF DESCRIPTION OF THE DRAWINGS
[0020] FIG. 1 shows the amino acid and nucleotide sequences of AppA2.
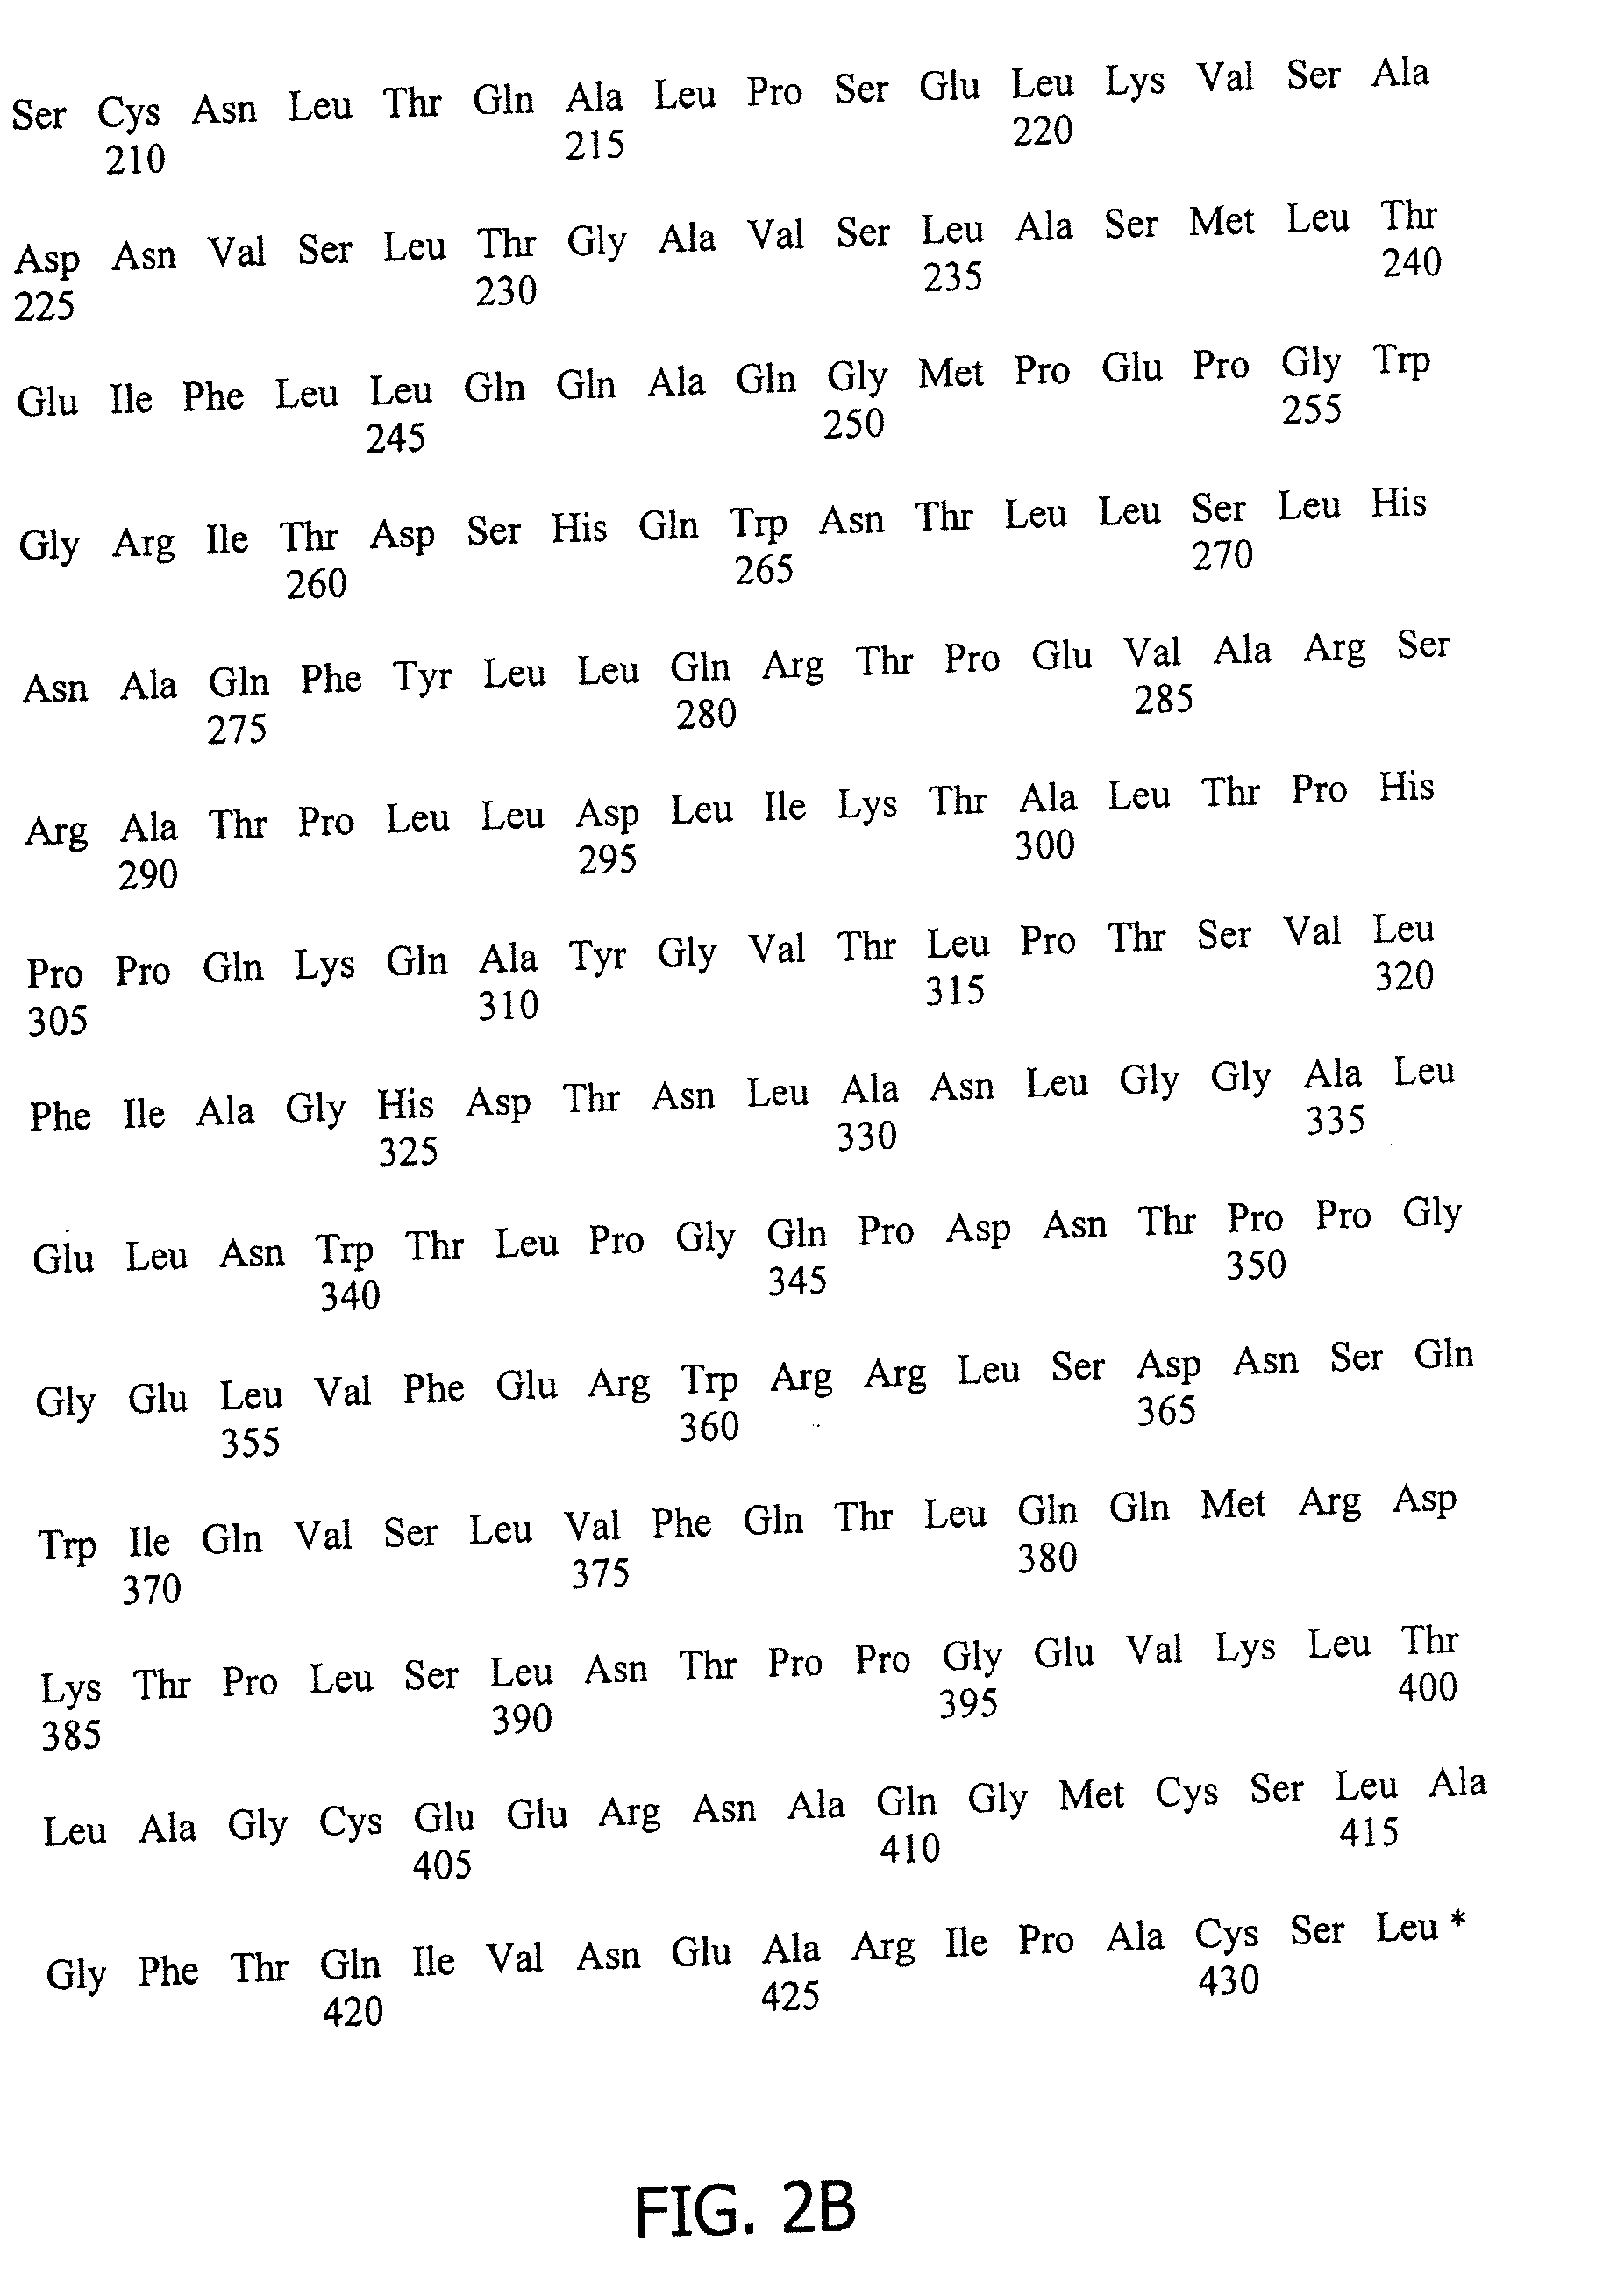
[0021] FIG. 2 shows the amino acid and nucleotide sequences of Mutant U.
[0022] FIG. 3 shows the percent increase in bioavailable phosphate in vivo in chickens fed an animal feed supplemented with Natuphos.RTM., Mutant U, AppA or AppA2.
DETAILED DESCRIPTION OF THE INVENTION
[0023] The present invention provides a method of improving the nutritional value of a foodstuff consumed by an animal wherein the foodstuff comprises myo-inositol hexakisphosphate, the substrate for the phytase enzymes of the invention. The method comprises the step of feeding to an animal the foodstuff in combination with a phytase expressed in yeast wherein the bioavailability of phosphate from phytate is increased, the feed to weight gain ratio is reduced, the bone mass and mineral content of the animal is increased or, for avian species, additionally the egg weight or number of eggs laid is increased. The phytase can be selected from the group consisting of Escherichia coli-derived AppA2 and a site-directed mutant of Escherichia coli derived-AppA. In an alternative embodiment, for avian species, the phytase can be any phytase, including phytases selected from the group consisting of Escherichia coli-derived AppA, Escherichia coli-derived AppA2, and a site-directed mutant of Escherichia coli-derived AppA. In some embodiments, the bioavailability of phosphate from phytate, the feed to weight gain ratio, and bone mass and mineral content are improved by at least 2-fold, for example, in an avian species, such as poultry, compared to the improvement in nutritional value obtained by feeding the foodstuff in combination with the same weight percent of a phytase expressed in a non-yeast host cell. The bioavailability of phosphate from phytate is also increased by at least 1.5-fold in porcine species compared to the improvement in nutritional value obtained by feeding the foodstuff in combination with the same weight percent of a phytase expressed in a non-yeast host cell. Additionally, the bioavailability of phosphate from phytate and the bone mass and mineral content obtained by feeding an avian species the foodstuff in combination with the phytase expressed in yeast is increased by at least 1.5-fold compared to the bioavailability of phosphate from phytate and the bone mass and mineral content obtained by feeding a non-avian species the foodstuff in combination with the yeast-expressed phytase.
[0024] As used herein "improving nutritional value" or "increased nutritional value" means an improvement in the nutritional value of a foodstuff as reflected by an increase in the bioavailability of phosphate from phytate, a reduction in the feed to weight gain ratio, an increase in bone mass and mineral content, an increase in the bioavailability of inositol from phytate, an increase in the bioavailability from phytate of minerals such as magnesium, manganese, calcium, iron and zinc in an animal fed the foodstuff, or an increase in egg weight or number of eggs laid for an avian species fed the foodstuff (e.g., for laying hens in the first or subsequent round of laying eggs).
[0025] As used herein an increase in the "bioavailability of phosphate from phytate" means an increase in availability of phosphate from phytate as reflected by an increase in weight gain or bone ash weight.
[0026] As used herein the term "non-yeast host cell" includes a fungal cell.
[0027] As used herein, the term "phytase" means an enzyme capable of catalyzing the removal of inorganic phosphate from myo-inositol hexakisphosphate.
[0028] As used herein, the term "phytate" means a composition comprising myo-inositol hexakisphosphate.
[0029] In accordance with the invention, the feed to weight gain ratio is calculated by dividing weight gain by feed intake. An increase in bone mass or mineral content is reflected by an increase in the dry weight of tibia or fibula bones or by an increase in ash weight.
[0030] A variety of phytase genes may be expressed to produce phytase for use in accordance with the invention. Exemplary of genes that can be used in accordance with the invention are phytase genes derived from bacteria, filamentous fungi, plants, and yeast, such as the appA (Gene Bank accession number M58708) and appA2 (Gene Bank accession number 250016) genes derived from Escherichia coli (E. coli) and the phyA and phyB genes derived from the fungus Aspergillus niger, or any site-directed mutant of these genes that retains or has improved myo-inositol hexakisphosphate phosphohydrolase activity.
[0031] Phytase genes can be obtained from isolated microorganisms, such as bacteria, fungus, or yeast, that exhibit particularly high phytase activity. As described below, the appA2 gene was cloned from such an E. coli isolate, and it is exemplary of such a phytase gene.
[0032] The expressed phytase gene can be a heterologous gene, or can be a homologous gene. A heterologous gene is defined herein as a gene originating from a different species than the species used for expression of the gene. For example, in the case of expression of a heterologous phytase gene, a phytase gene derived from E. coli or another species of bacteria can be expressed in a yeast species such as Saccharomyces cerevisiae or Pichia pastoris. A homologous gene is described herein as a gene originating from the same species used for expression of the gene. In the case of expression of a homologous phytase gene, a phytase gene derived from Saccharomyces cerevisiae can be expressed, for example, in the same yeast species.
[0033] Exemplary genes for use in producing phytase for use in accordance with the invention are appA, appA2, and site-directed mutants of appA or appA2. Substituted, deleted, and truncated phytase genes, wherein the resulting expressed phytase, or a fragment thereof, retains substantially the same phytase activity as the phytases specifically exemplified herein, are considered equivalents of the exemplified phytase genes and are within the scope of the present invention.
[0034] The appA gene was isolated from E. coli (see U.S. Pat. No. 6,451,572, incorporated herein by reference). The appA2 gene was isolated from a bacterial colony that exhibited particularly high phytase activity obtained from the colon contents of crossbred Hampshire-Yorkshire-Duroc pigs (see U.S. patent application Ser. No. 09/540,149, incorporated herein by reference). The AppA2 protein product exhibits a pH optimum between about 2.5 and about 3.5. The amino acid sequence of AppA2 is as shown in SEQ ID Nos.: 2, 3, and 10. FIG. 1 shows the amino acid and nucleotide sequences of AppA2. The untranslated region is indicated by lowercase letters. The underlined sequences are the primers used to amplify appA2 (Pf1: 1-22, and K2: 1468-1490), appA2 (E2: 243-252, and K: 1468-1490). Potential N-glycosylation sites are boxed. The sequence of appA2 has been transmitted to Genebank data library with accession number 250016. The nucleotide sequence of AppA2 is as shown in SEQ ID No.: 1.
[0035] Several site-directed mutants of appA have been isolated (see PCT Publication No. WO 01/36607 A1 (U.S. Patent Application No. 60/166,179, incorporated herein by reference)). These mutants were designed to enhance glycosylation of the AppA enzyme. The mutants include A131N/V134N/D207N/S211N, C200N/D207N/S211N (Mutant U), and A131N/V134N/C200N/D207N/S211N (see Rodriguez et al., Arch. of Biochem. and Biophys. 382: 105-112 (2000), incorporated herein by reference). Mutant U has a higher specific activity than AppA, and, like AppA2, has a pH optimum of between about 2.5 and about 3.5. The C200N mutation in Mutant U is in a gapped region and C200 is involved with C210 in forming a unique disulfide bond in AppA. FIG. 2 shows the amino acid and nucleotide sequences of Mutant U. The amino acid sequence of Mutant U is shown in SEQ ID No.: 5, and the nucleotide sequence of Mutant U is shown in SEQ ID No.: 4.
[0036] Any yeast expression system or other eukaryotic expression system known to those skilled in the art can be used in accordance with the present invention. For example, various yeast expression systems are described in U.S. patent application Ser. No. 09/104,769 (now U.S. Pat. No. 6,451,572), U.S. patent application Ser. No. 09/540,149, and in U.S. Patent Application No. 60/166,179 (PCT Publication No. WO 01/36607 A1), all incorporated herein by reference. Any of these yeast expression systems can be used. Alternatively, other eukaryotic expression systems can be used such as an insect cell expression system (e.g., SD cells), a fungal cell expression system (e.g., Trichoderma), or a mammalian cell expression system.
[0037] A yeast expression system can be used to produce a sufficient amount of the phytase being secreted from the yeast cells so that the phytase can be conveniently isolated and purified from the culture medium. Secretion into the culture medium is controlled by a signal peptide (e.g., the phyA signal peptide or yeast .alpha.-factor signal peptide) capable of directing the expressed phytase out of the yeast cell. Other signal peptides suitable for facilitating secretion of the phytase from yeast cells are known to those skilled in the art. The signal peptide is typically cleaved from the phytase after secretion.
[0038] If a yeast expression system is used, any yeast species suitable for expression of a phytase gene can be used including such yeast species as Saccharomyces species (e.g., Saccharomyces cerevisiae), Kluyveromyces species, Torulaspora species, Schizosaccharomyces species, and methylotrophic yeast species such as Pichia species (e.g., Pichia pastoris), Hansenula species, Torulopsis species, Candida species, and Karwinskia species. In one embodiment the phytase gene is expressed in the methylotrophic yeast Pichia pastoris. Methylotrophic yeast are capable of utilizing methanol as a sole carbon source for the production of the energy resources necessary to maintain cellular function, and contain a gene encoding alcohol oxidase for methanol utilization.
[0039] Any host-vector system known to the skilled artisan (e.g., a system wherein the vector replicates autonomously or integrates into the host genome) and compatible with yeast or another eukaryotic cell expression system can be used. In one embodiment, the vector has restriction endonuclease cleavage sites for the insertion of DNA fragments, and genetic markers for selection of transformants. The phytase gene can be functionally linked to a promoter capable of directing the expression of the phytase, for example, in yeast, and, in one embodiment, the phytase gene is spliced in frame with a transcriptional enhancer element and has a terminator sequence for transcription termination (e.g., HSP150 terminator). The promoter can be a constitutive (e.g., the 3-phospho-glycerate kinase promoter or the .alpha.-factor promoter) or an inducible promoter (e.g., the ADH2, GAL-1-10, GAL 7, PHO5, T7, or metallothionine promoter). Various host-vector systems are described in U.S. patent application Ser. No. 09/104,769 (now U.S. Pat. No. 6,451,572), U.S. patent application Ser. No. 09/540,149, and in U.S. Patent Application No. 60/166,179 (PCT Publication No. WO 01/36607 A1), all incorporated herein by reference.
[0040] Yeast cells are transformed with a gene-vector construct comprising a phytase gene operatively coupled to a yeast expression system using procedures known to those skilled in the art. Such transformation protocols include electroporation and protoplast transformation.
[0041] The transformed yeast cells may be grown by a variety of techniques including batch and continuous fermentation in a liquid medium or on a semi-solid medium. Culture media for yeast cells are known in the art and are typically supplemented with a carbon source (e.g., glucose). The transformed yeast cells can be grown aerobically at 30.degree. C. in a controlled pH environment (a pH of about 6) and with the carbon source (e.g., glucose) maintained continuously at a predetermined level known to support growth of the yeast cells to a desired density within a specific period of time.
[0042] The yeast-expressed phytase for use in accordance with the method of the present invention can be produced in purified form by conventional techniques (for example, at least about 60% pure, or at least about 70-80% pure). Typically, the phytase is secreted into the yeast culture medium and is collected from the culture medium. For purification from the culture medium the phytase can, for example, be subjected to ammonium sulfate precipitation followed by DEAE-Sepharose column chromatography. Other conventional techniques known to those skilled in the art can be used such as gel filtration, ion exchange chromatography, DEAE-Sepharose column chromatography, affinity chromatography, solvent-solvent extraction, ultrafiltration, and HPLC. Alternatively, purification steps may not be required because the phytase may be present in such high concentrations in the culture medium that the phytase is essentially pure in the culture medium (e.g., 70-80% pure).
[0043] In cases where the phytase is not secreted into the culture medium, the yeast cells can be lysed, for example, by sonication, heat, or chemical treatment, and the homogenate centrifuged to remove cell debris. The supernatant can then be subjected to ammonium sulfate precipitation, and additional fractionation techniques as required, such as gel filtration, ion exchange chromatography, DEAE-Sepharose column chromatography, affinity chromatography, solvent-solvent extraction, ultrafiltration, and HPLC to purify the phytase. It should be understood that the purification methods described above for purification of phytases from the culture medium or from yeast cells are nonlimiting and any purification techniques known to those skilled in the art can be used to purify the yeast-expressed phytase if such techniques are required to obtain a substantially pure phytase.
[0044] In one embodiment, the phytase is collected from the culture medium without further purification steps by chilling the yeast culture (e.g., to about 8.degree. C.) and removing the yeast cells using such techniques as centrifugation, micro filtration, and rotary vacuum filtration. The phytase in the cell-free medium can be concentrated by such techniques as, for example, ultrafiltration and tangential flow filtration.
[0045] Various formulations of the purified phytase preparation may be prepared. The phytase enzymes can be stabilized through the addition of other proteins (e.g., gelatin and skim milk powder), chemical agents (e.g., glycerol, polyethylene glycol, EDTA, potassium sorbate, sodium benzoate, and reducing agents and aldehydes), polysaccharides, monosaccharides, lipids (hydrogenated vegetable oils), sodium phytate, and other phytate-containing compounds, and the like. Phytase enzyme suspensions can also be dried (e.g., spray drying, drum drying, and lyophilization) and formulated as powders, granules, pills, mineral blocks, liquids, and gels through known processes. Gelling agents such as gelatin, alginate, collagen, agar, pectin and carrageenan can be used. The invention also extends to a feed innoculant preparation comprising lyophilized nonpathogenic yeast which can express the phytases of the present invention in the gastrointestinal tract of the animal when the animal is fed the preparation.
[0046] In one embodiment, the phytase in the cell-free culture medium is concentrated such as by ultrafiltration and spray drying of the ultrafiltration retentate. The spray dried powder can be blended directly with a foodstuff, or the spray dried powder can be blended with a carrier for use as a feed additive composition for supplementation of a foodstuff with phytase. In one embodiment, the phytase in the retentate is co-dried with a carrier and/or stabilizer. In another embodiment, the phytase is spray dried with an ingredient that helps the spray dried phytase to adhere to a carrier, or, alternatively, the phytase can loosely associate with the carrier. The feed additive composition (i.e., the phytase/carrier composition and, optionally, other ingredients) can be used for blending with the foodstuff to achieve more even distribution of the phytase in the foodstuff.
[0047] Exemplary feed additive compositions (i.e., phytase/carrier compositions and, optionally, other ingredients) can contain 600 units of phytase/gram of the carrier to 5000 units of phytase/gram of the carrier. These phytase/carrier compositions can contain additional ingredients. For example, the compositions can be formulated to contain rice hulls or wheat middlings as a carrier (25-80 weight percent), the phytase (0.5 to 20 weight percent), calcium carbonate (10 to 50 weight percent), and oils (1 to 3 weight percent). Alternatively, the feed additive composition can include the phytase and the carrier and no additional ingredients. The feed additive composition may be mixed with the feed to obtain a final feed mixture with from about 50 to about 2000 units of phytase/kilogram of the feed.
[0048] Thus, a foodstuff comprising a source of myo-inositol hexakisphosphate, a yeast-expressed phytase, and a carrier is also provided in accordance with the invention. Additionally, a method of improving the nutritional value of a foodstuff consumed by a monogastric animal wherein the foodstuff comprises myo-inositol hexakisphosphate is provided wherein the method comprises the steps of spray drying a phytase, including a phytase selected from the group consisting of Escherichia coli-derived AppA, Escherichia coli-derived AppA2, and a site-directed mutant of Escherichia coli-derived AppA, mixing the phytase with a carrier, and, optionally, other ingredients, to produce a feed additive composition for supplementing a foodstuff with the phytase, mixing the feed additive composition with the foodstuff, and feeding the animal the foodstuff supplemented with the feed additive composition.
[0049] In these embodiments, the carrier can be any suitable carrier for making a feed additive composition known in the art including, but not limited to, rice hulls, wheat middlings, a polysaccharide (e.g., specific starches), a monosaccharide, mineral oil, vegetable fat, hydrogenated lipids, calcium carbonate, gelatin, skim milk powder, phytate and other phytate-containing compounds, a base mix, and the like. A base mix typically comprises most of the ingredients, including vitamins and minerals, of a final feed mixture except for the feed blend (e.g., cornmeal and soybean meal). The phytase for use in the feed additive composition is preferably E. coli-derived AppA, E. coli-derived AppA2, or a site-directed mutant of E. coli-derived AppA.
[0050] The feed additive composition containing the spray dried phytase and a carrier and, optionally, other ingredients, is mixed with the final feed mixture to obtain a feed with a predetermined number of phytase units/kilogram of the feed (e.g., about 50 to about 2000 units phytase/kilogram of the feed). Before blending with the carrier, the spray dried phytase is assayed for phytase activity to determine the amount of dried powder to be blended with the carrier to obtain a feed additive composition with a predetermined number of phytase units/gram of the carrier. The phytase-containing carrier is then blended with the final feed mixture to obtain a final feed mixture with a predetermined number of phytase units/kilogram of the feed. Accordingly, the phytase concentration in the feed additive composition is greater than the phytase concentration in the final feed mixture.
[0051] In accordance with one embodiment of the invention the foodstuff is fed in combination with the yeast-expressed phytase to any monogastric animal (i.e., an animal having a stomach with a single compartment). Monogastric animals that can be fed a foodstuff in combination with a yeast-expressed phytase include agricultural animals, such as porcine species (e.g., barrows (i.e., castrated male pigs), gilts (i.e., female pigs prior to first mating) and any other type of swine), chickens, turkeys (poults (i.e., first several weeks post-hatching) and older animals), ducks, and pheasants, any other avian species, marine or fresh water aquatic species, animals held in captivity (e.g., zoo animals), or domestic animals (e.g., canine and feline).
[0052] Agricultural monogastric animals are typically fed animal feed compositions comprising plant products which contain phytate (e.g., cornmeal and soybean meal contain phytate (myo-inositol hexakisphosphate)) as the major storage form of phosphate, and, thus, it is advantageous to supplement the feed with phytase. Accordingly, the foodstuffs that can be supplemented with phytase in accordance with the invention include feed for agricultural animals such pig feed and poultry feed, and any foodstuff for avian species or marine or fresh water aquatic species (e.g., fish food). In addition, humans can be fed any foodstuff, such as a cereal product, containing phytate in combination with the yeast-expressed phytase of the present invention.
[0053] In the case of an animal feed fed to monogastric animals, any animal feed blend known in the art can be used in accordance with the present invention such as rapeseed meal, cottonseed meal, soybean meal, and cornmeal, but soybean meal and cornmeal are particularly preferred. The animal feed blend is supplemented with the yeast-expressed phytase, but other ingredients can optionally be added to the animal feed blend. Optional ingredients of the animal feed blend include sugars and complex carbohydrates such as both water-soluble and water-insoluble monosaccharides, disaccharides and polysaccharides. Optional amino acid ingredients that can be added to the feed blend are arginine, histidine, isoleucine, leucine, lysine, methionine, phenylalanine, threonine, tryptophan, valine, tyrosine ethyl HCl, alanine, aspartic acid, sodium glutamate, glycine, proline, serine, cysteine ethyl HCl, and analogs, and salts thereof. Vitamins that can be optionally added are thiamine HCl, riboflavin, pyridoxine HCl, niacin, niacinamide, inositol, choline chloride, calcium pantothenate, biotin, folic acid, ascorbic acid, and vitamins A, B, K, D, E, and the like. Minerals, protein ingredients, including protein obtained from meat meal or fish meal, liquid or powdered egg, fish solubles, whey protein concentrate, oils (e.g., soybean oil), cornstarch, calcium, inorganic phosphate, copper sulfate, salt, and limestone can also be added. Any medicament ingredients known in the art can be added to the animal feed blend such as antibiotics.
[0054] The feed compositions can also contain enzymes other than the yeast-expressed phytase. Exemplary of such enzymes are proteases, cellulases, xylanases, and acid phosphatases. For example, complete dephosphorylation of phytate may not be achieved by the phytase alone and addition of an acid phosphatase may result in additional phosphate release. A protease (e.g., pepsin) can be added, for example, to cleave the yeast-expressed phytase to enhance the activity of the phytase. Such a protease-treated phytase may exhibit enhanced capacity to increase the bioavailability of phosphate from phytate, to reduce the feed to weight gain ratio, to increase bone mass and mineral content, and to increase the egg weight or number of eggs laid for an avian species compared to intact yeast-expressed phytase. Additionally, combinations of phytases can be used, such as any combinations that may act synergistically to increase the bioavailability of phosphate from phytate, or proteolytic fragments of phytases or combinations of proteolytic fragments can be used. In this regard, the phytase gene expressed in yeast could be used to produce a truncated product directly for use in the method of the present invention.
[0055] Antioxidants can also be added to the foodstuff, such as an animal feed composition, to prevent oxidation of the phytase protein used to supplement the foodstuff. Oxidation can be prevented by the introduction of naturally-occurring antioxidants, such as beta-carotene, vitamin E, vitamin C, and tocopherol or of synthetic antioxidants such as butylated hydroxytoluene, butylated hydroxyanisole, tertiary-butylhydroquinone, propyl gallate or ethoxyquin to the foodstuff. Compounds which act synergistically with antioxidants can also be added such as ascorbic acid, citric acid, and phosphoric acid. The amount of antioxidants incorporated in this manner depends on requirements such as product formulation, shipping conditions, packaging methods, and desired shelf-life.
[0056] In accordance with one method of the present invention, the foodstuff, such as an animal feed, is supplemented with amounts of the yeast-expressed phytase sufficient to increase the nutritional value of the foodstuff. For example, in one embodiment, the foodstuff is supplemented with less than 2000 units (U) of the phytase expressed in yeast per kilogram (kg) of the foodstuff. This amount of phytase is equivalent to adding about 34 mg of the phytase to one kg of the foodstuff (about 0.0034% w/w). In another embodiment, the foodstuff is supplemented with less than 1500 U of the phytase expressed in yeast per kg of the foodstuff. This amount of phytase is equivalent to adding about 26 mg of the phytase to one kg of the foodstuff (about 0.0026% w/w). In another embodiment, the foodstuff is supplemented with less than 1200 U of the phytase expressed in yeast per kg of the foodstuff. This amount of phytase is equivalent to adding about 17 mg of the phytase to one kg of the foodstuff (about 0.0017% w/w). In another embodiment the foodstuff, such as an animal feed composition, is supplemented with about 50 U/kg to about 1000 U/kg of the yeast-expressed phytase (i.e., about 0.7 to about 14.3 mg/kg or about 0.00007% to about 0.0014% (w/w)). In yet another embodiment the foodstuff is supplemented with about 50 U/kg to about 700 U/kg of the yeast-expressed phytase (i.e., about 0.7 to about 10 mg/kg or about 0.00007% to about 0.001% (w/w)). In still another embodiment the foodstuff is supplemented with about 50 U/kg to about 500 U/kg of the yeast-expressed phytase (i.e., about 0.7 to about 7 mg/kg or about 0.00007% to about 0.007% (w/w)). In yet another embodiment, the foodstuff is supplemented with about 50 U/kg to about 200 U/kg of the yeast-expressed phytase (i.e., about 0.7 to about 2.9 mg/kg or about 0.00007% to about 0.0003% (w/w)). In each of these embodiments it is to be understood that "kg" refers to kilograms of the foodstuff, such as the final feed composition in the case of an animal feed blend (i.e., the feed in the composition as a final mixture). In addition, one unit (U) of phytase activity is defined as the quantity of enzyme required to produce 1 .mu.mol of inorganic phosphate per minute from 1.5 mmol/L of sodium phytate at 37.degree. C. and at a pH of 5.5.
[0057] The yeast-expressed phytase can be mixed with the foodstuff, such as an animal feed (i.e., the feed composition as a final mixture), prior to feeding the animal the foodstuff or the phytase can be fed to the animal with the foodstuff without prior mixing. For example, the phytase can be added directly to an untreated, pelletized, or otherwise processed foodstuff, such as an animal feed, or the phytase can be provided separately from the foodstuff in, for example, a mineral block, a pill, a gel formulation, a liquid formulation, or in drinking water. In accordance with the invention, feeding the animal the foodstuff "in combination with" the phytase means feeding the foodstuff mixed with the phytase or feeding the foodstuff and phytase separately without prior mixing.
[0058] The yeast expressed-phytase can be in an unencapsulated or an encapsulated form for feeding to the animal or for mixture with an animal feed blend. Encapsulation protects the phytase from breakdown and/or oxidation prior to ingestion by the animal (i.e., encapsulation increases the stability of the protein) and provides a dry product for easier feeding to the animal or for easier mixing with, for example, an animal feed blend. The yeast-expressed phytase can be protected in this manner, for example, by coating the phytase with another protein or any other substances known in the art to be effective encapsulating agents such as polymers, waxes, fats, and hydrogenated vegetable oils. For example, the phytase can be encapsulated using an art-recognized technique such as a Na.sup.2+-alginate encapsulation technique wherein the phytase is coated with Na.sup.2+-alginate followed by conversion to Ca.sup.2+-alginate in the presence of Ca.sup.2+ ions for encapsulation. Alternatively, the phytase can be encapsulated by an art-recognized technique such as prilling (i.e., atomizing a molten liquid and cooling the droplets to form a bead). For example, the phytase can be prilled in hydrogenated cottonseed flakes or hydrogenated soy bean oil to produce a dry product. The phytase can be used in an entirely unencapsulated form, an entirely encapsulated form, or mixtures of unencapsulated and encapsulated phytase can be added to the foodstuff, such as an animal feed composition, or fed directly to the animal without prior mixing with the foodstuff. Any phytase for use in accordance with the method of the present invention can be similarly treated.
[0059] In accordance with the method of the present invention, the phytase-containing foodstuff can be administered to animals orally in a foodstuff, such as an animal feed, or in a mineral block or in drinking water, but any other effective method of administration known to those skilled in the art can be utilized (e.g., a pill form). The foodstuff containing yeast-expressed phytase can be administered to the animals for any time period that is effective to increase the bioavailability of phosphate from phytate, to reduce the feed to weight gain ratio, or to increase the bone mass and mineral content of the animal. For example, in the case of a feed composition fed to a monogastric animal, the feed composition containing yeast-expressed phytase can be fed to the animal daily for the lifetime of the animal. Alternatively, the phytase-containing feed composition can be fed to the animal for a shorter time period. The time periods for feeding the phytase-containing foodstuff to animals are nonlimiting and it should be appreciated that any time period determined to be effective to enhance animal nutrition by administering the phytase-containing foodstuff can be used.
Example 1
Animal Feed Blend Composition
[0060] The composition of the animal feed blend for chicks and pigs (i.e., the feed composition without phytase) was as follows:
TABLE-US-00001 TABLE 1 Composition of the animal feed blend used in chick and pig assays. Ingredient Chick Assays Pig Assay Cornstarch to 100.0 to 100.0 Corn 50.89 61.35 Soybean meal, dehulled 39.69 31.19 Soybean oil 5.00 3.00 Limestone, ground 1.67 1.06 Salt 0.40 -- Chick vitamin mix 0.20 -- Pig vitamin mix -- 0.20 Chick trace mineral mix 0.15 -- Pig trace vitamin mix -- 0.35 Choline chloride (60%) 0.20 -- Pig antibiotic premix (CSP) -- 0.50 Bacitracin premix 0.05 -- Copper sulfate -- 0.08 L-Lysine HC1, feed grade -- 0.17 DL-Methionine, feed grade 0.20 0.05
Example 2
Phytase Preparation
[0061] Yeast seed cultures were inoculated in growth medium with Pichia pastoris X33 transformed with either AOX1-appA, pGAP-appA2, or AOX1-Mutant U. The seed cultures were grown at 30.degree. C. for about 24 hours until an OD.sub.600 of about 50 was reached. The seed cultures were then used to inoculate fermentors (batch process) containing sterile FM-22 growth medium containing 5% glucose. The 24-hour seed cultures were diluted about 1:25 to about 1:50 into the FM-22 growth medium. The yeast cultures were incubated aerobically in the fermentors at 30.degree. C. with pH control at 6.0 (using NH.sub.2OH) and with continuous glucose feed until the cultures reached an OD.sub.600 of about 400 (about 36 hours).
[0062] To collect the phytases from the culture medium, the yeast cultures were rapidly chilled to 8.degree. C. The cells were separated from the culture medium by centrifugation and by microfiltration. The phytases were 70-80% pure in the culture medium and were prepared for blending with a carrier as a feed additive as follows.
[0063] The cell-free media containing the secreted phytases were concentrated by ultrafiltration (10,000 MW exclusion limit). The ultrafiltration retentates (7-5% solids) were transferred to sterile containers for spray drying. The retentates were spray dried using standard techniques known in the art and the resulting powder was collected (4-6% moisture).
[0064] Microbiological testing of the powder was performed and the powder was assayed for phytase activity. The phytase activity of the powder (units of phytase activity/mg of powder) was used to determine the amount of dried powder to be blended with wheat middlings (i.e., the carrier) to obtain a phytase/carrier mixture with a predetermined number of phytase units/gram of the carrier. The dried phytase powder was mixed with the wheat middlings and packaged in moisture-proof containers. The phytase-containing wheat middlings were mixed with an animal feed blend as needed to obtain a final feed mixture with a predetermined number of phytase units/kg of the feed (about 400 to about 1000 U/kg).
Example 3
Feed Additive Composition
[0065] The following compositions are exemplary of feed additive compositions that may be mixed with an animal feed blend, such as the animal feed blend described in Example 1, to obtain a final feed mixture with, for example, about 50 U of phytase/kilogram of the final feed mixture to about 2000 U of phytase/kilogram of the feed. The feed additive compositions described below are nonlimiting and it should be appreciated that any phytase-containing feed additive composition determined to be effective to enhance the nutritional value of animal feed may be used. Exemplary feed additive compositions are shown for a feed additive composition containing 600 units of phytase/gram of the feed additive composition or 5000 units of phytase/gram of the feed additive composition.
TABLE-US-00002 600 phytase units/gram 5000 phytase units/gram (weight percent) (weight percent) Rice hulls 82.64 76.35 Calcium carbonate 15.00 15.00 Oil 1.5 1.5 Enzyme 0.86 7.15 Wheat middlings 82.64 76.35 Calcium carbonate 15.00 15.00 Oil 1.5 1.5 Enzyme 0.86 7.15
Example 4
Feeding Protocol
[0066] Chicks were fed using the protocol described in Biehl, et al. (J. Nutr. 125:2407-2416 (1995)). Briefly, assays were conducted with male and female chicks from the cross of New Hampshire males and Columbian females and were conducted in an environmentally controlled laboratory room with 24 hour fluorescent lighting. From day 0 to day 7 posthatching, chicks were fed a basal diet of 23% crude protein, methionine-fortified corn-soybean meal as described above in Example 1. On day 8, chicks were weighed, wingbanded and assigned randomly to experimental treatments. Five pens of three or four chicks per pen received each dietary treatment for a 13-day experimental feeding period, and the chicks had an average initial weight of 80 to 100 grams.
[0067] Throughout the 13-day feeding period, chicks were confined in thermostatically controlled stainless-steel chick batteries, and stainless-steel feeders and waterers were also used. These steps were taken to avoid mineral contamination from the environment. Diets and distilled deionized water were freely available throughout the feeding period.
[0068] Pigs were fasted for 12 hours before the beginning of each assay, were fed the experimental diets for 23 days, and were fasted for 12 hours after each assay was completed. Ten pigs were used per treatment group and the pigs averaged about 8-120 kg at the initiation of the assay. Pigs were housed in individual pens that contained a stainless-steel feeder, a stainless-steel waterer, and galvanized round-bar fencing.
[0069] All of the chicks in each treatment group and the five median-weight pigs of each treatment group were euthanized for testing. Body weight gain was measured and tibia (chicks) or fibula (pigs) bones were harvested for bone ash analysis as a reflection of bone mass and mineral content.
Example 5
Measurement of Inorganic Phosphate and Bioavailable Phosphate
[0070] Total phosphate in the feed samples used to generate a standard curve was quantified colorimetrically according to AOAC (1984) as described in Biehl et al. Monobasic potassium phosphate (KH.sub.2PO.sub.4) served as the standard. A standard curve was generated by measuring inorganic phosphate levels in basal feed supplemented with KH.sub.2PO.sub.4 (X-axis) and determining tibia ash weight (mg) or weight gain (g) (Y-axis) for animals fed basal feed supplemented with various levels of KH.sub.2PO.sub.4. The bioavailability of phosphate from phytate was then determined for animals fed basal feed supplemented with phytase by comparison of tibia ash weight and weight gain in these animals to the standard curve.
Example 6
Bone Ash Analysis
[0071] At the end of each experiment, chicks or pigs were euthanized, and right tibia or fibula bones were removed quantitatively from chicks or pigs, respectively. The bones were pooled by replicate pen and, after removal of adhering tissue, were dried for 24 hours at 100.degree. C. and were weighed. After weighing, the bones were dry ashed for 24 hours at 600.degree. C. in a muffle furnace. Ash weight was expressed as a percentage of dry bone weight and also as ash weight per bone.
Example 7
Phytase Expression in Yeast
[0072] In accordance with the present invention, any phytase gene may be expressed in yeast, and any yeast expression system may be used according to methods known to those skilled in the art. Yeast expression systems are described for exemplary phytase genes, such as the E. coli-derived appA and appA2 genes, and for a site-directed mutant of E. coli-derived AppA, in U.S. patent application Ser. No. 09/104,769 (now U.S. Pat. No. 6,451,572), U.S. patent application Ser. No. 09/540,149, and in U.S. Patent Application No. 60/166,179 (PCT Publication No. WO 01/36607 A1), all incorporated herein by reference. Exemplary yeast expression systems for expressing the AppA and AppA2 enzymes and a site-directed mutant of AppA are described briefly below.
Expression of the appA Gene in Saccharomyces cerevisiae.
[0073] The appA gene was expressed in Saccharomyces cerevisiae linked to the signal peptide of the phyA gene (phytase gene from Aspergillus niger). The appA gene was obtained from the ATCC, P.O. Box 1549, Manassas, Va. 20108, where it was deposited pursuant to the requirements of the Budapest Treaty, under ATCC accession number 87441. The appA gene (1.3 kb) was transformed into E. coli strain BL21 using the pappA1 expression vector (Ostanin et al., J. Biol. Chem., 267:22830-36 (1992)). To prepare the appA-phyA signal peptide construct, the polymerase chain reaction (PCR) was used. Two primers were synthesized and the 5' primer was 80 base pairs in length and contained the phyA signal peptide sequence, a KpnI restriction enzyme cut site, and sequence complementary to the template as follows: 5' GGG GTA CCA TGG GCG TCT CTG CTG TTC TAC TTC CTT TGT ATC TCC TGT CTG GAG TCA CCT CCG GAC AGA GTG AGC CGG AG 3' (SEQ. ID No.: 6). The 3' primer was 24 base pairs in length and contained an EcoRI site and sequence complementary to the template as follows: 5' GGG AAT TCA TTA CAA ACT GCA GGC 3' (SEQ. ID No.: 7). The PCR reaction was run for 25 cycles with 1 minute of denaturation at 95.degree. C., 1 minute of annealing at 58.degree. C., and 1 minute of chain extension at 72.degree. C. A 1.3 kb fragment was amplified by PCR, and was digested with KpnI and EcoRI and ligated into pYES2, a vector for expression in Saccharomyces cerevisiae. The pYES2-appA-phyA signal peptide construct was transformed into the yeast (INVScI, Invitrogen, San Diego, Calif.) by the lithium acetate method.
[0074] Selected transformants were inoculated into YEPD medium and expression was induced with galactose after an OD.sub.600 of 2 was reached. The cells were harvested 15-20 hours after induction. The AppA phytase enzyme was isolated from the culture supernatant and was the major protein present eliminating the need for a tedious purification.
Expression of the appA or appA2 Gene in Pichia pastoris.
[0075] appA. The template for the PCR reaction was as described above. The 5' primer used for the PCR reaction was as follows: 5' GGA ATT CCA GAG TGA GCC GGA 3' (SEQ ID No.: 8). The 3' primer was as follows: 5' GGG GTA CCT TAC AAA CTG CAC G 3' (SEQ ID No.: 9). The amplification reaction included 1 cycle at 94.degree. C. (3 min.), 30 cycles at 94.degree. C. (0.8 min), 30 cycles at 54.degree. C. (1 min.), 30 cycles at 72.degree. C. (2 min.), and 1 cycle at 72.degree. C. (10 min). The product was first inserted into the pGEM T-easy vector (Promega), and E. coli strain TOP10F' was used as the host to amplify the construct. The construct was then inserted into the yeast expression vector pPIcZaA (Invitrogen) at the EcoRI site, and E. coli strain TOPIOF' was again used as the host to amplify the construct.
[0076] The PIcZ.alpha. vector containing appA was transformed into Pichia pastoris strain X33 by electroporation. The transformed cells were plated into YPD-Zeocin agar medium and positive colonies were incubated in minimal media with glycerol (BMGY) for 24 hours. When an OD.sub.600 of 5 was reached, the cells were centrifuged and were resuspended in 0.5% methanol medium (BMMY) for induction. Methanol (100%) was added every 24 hours to maintain a concentration of 0.5-1%. The cells were harvested at 192 hours after induction and the AppA protein was purified by ammonium sulfate precipitation and DEAE-Sepharose column chromatography.
[0077] appA2. The appA2 gene was isolated (see U.S. patent application Ser. No. 09/540,179) from a bacterial colony that exhibited particularly high phytase activity obtained from the colon contents of crossbred Hampshire-Yorkshire-Duroc pigs. To isolate a bacterial colony exhibiting high phytase activity the colon contents sample was diluted in an anaerobic rumen fluid glucose medium, was shaken vigorously for 3 minutes, and was serially diluted. The diluted samples were cultured at 37.degree. C. for 3 days on a modified rumen fluid-glucose-cellobiose-Agar medium containing insoluble calcium phytate. Colonies with a clear zone were assayed for phytase activity using sodium phytate as a substrate. The colony identified as producing the highest phytase activity was identified as an E. coli strain. Accordingly, the appA2 gene was isolated using the primers as described above for appA expression in Pichia pastoris (SEQ. ID Nos. 8 and 9). The appA2 gene was cloned into the PIcZ.alpha. vector and Pichia pastoris strain X33 was transformed with the PIcZ.alpha.-appA2 construct as described above for appA expression in Pichia pastoris. The AppA2 enzyme was expressed as described above for AppA, and the AppA2 protein was collected from the yeast culture supernatant.
AppA Site-Directed Mutants.
[0078] Site-directed mutants of appA were prepared as described in U.S. patent application Ser. No. 06/166,179 (PCT Publication No. WO 01/36607 A1), incorporated herein by reference. Briefly, the E. coli appA mutants were constructed using the megaprimer site-directed mutagenesis method (Seraphin, B. et al., Nucleic Acids Res. 24:3276-77 (1996); Smith, A. M. et al., Biotechniques 22: 438-39 (1997), which are hereby incorporated by reference).
[0079] The template for mutagenesis was obtained from ATCC, and the gene (1.3 kb) was transformed into E. coli strain BL21 (No. 87441) using the pappA1 expression vector (Ostanin et al., J. Biol. Chem., 267:22830-36 (1992)). The template was amplified as described above for appA expressed in Pichia pastoris using the primers used above for appA expression in Pichia pastoris (SEQ. ID Nos.: 8 and 9). The amplification reaction included 1 cycle at 94.degree. C. (3 min.), 30 cycles at 94.degree. C. (0.5 min), 30 cycles at 54.degree. C. (1 min.), 30 cycles at 72.degree. C. (1.5 min.), and 1 cycle at 72.degree. C. (10 min).
[0080] The mutagenesis PCR reaction was performed as described above using the primers as follows:
TABLE-US-00003 (SEQ ID No.: 10) 5'CTGGGTATGGTTGGTTATATTACAGTCAGGT3' A131N V134N (SEQ ID No.: 11) 5'CAAACTTGAACCTTAAACGTGAG3' C200N (SEQ ID No.: 12) 5'CCTGCGTTAAGTTACAGCTTTCATTCTGTTT3' D207N S211N
[0081] The mutagenic PCR reactions incorporated appropriate primers to make the A131N/V134N/D207N/S211N, C200N/D207N/S211N (Mutant U), and A131N/V134N/C200N/D207N/S211N mutants of appA. The first mutagenic PCR reaction (100 .mu.l) was performed as described above, using 4 .mu.l of the intact appA PCR reaction mixture and the appropriate modified primers listed above. All megaprimer PCR products were resolved in a 1.5% low melting agarose gel. The expected fragments were excised and eluted with a GENECLEAN II kit. The final mutagenic PCR reaction (100 .mu.l) was set up as described above, using 4 p. 1 of the appA PCR product and varying concentrations of the purified megaprimer (50 ng to 4 .mu.g), depending on its size. Five thermal cycles were set up at 94.degree. C. for 1 minute and 70.degree. C. for 2 minutes. While at 70.degree. C., 1 .mu.mol of forward primer and 2 U of AmpliTaq DNA polymerase were added and gently mixed with the reaction mixture, and thermal cycling continued for 25 cycles at 94.degree. C. for 1 minute and 70.degree. C. for 1.5 minutes.
[0082] The genes encoding the site-directed mutants were expressed in Pichia pastoris as described above for the appA2 gene. The protein products were expressed as described above for AppA, and the site-directed mutants were purified from the yeast culture supernatant by ammonium sulfate precipitation and DEAE-Sepharose chromatography.
Example 8
In Vivo Effects of Yeast-Expressed Phytases Fed to Chicks
[0083] To evaluate their potential as animal feed supplements, the yeast-expressed phytases AppA and AppA2, were dried and added to the animal feed blend (23% crude protein) described above in Example 1 using wheat middlings as a carrier. Chicks (four chicks per pen; average initial weight of 97 grams) were fed phytase-supplemented feed compositions as described above in Example 4. The treatment groups included various level of KH.sub.2PO.sub.4 to construct the standard curve, 500 U/kg of Natuphos.RTM., a commercially available (Gist-Brocades) phytase expressed in the fungus Aspergillus niger, 500 U/kg of AppA expressed in Pichia pastoris or in E. coli, and various levels of AppA2/p (AppA2 expressed in Pichia pastoris using the constitutive pGAP promoter for gene expression) as follows:
Treatment Groups:
[0084] 1. Basal Diet (0.10% P, 0.75% Ca)
[0085] 2. Same as 1+0.05% P from KH.sub.2PO.sub.4
[0086] 3. Same as 1+0.10% P from KH.sub.2PO.sub.4
[0087] 4. Same as 1+0.15% P from KH.sub.2PO.sub.4
[0088] 5. Same as 1+500 U/kg AppA (yeast)
[0089] 6. Same as 1+500 U/kg AppA (E. coli)
[0090] 7. Same as 1+500 U/kg AppA2/p
[0091] 8. Same as 1+1000 U/kg AppA2/p
[0092] 9. Same as 1+1500 U/kg AppA2/p
[0093] 10. Same as 1+500 U/kg Natuphos
[0094] For the various treatment groups weight gain, feed intake, the feed to weight gain ratio, dry tibia weight, tibia ash weight, tibia ash weight as a percent of dry tibia weight, and the percentage of bioavailable phosphate based on both tibia ash weight and weight gain were determined. The results are expressed below as a mean for the four chicks for each of the five pens (R1, R2, R3, R4, and R5), and the mean for the five pens was also calculated (labeled "mean" in the tables). The treatment groups are labeled T1-T10 in the tables, and "g/c/d" indicates weight gain or feed intake in grams/chick/day.
TABLE-US-00004 Weight gain (g/c) T1 T2 T3 T4 T5 T6 T7 T8 T9 T10 R1 185 282 315 321 314 284 334 352 334 269 R2 219 286 315 336 317 322 315 326 348 274 R3 234 277 327 335 321 312 318 321 342 267 R4 234 291 309 311 316 308 326 342 333 276 R5 223 278 303 332 316 268 313 336 361 294 Mean 219.sup.g 283.sup.ef 314.sup.cd 327.sup.bc 317.sup.c 299.sup.de 321.sup.bc 335.sup.ab 344.sup.a 276.sup.f g/c/d 16.8 21.8 24.2 25.2 24.4 23.0 24.7 25.8 26.5 21.2 Pooled SEM = 6 LSD = 16 13-d Feed intake (g/c) T1 T2 T3 T4 T5 T6 T7 T8 T9 T10 R1 303 392 434 434 426 389 450 474 465 397 R2 330 462 448 454 429 430 425 449 472 396 R3 336 391 445 458 446 425 428 445 464 397 R4 350 416 432 424 432 420 441 464 449 386 R5 335 388 421 467 425 389 453 461 483 420 Mean 331.sup.f 410.sup.e 436.sup.c 447.sup.abc 432.sup.cd 411.sup.de 439.sup.bc 459.sup.ab 467.sup.a 399.sup.e g/c/d 25.5 31.5 33.5 34.4 33.2 31.6 33.8 35.3 35.9 30.7 Pooled SEM = 7 LSD = 21 Gain/feed (g/kg) T1 T2 T3 T4 T5 T6 T7 T8 T9 T10 R1 611 718 726 740 738 729 742 742 720 678 R2 665 618 703 741 738 749 741 727 738 692 R3 696 708 736 730 719 736 743 722 736 671 R4 668 700 715 733 731 733 738 738 743 715 R5 665 717 721 710 742 688 691 730 749 710 Mean 661.sup.c 692.sup.b 720.sup.a 731.sup.a 734.sup.a 727.sup.a 731.sup.a 732.sup.a 737.sup.a 691.sup.b Pooled SEM = 10 LSD = 28 Dry tibia weight (mg/c) T1 T2 T3 T4 T5 T6 T7 T8 T9 T10 R1 659 804 883 981 892 787 914 1059 1106 757 R2 655 769 891 977 907 918 873 997 1083 759 R3 713 751 878 1008 901 820 905 964 1065 726 R4 740 742 931 925 823 809 923 1083 1096 729 R5 714 714 866 942 841 809 931 1036 1132 764 Mean 698.sup.g 756.sup.f 890.sup.d 967.sup.c 873.sup.de 829.sup.e 909.sup.d 1028.sup.b 1096.sup.a 747.sup.f Pooled SEM = 16 LSD = 45 Tibia Ash (mg/c) T1 T2 T3 T4 T5 T6 T7 T8 T9 T10 R1 232 307 406 492 434 345 439 590 617 278 R2 215 315 415 507 445 435 420 546 600 305 R3 259 300 406 520 435 382 451 523 604 284 R4 237 297 442 462 392 372 454 590 616 267 R5 242 277 396 471 432 373 471 548 642 316 Mean 237.sup.h 299.sup.g 413.sup.e 490.sup.c 428.sup.de 381.sup.f 447.sup.d 559.sup.b 616.sup.a 290.sup.g Pooled SEM = 10 LSD = 28 Supplemental P Intake (g) T1 T2 T3 T4 R1 0 0.196 0.434 0.651 R2 0 0.231 0.448 0.680 R3 0 0.196 0.445 0.687 R4 0 0.208 0.432 0.636 R5 0 0.194 0.421 0.701 Mean 0.sup.d 0.205.sup.c 0.436.sup.b 0.671.sup.a Pooled SEM = 0.007 LSD = 0.022 Tibia ash (%) T1 T2 T3 T4 T5 T6 T7 T8 T9 T10 R1 35.15 38.22 46.03 50.12 48.64 43.78 47.98 55.64 55.79 36.78 R2 32.86 40.92 46.53 51.86 49.06 47.31 48.07 54.69 55.35 40.15 R3 36.30 39.96 46.22 51.61 48.31 46.62 49.85 54.23 56.69 39.14 R4 32.01 40.02 47.47 49.96 47.70 45.96 49.19 54.44 56.23 36.68 R5 33.45 38.82 45.74 49.95 51.40 46.11 50.54 52.86 56.71 41.32 Mean 33.95.sup.g 39.59.sup.f 46.40.sup.e 50.70.sup.c 49.02.sup.d 45.96.sup.e 49.13.sup.cd 54.37.sup.b 56.15.sup.a 38.81.sup.f Pooled SEM = 0.57 LSD = 1.62 Phosphorus Equivalency Estimates Tibia Ash Weight KH.sub.2PO.sub.4 Standard Curve: Y = tibia ash (mg) X = supplemental or equivalent P intake (g) Y = 232.0 + 389.9X r.sup.2 = 0.97 For 500 U/kg Phytase activity (example calculations using tibia ash treatment means) % Bioavailable P AppA (yeast): (428 - 232.0)/389.9 = 0.503 g P from 432 g FI = 0.116% AppA (E. coli): (381 - 232.0)/389.9 = 0.382 g P from 411 g FI = 0.093% AppA2/p: (447 - 232.0)/389.9 = 0.551 g P from 439 g FI = 0.126% Natuphos .RTM.: (290 - 232.0)/389.9 = 0.149 g P from 399 g FI = 0.037% ** Results from ANOVA (calculation performed for each pen of four birds; treatment legend on previous page) Bioavailable P (%) T5 T6 T7 T8 T9 T10 R1 0.122 0.075 0.118 0.194 0.212 0.030 R2 0.127 0.121 0.113 0.179 0.200 0.047 R3 0.117 0.091 0.131 0.168 0.206 0.034 R4 0.095 0.085 0.129 0.198 0.219 0.023 R5 0.121 0.093 0.135 0.176 0.218 0.051 Mean 0.116.sup.c 0.093.sup.d 0.125.sup.c 0.183.sup.b 0.211.sup.a 0.037.sup.e Pooled SEM = 0.005 LSD = 0.016 Contrasts Significance (P-value) AppA (yeast) vs. AppA (E. coli) 0.006 AppA2/p linear 0.001 AppA2/p quadratic 0.039 Weight Gain KH.sub.2PO.sub.4 Standard Curve: X = weight gain (g) Y = supplemental P intake (g) Y = 234.1 + 157.2X r.sup.2 = 0.84 Results from ANOVA (calculation performed for each pen of four birds; treatment legend on previous page) Bioavailable P (%) T5 T6 T7 T8 T9 T10 R1 0.119 0.082 0.141 0.158 0.137 0.056 R2 0.123 0.130 0.121 0.130 0.154 0.064 R3 0.124 0.117 0.125 0.124 0.148 0.053 R4 0.121 0.112 0.133 0.148 0.140 0.069 R5 0.123 0.055 0.111 0.141 0.167 0.091 Mean 0.122.sup.b 0.099.sup.d 0.126.sup.b 0.140.sup.ab 0.149.sup.a 0.067.sup.d Pooled SEM = 0.007 LSD = 0.021 Contrasts Significance (P-value) AppA (yeast) vs. AppA (E. coli) 0.038 AppA2/p linear 0.036 AppA2/p quadratic 0.768
[0095] Supplementation of the animal feed blend with increasing amounts of KH.sub.2PO.sub.4 resulted in linear (p<0.001) increases in weight gain and tibia ash.
[0096] Supplementation of the animal feed blend with Natuphos.RTM. resulted in linear increases (p<0.001) in weight gain, tibia ash, and % bioavailable phosphate. At 500 U/kg the yeast-expressed enzymes (AppA and AppA2/p) were more effective than E. coli-expressed AppA or Natuphos.RTM. at improving each of the in vivo responses tested, including the feed to weight gain ratio, tibia weight, and % bioavailable phosphate. In fact, AppA and AppA2/p were 2-6 times more effective at increasing the level of bioavailable phosphate than Natuphos.RTM., depending on whether tibia ash weight or weight gain was used to calculate the percent of bioavailable phosphate.
Example 9
In Vivo Effects of Yeast-Expressed Phytases Fed to Chicks
[0097] The procedure was as described in Example 8 except that the chicks had an average initial weight of 91 grams, and the treatment groups were as follows:
Treatment Groups:
[0098] 1. Basal Diet (0.10% P, 0.75% Ca)
[0099] 2. Same as 1+0.05% P from KH.sub.2PO.sub.4
[0100] 3. Same as 1+0.10% P from KH.sub.2PO.sub.4
[0101] 4. Same as 1+300 U/kg Natuphos.RTM. phytase
[0102] 5. Same as 1+500 U/kg Natuphos.RTM. phytase
[0103] 6. Same as 1+700 U/kg Natuphos.RTM. phytase
[0104] 7. Same as 1+900 U/kg Natuphos.RTM. phytase
[0105] 8. Same as 1+1100 U/kg Natuphos.RTM. phytase
[0106] 9. Same as 1+1300 U/kg Natuphos.RTM. phytase
[0107] 10. Same as 1+1500 U/kg Natuphos.RTM. phytase
[0108] 11. Same as 1+500 U/kg Ronozyme.RTM. phytase
[0109] 12. Same as 1+300 U/kg Mutant U phytase
[0110] 13. Same as 1+500 U/kg Mutant U phytase
[0111] 14. Same as 1+500 U/kg AppA phytase
[0112] 15. Same as 1+500 U/kg AppA2 phytase
[0113] The Ronozyme.RTM. (Roche) phytase is a phytase expressed in fungus. Mutant U is the site-directed mutant of AppA described above. The tables are labeled as described in Example 8. The in vivo effects of phytase supplementation described in Example 8 were measured and the results were as follows:
TABLE-US-00005 Weight gain (g/c) T1 T2 T3 T4 T5 T6 T7 T8 T9 T10 T11 T12 T13 T14 T15 R1 287 295 318 269 295 271 301 305 304 317 256 324 340 319 343 R2 271 291 342 288 297 282 313 295 323 327 231 289 349 325 342 R3 268 302 326 286 278 267 298 309 308 327 274 332 337 348 336 R4 256 282 317 255 304 280 294 295 289 310 287 310 338 324 330 R5 215 279 310 292 270 290 302 270 295 306 284 316 329 319 331 Mean 259 290 323 278 289 278 302 295 304 317 266 314 339 327 336 g/c/d 18.5 20.7 23.1 19.9 20.6 19.9 21.6 21.1 21.7 22.6 19.0 22.4 24.2 23.4 24.0 Pooled SEM = 6 LSD = 18 Feed intake (g/c) T1 T2 T3 T4 T5 T6 T7 T8 T9 T10 T11 T12 T13 T14 T15 R1 463 450 489 428 450 435 466 479 445 489 422 500 487 483 503 R2 424 439 565 443 427 454 470 469 490 489 394 459 518 459 519 R3 425 446 526 444 417 425 444 480 483 485 427 522 496 520 535 R4 406 437 472 398 450 437 462 442 425 505 439 478 499 496 491 R5 381 443 478 421 423 438 447 423 455 452 437 463 496 476 519 Mean 420 443 506 427 433 438 458 459 460 484 424 484 499 487 513 g/c/d 30.0 31.6 36.1 30.5 30.9 31.3 32.7 32.8 32.9 34.6 30.3 34.6 35.6 34.8 36.6 Pooled SEM = 10 LSD = 27 Gain/feed (g/kg) T1 T2 T3 T4 T5 T6 T7 T8 T9 T10 T11 T12 T13 T14 T15 R1 620 656 650 627 655 623 645 636 683 648 605 648 699 661 681 R2 639 662 606 651 696 621 665 629 659 668 587 629 672 709 659 R3 630 677 619 644 666 628 671 644 637 673 641 635 680 669 629 R4 631 645 671 641 675 642 636 668 679 614 654 649 678 652 671 R5 564 630 649 694 639 662 675 639 648 678 649 683 663 669 638 Mean 617 654 639 651 666 635 658 643 661 656 627 649 678 672 656 Pooled SEM = 10 LSD = 28 Dry tibia weight (mg/c) 1 2 3 4 5 6 7 8 9 10 11 12 13 14 15 R1 970 1010 1146 952 1028 1011 1007 995 1027 1131 -- 1150 1169 1160 1234 R2 920 1029 1175 974 937 1047 1013 993 1077 1077 828 995 1251 1130 1209 R3 1038 872 1147 981 932 917 1049 1072 1030 1137 1029 1151 1238 1178 1215 R4 890 944 1125 957 1008 964 1073 1005 961 1100 919 1116 1273 1177 1128 R5 882 970 1078 954 976 1004 961 963 1065 1101 937 1046 1172 1141 1145 Mean 940 965 1134 964 976 989 1021 1006 1032 1109 928 1092 1221 1157 1186 Pooled SEM = 22 LSD = 61 Supplemental P intake (g) 1 2 3 R1 0 0.225 0.489 R2 0 0.220 0.565 R3 0 0.223 0.526 R4 0 0.219 0.472 R5 0 0.222 0.478 Mean 0.sup.c 0.222.sup.b 0.506.sup.a Tibia ash (mg/c) 1 2 3 4 5 6 7 8 9 10 11 12 13 14 15 R1 284 333 437 279 303 305 328 324 340 369 -- 401 428 453 457 R2 270 318 447 298 290 336 336 325 383 363 226 355 481 441 470 R3 291 271 398 302 278 263 326 357 345 403 293 410 479 420 455 R4 234 305 398 281 314 297 341 317 324 364 264 406 500 447 413 R5 243 327 388 287 279 309 302 305 352 368 279 354 447 424 443 Mean 264 311 414 289 293 302 327 326 349 373 266 385 467 437 448 Pooled SEM = 10 LSD = 28 Tibia ash (%) 1 2 3 4 5 6 7 8 9 10 11 12 13 14 15 R1 29.30 32.94 38.15 29.25 29.48 30.18 32.55 32.54 33.10 32.60 -- 34.90 36.63 39.07 37.06 R2 29.29 30.97 38.03 30.61 30.99 32.06 33.21 32.73 35.51 33.67 27.33 35.66 38.48 39.04 38.89 R3 28.03 31.08 34.70 30.81 29.79 28.71 31.12 33.26 33.45 35.49 28.50 35.63 38.73 35.63 37.48 R4 26.30 32.33 35.34 29.35 31.17 30.80 31.73 31.55 33.71 33.11 28.74 36.38 39.29 38.00 36.63 R5 27.52 33.76 35.98 30.13 28.60 30.81 31.44 31.67 33.09 33.41 29.77 33.81 38.14 37.18 38.70 Mean 28.09 32.21 36.44 30.03 30.00 30.51 32.01 32.35 33.77 33.65 28.58 35.28 38.25 37.78 37.75 Pooled SEM = 0.49 LSD = 1.39 Phosphorus Equivalency Estimates KH.sub.2PO.sub.4 Standard Curve: Y = tibia ash (mg) X = supplemental or equivalent P intake (g) Y = 257.1 + 299.0X r.sup.2 = 0.88 For 500 U/kg Phytase activity (example calculations using tibia ash treatment mean) % Bioavailable P Natuphos .RTM.: (293 - 257.1)/299.0 = 0.120 g P from 433 g FI = 0.030% Ronozyme .RTM.: (266 - 257.1)/299.0 = 0.030 g P from 424 g FI = 0.007% Mutant U: (467 - 257.1)/299.0 = 0.702 g P from 499 g FI = 0.141% AppA: (437 - 257.1)/299.0 = 0.602 g P from 487 g FI = 0.124% AppA2: (448 - 257.1)/299.0 = 0.638 g P from 513 g FI = 0.124% Results from ANOVA (calculation performed for each pen of four birds; treatment legend on previous page) Bioavailable P (%) 4 5 6 7 8 9 10 11 12 13 14 15 R1 0.017 0.034 0.037 0.051 0.047 0.062 0.076 -- 0.097 0.117 0.136 0.133 R2 0.031 0.026 0.058 0.057 0.049 0.086 0.072 -0.026 0.071 0.145 0.134 0.137 R3 0.034 0.017 0.005 0.052 0.069 0.061 0.101 0.028 0.098 0.150 0.105 0.124 R4 0.020 0.043 0.030 0.060 0.045 0.053 0.071 0.006 0.104 0.163 0.128 0.106 R5 0.024 0.018 0.040 0.034 0.038 0.071 0.082 0.017 0.070 0.128 0.117 0.120 Mean 0.025 0.027 0.034 0.051 0.050 0.066 0.080 0.006 0.088 0.140 0.124 0.124 Pooled SEM = 0.006 LSD = 0.018 Contrasts Significance (P-value) Linear response to Natuphos .RTM. (treatment groups 5 (trt) 4-10) 0.001 Quadratic response to Natuphos .RTM. 0.208 500 U/kg Natuphos .RTM. (trt 5) vs 500 U/kg yeast-expressed phytases (trt 13-15) 0.001 500 U/kg Natuphos .RTM. (trt 5) vs 500 U/kg Ronozyme .RTM. (trt 11) 0.031 500 U/kg Ronozyme .RTM. (trt 11) vs 500 U/kg yeast-expressed phytases (trt 13-15) 0.001 300 U/kg Mutant U (trt 12) vs 500 U/kg Mutant U (trt 13) 0.001 500 U/kg Mutant U (trt 12) vs 500 U/kg AppA (trt 14) 0.074 500 U/kg Mutant U (trt 12) vs 500 U/kg AppA2 (trt 15) 0.074 Multiple Linear Regression: Y = tibia ash (mg) X = phytase intake (U) Y = 263.462 + 0.144(Natuphos .RTM.) + 0.014(Ronozyme .RTM.) + 0.823(MutantU) + 0.711(AppA) + 0.718(AppA2) R.sup.2 = 0.93 Relative Phytase Activity Ratio (%) Eq. To 500 U/kg Natuphos .RTM. Ronozyme .RTM.: (0.014/0.144) * 100 = 10 50 Mutant U: (0.823/0.144) * 100 = 572 2860 AppA: (0.711/0.144) * 100 = 494 2470 AppA2: (0.718/0.144) * 100 = 499 2495
[0114] At 500 U/kg, the yeast-expressed enzymes (Mutant U, AppA and AppA2) were more effective than Natuphos.RTM. or Ronozyme.RTM. (both enzymes are expressed in fungal expression systems) at improving the in vivo responses tested. For example, Mutant U, AppA and AppA2 were four times more effective than Natuphos.RTM. in releasing phosphate (see FIG. 3).
Example 10
In Vivo Effects of Yeast-Expressed Phytases Fed to Pigs
[0115] The procedure was as described in Example 8 except that pigs (average initial weight of 10 kg) were fed the phytase-supplemented feed composition. The treatment groups were as follows:
[0116] Treatment Groups:
[0117] 1) Basal diet (0.75 P; 0.60% Ca)
[0118] 2) Same as 1+0.05% P from KH.sub.2PO.sub.4
[0119] 3) Same as 1+0.10% P from KH.sub.2PO.sub.4
[0120] 4) Same as 1+0.15% P from KH.sub.2PO.sub.4
[0121] 5) Same as 1+400 U/kg phytase from Natuphos.RTM.
[0122] 6) Same as 1+400 U/kg phytase from Mutant U phytase
[0123] 7) Same as 1+400 U/kg AppA phytase
[0124] 8) Same as 1+400 U/kg AppA2 phytase
[0125] For the various treatment groups weight gain, feed to weight gain ratio, fibula ash weight, fibula ash weight as a percentage of dry fibula weight, and the percentage of bioavailable phosphate based on fibula ash weight were determined. The results were as follows:
TABLE-US-00006 TABLE 3 Pig Assay.sup.a Fibula Composition Weight G:F, Ash, Bioavailable Treatment Groups gain, g/d g/kg Ash, % mg P, %.sup.b Basal Diet 369 533 29.31 666 Same as 1 + 0.05% P from KH.sub.2PO.sub.4 435 576 32.83 766 Same as 1 + 0.10% P from KH.sub.2PO.sub.4 446 618 36.62 972 Same as 1 + 0.15% P from KH.sub.2PO.sub.4 509 660 36.57 1123 Same as 1 + 400 U/kg Natuphos .RTM. phytase 460 605 34.37 889 0.081 Same as 1 + 400 U/kg Mutant U phytase 458 645 35.45 961 0.116 Same as 1 + 400 U/kg AppA phytase 458 606 35.97 1035 0.136 Same as 1 + 400 U/kg AppA2 phytase 443 583 34.96 968 0.108 Contrast Significance (P-value) Natuphos .RTM. (treatment group (trt) 5) vs. yeast-expressed NS NS NS 0.05 0.048 phytases (trt 6-8) Mutant U (trt 6) AppA vs. (trt 7) and AppA2 (trt 8) 0.10 0.10 NS 0.001 0.239 .sup.aData are means of ten replicates per treatment of individually housed pigs during a period of 23 days; average initial weight was 8.4 .+-. 0.2 kg. .sup.bPercent bioavailable P calculations are estimates of P equivalency based on KH.sub.2PO.sub.4 standard curve (treatments 1-4). Calculations based on KH.sub.2PO.sub.4 standard curve where Y = fibula ash (mg) and X = supplemental or equivalent P intake (g): Y = 664.49 + 15.29X (r.sup.2 = 0.87).
[0126] 400 U/kg, the yeast-expressed enzymes (Mutant U, AppA, and AppA2) were more effective than Natuphos.RTM. (expressed in fungus) at improving the responses tested.
Example 11
In Vivo Effects of Yeast-Expressed Phytases in Chicks
[0127] The procedure was as described in Example 8 except that the chicks had an average initial weight of 83 grams, and the treatment groups were as follows:
Treatment Groups:
[0128] 1. Basal Diet (0.10% P; 0.75% Ca) [0129] 2. Same as 1+0.05% P from KH.sub.2PO.sub.4 [0130] 3. Same as 1+0.10% P from KH.sub.2PO.sub.4 [0131] 4. Same as 1+0.15% P from KH.sub.2PO.sub.4 [0132] 5. Same as 1+500 U/kg Natuphos.RTM. phytase (batch 1) [0133] 6. Same as 1+500 U/kg Natuphos.RTM. phytase (batch 2) [0134] 7. Same as 1+1000 U/kg Natuphos.RTM. phytase (batch 2) [0135] 8. Same as 1+500 U/kg Ronozyme.RTM. phytase (batch 1) [0136] 9. Same as 1+500 U/kg Ronozyme.RTM. phytase (batch 2) [0137] 10. Same as 1+1000 U/kg Ronozyme.RTM. phytase (batch 2) [0138] 11. Same as 1+500 U/kg Mutant U phytase [0139] 12. Same as 1+500 U/kg AppA phytase [0140] 13. Same as 1+500 U/kg AppA2 phytase [0141] 14. Same as 1+500 U/kg AppA2+novel promoter phytase (AppA2/p)
[0142] The tables are as labeled in Example 8. The in vivo effects of phytase supplementation described in Example 8 were measured and the results were as follows:
TABLE-US-00007 Weight gain (g/c) T1 T2 T3 T4 T5 T6 T7 T8 T9 T10 T11 T12 T13 T14 R1 152 252 295 299 215 235 241 223 256 254 325 308 322 314 R2 199 238 290 332 206 210 256 237 212 243 312 316 309 306 R3 163 257 297 347 235 254 250 215 218 246 324 309 313 335 R4 176 262 288 330 242 250 288 228 195 223 329 318 310 317 R5 190 257 295 356 193 230 288 218 214 259 306 307 314 317 Mean 176 253 293 333 218 236 265 224 219 245 319 312 314 318 g/c/d 12.6 18.1 20.9 23.8 15.6 16.9 18.9 16.0 15.6 17.5 22.8 22.3 22.4 22.7 Pooled SEM = 7 LSD = 19 Feed intake (g/c) T1 T2 T3 T4 T5 T6 T7 T8 T9 T10 T11 T12 T13 T14 R1 279 373 431 424 347 386 352 359 284 321 435 429 447 424 R2 335 352 407 441 333 340 375 363 325 368 395 441 427 465 R3 291 374 419 472 369 400 381 330 348 367 439 459 440 472 R4 292 386 400 457 366 370 405 358 328 356 451 473 421 441 R5 344 374 427 483 341 370 450 336 344 394 425 420 449 445 Mean 308 372 417 455 351 373 393 349 326 361 429 444 437 449 g/c/d 22.0 26.6 29.8 32.5 25.1 26.6 28.1 24.9 23.3 25.8 30.6 31.7 31.2 32.1 Pooled SEM = 10 LSD = 28 Gain/feed (g/kg) T1 T2 T3 T4 T5 T6 T7 T8 T9 T10 T11 T12 T13 T14 R1 544 674 684 705 618 608 684 621 676 793 747 718 719 742 R2 593 676 713 752 617 616 682 653 651 659 790 716 722 657 R3 558 686 709 736 636 635 656 650 626 671 737 673 713 708 R4 601 680 720 723 662 677 711 637 594 627 729 673 737 719 R5 551 685 690 737 565 622 641 649 624 658 721 732 700 712 Mean 569 680 703 731 620 632 675 642 634 682 745 702 718 708 Pooled SEM = 13 LSD = 37 Dry tibia weight (mg/c) 1 2 3 4 5 6 7 8 9 10 11 12 13 14 R1 671 886 1048 1002 919 840 912 825 891 831 1117 1041 1057 1091 R2 815 -- 1003 1298 752 765 906 865 756 916 1113 1152 1041 1070 R3 730 884 1036 1296 849 942 937 864 849 816 1154 1017 1130 1220 R4 698 911 931 1232 802 901 918 837 807 872 1163 1165 1047 1078 R5 773 929 1037 1266 793 845 867 768 825 962 1044 1054 1130 1140 Mean 737 903 1011 1219 823 859 908 832 826 879 1118 1086 1081 1120 Pooled SEM = 27 LSD = 77 Supplemental P intake (g) 1 2 3 4 R1 0 0.187 0.431 0.636 R2 0 0.176 0.407 0.661 R3 0 0.187 0.419 0.708 R4 0 0.193 0.400 0.685 R5 0 0.187 0.427 0.724 Mean 0.sup.d 0.186.sup.c 0.417.sup.b 0.683.sup.a Tibia ash (mg/c) 1 2 3 4 5 6 7 8 9 10 11 12 13 14 R1 174 255 381 367 254 230 246 239 253 224 415 385 404 411 R2 197 279 343 483 199 198 244 242 200 249 395 425 357 353 R3 185 279 361 486 238 261 276 230 228 231 410 370 389 454 R4 175 287 315 459 220 262 282 222 210 244 416 455 371 396 R5 183 261 335 481 211 229 264 202 222 262 383 380 406 431 Mean 183 272 347 455 224 236 262 227 223 242 404 403 385 409 Pooled SEM = 12 LSD = 32 Tibia ash (%) 1 2 3 4 5 6 7 8 9 10 11 12 13 14 R1 25.88 28.82 36.31 36.67 27.60 27.39 26.91 29.01 28.42 26.99 37.15 37.03 38.24 37.64 R2 24.20 -- 34.21 37.18 26.51 25.89 26.86 27.97 26.44 27.16 35.49 36.90 34.33 32.98 R3 25.43 31.61 34.87 37.53 28.06 27.75 29.52 26.65 26.85 28.35 35.54 36.34 34.40 37.22 R4 25.04 31.53 33.85 37.22 27.42 29.15 30.73 26.46 26.03 27.97 35.76 39.09 35.43 36.71 R5 23.72 28.11 32.27 38.02 26.61 27.17 30.41 26.26 26.88 27.22 36.67 36.02 35.99 37.80 Mean 24.85 30.02 34.30 37.32 27.24 27.47 28.89 27.27 26.92 27.54 36.12 37.08 35.68 36.47 Pooled SEM = 0.57 LSD = 1.61 Phosphorus Equivalency Estimates KH.sub.2PO.sub.4 Standard Curve: Y = tibia ash (mg) X = supplemental or equivalent P intake (g) Y = 187.9 + 393.4X r.sup.2 = 0.95 For 500 U/kg Phytase activity (example calculations using tibia ash treatment means) % Bioavailable P Natuphos .RTM. 1: (224 - 187.9)/393.4 = 0.092 g P from 351 g FI = 0.026% Natuphos .RTM. 2: (236 - 187.9)/393.4 = 0.122 g P from 373 g FI = 0.033% Ronozyme .RTM. 1: (227 - 187.9)/393.4 = 0.099 g P from 349 g FI = 0.028% Ronozyme .RTM. 2: (223 - 187.9)/393.4 = 0.089 g P from 326 g FI = 0.027% Mutant U: (404 - 187.9)/393.4 = 0.549 g P from 429 g FI = 0.128% AppA: (403 - 187.9)/393.4 = 0.547 g P from 444 g FI = 0.123% AppA2: (385 - 187.9)/393.4 = 0.501 g P from 437 g FI = 0.115% AppA2/p: (409 - 187.9)/393.4 = 0.562 g P from 449 g FI = 0.125% Results from ANOVA (calculation performed for each pen of four birds; treatment legend on previous page) Bioavailable P (%) 5 6 7 8 9 10 11 12 13 14 R1 0.048 0.028 0.042 0.036 0.058 0.029 0.133 0.117 0.123 0.138 R2 0.008 0.008 0.038 0.038 0.009 0.042 0.133 0.137 0.101 0.090 R3 0.035 0.047 0.059 0.032 0.029 0.030 0.129 0.101 0.116 0.143 R4 0.022 0.051 0.059 0.024 0.017 0.040 0.129 0.144 0.111 0.120 R5 0.017 0.028 0.043 0.011 0.025 0.048 0.117 0.116 0.123 0.139 Mean 0.026.sup.c 0.032.sup.bc 0.048.sup.b 0.028.sup.c 0.028.sup.c 0.038.sup.bc 0.128.sup.a 0.123.sup.a 0.115.sup.a 0.125.sup.a Pooled SEM = 0.006 LSD = 0.018
[0143] At 500 U/kg, the yeast-expressed enzymes (Mutant U, AppA, AppA2, and AppA2/p) were more effective than Natuphos.RTM. or Ronozyme.RTM. at improving the in vivo responses tested including weight gain, feed to weight gain ratio, bone mass and mineral content, and percent bioavailable phosphate. The yeast-expressed enzymes were about four times more effective at increasing the level of bioavailable phosphate than either of the fungus-expressed enzymes.
Example 12
In Vivo Effects of Yeast-Expressed Phytases Fed to Post-Molt Laying Hens
[0144] The procedure was as described in Example 8 except post-molt laying hens were tested, egg production and egg weight was determined, and the treatment groups and basal diet were as follows:
TABLE-US-00008 Treatments: 1. P-deficient corn-soybean meal basal diet (0.10% Pa; 3.8% Ca; 17% CP) 2. As 1 + 0.10% Pi from KH.sub.2PO.sub.4 3. As 1 + 150 U/kg r-AppA2 phytase 4. As 1 + 300 U/kg r-AppA2 phytase 5. As 1 + 10,000 U/kg r-AppA2 phytase Basal Diet: Ingredient % Corn 63.65 Soybean meal, dehulled 25.65 Limestone, ground 9.80 Salt 0.40 Mineral premix 0.20 Vitamin premix 0.15 DL-methionine, feed-grade 0.10 Choline chloride 0.05 **Note: Treatment 1 discontinued after week 4 due to egg production below 50%.
[0145] The following tables are labeled as described in Example 8 and some of the same responses as described in Example 8 were measured. The results show that AppA2 increases egg production and egg weight in post-molt laying hens.
TABLE-US-00009 Treatments: 1. P-deficient corn-soybean meal basal diet (0.10% pa; 3.8% Ca; 17% CP) 2. As 1 + 0.10% Pi from KH.sub.2PO.sub.4 3. As 1 + 150 U/kg r-AppA2 phytase 4. As 1 + 300 U/kg r-AppA2 phytase 5. As 1 + 10,000 U/kg r-AppA2 phytase T1 T2 T3 T4 T5 Initial body weights (g; mean of 12 hens) R1 1699 1792 1682 1790 1707 R2 1785 1698 1734 1855 1694 R3 1690 1665 1775 1724 1824 R4 1688 1745 1739 1823 1760 mean 1716 1725 1733 1798 1746 Pooled SEM = 26 LSD = 78 4-wk body weights (g: mean of 12 hens) R1 1566 1802 1763 1769 1748 R2 1558 1734 1816 1860 1723 R3 1633 1707 1744 1769 1850 R4 1615 1749 1762 1827 1757 mean 1593 1748 1771 1806 1770 Pooled SEM = 21 LSD = 64 12-wk body weights (g: mean of 12 hens) R1 -- 1876 1831 1792 1781 R2 -- 1791 1775 1856 1791 R3 -- 1800 1765 1806 1933 R4 -- 1853 1814 1876 1815 mean -- 1830 1796 1833 1830 Pooled SEM = 24 LSD = 74
TABLE-US-00010 Treatments: 1. P-deficient corn-soybean meal basal diet (0.10% pa; 3.8% Ca; 17% CP) 2. As 1 + 0.10% Pi from KH.sub.2PO.sub.4 3. As 1 + 150 U/kg r-AppA2 phytase 4. As 1 + 300 U/kg r-AppA2 phytase 5. As 1 + 10,000 U/kg r-AppA2 phytase T1 T2 T3 T4 T5 Feed intake(g/h/d).sup.1 R1 89 118 122 115 116 R2 92 125 114 122 119 R3 89 117 118 116 124 R4 94 123 119 115 123 mean 91.sup.b 121.sup.a 118.sup.a 117.sup.a 121.sup.a Pooled SEM = 2 LSD = 5 .sup.1Means are average daily feed intakes of hens for the first 4-wk period for treatment 1, and for the entire 12-wk period for treatments 2-5. Egg weights (g).sup.1 R1 57.5 64.0 65.4 65.7 64.5 R2 63.5 64.7 64.3 66.0 65.5 R3 60.3 64.3 64.6 64.8 65.6 R4 62.8 63.3 62.2 65.3 63.7 mean 61.0.sup.b 64.1.sup.a 64.1.sup.a 65.5.sup.a 64.8.sup.a Pooled SEM = 0.7 LSD = 2.2 .sup.1Means are average egg weights of hens for the first 4-wk period for treatment 1, and for the entire 12-wk period for treatments 2-5.
TABLE-US-00011 Treatments: 1. P-deficient corn-soybean meal basal diet (0.10% pa; 3.8% Ca; 17% CP) 2. As 1 + 0.10% Pi from KH.sub.2PO.sub.4 3. As 1 + 150 U/kg r-AppA2 phytase 4. As 1 + 300 U/kg r-AppA2 phytase 5. As 1 + 10,000 U/kg r-AppA2 phytase Egg production by week (%) 1 2 3 4 5 6 7 8 9 10 11 12 D1 75.3 55.7 36.0 22.9 -- -- -- -- -- -- -- -- D2 88.4 90.8 88.1 87.8 88.4 85.4 86.0 81.8 80.4 79.8 80.7 78.3 D3 84.5 85.1 83.3 85.1 83.3 82.1 83.6 79.2 77.4 77.4 79.5 76.5 D4 86.6 86.3 83.9 82.4 82.1 84.5 81.5 77.4 78.0 74.7 73.8 72.0 D5 82.4 83.3 83.6 84.8 80.7 81.3 82.7 78.6 80.1 78.9 76.8 72.6 SEM 3.0 3.2 3.4 3.5 3.3 3.2 3.2 4.1 3.4 4.5 3.5 3.9 Egg production (%).sup.1 T1 T2 T3 T4 T5 R1 44.6 86.5 73.0 81.0 80.7 R2 60.1 85.7 78.1 81.7 74.7 R3 43.2 87.2 84.3 83.9 87.8 R4 42.0 80.9 90.8 74.6 85.3 mean 47.5 85.1 81.6 80.3 82.1 Least-squares means.sup.2 53.8.sup.b 81.2.sup.a 80.7.sup.a 77.8.sup.a 82.9.sup.a Pooled SEM = 2.1 .sup.1Means are the average egg production of hens for the first 4-wk period for treatment 1, and for the entire 12-wk period for treatments 2-5. .sup.2Due to variation in week 1 egg production (above), covariance was used to analyze overall egg production, with least-squares means showing the effect of the covariable.
Example 13
In Vivo Effects of Yeast-Expressed Phytases Fed to Finishing Pigs
[0146] The procedure was as described in Example 8 except finishing pigs (i.e., gilts and barrows) were tested and the basal diet and treatment groups were as follows:
TABLE-US-00012 Treatments: 1. P-deficient corn-soybean meal basal diet 2. As 1 + 0.10% Pi from KH.sub.2PO.sub.4 3. As 1 + 250 FTU/kg r-AppA2 phytase 4. As 1 + 500 FTU/kg r-AppA2 phytase 5. As 1 + 1,000 FTU/kg r-AppA2 phytase 6. As 1 + 10,000 FTU/kg r-AppA2 phytase Basal diets: Weight range (kg) Ingredient 50-80 80-120 Cornstarch to 100 to 100 Corn 78.42 83.85 Soybean meal, dehulled 18.08 12.65 Limestone, ground 1.06 1.07 Dicalcium phosphate 0.16 -- Trace mineral premix 0.35 0.35 Vitamin premix 0.10 0.10 L-Lysine-HCl, feed-grade 0.16 0.11 L-threonine, feed-grade 0.02 -- Antibiotic premix 0.75 0.75 Calculated composition (NRC, 1998) Crude protein, % 15.1 13.0 Lysine, total % 0.88 0.69 Calcium, % 0.50 0.45 Phosphorus, total % 0.38 0.32 Phosphorus, estimated bioavailable, % 0.09 0.05 ME, kcal/kg 3293 3295
[0147] The following tables are labeled as described in Example 8 and some of the responses described in Example 8 were measured. Gain/feed ratio is shown rather than a feed/gain ratio.
[0148] The results show that AppA2 was as effective as phosphate at increasing bone mass and mineral content, and at improving the gain/feed ratio.
TABLE-US-00013 Treatments: 1. P-deficient corn-soybean meal basal diet 2. As 1 + 0.10% Pi from KH.sub.2PO.sub.4 3. As 1 + 250 FTU/kg r-AppA2 phytase 4. As 1 + 500 FTU/kg r-AppA2 phytase 5. As 1 + 1,000 FTU/kg r-AppA2 phytase 6. As 1 + 10,000 FTU/kg r-AppA2 phytase Barrows Gilts 1 2 3 4 5 6 1 2 3 4 5 6 Initial pig weights (kg) R1 52.2 52.8 53.0 51.8 52.0 51.8 51.2 50.8 52.2 52.2 51.3 52.4 R2 51.0 51.1 51.7 50.3 51.6 50.4 49.6 49.6 50.3 50.0 50.4 50.8 R3 48.2 49.6 49.8 49.6 50.1 49.2 48.1 49.6 47.9 47.1 48.8 48.4 R4 46.4 46.5 46.5 46.9 47.4 47.9 45.9 45.4 44.3 46.6 46.5 45.7 R5 52.0 44.1 51.0 52.4 46.4 50.7 43.4 43.9 44.0 43.1 44.1 44.0 mean 50.0 48.8 50.4 50.2 49.5 50.0 47.6 47.9 47.7 47.8 48.2 48.3 Pooled SEM = 0.4 Phase-switch pig weights (kg) R1 78.8 83.0 85.0 76.0 79.6 79.2 79.7 80.1 88.6 84.1 83.1 89.6 R2 76.8 80.6 86.9 79.9 82.2 83.8 80.0 83.5 87.7 84.5 87.3 83.5 R3 73.7 79.8 77.1 79.1 79.0 75.9 77.1 77.6 81.3 79.9 82.6 82.4 R4 82.3 82.5 79.2 79.1 84.4 84.5 74.7 78.1 73.9 84.6 78.9 79.1 R5 84.5 78.5 84.7 83.2 85.3 85.2 83.3 80.5 84.4 87.2 81.7 82.5 mean 79.2 80.9 82.6 79.5 82.1 81.7 78.9 79.9 83.2 83.4 82.7 83.4 Pooled SEM = 0.8 Final pig weights (kg) R1 111.3 121.2 121.9 115.9 112.9 111.1 105.9 109.5 119.9 116.1 105.4 130.1 R2 111.5 119.6 132.7 111.9 121.3 116.3 105.8 115.6 118.3 115.3 123.3 112.5 R3 115.9 126.4 117.1 119.9 114.0 120.7 104.9 107.9 123.6 125.2 127.1 130.8 R4 116.6 117.9 110.0 110.0 119.7 122.1 120.2 121.6 117.9 127.7 109.3 123.0 R5 118.3 111.6 122.3 114.2 123.0 117.1 115.2 110.4 119.2 135.1 119.1 117.1 mean 114.7 119.3 120.8 114.4 118.2 117.5 110.3 113.0 119.8 123.9 116.8 122.7 Pooled SEM = 3.0 (Sex x Diet, P < 0.10) Contrasts: Sex x Pi (2) vs Phytase (3-6), P < 0.05.
TABLE-US-00014 Treatments: 1. P-deficient corn-soybean meal basal diet 2. As 1 + 0.10% Pi from KH.sub.2PO.sub.4 3. As 1 + 250 FTU/kg r-AppA2 phytase 4. As 1 + 500 FTU/kg r-AppA2 phytase 5. As 1 + 1,000 FTU/kg r-AppA2 phytase 6. As 1 + 10,000 FTU/kg r-AppA2 phytase Barrows Gilts 1 2 3 4 5 6 1 2 3 4 5 6 Weight gain, initial-switch (g/d) R1 1024 1163 1233 931 1061 1055 816 836 1040 911 909 1063 R2 993 1135 1353 1140 1178 1283 867 966 1068 986 1055 936 R3 979 1162 1048 1131 1109 1028 829 801 955 935 965 971 R4 1025 1028 936 921 1057 1046 822 936 847 1001 925 952 R5 931 983 963 881 1109 984 950 870 962 1048 895 918 mean 990 1094 1107 1001 1103 1079 857 882 974 976 950 968 Pooled SEM = 0.24 Contrasts: Barrows (Ba) vs Gilts (Gi), P < 0.01; 1 vs 2-6, P < 0.01 Weight gain, switch-final(g/d) R1 832 979 945 1023 855 818 706 794 844 865 604 1095 R2 890 1000 1174 822 1001 833 688 874 835 830 974 784 R3 919 1013 870 889 762 974 545 593 829 888 871 949 R4 927 971 832 833 954 1015 893 854 861 904 596 862 R5 912 895 1018 836 1020 864 531 499 581 798 624 577 mean 896 972 968 881 918 901 673 723 790 857 734 853 Pooled SEM = 37 Contrasts: Ba vs Gi, P < 0.05 Weight gain, overall (g/d) R1 909 1053 1060 986 937 913 760 814 940 887 752 1079 R2 931 1054 1246 949 1072 1013 775 919 948 906 1013 858 R3 941 1066 934 976 888 993 660 678 880 907 910 958 R4 975 1006 882 876 1004 1030 864 887 855 944 730 898 R5 922 938 992 858 1063 922 703 652 738 901 735 717 mean 935 1023 1023 929 993 974 752 790 872 909 828 902 Pooled SEM = 38 (Sex x diet, P < 0.10) Contrasts: Sex x Pi (2) vs Phytase (3-6), P < 0.05
TABLE-US-00015 Treatments: 1. P-deficient corn-soybean meal basal diet 2. As 1 + 0.10% Pi from KH.sub.2PO.sub.4 3. As 1 + 250 FTU/kg r-AppA2 phytase 4. As 1 + 500 FTU/kg r-AppA2 phytase 5. As 1 + 1,000 FTU/kg r-AppA2 phytase 6. As 1 + 10,000 FTU/kg r-AppA2 phytase Barrows Gilts 1 2 3 4 5 6 1 2 3 4 5 6 Feed intake, initial-switch (g/d) R1 2670 2733 2947 2271 2516 2448 2152 2029 2437 2074 2211 2579 R2 2541 2564 2940 2590 2484 2899 2425 2068 2543 2326 2363 1979 R3 2277 2499 2338 2385 2601 2066 2134 2020 2388 2168 2207 2093 R4 2371 2370 2311 2206 2457 2077 2104 2230 1919 2139 2260 2215 R5 2665 2312 2603 2308 2696 2366 2008 1289 2396 2237 1494 1866 mean 2505 2496 2628 2352 2551 2371 2165 1927 2337 2189 2107 2146 Pooled SEM = 67 Contrasts: Ba vs Gi, P < 0.01 Feed intake, switch-final (g/d) R1 3181 3427 3559 3270 2962 2918 2443 2615 2890 2651 2094 3739 R2 2922 3039 3833 3011 3141 3147 2481 2652 2936 2796 3316 2565 R3 3087 3330 2847 2877 2904 2686 2241 2110 2849 2692 2820 2952 R4 2978 2945 2872 2646 3104 2876 2935 2946 2373 2685 2481 2836 R5 3244 2958 3549 3106 3517 3008 2307 1747 2728 2947 2224 2385 mean 3082 3140 3332 2982 3126 2926 2482 2414 2755 2754 2587 2895 Pooled SEM = 105 Contrasts: Ba vs Gi, P < 0.01 Feed intake, overall (g/d) R1 2977 3149 3314 2870 2784 2726 2302 2330 2670 2370 2151 3175 R2 2770 2849 3476 2842 2878 3048 2454 2368 2745 2568 2853 2280 R3 2794 3030 2663 2699 2794 2462 2197 2073 2661 2479 2571 2603 R4 2683 2632 2599 2432 2790 2488 2597 2655 2188 2463 2391 2583 R5 2963 2644 3089 2718 3118 2696 2184 1559 2591 2654 1993 2171 mean 2837 2861 3028 2712 2873 2684 2347 2197 2571 2507 2378 2562 Pooled SEM = 81 Contrasts: Ba vs GI, P < 0.01
TABLE-US-00016 Treatments: 1. P-deficient corn-soybean meal basal diet 2. As 1 + 0.10% Pi from KH.sub.2PO.sub.4 3. As 1 + 250 FTU/kg r-AppA2 phytase 4. As 1 + 500 FTU/kg r-AppA2 phytase 5. As 1 + 1,000 FTU/kg r-AppA2 phytase 6. As 1 + 10,000 FTU/kg r-AppA2 phytase Barrows Gilts 1 2 3 4 5 6 1 2 3 4 5 6 Gain/feed, initial-switch (g/kg) R1 383 425 418 410 421 431 379 412 427 439 411 412 R2 391 443 460 440 474 442 357 467 420 424 447 473 R3 430 465 448 474 427 498 388 396 400 431 437 464 R4 432 434 405 418 430 504 390 420 441 468 409 430 R5 349 425 370 382 411 416 473 675 402 469 599 492 mean 397 438 420 425 433 458 397 474 418 446 461 454 Pooled SEM = 12 Contrasts: 1 vs. 2-6, P < 0.01; 3 vs 4-6, P < 0.10 Gain/feed, switch-final (g/d) R1 262 286 265 313 289 281 289 304 292 326 289 293 R2 305 329 306 273 319 265 277 329 285 297 294 306 R3 298 304 307 309 262 363 243 281 291 330 309 321 R4 311 329 290 315 307 353 304 290 363 337 240 304 R5 281 303 287 269 290 287 230 285 213 271 281 242 mean 291 310 291 296 293 310 269 298 289 312 283 293 Pooled SEM = 8 Gain/feed overall (g/d) R1 305 334 320 344 337 335 330 349 352 374 350 340 R2 336 370 358 334 372 332 316 388 345 353 355 376 R3 337 352 351 362 318 403 301 327 331 366 354 368 R4 363 381 339 361 360 414 333 334 391 383 305 348 R5 311 355 321 316 341 342 322 418 285 340 382 330 mean 331 358 338 343 346 365 320 363 341 363 349 352 Pooled SEM = 8 Contrasts: 1 vs 2-6, P < 0.01
TABLE-US-00017 Treatments: 1. P-deficient corn-soybean meal basal diet 2. As 1 + 0.10% Pi from KH.sub.2PO.sub.4 3. As 1 + 250 FTU/kg r-AppA2 phytase 4. As 1 + 500 FTU/kg r-AppA2 phytase 5. As 1 + 1,000 FTU/kg r-AppA2 phytase 6. As 1 + 10,000 FTU/kg r-AppA2 phytase Barrows Gilts 1 2 3 4 5 6 1 2 3 4 5 6 Fibula Dry Weight (g) R1 8.18 10.90 11.45 12.11 10.08 12.08 7.54 10.95 9.92 9.42 9.87 11.29 R2 8.84 11.74 8.66 10.98 11.21 11.66 7.96 8.81 9.33 11.41 10.70 12.73 R3 8.54 11.29 9.81 11.90 10.10 12.77 8.62 10.25 9.94 10.50 11.86 12.46 R4 9.82 10.69 9.06 10.22 11.05 12.40 8.26 11.61 9.67 10.92 10.91 10.49 R5 7.88 8.88 10.33 10.51 12.01 11.26 7.68 9.51 11.16 11.48 10.10 11.44 mean 8.65 10.70 9.86 11.14 10.89 12.03 8.01 10.23 10.00 10.75 10.69 11.68 Pooled SEM = 0.27 Contrasts: 1 vs 2-6, P < 0.01; 3 vs 4-6, P < 0.01 Fibula Ash Weight (g) R1 4.37 6.32 6.34 6.90 6.03 6.94 4.06 6.42 5.21 5.33 5.61 6.78 R2 4.26 7.05 5.12 6.49 6.24 6.80 4.36 5.18 5.51 6.25 6.21 7.16 R3 4.51 6.54 5.78 7.17 5.81 7.49 4.35 5.91 6.11 5.79 6.93 7.23 R4 5.34 6.35 5.19 5.90 6.73 7.33 4.28 7.13 5.66 6.35 6.56 6.22 R5 4.37 5.22 6.02 6.34 7.06 6.64 3.91 5.64 7.02 6.25 5.88 6.93 mean 4.57 6.30 5.69 6.56 6.37 7.04 4.19 6.06 5.90 5.99 6.24 6.86 Pooled SEM = 0.17 Contrasts: Ba vs Gi, P < 0.10; 1 vs 2-6, P < 0.01; 3 vs 4-6, P < 0.01; 4 vs 5-6, P < 0.10; 5 vs 6, P < 0.01 Fibula Ash Percent (%) R1 53.42 57.98 55.37 56.98 59.82 57.45 53.85 58.63 52.52 56.58 56.84 60.05 R2 48.19 60.05 59.12 59.11 55.66 58.32 54.77 58.80 59.06 54.78 58.04 56.25 R3 52.81 57.93 58.92 60.25 57.52 58.65 50.46 57.66 61.47 55.14 58.43 58.03 R4 54.38 59.40 57.28 57.73 60.90 59.11 51.82 61.41 58.53 58.15 60.13 59.29 R5 55.46 58.78 58.28 60.32 58.78 58.97 50.91 59.31 62.90 54.44 58.22 60.58 mean 52.85 58.83 57.79 58.88 58.54 58.50 52.36 59.16 58.90 55.82 58.33 58.84 Pooled SEM = 0.65 Contrasts: 1 vs 2-6, P < 0.01
TABLE-US-00018 Treatments: 1. P-deficient corn-soybean meal basal diet 2. As 1 + 0.10% Pi from KH.sub.2PO.sub.4 3. As 1 + 250 FTU/kg r-AppA2 phytase 4. As 1 + 500 FTU/kg r-AppA2 phytase 5. As 1 + 1,000 FTU/kg r-AppA2 phytase 6. As 1 + 10,000 FTU/kg r-AppA2 phytase Barrows Gilts 1 2 3 4 5 6 1 2 3 4 5 6 Metatarsal Dry Weight (g) R1 11.42 14.03 15.84 15.36 14.43 13.85 11.77 15.90 16.00 15.48 12.65 15.05 R2 11.89 14.52 13.27 14.26 13.73 15.06 11.66 13.74 14.14 14.19 13.75 14.87 R3 14.01 14.45 13.20 13.99 14.91 17.43 10.52 12.20 11.95 16.31 17.53 17.13 R4 12.25 14.38 12.54 15.99 15.26 17.01 11.68 13.49 13.16 14.20 12.77 14.23 R5 12.55 13.30 14.30 14.36 17.79 14.29 11.26 12.76 12.47 16.93 12.78 13.10 mean 12.42 14.14 13.83 14.79 15.22 15.53 11.38 13.62 13.54 15.42 13.90 14.88 Pooled SEM = 0.44 Contrasts: 1 vs 2-6, P < 0.01; 3 vs 4-6, P < 0.05 Metatarsal Ash Weight (g) R1 5.28 6.59 7.97 6.93 6.74 6.86 4.74 7.21 6.72 7.09 6.07 7.50 R2 6.81 7.10 5.94 6.74 6.32 7.44 4.84 6.28 6.40 6.55 6.71 7.07 R3 4.82 6.95 6.41 6.77 6.72 7.88 4.82 5.59 6.67 6.99 8.13 8.11 R4 4.83 6.81 6.26 7.73 7.88 7.48 4.86 7.27 5.92 7.15 6.97 7.13 R5 5.20 5.75 7.22 6.99 8.33 7.14 5.24 6.61 6.65 7.07 6.04 6.55 mean 5.39 6.64 6.76 7.03 7.20 7.36 4.90 6.59 6.47 6.97 6.78 7.27 Pooled SEM = 0.18 Contrasts: 1 vs 2-6, P < 0.01; 3 vs 4-6, P < 0.05 Metatarsal Ash Percent (%) R1 46.25 46.99 50.31 45.15 46.75 49.56 40.22 45.37 42.01 45.80 47.96 49.84 R2 39.90 48.90 44.75 47.16 46.02 49.39 41.50 45.72 45.27 46.18 48.80 47.55 R3 34.38 48.12 48.59 48.36 45.09 45.18 45.84 45.78 55.84 42.87 46.39 47.35 R4 39.44 47.27 49.89 48.36 51.65 43.98 41.63 53.93 44.97 50.32 54.59 50.11 R5 41.44 43.26 50.50 48.69 46.81 49.95 46.50 51.82 53.33 41.74 47.28 50.00 mean 40.28 46.91 48.81 47.54 47.26 47.61 43.14 48.52 48.28 45.38 49.00 48.97 Pooled SEM = 1.05 Contrasts: 1 vs 2-6, P < 0.01
Example 14
In Vivo Effects of Yeast-Expressed Phytases Fed to Pigs
[0149] The procedure was as described in Example 8 except that the treatment groups were as follows:
[0150] 28-day period
[0151] 1. Basal-0.08% available phosphorus
[0152] 2. Basal+0.05 phosphorus from monosodium phosphate
[0153] 3. Basal+0.10 phosphorus from monosodium phosphate
[0154] 4. Basal+0.15 phosphorus from monosodium phosphate
[0155] 5. Basal+250 FTU/kg experimental phytase product
[0156] 6. Basal+500 FTU/kg experimental phytase product
[0157] 7. Basal+1,000 FTU/kg experimental phytase product
[0158] 8. Basal+2,000 FTU/kg experimental phytase product
[0159] 9. Basal+Natuphos.RTM. 500 FTU/kg
[0160] The results are shown in the following table. The results show that AppA2 increases bone mass and mineral content and improves the gain/feed ratio as effectively as phosphate.
TABLE-US-00019 Effect of phytase supplementation on pig growth performance and bone ash.sup.a Added NaH.sub.2PO.sup.4H.sub.2O.sup.h 0.00 0.05 0.10 0.15 Phytase units/g.sup.c 250 500 1,000 2,000 500 S.E. BASF Daily gain, kg.sup.ij 0.35.sup.g 0.39.sup.fg 0.46.sup.de 0.49.sup.d 0.38.sup.g 0.42.sup.el 0.47.sup.d 0.49.sup.d 0.42.sup.l 0.01 Daily feed intake, kg.sup.j 0.75.sup.f 0.75.sup.f 0.81.sup.def 0.85.sup.d 0.77.sup.ef 0.79.sup.def 0.83.sup.def 0.85.sup.d 0.85.sup.de 0.07 G:F.sup.ijk 0.48.sup.f 0.53.sup.de 0.57.sup.d 0.58.sup.d 0.50.sup.ef 0.54.sup.de 0.57.sup.d 0.57.sup.d 0.49.sup.ef 0.02 Fibula ash, g.sup.ij 0.57.sup.h 0.65.sup.gh 0.77.sup.f 0.88.sup.e 0.59.sup.h 0.72.sup.f 0.85.sup.e 0.97.sup.d 0.70.sup.fg 0.03 Fibula ash, %.sup.ij 34.6.sup.h 36.0.sup.gh 37.8.sup.g 41.5.sup.de 33.9.sup.h 38.2.sup.fg 40.4.sup.ef 42.6.sup.d 38.5.sup.f 0.84 % Available P.sup.l 18.43.sup.g -- -- -- 22.56.sup.g 38.31.sup.f 53.56.sup.e 66.71.sup.d 34.47.sup.f 4.07 aP Intake, g/d.sup.ijl 0.58.sup.g 0.92.sup.g 1.45.sup.f 1.92.sup.c 0.68.sup.g 1.22.sup.f 1.81.sup.e 2.31.sup.d 1.17.sup.f 0.13 Supplemental aP Intake, 0.02.sup.h 0.34.sup.gh 0.84.sup.f 1.27.sup.e 0.12.sup.h 0.62.sup.fg 1.17.sup.e 1.64.sup.d 0.57.sup.fg 0.13 g/d.sup.ijm .sup.aSix replications of two pigs per pen for performance data; six replications of two pigs per pen for bone data except for the treatment with phytase added at 500 units/g, which has five replications. .sup.bAdded P from monosodium phosphate (NaH.sub.2PO.sub.4H.sub.2O) to the basal diet. .sup.cSupplemental phytase added to the basal diet. .sup.defghMeans within a row without common superscripts differ (P < 0.05). .sup.iLinear effect of added P from monosodium phosphate (P < 0.001). .sup.jLinear effect of supplemental phytase (P < 0.001). .sup.kUF phytase v. BASF phytase (P < 0.07) .sup.lAssumes that the P in corn, soybean meal, and monosodium phosphate is 11.25, and 100% available, respectively. .sup.mAssumes that the P in monosodium phosphate is 100% available.
Example 15
In Vivo Effects of Yeast-Expressed Phytases Fed to Chicks and Pigs
[0161] The procedure for the studies summarized in the following tables was as described in Example 8. The treatment groups are shown in each table and the basal diet compositions are shown in the following table (see next page). The results show that AppA2 (ECP) is as effective as phosphate in improving the gain/feed ratio and in increasing bone mass and mineral content. The results also show that AppA2 is more effective than Natuphos.RTM. and Ronozyme.RTM. at increasing bioavailable phosphate. Furthermore, the results show that AppA2 increases egg weight and egg production in laying hens as effectively as phosphate.
TABLE-US-00020 Percentage composition of diets (as-fed basis). Chick Young pig Finishing pig assay Laying Ingredient assays assay 50-80 kg 80-120 kg hen assay Cornstarch to 100 to 100 to 100 to 100 -- Corn 50.89 60.85 78.42 83.85 63.65 Soybean meal, dehulled 39.69 31.19 18.08 12.65 25.65 Soybean oil 5.00 3.00 -- -- -- Limestone, ground 1.67 1.06 1.06 1.07 9.80 Salt 0.40 -- -- -- 0.40 Dicalcium phosphate -- -- 0.16 -- -- Trace mineral premix 0.15.sup.a 0.35.sup.b 0.35.sup.b 0.35.sup.b 0.20.sup.a Vitamin premix 0.20.sup.c 0.20.sup.d 0.10.sup.d 0.10.sup.d 0.15.sup.c Choline Chloride (60%) 0.20 -- -- -- 0.05 Antibiotic premix 0.05.sup.e 1.00.sup.f 0.75.sup.g 0.75.sup.g -- Copper sulfate -- 0.08 -- -- -- L-Lysine HCI, feed grade -- 0.17 0.16 0.11 -- L-Threonine, feed grade -- -- 0.02 -- -- DL-Methionine, feed grade 0.20 0.05 -- -- 0.10 Chemical composition Crude protein, %.sup.h 22.6 20.8 15.1 13.0 17.0 Total phosphorus, %.sup.h 0.42 0.35 0.38 0.32 0.34 Available phosphorus, %.sup.i 0.10 0.075 0.09 0.05 0.07 Calcium, %.sup.i 0.75 0.60 0.50 0.45 3.8 ME, kcal/kg.sup.i 3123 3387 3293 3295 2758 .sup.aSupplied the following per kilogram of complete diet: Fe, 75 mg (FeSO.sub.4H.sub.2O); Zn, 100 mg (ZnO); Mn, 75 mg (MnO); Cu, 8 mg (CuSO.sub.4H.sub.20); I, 0.35 mg (CaI.sub.2); Se, 0.3 mg (Na.sub.2SeO.sub.3); NaCL, 3 g. .sup.bSupplied the following per kilogram of complete diet: Fe, 90 mg (FeSO.sub.4H.sub.2O); Zn, 100 mg (ZnO); Mn, 20 mg (MnO); Cu, 8 mg (CuSO.sub.4H.sub.2O); I, 0.35 mg (CaI.sub.2); Se, .0.3 mg (Na.sub.2SeO.sub.3); NaCl, 3 g. .sup.cSupplied the following per kilogram of complete diet: retinyl acetate, 1,514 .mu.g; cholecalciferol, 25 .mu.g; DL-.alpha.-tocopheryl acetate, 11 mg; menadione sodium bisulfite complex, 2.3 mg; niacin, 22 mg; D-Ca-pantothenate, 10 mg; riboflavin, 4.4 mg; vitamin B.sub.12, 11 .mu.g. .sup.dSupplied the following per kilogram of complete diet; retinyl acetate, 2,273 .mu.g; cholecalciferol, 16.5 .mu.g; DL-.alpha.-tocopheryl acetate, 88 mg; menadione, 4.4 mg (menadione sodium bisulfite complex); niacin, 33 mg; D-Ca-pantothenate, 24.2 mg; riboflavin, 8.8 mg; vitamin B.sub.12, 35 .mu.g; choline chloride, 319 mg. .sup.eProvided 50 mg of bacitracin per kilogram of complete diet. .sup.fProvided 55 mg of mecadox per kilogram of complete diet. .sup.gProvided 38 mg of roxarsone per kilogram of complete diet. .sup.hAnalyzed (AOAC, 1999). .sup.iCalculated (NRC, 1994; NRC, 1998).
TABLE-US-00021 Assessment of relative phosphorus bioavailability in chicks as affected by two different phytase enzymes (Chick assay 1).sup.a. Gain/ Weight feed, Tibia ash Bioavailable Diet gain, g g/kg % mg P, % 1. Basal diet 259.sup.e 617.sup.d 28.1.sup.f 264.sup.f -- 2. As 1 + 0.05% 290.sup.d 654.sup.c 32.2.sup.d 311.sup.e -- P.sub.i (KH.sub.2PO.sub.4) 3. As 1 + 0.10% 323.sup.c 639.sup.cd 36.4.sup.c 414.sup.d -- P.sub.i (KH.sub.2PO.sub.4) 4. As 1 + 500 FTU/kg 289.sup.d 666.sup.c 30.0.sup.c 293.sup.c 0.027.sup.d Natuphos .RTM. 5. As 1 + 500 FTU/kg 346.sup.c 656.sup.c 37.8.sup.c 448.sup.c 0.124.sup.c ECP Pooled SEM 6 10 0.5 10 0.006 .sup.aValues are means of five pens of four male chicks fed the experimental diets during the period 8 to 22 d post-hatching; average initial weight was 91 g. .sup.bThe linear regression of tibia ash (mg) for Diets 1 to 3 as a function of supplemental P intake (g) was Y = 257.1 .+-. 9.8 + 299.0 .+-. 30.7X (r.sup.2 = 0.88); Bioavailable P concentrations (equivalent P yields) for Diets 4 and 5 were determined by calculating equivalent bioavailable P intake (g) from the standard curve, dividing that by the feed intake (g), and multiplying by 100. .sup.c,d,e,fMeans within a column with different superscripts are different, P < 0.05.
TABLE-US-00022 Relative phosphorus bioavailability in chicks fed different phytase enzymes (Chick assay 2).sup.a. Weight Gain/feed, Tibia ash Bioavailable Diet gain, g g/kg % mg P, % 1. Basal diet 176.sup.k 569.sup.k 24.9.sup.k 183.sup.k -- 2. As 1 + 0.05% P.sub.i (KH.sub.2PO.sub.4) 253.sup.hi 680.sup.h 30.0.sup.h 272.sup.h -- 3. As 1 + 0.10% P.sub.i (KH.sub.2PO.sub.4) 293.sup.g 703.sup.fgh 34.3.sup.g 347.sup.g -- 4. As 1 + 0.15% P.sub.i (KH.sub.2PO.sub.4) 333.sup.f 731.sup.ef 37.3.sup.e 455.sup.e -- 5. As 1 + 500 FTU/kg Natuphos .RTM..sup.c 218.sup.j 620.sup.j 27.2.sup.j 224.sup.j 0.026.sup.g 6. As 1 + 500 FTU/kg Natuphos .RTM..sup.d 236.sup.ij 632.sup.j 27.5.sup.ij 236.sup.ij 0.032.sup.fg 7. As 1 + 1,000 FTU/kg Natuphos .RTM..sup.d 265.sup.i 675.sup.gh 28.9.sup.hi 262.sup.hi 0.048.sup.f 8. As 1 + 500 FTU/kg Ronozyme .RTM. 219.sup.j 634.sup.j 26.9.sup.j 223.sup.j 0.028.sup.g 9. As 1 + 1,000 FTU/kg Ronozyme .RTM. 245.sup.i 682.sup.gh 27.5.sup.ij 242.sup.hij 0.038.sup.fg 10. As 1 + 500 FTU/kg ECP 318.sup.ef 708.sup.fgh 36.5.sup.ef 409.sup.f 0.125.sup.e Pooled SEM 7 10 0.6 12 0.006 .sup.aValues are means of five pens of four male chicks fed the experimental diets during the period 8 to 22 d posthatching; average initial weight was 83 g. .sup.bThe linear regression of tibia ash (mg) for Diets 1 to 4 as a function of supplemental P intake (g) was Y = 187.9 .+-. 8.7 + 393.4 .+-. 21.2X (r.sup.2 = 0.95); Bioavailable P concentrations (equivalent P yields) for Diets 4-11 were determined by calculating equivalent bioavailable P intake (g) from the standard curve, dividing that by the feed intake (g) of the pen, and multiplying by 100. .sup.cEnzyme was from the same batch that was used for chick assay 1. .sup.dEnzyme was from a different batch that was used for chick assay 1. .sup.e,f,g,h.i,j,kMeans within a column with different superscripts are different, P < 0.05.
TABLE-US-00023 The effect of activity level on the phosphorus-releasing efficacy of E. coli phytase in chicks (Chick assay 3).sup.a. Gain/ Tibia Weight feed, ash Bioavailable Diet gain, g g/kg mg P, %.sup.b 1. Basal diet 219.sup.h 661.sup.c 237.sup.f -- 2. As 1 + 0.05% P.sub.i (KH.sub.2PO.sub.4) 283.sup.fg 692.sup.d 299.sup.h -- 3. As 1 + 0.10% P.sub.i (KH.sub.2PO.sub.4) 314.sup.c 720.sup.c 413.sup.g -- 4. As 1 + 0.15% P.sub.i (KH.sub.2PO.sub.4) 327.sup.dc 731.sup.c 490.sup.e -- 5. As 1 + 500 FTU/kg ECP 321.sup.dc 731.sup.c 447.sup.f 0.125.sup.c 6. As 1 + 1,000 FTU/kg ECP 335.sup.cd 732.sup.c 559.sup.d 0.183.sup.d 7. As 1 + 1,500 FTU/kg ECP 344.sup.c 737.sup.c 616.sup.c 0.211.sup.c 8. As 1 + 500 FTU/kg 276.sup.g 691.sup.d 290.sup.h 0.037.sup.f Natuphos .RTM. Pooled SEM 6 10 12 0.005 .sup.aValues are means of five pens of four male chicks fed the experimental diets during the period 8 to 22 d post-hatching; average initial weight was 97 g. .sup.bThe linear regression of tibia ash (mg) for Diets 1 to 4 as a function of supplemental P intake (g) was Y = 232.0 .+-. 6.9 + 389.9 .+-. 16.7X (r.sup.2 = 0.97); Bioavailable P concentrations (equivalent P yields) for Diets 5 to 8 were determined by calculating equivalent bioavailable P intake (g) from the standard curve, dividing that by the feed intake (g) of the pen, and multiplying by 100. .sup.c,d,e,f,g,h,iMeans within a column with different superscripts are different, P < 0.05.
TABLE-US-00024 Combining 3- and 6-phytases does not produce synergistic effects on Pi-release in chicks fed a corn-soybean meal diet(Chick assay 4).sup.a. Weight Gain/feed, Tibia ash Bioavailable Diet gain, g g/kg % mg P, %.sup.b 1. Basal diet 137.sup.g 610.sup.g 25.4.sup.g 134.sup.h -- 2. As 1 + 0.05% P.sub.i (KH.sub.2PO.sub.4) 191.sup.ef 678.sup.dc 29.0.sup.f 198.sup.fg -- 3. As 1 + 0.10% P.sub.i (KH.sub.2PO.sub.4) 225.sup.d 712.sup.d 32.8.sup.e 253.sup.e -- 4. As 1 + 0.15% P.sub.i (KH.sub.2PO.sub.4) 276.sup.c 762.sup.c 36.3.sup.d 339.sup.d -- 5. As 1 + 500 FTU/kg Natuphos .RTM. 192.sup.ef 624.sup.fg 28.0.sup.f 187.sup.g 0.041.sup.g 6. As 1 + 500 FTU/kg Ronozyme .RTM. 182.sup.f 655.sup.cf 27.7.sup.f 188.sup.g 0.047.sup.fg 7. As 1 + 500 FTU/kg ECP 272.sup.c 760.sup.c 37.0.sup.d 343.sup.d 0.153.sup.d 8. As 5 + 6 211.sup.de 693.sup.de 28.3.sup.f 212.sup.fg 0.064.sup.ef 9. As 5 + 7 282.sup.c 763.sup.c 37.8.sup.d 360d 0.162.sup.d 10. As 1 + 1,000 FTU/kg Natuphos .RTM. 217.sup.d 703.sup.d 29.0.sup.f 217.sup.f 0.067.sup.c 11. As 1 + 1,000 FTU/kg Ronozyme .RTM. 201.sup.def 666.sup.ef 27.9.sup.f 194.sup.fg 0.050.sup.efg 12. As 1 + 1,000 FTU/kg ECP 292.sup.c 758.sup.c 41.1.sup.c 433.sup.c 0.206.sup.c Pooled SEM 9 15 0.6 10 0.007 .sup.aValues are means of five pens of four male chicks fed the experimental diets during the period 8 to 22 d post-hatching; average initial weight was 68 g. .sup.bThe linear regression of tibia ash (mg) for Diets 1 to 4 as a function of supplemental P intake (g) was Y = 138.6 .+-. 4.9 + 371.3 .+-. 14.7X (r.sup.2 = 0.97); Bioavailable P concentrations (equivalent P yields) for Diets 5 to 8 were determined by calculating equivalent bioavailable P intake (g) from the standard curve, dividing that by the feed intake (g) of the pen, and multiplying by 100. .sup.c,d,e,f,gMeans within a column with different superscripts are different, P < 0.05.
TABLE-US-00025 Effect of E. coli phytase on performance of laying hens from week 1-4..sup.a Egg Initial hen 4-wk hen Feed production, Egg Diet weight, g weight, g intake, g/d %.sup.b weight, g 1. P-deficient basal diet 1716 1593 90 54.0 61.0 2. As 1 + 0.10% Pi 1725 1748 122 84.8 64.2 3. As 1 + 150 FTU/kg ECP 1733 1771 119 83.7 63.8 4. As 1 + 300 FTU/kg ECP 1798 1806 119 82.3 65.4 5. As 1 + 10,000 FTU/kg ECP 1746 1770 123 85.9 65.1 Pooled SEM 26 .sup. 21.sup.c .sup. 2.sup.c 1.6.sup.c 0.7.sup.c .sup.aData are means of four replicates of 12 hens for the first 4 weeks of the study period. .sup.bEgg production (%) analyzed using covariance; data presented are least-squares means. .sup.cDiet 1 vs diets 2-5, P < 0.01.
TABLE-US-00026 Effect of E. coli phytase on performance of laying hens from week 5-12.sup.a. Feed Egg Egg 4-wk hen intake, production, weight, Diet weight, g g/d %.sup.b g 2. As 1 + 0.10% Pi 1830 120 80.5 64.0 3. As 1 + 150 FTU/kg 1796 118 80.6 64.1 ECP 4. As 1 + 300 FTU/kg 1833 116 77.2 65.5 ECP 5. As 1 + 10,000 FTU/kg 1830 120 81.2 64.8 ECP Pooled SEM 24 2 2.5 0.5.sup.c .sup.aData are means of four replicates of 12 hens for weeks 5 through 12 of the study period. Diet 1 was removed from study due to poor egg production. .sup.bEgg production (%) analyzed using covariance; data presented are least-squares means. .sup.cDiet 3 vs diets 4 and 5, P < 0.01.
TABLE-US-00027 Effect of E. coli phytase on performance of laying hens from week 1-12.sup.a. Egg Feed pro- in- duc- Egg Hen weights take, tion, weight, Diet Initial 4-wk 12-wk g/d %.sup.b g 1. P-deficient basal diet 1716 1593 -- 90 53.8 61.0 2. As 1 + 0.10% PI 1725 1748 1830 121 81.2 64.1 3. As 1 + 150 FTU/kg ECP 1733 1771 1796 118 80.7 64.1 4. As 1 + 300 FTU/kg ECP 1798 1806 1833 117 77.8 65.5 5. As 1 + 10,000 FTU/kg ECP 1746 1770 1830 121 82.9 64.8 Pooled SEM 26 21.sup.c 24 2.sup.c 2.1.sup.c 0.7.sup.c .sup.aData are means of four replicates of 12 hens. Data are means for the first 4 weeks for diet 1, but for all 12 weeks for diets 2-5. .sup.bEgg production (%) analyzed using covariance; data presented are least-squares means. .sup.cDiet 1 vs diets 2-5, P < 0.01.
TABLE-US-00028 Relative bioavailability of phosphorus in young pigs fed different phrase enzymes (Pig assay 1). Weight Gain/feed, Fibula ash Bioavailable Diet gain, g/d.sup.a g/kg.sup.a % mg P, %.sup.c 1. Basal diet 369.sup.f 533.sup.f 29.3.sup.g 666.sup.i -- 2. As 1 + 0.05% P.sub.i (KH.sub.2PO.sub.4) 435.sup.e 576.sup.ef 32.8.sup.f 766.sup.hi -- 3. As 1 + 0.10% P.sub.i (KH.sub.2PO.sub.4) 476.sup.de 618.sup.de 36.6.sup.d 972.sup.ef -- 4. As 1 + 0.15% P.sub.i (KH.sub.2PO.sub.4) 509.sup.d 660.sup.d 36.6.sup.d 1123.sup.d -- 5. As 1 + 400 FTU/kg Natuphos .RTM. 460.sup.c 605.sup.de 34.4.sup.def 889.sup.fg 0.081.sup.dc 6. As 1 + 400 FTU/kg Ronozyme .RTM. 445.sup.e 565.sup.ef 33.5.sup.ef .sup. 805.sup.gh 0.043.sup.f 7. As 1 + 400 FTU/kg ECP 443.sup.e 583.sup.ef 35.0.sup.def 968.sup.ef 0.108.sup.d Pooled SEM 17 21 0.8 38 0.016 .sup.aData are means of 10 individually-fed pigs over a 23-d feeding period; average initial weight was 8.4 kg. .sup.bData are means of five individually-fed pigs, chosen from the median-weight blocks at the end of the 23-d feeding period. .sup.cThe linear regression of fibula ash (mg) for Diets 1 to 4 as a function of supplemental P intake (g) was Y = 664.5 .+-. 25.5 + 15.3 .+-. 1.4X (r.sup.2 = 0.87); Bioavailable P concentrations (equivalent P yields) for Diets 5-7 were determined by calculating equivalent bioavailable P intake (g) from the standard curve, dividing that by the feed intake (g) of the pig, and multiplying by 100. .sup.d,e,f,g,h,iMeans within a column with different superscripts are different, P < 0.05.
TABLE-US-00029 Effect of E. coil phytase on growth performance of finishing pigs (Pig assay 2).sup.a. Dietary treatment As 1 + Response P-deficient As 1 + As 1 + 250 FTU/kg As 1 + 500 FTU/kg As 1 + 1,000 FTU/kg 10,000 FTU/kg Pooled variable basal diet 0.10% Pi ECP ECP ECP ECP SEM Daily gain, g.sup.b Barrows 935 1023 1023 929 993 974 Gilts 752 790 872 909 828 902 Mean 844 907 947 919 910 938 38 Daily feed, g.sup.c Barrows 2837 2861 3028 2712 2873 2684 Gilts 2347 2197 2571 2507 2378 2562 Mean 2592 2529 2800 2610 2625 2623 81 Gain/fed, g/kg.sup.d Barrows 331 358 338 343 346 365 Gilts 320 363 341 363 349 352 Mean 325 361 339 353 347 359 9 .sup.aData are means of five individually-fed pigs of each sex fed their experimental diets from 48.9 to 117.6 kg body weight. .sup.bSex x diet interaction. P < 0.10; Sex x Pi vs phytase-supplemented dies, P < 0.05. .sup.cBarrows vs gilts, P < 0.01. .sup.dP-deficient vs Pi- and phytase-supplemented diets, P < 0.01.
TABLE-US-00030 Effect of E. coil phytase on bone characteristics of finishing pigs (Pig assay 2).sup.a. Dietary treatment As 1 + P-deficient As 1 + As 1 + 250 FTU/kg As 1 + 500 FTU/kg As 1 + 1,000 FTU/kg 10,000 FTU/kg Pooled Response variable basal diet 0.10% Pi ECP ECP ECP ECP SEM Fibula ash, % g.sup.b Barrows 52.9 58.8 57.8 58.9 58.5 58.5 Gilts 52.4 59.2 58.9 55.8 58.3 58.8 Mean 52.6 59.0 58.3 57.3 58.4 58.7 0.7 Fibula ash, g.sup.bcdef Barrows 4.57 6.30 5.69 6.56 6.37 7.04 Gilts 4.19 6.06 5.90 5.99 6.24 6.86 Mean 4.38 6.18 5.80 6.28 6.31 6.95 0.17 Metatarsal ash, %.sup.b Barrows 40.3 46.9 48.8 47.5 47.3 47.6 Gilts 43.1 48.5 48.3 45.4 49.0 49.0 Mean 41.7 47.7 48.5 46.5 48.1 48.3 1.1 Metatarsal ash, g.sup.bd Barrows 5.4 6.6 6.8 7.0 7.2 7.4 Gilts 4.9 6.6 6.5 7.0 6.8 7.3 Mean 5.1 6.6 6.6 7.0 7.0 7.3 0.2 .sup.aData are means of five individually-fed pigs of each sex fed their experimental diets from 48.9 to 117.6 kg body weight. .sup.bP-deficient vs Pi- and phytase-supplemented diets, P < 0.01. .sup.cBarrows vs gilts, P < 0.10. .sup.d250 U/kg vs higher phytase activity levels, P < 0.01. .sup.e500 U/kg vs 1,000 and 10,000 U/kg phytase, P < 0.10. .sup.f1,000 U/kg vs 10,000 U/kg phytase, P < 0.01.
Sequence CWU 1
1
1211489DNAEscherichia
coliprimer_bind(1)..(22)CDS(16)..(108)CDS(182)..(1480)primer_bind(1468)..-
(1486) 1taaggagcag aaaca atg tgg tat ttc ctt tgg ttc gtc ggc att
ttg ttg 51 Met Trp Tyr Phe Leu Trp Phe Val Gly Ile Leu Leu 1 5
10atg tgt tcg ctc tcc acc ctt gtg ttg gta tgg ctg gac ccg cga ttg
99Met Cys Ser Leu Ser Thr Leu Val Leu Val Trp Leu Asp Pro Arg Leu
15 20 25aaa agt taa cgaacgtaag cctgatccgg cgcattagcg tcgatcaggc
148Lys Ser 30aataatatcg gatatcaaag cggaaacata tcg atg aaa gcg atc
tta atc cca 202 Met Lys Ala Ile Leu Ile Pro 35ttt tta tct ctt ttg
att ccg tta acc ccg caa tct gca ttc gct cag 250Phe Leu Ser Leu Leu
Ile Pro Leu Thr Pro Gln Ser Ala Phe Ala Gln 40 45 50agt gag ccg gag
ctg aag ctg gaa agt gtg gtg att gtc agc cgt cat 298Ser Glu Pro Glu
Leu Lys Leu Glu Ser Val Val Ile Val Ser Arg His 55 60 65ggt gtg cgt
gcc cca acc aag gcc acg caa ctg atg cag gat gtc acc 346Gly Val Arg
Ala Pro Thr Lys Ala Thr Gln Leu Met Gln Asp Val Thr70 75 80 85cca
gac gca tgg cca acc tgg ccg gta aaa ctg ggt tgg ctg aca cca 394Pro
Asp Ala Trp Pro Thr Trp Pro Val Lys Leu Gly Trp Leu Thr Pro 90 95
100cgc ggt ggt gag cta atc gcc tat ctc gga cat tac caa cgc cag cgt
442Arg Gly Gly Glu Leu Ile Ala Tyr Leu Gly His Tyr Gln Arg Gln Arg
105 110 115ctg gtg gcc gac gga ttg ctg gcg aaa aag ggc tgc ccg cag
cct ggt 490Leu Val Ala Asp Gly Leu Leu Ala Lys Lys Gly Cys Pro Gln
Pro Gly 120 125 130cag gtc gcg att att gct gat gtc gac gag cgt acc
cgt aaa aca ggc 538Gln Val Ala Ile Ile Ala Asp Val Asp Glu Arg Thr
Arg Lys Thr Gly 135 140 145gaa gcc ttc gcc gcc ggg ctg gca cct gac
tgt gca ata acc gta cat 586Glu Ala Phe Ala Ala Gly Leu Ala Pro Asp
Cys Ala Ile Thr Val His150 155 160 165acc cag gca gat acg tcc agt
ccc gat ccg tta ttt aat cct cta aaa 634Thr Gln Ala Asp Thr Ser Ser
Pro Asp Pro Leu Phe Asn Pro Leu Lys 170 175 180act ggc gtt tgc caa
ctg gat aac gcg aac gtg act gac gcg atc ctc 682Thr Gly Val Cys Gln
Leu Asp Asn Ala Asn Val Thr Asp Ala Ile Leu 185 190 195agc agg gca
gga ggg tca att gct gac ttt acc ggg cat cgg caa acg 730Ser Arg Ala
Gly Gly Ser Ile Ala Asp Phe Thr Gly His Arg Gln Thr 200 205 210gcg
ttt cgc gaa ctg gaa cgg gtg ctt aat ttt tcc caa tta aac ttg 778Ala
Phe Arg Glu Leu Glu Arg Val Leu Asn Phe Ser Gln Leu Asn Leu 215 220
225tgc ctt aac cgt gag aaa cag gac gaa agc tgt tca tta acg cag gca
826Cys Leu Asn Arg Glu Lys Gln Asp Glu Ser Cys Ser Leu Thr Gln
Ala230 235 240 245tta cca tcg gaa ctc aag gtg agc gcc gac aat gtt
tca tta acc ggt 874Leu Pro Ser Glu Leu Lys Val Ser Ala Asp Asn Val
Ser Leu Thr Gly 250 255 260gcg gta agc ctc gca tca atg ctg acg gaa
ata ttt ctc ctg caa caa 922Ala Val Ser Leu Ala Ser Met Leu Thr Glu
Ile Phe Leu Leu Gln Gln 265 270 275gca cag gga atg ccg gag ccg ggg
tgg gga agg atc act gat tca cac 970Ala Gln Gly Met Pro Glu Pro Gly
Trp Gly Arg Ile Thr Asp Ser His 280 285 290cag tgg aac acc ttg cta
agt ttg cat aac gcg caa ttt tat tta cta 1018Gln Trp Asn Thr Leu Leu
Ser Leu His Asn Ala Gln Phe Tyr Leu Leu 295 300 305caa cgc acg cca
gag gtt gcc cgc agt cgc gcc acc ccg tta ttg gat 1066Gln Arg Thr Pro
Glu Val Ala Arg Ser Arg Ala Thr Pro Leu Leu Asp310 315 320 325ttg
atc atg gca gcg ttg acg ccc cat cca ccg caa aaa cag gcg tat 1114Leu
Ile Met Ala Ala Leu Thr Pro His Pro Pro Gln Lys Gln Ala Tyr 330 335
340ggt gtg aca tta ccc act tca gtg ctg ttt att gcc gga cac gat act
1162Gly Val Thr Leu Pro Thr Ser Val Leu Phe Ile Ala Gly His Asp Thr
345 350 355aat ctg gca aat ctc ggc ggc gca ctg gag ctc aac tgg acg
ctt cca 1210Asn Leu Ala Asn Leu Gly Gly Ala Leu Glu Leu Asn Trp Thr
Leu Pro 360 365 370ggt cag ccg gat aac acg ccg cca ggt ggt gaa ctg
gtg ttt gaa cgc 1258Gly Gln Pro Asp Asn Thr Pro Pro Gly Gly Glu Leu
Val Phe Glu Arg 375 380 385tgg cgt cgg cta agc gat aac agc cag tgg
att cag gtt tcg ctg gtc 1306Trp Arg Arg Leu Ser Asp Asn Ser Gln Trp
Ile Gln Val Ser Leu Val390 395 400 405ttc cag act tta cag cag atg
cgt gat aaa acg ccg cta tca tta aat 1354Phe Gln Thr Leu Gln Gln Met
Arg Asp Lys Thr Pro Leu Ser Leu Asn 410 415 420acg ccg ccc gga gag
gtg aaa ctg acc ctg gca gga tgt gaa gag cga 1402Thr Pro Pro Gly Glu
Val Lys Leu Thr Leu Ala Gly Cys Glu Glu Arg 425 430 435aat gcg cag
ggc atg tgt tcg ttg gcc ggt ttt acg caa atc gtg aat 1450Asn Ala Gln
Gly Met Cys Ser Leu Ala Gly Phe Thr Gln Ile Val Asn 440 445 450gaa
gcg cgc ata ccg gcg tgc agt ttg taa tggtacccc 1489Glu Ala Arg Ile
Pro Ala Cys Ser Leu 455 460230PRTEscherichia coli 2Met Trp Tyr Phe
Leu Trp Phe Val Gly Ile Leu Leu Met Cys Ser Leu1 5 10 15Ser Thr Leu
Val Leu Val Trp Leu Asp Pro Arg Leu Lys Ser 20 25
303432PRTEscherichia coli 3Met Lys Ala Ile Leu Ile Pro Phe Leu Ser
Leu Leu Ile Pro Leu Thr1 5 10 15Pro Gln Ser Ala Phe Ala Gln Ser Glu
Pro Glu Leu Lys Leu Glu Ser 20 25 30Val Val Ile Val Ser Arg His Gly
Val Arg Ala Pro Thr Lys Ala Thr 35 40 45Gln Leu Met Gln Asp Val Thr
Pro Asp Ala Trp Pro Thr Trp Pro Val 50 55 60Lys Leu Gly Trp Leu Thr
Pro Arg Gly Gly Glu Leu Ile Ala Tyr Leu65 70 75 80Gly His Tyr Gln
Arg Gln Arg Leu Val Ala Asp Gly Leu Leu Ala Lys 85 90 95Lys Gly Cys
Pro Gln Pro Gly Gln Val Ala Ile Ile Ala Asp Val Asp 100 105 110Glu
Arg Thr Arg Lys Thr Gly Glu Ala Phe Ala Ala Gly Leu Ala Pro 115 120
125Asp Cys Ala Ile Thr Val His Thr Gln Ala Asp Thr Ser Ser Pro Asp
130 135 140Pro Leu Phe Asn Pro Leu Lys Thr Gly Val Cys Gln Leu Asp
Asn Ala145 150 155 160Asn Val Thr Asp Ala Ile Leu Ser Arg Ala Gly
Gly Ser Ile Ala Asp 165 170 175Phe Thr Gly His Arg Gln Thr Ala Phe
Arg Glu Leu Glu Arg Val Leu 180 185 190Asn Phe Ser Gln Leu Asn Leu
Cys Leu Asn Arg Glu Lys Gln Asp Glu 195 200 205Ser Cys Ser Leu Thr
Gln Ala Leu Pro Ser Glu Leu Lys Val Ser Ala 210 215 220Asp Asn Val
Ser Leu Thr Gly Ala Val Ser Leu Ala Ser Met Leu Thr225 230 235
240Glu Ile Phe Leu Leu Gln Gln Ala Gln Gly Met Pro Glu Pro Gly Trp
245 250 255Gly Arg Ile Thr Asp Ser His Gln Trp Asn Thr Leu Leu Ser
Leu His 260 265 270Asn Ala Gln Phe Tyr Leu Leu Gln Arg Thr Pro Glu
Val Ala Arg Ser 275 280 285Arg Ala Thr Pro Leu Leu Asp Leu Ile Met
Ala Ala Leu Thr Pro His 290 295 300Pro Pro Gln Lys Gln Ala Tyr Gly
Val Thr Leu Pro Thr Ser Val Leu305 310 315 320Phe Ile Ala Gly His
Asp Thr Asn Leu Ala Asn Leu Gly Gly Ala Leu 325 330 335Glu Leu Asn
Trp Thr Leu Pro Gly Gln Pro Asp Asn Thr Pro Pro Gly 340 345 350Gly
Glu Leu Val Phe Glu Arg Trp Arg Arg Leu Ser Asp Asn Ser Gln 355 360
365Trp Ile Gln Val Ser Leu Val Phe Gln Thr Leu Gln Gln Met Arg Asp
370 375 380Lys Thr Pro Leu Ser Leu Asn Thr Pro Pro Gly Glu Val Lys
Leu Thr385 390 395 400Leu Ala Gly Cys Glu Glu Arg Asn Ala Gln Gly
Met Cys Ser Leu Ala 405 410 415Gly Phe Thr Gln Ile Val Asn Glu Ala
Arg Ile Pro Ala Cys Ser Leu 420 425 43041486DNAEscherichia
coliCDS(188)..(1483) 4taaggagcag aaacaatgtg gtatttactt tggttcgtcg
gcattttgtt gatgtgttcg 60ctctccaccc ttgtgttggt atggctggac ccgcgattga
aaagttaacg aacgtaggcc 120tgatgcggcg cattagcatc gcatcaggca
atcaataatg tcagatatga aaagcggaaa 180catatcg atg aaa gcg atc tta atc
cca ttt tta tct ctt ctg att ccg 229tta acc ccg caa tct gca ttc gct
cag agt gag ccg gag ctg aag ctg 277gaa agt gtg gtg att gtc agc cgt
cat ggt gtg cgt gcc cca acc aag 325gcc acg caa ctg atg cag gat gtc
acc cca gac gca tgg cca acc tgg 373ccg gta aaa ctg ggt tgg ctg aca
cca cgc ggt ggt gag cta atc gcc 421tat ctc gga cat tac caa cgc cag
cgt ctg gtg gcc gac gga ttg ctg 469gcg aaa aag ggc tgc ccg cag cct
ggt cag gtc gcg att att gtc gat 517gtc gac gag cgt acc cgt aaa aca
ggc gaa gcc ttc gcc gcc ggg ctg 565gca cct gac tgt gca ata acc gta
cat acc cag gca gat acg tcc agt 613ccc gat ccg tta ttt att cct cta
aaa act ggc gtt tgc caa ctg gat 661aac gcg aac gtg act gac gcg atc
ctc agc agg gca gga ggg tca att 709gct gac ttt acc ggg cat cgg caa
acg gcg ttt cgc gaa ctg gaa cgg 757gtg ctt aat ttt ccg caa tca aac
ttg aac ctt aaa cgt gag aaa cag 805aat gaa agc tgt aac tta acg cag
gca tta cca tcg gaa ctc aag gtg 853agc gcc gac aat gtt tca tta acc
ggt gcg gta agc ctc gca tca atg 901ctg acg gaa ata ttt ctc ctg caa
caa gca cag gga atg ccg gag ccg 949ggg tgg gga agg atc act gat tca
cac cag tgg aac acc ttg cta agt 997ttg cat aac gcg caa ttt tat tta
cta caa cgc acg cca gag gtt gcc 1045cgc agt cgc gcc acc ccg tta ttg
gat ttg atc aag aca gcg ttg acg 1093ccc cat cca ccg caa aaa cag gcg
tat ggt gtg aca tta ccc act tca 1141gtg ctg ttt att gcc gga cac gat
act aat ctg gca aat ctc ggc ggc 1189gca ctg gag ctc aac tgg acg ctt
cca ggt cag ccg gat aac acg ccg 1237cca ggt ggt gaa ctg gtg ttt gaa
cgc tgg cgt cgg cta agc gat aac 1285agc cag tgg att cag gtt tcg ctg
gtc ttc cag act tta cag cag atg 1333cgt gat aaa acg ccg cta tca tta
aat acg ccg ccc gga gag gtg aaa 1381ctg acc ctg gca gga tgt gaa gag
cga aat gcg cag ggc atg tgt tcg 1429ttg gcc ggt ttt acg caa atc gtg
aat gaa gcg cgc ata ccg gcg tgc 1477agt ttg taa
14865432PRTEscherichia coli 5Met Lys Ala Ile Leu Ile Pro Phe Leu
Ser Leu Leu Ile Pro Leu Thr1 5 10 15Pro Gln Ser Ala Phe Ala Gln Ser
Glu Pro Glu Leu Lys Leu Glu Ser 20 25 30Val Val Ile Val Ser Arg His
Gly Val Arg Ala Pro Thr Lys Ala Thr 35 40 45Gln Leu Met Gln Asp Val
Thr Pro Asp Ala Trp Pro Thr Trp Pro Val 50 55 60Lys Leu Gly Trp Leu
Thr Pro Arg Gly Gly Glu Leu Ile Ala Tyr Leu65 70 75 80Gly His Tyr
Gln Arg Gln Arg Leu Val Ala Asp Gly Leu Leu Ala Lys 85 90 95Lys Gly
Cys Pro Gln Pro Gly Gln Val Ala Ile Ile Ala Asp Val Asp 100 105
110Glu Arg Thr Arg Lys Thr Gly Glu Ala Phe Ala Ala Gly Leu Ala Pro
115 120 125Asp Cys Ala Ile Thr Val His Thr Gln Ala Asp Thr Ser Ser
Pro Asp 130 135 140Pro Leu Phe Asn Pro Leu Lys Thr Gly Val Cys Gln
Leu Asp Asn Ala145 150 155 160Asn Val Thr Asp Ala Ile Leu Ser Arg
Ala Gly Gly Ser Ile Ala Asp 165 170 175Phe Thr Gly His Arg Gln Thr
Ala Phe Arg Glu Leu Glu Arg Val Leu 180 185 190Asn Phe Pro Gln Ser
Asn Leu Asn Leu Lys Arg Glu Lys Gln Asn Glu 195 200 205Ser Cys Asn
Leu Thr Gln Ala Leu Pro Ser Glu Leu Lys Val Ser Ala 210 215 220Asp
Asn Val Ser Leu Thr Gly Ala Val Ser Leu Ala Ser Met Leu Thr225 230
235 240Glu Ile Phe Leu Leu Gln Gln Ala Gln Gly Met Pro Glu Pro Gly
Trp 245 250 255Gly Arg Ile Thr Asp Ser His Gln Trp Asn Thr Leu Leu
Ser Leu His 260 265 270Asn Ala Gln Phe Tyr Leu Leu Gln Arg Thr Pro
Glu Val Ala Arg Ser 275 280 285Arg Ala Thr Pro Leu Leu Asp Leu Ile
Lys Thr Ala Leu Thr Pro His 290 295 300Pro Pro Gln Lys Gln Ala Tyr
Gly Val Thr Leu Pro Thr Ser Val Leu305 310 315 320Phe Ile Ala Gly
His Asp Thr Asn Leu Ala Asn Leu Gly Gly Ala Leu 325 330 335Glu Leu
Asn Trp Thr Leu Pro Gly Gln Pro Asp Asn Thr Pro Pro Gly 340 345
350Gly Glu Leu Val Phe Glu Arg Trp Arg Arg Leu Ser Asp Asn Ser Gln
355 360 365Trp Ile Gln Val Ser Leu Val Phe Gln Thr Leu Gln Gln Met
Arg Asp 370 375 380Lys Thr Pro Leu Ser Leu Asn Thr Pro Pro Gly Glu
Val Lys Leu Thr385 390 395 400Leu Ala Gly Cys Glu Glu Arg Asn Ala
Gln Gly Met Cys Ser Leu Ala 405 410 415Gly Phe Thr Gln Ile Val Asn
Glu Ala Arg Ile Pro Ala Cys Ser Leu 420 425 430680DNAArtificial
SequencePrimer for amplifying appA gene 6ggggtaccat gggcgtctct
gctgttctac ttcctttgta tctcctgtct ggagtcacct 60ccggacagag tgagccggag
80724DNAArtificial SequencePrimer for amplifying appA gene.
7gggaattcat tacaaactgc aggc 24821DNAArtificial SequencePrimer for
amplifying appA gene. 8ggaattccag agtgagccgg a 21922DNAArtificial
SequencePrimer for amplifying appA gene. 9ggggtacctt acaaactgca cg
221031DNAArtificial SequencePrimer for amplifying appA mutagenesis
PCR amplification. 10ctgggtatgg ttggttatat tacagtcagg t
311123DNAArtificial SequencePrimer for amplifying appA mutagenesis
PCR amplification. 11caaacttgaa ccttaaacgt gag 231231DNAArtificial
SequencePrimer for amplifying appA mutagenesis PCR amplification.
12cctgcgttaa gttacagctt tcattctgtt t 31
D00001
D00002
D00003
D00004
D00005
D00006
S00001
XML
uspto.report is an independent third-party trademark research tool that is not affiliated, endorsed, or sponsored by the United States Patent and Trademark Office (USPTO) or any other governmental organization. The information provided by uspto.report is based on publicly available data at the time of writing and is intended for informational purposes only.
While we strive to provide accurate and up-to-date information, we do not guarantee the accuracy, completeness, reliability, or suitability of the information displayed on this site. The use of this site is at your own risk. Any reliance you place on such information is therefore strictly at your own risk.
All official trademark data, including owner information, should be verified by visiting the official USPTO website at www.uspto.gov. This site is not intended to replace professional legal advice and should not be used as a substitute for consulting with a legal professional who is knowledgeable about trademark law.