Methods and systems for inferring intent and utilizing context for natural language expressions to modify data visualizations in a data visualization interface
Tory , et al. April 26, 2
U.S. patent number 11,314,817 [Application Number 16/575,354] was granted by the patent office on 2022-04-26 for methods and systems for inferring intent and utilizing context for natural language expressions to modify data visualizations in a data visualization interface. This patent grant is currently assigned to TABLEAU SOFTWARE, LLC. The grantee listed for this patent is Tableau Software, LLC.. Invention is credited to Alex Djalali, Vidya Raghavan Setlur, Melanie K. Tory.


View All Diagrams
| United States Patent | 11,314,817 |
| Tory , et al. | April 26, 2022 |
Methods and systems for inferring intent and utilizing context for natural language expressions to modify data visualizations in a data visualization interface
Abstract
A method modifies data visualizations based on user selected data sources and user input that specifies natural language commands requesting information from the data sources. The computer displays an initial data visualization according to a visual specification that specifies a plurality of visual variables. The computer determines one or more keywords from the natural language command and determines, based on the one or more keywords, a user intent to modify the data visualization. The computer modifies the plurality of visual variables based on the first user intent and displays a modified data visualization in accordance with the modified plurality of visual variables.
| Inventors: | Tory; Melanie K. (Palo Alto, CA), Setlur; Vidya Raghavan (Portola Valley, CA), Djalali; Alex (Athens, GA) | ||||||||||
|---|---|---|---|---|---|---|---|---|---|---|---|
| Applicant: |
|
||||||||||
| Assignee: | TABLEAU SOFTWARE, LLC (Seattle,
WA) |
||||||||||
| Family ID: | 1000004473467 | ||||||||||
| Appl. No.: | 16/575,354 | ||||||||||
| Filed: | September 18, 2019 |
Related U.S. Patent Documents
| Application Number | Filing Date | Patent Number | Issue Date | ||
|---|---|---|---|---|---|
| 62827768 | Apr 1, 2019 | ||||
| Current U.S. Class: | 1/1 |
| Current CPC Class: | G06T 11/206 (20130101); G06F 16/904 (20190101); G06F 16/90332 (20190101); G06F 3/167 (20130101); G06F 3/04847 (20130101) |
| Current International Class: | G06F 17/00 (20190101); G06F 16/904 (20190101); G06F 16/9032 (20190101); G06F 3/04847 (20220101); G06T 11/20 (20060101); G06F 3/16 (20060101) |
References Cited [Referenced By]
U.S. Patent Documents
| 4800810 | January 1989 | Masumoto |
| 5036314 | July 1991 | Barillari et al. |
| 5060980 | October 1991 | Johnson et al. |
| 5144452 | September 1992 | Abuyama |
| 5169713 | December 1992 | Kumurdjian |
| 5265244 | November 1993 | Ghosh et al. |
| 5265246 | November 1993 | Li et al. |
| 5377348 | December 1994 | Lau et al. |
| 5383029 | January 1995 | Kojima |
| 5560007 | September 1996 | Thai |
| 5577241 | November 1996 | Spencer |
| 5581677 | December 1996 | Myers et al. |
| 5664172 | September 1997 | Antoshenkov |
| 5664182 | September 1997 | Nierenberg et al. |
| 5668987 | September 1997 | Schneider |
| 5794246 | August 1998 | Sankaran et al. |
| 5864856 | January 1999 | Young |
| 5893088 | April 1999 | Hendricks et al. |
| 5913205 | June 1999 | Jain et al. |
| 5933830 | August 1999 | Williams |
| 6031632 | February 2000 | Yoshihara et al. |
| 6032158 | February 2000 | Mukhopadhyay et al. |
| 6044374 | March 2000 | Nesamoney et al. |
| 6100901 | August 2000 | Mohda et al. |
| 6115744 | September 2000 | Robins et al. |
| 6154766 | November 2000 | Yost et al. |
| 6173310 | January 2001 | Yost et al. |
| 6188403 | February 2001 | Sacerdoti et al. |
| 6208990 | March 2001 | Suresh et al. |
| 6222540 | April 2001 | Sacerdoti et al. |
| 6247008 | June 2001 | Cambot et al. |
| 6253257 | June 2001 | Dundon |
| 6260050 | July 2001 | Yost et al. |
| 6269393 | July 2001 | Yost et al. |
| 6300957 | October 2001 | Rao et al. |
| 6301579 | October 2001 | Becker |
| 6317750 | November 2001 | Tortolani et al. |
| 6327628 | December 2001 | Anuff et al. |
| 6339775 | January 2002 | Zamanian et al. |
| 6377259 | April 2002 | Tenev et al. |
| 6397195 | May 2002 | Pinard et al. |
| 6400366 | June 2002 | Davies et al. |
| 6405195 | June 2002 | Ahlberg |
| 6405208 | June 2002 | Raghavan et al. |
| 6424933 | July 2002 | Agrawala et al. |
| 6490593 | December 2002 | Proctor |
| 6492989 | December 2002 | Wilkinson |
| 6522342 | February 2003 | Gagnon et al. |
| 6611825 | August 2003 | Billheimer et al. |
| 6643646 | November 2003 | Su et al. |
| 6707454 | March 2004 | Barg et al. |
| 6714897 | March 2004 | Whitney et al. |
| 6725230 | April 2004 | Ruth et al. |
| 6750864 | June 2004 | Anwar |
| 6768986 | July 2004 | Cras et al. |
| 6906717 | June 2005 | Couckuyt et al. |
| 7009609 | March 2006 | Miyadai |
| 7023453 | April 2006 | Wilkinson |
| 7089266 | August 2006 | Stolte et al. |
| 7117058 | October 2006 | Lin et al. |
| 7176924 | February 2007 | Wilkinson |
| 7290007 | October 2007 | Farber et al. |
| 7302383 | November 2007 | Valles |
| 7315305 | January 2008 | Crotty et al. |
| 7379601 | May 2008 | Yang et al. |
| 7426520 | September 2008 | Gorelik et al. |
| 7603267 | October 2009 | Wang et al. |
| 7716173 | May 2010 | Stolte et al. |
| 7882144 | February 2011 | Stolte et al. |
| 8082243 | December 2011 | Gorelik et al. |
| 8140586 | March 2012 | Stolte et al. |
| 8442999 | May 2013 | Gorelik et al. |
| 8473521 | June 2013 | Fot et al. |
| 8620937 | December 2013 | Jonas |
| 8713072 | April 2014 | Stotle et al. |
| 8751505 | June 2014 | Carmel et al. |
| 8874613 | October 2014 | Gorelik et al. |
| 8972457 | March 2015 | Stolte et al. |
| 9183235 | November 2015 | Stolte et al. |
| 9299173 | March 2016 | Rope et al. |
| 9336253 | May 2016 | Gorelik et al. |
| 9501585 | November 2016 | Gautam et al. |
| 9633091 | April 2017 | Stolte et al. |
| 9665662 | May 2017 | Gautam et al. |
| 9818211 | November 2017 | Gibb et al. |
| 9858292 | January 2018 | Setlur et al. |
| 9947314 | April 2018 | Cao et al. |
| 9983849 | May 2018 | Weingartner |
| 10042517 | August 2018 | Stolte et al. |
| 10042901 | August 2018 | Stolte et al. |
| 10331720 | June 2019 | Neels et al. |
| 10418032 | September 2019 | Mohajer et al. |
| 10515121 | December 2019 | Setlur et al. |
| 10546001 | January 2020 | Nguyen et al. |
| 10546003 | January 2020 | Gupta et al. |
| 10564622 | February 2020 | Dean et al. |
| 10817527 | October 2020 | Setlur et al. |
| 10956655 | March 2021 | Choe |
| 11080336 | August 2021 | van Dusen |
| 11114189 | September 2021 | Prosky et al. |
| 2001/0013036 | August 2001 | Judicibus |
| 2002/0002325 | January 2002 | Lliff |
| 2002/0059204 | May 2002 | Harris |
| 2002/0118192 | August 2002 | Couckuyt et al. |
| 2002/0123865 | September 2002 | Whitney et al. |
| 2002/0135610 | September 2002 | Ootani et al. |
| 2002/0154118 | October 2002 | McCarthy et al. |
| 2003/0200034 | October 2003 | Fellenberg et al. |
| 2004/0148170 | July 2004 | Acero et al. |
| 2004/0183800 | September 2004 | Peterson |
| 2004/0227759 | November 2004 | McKnight et al. |
| 2004/0243593 | December 2004 | Stolte et al. |
| 2005/0035966 | February 2005 | Pasquarette et al. |
| 2005/0035967 | February 2005 | Joffrain et al. |
| 2005/0060300 | March 2005 | Stolte et al. |
| 2005/0099423 | May 2005 | Brauss |
| 2006/0129913 | June 2006 | Vigesaa et al. |
| 2006/0136825 | June 2006 | Cory et al. |
| 2006/0206512 | September 2006 | Hanrahan et al. |
| 2007/0061344 | March 2007 | Dickerman et al. |
| 2007/0061611 | March 2007 | MacKinlay et al. |
| 2007/0126736 | June 2007 | Tolle |
| 2007/0129936 | June 2007 | Wang et al. |
| 2008/0016026 | January 2008 | Farber et al. |
| 2009/0313576 | December 2009 | Neumann et al. |
| 2011/0112837 | May 2011 | Kurki-Sounio et al. |
| 2011/0119047 | May 2011 | Ylonen |
| 2011/0184718 | July 2011 | Chen |
| 2012/0323948 | December 2012 | Li et al. |
| 2013/0249917 | September 2013 | Fanning et al. |
| 2014/0164362 | June 2014 | Syed et al. |
| 2014/0236579 | August 2014 | Kurz |
| 2016/0078354 | March 2016 | Petri et al. |
| 2016/0092090 | March 2016 | Stojanovic et al. |
| 2016/0171050 | June 2016 | Das |
| 2016/0179908 | June 2016 | Johnston et al. |
| 2017/0011023 | January 2017 | Ghannam et al. |
| 2017/0091277 | March 2017 | Zoch |
| 2017/0091902 | March 2017 | Bostik et al. |
| 2017/0118308 | April 2017 | Vigeant |
| 2017/0154089 | June 2017 | Sherman |
| 2017/0308571 | October 2017 | McCurley |
| 2018/0032576 | February 2018 | Romero |
| 2018/0039614 | February 2018 | Govindarajulu et al. |
| 2018/0144065 | May 2018 | Yellai |
| 2018/0158245 | June 2018 | Govindan |
| 2018/0203924 | July 2018 | Agrawal et al. |
| 2018/0210883 | July 2018 | Ang |
| 2018/0329987 | November 2018 | Tata et al. |
| 2019/0042634 | February 2019 | Stolte et al. |
| 2019/0102390 | April 2019 | Antunes et al. |
| 2019/0108171 | April 2019 | Stolte et al. |
| 2019/0115016 | April 2019 | Seok et al. |
| 2019/0120649 | April 2019 | Seok et al. |
| 2019/0121801 | April 2019 | Jethwa et al. |
| 2019/0138648 | May 2019 | Gupta et al. |
| 2019/0163807 | May 2019 | Jain et al. |
| 2019/0179607 | June 2019 | Thangarathnam et al. |
| 2019/0197605 | June 2019 | Sadler et al. |
| 2019/0236144 | August 2019 | Hou et al. |
| 2019/0272296 | September 2019 | Prakash et al. |
| 2019/0311717 | October 2019 | Kim et al. |
| 2019/0349321 | November 2019 | Cai et al. |
| 2019/0384815 | December 2019 | Patel et al. |
| 2020/0065385 | February 2020 | Dreher et al. |
| 2020/0089700 | March 2020 | Ericson et al. |
| 2020/0089760 | March 2020 | Ericson et al. |
| 2020/0090189 | March 2020 | Tutuk et al. |
| 2020/0104402 | April 2020 | Burnett et al. |
| 2020/0110803 | April 2020 | Djalali et al. |
| 2020/0134103 | April 2020 | Mankovskii |
| 2020/0327432 | October 2020 | Doebelin et al. |
| 215657 | Jan 1994 | HU | |||
| WO 2006/060773 | Jun 2006 | WO | |||
Other References
|
Becker, Trellis Graphics Displays: A Multi-dimensional Data Visualization Tool for Data Mining, Aug. 1997, 13 pgs. cited by applicant . Becker, Visualizing Decision Table Classifiers, 1998, 4 pgs. cited by applicant . Beers, Office Action, U.S. Appl. No. 11/787,761, dated Jun. 12, 2008, 12 pgs. cited by applicant . Beers, Office Action, U.S. Appl. No. 11/787,761, dated Dec. 17, 2008, 13 pgs. cited by applicant . Bosch, Performance Analysis and Visualization of Parallel Systems Using SimOS and Rivet: A Case Study , Jan. 2000, 13 pgs. cited by applicant . Bosch, Rivet: A Flexible Environment for Computer Systems Visualization, Feb. 2000, 9 pgs. cited by applicant . Brunk, MineSet: An Integrated System for Data Mining, 1997, 4 pgs. cited by applicant . Derthick, An Interactive Visual Query Environment for Exploring Data, 1997, 11 pgs. cited by applicant . Freeze, Unlocking OLAP with Microsoft SQL Server and Excel 2000, 2000, 220 pgs. cited by applicant . Fua, "Hierarchical Parallel Coordinates for Exploration of Large Datasets," IEEE 1999, pp. 43-50 (Year: 1999). cited by applicant . Eser Kandogan, "Star Coordinates: A Multi-dimensional Visualization Technique with Uniform Treatment of Dimensions," www.citeseerx.st.psu.edu, pp. 1-4, 2000 (YearL 2000). cited by applicant . Fua, Navigating Hierarchies with Structure-Based Brushes, 1999, 7 pgs. cited by applicant . Gao, Tong, et al. "Datatone: Managing ambiguity in natural language interfaces for data visualization." Proceedings of the 28th Annual ACM Symposium on User Interface Software & Technology. Nov. 2015, pp. 489-500. (Year: 2015). cited by applicant . Goldstein, A Framework for Knowledge-Based Interactive Data Exploration, Dec. 1994, 30 pgs. cited by applicant . Gray, Data Cube: A Relational Aggregation Operator Generalizing Group-By, 1997, 24 pgs. cited by applicant . Hanrahan, Office Action, U.S. Appl. No. 11/005,652, dated Feb. 20, 2009, 11 pgs. cited by applicant . Hanrahan, Office Action, U.S. Appl. No. 11/005,652, dated Jul. 24, 2008, 11 pgs. cited by applicant . Hanrahan, Office Action, U.S. Appl. No. 11/005,652, dated Dec. 27, 2007, 11 pgs. cited by applicant . Hanrahan, Specification, U.S. Appl. No. 11/005,652, dated Dec. 2, 2004, 104 pgs. cited by applicant . Healey, On the Use of Perceptual Cues and Data Mining for Effective Visualization of Scientific Datasets, 1998, 8 pgs. cited by applicant . Hearst, Office Action, U.S. Appl. No. 16/601,413, dated Nov. 3, 2020, 17 pgs. cited by applicant . HU Search Report, HU P0700460, dated Oct. 9, 2007, 1 pg. cited by applicant . John V. Carlis and Joseph A. Konstan, Interactive Visulaization of Serial Periodic Data, www. Courses.ischool.berkeley.edu, pp. 1-10, 1998 (Year: 1998). cited by applicant . Joseph, Office Action, U.S. Appl. No. 13/734,694, dated Aug. 18, 2014, 46 pgs. cited by applicant . Keim, VisDB: Datatbase Exploration Using Multidimensional Visualization, Aug. 1994, 27 pgs. cited by applicant . Kohavi, Data Mining and Visualization, 2000, 8 pgs. cited by applicant . Livney, M. et al., "DEVise: Integraed Querying and Visual Exploration of Large Datasets," ACM, 1997, pp. 301-312, (Year: 1997). cited by applicant . MacDonald, Creating Basic Charts, 2006, 46 pgs. cited by applicant . MacKinlay, Automating the Design of Graphical Presentations of Relational Information, 1986, 34 pgs. cited by applicant . MacKinlay, Office Action, U.S. Appl. No. 11/223,658, dated May 21, 2008, 20 pgs. cited by applicant . MacKinlay, Office Action, U.S. Appl. No. 11/223,658, dated Feb. 23, 2009, 19 pgs. cited by applicant . MacKinlay, Specification, U.S. Appl. No. 11/223,658, dated Sep. 9, 2005, 58 pgs. cited by applicant . Matsushita, Mitsunori, Eisaku Maeda, and Tsuneaki Kato. "An interactive visualization method of numerical data based on natural language requirements." International journal of human-computer studies 60.4, Apr. 2004, pp. 469-488. (Year: 2004). cited by applicant . Perlin, An Alternative Approach to the Computer Interface, 1993, 11 pgs. cited by applicant . Popescu, et al. "Towards a theory of natural language interfaces to databases." Proceedings of the 8th international conference on Intelligent user interfaces. Jan. 2003, pp. 149-157. (Year: 2003). cited by applicant . Rao, The Table Lens: Merging Graphical and Symbolic Representation in an Interactive Focus+Context Visualization for Tabular Information, Apr. 1994, 7 pgs. cited by applicant . Roth, Interactive Graphic Design Using Automatic Presentation Knowledge, Apr. 24-28, 1994, 7 pgs. cited by applicant . Roth, Visage: A User Interface Environment for Exploring Information, Oct. 28-29, 2006, 9 pgs. cited by applicant . Screen Dumps for Microsoft Office Excel 2003 SP2, figures 1-36, 2003, pp. 1-19. cited by applicant . Setlur, Preinterview First Office Action, U.S. Appl. No. 16/234,470, dated Sep. 24, 2020, 6 pgs. cited by applicant . Setlur, First Action Interview Office Action, U.S. Appl. No. 16/234,470, dated Oct. 28, 2020, 4 pgs. cited by applicant . Spenke, Focus: The Interactive Table for Product Comparison and Selection, Nov. 1996, 10 pgs. cited by applicant . Stevens, On the Theory of Scales of Measurement, Jun. 7, 1946, 4 pgs. cited by applicant . Stolte, Multiscale Visualization Using Data Cubes, 2002, 8 pgs. cited by applicant . Stolte, Notice of Allowance, U.S. Appl. No. 10/453,834, dated May 27, 2006, 9 pgs. cited by applicant . Stolte, Notice of Allowance, U.S. Appl. No. 11/488,407, dated Dec. 29, 1999, 8 pgs. cited by applicant . Stolte, Notice of Allowance, U.S. Appl. No. 13/019,227, dated Nov. 10, 2011, 8 pgs. cited by applicant . Stolte, Notice of Allowance, U.S. Appl. No. 13/425,300, dated Dec. 10, 2013, 10 pgs. cited by applicant . Stolte, Office Action, U.S. Appl. No. 10/667,194, dated Jan. 7, 2008, 10 pgs. cited by applicant . Stolte, Office Action, U.S. Appl. No. 10/667,194, dated Feb. 9, 2009, 11 pgs. cited by applicant . Stolte, Office Action, U.S. Appl. No. 10/667,194, dated Aug. 14, 2007, 16 pgs. cited by applicant . Stolte, Office Action, U.S. Appl. No. 10/667,194, dated Aug. 14, 2008, 10 pgs. cited by applicant . Stolte, Office Action, U.S. Appl. No. 10/667,194, dated Jan. 18, 2007, 15 pgs. cited by applicant . Stolte, Office Action, U.S. Appl. No. 10/667,194, dated Jun. 26, 2006, 13 pgs. cited by applicant . Stolte, Office Action, U.S. Appl. No. 11/488,407, dated Apr. 3, 2009, 6 pgs. cited by applicant . Stolte, Office Action, U.S. Appl. No. 13/019,227, dated Apr. 18, 2011, 9 pgs. cited by applicant . Stolte, Office Action, U.S. Appl. No. 13/425,300, dated Mar. 15, 2013, 7 pgs. cited by applicant . Stolte, Office Action, U.S. Appl. No. 14/937,836, dated Oct. 7, 2016, 10 pgs. cited by applicant . Stolte, Notice of Allowance, U.S. Appl. No. 14/937,836, dated Mar. 1, 2017, 8 pgs. cited by applicant . Stolte, Office Action, U.S. Appl. No. 15/449,844, dated Jun. 29, 2017, 16 pgs. cited by applicant . Stolte, Final Office Action, U.S. Appl. No. 15/449,844, dated Feb. 6, 2018, 8 pgs. cited by applicant . Stolte, Notice of Allowance, U.S. Appl. No. 15/449,844, dated May 18, 2018, 9 pgs. cited by applicant . Stolte, Office Action, U.S. Appl. No. 15/582,478, dated Jul. 11, 2017, 16 pgs. cited by applicant . Stolte, Final Office Action, U.S. Appl. No. 15/582,478, dated Mar. 8, 2018, 10 pgs. cited by applicant . Stolte, Notice of Allowance U.S. Appl. No. 15/582,478, dated Jun. 26, 2017, 10 pgs. cited by applicant . Stolte, Notice of Allowance U.S. Appl. No. 16/056,396, dated Apr. 16, 2019, 10 pgs. cited by applicant . Stolte, Office Action, U.S. Appl. No. 16/056,819, dated Aug. 7, 2019, 12 pgs. cited by applicant . Stolte, Notice of Allowance, U.S. Appl. No. 16/056,819, dated Sep. 11, 2019, 8 pgs. cited by applicant . Stolte Office Action, U.S. Appl. No. 16/220,240, dated Aug. 7, 2019, 11 pgs. cited by applicant . Stolte, Notice of Allowance, U.S. Appl. No. 16/220,240, dated Sep. 11, 2019, 8 pgs. cited by applicant . Stolte Notice of Allowance, U.S. Appl. No. 16/137,457, dated Sep. 6, 2019, 10 pgs. cited by applicant . Stolte Notice of Allowance, U.S. Appl. No. 16/13 7,071, dated Sep. 11, 2019, 10 pgs. cited by applicant . Stolte, Polaris: A System for Query, Analysis, and Visualization of Multidimensional Relational Databases, Jan. 2002, 14 pgs. cited by applicant . Stolte, Query Analysis, and Visualization of Hierarchically Structured Data Using Polaris, Jul. 2002, 11 pgs. cited by applicant . Stolte, Specification, U.S. Appl. No. 10/453,834, Jun. 2, 2003, 114 pgs. cited by applicant . Stolte, Visualizing Application Behavior on Superscaler Processors, 1999, 9 pgs. cited by applicant . Tableau Software, IPRP, PCT/US2005/043937, Jun. 5, 2007, 9 pgs. cited by applicant . Tableau Software, IPRP, PCT/US2007/009810, Oct. 22, 2008, 7 pgs. cited by applicant . Tableau Software, ISR/WO, PCT/US2005/043937, Apr. 18, 2007, 9 pgs. cited by applicant . Tableau Software, ISR/WO, PCT/US2006/35300, Jul. 7, 2008, 6 pgs. cited by applicant . Tableau Software, ISR/WO, PCT/US2007/009810, Jul. 7, 2008, 8 pgs. cited by applicant . Tableau Software, Inc., International Search Report and Written Opinion, PCT/US2019/055169, dated Dec. 16, 2019, 12 pgs. cited by applicant . The Board of Trustees . . . Stanford, IPRP, PCT/US04/18217, Oct. 19, 2006, 4 pgs. cited by applicant . The Board of Trustees . . . Stanford, IPRP, PCT/US2004/30396, Jan 30, 2007, 3 pgs. cited by applicant . The Board of Trustees . . . Stanford, ISR/WO, PCT/US04/18217, Feb. 7, 2006, 6 pgs. cited by applicant . The Board of Trustees . . . Stanford, ISR/WO, PCT/US2004/30396, Aug. 24, 2006, 5 pgs. cited by applicant . The Board of Trustees . . . Stanford, Supplementary ESR, EP 04754739.3, Dec. 17, 2007, 4 pgs. cited by applicant . Thearling, Visualizing Data Mining Models, 2001, 14 pgs. cited by applicant . Tory, First Action Preinterview Office Action, U.S. Appl. No. 16/219,406, dated Jul. 10, 2020, 7 pgs. cited by applicant . Tory, Notice of Allowance U.S. Appl. No. 16/219,406, dated Sep. 9, 2020, 8 pgs. cited by applicant . Tory, Office Action, U.S. Appl. No. 16/575,354, dated Nov. 3, 2020, 17 pgs. cited by applicant . Tory, Office Action, U.S. Appl. No. 16/575,349, dated Oct. 13, 2020, 15 pgs. cited by applicant . Ward, XmdvTool: Integrating Multiple Methods for Visualizing Multi-Variate Data, 9 pgs. cited by applicant . Welling, Visualization of Large Multi-Dimensional Datasets, Aug. 11, 2000, 6 pgs. cited by applicant . Wilkinson, nViZn: An Algebra-Based Visualization System, Mar. 21-23, 2001, 7 pgs. cited by applicant . Wilkinson, Statistics and Computing--The Grammar of Graphics, 1999, 417 pgs. cited by applicant . Hearst, Notice of Allowance, U.S. Appl. No. 16/601,413, dated Mar. 3, 2021, 10 pgs. cited by applicant . Setlur, Final Office Action, U.S. Appl. No. 16/234,470, dated Jun. 2, 2021, 49 pgs. cited by applicant . Tory, Office Action, U.S. Appl. No. 16/575,349, dated Feb. 3, 2021, 9 pgs. cited by applicant . Setlur, Notice of Allowance, U.S. Appl. No. 16/234,470, dated Nov. 10, 2021, 14 pgs. cited by applicant. |
Primary Examiner: Amin; Mustafa A
Attorney, Agent or Firm: Morgan, Lewis & Bockius LLP
Parent Case Text
RELATED APPLICATIONS
This application claims priority to U.S. Provisional Application Ser. No. 62/827,768, filed Apr. 1, 2019, entitled "Inferring Intent and Utilizing Context for Natural Language Expressions in a Data Visualization User Interface," which is incorporated by reference herein in its entirety.
This application is related to U.S. patent application Ser. No. 16/219,406, filed Dec. 13, 2018, entitled "Identifying Intent in Visual Analytical Conversations," which is incorporated by reference herein in its entirety.
This application is related to U.S. patent application Ser. No. 16/575,349, filed Sep. 18, 2019, entitled "Methods and Systems for Inferring Intent and Utilizing Context For Natural Language Expressions To Generate Data Visualizations in a Data Visualization Interface," which is incorporated by reference herein in its entirety.
Claims
What is claimed is:
1. A method for generating modified data visualizations, comprising: at a computing device having one or more processors and memory storing one or more programs configured for execution by the one or more processors: displaying an initial data visualization according to an initial visual specification that specifies a data source, a plurality of visual variables, and a plurality of data fields from the data source, wherein: each of the visual variables defines a respective characteristic of data marks in the initial data visualization according to association of a respective one or more of the data fields with the respective visual variable, the respective characteristic specifying horizontal position, vertical position, color, size, or text, for the data marks; and the initial visual specification includes one or more previous natural language commands received from a user or properties specified by the user through natural language commands; receiving a first natural language command that includes a user request for information from the data source; in response to receiving the first natural language command: extracting one or more first keywords from the first natural language command; determining, based on the extracted one or more first keywords and one or more of (i) the data source, (ii) the visual variables, and/or (iii) the data fields of the initial visual specification, that the user request includes an intent request consisting of an explicit intent request or an implicit intent request, wherein the intent request is an implicit intent request when the extracted one or more keywords do not directly specify a characteristic in the visual specification; generating a modified visual specification in accordance with the determined intent request and the first natural language command; generating one or more queries based on the modified visual specification; executing the one or more queries to retrieve data for a modified data visualization; and generating and displaying the modified data visualization.
2. The method of claim 1, wherein the explicit intent request is prioritized over the implicit intent request.
3. The method of claim 1, further comprising: determining a data visualization type based on the first natural language command, wherein generating the modified data visualization is further in accordance with the determined data visualization type.
4. The method of claim 1, further comprising, in response to receiving the first natural language command: displaying a transcription of the first natural language command in an editable field in a user interface; and receiving user input to edit the transcription, wherein extracting the one or more first keywords from the first natural language command includes extracting the one or more first keywords based on the edited transcription of the first natural language command.
5. The method of claim 1, further comprising: receiving user input to adjust one or more interactive filter controls or interactive legends in a user interface; updating the modified visual specification based on the user input; and displaying an updated modified data visualization based on the updated modified visual specification.
6. The method of claim 1, further comprising: receiving a second natural language command that includes a request for information from the data source or a request to change the modified data visualization; determining one or more second keywords from the second natural language command; determining, based on the one or second more keywords, a second user intent to change the modified data visualization; determining a second context based on the modified data visualization and/or the first natural language command; updating the modified visual specification based on the second user intent and the second context; and displaying an updated data visualization based on the updated modified visual specification.
7. The method of claim 1, wherein the first natural language command includes a verbal user input.
8. The method of claim 1, wherein the first natural language command includes a user utterance.
9. The method of claim 1, wherein the first natural language command includes a user input of text into a natural language input field.
10. The method of claim 1, wherein: each of the data fields is identified as either a dimension or a measure; and the initial data visualization is generated according to the identification of each of the data fields as a dimension or a measure.
11. The method of claim 1, further comprising: determining that the intent request corresponds to an explicit intent request when the extracted one or more keywords directly specify a visual variable in the initial visual specification; and generating the modified visual specification includes: modifying the plurality of visual variables in the initial visual specification based on the extracted one or more keywords.
12. The method of claim 1, further comprising: determining that the intent request corresponds to an implicit intent request; and generating the modified visual specification includes: identifying one or more first data fields from the natural language command; and modifying the plurality of data fields in the initial visual specification to include the identified one or more first data fields.
13. A computing device, comprising: one or more processors; memory; a display; and one or more programs stored in the memory and configured for execution by the one or more processors, the one or more programs comprising instructions for: displaying an initial data visualization according to an initial visual specification that specifies a data source, a plurality of visual variables, and a plurality of data fields from the data source, wherein: each of the visual variables defines a respective characteristic of data marks in the initial data visualization according to association of a respective one or more of the data fields with the respective visual variable, the respective characteristic specifying horizontal position, vertical position, color, size, or text, for the data marks; and the initial visual specification includes one or more previous natural language commands received from a user or properties specified by the user through natural language commands; receiving a first natural language command that includes a user request for information from the data source; in response to receiving the first natural language command: extracting one or more first keywords from the first natural language command; determining, based on the extracted one or more first keywords and one or more of (i) the data source, (ii) the visual variables, and/or (iii) the data fields of the initial visual specification, that the user request includes an intent request consisting of an explicit intent request or an implicit intent request, wherein the intent request is an implicit intent request when the extracted one or more keywords do not directly specify a characteristic in the visual specification; generating a modified visual specification in accordance with the determined intent request and the first natural language command; generating one or more queries based on the modified visual specification; executing the one or more queries to retrieve data for a modified data visualization; and generating and displaying the modified data visualization.
14. The computing device of claim 13, wherein the explicit intent request is prioritized over the implicit intent request.
15. The computing device of claim 13, wherein the one or more programs further comprise instructions for: determining a data visualization type based on the first natural language command, wherein generating the modified the data visualization is further in accordance with the determined data visualization type.
16. The computing device of claim 13, wherein the one or more programs further comprise instructions for: in response to receiving the first natural language command: displaying a transcription of the first natural language command in an editable field in a user interface; and receiving user input to edit the transcription, wherein extracting the one or more first keywords from the first natural language command includes extracting the one or more first keywords based on the edited transcription of the first natural language command.
17. The computing device of claim 13, wherein the one or more programs further comprise instructions for: receiving user input to adjust one or more interactive filter controls or interactive legends in a user interface; updating the modified visual specification based on the user input; and displaying an updated modified data visualization based on the updated visual specification.
18. The computing device of claim 13, wherein the one or more programs further comprise instructions for: receiving a second natural language command that includes a request for information from the data source or a request to change the modified data visualization; determining one or more second keywords from the second natural language command; determining, based on the one or second more keywords, a second user intent to change the modified data visualization; determining a second context based on the modified data visualization and/or the first natural language command; updating the modified visual specification based on the second user intent and the second context; and displaying a second modified data visualization based on the updated modified visual specification.
19. The computing device of claim 13, wherein the first natural language command includes either a verbal user input or a user utterance.
20. A non-transitory computer readable storage medium storing one or more programs configured for execution by a computing device having one or more processors, memory, and a display, the one or more programs comprising instructions for: displaying an initial data visualization according to an initial visual specification that specifies a data source, a plurality of visual variables, and a plurality of data fields from the data source, wherein: each of the visual variables defines a respective characteristic of data marks in the initial data visualization according to association of a respective one or more of the data fields with the respective visual variable, the respective characteristic specifying horizontal position, vertical position, color, size, or text, for the data marks; and the initial visual specification includes one or more previous natural language commands received from a user or properties specified by the user through natural language commands; receiving a first natural language command that includes a user request for information from the data source; in response to receiving the first natural language command: extracting one or more first keywords from the first natural language command; determining, based on the extracted one or more first keywords and one or more of (i) the data source, (ii) the visual variables, and/or (iii) the data fields of the initial visual specification, that the user request includes an intent request consisting of an explicit intent request or an implicit intent request, wherein the intent request is an implicit intent request when the extracted one or more keywords do not directly specify a characteristic in the visual specification; generating a modified visual specification in accordance with the determined intent request and the first natural language command; generating one or more queries based on the modified visual specification; executing the one or more queries to retrieve data for a modified data visualization; and generating and displaying the modified data visualization.
Description
TECHNICAL FIELD
The disclosed implementations relate generally to data visualization and more specifically to systems, methods, and user interfaces that enable users to interact with and explore datasets using a natural language interface.
BACKGROUND
Data visualization applications enable a user to understand a data set visually, including distribution, trends, outliers, and other factors that are important to making business decisions. Some data sets are very large or complex, and include many data fields. Various tools can be used to help understand and analyze the data, including dashboards that have multiple data visualizations. However, some functionality may be difficult to use or hard to find within a complex user interface. Most systems return only very basic interactive visualizations in response to queries, and others require expert modeling to create effective queries. Other systems require simple closed-ended questions, and then are only capable of returning a single text answer or a static visualization.
Natural language has garnered interest as a useful modality for creating and interacting with visualizations. Natural language interaction techniques offer the promise of easy, intuitive engagement with data even for non-experts by enabling users to express their analytical goals as natural language utterances. Natural language interaction is effective when it supports questions pertaining to a user's information needs. In this respect, however, many natural language interfaces fail to accurately determine a user's information needs.
SUMMARY
To effectively support visual analytical workflows, it is critical to accurately infer the user's intent. However, existing natural language interfaces either do not infer intent, infer very limited aspects of intent, rely on explicitly named data attributes, values, and chart types, or restrict relevance of the automatically generated visualization responses.
Accordingly, there is a need for tools that infer user intent to produce more useful visualizations. There is also a need for tools that employ intent to allow users to effectively utilize functionality provided by data visualization applications. One solution to the problem is providing a natural language interface as part of a data visualization application (e.g., within the user interface for the data visualization application) for an interactive dialog that provides graphical results to natural language input. The natural language interface uses both context and intent to support analytical flow in conversations. The natural language interface models transitions in visual analytical conversations by characterizing users' goals.
In accordance with some implementations, a method executes at an electronic device with a display, one or more processors, and memory. For example, the electronic device can be a smart phone, a tablet, a notebook computer, or a desktop computer. The device receives user selection of a data source and a first natural language command, from the user, requesting information related to the data source. The device determines one or more first keywords from the first natural language command and determines, based on the one or more keywords, a first user intent to generate a data visualization. The device then generates a visual specification based on the first user intent. The visual specification specifies the data source (e.g., the user selected data source), a plurality of visual variables, and a plurality of data fields from the data source. Each of the visual variables is associated with a respective one or more of the data fields and each of the data fields is identified as either a dimension or a measure. The device then generates a data visualization based on the generated visual specification and displays the data visualization to the user.
In some implementations, the first user intent includes any of: determining an explicit user intent based on the one or more first keywords, determining a first context based on the plurality of data fields from the data source, and determining an implicit user intent based on the one or more first keywords and the first context.
In some implementations, when an explicit user intent and an implicit user intent are determined, the explicit user intent is prioritized over the implicit user intent.
In some implementations, the device displays a transcription of the first natural language command in an editable field in a user interface in response to receiving the first natural language command. The device may also receive user input to edit the transcription. In such cases, the one or more first keywords are determined based on the edited transcription of the first natural language command.
In some implementations, the device also receives user input to adjust one or more interactive filter controls and interactive legends in a user interface. In response to receiving the user input, the device modifies the plurality of visual variables based on the user input and displays a modified data visualization based on the modified plurality of visual variables.
In some implementations, the device also determines a data visualization type based on the first user intent and generates the data visualization in accordance with the determined data visualization type. In some implementations, the data visualization types include bar charts, line charts, scatterplots, pie charts, heatmaps, text tables, and maps.
In some implementations, the device also receives a second natural language command. In response to receiving the second natural language command, the device determines: (i) one or more second keywords from the second natural language command, (ii) a second user intent based on the one or more second keywords, and (iii) a second context based on the first natural language command and/or the data visualization. The device also modifies the data visualization based on the second user intent and the second context, and displays the modified data visualization.
In some implementations, the first natural language command includes verbal user input (e.g., captured by a microphone).
In some implementations, the first natural language command includes a user utterance.
In some implementations, the first natural language command includes user input of text into a natural language input field.
In accordance with some implementations, a method executes at an electronic device with a display, one or more processors, and memory. For example, the electronic device can be a smart phone, a tablet, a notebook computer, or a desktop computer. The device displays an initial data visualization according to a visual specification that specifies a data source, a plurality of visual variables, and a plurality of data fields from the data source. Each of the visual variables is associated with a respective one or more of the data fields and each of the data fields is identified as either a dimension or a measure. The device receives a user specified first natural language command requesting information related to the data source. The device extracts one or more first keywords from the first natural language command and determines a first user intent to modify the initial data visualization based on the one or more first keywords. The device then modifies the plurality of visual variables in the visual specification based on the first user intent and displays a modified data visualization to the user. The modified data visualization is based on the modified plurality of visual variables.
In some implementations, the first user intent includes any of: determining an explicit user intent based on the one or more first keywords, determining a first context based on the initial data visualization, and determining an implicit user intent based on the one or more first keywords and the first context.
In some implementations, when an explicit user intent and an implicit user intent are determined, the explicit user intent is prioritized over the implicit user intent.
In some implementations, the device also determines a data visualization type based on the first user intent and the data visualization is modified in accordance with the determined data visualization type.
In some implementations, the device displays a transcription of the first natural language command in an editable field in a user interface in response to receiving the first natural language command. The device may also receive a user input to edit the transcription. In such cases, the one or more first keywords are determined based on the edited transcription of the first natural language command.
In some implementations, the device also receives user input to adjust one or more interactive filter controls and interactive legends in a user interface. In response to receiving the user input, the device updates the modified plurality of visual variables based on the user input and displays a an updated data visualization based on the updated plurality of visual variables.
In some implementations, the device also receives a second natural language command that includes a request for information regarding the data source or a request to change the modified data visualization. In response to receiving the second natural language command, the device determines: (i) one or more second keywords from the second natural language command, (ii) a second user intent to change the modified data visualization based on the one or more second keywords, and (iii) a second context based the modified data visualization and/or the first natural language command. The device also updates the data visualization based on the second user intent and the second context, and displays the updated data visualization.
In some implementations, the first natural language command includes a verbal user input.
In some implementations, the first natural language command includes a user utterance.
In some implementations, the first natural language command includes a user input of text into a natural language input field.
Typically, an electronic device includes one or more processors, memory, a display, and one or more programs stored in the memory. The programs are configured for execution by the one or more processors and are configured to perform any of the methods described herein.
In some implementations, a non-transitory computer readable storage medium stores one or more programs configured for execution by a computing device having one or more processors, memory, and a display. The one or more programs are configured to perform any of the methods described herein.
Thus methods, systems, and graphical user interfaces are disclosed that allow users to efficiently generate and modify data displayed within a data visualization application by using natural language commands.
Both the foregoing general description and the following detailed description are exemplary and explanatory, and are intended to provide further explanation of the invention as claimed.
BRIEF DESCRIPTION OF THE DRAWINGS
For a better understanding of the aforementioned systems, methods, and graphical user interfaces, as well as additional systems, methods, and graphical user interfaces that provide data visualization analytics, reference should be made to the Description of Implementations below, in conjunction with the following drawings in which like reference numerals refer to corresponding parts throughout the figures.
FIG. 1 illustrates generating and modifying a data visualization based on natural language commands, in accordance with some implementations.
FIG. 2A is a block diagram illustrating a computing device according to some implementations.
FIG. 2B is a block diagram illustrating a data visualization server according to some implementations.
FIGS. 3A-3C illustrate how intent in analytical conversation is used to drive effective visualization responses, according to some implementations.
FIGS. 4A and 4B illustrate graphical user interfaces used in some implementations.
FIGS. 4C-4E provide examples of data visualizations according to some implementations.
FIGS. 5A-5D provide a flow diagram of a method for generating data visualizations according to some implementations.
FIGS. 6A-6D provide a flow diagram of a method for modifying data visualizations according to some implementations.
Reference will now be made to implementations, examples of which are illustrated in the accompanying drawings. In the following description, numerous specific details are set forth in order to provide a thorough understanding of the present invention. However, it will be apparent to one of ordinary skill in the art that the present invention may be practiced without requiring these specific details.
DESCRIPTION OF IMPLEMENTATIONS
FIG. 1 illustrates generating and modifying a data visualization based on natural language commands. Some implementations of an interactive data visualization application include a user interface 110 that includes a natural language input box 112 and a data visualization region 114 for displaying data visualization, as shown in FIG. 1. A data source 102 that is used by the interactive data visualization application to generate data visualizations may be stored locally (e.g., on the same device that is displaying the user interface) or may be stored externally (e.g., on a database server or in the cloud). A data source 102 may be stored in a database or stored as one or more files (e.g., .CSV files) in a file system.
Some implementations of an interactive data visualization application can provide data visualizations based on a natural language command input by a user. The natural language command can include any form of user input that can be understood and translated or transcribed. For instance, the natural language command may include verbal input, a user utterance, a text input, a symbolic input or even a user gesture. In most instances, the natural language command includes a request for information regarding the data source. For example, the natural language command may include a request to plot data included in the data source, or alternatively, may ask a question based on the data in the data source. For example, the data visualization application may receive a first natural language command to "create a scatter plot." In some instances, in response to receiving the first natural language command, the first natural language command is displayed in the natural language input box 112 and a data visualization 120 is displayed in the data visualization region 114 of the user interface 110. In addition to generating a data visualization based on the data source and a natural language command received from a user, the data visualization application may also receive a natural language command to modify a current data visualization. For example, as shown in FIG. 1, subsequent to displaying the data visualization 120 based on the data source and the first natural language command, the data visualization application may receive a second natural language command to "add a trend line." In response to receiving the second natural language command, the natural language input box 112 displays the second natural language command and a modified data visualization 122 is displayed in the data visualization region 114 of the user interface 110. In some instances, described below with respect to FIGS. 3A-3C and 4C-4E, the data visualization application may provide a data visualization in response to a natural language command that includes a question or a request for information about the data source. For example, the natural language command may ask a data source that includes historical records of Olympic medals, "which country won the most gold medals in the last ten years?" or "how many medals were awarded to Canada between the years 2000-2019?" In response to such questions, the data visualization application may display, respectively, a bar chart showing the total number of medals awarded to each country in the last ten years and a line graph showing the number of medals awarded to Canada between the years 2000 and 2019. Further, the data visualization may highlight or emphasize portions of the data visualization in order to better fulfill the user's natural language command. For example, in the bar chart showing the total number of medals awarded to each country in the last ten years, the top country or the top five countries with the highest sum of awarded medals may be highlighted.
In some implementations, the data visualization application is configured to provide responses to natural language commands so that there are no "dead ends." By utilizing the methods described herein, the data visualization application maintains context from either existing data visualizations or from the natural language command in order to provide consistent modifications to the data visualization that are not unexpected for the user (e.g., the system maintains the context of the data prior to the natural language command). Additionally, the data visualization application may use techniques to extract or infer a user's intention based on the natural language command. By using methods that can handle underspecified or vague commands, as well as infer an implicit user intent from the natural language command, the data visualization application can adapt to each natural language command, remain interactive with the user, and allow the user to "undo" or "retry" when the data visualization application provides an unexpected data visualization. This avoids raising error message or not providing a response to an underspecified natural language command (e.g., "dead ends").
FIG. 2A is a block diagram illustrating a computing device 200 that can execute a data visualization application 230 or a data visualization web application to display the graphical user interface 232 in accordance with some implementations. Various examples of the computing device 200 include a desktop computer, a laptop computer, a tablet computer, and other computing devices that have a display and a processor capable of running a data visualization application 230. The computing device 200 typically includes one or more processing units (processors or cores) 202, one or more network or other communications interfaces 204, memory 206, and one or more communication buses 208 for interconnecting these components. The communication buses 208 optionally include circuitry (sometimes called a chipset) that interconnects and controls communications between system components. The computing device 200 includes a user interface 210. The user interface 210 typically includes a display device 212. In some implementations, the computing device 200 includes input devices such as a keyboard, mouse, and/or other input buttons 216. Alternatively or in addition, in some implementations, the display device 212 includes a touch-sensitive surface 214, in which case the display device 212 is a touch-sensitive display. In some implementations, the touch-sensitive surface 214 is configured to detect various swipe gestures (e.g., continuous gestures in vertical and/or horizontal directions) and/or other gestures (e.g., single/double tap). In computing devices that have a touch-sensitive display 214, a physical keyboard is optional (e.g., a soft keyboard may be displayed when keyboard entry is needed). The user interface 210 also includes an audio output device 218, such as speakers or an audio output connection connected to speakers, earphones, or headphones. Furthermore, some computing devices 200 use a microphone 220 and voice recognition software to supplement or replace the keyboard. An audio input device 220 (e.g., a microphone) captures audio (e.g., speech from a user).
The memory 206 includes high-speed random-access memory, such as DRAM, SRAM, DDR RAM, or other random-access solid-state memory devices; and may include non-volatile memory, such as one or more magnetic disk storage devices, optical disk storage devices, flash memory devices, or other non-volatile solid-state storage devices. In some implementations, the memory 206 includes one or more storage devices remotely located from the processors 202. The memory 206, or alternatively the non-volatile memory devices within the memory 206, includes a non-transitory computer-readable storage medium. In some implementations, the memory 206 or the computer-readable storage medium of the memory 206 stores the following programs, modules, and data structures, or a subset or superset thereof: an operating system 222, which includes procedures for handling various basic system services and for performing hardware dependent tasks; a communications module 224, which is used for connecting the computing device 200 to other computers and devices via the one or more communication network interfaces 204 (wired or wireless), such as the Internet, other wide area networks, local area networks, metropolitan area networks, and so on; a web browser 226 (or other application capable of displaying web pages), which enables a user to communicate over a network with remote computers or devices; an audio input module 228 (e.g., a microphone module) for processing audio captured by the audio input device 220. The captured audio may be sent to a remote server and/or processed by an application executing on the computing device 200 (e.g., the data visualization application 230); a data visualization application 230 for generating data visualizations and related features. The application 230 includes a graphical user interface 232 (e.g., the graphical user interface 110 illustrated in FIG. 1) for a user to construct visual graphics. For example, a user selects one or more data sources 102 (which may be stored on the computing device 200 or stored remotely), selects data fields from the data sources, and uses the selected fields to define a visual graphic; and zero or more databases or data sources 102 (e.g., a first data source 102-1 and a second data source 102-2), which are used by the data visualization application 230. In some implementations, the data sources are stored as spreadsheet files, CSV files, text files, JSON files, XML files, or flat files, or stored in a relational database.
In some implementations, the data visualization application 230 includes a data visualization generation module 234, which takes user input (e.g., a visual specification 236), and generates a corresponding visual graphic. The data visualization application 230 then displays the generated visual graphic in the user interface 232. In some implementations, the data visualization application 230 executes as a standalone application (e.g., a desktop application). In some implementations, the data visualization application 230 executes within the web browser 226 or another application using web pages provided by a web server (e.g., a server-based application).
In some implementations, the information the user provides (e.g., user input) is stored as a visual specification 236. In some implementations, a visual specification 236 includes previous natural language commands received from a user or properties specified by the user through natural language commands.
In some implementations, the data visualization application 230 includes a language processing module 238 for processing (e.g., interpreting) commands provided by a user of the computing device. In some implementations, the commands are natural language commands (e.g., captured by the audio input device 220 or input via the touch surface 214 or the one or more input buttons such as buttons on a keyboard/mouse 216). In some implementations, the language processing module 238 includes sub-modules, such as an intent deduction module.
In some implementations, the memory 206 stores metrics and/or scores determined by the language processing module 238. In addition, the memory 206 may store thresholds and other criteria, which are compared against the metrics and/or scores determined by the language processing module 238. For example, the language processing module 238 may determine a relatedness metric (discussed in detail below) for an analytic word/phrase of a received command. Then, the language processing module 238 may compare the relatedness metric against a threshold stored in the memory 206.
Each of the above identified executable modules, applications, or sets of procedures may be stored in one or more of the previously mentioned memory devices, and corresponds to a set of instructions for performing a function described above. The above identified modules or programs (i.e., sets of instructions) need not be implemented as separate software programs, procedures, or modules, and thus various subsets of these modules may be combined or otherwise re-arranged in various implementations. In some implementations, the memory 206 stores a subset of the modules and data structures identified above. Furthermore, the memory 206 may store additional modules or data structures not described above.
Although FIG. 2A shows a computing device 200, FIG. 2A is intended more as a functional description of the various features that may be present rather than as a structural schematic of the implementations described herein. In practice, and as recognized by those of ordinary skill in the art, items shown separately could be combined and some items could be separated.
FIG. 2B is a block diagram illustrating a data visualization server 250 according to some implementations. A data visualization server 250 may host one or more databases that include data sources 102 or may provide various executable applications or modules. A server 250 typically includes one or more processing units/cores (CPUs) 252, one or more network communication interfaces 262, memory 264, and one or more communication buses 254 for interconnecting these components. In some implementations, the server 250 includes a user interface 256, which includes a display 258 and one or more input devices 260, such as a keyboard and a mouse. In some implementations, the communication buses 254 include circuitry (sometimes called a chipset) that interconnects and controls communications between system components.
In some implementations, the memory 264 includes high-speed random-access memory, such as DRAM, SRAM, DDR RAM, or other random-access solid-state memory devices, and may include non-volatile memory, such as one or more magnetic disk storage devices, optical disk storage devices, flash memory devices, or other non-volatile solid-state storage devices. In some implementations, the memory 264 includes one or more storage devices remotely located from the CPUs 250. The memory 264, or alternatively the non-volatile memory devices within the memory 264, comprises a non-transitory computer readable storage medium.
In some implementations, the memory 264, or the computer readable storage medium of the memory 264, stores the following programs, modules, and data structures, or a subset thereof: an operating system 270, which includes procedures for handling various basic system services and for performing hardware dependent tasks; a network communication module 272, which is used for connecting the server 250 to other computers via the one or more communication network interfaces 262 (wired or wireless) and one or more communication networks, such as the Internet, other wide area networks, local area networks, metropolitan area networks, and so on; a web server 274 (such as an HTTP server), which receives web requests from users and responds by providing responsive web pages or other resources; a data visualization web application 280, which may a web application that is downloaded and executed by a web browser 274 on a user's computing device 200. In general, a data visualization application web has the same functionality as a desktop data visualization application, but provides the flexibility of access from any device at any location with network connectivity, and does not require installation and maintenance. In some implementations, the data visualization web application includes various software modules to perform certain tasks. In some implementations, the data visualization web application includes a graphical user interface 282, which provides the user interface for all aspects of the data visualization application 280; and a database that stores zero or more data source 102, as described above for a client device 200.
In some implementations, the data visualization web application 280 includes a data visualization generation module 234 and/or a language processing module 238, as described above for a client device 200. In some implementations, the data visualization web application 280 stores visual specifications 236, which are used to build data visualizations.
Although FIG. 2B shows a data visualization server 250, FIG. 2B is intended more as a functional description of the various features that may be present rather than as a structural schematic of the implementations described herein. In practice, and as recognized by those of ordinary skill in the art, items shown separately could be combined and some items could be separated.
FIG. 3A-3C illustrate how intent in analytical conversation is used to drive effective visualization responses, according to some implementations. The examples shown in FIGS. 3A-3C are related to a data source that has information about passengers on the Titanic.
Referring to FIG. 3A, a user provides a first natural language command 302 ("show me children aboard who survived"). In some implementations, the computing device 200 responds by determining first keywords in the first natural language command 302 and determining user intent based on the first keywords. In this example, the computing device determines the user intent to generate a data visualization that includes the attributes "Age" and "Survived" and the determined first keywords may include, for example, "show," "children," and "survived." The computing device generates a visual specification that specifies the data source, a plurality of visual variables, and a plurality of data fields from the data source. Each of the visual variables is associated with a respective one or more of the data fields and each of the data fields is identified as either a dimension or a measure. For example, "Age" and "Survived" are dimensions, and are associated with the "columns" visible variable. The visual variables determine the visual marks to be displayed in a data visualization. The computing device generates and displays a first data visualization 312 based on the visual specification. In some implementations, as shown, the data visualization includes information regarding children who survived as well as children who did not survive since the context of total number of children aboard or the comparison between children who did versus did not survive may be more interesting or provide more context and relevance to the user.
Note that the generated data visualization has binned the records according to age, such as defining children to be passengers whose ages were <18. The display of children/not children and survived/not survived is generally more useful than a data visualization that literally displayed only what the user asked (e.g., a single number based on filtering the data to just rows from the data source having Age <18 and Survived=True).
A user may provide a second natural language command 304 ("break this down by sex and age"). In response, the computing device 200 modifies the visual specification based on second keyword(s) determined from the second natural language command 304 and a user intent that is determined based on the second keyword(s). The computing device 200 then provides a second data visualization 314. The second data visualization 314 retains the attributes "Children Aboard?" and "Survived?" from the first data visualization 312, while adding data attributes "Sex" and "Age" in a way that preserves the previous structure of the bar chart in the first data visualization 312 (namely, a stacked bar chart that is further split into age bins).
Further, the user provides a third natural language command 306 ("what's the correlation between age, fare, and survival"), which has an implicit intent of asking for a "correlation." The factors ("age," "fare," and "survival") in the data source suggest a new visualization, such as a heat map, to depict the correlation between the data attributes "survived," "Age," and "Fare." The computing device 200 responds by generating and displaying a third data visualization 314 that is a heat map, according to some implementations.
FIG. 3B shows another example of using the data source that has information about passengers on the Titanic. In response to receiving a first natural language command 322 ("show me distribution of survivors by fare") from a user, the computing device 200 provides an initial data visualization 332. The user may further ask, "split this data by survived status," providing a second natural language command 324. The initial data visualization 332 provides a context of (i) a bar graph and (ii) information regarding the attribute "fare." In response, the computing device 200 provides a modified data visualization 334 that, based on the context provided by the initial data visualization 332, retains the attribute "Fare" from the initial data visualization 322, while adding the data attribute "Survived?" in a way that preserves the previous structure of the bar chart in the initial data visualization 332 (e.g., by splitting the bar chart into two bar charts).
FIG. 3C illustrates an example of the computing device 200 receiving natural language commands that are related to modifying views or adding information to a previously displayed data visualization. For example, a user might say "show me a scatter plot of survival status by age and fare, providing a first natural language command 342. The computing device 200 determines, from the first natural language command 342, the user's intent of generating a data visualization that is a scatter plot data visualization type and generates a visual specification that corresponds with the determined user intent. In response to receiving the first natural language command 342, the computing device 200 displays an initial data visualization 352 that is a scatter plot of passengers according to the attributes "age" and "fare."
In some implementations, a natural language command may include an explicit intent request and/or an implicit intent. An explicit intent clearly states what a user expects to see and is prioritized over other inferences such as implicit intent. For example, if the first natural language command 342 includes "age and fare colored by survival status," the user clearly indicates how the survival status attribute should be encoded. In this example, the an explicit intent is determined by the computing device 200 and is used in generating the visual specification (e.g., the visual specification will dictate that the survival status is encoded by color). Conversely, implicit intents do not directly specify details of a visual specification, but visualization best practices suggest taking implicit intent into consideration when generating the visual specification.
Further, the user may provide a second natural language command 344 ("add a trend line") to modify the currently displayed data visualization 352. In response to receiving the second natural language command 344, the computing device 200 determines the user's intent to modify the existing data visualization by adding a trend line. The computing device 200 updates the visual specification based on the determined user intent and displays an updated data visualization 354 that retains the information and data visualization type of the initial data visualization 352 and adds trend lines that correspond to the displayed data. Note that two trend lines are created even though the user asked for "a trend line." The two distinct trend lines are needed because a separate trend line is needed for each survival status.
Some additional examples of user intent include: elaborate (add new information to the visualization); adjust/pivot (adapt aspects of the visualization, such as apply/remove/modify a filter, or add/remove data fields); start new (create an altogether new visualization); retry (re-attempt a previous step that "failed"--either for technical reasons, such as a query timeout, or because the previous command failed to convey the desired visualization); and undo (return to the prior state).
Some examples of context include (i) currently selected data source, (ii) currently selected data fields, (iii) current data visualization state or type, (iv) currently applied filters, (v) currently displayed visual marks (including trend lines, highlighting, emphasize/deemphasize), and (vi) current color scheme.
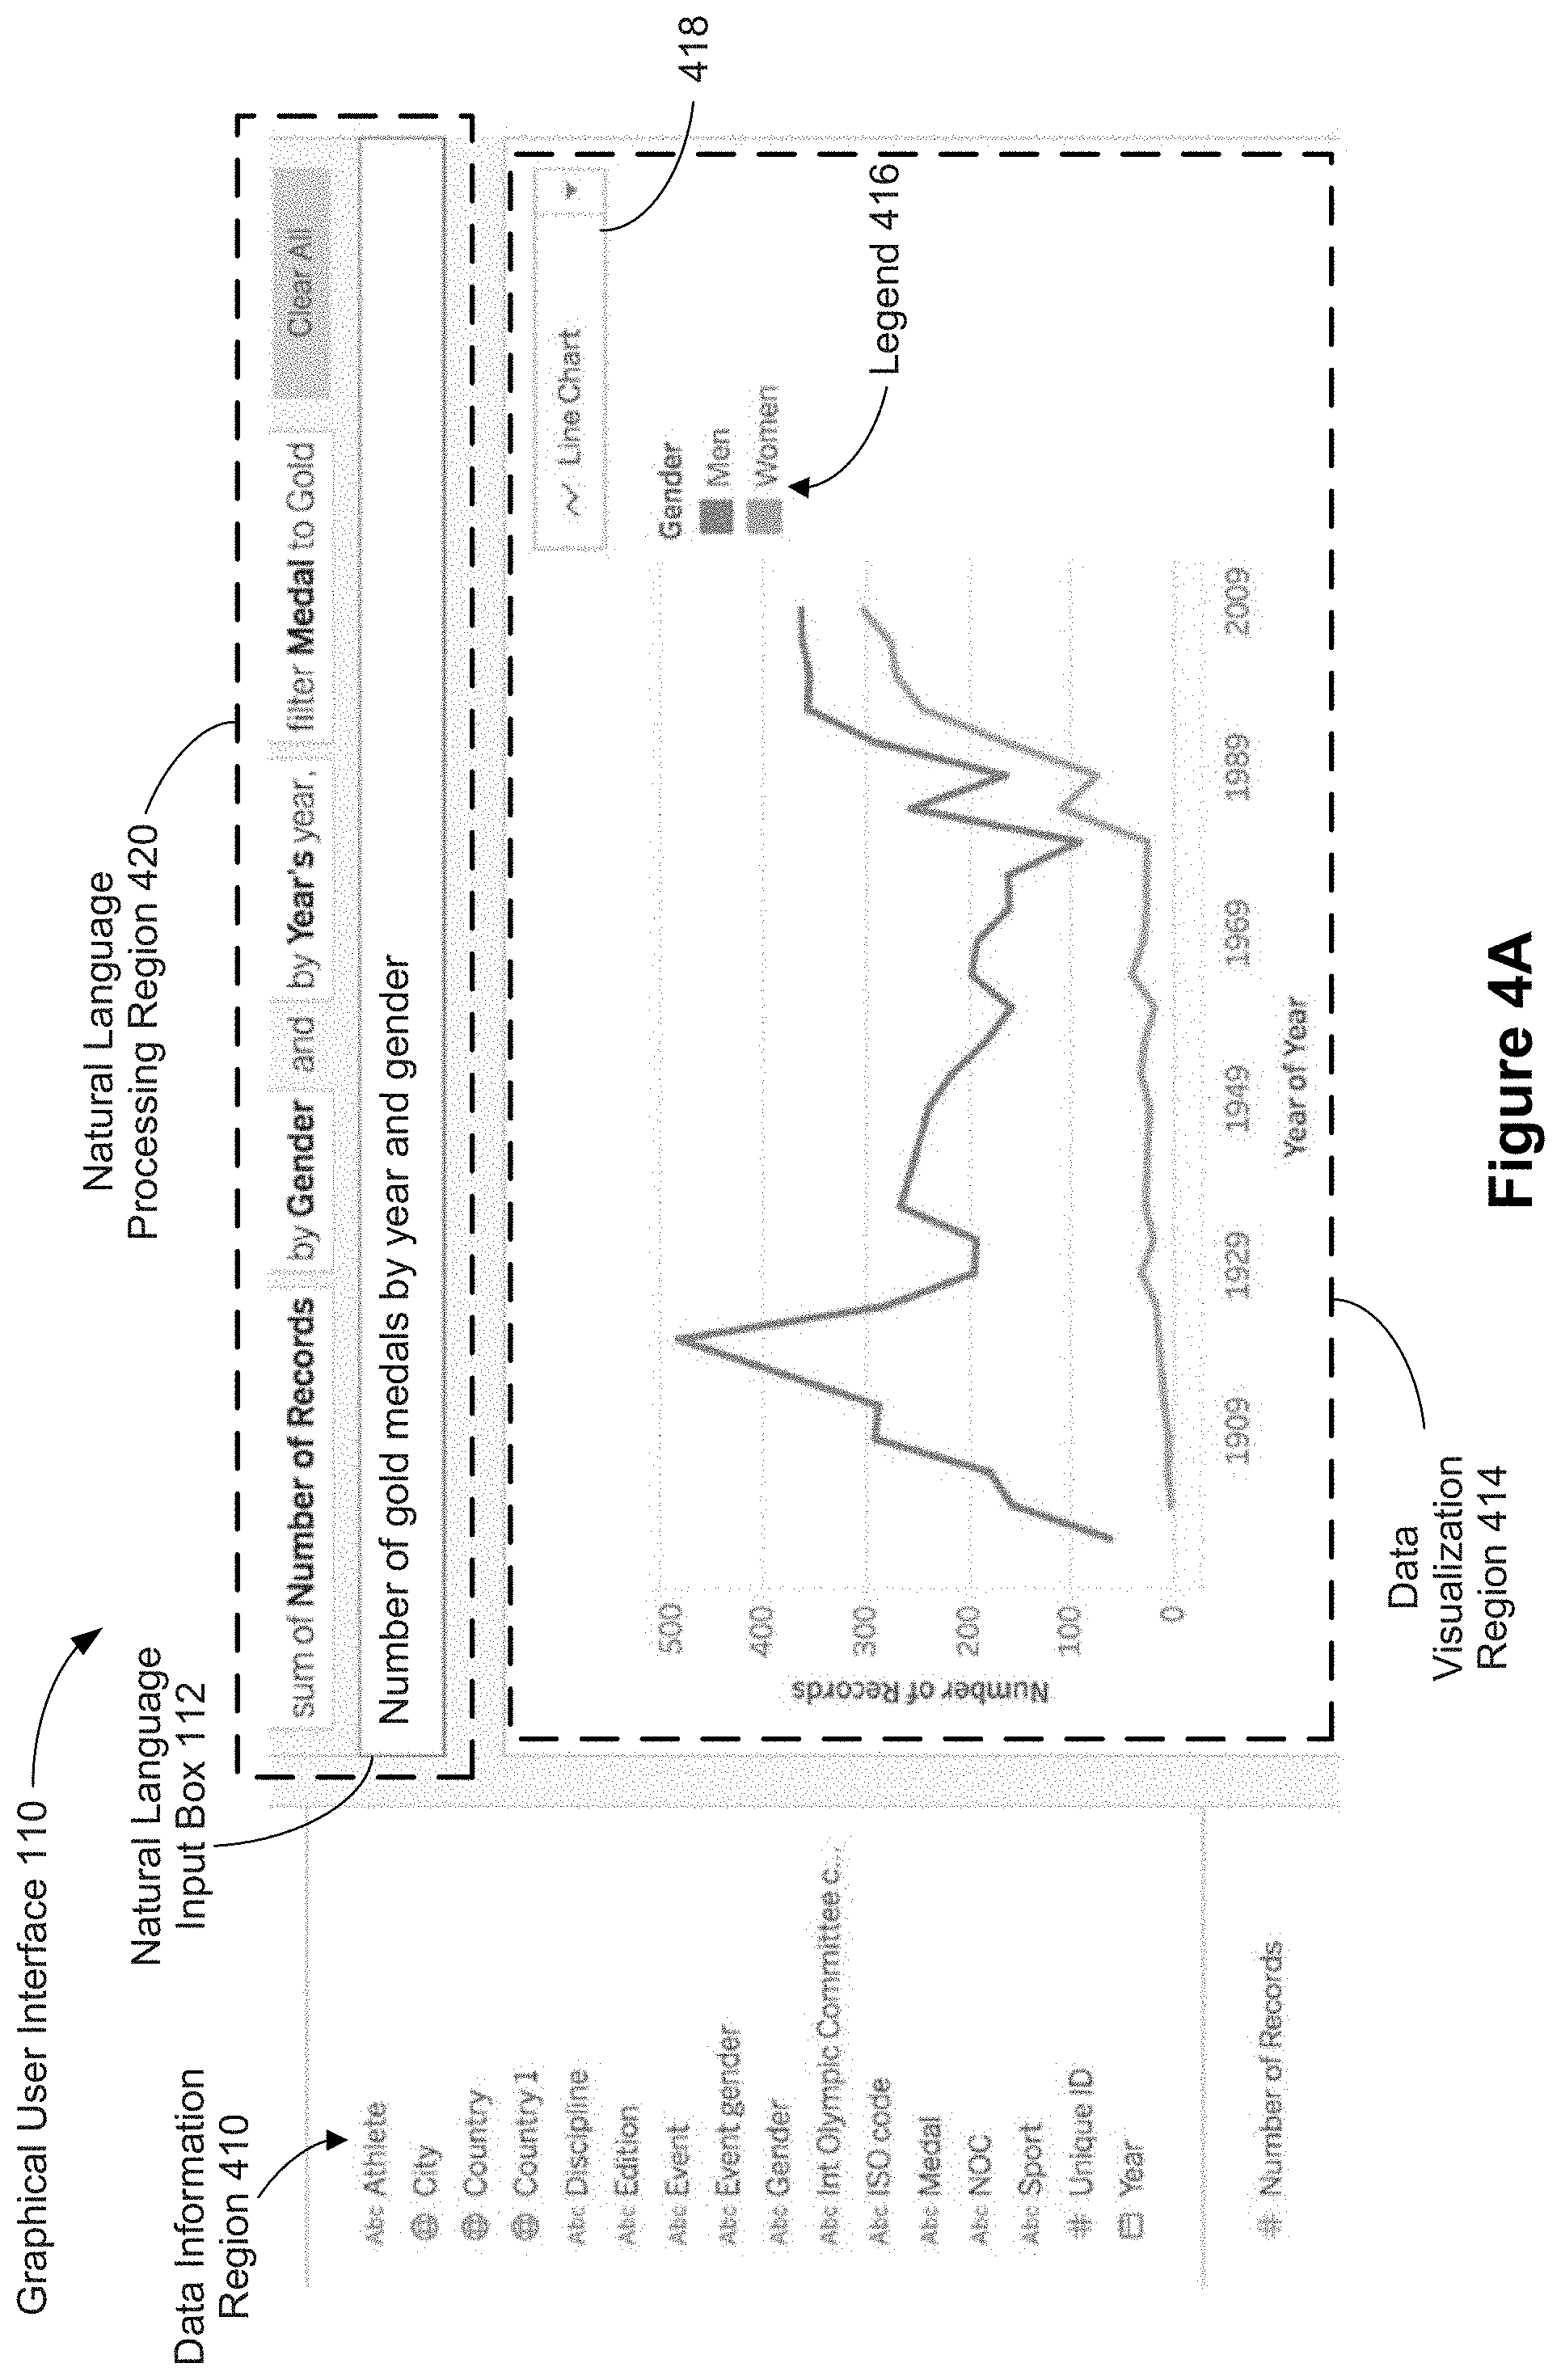
FIGS. 4A and 4B illustrate a graphical user interface 110 for interactive data analysis in accordance with some implementations. The graphical user interface 110 includes a data information region 410, which provides named data elements (e.g., field names) that may be selected and used in a data visualization (e.g., used to generate or build a data visualization, used to modify a data visualization, or included in a data visualization). In some implementations, the list of field names is separated into a group of dimensions (e.g., categorical data) and a group of measures (e.g., numeric quantities). Some implementations also include a list of parameters.
The graphical user interface 110 also includes a data visualization region 414 for displaying a visual graphic (also referred to herein as a data visualization). In this example, the data visualization region displays a data visualization corresponding to data fields shown in the data information region 410. In some implementations, when no data source or data fields have been selected, the data visualization region 414 initially has no visual graphic (e.g., a data visualization is not displayed).
In some instances, the data visualization region 414 also includes a legend 416 and an interactive user affordance 418 for displaying and selecting a data visualization type. For example, FIG. 4A has a legend 416 that shows the color coding scheme of the data visualization shown in the data visualization region 414. In this example, the legend 416 shows that the blue and orange lines shown in the displayed data visualization region correspond to "men" and "women" respectively. Alternatively, as shown in FIG. 4B, a legend may be interactive and may be included in a portion of the graphical user interface 110 that is separate from the data visualization region 414. Additionally, the interactive user affordance 418 displays the type of data visualization ("line chart") currently being displayed. In some implementations, as shown, the interactive user affordance 418 is a drop down box that allows a user to specify the data visualization type to be displayed in the data visualization region 414.
In some implementations, the graphical user interface 110 also includes a natural language processing region 420. The natural language processing region 420 includes a natural language input box 112 for receiving natural language commands. A user may interact with the input bar to provide commands. For example, the user may type a command in the natural language input box 112 to provide the command. In addition, the user may indirectly interact with the natural language input box 112 by speaking into a microphone (e.g., an audio input device 220) to provide commands. In some implementations, an initial data visualization may be generated based on a user's selection of a data source and one or more data fields. After the initial data visualization is generated and displayed (in the data visualization region 414), the user may use natural language commands (e.g., in the natural language processing region 420) to further explore the displayed data visualization. For example, the user may provide a command to create a relationship between two data elements. In response to receiving the command, an updated data visualization that shows a correlation between the two data elements is generated and displayed in the data visualization region 414.
In some implementations, the natural language input box 112 is an editable field. For example, the natural language command received from a user has been transcribed into the natural language input box 112 ("number of gold medals by year and gender"). In some cases, the transcription may have resulted in an incorrectly transcribed word, for example, the word "gold" may have been incorrectly transcribed as "gone" or the user may have included an incorrect spelling or a typographical error in entering the natural language command. In such cases, the text displayed in the natural language input box 112 is editable to either correct mistakes such as incorrect transcriptions or typographical errors as well as to change the natural language command. For instance, the user may provide a natural language command, "color code gender by green and blue" and after seeing that the two colors are too similar to one another, the user may change the text to "color code gender by orange and blue." In response to this command, the visual specification and the data visualization are updated or modified to color code the genders by orange and blue.
In some implementations, as shown in FIG. 4B, the natural language processing region 420 also displays information regarding the currently displayed visualization. For example, in FIG. 4B, the natural language processing region 420 shows the natural language command input box 112 as well as information 413 (e.g., a phrase) ("Showing: how many males vs. females survived in first class?") regarding the data visualization that is currently displayed in the data visualization region 414. Additionally, the graphical user interface 110 also includes interactive filter controls 430. In this example, the interactive filter controls 430 are shown as interactive legends. In some implementations, the interactive filter controls 430 may be distinct from the legend. In this example, a first set of interactive filter controls 430-1 allows a user to select one or more fare classes (e.g., 1st class, 2nd class, and/or 3rd class) to be displayed in the data visualization. In this case, the 1st fare class is selected. Thus, the data visualization displays information corresponding to 1st class passengers and does not include information regarding passengers in the other (e.g., 2nd and 3rd) fare classes. A second set of interactive filter controls 430-2 allows the user to select which passengers to show: (i) all of the passengers, (ii) passengers who did not survive, or (iii) passengers who survived. The user has selected an option ("yes") that corresponds to passengers that survived. Thus, the data visualization displayed in the data visualization region 414 shows the number of passengers who had 1st class fares and survived the sinking of the Titanic. The data visualization is updated to reflect the user's selections in the interactive filter controls 430 or interactive legend. In some implementations, the data visualization is updated in real time as the user selects/deselects different options in the interactive filter controls 430 or interactive legend. For example, in response to receiving user selection of the 2nd class fare ("2") in the first set of interactive filters 430-1, an updated or modified data visualization that includes information regarding passengers who had 2nd class fares is displayed in the data visualization region 414 in place of the previously displayed data visualization.
In some implementations, if a user deselects all options from any of the first or second set of interactive filter controls, the data visualization may show no data or the data visualization region 414 may be empty.
Some implementations include a filter attribute as an encoded visual variable in the visual specification that specifies the filter conditions. For example, by adjusting the interactive filter controls, a user updates the filter visual variable. Some implementations anticipate future user needs by adding more information than requested. As a simple example, when asked "how many people in first class survived?", the system may respond with a histogram showing the number of people who survived in all class fares. The user may then deselect options corresponding to the 2nd and 3rd class fares and in response, the data visualization shown in FIG. 4B is displayed in the data visualization region.
FIGS. 4C-4E provide examples of data visualizations in some implementations.
FIG. 4C illustrates a data visualization 490, which is a bar chart showing the number of passengers aboard the Titanic, separated by age. In some implementations, the data visualization 490 is generated and displayed in response to receiving a natural language command ("age as a histogram") from a user.
FIGS. 4D and 4E illustrate data visualizations 492 and 494, respectively, each of which displays information corresponding to a data source on apartment rentals. The data visualization 492, shown in FIG. 4D, is a histogram showing the number of apartment rental types in each neighborhood. In some implementations, the data visualization 492 is generated and displayed in response to receiving a first natural language command ("how many room types for each neighborhood") from a user. In response to receiving a second natural language command ("how many beds for each neighborhood") from the user, the data visualization region 414 is populated with a second data visualization 494, which is a histogram showing the average number of beds for the apartment rentals that are available in each neighborhood. In some implementations, the first data visualization 492 is replaced by the second data visualization 492 in the data visualization region 414.
FIGS. 5A-5D provide a flow diagram illustrating a method 500 of using natural language for generating (502) a data visualization according to some implementations. The steps of the method 500 may be performed by a computer 200. In some implementations, the computer includes one or more processors and memory. FIGS. 5A-5D correspond to instructions stored in a computer memory or computer-readable storage medium (e.g., the memory 206 of the computing device 200). The memory stores one or more programs configured for execution by the one or more processors. For example, the operations of the method 500 are performed, at least in part, by a data visualization generation module 234 and/or a language processing module 238.
In accordance with some implementations, the computer receives (510) user selection of a data source. For example, referring to FIG. 1, a user may select a data source 102 that includes a plurality of data fields. The computer also receives (520) user input that specifies a first natural language command. The first natural language command includes a request for information about the data source. For example, referring to FIG. 3A, the user may ask "how many children survived?" (or "show me children aboard who survived?") in relation to a data source that includes information regarding passengers aboard the Titanic. The first natural language command may include (521) any of: a verbal user input, a user utterance, or a user input of text into a natural language input field. For example, the user input may be received as text input (e.g., via a keyboard 216 or via a touch sensitive display 214) from a user in a data-entry region (such as the natural language input box 112 described with respect to FIGS. 4A and 4B) on the display in proximity to the displayed data visualization. In some instances, the user input is received as a voice command using a microphone 220 coupled to the computer. For example, in FIG. 3A, the natural language commands 302, 304, and 306 may be specified by voice commands.
The computer then determines (530) one or more first keywords from the first natural language command and based on the one or more first keywords, the computer determines (540) a first user intent to generate a data visualization. For example, referring to FIG. 3A, the second natural language command 304 received by the computer specifies "break this down by sex and age." In some implementations, the computer extracts "break," "this," "by sex and age" from the natural language command because these cue phrases relate to the displayed data visualization. When the phrases have direct reference to data fields in the displayed data visualization, the determination (e.g., extraction) of keywords is straight forward: collect all phrases that are direct references to data fields. In some implementations, the computer stems or removes stop words, filler words, or any predefined set of words from the incoming query, and extracts all other phrases from the natural language command because they may be related to the displayed data visualization. Some implementations use this approach when the phrases in the natural language command have some indirect reference to the data fields in the displayed visualization.
The computer (550) generates a visual specification that specifies the data source, a plurality of visual variables, and a plurality of data fields from the data source. Each of the visual variables is associated with a respective one or more of the data fields and each of the data fields is identified as either a dimension or a measure. Each of the plurality of visual variables is specified based on the first user intent.
The computer then (560) generates a data visualization based on the generated visual specification and (570) displays the data visualization. Following the example in FIG. 3A, the computer displays the first data visualization 312, based on the first natural language command 302. The first data visualization 312 is generated based on a visual specification that is built in accordance with the first user intent.
In some implementations, a transcription of the first natural language command is displayed (522) in an editable field in a user interface and the computer receives (524) a first user input to edit the transcription. In such cases, the one or more keywords are determined (532) based in the edited transcription of the first natural language command. For example, as shown in FIG. 4A, a transcription of a natural language command is displayed in the natural language input box 112. The natural language input box 112 is an editable field that allows the user to edit the text/transcription displayed. For example, the user may edit the text/transcription shown in the natural language input box 112 to correct transcription errors, spelling errors, or typographical errors.
In some implementations, the computer determines one or more of: an explicit user intent (542) based on the one or more first keywords, an implicit user intent (544) based on the one or more keywords, and a data visualization type (546) based on the first user intent. When an explicit user intent and an implicit user intent are both determined, the explicit user intent is prioritized (548) over the implicit user intent. In some implementations, the data visualization is generated (562) in accordance with the determined data type.
In some implementations, the computer (580) receives a second user input to adjust one or more interactive filter controls and/or interactive legends in the user interface, modifies (582) the plurality of visual variables based on the second user input, and displays (584) a modified data visualization based on the modified plurality of visual variables. For example, FIG. 4B shows interactive filters that are displayed as part of an interactive legend. As described above, the user may use the interactive filters to select/deselect which filters are applied to the data fields and therefore, what information is displayed in the data visualization.
In some implementations, the computer also receives (590) a second natural language command and determines: one or more second keywords (591) from the second natural language command, a second user intent (592) based on the one or more keywords, and a second context (593) based on the first natural language command and/or the data visualization that is currently displayed. The computer then modifies (594) the data visualization based on the second user intent and the second context and displays (595) the modified data visualization. For example, in FIG. 3A, the computer receives a second natural language command 304 and in response, generates and displays the second data visualization 314. Additional details are provided above with respect to FIG. 3A.
FIGS. 6A-6D provide a flow diagram illustrating a method of using natural language for modifying (602) data visualizations according to some implementations. The steps of the method 600 may be performed by a computer 200. In some implementations, the computer includes one or more processors and memory. FIGS. 6A-6D correspond to instructions stored in a computer memory or computer-readable storage medium (e.g., the memory 206 of the computing device 200). The memory stores one or more programs configured for execution by the one or more processors. For example, the operations of the method 600 are performed, at least in part, by a data visualization generation module 234 and/or a language processing module 238.
In accordance with some implementations, the computer displays (610) an initial data visualization according to a visual specification that specifies the data source, a plurality of visual variables, and a plurality of data fields from the data source. Each of the visual variables is associated with a respective one or more of the data fields and each of the data fields is identified as either a dimension or a measure. For example, FIG. 3B illustrates an initial data visualization 332 showing the number of survivors by fare. The computer receives (620) a user input that specifies a first natural language command. The first natural language command includes a request for information from the data source. For example, referring to FIG. 3B, the natural language command is "split this data by survived status." The first natural language command may include (621) any of: a verbal user input, a user utterance, or a user input of text into a natural language input field. For example, the user input may be received as text input (e.g., via a keyboard 216 or via a touch sensitive display 214) from a user in a data-entry region (such as the natural language input box 112 described with respect to FIGS. 4A and 4B) on the display in proximity to the displayed data visualization. In some instances, the user input is received as a voice command using a microphone 220 coupled to the computer. For example, in FIG. 3B, the natural language command 324 may be specified by a voice command.
The computer then determines (630) one or more first keywords from the first natural language command and based on the one or more first keywords, the computer determines (640) a first user intent to modify the initial data visualization. For example, referring to FIG. 3B, the natural language command 324 received by the computer specifies "split this data by survived status." In some implementations, the computer extracts "split," "this," "by survived status" from the natural language command because these cue phrases relate to the displayed data visualization. When the phrases have direct reference to data fields in the displayed data visualization, the determination (e.g., extraction) of keywords is straight forward: collect all phrases that are direct references to data fields. In some implementations, the computer stems or removes stop words, filler words, or any predefined set of words from the incoming query, and extracts all other phrases from the natural language command because they may be related to the displayed data visualization. Some implementations use this approach when the phrases in the natural language command have some indirect reference to the data fields in the displayed visualization.
The computer then modifies (650) the plurality of visual variables based on the first user intent and displays (660) a modified data visualization based on the modified plurality of visual variables. Following example 3B, the computer determines the user intent to split the data by the data field "survived?". Thus, the computer modifies the visual variables in the visual specification to include two graphs in the data visualization, one which shows information regarding passengers of the Titanic who survived ("yes") and a second graph that shows information regarding passengers of the Titanic who did not survive ("no").
In some implementations, a transcription of the first natural language command is displayed (622) in an editable field in a user interface and the computer receives (624) a first user input to edit the transcription. In such cases, the one or more keywords are determined (632) based in the edited transcription of the first natural language command. An example is provided with respect to FIG. 4A.
In some instances, the computer determines one or more of: an explicit user intent (641) based on the one or more first keywords, a first context (642) based on the initial data visualization, an implicit user intent (643) based on the one or more keywords, and a data visualization type (644) based on the first user intent. When an explicit user intent and an implicit user intent are both determined, the explicit user intent is prioritized (645) over the implicit user intent. In some implementations, the data visualization is generated (562) in accordance with the determined data type.
In some instances, the computer receives (670) a second user input to adjust one or more interactive filter controls and/or interactive legends in user interface, updates (672) the modified plurality of visual variables based on the second user input, and displays (674) an updated data visualization based on the updated plurality of visual variables. For example, FIG. 4B shows interactive filters that are displayed as part of an interactive legend. As described above, the user may use the interactive filters to select/deselect which filters are applied to the data fields and therefore, what information is displayed in the data visualization.
In some instances, the computer receives (680) a second natural language command and determines: one or more second keywords (681) from the second natural language command, a second user intent (682) based on the one or more keywords, and a second context (683) based on the first natural language command and/or the modified data visualization. The computer then updates (684) the modified data visualization based on the second user intent and the second context and displays (685) an updated data visualization based on the updated plurality of visual variables.
The terminology used in the description of the invention herein is for the purpose of describing particular implementations only and is not intended to be limiting of the invention. As used in the description of the invention and the appended claims, the singular forms "a," "an," and "the" are intended to include the plural forms as well, unless the context clearly indicates otherwise. It will also be understood that the term "and/or" as used herein refers to and encompasses any and all possible combinations of one or more of the associated listed items. It will be further understood that the terms "comprises" and/or "comprising," when used in this specification, specify the presence of stated features, steps, operations, elements, and/or components, but do not preclude the presence or addition of one or more other features, steps, operations, elements, components, and/or groups thereof.
The foregoing description, for purpose of explanation, has been described with reference to specific implementations. However, the illustrative discussions above are not intended to be exhaustive or to limit the invention to the precise forms disclosed. Many modifications and variations are possible in view of the above teachings. The implementations were chosen and described in order to best explain the principles of the invention and its practical applications, to thereby enable others skilled in the art to best utilize the invention and various implementations with various modifications as are suited to the particular use contemplated.
* * * * *
References
D00000
D00001
D00002
D00003
D00004
D00005
D00006
D00007
D00008
D00009
D00010
D00011
D00012
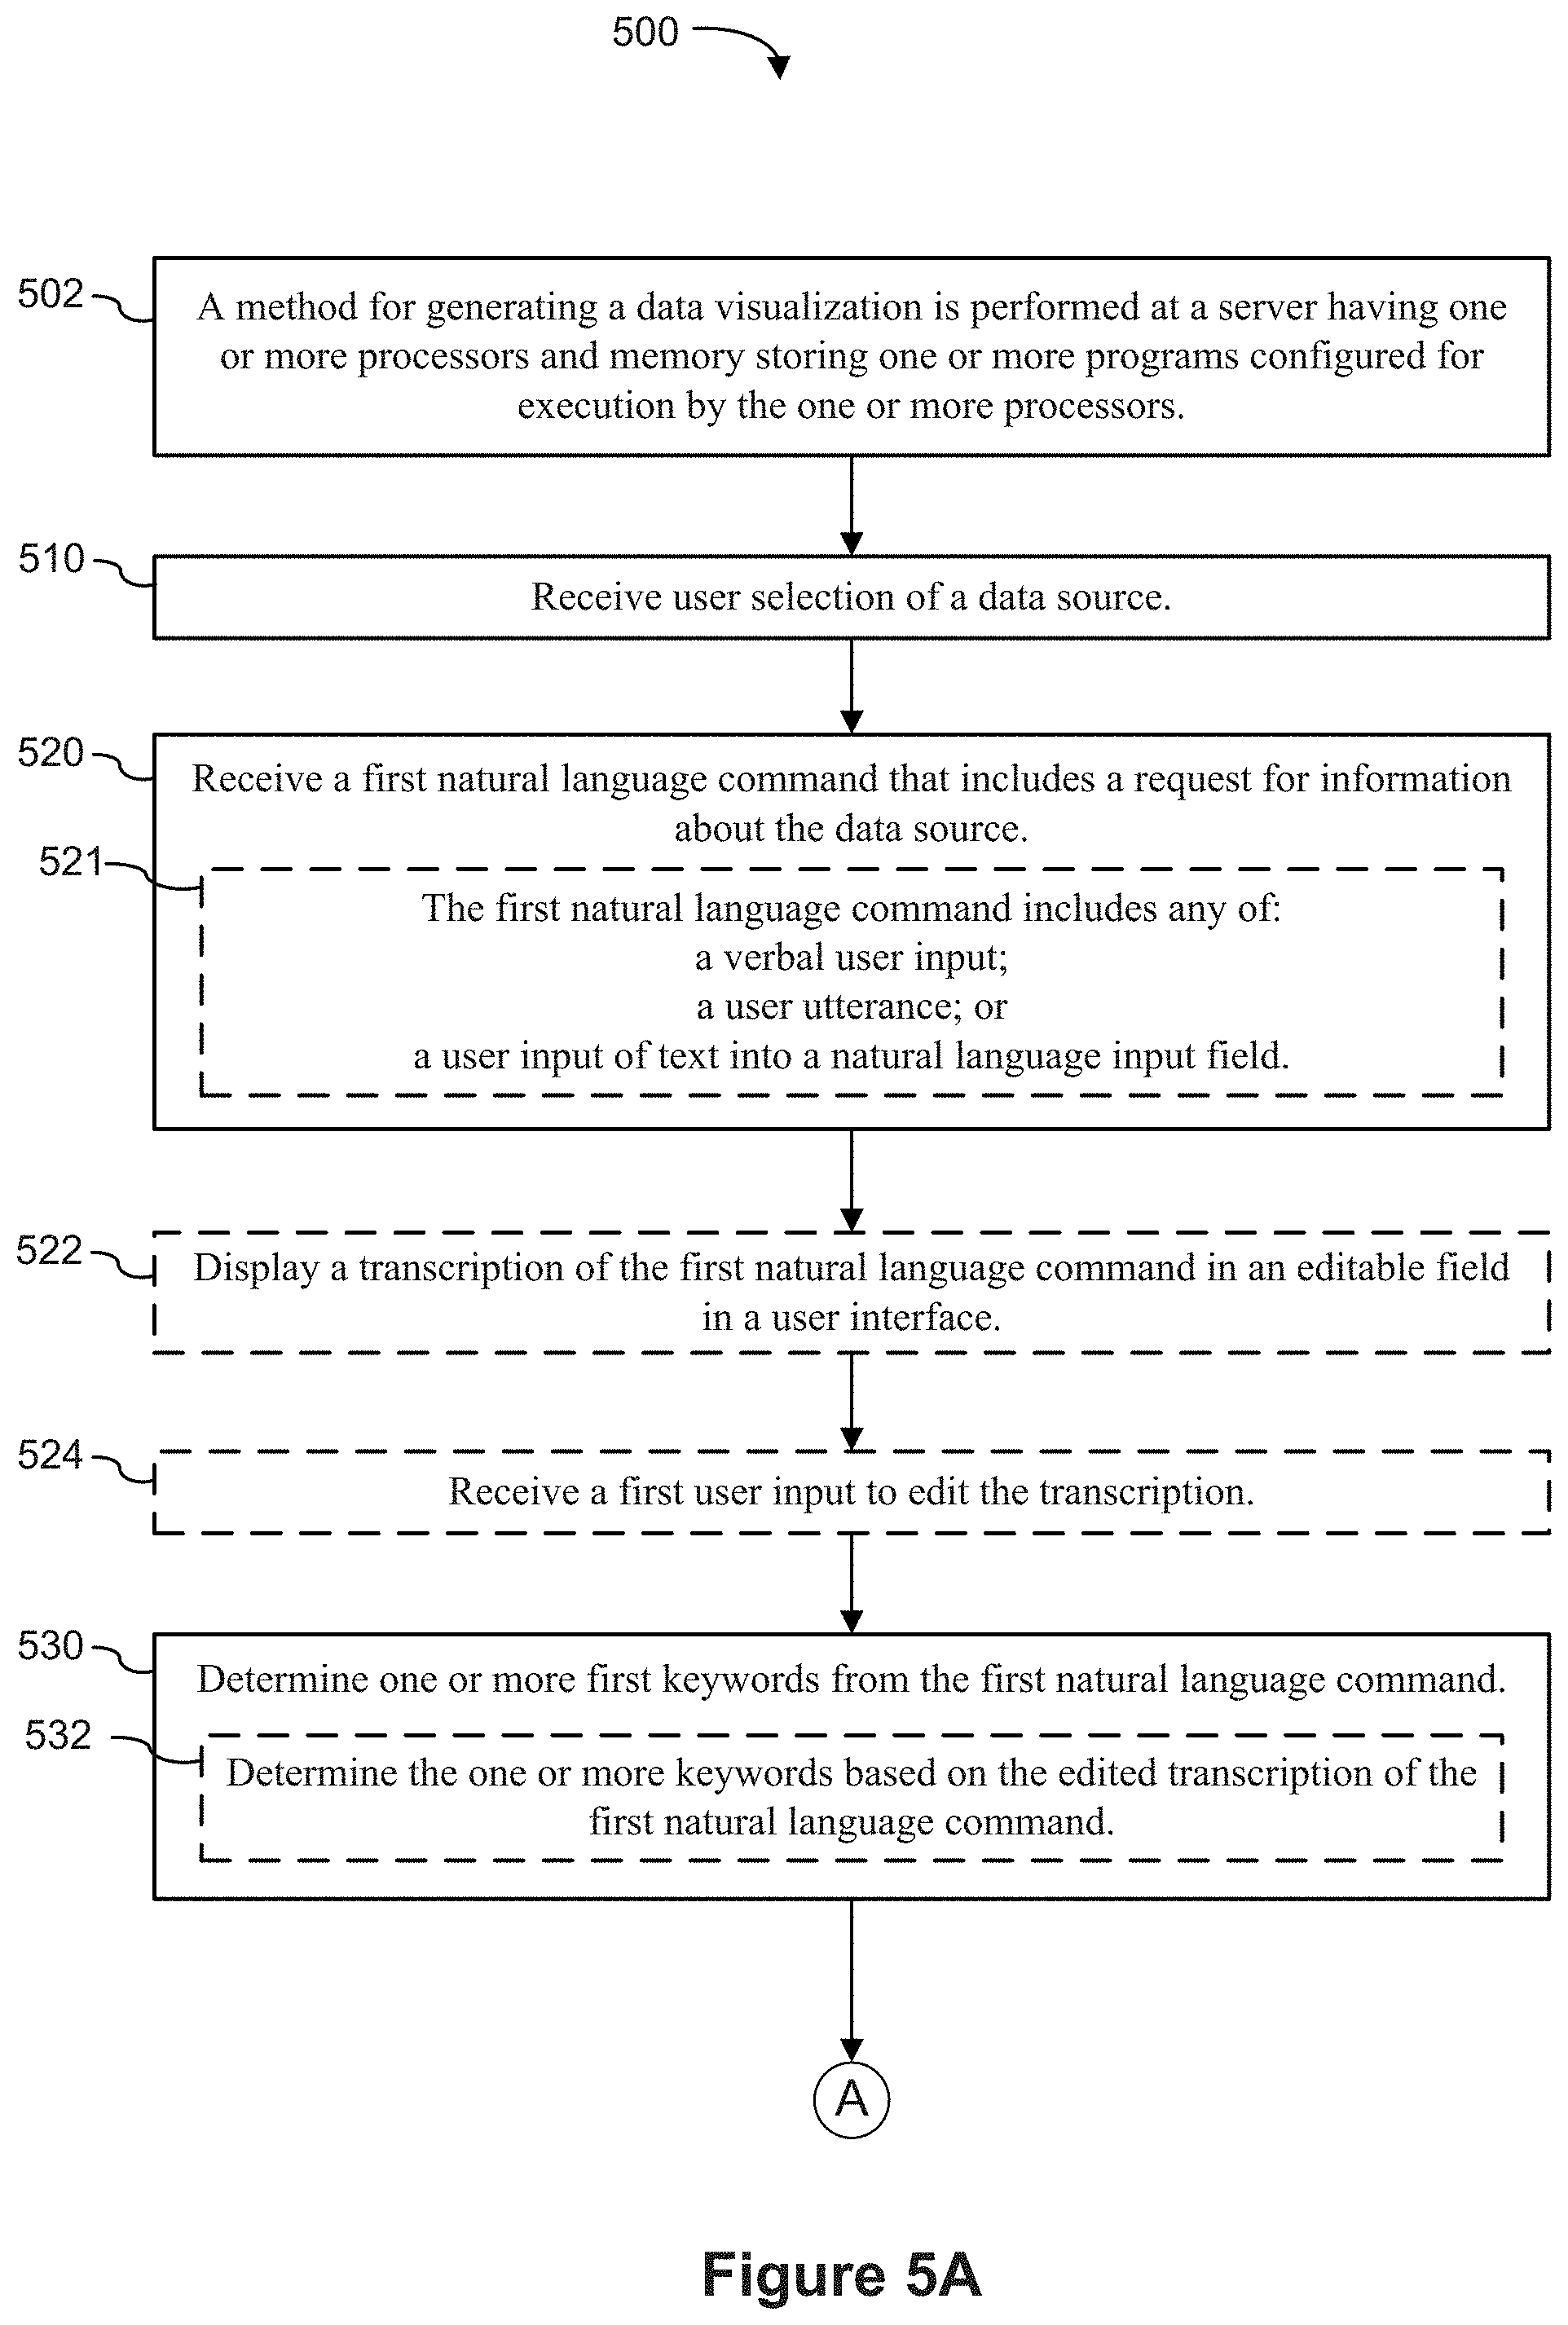
D00013

D00014

D00015
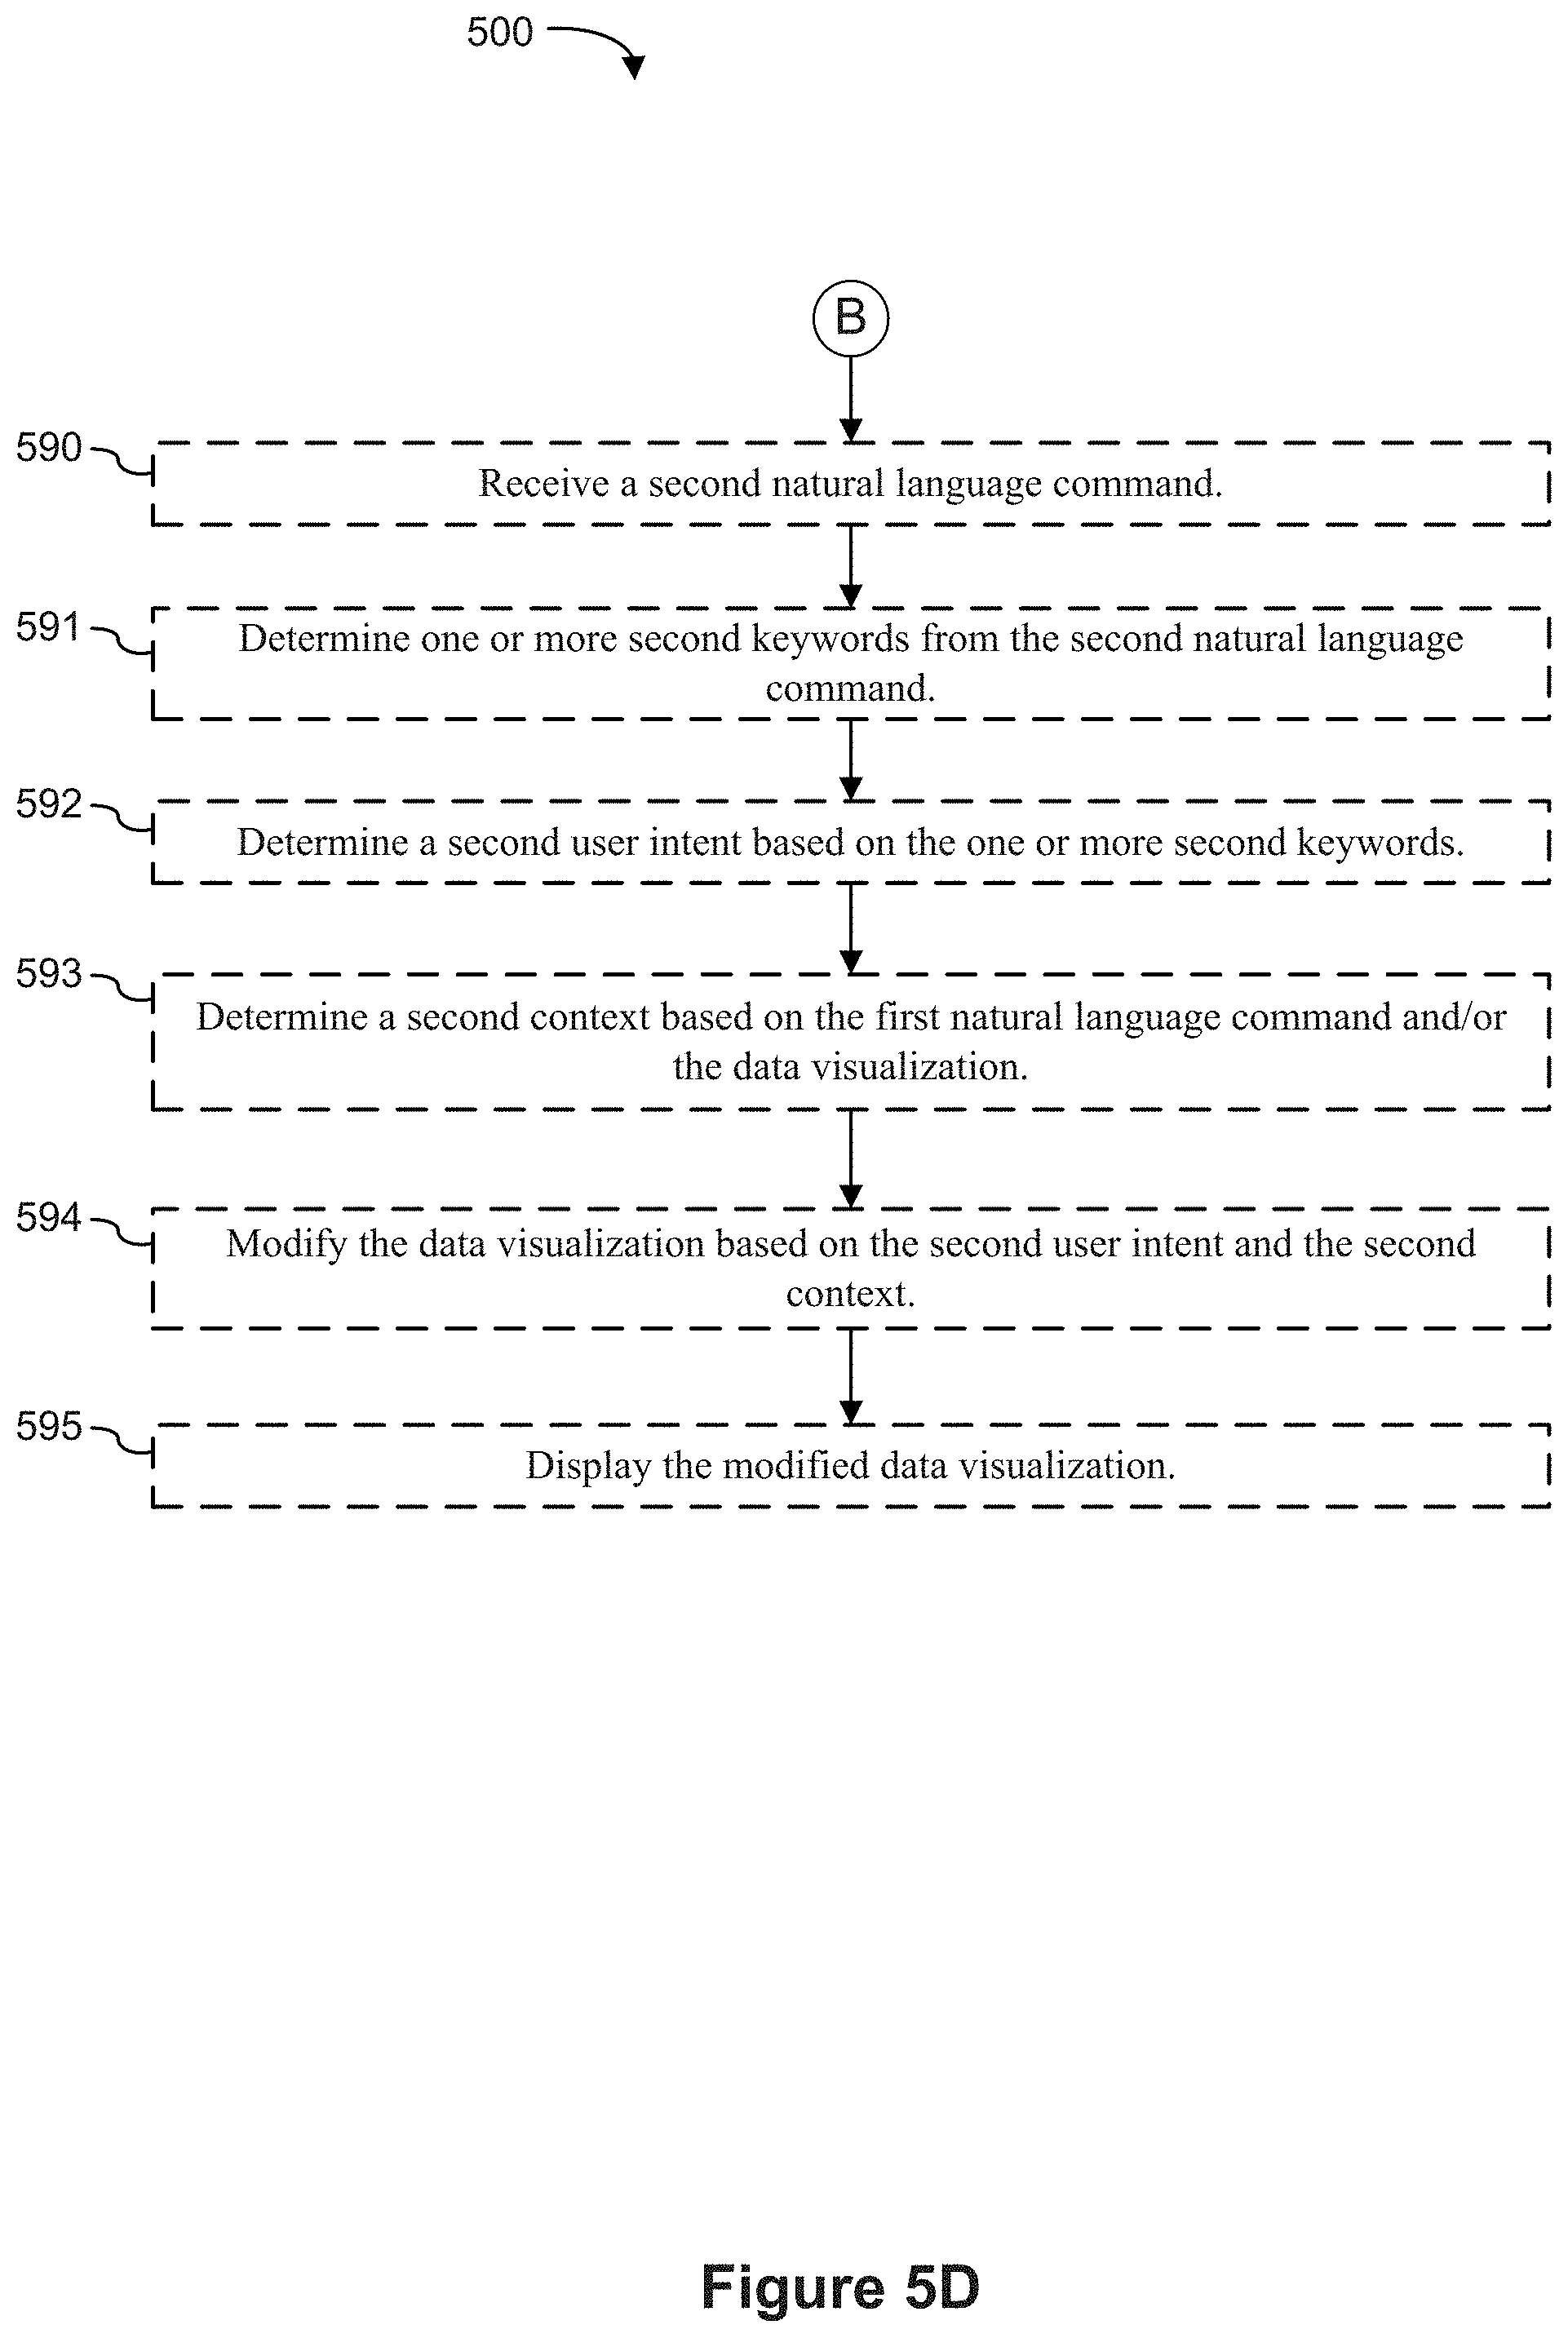
D00016

D00017

D00018

D00019

XML
uspto.report is an independent third-party trademark research tool that is not affiliated, endorsed, or sponsored by the United States Patent and Trademark Office (USPTO) or any other governmental organization. The information provided by uspto.report is based on publicly available data at the time of writing and is intended for informational purposes only.
While we strive to provide accurate and up-to-date information, we do not guarantee the accuracy, completeness, reliability, or suitability of the information displayed on this site. The use of this site is at your own risk. Any reliance you place on such information is therefore strictly at your own risk.
All official trademark data, including owner information, should be verified by visiting the official USPTO website at www.uspto.gov. This site is not intended to replace professional legal advice and should not be used as a substitute for consulting with a legal professional who is knowledgeable about trademark law.