Markers of immune response
Mascarell , et al. May 25, 2
U.S. patent number 11,015,221 [Application Number 15/521,680] was granted by the patent office on 2021-05-25 for markers of immune response. This patent grant is currently assigned to STALLERGENES. The grantee listed for this patent is STALLERGENES. Invention is credited to Veronique Bodo, Claire Gueguen, Laurent Mascarell, Philippe Moingeon, Emmanuel Nony.


View All Diagrams
| United States Patent | 11,015,221 |
| Mascarell , et al. | May 25, 2021 |
Markers of immune response
Abstract
The present invention concerns methods for determining if a dendritic cell is a type 2 dendritic cell or a tolerogenic dendritic cell, methods for determining if a patient undergoing immunotherapy, and/or who has been administered with a vaccine, is developing an immune response oriented either towards a regulatory T cell response or towards an effector type 2 cell response, and methods of determining response to immunotherapy.
| Inventors: | Mascarell; Laurent (Paris, FR), Gueguen; Claire (Reading, GB), Nony; Emmanuel (Antony, FR), Moingeon; Philippe (Verrieres le Buisson, FR), Bodo; Veronique (Palaiseau, FR) | ||||||||||
|---|---|---|---|---|---|---|---|---|---|---|---|
| Applicant: |
|
||||||||||
| Assignee: | STALLERGENES (Antony,
FR) |
||||||||||
| Family ID: | 1000005574149 | ||||||||||
| Appl. No.: | 15/521,680 | ||||||||||
| Filed: | October 29, 2015 | ||||||||||
| PCT Filed: | October 29, 2015 | ||||||||||
| PCT No.: | PCT/EP2015/075174 | ||||||||||
| 371(c)(1),(2),(4) Date: | April 25, 2017 | ||||||||||
| PCT Pub. No.: | WO2016/066770 | ||||||||||
| PCT Pub. Date: | May 06, 2016 |
Prior Publication Data
| Document Identifier | Publication Date | |
|---|---|---|
| US 20170233816 A1 | Aug 17, 2017 | |
Foreign Application Priority Data
| Oct 29, 2014 [EP] | 14306733 | |||
| Current U.S. Class: | 1/1 |
| Current CPC Class: | C12Q 1/6881 (20130101); C12Q 1/6883 (20130101); G01N 33/505 (20130101); G01N 33/5023 (20130101); C12Q 1/6886 (20130101); C12Q 2600/158 (20130101); C12Q 2600/106 (20130101) |
| Current International Class: | C12Q 1/6883 (20180101); C12Q 1/6886 (20180101); G01N 33/50 (20060101); C12Q 1/6881 (20180101) |
References Cited [Referenced By]
U.S. Patent Documents
| 7645575 | January 2010 | Wohlgemuth |
| 2003/0134283 | July 2003 | Peterson |
| 2013034569 | Mar 2013 | WO | |||
Other References
|
Esnault S, Kelly EA, Schwantes EA, Liu LY, DeLain LP, et al. (2013) Identification of Genes Expressed by Human Airway Eosinophils after an in Vivo Allergen Challenge. PLoS One 8(7): e67560. (Year: 2013). cited by examiner . NCBI Platform GPL17077. Agilent-039494 SurePrint G3 Human GE v2 8x60K Microarray 039381. two pages. (Year: 2013). cited by examiner . Masuda et al., 2003, J. Rheum. vol. 30: 1911-1917. cited by examiner . Chauhan et al., 2015, J. Biol. Chem. vol. 290: 5127-5140. cited by examiner . Kowal et al., 2012, Scan. J. Immunol. pp. 531-539. cited by examiner . Zhong et al., 2012, Blood, vol. 120: 3326-3335. cited by examiner . Huang et al., 2012, Gene, vol. 504: 284-287. cited by examiner . Sugita et al., 1999, Clin. Exp Immunol. vol. 117: 350-354. cited by examiner . Watanabe et al., 1998, Clin. Immunol. vol. 88: 91-95. cited by examiner . Moniuszko et al., 2007, Folia Histo. et Cyto: vol. 45: 181-189. cited by examiner . Hatjiharissi et al., 2007, Blood vol. 110: 2561-2564. cited by examiner . Bournazos et al., Immunity vol. 47: 224-233. cited by examiner . Geo Accession viewer for GF211, 2019, pp. 1-57. cited by examiner . Lynch, 2000, J. Leuk. Biol. vol. 67: 279-284. cited by examiner . Dreschler et al., 2011, J. Aller. Clin. Immunol. vol. 127: 487-94. cited by examiner . Kayserova et al., 2011, Scan J. Immunol. pp. 305-312. cited by examiner . Liu et al., 2005, Clin. Exp. Allergy vol. 35: 1581-1590. cited by examiner . Torres-Aguilar et al., 2010, J. Immunol. vol. vol. 184: 1765-1775. cited by examiner . Hirsch et al., 2015: Immunotargets and Therapy vol. 4: 1-11. cited by examiner . Fick et al., 2000, Immunopharm. vol. 48: 307-310. cited by examiner . Liu et al., 2000, Blood, vol. 95: 2482-2483. cited by examiner . Yerkovich et all., 2009, J Allergy Clin Immunol. vol. 123: 209-216. cited by examiner . Lundberg et al., Sep. 2014, Allergy, vol. 69: p. 162. cited by examiner . Zimmer et al.,"A regulatory dendritic cell signature correlates with the clinical efficacy of allergen-specific sublingual immunotherapy", Journal of Allergy and Clinical Immunology, pp. 1020-1030, vol. 129, No. 4 (Feb. 2012). cited by applicant . J. Gomez et al.,"Differential up-regulation of HLA-DM, invariant chain, and CD83 on myeloid and plasmacytoid dendritic cells from peripheral blood" Tissue Antigens, pp. 149-157, vol. 63, No. 2 (Feb. 2004). cited by applicant . Lonial et al.,"Regulation of alloimmune responses by dendritic cell subsets", Experimental Hematology, pp. 1309-1317, vol. 36, No. 10 (Oct. 2008). cited by applicant . Arpinati et al.,"Use of anti-BDCA-2 antibody for detection of dendritic cells type-2 (DC2) in allogeneic hematopoietic stem cell transplantation", Bone Marrow Transplantation, pp. 887-891, vol. 29, No. 11 (Jun. 2002). cited by applicant . Querec et al.,"Systems biology approach predicts immunogenicity of the yellow fever vaccine in humans", Nature Immunology, pp. 116-125, vol. 10, No. 1 (Nov. 2008). cited by applicant . De Baey Annegret et al.,"Phenotype and function of human dendritic cells derived from M-DC8+ monocytes" European Journal of Immunology, pp. 1646-1655, vol. 31, No. 6 (Jun. 2001). cited by applicant . Piccioli et al.,"Functional specialization of human circulating CD16 and CD1c myeloid dendritic-cell subsets" Blood, pp. 5371-5379, vol. 109, No. 12 (Jun. 2007). cited by applicant . Mellor et al.,"A critical review of the role of Fc gamma receptor polymorphisms in the response to monoclonal antibodies in cancer", Journal of Hematology & Oncology, pp. 1756-8722, vol. 6, No. 1 (Jan. 2013). cited by applicant . Gordon et al.,"Regulatory Dendritic Cells for Immunotherapy in Immunologic Disease", Frontiers in Immunology, pp. 1-19, vol. 5 (Jan. 2014). cited by applicant . Adkis et al.,"Mechanisms of allergen-specific immunotherapy: Multiple suppressor factors at work in immune tolerance to allergens" J Allergy Clin Immunol, pp. 621-631 (Mar. 2014). cited by applicant . Moingeon et al.,"Immune mechanisms of allergen-specific sublingual immunotherapy", Allergy, pp. 151-165, (Sep. 2005). cited by applicant . Jain et al, "Cutting Edge: Dab2 Is F0XP3 Target Gene Required for Regulatory T Cell Function", The Journal of Immunology, pp. 4192-4196, vol. 183, No. 7 (Sep. 2009). cited by applicant . Ahmed et al.,"Dab2, a negative regulator of DC irmunogenicity, is an attractive molecular target for DC-based inmunotherapy" Oncoimmunology, pp. 1-15, vol. 4, No. 1 (Jan. 2015). cited by applicant . Sallusto et al.,"Efficient Presentation of Soluble Antigen by Cultured Human Dendritic Cells is Maintained by Granulocyte/Macrophage Colony-stimulating Factor Plus luterleukin 4 and Downregulated by Tumor Necrosis Factor (sigma)", J. Exp. Med , pp. 1109-1118, vol. 179 (Apr. 1994). cited by applicant . Scadding et al.,"Sublingual grass pollen immunotherapy is associated with increases in sublingual Foxp3-expressing cells and elevated allergen-specific immunog lobulin G4, immunoglobulin A and serum inhibitory activity for immunoglobulin E-facilitated allergen binding to B cells" Clinical & Experimental Allergy, pp. 598-606, vol. 40 (Dec. 2009). cited by applicant . Van Overtvelt et al.,"Changes in basophil activation during grass-pollen sublingual immunotherapy do not correlate with clinical efficacy" Allergy, pp. 1530-1537, 66 (Jul. 2011). cited by applicant . Zimmer et al.,"Identification of a New Phenotype of Tolerogenic Human Dendritic Cells Induced by Fungal Proteases from Aspergillus oryzae", J Immunol., pp. 3966-3976 (Mar. 2011). cited by applicant . Bohle et al.,"Sublingual immunotherapy induces IL-10--producing T regulatory cells, allergen-specific T-cell tolerance, and immune deviation", J Allergy Clin Immunol., pp. 707-713, vol. 120, No. 3 (Aug. 2007). cited by applicant . Horak et al.,"Early onset of action of a 5-grass-pollen 300-IR sublingual immunotherapy tablet evaluated in an allergen challenge chamber" J Allergy Clin Immunol., pp. 471-477 (Sep. 2009). cited by applicant . Kasturi et al.,"Programming the magnitude and persistence of antibody responses with innate immunity", Nature, pp. 543-547, vol. 470, No. 7335 (Feb. 2011). cited by applicant . Florin-Dan et al."Molecular biomarkers for grass pollen immunotherapy" World Journal of Methodology, pp. 26-45 , vol. 1, No. 1 (Mar. 2014). cited by applicant . Gueguen et al.,"Changes in markers associated with dendritic cells driving the differentiation of either TH2 cells or regulatory T cells correlate with clinical benefit during allergen immunotherapy" Journal of Allergy and Clinical Immunology, pp. 545-558 vol. 137, No. 2 (Oct. 2015). cited by applicant. |
Primary Examiner: Juedes; Amy E
Attorney, Agent or Firm: Browdy and Neimark, PLLC
Claims
The invention claimed is:
1. A method for treating a patient suffering from allergy and is undergoing allergen immunotherapy, which method comprises the steps of: a) administering an effective amount of an allergen immunotherapy to a patient suffering from the allergy; b) determining the level of expression of at least one marker protein comprising Fc.gamma.RIIIa, or of an mRNA thereof, in a biological sample from the patient treated with allergen immunotherapy, said biological sample containing dendritic cells; c) comparing the level of expression of the at least one marker protein, or of an mRNA thereof, measured in step b) with that of a control; and d) based on the comparison with the control, determining if the immune response developed by the patient is shifting from a Th2 response towards a tolerogenic T cell response, Wherein the control consists of a biological sample from the patient obtained before the patient undergoes allergen immunotherapy, said biological sample containing dendritic cells, and wherein step d) is as follows: identifying that the immune response developed by the patient is shifting from a Th2 response towards a tolerogenic T cell response when the level of expression of the at least one marker protein comprising Fc.gamma.RIIIa, or of an mRNA thereof, is higher than that of the control, and then proceeding with administering further rounds of the same allergen immunotherapy; or identifying that the immune response developed by the patient is not shifting from a Th2 response towards a tolerogenic T cell response when the level of expression of the at least one marker protein comprising Fc.gamma.RIIIa, or of an mRNA thereof is lower than that of the control, and then stopping the allergen immunotherapy administration to the patient.
2. The method according to claim 1, wherein the immune response developed by the patient is identified as shifting from a Th2 response towards a tolerogenic T cell response when the level of expression of the at least one marker protein compri sing Fc.gamma.RIIIa, or of an mRNA thereof, is higher than the control.
3. The method according to claim 1, wherein the allergen immunotherapy is a desensitization therapy.
Description
The present invention concerns markers of different subsets of dendritic cells, and the use thereof to assess immune response in an individual.
Allergen immunotherapy (AIT) is an efficacious therapy for type I respiratory allergies, which reorients CD4+ T cells from a Th2 towards a Th1/Treg pattern (Moingeon et al. (2006) Allergy 61:151-165; Bohle et al. (2007) J. Allergy Clin. Immunol. 120:707-713; Akdis et al. (2014) J. Allergy Clin Immunol. 3:621-631). However, surrogate biomarkers which could be used as follow-up read-outs of AIT efficacy remain to be fully established.
Several biological parameters were previously evaluated during AIT in order to identify such markers of clinical efficacy: generation of Treg cells, changes in blocking IgG.sub.4 antibody responses, down-regulation of Th2 response, and decrease of basophils activity. These markers were identified in open clinical studies with small cohorts and without established links with clinical efficacy (Bohle et al. (2007) J. Allergy Clin. Immunol. 120:707-713; Scadding et al. (2010) Clinical & Experimental Allergy 40:598-606). In recent studies, the inventors took advantage of a double-blind, placebo-controlled study conducted in a pollen chamber in a cohort of 82 grass pollen allergic patients to test allergen reactivity of peripheral blood basophils, changes in phenotype and in cytokine secretion in grass pollen-specific CD4+ T cells, and antibody responses after AIT. However, none of those parameters was confirmed to be a marker for the early onset of efficacy of AIT (Van Overtvelt et al. (2011) Allergy 66:1530-1537).
Accordingly, there is still an important need of biochemical markers indicative of the immune response developed by a subject further to an immunotherapy.
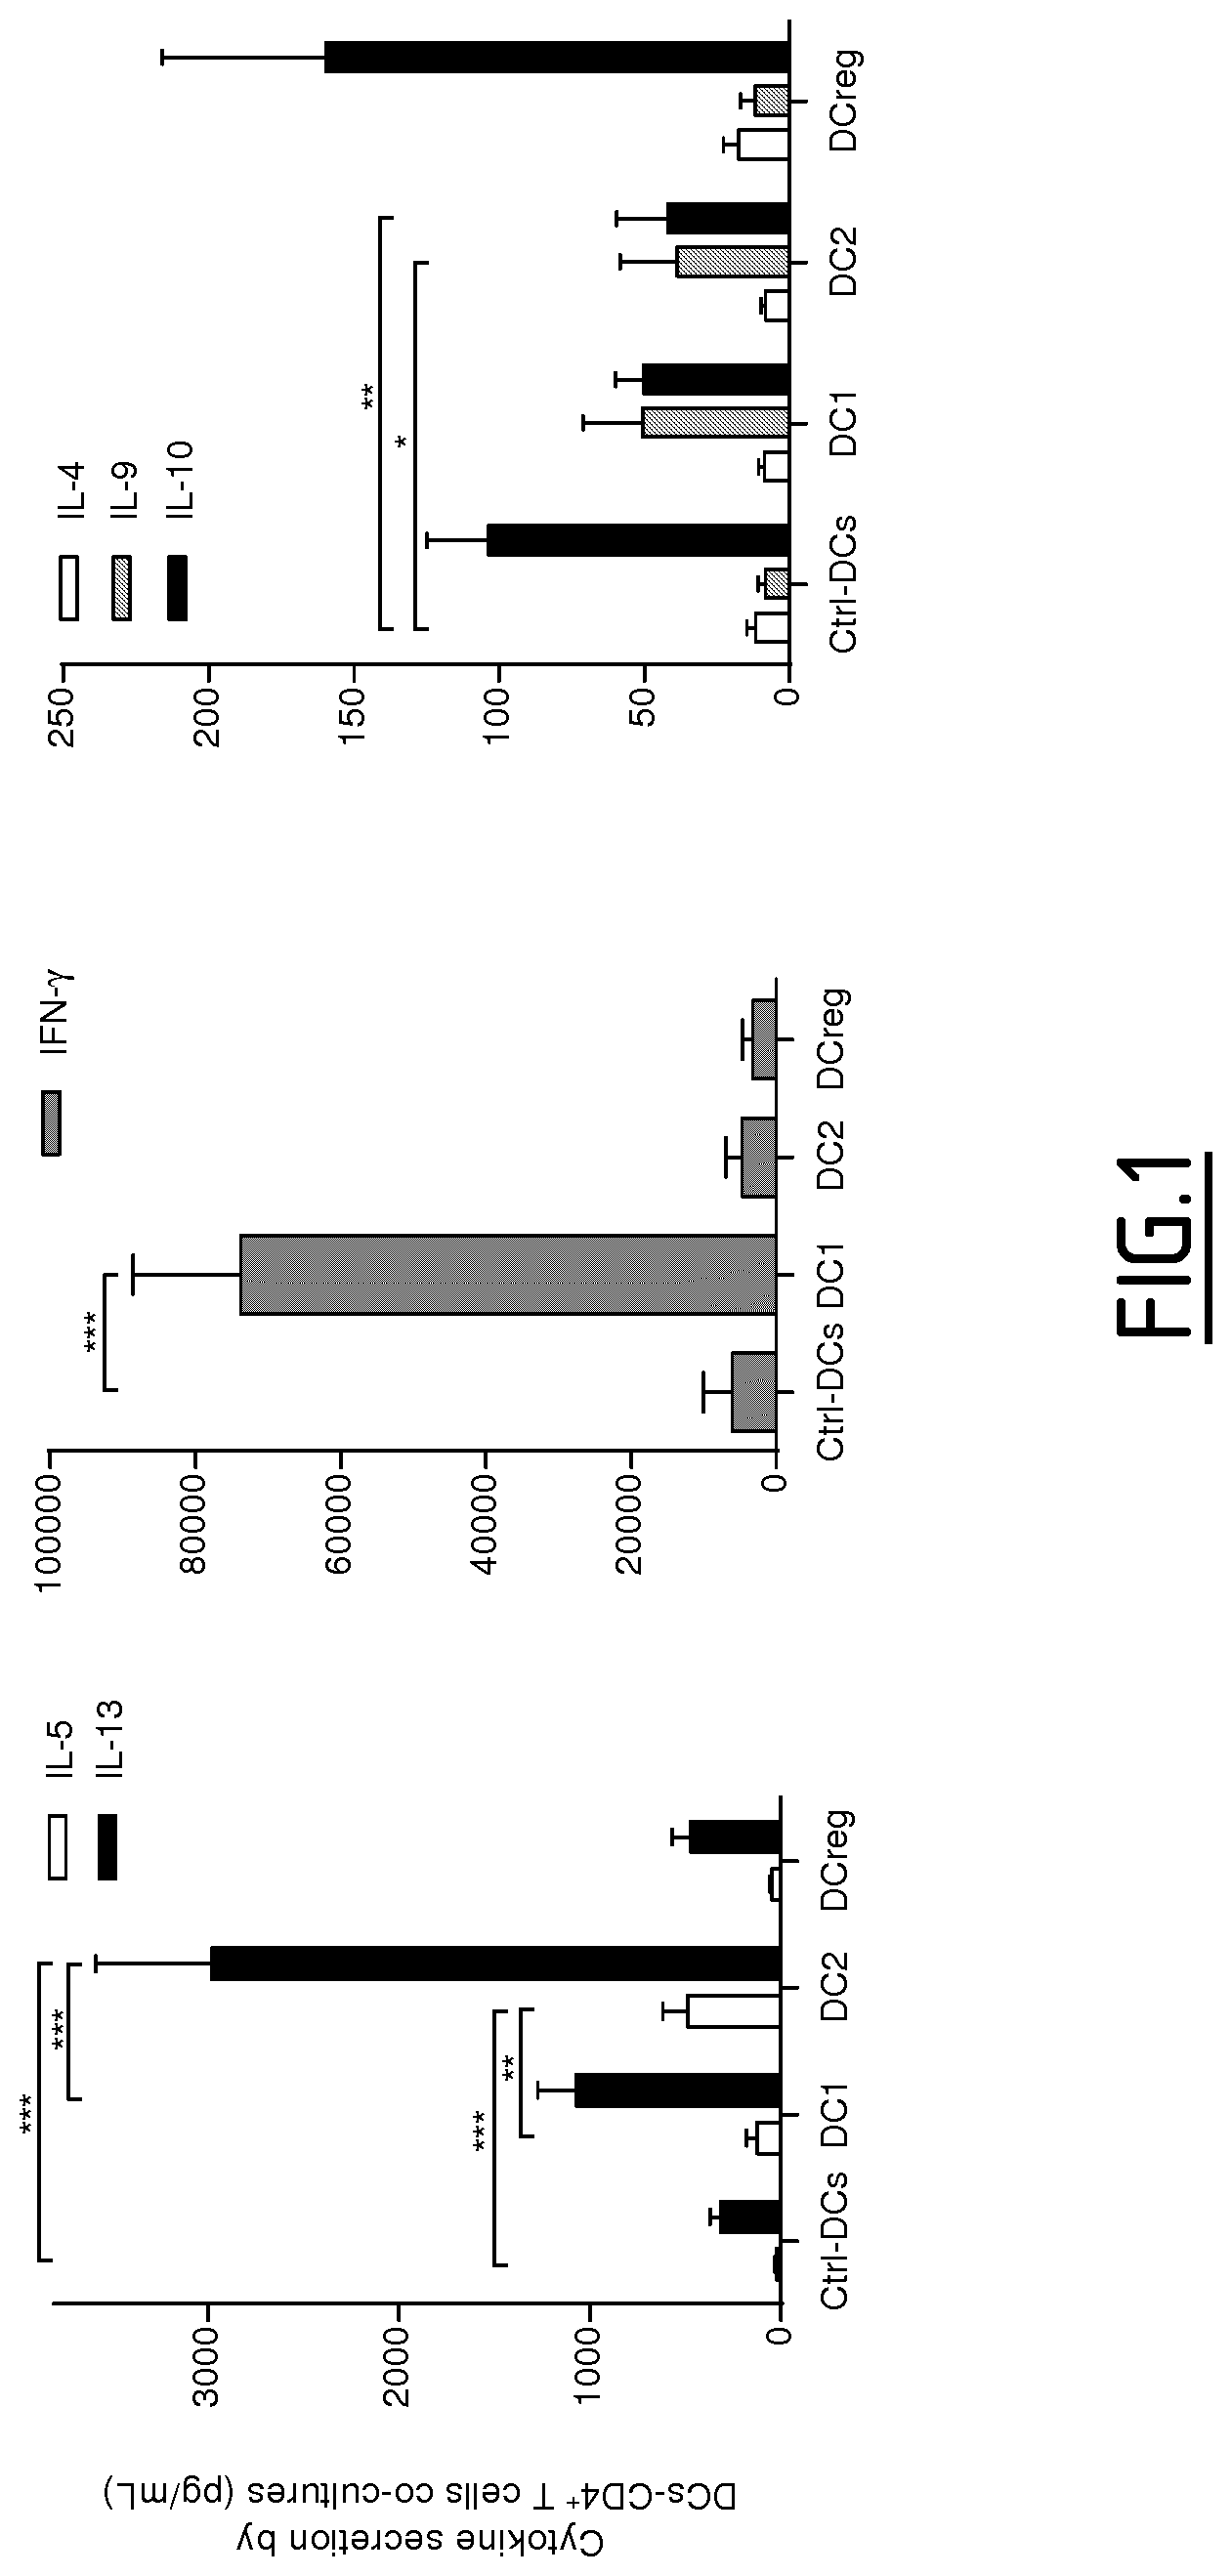
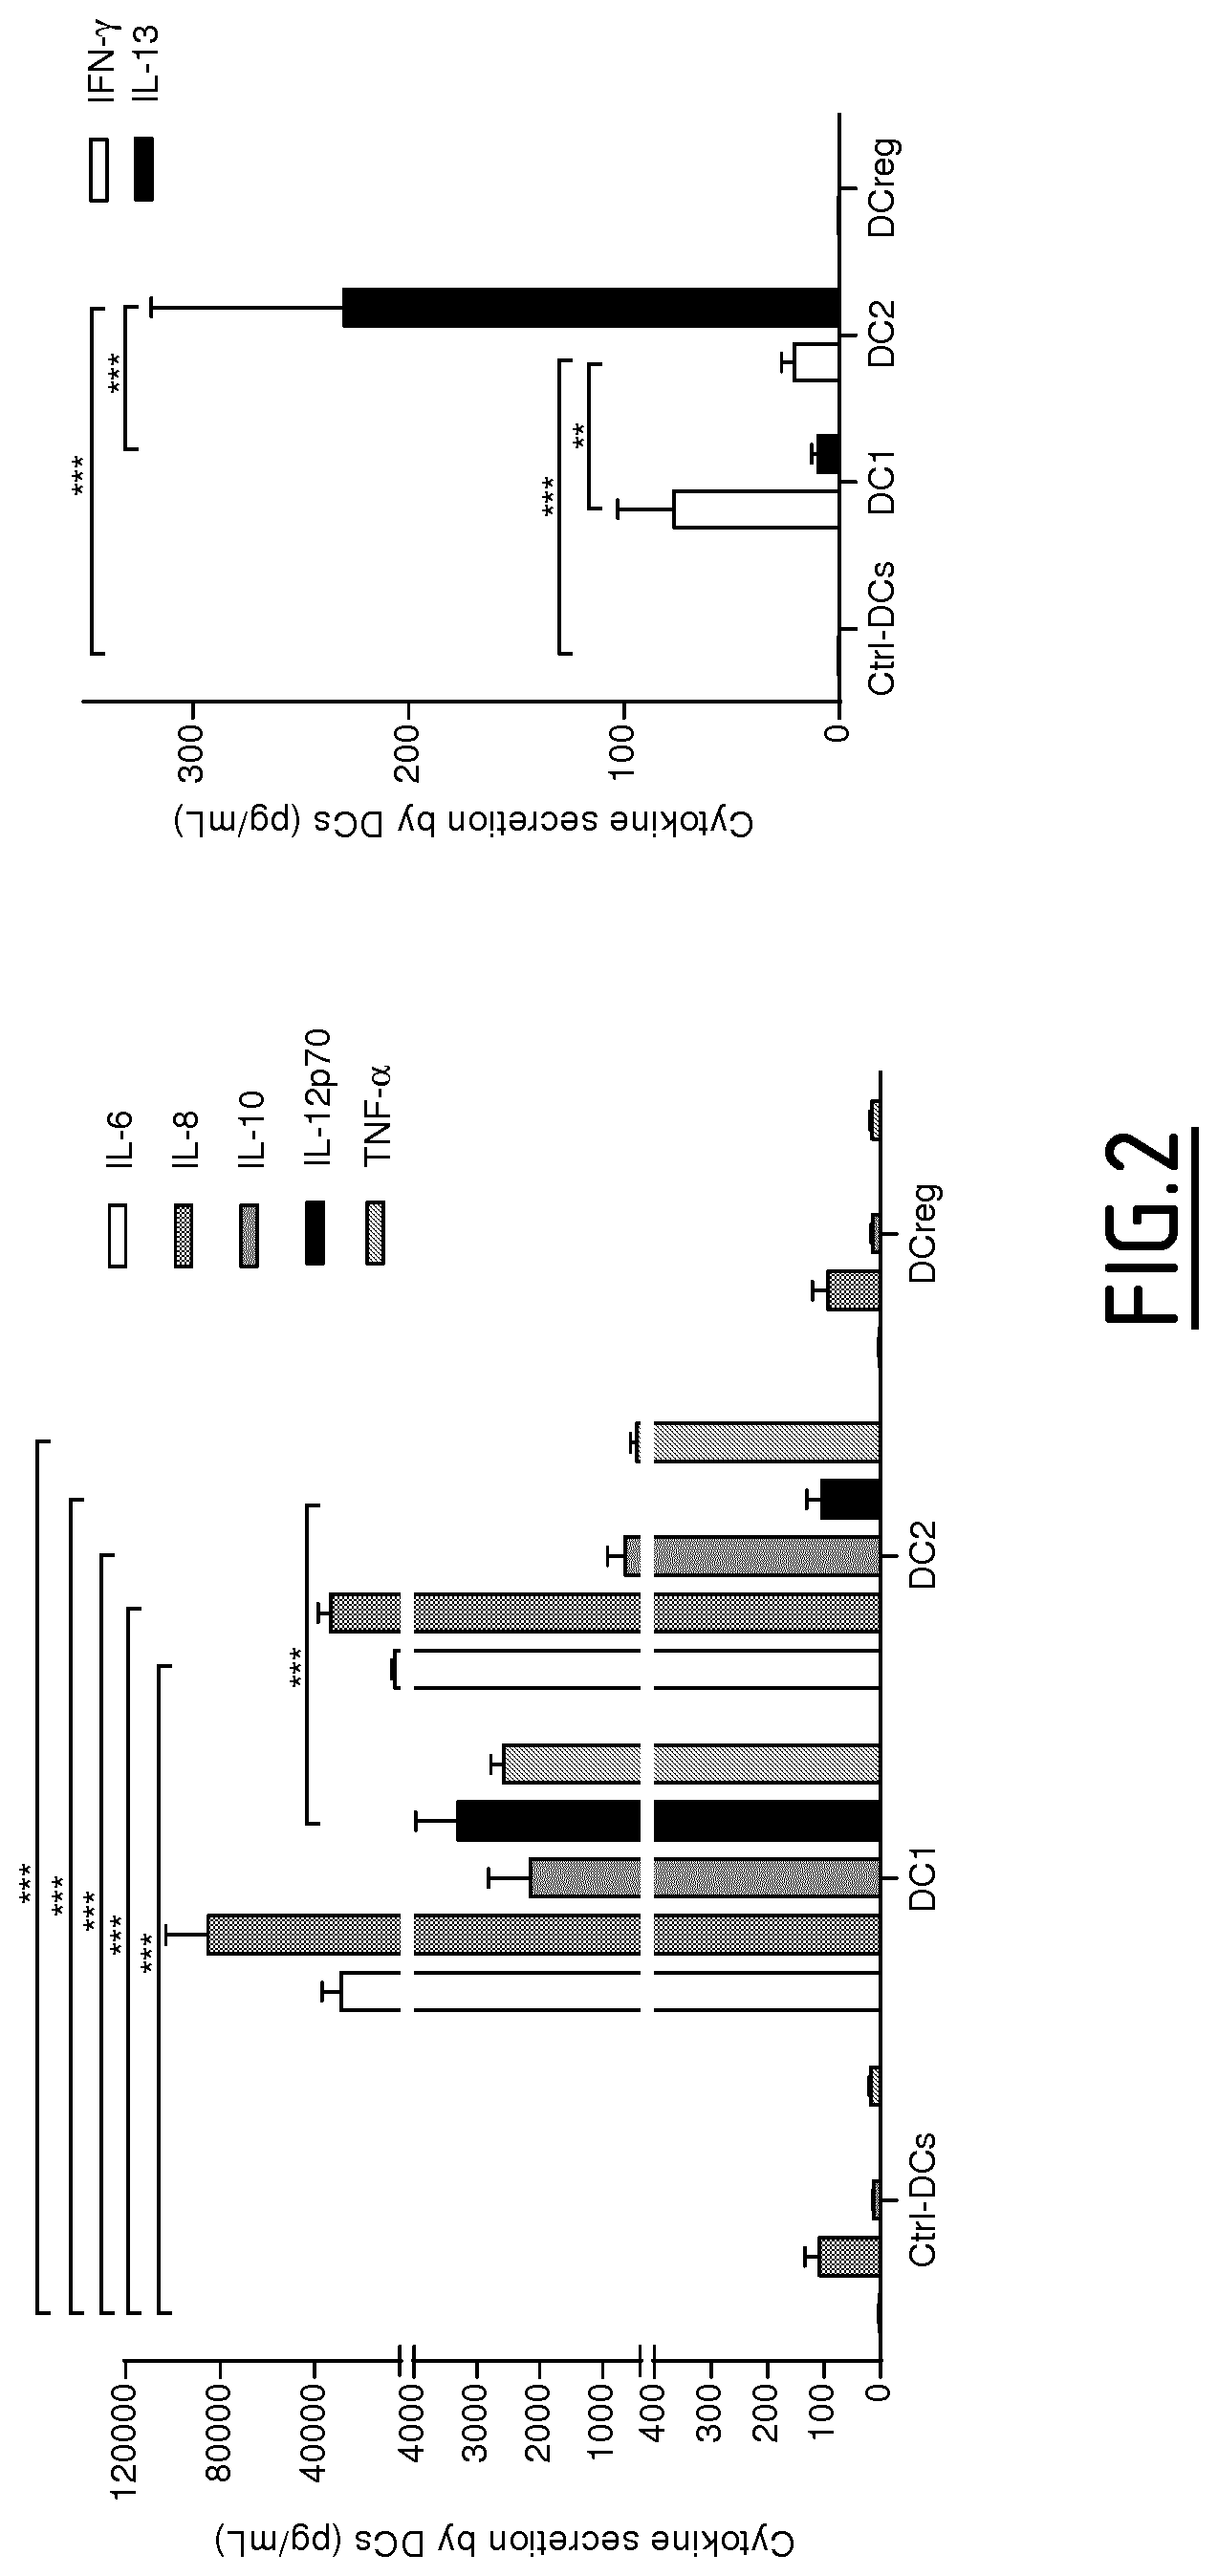
Dendritic cells (DCs) are key players to assess proper polarization or reorientation of T helper responses (Th1, Th2 and Treg induced by DC1, DC2 and DCreg, respectively) and recent findings revealed a growing interest in characterizing molecular markers from monocyte-derived dendritic cells (MoDCs) which persist in patient's blood following vaccination or immunotherapy (Querec et al. (2009) Nat. Immunol. 10:116-125; Kasturi et al. (2011) Nature 470:543-547; Zimmer et al. (2012) J. Allergy Clin. Immunol. 129:1020-1030).
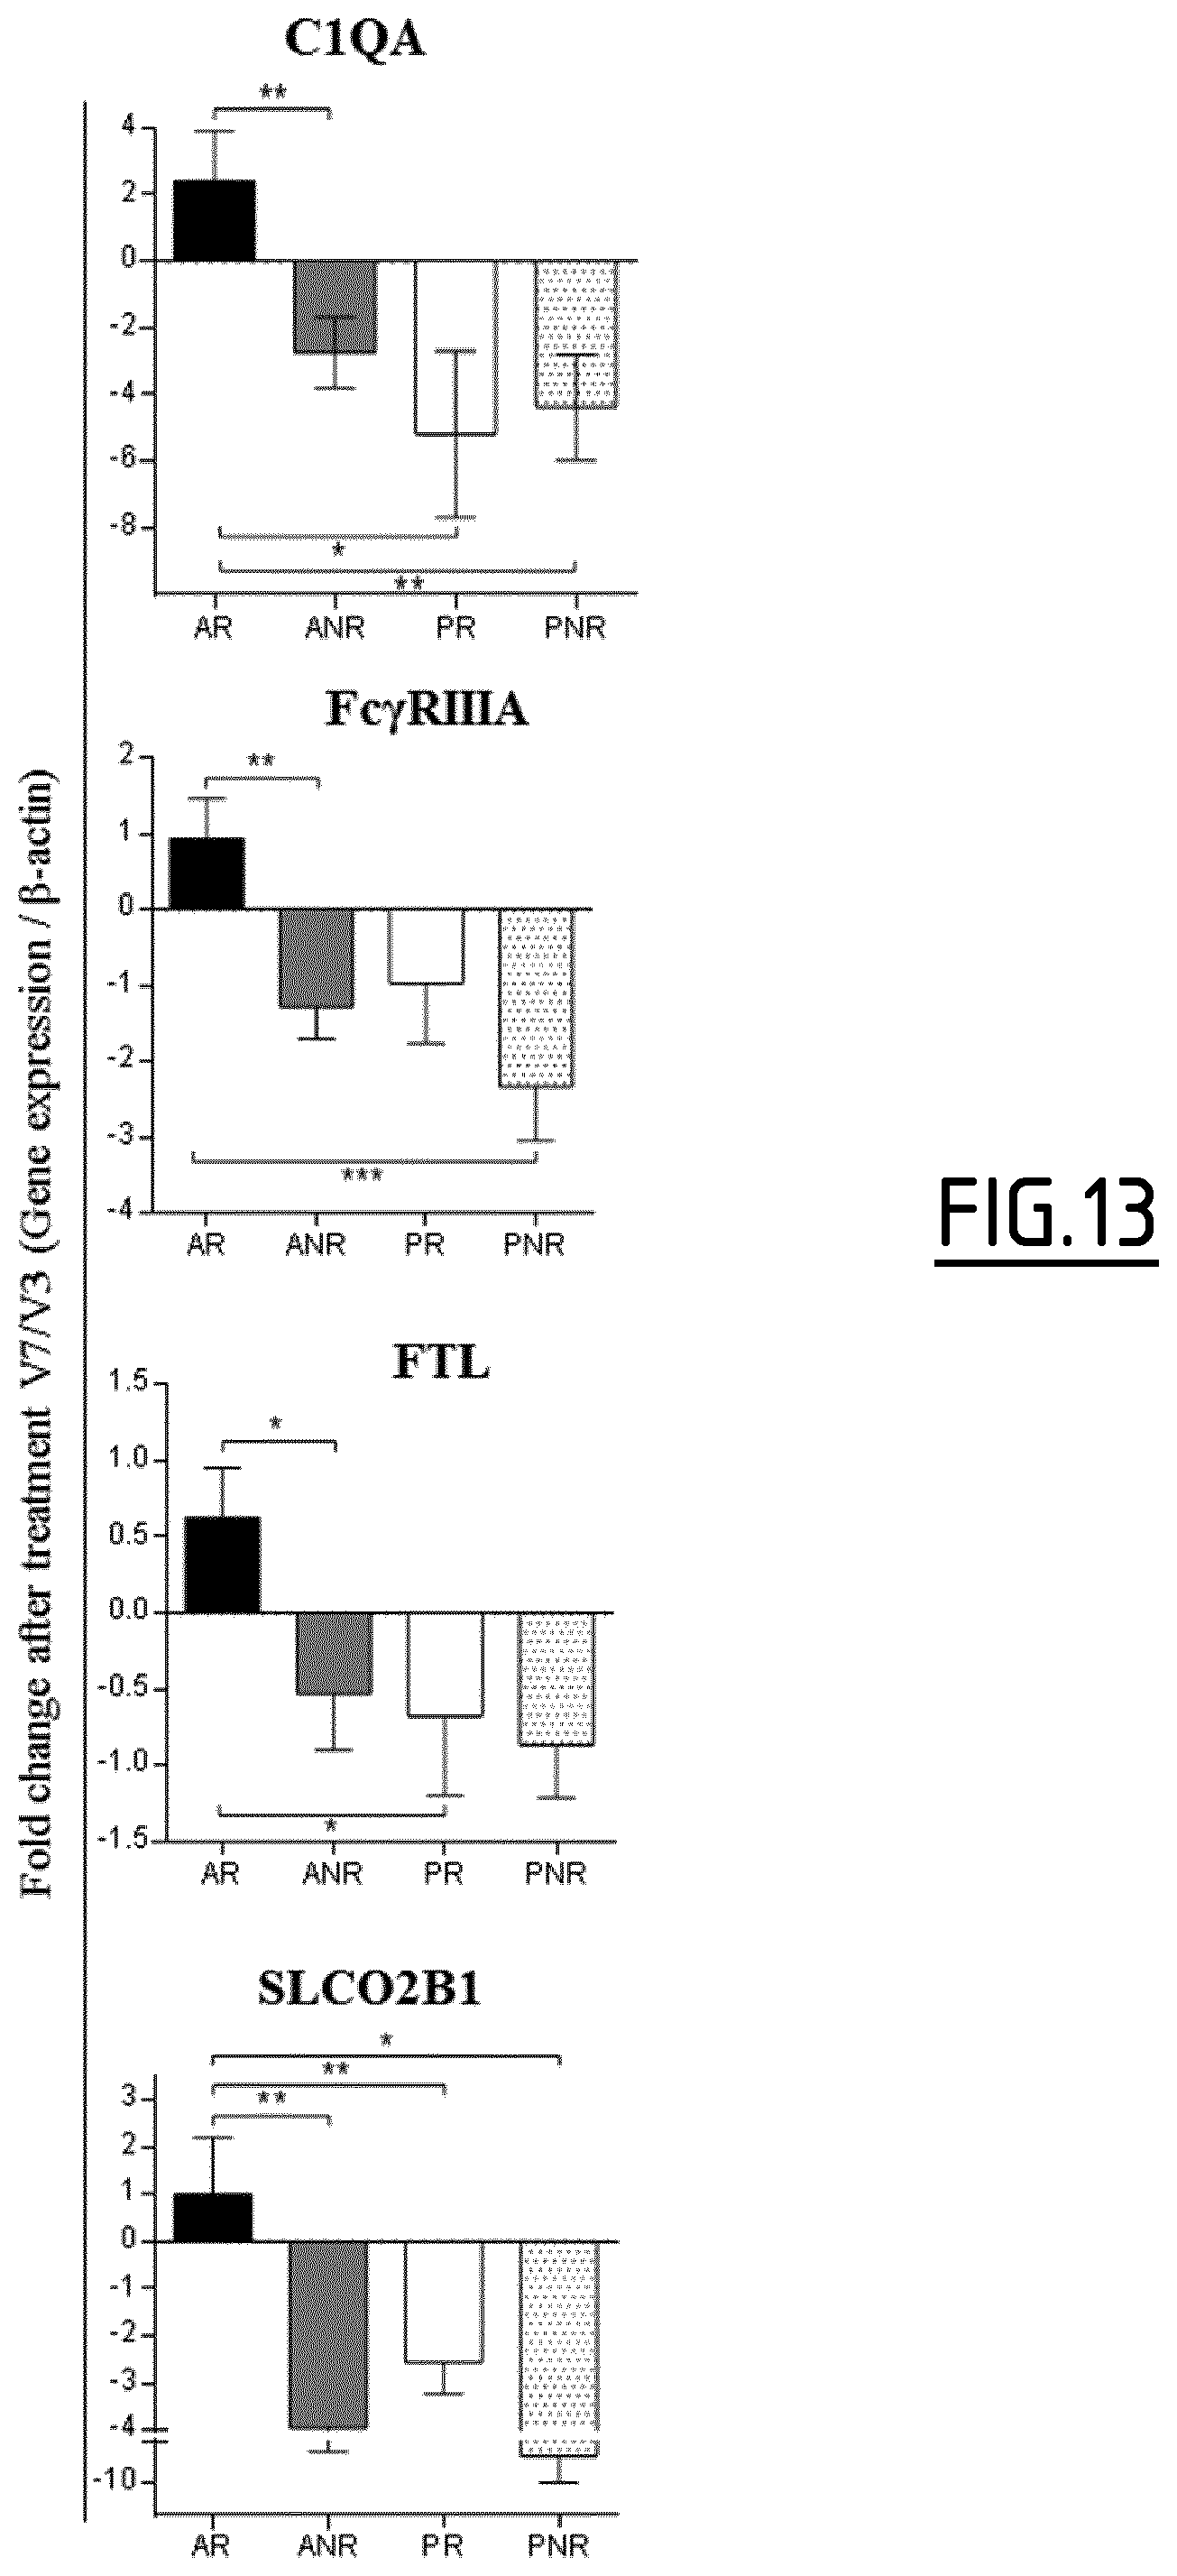
The inventors previously showed that the increased expression of the DCreg markers C1Q and Stabilin-1 in peripheral blood mononuclear cells (PBMCs) of grass pollen allergic patients correlated with clinical efficacy of AIT (Zimmer et al. (2012) J. Allergy Clin. Immunol. 129:1020-1030; International application WO 2013/034569). However, whereas down-regulation of Th2 response is known to be a marker of the clinical efficacy of AIT, no alteration of DC2 markers, which could be useful to predict the efficacy of AIT, has been identified yet.
DESCRIPTION OF THE INVENTION
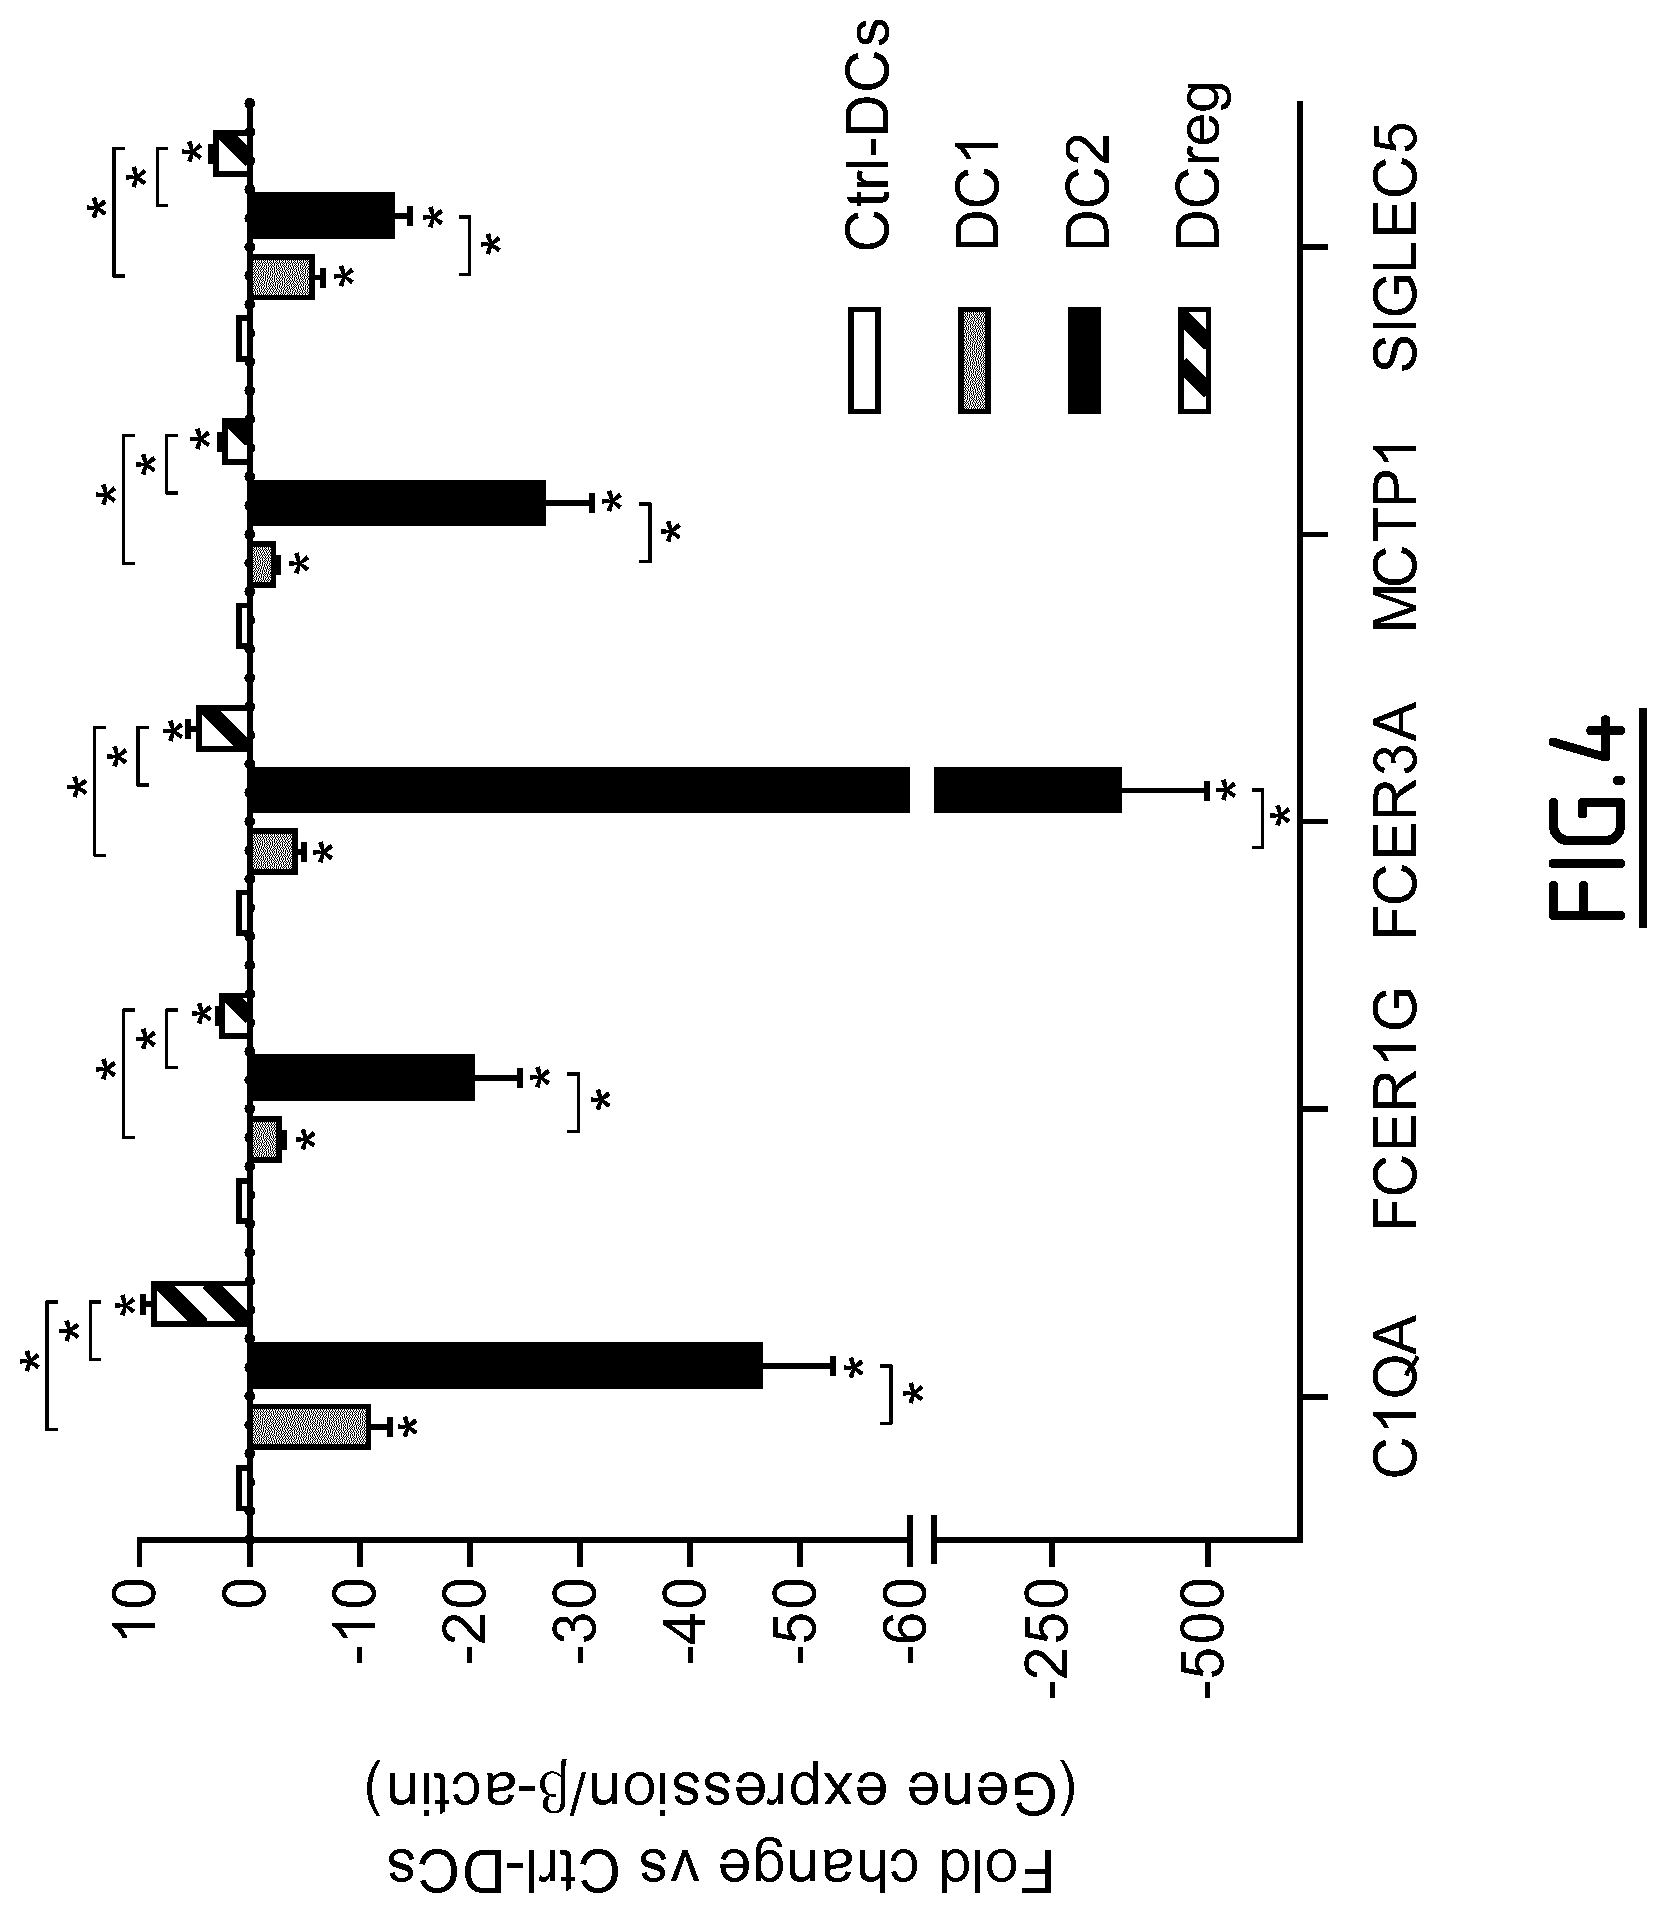
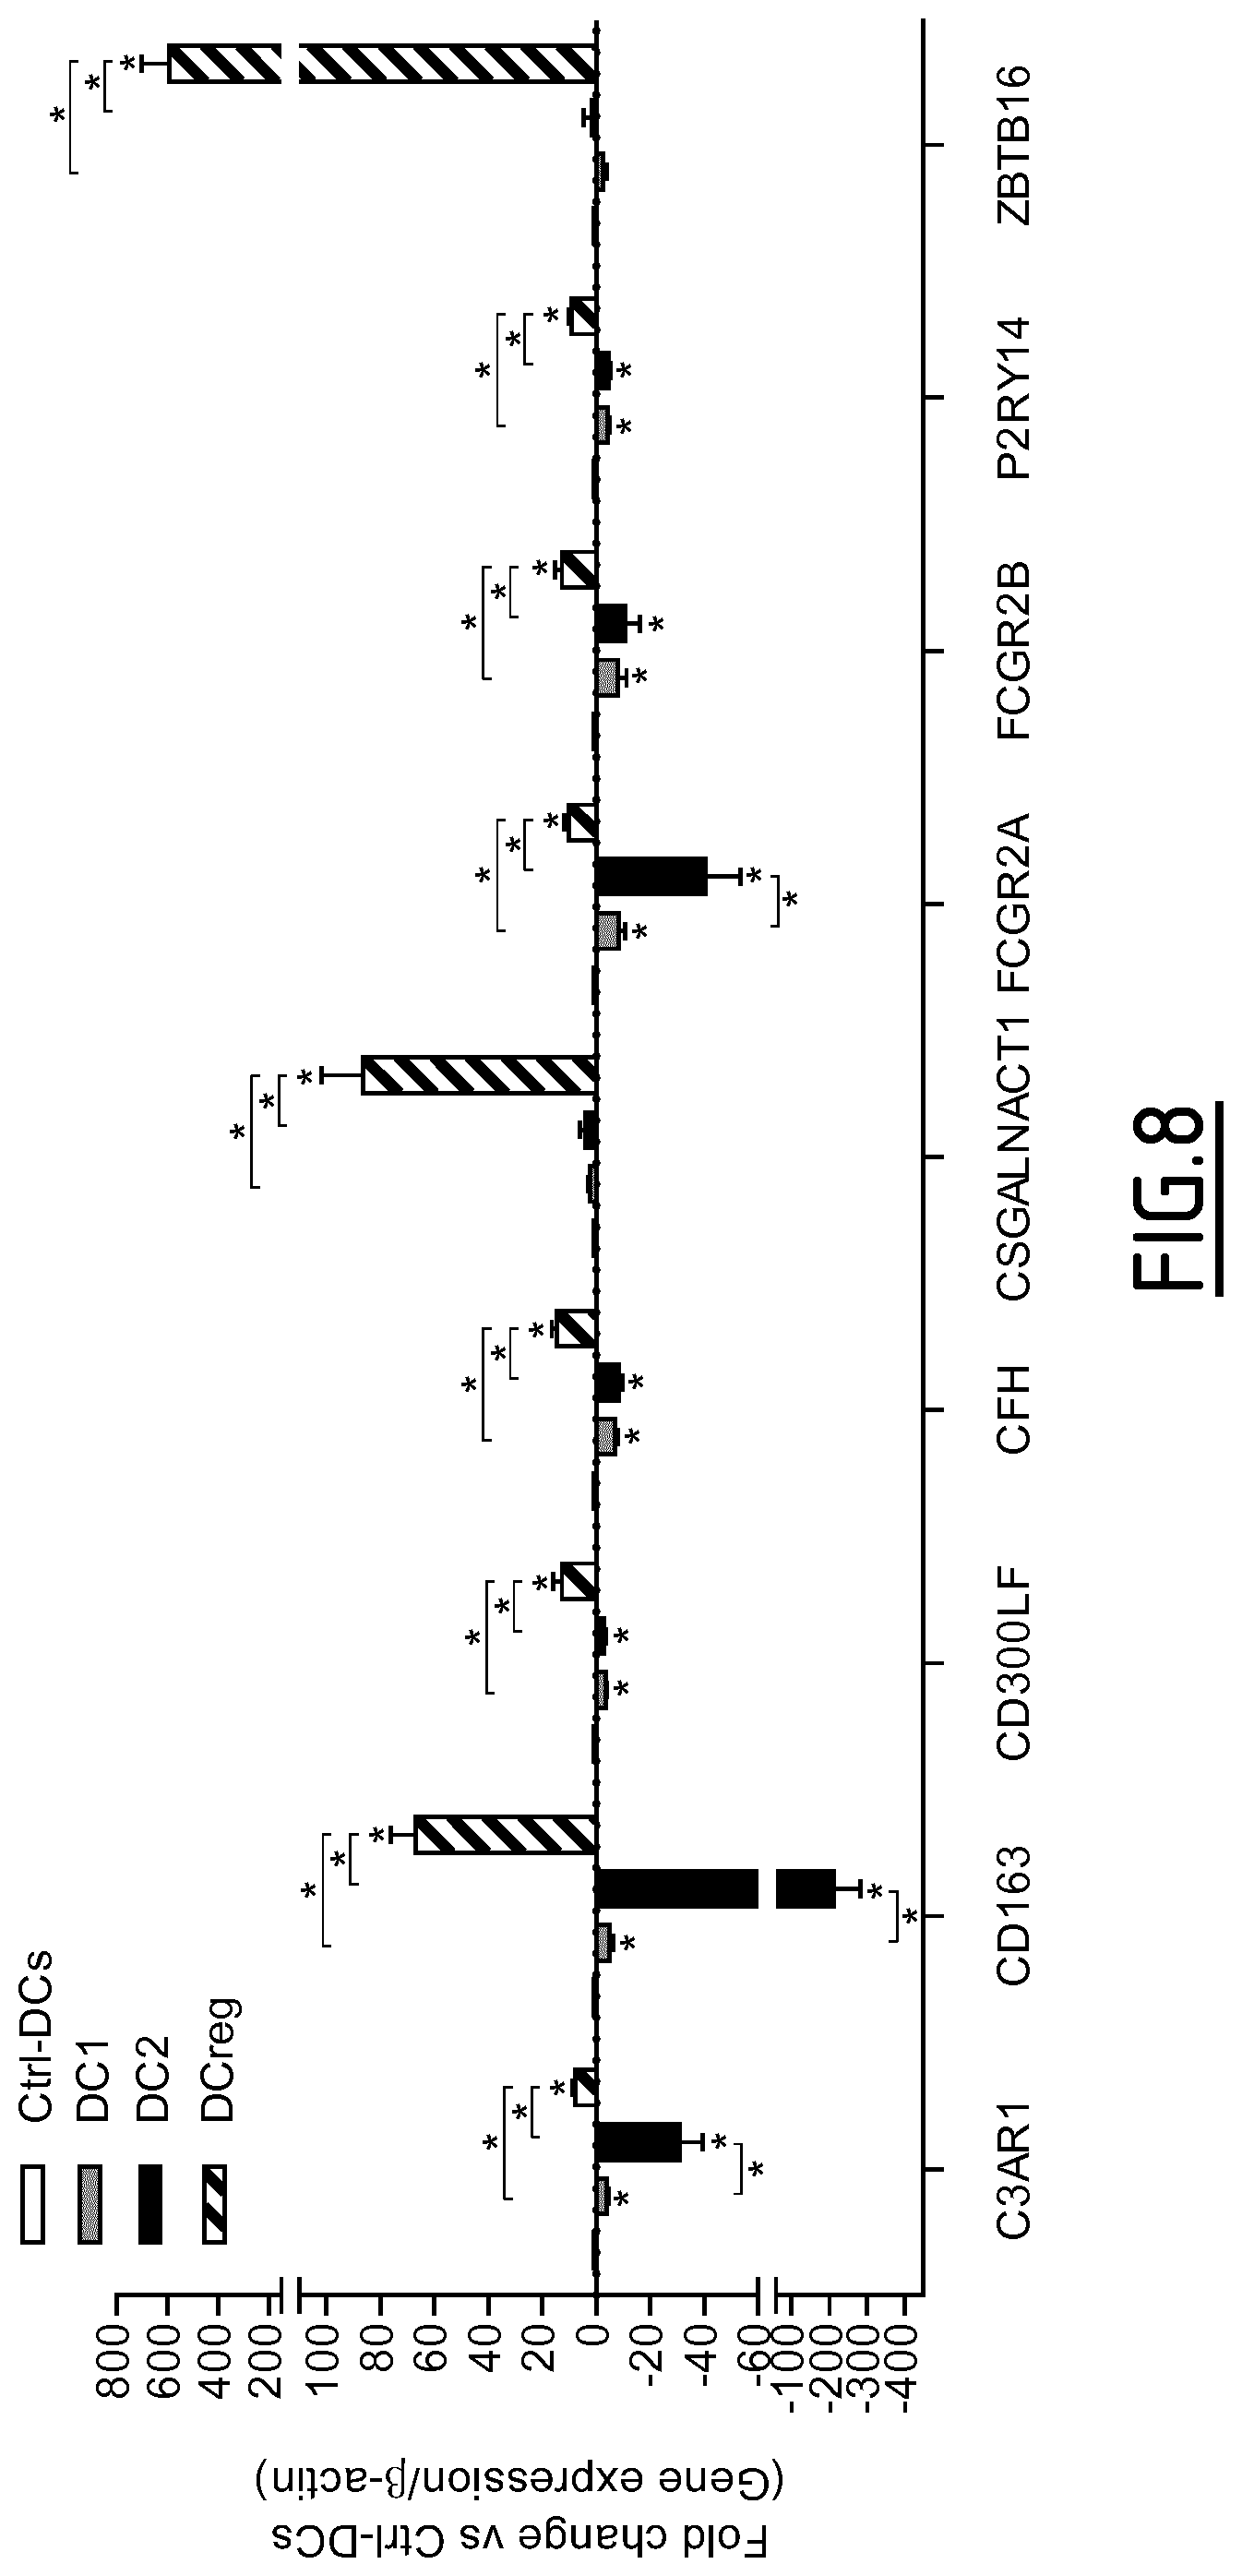
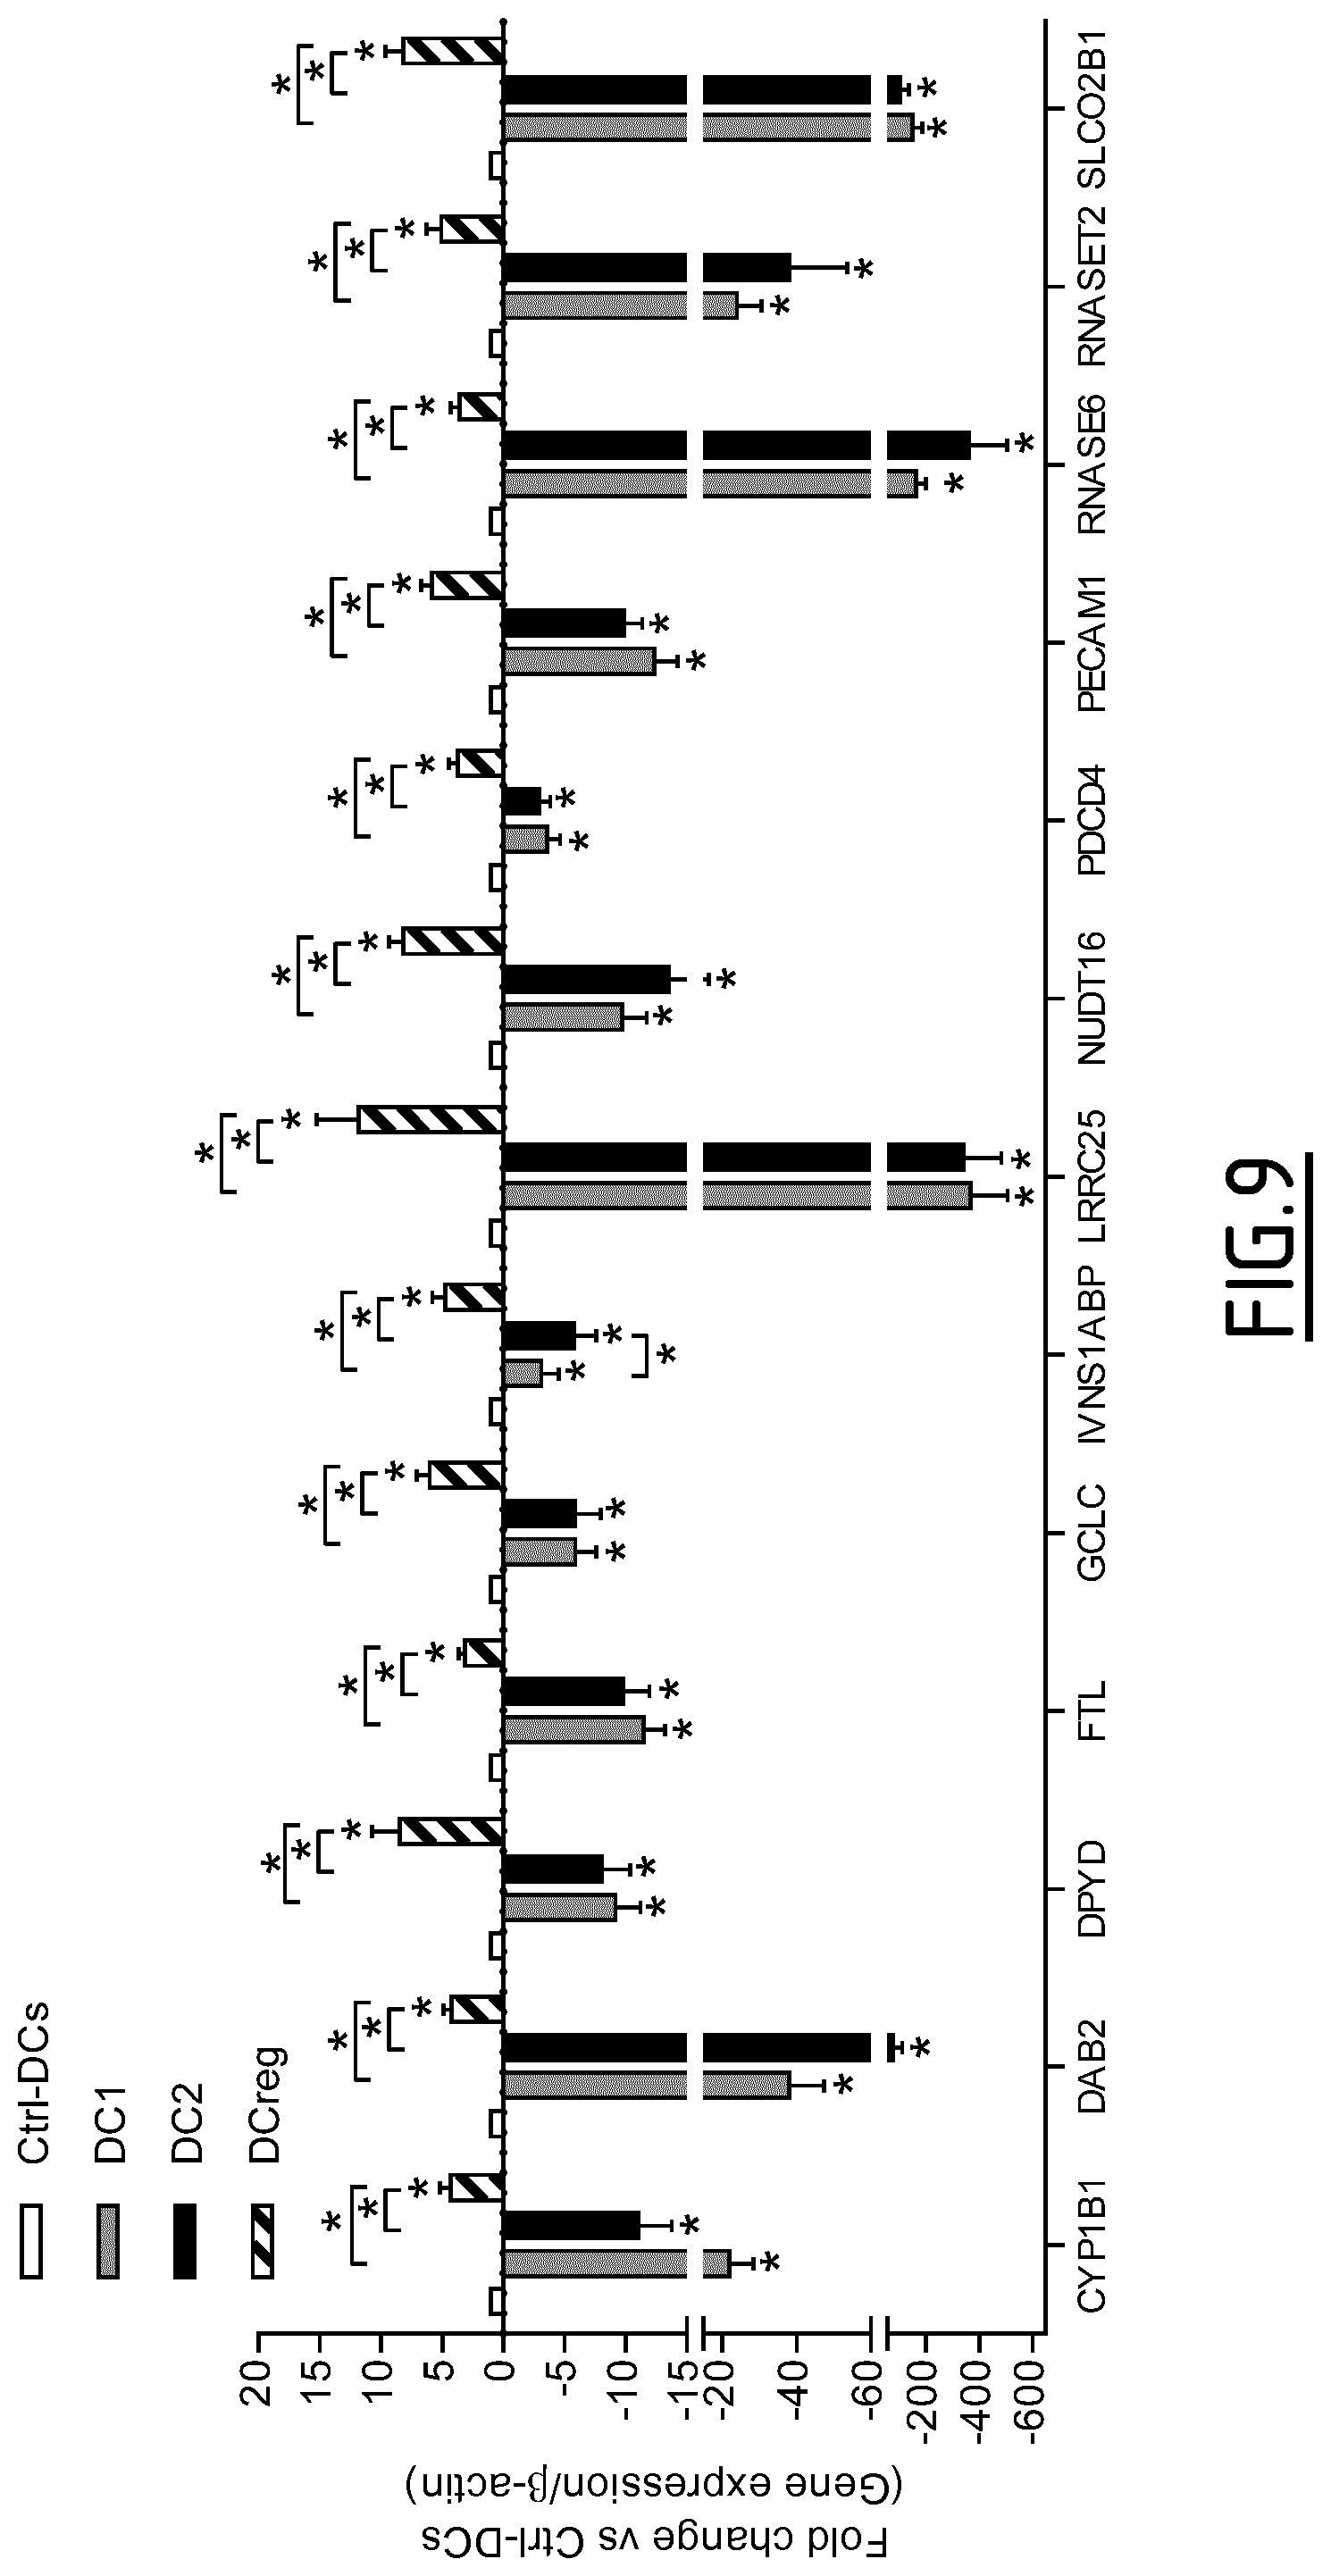
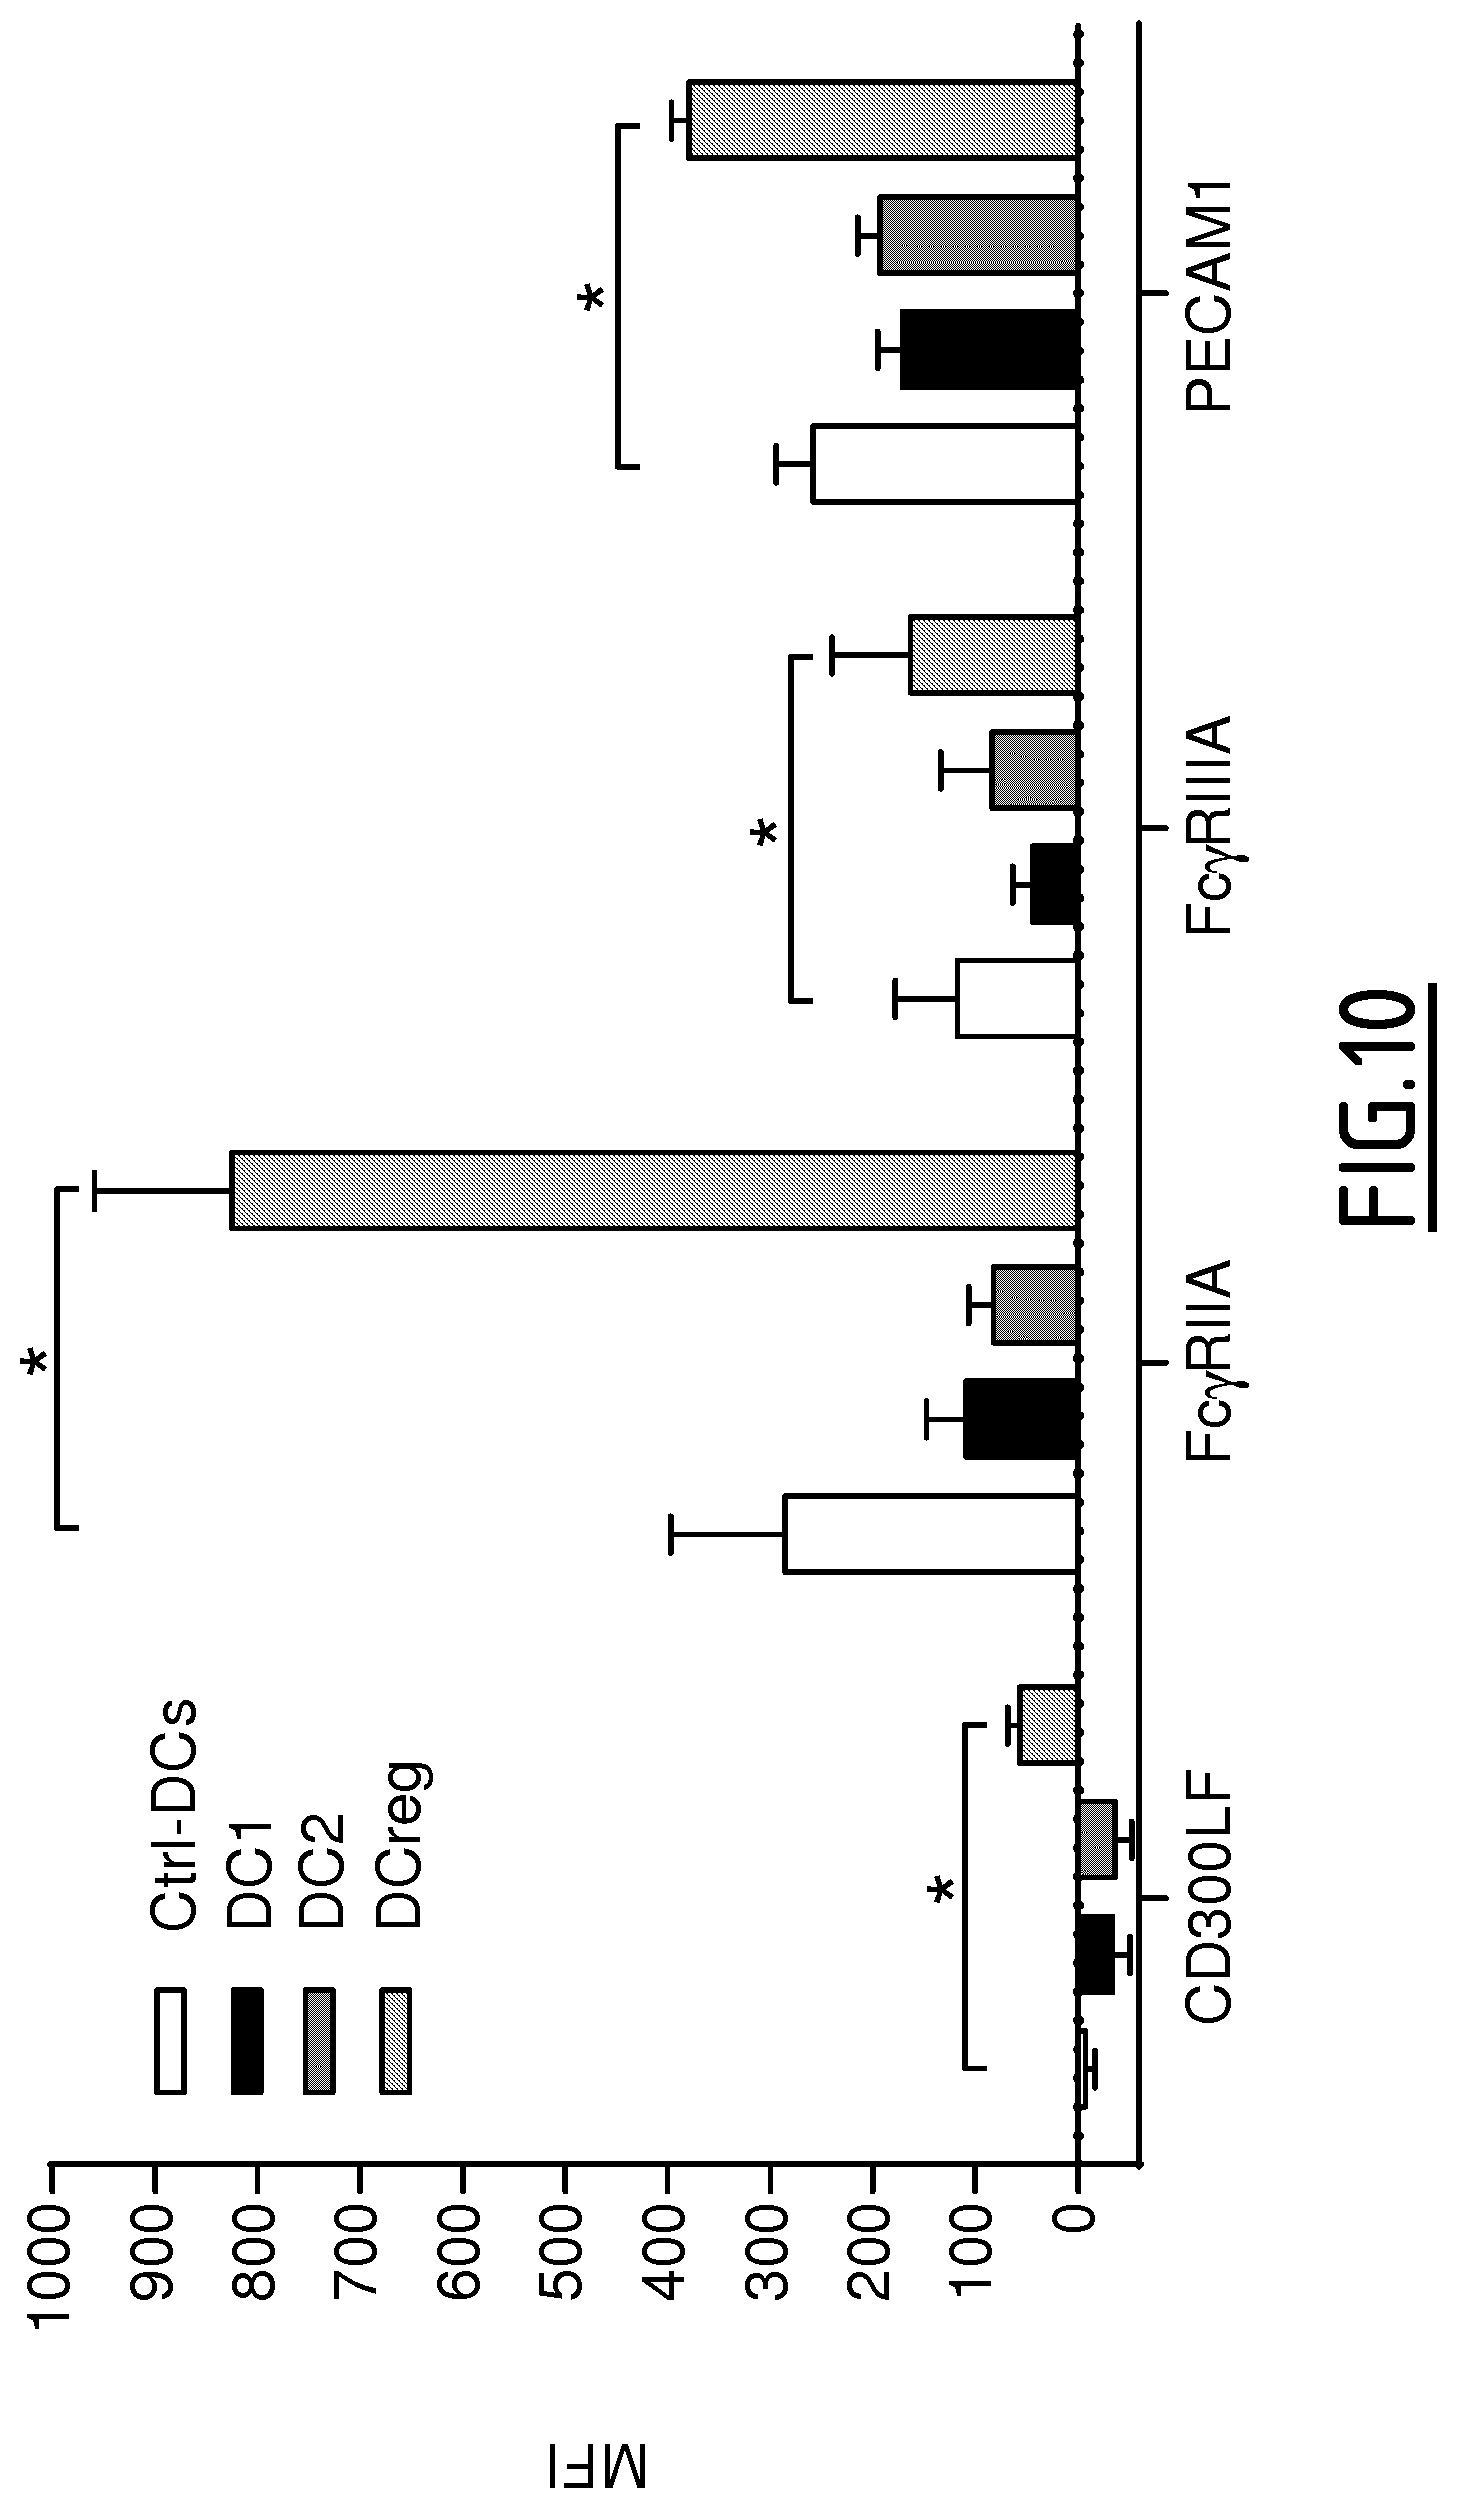
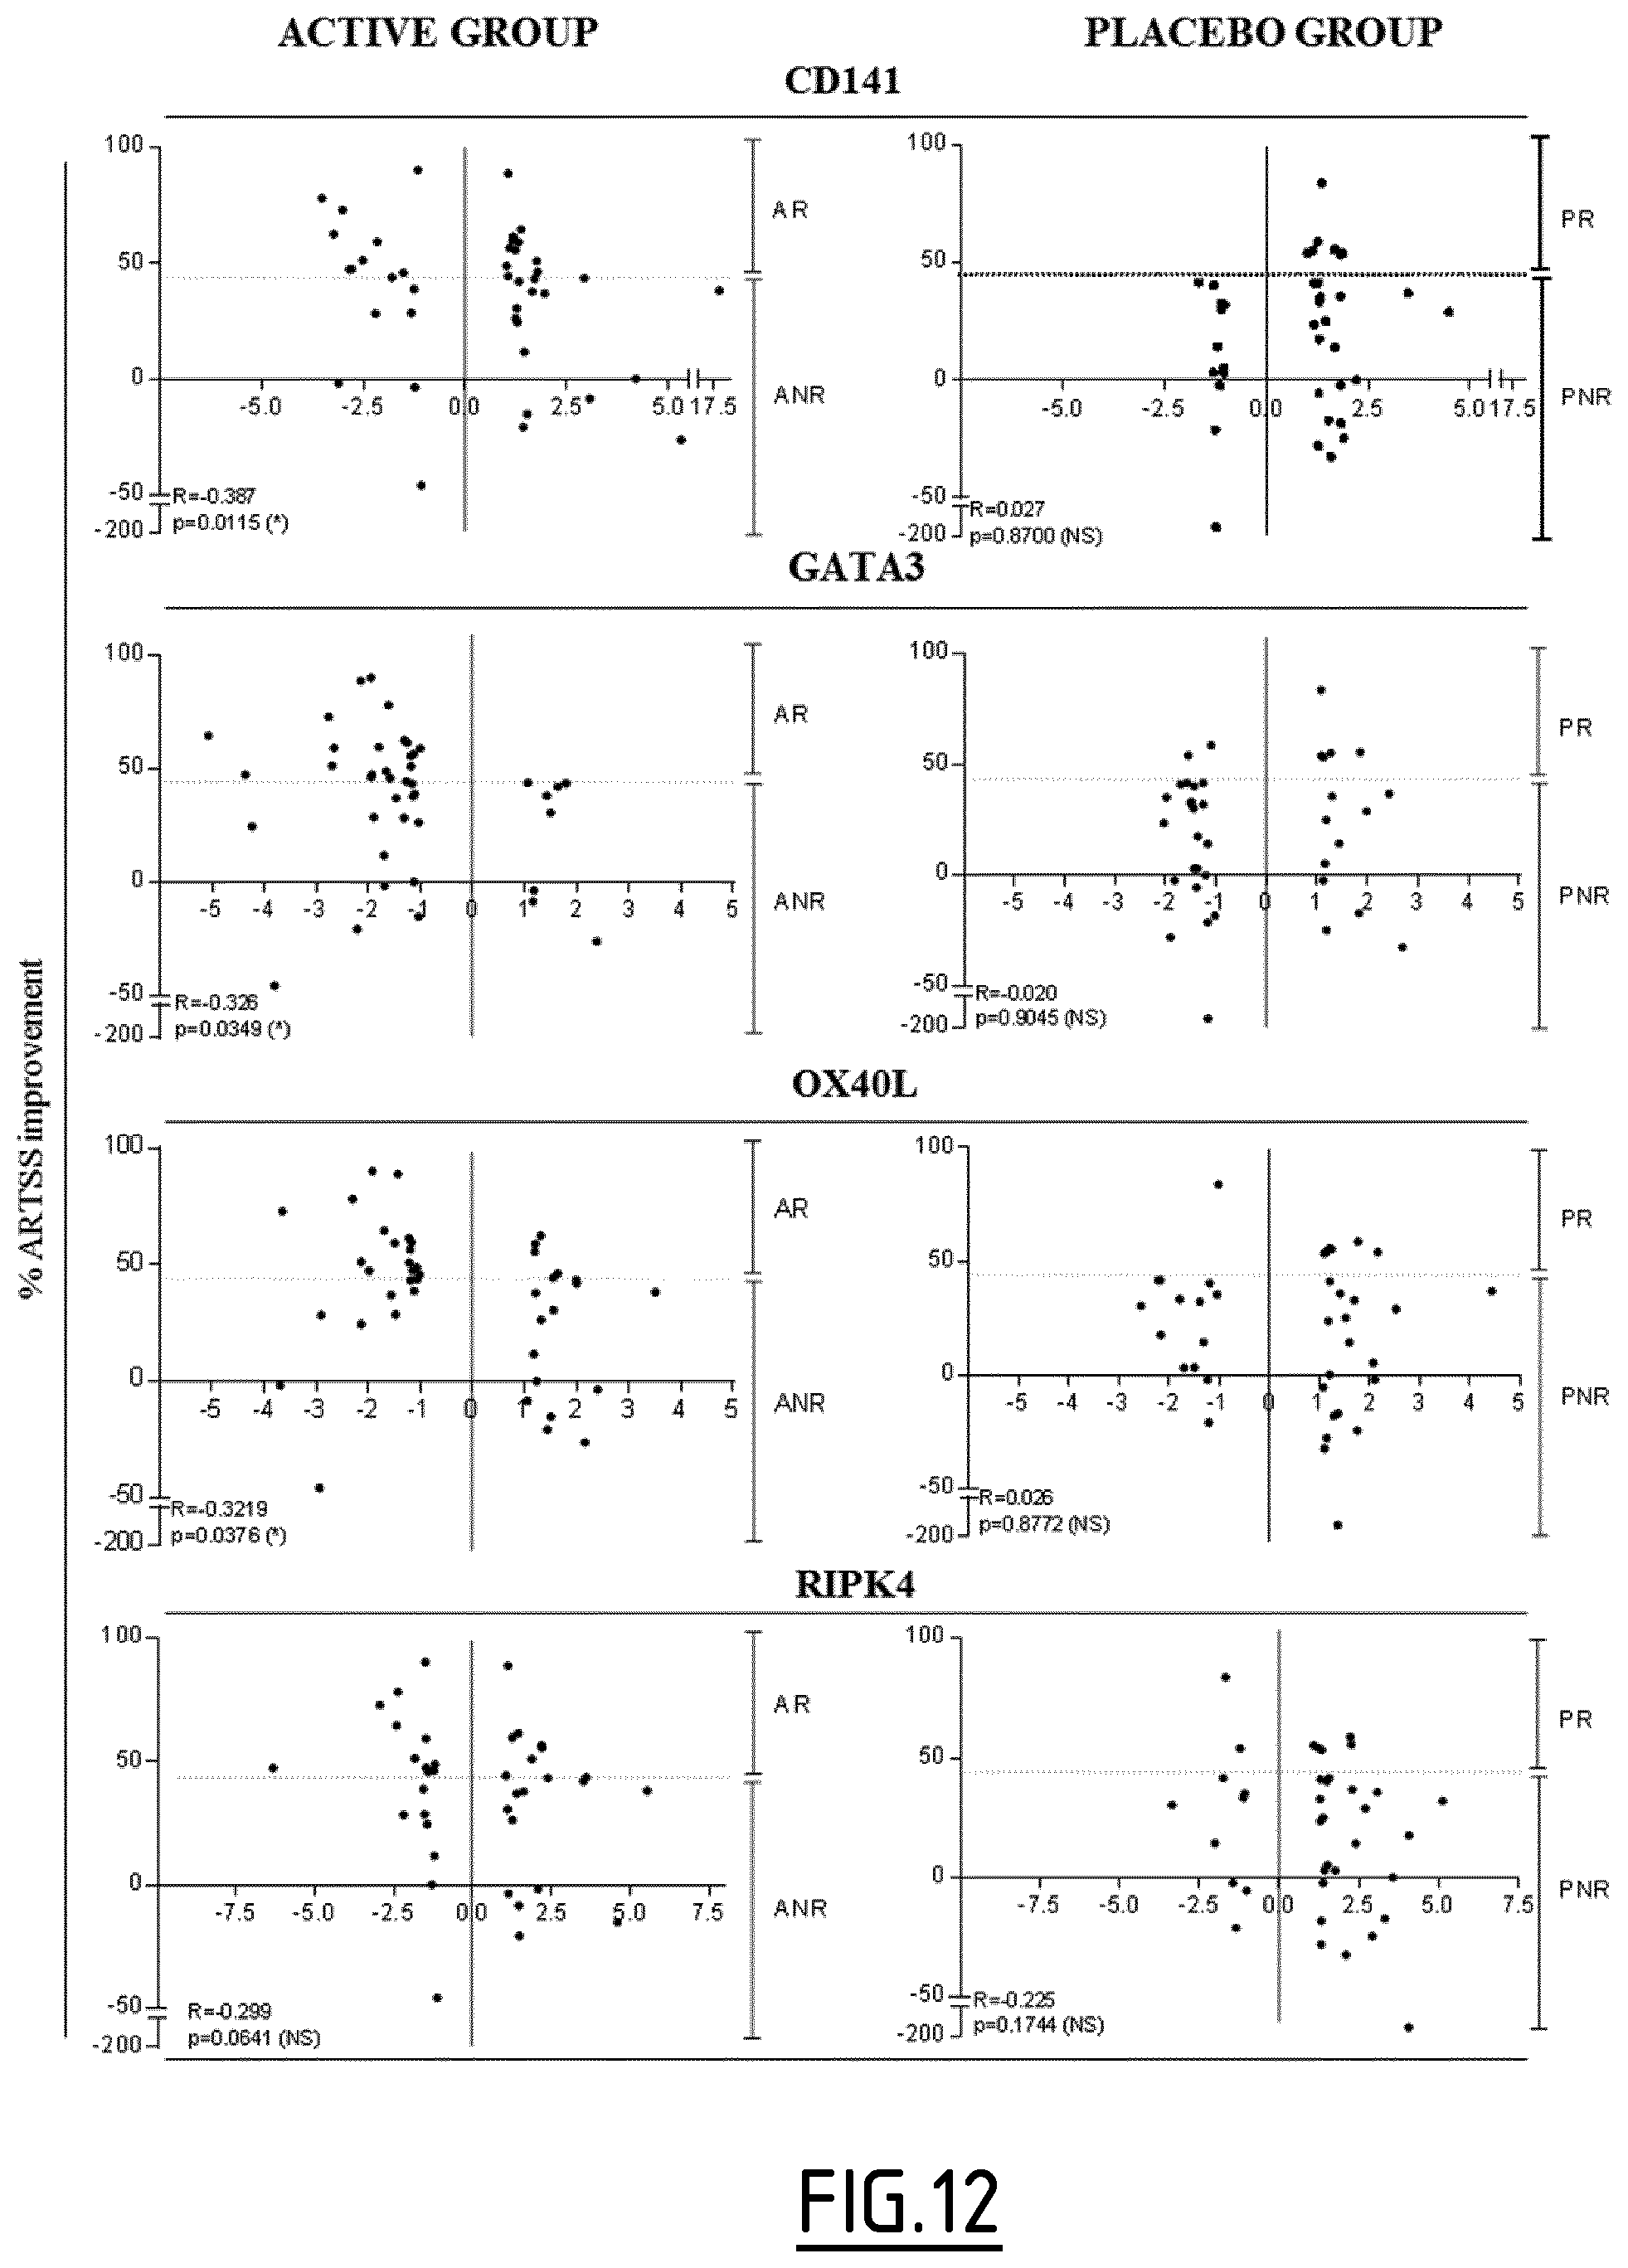
The present invention results from the identification by the inventors of molecular signatures of DC2 and DCreg, using optimal culture conditions capable of inducing the differentiation of immature MoDCs towards DCreg and DC2, which promoted respectively Treg and Th2 responses. Using cDNA microarrays together with quantitative proteomics (label-free mass spectrometry), the inventors here identified novel markers specific for DC2 and DCreg and showed that these markers correlate with the clinical efficacy of AIT as soon as 2 months after the beginning of therapy and are therefore useful biomarkers of a successful clinical response in allergic patients undergoing sublingual AIT.
Therefore, in a first aspect, the present invention concerns a method, preferably an in vitro method, for determining if a patient is developing an immune response oriented either towards a regulatory T cell (or Treg) response or towards a Th2 response, which method comprises the step a) of determining the level of expression of at least one, preferably 2, 3, 4, 5, 6, 7, 8, 9, 10, 11, 12, 13, 14, 15, 16, 17, 18, 19, 20, 21, 22, 23, 24, 25, 26, 27, 28, 29, 30, 31, 32, 33, 34, 35, 36, 37, 38, 39, 40, 41, 42, 43, 44, 45, 46, 47 or 48, marker protein(s) selected from the group consisting of DAB2, Fc.gamma.RIIa, Fc.gamma.RIIIa, FTL, PECAM1, SLCO2B1, GATA3, RIPK4, CALCA, CREM, FMOD, HCRTR1, ILDR2, ITK, PADI2, PDE4D, PNOC, RGS9, ROR1, SIX2, SYT4, THBS1, TRIM9, ADAM8, CYTIP, NRP2, SEMA7A, TBC1D13, Fc.epsilon.RIG, MCTP1, SIGLEC5, C3AR1, CD163, IVNS1ABP, CD300LF, CFH, CSGALNACT1, P2RY14, ZBTB16, Fc.gamma.RIIB, CYP1B1, DPYD, GCLC, LRRC25, NUDT16, PDCD4, RNASE6 and RNASET2, or of an mRNA thereof, in a biological sample from the patient.
In the first aspect of the invention, the patient may be a patient suffering from a disease, for instance an infectious disease, a tumor, an autoimmune disease, an allergy, or a patient who has been grafted. Further, the patient may be treated or not against said disease or against graft rejection.
In a preferred embodiment, the patient is undergoing immunotherapy and/or has been administered with a vaccine.
If the method is carried out on a biological sample obtained from a non treated patient, it will allow assessing which type of T cell response the patient suffering from a disease is developing.
Preferably, the method further comprises the steps of:
b) comparing the level of expression of the at least one marker protein, or of an mRNA thereof, measured in step a) with a control, and
c) based on the comparison of step b), determining if the patient is developing an immune response oriented either towards a regulatory T cell response or towards a Th2 response.
When the patient is not treated, the control may consist of immature and/or polarized dendritic cells, more preferably immature dendritic cells. Alternatively, the control may be a biological sample from a healthy donor, in particular of the same nature than that of the biological sample to be tested (e.g. peripheral blood when the biological sample to be tested is peripheral blood, etc).
When the patient is treated, the control may consist of a biological sample from the patient obtained before the beginning of the treatment, in particular before said patient undergoes immunotherapy and/or is administered with a vaccine, said biological sample being in particular of the same nature than that of the biological sample to be tested.
Whatever the type of patients (i.e. treated or not treated), preferably when the above recited controls are used, the determination step c) of the method is as follows: an increased level of expression (in particular compared to the above recited controls) of at least one marker protein selected from the group consisting of DAB2, Fc.gamma.RIIA, Fc.gamma.RIIIa, FTL, PECAM1, SLCO2B1, C3AR1, CD163, CD300LF, CFH, CSGALNACT1, P2RY14, ZBTB16, Fc.gamma.RIIB, CYP1B1, DPYD, GCLC, IVNS1ABP, LRRC25, NUDT16, PDCD4, RNASE6, RNASET2, Fc.epsilon.RIG, MCTP1 and SIGLEC5, or of an mRNA thereof, indicates that the patient is developing an immune response oriented towards a regulatory T cell response, and/or an increased level of expression (in particular compared to the above recited controls) of at least one marker protein selected from the group consisting of GATA3, RIPK4, CALCA, CREM, FMOD, HCRTR1, ILDR2, ITK, PADI2, PDE4D, PNOC, RGS9, ROR1, SIX2, SYT4, THBS1, TRIM9, ADAM8, CYTIP, NRP2, SEMA7A and TBC1D13, or of an mRNA thereof, and/or a decreased level of expression (in particular compared to the above recited controls) of at least one marker protein selected from the group consisting of Fc.gamma.RIIa, Fc.gamma.RIIIa, Fc.epsilon.RIG, MCTP1, SIGLEC5, C3AR1, CD163 and IVNS1ABP, or of an mRNA thereof, indicates that the patient is developing an immune response oriented towards a Th2 response.
Preferably, the at least one marker protein the level of expression of which is determined in step a) is selected from the group consisting of CALCA, PNOC, ROR1 and SYT4. Still preferably, the at least one marker protein the level of expression of which is determined in step a) is selected from the group consisting of CREM, FMOD, GATA3, HCRTR1, ILDR2, ITK, PADI2, PDE4D, RGS9, RIPK4, SIX2, THBS1 and TRIM9. Still preferably, the at least one marker protein the level of expression of which is determined in step a) is selected from the group consisting of Fc.gamma.RIIa, Fc.gamma.RIIIa, Fc.epsilon.RIG, MCTP1, SIGLEC5, C3AR1, CD163 and IVNS1ABP.
Preferably, the at least one marker protein the level of expression of which is determined in step a) is selected from the group consisting of C3AR1, CD163, CD300LF, CHF, CSGALNACT1, Fc.gamma.RIIa, Fc.gamma.RIIb, P2RY14 and ZBTB16. Still preferably, the at least one marker protein the level of expression of which is determined in step a) is selected from the group consisting of C3AR1, CD163, CD300LF, CHF, Fc.gamma.RIIa, Fc.gamma.RIIb and P2RY14. Still preferably, the at least one marker protein the level of expression of which is determined in step a) is selected from the group consisting of CYP1B1, DAB2, DPYD, FTL, GCLC, IVNS1ABP, LRRC25, NUDT16, PDCD4, PECAM1, RNASE6, RNASET2, and SLCO2B1. Still preferably, the at least one marker protein the level of expression of which is determined in step a) is selected from the group consisting of CD300LF, Fc.gamma.RIIIa, Fc.gamma.RIIa, PECAM1.
An increased level of expression (in particular compared to the above recited controls) of at least one marker protein selected from the group consisting of DAB2, Fc.gamma.RIIA, Fc.gamma.RIIIa, FTL, PECAM1, SLCO2B1, C3AR1, CD163, CD300LF, CFH, CSGALNACT1, P2RY14, ZBTB16, Fc.gamma.RIIB, CYP1B1, DPYD, GCLC, IVNS1ABP, LRRC25, NUDT16, PDCD4, RNASE6, RNASET2, Fc.epsilon.RIG, MCTP1 and SIGLEC5, or of an mRNA thereof, also identifies the patient as likely to be a responder to the immunotherapy and/or vaccine, when the immunotherapy and/or vaccine aims at treating an autoimmune disease or an allergy.
A decreased level of expression (in particular compared to the above recited controls) of at least one marker protein selected from the group consisting of GATA3, RIPK4, CALCA, CREM, FMOD, HCRTR1, ILDR2, ITK, PADI2, PDE4D, PNOC, RGS9, ROR1, SIX2, SYT4, THBS1, TRIM9, ADAM8, CYTIP, NRP2, SEMA7A and TBC1D13, or of an mRNA thereof, also identifies the patient as likely to be a responder to the immunotherapy and/or vaccine, when the immunotherapy and/or vaccine aims at treating an autoimmune disease or an allergy.
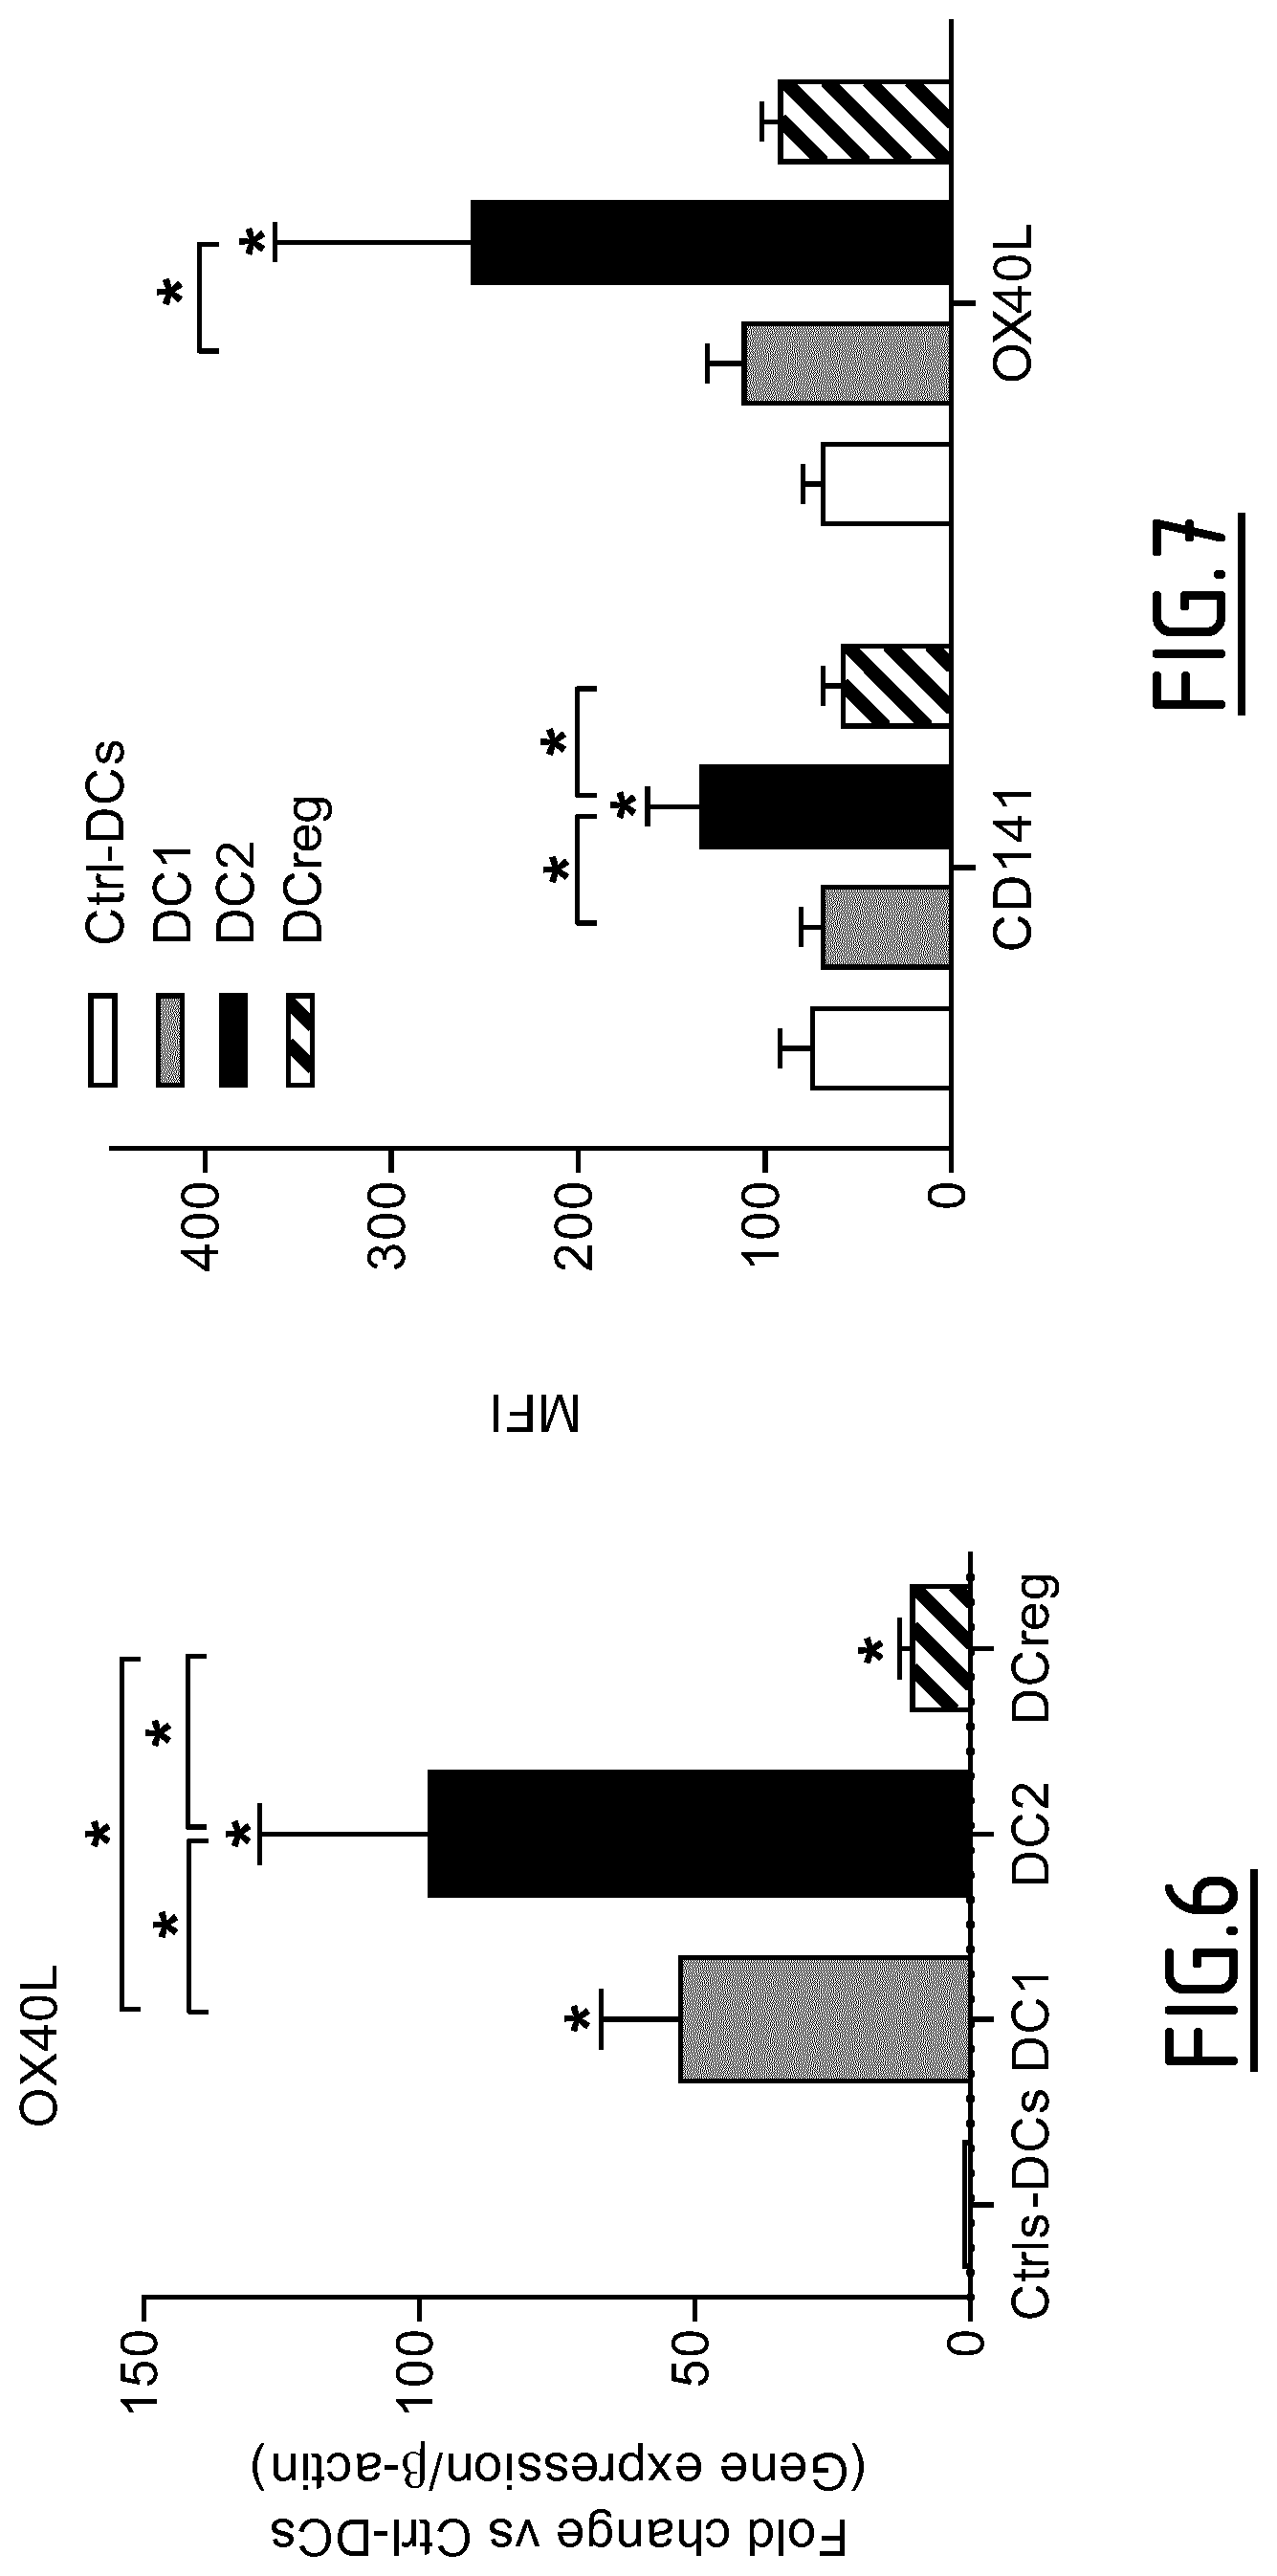
In a second aspect, the present invention concerns a method, preferably an in vitro method, for determining if the immune response developed by a patient, who is undergoing immunotherapy and/or has been administered with a vaccine aiming at treating an autoimmune disease or an allergy, is shifting from a Th2 response towards a tolerogenic T cell response, which method comprises the step a) of determining the level of expression of at least one, preferably 2, 3, 4, 5, 6, 7, 8, 9, 10, 11, 12, 13, 14, 15, 16, 17, 18, 19, 20, 21, 22, 23, 24, 25, 26, 27, 28, 29, 30, 31, 32, 33, 34, 35, 36, 37, 38, 39, 40, 41, 42, 43, 44, 45, 46, 47, 48, 49 or 50, marker protein(s) selected from the group consisting of DAB2, Fc.gamma.RIIa, Fc.gamma.RIIIa, FTL, PECAM1, SLCO2B1, CD141, GATA3, RIPK4, OX40L, CALCA, CREM, FMOD, HCRTR1, ILDR2, ITK, PADI2, PDE4D, PNOC, RGS9, ROR1, SIX2, SYT4, THBS1, TRIM9, ADAM8, CYTIP, NRP2, SEMA7A, TBC1D13, Fc.epsilon.RIG, MCTP1, SIGLECS, C3AR1, CD163, CD300LF, CFH, CSGALNACT1, P2RY14, ZBTB16, Fc.gamma.RIIB, CYP1B1, DPYD, GCLC, IVNS1ABP, LRRC25, NUDT16, PDCD4, RNASE6 and RNASET2, or of an mRNA thereof, in a biological sample from the patient.
In this second aspect, the patient is preferably undergoing an immunotherapy that aims at treating an allergy, preferably a desensitization therapy, the immunotherapy preferably aiming at reducing (i) the immune response against the allergen(s) which trigger(s) the allergy and/or (ii) manifestation of clinical symptoms of allergy.
Preferably, the at least one protein marker the level of expression of which is determined in step a) is selected from the group consisting of DAB2, Fc.gamma.RIIa, Fc.gamma.RIIIa, FTL, PECAM1, SLCO2B1, CD141, GATA3, RIPK4 and OX40L. Still preferably, the at least one protein marker the level of expression of which is determined in step a) is selected from the group consisting of Fc.gamma.RIIIa, FTL, SLCO2B1, CD141, GATA3 and OX40L. Still preferably, the at least one protein marker the level of expression of which is determined in step a) is selected from the group consisting of Fc.gamma.RIIIa and FTL. Still preferably, the at least one protein marker the level of expression of which is determined in step a) is Fc.gamma.RIIIa.
Preferably, the method further comprises the steps of:
b) comparing the level of expression of the at least one marker protein, or of an mRNA thereof, measured in step a) with a control, and
c) based on the comparison of step b), determining if the immune response developed by the patient is shifting from a Th2 response towards a tolerogenic T cell response.
In the second aspect of the invention, the control may consist of immature and/or polarized dendritic cells, more preferably immature dendritic cells. Alternatively, the control may be a biological sample from a healthy donor, in particular of the same nature than that of the biological sample to be tested (e.g. peripheral blood when the biological sample to be tested is peripheral blood, etc). The control may alternatively consist of a biological sample from the patient obtained before the beginning of the treatment, in particular before said patient undergoes immunotherapy and/or is administered with a vaccine, said biological sample being in particular of the same nature than that of the biological sample to be tested.
Preferably when the above recited controls are used, the determination step c) of the method is as follows: an increased level of expression (in particular compared to the above recited controls) of at least one marker protein selected from the group consisting of DAB2, Fc.gamma.RIIa, Fc.gamma.RIIIa, FTL, PECAM1, SLCO2B1, C3AR1, CD163, CD300LF, CFH, CSGALNACT1, P2RY14, ZBTB16, Fc.gamma.RIIB, CYP1B1, DPYD, GCLC, IVNS1ABP, LRRC25, NUDT16, PDCD4, RNASE6, RNASET2, Fc.epsilon.RIG, MCTP1 and SIGLEC5, or of an mRNA thereof, and/or a decreased level of expression (in particular compared to the above recited controls) of at least one marker protein selected from the group consisting of CD141, GATA3, RIPK4, OX40L, CALCA, CREM, FMOD, HCRTR1, ILDR2, ITK, PADI2, PDE4D, PNOC, RGS9, ROR1, SIX2, SYT4, THBS1, TRIM9, ADAM8, CYTIP, NRP2, SEMA7A and TBC1D13, or of an mRNA thereof, indicates that the immune response developed by the patient is shifting from a Th2 response towards a tolerogenic T cell response.
More preferably, when the abovementioned controls are used, the determination step c) of the method is as follows: an increased level of expression of at least one marker protein selected from the group consisting of DAB2, Fc.gamma.RIIA, Fc.gamma.RIIIa, FTL, PECAM1, SLCO2B1, C3AR1, CD163, CD300LF, CFH, CSGALNACT1, P2RY14, ZBTB16, Fc.gamma.RIIB, CYP1B1, DPYD, GCLC, IVNS1ABP, LRRC25, NUDT16, PDCD4, RNASE6, RNASET2, Fc.epsilon.RIG, MCTP1 and SIGLEC5, or of an mRNA thereof, indicates that the immune response developed by the patient is shifting from a Th2 response towards a tolerogenic T cell response.
In a particular embodiment, the level of expression of at least three protein markers more preferably of at least five protein markers, is determined in step a). Preferably, the level of expression of at least GATA3 is determined in step a). Still preferably, the level of expression of at least GATA3 and Fc.gamma.RIIIa is determined in step a). Still preferably, the level of expression of at least GATA3, Fc.gamma.RIIIa and Fc.gamma.RIIa is determined in step a). Still preferably, the level of expression of at least GATA3, Fc.gamma.RIIIa and RIPK4 is determined in step a). Still preferably, the level of expression of at least GATA3, CD141, RIPK4, C1Q (C1QA, C1QB and/or C1QC) and Fc.gamma.RIIIa is determined in step a).
In a particular embodiment, the level of expression of at least three protein markers more preferably of at least five protein markers, is determined in step a).
Preferably, the level of expression of at least Fc.gamma.RIIIa is determined in step a). Still preferably, the level of expression of at least Fc.gamma.RIIIa and GATA3 is determined in step a). Still preferably, the level of expression of at least Fc.gamma.RIIIa, GATA3 and Fc.gamma.RIIa is determined in step a). Still preferably, the level of expression of at least Fc.gamma.RIIIa, GATA3 and RIPK4 is determined in step a). Still preferably, the level of expression of at least Fc.gamma.RIIIa, GATA3, CD141, RIPK4 and C1Q (C1QA, C1QB and/or C1QC) is determined in step a).
In another embodiment, the level of expression of at least one protein markers or mRNA thereof is combined with at least one marker protein or mRNA thereof of DCreg known in the prior art such as one described in International application WO 2013/034569.
This also identifies the patient as likely to be a responder to the immunotherapy and/or vaccine.
Accordingly, in a third aspect, the invention relates to a method, preferably an in vitro method, for determining if a patient is likely to be a responder to an immunotherapy and/or a vaccine aiming at treating an autoimmune disease or an allergy, which method comprises the step a) of determining the level of expression of at least one, preferably 2, 3, 4, 5, 6, 7, 8, 9, 10, 11, 12, 13, 14, 15, 16, 17, 18, 19, 20, 21, 22, 23, 24, 25, 26, 27, 28, 29, 30, 31, 32, 33, 34, 35, 36, 37, 38, 39, 40, 41, 42, 43, 44, 45, 46, 47, 48, 49 or 50, marker protein(s) selected from the group consisting of DAB2, Fc.gamma.RIIa, Fc.gamma.RIIIa, FTL, PECAM1, SLCO2B1, CD141, GATA3, RIPK4, OX40L, CALCA, CREM, FMOD, HCRTR1, ILDR2, ITK, PADI2, PDE4D, PNOC, RGS9, ROR1, SIX2, SYT4, THBS1, TRIM9, ADAM8, CYTIP, NRP2, SEMA7A, TBC1D13, Fc.epsilon.RIG, MCTP1, SIGLEC5, C3AR1, CD163, CD300LF, CFH, CSGALNACT1, P2RY14, ZBTB16, Fc.gamma.RIIB, CYP1B1, DPYD, GCLC, IVNS1ABP, LRRC25, NUDT16, PDCD4, RNASE6 and RNASET2, or of an mRNA thereof, in a biological sample from the patient.
Preferably, the at least one protein marker the level of expression of which is determined in step a) is selected from the group consisting of DAB2, Fc.gamma.RIIa, Fc.gamma.RIIIa, FTL, PECAM1, SLCO2B1, CD141, GATA3, RIPK4 and OX40L. Still preferably, the at least one protein marker the level of expression of which is determined in step a) is selected from the group consisting of DAB2, Fc.gamma.RIIa, Fc.gamma.RIIIa, FTL, PECAM1, SLCO2B1, CD141, GATA3 and RIPK4. Still preferably, the at least one protein marker the level of expression of which is determined in step a) is selected from the group consisting of Fc.gamma.RIIIa, FTL, SLCO2B1, CD141 and GATA3. Still preferably, the at least one protein marker the level of expression of which is determined in step a) is selected from the group consisting of Fc.gamma.RIIIa and FTL. Still preferably, the at least one protein marker the level of expression of which is determined in step a) is Fc.gamma.RIIIa.
In the third aspect of the invention, the patient may be a patient suffering from an autoimmune disease or an allergy. Further, the patient may be treated against said disease.
In a preferred embodiment, the patient is undergoing immunotherapy and/or has been administered with a vaccine. Preferably, in this third aspect, the patient is undergoing an immunotherapy that aims at treating an allergy, preferably a desensitization therapy, the immunotherapy preferably aiming at reducing (i) the immune response against the allergen(s) which trigger(s) the allergy and/or (ii) manifestation of clinical symptoms of allergy.
Preferably, the method further comprises the steps of:
b) comparing the level of expression of the at least one marker protein, or of an mRNA thereof, measured in step a) with a control, and
c) based on the comparison of step b), determining if the patient is likely to be a responder to an immunotherapy and/or a vaccine aiming to treat an autoimmune disease or an allergy.
In the third aspect of the invention, the control may consist of immature and/or polarized dendritic cells, more preferably immature dendritic cells. Alternatively, the control may be a biological sample from a healthy donor, in particular of the same nature than that of the biological sample to be tested (e.g. peripheral blood when the biological sample to be tested is peripheral blood, etc). The control may alternatively consist of a biological sample from the patient obtained before the beginning of the treatment, in particular before said patient undergoes immunotherapy and/or is administered with a vaccine, said biological sample being in particular of the same nature than that of the biological sample to be tested.
Preferably when the above recited controls are used, the determination step c) of the method is as follows: an increased level of expression of at least one marker protein selected from the group consisting of DAB2, Fc.gamma.RIIa, Fc.gamma.RIIIa, FTL, PECAM1, SLCO2B1, C3AR1, CD163, CD300LF, CFH, CSGALNACT1, P2RY14, ZBTB16, Fc.gamma.RIIB, CYP1B1, DPYD, GCLC, IVNS1ABP, LRRC25, NUDT16, PDCD4, RNASE6, RNASET2, Fc.epsilon.RIG, MCTP1 and SIGLEC5, or of an mRNA thereof, and/or a decreased level of expression of at least one marker protein selected from the group consisting of CD141, GATA3, RIPK4, OX40L, CALCA, CREM, FMOD, HCRTR1, ILDR2, ITK, PADI2, PDE4D, PNOC, RGS9, ROR1, SIX2, SYT4, THBS1, TRIM9, ADAM8, CYTIP, NRP2, SEMA7A and TBC1 D13, or of an mRNA thereof, indicates that the patient is likely to be a responder to an immunotherapy and/or a vaccine aiming to treat an autoimmune disease or an allergy.
In a particular embodiment, the level of expression of at least three protein markers more preferably of at least five protein markers, is determined in step a).
Preferably, the level of expression of at least GATA3 is determined in step a). Still preferably, the level of expression of at least GATA3 and Fc.gamma.RIIIa is determined in step a). Still preferably, the level of expression of at least GATA3, Fc.gamma.RIIIa and Fc.gamma.RIIA is determined in step a). Still preferably, the level of expression of at least GATA3, CD141, RIPK4, C1Q (C1QA, C1QB and/or C1QC) and Fc.gamma.RIIIa is determined in step a).
In a particular embodiment, the level of expression of at least three protein markers more preferably of at least five protein markers, is determined in step a). Preferably, the level of expression of at least Fc.gamma.RIIIa is determined in step a). Still preferably, the level of expression of at least Fc.gamma.RIIIa and GATA3 is determined in step a). Still preferably, the level of expression of at least Fc.gamma.RIIIa, GATA3 and Fc.gamma.RIIa is determined in step a). Still preferably, the level of expression of at least Fc.gamma.RIIIa, GATA3 and RIPK4 is determined in step a). Still preferably, the level of expression of at least Fc.gamma.RIIIa, GATA3, CD141, RIPK4 and C1Q (C1QA, C1QB and/or C1QC) is determined in step a).
In another embodiment, the level of expression of at least one protein markers or mRNA thereof is combined with at least one marker protein or mRNA thereof of DCreg known in the prior art such as one described in International application WO 2013/034569.
In a fourth aspect, the present invention concerns a method, preferably an in vitro method, for determining if a patient is likely to be a responder to an immunotherapy and/or a vaccine aiming at inducing an immune response against an infectious pathogen or a tumor, which method comprises the step a) of determining the level of expression of at least one, preferably 2, 3, 4, 5, 6, 7, 8, 9, 10, 11, 12, 13, 14, 15, 16, 17, 18, 19, 20, 21, 22, 23, 24, 25, 26, 27, 28, 29, 30, 31, 32, 33, 34, 35, 36, 37, 38, 39, 40, 41, 42, 43, 44, 45, 46, 47, 48, 49 or 50, marker protein(s) selected from the group consisting of CD141, OX40L, DAB2, Fc.gamma.RIIa, Fc.gamma.RIIIa, FTL, PECAM1, SLCO2B1, GATA3, RIPK4, CALCA, CREM, FMOD, HCRTR1, ILDR2, ITK, PADI2, PDE4D, PNOC, RGS9, ROR1, SIX2, SYT4, THBS1, TRIM9, ADAM8, CYTIP, NRP2, SEMA7A, TBC1D13, Fc.epsilon.RIG, MCTP1, SIGLEC5, C3AR1, CD163, CD300LF, CFH, CSGALNACT1, P2RY14, ZBTB16, Fc.gamma.RIIB, CYP1B1, DPYD, GCLC, IVNS1ABP, LRRC25, NUDT16, PDCD4, RNASE6 and RNASET2, or of an mRNA thereof, in a biological sample from the patient.
In the fourth aspect of the invention, the patient may be a patient suffering from an infectious disease or a tumor. Further, the patient may be treated against said disease.
In a preferred embodiment, the patient is undergoing immunotherapy and/or has been administered with a vaccine. Preferably, in this fourth aspect, the patient is undergoing an immunotherapy and/or has been administered with a vaccine that aims at inducing an immune response against the infectious pathogen responsible of the infectious disease or against the tumor.
Preferably, the method further comprises the steps of:
b) comparing the level of expression of the at least one marker protein, or of an mRNA thereof, measured in step a) with a control, and
c) based on the comparison of step b), determining if the patient is likely to be a responder to an immunotherapy and/or a vaccine aiming at inducing an immune response against an infections pathogen or a tumor.
In the fourth aspect of the invention, the control may consist of immature and/or polarized dendritic cells, more preferably immature dendritic cells. The control may alternatively consist of a biological sample from the patient obtained before the beginning of the treatment, in particular before said patient undergoes immunotherapy and/or is administered with a vaccine, said biological sample being in particular of the same nature than that of the biological sample to be tested.
Preferably when the above recited controls are used, the determination step c) of the method is as follows: an increased level of expression of at least one marker protein selected from the group consisting of GATA3, RIPK4, CALCA, CREM, FMOD, HCRTR1, ILDR2, ITK, PADI2, PDE4D, PNOC, RGS9, ROR1, SIX2, SYT4, THBS1, TRIM9, ADAM8, CYTIP, NRP2, SEMA7A and TBC1 D13, or of an mRNA thereof, and/or a decreased level of expression of at least one marker protein selected from the group consisting of Fc.gamma.RIIIa, Fc.epsilon.RIG, MCTP1, SIGLEC5, DAB2, Fc.gamma.RIIa, FTL, PECAM1, SLCO2B1, C3AR1, CD163, CD300LF, CFH, CSGALNACT1, P2RY14, ZBTB16, Fc.gamma.RIIB, CYP1B1, DPYD, GCLC, IVNS1ABP, LRRC25, NUDT16, PDCD4, RNASE6 and RNASET2, or of an mRNA thereof, indicates that the patient is likely to be a responder to an immunotherapy and/or a vaccine aiming inducing an immune response against an infectious pathogen or a tumor.
In a fifth aspect, the invention relates to a method, preferably an in vitro method, for determining if a dendritic cell is a type 2 dendritic cell, which method comprises the steps of:
a) determining the level of expression by the dendritic cell to be tested of at least one, 2, 3, 4, 5, 6, 7, 8, 9, 10, 11, 12, 13, 14, 15, 16, 17, 18, 19, 20, 21, 22, 23, 24, 25, 26, 27, 28 or 29, marker protein(s) selected from the group consisting of C1Q (C1QA, C1QB and/or C1QC), Fc.gamma.RIIIa, GATA3, RIPK4, CALCA, CREM, FMOD, HCRTR1, ILDR2, ITK, PADI2, PDE4D, PNOC, RGS9, ROR1, SIX2, SYT4, THBS1, TRIM9, ADAM8, CYTIP, NRP2, SEMA7A, TBC1D13, C3AR1, CD163, Fc.gamma.RIIa, Fc.epsilon.RIG, MCTP1, IVNS1ABP and SIGLECS, or of an mRNA thereof, b) comparing said level of expression with that of a control, and c) based on the comparison of step b), determining if the dendritic cell is a type 2 dendritic cell.
Preferably, the at least one marker protein the level of expression of which is determined in step a) is selected from the group consisting of CALCA, PNOC, ROR1 and SYT4. Still preferably, the at least one marker protein the level of expression of which is determined in step a) is selected from the group consisting of CREM, FMOD, GATA3, HCRTR1, ILDR2, ITK, PADI2, PDE4D, RGS9, RIPK4, SIX2, THBS1 and TRIM9. Still preferably, the at least one marker protein the level of expression of which is determined in step a) is selected from the group consisting of C1Q (C1QA, C1QB and/or C1QC), Fc.gamma.RIIIa, C3AR1, CD163, Fc.gamma.RIIa, Fc.epsilon.RIG, MCTP1, IVNS1ABP and SIGLECS.
Preferably, the determination step c) of the method is as follows: an increased level of expression of at least one marker protein selected from the group consisting of GATA3, RIPK4, CALCA, CREM, FMOD, HCRTR1, ILDR2, ITK, PADI2, PDE4D, PNOC, RGS9, ROR1, SIX2, SYT4, THBS1, TRIM9, ADAM8, CYTIP, NRP2, SEMA7A and TBC1 D13, or of an mRNA thereof, and/or a decreased level of expression of at least one marker protein selected from the group consisting of C1Q (C1QA, C1QB and/or C1QC), Fc.gamma.RIIIa, C3AR1, CD163, Fc.gamma.RIIa, Fc.epsilon.RIG, MCTP1, IVNS1ABP and SIGLECS, or of an mRNA thereof, indicates that the dendritic cell is a type 2 dendritic cell.
In a sixth aspect, the invention concerns a method, preferably an in vitro method, for determining if a dendritic cell is a tolerogenic dendritic cell, which method comprises the steps of:
a) determining the level of expression by the dendritic cell to be tested of at least one, preferably 2, 3, 4, 5, 6, 7, 8, 9, 10, 11, 12, 13, 14, 15, 16, 17, 18, 19, 20, 21, 22, 23, 24, 25 or 26, marker protein(s) selected from the group consisting of DAB2, Fc.gamma.RIIa, Fc.gamma.RIIIa, FTL, PECAM1, SLCO2B1, C3AR1, CD163, CD300LF, CFH, CSGALNACT1, P2RY14, ZBTB16, Fc.gamma.RIIB, CYP1B1, DPYD, GCLC, IVNS1ABP, LRRC25, NUDT16, PDCD4, RNASE6, RNASET2, Fc.epsilon.RIG, MCTP1 and SIGLEC5, or of an mRNA thereof, b) comparing said level of expression with that of a control, and c) based on the comparison of step b), determining if the dendritic cell is a tolerogenic dendritic cell.
Preferably, the at least one marker protein the level of expression of which is determined in step a) is selected from the group consisting of C3AR1, CD163, CD300LF, CHF, CSGALNACT1, Fc.gamma.RIIa, Fc.gamma.RIIb, P2RY14 and ZBTB16. Still preferably, the at least one marker protein the level of expression of which is determined in step a) is selected from the group consisting of C3AR1, CD163, CD300LF, CHF, Fc.gamma.RIIa, Fc.gamma.RIIb and P2RY14. Still preferably, the at least one marker protein the level of expression of which is determined in step a) is selected from the group consisting of CYP1B1, DAB2, DPYD, FTL, GCLC, IVNS1ABP, LRRC25, NUDT16, PDCD4, PECAM1, RNASE6, RNASET2, and SLCO2B1. Still preferably, the at least one marker protein the level of expression of which is determined in step a) is selected from the group consisting of CD300LF, Fc.gamma.RIIIa, Fc.gamma.RIIa, PECAM1.
Preferably, the determination step c) of the method is as follows: an increased level of expression of at least one marker protein selected from the group consisting of C3AR1, CD163, CD300LF, CFH, CSGALNACT1, P2RY14, ZBTB16, Fc.gamma.RIIA, Fc.gamma.RIIB, CYP1B1, DAB2, DPYD, FTL, GCLC, IVNS1ABP, LRRC25, NUDT16, PDCD4, RNASE6, RNASET2, SLCO2B1, Fc.epsilon.RIG, Fc.gamma.RIIIA, MCTP1 and SIGLEC5, or of an mRNA thereof, indicates that the dendritic cell is a tolerogenic dendritic cell.
In the fifth or sixth aspect of the invention, the control may consist of polarized and/or immature dendritic cells, more preferably immature dendritic cells.
The application further discloses kits that are useful in the above methods.
Accordingly, in a seventh aspect, the invention concerns a kit for determining if a patient is developing an immune response oriented either towards a regulatory T cell response or towards a Th2 response, which kit comprises:
a) means for determining the level of expression of at least one, preferably 2, 3, 4, 5, 6, 7, 8, 9, 10, 11, 12, 13, 14, 15, 16, 17, 18, 19, 20, 21, 22, 23, 24, 25, 26, 27, 28, 29, 30, 31, 32, 33, 34, 35, 36, 37, 38, 39, 40, 41, 42, 43, 44, 45, 46, 47 or 48, marker protein(s) selected from the group consisting of DAB2, Fc.gamma.RIIa, Fc.gamma.RIIIa, FTL, PECAM1, SLCO2B1, GATA3, RIPK4, CALCA, CREM, FMOD, HCRTR1, ILDR2, ITK, PADI2, PDE4D, PNOC, RGS9, ROR1, SIX2, SYT4, THBS1, TRIM9, ADAM8, CYTIP, NRP2, SEMA7A, TBC1D13, Fc.epsilon.RIG, MCTP1, SIGLEC5, C3AR1, CD163, CD300LF, CFH, CSGALNACT1, P2RY14, ZBTB16, Fc.gamma.RIIB, CYP1B1, DPYD, GCLC, IVNS1ABP, LRRC25, NUDT16, PDCD4, RNASE6 and RNASET2, or of an mRNA thereof, b) a standard control curve showing a relationship between the level of expression of the marker proteins, or of an mRNA thereof, and the probable development of an immune response oriented towards a regulatory T cell response or towards a Th2 response, and c) a control sample indicative of the level of expression of the marker proteins, or of an mRNA thereof, in a biological sample from an healthy patient.
The kit may further comprise instructions for the use of said kit in determining if the immune response is oriented either towards a regulatory T cell response or towards a Th2 response.
In an eighth aspect, the invention concerns a kit for determining if a patient is likely to be a responder to an immunotherapy and/or a vaccine aiming at treating an autoimmune disease or an allergy, which kit comprises:
a) means for determining the level of expression of at least one, preferably 2, 3, 4, 5, 6, 7, 8, 9, 10, 11, 12, 13, 14, 15, 16, 17, 18, 19, 20, 21, 22, 23, 24, 25, 26, 27, 28, 29, 30, 31, 32, 33, 34, 35, 36, 37, 38, 39, 40, 41, 42, 43, 44, 45, 46, 47, 48, 49 or 50, marker protein(s) selected from the group consisting of DAB2, Fc.gamma.RIIa, Fc.gamma.RIIIa, FTL, PECAM1, SLCO2B1, CD141, GATA3, RIPK4, OX40L, CALCA, CREM, FMOD, HCRTR1, ILDR2, ITK, PADI2, PDE4D, PNOC, RGS9, ROR1, SIX2, SYT4, THBS1, TRIM9, ADAM8, CYTIP, NRP2, SEMA7A, TBC1D13, Fc.epsilon.RIG, MCTP1, SIGLEC5, C3AR1, CD163, CD300LF, CFH, CSGALNACT1, P2RY14, ZBTB16, Fc.gamma.RIIB, CYP1B1, DPYD, GCLC, IVNS1ABP, LRRC25, NUDT16, PDCD4, RNASE6 and RNASET2, or of an mRNA thereof, b) a standard control curve showing a relationship between the level of expression of the marker proteins, or of an mRNA thereof, and the probable response to the immunotherapy and/or the vaccine, and c) a control sample indicative of the level of expression of the marker proteins, or of an mRNA thereof, in a biological sample from a patient known to respond to the immunotherapy and/or the vaccine and/or from a patient known not to respond to the immunotherapy and/or the vaccine.
In a ninth aspect, the invention concerns a kit for determining if a patient is likely to be a responder to an immunotherapy and/or a vaccine aiming at inducing an immune response against an infectious pathogen or a tumor, which kit comprises:
a) means for determining the level of expression of at least one, preferably 2, 3, 4, 5, 6, 7, 8, 9, 10, 11, 12, 13, 14, 15, 16, 17, 18, 19, 20, 21, 22, 23, 24, 25, 26, 27, 28, 29, 30, 31, 32, 33, 34, 35, 36, 37, 38, 39, 40, 41, 42, 43, 44, 45, 46, 47 or 48, marker protein(s) selected from the group consisting of CD141, OX40L, DAB2, Fc.gamma.RIIa, Fc.gamma.RIIIa, FTL, PECAM1, SLCO2B1, GATA3, RIPK4, CALCA, CREM, FMOD, HCRTR1, ILDR2, ITK, PADI2, PDE4D, PNOC, RGS9, ROR1, SIX2, SYT4, THBS1, TRIM9, ADAM8, CYTIP, NRP2, SEMA7A, TBC1D13 Fc.epsilon.RIG, MCTP1, SIGLEC5, C3AR1, CD163, CD300LF, CFH, CSGALNACT1, P2RY14, ZBTB16, Fc.gamma.RIIB, CYP1B1, DPYD, GCLC, IVNS1ABP, LRRC25, NUDT16, PDCD4, RNASE6 and RNASET2, or of an mRNA thereof, b) a standard control curve showing a relationship between the level of expression of the marker proteins, or of an mRNA thereof, and the probable response to the immunotherapy and/or the vaccine, and c) a control sample indicative of the level of expression of the marker proteins, or of an mRNA thereof, in a biological sample from a patient known to respond to the immunotherapy and/or the vaccine and/or from a patient known not to respond to the immunotherapy and/or the vaccine.
In the eighth and ninth aspect of the invention, the kit may further comprise instructions for the use of said kit in determining if the patient is responding to the immunotherapy.
In a tenth aspect, the invention concerns a kit for determining if a dendritic cell is a type 2 dendritic cell, which kit comprises:
a) means for determining the level of expression of at least one, preferably 2, 3, 4, 5, 6, 7, 8, 9, 10, 11, 12, 13, 14, 15, 16, 17, 18, 19, 20, 21, 22, 23, 24, 25, 26, 27, 28, 29, 30, 31, 32 or 33, marker protein(s) selected from the group consisting of C1Q (C1QA, C1QB and/or C1QC), Fc.gamma.RIIIa, GATA3, RIPK4, CALCA, CREM, FMOD, HCRTR1, ILDR2, ITK, PADI2, PDE4D, PNOC, RGS9, ROR1, SIX2, SYT4, THBS1, TRIM9, ADAM8, CYTIP, NRP2, SEMA7A, TBC1D13, C3AR1, CD163, Fc.gamma.RIIa, Fc.epsilon.RIG, MCTP1, IVNS1ABP and SIGLEC5, or of an mRNA thereof, b) a standard control curve showing a relationship between the level of expression of the marker proteins, or of an mRNA thereof, and the probable subset to which the dendritic cell belongs, and c) a control sample indicative of the level of expression of the marker proteins, or of an mRNA thereof, in an immature dendritic cell.
The kit may further comprise instructions for the use of said kit in determining if the dendritic cell is a type 2 dendritic cell.
In an eleventh aspect, the present invention concerns a kit for determining if a dendritic cell is a tolerogenic dendritic cell, which kit comprises:
a) means for determining the level of expression of at least one, preferably 2, 3, 4, 5, 6, 7, 8, 9, 10, 11, 12, 13, 14, 15, 16, 17, 18, 19, 20, 21, 22, 23, 24, 25 or 26, marker protein(s) selected from the group consisting of DAB2, Fc.gamma.RIIa, Fc.gamma.RIIIa, FTL, PECAM1, SLCO2B1, C3AR1, CD163, CD300LF, CFH, CSGALNACT1, P2RY14, ZBTB16, Fc.gamma.RIIB, CYP1B1, DPYD, GCLC, IVNS1ABP, LRRC25, NUDT16, PDCD4, RNASE6, RNASET2, Fc.epsilon.RIG, MCTP1 and SIGLECS, or of an mRNA thereof,
b) a standard control curve showing a relationship between the level of expression of the marker proteins, or of an mRNA thereof, and the probable subset to which the dendritic cell belongs, and
c) a control sample indicative of the level of expression of the marker proteins, or of an mRNA thereof, in an immature dendritic cell.
The kit may further comprise instructions for the use of said kit in determining if the dendritic cell is a tolerogenic dendritic cell.
Optionally, the kits of the invention may further comprise means for measuring the expression level of some housekeeping genes.
In a preferred embodiment, the kits according to the invention comprise, in addition to the means for determining the level of expression of at least the recited marker protein(s), or for determining the expression of an mRNA thereof, a control sample comprising a known amount of the marker protein(s) to be measured.
The kits of the invention may further comprise a packaging.
Means for determining the level of expression of the marker proteins, or of the mRNA thereof, which are recited herein, in particular in Tables 1, 2 and 3, are well-known in the art. They include, e.g. reagents allowing the detection of mRNA by real-time quantitative-PCR, such as primers specific for the marker proteins to be measured. When the kit comprises means for real-time quantitative-PCR mRNA detection, the kit may further comprise a second reagent, labeled with a detectable compound, which binds to mRNA synthesized during the PCR, such as e.g. SYBER GREEN reagents or TaqMan reagents.
Means for determining the level of expression of the marker proteins may also include antibodies or aptamers specifically binding to the marker proteins to be measured. Such means can be labeled with detectable compound such as fluorophores or radioactive compounds. For example, the probe or the antibody specifically binding to the marker proteins may be labeled with a detectable compound. Alternatively, when the kit comprises an antibody, the kit may further comprise a secondary antibody, labeled with a detectable compound, which binds to an unlabelled antibody specifically binding to the marker protein(s) to be measured. Means for determining the level of expression of the marker proteins may also include calibration standard peptide or protein, with or without mass modifying label.
The means for measuring the level of expression of the marker proteins may also include reagents such as e.g. reaction, hybridization and/or washing buffers. The means may be present, e.g., in vials or microtiter plates, or be attached to a solid support such as a microarray as can be the case for primers and probes.
In a twelfth aspect, the present invention concerns an in vitro method for screening for compounds which are suitable for polarizing a dendritic cell towards the type 2 dendritic cell subset, which method comprises the steps of:
a) providing a test compound,
b) contacting immature dendritic cells with the test compound,
c) determining the level of expression by the dendritic cell of at least one protein marker selected from the group consisting of C1Q (C1QA, C1QB and/or C1QC), Fc.gamma.RIIIa, GATA3, RIPK4, CALCA, CREM, FMOD, HCRTR1, ILDR2, ITK, PADI2, PDE4D, PNOC, RGS9, ROR1, SIX2, SYT4, THBS1, TRIM9, ADAM8, CYTIP, NRP2, SEMA7A, TBC1D13, C3AR1, CD163, Fc.gamma.RIIa, Fc.epsilon.RIG, MCTP1, IVNS1ABP and SIGLEC5, or of an mRNA thereof, wherein the determination that the level of expression of at least one protein marker, selected from the group consisting of GATA3, RIPK4, CALCA, CREM, FMOD, HCRTR1, ILDR2, ITK, PADI2, PDE4D, PNOC, RGS9, ROR1, SIX2, SYT4, THBS1, TRIM9, ADAM8, CYTIP, NRP2, SEMA7A and TBC1D13, or of an mRNA thereof, by the dendritic cells contacted with the test compound is higher than the level of expression of said protein marker, or an mRNA thereof, by a control sample consisting of immature dendritic cells which has not been contacted with the test compound, and/or the determination that the level of expression of at least one protein marker, selected from the group consisting of C1Q (C1QA, C1QB and/or C1QC), Fc.gamma.RIIIa, C3AR1, CD163, Fc.gamma.RIIa, Fc.epsilon.RIG, MCTP1, IVNS1ABP and SIGLEC5, or of an mRNA thereof, by the dendritic cells contacted with the test compound is lower than the level of expression of said protein marker, or an mRNA thereof, by a control sample consisting of immature dendritic cells which has not been contacted with the test compound, indicates that said test compound is suitable for polarizing a dendritic cell towards the type 2 dendritic cell subset.
In a thirteenth aspect, the present invention also concerns an in vitro method for screening for compounds which are suitable for polarizing a dendritic cell towards the tolerogenic dendritic cell subsets, which method comprises the steps of:
a) providing a test compound,
b) contacting immature dendritic cells with the test compound,
c) determining the level of expression by the dendritic cell of at least one protein marker selected from the group consisting of DAB2, Fc.gamma.RIIa, Fc.gamma.RIIIa, FTL, PECAM1, SLCO2B1, C3AR1, CD163, CD300LF, CFH, CSGALNACT1, P2RY14, ZBTB16, Fc.gamma.RIIB, CYP1B1, DPYD, GCLC, IVNS1ABP, LRRC25, NUDT16, PDCD4, RNASE6, RNASET2, Fc.epsilon.RIG, MCTP1 and SIGLEC5, or of an mRNA thereof, wherein the determination that the level of expression of at least one protein marker, selected from the group consisting of DAB2, Fc.gamma.RIIa, Fc.gamma.RIIIa, FTL, PECAM1, SLCO2B1, C3AR1, CD163, CD300LF, CFH, CSGALNACT1, P2RY14, ZBTB16, Fc.gamma.RIIB, CYP1B1, DPYD, GCLC, IVNS1ABP, LRRC25, NUDT16, PDCD4, RNASE6, RNASET2, Fc.epsilon.RIG, MCTP1 and SIGLEC5, or of an mRNA thereof, by the dendritic cells contacted with the test compound is higher than the level of expression of said protein marker, or an mRNA thereof, by a control sample consisting of immature dendritic cells which has not been contacted with the test compound, indicates that said test compound is suitable for polarizing a dendritic cell towards the tolerogenic dendritic cell subsets.
In a fourteenth aspect, the present invention also concerns an in vitro method for screening for compounds which are suitable in a patient for shifting from a Th2 response towards a tolerogenic T cell response, which method comprises the steps of:
a) providing a test compound,
b) contacting immature and/or type 2 dendritic cells with the test compound,
c) determining the level of expression by the dendritic cell of at least one protein marker selected from the group consisting of DAB2, Fc.gamma.RIIa, Fc.gamma.RIIIa, FTL, PECAM1, SLCO2B1, CD141, GATA3, RIPK4, OX40L, CALCA, CREM, FMOD, HCRTR1, ILDR2, ITK, PADI2, PDE4D, PNOC, RGS9, ROR1, SIX2, SYT4, THBS1, TRIM9, ADAM8, CYTIP, NRP2, SEMA7A, TBC1D13, Fc.epsilon.RIG, MCTP1, SIGLEC5, C3AR1, CD163, CD300LF, CFH, CSGALNACT1, P2RY14, ZBTB16, Fc.gamma.RIIB, CYP1B1, DPYD, GCLC, IVNS1ABP, LRRC25, NUDT16, PDCD4, RNASE6 and RNASET2, or of an mRNA thereof, wherein the determination that the level of expression of at least one protein marker, selected from the group consisting of DAB2, Fc.gamma.RIIa, Fc.gamma.RIIIa, FTL, PECAM1, SLCO2B1, C3AR1, CD163, CD300LF, CFH, CSGALNACT1, P2RY14, ZBTB16, Fc.gamma.RIIB, CYP1B1, DPYD, GCLC, IVNS1ABP, LRRC25, NUDT16, PDCD4, RNASE6, RNASET2, Fc.epsilon.RIG, MCTP1 and SIGLEC5, or of an mRNA thereof, by the dendritic cells contacted with the test compound is higher than the level of expression of said protein marker, or an mRNA thereof, by a control sample consisting of immature dendritic cells which has not been contacted with the test compound, and/or wherein the determination that the level of expression of at least one protein marker, selected from the group consisting of GATA3, RIPK4, CALCA, CREM, FMOD, HCRTR1, ILDR2, ITK, PADI2, PDE4D, PNOC, RGS9, ROR1, SIX2, SYT4, THBS1, TRIM9, ADAM8, CYTIP, NRP2, SEMA7A and TBC1D13, or of an mRNA thereof, by the dendritic cells contacted with the test compound is lower than the level of expression of said protein marker, or an mRNA thereof, by a control sample consisting of immature dendritic cells which has not been contacted with the test compound indicates that said test compound is suitable for shifting from a Th2 response towards a tolerogenic T cell response.
The method may further allow identifying compounds suitable for use in the treatment of allergy.
Marker Proteins
The term "marker protein" includes all isoforms of said proteins. Thus, for the marker proteins described above, the term "marker protein" includes the polypeptide having the amino acid sequences disclosed herein and all isoforms thereof. "Isoform" refers to all alternative forms of a protein, for example amino-acid substituted forms, alternatively spliced versions and post-translationally modified forms such as glycoforms. Post-translationally modified isoforms may include acetylated, formylated, lipoylated, myristoylated, palmitoylated, alkylated, methylated, amidated, glycosylated, hyrdroxylated, nitrosylated, phosphorylated, sulphated, polysialylated and sialylated forms. Isoforms include naturally occurring variants, allelic variants, SNPs (single nucleotide polymorphisms), alternative splice variants and truncated or secreted forms of the protein. Alternatively spliced and truncated mRNAs encoding the marker proteins may also be detected.
Detection of the "level of expression" of a marker protein may refer to the level of expression of any individual isoform of said protein, the collective level of expression of selected isoforms of said protein, or the total level of expression of said protein including the reference sequence and all isoforms.
The marker proteins described herein are defined in Tables 1, 2 and 3 below.
In one embodiment, the marker proteins have the sequence corresponding to the Uni-Prot/Swiss-Prot accession number recited in Tables 1, 2 and 3 below. In another embodiment, the marker proteins comprise or consist of one of the sequences set forth under the corresponding SEQ ID recited in Tables 1, 2 and 3 below.
TABLE-US-00001 TABLE 1 Marker proteins used to identify DCreg UniProt/SwissProt SEQ Marker Protein name Synonyms Accession No. ID NO: DAB2 Disabled homolog 2 DOC-2; differentially- P98082 1-3 expressed protein 2 FTL Ferritin light chain Ferritin L subunit P02792 6 PECAM1 Platelet endothelial cell EndoCAM; GPIIA'; P16284 7-12 adhesion molecule PECA1; CD31 SLCO2B1 Solute carrier organic Organic anion transporter B; O94956 13-16 anion transporter family OATP-B; member 2B1 Organic anion transporter polypeptide-related protein 2; OATP-RP2; OATPRP2: Solute carrier family 21 member 9 CD300LF CMRF35-like molecule 1 CLM-1; CD300 antigen-like Q8TDQ1 22-27 family member F; Immune receptor expressed on myeloid cells 1; IREM-1; immunoglobulin superfamily member 13; IgSF13; NK inhibitory receptor; CD300f CFH Complement factor H H factor 1; HF; HF1; HF2 P08603 28-29 CSGALNA Chondroitin sulfate N- CsGalNAcT-1; CT1 acetylgalactosaminyl- Chondroitin beta-1,4-N- Q8TDX6 30-32 transferase 1 acetylgalactosaminyltransfe 1; Beta4GaINAct-1; CHGN; GALNACT1 P2RY14 P2Y purinoceptor 14 P2Y14; G-protein coupled Q15391 33 receptor 105; UDP-glucose receptor; GPR105 ZBTB16 Zinc finger and BTB Promyelocytic leukemia zinc Q05516 34-35 domain-containing finger protein; Zinc finger protein 16 protein 145; Zinc finger protein PLZF; PLZF; ZNF145 Fc.gamma.RIIB Low affinity IgG Fc receptor II-b; CDw32; P31994 36-38 immunoglobulin gamma FCGR2B; CD32; FcRII-b Fc region receptor II-b CYP1B1 Cytochrome P450 1B1 CYPIB1 Q16678 39 DPYD Dihydropyrimidine DHPDHase; DPD; dehydrogenase [NADP(+)] Dihydrothymine Q12882 40-41 dehydrogenase; Dihydrouracil dehydrogenase GCLC Glutamate-cysteine ligase GCS heavy chain; Gamma- P48506 42 catalytic subunit ECS; Gamma- glutamylcysteine synthetase LRRC25 Leucine-rich repeat- Monocyte and plasmacytoid- Q8N386 44 containing protein 25 activated protein NUDT16 U8 snoRNA-decapping IDP phosphatase; IDPase; Q96DE0 45-48 enzyme Inosine diphosphate phosphatase; Nucleoside diphosphate-linked moiety X motif 16; Nudix motif 16; U8 snoRNA-binding protein H29K; m7GpppN-mRNA hydrolase PDCD4 Programmed cell death Neoplastic transformation Q53EL6 49-50 protein 4 inhibitor protein; Nuclear antigen H731-like; Protein 197/15a RNASE6 Ribonuclease K6 RNase K6 Q93091 51 RNASET2 Ribonuclease T Ribonuclease 6; RNASE6PL O00584 52-53
TABLE-US-00002 TABLE 2 Marker proteins used to identify DCreg and DC2 SEQ UniProt/SwissProt ID Marker Protein name Synonyms Accession No. NO: Fc.gamma.RIIIa Low affinity immunoglobulin CD16a antigen; Fc-gamma RIII-alpha; P08637 54 gamma Fc region receptor Fc-gamma RIII; Fc-gamma RIIIa; FcRIII; III-A FcRIIIa; FcR-10; IgG Fc receptor III-2; CD16a; FCGR3A Fc.gamma.RIlla Low affinity immunoglobulin IgG Fc receptor II-a; CDw32; P12318 4-5 gamma Fc region receptor Fc-gamma RIII-a; Fc-gamma-RIIIa; II-a FcRII-a; CD32 C3AR1 C3a anaphylatoxin C3AR; AZ3B, C3R1, HNFAG09 Q16581 17 chemotactic receptor CD163 Scavenger receptor Hemoglobin scavenger receptor; M130 Q86VB7 18-21 cysteine-rich type 1 protein M130 IVNS1ABP Influenza virus NS1A- NS1-BP; NS1-binding protein; Aryl Q9Y6Y0 43 binding protein hydrocarbon receptor-associated protein 3 Fc.epsilon.RIG High affinity immunoglobulin Fc receptor gamma-chain; FcRgamma; P30273 56 epsilon receptor subunit gamma Fc-epsilon RI-gamma; IgE Fc receptor subunit gamma; FceRI gamma; FCER1G MCTP1 Multiple C2 and transmembrane -- Q6DN14 57-61 domain-containing protein 1 SIGLEC5 Sialic acid-binding Ig-like Siglec-5; CD33 antigen-like 2; O15389 62 lectin 5 Obsesity-binding protein 2; OB-BP2; OB-binding protein 2; CD170; CD33L2; OBBP2
TABLE-US-00003 TABLE 3 Marker proteins used to identify DC2 UniProt/ SEQ SwissProt ID Marker Protein name Synonyms Accession No. NO: C1QA Complement C1q -- P02745 55 subcomponent subunit A C1QB Complement C1q -- P02746 152 subcomponent subunit B C1QC Complement C1q -- P02747 153 subcomponent subunit C GATA3 Trans-acting T cell-specific GATA-binding factor 3 P23771 63-64 transcription factor GATA-3 RIPK4 Receptor-interacting Ankyrin repeat domain- P57078 65-66 serine/threonine- containing protein 3; PKC- protein kinase 4 delta-interacting protein kinase CALCA Calcitonin gene-related Alpha-type CGRP; P06881 67 peptide 1 Calcitonin gene-related peptide I; CGRP-I CREM cAMP-responsive element Inducible cAMP early Q03060 68-96 modulator repressor; ICER FMOD Fibromodulin FM; Collagen-binding 59 Q06828 97 kDa protein; Keratan sulfate proteoglycan fibromodulin; KSPG fibromodulin HCRTR1 Orexin receptor type 1 Ox-1-R; Ox1-R; Ox1R; O43613 98 Hypocretin receptor type 1 ILDR2 Immunoglobulin-like -- Q71H61 99 domain-containing receptor 2 ITK Tyrosine-protein kinase Interleukin-2-inducible Q08881 100 ITK/TSK T-cell kinase; IL-2-inducible T-cell kinase; Kinase EMT; T-cell- specific kinase; Tyrosine- protein kinase Lyk; EMT; LYK PAD12 Protein-arginine deiminase type-2 PAD-H19; Peptidylarginine Q9Y2J8 101-102 deiminase II; Protein-arginine deiminase type II PDE4D cAMP-specific 3',5'-cyclic DPDE3; PDE43 Q08499 103-114 phosphodiesterase 4D PNOC Prepronociceptin -- Q13519 115-116 RGS9 Regulator of G-protein -- O75916 117-121 signaling 9 ROR1 Tyrosine-protein kinase Neurotrophic tyrosine kinase, Q01973 122-124 transmembrane receptor ROR1 receptor-related 1; NTRKR1 SIX2 Homeobox protein SIX2 Sine oculis homeobox Q9NPC8 125 homolog 2 SYT4 Synaptotagmin-4 Synaptotagmin IV; SytIV Q9H2B2 126 or 127 THBS1 Thrombospondin-1 -- P07996 128-129 TRIM9 E3 ubiquitin-protein ligase RING finger protein 91; Q9C026 130-132 TRIM9 Tripartite motif-containing protein 9 ADAM8 Disintegrin and metalloproteinase Cell surface antigen MS2; P78325 133-135 domain-containing protein 8 CD156a CYTIP Cytohesin-interacting Cytohesin binder and O60759 136-137 protein regulator; CYBR; Cytohesin- associated scaffolding protein; CASP; Cytohesin-binding protein HE; Cbp HE; Pleckstrin homology Sec7 and coiled-coil domains- binding protein NRP2 Neuropilin-2 Vascular endothelial cell O60462 138-143 growth factor 165 receptor 2 SEMA7A Semaphorin-7A CDw108; JMH blood group O75326 144-145 antigen; John-Milton-Hargen human blood group Ag; Semaphorin-K1; Sema K1; Semaphorin-L; Sema L; CD108 TBC1D13 TBC1 domain family member 13 -- Q9NVG8 146-148 OX4OL Tumor necrosis factor ligand Glycoprotein Gp34; OX40 P23510 149-150 superfamily member 4 ligand; TAX transcriptionally- activated glycoprotein 1; CD252; TNFSF4; TNFL4 CD141 Thrombomodulin TM; Fetomodulin; TRBM P07204 151 THBD
In the context of the invention, the above cited Swiss Prot references are those that were available on Oct. 28, 2014.
In some embodiments, the methods of the invention involve detection of a single marker protein or protein isoform of the proteins listed in Tables 1, 2 and 3, or an mRNA thereof. In other embodiments, more than one protein or protein isoform listed in Tables 1, 2 and 3, or an mRNA thereof, is detected, for example at least 2, 3, 4, 5, 6, 7, 8, 9, 10, 11, 12, 13, 14, 15, 16, 17, 18, 19, 20, 21, 22, 23, 24, 25, 26, 27, 28, 29, 30, 31, 32, 33, 34, 35, 36, 37, 38, 39, 40, 41, 42, 43, 44, 45, 46, 47, 48, 49, 50, 51, 52 or at least 53 proteins or protein isoforms, or the mRNAs thereof.
An increase or decrease in the level of expression of a protein isoform, or an mRNA thereof, may be detected in a biological sample compared to a control, as detailed below. The fold change in the patient sample compared to the control may be at least 2, at least 2,3, at least 3, at least 4, at least 5, at least 10, at least 15, at least 17, at least 20, at least 30, at least 40, at least 50, at least 60, at least 70, at least 80, at least 90, at least 100, at least 200, at least 300, at least 400 or at least 500-fold.
As used throughout the present specification, any reference to the "marker proteins" recited in Tables 1, 2 and 3 is meant to encompass any naturally occurring isoform of the marker proteins naturally encoded by human, but also their homologous and orthologous counterpart of other animals.
The patient is preferably a mammal, such as a rodent, a feline, an equine, a bovine, an ovine, a canine or a primate, and is preferably a human, in particular a child, a woman, a man.
Depending on the origin of sample to be tested (e.g. a rodent, a feline, an equine, a bovine, an ovine, a canine or a primate . . . ), the person skilled in the art will easily determine which are the sequences of the markers to be detected by consulting the commonly known sequence databases and will therefore choose the means suitable for detecting these markers.
For instance, when the patient is a human, the term "marker proteins" is intended to mean any naturally occurring isoform of the marker proteins naturally encoded by human genome, including the protein having an amino acid sequence corresponding to the sequences of accession number and of SEQ ID listed in Tables 1, 2 and 3, human equivalents of the non-human sequences listed, allelic variants thereof and splice variants thereof.
Biological Sample
The biological sample may be, without limitation, blood (e.g. peripheral blood, PBMCs), plasma, serum, mucosal (e.g. nasal secretion, saliva), bronchoalveolar cerebrospinal fluid or urine. In a particularly preferred embodiment, the biological sample is a blood sample, more preferably a blood serum sample. Still preferably, the biological sample comprises PBMCs.
The biological sample may as well be tissues, epithelial brushings, most particularly from mucosal surfaces. In some embodiments, said biological sample contains antigen-presenting cells (i.e. monocytes, macrophages and/or dendritic cells), more preferably dendritic cells. However, it is not necessary for the sample to contain antigen-presenting cells, as the marker protein may be secreted and may be detected in body fluids or tissues which do not contain the antigen-presenting cells themselves.
In some embodiments, the biological sample is preferably taken before the commencement of therapy or before the planned commencement of therapy. In other embodiment, the biological sample may also be taken after the commencement of therapy, for example after one round of therapy is completed in order to decide whether to proceed to further rounds. In particular, where the method comprises determining if a patient undergoing immunotherapy is likely to respond to said immunotherapy, samples taken before the commencement of therapy, during therapy and/or at the end of therapy may be required.
In all aspect of the invention relating to allergy, the biological sample is preferably peripheral blood, blood serum or PBMCs sample, nasal secretion, saliva or bronchoalveolar fluid, mucosal tissues or epithelial brushing.
Control
The expression of the marker proteins by dendritic cells to be tested, or where appropriate in a patient biological sample, may be compared with a control standard value and/or or with the expression of said marker protein in a control sample as explained above, for instance a control sample of the same nature.
A standard value may be obtained by, for example, detecting the level of expression in a given subset of dendritic cells (e.g. immature dendritic cells, type 1, type 2 or tolerogenic dendritic cells) or in a given group of subjects (for instance healthy donors, patients developing an immune response oriented towards a regulatory T cell response or towards a Th2 response, patients previously identified as a responder to a treatment, or patients previously identified as a non-responder to a treatment) and obtaining an average or median figure.
The control sample may consist of immature dendritic cells.
In the context of the invention, the term "immature dendritic cells" is intended to mean that the dendritic cells are not activated and have not been polarized towards tolerogenic or effector subsets. Immature dendritic cells may be obtained from monocytes sorted out from peripheral blood (e.g. from PBMCs) by method well known from the one skilled in the art. Such methods are for instance disclosed in Sallusto and Lanzavecchia, J Exp Med, 179:1109-1118, 1994, and in Example 1 of the present application. Other sources of DCs include plasmacytoid DCs (from blood, PBMCs, tissues), dermal DCs and Langerhans cells (from skin or mucosal tissues).
The term "polarized dendritic cells" is intended to mean that the dendritic cells are activated and have been polarized towards tolerogenic or effector subsets. Polarized dendritic cells of specific subtypes may be obtained from immature dendritic cells by method well known from the one skilled in the art
As will be clear to the skilled person, the nature of the comparison of the dendritic cell to be tested, or where appropriate of the patient biological sample to be tested, with the control and the conclusions drawn will depend on the nature of the control.
For instance, where the marker protein is disclosed herein as a protein displaying an increased level of expression in tolerogenic dendritic cells and the control is based on immature dendritic cells, a value the same as or similar to, or lower than, the control may be indicative that the dendritic cell to be tested is not a tolerogenic dendritic cell, whereas a value higher than the control may be indicative that the dendritic cell to be tested is a tolerogenic dendritic cell. Conversely, where the control is based on tolerogenic dendritic cells, a value the same as or similar to the control may be indicative that the dendritic cell to be tested is a tolerogenic dendritic cell.
Similarly, where the marker protein is disclosed herein as a protein displaying an increased level of expression in type 2 dendritic cells and the control is based on immature dendritic cells, a value the same as or similar to, or lower than, the control may be indicative that the dendritic cell to be tested is not a type 2 dendritic cell, whereas a value higher than the control may be indicative that the dendritic cell to be tested is a type 2 dendritic cell. Conversely, where the control is based on type 2 dendritic cells, a value the same as or similar to the control may be indicative that the dendritic cell to be tested is a type 2 dendritic cell.
Similarly, where the marker protein is disclosed herein as a protein displaying a decreased level of expression in type 2 dendritic cells and the control is based on immature dendritic cells, a value the same as or similar to, or higher than, the control may be indicative that the dendritic cell to be tested is not a type 2 dendritic cell, whereas a value lower than the control may be indicative that the dendritic cell to be tested is a type 2 dendritic cell. Conversely, where the control is based on type 2 dendritic cells, a value the same as or similar to the control may be indicative that the dendritic cell to be tested is a type 2 dendritic cell.
The same type of reasoning applies to determine if a patient is developing an immune response oriented either towards a regulatory T cell response or towards a Th2 response.
For instance, concerning the embodiments wherein the patient has not been treated, as exemplified above, the control may be immature dendritic cells, in particular which have not been polarized towards tolerogenic or effector subsets, or a biological sample from a healthy donor of the same nature than that of the biological sample to be tested. The control may also be type 2 dendritic cells, tolerogenic dendritic cells, biological sample of a patient who is developing a regulatory T cell response, biological sample of a patient who is developing a Th2 response. On the basis of a reasoning similar to that above in relation to the determination of to which dendritic cell subset belongs the DCs to be tested, depending on the type of control, the person skilled in the art will be able to determine if a patient is developing an immune response oriented either towards a regulatory T cell response or towards a type 2 response.
Regarding the embodiments wherein the patient has been treated, as exemplified above, the control may be a biological sample from a patient or group of patients of the same nature as that of the biological sample to be tested, which sample has been obtained before the treatment begins. Preferably, the control is a pre-treatment sample taken from the patient undergoing treatment. The control may also be type 2 dendritic cells, tolerogenic dendritic cells, a biological sample from a patient who is developing a regulatory T cell response, a biological sample from a patient who is developing a Th2 response. Further, when one wishes to determine if the patient will likely be a responder or a non-responder to a treatment, the control may be a biological sample from a healthy donor, a biological sample from a patient previously identified as a responder to the treatment, a biological sample from a patient previously identified as a non-responder to the treatment (biological samples of the same nature than that of the biological sample to be tested) and, where the sample is a patient sample, the sample is obtained before the beginning of treatment.
The methods according to the first, second, third and fourth aspects of the invention may in particular be used to monitor patients during therapy to establish whether they are responding to therapy, an increase or decrease in marker protein expression during therapy being indicative of responsiveness to treatment.
Where the marker protein is disclosed herein as a protein displaying an increased level of expression in responder subjects and the control is based on a non-responder subject or group of such subjects, a value the same as or similar to, or lower than, the control may be indicative of non-responsiveness to therapy, whereas a value higher than the control may be indicative of responsiveness to therapy. Conversely, where the control is based on a responder subject or group of such subjects, a value the same as or similar to, or higher than, the control may be indicative of responsiveness to therapy, whereas a value lower than the control may be indicative of non-responsiveness to therapy. Where the control is based on an average or median value obtained from a random group of subjects, a value higher than the control may be indicative of responsiveness to therapy.
Similarly, where the marker protein is disclosed herein as a protein displaying a decreased level of expression in responder subjects and the control is based on a non-responder subject or group of such subjects, a value the same as or similar to, or higher than, the control may be indicative of non-responsiveness to therapy, whereas a value lower than the control may be indicative of responsiveness to therapy. Where the control is based on a responder subject or group of such subjects, a value the same as or similar to, or lower than, the control may be indicative of responsiveness to therapy, whereas a value higher than the control may be indicative of non-responsiveness to therapy. Where the control is based on an average or median value obtained from a random group of subjects, a value lower than the control may be indicative of responsiveness to therapy.
Detection of Marker Proteins/Determination of the Level of Expression of Markers Proteins
The level of expression of the marker protein may be determined by gel electrophoresis (SDS-PAGE), in particular one and two-dimensional gel electrophoresis (1D-, 2D-PAGE), carried out on the sample or a protein-containing extract thereof. 2D-PAGE is a well-established technique in which proteins are first separated in one dimension by isoelectric focusing and further separated by SDS-PAGE along a second dimension. Protein expression may be analyzed by visualization of labeled proteins, or by western blotting (i.e. using a monoclonal or polyclonal antibody). Protein quantitation by 2D-PAGE is usually carried out by 2D-DiGE, in which proteins from a control sample and the test sample are labeled with different dyes. The dyes are of similar mass and identical charge so the labeled proteins migrate to the same position on the gel, allowing quantitation to be carried out within a single gel.
The level of expression of the marker protein may also be determined by mass spectrometry assays (LC-MS or LC-MS/MS). Qualitative and quantitative mass spectrometric techniques are known and used in the art. To this aim, target peptides specific for marker proteins are selected and quantified based on calibration curves established with synthetic peptides labeled with stable isotopes. Enzymatic digests, spiked with a defined amount of isotope labeled target peptides, are analyzed by liquid chromatography coupled with mass spectrometry. The ratio between labeled and non-labeled target peptides is measured to assess target peptide concentrations and therefore protein marker concentration.
The level of expression of the marker protein may also be determined using an antibody which binds to the protein, for example a monoclonal or polyclonal antibody, an antibody variant or fragments such as a single chain antibody, a diabody, a minibody, a single chain Fv fragment (sc(Fv)), a Sc(Fv).sub.2 antibody, a Fab fragment or a F(ab').sub.2 fragment, a V.sub.HH antibody or a single domain antibody. The antibody may be mono-, bi-, tri- or multivalent. The antibody may be immobilized on a solid support. Antibodies may be used to determine protein expression in a range of immunological assays including competitive and non-competitive assay systems using techniques such as western blotting, immunohistochemistry/immunofluorescence (i.e protein detection on fixed cells or tissues), radioimmunoassay such as RIA (radio-linked immunoassay), ELISA (enzyme linked immunosorbent assay), "sandwich" immunoassays, immunoprecipitation assays, immunodiffusion assays, agglutination assays, complement-fixation assays, immunoradiometric assays, fluorescent immunoassays, e.g. FIA (fluorescence-linked immunoassay), chemiluminescence immunoassays, ECLIA (electrochemiluminescence immunoassay) and protein A immunoassays. Such assays are routine and well known to the person skilled in the art.
The level of expression of the marker protein may alternatively be determined using a protein-specific aptamer. An aptamer is a short peptide capable of specifically binding to a specific protein sequence, consisting of a variable peptide loop attached at both ends to a protein scaffold. Methods for making protein aptamers are well known in the art, the most commonly used method being the yeast two-hybrid system. Such aptamers may preferably be labeled in order to allow the detection of a protein-ligand interaction. A nanotechnology-based assay could also be used.
Accordingly, in particular embodiments, the level of expression of the at least one marker protein as defined above is determined by immunological assay, mass spectrometry assays or gel electrophoresis.
Detection of mRNA of the Marker Proteins/Determination of the Level of Expression of mRNA of the Markers Proteins
The level of expression of mRNAs of the marker proteins may be determined by real-time quantitative RT-PCR, using primers specific for the marker proteins to be measured. This method allows the detection of mRNA in a biological sample by generating cDNA by reverse transcription using at least one primer; amplifying the cDNA so produced using gene specific polynucleotides as sense and antisense primers and detecting the presence of the amplified cDNA by methods well known to the person skilled in the art. This includes cDNA amplification with specific predesigned primers using SYBR GREEN or Taqman reagents. Other methods such as high throughput sequencing are also applicable.
Therapeutic Applications
"Therapy", "therapeutic", "treatment" or "treating" include reducing, alleviating or inhibiting or eliminating the symptoms of diseases (e.g. infectious diseases, tumors, autoimmune diseases) or of pathological conditions (e.g. allergy), as well as treatment intended to reduce, alleviate, inhibit or eliminate said symptoms. These terms may include preventive treatment which is intended to, or has the effect of, reducing, alleviating, inhibiting or eliminate future symptoms. They may also include treatment of ongoing symptoms.
By "a tumor" is meant any type of cancerous (malignant) tumor. The malignant tumor may be for instance carcinomas, adenocarcinomas, sarcomas, malignant melanomas, mesotheliomas, blastomas. The carcinoma or adenocarcinoma may for example correspond to a bladder, a colon, a kidney, an ovary, a prostate, a lung, an uterus, a breast or a prostate carcinoma or adenocarcinoma. The blastoma may for example correspond to a neuroblastoma, a glioblastoma or a retinoblastoma. The cancer is preferably selected from the group consisting of prostate cancer (e.g. prostate adenocarcinoma), lung cancer (e.g. squamous cellular carcinoma), breast cancer (e.g. infiltrated ductal carcinoma), ovary cancer (e.g. serous papillary carcinoma), uterus cancer (squamous cellular carcinoma), brain cancer (e.g. astrocytoma), colon cancer (e.g. colon adenocarcinoma), colorectal cancer, rectal cancer (e.g. rectal adenocarcinoma), cancer of the striated muscle (e.g. rhabdomyosarcoma), thyroid cancer, testicular cancer. In a most preferred embodiment, the cancer is selected from the group consisting of lung cancer, prostate cancer, ovary cancer, uterus cancer, brain cancer, colon cancer, colorectal cancer, rectal cancer and cancer of the striated muscle, bladder cancer, liver cancer, kidney cancer and thyroid cancer.
By "infectious disease", also known as contagious disease or transmissible disease, is meant any disease which is due to a biological agent which can be spread from one subject to another, i.e. an infectious pathogen. The infectious pathogen may be viruses, bacteria, fungi, protozoa and multicellular parasites.
"Autoimmune disease" is a condition that occurs when the immune system mistakenly attacks and destroys healthy body tissue. Examples of autoimmune (or autoimmune-related) disorders include Addison's disease, Celiac disease--sprue (gluten-sensitive enteropathy), dermatomyositis, Graves disease, Hashimoto's thyroiditis, multiple sclerosis, myasthenia gravis, pernicious anemia, reactive arthritis, rheumatoid arthritis, Sjogren syndrome, systemic lupus erythematosus and type I diabetes.
"Graft rejection" is the rejection of the graft (organs, tissues or cells) by the recipient. The rejection may be based on both cell-mediated and antibody-mediated immunity directed against cells of the graft. The graft may be for instance a xenograft (i.e. tissue that is transplanted from one species to another) or an allograft (i.e. a graft of tissue obtained from a donor genetically different from, though of the same species as the recipient).
"Allergy" or "type 1 hypersensitivity", is a condition characterized by production of allergen-specific IgE in response to a specific allergen, usually a protein. Clinical manifestations and symptoms of allergy may include nasal congestion, nasal pruritis, ocular pruritis, tearing, rhinorrhoea, sinusitis, rhinitis, sneezing, wheezing, conjunctivitis, dermal itching, dermatitis, skin irritation and asthma.
An "allergen" is a substance, usually a protein, which elicits the production of IgE antibodies in predisposed individuals. Allergens may include pollen allergens (such as tree, herb, weed and grass pollen allergens), insect allergens (such as inhalant, saliva and venom allergens, e.g. cockroach, midge and house dust mite allergens and hymenoptera venom allergens), animal hair and dander allergens (from e.g. dog, cat, horse, rat, mouse, rabbit) and food allergens (from e.g. tree nuts, peanut, milk, egg). In a preferred embodiment, the patient has grass pollen allergy and the immunotherapy uses grass pollen allergen.
For instance, a protein allergen may be selected from the group consisting of a protein allergen of the genus Dermatophagoides; a protein allergen of the genus Felis; a protein allergen of the genus Ambrosia; a protein allergen of the genus Lolium; a protein allergen of the genus Cryptomeria; a protein allergen of the genus Alternaria; a protein allergen of the genus Alder, a protein allergen of the genus Betula; a protein allergen of the genus of Blomia; a protein allergen of the genus Quercus; a protein allergen of the genus Olea; a protein allergen of the genus Artemisia; a protein allergen of the genus Plantago; a protein allergen of the genus Parietaria; a protein allergen of the genus Canine; a protein allergen of the genus Blattella; a protein allergen of the genus Apis; a protein allergen of the genus Cupressus; a protein allergen of the genus Thuya; a protein allergen of the genus Chamaecyparis; a protein allergen of the genus Periplaneta; a protein allergen of the genus Agropyron; a protein allergen of the genus Secale; a protein allergen of the genus Triticum; a protein allergen of the genus Cynorhodon; a protein allergen of the genus Juniperus; a protein allergen of the genus Dactylis; a protein allergen of the genus Festuca; a protein allergen of the genus Poa; a protein allergen of the genus Lolium; a protein allergen of the genus Avena; a protein allergen of the genus Holcus; a protein allergen of the genus Anthoxanthum; a protein allergen of the genus Arrhenatherum; a protein allergen of the genus Agrostis; a protein allergen of the genus Phleum; a protein allergen of the genus Phalaris; a protein allergen of the genus Paspalum; and a protein allergen of the genus Sorghum.
Examples of various known protein allergens derived from some of the above-identified genus include: Betula (verrucosa) Bet v I; Bet v II; Blomia Blo 1 1; Blo t III; Blo t V; Blo t XII; Cynorhodon Cyn d I; Dermatophagoides (pteronyssinus or farinae) Der p I; Der p II; Der p III; Der p VII; Der f I; Der f II; Der f III; Der f VII; Felis (domesticus) Fel d I; Ambrosia (artemiisfolia) Amb a 1.1; Amb a 1.2; Amb a 1.3; Amb a 1.4; Amb a II; Lollium (perenne) Lol p I; Lot p II; Lol p III; Lot p IV; Lol p IX (Lol p V or Lol p Ib); Cryptomeria (japonica) Cry j I; Cry j II; Canis (familiaris) Can f I; Can f II; Juniperus (sabinoides or virginiana) Jun s I; Jun v I; Juniperus (ashei) Jun aI; Jun aII; Dactylis (glomerata) Dae g I; Dae g V; Poa (pratensis) Poa p I; PhI p I; PhI p V; PhI p VI and Sorghum (halepensis) Sor h I.
"Immunotherapy" is intended to mean a treatment of disease by inducing, enhancing, or suppressing an immune response by administration of substances (e.g. allergens, immunomodulators such as granulocyte colony-stimulating factor (G-CSF), interferons, imiquimod, cellular membrane fractions from bacteria, cytokines/interleukins (e.g. IL-2, IL-7, IL-12), various chemokines or cells (for instance lymphocytes, macrophages, dendritic cells, natural killer cells (NK Cell), cytotoxic T lymphocytes).
"Vaccine" refers to a pharmaceutical composition comprising an antigen and optionally an adjuvant to stimulate the immune system of an individual to develop adaptive immunity to said antigen. The antigen may for instance be biological agents (for example viruses, bacteria, fungi, protozoa and multicellular parasites) or a peptide therefrom, or a tumoral antigen. Vaccines can be prophylactic (e.g. to prevent or ameliorate the effects of a future infection by the infectious pathogen), or therapeutic (e.g. vaccines against cancer).
The substance used in immunotherapy and the vaccine may be administered via a parenteral route, such as subcutaneously or intravenously, for example via injection, or via alternative routes such as intranasal, skin immunisation e.g. transdermal, epicutaneous, intralymphatic administration or mucosal (administration on mucosal surfaces, e.g. a sublingual, oral, buccal, ocular, rectal, urinal, vaginal, pulmonary or otolar surface).
In relation to allergy, immunotherapy may for example consist of administering an allergen to a patient with the aim of reducing current or future immune response, such as an IgE response, and/or manifestation of clinical symptoms of allergy. Immunotherapy is conventionally carried out by administering repeatedly a monodose or incremental doses of an allergen to a patient in need thereof, thereby resulting in an adaptive immune response of the patient who becomes desensitised to the allergen. Immunotherapy may comprise administration of allergen to a mucosal surface, optionally a sublingual, oral, buccal, ocular, rectal, urinal, vaginal, pulmonary or otolar surface. In particular, immunotherapy may be sublingual immunotherapy. Alternatively, immunotherapy may comprise administration via a parenteral route, such as subcutaneously or intravenously, for example via injection, or via alternative routes such as intranasal, skin immunisation e.g. transdermal, or intralymphatic administration.
The allergen used for immunotherapy may be a single allergenic substance or a mixture of such substances, for example a mixture of proteins. It may be a partially or fully purified extract, such as a pollen extract, a recombinant protein, a hypoallergen or peptide derived therefrom. For example, where the immunotherapy is used to treat grass pollen allergy, the allergen administered for immunotherapy may be a grass pollen extract from pollen of one or several genera of grasses, such as Dactylis, Poa, Lolium, Anthoxanthum and Phleum genera. The allergen may also be an allergoid, i.e. a chemically modified form of a naturally occurring allergen which has been chemically modified (for example by aldehydation). The allergen may be administered in conjunction with an adjuvant.
"Response" of a patient to treatment indicates that the patient manifests a reduction in the clinical symptoms. Clinical symptoms may be assessed over the course of treatment, i.e. symptoms before treatment may be compared to symptoms during and after treatment. Alternatively, a reduction in symptoms may be determined by comparison to a baseline level established before treatment. Concerning allergy, this approach is particularly useful where, for example, immunotherapy is carried out in patients not currently experiencing symptoms, as may be the case for seasonal grass pollen allergy sufferers, who may be treated before the pollen season. Symptoms may be assessed by standard methods, such as patient self-assessment or record of the amount of medication required. The degree of a patient's response to treatment may be assessed by measuring the degree of reduction of severity in symptoms, for example as described in Example 4 below.
A "responder" subject as defined herein is a subject who responds to immunotherapy or vaccine administration with an improvement in clinical symptoms, preferably a statistically significant improvement as compared to patients receiving placebo or no treatment. Preferably, a responder subject will demonstrate an improvement in clinical symptoms which is greater than the average or median improvement seen in a random sample of subjects.
A "non-responder" subject is a subject who does not manifest any improvement in clinical symptoms following immunotherapy or vaccine administration, or who demonstrates a non-statistically significant improvement in symptoms, or who demonstrates an improvement in clinical symptoms which is less than the average or median improvement seen in a random sample of subjects.
For example, where the allergy is grass pollen allergy, improvement in clinical symptoms may be detected by a reduction in the frequency or severity of nasal congestion, nasal pruritis, ocular pruritis, tearing, rhinorrhoea, sinusitis, rhinitis, sneezing, wheezing and/or conjunctivitis and/or lessening in the uptake of known relief medication.
"Patient" includes any individual who is a candidate for immunotherapy or vaccine, including individuals not currently undergoing therapy.
Concerning allergy, in most cases, the patient will be an individual who has, or has had at any time in the past, clinical symptoms of allergy and/or sensitization to an allergen and/or an allergen-specific IgE response, or an individual at risk of developing such symptoms. Sensitisation to an allergen may be assessed by detecting IgE directed against allergen(s) from this source in the serum of the patient or by skin testing with a preparation containing the corresponding allergen(s). The allergen may without limitation include any of the allergens disclosed herein, in particular a grass pollen allergen.
"Healthy individual" or "healthy donor" denotes a subject who has not previously had an auto-immune disease, an allergy, an infectious disease or a tumor as defined above. A healthy donor also does not otherwise exhibit symptoms of disease. In other words, such donor, if examined by a medical professional, would be characterized as healthy and/or free of symptoms of disease.
All documents referred to herein are hereby incorporated by reference in their entirety.
Throughout the instant application, the term "comprising" is to be interpreted as encompassing all specifically mentioned features as well optional, additional, unspecified ones. As used herein, the use of the term "comprising" also encompasses the embodiment wherein no features other than the specifically mentioned features are present (i.e. "consisting of") as well as the embodiment wherein features other than the specifically mentioned feature are present provided that the essential characteristics of the composition are not materially affected by their presence (i.e. "consisting essentially of").
The present invention will be further illustrated by the following figures and examples which illustrate the characterization of markers of dendritic cell subsets, and their role in assessing the clinical response of patients undergoing anti-allergy immunotherapy. It should be understood however that these examples are given only by way of illustration of the invention and do not constitute in any way a limitation thereof.
BRIEF DESCRIPTION OF THE FIGURES
FIGS. 1 and 2 show that in vitro treatment of MoDCs with LPS, DC2 cocktail or Dex induces pro-inflammatory and tolerogenic MoDCs.
FIG. 1 shows the cytokine production by co-cultures of CD4.sup.+ T cells with MoDCs analyzed by using multiplex cytokine quantification assay. Data are shown as means.+-.SEMs (n=12). p values.ltoreq.0.05 (*), 0.01 (**) and 0.001 (***) (Wilcoxon test).
FIG. 2 shows the cytokine production by MoDCs analyzed by using multiplex cytokine quantification assay. Data are shown as means.+-.SEMs (n=12). p values.ltoreq.0.05 (*), 0.01 (**) and 0.001 (***) (Wilcoxon test).
FIGS. 3-7 shows the validation of DC2 markers by qPCR and flow cytometry. Data are shown as means.+-.SEMs (n=6). p values.ltoreq.0.05 (*) and 0.01 (**) (Wilcoxon test).
FIG. 3 shows the up-regulated mRNA expression of markers identified by using microarrays by polarized DCs (i.e. Ctrl-DCs, DC1, DC2 and DCreg), analyzed by using qPCR.
FIG. 4 shows the down-regulated mRNA expression of markers identified by using microarrays by polarized DCs (i.e. Ctrl-DCs, DC1, DC2 and DCreg) analyzed by using qPCR.
FIG. 5 shows mRNA expression of markers identified by using label-free MS by polarized DCs (i.e. Ctrl-DCs, DC1, DC2 and DCreg) was analyzed by using qPCR.
FIG. 6 shows mRNA expression of OX40L by polarized DCs (i.e. Ctrl-DCs, DC1, DC2 and DCreg) analyzed by using qPCR.
FIG. 7 shows protein expression of CD141 and OX40L by polarized DCs (i.e. Ctrl-DCs, DC1, DC2 and DCreg) analyzed by flow cytometry. Results are expressed as the mean fluorescence intensity (MFI) obtained with specific antibodies subtracting the signal obtained with the isotype control.
FIG. 8-10 shows the validation of DCreg markers by qPCR and flow cytometry. Data are shown as means.+-.SEMs (n=6). p values.ltoreq.0.05 (*) and 0.01 (**) (Wilcoxon test).
FIG. 8 shows mRNA expression of DCreg markers identified by using microarrays, analyzed by using qPCR.
FIG. 9 shows mRNA expression of DCreg markers identified by using label-free MS, analyzed by using qPCR.
FIG. 10 shows protein expression by polarized MoDCs (i.e. Ctrl-DCs, DC1, DC2 and DCreg) of markers up-regulated in DCreg and analyzed by flow cytometry. Results are expressed as the mean fluorescence intensity (MFI) obtained with specific antibodies subtracting the signal obtained with the isotype control. Data are shown as means.+-.SEMs (n=6).
FIGS. 11-12 show the decrease of CD141, GATA3, OX40L and RIPK4 genes in PBMCs from patients with grass pollen allergy receiving AIT after 4 months of treatment.
FIG. 11 shows mRNA expression of CD141, GATA3, OX40L and RIPK4 in PBMCs (AR, n=21; ANR, n=21; PR, n=7; and PNR, n=31 except for RIPK4, AR, n=19 and ANR, n=20). p values.ltoreq.0.05 (*), 0.01 (**) and 0.001 (***) (Mann-Whitney test). AR: Active (treated) responder patient; ANR: Active (treated) Non-Responder patient; PR: Placebo Responder patient; PNR: Placebo Non Responder patient.
FIG. 12 shows Spearman correlation of mRNA expression of CD141, GATA3, OX40L and RIPK4 with percentages of ARTSS improvement in patients from the active and placebo groups after 4 months of AIT.
FIG. 13 shows the induction of C1QA, Fc.gamma.RIIIA, FTL and SLCO2B1 genes in PBMCs from patients with grass pollen allergy receiving AIT after 4 months of treatment. It shows mRNA expression of C1QA, Fc.gamma.RIIIA, FTL and SLCO2B1 in PBMCs (AR, n=21; ANR, n=21; PR, n=7; and PNR, n=31 except for C1QA, ANR, n=19; and PNR, n=30). p values.ltoreq.0.05 (*), 0.01 (**) and 0.001 (***) (Mann-Whitney test).
FIG. 14 shows the induction of DAB2, Fc.gamma.RIIA and PECAM1 genes in PBMCs from patients with grass pollen allergy receiving AIT after 4 months of treatment. It shows mRNA expression of DAB2, Fc.gamma.RIIA and PECAM1 in PBMCs of patients (AR, n=21; ANR, n=21; PR, n=7; and PNR, n=31). p values of less than 0.05 (*) and 0.01 (**) were considered significant (Mann-Whitney test).
FIG. 15 shows the induction of Fc.gamma.RIIIA in PBMCs from patients with grass pollen allergy receiving AIT after 2 months of treatment. It shows mRNA expression of Fc.gamma.RIIIA in PBMCs (AR, n=21; ANR, n=21; PR, n=7; and PNR, n=29). p value.ltoreq.0.05 (*) (Mann-Whitney test).
FIG. 16 shows Spearman correlation of mRNA expression of C1QA, Fc.gamma.RIIIA, FTL and SLCO2B1 with percentages of ARTSS improvement in patients from the active and placebo groups after 4 months of AIT.
FIG. 17 shows Spearman correlation of mRNA expression of DAB2, Fc.gamma.RIIA and PECAM1 in PBMCs with percentages of ARTSS improvement in patients from the active and placebo groups after 4 months of AIT.
FIG. 18 shows Spearman correlation of mRNA expression of Fc.gamma.RIIIA with percentages of ARTSS improvement in patients from the active and placebo groups after 2 months of AIT.
FIG. 19 shows ROC analyses of DC2 (A) and DCreg (B) markers after 4 months of AIT (n=42). AUC=area under the ROC curve. p values of less than 0.05 (*) and 0.01 (**) were considered significant.
FIG. 20 shows ROC analysis of Fc.gamma.RIIIA after 2 months of AIT (n=42). AUC=area under the ROC curve. p values of less than 0.05 (*) and 0.01 (**) were considered significant.
FIG. 21 shows ROC analyses of combination of Fc.gamma.RIIIA, Fc.gamma.RIIIA and GATA3 markers after 2 months (A) and after 4 months (B) of AIT (n=42). AUC=area under the ROC curve. p values.ltoreq.0.01 (**).
FIG. 22 shows Spearman correlation of expression of 3 combined markers (Fc.gamma.RIIIA, Fc.gamma.RIIIA and GATA3) with percentages of ARTSS improvement in patients from the active and placebo groups after 2 months (A) and 4 months (B) of AIT (active, n=42 and placebo, n=36 and 38 after 2 and 4 months of AIT, respectively). p values.ltoreq.0.01 (**) and 0.001 (***).
FIG. 23 shows ROC analyses of combination of 2 DCreg (C1QA and Fc.gamma.RIIIA) and 3 DC2 (GATA3, CD141 and RIPK4) markers after 2 months (A) and after 4 months (B) of AIT (n=42). AUC=area under the ROC curve. p values.ltoreq.0.01 (**) and 0.001 (***).
FIG. 24 shows Spearman correlation of expression of 5 combined markers (GATA3, CD141, RIPK4, C1QA and Fc.gamma.RIIIA) with percentages of ARTSS improvement in patients from the active and placebo groups after 2 months (A) and 4 months (B) of AIT (active, n=42 and placebo, n=36 and 38 after 2 and 4 months of AIT, respectively). p values.ltoreq.0.01 (*) and 0.001 (**).
FIG. 25 shows ROC analyses of combination of 7 DCreg (C1QA, SLCO2B1, Fc.gamma.RIIIA, Fc.gamma.RIIA, DAB2, PECAM1 and FTL) and 4 DC2 (CD141, GATA3, OX40L and RIPK4) markers after 2 months (A) and after 4 months (B) of AIT (n=42). AUC=area under the ROC curve. p values.ltoreq.0.001 (***).
FIG. 26 shows Spearman correlation of expression of 11 combined markers (C1QA, SLCO2B1, Fc.gamma.RIIIA, Fc.gamma.RIIA, DAB2, PECAM1, FTL, CD141, GATA3, OX40L and RIPK4) with percentages of ARTSS improvement in patients from the active and placebo groups after 2 months (A) and 4 months (B) of AIT (active, n=42 and placebo, n=36 and 38 after 2 and 4 months of AIT, respectively). p values.ltoreq.0.001 (***).
BRIEF DESCRIPTION OF THE TABLES
Table 1: Marker proteins used to identify DCreg.
Table 2: Marker proteins used to identify DCreg and DC2.
Table 3: Marker proteins used to identify DC2.
Table 4: Candidate markers identified by using microarrays.
Candidate markers identified with a multiple comparison test, a FDR p value.ltoreq.0.01 and at least a 4-fold change are listed, corresponding to a total of A, 17 sequences up-regulated in DC2, B, 5 sequences down-regulated in DC2 and C, 9 sequences up-regulated in DCreg. Table 5: Candidate markers identified through the label-free MS approach. Candidate markers identified with two or more peptides are listed corresponding to a total of A, 4 proteins up-regulated in DC2, B, 1 protein down-regulated in DC2 and C, 18 proteins up-regulated in DCreg (multiple comparison test, FDR p value.ltoreq.0.01 and fold change.gtoreq.1.5). Table 6: Overview of candidate markers for DC2 and DCreg identified through transcriptomic and proteomic approaches, and further validated by qPCR. The know function described in the literature for candidate markers for DC2 or DCreg is summarized.
TABLE-US-00004 Brief description of the sequences SEQ ID NO: Description 1-3 Amino acid sequences of DAB2 isoforms 4-5 Amino acid sequences of Fc.gamma.RIIa isoforms 6 Amino acid sequence of FTL 7-12 Amino acid sequences of PECAM1 isoforms 13-16 Amino acid sequences of SLCO2B1 isoforms 17 Amino acid sequence of C3AR1 18-21 Amino acid sequences of CD163 isoforms 22-27 Amino acid sequences of CD300LF isoforms 28-29 Amino acid sequences of CFH isoforms 30-32 Amino acid sequences of CSGALNACT1 isoforms 33 Amino acid sequence of P2RY14 34-35 Amino acid sequences of ZBTB16 isoforms 36-38 Amino acid sequences of Fc.gamma.RIIB isoforms 39 Amino acid sequence of CYP1B1 40-41 Amino acid sequences of DPYD isoforms 42 Amino acid sequence of GCLC 43 Amino acid sequence of IVNS1ABP 44 Amino acid sequence of LRRC25 45-48 Amino acid sequences of NUDT16 isoforms 49-50 Amino acid sequences of PDCD4 isoforms 51 Amino acid sequence of RNASE6 52-53 Amino acid sequences of RNASET2 isoforms 54 Amino acid sequence of Fc.gamma.RIIIa 55 Amino acid sequence of C1QA 56 Amino acid sequence of Fc.epsilon.RIG 57-61 Amino acid sequences of MCTP1 isoforms 62 Amino acid sequence of SIGLEC5 63-64 Amino acid sequences of GATA3 isoforms 65-66 Amino acid sequences of RIPK4 isoforms 67 Amino acid sequence of CALCA 68-96 Amino acid sequences of CREM isoforms 97 Amino acid sequence of FMOD 98 Amino acid sequence of HCRTR1 99 Amino acid sequence of ILDR2 100 Amino acid sequence of ITK 101-102 Amino acid sequences of PADI2 isoforms 103-114 Amino acid sequences of PDE4D isoforms 115-116 Amino acid sequences of PNOC isoforms 117-121 Amino acid sequences of RGS9 isoforms 122-124 Amino acid sequences of ROR1 isoforms 125 Amino acid sequence of SIX2 126-127 Amino acid sequences of SYT4 isoforms 128-129 Amino acid sequences of THBS1 isoforms 130-132 Amino acid sequences of TRIM9 isoforms 133-135 Amino acid sequences of ADAM8 isoforms 136-137 Amino acid sequences of CYTIP isoforms 138-143 Amino acid sequences of NRP2 isoforms 144-145 Amino acid sequences of SEMA7A isoforms 146-148 Amino acid sequences of TBC1D13 isoforms 149-150 Amino acid sequences of OX40L isoforms 151 Amino acid sequence of CD141 152 Amino acid sequence of C1QB 153 Amino acid sequence of C1QC 154-261 Amino acid sequences of peptides of Table 5
EXAMPLES
Example 1: Polarization of Monocytes Derived DCs Towards DC2 and/or DCreg
This example describes a method for the polarization of MoDCs towards DC2 and/or DCreg.
Materials and Methods
DC Generation and In Vitro Stimulation
Human PBMCs from healthy donors obtained at "Etablissement Francais du Sang" (Rungis, France) were separated from fresh buffy coats of by centrifugation over a lymphocytes separation medium (Eurobio AbCys, Courtaboeuf, France). CD14.sup.+ monocytes were purified from the mononuclear fraction by magnetic cell sorting, using microbead-conjugated with anti-CD14 antibodies (MACS; Miltenyi Biotec, Bergisch Gladbach, Germany) and an autoMACS Pro Separator (Miltenyi Biotec), resulting in more than 95% purity of CD14.sup.+ cells. To generate monocyte-derived DCs (MoDCs), CD14.sup.+ monocytes were cultured (6.times.10.sup.5 cells/ml) for 6 days at 37.degree. C. in humidified air containing 5% CO.sub.2, in RPMI 1640 medium with stable glutamine supplemented with 10 .mu.g/ml Gentamicin, 50 .mu.M 2-ME, 1% nonessential amino acids (all obtained from Invitrogen, Carlsbad, Calif.), and 10% fetal calf serum (FCS, PAA Laboratories, Les Mureaux, France), in presence of human rGM-CSF and rIL-4 (Miltenyi Biotec) using 125 and 75 ng/ml concentrations, respectively. One fifth of the amount of medium with cytokines was added after 4 days. On day 6, a pure population of MoDCs was obtained, with 98% CD14.sup.- CD1a.sup.+ CD11c.sup.+ and maximum 0.5% CD3.sup.+ cells detected by flow cytometry using a FACSVerse cytometer (BD Biosciences, Le Pont de Claix, France) and the FlowJo analysis software (Treestar). Up to 1.times.10.sup.6 MoDCs were plated in a 24-well plate in presence of medium for Ctrl-DCs or treated with Dexamethasone (Dex, 1 .mu.g/ml; Sigma-Aldrich, St. Louis, Mo.) for DCreg, with highly purified lipopolysaccharide (LPS) from Escherichia coli (1 .mu.g/ml; Sigma-Aldrich) for DC1 or with a mix composed of Histamine (10 .mu.M; Sigma-Aldrich), IL-25 (100 ng/ml; R&D Systems, Minneapolis, Minn.), IL-33 (100 ng/ml; R&D Systems), LPS (10 ng/ml; Sigma-Aldrich), Prostaglandin E2 (PGE2, 10 .mu.M; Sigma-Aldrich), Thymic Stromal Lymphopoietin (TSLP, 100 ng/ml; R&D Systems) for DC2, for 24 h at 37.degree. C. and 5% CO.sub.2.
MoDCs/T-Cells Co-Cultures
For MoDCs/T-cells co-cultures experiments, treated MoDCs were washed twice with medium and cultured in a 48-well plate with allogeneic CD4.sup.+ naive T cells at a 1:10 MoDCs/T cells ratio for 5 days. Naive CD4.sup.+ T cells were isolated from PBMCs by negative selection using the MACS naive CD4 isolation kit II (Miltenyi Biotec), according to the manufacturer's instructions. Such naive T cells were confirmed to have purity greater than 95% based on CD4 and CD45RA expression evaluated by flow cytometry.
Analysis of Cytokine Production
Cytokine measurement was performed in supernatants collected 24 h after treatment of MoDCs using multiplex cytokine quantification assays. IFN-.gamma., IL-4, IL-5, IL-6, IL-8, IL-9, IL-10, IL-12p70, IL-13, and TNF-.alpha. were measured using the Milliplex MAP human kit Cytokine/Chemokine Magnetic Bead Panel (Millipore, Le Pont de Claix, France) and analyzed using an MagPix Luminex xMAP technology (Millipore).
Results
The inventors defined optimal culture conditions inducing the polarization of immature monocytes derived DCs (MoDCs) toward DC2, capable to promote the differentiation of naive CD4.sup.+ T cells toward Th2 cells (IL-5 and IL-13 secreting cells). After screening several biological and pharmaceutical agents, they selected a mixture of molecules, subsequently termed "DC2 cocktail", capable of polarizing MoDCs toward DC2. Immature MoDCs (Ctrl-DCs), MoDCs treated with LPS (DC1) and MoDCs treated with Dex (DCreg) were used as benchmarkers to compare with DC2.
The polarization of naive allogeneic CD4.sup.+ T cells co-cultured for 5 days with polarized MoDCs (12 independent donors) was analyzed by evaluating cytokine levels in culture supernatants, as a read-out of DCs functional polarization. As expected, CD4.sup.+ T cells co-cultured with DC1 and DCreg produced high levels of IFN-.gamma. and IL-10, respectively, when compared to Ctrl-DCs (FIG. 1). Markedly, DC2 promoted the differentiation of IL-5 and IL-13 secreting CD4.sup.+ T cells while preventing the production of IFN-.gamma. and IL-10, thus confirming the bona fide type 2 profile of these cells.
The inventors further characterized the pattern of cytokine secreted by DC2 in comparison with other MoDC subsets. As previously reported (Zimmer et al. (2011) J. Immunol. 186:3966-3976), DCreg did not induce any pro-inflammatory cytokines when compared to Ctrl-DCs (FIG. 2). In contrast, DC1 expressed high levels of the Th1-inducing cytokine IL-12p70, increased inflammatory cytokines (IL-6, IL-8, IL-10, and TNF-.alpha.) and Th1 cytokines (IFN-.gamma.) in comparison with Ctrl-DCs. DC2 expressed high levels of IL-13 and also secreted some inflammatory cytokines such as IL-6, IL-8, IL-10 and TNF-.alpha.. Noticeably, DC2 significantly increased Th2 (IL-13) while decreasing Th1 (IL-12p70 and IFN-.gamma.) driving cytokines when compared to DC1.
Collectively, those experiments confirm that the "DC2 cocktail" is able to generate bona fide type 2 MoDCs which express effector genes, produce specific inflammatory cytokines (i.e. IL-6, IL-8, IL-10, IL-13 and TNF-.alpha.) and promote the differentiation of Th2 (IL5.sup.+ IL13.sup.+ IFN-.gamma..sup.-) CD4.sup.+ T cells.
Example 2: Identification of Molecular Markers for DC2
This example describes the identification of novel molecular markers for CD2.
Materials and Methods
RNA Preparation and Microarray Analysis of MoDC Types
Polarized MoDCs were harvested 24 h after treatment as described in Example 1, washed in PBS. Total RNA from MoDCs was isolated using standard RNA extraction protocols miRNeasy Mini Kit (Qiagen, Courtaboeuf, France). RNA samples were quality-checked via the Agilent 2100 Bioanalyzer platform (Agilent Technologies, Waldbronn, Germany). For the linear T7-based amplification step, 100 ng of each total RNA sample was used. To produce Cy3-labeled cRNA, the RNA samples were amplified and labelled using the Agilent Low Input Quick Amp Labeling Kit (Agilent Technologies) following the manufacturer's protocol. After quantification of the dye incorporation, labelled cRNA samples were hybridized according to the Agilent 60-mer oligo microarray process in protocol using the Agilent Gene Expression Hybridization Kit (Agilent Technologies). 600 ng of Cy3-labeled fragmented cRNA in hybridization buffer was hybridized overnight (17 h, 65.degree. C.) to Agilent Whole Human Genome Oligo Microarrays 8.times.60K V2 using Agilent's recommended hybridization chamber and oven. The microarrays were washed once with the Agilent Gene Expression Wash Buffer 1 for 1 min at room temperature followed by a second wash with preheated Agilent Gene Expression Wash Buffer 2 (37.degree. C.) for 1 min. Fluorescence signals of the hybridized Agilent Microarrays were detected using Agilent's Microarray Scanner System (Agilent Technologies). Raw microarray image data were extracted and analyzed with the Agilent Feature Extraction Software. The software determines feature intensities (including background subtraction), rejects outliers and calculates statistical confidences. The signal intensities form the single-experiment raw data lists are normalized by dividing the intensity values by their median.
After background correction, quantile normalization was conducted between arrays. Finally, the normalized intensities were log 2-transformed and served as basis for further analysis. A combination of statistical and non-statistical analyses was conducted in order to identify genes differentially expressed between the four groups (Ctlr-DCs, DC1, DC2 and DCreg). In the first step of the statistical analyses, ANOVA tests with repeated measurements design were applied to evaluate differences between all sample groups. To correct for type I error, the Benjamini-Hochberg multiple testing correction method was applied. As rule of thumb, statistically significant changes in expression are usually considered for reporters with adjusted p-values of less than or equal to 0.05. However, since very many significant records remained after p-value correction the threshold was set to adjusted p-values.ltoreq.0.01 in the first round of selection of differentially expressed genes. The second evaluation for expression differences between one particular MoDCs sample group relative to the control group occurred by Tukey's post-hoc test. Significant differences were considered for Tukey p-value.ltoreq.0.01. The statistical tests were complemented by a non-statistical quantification of the median fold change between the two groups. A cut-off of at least 4-fold differential expression was applied.
Label-Free Mass Spectrometry Analysis of MoDC Types
Polarized MoDCs were washed twice with PBS and cell pellets were harvested and lysed in buffer containing 6 M urea, 2 M thiourea, 0.15% ProteaseMax, 5 mM TCEP, 20 mM Trix pH 8.5 and 24 mM spermine (all obtained from Sigma). Proteins were then quantified using a Bradford assay (Biorad) and fractionated over 4-12% gradient precast gel (NuPAGE, Invitrogen) to control quality. 100 .mu.g of proteins were digested with Lys-C (37.degree. C., 3.5 h, enzyme/substrate ratio of 1/50, Sigma) and with trypsin (25.degree. C., overnight, enzyme/substrate ratio of 1/20) and the digestion was stopped with 2.8% FA. After centrifugation (25 000 g, 10 min, 20.degree. C.), supernatants were collected and stored at -80.degree. C.
NanoLC-MS analysis was accomplished using the nanoLC Q-Exactive (Thermo Fisher) coupled to a nano-UPLC RSLC Ultimate 3000 (Dionex). 1000 ng of tryptic peptides were injected (6 .mu.l) and trapped for 10 min with a flow rate of 12 .mu.I/min (2% ACN, 0.15% FA). Separation was then performed using a C18 column (75 .mu.m--50 cm, C.sub.18, 3 .mu.m) with a flow rate of 270 nl/min, two linear gradient segments (4-27% H.sub.2O/ACN for 130 min, 27-50% H.sub.2O/ACN for 38 min) and holding at 95% H.sub.2O/ACN for a further 8 min before returning to 4% H.sub.2O/ACN for 18 min. The data were acquired with a nano-UPLC RSLC Ultimate 3000. Ion intensities recorded in LC-MS data were analyzed using Progenesis LC-MS v3.1 software (nonlinear Dynamics) to provide reliable measurements of peptide abundance across samples. Data were then normalized by the "normalize to all features" method and comparison between the four groups (obtained Ctlr-DCs, DC1, DC2 and DCreg) was performed to choose which peptides were statistically differentially represented (FDR p-value.ltoreq.0.01 and fold change.gtoreq.1.5).
RNA Isolation and Quantitative Real-Time PCR Analysis
Total RNA was extracted from treated MoDCs, PBMCs or subsets of PBMCs using the RNeasy Mini kit and the Qiacube robot (Qiagen), and cDNAs were synthesized using TaqMan reverse transcription reagents (Applied Biosystems, Les Ulis, France) as per the manufacturer's instructions. mRNA expression was evaluated by quantitative PCR on a 7900HT Real-Time PCR system (Applied Biosystems) with predesigned TaqMan gene expression assays and reagents, according to the manufacturer's instructions. Expression of the following genes was assessed in DCs or PBMCs: ADAM8 (Hs00923290_g1), C1QA (Hs00381122_m1), C3AR1 (Hs00269693_s1), CALCA (Hs01100741_m1), CD141 (Hs00264920_s1), CD163 (Hs00174705_m1), CD300LF (Hs00371178_m1), CFH (Hs00962373_m1), CREM (Hs01590456_m1), CSGALNACT1 (Hs00218054_m1), CYP1B1 (Hs02382919_s1), CYTIP (Hs00976346_m1), DAB2 (Hs01120074_m1), DPYD (Hs0055279_m1), FCER1G (Hs00175408_m1), FCGRIIA (Hs01017702_g1), FCGR2B (Hs01634996_s1), FCGRIIIA (Hs02388314_m1), FMOD (Hs00157619_m1), FTL (Hs00830226_gH), GATA3 (Hs00231122_m1), GCLC (Hs00155249_m1), HCRTR1 (Hs00173513_m1), ILDR2 (Hs01025498_m1), ITK (Hs00950634_m1), IVNS1ABP (Hs01573482_m1), LRRC25 (Hs01029557_m1), MCTP1 (Hs00381047_m1), NRP2 (Hs00187290_m1), NUDT16 (Hs001292234_m1), OX40L (Hs00182411_m1), P2RY14 (Hs01848195_s1), PADI2 (Hs00247108_m1), PDCD4 (Hs00377253_m1), PDE4D (Hs01579625_m1), PECAM1 (Hs0016977_m1), PLEKHAS (Hs00219251_m1), PNOC (Hs00918595_m1), RGS9 (Hs00187172_m1), RIPK4 (Hs01062501_m1), RNASE6 (Hs00271608_s1), RNASET2 (Hs00427770_m1), ROR1 (Hs00938677_m1), SEMA7A (Hs01118876_g1), SIX2 (Hs00232731_m1), SLCO2B1 (Hs01030343_m1), SIGLECS (Hs00174659_m1), SYT4 (Hs01086433_m1), TBC1D13 (Hs00217055_m1), THBS1 (Hs00962908_m1), TRIM9 (Hs00364838_m1), and ZBTB16 (Hs00957433_m1). Data were interpreted for each target gene in comparison with endogenous .beta.-actin (Hs99999903 m1) as a control. The relative amount of target genes in each sample was calculated in comparison with the calibrator sample (unstimulated cells or PBMCs before treatment) using the .DELTA..DELTA. cycle threshold (Ct) method. The magnitude of gene induction was calculated using the equation 2-.DELTA..DELTA.Ct=2-(.DELTA.Ct for stimulated cells-.DELTA.Ct for unstimulated cells) or 2-.DELTA..DELTA.Ct=2-(.DELTA.Ct for PBMCs after treatment-.DELTA.Ct for PBMCs before treatment).
Results
Two different approaches were used to identify specific DC2 markers.
Firstly, whole genome mRNA expression analysis was conducted in Ctrl-DCs, DC1, DC2 and DCreg generated from peripheral blood monocytes of 6 independent donors, as described in Example 1, by using microarrays covering 50 684 sequences. When compared to Ctrl-DCs, DC2 up- and down-regulated 1493 and 1882 genes, respectively, with a p value.ltoreq.0.01 and a minimum fold change of 4. Interestingly, when compared to all experimental groups (i.e. Ctrl-DCs, DC1 and DCreg) 98 and 25 sequences were specifically over- and under-expressed, respectively, in DC2 (Table 4, A-B).
The inventors subsequently investigated differences in protein expression between polarized DCs by using label-free MS-based approaches. Differentially regulated peptides were fragmented in MS/MS mode, leading to the identification of proteins further matched to sequence databases (Mascot and Peaks). Up to 556 and 538 proteins were identified with Mascot and Peaks, respectively (with FDR p value.ltoreq.0.01, a fold increase of minimum 1.5 [multiple comparison test] and peptide number.gtoreq.2). Markedly, 24 and 7 of those proteins were significantly up- and down-regulated, respectively, in DC2 when compared to all experimental groups (i.e. Ctrl-DCs, DC1 and DCreg) as summarized in Table 5, A-B.
To validate these findings, the inventors selected 31 candidate markers specific of DC2 identified by microarrays analyses, based on their fold change 17) and/or their relevance in allergy and tolerance, and assessed their expression by qPCR. Interestingly, 17 genes markers were confirmed to be strongly up-regulated in DC2 when compared to Ctrl-DCs. 4 of them (i.e. CALCA, PNOC, ROR1 and SYT4) were only amplified in DC2 conditions while the remaining 13 (i.e. CREM, FMOD, GATA3, HCRTR1, ILDR2, ITK, PADI2, PDE4D, RGS9, RIPK4, SIX2, THBS1 and TRIM9) exhibited a greater than 11-fold increase in DC2 when compared to Ctrl-DCs (FIG. 3 and Table 6A). As well, 5 markers (i.e. C1QA, Fc.epsilon.RIG, Fc.gamma.RIIIA, MCTP1 and SIGLECS) were shown to be under-expressed in DC2 while being over-expressed in DCreg (FIG. 4 and Table 6B). Additionally, as GATA3, ITK and TRIM9 are highly expressed by T cells (bioGPS database), DC2 were sorted after stimulation, to exclude that the up-regulation of these genes was due to potential contaminating CD3.sup.+ T cells. Noteworthy, the up-regulation of GATA3, ITK and TRIM9 was confirmed in ultrapure DC2 (>99.9% CD1a.sup.+ CD11c.sup.+ CD3.sup.-) whereas the expression of two specific markers for T cells (i.e. CD3 and CD2) could not be detected by using qPCR, thus confirming that residual CD3.sup.+ T cells were absent.
Proteins identified by label-free MS were also validated by using qPCR. As shown in FIG. 5, the expression of genes encoding ADAM8, CYTIP, NRP2, SEMA7A and TBC1D13 was significantly increased in DC2 when compared to Ctrl-DCs.
In addition, the expression of OX40L (TNSFS4) and CD141 (thrombomodulin or blood dendritic cell antigen 3) was also assessed in DC2. As shown in FIGS. 6 and 7, up-regulation of OX40L in DC2 was validated by qPCR and flow cytometry analyses whereas up-regulation of the CD141 protein was only confirmed by flow cytometry.
Altogether, experiments conducted using these two different approaches led to the identification of several markers specific of the DC2 subset which are either over-expressed (i.e. ADAM8, CALCA, CD141, CREM, CYTIP, FMOD, GATA3, HCRTR1, ILDR2, ITK, NRP2, PADI2, PDE4D, PNOC, OX40L, RGS9, RIPK4, ROR1, SEMA7A, SIX2, SYT4, TBC1D13, THBS1 and TRIM9), or under-expressed (i.e. C1QA, Fc.epsilon.RIG, Fc.gamma.RIIIA, MCTP1, SIGLECS), respectively, when compared to Ctrl-DCs. The known function of each of those DC2 specific markers is summarized in Tables 2 and 3.
Example 3: Identification of Molecular Markers for DCreg
This example shows the identification of new molecular markers for DCreg.
Materials and Methods
RNA Preparation and Microarray Analysis of MoDC Types
RNA preparation and microarray analysis was performed as described in Example 2.
Label-Free Mass Spectrometry Analysis of MoDC Types
Label-free mass spectrometry analysis was performed as described in Example 2.
RNA Isolation and Quantitative Real-Time PCR Analysis
RNA isolation and quantitative real-time PCR analysis was performed as described in Example 2.
Results
To identify new markers specific to DCreg, the inventors similarly took advantage of microarrays and label-free MS results from the comparison of mRNA and protein expression in Ctrl-DCs, DC1, DC2 and DCreg. When using criteria similar to these described for the identification of specific DC2 markers in Example 2, 115 genes and 20 proteins were specifically up-regulated in tolerogenic DCs when compared to all experimental groups (i.e. Ctrl-DCs, DC1 and DC2) (Table 4C and Table 6C). Furthermore, 5 proteins (i.e. C1QA, C1QB, C1QC, FKBP5 and STAB1) identified in a previous study (Zimmer et al. (2012) J. Allergy Clin. Immunol. 129:1020-1030), were confirmed to be over-expressed in DCreg with this proteomic analysis. Interestingly, these two approaches (i.e. microarray and label-free MS) confirmed the up-regulation of Fc.gamma.RIIA and Fc.gamma.RIIB.
To validate these findings, the inventors selected 10 candidate markers specific of DCreg identified by microarrays analyses based on their fold change 4.5) and/or their relevance in tolerance, and assessed their expression by using qPCR. Among the 10 markers selected, 9 of them (i.e. C3AR1, CD163, CD300LF, CFH, CSGALNACT1, Fc.gamma.RIIA, Fc.gamma.RIIB, P2RY14 and ZBTB16) were confirmed to be significantly up-regulated in DCreg and interestingly, 7 of them (i.e. C3AR1, CD163, CD300LF, CFH, Fc.gamma.RIIA, Fc.gamma.RIIB, and P2RY14) were down-regulated in DC2 when compared to Ctrl-DCs (FIG. 8). Proteins identified by label-free MS were also validated by using qPCR (FIG. 9). Markedly, the expression of genes encoding CYP1B1, DAB2, DPYD, FTL, GCLC, IVNS1ABP, LRRC25, NUDT16, PDCD4, PECAM1, RNASE6, RNASET2 and SLCO2B1 was significantly increased in DCreg and decreased in DC1 and DC2. The inventors next performed validation experiments by using flow cytometry analyses and the up-regulation of CD300LF, Fc.gamma.RIIIA, Fc.gamma.RIIA and PECAM1 expression was also detected at the MoDCs cell surface (FIG. 10). Together, these two distinct analytic methods led to the identification of several new markers for tolerogenic DCs (i.e. C3AR1, CD163, CD300LF, CFH, CSGALNACT1, CYP1B1, DAB2, DPYD, Fc.gamma.RIIA, Fc.gamma.RIIB, FTL, GCLC, IVNS1ABP, LRRC25, NUDT16, P2RY14, PDCD4, PECAM1, RNASE6, RNASET2, SLCO2B1 and ZBTB16).
Example 4: Assessment of Specific Markers for DC2 and DCreg in PBMCs from Patients Undergoing Successful AIT
Materials and Methods
Clinical Samples from the VO56.07A Pollen Chamber Study
Details of the double-blind, placebo-controlled clinical trial V056.07A (ClinicalTrials.gov NCT00619827) have been published in (Horak et al. (2009) J. Allergy Clin. Immunol. 129:471-477). Briefly, after the randomization visit (V3), 89 grass pollen allergic patients received sublingually a daily grass pollen tablet (Stallergenes SA, Antony, France) or a placebo for 4 months. Patients were treated outside of the pollen season and exposed to grass pollens in an allergen challenge chamber (ACC) at baseline (V3), after 1 week (V4), 1 (V5), 2 (V6) and 4 (V7) months. Percentages of improvement of Average Rhinoconjunctivitis Total Symptom Score (ARTSS) were calculated between baseline and each challenge for all individuals patients. The median of percentages of ARTSS improvement in the active group (corresponding to at least a 43.9% decrease of ARTSS at V7, i.e after treatment) was considered as a threshold to define responder and nonresponder patients. As a result, the inventors classified patients in 4 subgroups including active responders (AR), active nonresponders (ANR), placebo responders (PR) and placebo nonresponders (PNR). Analysis of DC markers was perform on samples collected at baseline (V3), after 2 (V6) and 4 (V7) months of immunotherapy from 80 patients (n=42 from active group and n=38 for placebo group). PBMCs were processed as previously described [2] and used for RNA isolation and PCR analysis. All samples were coded and all biological analyses reported herein were conducted in a blind manner by the operators.
RNA Isolation and Quantitative Real-Time PCR Analysis
RNA isolation and quantitative real-time PCR analysis was performed as described in Example 2.
Statistical Analysis
Data are expressed as mean.+-.SEM. Stastistical differences between groups were assessed by using 2-tailed nonparametric tests: Wilcoxon and Mann-Whitney test for paired or independent data, respectively. Treatments were compared with controls and P values of less than 0.05 were considered significant. Correlation analyses were performed by using the nonparametric Spearman test, and receiver operating characteristic (ROC) analyses were assessed by using an empiric model. Statistical and graphic analyses were performed with Prism6 software (GraphPad Software, Inc, La Jolla, Calif.). ROC analyses of combination of markers were performed with mROC program (Kramar 2001).
Results
The inventors investigated a potential shift from effector to tolerogenic DC markers during AIT. To this aim, they assessed the expression of genes encoding the markers of the invention in PBMCs collected from 80 grass pollen allergic patients before (V3), and after 2 (V6) and 4 (V7) months of sublingual AIT. In addition, the expression of C1QA was monitored in these patients as a positive control because its expression was already shown to increase after AIT in a previous study in the active group, among responders (AR) (Zimmer et al. (2012) J. Allergy an. Immunol. 129:1020-1030).
In a first set of experiments, all selected genes encoding for DC2 markers (24 markers) and for DCreg markers (29 markers) were first assessed by using qPCR in a subgroup of 23 patients. Strikingly, the expression of several DC2 markers (i.e. CD141, ITK, GATA3, OX40L, RIPK4 and TBC1D13) decreased in the active group and specifically in the AR group, whereas the expression of several DCreg markers (i.e. C1QA, CD163, CD300LF, DAB2, Fc.gamma.RIIA, Fc.gamma.RIIIA, FTL, LRRC25, PECAM1, SLCO2B1 and RNASE6) rather increased. These candidate markers were then selected to assess the polarization of peripheral blood DCs in the whole cohort (n=80 patients).
The expression of CD141, GATA3 and RIPK4 was significantly down-regulated in ARs in contrast to ANRs and the placebo group after 4 months of treatment (FIG. 11). Interestingly, when plotted against percentages of ARTSS improvement for each patient, CD141, GATA3, and OX40L but not RIPK4 mRNA expression levels were significantly correlated with clinical benefit in patients from the active group but not from the placebo group after 4 months of treatment (FIG. 12). Finally, no alteration of those markers could be seen after 2 months of treatment.
In contrast to the down-regulation of DC2 markers, the expression of DCreg markers (i.e. C1QA, DAB2, Fc.gamma.RIIA, Fc.gamma.RIIIA, FTL, PECAM1 and SLCO2B1) was significantly up-regulated in ARs in contrast to ANRs and the placebo group, in whom a down-regulation was observed after 4 months of treatment (Figured 13 and 14). Importantly, as early as 2 months of treatment, Fc.gamma.RIIIA genes were up-regulated in ARs in contrast to ANRs (FIG. 15). Most interestingly, when plotted against percentages of ARTSS improvement of each patient, C1QA, Fc.gamma.RIIIA, FTL and SLCO2B1 mRNA expression levels were significantly correlated with clinical benefit in patient from the active group but not in the placebo group after 4 months of treatment (FIGS. 16 and 17). An increased expression level of Fc.gamma.RIIIA also correlated with clinical efficacy in the active group but not in the placebo group after 2 months of therapy (FIG. 18). These results confirm and extend the previous observation of the inventors of an induction of DCreg markers in blood of ARs.
The pertinence of these potential biomarkers of efficacy was further assessed by using a ROC analysis. All DC2 and DCreg markers except OX40L (i.e. C1QA, CD141, DAB2, Fc.gamma.RIIA, Fc.gamma.RIIIA, FTL, GATA3, PECAM1, RIPK4 and SLCO2B1) are useful to discriminate clinical responders from nonresponders after 4 months of treatment (FIG. 19). After 2 months of treatment, Fc.gamma.RIIIA is particularly useful to discriminate clinical responders from nonresponders (FIG. 20).
As expression of DC2 and DCreg markers were correlated, the inventors next performed ROC analysis with mROC program in order to identify the best combination of markers to discriminate clinical responders from nonresponders after 2 and 4 months of treatment (FIG. 23). By combining 5 markers (i.e. GATA3, CD141, RIPK4, C1QA and Fc.gamma.RIIIA), they reached an area under the ROC curve (AUC) of 0.785, a threshold of 0.6182 for a sensitivity of 90.48% and a sensibility of 61.9% after 2 months and an AUC of 0.798, a threshold of 0.429 for a sensitivity of 90.48% and a sensibility of 61.9% after 4 months of treatment. Interestingly, when plotted against percentages of ARTSS improvement of each patients, expression of 5 combined markers were correlated with clinical benefit in patients from the active group, with Spearman correlations of 0.38 (p=0.014) and 0.5 (p=0.0007) after 2 and 4 months of AIT, respectively, whereas no such correlation was observed in placebo-treated patients (FIG. 24). For the combination of 3 markers obtained with the mROC program (FIG. 21), when plotted against percentages of ARTSS improvement of each patients, expression of 3 combined markers (Fc.gamma.RIIA, Fc.gamma.RIIIA and GATA3) were correlated with clinical benefit in patients from the active group, with Spearman correlations of 0.4 (p=0.009) and 0.5 (p=0.0008) respectively after 2 and 4 months of AIT, whereas no such correlation was observed in placebo-treated patients (FIG. 22). For the combination of 11 DC2 and DCreg markers obtained with the mROC program (FIG. 25), when plotted against percentages of ARTSS improvement of each patients, expression of 11 combined markers were correlated with clinical benefit in patients from the active group, with Spearman correlations of 0.5 (p=0.0007) after 2 and 4 months of AIT, whereas no such correlation was observed in placebo-treated patients (FIG. 26).
TABLE-US-00005 TABLE 4 Quantification data Fold Change Identification data Adj. (DC vs Ctrl- Average median cent. log2 intensites A GeneName Description SeqRef ProbeID Refseq GeneID p value DCs) Ctrl-DCs DC1 DC2 DCreg Sequences CALCA Homo sapiens calcitonin-related polypeptide 886284 A_23_P301846 NM_001033952 796 1.0E-07 183.1 -0.992 -0.- 208 5.902 -0.324 up-regulated alpha 2325230 A_33_P3318771 NM_001033952 796 9.7E-07 54.7 -0- .126 0.064 5.334 -0.688 in DC2 CREM Homo sapiens cAMP responsive element 878925 A_23_P201979 NM_183013 1390 2.5E-07 8.9 -0.939 0.011 2.348- -0.101 modulator FMOD Homo sapiens fibromodulin 1159270 A_23_P114883 NM_002023 2331 6.5E-06 9.7 -0.037 0.138- 3.088 -0.101 GATA3 Homo sapiens GATA binding protein 3 2333191 A_33_P3360341 NM_001002295 2625 1.5E-07 46.1 -0.451 0.670 4.603- -0.342 HCRTR1 Homo sapiens hypocretin (orexin) receptor 1 2330257 A_33_P3360249 NM_001525 3061 6.8E-08 23.3 0.190 0.746 4.972 -0.- 045 886081 A_23_P74178 NM_001525 3061 8.0E-08 5.0 -0.183 -0.277 2.550 -0.56- 5 ILDR2 Homo sapiens immunoglobulin-like domain 2322752 A_33_P3328317 NM_199351 387597 1.4E-07 12.3 -0.686 0.273 3- .094 -0.101 containing receptor 2 ITK Homo sapiens IL2-inducible T-cell kinase 1141457 A_23_P354151 NM_005546 3702 2.0E-08 30.3 -1.179 1.110 3.57- 5 -0.906 PADI2 Homo sapiens peptidyl arginine deiminase, 1154169 A_23_P201747 NM_007365 11240 2.9E-05 9.0 0.437 -1.817 - 3.786 -1.283 type II 1149648 A_24_P187970 NM_007365 11240 8.3E-06 7.2 0.406 -0.897 3.- 768 -0.794 PDE4D Homo sapiens phosphodiesterase 4D, 2334429 A_33_P3389658 NM_001165899 5144 1.7E-05 8.0 -0.094 -0.863 2.8- 61 0.055 cAMP-specific 2320887 A_33_P3389653 NM_001165899 5144 1.7E-06 5.4 -0.040- -1.330 2.931 -0.501 PNOC Homo sapiens prepronociceptin 882803 A_23_P253321 NM_006228 5368 1.9E-06 44.2 -0.327 0- .348 5.489 -0.355 RGS9 Homo sapiens regulator of G-protein signaling 9 884073 A_23_P66881 NM_003835 8787 5.3E-09 47.7 -0.269 0.747 5.394 -0.93- 8 2544564 A_21_P0000057 NM_001165933 ND 5.5E-08 22.7 -0.126 0.322 4.393 0- .345 RIPK4 Homo sapiens receptor-interacting 887044 A_24_P125871 NM_020639 54101 2.4E-07 17.0 -0.- 005 0.392 4.383 -0.026 serine-threonine kinase 4 ROR1 Homo sapiens receptor tyrosine kinase-like 879927 A_23_P12363 NM_005012 4919 7.9E-07 17.0 -0.599 0.356 3- .639 -0.003 orphan receptor 1 SIX2 Homo sapiens SIX homeobox 2 1164459 A_23_P28120 NM_016932 10736 7.0E-07 11.4 0.057 0.331 3.564 0.02- 7 SYT4 Homo sapiens synaptotagmin IV 1161235 A_23_P208030 NM_020783 6860 2.5E-08 63.5 -0.007 0.725 5.939 0.- 287 THBS1 Homo sapiens thrombospondin 1 1155717 A_24_P142118 NM_003246 7057 7.7E-05 7.4 -0.558 0.226 2.546 0.47- 6 TRIM9 Homo sapiens tripartite motif containing 9 2336091 A_33_P3383836 NM_015163 114088 1.3E-05 11.6 0.027 0.272 3.319 0- .082 Quantification data Fold Change Identification data (DC2 vs Ctrl- Average median cent. log2 intensites B GeneName Description SeqRef ProbeID Refseq GeneID Adj. p value DCs) Ctrl-DCs DC1 DC2 DCreg Sequences C1QB Homo sapiens complement component 1, 880218 A_23_P137366 NM_000491 713 7.1E-09 -11.0 0.382 -0.672 -2.989 1.- 773 down-regulated q subcomponent, B chain in DC2 FCER1G Homo sapiens Fc fragment of IgE, high affinity I, 878836 A_23_P160849 NM_004106 2207 1.1E-07 -11.9 0.581 -0.942 -2.766 0- .383 receptor for; gamma polypeptide FCGR3A Homo sapiens Fc fragment of IgG, low affinity 1146263 A_23_P200728 NM_000569 2214 4.9E-07 -48.0 0.723 -0.568 -- 4.898 1.886 IIIa, receptor (CD16a) MCTP1 Homo sapiens multiple C2 domains, 1142060 A_23_P133293 NM_024717 79772 2.6E-07 -10.4 0.236 -0.401 - -2.989 1.033 transmembrane 1 SIGLEC5 Homo sapiens sialic acid binding Ig-like lectin 5 1157834 A_24_P48539 NM_003830 8778 1.5E-04 -5.7 0.491 0.162 -2.029 0.51- 8 Quantification data Fold Change Identification data (DCreg vs Average median cent. log2 intensites C GeneName Description SeqRef ProbeID Refseq GeneID Adj. p value Ctrl-DCs.) Ctrl-DCs DC1 DC2 DCreg Sequences C3AR1 Homo sapiens complement component 3a 1159311 A_23_P2431 NM_004054 719 5.0E-08 4.26 0.903 -0.357 -0.731 3.17- 1 up-regulated receptor 1 in DCreg CD163 Homo sapiens CD163 molecule 879889 A_23_P33723 NM_004244 9332 3.3E-07 38.94 0.709 0.703 -1.0- 00 5.792 CD300LF Homo sapiens CD300 molecule-like family 879105 A_23_P55020 NM_139018 146722 9.6E-07 9.96 -0.473 -1.749 0.3- 06 2.348 member f CFH Homo sapiens complement factor H 879599 A_23_P114740 NM_000186 3075 1.1E-09 11.34 1.036 -0.660 -0.941 4.- 404 2332614 A_33_P3367692 NM_001014975 3075 3.3E-06 8.29 0.187 -0.603 -1.01- 2 3.252 2324094 A_33_P3318288 NM_001014975 3075 2.0E-09 7.85 0.584 -0.478 -0.38- 8 3.549 CSGALNACT1 Homo sapiens chondroitin sulfate 2319487 A_33_P3366540 NM_001130518 55790 8.4E-07 33.15 0.486 -0.8- 44 0.082 5.311 N-acetylgalactosaminyltransferase 1 882076 A_23_P134835 NM_018371 55790 5.0E-07 28.11 0.284 -0.091 -0.145 4- .651 FCGR2A Homo sapiens Fc fragment of IgG, low affinity 882891 A_23_P85716 NM_021642 2212 1.5E-07 6.91 1.534 -1.531 -2.5- 64 4.575 IIa, receptor (CD32) 2332515 A_33_P3403576 NM_001136219 2212 3.1E-07 4.66 1.237 -1.951 - -3.754 3.848 FCGR2B Homo sapiens Fc fragment of IgG, low affinity 1149952 A_23_P34644 NM_004001 2213 6.9E-08 5.97 1.843 -2.755 -3.- 435 4.828 IIb, receptor (CD32) P2RY14 Homo sapiens purinergic receptor P2Y, 879468 A_24_P165864 NM_014879 9934 1.3E-08 4.93 0.986 -1.835 -2.116 - 3.373 G-protein coupled, 14 ZBTB16 Homo sapiens zinc finger and BTB domain 882589 A_23_P104804 NM_006006 7704 8.1E-09 71.42 -0.148 -0.071 0.6- 98 5.928 containing 16
TABLE-US-00006 TABLE 5 Identification data No. of Mascot pep- Re- pro- tide tention Mascot Accession Protein tein ident- Peptide m/z Measured .DELTA. m/z time peptide no. name score ified number measured mass z (ppm) (min) score Sequences Proteins up-regulated in DC2 A ADAM8_HUMAN Disintegrin 239 4 40620 779.9357 3115.7138 4 -1.41 107.9 76.6 - QVIKPTAFAPPVPPVKPGA and GAANPGPAEGAVGPK metallo- 42728 992.1332 2973.3777 3 -2.40 147.0 77.1 QICIVDVCHALTTE proteinase DGTAYEPVPEGTR domain- 45025 786.7696 2357.2871 3 -1.06 136.2 49.8 RPPPAPPVTVSSPPFPVPV- YTR containing 60598 576.3161 1725.9264 3 -0.58 62.1 35.8 TAAVFRPRPGDSLPSR protein 8 CYTIP_HUMAN Cytohesin- 231 3 20264 421.7580 841.5014 2 -0.93 84.0 38.2 QVV- DLIR interacting 31402 714.8965 1427.7785 2 -1.49 132.0 80.0 IQMLADTVATLPR protein 46190 1121.5353 3361.5842 3 -1.28 155.0 112.6 IQEDSPAHCAGLQAGD VLANINGVSTEGFTYK 34452 960.7867 2879.3384 3 0.44 144.3 123.3 YYLVHQEPLENFQCNVPLGMESG R 36353 544.7830 1087.5515 2 0.52 91.4 58.0 SGEIAIDDIR 46029 861.4069 2581.1987 3 -6.57 88.1 59.5 IANEQISASSTYSDGRWTPQQSR 48576 376.9007 1127.6803 3 -1.11 91.1 63.6 LISPPVHLPR 50339 849.8991 1697.7836 2 -1.17 65.8 111.9 IANEQISASSTYSDGR 52576 384.4701 1533.8513 4 -0.95 68.4 40.1 IRPQTWHSGIALR SEM7A_HUMAN Semaphorin 394 14 33058 819.4081 2455.2026 3 -1.11 118.4 76.1 - IRGESELYTSDTVMQNPQFIK 7A SEMA7A 36596 690.8437 2759.3455 4 -1.27 153.9 108.9 VVEPGEQEHSFAFNIM- EIQPFRR 55401 920.7887 2759.3442 3 -1.75 153.9 33.1 VVEPGEQEHSFAFNIMEIQPFRR 39122 404.7208 807.4271 2 -1.00 93.9 31.3 WNTFLK 40165 622.0668 2484.2381 4 -2.00 58.1 55.7 SVLQSINPAEPHKECPNKPDK 52897 497.8549 2484.2382 5 -1.96 58.1 42.7 SVLQSINPAEPHKECPNKPDK 58352 829.0870 2484.2392 3 -1.56 58.1 59.0 SVLQSINPAEPHKECPNKPDK 473861 622.0665 2484.2369 4 -2.51 60.2 73.5 SVLQSINPAEPHKECPNKPDK 1847 382.2284 762.4422 2 -0.82 107.4 36.6 IFAVWK 42173 688.8444 1375.6742 2 -1.64 90.7 48.8 AAAIQTMSLDAER 44705 715.7487 3573.7073 5 -1.86 111.4 54.8 GVHGQDRVDFGQTEPHT VLFHEPGSSSVWVGGR 58580 894.4348 3573.7101 4 -1.07 111.4 102.3 GVHGQDRVDFGQTEPHT VLFHEPGSSSVWVGGR 50587 713.3365 1424.6585 2 -1.49 147.5 47.9 DCENYITLLER 53852 702.6727 2104.9962 3 -1.81 100.1 112.1 MQASHGETFHVLYLTTDR TBC_HUMAN TBC1 domain 1844 6 25032 622.3736 1243.732718 2 -0.71 152.0 57.4 ILLNYLPLER family 29111 550.3117 1098.6088 2 -1.71 91.3 40.8 EMIIQPGIAK member 13 31762 488.7764 975.5382 2 -0.76 116.4 47.7 ASWTSILAK TBCD1 34023 441.9101 1322.7084 3 -0.86 98.2 62.0 QRELYAQFLR 47981 434.2705 866.5264 2 -0.26 115.6 46.0 ILFIYAK 49432 693.8124 1385.6102 2 -2.24 70.5 81.4 SLDDSQCGITYK Proteins down-regulared in CD2 B C1QC_HUMAN Complement 463 7 7211 542.7927 1083.5708 2 -0.47 103.3 64.7 FQS- VFTVTR C1q 10303 486.9314 1457.7725 3 -0.95 56.2 85.3 QTHQPPAPNSLIR sub- 41140 729.8931 1457.7717 2 -1.52 56.2 41.2 QTHQPPAPNSLIR component 18280 629.3483 1256.6820 2 -1.36 69.0 70.1 TNQVNSGGVLLR subunit C 23817 964.4533 1926.8921 2 -2.02 100.4 102.6 FNAVLTNPQGDYDTST- GK 64298 822.0504 2463.1294 3 -3.37 105.1 99.1 FNAVLTNPQGDYDTSTGKFTCK 66075 822.0510 2463.1313 3 -2.61 105.3 84.2 FNAVLTNPQGDYDTSTGKFTCK Proteins up-regulared in DCreg C C1QA_HUMAN Complement 359 5 23302 419.8944 1256.6613 3 -1.00 69.1 47.4 GQP- RPAFSAIR C1q 23608 614.3273 1226.6401 2 -0.58 84.2 43.9 VGYPGPSGPLGAR sub- 32984 819.7395 2456.1966 3 -1.89 165.5 126.4 KGHIYQGSEADSVFSGFLIFP- SA component 59227 478.5100 1910.0111 4 -0.60 67.9 62.4 GSPGNIKDQPRPAFSAIR- subunit A 69800 637.6774 1910.0104 3 -0.96 67.9 79.0 GSPGNIKDQPRPAFSAIR- C1QB_HUMAN Complement 381 5 16830 538.7700 1075.5255 2 -1.10 93.0 46.5 GNL- CVNLMR C1q 16880 554.2749 1659.8028 3 -1.03 118.8 91.5 VPGLYYFTYHASSR sub- 47661 830.9081 1659.8017 2 -1.72 118.7 90.4 VPGLYYFTYHASSR component 25983 826.3894 2476.1463 3 -3.65 116.1 94.9 DQTIRFDHVITNMNNNY- EPR subunit B 38532 621.9520 1862.8341 3 -1.55 84.3 57.3 FDHVITNMNNNYEPR C1QC_HUMAN Complement 463 7 7211 542.7927 1083.5708 2 -0.47 103.3 64.7 FQS- VFTVTR C1q 10303 486.9314 1457.7725 3 -0.95 56.2 85.3 QTHQPPAPNSLIR sub- 41140 729.8931 1457.7717 2 -1.52 56.2 41.2 QTHQPPAPNSLIR component 18280 629.3483 1256.6820 2 -1.36 69.0 70.1 TNQVNSGGVLLR subunit C 23817 964.4533 1926.8921 2 -2.02 100.4 102.6 FNAVLTNPQGDYDTST- GK 64298 822.0504 2463.1294 3 -3.37 105.1 99.1 FNAVLTNPQGDYDTSTGKFTCK 66075 822.0510 2463.1313 3 -2.61 105.3 84.2 FNAVLTNPQGDYDTSTGKFTCK CP1B1_HUMAN Cytochrome 225 3 51421 549.2843 1096.5540 2 -1.22 124.4 44.3 N- FSNFILDK p450 1B1 60809 1223.6314 2445.2482 2 -1.33 180.1 131.6 TVGAGSLVDVMPWLQY- FPNPVR 68218 816.0895 2445.2466 3 -2.00 180.1 49.2 TVGAGSLVDVMPWLQYFPNPVR DAP2_HUMAN Disabled 255 6 6529 619.8475 1237.6804 2 7.85 130.1 19.2 DLFQVT- YNVK homolog 2 27331 619.8420 1237.6695 2 -1.01 162.8 49.9 DLFQVTYNVK 26826 672.6523 2014.9349 3 -0.52 122.6 67.1 AFGYVCGGEGQHQFFAIK 33990 699.3838 1396.7530 2 -2.32 102.6 61.4 TGQQAEPLVVDLK 34785 592.3176 1182.6207 2 -3.24 111.2 22.7 LIGIDDVPDAR 48106 708.8256 1415.6366 2 0.62 141.1 53.7 STDNAFENPFFK DPYD_HUMAN Dihydro- 355 7 41225 490.7739 979.5332 2 -0.63 92.0 50.5 SFITSL- ANK pyrimidine 48858 711.8782 1421.7419 2 -1.20 124.7 57.8 SLSVNEMTLSTLK dehyro- 50757 630.3615 1888.0628 3 -0.81 82.9 35.0 RTTYGGVSGTAIRPIALR genase 53711 934.8158 2801.4255 3 -0.74 167.4 55.7 DAIFQGLTQDQFGYTSKDF- LPLVA [NADP(+) K 58226 752.3550 2254.0430 3 -3.18 104.0 66.6 SIEELQDWDGQSPATVSHQK 65601 519.5747 1555.7023 3 -2.24 75.5 41.8 AGMCACHSPLPSIR 71371 451.7703 901.5261 2 -1.30 132.4 47.4 DFLPLVAK FCG2A_HUMAN Low affinity 221 2 46172 896.4039 2686.1899 3 -1.11 99.7 149.1 RQLEETNNDYETAD- GGYMTLNPR immuno- 55013 971.1279 2910.3618 3 -2.30 127.9 71.6 SPESDSIQWFHNGNLIPTH- TQPSY globulin R gamma Fc region receptor II-a FCG2B_HUMAN Low affinity 470 5 33831 1014.4865 3040.4376 3 -2.35 158.3 158.8 VGAENTITYSLL- MHPDALEEPDD immuno- QNRI globulin 33860 904.8170 2711.4292 3 -0.87 164.7 114.9 AVLKLEPQWINVLQEDS- VTLTCR gamma Fc 34178 761.6872 2282.0397 3 1.11 72.2 58.2 EMGETLPEKPANPTNPDEAD- K region 39411 802.3802 3205.4916 4 -1.55 113.3 73.6 GTHSPESDSIQWFH receptor NGNLIPTHTQPSRY II-b 41999 642.1060 3205.7937 5 -0.90 113.4 64.2 GTHSPESDSIQWFH NGNLIPTHTQPSRY FRIL_HUMAN Ferritin 768 9 2304 574.0000 1718.9780 3 -0.62 105.9 118.1 KLNQ- ALLDLHALGSAR light chain 6034 430.7515 1718.9771 4 -1.18 105.9 77.3 KLNQALLDLHALGSAR- FTL 23593 860.4946 1718.9746 2 -2.61 105.9 114.6 KLNQALLDLHALGSAR 3378 782.3621 2344.0644 3 -1.61 155.2 104.2 TDPHLCDFLETHFLDEEVK 4359 587.0329 2344.0667 4 -0.66 155.2 98.7 TDPHLCDFLETHFLDEEVK 27245 1173.0397 2344.0648 2 -1.44 155.2 85.2 TDPHLCDFLETHFLDEEVK 3846 417.7393 833.4640 2 -0.84 86.5 39.7 ALFQDIK 21979 536.6067 1606.7984 3 -0.43 154.4 41.0 LGGPEAGLGEYLFER 25842 531.3019 1590.8837 3 -0.30 121.7 89.5 LNQALLDLHALGSAR GSHI_HUMAN Glutamate- 317 5 34579 514.8283 1027.6420 2 -0.94 137.8 40.0 VV- INVPIFK cysteine 42132 726.0763 2900.2762 4 -0.76 116.6 74.5 IHLDDANESDHFENIQST- NWQTM ligase R catalytic 46362 424.5952 1270.7638 3 -0.86 114.4 44.4 VVINVPIFKDK subunit 48893 1028.4602 2054.9056 2 -0.50 138.8 95.8 NTPSPFIRTFTEDDEASR- GCLC 52159 419.7410 1674.9349 4 -0.52 111.4 62.4 HGILQFLHIYHAVK LRC28_HUMAN Leucine- 151 3 42808 478.3000 954.5854 2 -0.86 124.6 53.8 LEVL- NVLR rich 46857 477.2659 1428.7760 3 -0.37 136.5 59.3 ELPVTFFAHLQK repeat- 73402 715.3946 1428.7747 2 -1.23 136.5 37.9 ELPVTFFAHLQK containing protein 25 LRRC25 NS1BP_HUMAN Influenza 98 2 50593 541.2784 1620.8135 3 5.76 65.6 39.6 LIAAG- GYNREECLR virus 73462 363.4312 1449.6955 4 -0.94 55.8 58.2 LQVCGHEMLAHR NS1A- binding protein IVNS1ABP NUD16_HUMAN U8 snoRNA- 605 8 27279 968.9919 1935.9693 2 0.08 172.1 100.0 DGVGGLPTFLENSFI- GSAR decapping 28810 604.3433 1206.6721 2 -0.03 124.1 65.8 DHGLEVLGLVR enzyme 35457 403.2310 1206.6711 3 -0.82 124.0 80.2 DHGLEVLGLVR NUDT16 34907 771.4260 2311.2562 3 -3.16 177.8 83.9 EQLLEALQDLGLLQSGSISG- LK 71198 1156.6372 2311.2598 2 -1.60 177.8 95.6 EQLLEALQDLGLLQSGSISGLK 37429 431.2625 860.5104 2 -1.88 86.1 38.0 VPLYTLR 48520 543.3013 1626.8821 3 -1.31 144.6 81.5 RLELGEALALGSGWR 59975 581.3303 1740.9691 3 -2.50 153.4 59.6 RLTLEELLAVEAGATR PDCD4_HUMAN Programmed 226 3 31716 829.4224 2485.2453 3 -1.43 156.5 100.3 - IYNEIPDINLDVPHSYSVLER cell death 44656 423.2614 844.5082 2 -1.19 145.2 53.3 MILDLLK protein 4 49664 894.9252 1787.8359 2 -2.30 137.0 72.2 AVGDGILCNTYIDSYK PECA1_HUMAN Platelet 1118 15 18358 664.3299 1326.6452 2 -0.33 118.5 59.1 S- TESYFIPEVR endothelial 23955 693.1004 3460.4655 5 -0.84 85.7 28.2 NSNDPAVFKDNPTED cell VEYQCVADNCHSHAK adhesion 27562 446.2497 1780.9695 4 -1.56 109.5 75.2 APIHFTIEKLELNEK molecule 28122 744.3384 1486.6623 2 0.89 82.1 59.9 SDSGTYICTAGIDK PECAM1 31674 752.0483 2253.1231 3 -0.62 115.7 60.0 QMPVEMSRPAVPLLNSNNEK- 32518 511.2644 1530.7714 3 0.16 58.8 60.0 IISGIHMQTSESTK 73926 766.3917 1530.7688 2 -1.57 58.8 86.2 IISGIHMQTSESTK 33103 833.8435 1665.6725 2 -0.22 92.0 46.3 EQEGEYYCTAFNR 42511 762.8932 1523.7719 2 0.01 118.2 69.6 SELVTVTESFSTPK 43635 837.7794 2510.3164 3 -1.55 144.0 101.9 CTIQVTHLAQEFPEIIIQKDK 43885 620.9814 1859.9225 3 -0.47 163.6 80.3 SNTVQIVVCEMLSQPR 45957 756.7387 2267.1942 3 -1.86 156.7 66.7 CTIQVTHLAQEFPEIIIQK 53138 352.5339 1054.5799 3 -1.16 72.4 70.1 APIHTIEK 54846 547.9748 2187.8700 4 0.07 47.2 64.0 MSDPNMEANSHYGHNDDVR 73094 730.2970 2187.8693 3 -0.25 47.1 82.4 MSDPNMEANSHYGHNDDVR RNAS6_HUMAN Ribo- 145 3 22242 566.0311 2260.0953 4 -0.33 112.5 39.3 AHWFEI- QHIQPSPLQCNR nuclease 26585 754.3718 2260.0935 3 -1.11 112.5 78.8 AHWFEIQHIQPSPLQCNR- K6 RNASE6 30445 661.3328 1320.6510 2 -2.04 110.2 27.0 FFIVACDPPQK RNT2_HUMAN Ribo- 112 2 36103 619.2258 1854.9856 3 -1.25 127.2 60.9 LGIKPSI- NYYQVADFK nuclease 63130 757.6804 2270.0195 3 -0.89 144.5 51.5 DCRDPPDYWTIHGLWPDK- T2 RNASET2 SOXB1_HUMAN Solute 95 2 32214 798.9317 1595.8488 2 -1.89 98.1 64.3 SSSPAVE- QQLLVSGPGK carrier 57116 731.9033 1461.7920 2 -1.33 70.3 30.4 RIGPAGEVPQVPDK organic amion transporter family member 2B1 SLCO2B1 Identi- Quantification data fication data Use in Highest Lowest FDR Average normalized abundance Accession SEQ ID quanti- Max mean mean p value Crtl-
no. NO: taion fold condition condition <0.01 DCs DC1 DC2 DCreg Proteins up-regulated in DC2 A ADAM8_HUMAN 154 True 209.6 DC2 DCreg 1.1E-02 49287 504170 1288393 6146 155 True 25.2 DC2 DCreg 4.1E-07 68926 378007 957710 37987 156 True 89.4 DC2 DCreg 1.1E-03 18609 348135 791433 8851 157 True 21716.3 DC2 DCreg 7.3E-04 2074 20383 133531 6 CYTIP_HUMAN 158 True 2.5 DC2 DCreg 3.4E-05 168567 310569 415902 164477 159 True 1.4 DC2 DCreg 3.7E-04 50252 384611 557797 45026 160 True 21.1 DC2 Ctrl-DCs 3.4E-02 50692 511229 1071806 55618 161 True 18.7 DC2 DCreg 2.5E-04 151995 644771 1644140 87804 162 True 13.7 DC2 DCreg 2.5E-06 28560 134921 295704 21643 163 True 4.4 DC2 DCreg 2.1E-01 57651 146593 220459 49801 164 True Infinity DC2 DCreg 2.1E-04 594 66350 261166 0 165 True 75.4 DC2 DCreg 1.1E-01 5414 111265 355791 4717 166 True 7097.8 DC2 DCreg 2.1E-03 363 22052 94544 13 SEM7A_HUMAN 167 True 60.5 DC2 DCreg 3.2E-02 27816 437916 1324295 21893 168 True 39.0 DC2 DCreg 3.4E-05 32341 336465 1221461 31352 168 True 41.5 DC2 DCreg 1.1E-01 15906 61277 357794 8621 169 True Infinity DC2 Ctrl-DCs 1.0E-03 0 62718 223729 0 170 True 35.9 DC2 DCreg 2.3E-07 32857 239108 1001751 27892 170 True 17.8 DC2 DCreg 1.5E-03 18251 57079 317373 17849 170 True 321.1 DC2 Ctrl-DCs 7.3E-06 1389 30315 445894 1801 170 True 91.6 DC1 DC2 3.5E-01 1189 90482 988 2451 171 True 2473.0 DC2 DCreg 2.2E-04 116 39511 201874 82 172 True Infinity DC2 DCreg 4.2E-03 2244 52580 320675 0 173 True 80.4 DC2 DCreg 1.6E-02 22432 242583 888854 11060 173 True Infinity DC2 Ctrl-DCs 8.2E-11 0 61257 360296 0 174 True 134924.5 DC2 DCreg 1.1E-03 2546 35259 265951 2 175 True 38.9 DC2 Ctrl-DCs 1.0E-01 8094 46240 314775 8641 TBC_HUMAN 176 True 8.1 DC2 DCreg 3.8E-04 115793 579639 774879 96091 177 True 6.9 DC2 DCreg 1.4E-04 69330 320850 436457 63124 178 True 7.6 DC2 DCreg 3.8E-05 49119 198307 316907 41745 179 True 11.9 DC2 DCreg 2.0E-04 24157 149819 246663 20796 180 False 58.3 DC2 Ctrl-DCs 2.1E-02 1648 28487 96114 3050 181 True 26.0 DC2 Ctrl-DCs 2.2E-01 10346 120129 269005 17175 Proteins down-regulated in DC2 B C1QC_HUMAN 182 True 16.5 DCreg DC2 3.7E-06 1845331 505826 233719 3862088 183 True 23.0 DCreg DC2 1.8E-05 1339675 356410 142830 3290331 183 True 494.5 DCreg DC2 1.2E-02 174862 25371 1377 681081 184 True 15.9 DCreg DC2 1.1E-03 499581 292150 112707 1790150 185 True 177.4 DCreg DC2 2.2E-02 1283024 43313 21341 3786198 186 True Infinity DCreg DC1 5.5E-03 18351 0 0 95834 186 True Infinity DCreg DC2 2.0E-03 5246 1770 0 70445 Proteins up-regulated in DCreg C C1QA_HUMAN 187 False 14.2 DCreg DC1 5.4E-05 171783 54710 91384 774305 188 True 7.1 DCreg DC2 2.2E-05 529942 480161 320306 2265965 189 True 7.5 DCreg DC2 2.2E-05 329553 176475 173793 1297106 190 True Infinity DCreg DC1 1.6E-03 3645 0 0 150002 190 True Infinity DCreg DC2 1.9E-05 121 20 0 98083 C1QB_HUMAN 191 True 34.6 DCreg DC2 3.6E-05 351204 62158 52822 1825126 192 True 53.7 DCreg DC2 3.9E-06 749388 145785 68423 3676086 192 True 58.6 DCreg DC2 6.1E-05 7306 6183 5949 348671 193 True 34.2 DCreg DC2 6.8E-05 310207 97738 61260 2095064 194 True Infinity DCreg DC2 1.5E-03 32761 4281 0 736461 C1QC_HUMAN 195 True 16.5 DCreg DC2 3.7E-06 1845331 505826 233719 3862088 196 True 23.0 DCreg DC2 1.8E-05 1339675 356410 142830 3290331 196 True 494.5 DCreg DC2 1.2E-02 174862 25371 1377 681081 197 True 15.9 DCreg DC2 1.1E-03 499581 592150 112707 1790150 198 True 177.4 DCreg DC2 2.2E-02 1283024 43313 21341 3786198 199 True Infinity DCreg DC1 5.5E-03 18351 0 0 95834 199 True Infinity DCreg DC2 2.0E-03 5246 1770 0 70445 CP1B1_HUMAN 200 True 33.3 DCreg DC2 6.6E-02 95830 13418 3833 127730 201 True 5.4 DCreg DC2 3.7E-02 211635 82257 69022 369989 201 True 11.1 DCreg DC1 7.8E-03 51883 11702 14346 129442 DAP2_HUMAN 202 False 1.5 DCreg DC2 1.2E-03 2244487 1806006 1767824 2620959- 202 True 6.3 DCreg DC2 2.1E-06 279674 109475 65483 412357 203 True 5.6 DCreg DC2 1.4E-06 595052 217775 157193 886757 204 True 7.5 DCreg DC2 1.4E-7 386035 57525 80652 603722 205 True 3.3 DCreg DC1 2.0E-03 205587 95619 100344 312129 206 True 5.2 DCreg DC1 1.7E-05 315416 95461 102039 496963 DPYD_HUMAN 207 True 6.0 DCreg DC1 9.9E-04 156481 43946 63634 264525 208 True 27.1 DCreg DC1 2.9E-02 122573 8123 14551 219908 209 True 78.0 DCreg DC2 7.7E-04 112282 4776 3153 245914 210 True 3.9 DCreg DC1 8.0E-04 118751 54385 55210 212884 211 True 30.4 DCreg DC2 3.7E-02 51554 17811 5161 157127 212 True 6.5 DCreg DC2 1.5E-01 30743 18729 15095 97969 213 False Infinity DCreg DC1 4.0E-02 3564 0 0 16994 FCG2A_HUMAN 214 True 65.1 DCreg DC1 5.0E-02 101527 10788 32758 702145 215 True 23.6 DCreg DC2 1.6E-01 80325 55341 23363 551485 FCG2B_HUMAN 216 True 72.9 DCreg DC1 2.0E-02 165769 16900 46272 1232793 217 True 8.8 DCreg DC2 1.5E-05 279671 170986 129348 1140116 218 True 2.9 DCreg DC1 1.4E-03 333840 228200 280976 654719 219 True 41.0 DCreg DC1 5.4E-02 190828 34112 37862 1397548 219 True 21.5 DCreg DC1 2.1E-03 129897 39504 41686 848246 FRIL_HUMAN 220 True 2.7 DCreg DC1 3.1E-04 9028936 5831391 6026760 15498177- 220 True 2.4 DCreg DC1 1.1E-03 2441139 1712601 1776340 4171118 220 True 2.2 DCreg DC2 3.0E-02 824927 781491 761910 1658217 221 True 2.8 DCreg DC2 2.4E-04 9767972 6088824 5891114 16328683 221 True 2.7 DCreg DC1 3.9E-04 4955168 3136020 3208186 8559298 221 True 9.4 DCreg DC1 1.3E-01 794526 276221 452365 2590366 222 True 3.4 DCreg DC1 5.9E-02 1910875 1448455 1571448 4991774 223 True 4.0 DCreg DC1 5.6E-04 398613 217925 306463 876779 224 True 2.5 DCreg DC2 1.2E-02 253922 213556 193756 484566 GSHI_HUMAN 225 True 2.7 DCreg NS 5.9E-03 75405 93773 120372 204049 226 True 2.2 DCreg DC1 1.8E-02 270246 185293 234151 407509 227 True 2.8 DCreg DC1 8.0E-03 55698 35849 39616 100225 228 True 2.0 DCreg DC2 5.2E-02 238018 213746 200026 403322 229 True 2.5 DCreg NS 2.3E-01 76407 115575 108738 190188 LRC28_HUMAN 230 True 4.2 DCreg DC1 2.1E-01 54580 29767 67129 127450 231 True 3.0 DCreg DC1 2.4E-02 68448 44454 51956 134250 231 True 41.2 DCreg DC2 2.2E-01 2066 3363 675 27809 NS1BP_HUMAN 232 True 5.2 DCreg DC2 4.1E-03 40518 58826 36228 188014 233 True 21.1 DCreg DC2 1.9E-02 7303 3619 2002 42211 NUD16_HUMAN 234 True 1.9 DCreg DC1 1.8E-06 1197452 832148 910778 1543110 235 True 2.0 DCreg DC1 1.1E-03 181481 177210 199122 359046 235 True 3.8 DCreg DC1 1.0E-04 89517 45409 71981 171397 236 True 2.8 DCreg DC1 1.2E-03 261534 163733 218868 456761 236 True 12.1 DCreg DC2 7.4E-02 38757 18798 7808 94260 237 True 4.6 DCreg DC2 3.1E-02 90704 85730 83012 384830 238 True 4.2 DCreg DC1 5.8E-03 63810 30067 33916 126576 239 True 2.8 DCreg DC2 4.5E-01 73241 40399 38050 108135 PDCD4_HUMAN 24 True 8.4 DCreg DC1 2.5E-03 677129 141522 254665 1185836 241 True 34.1 DCreg DC1 8.4E-03 90727 4531 5409 154655 242 True 27.5 DCreg DC2 1.4E-02 167905 19048 17041 469423 PECA1_HUMAN 243 True 2.4 DCreg DC1 3.7E-03 617024 436629 467035 1050892 244 True 3.1 DCreg DC1 4.5E-02 617536 306513 424452 948411 245 True 2.4 DCreg DC2 30.E-02 271527 232166 226470 532548 246 True 1.4 DCreg DC1 3.2E-01 943851 722386 770221 1033031 247 True 2.9 DCreg DC2 7.6E-03 442466 313856 266796 776220 248 True 2.7 DCreg DC1 3.2E-03 266941 193853 256411 514688 248 True 5.0 DCreg DC1 1.3E-01 18870 13533 14694 67126 249 True 2.3 DCreg DC2 1.1E-02 253573 317836 237231 546558 250 True 3.7 DCreg DC2 1.3E-02 169334 142039 103929 386866 251 True 4.1 DCreg DC2 2.4E-03 146076 97769 94557 391981 252 True 3.0 DCreg DC2 3.3E-02 128466 104356 94443 285019 253 True 3.2 DCreg DC2 3.9E-01 106337 103892 89592 285806 254 True 2.5 DCreg DC1 4.1E-02 33869 29317 33705 73646 255 True 3.8 DCreg DC2 6.9E-01 112574 67626 62913 238863 255 True 4.4 DCreg DC2 2.1E-01 46657 25707 21214 92675 RNAS6_HUMAN 256 True 5.6 DCreg DC2 1.4E-05 811673 272135 323560 1295597 256 True 8.7 DCreg DC2 3.7E-06 1122177 337854 205808 1792978 257 True 13.8 DCreg DC2 7.4E-02 214063 29704 25224 348226 RNT2_HUMAN 258 True 38.0 DCreg DC2 4.3E-04 274832 24804 15644 593717 259 True 26.7 DCreg DC1 4.2E-01 40568 4495 5990 120188 SOXB1_HUMAN 260 True 13.9 DCreg DC1 6.0E-05 539560 87068 145358 1206365 261 True 294.3 DCreg DC2 4.3E-04 31785 1021 657 193305
TABLE-US-00007 TABLE 6 Up-regulaled DC2 markers A Fold increase Type of Identification Swissprot in mRNA (DC2 Go annotation proteins method accession no. Protein name vs Ctrl-DCs) function (nextprot) Up-regulated Microarray CALCA Calcitonin gene-related peptide 1 ND Hormone and validated CREM cAMP-responsive element modulator 24.7 Activator, developmental proteins in DC2 protein, repressor, transcription regulation FMOD Fibromodulin 34.9 Extracellular matrix organization GATA3 Trans-acting T-cell-specific transcription 64.8 Transcription regulation factor GATA-3 HCRTR1 Orexin receptor type 1 11.0 G-protein coupled receptor, Orexin receptor activity ILDR2 Immunoglobulin-like domain-containing 13.7 Cell differentiation, response receptor 2 to glucose ITK Tyrosine-protein kinase ITK/TSK 97.0 Adaptive immunity, tyrosine protein kinase PADI2 Protein-arginine deiminase type-2 38.8 Hydrolase PDE4D cAMP-specific 3'.5'-cyclic phosphodiesterase 4D 26.7 Hydrolase PNOC Prepronociceptin ND Neuropeptide, neurotransmitter RGS9 Regulator of G-protein signaling 9 258.9 Signal transduction inhibitor RIPK4 Receptor-interacting serine/threonine-protein 383.3 Kinase kinase 4 ROR1 Tyrosine-protein kinase transmembrane receptor ND Kinase, transferase SIX2 Homeobox protein SIX2 201.5 Developmental protein SYT4 Synaptotagmin-1 ND Calcium ion binding THBS1 Thrombospondin-1 615 Cell adhesion TRIM9 E3 ubiquitin-protein ligase TRIM9 23.4 Ligase Label-free ADAM8 Disintegrin and metalloproteinase 3.3 Hydrolase, metalloprotease, domain-containing protein 8 protease MS CYTIP Cytohesin-interacting protein 5.8 Protein binding, regulation of cell adhesion NRP2 Neuropilin-2 7.3 Developmental protein, differentiation SEMA7A Semaphorin-7A 15.1 Developmental protein, differentiation, inflammatory response TBC1D13 TBC1 domain family member 13 8.6 GTPase activation CD141 Thrombomodulin ND Blood coagulation, homeostasis, receptor OX40L Tumor necrosis factor ligand superfamily 98.2 Cytokine member 4 Down-regulatcd DC2 and up-regulated DCreg Markers Fold decrease Fold increase B in mRNA in mRNA Type of Identification Swissprot (Ctrl-DCs (DCreg vs Go annotation proteins method accession no. Protein name vs DC2) Ctrl-DCs) function (nextprot) Down-regulated Label-free MS IVNS1ABP Influenza virus NS1A-binding protein 5.8 4.8 Host-virus interaction DC2 and Microarray and Fc.gamma.RIIA Low affinity immunoglobulin gamma Fc 357 24.2 Immunity, IgG binding up-regulated label-free MS region receptor II-a (IgG Fc receptor II-a) DCreg Microarray C3AR1 C3a anaphylatoxin chemotactic receptor 31 25.2 Chemotaxis Markers CD163 Scavenger receptor cysteine-rich type 1 212.5 26.4 Inflammatory response protein M130 Fc.epsilon.RIG High affinity immunoglobulin epsilon 20.2 2.6 Immunity, IgE receptor subunit gamma receptor activity Fc.gamma.RIIIA Low affinity immunoglobulin gamma Fc 357 4.6 Immunity, IgG binding region receptor III-A MCTP1 Multiple C2 and transmembrane domain- 26.7 2.3 Calcium ion binding containing protein 1 SIGLEC5 Sialic acid-binding Ig-like lectin 5 (Siglec-5) 13 3.1 Cell adhesion C1QA Complement C1q subcomponent subunit A 46.4 8.8 Compement subunit, innate immunity, signal transduction Up-regulated DCreg markers Fold increase C in mRNA Type of Identification Swissprot (DCreg vs Go annotation proteins method accession no. Protein name Ctrl-DCs) function (nextprot) Up-regulated Microarray CD300LF CMRF35-like molecule 1 30.4 Immunity and validated CFH Complement factor H 14.9 Complement alternate proteins in pathway, innate immunity DCreg CSGALNAC Chondroitin sulfate N-acetylgalactosaminyltransferase 1 86.3 Transferase T1 P2RY14 P2Y purinoceptor 14 9.3 G-protein coupled receptor ZBTB16 Zinc finger and BTB domain-containing protein 16 592.8 Transcription regulation Microarray and Fc.gamma.RIIB Low affinity immunoglobulin gamma 12.7 Immunity, IgG binding label-free MS Fc region receptor II-b (IgG Fc receptor II-b) Label-free MS CYP1B1 Cytochrome P450 1B1 4.3 Oxidoreductase DAB2 Disabled homolog 2 4.2 Apoptosis, differentiation, endocytosis DPYD Dihydropyrimidine dehydrogenase [NADP(+)] 8.5 Oxidoreductase FTL Ferritin light chain 3.6 Ion storage GCLC Glutamate--cysteine ligase catalytic subunit 6 Glutathione biosynthesis, ligase LRRC25 Leucine-rich repeat-containing protein 25 12 Immunity? NUDT16 U8 snoRNA-decapping enzyme 8.2 Hydrolase PDCD4 Programmed cell death protein 4 3.8 Apoptose PECAM1 Platelet endothelial cell adhesion molecule 5.9 Cell adhesion, phagocytosis RNASE6 Ribonuclease K6 3.6 Endonuclease RNASET2 Ribonuclease T2 5.1 Endonuclease, hydrolase SLCO2B1 Solute carrier organic anion transporter 8.2 Ion transport family member 2B1
SEQUENCE LISTINGS
0 SQTB SEQUENCE LISTING The patent contains a lengthy "Sequence Listing" section. A copy of the "Sequence Listing" is available in electronic form from the USPTO web site (https://seqdata.uspto.gov/?pageRequest=docDetail&DocID=US11015221B2- ). An electronic copy of the "Sequence Listing" will also be available from the USPTO upon request and payment of the fee set forth in 37 CFR 1.19(b)(3).
* * * * *
References
D00001
D00002
D00003
D00004
D00005
D00006
D00007
D00008
D00009
D00010
D00011
D00012
D00013
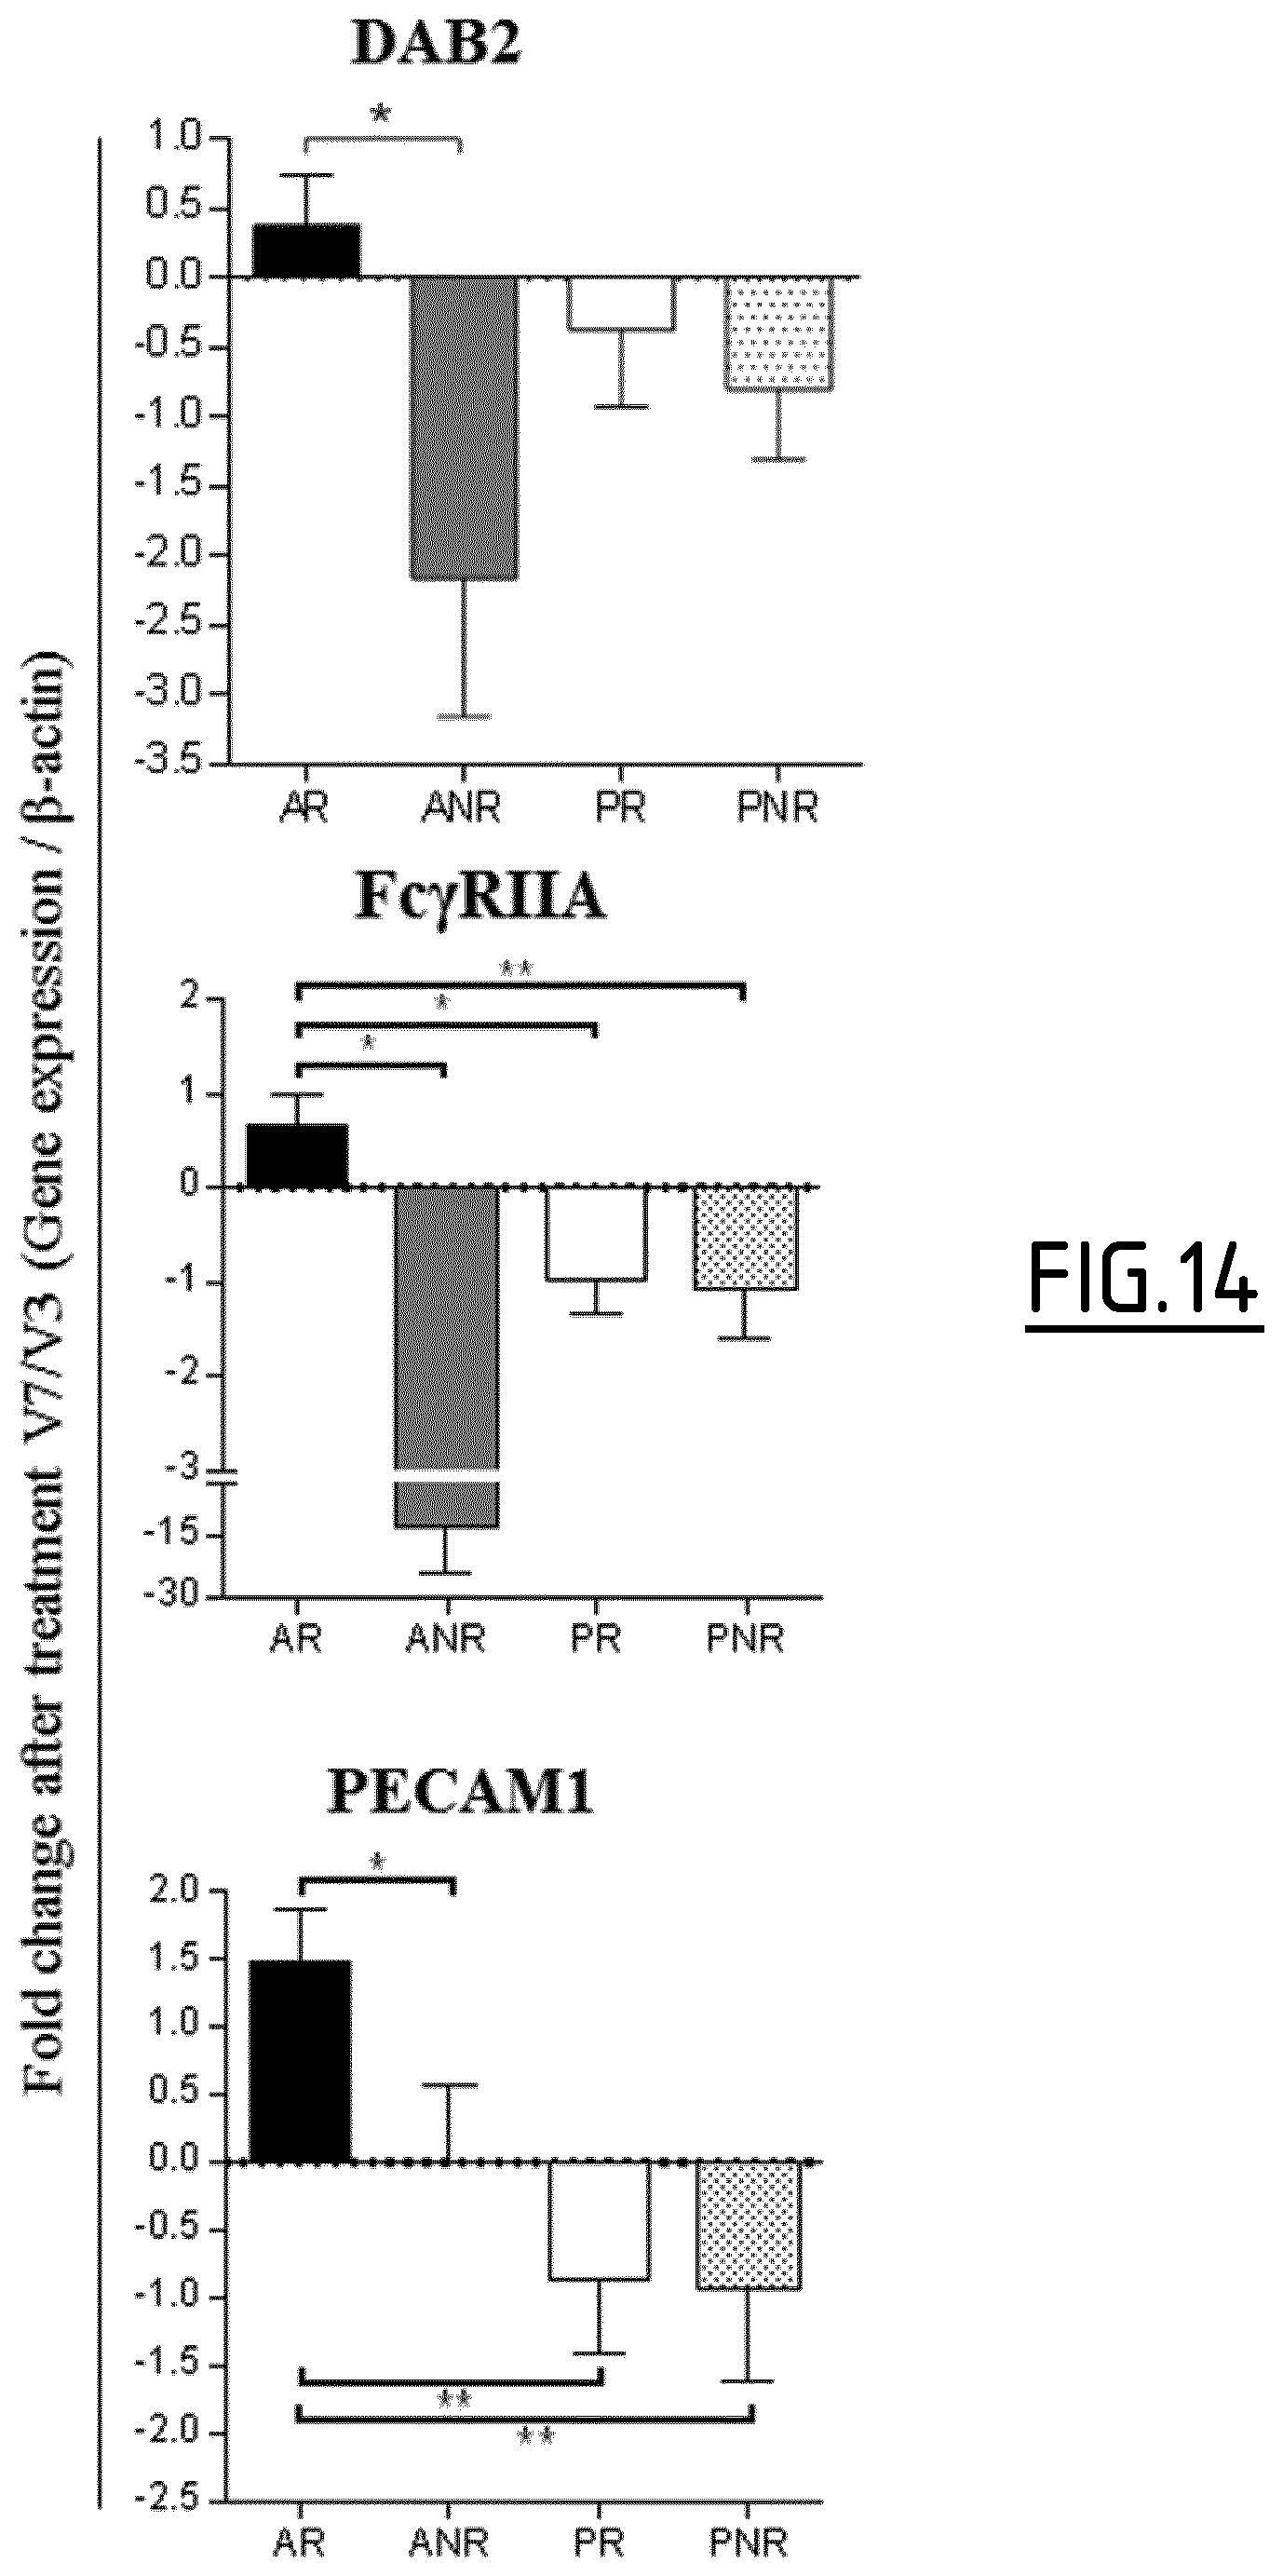
D00014
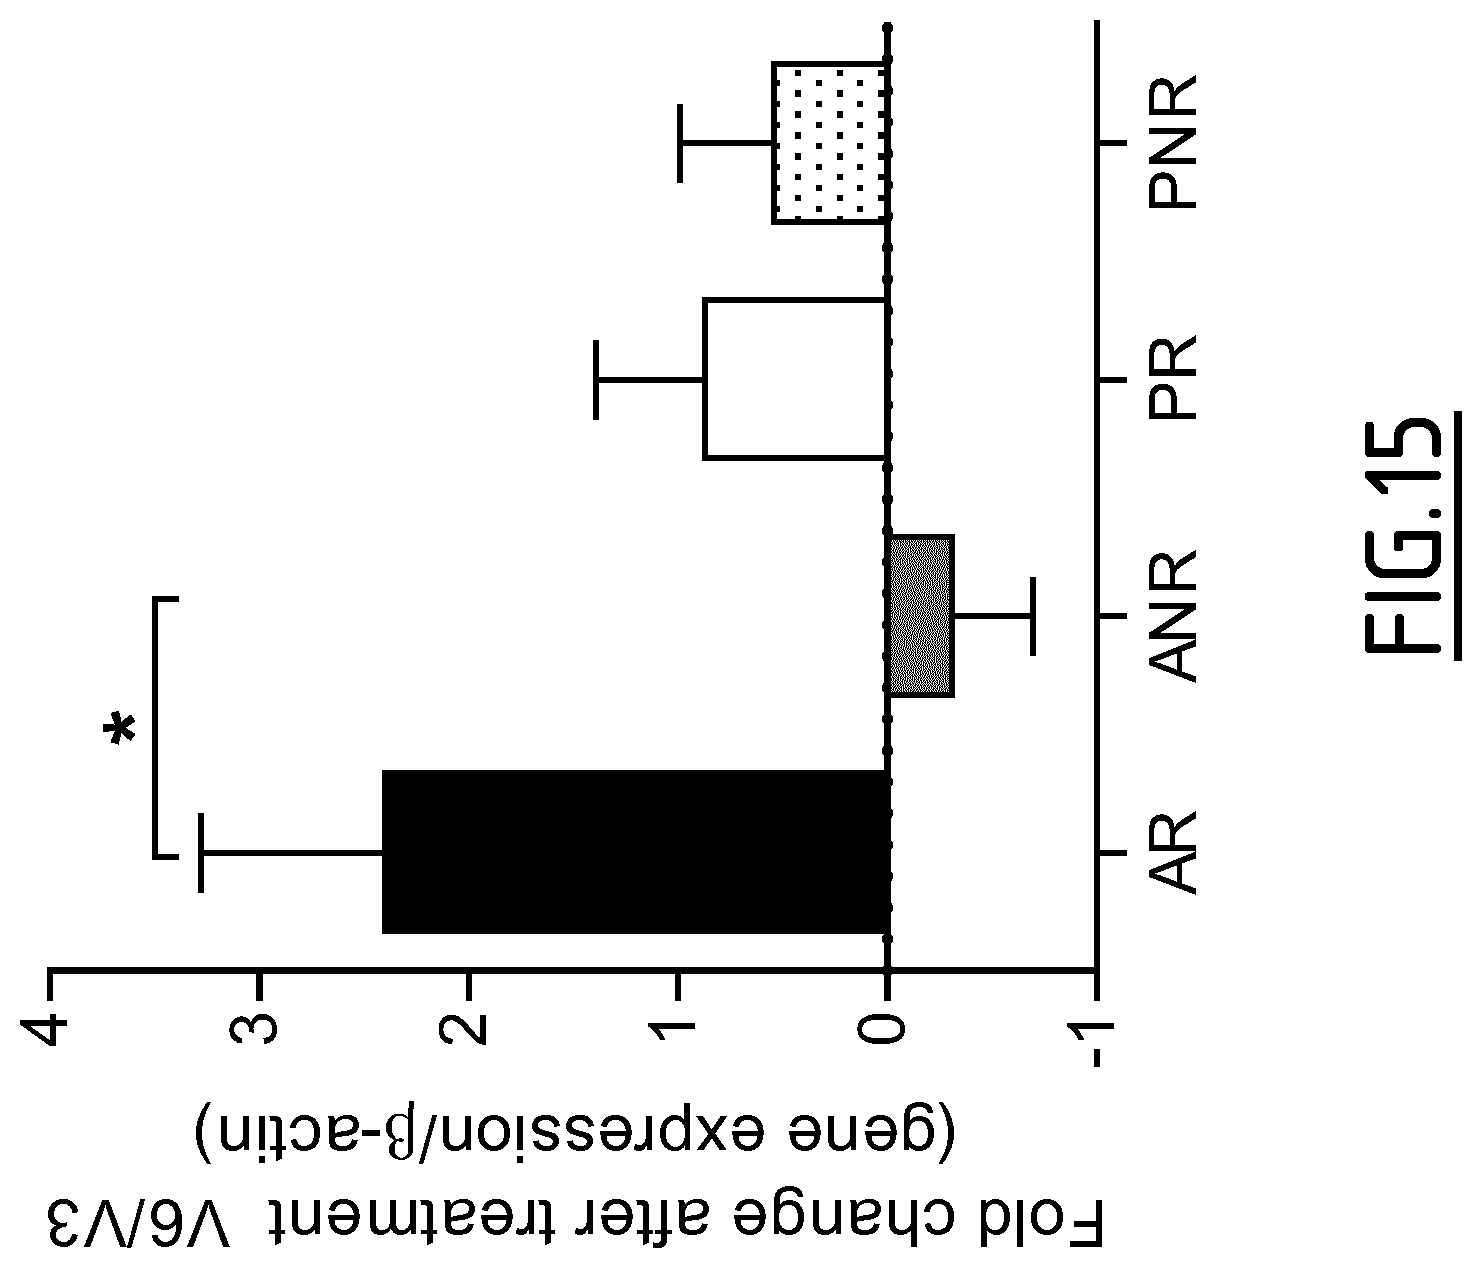
D00015
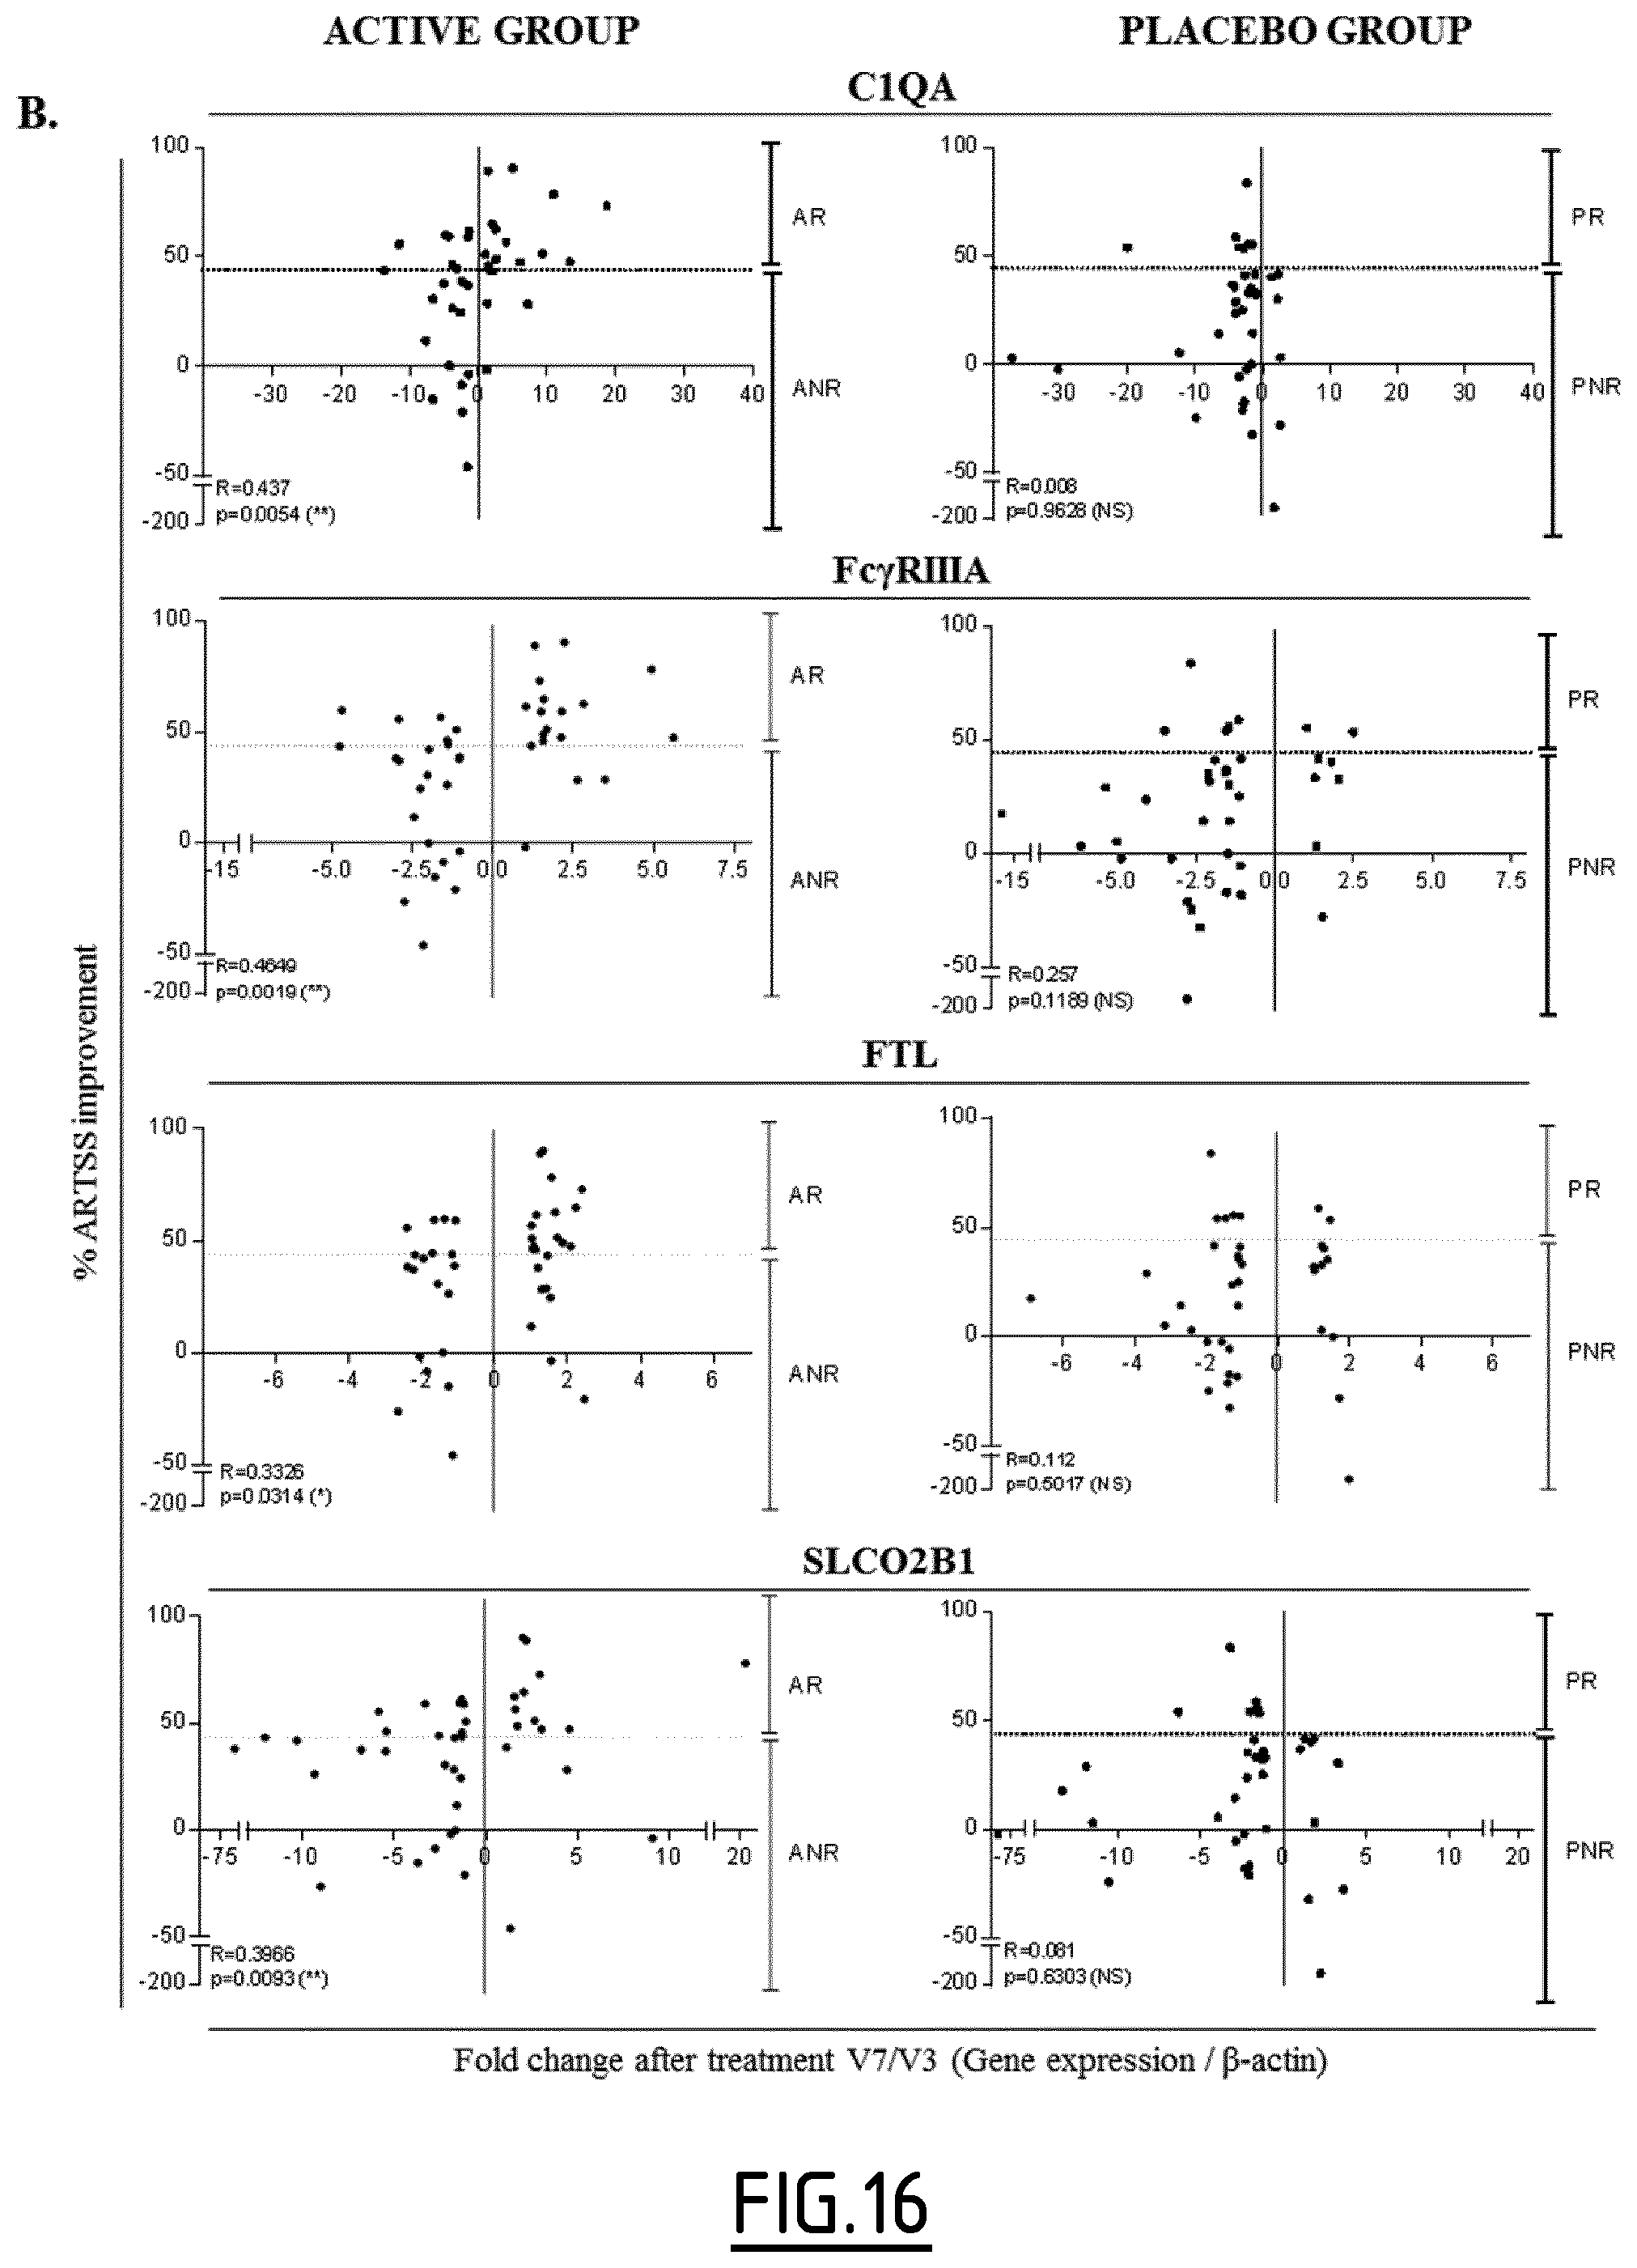
D00016

D00017
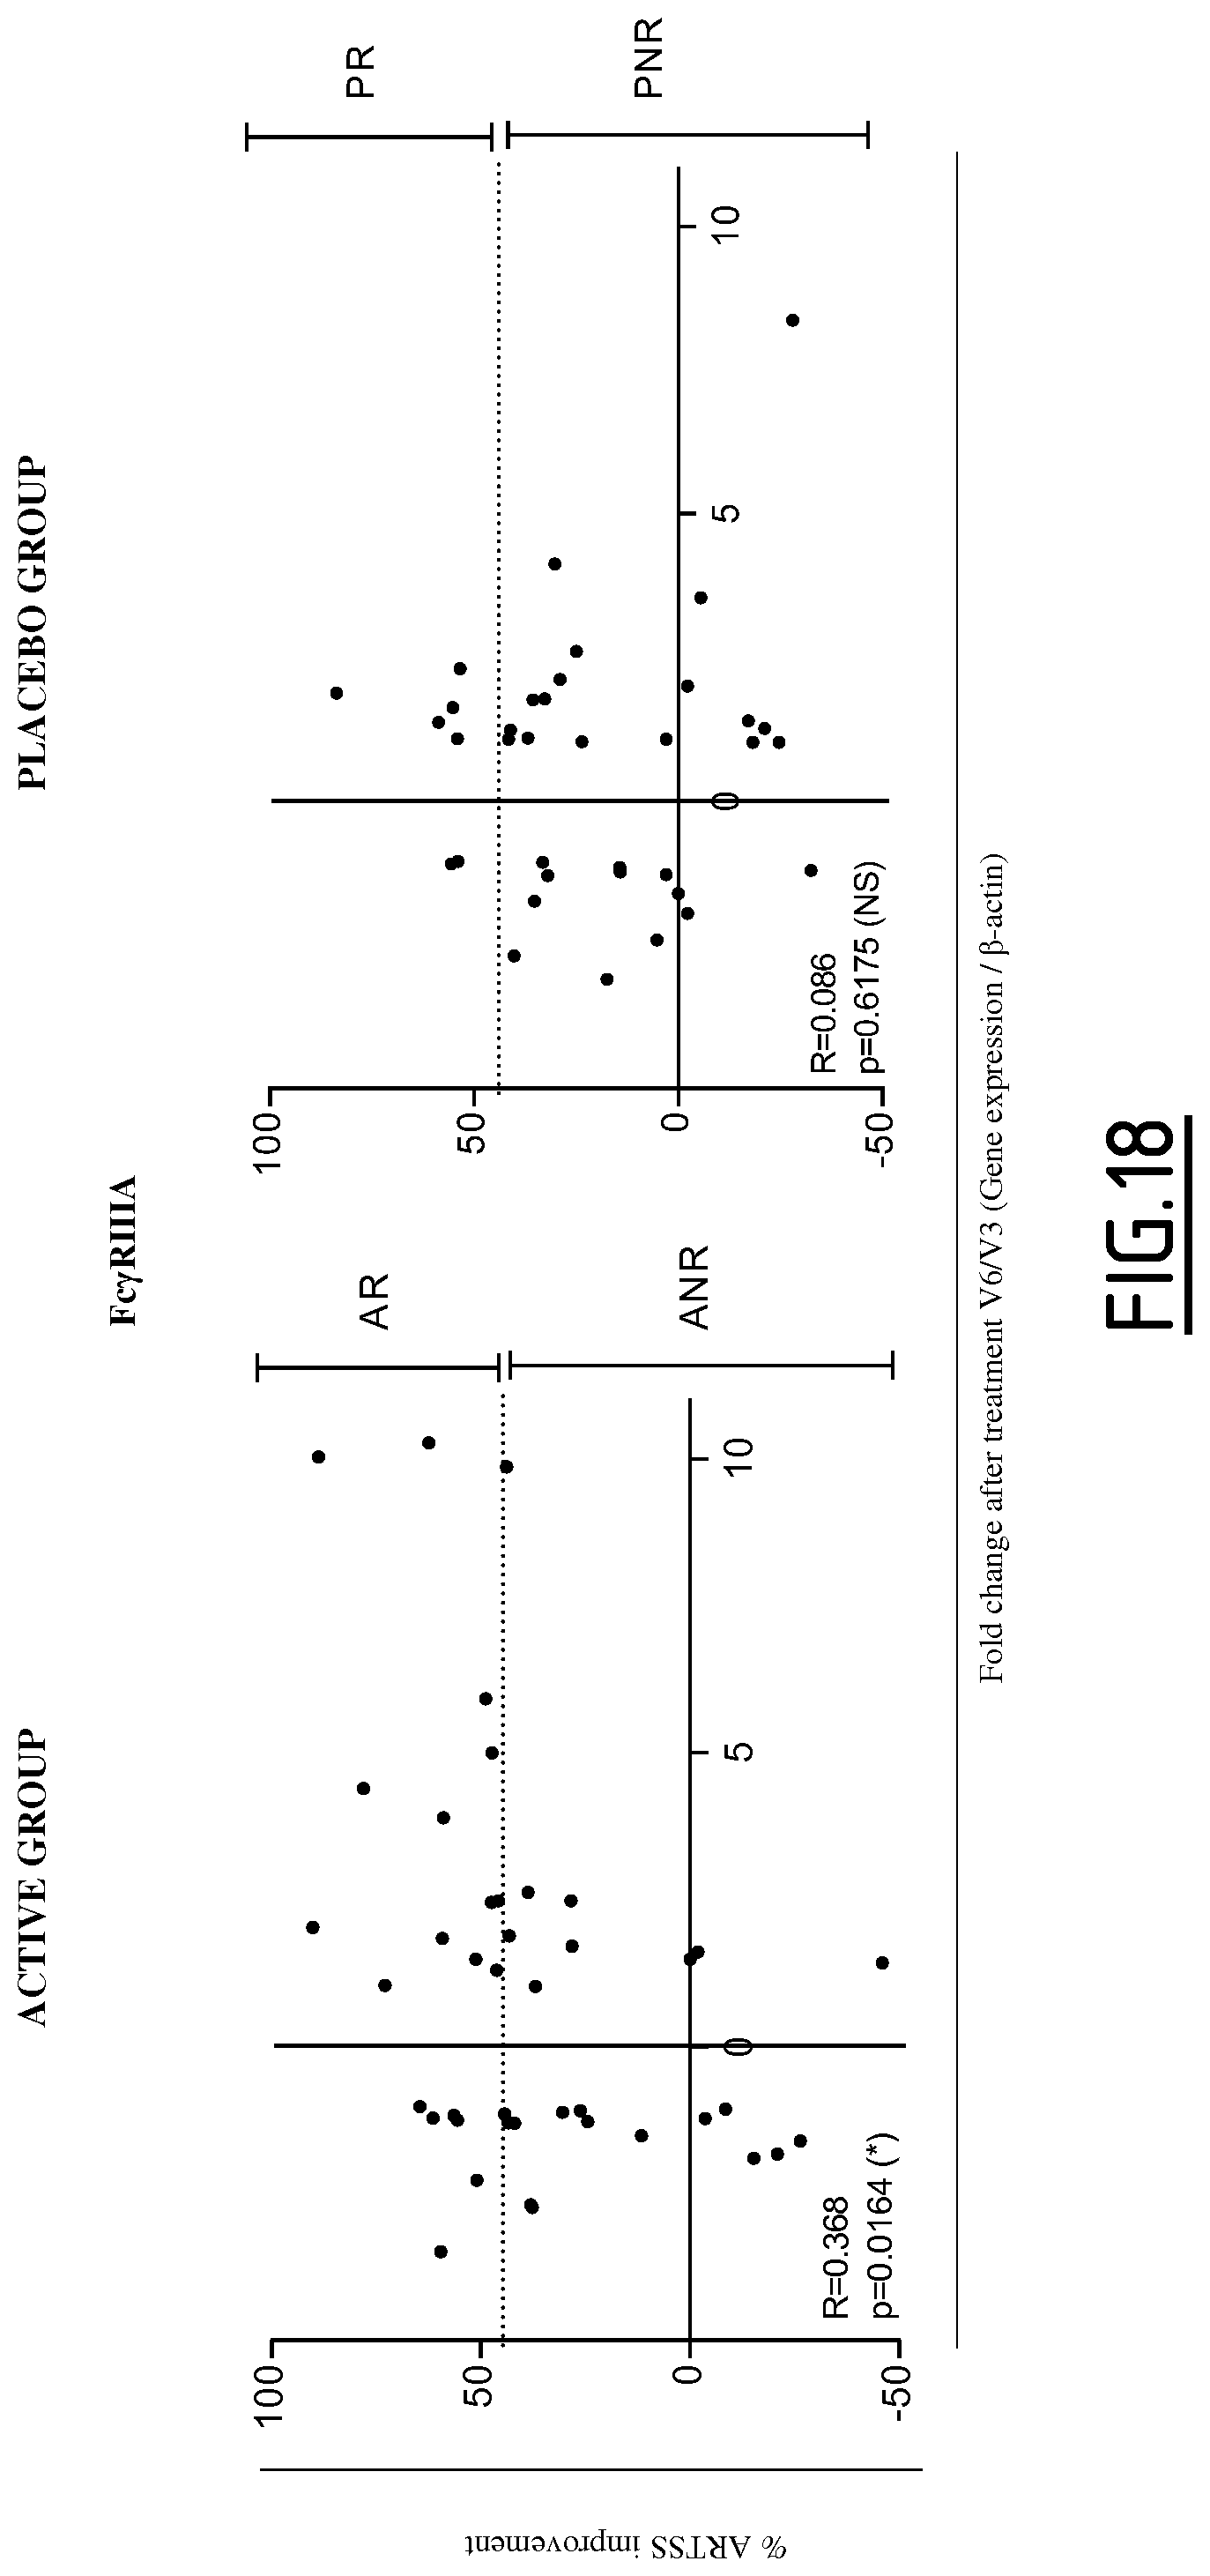
D00018
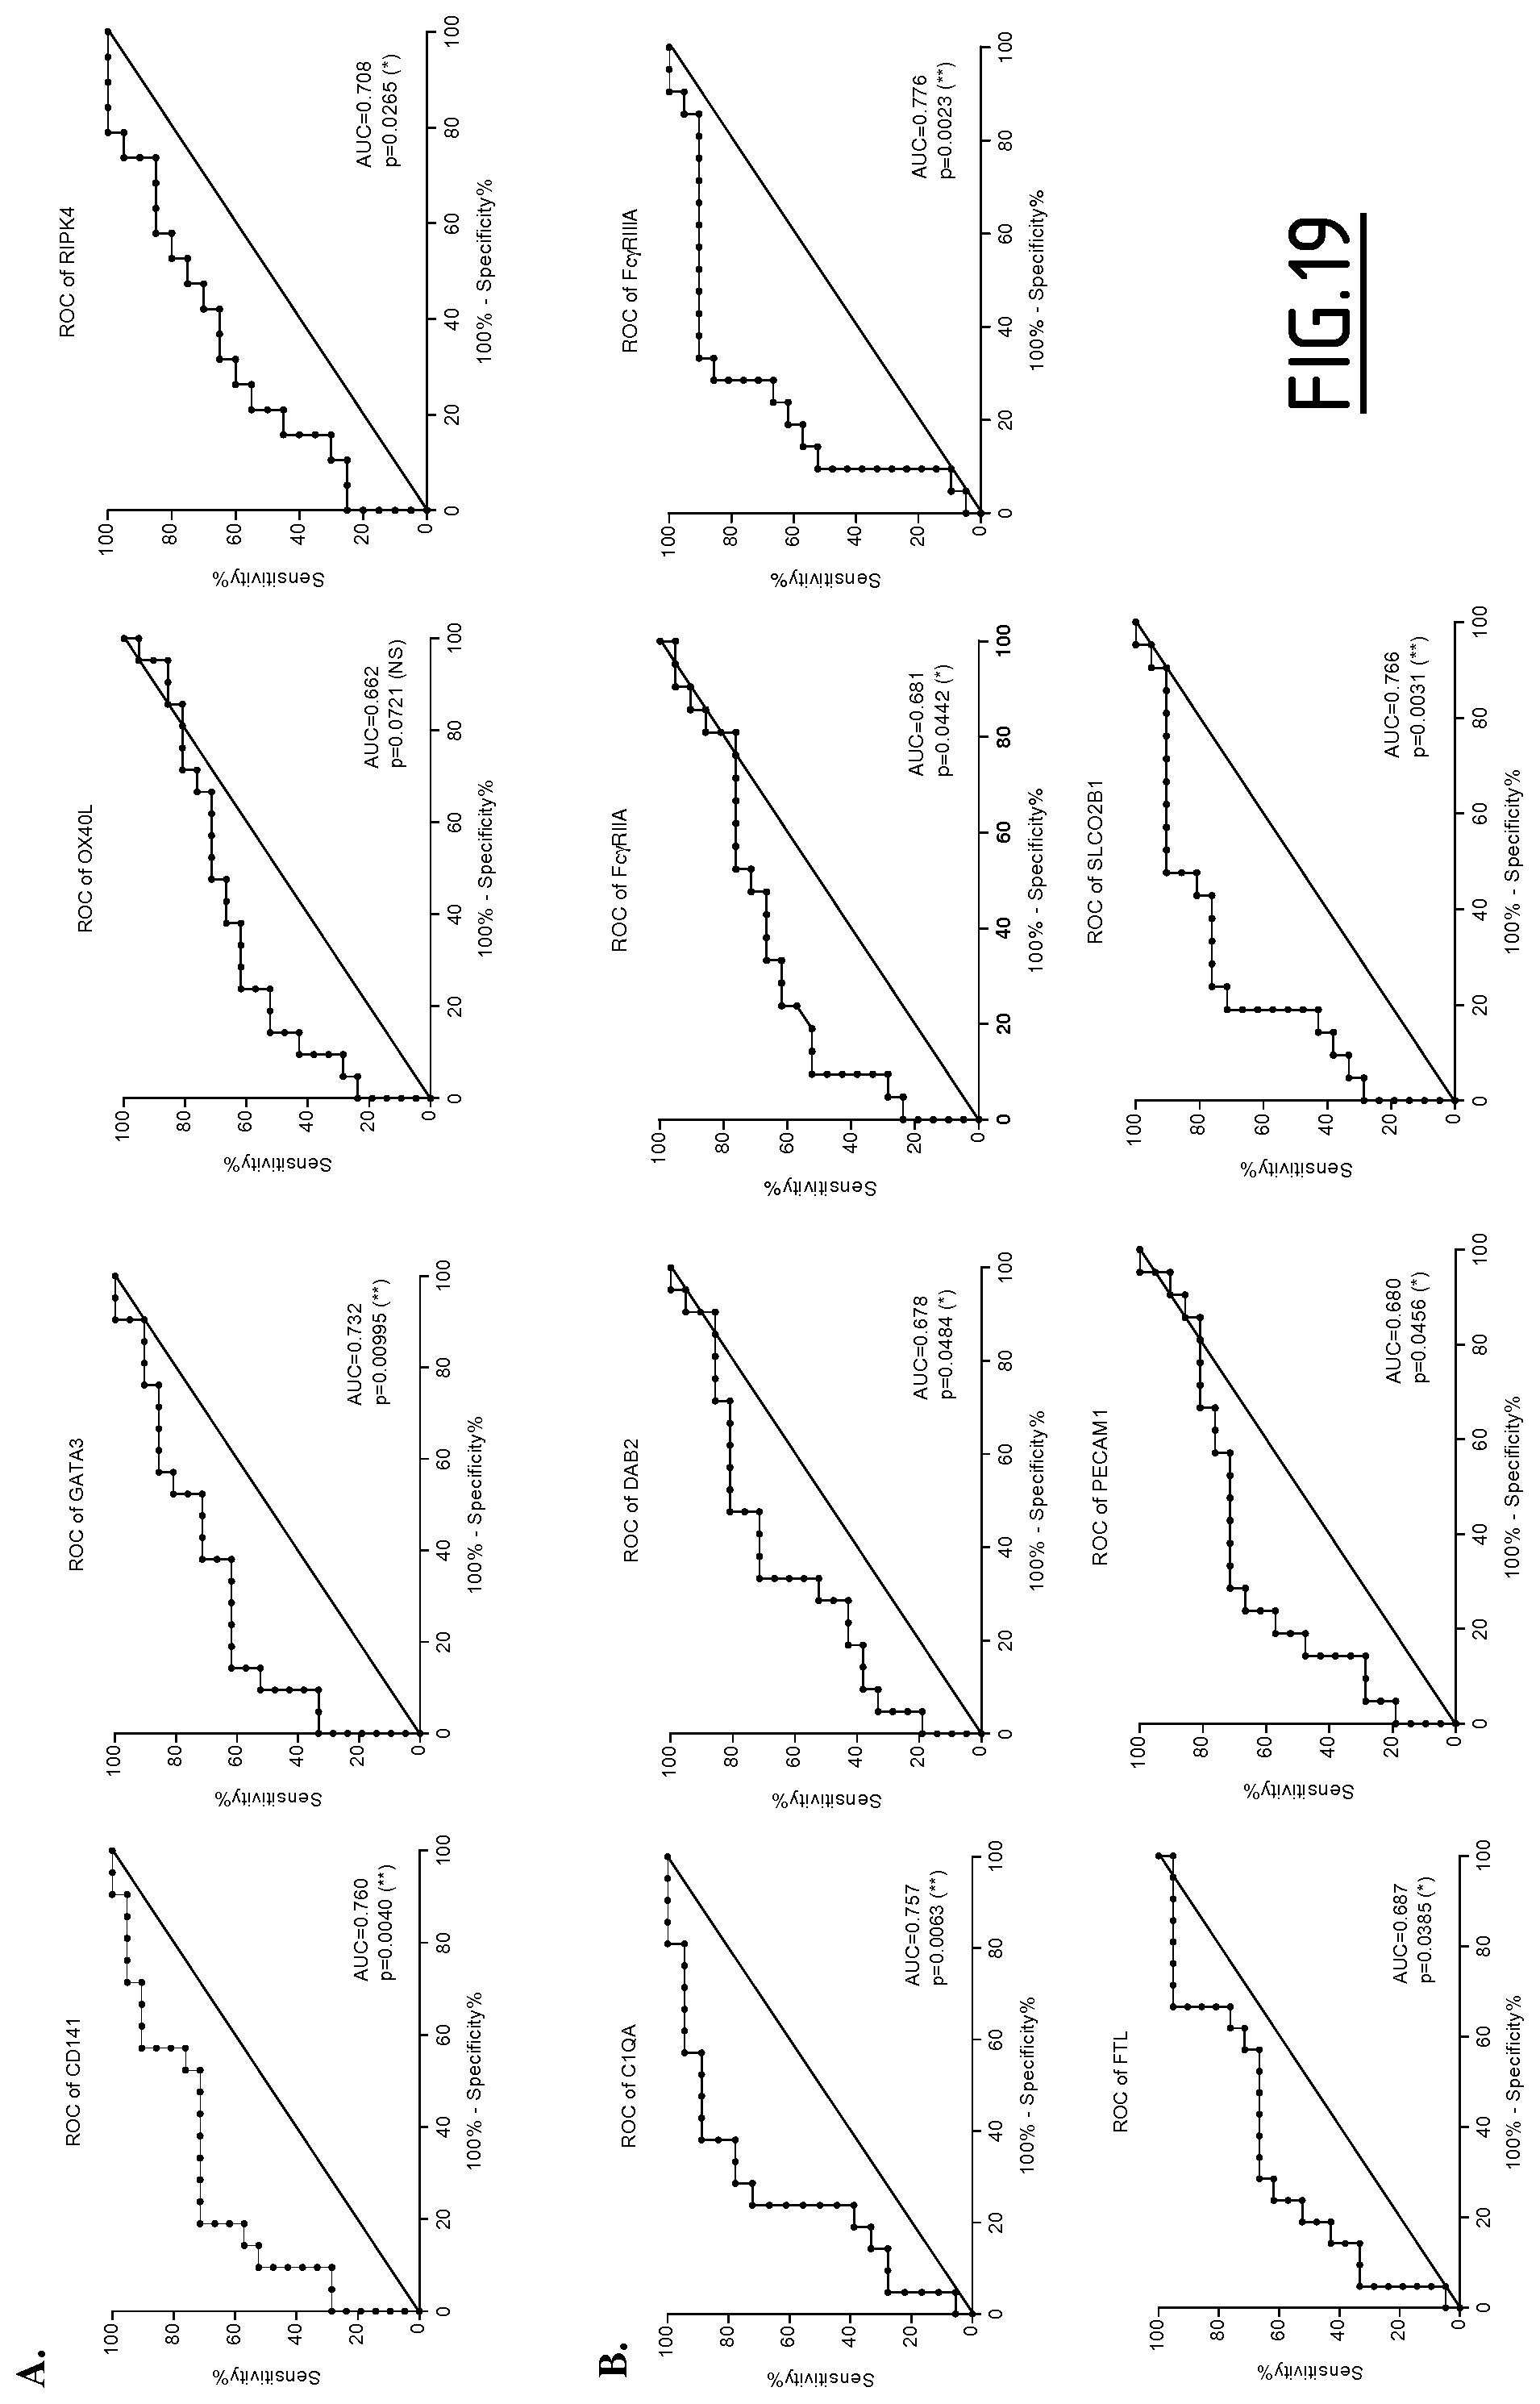
D00019

D00020

D00021
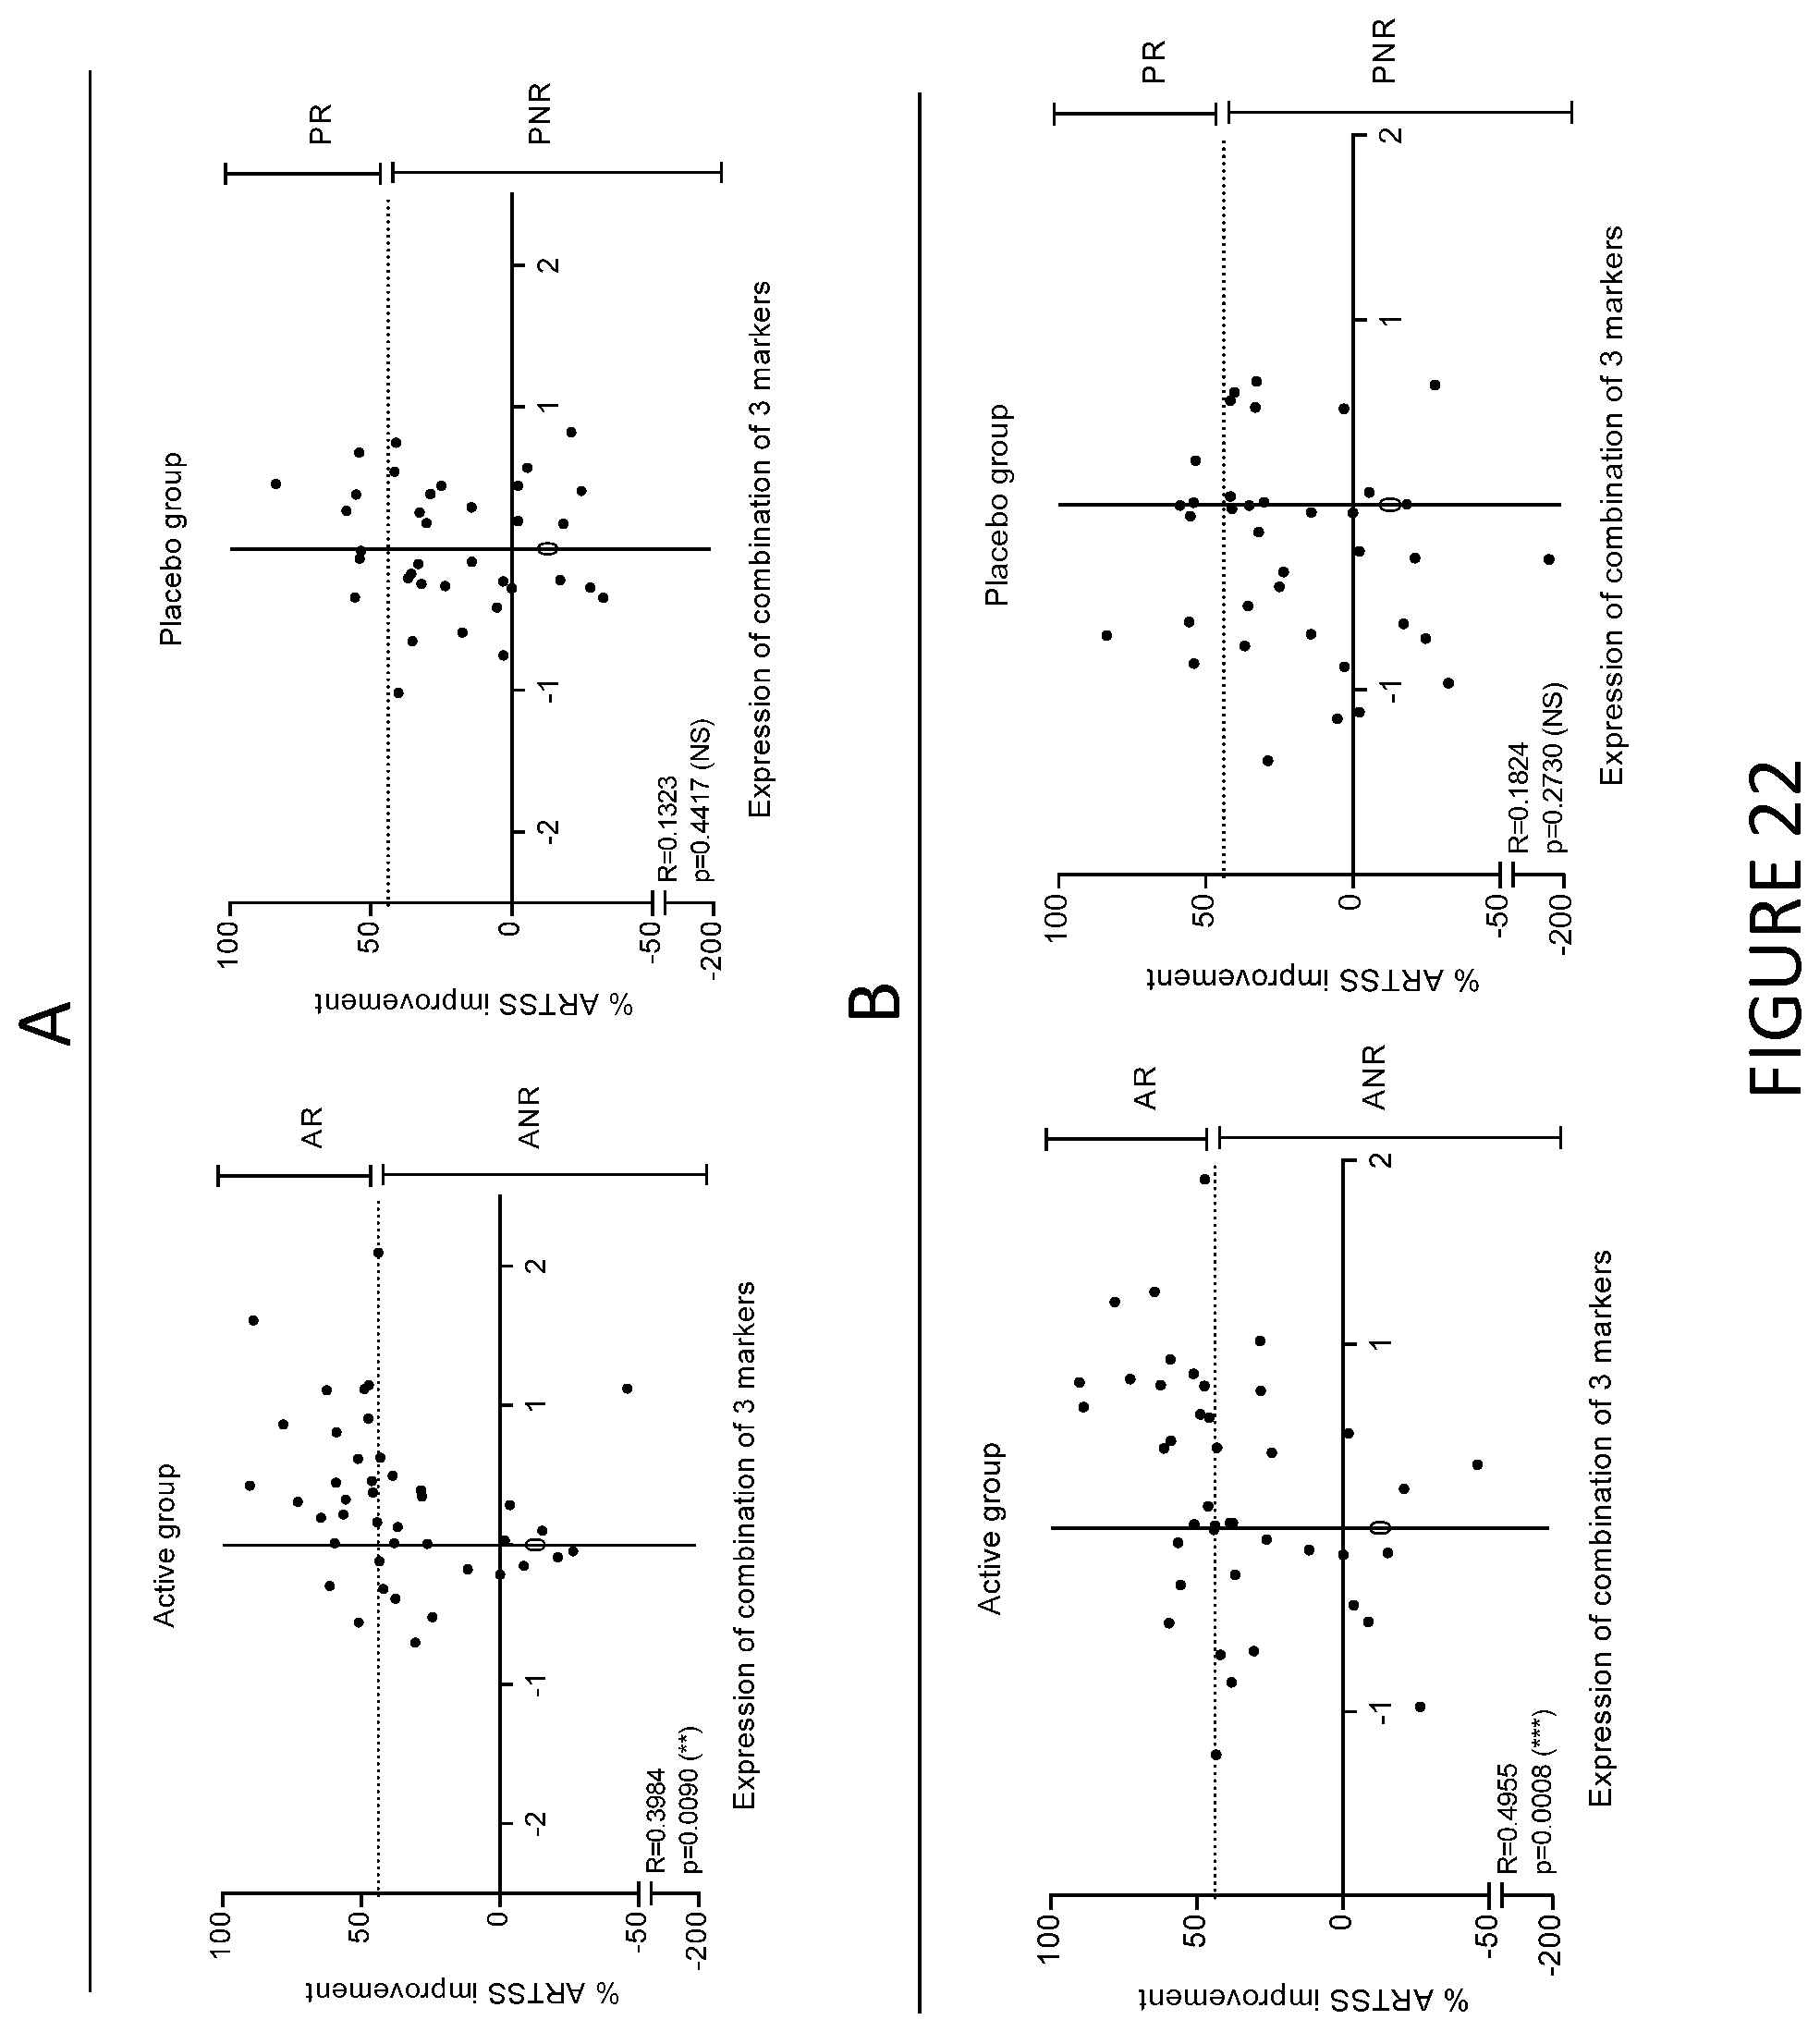
D00022
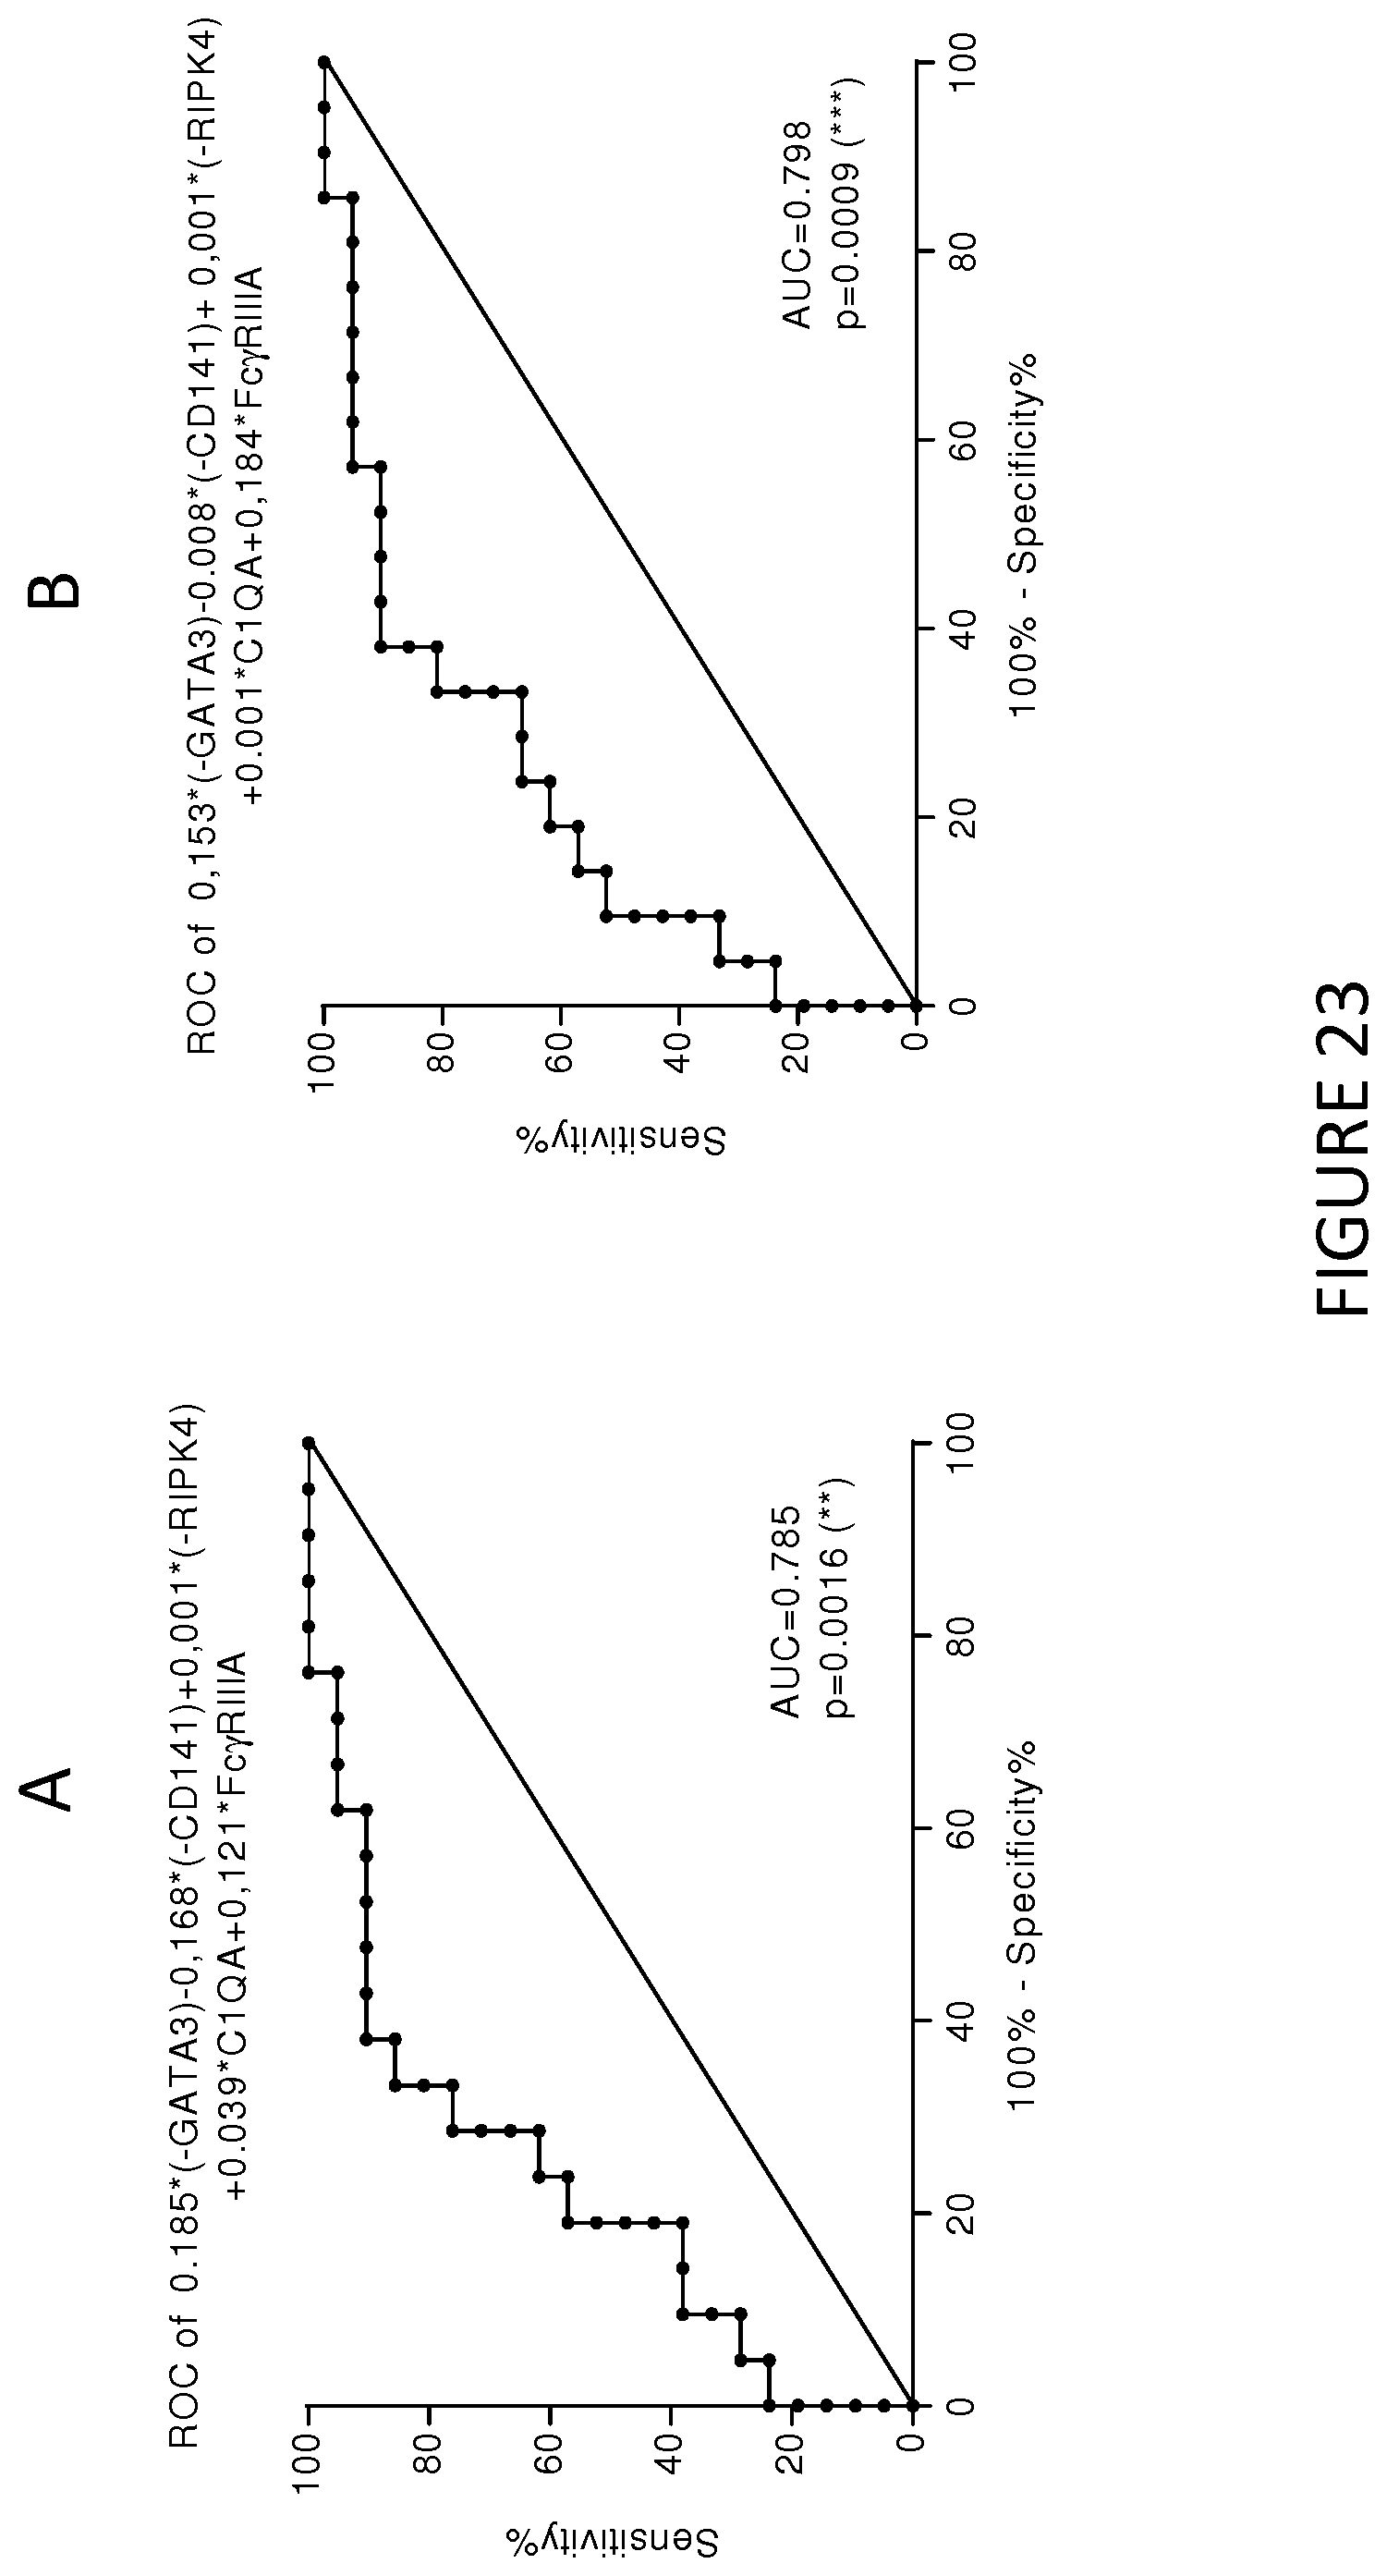
D00023
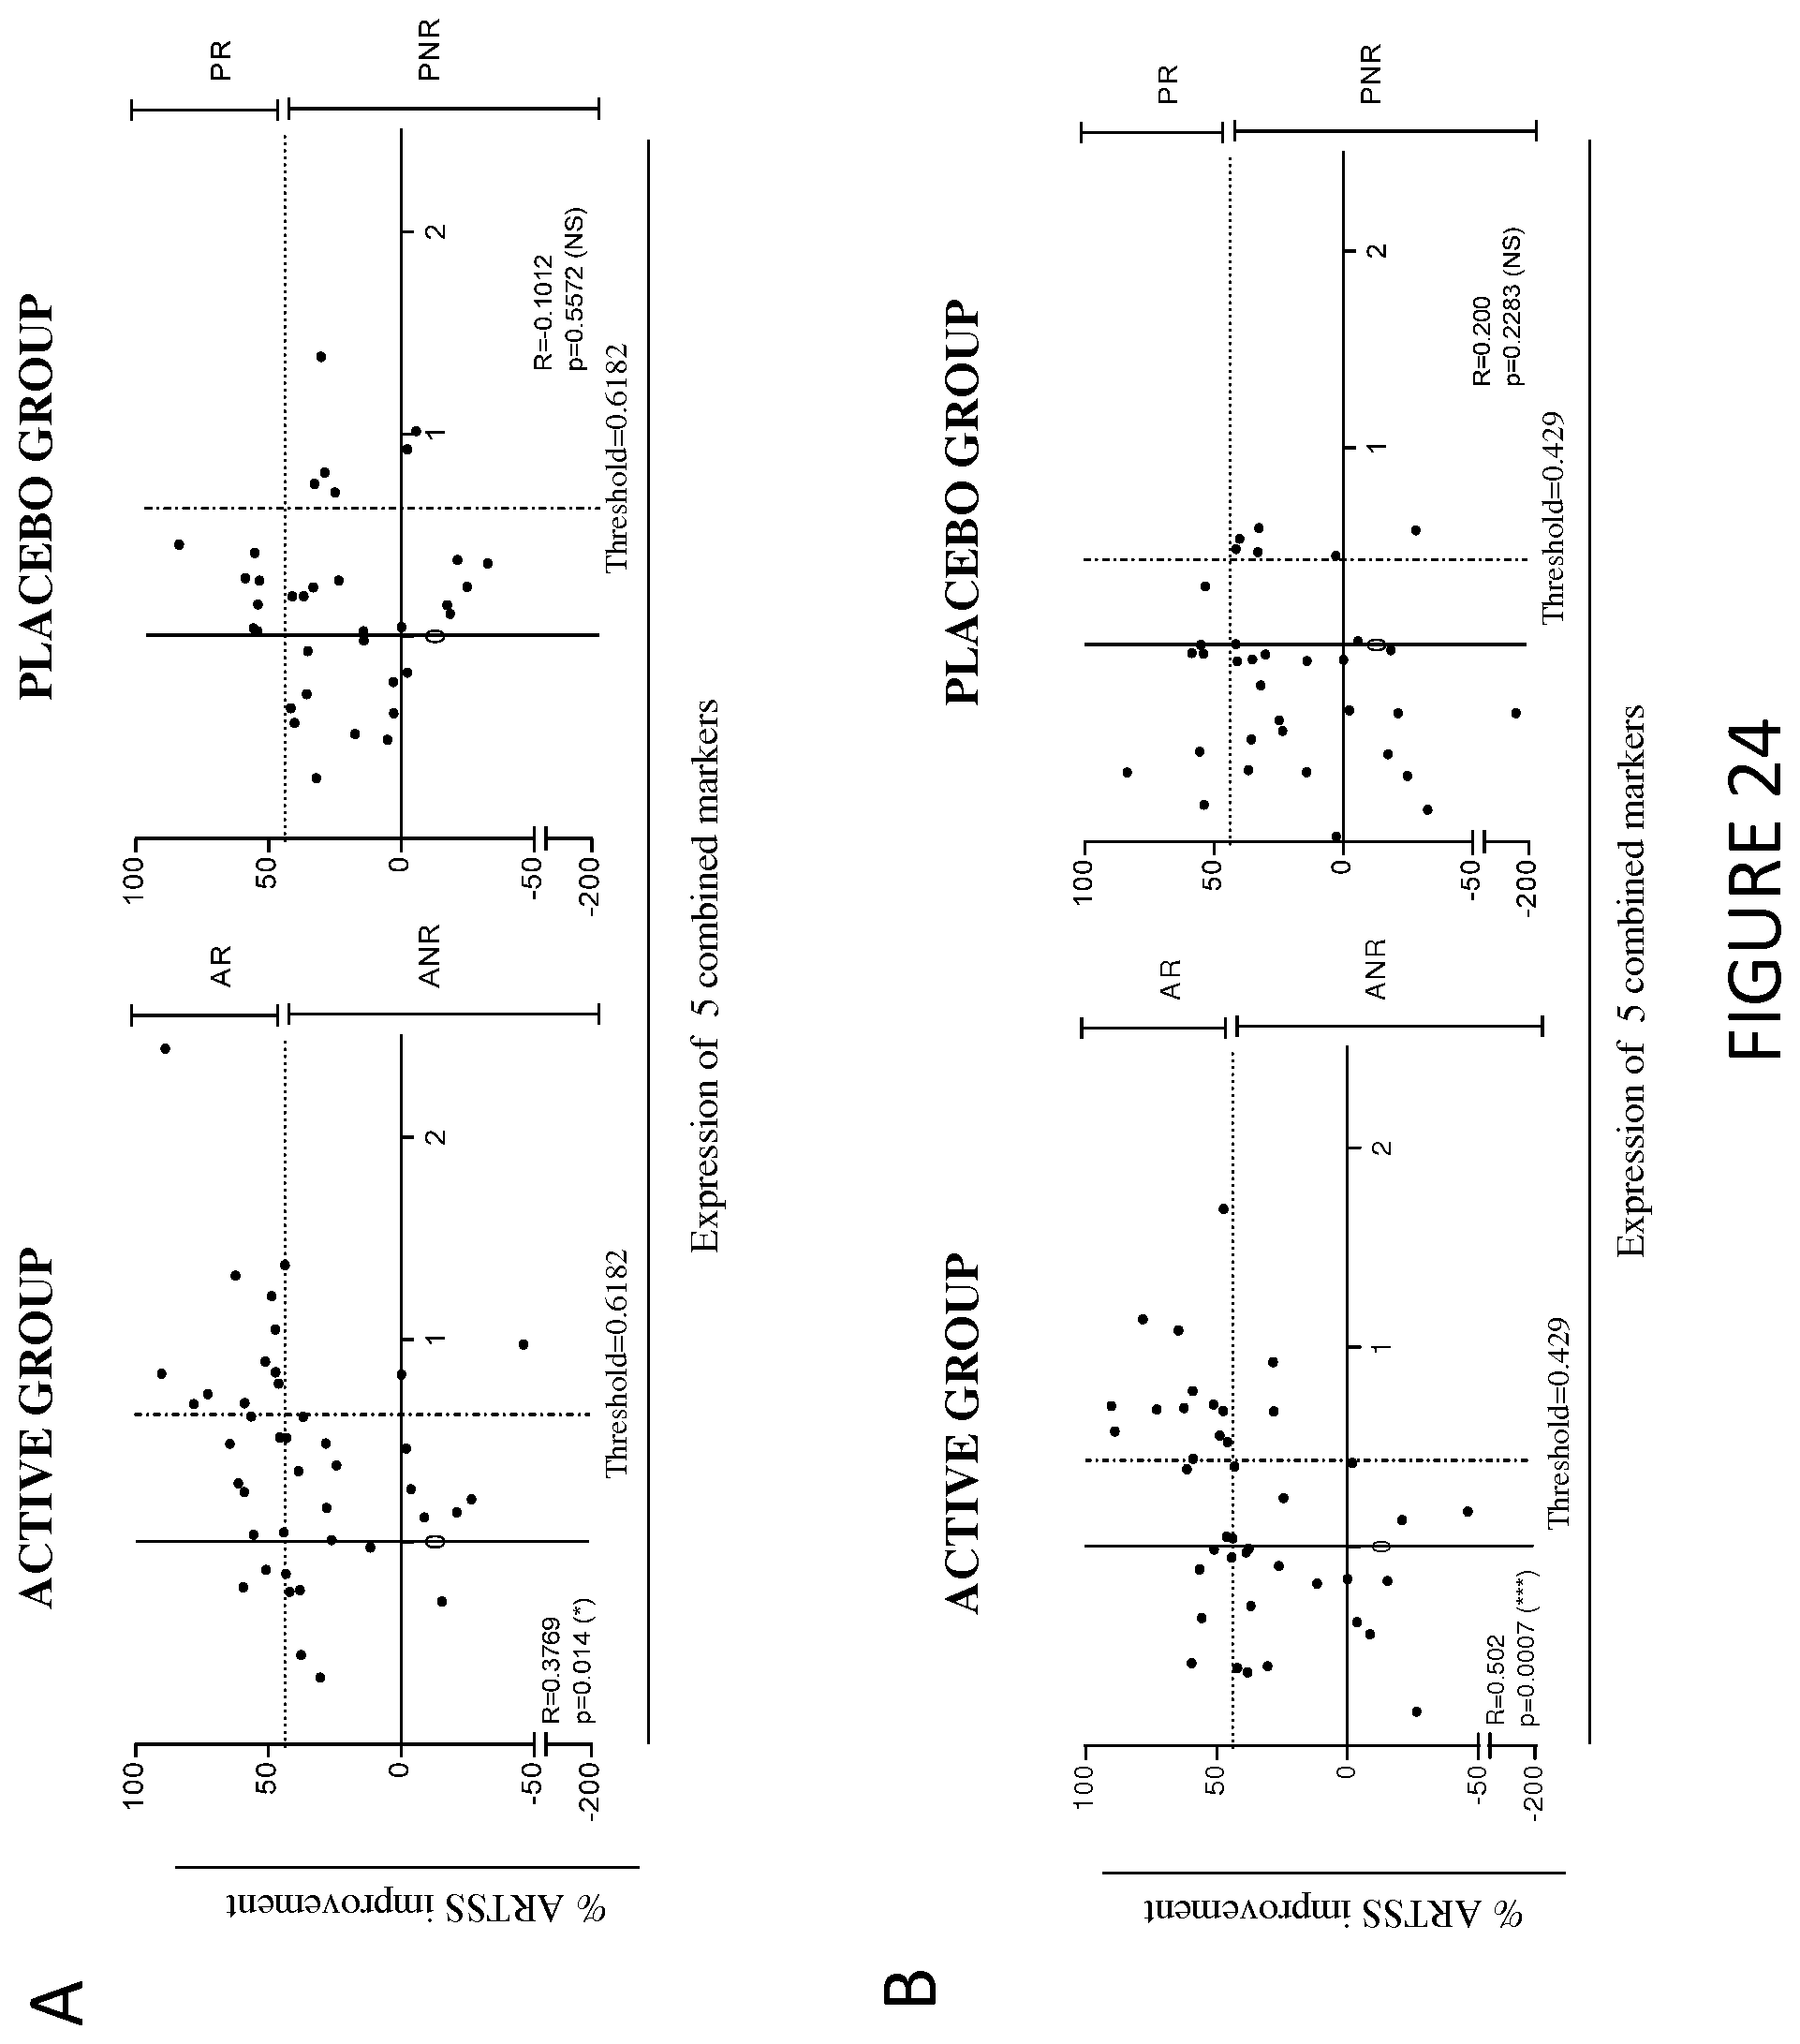
D00024

D00025
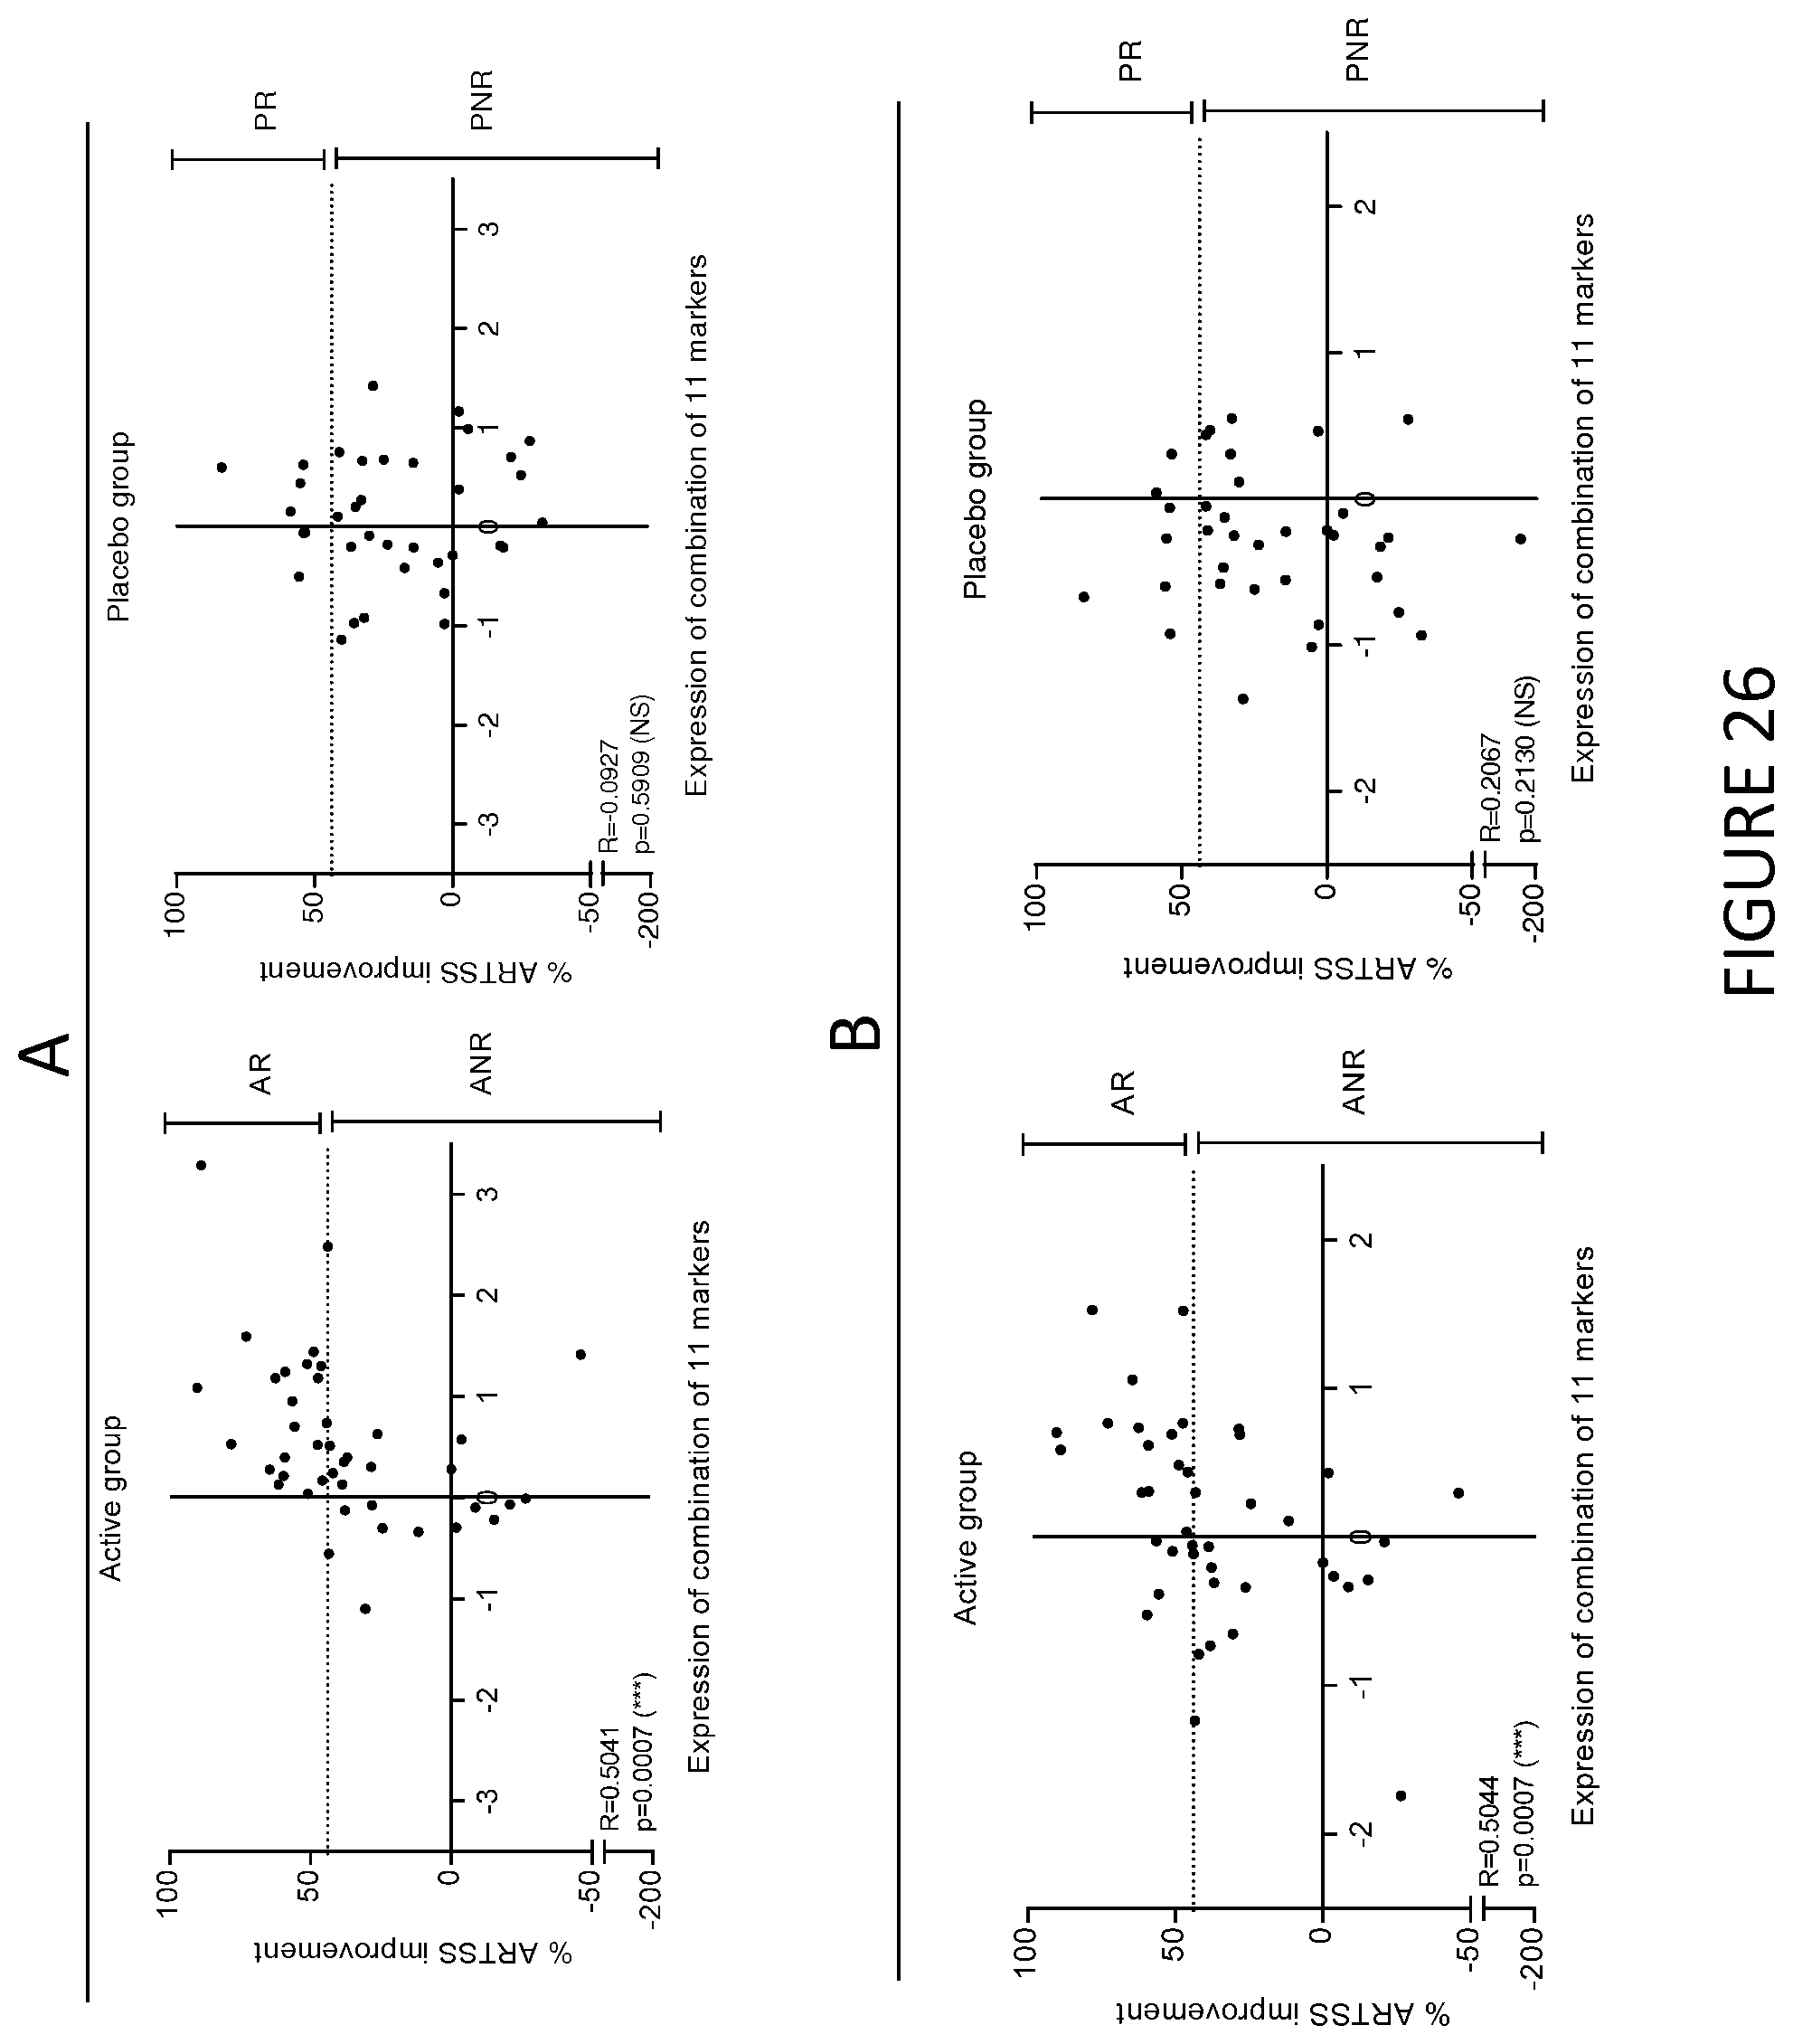
S00001
XML
uspto.report is an independent third-party trademark research tool that is not affiliated, endorsed, or sponsored by the United States Patent and Trademark Office (USPTO) or any other governmental organization. The information provided by uspto.report is based on publicly available data at the time of writing and is intended for informational purposes only.
While we strive to provide accurate and up-to-date information, we do not guarantee the accuracy, completeness, reliability, or suitability of the information displayed on this site. The use of this site is at your own risk. Any reliance you place on such information is therefore strictly at your own risk.
All official trademark data, including owner information, should be verified by visiting the official USPTO website at www.uspto.gov. This site is not intended to replace professional legal advice and should not be used as a substitute for consulting with a legal professional who is knowledgeable about trademark law.