Recording, replay, and sharing of live network monitoring views
Kakatkar , et al. April 27, 2
U.S. patent number 10,992,555 [Application Number 12/791,704] was granted by the patent office on 2021-04-27 for recording, replay, and sharing of live network monitoring views. This patent grant is currently assigned to Virtual Instruments Worldwide, Inc.. The grantee listed for this patent is Rangaswamy Jagannathan, Kishor Kakatkar, Rosanna Lee, Jing Liu, David Messina, Roy Nakashima, Derek Sanders. Invention is credited to Rangaswamy Jagannathan, Kishor Kakatkar, Rosanna Lee, Jing Liu, David Messina, Roy Nakashima, Derek Sanders.
| United States Patent | 10,992,555 |
| Kakatkar , et al. | April 27, 2021 |
Recording, replay, and sharing of live network monitoring views
Abstract
Network monitoring views can be recorded, replayed and shared. A monitoring system receives monitoring data, in response to which a monitoring view can be constructed. The monitoring data is maintained in memory or mass storage. One or more monitoring views can later be constructed in response to user preferences, even if those users would not have known to select those particular preferences or construct those particular monitoring views at the time. The monitoring views constructed in response to that monitoring data can be presented to users in a simulation of the problem, as if it were occurring at that time. Users can send particular monitoring views to others, with both the effects that the monitoring view can be preserved as part of a trouble report, and the persons receiving the monitoring view can have useful insight into what problem the user has pointed to.
| Inventors: | Kakatkar; Kishor (Kothrud, IN), Nakashima; Roy (San Jose, CA), Lee; Rosanna (Palo Alto, CA), Liu; Jing (Cupertino, CA), Sanders; Derek (Saratoga, CA), Jagannathan; Rangaswamy (Sunnyvale, CA), Messina; David (Los Gatos, CA) | ||||||||||
|---|---|---|---|---|---|---|---|---|---|---|---|
| Applicant: |
|
||||||||||
| Assignee: | Virtual Instruments Worldwide,
Inc. (San Jose, CA) |
||||||||||
| Family ID: | 1000005517614 | ||||||||||
| Appl. No.: | 12/791,704 | ||||||||||
| Filed: | June 1, 2010 |
Prior Publication Data
| Document Identifier | Publication Date | |
|---|---|---|
| US 20210067426 A1 | Mar 4, 2021 | |
Related U.S. Patent Documents
| Application Number | Filing Date | Patent Number | Issue Date | ||
|---|---|---|---|---|---|
| 61182242 | May 29, 2009 | ||||
| Current U.S. Class: | 1/1 |
| Current CPC Class: | H04L 43/045 (20130101); H04L 41/22 (20130101); H04L 43/00 (20130101); G06F 3/048 (20130101) |
| Current International Class: | H04L 12/26 (20060101); H04L 12/24 (20060101); G06F 3/048 (20130101) |
| Field of Search: | ;715/700,733-734,736-738,751,748,769,770,965-966,969,971 ;709/223-226,248 |
References Cited [Referenced By]
U.S. Patent Documents
| 5128871 | July 1992 | Schmitz |
| 5233604 | August 1993 | Ahmadi et al. |
| 5271038 | December 1993 | Cai |
| 5430709 | July 1995 | Galloway |
| 5442750 | August 1995 | Harriman, Jr. et al. |
| 5684945 | November 1997 | Chen et al. |
| 5687168 | November 1997 | Iwata |
| 5779030 | July 1998 | Ikegami et al. |
| 5917870 | June 1999 | Wolf |
| 5958053 | September 1999 | Denker |
| 5970064 | October 1999 | Clark et al. |
| 5991881 | November 1999 | Conklin et al. |
| 6046979 | April 2000 | Bauman |
| 6076115 | June 2000 | Sambamurthy et al. |
| 6115745 | September 2000 | Berstis et al. |
| 6128296 | October 2000 | Daruwalla et al. |
| 6167025 | December 2000 | Hsing et al. |
| 6189035 | February 2001 | Lockhart et al. |
| 6202084 | March 2001 | Kumar et al. |
| 6314093 | November 2001 | Mann et al. |
| 6314464 | November 2001 | Murata et al. |
| 6347339 | February 2002 | Morris et al. |
| 6400681 | June 2002 | Bertin et al. |
| 6502135 | December 2002 | Minger et al. |
| 6529866 | March 2003 | Cope et al. |
| 6611525 | August 2003 | Natanson et al. |
| 6697802 | February 2004 | Ma |
| 6725377 | April 2004 | Kouznetsov |
| 6757742 | June 2004 | Viswanath |
| 6785237 | August 2004 | Sufleta |
| 6789190 | September 2004 | Cohen |
| 6807172 | October 2004 | Levenson et al. |
| 6816910 | November 2004 | Ricciulli |
| 6930978 | December 2005 | Sharp et al. |
| 6973040 | December 2005 | Ricciulli |
| 6990591 | January 2006 | Pearson |
| 7006443 | February 2006 | Storr |
| 7007301 | February 2006 | Crosbie et al. |
| 7013482 | March 2006 | Krumel |
| 7051369 | May 2006 | Baba |
| 7062782 | June 2006 | Stone et al. |
| 7076547 | July 2006 | Black |
| 7089428 | August 2006 | Farley et al. |
| 7260840 | August 2007 | Swander et al. |
| 7331060 | February 2008 | Ricciulli |
| 7376969 | May 2008 | Njemanze |
| 7386888 | June 2008 | Liang et al. |
| 7409714 | August 2008 | Gupta et al. |
| 7461403 | December 2008 | Libenzi et al. |
| 7506046 | March 2009 | Rhodes |
| 7594260 | September 2009 | Porras et al. |
| 7607170 | October 2009 | Chesla |
| 7620986 | November 2009 | Jagannathan et al. |
| 7702563 | April 2010 | Balson et al. |
| 7895320 | February 2011 | Oggerino et al. |
| 7941135 | May 2011 | Abusch-Magder |
| 7987228 | July 2011 | McKeown et al. |
| 8738761 | May 2014 | Raisoni |
| 9716638 | July 2017 | Sanders et al. |
| 9935858 | April 2018 | Sanders et al. |
| 10009237 | June 2018 | Sanders et al. |
| 2001/0049711 | December 2001 | Nishihara |
| 2001/0052087 | December 2001 | Garg et al. |
| 2002/0052967 | May 2002 | Goldhor et al. |
| 2002/0131413 | September 2002 | Tsao et al. |
| 2002/0152284 | October 2002 | Cambray |
| 2002/0164999 | November 2002 | Johnson |
| 2003/0202471 | October 2003 | Murooka et al. |
| 2003/0229485 | December 2003 | Nishikawa et al. |
| 2003/0229692 | December 2003 | Vo |
| 2004/0052209 | March 2004 | Ortiz |
| 2004/0054925 | March 2004 | Etheridge et al. |
| 2004/0064293 | April 2004 | Hamilton et al. |
| 2004/0111358 | June 2004 | Lange et al. |
| 2004/0117769 | June 2004 | Lauzon et al. |
| 2005/0099983 | May 2005 | Nakamura et al. |
| 2005/0171960 | August 2005 | Lomet |
| 2005/0190695 | September 2005 | Phaal et al. |
| 2005/0213504 | September 2005 | Enomoto et al. |
| 2005/0276230 | December 2005 | Akahane et al. |
| 2005/0278779 | December 2005 | Koppol et al. |
| 2006/0059282 | March 2006 | Chaudhary et al. |
| 2006/0077905 | April 2006 | Russell et al. |
| 2006/0077981 | April 2006 | Rogers |
| 2006/0109793 | May 2006 | Kim |
| 2006/0195896 | August 2006 | Fulp et al. |
| 2006/0272018 | November 2006 | Fouant et al. |
| 2007/0014248 | January 2007 | Fowlow |
| 2007/0019557 | January 2007 | Catter |
| 2007/0156919 | July 2007 | Potti et al. |
| 2007/0195787 | August 2007 | Alnuweiri et al. |
| 2007/0211645 | September 2007 | Tachibana et al. |
| 2007/0211697 | September 2007 | Noble |
| 2007/0237079 | October 2007 | Whitehead |
| 2007/0245015 | October 2007 | Raisoni |
| 2007/0245051 | October 2007 | Raisoni et al. |
| 2007/0248029 | October 2007 | Merkey et al. |
| 2007/0271374 | November 2007 | Shomura et al. |
| 2008/0046104 | February 2008 | Van Camp |
| 2008/0049628 | February 2008 | Bugenhagen |
| 2008/0049639 | February 2008 | Wiley et al. |
| 2008/0049748 | February 2008 | Bugenhagen et al. |
| 2008/0052387 | February 2008 | Heinz et al. |
| 2008/0219267 | September 2008 | Xia et al. |
| 2008/0225746 | September 2008 | Bedrosian |
| 2008/0291915 | November 2008 | Foschiano |
| 2009/0046664 | February 2009 | Aso |
| 2009/0182953 | July 2009 | Merkey et al. |
| 2010/0135180 | June 2010 | Morinaga et al. |
| 2010/0309812 | December 2010 | Galan Marquez et al. |
| 2011/0040706 | February 2011 | Sen et al. |
| 2011/0060831 | March 2011 | Ishii et al. |
| 2011/0250883 | October 2011 | Pyhtila et al. |
Other References
|
Deering et al. "RFC1883", Internet Protocol Specification, Dec. 1995, pp. 1-27, ver. 6, <http://www.faqs.org/rfcs/frc1883.html>. cited by applicant . Steinke "IP Addresses and Subnet Masks," Network Magazine, Oct. 1995, pp. 1-3, Tables 1 and 3, <hppt://www.networkmagazine.com/shared/printableArticle.jhtml?articleI- D=17601068>. cited by applicant. |
Primary Examiner: Macilwinen; John M
Attorney, Agent or Firm: Ahmann Kloke LLP
Claims
The invention claimed is:
1. A method of monitoring network data, the method comprising: during a first period of time: receiving, in real-time, a set of network monitoring data from a plurality of endpoints of a network including one of a processing and storage device, the processing and storage device being capable of sending or receiving network traffic through the network; mapping the received set of network monitoring data to a plurality of entities of the network; presenting, in real-time, to a user, one or more monitoring views, the one or more monitoring views identifying a subset of the plurality of entities of the network and identifying changes in operation of the network based on the set of network monitoring data; analyzing, after presenting the one or more monitoring views during the first period of time, at least a subset of the set of network monitoring data; identifying an alarm condition based on analyzing the at least the subset of the set of network monitoring data, the alarm condition occurring at a particular time within the first period of time, the alarm condition not being indicated within the presentation; during a second period of time, the second period of time beginning after an end of the first period of time: receiving a request for a first simulation of the network using the at least the subset of the set of network monitoring data; simulating at least a portion of the first simulation of the network using the at least the subset of the set of network monitoring data and the first simulation including the alarm condition, the alarm condition being indicated during the first simulation when simulating the particular time within the first period of time; and presenting the at least the portion of the first simulation of the network, the presenting including the alarm condition when simulating the particular time within the first period of time.
2. The method as in claim 1, wherein the set of network monitoring data including measures of network traffic such as bit rate and packet rate of the network traffic.
3. The method as in claim 1, wherein parameters of the network include a bit rate of the network traffic, a packet rate of the network traffic, an interaction rate, and burstiness, the interaction rate being a measure of a particular endpoint of the network with other entities of the network, the burstiness being a measure of a rate of change of bit rate for the particular endpoint of the network.
4. The method as in claim 1, wherein the analyzing includes analyzing an exponential moving average of one or more parameters of the network.
5. The method as in claim 4, wherein the analyzing includes comparing the exponential moving average with user-defined thresholds.
6. The method as in claim 1, wherein the entities of the network include: endpoints of the network, an application of the network, a location of the network, or a flow interface of the network.
7. The method as in claim 1, wherein the identifying the alarm condition did not occur during the first period of time.
8. The method as in claim 1, wherein simulating the at least the portion of the first simulation includes simulating the alarm condition at a point in time where the alarm condition takes place as if the alarm condition was occurring in real-time.
9. A method, including steps of: receiving, during a first period of time, a set of network monitoring data from a plurality of endpoints of a network including one of a processing and storage device, the processing and storage device being capable of sending or receiving network traffic through the network; mapping the received set of network monitoring data to one or more entities of the network; presenting, in real-time, one or more live network monitoring views, the one or more live network monitoring views identifying a subset of the one or more entities of the network and identifying changes in operation of the set of network monitoring data; analyzing, after presenting the one or more live network monitoring views during the first period of time, at least a subset of the set of network monitoring data, the analyzing being based at least on maximum and minimum values of one or more parameters of the network; identifying an alarm condition based on analyzing the at least the subset of the set of network monitoring data, the alarm condition occurring at a particular time within the first period of time, the alarm condition not being indicated within the presentation; receiving, from a user during a second period of time, a request for a first simulation of the network using the at least the subset of the set of network monitoring data, the first simulation of the network including the one or more live network monitoring views, the second period of time beginning after an end of the first period of time; simulating at least a portion of the first simulation of the network using the at least the subset of the set of network monitoring data and the first simulation including the alarm condition, the alarm condition being indicated during the first simulation when simulating the particular time within the first period of time; presenting the at least the portion of the first simulation of the network, the presenting including the alarm condition when simulating the particular time within the first period of time; receiving, during the presenting, an indication to change one or more parameters associated with a particular behavior of the network, the one or more parameters being associated with the alarm condition; dynamically adjusting, in real-time, the first simulation, based on the indication to change the one or more parameters, the first simulation substituting the one or more parameters during the first simulation, a relationship of the particular behavior with the one or more parameters not having been computed during the first period of time; and presenting, in real-time, the first simulation after the dynamic adjustment.
10. The method as in claim 9, wherein the set of network monitoring data includes measures of network traffic such as bit rate and packet rate of the network traffic.
11. The method as in claim 9, wherein the set of network monitoring data includes measures of network traffic such as bit rate and packet rate of the network traffic.
12. The method as in claim 9, wherein the parameters of the network include a bit rate of the network traffic, a packet rate of the network traffic, an interaction rate, and burstiness, the interaction rate being a measure of a particular endpoint of the network with other entities of the network, the burstiness being a measure of a rate of change of bit rate for the particular endpoint of the network.
13. The method as in claim 9, wherein the analyzing includes analyzing an exponential moving average of one or more parameters of the network.
14. The method as in claim 13, wherein the analyzing includes comparing the exponential moving average with user-defined thresholds.
15. The method as in claim 9, wherein the entities of the network include: endpoints of the network, an application of the network, a location of the network, or a flow interface of the network.
16. The method as in claim 9, wherein the identifying the alarm condition did not occur during the first period of time.
17. The method as in claim 9, wherein simulating the at least the portion of the first simulation includes simulating the alarm condition at a point in time where the alarm condition takes place as if the alarm condition was occurring in real-time.
Description
This application names the following inventors:
TABLE-US-00001 Inventor Citizenship Residence City and State Kishor KAKATKAR United States Kothrud, INDIA Roy NAKASHIMA United States Cupertino, California Rosanna K. LEE United States Palo Alto, California Jing LIU United States Cupertino, California Derek A. SANDERS United States Saratoga, California Rangaswamy JAGANNATHAN Canada Sunnyvale, California David MESSINA United States Cupertino, California
This application names the following assignee: Xangati, a business having an office in Cupertino, Calif.
RELATED APPLICATION
This application claims priority from U.S. Provisional Application No. 61/182,242, filed May 29, 2009, entitled "Recording, Replay, and Sharing of Live Network Monitoring Views," in the name of Kishor Kakatkar, Roy Nakashima, Rosanna K. Lee, Jing Liu, Derek A. Sanders, Rangaswamy Jagannathan, and David Messina.
INCORPORATED DISCLOSURES
This patent application is intended to be read with the following documents: U.S. Provisional Application No. 61/182,242, filed May 29, 2009, entitled "Recording, Replay, and Sharing of Live Network Monitoring Views," in the name of Kishor Kakatkar, Roy Nakashima, Rosanna K. Lee, Jing Liu, Derek A. Sanders, Rangaswamy Jagannathan, and David Messina, including the Technical Appendix thereto. U.S. patent application Ser. No. 11/153,217, filed Jun. 14, 2005, entitled "Defenses Against Software Attacks in Distributed Computing Environments," in the names of Jagan Jagannathan and Rangaswamy Vasudevan; U.S. patent application Ser. No. 12/179,703, filed Jul. 25, 2008, entitled "Parallel Distributed Network Monitoring," in the names of Rangaswamy Jagannathan, Rosanna Lee, Derek Sanders, Kishor Kakatkar and Xiaohong Pan; U.S. patent application Ser. No. 12/180,193, filed Jul. 25, 2008, entitled "Network Monitoring Using Virtual Packets," in the names of Rosanna Lee, Xiaohong Pan, Rangaswamy Jagannathan, Derek Sanders, and Kishor Kakatkar; U.S. patent application Ser. No. 12/180,333, filed Jul. 25, 2008, entitled "Network Monitoring Using Bounded Memory Data Structures," in the names of Rosanna Lee, Xiaohong Pan, Rangaswamy Jagannathan, Derek Sanders, and Kishor Kakatkar; U.S. patent application Ser. No. 12/180,243, filed Jul. 25, 2008, entitled "Network Monitoring of Behavior Probability Density," in the names of Derek Sanders, Rangaswamy Jagannathan, Rosanna Lee, Kishor Kakatkar, Xiaohong Pan, and Jing Liu; and U.S. patent application Ser. No. 12/180,437, filed Jul. 25, 2008, entitled "Symptom Detection Using Behavior Probability Density," in the names of Derek Sanders, Rangaswamy Jagannathan, Rosanna Lee, Kishor Kakatkar, and Xiaohong Pan.
Each and every one of these documents including all drawings, figures, and subparts, is hereby incorporated by reference as if fully set forth herein. These documents are sometimes referred to herein, either as an entire set or a subset thereof, as the "Incorporated Disclosure" or "Incorporated Disclosures."
BACKGROUND
Monitoring of network data tells network administrators how the network is operating, and whether there are network problems which should be addressed. Network problems should be identified almost immediately as they happen, so that network administrators can take appropriate action. For example, some network problems might indicate that the network has been infected with a virus, is under a denial-of-service attack, or is suffering from other (e.g., non-security-related) reasons, for example and without limitation, that a network communication link has failed or degraded, or that a network endpoint has failed or degraded. Known systems sometimes alert network administrators when a network problem is detected. For example and without limitation, a network administrators might be alerted using direct communication, such as by email or pager, by using network management systems, such as by using a network management system, e.g., a system log or a selected set of SNMP traps. While these known systems generally achieve the purpose of providing a rapid alert, the alerted network administrators then work with a network problem that has already occurred, rather than one which is occurring while the network administrators are able to watch it unfold.
SUMMARY OF THE DESCRIPTION
A set of techniques provides methods by which live network monitoring views can be recorded, replayed and shared. A network monitoring system receives network monitoring data, in response to which a network monitoring view can be constructed. The network monitoring data is maintained in memory or mass storage, with the effect that one or more network monitoring views can later be constructed in response to user preferences, even if those users would not have known to select those particular preferences or construct those particular network monitoring views at the time.
The network monitoring views constructed in response to that network monitoring data can be presented to users in a simulation of the network problem, as if it were occurring at that time, with the effect that users can visualize and trouble-shoot operation of network problems even if those users were not present at the time those network problems occurred. This might be thought of as a recorded video stream, such as presentable on YouTube or a similar service, except that these views are far more versatile, in that they are dynamically adjustable (and in response to parameters which might not have been thought of at the time the video stream was recorded), and are presented as if they were occurring "live" for the user, e.g., a network administrator. Users can send particular network monitoring views to others, with both the effects that (1) the network monitoring view can be preserved as part of a trouble report, and (2) the persons receiving the network monitoring view can have useful insight into what problem the user has pointed to. After reading this application, those skilled in the art would appreciate that these effects would allow a network administrator to view (and repeatedly re-view) the network problem "as if" it were occurring in real time. For example and without limitation, these re-views "as if" they were occurring in real time would allow a network administrator to gain significant insight into whatever problem there might have been, by repeatedly examining the problem as it unfolds in "real time" and watching for particular types of features or symptoms, which might be associated with particular types of network problem.
DETAILED DESCRIPTION
Definitions
The following definitions are generally applicable herein: The terms "client" and "server", and the like, generally refer to any client-server relationship between devices or applications. Thus, as used herein, one "client" or one "server" can comprise any of the following: (a) a single physical device capable of executing software; (b) a portion of a physical device, such as a software process or set of software processes capable of executing on one hardware device; or (c) a plurality of physical devices, or portions thereof, capable of cooperating to form a logical entity. The phrase "formatting schema", and the like, generally refers to any specification for presentation of network monitoring data, including without limitation any specification with respect to the data selected for presentation, the aggregation or other collection of that data for presentation, and the method of comparison of that data with other network monitoring data. The phrases "live network monitoring view", "network monitoring view", "monitoring view", and the like, generally refer to any presentation (whether the actual presentation, a recording, or a specification of how to make that presentation) of network monitoring data to a user. For example and without limitation, a monitoring view might include a time-varying presentation of one or more time series of data regarding network operation. The phrase "network application", and the like, and the term "application", and the like, generally refer to any program, process, or operation that one endpoint might perform in association with interacting with another endpoint. For a first example and without limitation, IM (instant messaging) might be performed by both sender and receiver as an application both are using. For a second example and without limitation, HTTPS (hypertext transfer protocol, secure) might be performed by a client device and a server device as an application. The first example is substantially symmetric, in that each participant both sends information to the other and receives (and presents to a user) information from the other. However, the second example is substantially asymmetric, in that one participant is the client, which makes requests, and that one participant is the server, which services those requests. In the case of HTTPS, and its variants, the client primarily asks for particular information and the server supplies that information. The phrase "network endpoint", and the like, and the term "endpoint", and the like, generally refer to anything in the environment associated with the network that is specifically addressable, and which interacts with other endpoints by the exchange of messages or data. For example and without limitation, an endpoint might include any device (such as a printer) with an IP (internet protocol) address and capable of receiving messages from other endpoints. In this example, a printer might receive messages from other endpoints regarding data (or pointers to data) to be printed. The phrases "network monitoring data", "monitoring data", and the like, generally refer to any set of information regarding the state, changing state, or operation of a network. For example and without limitation, monitoring data might include one or more measures of network traffic, one or more measures of user activity with the network, and otherwise. The terms "produce" and "consume", and the like, when referring to network applications, generally refer to any operation which causes a program, process, or operation to be instantiated, performed, or started, at one or more endpoints. The phrases "simulation of live monitoring", and the like, "simulation of live data", and the like, generally refer to any presentation which resembles a presentation at the time or time epoch of original occurrence, or which resembles a presentation that would have been made, if requested, at the time or time epoch of original occurrence. For example and without limitation, a time-shifted presentation of network monitoring data, even if that network monitoring data were selected in response to information not available at the time or time epoch of the original occurrence, would be an example of a simulation of live monitoring. The phrase "time-shifted", and the like, generally refers to any operation or presentation which is performed, or re-performed, at a time or during a time epoch other than the original time or time epoch when that operation or presentation was first performed. For example and without limitation, presentation of data relating to network traffic, substantially as if presented at the time of original occurrence, would be time-shifted with respect to the original occurrence of that network traffic.
These definitions should be regarded as exemplary and not in any way limiting.
FIGURES AND TEXT
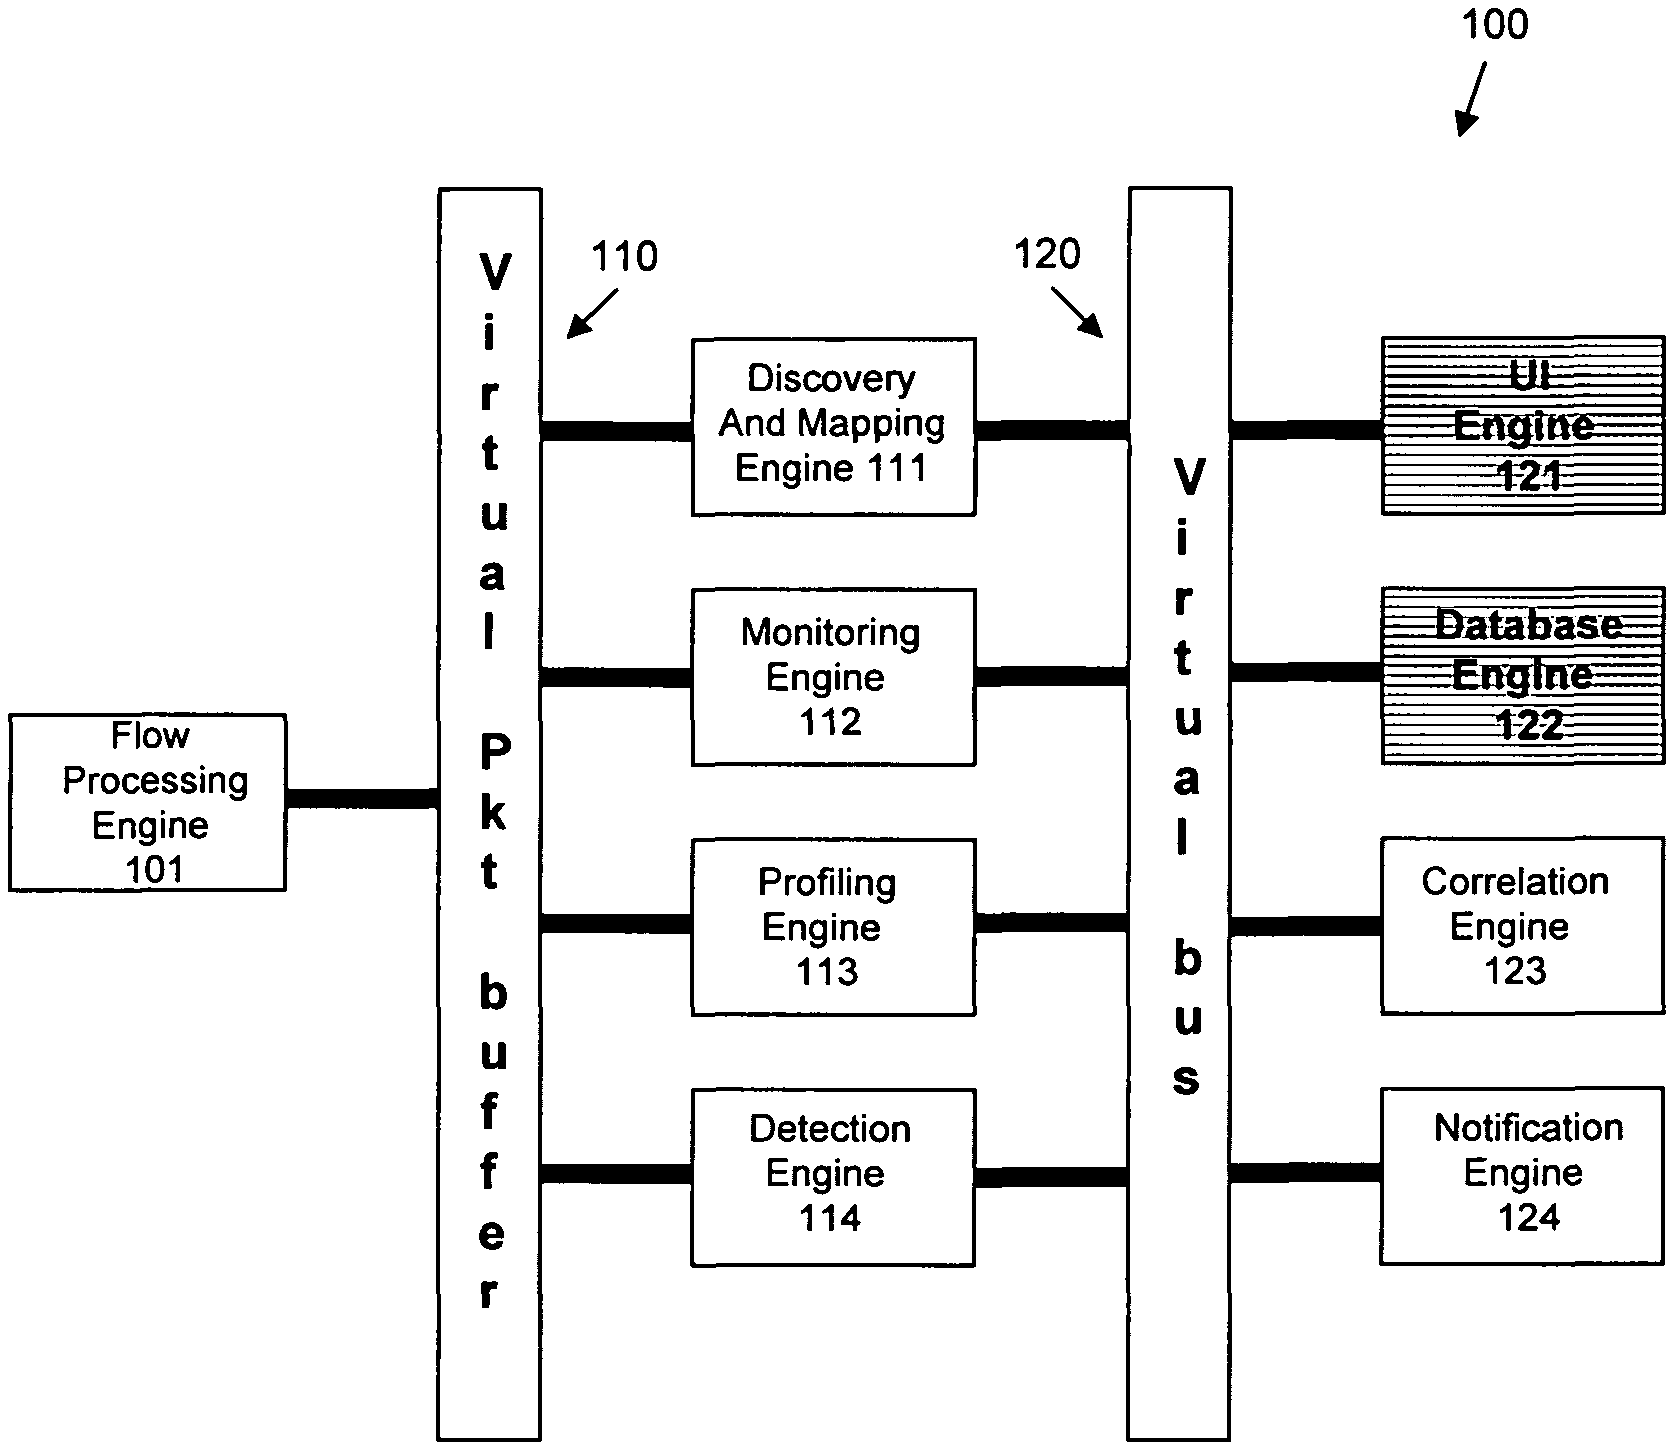
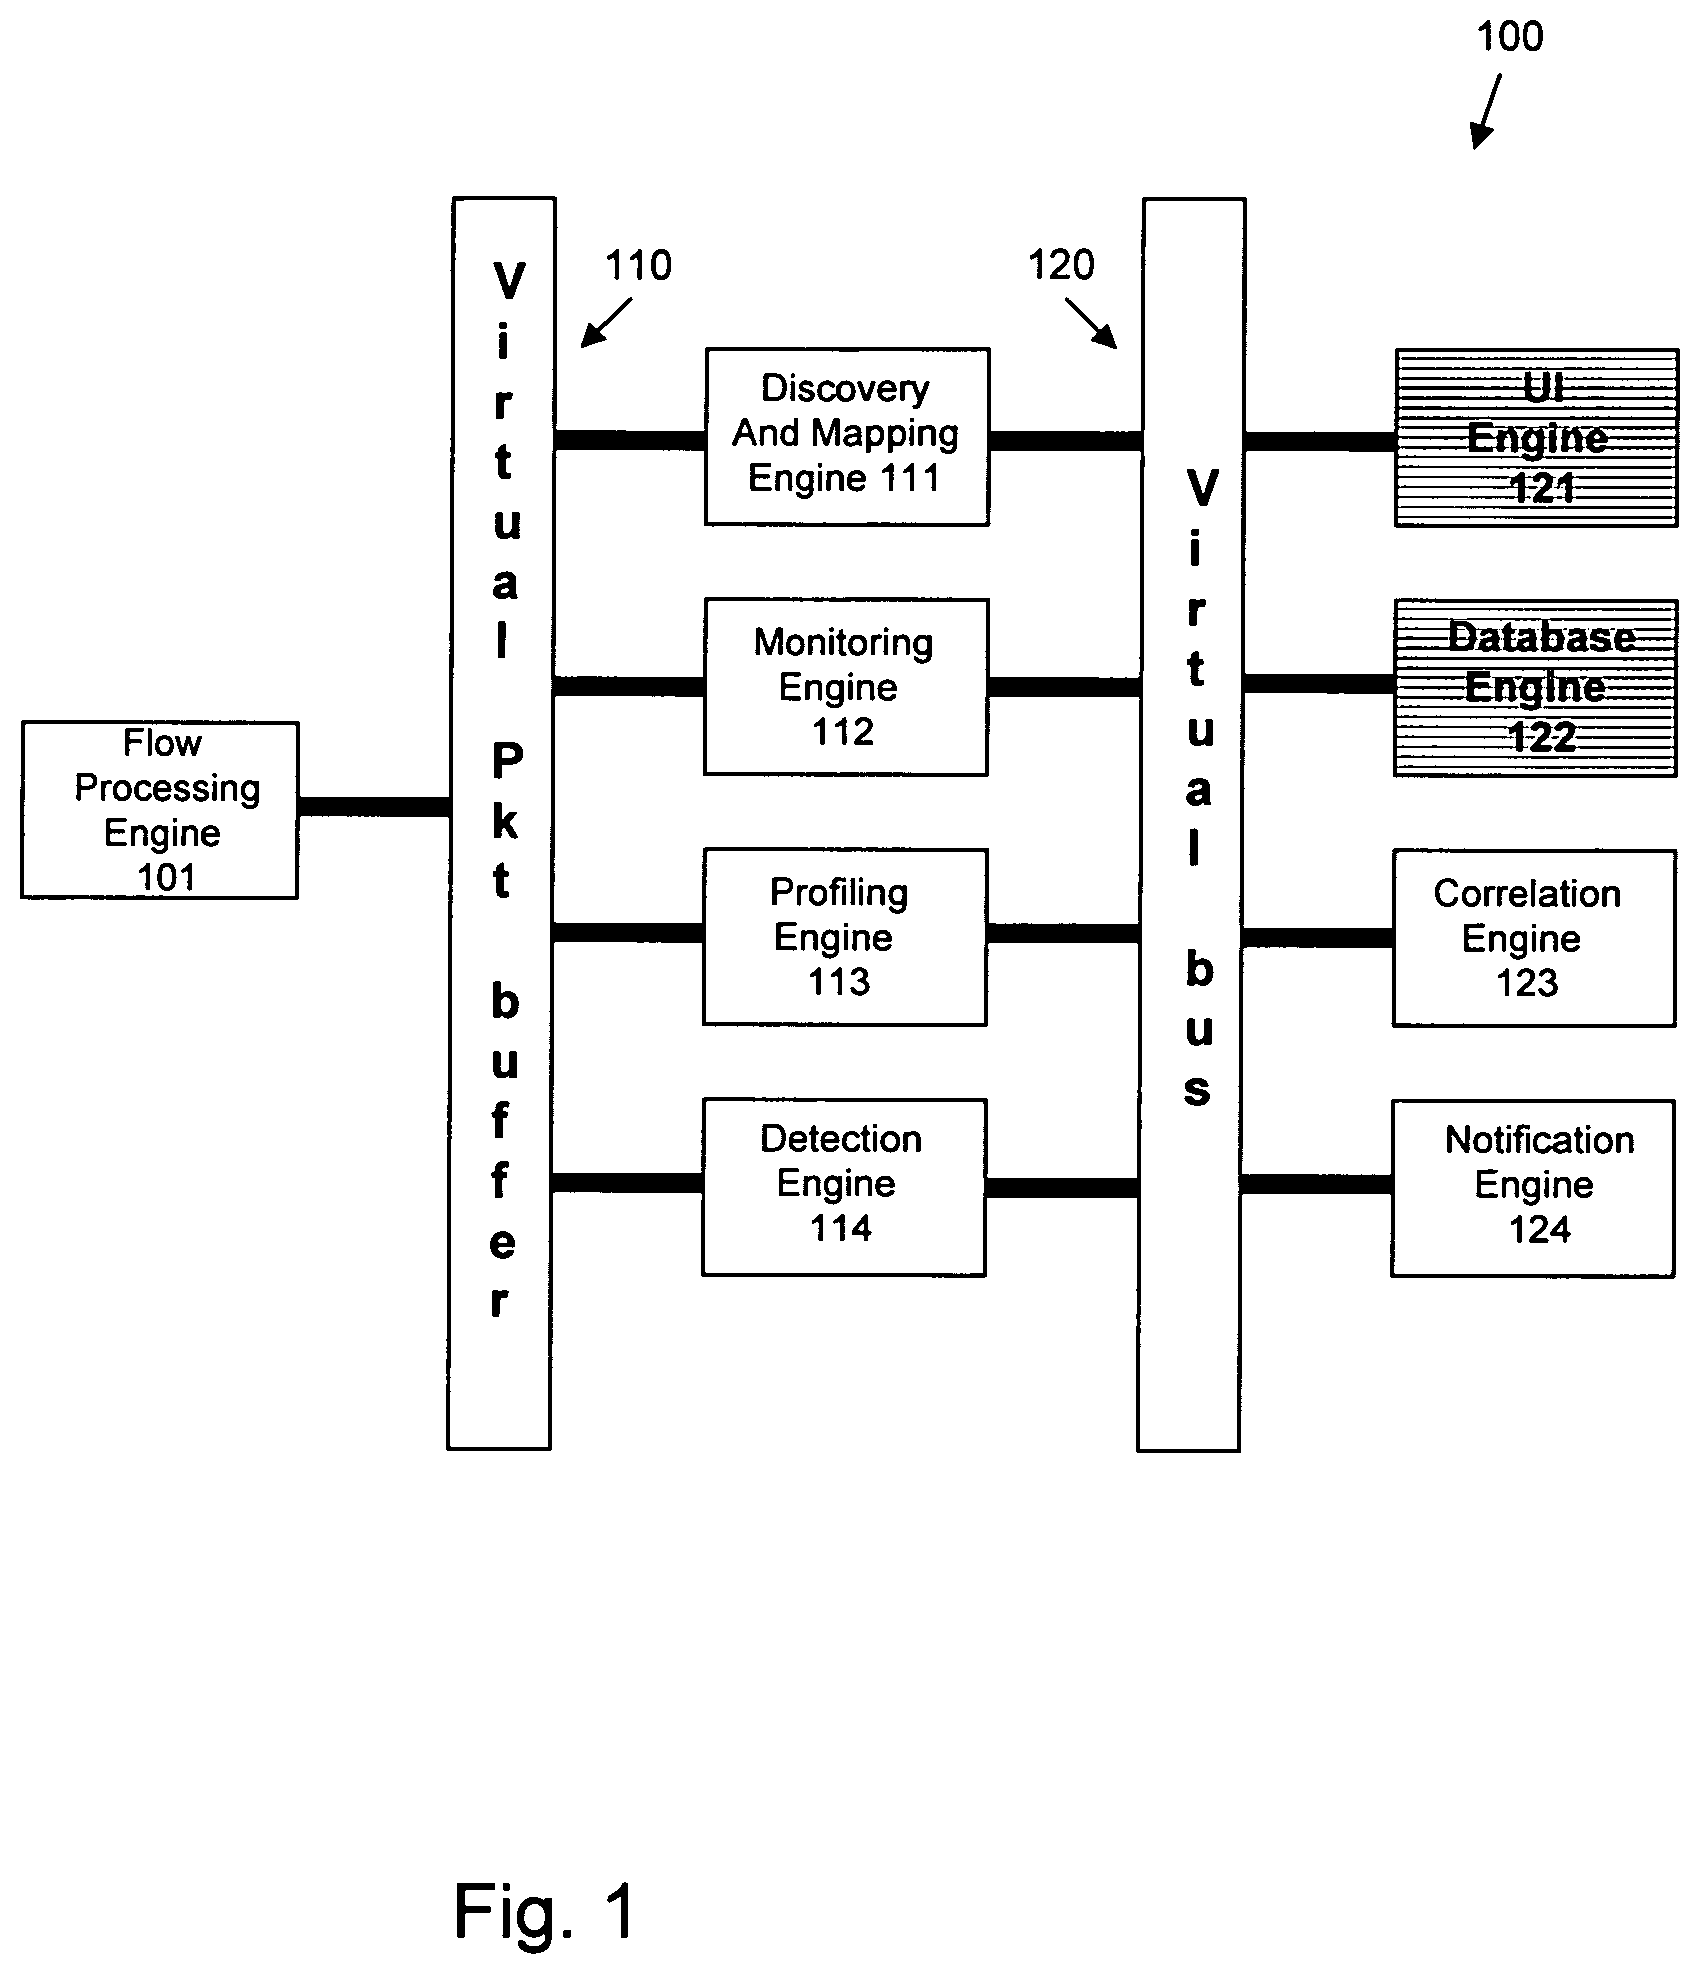
FIG. 1 shows a conceptual diagram of a system.
A system 100 includes elements as shown in the FIG. 1, including a flow processing engine 101, a virtual packet buffer no, a discovery and mapping engine 11, a monitoring engine 112, a profiling engine 113, a detection engine 114, a virtual bus 120, a UI engine 121, a database engine 122, a correlation engine 123, and a notification engine 124.
The system 100 operates as described in the Incorporated Disclosure, which describes in further and other detail at least the operation of these elements. In particular, the Incorporated Disclosure describes in further and other detail multiple phases of operation of the system 100.
In particular, the Incorporated Disclosure describes in further and other detail, at least the following: how the flow processing engine 101 receives monitoring information; how the virtual packet buffer 110 segregates that monitoring information into virtual packets having a (simulated) relatively uniform time spacing; how the discovery and mapping engine in discovers IP addresses, application ports, subnets, interfaces and performance probes, in response to monitoring information; how the discovery and mapping engine 111 maps those IP addresses to endpoints, those application ports to applications, those subnets to locations, and those interfaces to flow interfaces; how the monitoring engine 112 reports bandwidth plots and other useful information relating to selected endpoints, applications, locations, and flow interfaces; how the profiling engine 113 and detection engine 114 provide detection of symptoms associated with endpoints, in response to the monitoring engine 112; how the virtual bus 120 gathers and distributes information between and among elements of the system 100; how the correlation engine 123 correlates symptoms to infer events and to manage those actions of discovery, profiling, and correlation; and how the notification engine 124 informs network personnel of substantially important information.
The UI engine 121 and the database engine 122 provide network personnel for live viewing and recording, and later playback and sharing, of information relating to the operation of the system 100. For example and without limitation, such information might include recordings of endpoints, applications, locations, and flow interfaces, as well as applicable pairs or triplets thereof. After reading this application, those skilled in the art will note that the information maintained by the database engine 122 is sufficient to replay, as if "live", system problems as if they were occurring, and with the added feature of being able to review particular endpoints (and the like), and pairs and triplets thereof, during the replay of those system problems, even though network personnel might not have thought to include presentation of that information, or might not have had access to that information, at the time of the original system problem. Thus, the system 100 provides not just the ability to view and record system operation, but also provides the ability to enhance those recordings of system operation with then-current information that was not, in fact, then-available to network personnel.
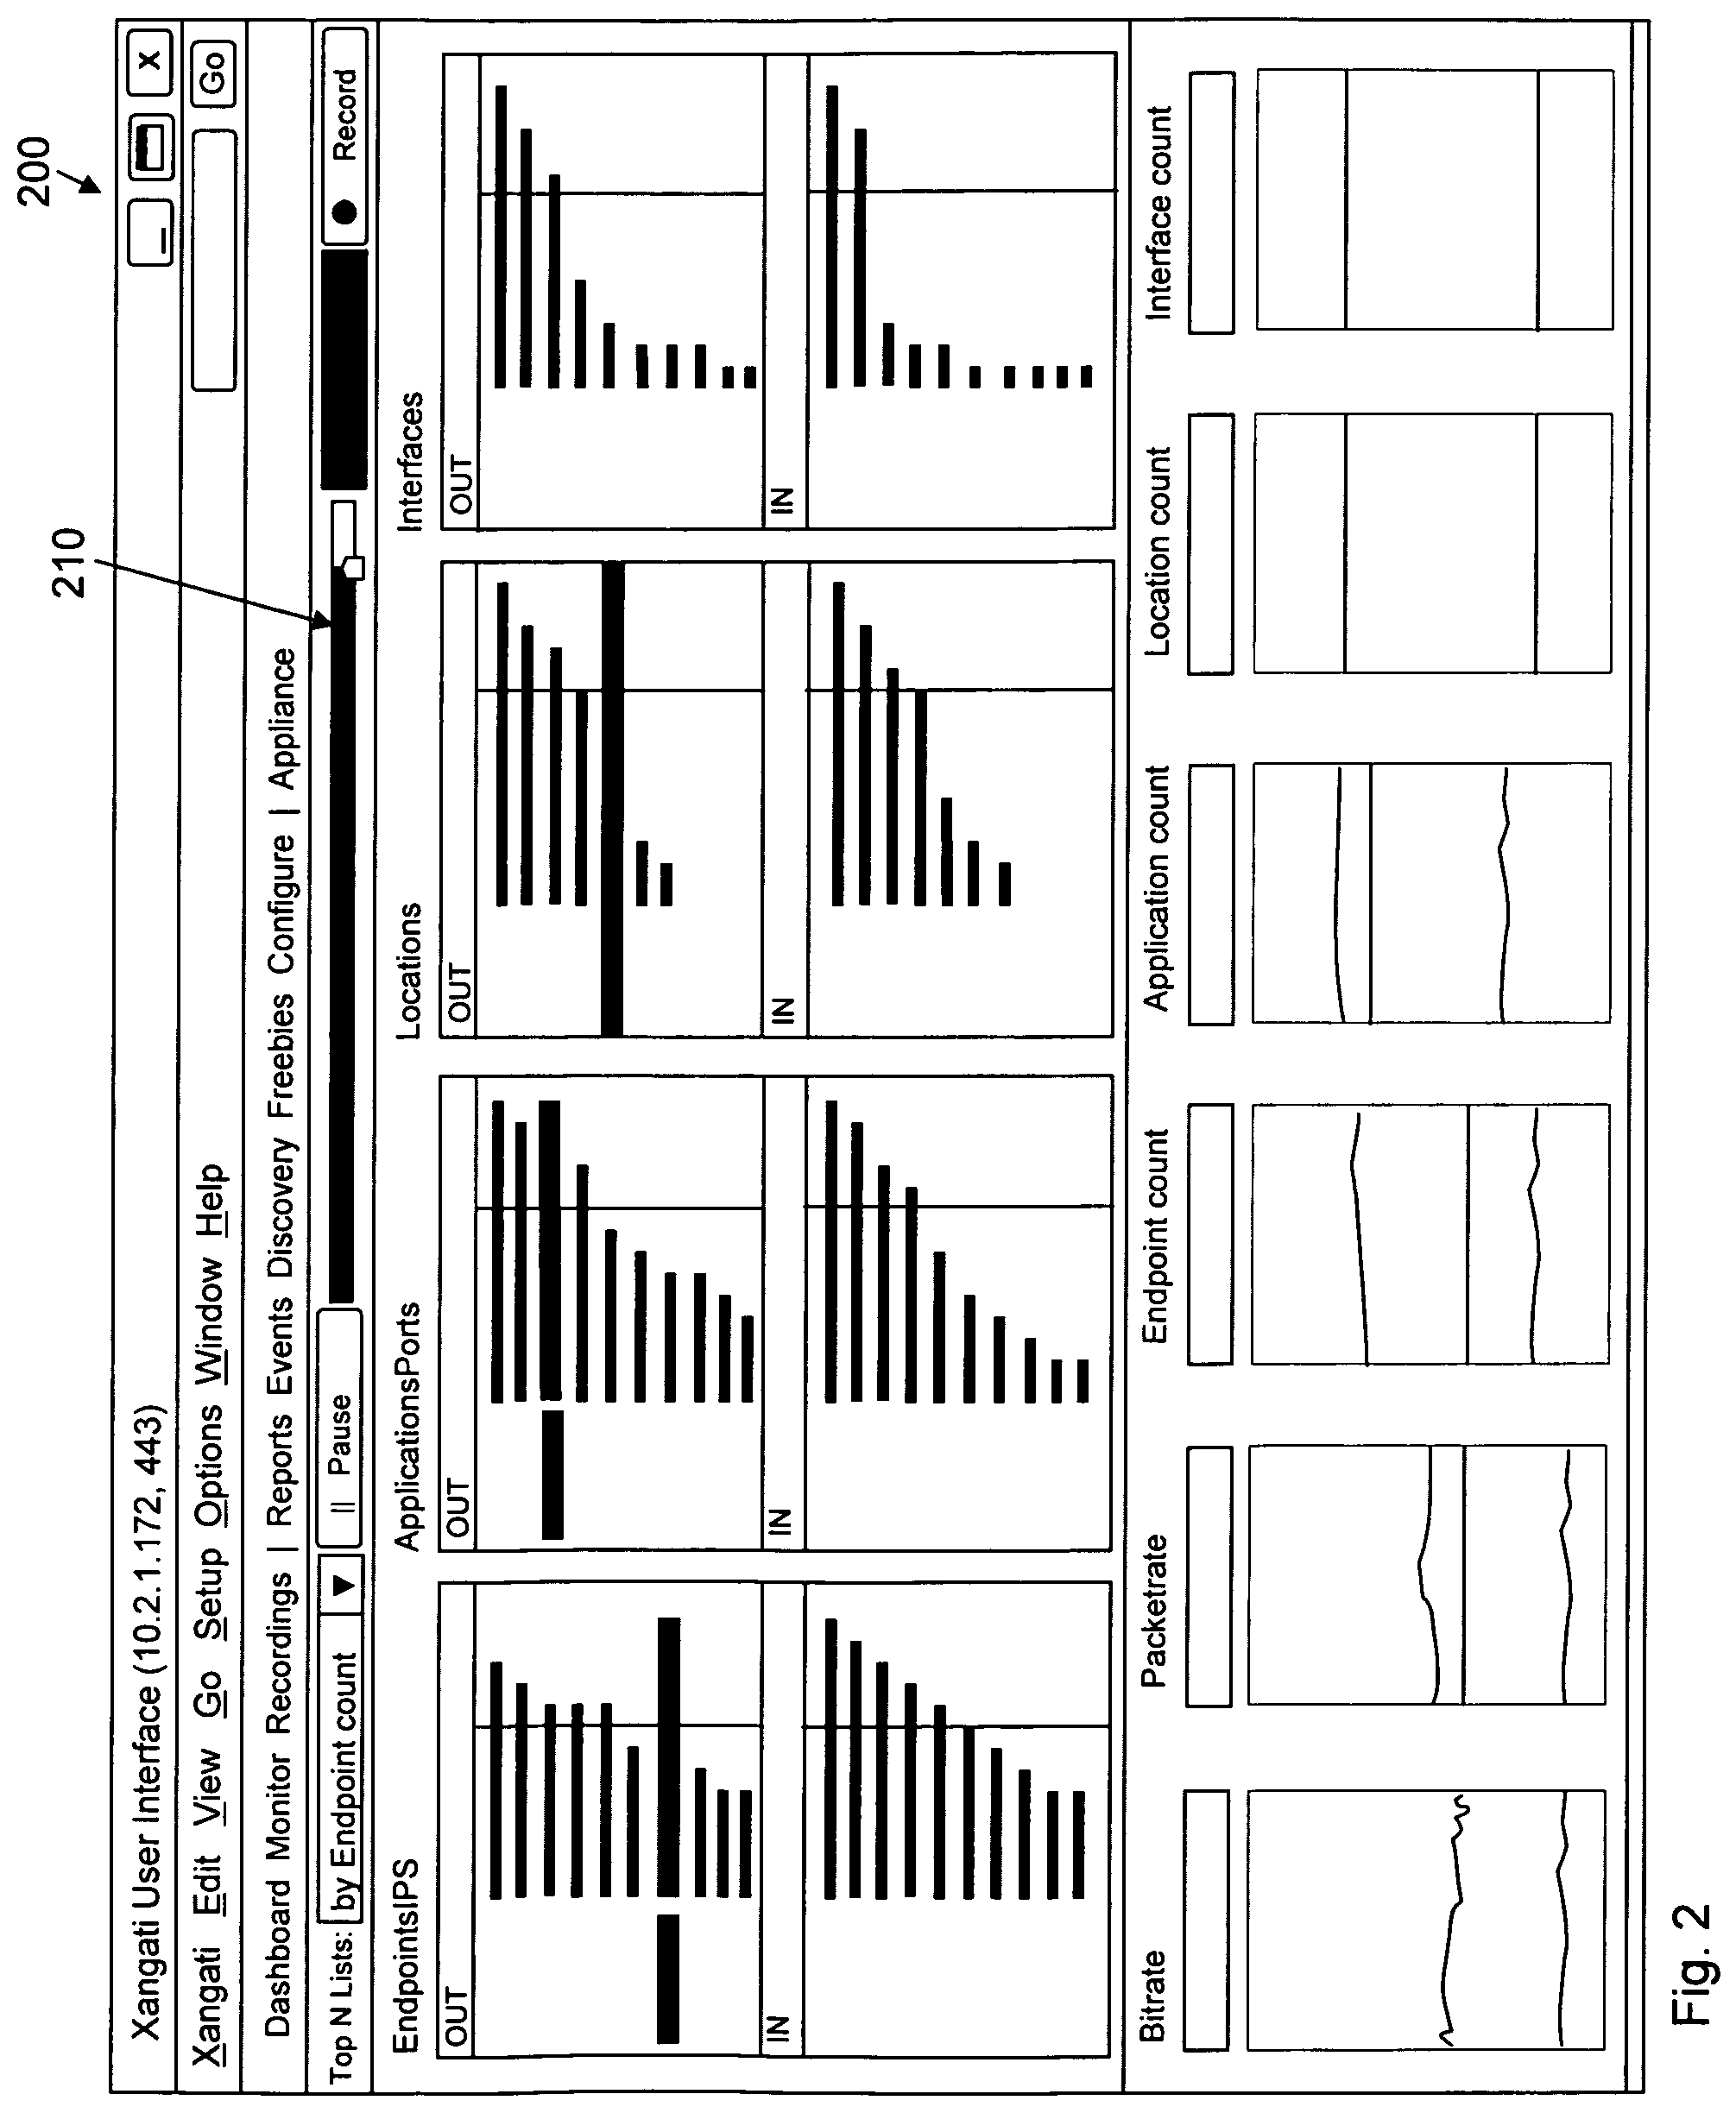
FIG. 2
FIG. 2 shows a conceptual diagram of a portion of a user interface.
A user interface 200 includes at least a network slider bar 210, which provides network personnel with the ability to pause, back up, replay, fast forward, and other functions, with respect to a network monitoring view, whether that network monitoring view is one relating to a current state of the system 100 or one relating to a past state of the system 100.
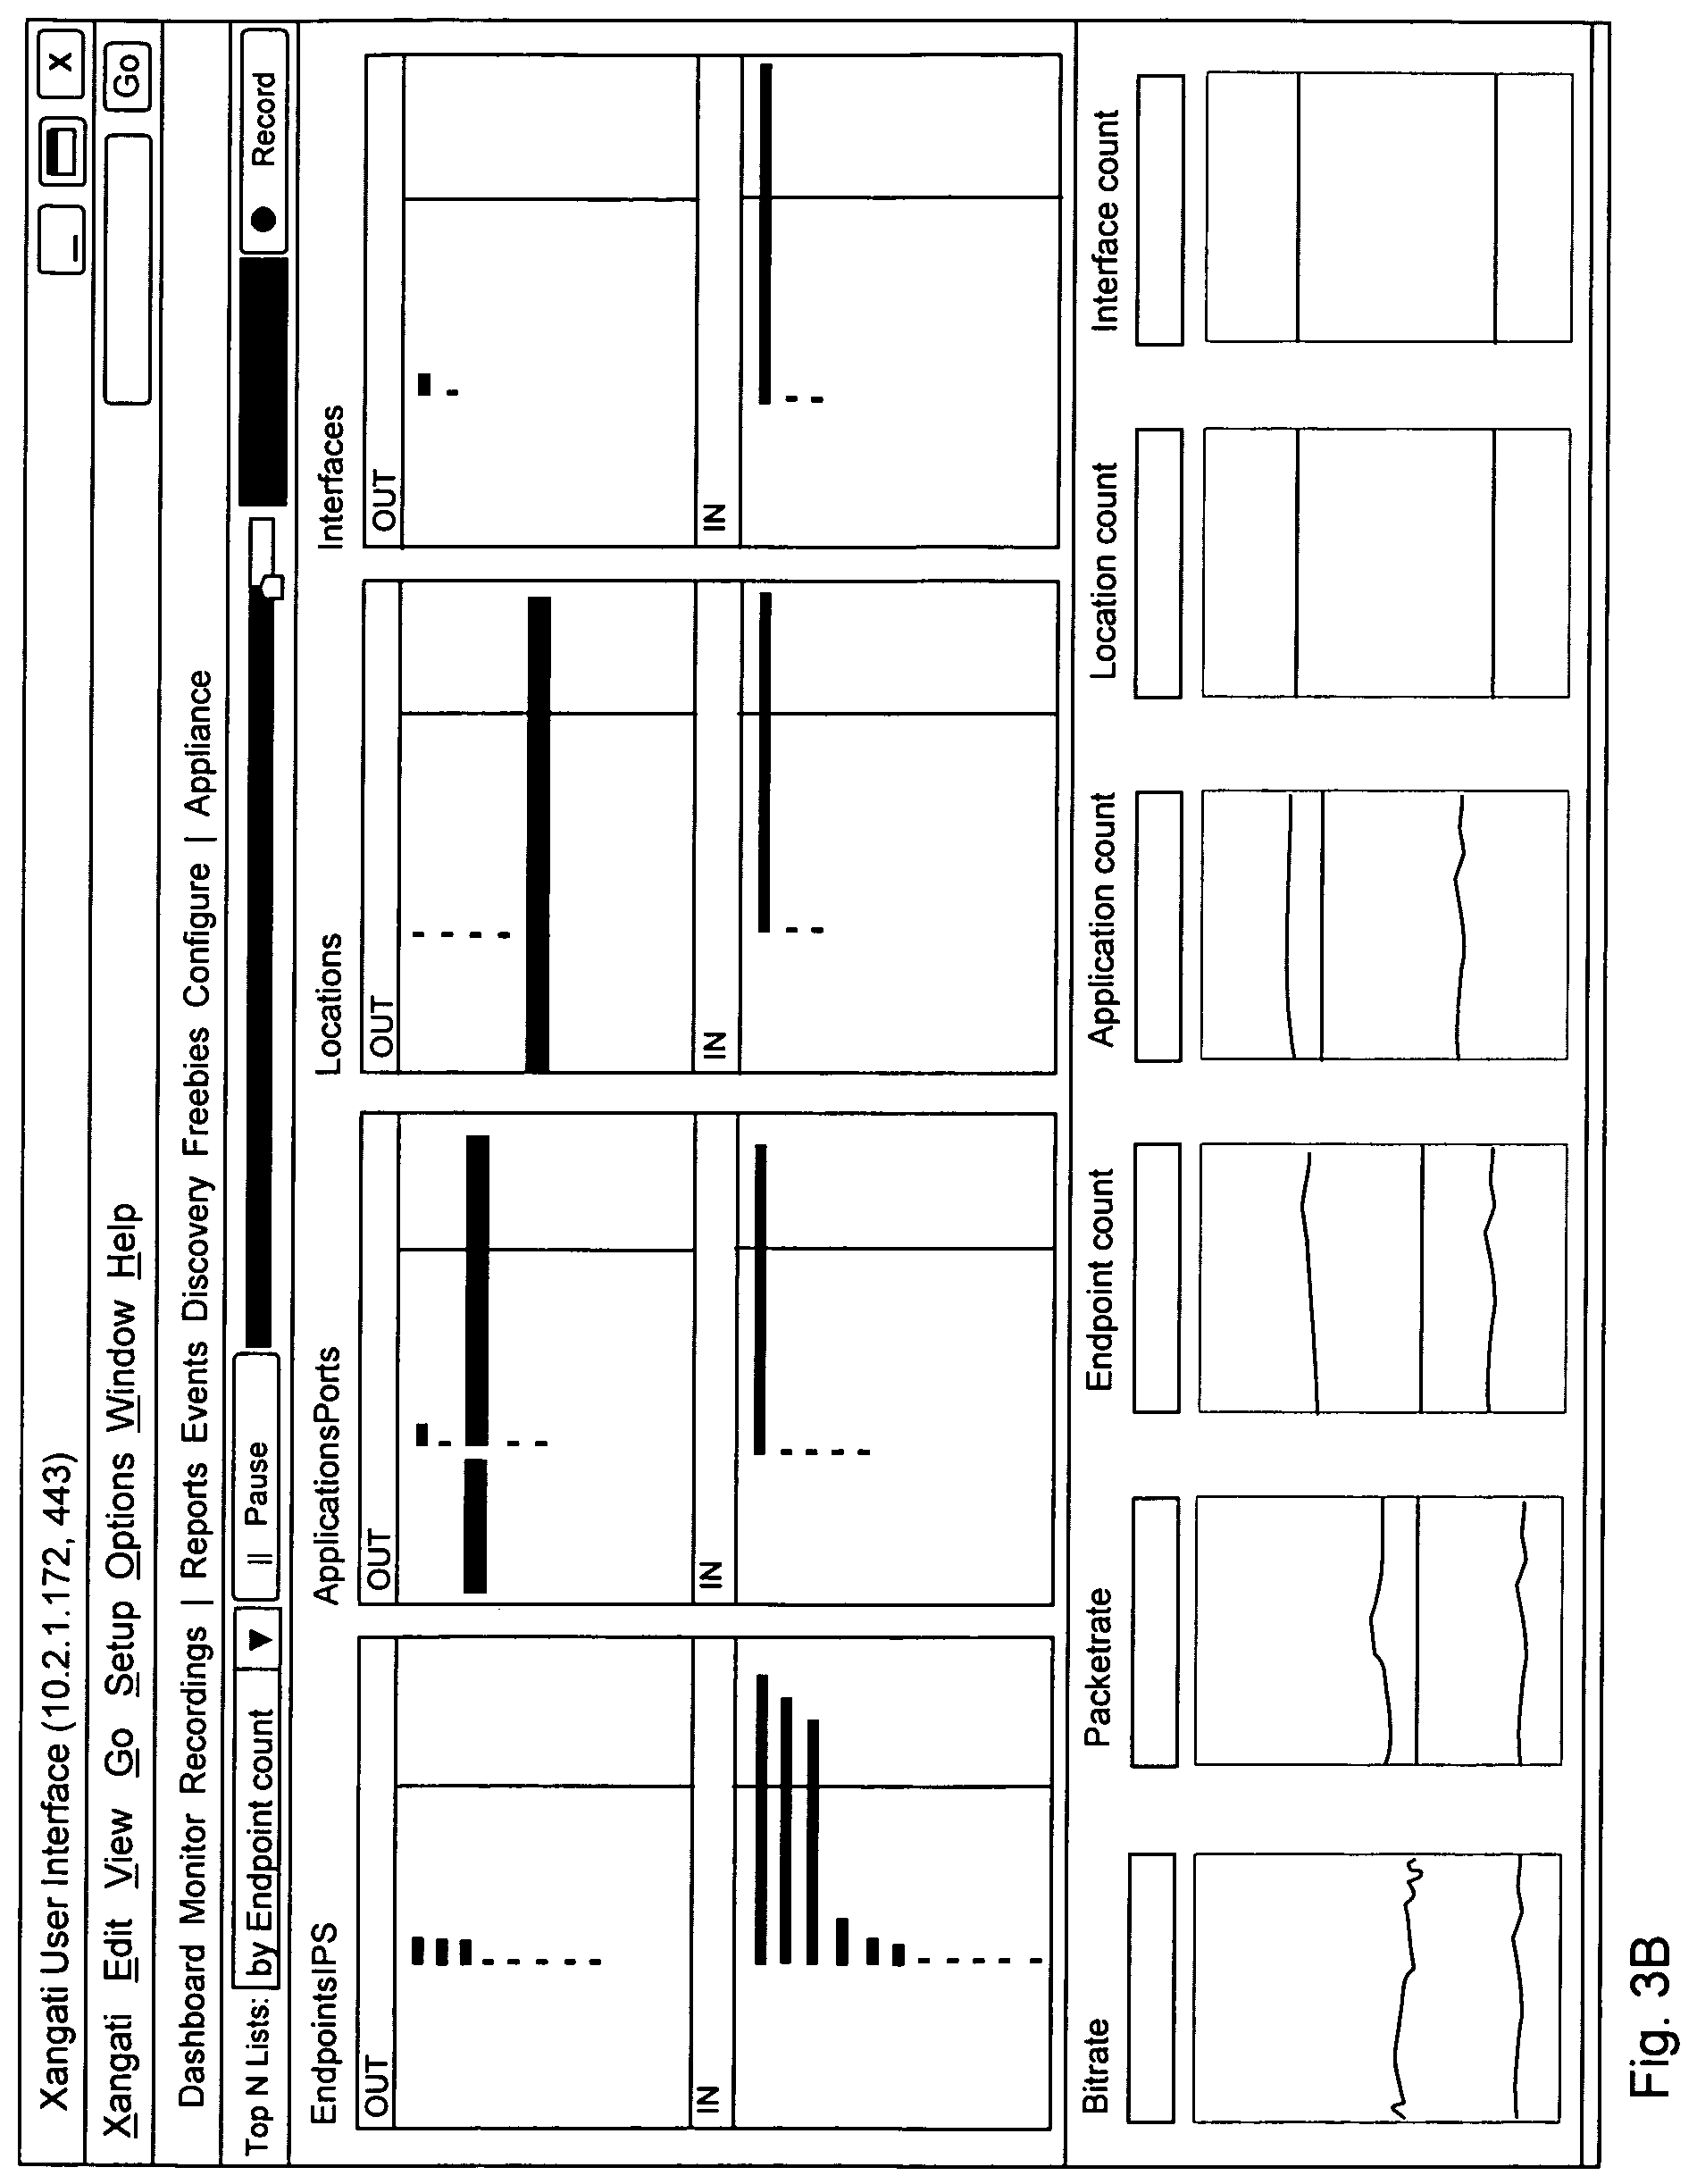
The user interface 200 also includes a set of (optionally multiple) views of information relating to the system 100. For example and without limitation, these views might include: an "entire network view", including without limitation, substantially at least some of the following information: (1) a bi-directional view of a set of Top-N endpoints, applications, locations and interfaces that can be viewed by bandwidth, by related endpoints, by bandwidth change and by related endpoint change. In one embodiment, this information might be updated every 10 seconds; and (2) a set of information relating to bi-directional trends of endpoint count, application count, location count and interface count as well as bit-rate and packet-rate. In one embodiment, this information might be updated every second.
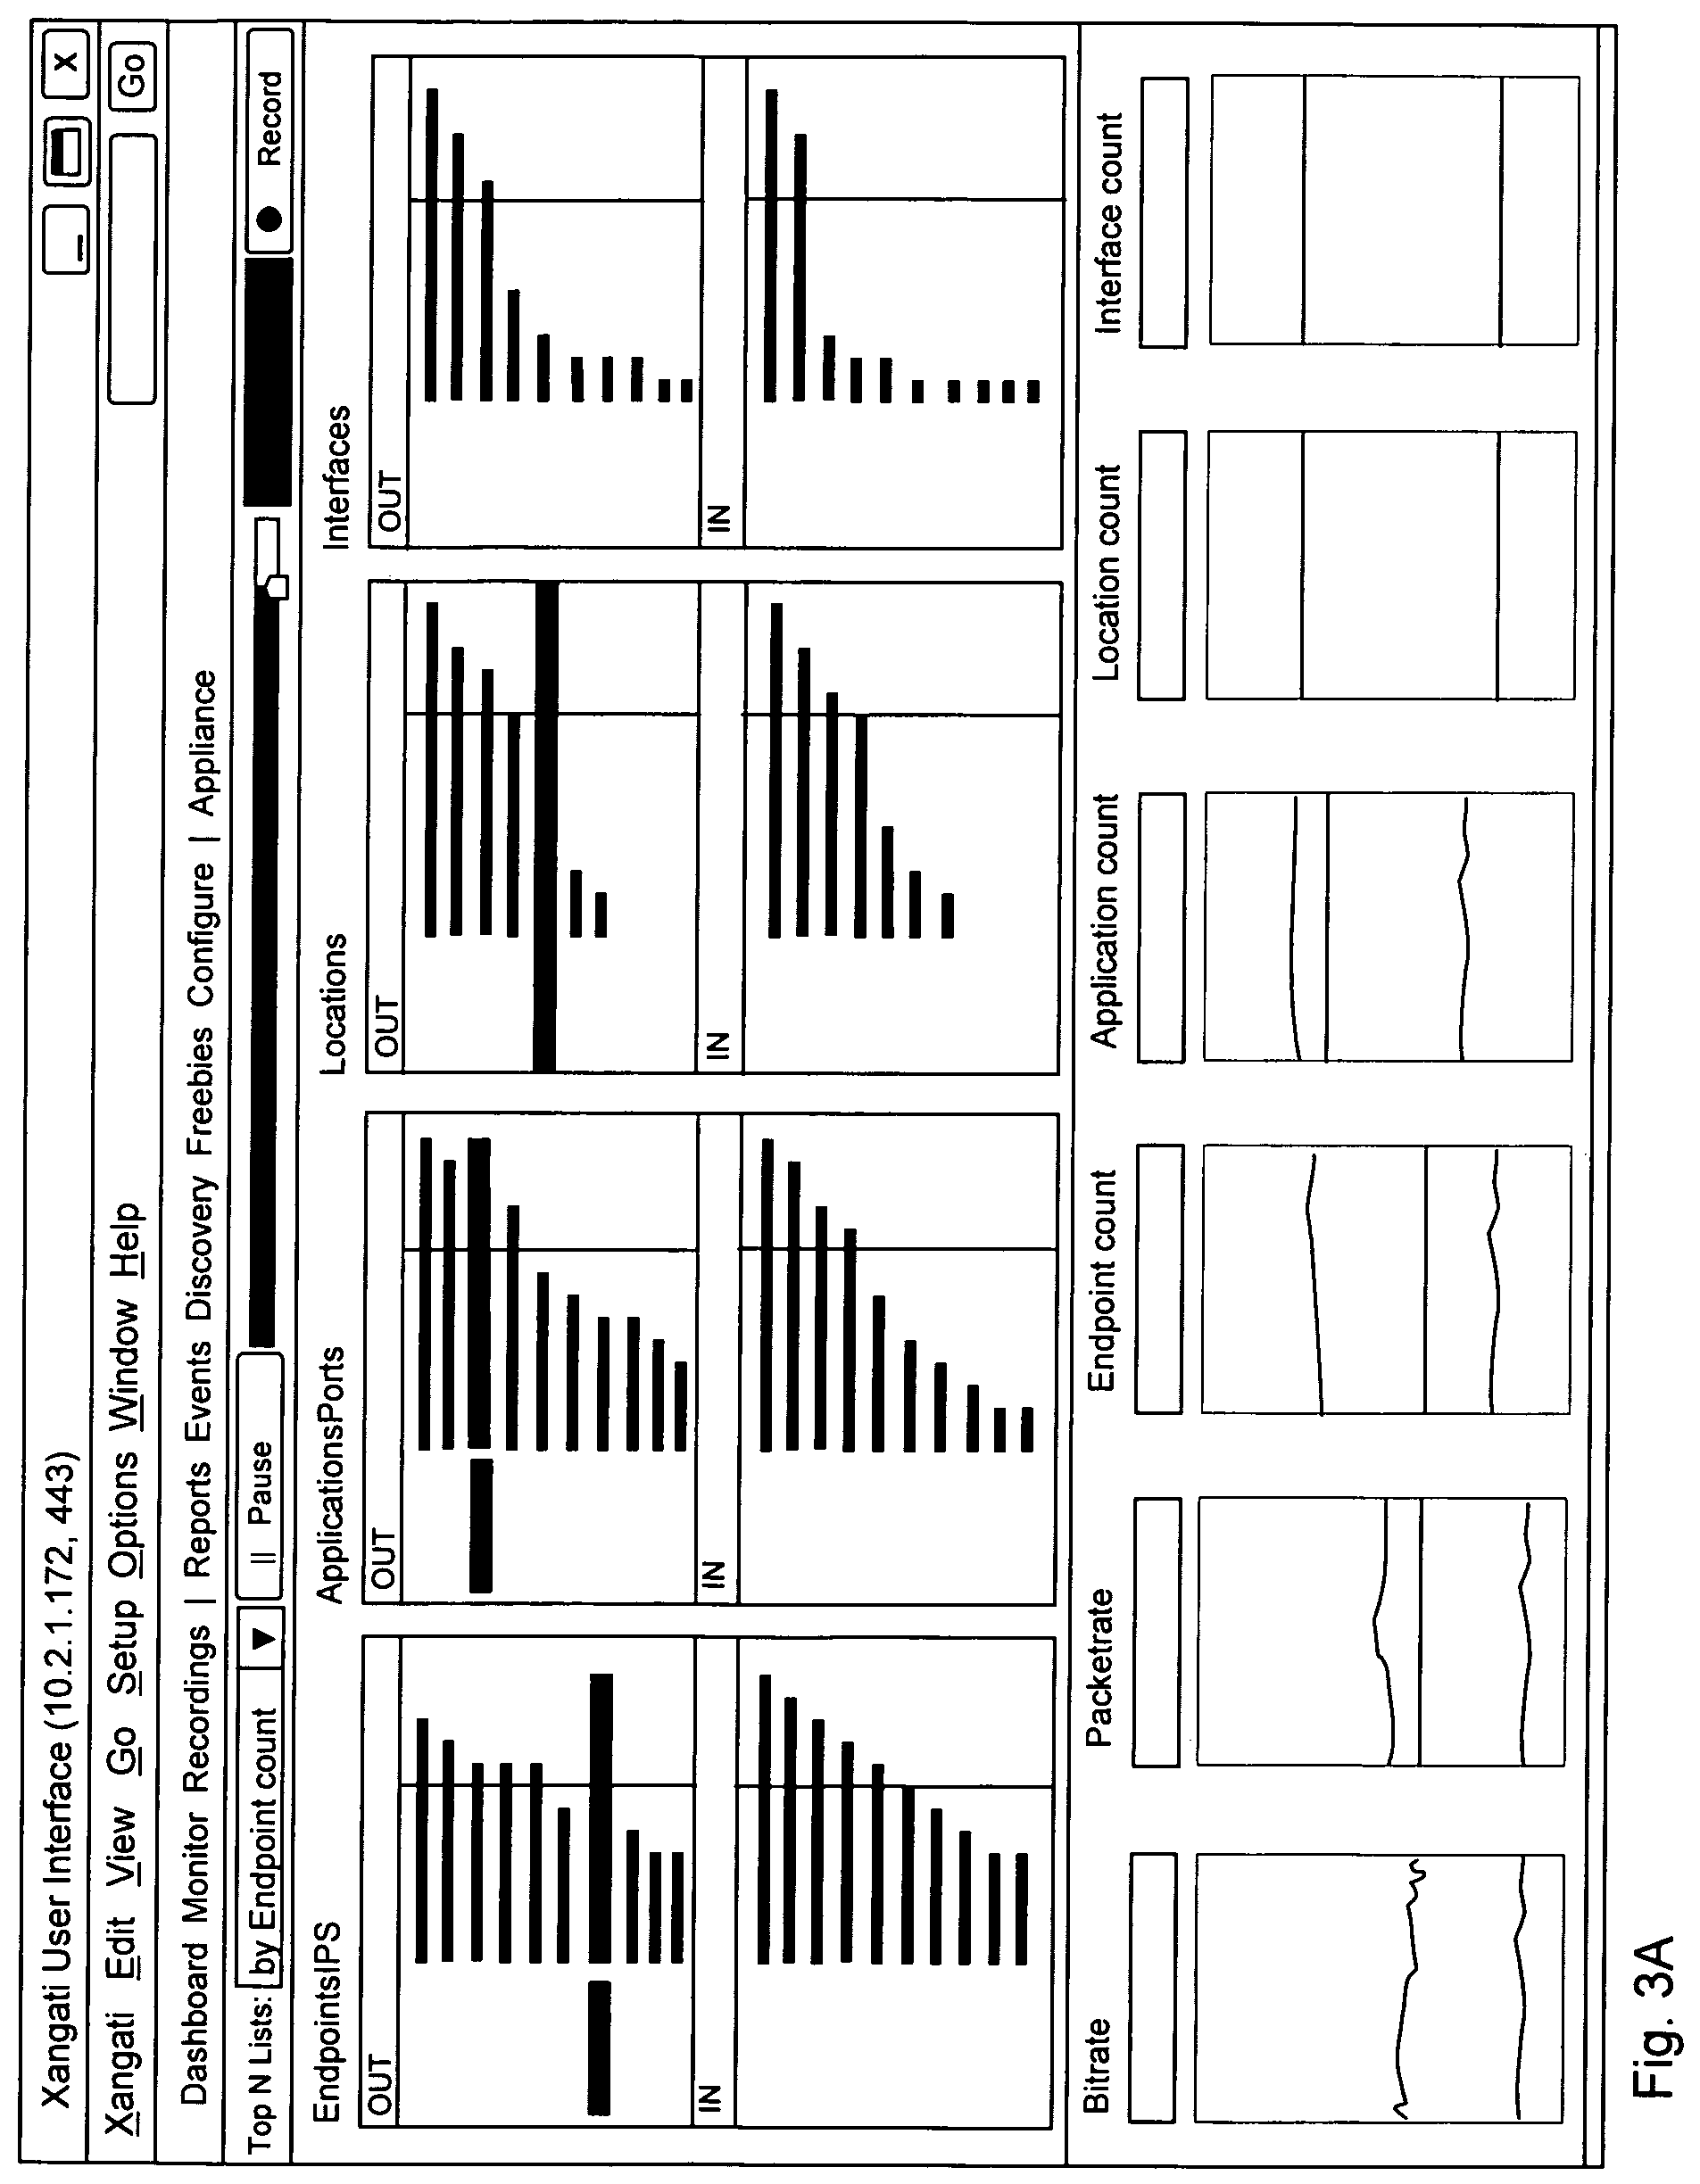
FIG. 3A and FIG. 3B show examples of an "entire network view".
For a first example and without limitation, data for the entire network view might be generated by the monitoring engine 112, published using the virtual bus 120, and consumed directly by the UI engine 121.
For a second example and without limitation, data for the entire network view might be generated by the monitoring engine 112, published using the virtual bus 120, and recorded by the database engine 122 for later use.
For a third example and without limitation, data for the entire network view might be generated by the monitoring engine 112, published using the virtual bus 120, and consumed by the correlation engine 123, such as to determine correlations of interest to network administrators.
For a fourth example and without limitation, data for the entire network view might be generated by the monitoring engine 112, published using the virtual bus 120, and consumed by the notification engine 124, which might itself make use of the UI engine 121 to present notifications to network administrators or other personnel.
The user interface 200 also includes a set of (optionally multiple) views of information relating to portions of the system 100, not equal to the entire system 100. For example and without limitation, these views might include: an "object-specific view", including without limitation, substantially at least some of the information as described above with respect to the "entire network view", but limited to a selected object or set of objects; a "pairwise context view", including without limitation, substantially at least some of the information as described above with respect to the "entire network view", but limited to a pair of objects; a "multi-level context view", including without limitation, substantially at least some of the information as described above with respect to the "entire network view", but limited to a sets of objects considered as tuples, e.g., triplets of objects.
Further and other specific information that might be collected by the monitoring engine 112 is described in further and other detail in the Incorporated Disclosures, described below, and hereby incorporated by reference as if fully set forth herein.
Visual Trouble Tickets
As noted above, network monitoring views can be manipulated by network administrators (or other authorized personnel) using a network slider bar 210 (described above with respect to the FIG. 2). The network slider bar 210 provides network personnel with the ability to pause, back up, replay, fast forward, and other functions, with respect to a network monitoring view, whether that network monitoring view is one relating to a current state of the system 100 or one relating to a past state of the system 100.
When a user (or administrator, or other authorized personnel), identifies a problem, it might be desirable for that user to report the problem using a "trouble ticket", i.e., a report to network administrators of the existence of the problem, and some preferably detailed description of how the problem occurred and what the problem caused. In one embodiment, the user can send the associated network monitoring data, which thus identifies the problem using a "visual" trouble ticket. For example and without limitation, a "visual" trouble ticket might allow a recipient to re-view (possibly over and over) the problem as it occurred in "real time" (i.e., a simulation thereof), with the effect that users can visualize and trouble-shoot operation of the network "as if" the problem were unfolding before them in "real time".
Sharing Recordings
Similarly to visual trouble tickets, a user might find it desirable for to share a network monitoring view of a past state of the system, with the effect that a recipient would be able to re-view (possibly over and over) the past state as it occurred in "real time" (i.e., a simulation thereof), with the effect that users can visualize and trouble-shoot operation of the network "as if" the problem were unfolding before them in "real time".
For example and without limitation, a user or a recipient might have interest in one or more of, or some combination or conjunction of, the following:
a particular behavior of the network, which might or might not adequately adhere to a specification of the network approved by management;
a particular behavior of the network, which might or might not reflect the existence of a software anomaly or a software bug in network management;
a particular behavior of the network, which might be useful as evidence of behavior of the network during some past time epoch--for example and without limitation, the particular behavior of the network might be evidence of manipulation of the network by an unauthorized party; a particular behavior of the network, which might be useful to identify a change in network behavior with addition (or deletion) of a selected feature or a selected software routine.
For example and without limitation, in each such case the user can send the associated network monitoring data, which thus identifies the problem in a way that might allow a recipient to replay the behavior of the network "as if" that behavior were occurring in "real time".
Generality of Invention
This application should be read in the most general possible form. This includes, without limitation, the following: References to specific techniques include alternative and more general techniques, especially when discussing aspects of the invention, or how the invention might be made or used. References to "preferred" techniques generally mean that the inventor contemplates using those techniques, and thinks they are best for the intended application. This does not exclude other techniques for the invention, and does not mean that those techniques are necessarily essential or would be preferred in all circumstances. References to contemplated causes and effects for some implementations do not preclude other causes or effects that might occur in other implementations. References to reasons for using particular techniques do not preclude other reasons or techniques, even if completely contrary, where circumstances would indicate that the stated reasons or techniques are not as applicable.
The invention is not limited to the specifics of any particular embodiments and examples disclosed herein. Many other variations are possible which remain within the content, scope and spirit of the invention, and these variations would become clear to those skilled in the art after perusal of this application.
Alternative Embodiments
After reading this application, those skilled in the art would recognize that the scope and spirit of the invention includes other and further embodiments beyond the specifics of those disclosed herein, and that such other and further embodiments would not require new invention or undue experimentation.
* * * * *
References
D00000
D00001
D00002
D00003
D00004
XML
uspto.report is an independent third-party trademark research tool that is not affiliated, endorsed, or sponsored by the United States Patent and Trademark Office (USPTO) or any other governmental organization. The information provided by uspto.report is based on publicly available data at the time of writing and is intended for informational purposes only.
While we strive to provide accurate and up-to-date information, we do not guarantee the accuracy, completeness, reliability, or suitability of the information displayed on this site. The use of this site is at your own risk. Any reliance you place on such information is therefore strictly at your own risk.
All official trademark data, including owner information, should be verified by visiting the official USPTO website at www.uspto.gov. This site is not intended to replace professional legal advice and should not be used as a substitute for consulting with a legal professional who is knowledgeable about trademark law.