Doped scandia stabilized zirconia electrolyte compositions
Miller , et al. April 13, 2
U.S. patent number 10,978,726 [Application Number 16/406,961] was granted by the patent office on 2021-04-13 for doped scandia stabilized zirconia electrolyte compositions. This patent grant is currently assigned to BLOOM ENERGY CORPORATION. The grantee listed for this patent is BLOOM ENERGY CORPORATION. Invention is credited to Tad Armstrong, John T S Irvine, David N. Miller, Cristian Savaniu.


View All Diagrams
| United States Patent | 10,978,726 |
| Miller , et al. | April 13, 2021 |
Doped scandia stabilized zirconia electrolyte compositions
Abstract
A solid oxide fuel cell (SOFC) electrolyte composition includes zirconia stabilized with scandia, and at least one of magnesia, zinc oxide, indium oxide, and gallium oxide, and optionally ceria in addition to the oxides above.
| Inventors: | Miller; David N. (St. Andrews, GB), Savaniu; Cristian (St. Andrews, GB), Irvine; John T S (St. Andrews, GB), Armstrong; Tad (Burlingame, CA) | ||||||||||
|---|---|---|---|---|---|---|---|---|---|---|---|
| Applicant: |
|
||||||||||
| Assignee: | BLOOM ENERGY CORPORATION (San
Jose, CA) |
||||||||||
| Family ID: | 1000005487221 | ||||||||||
| Appl. No.: | 16/406,961 | ||||||||||
| Filed: | May 8, 2019 |
Prior Publication Data
| Document Identifier | Publication Date | |
|---|---|---|
| US 20190312294 A1 | Oct 10, 2019 | |
Related U.S. Patent Documents
| Application Number | Filing Date | Patent Number | Issue Date | ||
|---|---|---|---|---|---|
| 15340625 | Nov 1, 2016 | 10381673 | |||
| 14083708 | Dec 6, 2016 | 9515344 | |||
| 61792699 | Mar 15, 2013 | ||||
| 61728270 | Nov 20, 2012 | ||||
| Current U.S. Class: | 1/1 |
| Current CPC Class: | H01M 8/1253 (20130101); H01M 2008/1293 (20130101); Y02E 60/50 (20130101); Y02P 70/50 (20151101) |
| Current International Class: | H01M 8/1253 (20160101); H01M 8/124 (20160101) |
References Cited [Referenced By]
U.S. Patent Documents
| 4052532 | October 1977 | Tannenberger et al. |
| 4272353 | June 1981 | Lawrance et al. |
| 4426269 | January 1984 | Brown et al. |
| 4459340 | July 1984 | Mason |
| 4575407 | March 1986 | Diller |
| 4686158 | August 1987 | Nishi et al. |
| 4791079 | December 1988 | Hazbun |
| 4792502 | December 1988 | Trocciola et al. |
| 4804592 | February 1989 | Vanderborgh et al. |
| 4847173 | July 1989 | Mitsunaga et al. |
| 4898792 | February 1990 | Singh et al. |
| 4913982 | April 1990 | Kotchick et al. |
| 4917971 | April 1990 | Farooque |
| 4925745 | May 1990 | Remick et al. |
| 4983471 | January 1991 | Reichner et al. |
| 5034287 | July 1991 | Kunz |
| 5047299 | September 1991 | Shockling |
| 5143800 | September 1992 | George et al. |
| 5162167 | November 1992 | Minh et al. |
| 5169730 | December 1992 | Reichner et al. |
| 5170124 | December 1992 | Blair et al. |
| 5171645 | December 1992 | Khandkar |
| 5192334 | March 1993 | Rohr et al. |
| 5213910 | May 1993 | Yamada |
| 5215946 | June 1993 | Minh |
| 5256499 | October 1993 | Minh et al. |
| 5273837 | December 1993 | Aiken et al. |
| 5290323 | March 1994 | Okuyama et al. |
| 5290642 | March 1994 | Minh et al. |
| 5302470 | April 1994 | Okada et al. |
| 5342705 | August 1994 | Minh et al. |
| 5368667 | November 1994 | Minh et al. |
| 5441821 | August 1995 | Merritt et al. |
| 5498487 | March 1996 | Ruka et al. |
| 5501914 | March 1996 | Satake et al. |
| 5505824 | April 1996 | McElroy |
| 5518829 | May 1996 | Satake et al. |
| 5527631 | June 1996 | Singh et al. |
| 5573867 | November 1996 | Zafred et al. |
| 5589017 | December 1996 | Minh |
| 5589285 | December 1996 | Cable et al. |
| 5601937 | February 1997 | Isenberg |
| 5686196 | November 1997 | Singh et al. |
| 5688609 | November 1997 | Rostrup-Nielsen et al. |
| 5733675 | March 1998 | Dederer et al. |
| 5741406 | April 1998 | Barnett et al. |
| 5741605 | April 1998 | Gillett et al. |
| 5922488 | July 1999 | Marucchi-Soos et al. |
| 5942349 | August 1999 | Badwal et al. |
| 5955039 | September 1999 | Dowdy |
| 5993989 | November 1999 | Baozhen et al. |
| 6013385 | January 2000 | DuBose |
| 6051125 | April 2000 | Pham et al. |
| 6106964 | August 2000 | Voss et al. |
| 6228521 | May 2001 | Kim et al. |
| 6238816 | May 2001 | Cable et al. |
| 6280865 | August 2001 | Eisman et al. |
| 6287716 | September 2001 | Hashimoto et al. |
| 6329090 | December 2001 | McElroy et al. |
| 6361892 | March 2002 | Ruhl et al. |
| 6403245 | June 2002 | Hunt |
| 6436562 | August 2002 | DuBose |
| 6451466 | September 2002 | Grasso et al. |
| 6489050 | December 2002 | Ruhl et al. |
| 6495279 | December 2002 | Bogicevic et al. |
| 6558831 | May 2003 | Doshi et al. |
| 6582845 | June 2003 | Helfinstine et al. |
| 6592965 | July 2003 | Gordon |
| 6605316 | August 2003 | Visco |
| 6623880 | September 2003 | Geisbrecht et al. |
| 6677070 | January 2004 | Kearl |
| 6682842 | January 2004 | Visco et al. |
| 6767662 | July 2004 | Jacobson et al. |
| 6787261 | September 2004 | Ukai |
| 6803141 | October 2004 | Pham et al. |
| 6811913 | November 2004 | Ruhl |
| 6821663 | November 2004 | McElroy et al. |
| 6854688 | February 2005 | McElroy et al. |
| 6924053 | August 2005 | McElroy |
| 6972161 | December 2005 | Beatty et al. |
| 6979511 | December 2005 | Visco et al. |
| 7150927 | December 2006 | Hickey et al. |
| 7157173 | January 2007 | Kwon |
| 7255956 | August 2007 | McElroy et al. |
| 7494732 | February 2009 | Roy et al. |
| 7550217 | June 2009 | Kwon et al. |
| 7563503 | July 2009 | Gell et al. |
| 7601183 | October 2009 | Larsen |
| 8580456 | November 2013 | Armstrong et al. |
| 9515344 | December 2016 | Miller et al. |
| 2001/0049035 | December 2001 | Haltiner, Jr. et al. |
| 2002/0012825 | January 2002 | Sasahara et al. |
| 2002/0014417 | February 2002 | Kuehnle et al. |
| 2002/0028362 | March 2002 | Prediger et al. |
| 2002/0028367 | March 2002 | Sammes et al. |
| 2002/0058175 | May 2002 | Ruhl |
| 2002/0098406 | July 2002 | Huang et al. |
| 2002/0106544 | August 2002 | Noetzel et al. |
| 2002/0127455 | September 2002 | Pham et al. |
| 2002/0132156 | September 2002 | Ruhl et al. |
| 2003/0152067 | August 2003 | McElroy |
| 2003/0165732 | September 2003 | McElroy |
| 2003/0196893 | October 2003 | McElroy et al. |
| 2004/0081859 | April 2004 | McElroy et al. |
| 2004/0191595 | September 2004 | McElroy et al. |
| 2004/0191597 | September 2004 | McElroy |
| 2004/0191598 | September 2004 | Gottmann et al. |
| 2004/0202914 | October 2004 | Sridhar et al. |
| 2004/0224193 | November 2004 | Mitlitsky et al. |
| 2004/0229031 | November 2004 | Gell et al. |
| 2004/0265484 | December 2004 | Pham et al. |
| 2004/0265663 | December 2004 | Badding et al. |
| 2005/0048334 | March 2005 | Sridhar et al. |
| 2005/0074650 | April 2005 | Sridhar et al. |
| 2005/0164051 | July 2005 | Venkataraman et al. |
| 2005/0214616 | September 2005 | Kumar et al. |
| 2005/0227134 | October 2005 | Nguyen |
| 2005/0271919 | December 2005 | Hata et al. |
| 2006/0008682 | January 2006 | McLean et al. |
| 2006/0040168 | February 2006 | Sridhar |
| 2006/0110633 | May 2006 | Ukai et al. |
| 2006/0166070 | July 2006 | Hickey et al. |
| 2006/0199057 | September 2006 | Hiwatashi |
| 2006/0216575 | September 2006 | Cassidy |
| 2006/0222929 | October 2006 | Hickey et al. |
| 2007/0045125 | March 2007 | Hartvigsen et al. |
| 2007/0082254 | April 2007 | Hiwatashi |
| 2007/0141422 | June 2007 | Brown |
| 2007/0141423 | June 2007 | Suzuki et al. |
| 2007/0141443 | June 2007 | Brown |
| 2007/0141444 | June 2007 | Brown |
| 2007/0224481 | September 2007 | Suzuki et al. |
| 2007/0237999 | October 2007 | Donahue et al. |
| 2007/0275292 | November 2007 | Sin Xicola et al. |
| 2007/0287048 | December 2007 | Couse et al. |
| 2008/0029388 | February 2008 | Elangovan et al. |
| 2008/0075984 | March 2008 | Badding et al. |
| 2008/0076006 | March 2008 | Gottmann et al. |
| 2008/0096080 | April 2008 | Batawi et al. |
| 2008/0102337 | May 2008 | Shimada |
| 2008/0254336 | October 2008 | Batawi |
| 2008/0261099 | October 2008 | Nguyen et al. |
| 2009/0029195 | January 2009 | Gauckler et al. |
| 2009/0068533 | March 2009 | Fukasawa et al. |
| 2009/0186250 | July 2009 | Narendar et al. |
| 2009/0214919 | August 2009 | Suzuki |
| 2009/0291347 | November 2009 | Suzuki |
| 2009/0305106 | December 2009 | Gell et al. |
| 2011/0039183 | February 2011 | Armstrong et al. |
| 2011/0183233 | July 2011 | Armstrong et al. |
| 2012/0231368 | September 2012 | Hata |
| 2014/0051010 | February 2014 | Armstrong et al. |
| 2014/0141344 | May 2014 | Miller et al. |
| 2017/0117567 | April 2017 | Miller et al. |
| 101147285 | Mar 2008 | CN | |||
| 101295792 | Oct 2008 | CN | |||
| 102725902 | Oct 2012 | CN | |||
| 1048839 | Nov 1966 | GB | |||
| 3196465 | Aug 1991 | JP | |||
| H06150943 | May 1994 | JP | |||
| 6215778 | Aug 1994 | JP | |||
| 2000-340240 | Aug 2000 | JP | |||
| 2000-281438 | Oct 2000 | JP | |||
| 2003-068324 | Mar 2003 | JP | |||
| 2004-087490 | Mar 2004 | JP | |||
| 2007-026874 | Feb 2007 | JP | |||
| 2008-502113 | Jan 2008 | JP | |||
| 2008-189838 | Aug 2008 | JP | |||
| 2008189838 | Aug 2008 | JP | |||
| 2008-305804 | Dec 2008 | JP | |||
| 2009-059699 | Mar 2009 | JP | |||
| 20020092223 | Dec 2002 | KR | |||
| 20070095440 | Sep 2007 | KR | |||
| 20080010737 | Jan 2008 | KR | |||
| 20080097971 | Nov 2008 | KR | |||
| 100886239 | Feb 2009 | KR | |||
| 20090061870 | Jun 2009 | KR | |||
| 201233731 | Aug 2012 | TW | |||
| WO2004/093214 | Oct 2004 | WO | |||
| WO2005/041329 | May 2005 | WO | |||
| WO2008/019926 | Feb 2008 | WO | |||
| WO2009/097110 | Aug 2009 | WO | |||
Other References
|
Ahmad-Khantou et al., "Electrochemical & Microstructural Study of SOFC Cathodes Based on La.sub.0.5Sr.sub.0.3MnO.sub.3 and Pr.sub.0.65Sr.sub.0.3MnO.sub.3," Electrochemical Society Proceedings, 2001, p. 476-485, vol. 2001-16. cited by applicant . Mori et al., "Lanthanum Alkaline-Earth Manganites as a Cathode Material in High-Temperature Solid Oxide Fuel Cells," Journal of the Electrochemical Society, 1999, p. 4041-4047, vol. 146. cited by applicant . L.G. Austin, "Cell & Stack Construction: Low Temperature Cells," NASA SP-120, 1967. cited by applicant . EG & G Services, Parsons, Inc., SAIC, Fuel Cell Handbook, 5th Edition, USDOE, Oct. 2000, p. 9-1-9.4, and 9-12-9-14. cited by applicant . J.M. Sedlak, et al., "Hydrogen Recovery and Purification Using the Solid Polymer Electrolyte Electrolysis Cell," Int. J. Hydrogen Energy, vol. 6, p. 45-51, 1981. cited by applicant . Dr. Ruhl, "Low Cost Reversible Fuel Cell System," Proceedings of the 2000 U.S. DOE Hydrogen Program Review, Jun. 15, 2000, NREL/CP-570-30535. cited by applicant . Low Cost, Compact Solid Oxide Fuel Cell Generator, NASA Small Business Innovation Research Program, 2001. cited by applicant . Low Cost, High Efficiency Reversible Fuel Cell (and Electrolyzer) Systems, Proceedings of the 2001 DOE Hydrogen Program Review NREL/CP-570-30535. cited by applicant . Milliken et al., "Low Cost, High Efficiency Reversible Fuel Cell Systems," Proceedings of the 2002 U.S. DOE Hydrogen Program Review, NREL/CP-610-32405. cited by applicant . K. Eguchi et al., Power Generation and Steam Electrolysis Characteristics of an Electrochemical Cell with a Zirconia or Ceria based Electrode, Solid State Ionics, 86 88, 1996, p. 1245-49. cited by applicant . F. Mitlitsky et al , "Regenerative Fuel Cells for High Altitude Long Endurance Solar Powered Aircraft," 28.sup.th Intersociety Energy Conversion Engineering Conference (IECED), Jul. 28, 1993, UCRL-JC-113485. cited by applicant . Small, Ultra Efficient Fuel Cell Systems, Advanced Technology Program, ATP 2001 Competition, Jun. 2002. cited by applicant . F. Mitlitsky et al., Unitized Regenerative Fuel Cells for Solar Rechargeable Aircraft and Zero Emission Vehicles, 1994 Fuel Cell Seminar, Sep. 6, 1994, UCRL-JC-117130. cited by applicant . Ralph et al., "Cathode Materials for Reduced-Temperature SOFCs," Journal of the Electrochemical Society, 2003, p. A1518-A1522, vol. 150. cited by applicant . Simmer et al., "Development of Fabrication Techniques and Electrodes for Solid Oxide Fuel Cells," Electrochemcial Society Proceedings, p. 1050-1061, vol. 2001-16. cited by applicant . Yamamoto et al., "Electrical Conductivity of Stabilized Zirconia with Ytterbia and Scandia," Solid State Ionics, v79, p. 137-142, Jul. 1995. cited by applicant . Araki et al., "Degradation Mechanism of Scandia-Stabilized Zirconia Electrolytes: Discussion based on Annealing Effects on Mechanical Strength, Ionic Conductivity, and Raman Spectrum," Solid State Ionics, v180, n28-31, p. 1484-1489, Nov. 2009. cited by applicant . Lybye et al., "Effect of Transition Metal Ions on the Conductivity and Stability of Stabilized Zirconia," Ceramic Engineering and Science Proceedings, v27, n4, p. 67-78, 2006. cited by applicant . International Application No. PCT/US2011/021664, International Preliminary Report on Patentability, dated Aug. 9, 2012. cited by applicant . International Application No. PCT/US2013/070783, International Search Report and Written Opinion, dated Mar. 10, 2014. cited by applicant . Chinese Patent Application No. 201180006935.5, Office Action dated Jun. 13, 2014. cited by applicant . Chinese Patent Application No. 201380060253.1, Office Action dated Sep. 2, 2016, 11pgs. cited by applicant . Chinese Patent Application No. 201380060253.1, Office Action dated Apr. 27, 2017, 14pgs. cited by applicant . Chinese Patent Application No. 201380060253.1, Office Action dated Dec. 21, 2017, 4pgs. cited by applicant . Chinese Patent Application No. 201380060253.1, Office Action dated May 28, 2018. cited by applicant . Taiwan Patent Application No. 100102963, Office Action dated May 6, 2014. cited by applicant . Taiwan Patent Application No. 100102963, Taiwan Search Report dated May 6, 2014. cited by applicant . Taiwan Patent Application No. 102142390, Office Action dated Jan. 19, 2017, 5 pgs. cited by applicant . Taiwan Patent Application No. 105134369, Office Action dated Mar. 7, 2018, 3pgs. cited by applicant . Taiwan Patent Application No. 105134369, Office Action dated Sep. 25, 2018. cited by applicant . International Application No. PCT/US2011/021664, International Search Report dated Sep. 28, 2011. cited by applicant . International Application No. PCT/US2013/070783, International Preliminary Report on Patentability dated Jun. 4, 2015. cited by applicant . Japanese Application No. 2015-543115, Notice of Reasons for Rejection, dated Sep. 7, 2017, 4pgs. cited by applicant . Japanese Application No. 2018-091247, Notice of Reasons for Rejection, dated May 22, 2019, 5 pgs. cited by applicant . Office Communication with Search Report from the Taiwanese Patent Office for ROC (Taiwan) Patent Application No. 108115947, dated Nov. 27, 2019, 4 pages. cited by applicant. |
Primary Examiner: Sheikh; Haroon S.
Attorney, Agent or Firm: The Marbury Law Group PLLC
Claims
The invention claimed is:
1. An electrolyte composition for a solid oxide fuel cell, comprising zirconia stabilized with scandia and magnesia; wherein the electrolyte composition comprises a formula Zr.sub.1-w-x-zSc.sub.wMg.sub.xIn.sub.zO.sub.d, wherein 0.1.ltoreq.w.ltoreq.0.18, wherein 0.ltoreq.x.ltoreq.0.03, wherein 0.01.ltoreq.z.ltoreq.0.12, and wherein 1.8.ltoreq.d.ltoreq.2.
2. The electrolyte composition of claim 1, wherein w=0.171-z, wherein 0.013.ltoreq..times..ltoreq.0.014, and wherein 0.018.ltoreq.z.ltoreq.0.06.
3. The electrolyte composition of claim 1, wherein z=0.018 or z=0.036.
Description
FIELD
The present invention is generally directed to fuel cell components, and to solid oxide fuel cell electrolyte materials in particular.
BACKGROUND OF THE INVENTION
Fuel cells are electrochemical devices which can convert chemical energy stored in fuels to electrical energy with high efficiencies. They comprise an electrolyte between electrodes. Solid oxide fuel cells (SOFCs) are characterized by the use of a solid oxide as the electrolyte.
In solid oxide fuel cell (SOFC) system, an oxidizing flow is passed through the cathode side of the fuel cell while a fuel flow is passed through the anode side of the fuel cell. The oxidizing flow is typically air, while the fuel flow can be a hydrocarbon fuel, such as methane, natural gas, pentane, ethanol, or methanol. The fuel cell, operating at a typical temperature between 650.degree. C. and 950.degree. C., enables the transport of negatively charged oxygen ions from the cathode flow stream to the anode flow stream, where the ion combines with either free hydrogen or hydrogen in a hydrocarbon molecule to form water vapor and/or with carbon monoxide to form carbon dioxide. The excess electrons from the negatively charged ion are routed back to the cathode side of the fuel cell through an electrical circuit completed between anode and cathode, resulting in an electrical current flow through the circuit.
In recent years considerable interest has been shown towards the development of SOFC electrolyte compositions of high ionic conductivity. Doped cerium oxide, lanthanum gallate and zirconium oxide are the most suitable candidates. However, in order to achieve sufficient ionic conductivity high operation temperature is often required, deteriorating the life of the fuel cell components and requiring the use of expensive materials in the fuel cell stack, such as chromium alloy interconnects. Therefore, it is highly desirable to lower the operation temperature of SOFCs and one important step to achieve this is the development of an electrolyte composition with higher ionic conductivity than yttria-stabilized zirconia (YSZ), the state of the art SOFC electrolyte material.
Doping zirconia with aliovalent dopants stabilizes the high temperature cubic fluorite phase at room temperature leading to an increase in oxygen vacancy concentration, oxygen mobility and ionic conductivity. Complex studies have demonstrated a correlation between the dopant and host ionic radii and the existence of a critical dopant cation radius that can ensure maximum conductivity. It has been suggested that a good evaluation of the relative ion mismatch between dopant and host would be to compare the cubic lattice parameter of the host oxide and the pseudocubic lattice parameter of the dopant oxide, a smaller size mismatch being preferred for obtaining high ionic conductivity.
Numerous attempts to find the appropriate dopant for stabilizing the cubic phase have been made (Y, Yb, Ce, Bi, etc). Among these, scandia stabilized zirconia shows the highest ionic conductivity with Sc.sup.3+ concentration of 11 mole % (2-3 higher than YSZ at 800.degree. C.) due to a lower activation energy than YSZ. The complex phase diagram in the Sc.sub.2O.sub.3--ZrO.sub.2 system is still under debate, with several phases identified in the dopant rich segment of the phase diagram, as monoclinic, tetragonal and rhombohedral intermediate phases appear at low temperatures. One example is the distorted rhombohedral .beta. phase (Sc.sub.2Zr.sub.7O.sub.17), that undergoes a rhombohedral-cubic phase transition around 600-700.degree. C. and induces a steep decrease in conductivity in this temperature region. This transition is not favorable from the point of view of thermal expansion mismatch and may be related to order-disorder transition of oxygen vacancies.
Co-doping in zirconia systems may produce cheaper, stable compositions with enhanced ionic conductivity. Co-dopants in the scandia zirconia system include Ce, Y, Yb and Ti, the former (1 mole % CeO.sub.2) being the most successful to date in stabilizing the cubic phase at room temperature and very high conductivity values have been measured by Lee et al, 135 mS/cm at 800.degree. C. in air (SSI 176 (1-2) 33-3 (2005)). However, concerns about long term stability, especially at the interface with the fuel electrode, due to Ce.sup.3+ presence, have been reported.
In general, CaO or MgO are used for improving the toughness of zirconia ceramics by stabilizing the tetragonal phase at room temperature.
However, previous studies for doping zirconia with alkaline earth metal cations alone have been unsuccessful in improving the conductivity because of a high tendency of defect association and a lower thermodynamic stability of cubic fluorite ZrO.sub.2--CaO and ZrO.sub.2--MgO solid solutions.
SUMMARY OF THE INVENTION
A solid oxide fuel cell (SOFC) electrolyte composition includes zirconia stabilized with scandia, and at least one of magnesia, zinc oxide, indium oxide, and gallium oxide, and optionally ceria.
Another embodiment of the invention provides an electrolyte composition for a solid oxide fuel cell that includes zirconia stabilized with scandia and indium oxide, in which scandia and indium oxide are present in total amount that is greater than or equal to 10 mol % and less than or equal to 13 mol %. Another embodiment of the invention provides zirconia stabilized with scandia, indium oxide, and ceria, in which scandia, indium oxide, and ceria are present in a total amount that is greater than or equal to 8 mol % and less than or equal to 14 mol %, such as 11 mol %.
BRIEF DESCRIPTION OF THE DRAWINGS
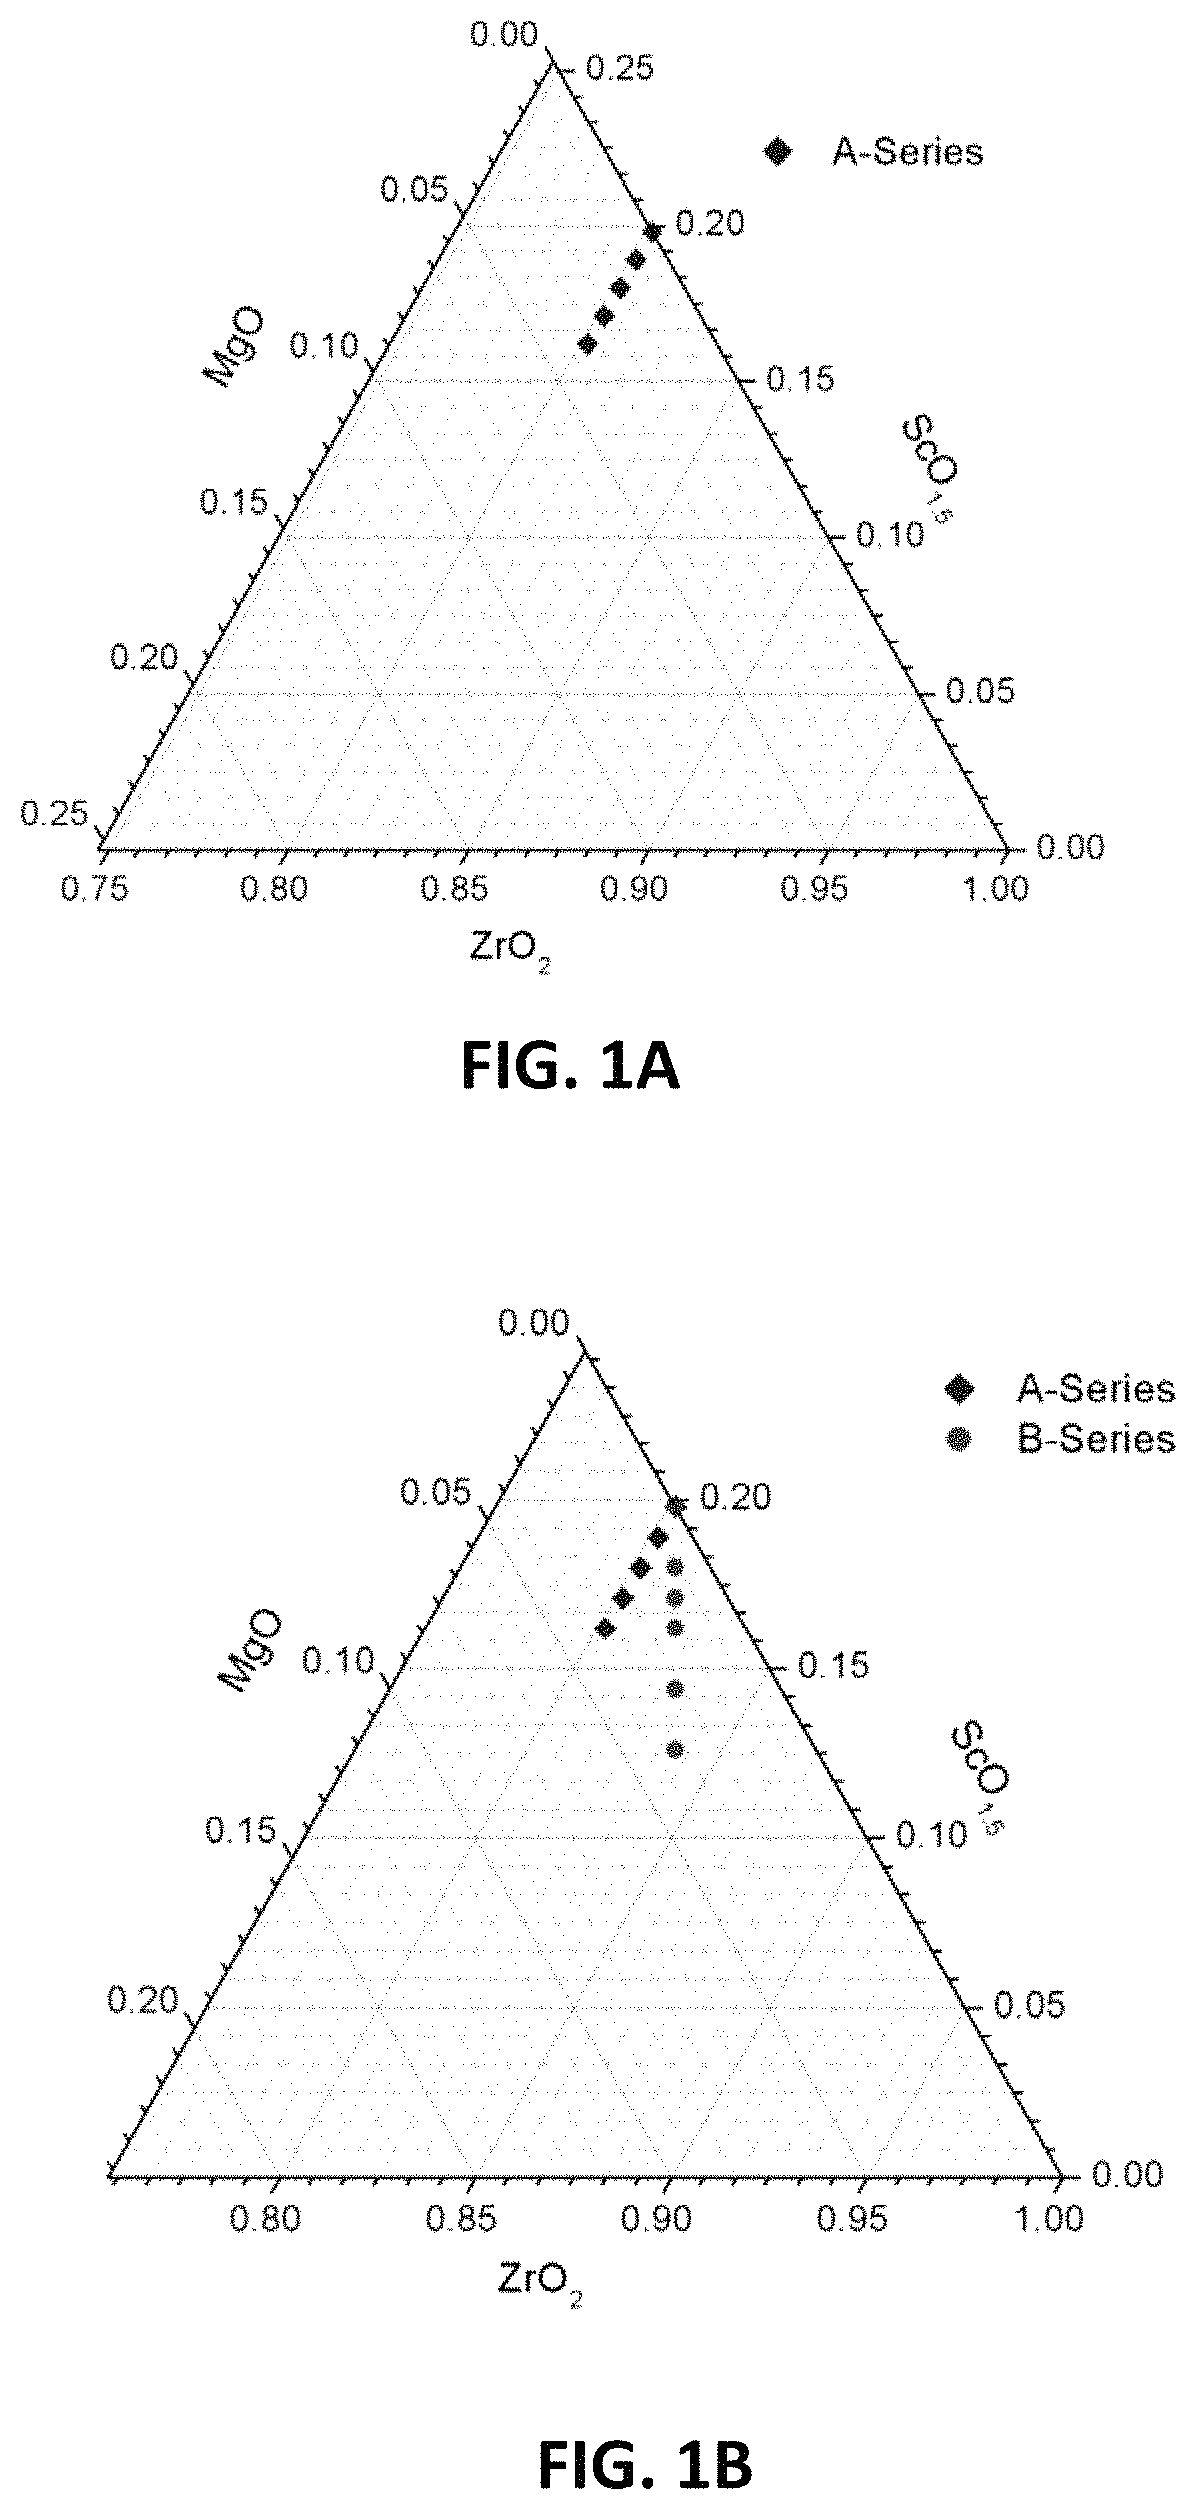
FIGS. 1A-1D are ternary phase diagrams illustrating embodiment series of magnesia doped scandia stabilized zirconia compositions.
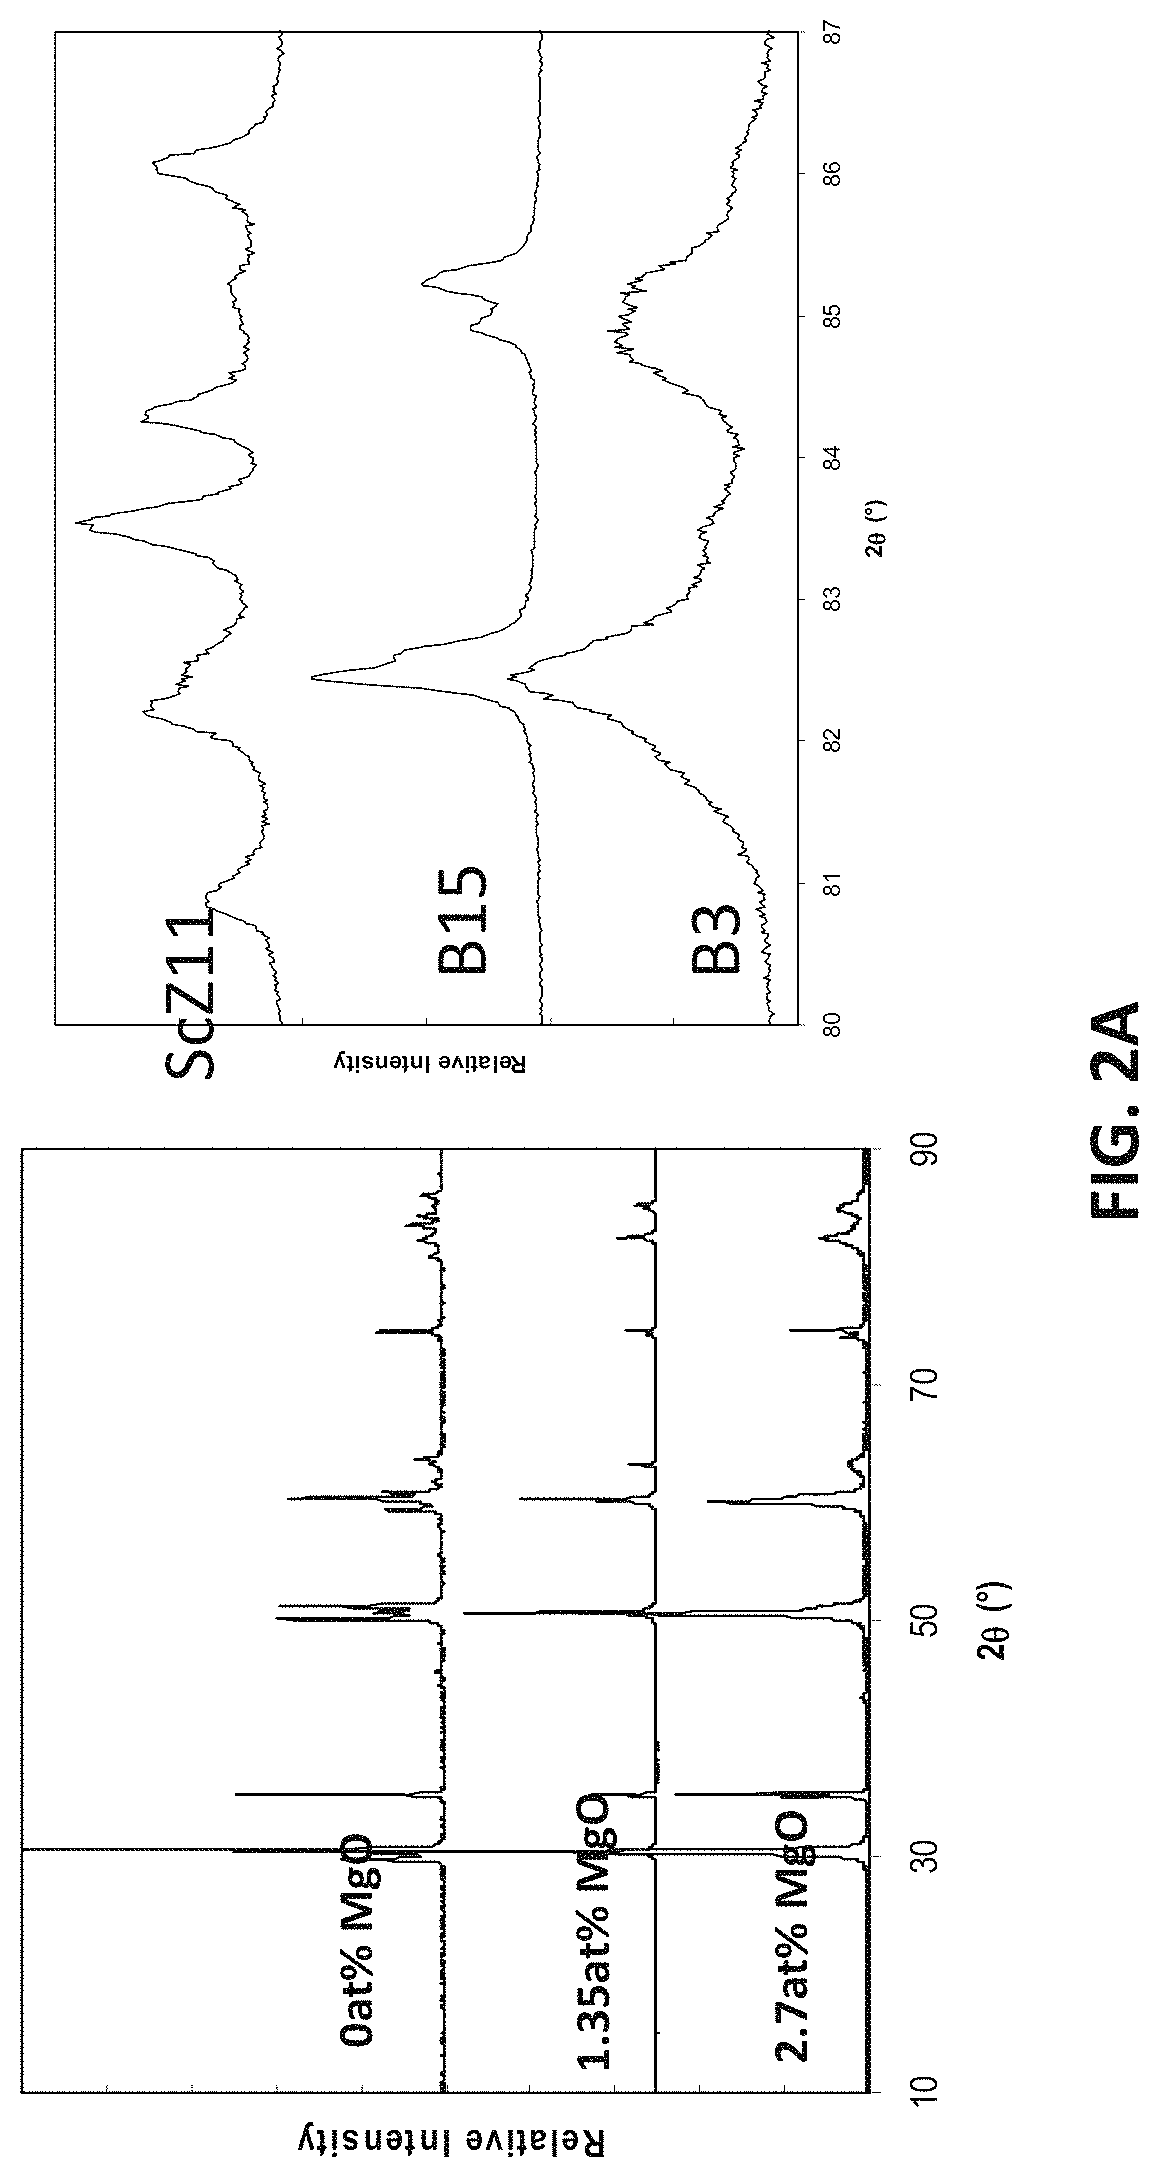
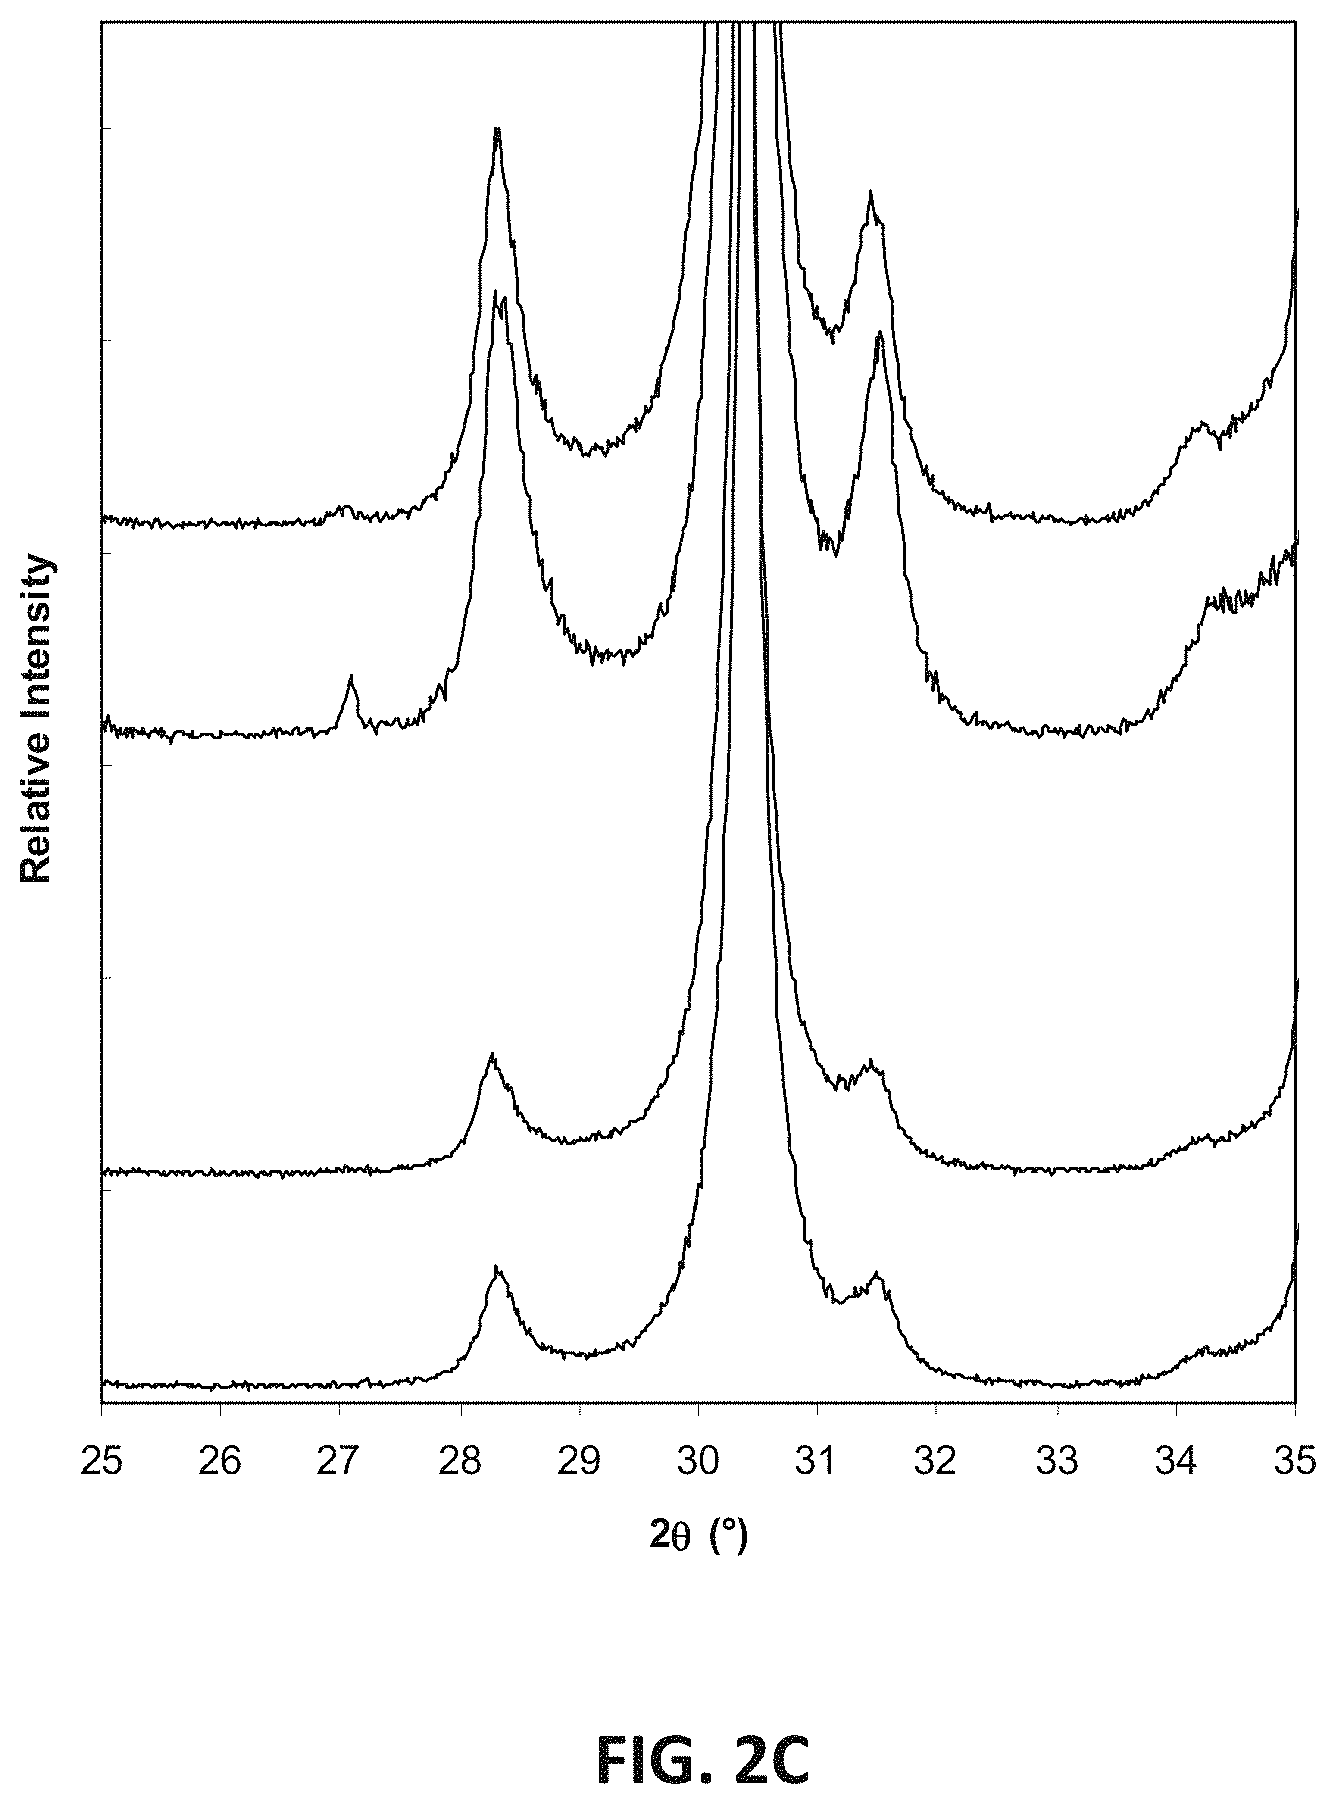
FIGS. 2A-2D are plots showing x-ray diffraction patterns for compositions in embodiment series of magnesia doped scandia stabilized zirconia compositions.
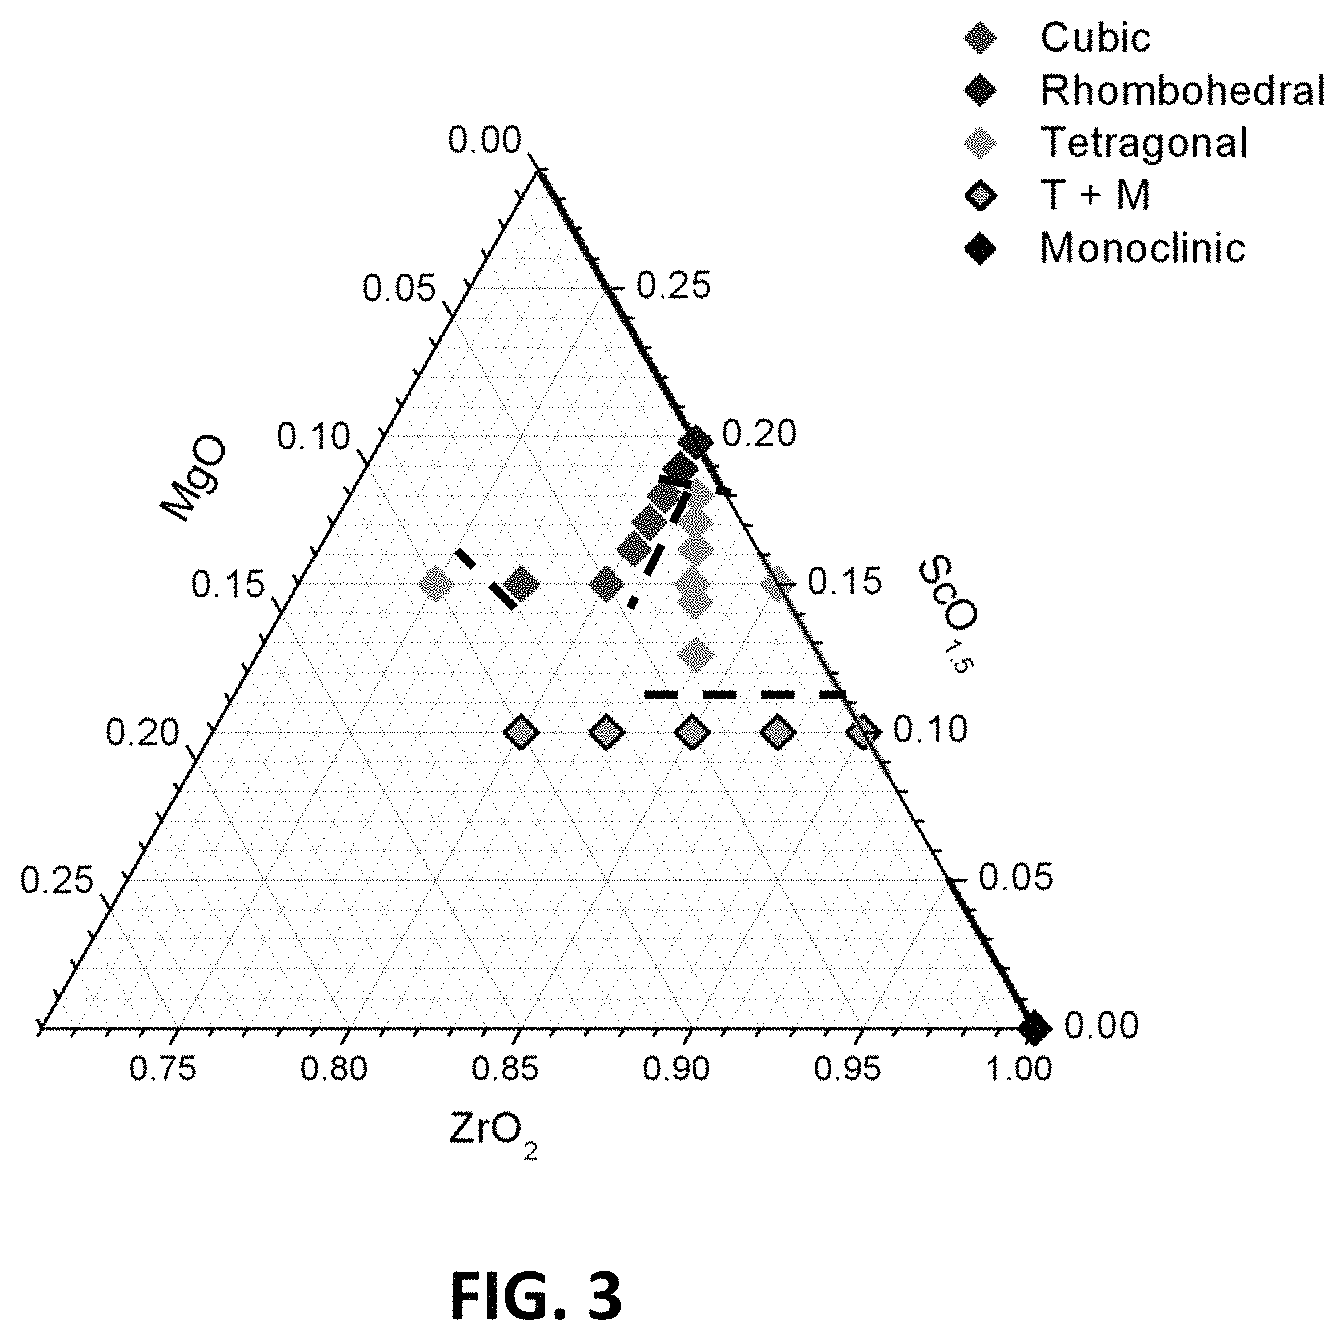
FIG. 3 is a ternary phase diagram illustrating the structures of compositions in embodiment series of magnesia doped scandia stabilized zirconia compositions.
FIGS. 4A and 4B are back scattered electron images from sample compositions in embodiment series of magnesia doped scandia stabilized zirconia compositions.
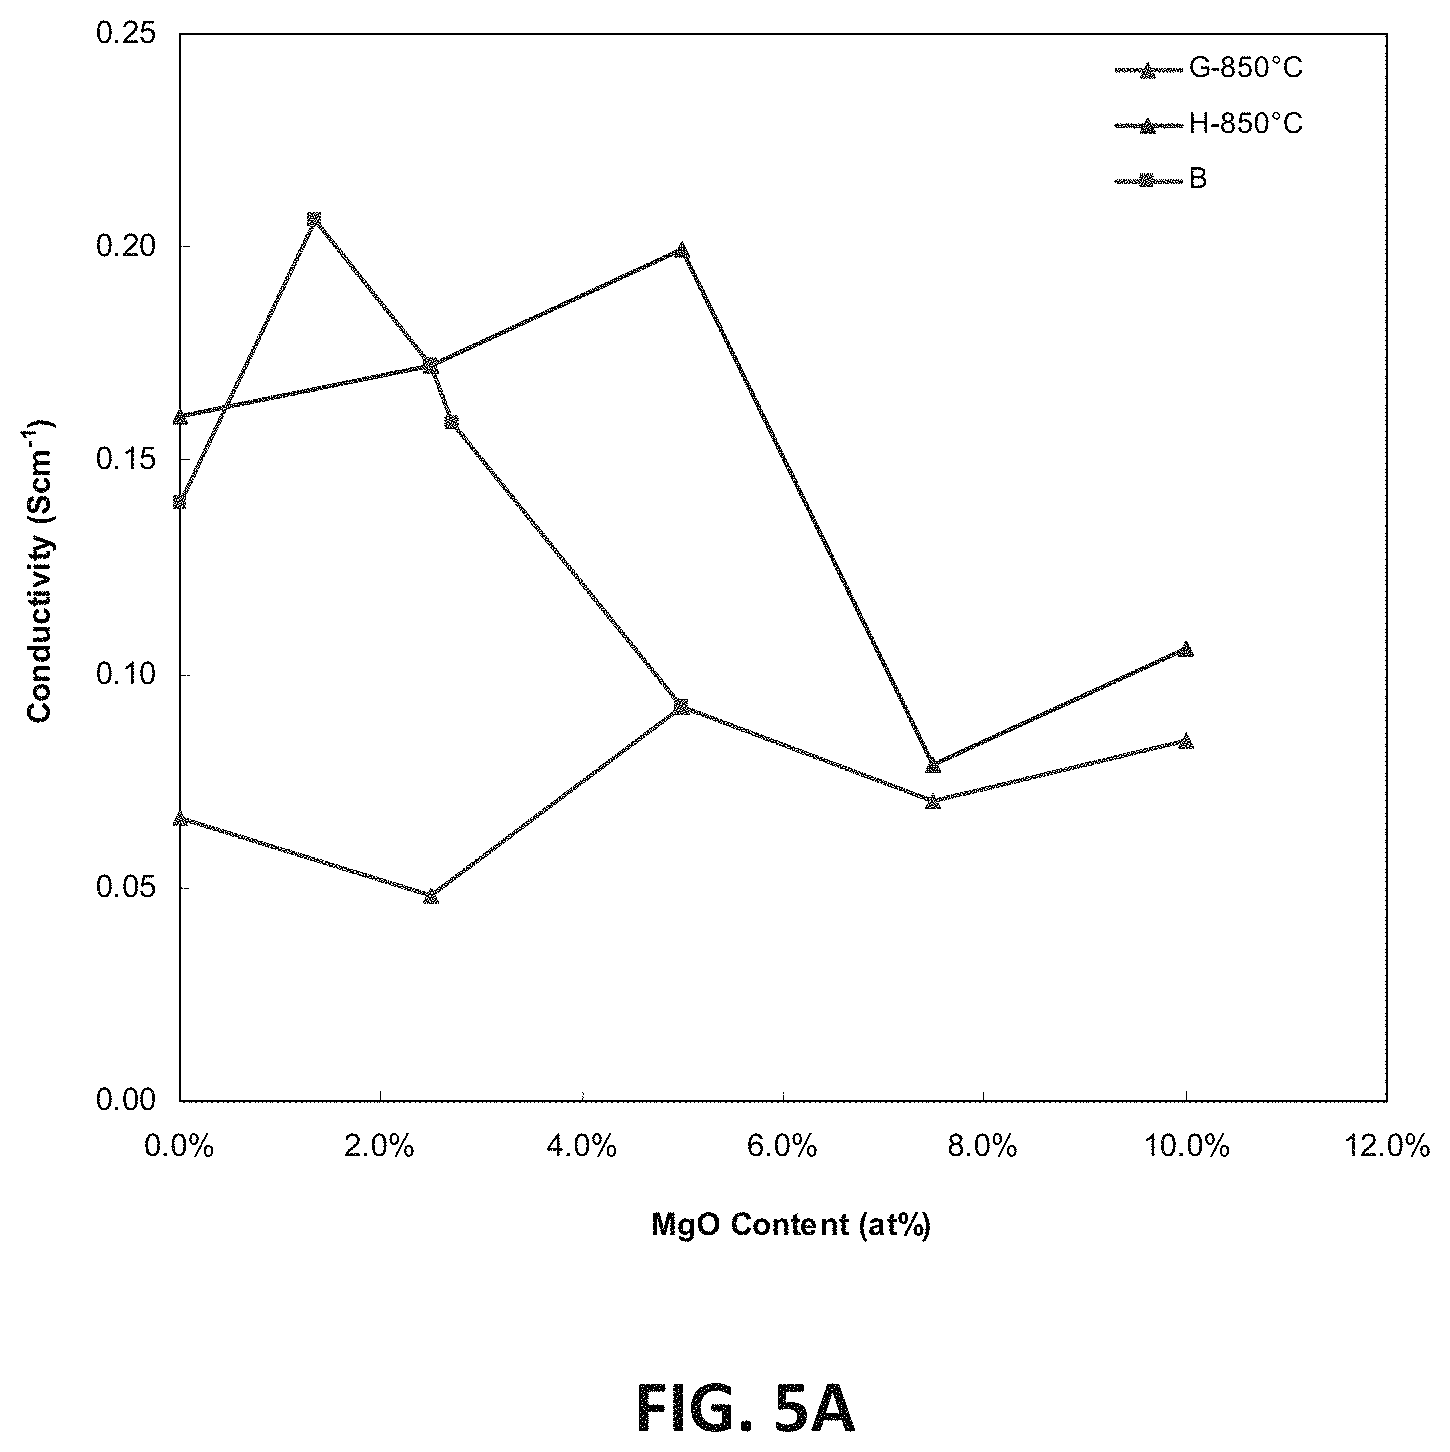
FIG. 5A is a graph showing D.C. conductivity versus atomic percent of magnesium ions at 850.degree. C. for embodiment series of magnesia doped scandia stabilized zirconia compositions.
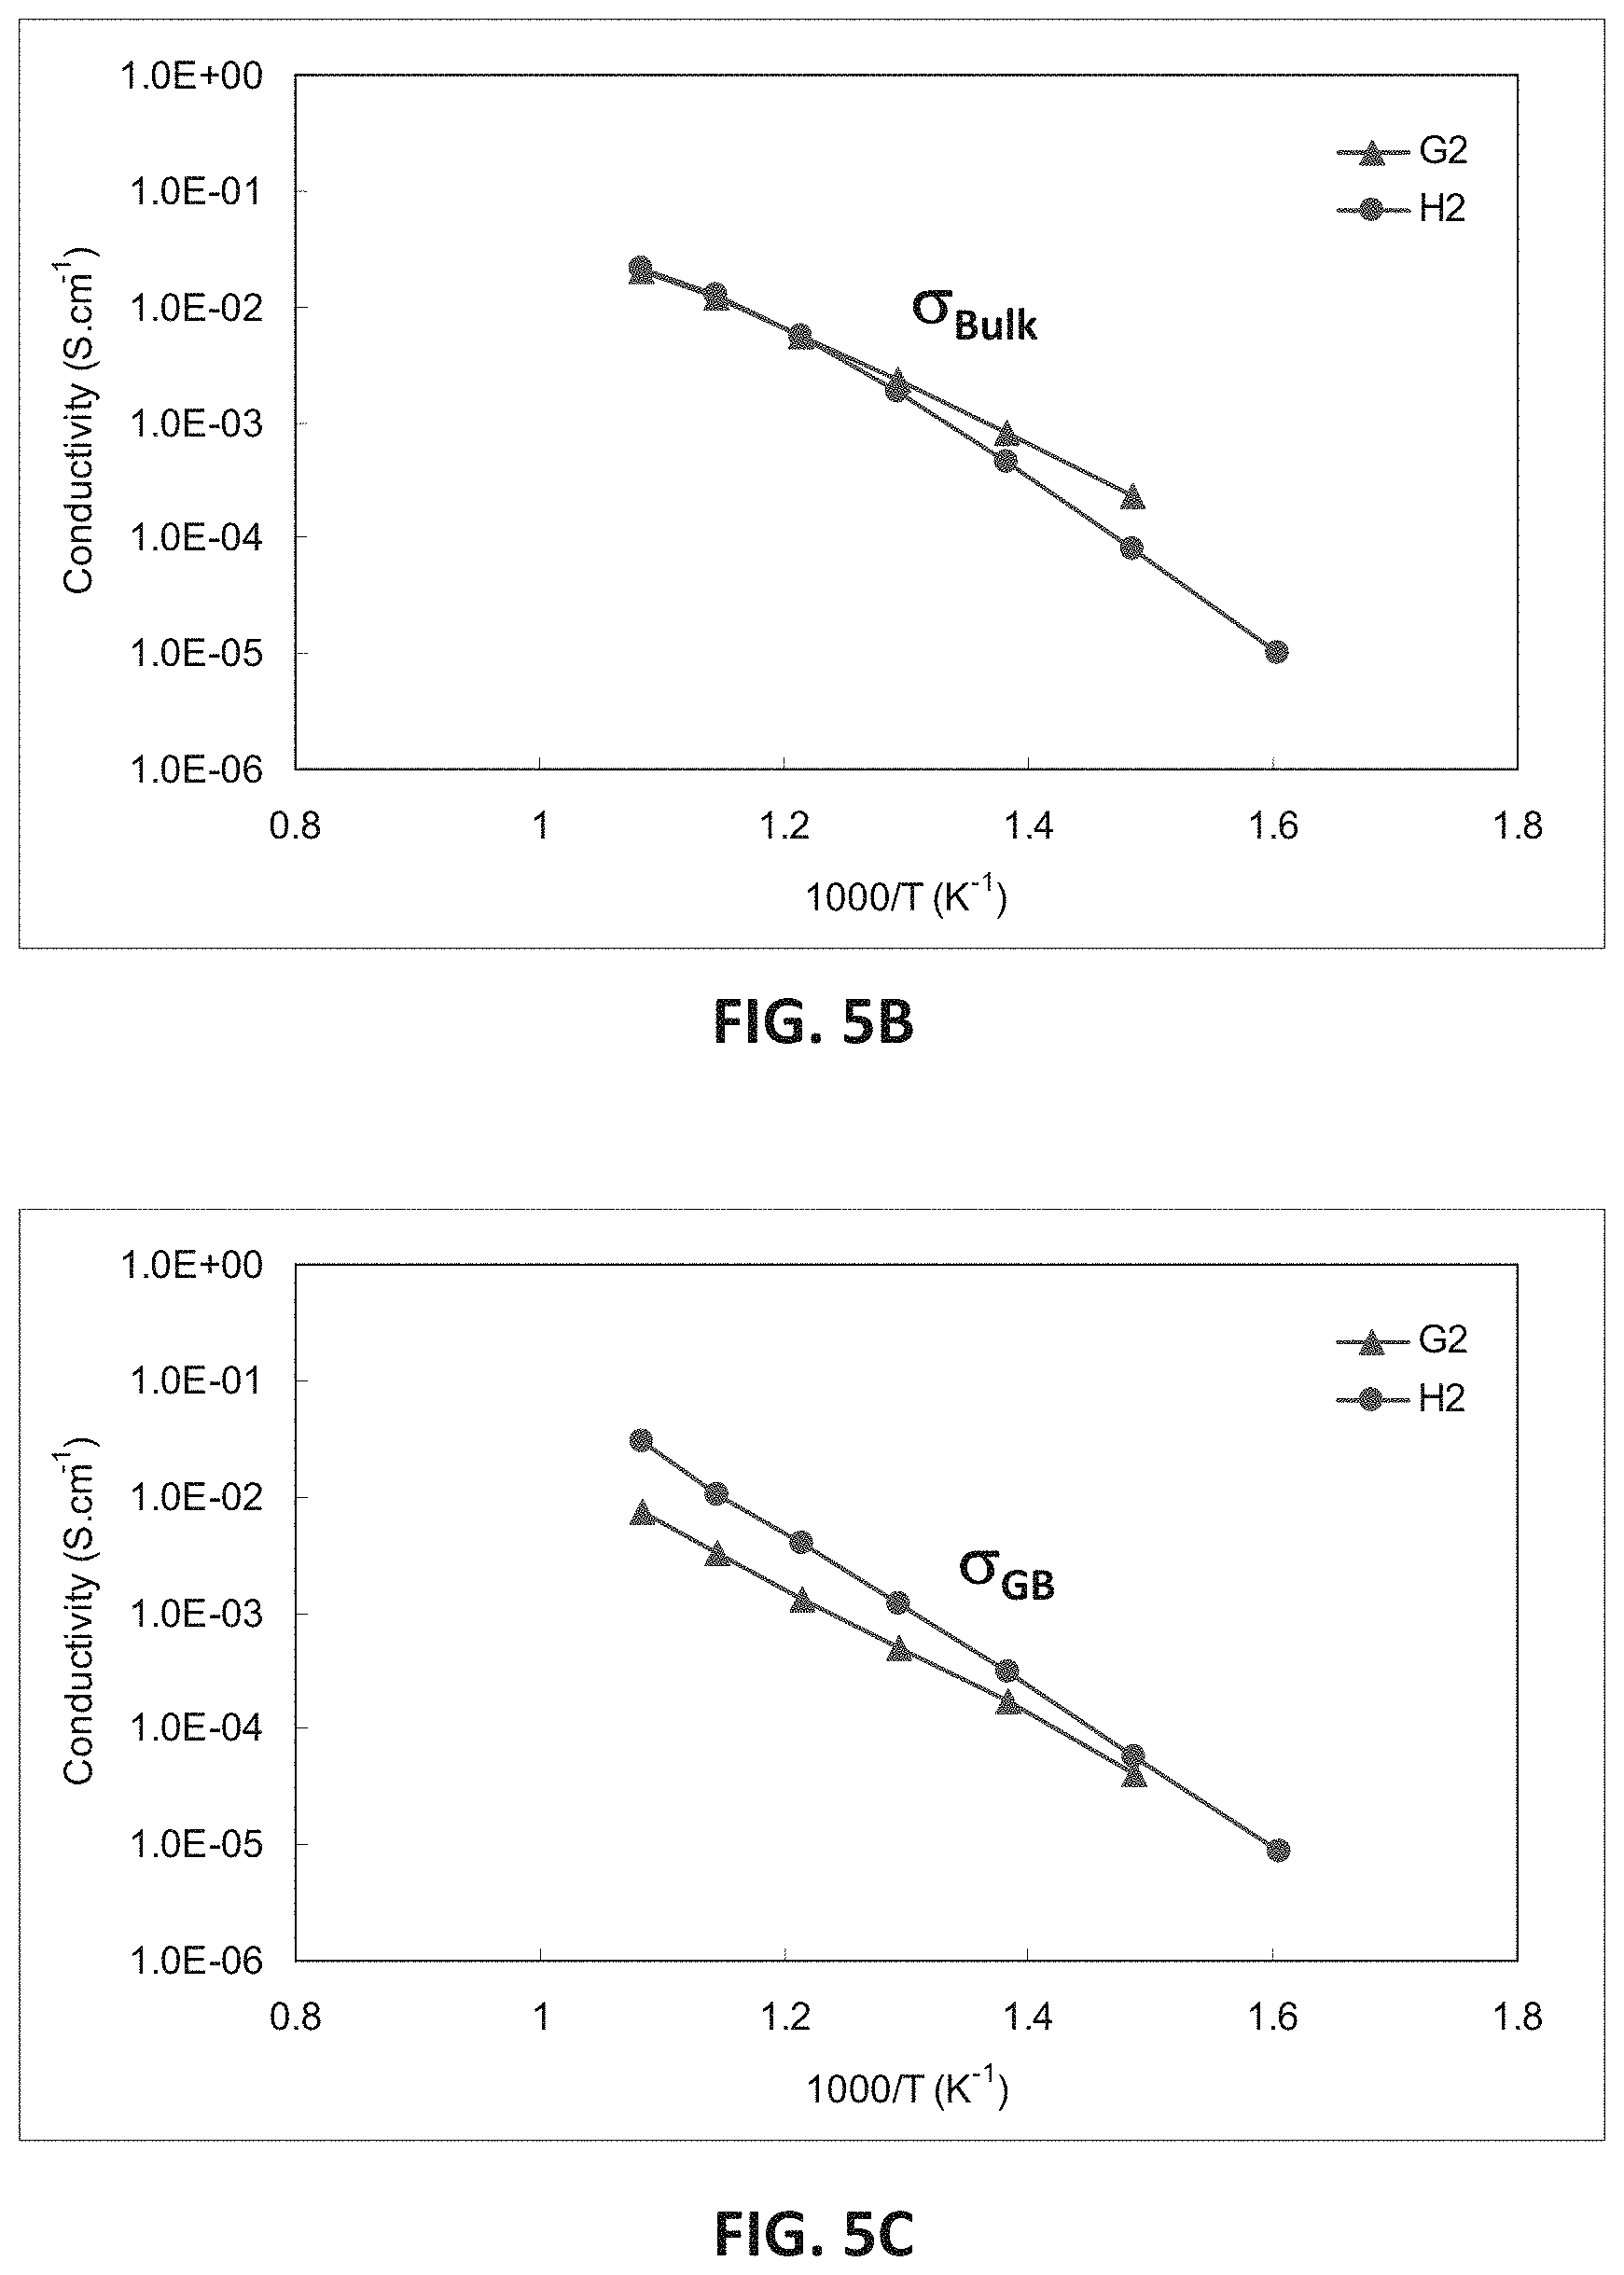
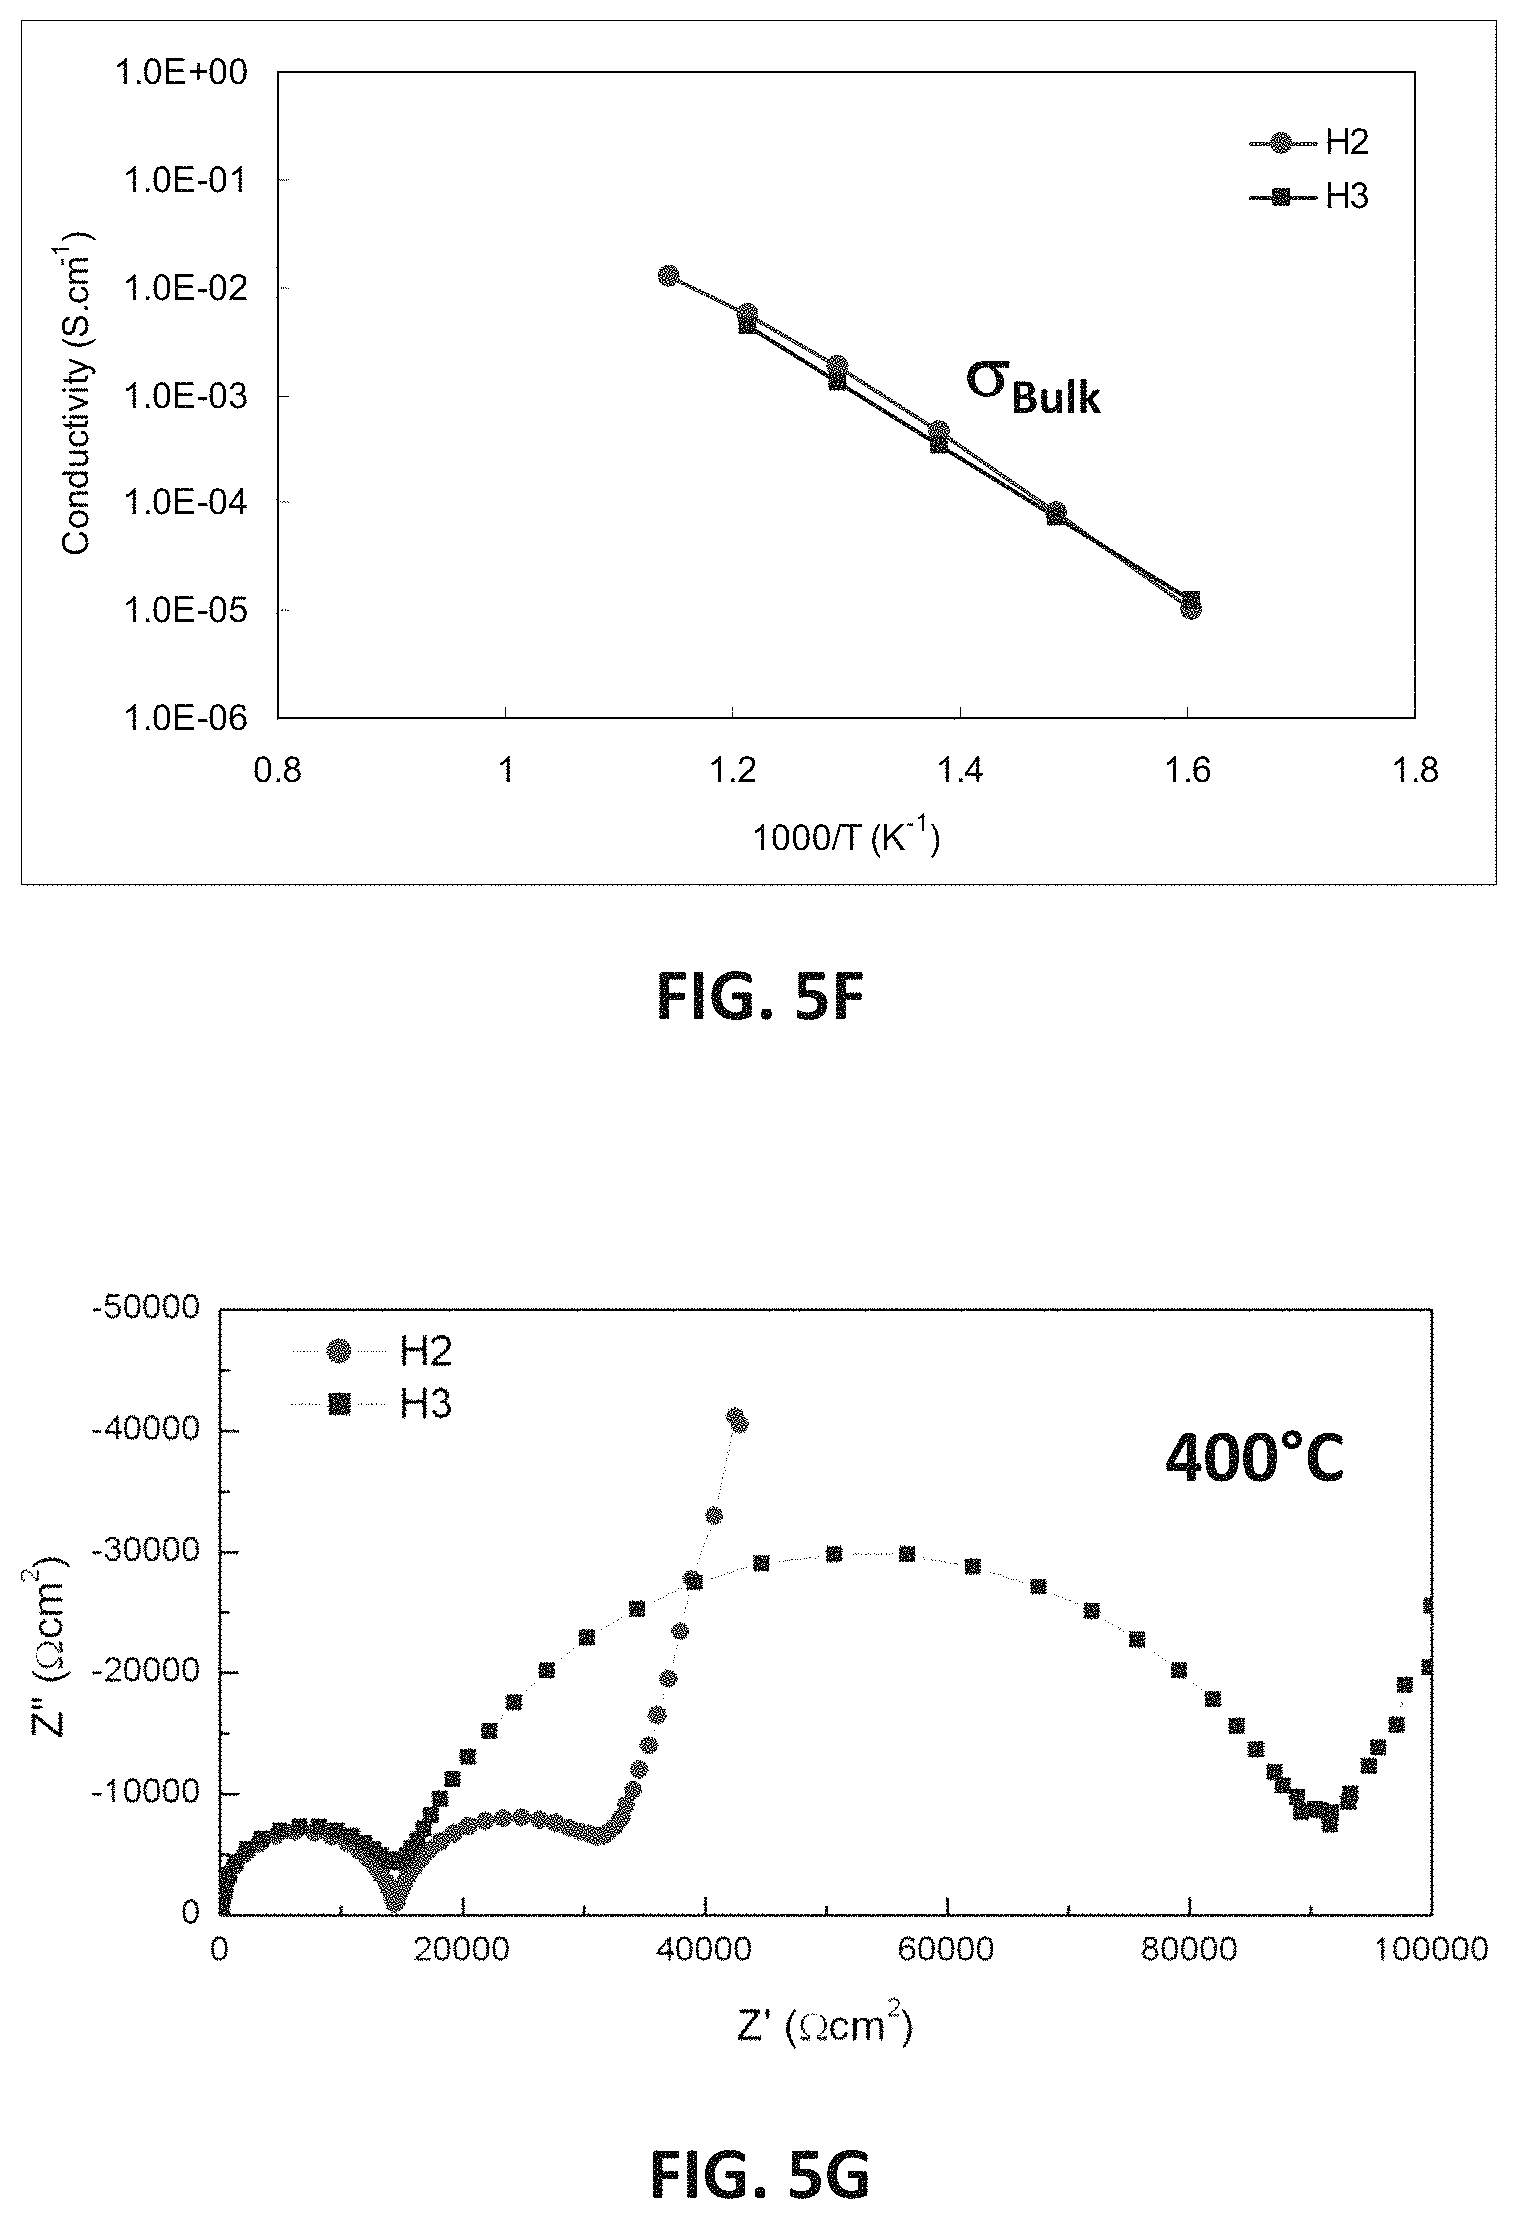
FIGS. 5B-5G are graphs showing electrical impedance spectroscopy results for sample compositions in embodiment series of magnesia doped scandia stabilized zirconia compositions.
FIG. 6A is a graph showing D.C. conductivity versus atomic percent of scandium ions at 850.degree. C. for embodiment series of magnesia doped scandia stabilized zirconia compositions.
FIG. 6B is a graph showing D.C. conductivity versus oxygen stoichiometry at 850.degree. C. for embodiment series of magnesia doped scandia stabilized zirconia compositions.
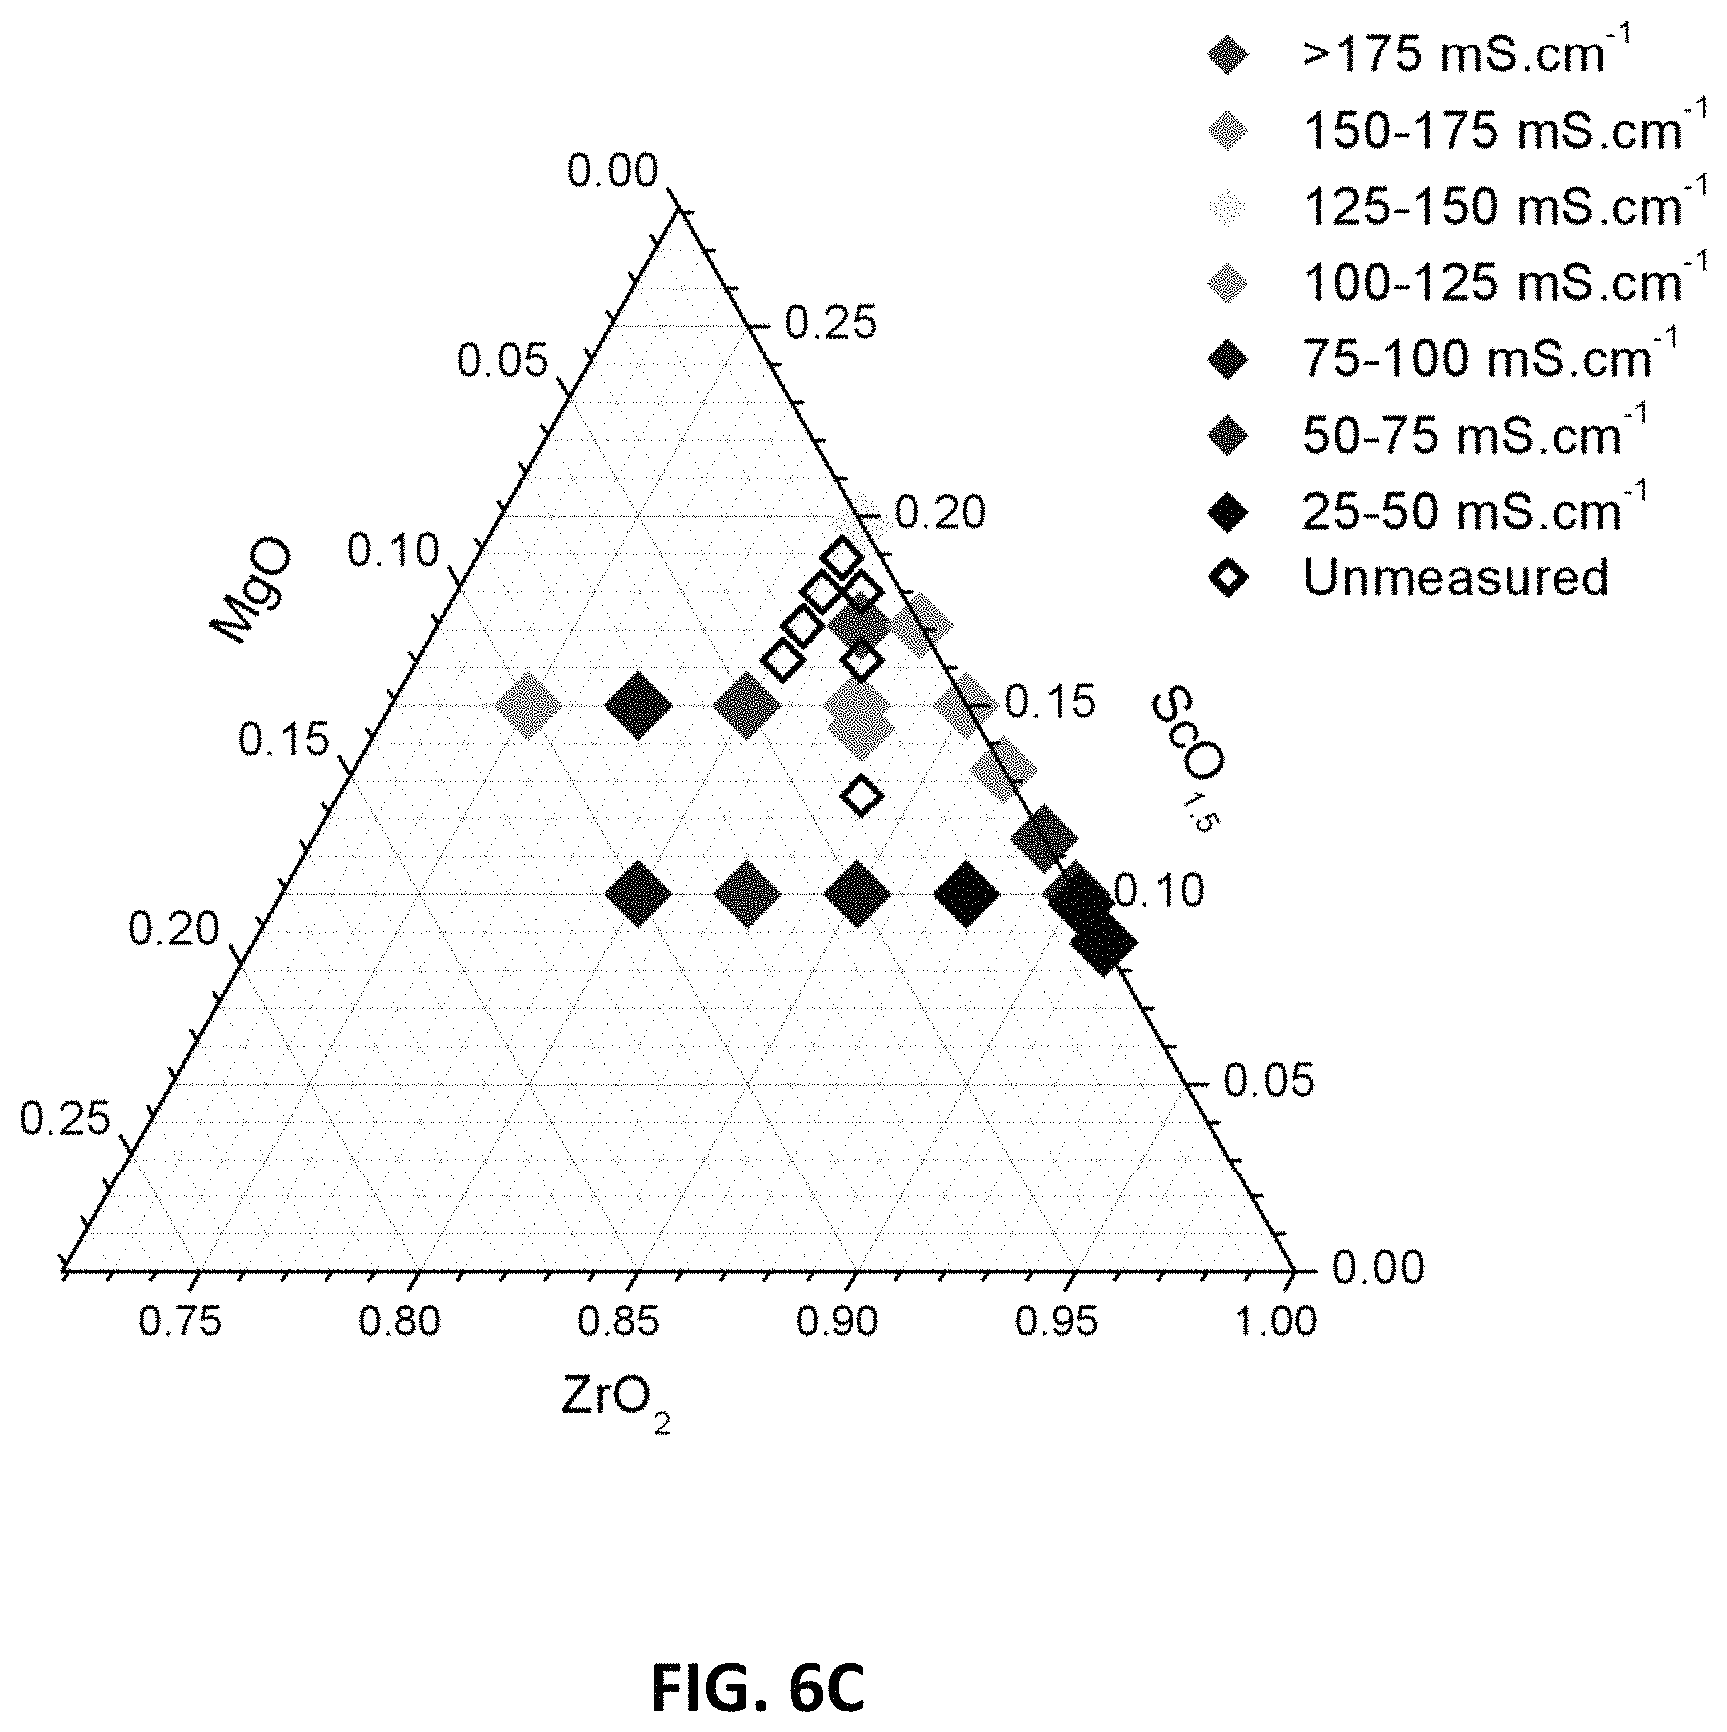
FIG. 6C is a ternary phase diagram showing D.C. conductivity results at 850.degree. C. for embodiment series of magnesia doped scandia stabilized zirconia compositions.
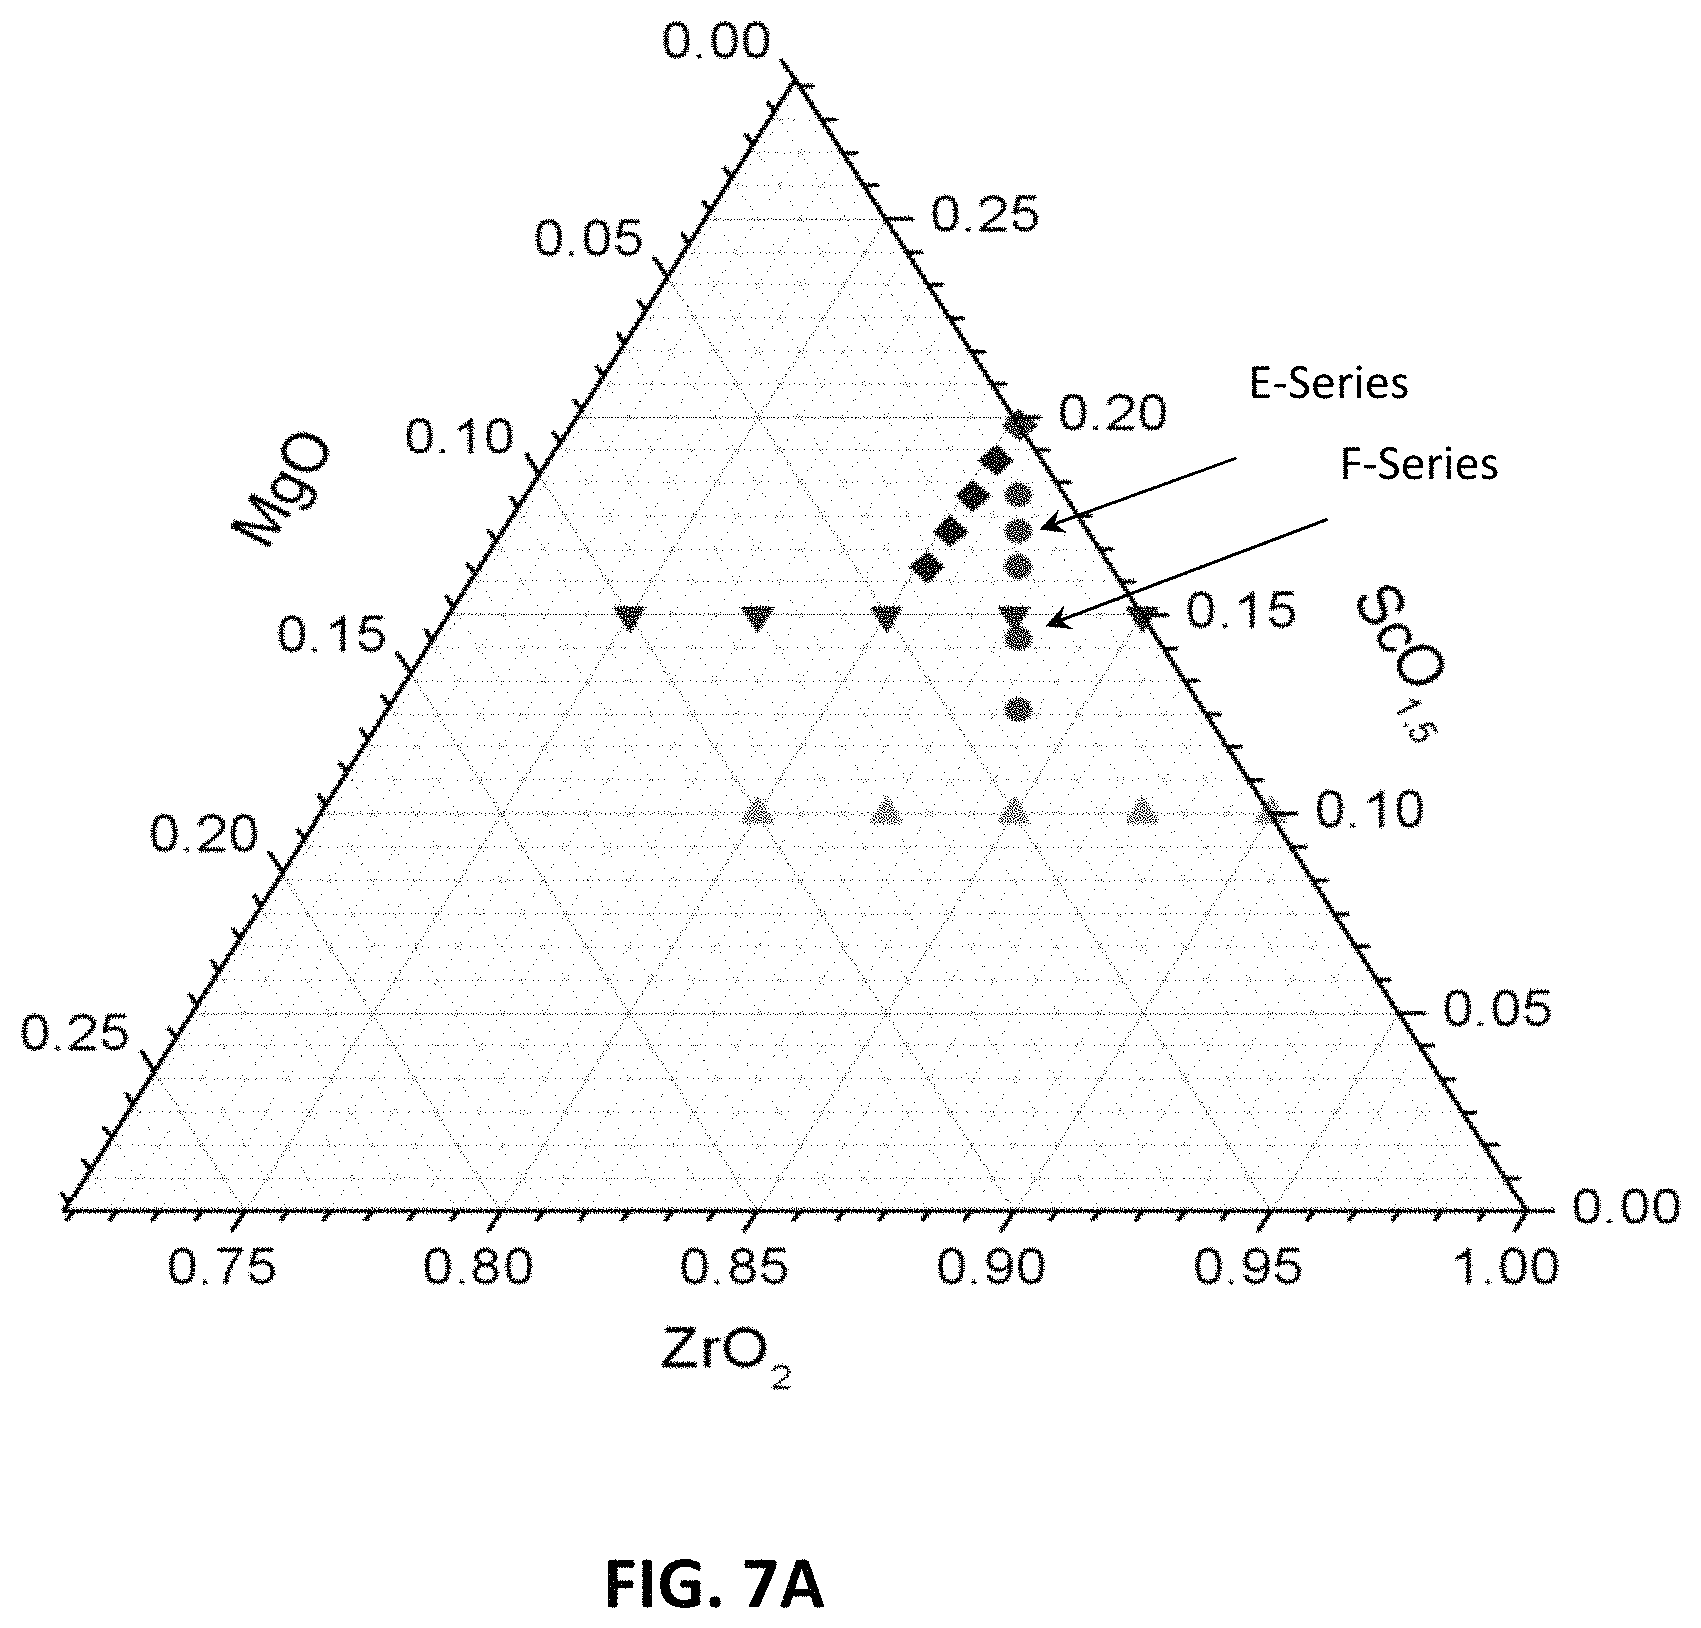
FIG. 7A is a ternary phase diagram of two embodiment series of yttria and magnesia doped scandia stabilized zirconia compositions.
FIGS. 7B and 7C are plots showing x-ray diffraction patterns for compositions in two embodiment series of yttria and magnesia doped scandia stabilized zirconia compositions.
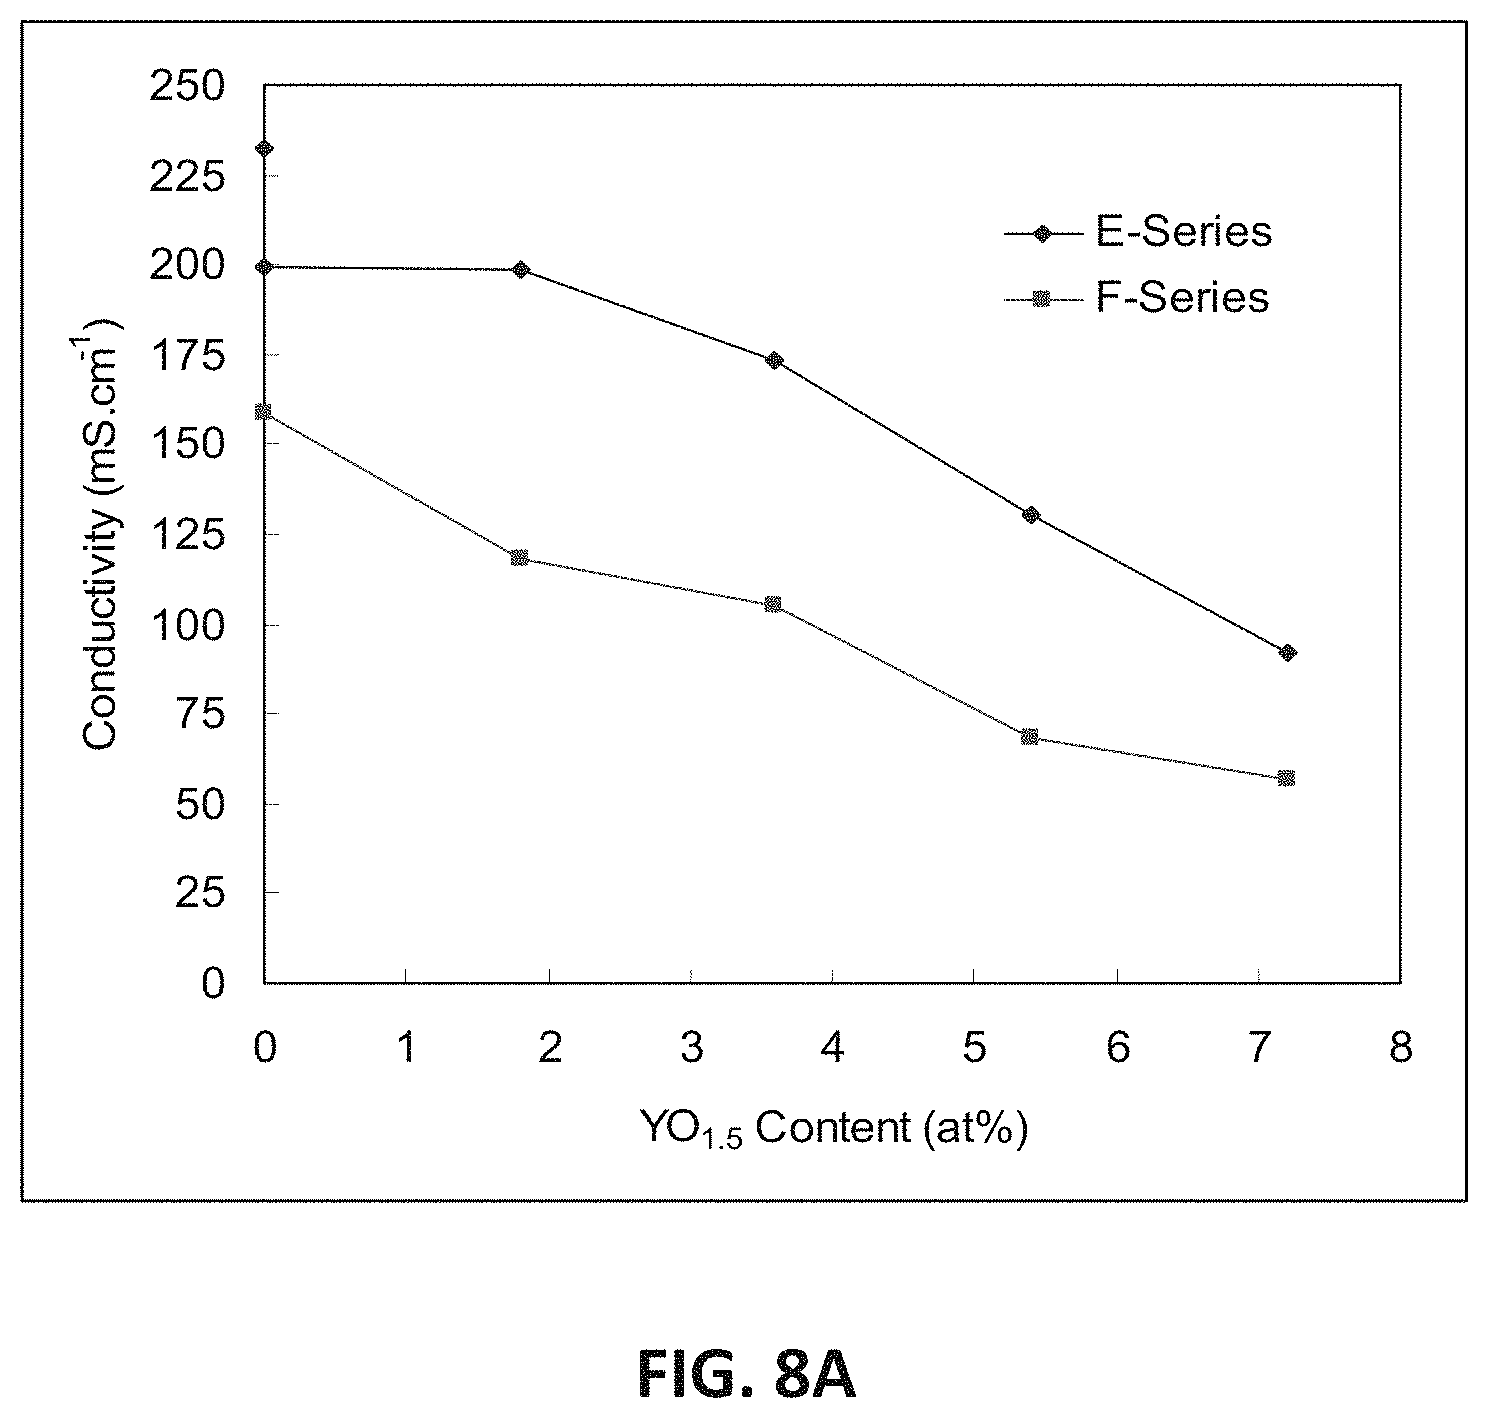
FIG. 8A is a graph showing D.C. conductivity versus atomic percentage of yttrium ions at 850.degree. C. for two embodiment series of yttria and magnesia doped scandia stabilized zirconia compositions.
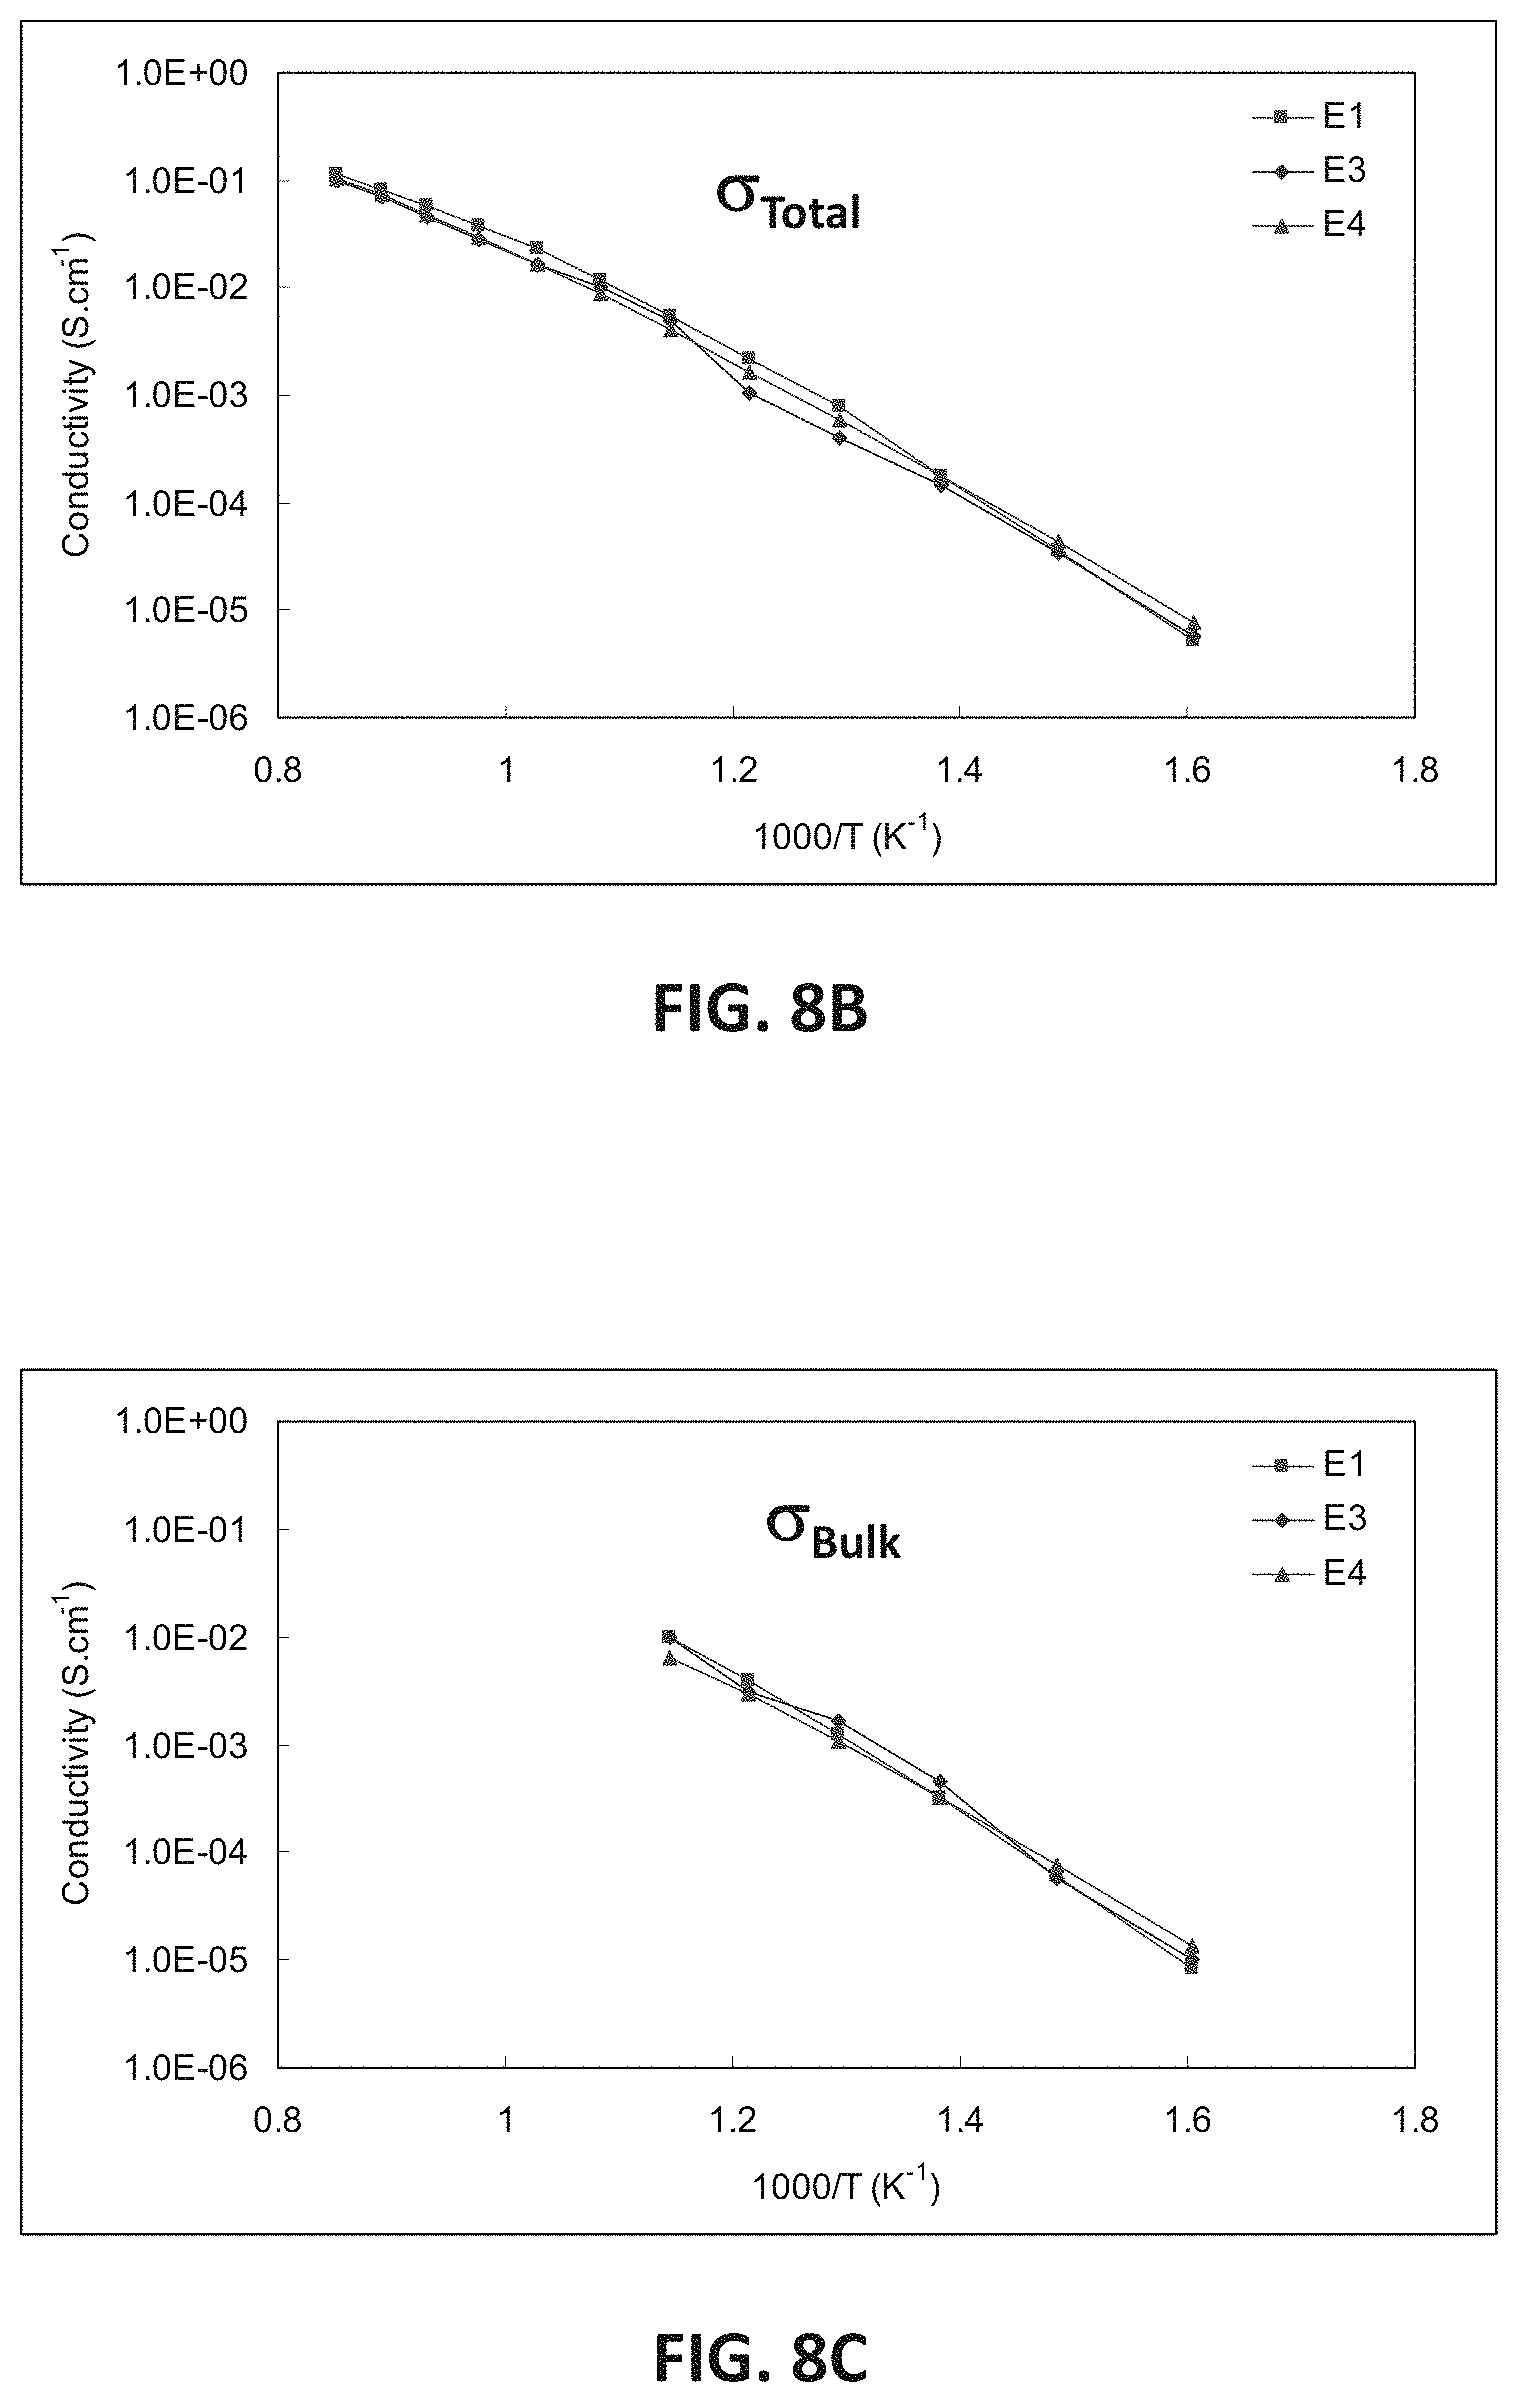
FIGS. 8B-8E are graphs showing electrical impedance spectroscopy results for sample compositions in an embodiment series of yttria and magnesia doped scandia stabilized zirconia compositions.
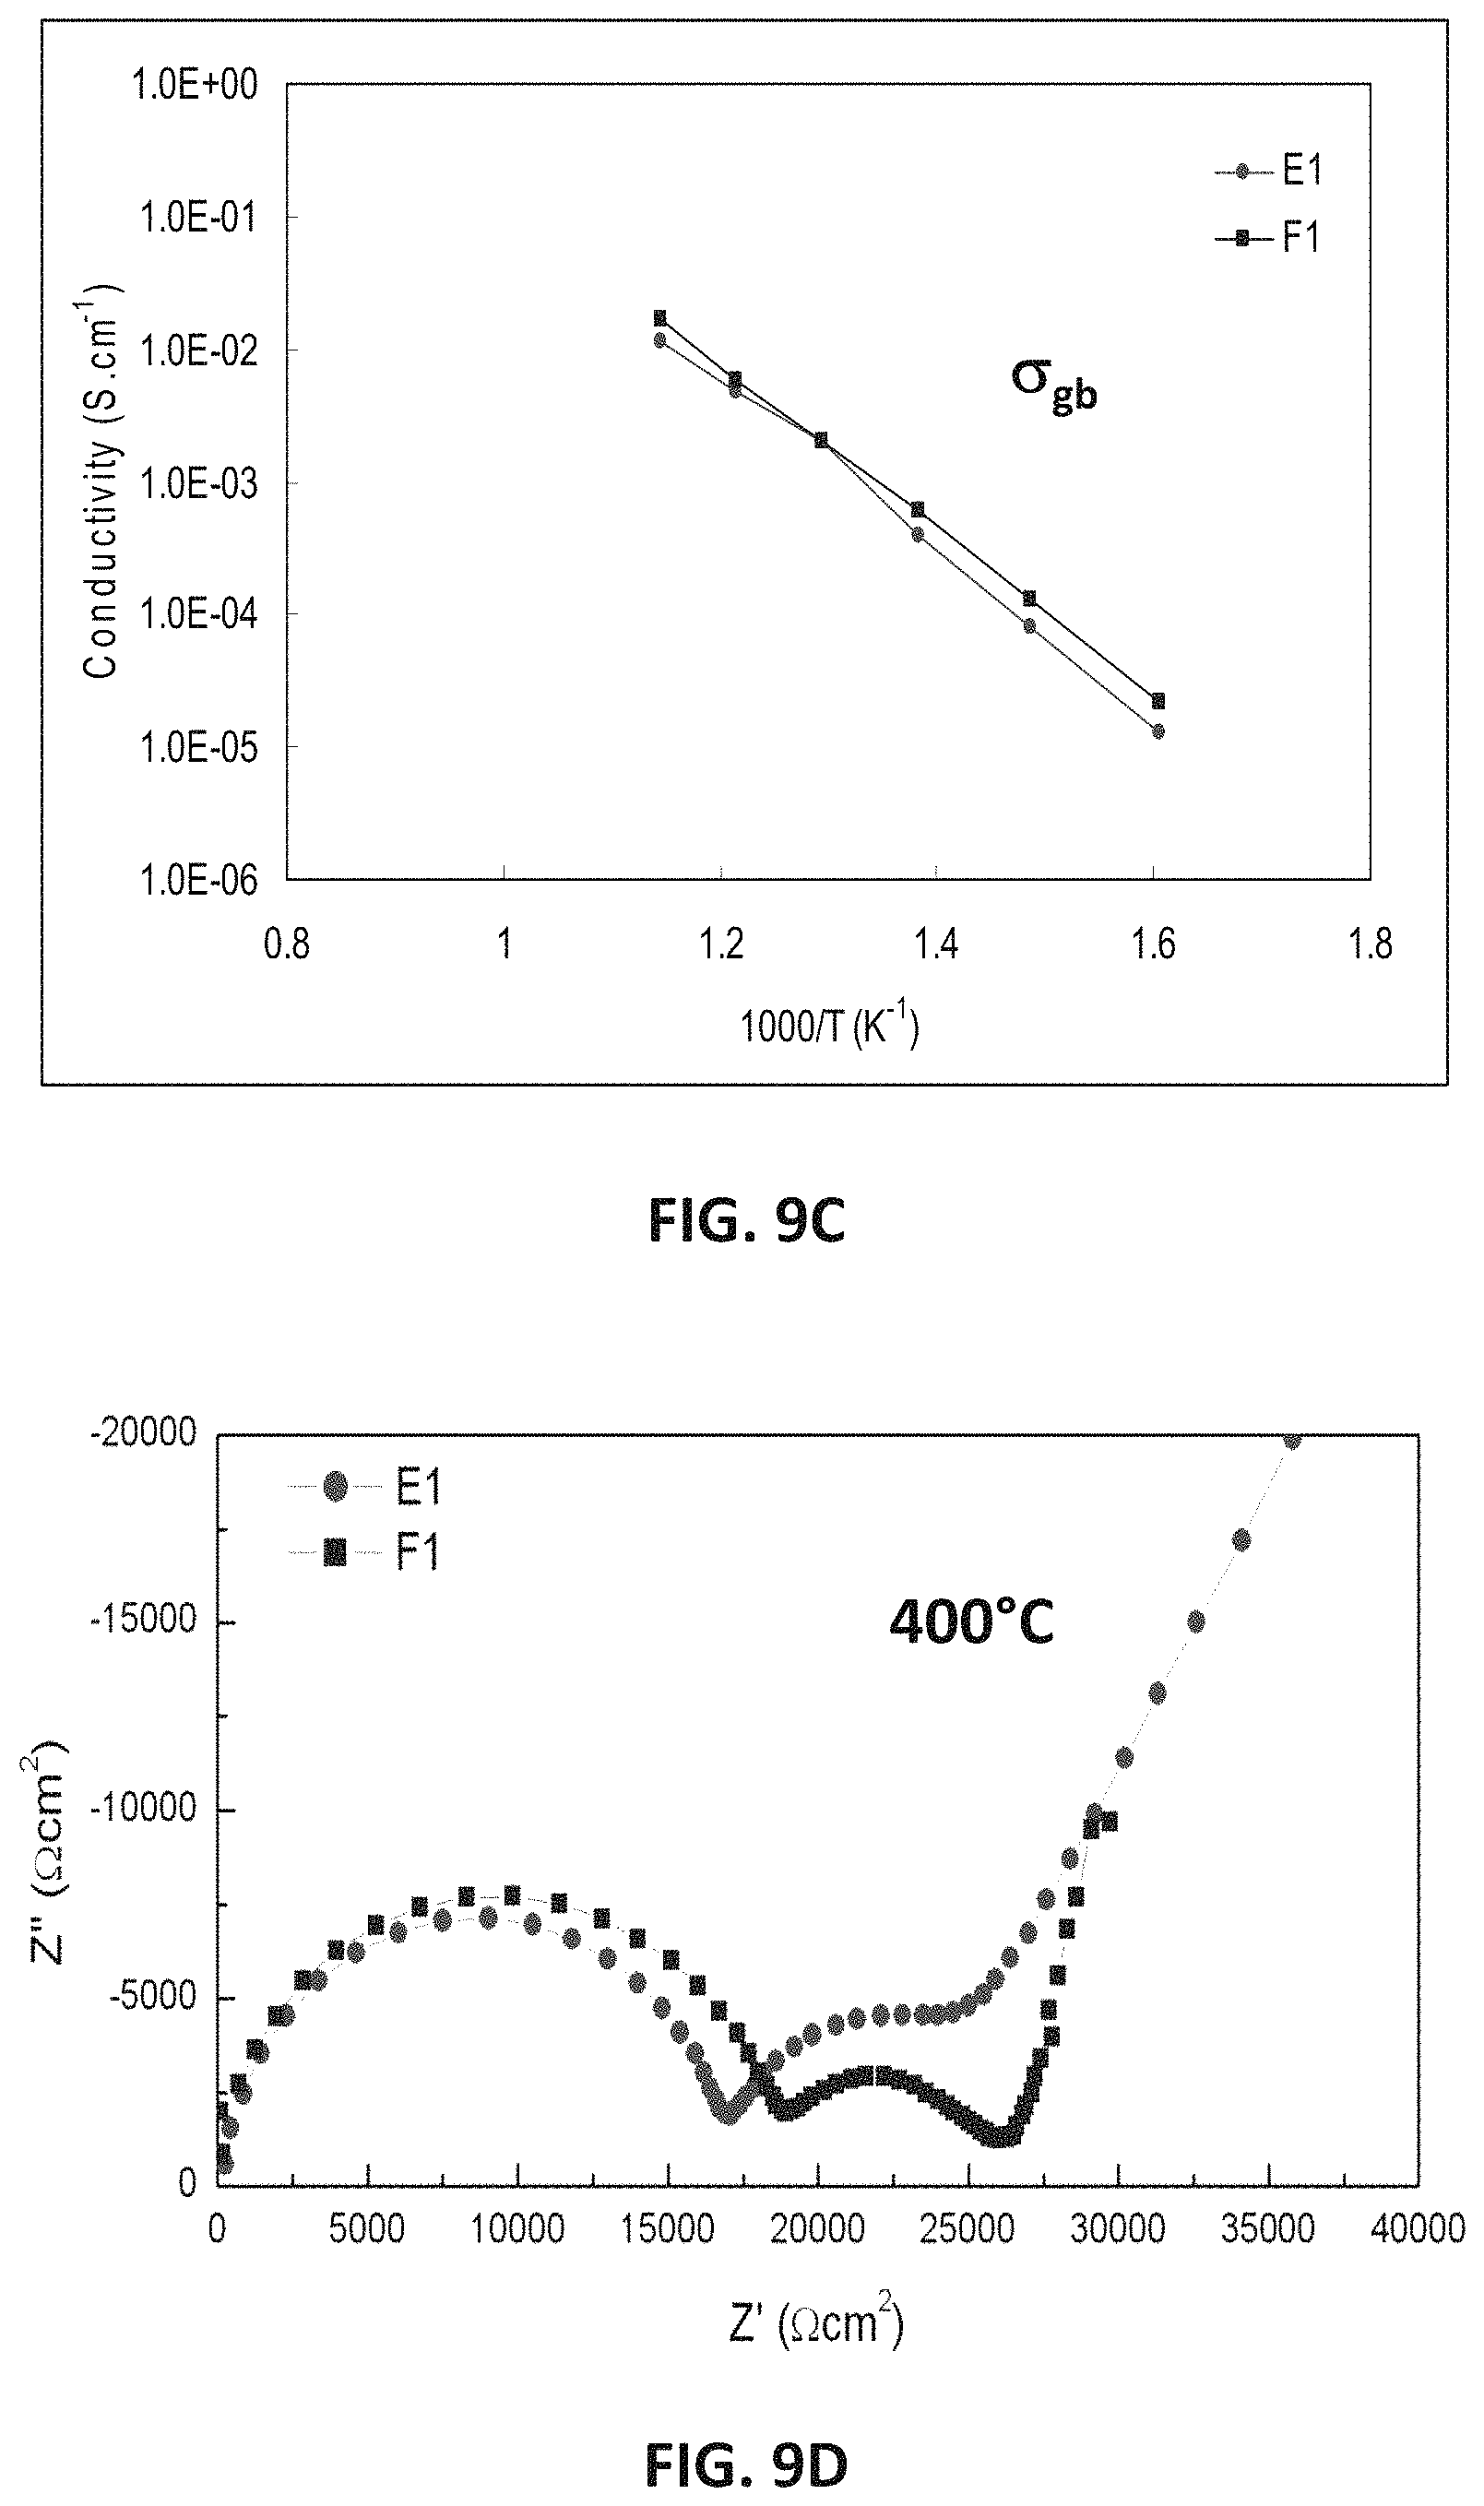
FIGS. 9A-9D are graphs showing electrical impedance spectroscopy results for sample compositions in two embodiment series of yttria and magnesia doped scandia stabilized zirconia compositions.
FIG. 10A is a graph showing D.C. conductivity versus atomic percentage of scandium ions at 850.degree. C. for embodiment series of magnesia doped scandia stabilized zirconia compositions and yttria and magnesia doped scandia stabilized zirconia compositions.
FIG. 10B is a graph showing D.C. conductivity versus oxygen stoichiometry at 850.degree. C. for embodiment series of magnesia doped scandia stabilized zirconia compositions and yttria and magnesia doped scandia stabilized zirconia compositions.
FIG. 11A is a plot showing x-ray diffraction patterns for sample compositions in an embodiment series of zinc oxide doped scandia stabilized zirconia compositions.
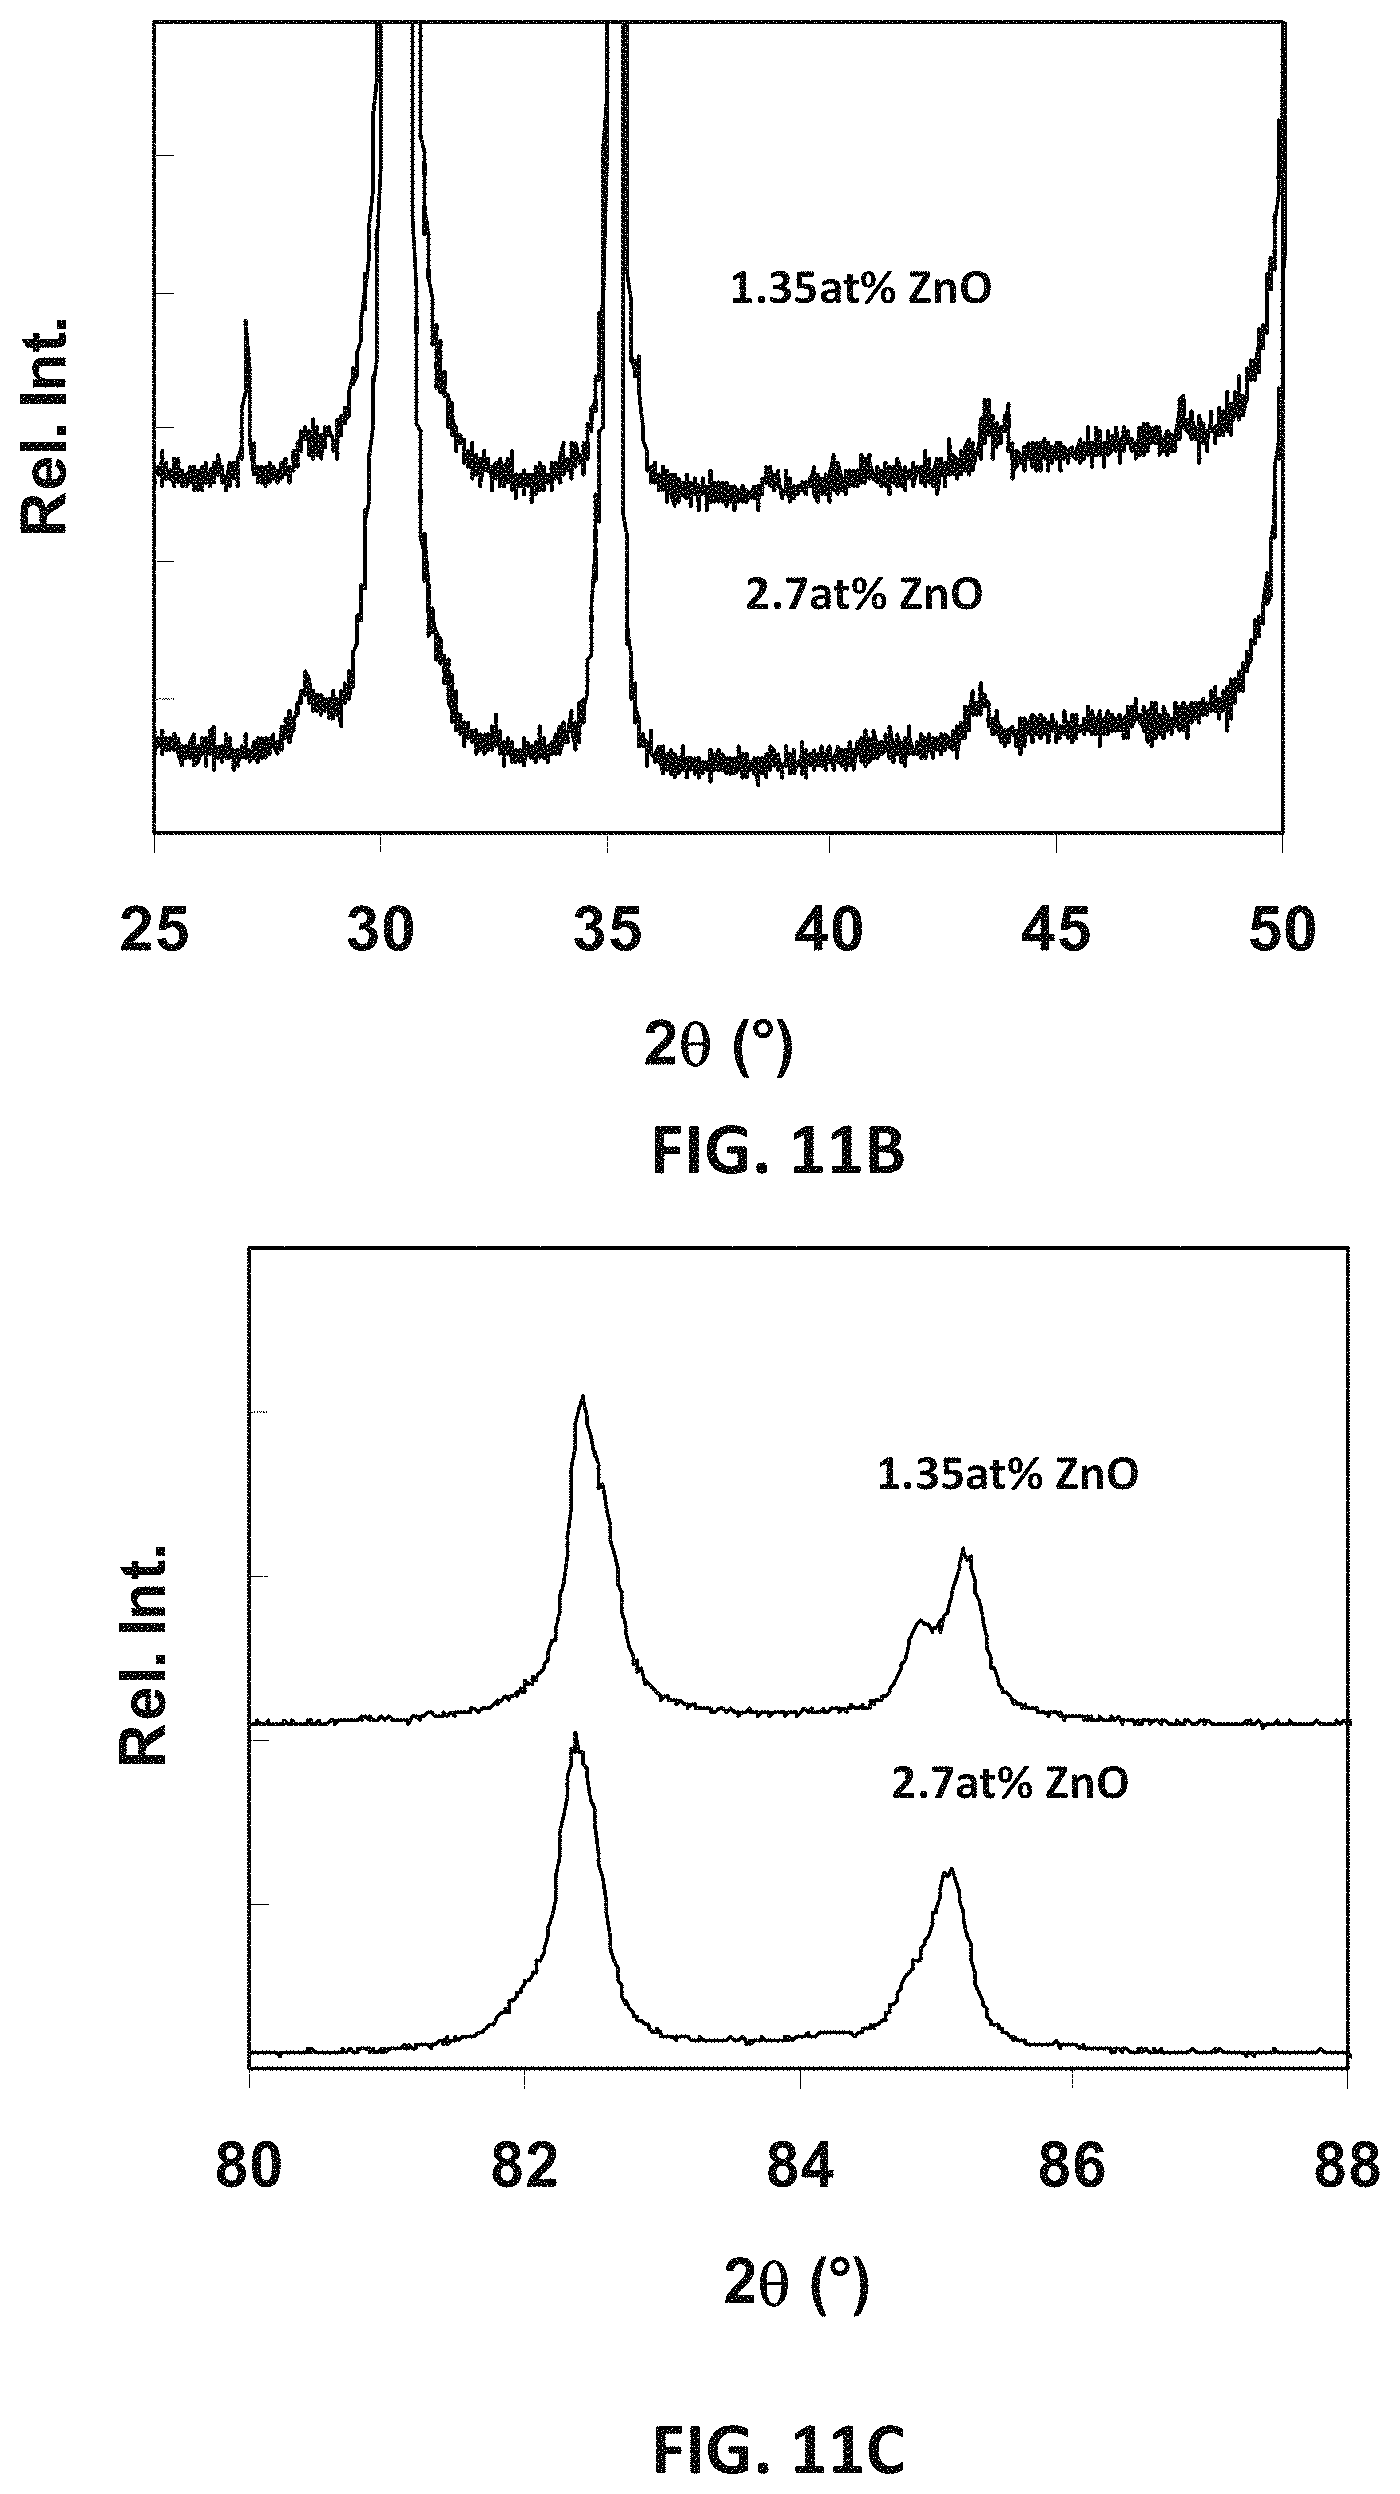
FIG. 11B is an expanded view of the x-ray diffraction patterns of FIG. 11A for angles within the range of 2.theta.=25-50.
FIG. 11C is an expanded view of the x-ray diffraction patterns of FIG. 11A for angles within the range of 2.theta.=80-88.
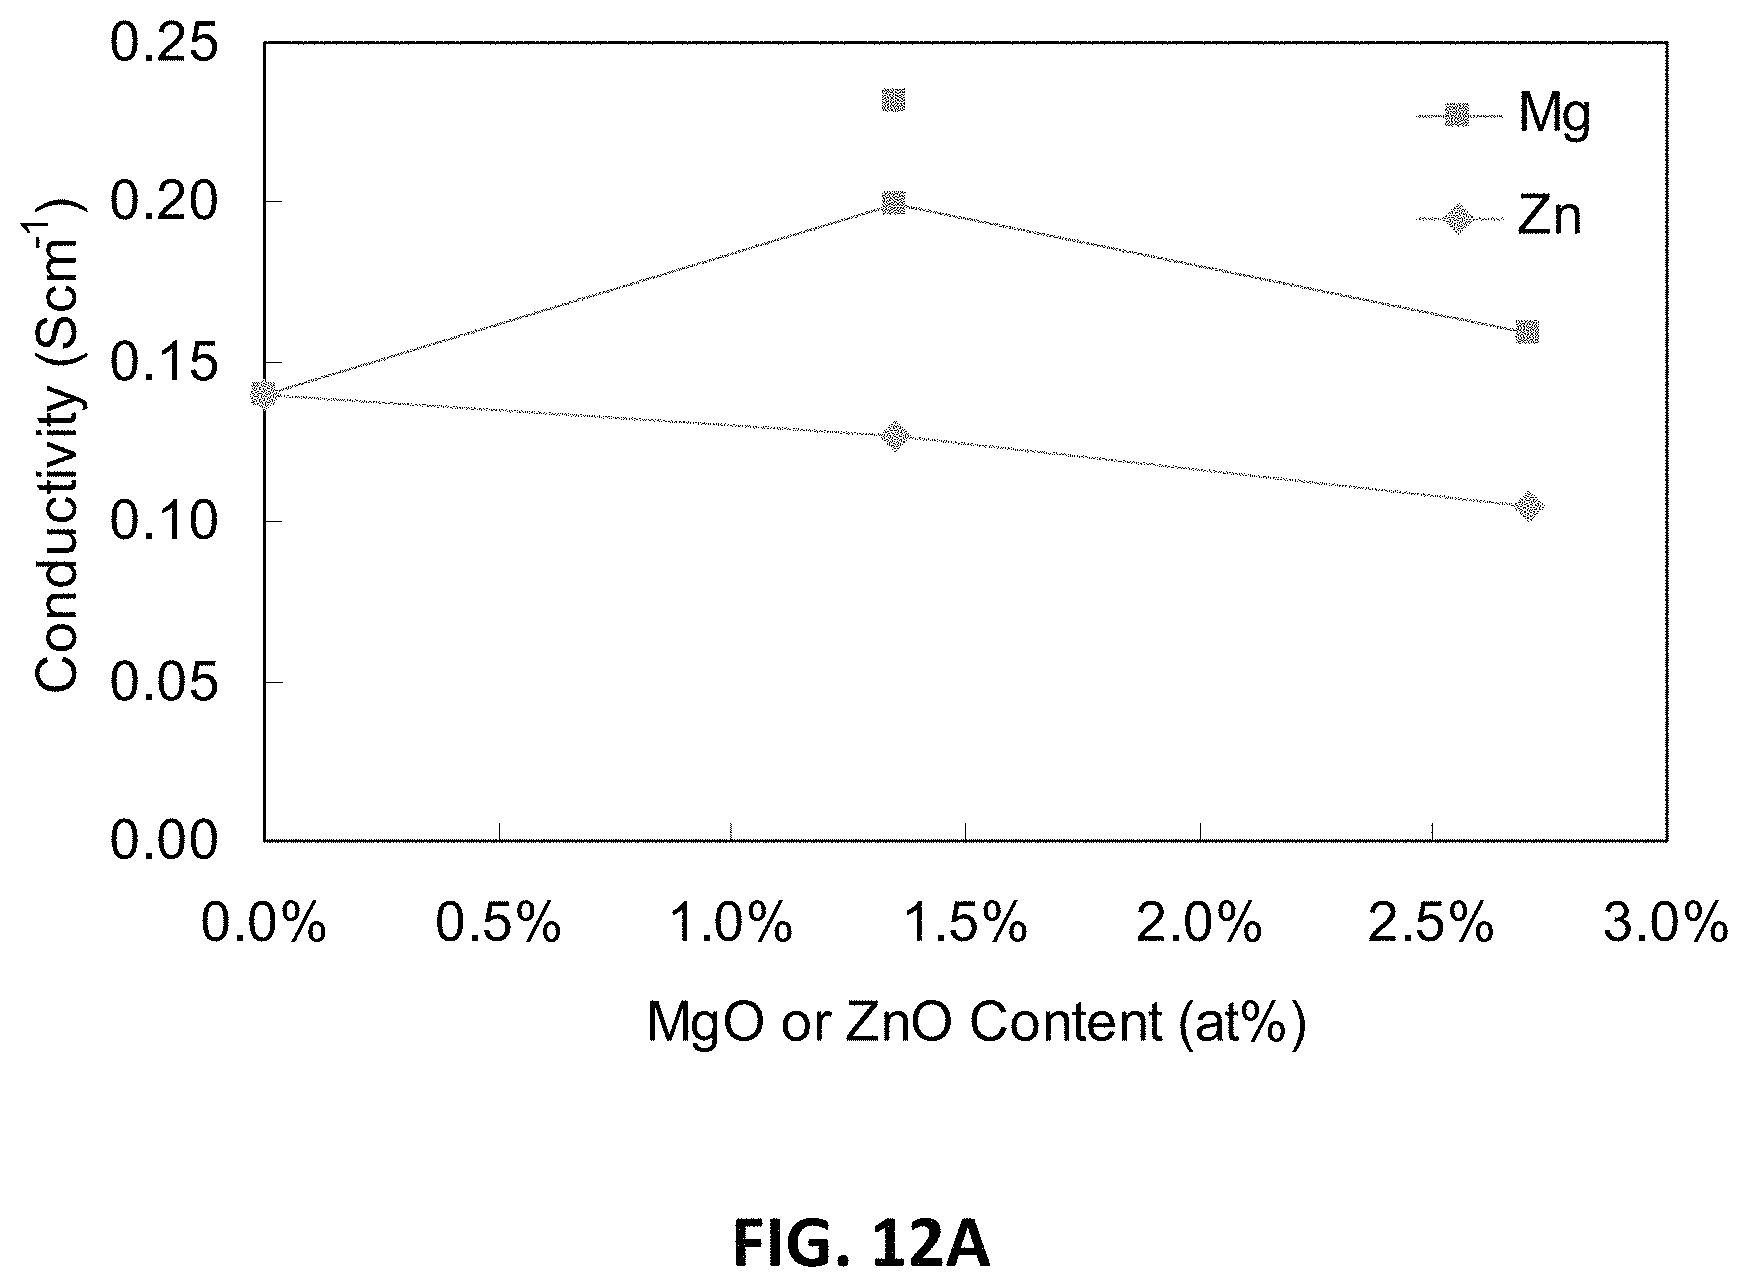
FIG. 12A is a graph comparing D.C. conductivities at 850.degree. C. of an embodiment series of magnesia doped scandia stabilized zirconia compositions and a similar series of zinc oxide doped scandia stabilized zirconia compositions.
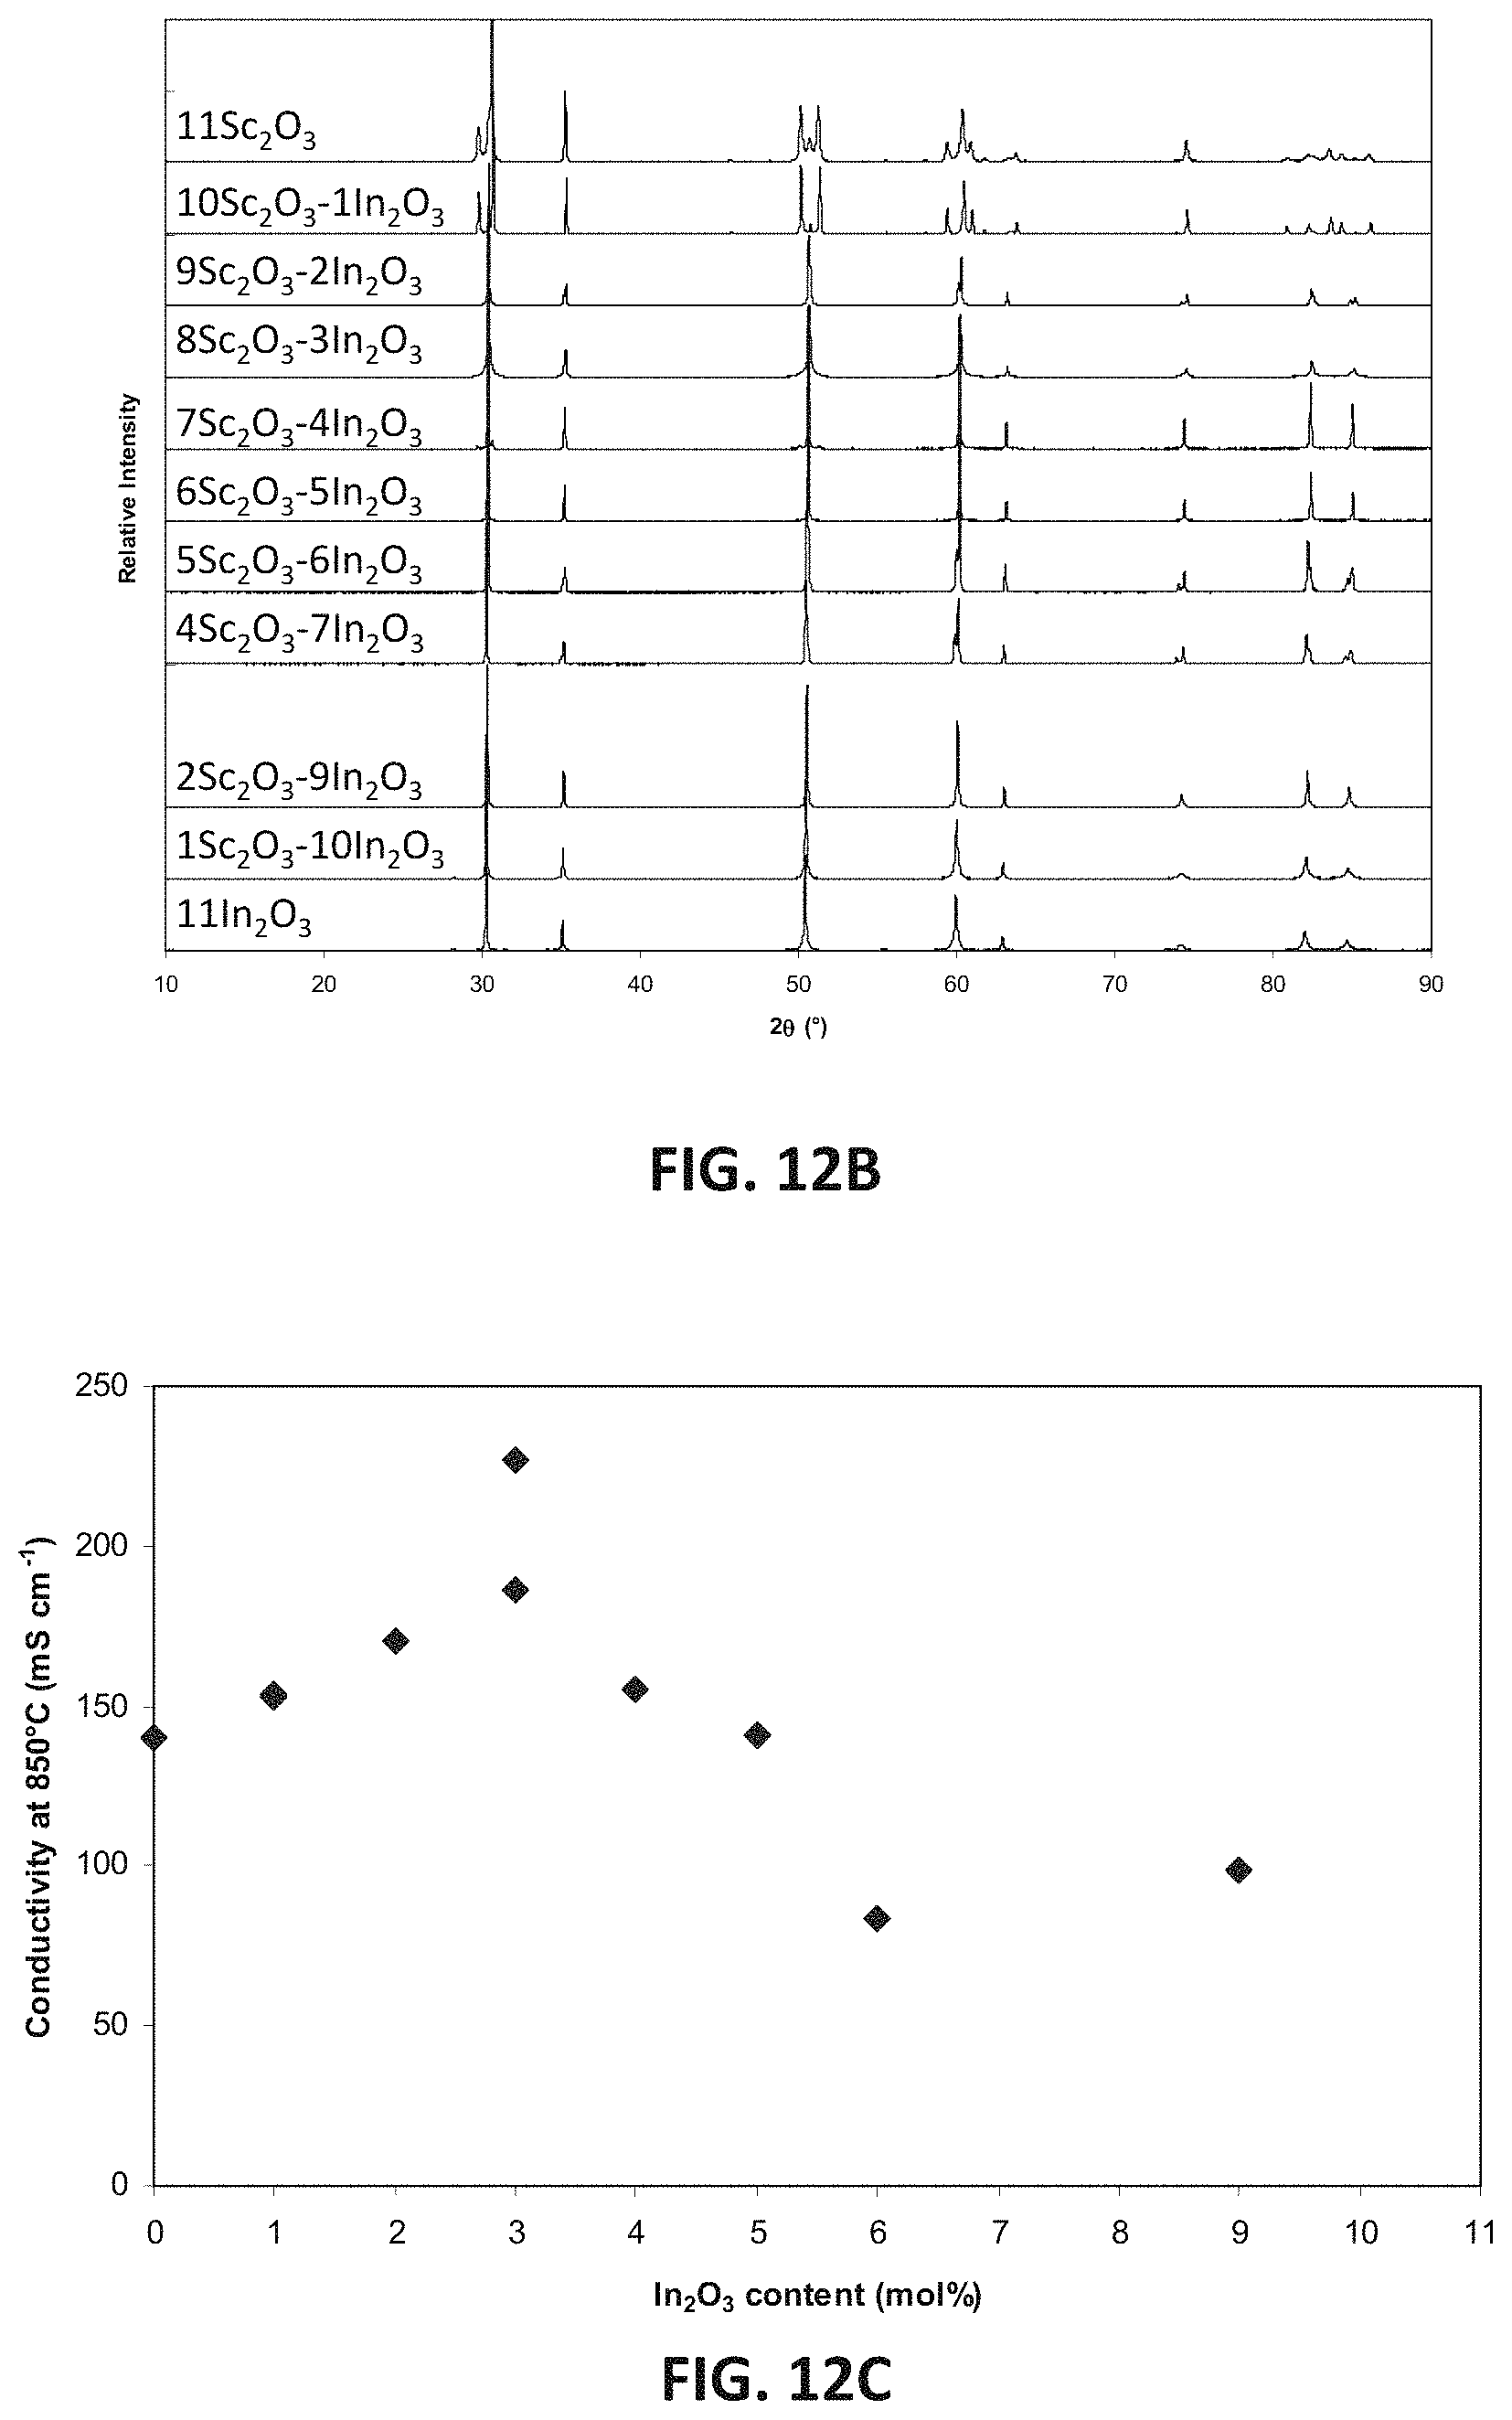
FIG. 12B is a plot showing x-ray diffraction patterns for an embodiment series of indium oxide doped scandia stabilized zirconia compositions.
FIG. 12C is a graph showing D.C. conductivity versus mole percent of indium oxide at 850.degree. C. for an embodiment series of indium oxide doped scandia stabilized zirconia compositions.
FIG. 13A is plot showing electron diffraction spectroscopy patterns for an embodiment series of indium oxide and magnesia doped scandia stabilized zirconia compositions and an embodiment series of indium oxide doped scandia stabilized zirconia compositions.
FIG. 13B is a plot showing x-ray diffraction patterns for sample compositions in embodiment series of scandia stabilized zirconia compositions doped with varying amounts of indium oxide and magnesia.
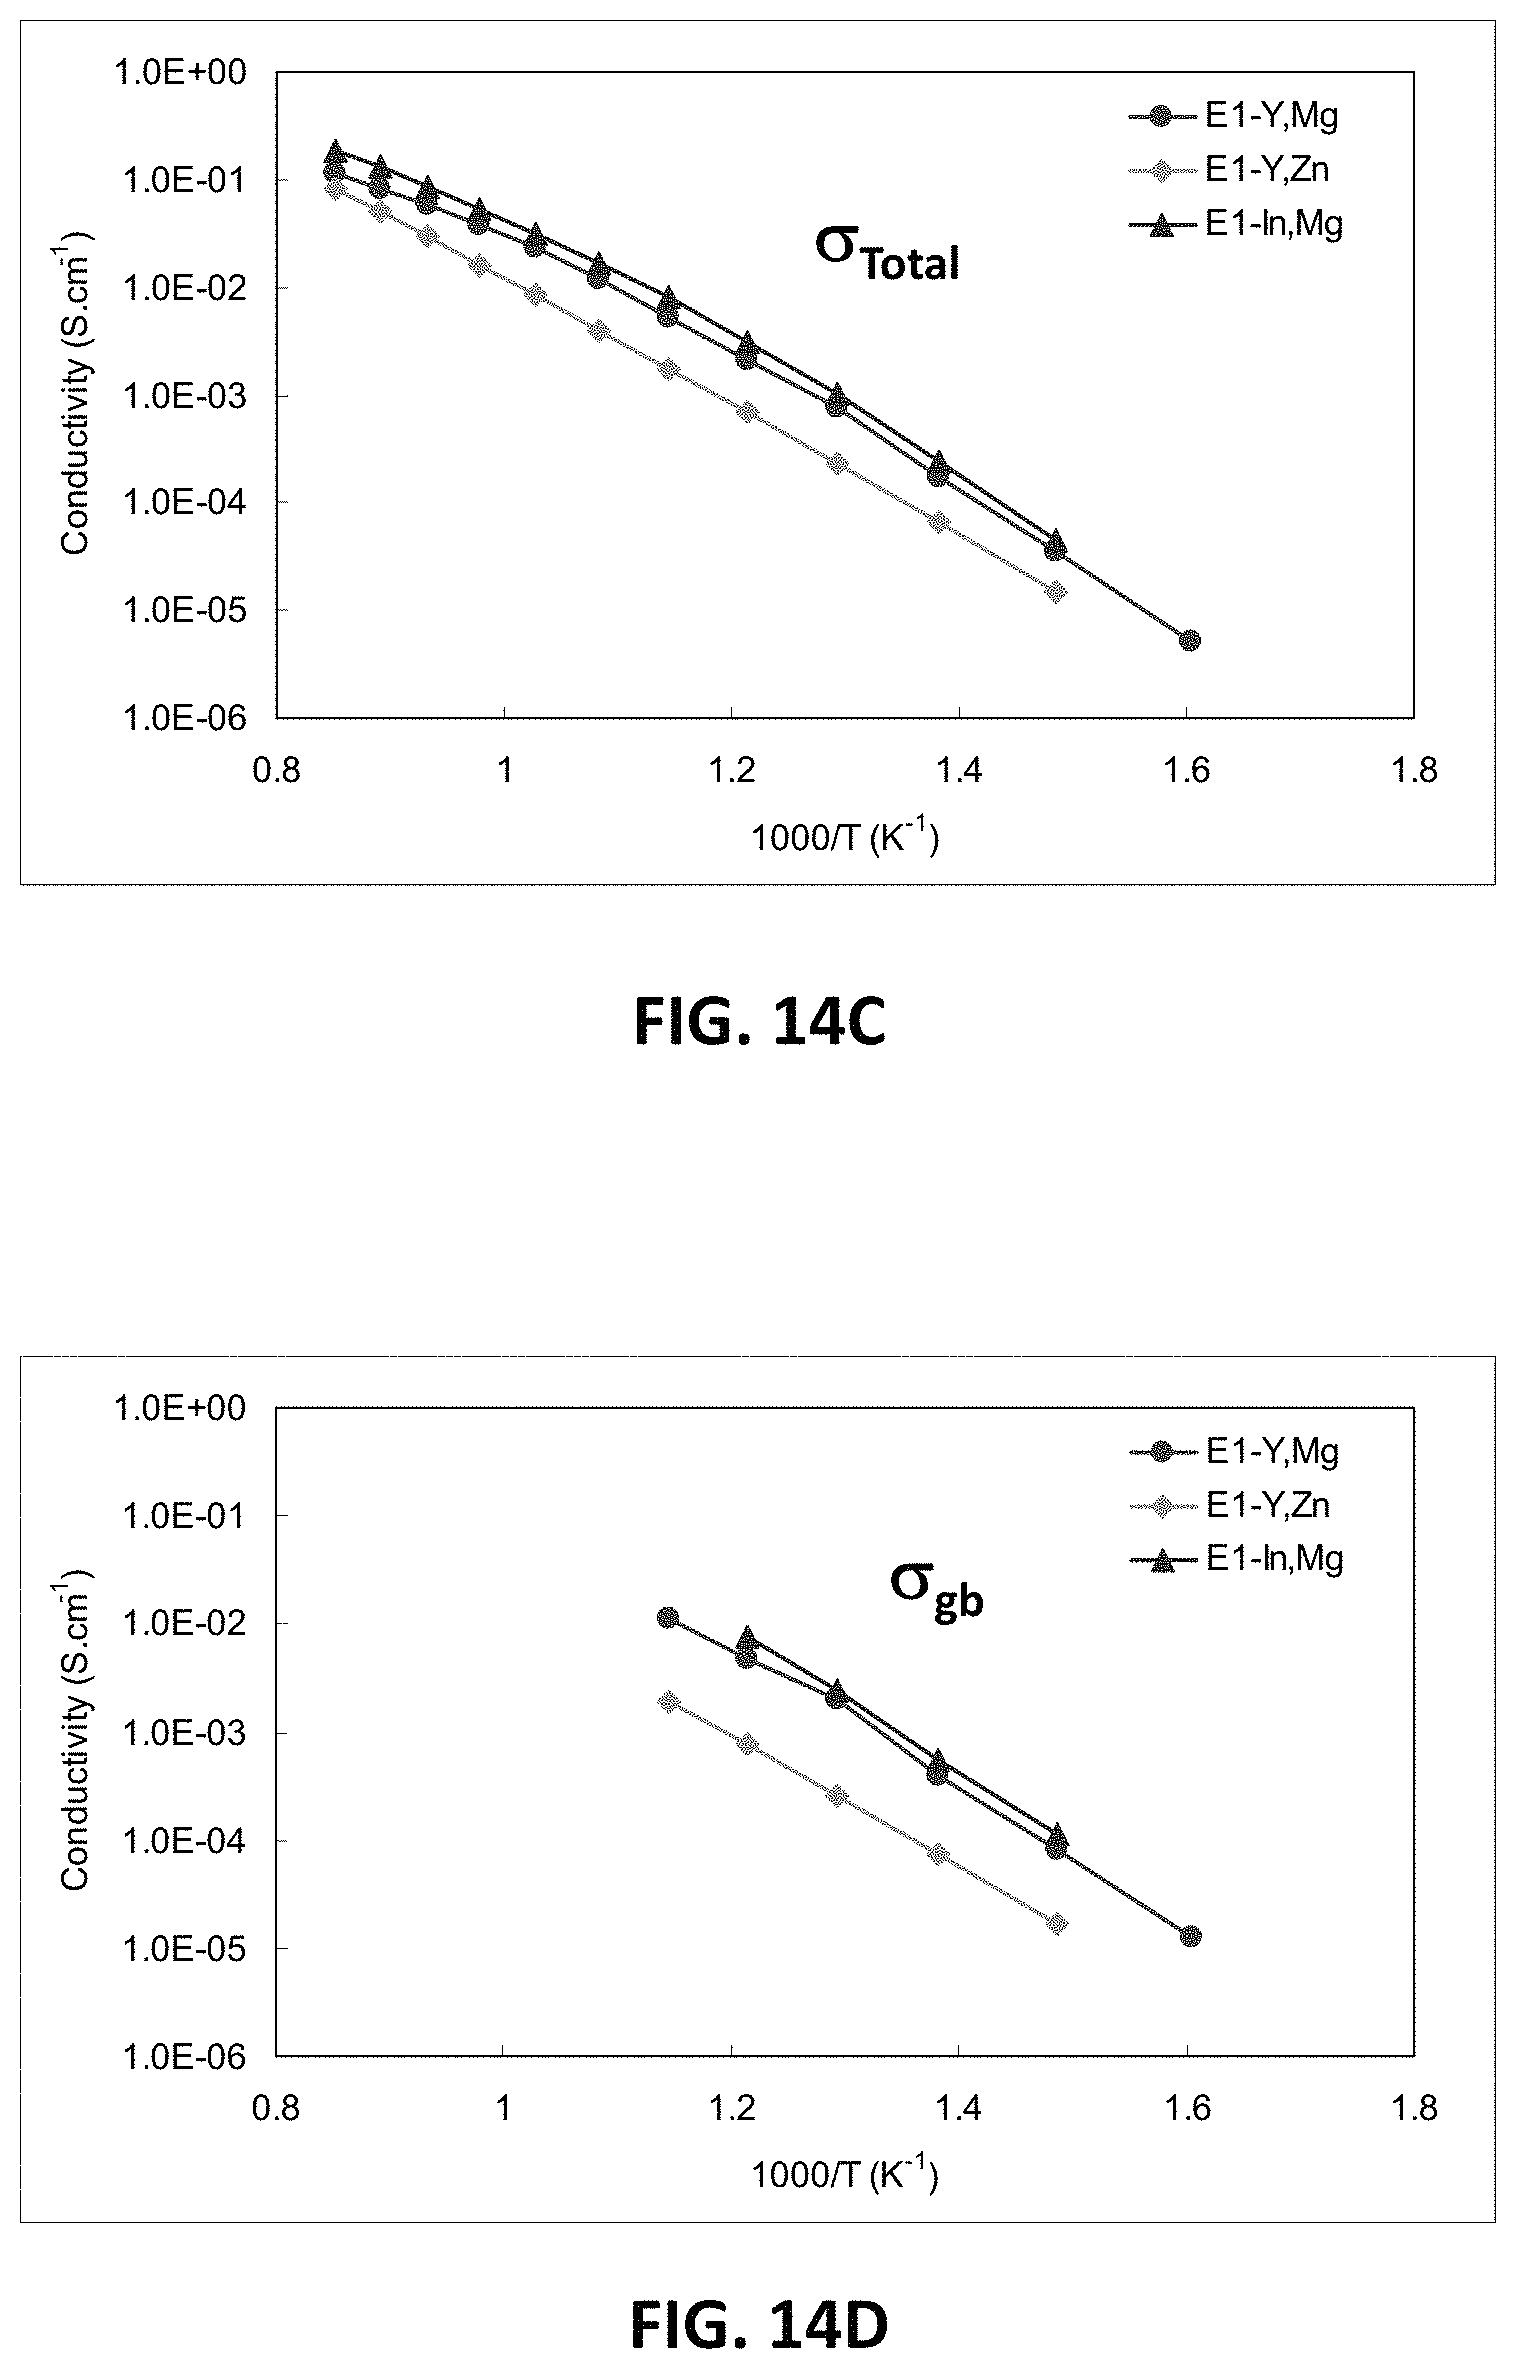
FIGS. 14A-14D are graphs showing electrical impedance spectroscopy results for sample compositions in embodiment series of scandia stabilized zirconia compositions doped with varying amounts of yttria, magnesia, indium oxide, and/or zinc oxide.
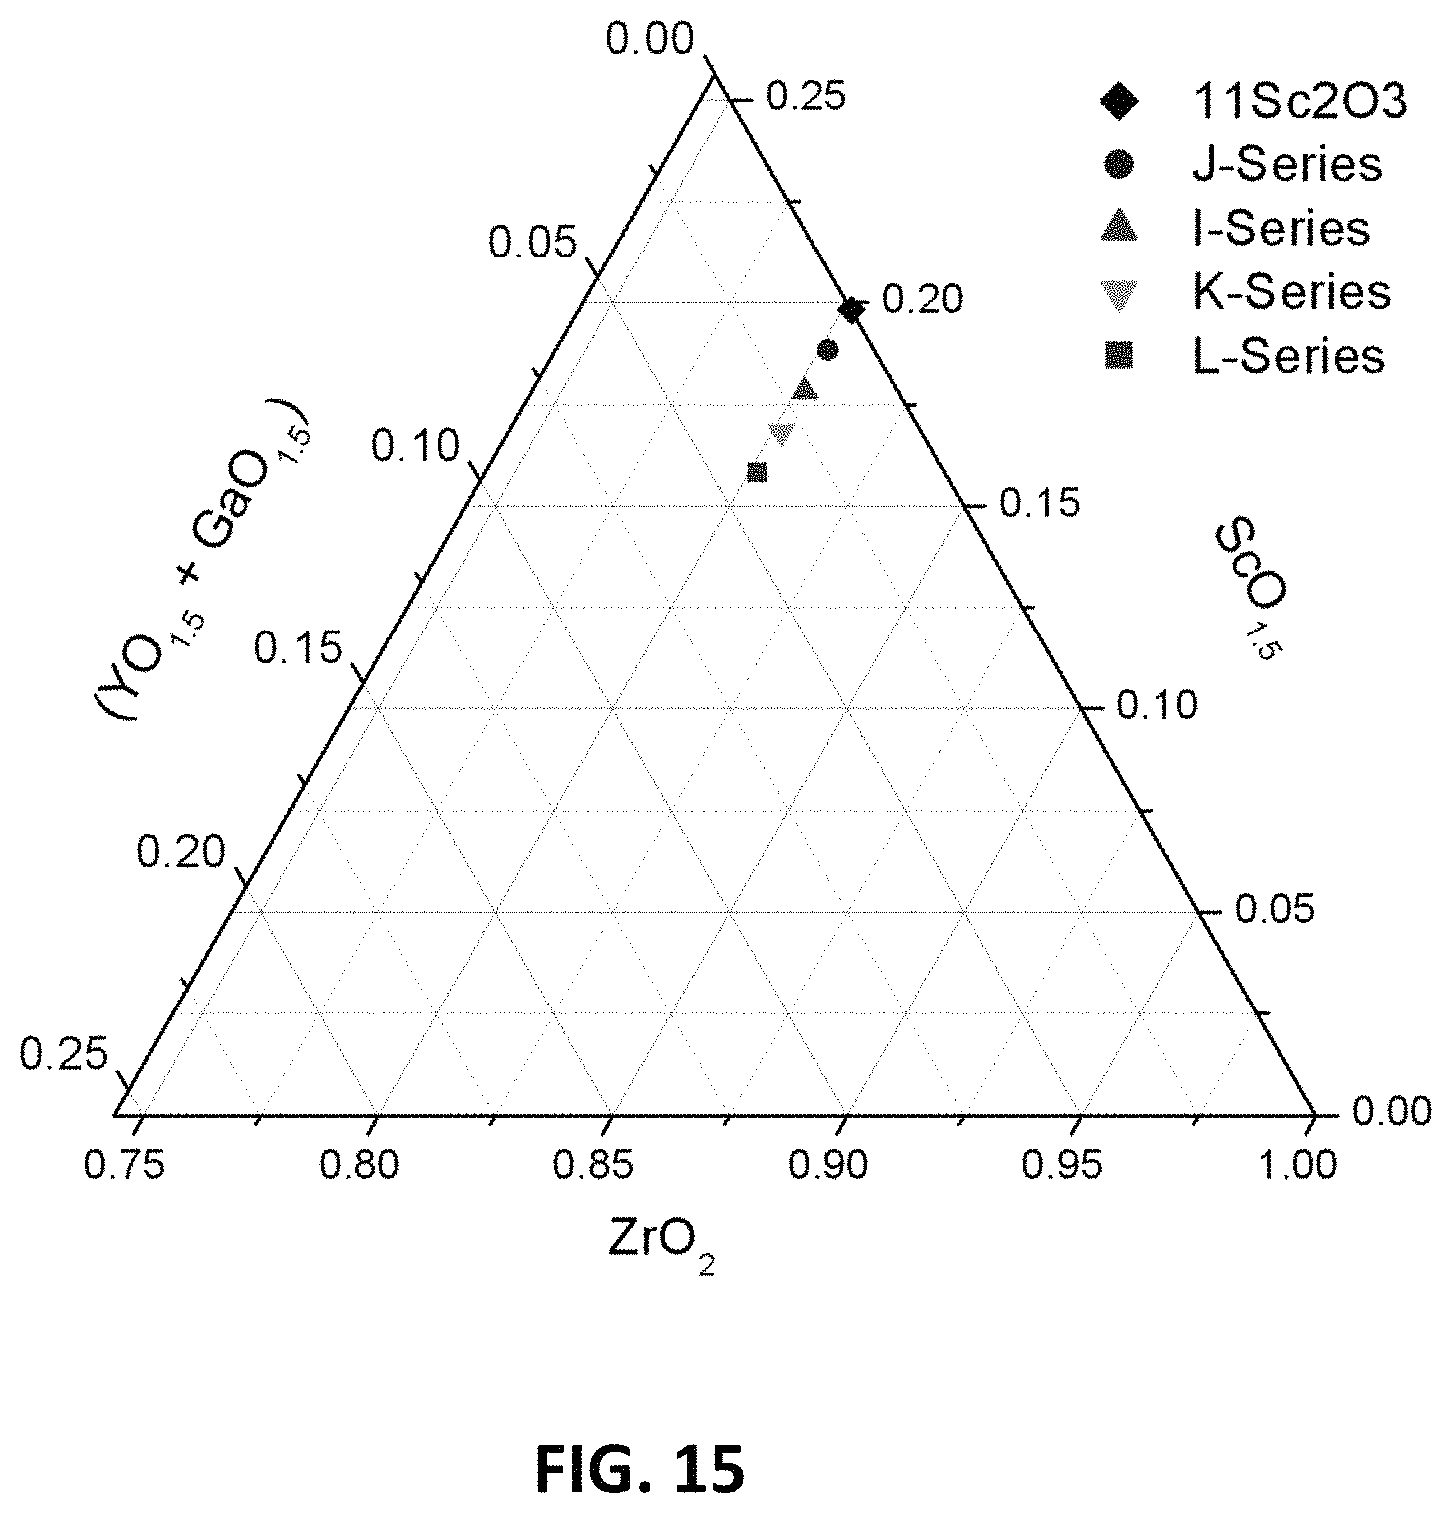
FIG. 15 is a ternary phase diagram of embodiment series of scandia stabilized zirconia compositions doped with varying amounts of yttria and gallium oxide.
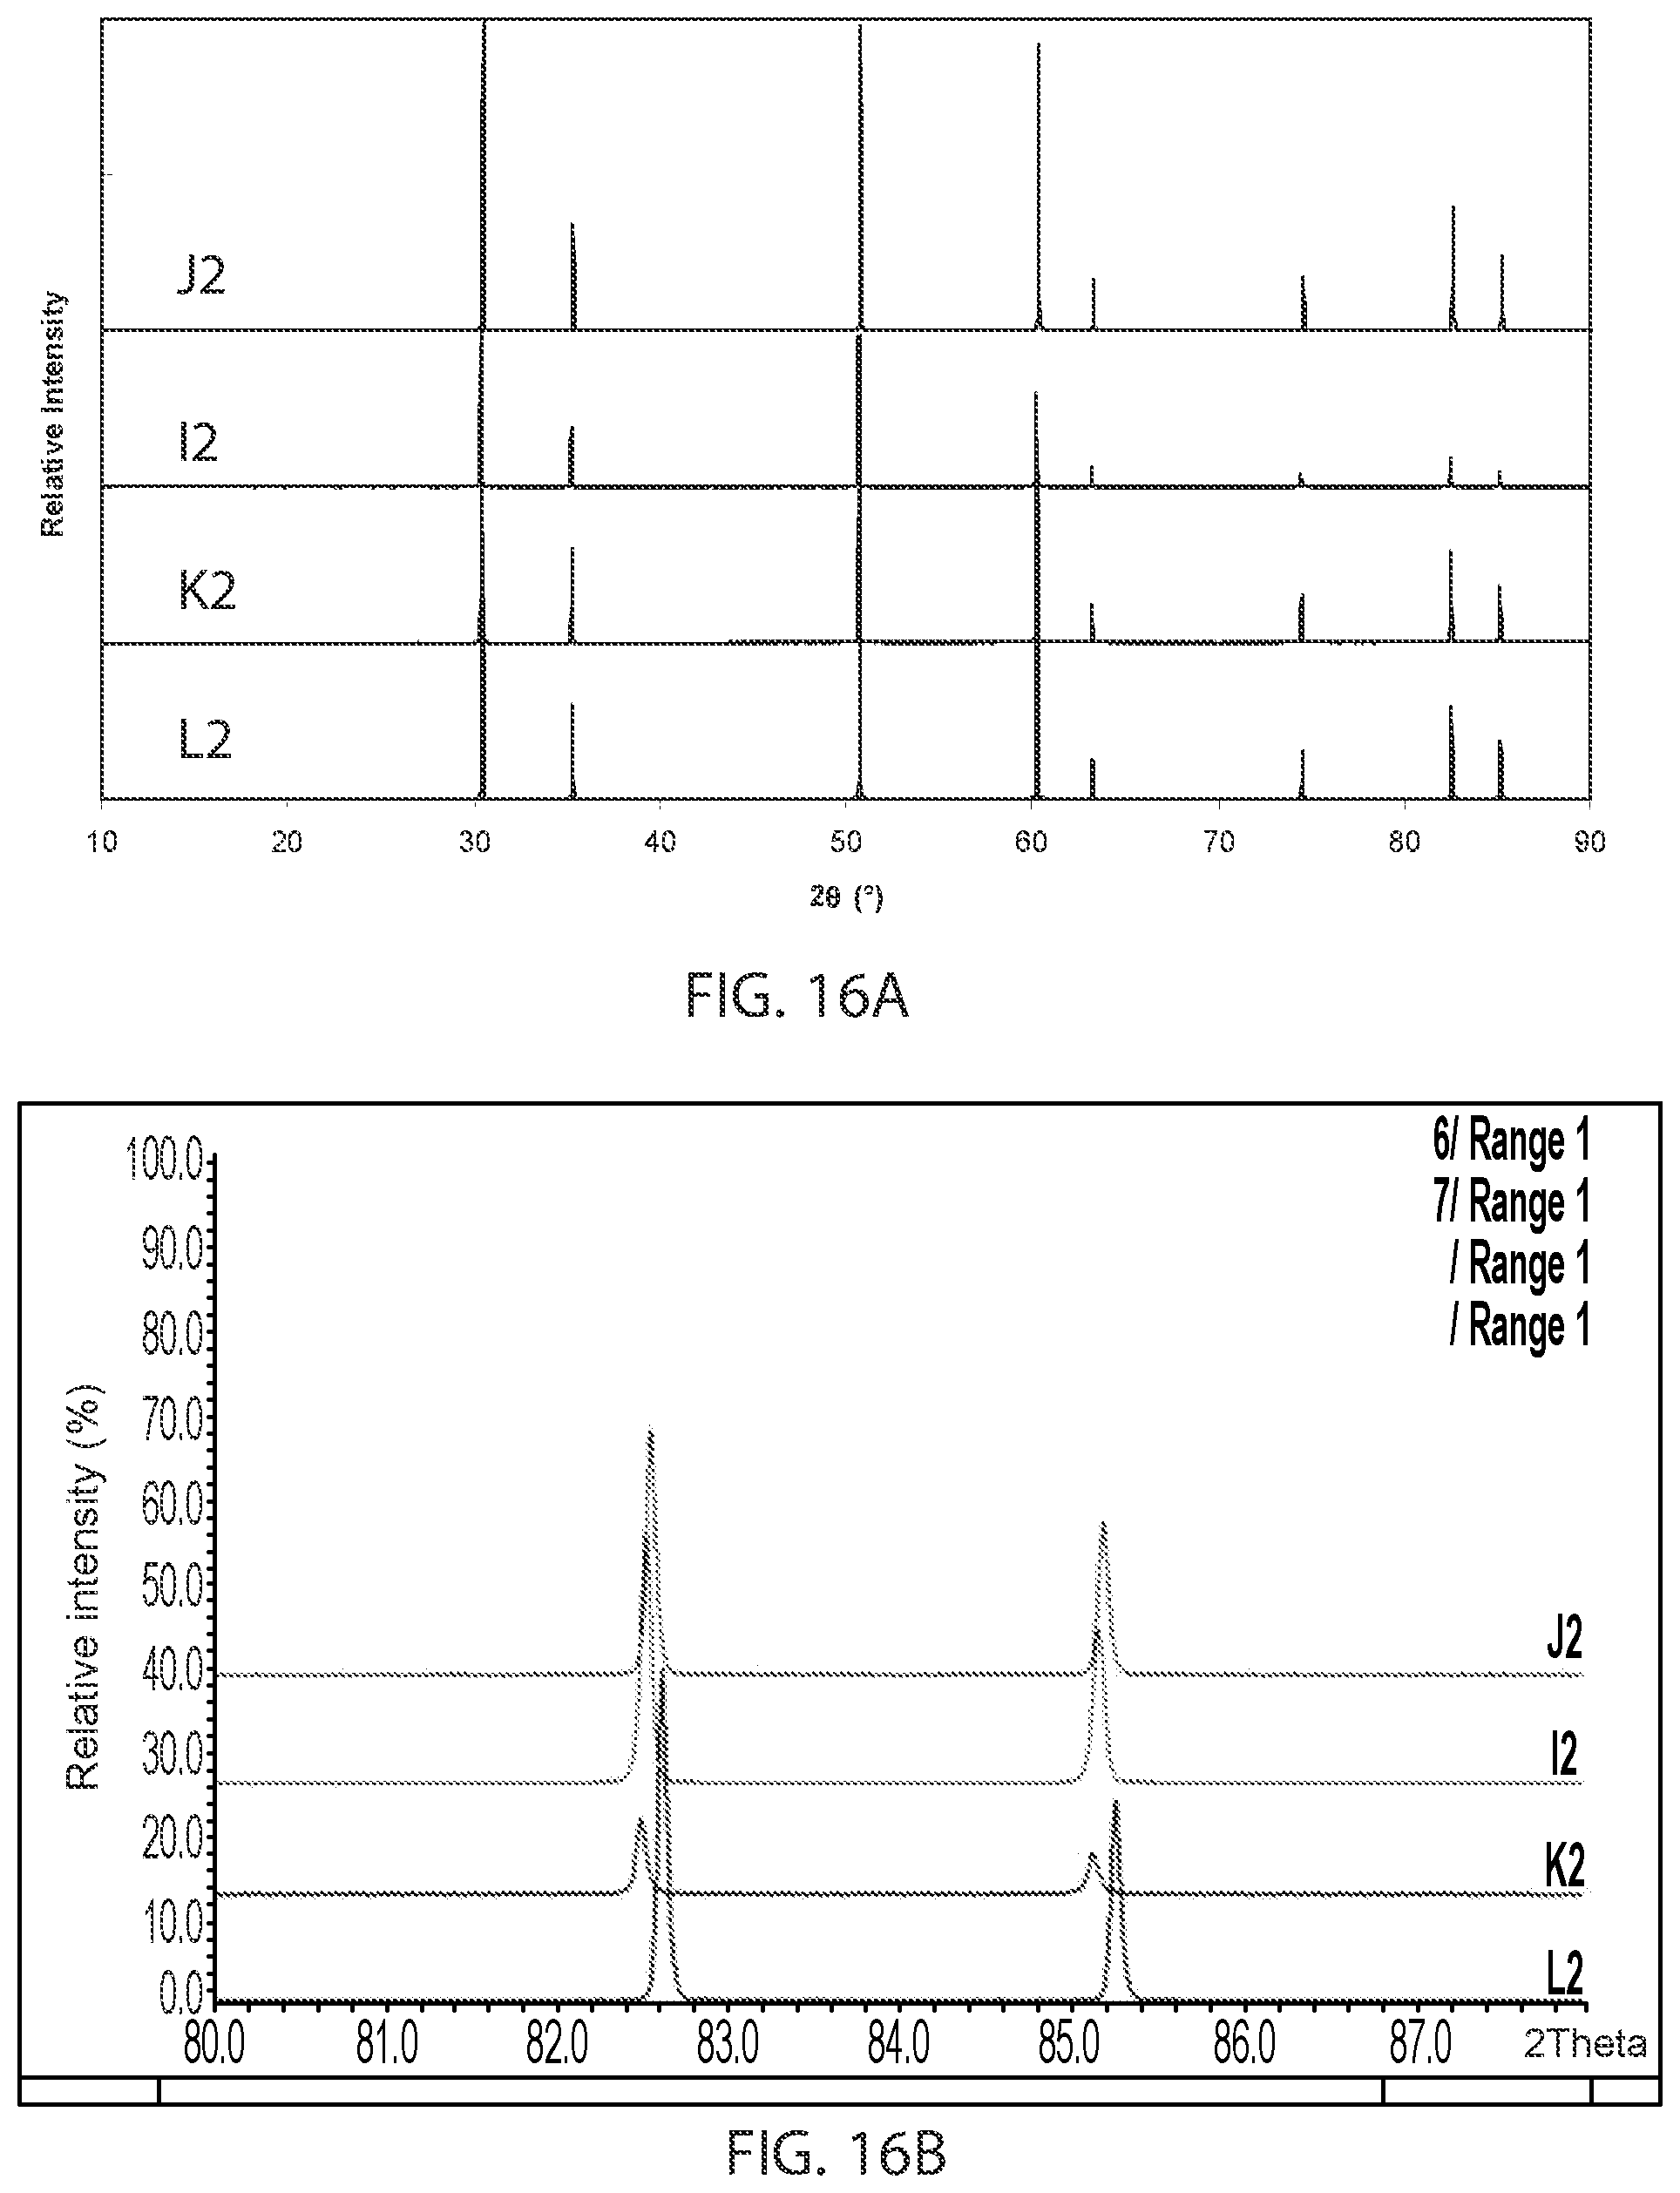
FIG. 16A is a plot showing x-ray diffraction patterns for sample compositions in embodiment series of scandia stabilized zirconia compositions doped with varying amounts of yttria and gallium oxide.
FIG. 16B is an expanded view of the x-ray diffraction patterns of FIG. 16A for angles within the range of 2.theta.=82-85.
FIG. 17A is a graph showing D.C. conductivity versus atomic percentage of yttrium and gallium ions at 850.degree. C. for embodiment series of scandia stabilized zirconia compositions doped with varying amounts of yttria and gallium oxide.
FIG. 17B is a graph showing D.C. conductivity versus atomic percentage of scandium ions at 850.degree. C. for embodiment series of scandia stabilized zirconia compositions doped with varying amounts of yttria and gallium oxide.
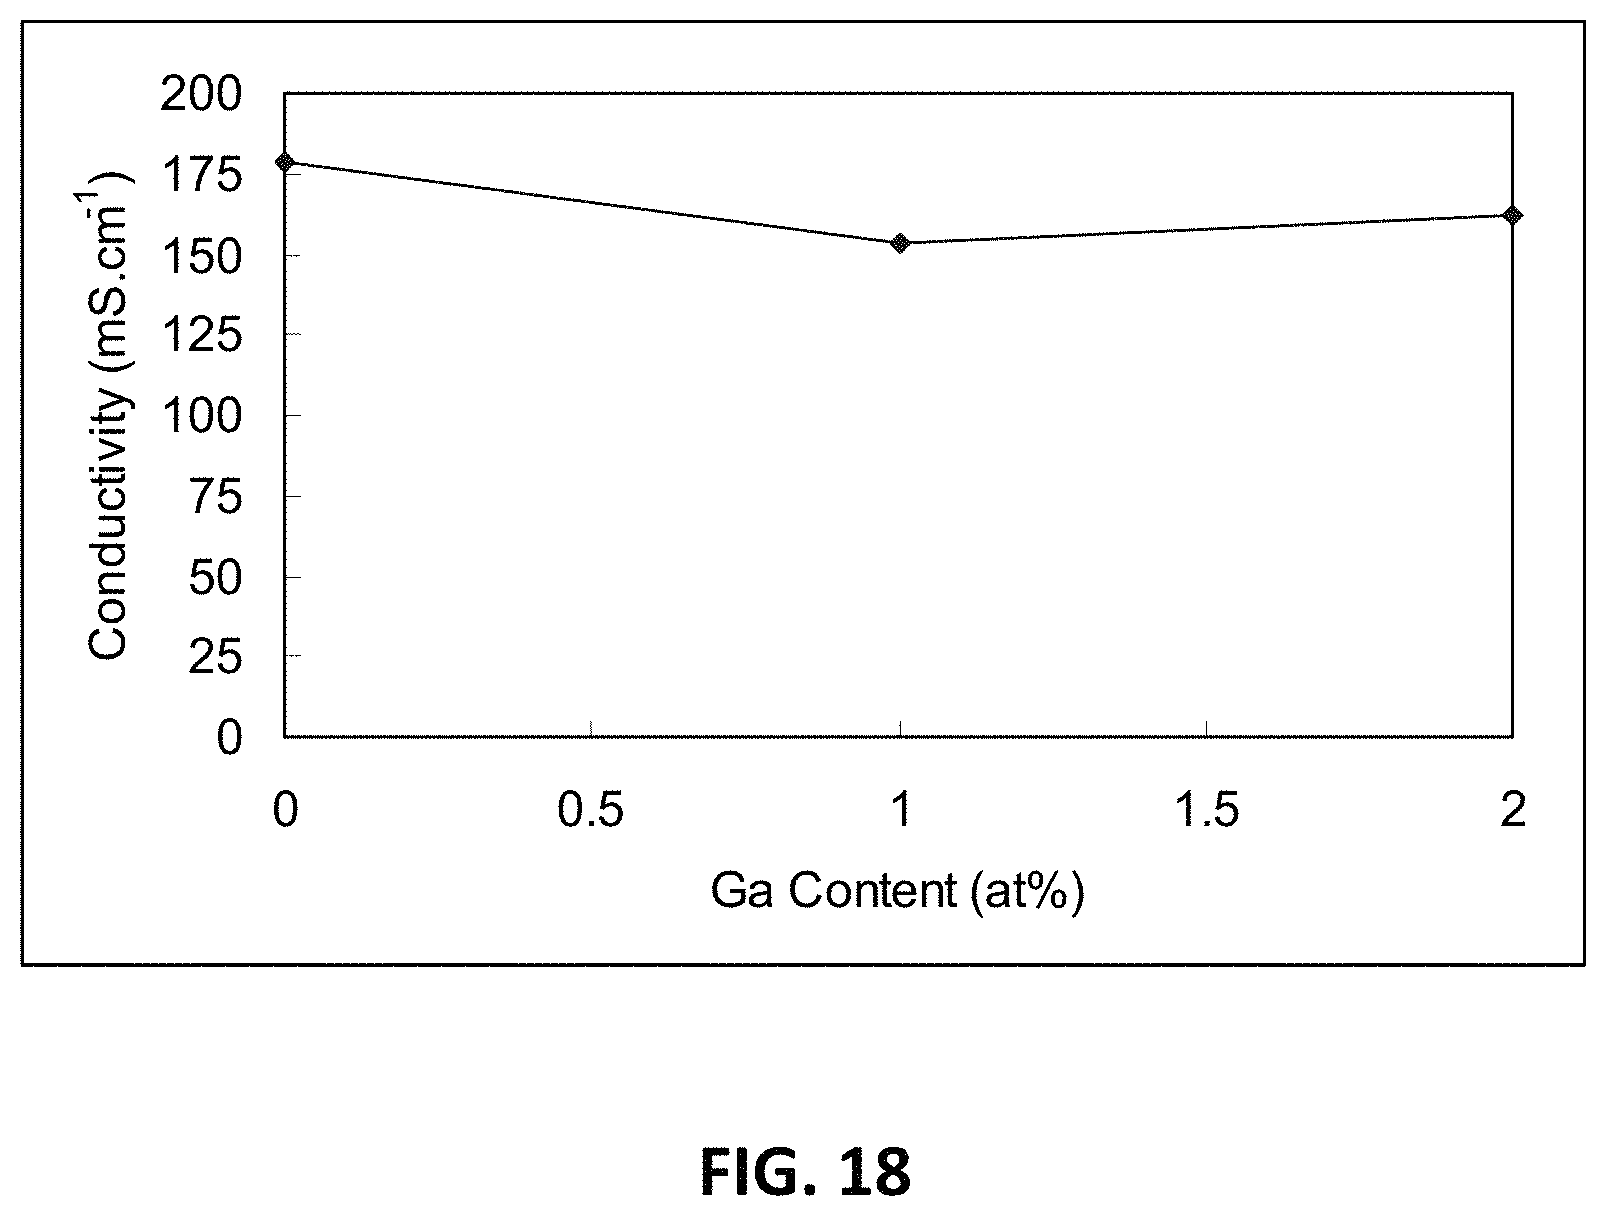
FIG. 18 is a graph showing D.C. conductivity versus atomic percentage of gallium ions at 850.degree. C. for an embodiment series of scandia stabilized zirconia compositions doped with yttria, gallium oxide, and magnesia.
FIG. 19A is a graph showing D.C. conductivities as a function of scandium content for sample compositions of various series of scandia stabilized zirconia doped with indium oxide and ceria at 850.degree. C.
FIG. 19B is a graph showing D.C. conductivities as a function of indium content for sample compositions of various series of scandia stabilized zirconia doped with indium oxide and ceria at 850.degree. C.
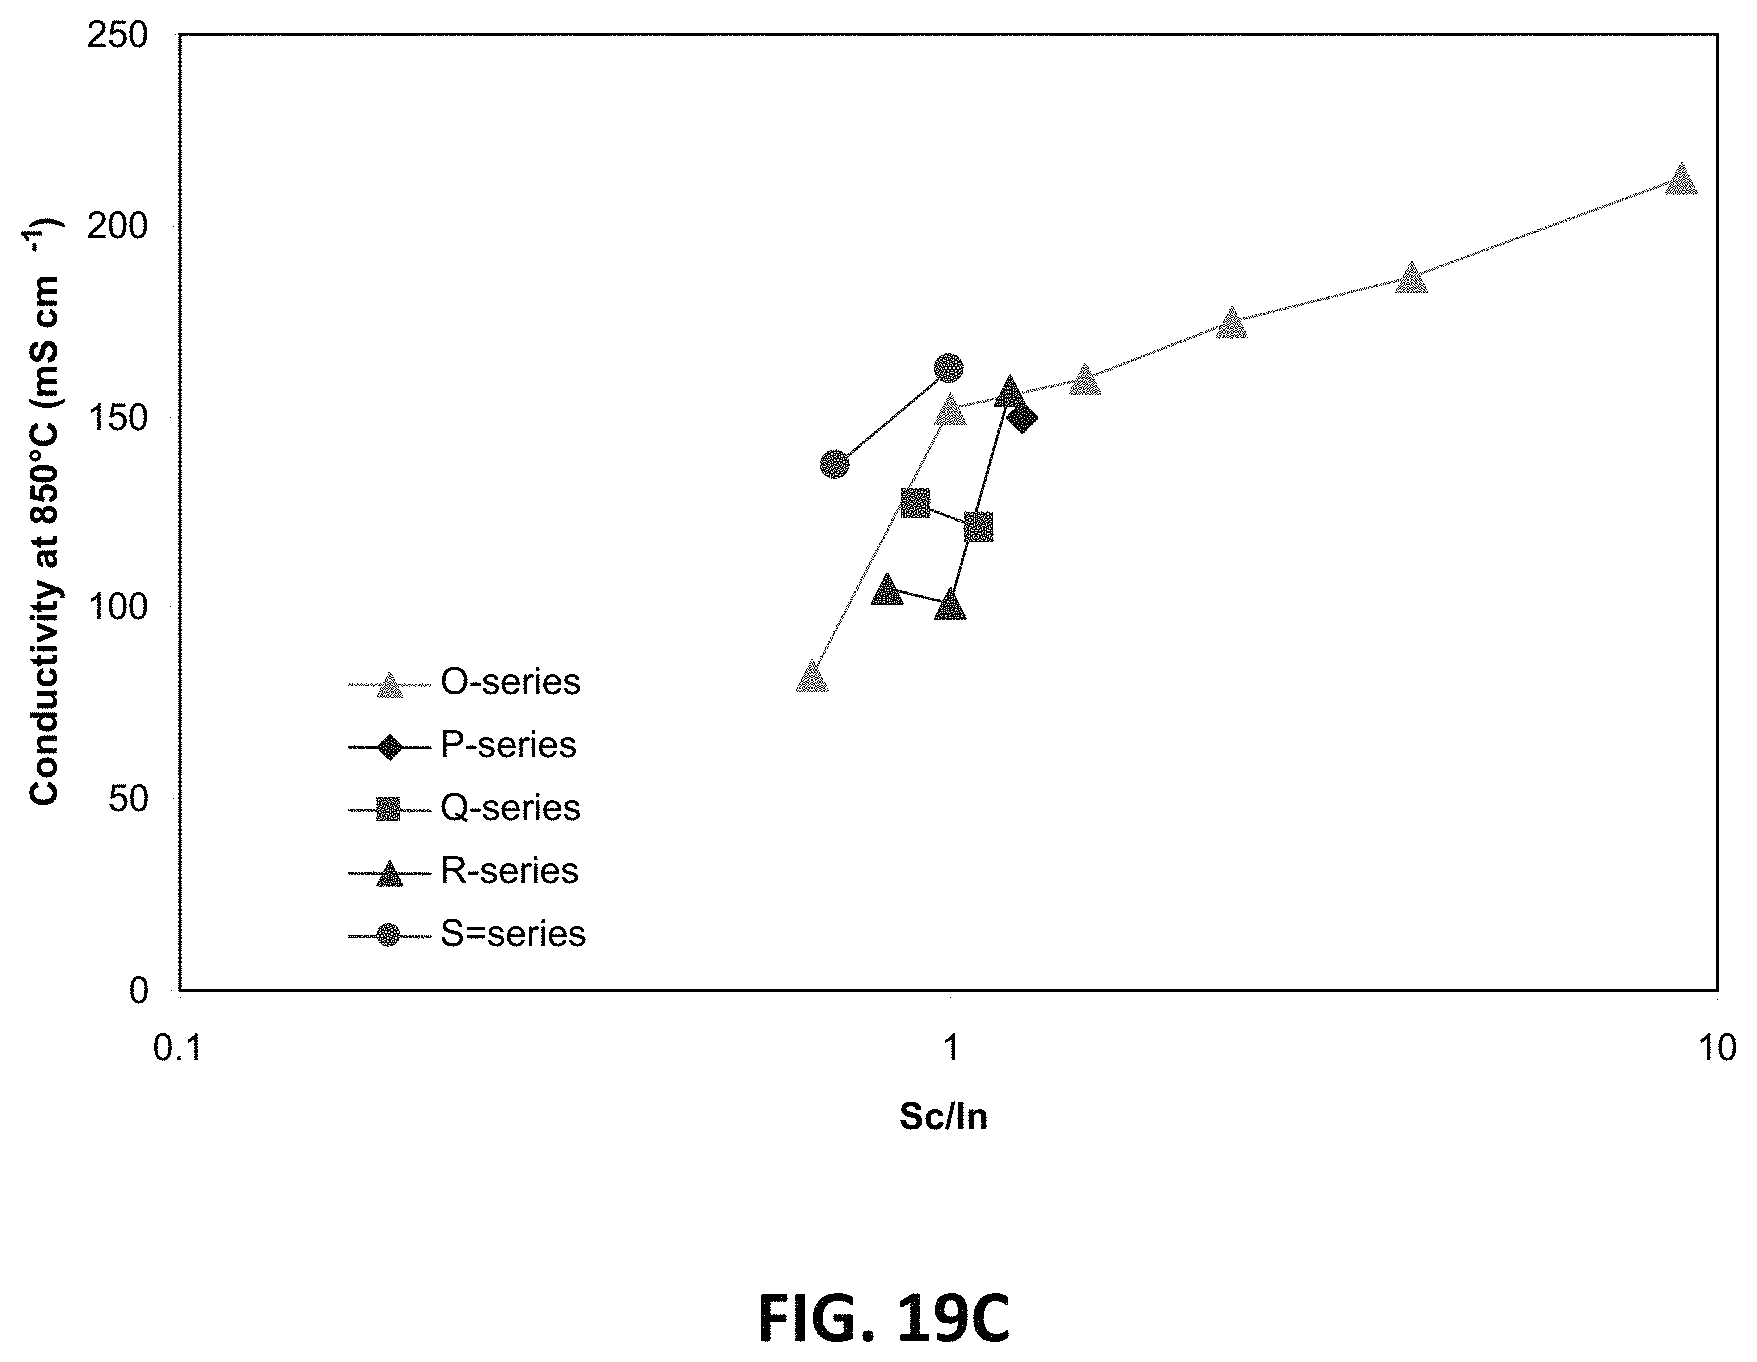
FIG. 19C is a graph showing D.C. conductivities as a function of the ratio of scandium to indium for sample compositions of various series of scandia stabilized zirconia doped with indium oxide and ceria at 850.degree. C.
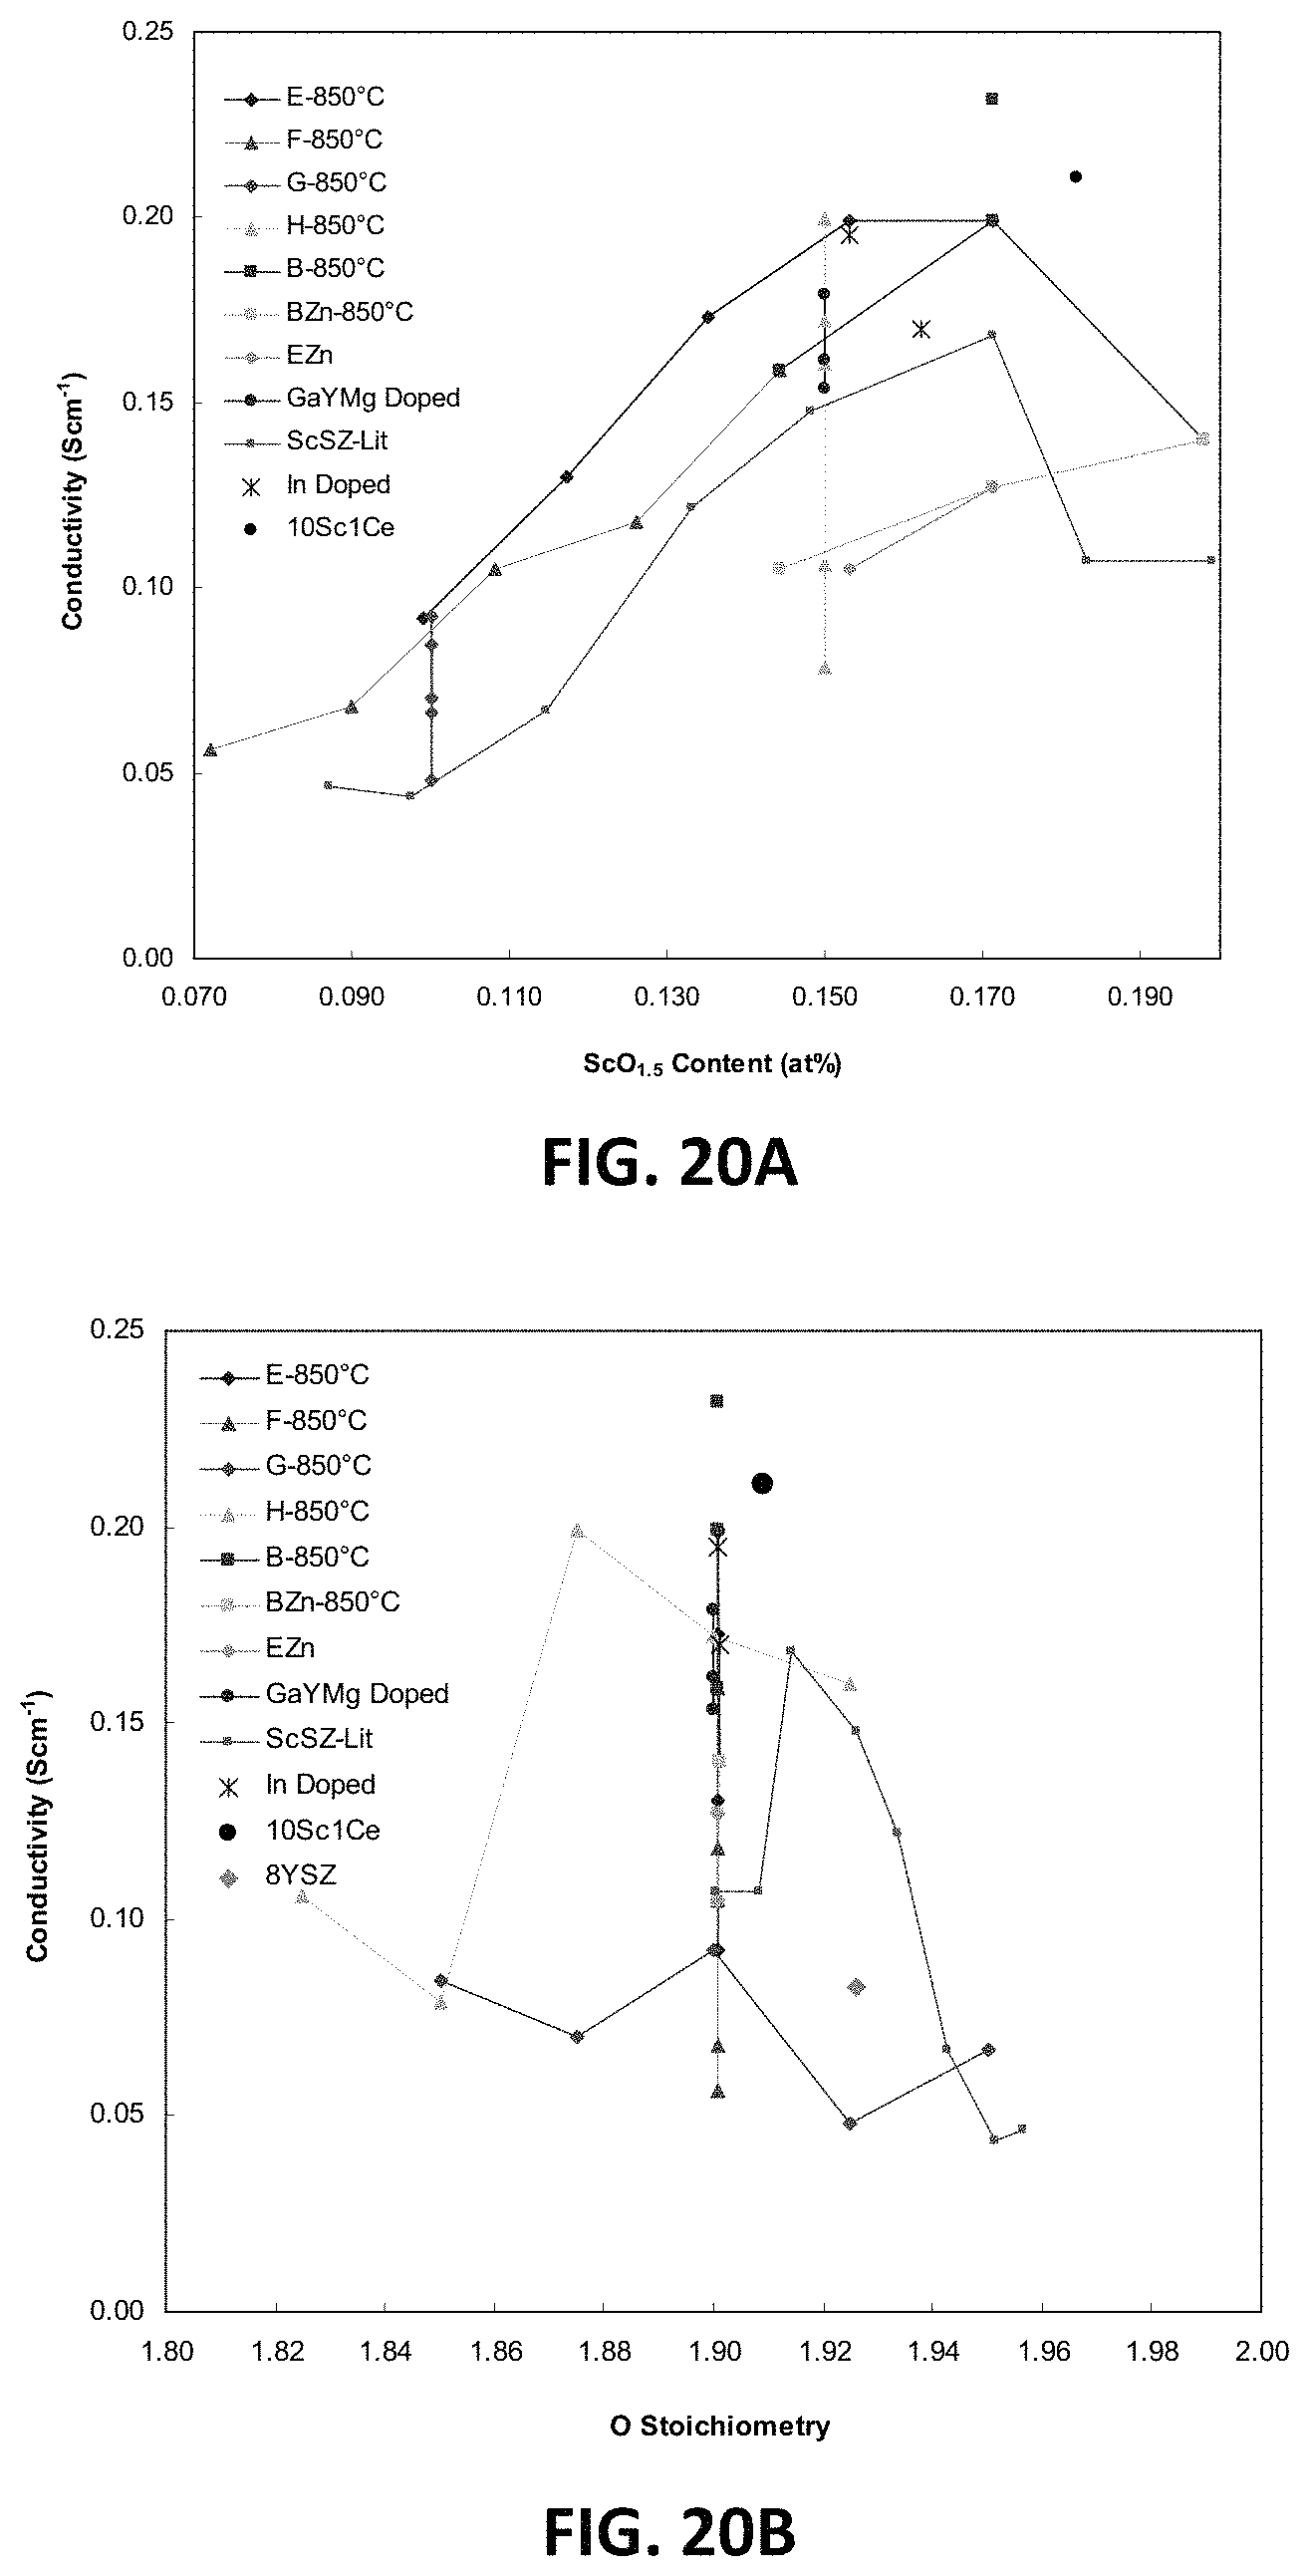
FIG. 20A is a graph showing D.C. conductivity as a function of scandium content at 850.degree. C. for embodiment series of scandia stabilized zirconia compositions with various dopant combinations.
FIG. 20B is a graph showing D.C. conductivity as a function of oxygen stoichiometry at 850.degree. C. for embodiment series of scandia stabilized zirconia compositions with various dopant combinations.
FIG. 21 is a ternary phase diagram showing sample high conductivity compositions of two embodiment series of scandia stabilized zirconia compositions doped with magnesia.
DETAILED DESCRIPTION OF THE EMBODIMENTS
The various embodiments provide compositions of an electrolyte for a SOFC which includes a doped scandia stabilized zirconia. In an embodiment, zirconia is co-doped with scandium and aliovalent atoms and is made by co-precipitation.
As both phase composition and conductivity may be very much dependant on the synthesis conditions, numerous studies have focused on developing technologies for synthesis and sintering. Solid state synthesis is known to lead to phase inhomogeneity due to the slow kinetics for cation migration, therefore high sintering temperatures may be required for phase formation. Alternative techniques such as co-precipitation, combustion and sol-gel may prove to be more successful in achieving compositional homogeneity and high extent of densification.
In the various embodiments, powder may be obtained using co-precipitation, which includes dissolving stoichiometric amounts of scandium, and at least one of magnesium oxide or carbonate, zinc oxide, indium oxide and/or gallium oxide (and optionally yttrium oxide in addition to the above oxides depending on the composition) in hot HNO.sub.3 followed by mixing with and aqueous solution in which zirconium acetylacetonate or other Zr precursor compound has been dissolved. The mixture may be stirred under heating on a hot plate then cooled down to room temperature and precipitated with ammonia until pH=9. The formed precipitate may be filtrated, dried and calcined at 1200.degree. C. for 5 hours. The resulting powder may be crushed, ball milled and pressed into pellets and bars to be sintered to dense bodies at 1500-1550.degree. C. for 7 hours. The sintered product may be characterised using X-ray diffraction, particle size analysis, SEM, TEM and conductivity measurements. To obtain an accurate value of the ionic conductivity at high temperatures, the bulk and grain boundary contributions to the total resistance of the sample may be separated out.
In preparing these new electrolyte compositions, a parent electrolyte material may have a molar ratio of zirconia (ZrO.sub.2): scandia (Sc.sub.2O.sub.3) that is around 89:11, such as 87-91:13-9. In an embodiment, zirconia may be doped with magnesia (MgO), or other ionic oxide with an aliovalent cation (e.g., Mg.sup.2+), up to 11% mole percent (mol %), while keeping the atomic percent of either Sc or Zr constant. In other embodiments, zirconia may be doped with a combination of one or more of magnesia, yttria, zinc oxide, and/or indium oxide. In other embodiments, zirconia may be doped with a combination of one or more of magnesia, yttria, and gallium oxide.
In an embodiment, magnesia may be used as a dopant that replaces scandia in scandia stabilized zirconia. Four example series of compositions are discussed in further detail below.
One example series of compositions ("A-series") may be prepared based on the composition of 11 mol % Sc.sub.2O.sub.3, and may have a formula of Zr.sub.0.802Sc.sub.0.198-xMg.sub.xO.sub.1.90-0.5x. A ternary phase diagram showing the compositions of this example A-series is illustrated in FIG. 1A. In the A-series compositions, Sc.sup.3+ ions may be replaced by Mg.sup.2+ ions in a 1:1 ratio, thereby lowering scandium and oxygen content of the composition, while keeping zirconia content constant. The x values in the above formula that may be used to form the A-series are: 0, 0.009, 0.018, 0.027 and 0.036, thereby creating the following compositions:
A0: Zr.sub.0.802Sc.sub.0.198O.sub.1.90
A1: Zr.sub.0.802Sc.sub.0.189Mg.sub.0.009O.sub.1.90
A2: Zr.sub.0.802Sc.sub.0.180Mg.sub.0.018O.sub.1.89
A3: Zr.sub.0.802Sc.sub.0.171Mg.sub.0.027O.sub.1.89
A4: Zr.sub.0.802Sc.sub.0.162Mg.sub.0.036O.sub.1.88
In this example series, at x=0, no Sc.sup.3+ ions are replaced, and therefore the atomic percent of Sc.sup.3+ ions is equal to the atomic percent in the parent material (i.e., 19.8%). At the highest x value tested (x=0.36), the atomic percent of scandium ions becomes the lowest (i.e., 16.2%).
Another example series of compositions ("B-series") may be prepared based on the composition of 11 mol % Sc.sub.2O.sub.3. A formula for the B-series compositions may be Zr.sub.0.802+xSc.sub.0.198-2xMg.sub.xO.sub.1.90. FIG. 1B is a ternary phase diagram showing the compositions of the B-series. In this example series, two Sc.sup.3+ ions may be replaced by one Zr.sup.4+ and one Mg.sup.2+ ion, thereby lowering scandium content while keeping the oxygen content and stoichiometry constant at 1.90. The x values that may be used to form this B-series are: 0, 0.009, 0.0135, 0.018 0.027 and 0.036, thereby creating the following compositions:
B0: Zr.sub.0.802Sc.sub.0.198O.sub.1.90
B1: Zr.sub.0.811Sc.sub.0.18Mg.sub.0.009O.sub.1.90
B1.5: Zr.sub.0.815Sc.sub.0.171Mg.sub.0.0135O.sub.1.90
B2: Zr.sub.0.820Sc.sub.0.162Mg.sub.0.018O.sub.1.90
B3: Zr.sub.0.829Sc.sub.0.144Mg.sub.0.027O.sub.1.90
B4: Zr.sub.0.838Sc.sub.0.126Mg.sub.0.036O.sub.1.90
In this example series, at x=0, no Sc.sup.3+ ions are replaced, and therefore the atomic percent of Sc.sup.3+ ions is equal to the atomic percent in the parent material (i.e., 19.8%). At the highest x value tested (x=0.036), the atomic percent of scandium ions is the lowest (i.e., 12.6%). A ternary phase diagram showing the compositions of this example B-series is illustrated in FIG. 1B.
Other example series of compositions ("G-series" and "H-series") may maintain constant scandia content and increase magnesia levels by replacing Zr ions with Mg ions, thereby lowering the levels of zirconium and oxygen. The example G-series of compositions may be prepared based on a parent composition with 5.3 mol % Sc.sub.2O.sub.3, and may have a formula of Zr.sub.0.9-xSc.sub.0.1Mg.sub.xO.sub.1.95-x. A ternary phase diagram showing the compositions in this example G-series is illustrated in FIG. 1C. The x values that may be used to form the G-series compositions are: 0, 0.025, 0.05, 0.075 and 0.10, thereby creating the following compositions:
G0: Zr.sub.0.9Sc.sub.0.1O.sub.1.95
G1: Zr.sub.0.875Sc.sub.0.1Mg.sub.0.025O.sub.1.925
G2: Zr.sub.0.85Sc.sub.0.1Mg.sub.0.05O.sub.1.90
G3: Zr.sub.0.825Sc.sub.0.1Mg.sub.0.075O.sub.1.875
G4: Zr.sub.0.80Sc.sub.0.1Mg.sub.0.10O.sub.1.85
At x=0, no Mg.sup.2+ ions are added, and therefore the atomic percent of Sc.sup.3+ ions is equal to the atomic percent in the parent material (i.e., 10.0%). At the highest x value (x=0.10), the atomic percent of zirconium ions is the lowest (i.e., 80.0%).
Another example series of compositions ("H-series") may be prepared based on a parent composition of 8.1 mol % Sc.sub.2O.sub.3. The H-series compositions may have a formula Zr.sub.0.85-xSc.sub.0.15Mg.sub.xO.sub.1.925-x. A ternary phase diagram showing the example H-series compositions is illustrated in FIG. 1D. The x values that may be used to form the H-series compositions are: 0, 0.025, 0.05, 0.075 and 0.10, thereby creating the following compositions:
H0: Zr.sub.0.85Sc.sub.0.15O.sub.1.925
H1: Zr.sub.0.825Sc.sub.0.15Mg.sub.0.025O.sub.1.90
H2: Zr.sub.0.80Sc.sub.0.15Mg.sub.0.05O.sub.1.875
H3: Zr.sub.0.775Sc.sub.0.15Mg.sub.0.075O.sub.1.85
H4: Zr.sub.0.75Sc.sub.0.15Mg.sub.0.10O.sub.1.825
X-ray diffraction patterns may determine the stable phase at room temperature for each magnesia doped scandia stabilized zirconia composition. The phases at room temperature for compositions in the example A-, B-, G-, and H-series of compositions are shown in Table 1 below:
TABLE-US-00001 Composition Phases Present Spacegroup A0, B0 Rhombohedral R-3C A1 Rhombohedral R-3C A2 Cubic Fm-3m A3 Cubic Fm-3m A4 Cubic Fm-3m B1 Tetragonal P42 nmc B1-5 Tetragonal P42 nmc B2 Tetragonal P42 nmc B3 Tetragonal P42 nmc B4 Tetragonal P42 nmc G0 Tetragonal + monoclinic P42 nmc + G1 Tetragonal + monoclinic P42 nmc + G2 Tetragonal + monoclinic P42 nmc + G3 Tetragonal + monoclinic P42 nmc + G4 Tetragonal + monoclinic P42 nmc + H0 Tetragonal P42 nmc H1 Tetragonal P42 nmc H2 Cubic Fm-3m H3 Cubic Fm-3m H4 Tetragonal P42 nmc
Previous studies of the parent composition A0, B0 of the A and B-series, 11 mol % Sc.sub.2O.sub.3, have found it to have a rhombohedral structure at room temperature. At the lowest level of doping in the A-series of compositions (x=0.09), the structure may remain rhombohedral, while at all other doping levels the cubic fluorite structure may be stable. For the example B-series, all compositions may have a tetragonal fluorite structure. FIG. 2A illustrates an x-ray diffraction patterns for the example B-Series compositions.
X-ray analysis of the magnesium free G0 sample showed both tetragonal and monoclinic fluorite phases to be present, consistent with findings by Ruh et al. (Ruh 1977), in their study. FIG. 2B illustrates x-ray diffraction (XRD) patterns for G-series compositions, which show that increasing the magnesia content across the G-Series leads to a reduction in the amount of monoclinic phase present. For example, FIG. 2C, which is a close up view of the low angle region in FIG. 2B illustrates x-ray diffraction patterns for G-series compositions, which show relative peak heights of the monoclinic reflections reduce with increasing magnesia content.
With respect to the H-series of compositions, additions of MgO with between 2.5 and 7.5 at. % magnesium stabilize the cubic phase. When the magnesium content is increased to 2.5 at. % the structure may remain tetragonal, but when the magnesium content is further increased to 5.0 and 7.5 at. %, the cubic structure may be stabilized. A further increase in magnesium content to 10 at. % tetragonal structure may become stable. This is shown in FIG. 2D which is an XRD pattern series for the H-series compositions. A ternary phase diagram showing as fired phases for the B-, G- and H-series compositions is illustrated in FIG. 3.
FIGS. 4A and 4B are back scattered electron (BSE) images from samples B2 and H2 respectively, taken using a scanning electron microscope (SEM). As shown by the data, sample G2 may have a much finer grain structure, which is consistent with the presence of tetragonal and monoclinic zirconia. In contrast sample H2 may have a much coarser microstructure, typical of cubic zirconia.
FIG. 5A illustrates the variation of example D.C. conductivity measurements with magnesia content (measured atomic percent of magnesium) at 850.degree. C. for the B, G and H-Series of compositions. Peak conductivity may be measured at or above 200 mS/cm, such as 200-210 mS/cm for the B1.5 composition (Zr.sub.0.815Sc.sub.0.171Mg.sub.0.0135O.sub.1.90)
Regarding the G-series of compositions, conductivity may remain less than 100 m/Scm across the entire range of compositions. These relatively low conductivities may be consistent with XRD results that show the presence of unwanted low conductivity monoclinic phases at room temperature. These low results may also indicate that G-series levels of magnesia and scandia are likely insufficient to stabilize the more conductive cubic phase of zirconia at 850.degree. C. In contrast, the example H-series of compositions may show conductivities above 150 mS/cm, such as 150-199 mS/cm at compositions with 5.0 at. % magnesium or less. The conductivity may increase approximately linearly with magnesia content to a peak value of 199 mS/cm for the H2 sample, (5.0 at. % magnesium). A further increase to 7.5 at. % magnesium may lead to a large drop in conductivity to 79 mS/cm.
FIG. 5B illustrates electrical impedance spectroscopy (EIS) measurements showing bulk conductivity for the sample G2 and H2 compositions with 5 at. % magnesium. FIG. 5C illustrates EIS measurements showing conductivity across the grain boundary of the sample G2 and H2 compositions. At 400.degree. C. the low scandia G2 sample may have a higher bulk conductivity but lower grain boundary conductivity than the higher scandia H2 sample. As temperature increases the bulk and grain boundary component of the conductivity may increase faster for the higher scandia sample, leading to the far superior conductivity at 850.degree. C. Without wishing to be bound by a particular theory, the large grain boundary resistance of the G-series phase may be the result of the presence of the lower conductivity monoclinic phase.
When the magnesium content of the H-series of compositions is increased from 5 at. % to 7.5 at. % or higher, a large decrease in conductivity may be observed. FIG. 5D illustrates EIS measurements showing total conductivity for H2 and H3 samples, which have 5 at. % and 7.5 at. % magnesium, respectively. FIG. 5E illustrates EIS measurements showing conductivity across the grain boundary for H2 and H3. FIG. 5F illustrates EIS measurements showing bulk conductivity for H2 and H3 samples, while FIG. 5G illustrates bulk resistivity measurements for the H2 and H3 samples. It may be observed from these measurements that H2 and H3 samples may have very similar bulk conductivities, while H3 may have a much lower grain boundary conductivity. Thus, 1-6 atomic percent MgO, such as 1.3-5 atomic percent are preferred.
FIG. 6A illustrates the variation of D.C. conductivity measurements with scandia content (measured as atomic percent of scandia) at 850.degree. C. for the B, G and H-Series of compositions. FIG. 6B illustrates the variation of D.C. conductivity measurements with oxygen stoichiometry at 850.degree. C. for the B, G and H-Series of compositions. FIG. 6C illustrates the D.C. conductivity results at 850.degree. C. are presented on a ternary composition diagram. These plots indicate that peak values of conductivity may be achieved at scandia contents between 15 and 19 at. %, magnesia contents less than 5 at. % (e.g., 2-5 at. %), and oxygen stoichiometries between 1.875 and 1.9.
In order to further decrease the level of scandia, two additional series of compositions based on the B1.5 and B3 compositions may be developed.
In another embodiment, scandia stabilized zirconia compositions may be co-doped with magnesia and yttria. An example series of compositions ("E-series") may be prepared based on a parent composition of 10.7 mol % Sc.sub.2O.sub.3. The E-series may have a formula Zr.sub.0.815Sc.sub.0.171-xY.sub.xMg.sub.0.0135O.sub.1.90. In this series of compositions, one Y.sup.3+ ion replaces one scandium ion, while zirconium, magnesium and oxygen levels remain constant. The x values that may be used to form the E-series compositions were: 0, 0.018, 0.036, 0.054, and 0.072, thereby creating the following E-series compositions:
E0: Zr.sub.0.815Sc.sub.0.171Mg.sub.0.0135O.sub.1.90. (Same as B1.5)
E1: Zr.sub.0.815Sc.sub.0.153Y.sub.0.018Mg.sub.0.0135O.sub.1.90
E2: Zr.sub.0.815Sc.sub.0.135Y.sub.0.036Mg.sub.0.0135O.sub.1.90
E3: Zr.sub.0.815Sc.sub.0.117Y.sub.0.054Mg.sub.0.0135O.sub.1.90
E4: Zr.sub.0.815Sc.sub.0.099Y.sub.0.072Mg.sub.0.0135O.sub.1.90
At x=0, no scandium ions are replaced, and the atomic percent of scandium is equal to the parent composition (i.e., 17.1%). At the highest x value, x=0.072, atomic percent of scandium is lowest of the series (i.e., 9.9%).
Another example series of compositions ("F-series") may be prepared based on a parent composition of 7.9 mol % Sc.sub.2O.sub.3. The F-series may have a formula Zr.sub.0.829Sc.sub.0.144-xY.sub.xMg.sub.0.027O.sub.1.90. The x values that may be used to prepare the F-series compositions are: 0, 0.018, 0.036, 0.054, and 0.072, thereby creating the following compositions:
F0: Zr.sub.0.829Sc.sub.0.144Mg.sub.0.027O.sub.1.90 (Same as B3)
F1: Zr.sub.0.829Sc.sub.0.126Y.sub.0.018Mg.sub.0.027O.sub.1.90
F2: Zr.sub.0.829Sc.sub.0.108Y.sub.0.036Mg.sub.0.027O.sub.1.90
F3: Zr.sub.0.829Sc.sub.0.09Y.sub.0.054Mg.sub.0.027O.sub.1.90
F4: Zr.sub.0.829Sc.sub.0.072Y.sub.0.072Mg.sub.0.027O.sub.1.90
In this series of compositions, like in the E-series, one Y.sup.3+ ion replaces one scandium ion, while zirconium, magnesium and oxygen levels remain constant. At x=0, no scandium ions are replaced, and the atomic percent of scandium is equal to the parent composition (i.e., 14.4%). At the highest x value, x=0.072, atomic percent of scandium is lowest of the series (i.e., 7.2%). A ternary phase diagram of the example E- and F-series compositions is illustrated in FIG. 7A (yttria not shown).
The XRD patterns of the example in the E-series and F-series compositions are shown in FIGS. 7B and 7C, respectively. The E-series of compositions may be tetragonal at yttrium contents of 5.4 at. % or less and may be cubic at 7.2 at. %. The F-series compositions may remain tetragonal. At 5.4 at. % and 7.2 at. % yttrium, the F-series samples may also have small amounts of monoclinic phase. Table 2 shows the room temperature phases of example compositions E0 through E4, and F0 through F4.
TABLE-US-00002 Composition Phases Present Spacegroup E0 (B1-5) Tetragonal P42 nmc E1 Tetragonal P42 nmc E2 Tetragonal P42 nmc E3 Tetragonal P42 nmc E4 Cubic Fm3m F0 Tetragonal P42 nmc F1 Tetragonal F2 Tetragonal P42 nmc F3 Tetragonal + monoclinic P42 nmc F4 Tetragonal + monoclinic P42 nmc
FIG. 8A illustrates the variation in D.C. conductivity with yttria content measured for the E and F series of compositions at 850.degree. C. As the data show, an approximately linear decrease in conductivity may occur with increasing content. The highest conductivity for a yttria-containing sample may be 199 mS/cm for E1, which has 1.8 at. % yttrium.
FIG. 8B illustrates EIS measurements showing total conductivity for the E-series compositions E1, E3 and E4. FIG. 8C illustrates EIS measurements showing bulk conductivity for E1, E3 and E4. FIG. 8D illustrates EIS measurements showing conductivity across the grain boundary plane for E1, E3 and E4. FIG. 8E illustrates bulk resistivity values at 400.degree. C. for E1, E3 and E4.
FIG. 9A illustrates EIS measurements showing total conductivity for the samples E1 and F1, each of which have 1.8 at. % yttrium. FIG. 9B illustrates EIS measurements showing bulk conductivity for E1 and Ft. FIG. 9C illustrates EIS measurements showing conductivity across the grain boundary plane for E and F1. FIG. 9D illustrates bulk resistivity values at 400.degree. C. for E1 and F1.
FIG. 10A illustrates D.C. conductivity at 850.degree. C. versus scandia content for series A, B, G and H (ZrO.sub.2--Sc.sub.2O.sub.3--MgO), and E and F (ZrO.sub.2--Sc.sub.2O.sub.3--Y.sub.2O.sub.3--MgO) at 850.degree. C. Further, FIG. 10 B illustrates D.C. conductivity at 850.degree. C. versus oxygen stoichiometry for each of these series. The conditions for high conductivity in the yttria containing samples are consistent with those found for the yttria free samples. The highest values of conductivity may be found for scandium contents between 15 and 19 at. % magnesium contents less than 5 at. % and oxygen stoichiometries between 1.875 and 1.9.
In another embodiment, scandia stabilized zirconia compositions that are similar to the B-series compositions may be doped with either zinc oxide (ZnO) or indium oxide (In.sub.2O.sub.3), instead of or in addition to magnesia.
In an example series of compositions ("B--Zn series"), which may be based on the B1.5 sample composition discussed above, zinc ions may replace magnesium ions. The B--Zn series may have a formula of Zr.sub.0.802+xSc.sub.0.198-2xZn.sub.xO.sub.1.90. X values that may be used to prepare this B--Zn series of compositions are: 0, 0.0135 (corresponding to B1.5) and 0.027 (corresponding to B3), thereby creating the following compositions:
B1.5Zn: Zr.sub.0.815Sc.sub.0.171Zn.sub.0.0135O.sub.1.90
B3Zn: Zr.sub.0.829Sc.sub.0.144Zn.sub.0.0270O.sub.1.90
Specifically, in this series, two Sc.sup.3+ ions may be replaced by one Zn.sup.2+ and one Zr.sup.4+ ion. The oxygen stoichiometry remains constant as Sc.sup.3+ is replaced by these ions. XRD patterns for sample compositions in this B--Zn series of compositions are illustrated in FIGS. 11A-11C, where FIGS. 11B and 11C are close ups of low and high angle regions of FIG. 11A.
The conductivities at 850.degree. C. of the B--Zn series compositions, compared to corresponding B-series compositions and the parent composition with 11 mol % Sc.sub.2O.sub.3, are provided in Table 3 below:
TABLE-US-00003 .sigma..sub.850.degree. C. (mS cm.sup.-1) B--Zn series B-series 11Sc.sub.2O.sub.3 140 140 B1.5 127 199, 232 B3 105 159
FIG. 12A illustrates D.C. conductivity at 850.degree. C. versus ZnO content (measured as atomic percent of zinc) for the B--Zn series of compositions, overlaid onto a plot of D.C. conductivity at 850.degree. C. versus magnesium content for B1.5 and B3.
In another example series of compositions, indium oxide may be used as a co-dopant with scandia. Similar to the A-series of compositions in which Mg.sup.2+ is a co-dopant that replaces Sc.sup.3+, in an In.sub.2O.sub.3 co-doped composition the In.sup.3+ ions may replace Sc.sup.3+ ions in a 1:1 ratio, with the oxygen content remaining fixed. This series may be based on a parent composition of 11 mol % Sc.sub.2O.sub.3, and may have a formula of: Zr.sub.0.802Sc.sub.0.198-xIn.sub.xO.sub.1.90 where 0.ltoreq.x.ltoreq.0.198, such as 0.018.ltoreq.x.ltoreq.0.18.
Sample compositions of this embodiment may have 0-11 mol % Sc.sub.2O.sub.3, such as 1-9 mol % Sc.sub.2O.sub.3, and 0-11 mol % In.sub.2O.sub.3, such as 2-10 mol % In.sub.2O.sub.3, with a total doping range (i.e., sum of Sc.sub.2O.sub.3 and In.sub.2O.sub.3 mole percentages) of 11 mol %. In one example, the composition may have 9 mol % Sc.sub.2O.sub.3 and 2 mol % In.sub.2O.sub.3, and therefore have a formula of Zr.sub.0.802Sc.sub.0.162In.sub.0.036O.sub.1.90.
FIG. 12B illustrates XRD patterns for this series, in which sample compositions have discreet integer indium oxide contents varying from 0 to 11 mol % and discreet integer scandia contents varying from 11 to 0 mol %. FIG. 12C illustrates the variation in D.C. conductivity of these sample compositions as a function of discrete integer indium oxide content (measured as mole percent of In.sub.2O.sub.3), where indium oxide content varies from 0 to 11 mol %. As shown by the data plot, D.C. conductivity of the samples may be a value between 80 mS/cm and 220 mS/cm. As also shown by the data plot, a peak D.C. conductivity level of at least 215 mS/cm, such as between 215 and 220 mS/cm, may be achieved at about 3 mol % In.sub.2O.sub.3, which corresponds to a sample formula of around Zr.sub.0.802Sc.sub.0.144In.sub.0.054O.sub.1.90. Thus, this series may be described as having a formula Zr.sub.1-w-ySc.sub.wIn.sub.yO.sub.d, in which 0.018.ltoreq.w.ltoreq.0.18, in which 0.018.ltoreq.y.ltoreq.0.18, and in which 1.8.ltoreq.d.ltoreq.2. In an embodiment, scandium ion concentration (w) may be characterized by w=0.198-y. In another embodiment, indium ion concentration (y) may be characterized by y=0.054.
In another embodiment, scandia stabilized zirconia compositions that are similar to the H-series compositions may be doped with indium oxide (In.sub.2O.sub.3) in addition to magnesia. In an example series of compositions ("H--In series"), which may be based on the H2 sample composition discussed above, Sc.sup.3+ ions may be replaced by Mg.sup.2+ ions in a 1:1 ratio, thereby lowering scandium and oxygen content of the composition while keeping zirconia and indium content constant. The H--In series may have a formula of Zr.sub.0.8Sc.sub.0.15-xIn.sub.0.05Mg.sub.xO.sub.2-d, in which 0.ltoreq.x.ltoreq.0.05. The formula for the H--In series may also be written as Zr.sub.0.8Sc.sub.0.15-xIn.sub.0.05Mg.sub.xO.sub.d, in which 1.8.ltoreq.d.ltoreq.2 and 0.ltoreq.x.ltoreq.0.05. At x=0, no magnesia is present and a sample composition has a formula Zr.sub.0.8Sc.sub.0.10In.sub.0.05O.sub.2-d. At x=0.05, a sample composition has a formula Zr.sub.0.8Sc.sub.0.10In.sub.0.05Mg.sub.0.05O.sub.2-d.
Another set of examples involves variants of the E1 sample composition, discussed above. In one example composition, zinc oxide may replace magnesia as a dopant, producing a composition "E1-Zn" that may have a formula Zr.sub.0.815Sc.sub.0.153Y.sub.0.018Zn.sub.0.0135O.sub.1.90. In another example, In.sub.2O.sub.3 may be used as a co-dopant that replaces yttria, producing a composition "E1-In" that may have a formula Zr.sub.0.815Sc.sub.0.153In.sub.0.018Mg.sub.0.0135O.sub.1.90.
FIG. 13A illustrates energy-dispersive x-ray (EDX) spectroscopy analysis of the sample compositions E1-In and 9Sc.sub.2O.sub.3-2In.sub.2O.sub.3. FIG. 13B illustrates x-ray diffraction (XRD) patterns for these compositions, with an expanded view region for angles of 2.theta.=80-88.degree.. At 850.degree. C., the D.C. conductivity of E1-In at 850.degree. C. may be around 195 mS/cm, while the D.C. conductivity of 9Sc.sub.2O.sub.3-2In.sub.2O.sub.3 may be around 170 mS/cm. Thus, these compositions have a conductivity of at least 170, such as 180-195 mS/cm.
FIG. 14A shows bulk impedance values of the E1 sample composition with the E1 variants E1-Zn and E1-In at 400.degree. C. FIG. 14B shows bulk conductivity measurements for E1, E1-Zn and E1-In. FIG. 14C shows the total conductivity measurements for E1, E1-Zn and E1-In, and FIG. 14D shows the conductivity across the grain boundary plane for E1, E1-Zn and E1-In.
In further embodiments, scandia stabilized zirconia may be co-doped with gallium oxide and yttria. Without wishing to be bound to a particular theory, the combination of the smaller radius Ga.sup.3+ ion and the larger radius Y.sup.3+ may lead to less distortion of the crystal structure.
An example series of compositions ("I-series") may be created with a formula Zr.sub.0.8018Sc.sub.0.1782Y.sub.0.02-xGa.sub.xO.sub.1.90. In this series of compositions, one Ga.sup.3+ ion replaces one Y.sup.3+ ion, while zirconium, scandium and oxygen levels remain constant. The x values that may be used to form the I-series compositions are: 0, 0.005, 0.01, 0.015 and 0.02, thereby creating the following compositions:
I0: Zr.sub.0.802Sc.sub.0.178Y.sub.0.02O.sub.1.90
I1: Zr.sub.0.802Sc.sub.0.171Y.sub.0.015Ga.sub.0.005O.sub.1.90
I2: Zr.sub.0.802Sc.sub.0.171Y.sub.0.01Ga.sub.0.01O.sub.1.90
I3: Zr.sub.0.802Sc.sub.0.171Y.sub.0.005Ga.sub.0.015O.sub.1.90
I4: Zr.sub.0.802Sc.sub.0.171Ga.sub.0.02O.sub.1.90
At x=0, no yttrium ions are replaced, and no gallium ions are present. At the highest x value, x=0.02, all yttrium ions are replaced by gallium ions.
Another example series of compositions ("J-series") may be prepared with a formula Zr.sub.0.802Sc.sub.0.188Y.sub.0.01-xGa.sub.xO.sub.1.90. In the J-series, one Ga.sup.3+ ion replaces one Y.sup.3+ ion, while zirconium, scandium and oxygen levels remain constant. The x values that may be used to form the J-series compositions are: 0, 0.0025, 0.005, 0.0075, thereby creating the following compositions:
J0: Zr.sub.0.802Sc.sub.0.188Y.sub.0.01O.sub.1.90
J1: Zr.sub.0.802Sc.sub.0.188Y.sub.0.0075Ga.sub.0.0025O.sub.1.90
J2: Zr.sub.0.802Sc.sub.0.188Y.sub.0.005Ga.sub.0.005O.sub.1.90
J3: Zr.sub.0.802Sc.sub.0.188Y.sub.0.0025Ga.sub.0.0075O.sub.1.90
At x=0, no yttrium ions are replaced, and no gallium ions are present. At the highest x value, x=0.0075, the composition contains 2.5 at. % Y.sup.3+ and 7.5 at. % Ga.sup.3+ ions.
Another example series of compositions ("K-series") may be prepared with a formula Zr.sub.0.8018Sc.sub.0.1682Y.sub.0.03-xGa.sub.xO.sub.1.90. In this series of compositions, one Ga.sup.3+ ion replaces one Y.sup.3+ ion, while zirconium, scandium and oxygen levels remain constant. An x value that may be used to form an example K-series composition is 0.015, which may create a K2 sample composition having a formula Zr.sub.0.8018Sc.sub.0.1682Y.sub.0.015Ga.sub.0.015O.sub.1.90. At this x value, the atomic percentages of Y.sup.3+ ions and Ga.sup.3+ ions are equal.
Another example series of compositions ("L-series") may be prepared with a formula Zr.sub.0.8018Sc.sub.0.1582Y.sub.0.04-xGa.sub.xO.sub.1.90. In this series of compositions, one Ga.sup.3+ ion replaces one Y.sup.3+ ion, while zirconium, scandium and oxygen levels remain constant. An x value that may be used to form an example L-series composition is 0.02, which may create a L2 sample composition having a formula Zr.sub.0.8018Sc.sub.0.1582Y.sub.0.02Ga.sub.0.02O.sub.1.90. At this x value, the atomic percentages of Y.sup.3+ ions and Ga.sup.3+ ions are equal.
FIG. 15 is a ternary phase diagram showing the example I-, J-, K- and L-series of compositions. FIG. 16A illustrates XRD patterns for sample compositions in these series, J2, J2, K2, and L2. FIG. 16B is an expansion of the XRD patterns over the range of 2.theta.=82-85.degree.. FIG. 17A illustrates the variation in D.C conductivity with total gallium oxide and yttria content (measured as atomic percent of gallium or yttrium) for the I, J, K and L series of compositions at 850.degree. C. FIG. 17B illustrates the variation in D.C. conductivity with scandium content (measured as atomic percent of scandium). As the data show, the K-series composition, which has 0.015 at. % Y.sup.3+ ions and 0.015 at. % Ga.sup.3+ ions, has the highest conductivity, such as above 200 mS/cm, for example 221 mS/cm.
D.C. conductivities of sample compositions I2, I3, J2, J3, K2 and L2 at 850.degree. C. are provided in Table 4 below:
TABLE-US-00004 Composition .sigma..sub.850.degree. C. I2 132 I3 126 J2 118 J3 129 K2 221 L3 106
Another example series of compositions ("M-series") may be prepared with a formula Zr.sub.0.815Sc.sub.0.15Y.sub.0.02-xGa.sub.xMg.sub.0.015O.sub.1.- 90. In this series of compositions, one Ga.sup.3+ ion replaces one Y.sup.3+ ion, while zirconium, scandium, magnesium and oxygen levels remain constant. The x values that may be used to prepare the M-series are 0, 0.01 and 0.02, thereby creating the following compositions:
M0: Zr.sub.0.815Sc.sub.0.15Y.sub.0.02Mg.sub.0.015O.sub.1.9
M1: Zr.sub.0.815Sc.sub.0.15Y.sub.0.01Ga.sub.0.01Mg.sub.0.015O.sub.1.9
M2: Zr.sub.0.815Sc.sub.0.15Ga.sub.0.02Mg.sub.0.015O.sub.1.9
At x=0, no yttrium ions are replaced, and no gallium is present, and at x=0.02, all yttrium ions are replaced with gallium ions.
D.C. conductivity results of the M-series compositions at 850.degree. C. are provided in Table 5 below:
TABLE-US-00005 Composition .sigma..sub.850.degree. C. M0 179 M1 154 M2 162
FIG. 18 is a graph illustrating the D.C. conductivity for the M-series compositions with varying gallium oxide content (measured as atomic percent gallium).
Another example series of compositions ("N-series") may be created with a formula Zr.sub.0.815Sc.sub.0.13Y.sub.0.04-xGa.sub.xMg.sub.0.015O.sub.1.90- . In this series of compositions, one Ga.sup.3+ ion replaces one Y.sup.3+ ion, while zirconium, scandium, magnesium and oxygen levels remain constant. The x values that may used to make the N-series are 0, 0.01, 0.02, 0.03, and 0.04, thereby creating the following compositions:
N0: Zr.sub.0.815Sc.sub.0.13Y.sub.0.04Mg.sub.0.015O.sub.1.90
N1: Zr.sub.0.815Sc.sub.0.13Y.sub.0.03Ga.sub.0.01Mg.sub.0.015O.sub.1.90
N2: Zr.sub.0.815Sc.sub.0.13Y.sub.0.02Ga.sub.0.02Mg.sub.0.015O.sub.1.90
N3: Zr.sub.0.815Sc.sub.0.13Y.sub.0.01Ga.sub.0.03Mg.sub.0.015O.sub.1.90
N4: Zr.sub.0.815Sc.sub.0.13Ga.sub.0.04Mg.sub.0.015O.sub.1.90
At x=0, no yttrium ions are replaced, and no gallium is present, and at x=0.04, all yttrium ions are replaced with gallium ions.
In further embodiments, scandia stabilized zirconia may be co-doped with indium oxide and ceria. An example series of compositions ("O-series") may be created with a formula Zr.sub.0.809Sc.sub.0.182-xCe.sub.0.009In.sub.xO.sub.2-d, where 0.ltoreq.x.ltoreq.0.164. This series may also be written as Zr.sub.0.809Sc.sub.0.182-xCe.sub.0.009In.sub.xO.sub.d, where 1.8.ltoreq.d.ltoreq.2 and 0.ltoreq.x.ltoreq.0.164. In this series of compositions, In.sup.3+ ions replace Sc.sup.3+ ions in a 1:1 ratio, while zirconium, cerium, and oxygen levels remain constant. A parent dopant material for the O-series of compositions may be 10Sc.sub.2O.sub.3-1CeO.sub.2. Sample compositions may be created by replacing Sc.sub.2O.sub.3 with up to 9 mol % In.sub.2O.sub.3 (e.g., 9Sc.sub.2O.sub.3-1In.sub.2O.sub.3-1CeO.sub.2 to 1Sc.sub.2O.sub.3-9In.sub.2O.sub.3-1CeO.sub.2).
Other example compositions may be created with total dopant amounts lower than 11 mol %. For example, one series of compositions may be created with at least 8 mol %, such as 9 mol % of total dopant, and a formula Zr.sub.0.843Sc.sub.0.0926-xCe.sub.0.009In.sub.0.0556+xO.sub.2-d, where 0.ltoreq.x.ltoreq.0.0741. The formula for this series may also be written as Zr.sub.0.843Sc.sub.0.0926-xCe.sub.0.009In.sub.0.556+xO.sub.d, where 1.8.ltoreq.d.ltoreq.2 and 0.ltoreq.x.ltoreq.0.0741. In this series of compositions, In.sup.3+ ions replace Sc.sup.3+ ions in a 1:1 ratio, while zirconium, cerium, and oxygen levels remain constant. A parent dopant material may comprise 5Sc.sub.2O.sub.3-3In.sub.2O.sub.3-1CeO.sub.2. Sample compositions may be created by replacing Sc.sub.2O.sub.3 with up to 4 mol % In.sub.2O.sub.3 (e.g., 5Sc.sub.2O.sub.3-3In.sub.2O.sub.3-1CeO.sub.2 to 1Sc.sub.2O.sub.3-7In.sub.2O.sub.3-1CeO.sub.2). In another example, a series of compositions ("P-series") may be created with 10 mol % of total dopant, and a formula Zr.sub.0.825Sc.sub.0.110-xCe.sub.0.009In.sub.0.055+xO.sub.2-d, where 0.ltoreq.x.ltoreq.0.0917. The formula for the P-series may also be written as Zr.sub.0.825Sc.sub.0.110-xCe.sub.0.009In.sub.0.055+xO.sub.d, where 1.8.ltoreq.d.ltoreq.2 and 0.ltoreq.x.ltoreq.0.0917. In this series of compositions, In.sup.3+ ions replace Sc.sup.3+ ions in a 1:1 ratio, while zirconium, cerium, and oxygen levels remain constant. A parent dopant material may be 6Sc.sub.2O.sub.3-3In.sub.2O.sub.3-1CeO.sub.2. Sample compositions may be created by replacing Sc.sub.2O.sub.3 with up to 5 mol % In.sub.2O.sub.3 (e.g., 6Sc.sub.2O.sub.3-3In.sub.2O.sub.3-1CeO.sub.2 to 1Sc.sub.2O.sub.3-8In.sub.2O.sub.3-1CeO.sub.2). Some x values that may used to make the P-series are 0 and 0.018, thereby creating the following compositions:
P0: Zr.sub.0.825Sc.sub.0.110Ce.sub.0.009In.sub.0.055O.sub.1.92
P1: Zr.sub.0.825Sc.sub.0.092Ce.sub.0.009In.sub.0.073O.sub.1.92
At x=0, no additional scandium ions are replaced, and the amount of indium present is the same as in the parent dopant material.
Other embodiment compositions may be created with total dopant amounts that are higher than 11 mol %, such as up to 14 mol %. For example, one series of compositions ("Q-series") may be created with 11.5 mol % of total dopant, and a formula Zr.sub.0.801Sc.sub.0.10-xCe.sub.0.009In.sub.0.091+xO.sub.2-d, where 0.ltoreq.x.ltoreq.0.082. The formula for the Q-series may also be written as Zr.sub.0.801Sc.sub.0.10-xCe.sub.0.009In.sub.0.091+xO.sub.d, where 1.8.ltoreq.d.ltoreq.2 and 0.ltoreq.x.ltoreq.0.082. In this series of compositions, In.sup.3+ ions replace Sc.sup.3+ ions in a 1:1 ratio, while zirconium, cerium, and oxygen levels remain constant. A parent dopant material may be 5.5Sc.sub.2O.sub.3-5In.sub.2O.sub.3-1CeO.sub.2. Sample compositions may be created by replacing Sc.sub.2O.sub.3 with up to 4.5 mol % In.sub.2O.sub.3 (e.g., 5.5Sc.sub.2O.sub.3-5In.sub.2O.sub.3-1CeO.sub.2 to 1Sc.sub.2O.sub.3-9.5In.sub.2O.sub.3-1CeO.sub.2). Some x values that may used to make the Q-series are 0 and 0.010, thereby creating the following compositions:
Q0: Zr.sub.0.801Sc.sub.0.10Ce.sub.0.009In.sub.0.091O.sub.1.91
Q1: Zr.sub.0.825Sc.sub.0.091Ce.sub.0.09In.sub.0.10O.sub.1.91
At x=0, no additional scandium ions are replaced, and the amount of indium present is the same as in the parent dopant material.
In another example, a series of compositions ("R-series") may be created with 12 mol % of total dopant, and a formula Zr.sub.0.793Sc.sub.0.110-xCe.sub.0.009In.sub.0.090+xO.sub.2-d, where 0.ltoreq.x.ltoreq.0.09. The formula for the R-series may also be written as Zr.sub.0.793Sc.sub.0.110-xCe.sub.0.009In.sub.0.090+xO.sub.d, where 1.8.ltoreq.d.ltoreq.2 and 0.ltoreq.x.ltoreq.0.09. In this series of compositions, In.sup.3+ ions replace Sc.sup.3+ ions in a 1:1 ratio, while zirconium, cerium, and oxygen levels remain constant. A parent dopant material may be 6Sc.sub.2O.sub.3-5In.sub.2O.sub.3-1CeO.sub.2. Sample compositions may be created by replacing Sc.sub.2O.sub.3 with up to 5 mol % In.sub.2O.sub.3 (e.g., 6Sc.sub.2O.sub.3-5In.sub.2O.sub.3-1CeO.sub.2 to 1Sc.sub.2O.sub.3-10In.sub.2O.sub.3-1CeO.sub.2). Some x values that may used to make the R-series are 0, 0.009, and 0.018, thereby creating the following compositions:
R0: Zr.sub.0.793Sc.sub.0.110Ce.sub.0.009In.sub.0.090O.sub.1.90
R1: Zr.sub.0.793Sc.sub.0.101Ce.sub.0.009In.sub.0.099O.sub.1.90
R2: Zr.sub.0.793Sc.sub.0.092Ce.sub.0.009In.sub.0.108O.sub.1.90
At x=0, no additional scandium ions are replaced, and the amount of indium present is the same as in the parent dopant material.
In another embodiment, a related series of compositions (R'-series) also having a total of 12 mol % dopant may be created with scandia stabilized zirconia that is co-doped only with indium, and lacks cerium or ceria. The R'-series may have a formula Zr.sub.0.786Sc.sub.0.143-xIn.sub.0.071+xO.sub.2-d, where 0.ltoreq.x.ltoreq.0.125. The formula for the R'-series may also be written as Zr.sub.0.786Sc.sub.0.143-xIn.sub.0.071+xO.sub.d, where 1.8.ltoreq.d.ltoreq.2 and 0.ltoreq.x.ltoreq.0.125. In this series of compositions, In.sup.3+ ions replace Sc.sup.3+ ions in a 1:1 ratio, while zirconium and oxygen levels remain constant. A parent dopant material may be 8Sc.sub.2O.sub.3-4In.sub.2O.sub.3. Sample compositions may be created by replacing Sc.sub.2O.sub.3 with up to 7 mol % In.sub.2O.sub.3 (e.g., 8Sc.sub.2O.sub.3-4In.sub.2O.sub.3 to 1Sc.sub.2O.sub.3-11In.sub.2O.sub.3). Some x values that may used to make the R-series are 0 and 0.036, thereby creating the following compositions:
R'0: Zr.sub.0.786Sc.sub.0.143In.sub.0.071O.sub.1.89
R'1: Zr.sub.0.786Sc.sub.0.107In.sub.0.107O.sub.1.89
At x=0, no additional scandium ions are replaced, and the amount of indium present is the same as in the parent dopant material. At x=0.036, the amounts of indium and scandium are equal in the dopant material.
In another example, a series of compositions ("S-series") having 13 mol % of total dopant may be created using scandia stabilized zirconia co-doped with indium oxide and ceria. The S-series may have a formula Zr.sub.0.777Sc.sub.0.107-xCe.sub.0.009In.sub.0.107+xO.sub.2-d, where 0.ltoreq.x.ltoreq.0.089. The formula for the S-series may also be written as Zr.sub.0.777Sc.sub.0.107-xCe.sub.0.009In.sub.0.107+xO.sub.d, where 1.8.ltoreq.d.ltoreq.2 and 0.ltoreq.x.ltoreq.0.089. In this series of compositions, In.sup.3+ ions replace Sc.sup.3+ ions in a 1:1 ratio, while zirconium, cerium, and oxygen levels remain constant. A parent dopant material may be 6Sc.sub.2O.sub.3-6In.sub.2O.sub.3-1CeO.sub.2. Sample compositions may be created by replacing Sc.sub.2O.sub.3 with up to 5 mol % In.sub.2O.sub.3 (e.g., 6Sc.sub.2O.sub.3-6In.sub.2O.sub.3-1CeO.sub.2 to 1Sc.sub.2O.sub.3-11In.sub.2O.sub.3-1CeO.sub.2). Some x values that may used to make the S-series are 0 and 0.018, thereby creating the following compositions:
S0: Zr.sub.0.777Sc.sub.0.107Ce.sub.0.009In.sub.0.090O.sub.1.87
S1: Zr.sub.0.793Sc.sub.1.101Ce.sub.0.009In.sub.0.099O.sub.1.87
In another embodiment, a related series of compositions (S'-series) also having a total of 13 mol % dopant may be created with scandia stabilized zirconia that is co-doped only with indium. The S'-series may have a formula Zr.sub.0.770Sc.sub.0.142-xIn.sub.0.088+xO.sub.2-d, where 0.ltoreq.x.ltoreq.0.125. The formula for the S'-series may also be written as Zr.sub.0.770Sc.sub.0.142-xIn.sub.0.088+xO.sub.d, where 1.8.ltoreq.d.ltoreq.2 and 0.ltoreq.x.ltoreq.0.125. In this series of compositions, In.sup.3+ ions replace Sc.sup.3+ ions in a 1:1 ratio, while zirconium and oxygen levels remain constant. A parent dopant material may be 8Sc.sub.2O.sub.3-5In.sub.2O.sub.3. Sample compositions may be created by replacing Sc.sub.2O.sub.3 with up to 7 mol % In.sub.2O.sub.3 (e.g., 8Sc.sub.2O.sub.3-5In.sub.2O.sub.3 to 1Sc.sub.2O.sub.3-12In.sub.2O.sub.3).
FIGS. 19A-19C are graphs illustrating the variation in D.C. conductivity for sample compositions of the O-series, P-series, Q-series, R-series, and S-series. FIG. 19A shows D.C. conductivity of sample compositions in these series as a function of discrete integer scandium content (measured as at. % Sc.sup.3+), where scandium content varies from 7.2 to 18.2 at. %. FIG. 19B shows the variation in D.C. conductivity of the sample compositions as a function of indium content (measured as at. % In.sup.3+), where indium content varies from 0 to 10.9 at. %. FIG. 19C shows the variation in D.C. conductivity of the sample compositions as a function of the ratio of scandium content to indium content (excluding an O-series sample in which dopant composition had 0% indium oxide).
As shown by the data plots, D.C. conductivity of the samples may be a value between 80 mS/cm and 220 mS/cm. As also shown by the data plot, a peak D.C. conductivity level of at least 215 mS/cm, such as between 215 and 220 mS/cm, may be achieved in the O-series in a sample with around 16.3 at. % scandium, and around 1.8 at % indium, which has a sample formula of around Zr.sub.0.809Sc.sub.0.163Ce.sub.0.009In.sub.0.018O.sub.1.9. The amounts of scandium and indium at the peak D.C. conductivity level correspond to a dopant material of 9 mol % Sc.sub.2O.sub.3, 1 mol % In.sub.2O.sub.3, and 1 mol % CeO.sub.2. Thus, the O-series this series may be described as having a formula Zr.sub.1-w-y-zSc.sub.wCe.sub.zIn.sub.yO.sub.d, in which 0.072.ltoreq.w.ltoreq.0.182, in which 0.ltoreq.y.ltoreq.0.1098, in which 0.008.ltoreq.z.ltoreq.0.1, and in which 1.8.ltoreq.d.ltoreq.2. In an embodiment, scandium ion concentration (w) may be characterized by w=0.182-y, and cerium ion concentration (z) may be characterized by z=0.009. In another embodiment, indium ion concentration (y) may be characterized by y=0.018.
FIGS. 20A and 20B are graphs illustrating summaries of the D.C. conductivity results for various example series of scandia stabilized zirconia compositions that may have the properties discussed above. FIG. 20A shows D.C. conductivity of sample compositions in these series as a function of discrete integer scandium content (measured as at. % Sc.sup.3+). FIG. 20B shows D.C. conductivity of the sample compositions in these series as a function of oxygen stoichiometry.
FIG. 21 is a ternary phase diagram showing sample high conductivity compositions of embodiment B- and H-series scandia stabilized zirconia that is doped with magnesia.
As demonstrated in the various example series of scandia stabilized zirconia compositions, the B- and H-series compositions may have high relative conductivities. For example, a sample B1.5 composition may have a D.C. conductivity of 232 mS/cm. In another example, sample H2 and H1 compositions may have D.C. conductivities of 199 mS/cm and 171 mS/cm, respectively.
In another example, a sample K2 composition may have a relatively high conductivity of 145 mS/cm. In another example, a sample L2 composition may also have a relatively high conductivity of 145 mS/cm. In another example, compositions doped In.sub.2O.sub.3 may have relatively high conductivities around 195 mS/cm.
The compositions above may be used for a solid oxide fuel cell electrolyte. The electrolyte may be plate shaped with an anode electrode on one side (e.g., a nickel and stabilized zirconia and/or doped ceria cermet) and a cathode electrode (e.g., lanthanum strontium manganate) on the opposite side. The fuel cell comprising the electrolyte, anode and cathode electrodes may be located in a fuel cell stack. The term "fuel cell stack," as used herein, means a plurality of stacked fuel cells separated by interconnects which may share common air and fuel inlet and exhaust passages, manifolds or risers. The "fuel cell stack," as used herein, includes a distinct electrical entity which contains two end plates which are connected to power conditioning equipment and the power (i.e., electricity) output of the stack. Thus, in some configurations, the electrical power output from such a distinct electrical entity may be separately controlled from other stacks. The term "fuel cell stack" as used herein, also includes a part of the distinct electrical entity. For example, the stacks may share the same end plates. In this case, the stacks jointly comprise a distinct electrical entity, such as a column. In this case, the electrical power output from both stacks cannot be separately controlled.
The formulas that represent the compositions above are not intended to limit the scope of the invention to particular atomic or mole percentages, but are provided to facilitate disclosure of the various series of related compositions. For example, the representation of oxygen as "O.sub.2-d" Or "O.sub.d" provides for a variable amount of oxygen that may depend, for example, on the total amount of doping, valence of cations in the composition, etc. Example amounts of oxygen that may be present in series of compositions discussed above include, without limitation: 1.92 at % oxygen in the P-series; 1.91 at % oxygen in the Q-series, 1.90 at % oxygen in the R-series; 1.89 at % oxygen in the R'-series; and 1.87 at % oxygen in the S-series.
The foregoing description of the invention has been presented for purposes of illustration and description. It is not intended to be exhaustive or to limit the invention to the precise form disclosed, and modifications and variations are possible in light of the above teachings or may be acquired from practice of the invention. The description was chosen in order to explain the principles of the invention and its practical application. It is intended that the scope of the invention be defined by the claims appended hereto, and their equivalents.
* * * * *
D00000
D00001
D00002
D00003
D00004
D00005
D00006
D00007
D00008
D00009
D00010
D00011
D00012
D00013

D00014
D00015
D00016

D00017

D00018
D00019
D00020

D00021

D00022
D00023

D00024

D00025
D00026
D00027
D00028

D00029

D00030

D00031
D00032
D00033
D00034

D00035
D00036

D00037
D00038
D00039

XML
uspto.report is an independent third-party trademark research tool that is not affiliated, endorsed, or sponsored by the United States Patent and Trademark Office (USPTO) or any other governmental organization. The information provided by uspto.report is based on publicly available data at the time of writing and is intended for informational purposes only.
While we strive to provide accurate and up-to-date information, we do not guarantee the accuracy, completeness, reliability, or suitability of the information displayed on this site. The use of this site is at your own risk. Any reliance you place on such information is therefore strictly at your own risk.
All official trademark data, including owner information, should be verified by visiting the official USPTO website at www.uspto.gov. This site is not intended to replace professional legal advice and should not be used as a substitute for consulting with a legal professional who is knowledgeable about trademark law.