Beta titanium alloy sheet for elevated temperature applications
Gudipati , et al. November 17, 2
U.S. patent number 10,837,085 [Application Number 16/032,681] was granted by the patent office on 2020-11-17 for beta titanium alloy sheet for elevated temperature applications. This patent grant is currently assigned to TITANIUM METALS CORPORATION. The grantee listed for this patent is Titanium Metals Corporation. Invention is credited to Phani Gudipati, Yoji Kosaka.


| United States Patent | 10,837,085 |
| Gudipati , et al. | November 17, 2020 |
Beta titanium alloy sheet for elevated temperature applications
Abstract
A cold rollable beta titanium alloy is provided by the present disclosure that exhibits excellent tensile strength, and creep and oxidation resistance at elevated temperatures. In one form, the beta titanium alloy includes molybdenum between 13.0 wt. % to 20.0 wt. %, niobium between 2.0 wt. % to 4.0 wt. %, silicon between 0.1 wt. % to 0.4 wt. %, aluminum between 3.0 wt. % to 5.0 wt. %, zirconium greater than 0.0 wt. % and up to 3.0 wt. %, tin up to 5.0 wt. %, oxygen up to 0.25 wt. %, and a balance of titanium and incidental impurities. Additionally, the ranges for each element satisfies the conditions of: 6.0 wt. %.ltoreq.X wt. %.ltoreq.7.5 wt. %; and (i) 3.5 wt. %.ltoreq.Y wt. %.ltoreq.5.15 wt. %, where (ii) X wt. %=aluminum+tin/3+zirconium/6+10*(oxygen+nitrogen+carbon), and Y wt. %=aluminum+silicon*(zirconium+tin).
| Inventors: | Gudipati; Phani (Henderson, NV), Kosaka; Yoji (Henderson, NV) | ||||||||||
|---|---|---|---|---|---|---|---|---|---|---|---|
| Applicant: |
|
||||||||||
| Assignee: | TITANIUM METALS CORPORATION
(Henderson, NV) |
||||||||||
| Family ID: | 56369151 | ||||||||||
| Appl. No.: | 16/032,681 | ||||||||||
| Filed: | July 11, 2018 |
Prior Publication Data
| Document Identifier | Publication Date | |
|---|---|---|
| US 20180320251 A1 | Nov 8, 2018 | |
Related U.S. Patent Documents
| Application Number | Filing Date | Patent Number | Issue Date | ||
|---|---|---|---|---|---|
| 14703297 | May 4, 2015 | 10041150 | |||
| Current U.S. Class: | 1/1 |
| Current CPC Class: | C22F 1/183 (20130101); C22C 14/00 (20130101) |
| Current International Class: | C22C 14/00 (20060101); C22F 1/18 (20060101) |
| H01129941 | May 1989 | JP | |||
| 2006034414 | Feb 2006 | JP | |||
| 534510 | Nov 1976 | SU | |||
| 578357 | Oct 1977 | SU | |||
Other References
|
TIMET, TIMETAL 21S High Strength, Oxidation Resistant Strip Alloy, product pages, 2000. cited by applicant . Federal Institute of Industrial Property Search Report for registration No. 2017141846/02(072399), completed Aug. 22, 2018. cited by applicant. |
Primary Examiner: Zheng; Lois L
Attorney, Agent or Firm: Burris Law, PLLC
Parent Case Text
CROSS-REFERENCE TO RELATED APPLICATIONS
This application is a continuation application of U.S. application Ser. No. 14/703,297 filed on May 4, 2015, the entirety of which is incorporated herein by reference.
Claims
What is claimed is:
1. A beta titanium alloy with a chemical composition comprising: molybdenum in an amount ranging between 13.0 wt. % to 20.0 wt. %; niobium in an amount ranging between 2.0 wt. % to 4.0 wt. %; silicon in an amount ranging between 0.1 wt. % to 0.4 wt. %; aluminum in an amount ranging between 3.0 wt. % to 5.0 wt. %; zirconium in an amount greater than 0.0 wt. % and up to 3.0 wt. %; tin in an amount up to 5.0 wt. %; oxygen in an amount up to 0.25 wt. %; and a balance of titanium and incidental impurities, wherein the chemical composition satisfies the following conditions: 6.0 wt. %.ltoreq.X wt. %.ltoreq.7.5 wt. %, I. 3.5 wt. %.ltoreq.Y wt. %.ltoreq.5.15 wt. %, II. where X wt. %=aluminum+tin/3+zirconium/6+10*(oxygen+nitrogen+carbon), and Y wt. %=aluminum+silicon*(zirconium+tin).
2. The beta titanium alloy according to claim 1 further comprising chromium in an amount up to 1.5 wt. %.
3. The beta titanium alloy according to claim 1 further comprising tantalum in an amount up to 2.0 wt. %.
4. The beta titanium alloy according to claim 1 further comprising chromium in an amount up to 1.5 wt. % and tantalum in an amount up to 2.0 wt. %, wherein the total of chromium and tantalum is less than 3.0 wt. %.
5. The beta titanium alloy according to claim 1 comprising an average room temperature yield strength of at least 135 ksi (930 MPa), an ultimate tensile strength of at least 145 ksi (1000 MPa), and percent elongation of at least 7%.
6. The beta titanium alloy according to claim 1 comprising a yield strength of at least 80 ksi (551 MPa) and an ultimate tensile strength of about 90 ksi (620 MPa) at an elevated temperature of 1000.degree. F. (538.degree. C.).
7. The beta titanium alloy according to claim 1 comprising a total strain of no more than 1.0% after a creep test at 1000.degree. F./20 ksi/50 hrs (538.degree. C./138 MPa/50 hrs).
8. A part formed from the titanium alloy according to claim 1.
9. A beta titanium alloy with a chemical composition comprising: molybdenum in an amount ranging between 13.0 wt. % to 20.0 wt. %; niobium in an amount ranging between 2.0 wt. % to 4.0 wt. %; silicon in an amount ranging between 0.1 wt. % to 0.4 wt. %; aluminum in an amount ranging between 3.0 wt. % to 5.0 wt. %; zirconium in an amount up to 3.0 wt. %; tin in an amount greater than 0.0 wt. % and up to 5.0 wt. %; oxygen in an amount up to 0.25 wt. %; and a balance of titanium and incidental impurities, wherein the chemical composition satisfies the following conditions: 6.0 wt. %.ltoreq.X wt. %.ltoreq.7.5 wt. %, I. 3.5 wt. %.ltoreq.Y wt. %.ltoreq.5.15 wt. %, II. where X wt. %=aluminum+tin/3+zirconium/6+10*(oxygen+nitrogen+carbon), and Y wt. %=aluminum+silicon*(zirconium+tin).
10. The beta titanium alloy according to claim 9 further comprising chromium in an amount up to 1.5 wt. %.
11. The beta titanium alloy according to claim 9 further comprising tantalum in an amount up to 2.0 wt. %.
12. The beta titanium alloy according to claim 9 further comprising chromium in an amount up to 1.5 wt. % and tantalum in an amount up to 2.0 wt. %, wherein the total of chromium and tantalum is less than 3.0 wt. %.
13. The beta titanium alloy according to claim 9 comprising an average room temperature yield strength of at least 135 ksi (930 MPa), an ultimate tensile strength of at least 145 ksi (1000 MPa), and percent elongation of at least 7%.
14. The beta titanium alloy according to claim 9 comprising a yield strength of at least 80 ksi (551 MPa) and an ultimate tensile strength of about 90 ksi (620 MPa) at an elevated temperature of 1000.degree. F. (538.degree. C.).
15. The beta titanium alloy according to claim 9 comprising a total strain of no more than 1.0% after a creep test at 1000.degree. F./20 ksi/50 hrs (538.degree. C./138 MPa/50 hrs).
16. A beta titanium alloy with a chemical composition comprising: molybdenum in an amount ranging between 13.0 wt. % to 20.0 wt. %; niobium in an amount ranging between 2.0 wt. % to 4.0 wt. %; silicon in an amount ranging between 0.1 wt. % to 0.4 wt. %; aluminum in an amount ranging between 3.0 wt. % to 5.0 wt. %; zirconium in an amount greater than 0.0 wt. % and up to 3.0 wt. %; tin in an amount greater than 0.0 wt. % and up to 5.0 wt. %; oxygen in an amount up to 0.25 wt. %; and a balance of titanium and incidental impurities, wherein the chemical composition satisfies the following conditions: 6.0 wt. %.ltoreq.X wt. %.ltoreq.7.5 wt. %; and (i) 3.5 wt. %.ltoreq.Y wt. %.ltoreq.5.15 wt. %, (ii) where X wt. %=aluminum+tin/3+zirconium/6+10*(oxygen+nitrogen+carbon), and Y wt. %=aluminum+silicon*(zirconium+tin).
17. The beta titanium alloy according to claim 16 further comprising tantalum in an amount up to 2.0 wt. %.
18. The beta titanium alloy according to claim 16 further comprising chromium in an amount up to 1.5 wt. % and tantalum in an amount up to 2.0 wt. %, wherein the total of chromium and tantalum is less than 3.0 wt. %.
19. The beta titanium alloy according to claim 16 comprising: an average room temperature yield strength of at least 135 ksi (930 MPa), an average room temperature ultimate tensile strength of at least 145 ksi (1000 MPa), and an average room temperature percent elongation of at least 7%; and a yield strength of at least 80 ksi (551 MPa) and an ultimate tensile strength of about 90 ksi (620 MPa) at an elevated temperature of 1000.degree. F. (538.degree. C.).
20. The beta titanium alloy according to claim 16 comprising a total strain of no more than 1.0% after a creep test at 1000.degree. F./20 ksi/50 hrs (538.degree. C./138 MPa/50 hrs).
Description
FIELD
This disclosure relates generally to titanium alloys. More specifically, this disclosure relates to titanium alloys having a combination of properties including creep and oxidation resistance, in addition to tensile strength, at elevated temperatures while also being able to be produced in cold rolled sheet form.
BACKGROUND
The statements in this section merely provide background information related to the present disclosure and may not constitute prior art.
Titanium alloys are commonly used in aerospace applications due to their excellent strength to weight ratio and high temperature capability. Some commonly used titanium alloys for high temperature engine applications are near-alpha titanium alloys such as Ti-6242S (Ti-6Al-2Sn-4Zr-2Mo-0.1Si), Ti-1100 (Ti-6Al-2.7Sn-4Zr-0.4Mo-0.45Si) and Ti-834 (Ti-5.8Al-4Sn-0.7Nb-0.5Mo-0.3Si-0.006C). Although these alloys have excellent high temperature strength and creep resistance, it is very challenging to produce these alloys to sheets or strip form because of their inferior hot workability and limited cold rollability.
Due to increasing performance in aerospace applications, and especially aircraft turbojet engines with higher operating temperatures, new and improved titanium alloys that can meet the increasing mechanical and thermal requirements, while exhibiting good manufacturing characteristics, are continually desired.
SUMMARY
The present disclosure generally relates to a cold rollable beta titanium alloy having a combination of good tensile strength, creep and oxidation resistance at elevated temperatures (above about 1000.degree. F. (538.degree. C.)). The alloy consists essentially of, in weight percent, about 13.0 to about 20.0 molybdenum (Mo), about 2.0 to about 4.0 niobium (Nb), about 0.1 to about 0.4 silicon (Si), about 3.0 to about 5.0 aluminum (Al), up to about 3.0 zirconium (Zr), up to about 5.0 tin (Sn), up to about 0.25 oxygen (O), with a balance titanium (Ti) and other incidental impurities. Optional alloying elements may include, in weight percent, up to about 1.5 chromium (Cr) and up to about 2.0 tantalum (Ta), with a total of these optional alloying elements being less that about 3.0 weight percent (wt. %).
Additionally, the present disclosure relates to a cold rollable beta titanium alloy meeting the following conditions: 6.0 wt. %.ltoreq.X wt. %.ltoreq.7.5 wt. % (i) 3.5 wt. %.ltoreq.Y wt. %.ltoreq.5.15 wt. % (ii)
where: X wt. %=Al+Sn/3+Zr/6+10*(O+N+C) Y wt. %=Al+Si*(Zr+Sn)
The alloys of the present disclosure are metastable beta (.beta.-type) titanium alloys that can be strip or cold rolled to sheet gauges, among other stock forms, and exhibit excellent cold formability along with corrosion resistance in hydraulic fluids used for aircraft.
Further areas of applicability will become apparent from the description provided herein. It should be understood that the description and specific examples are intended for purposes of illustration only and are not intended to limit the scope of the present disclosure.
BRIEF DESCRIPTION OF THE DRAWINGS
The drawings described herein are for illustration purposes only and are not intended to limit the scope of the present disclosure in any way.
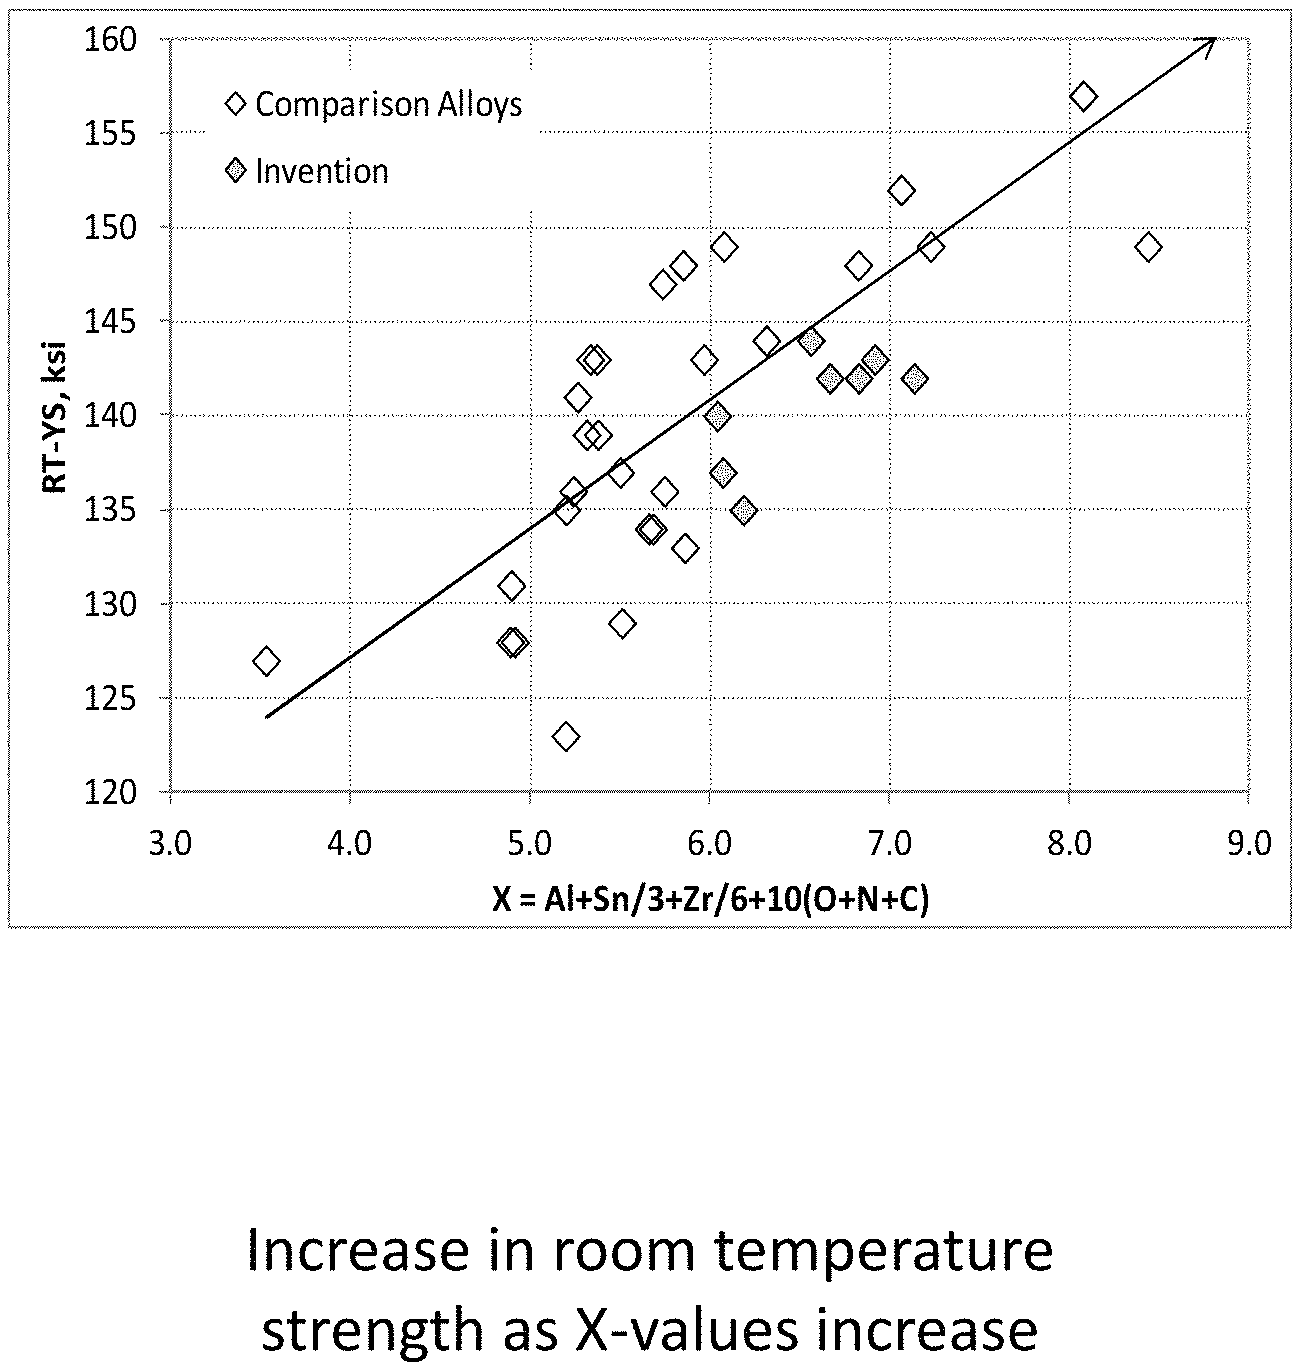
FIG. 1 is a graph of test data for beta titanium alloys according to the present disclosure compared to comparative alloys illustrating an increase in room temperature strength as the X-value of the equivalent alloy increases;
FIG. 2 is a graph of test data for beta titanium alloys according to the present disclosure compared to comparative alloys illustrating a deterioration of room temperature ductility as the X-value of the equivalent alloy increases;
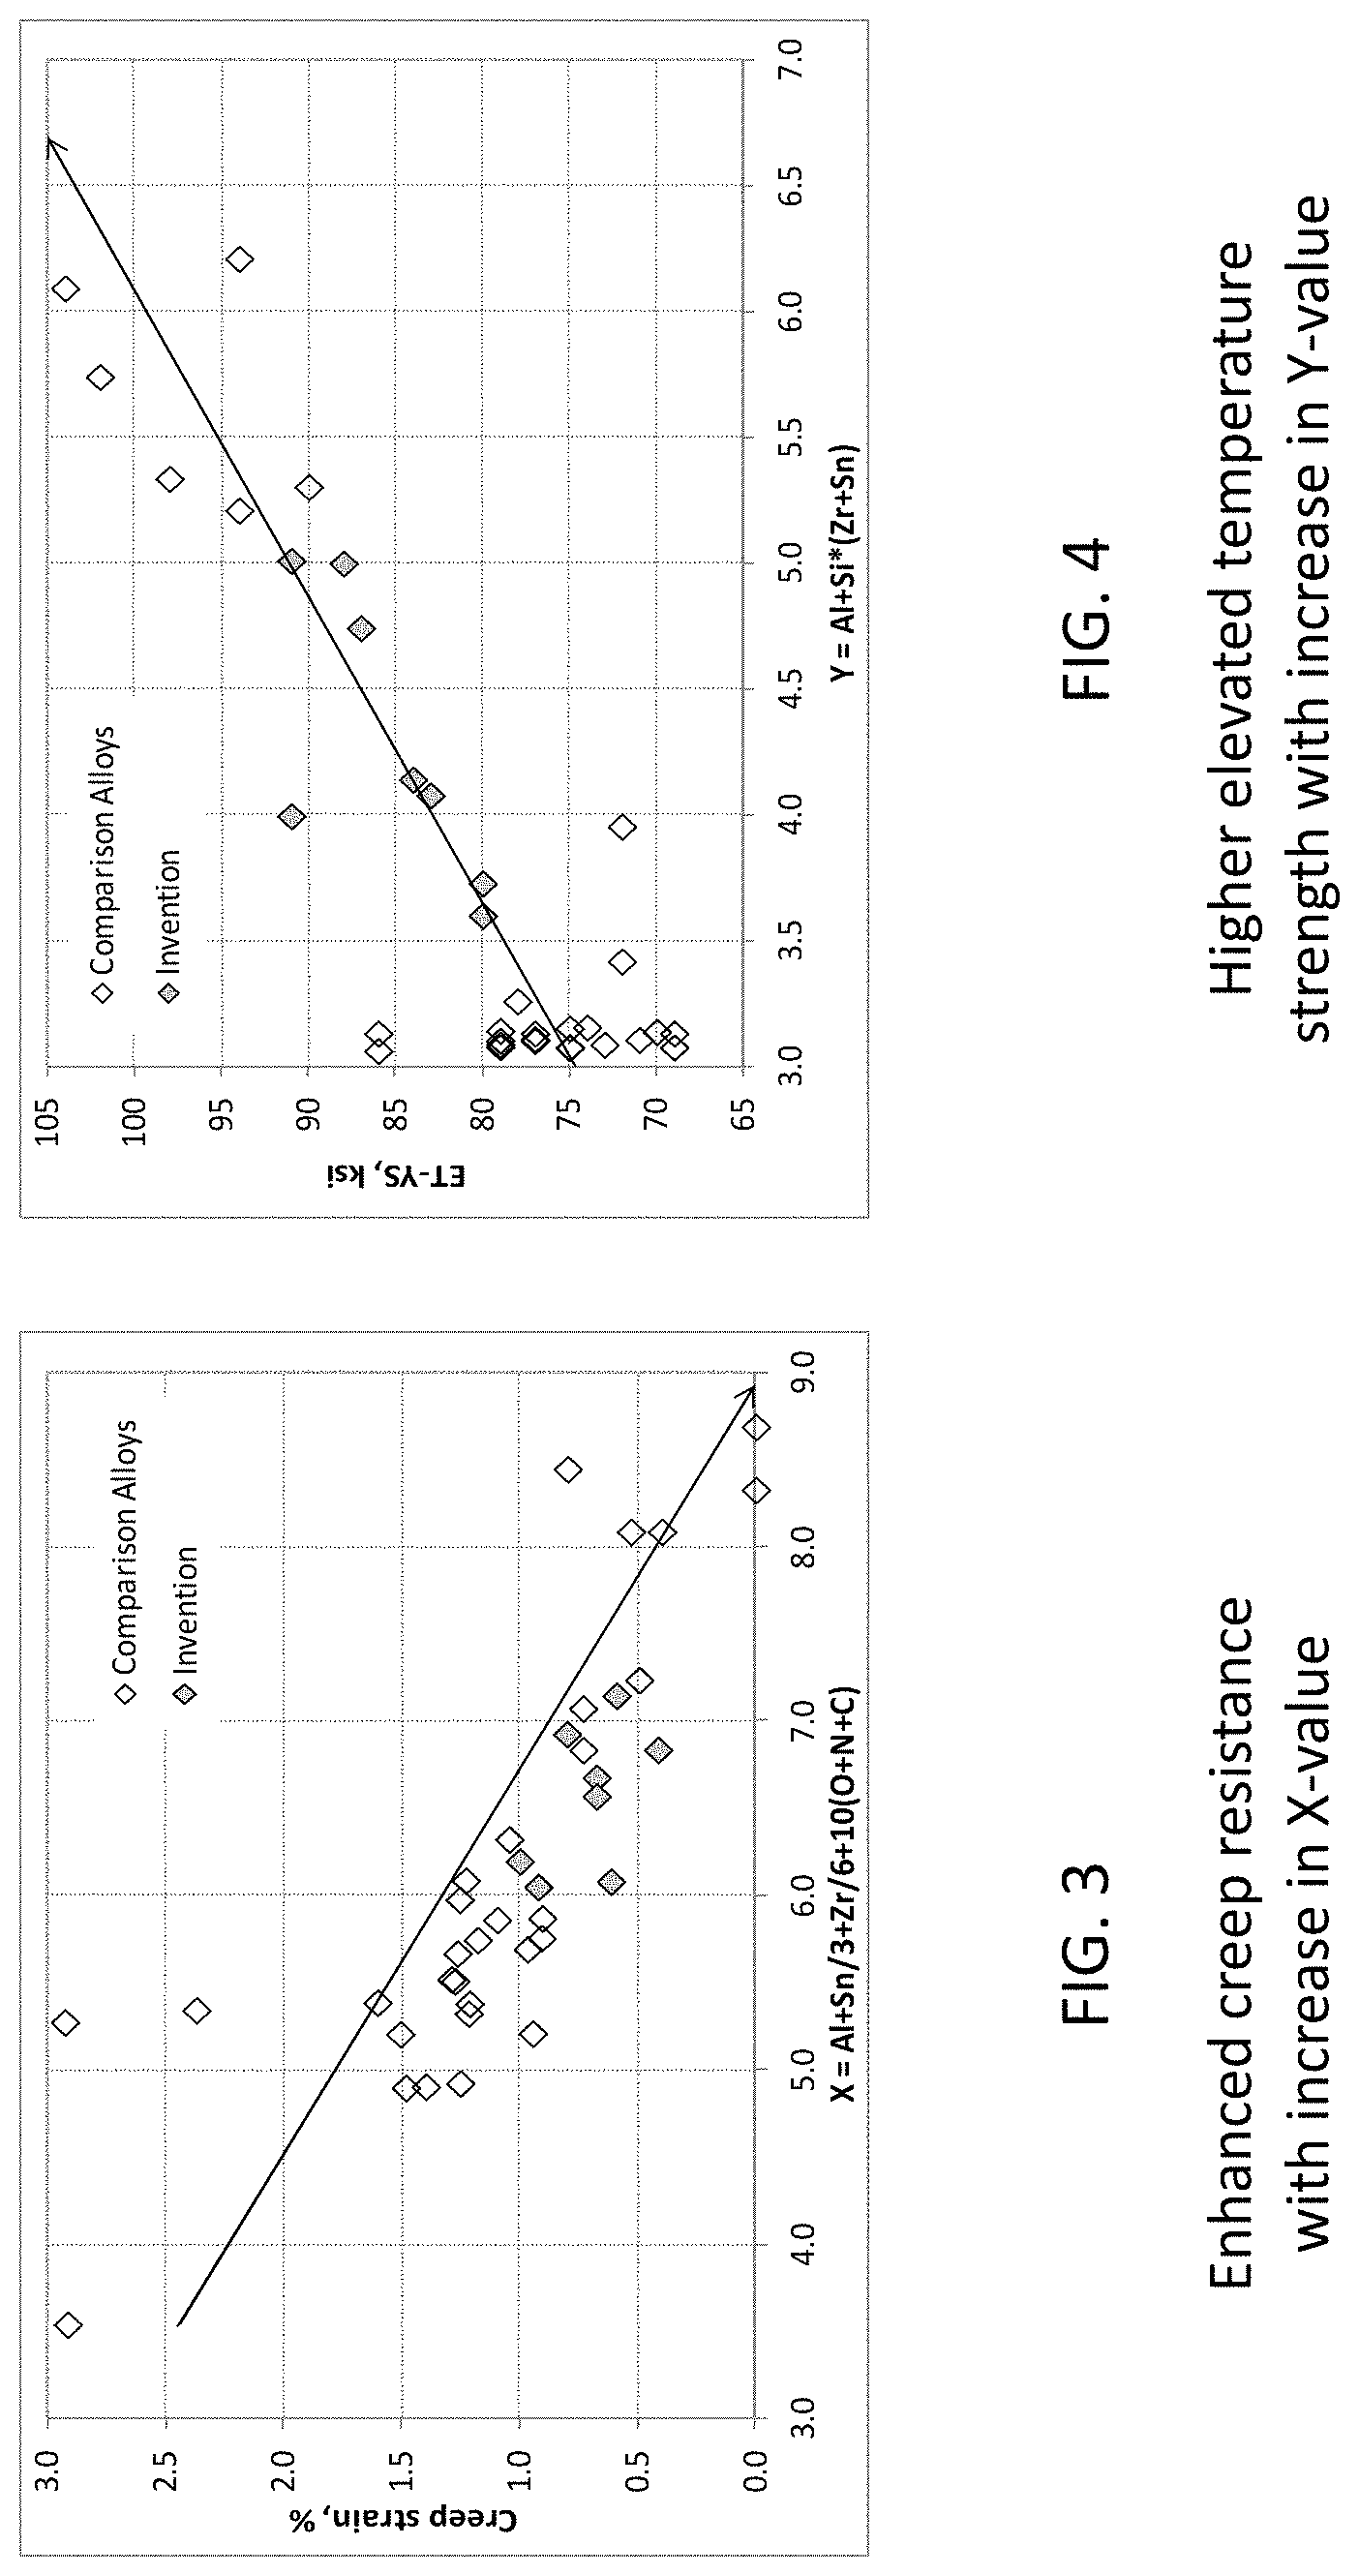
FIG. 3 is a graph of test data for beta titanium alloys according to the present disclosure compared to comparative alloys illustrating enhanced creep resistance as the X-value of the equivalent alloy increases;
FIG. 4 is a graph of test data for beta titanium alloys according to the present disclosure compared to comparative alloys illustrating higher elevated temperature strength as the Y-value of the equivalent alloy increases;
FIG. 5 is a graph of test data for beta titanium alloys according to the present disclosure compared to comparative alloys illustrating a loss of room temperature ductility as the Y-value of the equivalent alloy increases; and
FIG. 6 is a graph of test data illustrating the high temperature tensile strength (ultimate tensile strength or UTS) compared with an alloy V4 as shown in Table 4.
DETAILED DESCRIPTION
The following description is merely exemplary in nature and is in no way intended to limit the present disclosure or its application or uses. It should be understood that throughout the description, corresponding reference numerals indicate like or corresponding parts and features.
The present disclosure includes a cold rollable beta titanium alloy comprising molybdenum in an amount ranging between about 13.0 wt. % to about 20.0 wt. %, niobium in an amount ranging between about 2.0 wt. % to about 4.0 wt. %, silicon in an amount ranging between about 0.1 wt. % to about 0.4 wt. %, aluminum in an amount ranging between about 3.0 wt. % to about 5.0 wt. %, zirconium in an amount up to about 3.0 wt. %, tin in an amount up to about 5.0 wt. %, oxygen in an amount up to about 0.25 wt. %, and a balance of titanium and incidental impurities.
Optional alloying elements may be included, such as chromium in an amount up to about 1.5 wt. %, and tantalum in an amount up to about 2.0 wt. %. However, the total of chromium and tantalum is less than about 3.0 wt. %.
The titanium alloy according to the present disclosure satisfies the following conditions: 6.0 wt. %.ltoreq.X wt. %.ltoreq.7.5 wt. % (i) 3.5 wt. %.ltoreq.Y wt. %.ltoreq.5.15 wt. % (ii)
where: X wt. %=Al+Sn/3+Zr/6+10*(O+N+C) Y wt. %=Al+Si*(Zr+Sn)
Each of the alloying elements and their criticality in achieving the desired mechanical properties and cold rollability is now described in greater detail:
Molybdenum
Molybdenum (Mo) is a beta stabilizing element that substantially increases high temperature strength and creep properties. A content greater than at least 10 wt. % is needed in a titanium alloy containing molybdenum to obtain 100% meta-stable beta phase at room temperature. Excess amounts of Mo will stabilize beta phase excessively resulting poor aging response that affects the overall properties of the alloy. It was therefore determined that the range for Mo content for this invention to be 13.0 to 20.0 wt. %.
Niobium
Niobium (Nb) is employed in the alloy of the present disclosure to further enhance oxide layer thickness reduction and resistance to the formation of an oxygen enriched zone. This effect of Nb in the invented alloy can generally be observed when its content is greater than 2.0 wt. %. Excessive amounts of Nb have adverse effects on elevated temperature strength and creep resistance of the alloy as the beta phase is stabilized. It is for this reason that the Nb content was determined to be 2.0 to 4.0 wt. %.
Silicon
Silicon (Si) is used in the present disclosure in order to develop a secondary silicide phase that impedes dislocation movement and thus improves creep strength. Silicon, generally present in solid solution as well as silicide dispersions, also has an influence on the tensile strength of the inventive alloy at elevated temperatures. Silicide particles are understood to progressively release silicon into the scales during long term exposure, which increases oxidation resistance with time. A combination of Al and Si will help reduce the thickness of the oxide layer by offering resistance to the formation of an oxygen diffusion zone. If the Si content is too low, the required effect in terms of oxidation, creep and elevated temperature tensile strength cannot be achieved. On the other hand, an increased Si content results in rapid reduction of ductility that adversely affects the cold formability. In this regard, the range for Si content for the alloys of the present disclosure is determined to be in the range of about 0.1 to about 0.4 wt. %.
Aluminum
The alloy of the present disclosure contains aluminum higher than the baseline Ti-21S for the purpose of achieving greater strength and creep resistance at elevated temperatures. When the aluminum content is less than 3.0 wt. %, the effect of solution hardening is less pronounced, therefore the desired strength cannot be achieved. When the aluminum content exceeds 5.0 wt. %, resistance to hot formability is increased and cold workability is deteriorated, thereby causing difficulty in cold rollability. Frequent annealing is required to produce sheet gauge, which is not economical. Accordingly, the aluminum content of the present disclosure is in the range of about 3.0 to about 5.0 wt. % to suppress the deterioration of cold rollability while maintaining solution hardening effects.
Zirconium and Tin
Zirconium (Zr) and/or tin (Sn) are employed as alloying elements according to the teachings of the present disclosure, solely or in combination, by substituting a part of aluminum accordingly. In this case, one inventive alloy contains no more than about 3.0 wt. % of Zr and no more than about 5.0 wt. % of Sn and the value `X` as indicated in Equation (i) above, ranges from about 6.0 to about 7.5 wt. %. A higher `X` for the alloy of the present disclosure means a much higher strength alloy after aging by solid solutioning and/or alpha precipitates and/or silicide formation compared to the prior art (Ti-21S). "Ordering," a well known phenomenon in titanium alloys, is understood to occur at an aluminum equivalent of about 8 wt. %. This effectively limits the value `X` to a maximum of about 7.5% wt. % to avoid ordering. Lower `X` values (less than about 6.0 wt. %) do not provide the elevated temperature benefits of the present alloy compared to the prior art. The difference in aluminum equivalents between the alloy of the present disclosure and the prior art will also mean differences in strengthening capability between both the alloys.
Zirconium is known to form a continuous solid solution with titanium and in the alloy of the present disclosure improves the room temperature strength and enhances the creep strengthening, even with a solid solutioning mechanism or with the existence of silicon. Zirconium containing titanium alloys result in the formation of a complex compound of titanium-zirconium-silicon, (TiZr).sub.5Si.sub.3 that benefits creep resistance. Tin may also be added by substituting aluminum since it further strengthens the beta matrix and alpha precipitates, resulting in an increase in tensile strength while maintaining ductility. However, excessive addition of tin will result in ductility losses, thereby affecting the cold workability.
Oxygen
Oxygen (O) in the present inventive alloy contributes to an increase in mechanical strength by constituting a solid solution, mainly in the alpha phase. While lower oxygen content does not contribute to the overall strength of the alloy, higher content will deteriorate room temperature ductility. Accordingly the oxygen content of the present disclosure should not exceed about 0.25 wt. %.
Optional Alloying Elements
Optional alloying elements other than those mentioned above may include Chromium (Cr) and Tantalum (Ta) in accordance with the teachings of the present disclosure. The use of each individual or any combination of these elements contributes to improvement in the properties as set forth above, and the total content of these alloying elements is limited to about 3.0 wt. %. Tantalum, in particular, may be considered as an alloying addition in lieu of Sn and by substituting parts of Al. Besides being beneficial for improving the elevated temperature properties such as strength and creep resistance of the alloy, Ta is effective in achieving enhanced oxidation resistance. However, excessive amounts of Ta may lead to melt related issues, such as segregation, thus affecting the overall properties of the alloy and increasing manufacturing costs. It has therefore been determined that tantalum content be limited to a maximum of about 2.0 wt. %. Similarly, the Cr content should be limited to a maximum of about 1.5 wt. % in accordance with the teachings of the present disclosure.
The following specific embodiments are given to illustrate the composition, properties, and use of titanium alloys prepared according to the teachings of the present disclosure and should not be construed to limit the scope of the disclosure. Those skilled in the art, in light of the present disclosure, will appreciate that many changes can be made in the specific embodiments which are disclosed herein and still obtain alike or similar result without departing from or exceeding the spirit or scope of the disclosure.
Mechanical property testing was performed and compared for titanium alloys prepared within the claimed compositional range, prepared outside of the claimed compositional range, and on conventional alloys either currently in use or potentially suitable for use. One skilled in the art will understand that any properties reported herein represent properties that are routinely measured and can be obtained by multiple different methods. The methods described herein represent one such method and other methods may be utilized without exceeding the scope of the present disclosure.
Example 1
Individual alloys were melted as 250 gm button ingots. These button ingots were converted to sheet by hot rolling to 0.15'' (3.8 mm) thickness, conditioned and cold rolled by a 67% reduction to a thickness of 0.050'' (1.27 mm). The cold rolling process was used as a preliminary indicator of the capability of various alloys for strip producibility. Those alloys that cracked during the conversion process were not evaluated further. The cold rolled sheets were subjected to a conventional beta solution anneal followed by duplex ageing at 1275.degree. F./8 hr/air cool and 1200.degree. F./8 hr/air cool. (691.degree. C./8 hr/air cool and 649.degree. C./8 hr/air cool). Coupons were cut from these sheets for ambient and elevated temperature tensile tests and creep testing.
Table 1 below includes the chemical composition of a series of button ingots that were melted. Mechanical properties including ambient, elevated temperature tensile and percentage strain measured during creep tests are shown in Table 2 below. All elevated temperature tensile tests were performed at 1000.degree. F. (538.degree. C.). Creep tests were conducted at 1000.degree. F./20 ksi (538.degree. C./138 MPa) for 50 hr and creep strain was measured.
As shown from the test results, alloys with "X" and "Y" values below the lower limit as indicated in Equations (i) and (ii) display inferior properties, including lower strength, than the targeted values. Higher Al content than the upper limit specified in the present disclosure, relates to high "X" values, thus deteriorating the room temperature ductility (and overall cold formability). The index "Y" is used for determining the chemical composition of the alloy to achieve improved properties. With "X" values within the specified limits, a low "Y" index results in inferior strength at elevated temperatures, and a high "Y" deteriorates cold formability. It is therefore desired to maintain a balance in the addition of alloying elements in accordance with the Equations (i) and (ii) set forth above.
As shown, alloys containing low Al without Zr or Sn (Alloy A5) have poor elevated temperature strength and creep resistance. Alloys with high Al content greater than the limit mentioned in the present disclosure (Alloys A24, A25, A26 etc.) deteriorates the ductility at room temperature, thereby affecting the overall cold formability. An elevated Nb level (Alloy A4) adversely affects the high temperature strength while degrading creep resistance. Also, due to the absence of other alloying elements to substitute for Al content, the alloy A4 fails to meet the targeted ambient temperature strength. Alloy A29 contains 2.0 wt. % Ta replacing Sn and substituting parts of Al, within the limits specified in this disclosure. It is noteworthy to mention that this alloy also exhibits an excellent balance of properties and confirms the benefit of Ta addition within the limits according to the teachings of the present disclosure.
TABLE-US-00001 TABLE 1 Mo Al Nb Si Sn Zr O Others X Y Range 13.0-20.0 3.0-5.0 2.0-4.0 0.1-0.4 .ltoreq.5.0 .ltoreq.3.0 C .ltoreq.- 0.25 N <3.0 6.0-7.5 3.50-5.15 Comments A1 19.3 3.12 2.84 0.19 0.02 0.00 0.01 0.21 0.004 0.000 5.37 3.12 Compariso- n A2 14.5 3.06 2.82 0.32 0.02 0.00 0.01 0.20 0.003 0.000 5.20 3.07 Compariso- n A3 14.7 3.06 2.85 0.47 0.02 0.00 0.01 0.23 0.003 0.000 5.50 3.07 Compariso- n A4 14.6 3.06 5.08 0.17 0.03 0.00 0.01 0.20 0.002 0.000 5.19 3.07 Compariso- n A5 14.7 1.15 2.65 0.21 0.02 0.00 0.01 0.22 0.007 0.000 3.53 1.15 Compariso- n A6 14.6 5.00 2.84 0.17 0.01 0.00 0.02 0.19 0.003 0.000 7.13 5.00 Invention- A7 14.5 3.07 2.83 0.18 1.01 0.00 0.01 0.20 0.000 0.000 5.51 3.25 Compariso- n A8 14.6 3.08 2.85 0.17 3.01 0.00 0.01 0.19 0.010 0.000 6.18 3.59 Invention- A9 14.5 3.10 2.83 0.18 4.93 0.00 0.01 0.20 0.007 0.000 6.91 3.99 Invention- A10 14.4 3.07 2.83 0.18 0.06 0.00 0.07 0.24 0.012 0.000 6.31 3.08 Comparis- on A11 14.6 3.05 2.84 0.16 0.03 0.00 0.01 0.21 0.007 1.97 Cr 5.33 3.05 Comparison A12 14.7 3.08 2.87 0.46 0.03 0.00 0.01 0.20 0.007 1.98 Cr 5.26 3.09 Comparison A13 14.3 3.06 2.82 0.48 0.02 0.00 0.01 0.20 0.007 3.03 Cr 5.24 3.07 Comparison A14 14.4 3.05 2.83 0.18 0.02 1.98 0.01 0.23 0.007 0.000 5.86 3.41 Comparis- on A15 14.4 3.05 2.83 0.45 0.02 1.97 0.01 0.21 0.007 0.000 5.66 3.95 Comparis- on A17 14.5 3.15 2.66 0.20 0.01 0.00 0.01 0.24 0.003 0.000 5.68 3.15 Comparis- on A18 14.4 3.10 2.54 0.21 0.01 0.00 0.02 0.24 0.003 0.000 5.73 3.10 Comparis- on A19 14.4 3.09 2.53 0.21 0.01 0.00 0.03 0.24 0.005 0.000 5.85 3.10 Comparis- on A20 14.5 3.12 2.64 0.34 0.01 0.00 0.01 0.25 0.002 0.000 5.74 3.12 Comparis- on A21 14.5 3.14 2.66 0.40 0.01 0.00 0.03 0.25 0.002 0.000 5.96 3.14 Comparis- on A22 14.5 3.13 2.64 0.45 0.01 0.00 0.02 0.27 0.004 0.000 6.07 3.13 Comparis- on A23 14.4 4.13 2.65 0.20 0.01 0.00 0.01 0.24 0.003 0.000 6.66 4.13 Inventio- n A24 14.0 5.19 2.70 0.36 0.01 0.00 0.07 0.24 0.002 0.000 8.31 5.19 Comparis- on A25 13.9 5.11 2.68 0.35 5.06 0.00 0.08 0.22 0.003 0.000 9.83 6.88 Comparis- on A26 14.0 6.15 2.69 0.21 0.01 0.00 0.02 0.23 0.002 0.000 8.67 6.15 Comparis- on A27 15.5 3.10 2.69 0.22 0.02 0.00 0.02 0.19 0.011 0.000 5.31 3.10 Comparis- on A28 15.4 3.08 2.66 0.10 0.02 0.00 0.02 0.20 0.009 0.000 5.37 3.08 Comparis- on A29 15.5 3.10 2.64 0.31 0.00 0.00 0.02 0.20 0.007 2.0 Ta 6.04 3.72 Invention A30 15.4 4.08 2.67 0.37 3.03 0.00 0.01 0.18 0.007 0.000 7.06 5.20 Comparis- on A31 15.4 4.07 2.61 0.22 0.02 3.00 0.02 0.17 0.008 0.000 6.56 4.73 Inventio- n A33 15.3 4.56 2.63 0.38 2.02 0.00 0.02 0.16 0.019 0.000 7.22 5.33 Comparis- on A34 15.2 4.54 2.61 0.22 0.01 2.04 0.02 0.16 0.014 0.000 6.82 4.99 Inventio- n A35 15.2 4.54 2.62 0.37 0.01 2.03 0.02 0.16 0.014 0.000 6.82 5.29 Comparis- on A36 15.2 4.06 2.61 0.37 0.01 0.01 0.01 0.18 0.010 0.000 6.07 4.07 Inventio- n A37 15.2 5.07 2.60 0.22 0.01 3.00 0.02 0.22 0.010 0.000 8.07 5.73 Comparis- on A38 15.4 5.09 2.66 0.22 0.01 5.04 0.02 0.22 0.010 0.000 8.43 6.20 Comparis- on A39 15.4 6.08 2.70 0.38 0.01 0.00 0.02 0.17 0.009 0.000 8.07 6.08 Comparis- on A40 15.4 3.10 2.66 0.22 0.02 0.00 0.02 0.16 0.009 0.000 4.91 3.10 Comparis- on A41 15.6 3.13 2.66 0.22 0.01 0.00 0.02 0.15 0.010 0.000 4.89 3.13 Comparis- on A42 15.6 3.12 2.70 0.23 0.01 0.00 0.02 0.15 0.009 0.000 4.88 3.12 Comparis- on X = Al + (Sn/3) + (Zr/6) + 10(O + N + C) Y = Al + Si*(Zr + Sn)
TABLE-US-00002 TABLE 2 Room Temperature Properties Elevated Temperature Properties YS, ksi UTS, ksi YS, ksi UTS, ksi (MPa) (MPa) EI % (MPa) (MPa) Creep, % Target Remarks .gtoreq.135 (930) .gtoreq.145 (1000) .gtoreq.7.0 .gtoreq.80 (551) .gtoreq.90 (620) EI, % .ltoreq.1.00 Comments A1 Comparison 143 (986) 153 (1055) 10 86 (593) 97 (669) 18 1.21 Poor Creep A2 Comparison 135 (931) 146 (1007) 13 75 (517) 90 (620) 16 0.95 Low ET Strength A3 Comparison 137 (945) 148 (1020) 9 75 (517) 90 (620) 17 1.27 Poor Creep, Low ET Strength A4 Comparison 123 (848) 134 (924) 14 69 (476) 78 (538) 24 1.51 Poor Creep, Low RT & ET Strength A5 Comparison 127 (876) 135 (931) 9 58 (400) 71 (489) 18 2.92 Poor Creep, Low RT & ET Strength A6 Invention 142 (979) 155 (1069) 15 91 (627) 109 (751) 15 0.59 Invention A7 Comparison 129 (889) 140 (965) 15 78 (538) 93 (641) 27 1.29 Poor Creep, Low RT & ET Strength A8 Invention 135 (931) 145 (1000) 11 80 (552) 94 (648) 17 1.00 Invention A9 Invention 143 (986) 153 (1055) 10 91 (627) 108 (745) 18 0.80 Invention A10 Comparison 144 (993) 155 (1069) 14 79 (545) 94 (648) 24 1.05 Poor Creep, Low ET Strength A11 Comparison 143 (986) 155 (1069) 12 86 (593) 88 (607) 23 2.37 Poor Creep, Low ET Strength A12 Comparison 141 (972) 153 (1055) 10 77 (531) 89 (614) 40 2.93 Poor Creep, Low ET Strength A13 Comparison 136 (938) 148 (1020) 9 79 (545) 90 (620) 40 5.31 Poor Creep, Low ET Strength A14 Comparison 133 (917) 144 (993) 11 72 (496) 88 (607) 18 0.91 Low RT & ET strength A15 Comparison 134 (924) 145 (1000) 3 72 (496) 86 (593) 20 1.26 Poor Creep, Low RT Strength & EI A17 Comparison 134 (924) 146 (1007) 18 74 (510) 84 (579) 25 0.97 Low RT & ET strength A18 Comparison 147 (1013) 158 (1098) 11 77 (531) 93 (641) 29 1.18 Poor Creep, Low ET Strength A19 Comparison 148 (1020) 159 (1096) 8 79 (545) 91 (627) 12 1.10 Poor Creep, Low ET Strength A20 Comparison 136 (938) 145 (1000) 5 77 (531) 89 (614) 20 0.91 Low RT-EI, Low ET strength A21 Comparison 143 (986) 154 (1062) 6 75 (517) 88 (607) 19 1.26 Low RT-EI, Poor Creep, Low ET Strength A22 Comparison 149 (1027) 162 (1117) 6 79 (545) 91 (627) 21 1.23 Low RT-EI, Poor Creep, Low ET Strength A23 Invention 142 (979) 154 (1062) 9 84 (579) 96 (662) 18 0.68 Invention A24 Comparison Broken during conversion Poor Cold Formability A25 Comparison Broken during conversion Poor Cold Formability A26 Comparison Broken during conversion Poor Cold Formability A27 Comparison 139 (958) 149 (1027) 8 77 (531) 90 (620) 25 1.22 Poor Creep, Low ET Strength A28 Comparison 139 (958) 150 (1034) 12 73 (503) 87 (599) 24 1.60 Poor Creep, Low ET Strength A29 Invention 140 (965) 150 (1034) 12 80 (552) 94 (648) 20 0.92 Invention A30 Comparison 152 (1048) 157 (1082) 3 94 (648) 111 (765) 16 0.73 Low RT-EI A31 Invention 144 (993) 154 (1062) 8 87 (600) 102 (703) 21 0.68 Invention A33 Comparison 149 (1027) 153 (1055) 2 98 (676) 115 (793) 23 0.49 Low RT-EI A34 Invention 142 (979) 153 (1055) 13 88 (607) 103 (710) 17 0.41 Invention A35 Comparison 148 (1020) 152 (1048) 2 90 (621) 106 (731) 19 0.73 Low RT-EI A36 Invention 137 (945) 149 (1027) 12 83 (572) 98 (676) 14 0.61 Invention A37 Comparison 157 (1082) 168 (1158) 4 102 (703) 121 (834) 13 0.53 Low RT-EI A38 Comparison 149 (1027) 149 (1027) 0 94 (648) 115 (793) 23 0.80 Low RT-EI A39 Comparison 157 (1082) 165 (1138) 2 104 (717) 127 (876) 18 0.40 Low RT-EI A40 Comparison 128 (882) 138 (951) 17 71 (489) 88 (607) 22 1.25 Poor Creep, Low RT & ET Strength A41 Comparison 131 (903) 140 (965) 15 70 (483) 83 (572) 12 1.40 Poor Creep, Low RT & ET Strength A42 Comparison 128 (882) 138 (951) 15 69 (476) 82 (565) 25 1.48 Poor Creep, Low RT & ET Strength All Elevated Temperature Tests at 1000 F. (537.8 C.) Creep test condition: 1000 F./20 ksi/50 hr (537.8 C./137.9 MPa/50 hr)
While Tables 1 and 2 present the chemical composition and the mechanical properties respectively, for the button alloys, Table 3 below provides a summary of each alloy, with a "P" indicating that the particular property/value confers to the desired target and an "F" indicating out of limits for the corresponding alloy:
TABLE-US-00003 TABLE 3 RT Properties ET Properties at 1000 F. 6 .ltoreq. X- 3.5 .ltoreq. Y- YS .gtoreq. UTS .gtoreq. EI .gtoreq. YS .gtoreq. UTS .gtoreq. Creep .ltoreq. Alloy value .ltoreq. 7.5 index .ltoreq. 5.15 135 ksi 145 ksi 7.0% 80 ksi 90 ksi 1.0% Conclusion A1 F F P P P P P F Comparison A2 F F P P P F P P Comparison A3 F F P P P F P F Comparison A4 F F F F P F F F Comparison A5 F F F F P F F F Comparison A6 P P P P P P P P Invention A7 F F F F P F P F Comparison A8 P P P P P P P F Invention A9 P P P P P P P P Invention A10 P F P P P F P F Comparison A11 F F P P P P F F Comparison A12 F F P P P F F F Comparison A13 F F P P P F P F Comparison A14 F F F F P F F P Comparison A15 F P F P F F F F Comparison A17 F F F P P F F P Comparison A18 F F P P P F P F Comparison A19 F F P P P F P F Comparison A20 F F P P F F F P Comparison A21 F F P P F F F F Comparison A22 P F P P F F P F Comparison A23 P P P P P P P P Invention A24 F F F F F F F P Comparison A25 F F F F F F F P Comparison A26 F F F F F F F P Comparison A27 F F P P P F P F Comparison A28 F F P P P F F F Comparison A29 P P P P P P P P Invention A30 P F P P F P P P Comparison A31 P P P P P P P P Invention A33 P F P P F P P P Comparison A34 P P P P P P P P Invention A35 P F P P F P P P Comparison A36 P P P P P P P P Invention A37 F F P P F P P P Comparison A38 F F P P F P P P Comparison A39 F F P P F P P P Comparison A40 F F F F P F F F Comparison A41 F F F F P F F F Comparison A42 F F F F P F F F Comparison
Referring now to the figures, FIGS. 1 through 3 present the effect of the "X" value on room temperature yield strength, elongation, and the creep strain observed on the button alloys. As evident from the trends depicted in the respective figures, it can be noted that a low "X" value relates to low strength, and an increase in the "X" value subsequently increases strength, however at the compromise of the room temperature ductility. Also, significant improvements in the creep resistance of the button alloys with an increase in "X" values can be observed from FIG. 3. Similarly, FIGS. 4 and 5 show that an increase in the "Y" index also relates to an increase in elevated temperature strength, but a corresponding loss in room temperature ductility respectively, for the button alloys.
In summary, it is to be understood that "X" and "Y" values higher than the limits according to the present disclosure, lead to an increase in strength and improvement of creep resistance, however, the cold formability of the alloy deteriorates considerably. On the other hand, low values of "X" and "Y" other than those according to the present disclosure, do not achieve the required target properties.
Example 2
Four alloy ingots, each about 38 lb (17 kg) were made using a laboratory VAR (Vacuum Arc Remelting) furnace. The ingots were 8'' (200 mm) diameter and produced using a double VAR process. Chemical compositions of these ingots are shown in Table 4 below. The ingots were forged to 1.5'' (3.8 cm) thick plates, followed by hot rolling to 0.15'' (3.8 mm) thick plates. After conditioning to remove the alpha case and the scale, these plates were then cold rolled to 0.060'' (1.5 mm) followed by solution anneal and duplex ageing. Various tests were performed on the sheets to verify the superiority in properties of the alloy of the present disclosure compared to the baseline Ti-21S alloy.
TABLE-US-00004 TABLE 4 Mo Al Nb Si Sn Zr O Others X, wt % Y, wt % Range 13.0-20.0 3.0-5.0 2.0-4.0 0.1-0.4 .ltoreq.5.0 .ltoreq.3.0 C .ltoreq.- 0.25 N <3.0 6.0-7.5 3.50-5.15 Remarks V1 16.2 4.60 2.83 0.23 0.016 1.48 0.009 0.15 0.007 0.000 6.51 4.94 Inventi- on V2 16.2 4.67 2.85 0.24 0.017 1.89 0.015 0.15 0.008 0.000 6.72 5.13 Inventi- on V3 16.0 4.58 2.79 0.23 0.017 2.27 0.013 0.15 0.009 0.000 6.68 5.11 Inventi- on V4 15.8 4.59 2.76 0.35 0.000 0.00 0.012 0.16 0.010 2.0 Ta 7.08 5.29 Comparison Prod. Heat 15.5 2.84 2.71 0.20 0.015 0.00 0.022 0.12 0.001 0.000 4.28 2.84- Comparison
Results of evaluation from these sheets as set forth above are shown in Table 5:
TABLE-US-00005 TABLE 5 Room Temperature Properties Elevated Temperature Properties YS, ksi UTS, ksi YS, ksi UTS, ksi (MPa) (MPa) EI % (MPa) (MPa) Creep, % Target Comments .gtoreq.135 (930) .gtoreq.145 (1000) .gtoreq.7.0 .gtoreq.80 (551) .gtoreq.90 (620) EI % .ltoreq.1.0 Remarks V1 Invention 148 (1022) 161 (1109) 7.8 90 (620) 102 (703) 14 0.34 Invention V2 Invention 150 (1036) 162 (1120) 7.2 85 (586) 94 (648) 13 0.46 Invention V3 Invention 149 (1027) 161 (1107) 9.2 98 (676) 112 (772) 14 0.31 Invention V4 Comparison 155 (1069) 165 (1141) 4.1 87 (596) 97 (667) 13 0.42 Low RT-EI Prod. Heat Comparison 131 (903) 141 (972) 22.0 73 (503) 82 (565) 48 1.70 Low RT, ET strength, Poor Creep All Elevated Temperature Tests at 1000 F. (537.8 C.) Creep test condition: 1000 F./20 ksi/50 hr (537.8 C./137.9 MPa/50 hr)
A noticeable increase in the room temperature strength (about 13.about.15%) for the alloys according to the present disclosure was observed when compared to the baseline Ti-21S alloy (production heat). As set forth above in Equation (ii), the "Y" index of Alloy V4 exceeds the specified limit that reflects in lower room temperature elongation, thereby affecting the cold workability.
Elevated temperature strength at various temperatures for the four alloy sheets along with the production heat (Ti-21S) is shown below in Table 6 and graphically represented in FIG. 6. As demonstrated, the alloys of present disclosure provide about 80.about.130.degree. F. (or 44.about.72.degree. C.) advantage over the baseline Ti-21S, over the range of test temperatures. Although the Alloy V4 exhibits equivalent strength as others in the present disclosure, it is to be noted that Alloy V4 exceeds the index "Y" specified in Equation (ii) above and thus has deteriorated ductility at room temperature.
TABLE-US-00006 TABLE 6 Elevated temperature UTS, ksi (MPa) of the invented alloy sheets 1000.degree. F. 1100.degree. F. 1200.degree. F. 1300.degree. F. 1400.degree. F. Ingot Remarks (537.8.degree. C.) (593.3.degree. C.) (648.9.degree. C.) (704.4.degree. C.) (760.degree. C.) V1 Invention 102 (703) 96 (662) 68 (469) 42 (289) V2 Invention 111 (765) 98 (676) 71 (489) 42 (289) V3 Invention 112 (772) 99 (682) 71 (489) 42 (289) V4 Comparison 97 (669) 100 (689) 76 (524) 45 (310) Prod. Heat Comparison 82 (565) 42 (289) 13 (90)
As shown below in Table 7, the Larson Miller Parameter for the alloys of the present disclosure almost falls within the range of a near alpha titanium alloy such as Ti-6242S at the tested temperatures, exhibiting exceptional creep resistance for a beta titanium alloy:
TABLE-US-00007 TABLE 7 Larson-Miller Alloy Parameter (0.2%) Remarks V1 31.53 Invention V2 31.12 Invention V3 31.67 Invention V4 31.31 Comparison Prod. Heat (Ti--21S) 30.12 Comparison Prod. Heat (Ti--6242S) 31.39 Comparison Note: Larson Miller Parameter = [(492 + T) * (20 + log.sub.10t)/1000], where `T` is temperature in .degree. F. and `t` is time in hrs., respectively.
Oxidation Testing
Weighed coupons from the sheets produced using the compositions shown in Table 4 were exposed to air at temperatures of 1200.degree. F. (649.degree. C.) and 1400.degree. F. (760.degree. C.) for 200 hours. The specimens were weighed again after the test and the weight gain was calculated based on the area of specimen exposed. This weight gain (mg/cm.sup.2) is used as the criterion for determining oxidation resistance. As shown in Table 8 below, slightly higher weight gain for the alloys of the present disclosure at low temperature (such as 1200.degree. F. or 649.degree. C.) is noted, but lower weight gain at high temperatures (>1200.degree. F. or 649.degree. C.) demonstrates the ability of the alloy to be used for elevated temperature applications.
TABLE-US-00008 TABLE 8 Weight Gain (mg/cm.sup.2) 1200.degree. F. 1400.degree. F. Alloy (649.degree. C.)/200 hr (760.degree. C.)/200 hr Remarks V1 0.925 1.860 Invented V2 0.982 1.020 Invented V3 1.139 2.135 Invented V4 0.620 1.198 Comparison Prod. Heat 0.576 2.165 Comparison (Ti--21S) Prod. Heat 0.453 4.629 Comparison (Ti--6242S)
Additional oxidation tests were performed in a thermo gravimetric analysis (TGA) unit, wherein the samples were exposed to air in a temperature range of 1000.degree. F. to 1500.degree. F. (538.degree. C. to 816.degree. C.) for 200 hours. Samples from the alloy V1 (as mentioned in Table 4) and production scale Ti-21S were used for this experimental purpose. Results, shown in Table 9 below, indicate a similar trend as observed in the oxidation studies mentioned above. The oxidation weight gain (mg/cm.sup.2) of the inventive alloy is slightly higher than the standard Ti-21S at the lower temperatures, however, lower weight gain measurements were recorded for the inventive alloy at temperatures greater than 1200.degree. F. (649.degree. C.).
TABLE-US-00009 TABLE 9 1000.degree. F. 1100.degree. F. 1200.degree. F. 1300.degree. F. 1400.degree. F. 1500.degree. F. (538.degree. C.) (593.degree. C.) (649.degree. C.) (704.degree. C.) (760.degree. C.) (816.degree. C.) Alloy V1 0.309 0.488 0.975 1.311 1.929 4.927 Prod. Heat Ti--21S 0.200 0.464 0.806 1.350 2.255 5.979
Accordingly, the alloy properties of the present disclosure achieve at least 10% higher minimum room temperature strength and elongation than the Ti-21S alloy, subjected to solution anneal and duplex aging (AMS 4897). Additionally, the high temperature strength and creep properties of the alloys of the present disclosure provide about 100.degree. F. (55.degree. C.) improvement in service temperatures over the baseline Ti-21S alloy. Further, alloys of the present disclosure exhibited significantly lower weight gain compared to the baseline Ti-21S alloy when subjected to oxidation tests at elevated temperatures (above about 1200.degree. F. or 649.degree. C.) for about 200 hours. The present inventive alloy thus delivers a strip producible beta titanium alloy with high strength at room temperature and excellent elevated temperature properties such as creep and oxidation resistance.
Cold rolling, or processing alloy stock below its recrystallization temperature, may be performed with a variety of stock forms, such as strip, coil sheet, bar, or rod by way of example. The cold rolling process may be continuous, or discontinuous, and reduction of the stock through the cold rolling process is between about 20% and about 90%. In one form of the present disclosure, cold rolling is performed with a continuous strip coil process.
The foregoing description of various forms of the invention has been presented for purposes of illustration and description. It is not intended to be exhaustive or to limit the invention to the precise forms disclosed. Numerous modifications or variations are possible in light of the above teachings. The forms discussed were chosen and described to provide illustrations of the principles of the invention and its practical application to thereby enable one of ordinary skill in the art to utilize the invention in various forms and with various modifications as are suited to the particular use contemplated. All such modifications and variations are within the scope of the invention as determined by the appended claims when interpreted in accordance with the breadth to which they are fairly, legally, and equitably entitled.
* * * * *
D00000
D00001
D00002
D00003
D00004
XML
uspto.report is an independent third-party trademark research tool that is not affiliated, endorsed, or sponsored by the United States Patent and Trademark Office (USPTO) or any other governmental organization. The information provided by uspto.report is based on publicly available data at the time of writing and is intended for informational purposes only.
While we strive to provide accurate and up-to-date information, we do not guarantee the accuracy, completeness, reliability, or suitability of the information displayed on this site. The use of this site is at your own risk. Any reliance you place on such information is therefore strictly at your own risk.
All official trademark data, including owner information, should be verified by visiting the official USPTO website at www.uspto.gov. This site is not intended to replace professional legal advice and should not be used as a substitute for consulting with a legal professional who is knowledgeable about trademark law.