MicroRNA biomarker for the diagnosis and treatment of gastric cancer
Too , et al. Sep
U.S. patent number 10,767,230 [Application Number 15/501,691] was granted by the patent office on 2020-09-08 for microrna biomarker for the diagnosis and treatment of gastric cancer. This patent grant is currently assigned to Agency for Science, Technology and Research, National University Hospital (Singapore) Pte Ltd., National University of Singapore. The grantee listed for this patent is Agency for Science, Technology and Research, National University Hospital (Singapore) Pte Ltd, National University of Singapore. Invention is credited to Bok Yan So, Heng-phon Too, Khay Guan Yeoh, Wei Peng Yong, Lihan Zhou, Feng Zhu, Ruiyang Zou.


View All Diagrams
| United States Patent | 10,767,230 |
| Too , et al. | September 8, 2020 |
MicroRNA biomarker for the diagnosis and treatment of gastric cancer
Abstract
Disclosed are methods of determining the likelihood of a subject having or developing a gastric cancer. The methods comprise measuring the expression level of at least one miRNA having at least 90% sequence identity with an miRNA as described herein in a non-cellular biofluid sample obtained from the subject, wherein differential expression of miRNA expression in the sample obtained from the subject, as compared to a control, may be indicative of the subject having gastric cancer and wherein the miRNA may be either an miRNA listed as "up-regulated" or an miRNA listed as "down-regulated". Also disclosed is a method of determining the likelihood of a subject having or developing a stage of a gastric cancer.
| Inventors: | Too; Heng-phon (Singapore, SG), Zhou; Lihan (Singapore, SG), Zou; Ruiyang (Singapore, SG), Yeoh; Khay Guan (Singapore, SG), So; Bok Yan (Singapore, SG), Zhu; Feng (Singapore, SG), Yong; Wei Peng (Singapore, SG) | ||||||||||
|---|---|---|---|---|---|---|---|---|---|---|---|
| Applicant: |
|
||||||||||
| Assignee: | Agency for Science, Technology and
Research (Singapore, SG) National University of Singapore (Singapore, SG) National University Hospital (Singapore) Pte Ltd. (Singapore, SG) |
||||||||||
| Family ID: | 1000005041349 | ||||||||||
| Appl. No.: | 15/501,691 | ||||||||||
| Filed: | August 11, 2015 | ||||||||||
| PCT Filed: | August 11, 2015 | ||||||||||
| PCT No.: | PCT/SG2015/050256 | ||||||||||
| 371(c)(1),(2),(4) Date: | February 03, 2017 | ||||||||||
| PCT Pub. No.: | WO2016/022076 | ||||||||||
| PCT Pub. Date: | February 11, 2016 |
Prior Publication Data
| Document Identifier | Publication Date | |
|---|---|---|
| US 20170233822 A1 | Aug 17, 2017 | |
Foreign Application Priority Data
| Aug 7, 2014 [SG] | 10201404742W | |||
| Current U.S. Class: | 1/1 |
| Current CPC Class: | G16B 25/00 (20190201); G16H 50/20 (20180101); G16B 20/00 (20190201); C12Q 1/6886 (20130101); G01N 33/57407 (20130101); C12Q 2600/106 (20130101); C12Q 2600/16 (20130101); C12Q 2600/178 (20130101); C12Q 2600/118 (20130101); G01N 2800/50 (20130101); C12Q 2600/158 (20130101); C12Q 2600/112 (20130101) |
| Current International Class: | C12Q 1/6886 (20180101); G16B 25/00 (20190101); G16B 20/00 (20190101); G01N 33/574 (20060101); G16H 50/20 (20180101) |
References Cited [Referenced By]
U.S. Patent Documents
| 2013/0065769 | March 2013 | Wong |
| 101988059 | Mar 2011 | CN | |||
| 102007223 | Apr 2011 | CN | |||
| 103773761 | May 2014 | CN | |||
| 2013085542 | May 2013 | JP | |||
| WO-2009/108853 | Sep 2009 | WO | |||
| WO-2009/147656 | Dec 2009 | WO | |||
| WO-2012/010584 | Jan 2012 | WO | |||
| WO-2015052526 | Apr 2015 | WO | |||
Other References
|
Liu, Rui, et al. "A five-microRNA signature identified from genome-wide serum microRNA expression profiling serves as a fingerprint for gastric cancer diagnosis." European journal of cancer 47.5 (2011): 784-791. cited by examiner . Benjamini, Y. and Hochberg, Y., Controlling the false discovery rate: A practical and powerful approach to multiple testing, J.R. Statist. Soc. B, 57(1): 289-300 (1995). cited by applicant . Blanco-Calvo, M. et al., Circulating microRNAs: molecular microsensors in gastrointestinal cancer, Sensors, 12(7): 9349-9362 (2012). cited by applicant . Cai, H. et al., Plasma microRNAs serve as novel potential biomarkers for early detection of gastric cancer, Medical Oncology, 30(1): 452 1-7 (2013). cited by applicant . Cissell, K.A. and Deo, S.K., Trends in microRNA detection, Anal Bioanal Chem, 394(4): 1109-1116 (2009). cited by applicant . Cortez, M.A. et al., MicroRNAs in body fluids--the mix of hormones and biomarkers, Nat Rev Clin Oncol, 8(8): 467-477 (2011). cited by applicant . Cui, M-H. et al., Upregulation of micro RNA 181 c expression in gastric cancer tissues and plasma. Asian Pacific journal of cancer prevention: Asian Pacific Journal of Cancer Prevention, 14(5): 3063-3066 (2013). cited by applicant . Etheridge, A. et al., Extracellular microRNA: a new source of biomarkers, Mutat Res, 717(1-2): 85-90 (2011). cited by applicant . Ferlay, J. et al., Estimates of worldwide burden of cancer in 2008: GLOBOCAN 2008, Int J Cancer, 127(12): 2893-2917 (2010). cited by applicant . Gao, M. et al., Clinical application of micro RNA in gastric cancer in Eastern Asian area, World J. Gastroenterol, 19(13): 2019-2027 (2013). cited by applicant . Gong, H. et al., Characterization of photosystem II in salt-stressed cyanobocterial Spirulina platensis cells, Biochimica et Biophysica Acta, 1777(6): 488-495 (2008). cited by applicant . Gorur, A. et al., Determination of plasma microRNA for early detection of gastric cancer, Mol Biol Rep, 40(3): 2091-2096 (2013). cited by applicant . Hindson, B.J. et al., High-throughput droplet digital PCR system for absolute quantitation of DNA copy number, Anal Chem, 83(22): 8604-8610 (2011). cited by applicant . International Search Report for PCT/SG2015/050256, 9 pages (dated Oct. 30, 2015). cited by applicant . Jemal, A. et al., Global cancer statistics, CA Cancer J Clin., 61(2): 69-90 (2011). cited by applicant . Kim, S.Y. et al., Validation of Circulating miRNA Biomarkers for Predicting Lymph Node Metastasis in Gastric Cancer, The Journal of Molecular Diagnosis, 15(5):661-669 (2013). cited by applicant . Li, B-s., et al., Plasma microRNAs, miR-223, miR-21 and miR-218, as Novel Potential Biomarkers for Gastric Cancer Detection, PloS ONE, 7(7): e41629 1-8 (2012). cited by applicant . Li, B. et al., Analysis of connection networks among miRNAs differentially expressed in early gastric cancer for disclosing some biological features of disease development, Gene, 548:159-165 (2014). cited by applicant . Li, C. et al., miRNA-199a-3p in plasma as a potential diagnostic biomarker for gastric cancer, Ann Surg Oncol, 20: S397-S405 (2013). cited by applicant . Li, C. et al., MiRNA-199a-3p: A potential circulating diagnostic biomarker for early gastric cancer, Journal of Surgical Oncology, 108(2): 89-92 (2013). cited by applicant . Li, Y. and Kowdley, K.V., Method for microRNA isolation from clinical serum samples, Anal Biochem, 431(1): 69-75 (2012). cited by applicant . Liang, H. et al., The origin, function, and diagnostic potential of extracellular microRNAs in human body fluids, Wiley Interdiscip Rev RNA, 5(2): 285-300 (2014). cited by applicant . Liu, H. et al., Genome-wide microRNA profiles identify miR-378 as a serum biomarker for early detection of gastric cancer, Cancer Lett, 316(2): 196-203 (2012). Accepted Manuscript, 38 pages (2011). cited by applicant . Liu, R. et al., A five-microRNA signature identified from genome-wide serum microRNA expression profiling serves as a fingerprint for gastric cancer diagnosis, European Journal of Cancer, 47(5):784-791 (2011). cited by applicant . Lo, S-S. et al., Overexpression of miR-370 and down regulation of its novel target TGF.beta.-RII contribute to the progression of gastric carcinoma, Oncogene, 31(2): 226-237 (2012). cited by applicant . Mabert, K. et al., Cancer biomarker discovery: current status and future perspectives, Int J Radlat Biol, Accepted Manuscript, 49 pages (2014). cited by applicant . Redova, M. et al., Circulating miRNAs as new blood-based biomarkers for solid cancers, Future Oncol, 9(3): 387-402 (2013). cited by applicant . Saeys, Y. et al., A review of feature selection techniques in bioinformatics, Bioinformatics, 23(19): 2507-2517 (2007). cited by applicant . Song, J. et al., Identification of Suitable Reference Genes for qPCR Analysis of Serum microRNA in Gastric Cancer Patients, Digestive Diseases and Sciences, 57:897-904 (2012). cited by applicant . Song, M-y. et al, Identification of serum microRNAs as novel non-invasive biomarkers for early detection of gastric cancer, PloS ONE, 7(3): e33608 1-9 (2012). cited by applicant . Tong, F. et al., MicroRNAs in gastric cancer: from bench top to bedside, Dig Dis Sci, 59(1): 24-30 (2014). cited by applicant . Tsongalis, G.J. et al., MicroRNA Analysis: Is It Ready for Prime Time? Clinical Chemistry, 59(2): 343-347 (2013). cited by applicant . Tsujiura, M. et al., Circulating microRNAs in plasma of patients with gastric cancers, British Journal of Cancer, 102(7): 1174-1179 (2010). cited by applicant . Ueda, T. et al., Relation between microRNA expression and progression and prognosis of gastric cancer: a microRNA expression analysis, Lancet Oncology, 11(2):136-146 (2010). cited by applicant . Uedo, N. et al., Screening and Treating Intermediate Lesions to Prevent Gastric Cancer, Gastroenterol Clin N Am., 42(2): 317-335 (2013). cited by applicant . Valladares-Ayerbes, M. et al., Circulating miR-200c as a diagnostic and prognostic biomarker for gastric cancer, Journal of Translational Medicine, 10:186 1-14 (2012). cited by applicant . Written Opinion for PCT/SG2015/050256, 10 pages (dated Oct. 30, 2015). cited by applicant . Wu, H-H. et al., Advances in molecular biomarkers for gastric cancer: miRNAs as emerging novel cancer markers, Expert Reviews in Molecular Medicine, 16: e1 1-18 (2014). cited by applicant . Xiong, M. et al., Biomarker identification by feature wrappers, Genome Res., 11(11): 1878-1887 (2001). cited by applicant . Zhang, W-H. et al., The Identification of miR-375 as a Potential Biomarker in Distal Gastric Adenocarcinoma, Oncology Research, 20(4): 139-147 (2012). cited by applicant . Zhang, X. et al., Combination of hsa-miR-375 and hsa-miR-142-5p as a predictor for recurrence risk in gastric cancer patients following surgical resection, Annals of Oncology, 22(10):2257-2266 (2011). cited by applicant . Zheng, G. et al., A two-microRNA signature as a potential biomarker for early gastric cancer, Oncology Letters, 7:679-684 (2014). cited by applicant . Liu, T. et al., MicroRNA-27a functions as an oncogene in gastric adenocarcinoma by targeting prohibitin, Cancer Lett, 273(2):233-242 (2009). cited by applicant. |
Primary Examiner: Vanni; G Steven
Attorney, Agent or Firm: Choate, Hall & Stewart LLP Reese; Brian E. Daukss; Dana M.
Claims
The invention claimed is:
1. A method of treating a gastric cancer, wherein the method comprises: a) detecting or diagnosing a gastric cancer in a subject or determining a likelihood of a subject having said gastric cancer, wherein detecting or diagnosing said gastric cancer in the subject or determining the likelihood of the subject having said gastric cancer comprises: i) determining, in a non-cellular biofluid sample obtained from the subject, the expression level of at least six microRNAs (miRNAs) each having at least 90% sequence identity with an miRNA selected from the group consisting of hsa-miR-21-5p, hsa-miR-103a-3p, hsa-miR-20a-5p, hsa-miR-181a-5p, hsa-miR-142-5p, hsa-miR-27a-5p, hsa-miR-26a-5p, hsa-miR-17-5p, hsa-miR-616-5p, hsa-miR-30a-5p, hsa-miR-532-5p and hsa-miR-30e-5p, ii) determining differential expression of miRNA in the sample, as compared to a control in order to determine the subject to have said gastric cancer or diagnose the subject as having said gastric cancer or determine the likelihood of the subject to develop said gastric cancer, wherein the differential expression of miRNA is an upregulation or a downregulation of miRNA expression of the at least six miRNAs and b) treating the subject determined to have or diagnosed with said gastric cancer or having the likelihood of developing said gastric cancer with an anti-gastric cancer compound or a combination of anti-gastric cancer compounds.
2. The method according to claim 1, wherein the control is a sample obtained from a gastric cancer free subject.
3. The method according to claim 1, wherein the at least six miRNAs comprise hsa-miR-21-5p, hsa-miR-103a-3p, hsa-miR-20a-5p, hsa-miR-181a-5p, hsa-miR-142-5p, hsa-miR-27a-5p, hsa-miR-26a-5p, hsa-miR-17-5p, hsa-miR-616-5p, hsa-miR-30a-5p, hsa-miR-532-5p and hsa-miR-30e-5p.
4. The method according to claim 1, wherein the at least six miRNAs are identical to miRNAs selected from the group consisting of hsa-miR-21-5p, hsa-miR-103a-3p, hsa-miR-20a-5p, hsa-miR-181a-5p, hsa-miR-142-5p, hsa-miR-27a-5p, hsa-miR-26a-5p, hsa-miR-17-5p, hsa-miR-616-5p, hsa-miR-30a-5p, hsa-miR-532-5p and hsa-miR-30e-5p.
Description
CROSS-REFERENCE TO RELATED APPLICATIONS
This patent application is a National Stage Entry of International Patent Application No. PCT/SG2015/050256, filed on Aug. 11, 2015 which claims the benefit of priority of Singapore patent application No. 10201404742W, filed 7 Aug. 2014, the contents of each of which are hereby incorporated by reference in their entirety for all purposes herein.
FIELD OF THE INVENTION
The present invention relates to biochemistry in particular biomarkers. In particular, the present invention relates to biomarkers associated with cancer and methods of using the biomarkers to determine the likelihood that a patient suffers from cancer, such as gastric cancer.
BACKGROUND OF THE INVENTION
Gastric cancer is the 4th most common cancer (>1 million cases per year) and the 2nd most common cause of cancer deaths worldwide. Prognosis of gastric cancer is poor, with a less than 10% 5-year survival rate, largely because the condition is usually presented at an advanced state of the disease. Hence, to improve the clinical outcomes, early detection and accurate monitoring of the disease is necessary. Currently, endoscopy is the only reliable method for early diagnosis but it is limited as a screening test due to the high cost and risk. A less invasive screening test for gastric cancer is highly desirable and should reduce unnecessary endoscopy.
Thus, the present invention provides an alternative method of detecting gastric cancer.
SUMMARY OF THE INVENTION
In one aspect, there is provided a method of detecting or diagnosing gastric cancer in a subject or determining the likelihood of a subject developing gastric cancer, the method comprising: determining an expression level of at least one miRNA having at least 90% sequence identity with an miRNA in a non-cellular biofluid sample obtained from the subject, wherein differential expression of the miRNA expression, as compared to a control, is indicative of the subject having gastric cancer, and wherein the miRNA is either an "up-regulated" miRNA selected from the group consisting of hsa-miR-142-5p, hsa-miR-29c-3p, hsa-miR-93-5p, hsa-miR-140-5p, hsa-miR-148a-3p, hsa-miR-183-5p, hsa-miR-29b-3p, hsa-miR-424-5p, hsa-miR-101-3p, hsa-miR-106b-3p, hsa-miR-128, hsa-miR-1280, hsa-miR-140-3p, hsa-miR-15b-3p, hsa-miR-186-5p, hsa-miR-18b-5p, hsa-miR-197-3p, hsa-miR-19a-3p, hsa-miR-19b-3p, hsa-miR-20b-5p, hsa-miR-21-3p, hsa-miR-23a-5p, hsa-miR-25-3p, hsa-miR-27a-5p, hsa-miR-29a-3p, hsa-miR-29b-2-5p, hsa-miR-29c-5p, hsa-miR-338-5p, hsa-miR-425-3p, hsa-miR-4306, hsa-miR-450a-5p, hsa-miR-486-5p, hsa-miR-500a-3p, hsa-miR-501-5p, hsa-miR-532-3p, hsa-miR-550a-5p, hsa-miR-579, hsa-miR-589-5p, hsa-miR-590-5p, hsa-miR-598, hsa-miR-616-5p, hsa-miR-627, hsa-miR-629-3p, hsa-miR-629-5p, hsa-miR-93-3p, hsa-miR-195-5p, hsa-miR-18a-3p, hsa-miR-363-3p, hsa-miR-181a-2-3p, hsa-miR-16-5p, hsa-miR-501-3p, hsa-miR-23a-3p, hsa-miR-339-3p, hsa-miR-15a-5p, hsa-miR-320b, hsa-miR-374b-5p, hsa-miR-650, hsa-miR-1290, hsa-miR-22-3p, hsa-miR-320c, hsa-miR-130a-3p, hsa-miR-320e, hsa-miR-378a-3p, hsa-miR-9-5p, hsa-miR-200b-3p, hsa-miR-141-3p, hsa-miR-191-5p, hsa-miR-628-5p, hsa-miR-484, hsa-miR-425-5p; or a "down-regulated" miRNA selected from the group consisting of hsa-miR-103a-3p, hsa-miR-30a-5p, hsa-miR-181a-5p, hsa-miR-107, hsa-miR-26a-5p, hsa-miR-126-3p, hsa-miR-99b-5p, hsa-miR-339-5p, hsa-miR-122-5p, hsa-miR-136-5p, hsa-miR-139-5p, hsa-miR-146a-5p, hsa-miR-154-5p, hsa-miR-193b-3p, hsa-miR-23c, hsa-miR-30b-5p, hsa-miR-337-5p, hsa-miR-382-5p, hsa-miR-409-3p, hsa-miR-411-5p, hsa-miR-485-3p, hsa-miR-487b, hsa-miR-495, hsa-miR-885-5p, hsa-miR-99a-5p, hsa-miR-362-5p, hsa-miR-671-3p, hsa-miR-454-3p, hsa-miR-328, hsa-miR-320a, hsa-miR-126-5p, hsa-miR-27a-3p, hsa-miR-30d-5p, hsa-miR-10a-5p, hsa-miR-10b-5p, hsa-miR-497-5p, hsa-miR-134, and hsa-miR-150-5p.
In another aspect, there is provided a method of detecting or diagnosing gastric cancer stage in a subject or determining the likelihood of a subject having a stage of a gastric cancer, the method comprising: determining the expression level of at least one microRNA (miRNA) having at least 90% sequence identity with an miRNA as listed in at least one of the tables selected from the group consisting of Table 8, Table 15, Table 16, and Table 17, in a non-cellular biofluid sample obtained from the subject; and wherein differential expression of miRNA expression in the sample, as compared to a control, diagnoses the subject to have any one of stage 1, stage 2, stage 3 or stage 4 gastric cancer.
In yet another aspect, there is provided a method of detecting or diagnosing gastric cancer in a subject, comprising the steps of: (a) measuring an expression level of at least one miRNA in a non-cellular biofluid sample, wherein the miRNA has at least 90% sequence identity with an miRNA selected from the group consisting of hsa-miR-103a-3p, hsa-miR-142-5p, hsa-miR-29c-3p, hsa-miR-30a-5p, hsa-miR-107, hsa-miR-26a-5p, hsa-miR-140-5p, hsa-miR-148a-3p, hsa-miR-29b-3p, hsa-miR-126-3p, hsa-miR-181a-5p, hsa-miR-27a-5p, hsa-miR-616-5p, hsa-miR-484, hsa-miR-4306, hsa-miR-590-5p, hsa-miR-362-5p, hsa-miR-106b-3p, hsa-miR-497-5p, hsa-miR-18b-5p, hsa-miR-122-5p, hsa-miR-200b-3p, hsa-miR-197-3p, hsa-miR-486-5p, hsa-miR-99a-5p, hsa-miR-885-5p, hsa-miR-598, hsa-miR-454-3p, hsa-miR-130a-3p, hsa-miR-150-5p, hsa-miR-30d-5p, hsa-miR-10b-5p, hsa-miR-532-3p, hsa-miR-23a-5p, hsa-miR-21-3p, hsa-miR-136-5p, hsa-miR-1280, and hsa-miR-16-5p; (b) generating a score based on the expression level of the miRNAs measured in step (a); and (c) using the score to predict the likelihood of the subject having gastric cancer, wherein the score is calculated by a classification algorithm that compares the expression level of the subject with that of a positive control (sample from gastric cancer subject) or a negative control (sample from gastric cancer free subject), and wherein the score identifies the likelihood of the subject to either: i. have gastric cancer, which score would fall within the score of the positive control, or ii. have no gastric cancer (gastric cancer free), which score would fall within the score of the negative control.
BRIEF DESCRIPTION OF THE DRAWINGS
The invention will be better understood with reference to the detailed description when considered in conjunction with the non-limiting examples and the accompanying drawings, in which:
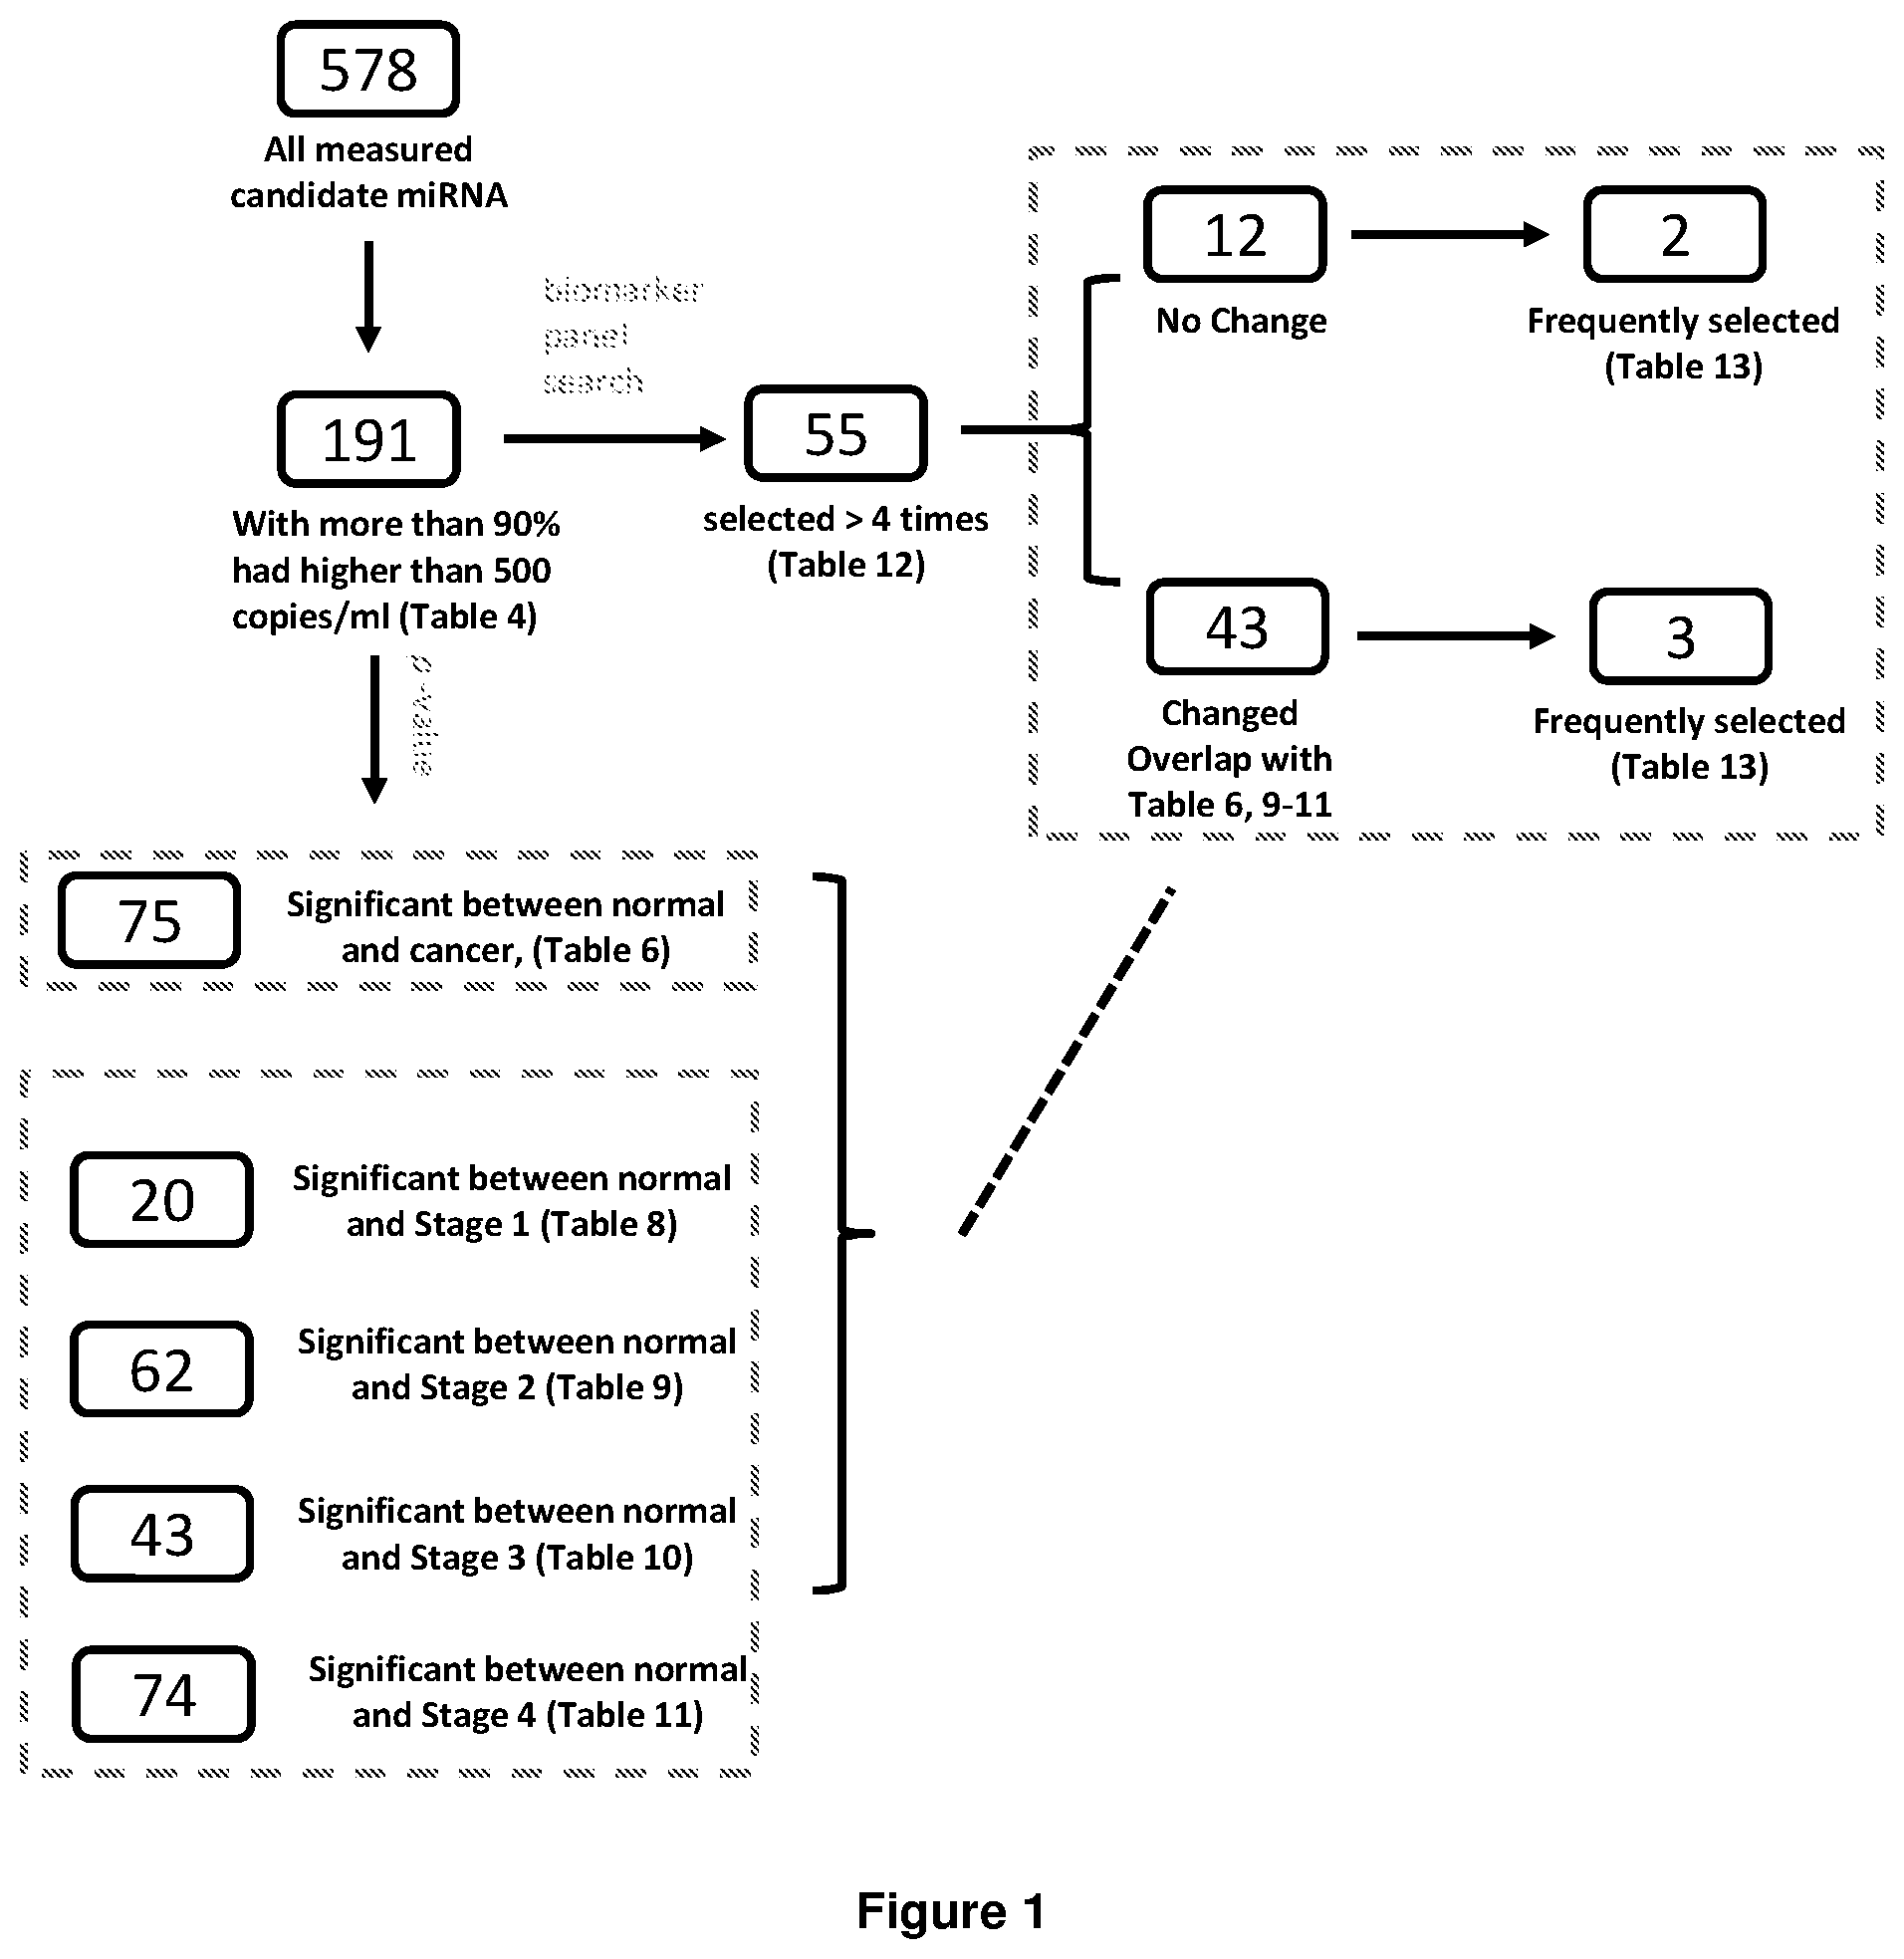
FIG. 1 shows a schematic diagram of the division of miRNAs detected in patients with gastric cancer.
FIG. 2 shows an example of a workflow diagram of the high-throughput miRNA RT-qPCT measurement of miRNA detected in clinical samples. FIG. 2 shows the steps occurred in the process from isolation of total miRNA from clinical sample to eventual data processing and statistical analysis. As illustrated in FIG. 2, clinical samples are first subjected to the step of "isolation", which refers to the isolation and purification of miRNA from samples, such as serum of a patient. Next, samples are added with spike-in miRNA, which are non-natural synthetic miRNAs mimics (i.e. small single-stranded RNA with length range from 22 to 24 bases). These spike-in miRNA are added into samples to monitor the efficiencies at various steps including isolation, reverse transcription, augmentation and qPCR. Next, miRNA are divided to a number of multiple groups. This step is referred to as "multiplex design", where miRNA assays were deliberately divided into a number of multiplex groups (45 to 65 miRNA per group) in silico to minimize non-specific amplifications and primer-primer interaction during the RT and augmentation processes. Next, samples go through "multiplex reverse transcription" process where various pools of reverse transcription primers were combined and added to different multiplex groups to generate cDNA. Upon generation of cDNA, a pool of PCR primers are combined with each of the cDNA pool generated (from a certain multiplex croup) and an optimized touch down PCR is carried out to enhance the amount of total cDNAs in the group simultaneously. This step of enhancement of the amount of total (all) cDNAs is referred to as "augmentation" step. After augmentation and before data processing and statistical analysis, the augmented cDNA undergoes a single-plex qPCR, which refers to the step where the augmented cDNA pools are distributed in to various wells in the 384 plates and single-plex qPCR reactions are then carried out. At the same time as measurements of miRNA in clinical samples, synthetic miRNA standard curves are measured together to obtain interpolation of absolute copy numbers in all the measurements. Thus, FIG. 2 provides a detailed step by step workflow of miRNA sample processing that occurred in the Experimental section below.
FIG. 3 shows a heat-map of miRNAs consistently detected in samples obtained from subjects. FIG. 3 shows a heat-map representation of all reliably detected miRNAs (as listed in Table 4); the expression levels (copy/ml) of miRNAs were presented in log 2 scale and standardized to zero mean. The color of the points represented the concentrations. Hierarchical clustering was carried out for both dimensions (the miRNAs and the samples) based on the Euclidean distance. For the horizon dimension: black represents gastric cancer subjects and white represents normal/control subjects.
FIG. 4 shows a heat-map of regulated miRNAs. In particular, the heat-map as presented in FIG. 4 represents all of the regulated miRNAs, which are listed in Table 6, in gastric cancer. The expression levels (copy/ml) of miRNAs were presented in log 2 scale and standardized to zero mean. The gray-scale represented the concentrations of miRNA. Hierarchical clustering was carried out for both dimensions (the miRNAs and the samples) based on the Euclidean distance. For the horizon dimensions: black represents gastric cancer subjects and white represents normal/control subjects.
FIG. 5 shows boxplot diagrams representing the expression level of topped ranked up-regulated (hsa-miR-142-5p) and down-regulated miRNAs (hsa-miR-99b-5p) in all gastric cancer subjects (regardless of subtypes and stages) compared to normal/control subjects. Expression levels (copy/ml) are presented in log 2 scale. The boxplot presented miRNA expression levels in subjects that falls in the 25.sup.th, 50.sup.th, and 75.sup.th percentiles in the distribution of expression levels. AUC refers to area under the receiver operating characteristic curve.
FIG. 6 shows a dot plot showing the results of a correlation analysis between all reliably detected miRNAs. Based on the log 2 scale expression levels (copy/mL), the Pearson's linear correlation efficiencies were calculated between all 191 reliable detected miRNA targets, which are listed in Table 4. Each dot represents a pair of miRNAs where the correlation efficiency is higher than 0.5 (left graph, positively correlated) or low than -0.5 (right graph, negatively correlated) and where the p-value for having a correlation different from zero is lower than 0.01.
FIG. 7 shows a dot plot showing the results of a correlation analysis gastric cancer biomarkers. Based on the log 2 scale expression levels (copy/mL), the Pearson's linear correlation efficiencies were calculated between all 75 miRNAs altered in gastric cancer subjects, which are listed in Table 6. Each dot represents a pair of miRNAs where the correlation efficiency is higher than 0.5 (left figure, positively correlated) or low than -0.5 (right figure, negatively correlated) and the p-value with a correlation different from zero is lower than 0.01. Thus, taken together, FIG. 6 and FIG. 7 show large numbers of cancer related and non-related miRNAs are found to be positively correlated, which makes the choice of the best miRNA combinations for gastric cancer diagnosis challenging.
FIG. 8 shows graphs plotting the sensitivity and specificity of various top rated miRNAs in the various stages of gastric cancer as compared to normal/control. More specifically, FIG. 8 shows the receiver operating characteristic curves of top (based on AUC, which is the area under the receiver operating characteristic curve) up-regulated (row 1) and down-regulated (row 2) miRNAs in the various stages of gastric cancer subjects as compared to miRNAs in normal/control subjects.
FIG. 9 shows Venn diagrams illustrating the overlaps between the biomarkers for various stages of gastric cancers. These Venn diagrams are generated based on Tables 8, 9, 10 and 11. Thus, FIG. 9 shows that the miRNAs used for determining the various stages of gastric cancer appear to be specific for the stages they are correlated to, with the exception of large overlap observed in both Stage 3 and Stage 4, which is expected as these two stages are clinically closely related.
FIG. 10 shows boxplots of diagnostic power (AUC) of multivariant biomarker panels (number of miRNAs is 3 to 10) in the discovery and validation phases during the four fold cross validation in silico. The biomarker panels with 3 to 10 miRNAs were identified with the sequence forward floating search using linear support vector machine as the model based on the discovery set of samples and validated in another independent set of samples. Multiple times of four fold cross validation were carried out. The boxplot presented the 25th, 50th, and 75th percentiles of miRNA sets in the AUC for the classification of normal/control and gastric cancer subjects. FIG. 10 shows the robustness of the data obtained from the various multivariant biomarker panels.
FIG. 11 shows a bar graph showing the means of AUC of various multivariant biomarker panels in the discovery set (black bars) and validations set (gray bars) during the cross validation processes. The error bar represented the standard deviation of the AUC. In order to test the significance of the AUC improvement in the validation set when more miRNAs were included in the panel, the right-tailed t-test was carried to compare all the adjacent gray bars. *: p-value<0.05; **: p-value<0.01; ***: p-value<0.001. Thus, FIG. 11 shows the differences in the AUC between the various numbers of miRNAs in a multivariant biomarker panel set.
FIG. 12 shows a schematic diagram summarizing the steps of the method as described herein when used to determine the likelihood of a subject having gastric cancer.
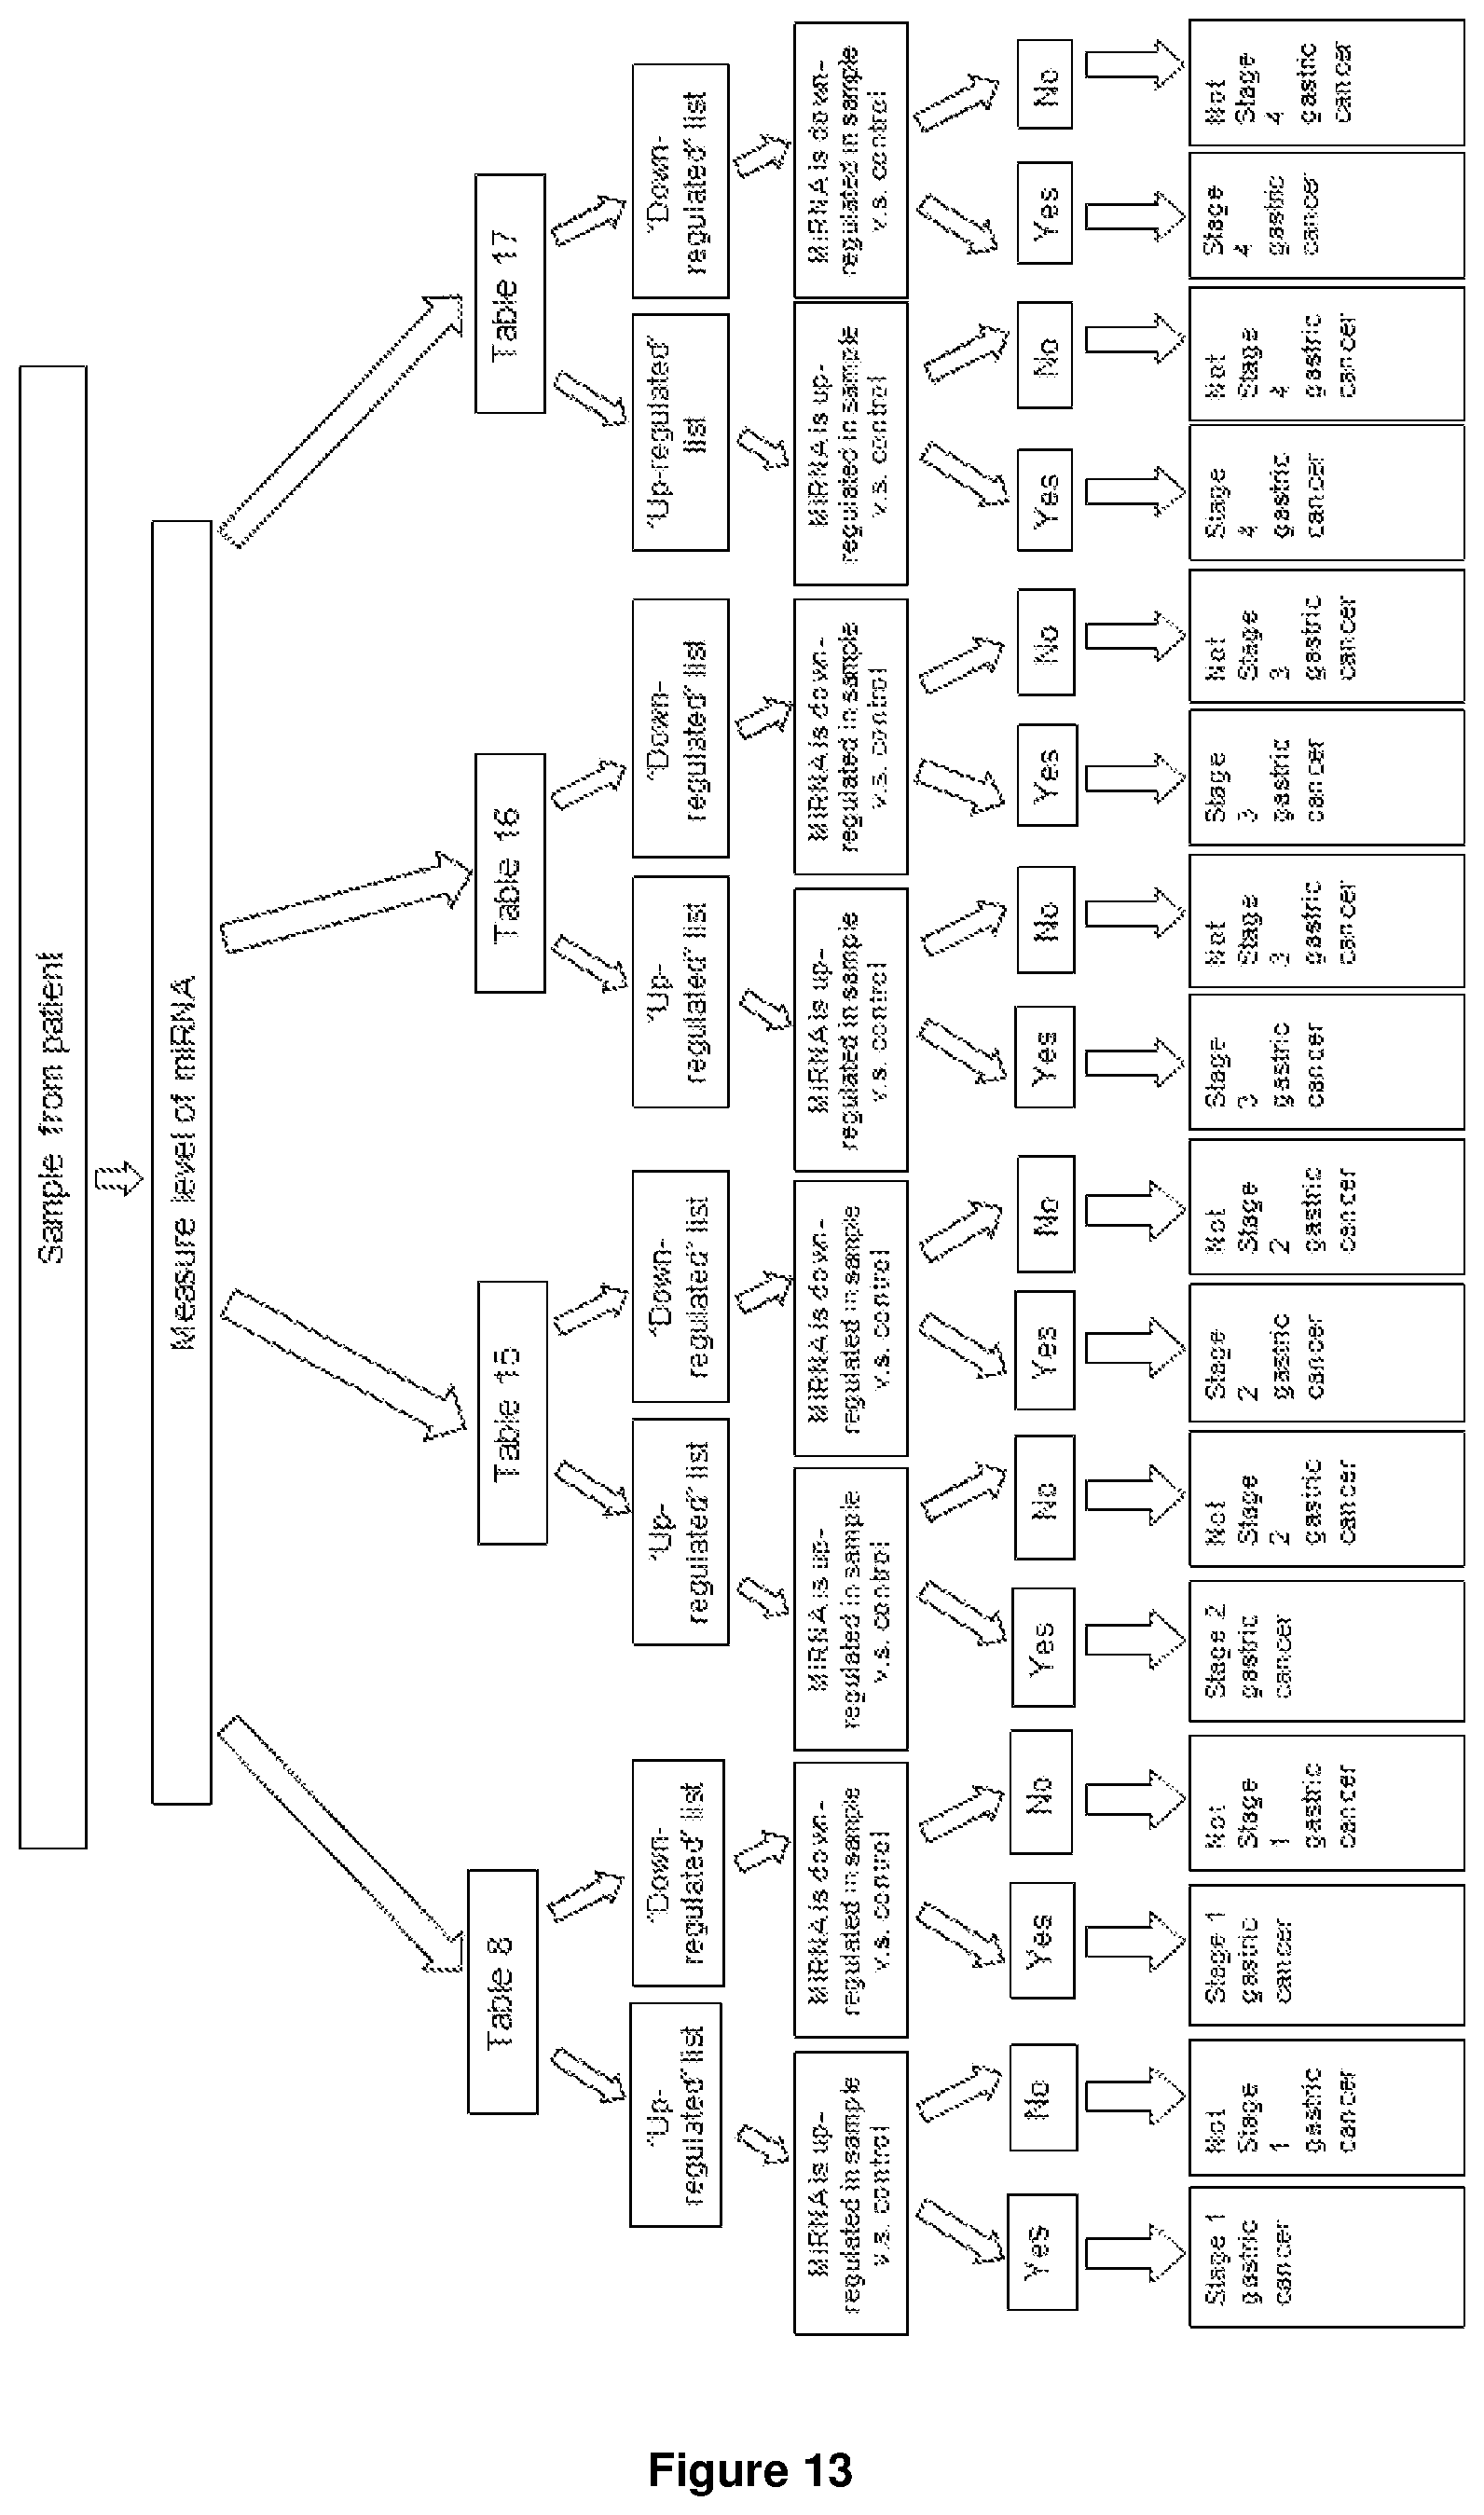
FIG. 13 shows a schematic diagram summarizing the steps of the method as described herein when used to determine the likelihood of a subject having one of the stages of gastric cancer.
FIG. 14 shows a schematic diagram summarizing the steps of the multivariant method as described herein in determining the likelihood of a subject having gastric cancer.
FIG. 15 shows (A) the boxplot representation of cancer risk scores for the control and gastric cancer subjects in this study; (B) the probability distributions of the cancer risk score fitted with logistic distribution for the control and gastric cancer subjects in this study, (C) the probability of an unknown subject (belonging to the high risk population) having gastric cancer depends on the value of cancer risk score (the prevalence of gastric cancer in high risk population was 0.0067 based on the data from National University Hospital); (D) fold increase of the probability (risk) of an unknown subject having gastric cancer at various cancer risk score levels compared to the prevalence of gastric cancer in high risk population. The dashed lines define the threshold scores that separate the subjects into high cancer risk (H), medium cancer risk (M) or low cancer risk (L) groups.
BRIEF DESCRIPTION OF THE TABLES
The invention will be better understood with reference to the detailed description when considered in conjunction with the non-limiting examples and the accompanying tables, in which:
Table 1 shows a summary of serum/plasma microRNA biomarker studies for gastric cancer. Table 1 summarizes various studies that measure the level of miRNAs in cell-free serum/plasma samples. Only results validated with RT-qPCR are listed in this table. "GC" refers to gastric cancer subjects and "C" refers to control subjects.
Table 2 shows the clinical information of gastric cancer subjects analyzed in the Experiment section of the present disclosure. All serums were collected from 236 gastric cancer subjects before any treatment and stored at -80.degree. C. prior to use. The status of H. pylori infection is also indicated in column labelled "H pylori", which refers to Helicobacter pylori.
Table 3 shows the clinical information of normal subjects (control). All normal/control subject s (237 subjects) were confirmed gastric cancer free by endoscopy at the time the samples were collected. Subjects were followed up for 3-5 years with endoscopy screening every 2 years to ensure the subjects did not develop gastric cancer within this period of time. All serums were stored at -80.degree. C. prior to use. The status of H. pylori infection is also indicated in column labelled "H pylori", which refers to Helicobacter pylori.
Table 4 shows the sequences of 191 miRNA reliably detected in the serum samples of both gastric cancer subjects and normal subjects (control). An miRNA is considered "reliably detected" when at least 90% of the serum samples had a concentration higher than 500 copies per ml. The miRNAs were named according to the miRBase V18 release.
Table 5 shows a summary of the characteristics of both gastric cancer subjects and healthy control (normal subjects/control).
Table 6 lists miRNAs that are differentially expressed in normal subject (control) and gastric cancer subjects. For the comparison between normal/control and all gastric cancer subjects (regardless of subtypes and stages), 75 miRNA had p-value lower than 0.01 after false discovery rate correction (Bonferroni method). AUC--area under the receiver operating characteristic curve; fold change--the mean expression level (copy/ml) of miRNA in the cancer population divided by that in the normal/control population.
Table 7 shows the comparison between the current study and other literature reports. MiRNAs not listed in Table 4 (i.e. miRNAs with expression level of .gtoreq.500 copies/ml) were considered to be below detection limit of the study (N.D.). Thus, Table 7 shows the majority of the purported differentially regulated miRNA in the art are different from the exemplary miRNA of the present disclosure.
Table 8 lists miRNAs that are differentially expressed between normal subjects (control) and stage 1 gastric cancer subjects. For the comparison between normal/control and stage 1 gastric cancer subjects, 20 miRNA had p-value lower than 0.01 after false discovery rate correction (Bonferroni method). AUC--area under the receiver operating characteristic curve; fold change--the mean expression level (copy/ml) of miRNA in the cancer population divided by that in the normal/control population.
Table 9 lists miRNAs that are differentially expressed between normal subjects (control) and stage 2 gastric cancer subjects. For the comparison between normal/control and stage 2 gastric cancer subjects, 62 miRNA had p-value lower than 0.01 after false discovery rate correction (Bonferroni method). AUC--area under the receiver operating characteristic curve; fold change--the mean expression level (copy/ml) of miRNA in the cancer population divided by that in the normal/control population.
Table 10 lists miRNAs that are differentially expressed between normal subjects (control) and stage 3 gastric cancer subjects. For the comparison between normal/control and stage 3 gastric cancer subjects, 43 miRNA had p-value lower than 0.01 after false discovery rate correction (Bonferroni method). AUC--area under the receiver operating characteristic curve; fold change--the mean expression level (copy/ml) of miRNA in the cancer population divided by that in the normal/control population.
Table 11 lists miRNAs that are differentially expressed between normal subjects (control) and stage 4 gastric cancer subjects. For the comparison between normal/control and stage 4 gastric cancer subjects, 74 miRNA had p-value lower than 0.01 after false discovery rate correction (Bonferroni method). AUC--area under the receiver-operating characteristic curve; fold change--the mean expression level (copy/ml) of miRNA in the cancer population divided by that in the normal/control population.
Table 12 lists miRNAs that are identified in the multivariant biomarker panel identification process. The identities of the miRNAs selected for the assembly of biomarker panels with 6, 7, 8, 9, and 10 miRNA were summarized. Prevalence was defined by the counts of the miRNA in all panels divided by the total number of panels. The panels with the top 10% and bottom 10% AUC were excluded to avoid counting of falsely discovered biomarkers due to fitting of inaccurate data from subpopulations generated by the randomization process in cross-validation analysis. Only the miRNAs with 4 or more counts among were listed. The changes of the miRNAs in various stages of gastric cancers were defined based on Table 6, 8-11.
Table 13 shows the statistics of the occurrence of miRNAs frequently selected in the multivariant biomarker panel selection process. The percentage of miRNA panels using different numbers of miRNAs from the two miRNAs groups: hsa-21-5p, hsa-103a-3p and hsa-20a-5p group, and the hsa-532-5p and hsa-30e-5p group. The top 10% and bottom 10% of the 6, 7, 8, 9, 10 miRNA biomarker panels defined by the AUC in the validation set (FIG. 10) were excluded for counting.
Table 14 lists miRNAs that are differentially expressed between normal/control and gastric cancer (regardless of stages), which were not previously reported in the art (which are listed in Table 1).
Table 15 lists miRNAs that are differentially expressed between normal/control and stage 2 gastric cancer, which were not previously reported in the art.
Table 16 lists miRNAs that are differentially expressed between normal/control and stage 3 gastric cancer, which were not previously reported in the art.
Table 17 lists miRNAs that are differentially expressed between normal/control and stage 4 gastric cancer, which were not previously reported in the art.
Table 18 lists miRNAs that are differentially expressed between normal/control and either stage 1, stage 2, stage 3, stage 4 or all stages of gastric cancer, which were not previously reported in the art. Table 18 is a combination of Table 14, Table 8, Table 15, Table 16 and Table 17.
Table 19 lists miRNAs frequently selected for use in multivariant biomarker panel where the expression levels of the miRNAs were altered in the gastric cancer subjects (i.e. significant group from Table 12), which were not previously reported in the art.
Table 20 lists miRNAs frequently selected for use in multivariant biomarker panel where the expression levels of the miRNAs were not altered in the gastric cancer subjects (i.e. insignificant group from Table 12), which were not previously reported in the art.
Table 21 lists 12 miRNAs (with their K.sub.i coefficient values) frequently selected in the multivariant biomarker panel identification process with prevalence >20% which are combined to calculate the cancer risk score (Formula 1) in FIG. 15.
DETAILED DESCRIPTION OF THE PRESENT INVENTION
MicroRNAs (miRNAs) are small noncoding RNAs that are known to play a role in gene-expression regulation and aberrant expression is implicated in the pathogenesis of a variety of cancers, including gastric cancer. It is known that microRNA can be used to determine the likelihood of a subject developing a cancer.
Thus, in one aspect, there is provided a method for determining the likelihood of a subject developing or having gastric cancer. In one example, FIG. 12 summarizes the steps of the method for determining the likelihood of a subject developing or having gastric cancer. In one example, the method may also be for detecting or diagnosing gastric cancer in a subject. In one example, the method is an in vitro method. In one example, the method as described herein may comprise measuring or determining the expression level of at least one microRNA (miRNA) having at least 90% sequence identity with an miRNA listed in Table 18 in a non-cellular biofluid sample obtained from the subject, wherein differential expression of miRNA expression, as compared to a control, is indicative of the subject having gastric cancer and wherein the miRNA is either an miRNA listed as "up-regulated" in Table 18 or an miRNA listed as "down-regulated" in Table 18.
Table 18 lists miRNA which may be used to determine the likelihood of a patient developing or having gastric cancer and is as follows:
TABLE-US-00001 Up-regulated Down-regulated hsa-miR-101-3p hsa-miR-107 hsa-miR-106b-3p hsa-miR-122-5p hsa-miR-128 hsa-miR-126-3p hsa-miR-1280 hsa-miR-136-5p hsa-miR-140-3p hsa-miR-139-5p hsa-miR-140-5p hsa-miR-146a-5p hsa-miR-142-5p hsa-miR-154-5p hsa-miR-148a-3p hsa-miR-181a-5p hsa-miR-15b-3p hsa-miR-193b-3p hsa-miR-183-5p hsa-miR-23c hsa-miR-186-5p hsa-miR-26a-5p hsa-miR-18b-5p hsa-miR-30a-5p hsa-miR-197-3p hsa-miR-30b-5p hsa-miR-19a-3p hsa-miR-337-5p hsa-miR-19b-3p hsa-miR-339-5p hsa-miR-20b-5p hsa-miR-382-5p hsa-miR-21-3p hsa-miR-409-3p hsa-miR-23a-5p hsa-miR-411-5p hsa-miR-25-3p hsa-miR-485-3p hsa-miR-27a-5p hsa-miR-487b hsa-miR-29a-3p hsa-miR-495 hsa-miR-29b-2-5p hsa-miR-885-5p hsa-miR-29b-3p hsa-miR-99a-5p hsa-miR-29c-3p hsa-miR-103a-3p hsa-miR-29c-5p hsa-miR-362-5p hsa-miR-338-5p hsa-miR-671-3p hsa-miR-424-5p hsa-miR-454-3p hsa-miR-425-3p hsa-miR-328 hsa-miR-4306 hsa-miR-320a hsa-miR-450a-5p hsa-miR-99b-5p hsa-miR-486-5p hsa-miR-126-5p hsa-miR-500a-3p hsa-miR-27a-3p hsa-miR-501-5p hsa-miR-30d-5p hsa-miR-532-3p hsa-miR-10a-5p hsa-miR-550a-5p hsa-miR-10b-5p hsa-miR-579 hsa-miR-497-5p hsa-miR-589-5p hsa-miR-134 hsa-miR-590-5p hsa-miR-150-5p hsa-miR-598 hsa-miR-616-5p hsa-miR-627 hsa-miR-629-3p hsa-miR-629-5p hsa-miR-93-3p hsa-miR-93-5p hsa-miR-195-5p hsa-miR-18a-3p hsa-miR-363-3p hsa-miR-181a-2-3p hsa-miR-16-5p hsa-miR-501-3p hsa-miR-23a-3p hsa-miR-339-3p hsa-miR-15a-5p hsa-miR-320b hsa-miR-374b-5p hsa-miR-650 hsa-miR-1290 hsa-miR-22-3p hsa-miR-320c hsa-miR-130a-3p hsa-miR-320e hsa-miR-378a-3p hsa-miR-9-5p hsa-miR-200b-3p hsa-miR-141-3p hsa-miR-191-5p hsa-miR-628-5p hsa-miR-484 hsa-miR-425-5p
As used herein, the term "miRNA" or "microRNA" or "miR" refers to an RNA (or RNA analog) comprising the product of an endogenous, non-coding gene whose precursor RNA transcripts can form small stem-loops from which mature "miRNAs" are cleaved by the endonuclease Dicer. MiRNAs are encoded in genes distinct from the mRNAs whose expression they control. In one example, the term "miRNA" or "microRNA" refers to single-stranded RNA molecules of at least 10 nucleotides and of not more than 35 nucleotides covalently linked together. In one example, the polynucleotides are molecules of 10 to 33 nucleotides or of 15 to 30 nucleotides in length, or of 17 to 27 nucleotides or of 18 to 26 nucleotides in length, i.e. 10, 11, 12, 13, 14, 15, 16, 17, 18, 19, 20, 21, 22, 23, 24, 25, 26, 27, 28, 29, 30, 31, 32, 33, 34, or 35 nucleotides in length, not including optionally labels and/or elongated sequences (e.g. biotin stretches). The sequences of the miRNAs as described herein are provided in Table 4 provided herein, which includes miRNA sequences SEQ ID NO: 1 to SEQ ID NO: 191. As would be appreciated by the skilled person in the art, miRNA is a type of polynucleotide that has sequences comprising letters such as "ATGC". It will be understood that the nucleotides are in 5'.fwdarw.3' order from left to right and that "A" denotes deoxyadenoside, "C" denotes deoxycytidine, "G" denotes doxyguanoside, and "T" denotes deoxythymidine, unless otherwise noted. The letters A, C, G, and T can be used to refer to the bases themselves, to the nucleosides, or to nucleotides comprising the bases, as is standard in the art. This term includes oligonucleotides composed of naturally occurring nucleobases, sugars, and internucleotides (backbone) linkages as well as oligonucleotides having non-naturally-occurring portions which function similarly or with specific improved functions. In naturally occurring polynucleotides, the inter-nucleoside linkage is typically a phosphodiester bond, and the subunits are referred to as "nucleotides". The term "oligonucleotide" may also include fully or partly modified or substituted oligonucleotides, such as in the bases and/or sugars.
As would be appreciated in the art of the present disclosure, in any of the methods as described herein, the miRNAs may not have 100% sequence identity with the sequences of miRNAs as listed in Table 4. Thus, in one example, the measured miRNA may have at least 75%, or at least 80%, or at least 85%, or at least 90%, or at least 95%, or at least 97.5%, or at least 98%, or at least 99%, or at least 99.9% sequence identity to the miRNAs as listed in any one of Table 8, Table 15, Table 16, Table 17, Table 18, Table 19 or Table 20 (with reference to Table 4). In one example, the measured miRNAs may have one, two, three or four nucleotide substitutions. Thus, the miRNAs as used in the methods as described herein may be detected using reagents that may be able to hybridize or bind specifically to the sequences as listed in Table 8, Table 15, Table 16, Table 17, Table 18, Table 19 or Table 20 (with reference to sequences provided in Table 4). As used herein, the terms "hybridizing to" and "hybridization" are interchangeable used with the terms "specific for" and "specifically binding" and refer to the sequence specific non-covalent binding interactions with a complementary nucleic acid, for example, interactions between a target nucleic acid sequence and a target specific nucleic acid primer or probe. In one example, a nucleic acid probe, which hybridizes is one which hybridizes with a selectivity of greater than 70%, greater than 80%, greater than 90% or of 100% (i.e. cross hybridization with one of the miRNAs as described herein may occur at less than 30%, less than 20%, less than 10%). As would be understood to a person skilled in the art, a nucleic acid probe, which "hybridizes" to the miRNA as described herein may be determined taking into account the length and composition. In one example, the nucleic acid probes, which hybridize with the any of the miRNAs as described herein may have one, or two, or three mismatched base pairing. In one example, the term "miRNA" as described herein may include miRNAs, which during production, the 3'-end and/or 5' end of the miRNA may be modified and/or digested. In one example, miRNA that has been modified and/or digested at the 3'-end and/or 5' end during production is picked up by the assay of the present invention. In one example, the miRNA as disclosed herein may include miRNAs which may differ from the sequences as listed in Table 4 by 3, or 4, or 5 nucleotides.
As used herein, the term "cancer" refers to the presence of cells possessing characteristics typical of cancer-causing cells, such as uncontrolled proliferation, immortality, metastatic potential, rapid growth and proliferation rate, and certain characteristic morphological features known in the art. In one example, the "cancer" may be gastric cancer or stomach cancer. In one example, the "cancer" may include pre-malignant as well as malignant cancers. Thus, the term "gastric cancer" covers all stages of gastric cancer as described by the National Cancer Institute of the National Health.
In one example, as would be appreciated by a person skilled in the art, the methods as described herein do not involve the step performed by a doctor/physician. Thus, the results as obtained from the methods as described herein would need to be combined with clinical data and other clinical presentations before a final diagnosis performed by a physician can be provided to the subject. The final diagnosis on whether a subject has gastric cancer is the scope of a physician and is not considered to be part of the present disclosure. Accordingly, as used herein, the term "determining", "detecting" and "diagnosing" refers to the identification of the chances or likelihood of a subject having disease (such as gastric cancer) at any stage of its development, or the determination of predisposition of a subject to develop the disease. In one example, "diagnosis", "determination", "detecting" occurs prior to the manifestation of symptoms. In one example, "diagnosis", "determination", "detecting", allows a clinician/physician (in conjunction with other clinical presentations), confirmation of gastric cancer in a subject suspected of having gastric cancer.
As used herein, the term "differential expression" refers to a difference in the level of expression of one or more miRNAs, as measured by the amount of miRNA, in one sample as compared with the level of expression of the same one or more miRNA in a second sample or with regard to a predetermined reference value or a control. Differential expression can be determined by methods known in the art, such as by array hybridization, next generation sequencing, RT-PCR and other methods as would be understood by a person skilled in the art.
Depending on the purposes of the methods as described herein, the control group used to determine whether a differential expression is observed may be different. However, as a general rule, the control group, in any given method as described herein, may be readily determined by the skilled person in the art. Unless specifically mentioned otherwise, in one example, the control group may be a subject without any gastric cancer related diseases. In one example, the control group may be a healthy subject without any existing diseases. In one example, the control group may be a subject known to have non-gastric cancer related diseases, such as, but is not limited to, gastritis, intestinal metaplasia, intestinal atrophy and the like. In one example, the control may vary on the nature of the sample as well as other factors such as the gender, age, ethnicity of the subjects based on whom the training data set was obtained from. In one example, the control subject may be of an Asian ethnicity or descent, for example a Chinese ethnicity or ethnic Chinese descent.
In one example, differential expression is observed when an miRNA as listed as "up-regulated" in Table 18, when compared to a control, is found to be up-regulated in the sample obtained from a subject suspected to have gastric cancer. Thus, in one example, upregulation of miRNAs as listed as "up-regulated" in Table 18, as compared to the control, may be indicative of the subject having gastric cancer or diagnoses the subject to have gastric cancer.
As used herein, in any of the examples or methods as described herein, the term "up-regulated" refers to an increase in the level of miRNA expression or the detection of more copies of miRNA as compared to a control. In one example, an miRNA may be considered to be "up-regulated" if the level of expression is at least about 1.01 fold change relative to control or more. In one example, the p-values in a statistical test for the change may be lower than 0.05. In one example, the p-values may be calculated using a statistical test known in the art such as a t-test (p-value<0.01). In another example, the statistical test is a t-test (p-value<0.01) that is corrected for false discovery rate (FDR) estimation using Bonferroni-type multiple comparison procedures as known in the art. This was exemplarily used in the examples below. In one example, an miRNA may be considered to be "up-regulated" if the level of expression is at least about 1.02 fold change to about 2.5 fold change, relative to control. In one example, as exemplified in Table 6, an miRNA may be considered to be "up-regulated" if the level of expression is at least about 1.05 fold change to about 1.53 fold change, relative to control. In one example, the miRNA may be considered to be "up-regulated" if the level of expression may have about 1.10 fold, or about 1.15 fold, or about 1.20 fold, or about 1.25 fold, or about 1.30 fold, or about 1.35 fold, or about 1.40 fold, or about 1.45 fold, or about 1.50 fold change, relative to control. As used herein, the control may be a gastric cancer free subject.
In one example, differential expression is observed when an miRNA as listed as "down-regulated" in Table 18, when compared to a control, is found to be down-regulated in the sample obtained from a subject suspected to have gastric cancer. Thus, in one example, down-regulation of miRNAs as listed as "down-regulated" in Table 18, as compared to the control, may be indicative of the subject having gastric cancer or may diagnose the subject to have gastric cancer.
As used herein, in any of the examples or methods as described herein, the term "down-regulated" refers to a decrease in the level of miRNA expression or the detection of less copies of miRNA as compared to a control. In one example, an miRNA may be considered to be "down-regulated" if the level of expression is shown to have at least about 0.99 fold change relative to control or less more. In one example, the p-values in a statistical test for the change may be lower than 0.05. In one example, the p-values may be calculated using a statistical test known in the art such as a t-test (p-value<0.01). In another example, the statistical test is a t-test (p-value<0.01) that is corrected for false discovery rate (FDR) estimation using Bonferroni-type multiple comparison procedures as known in the art. This was exemplarily used in the examples below. In one example, an miRNA may be considered to be "down-regulated" if the level of expression is at least about 0.98 fold change to about 0.3 fold change, relative to control. In one example, as exemplified in Table 6, an miRNA may be considered to be "down-regulated" if the level of expression is shown to have at least about 0.5 fold change to about 0.92 fold change, relative to control. In one example, the miRNA expression may be considered to be "down-regulated" if the level of expression may have about 0.95 fold, or about 0.90 fold, or about 0.85 fold, or about 0.80 fold, or about 0.75 fold, or about 0.70 fold, or about 0.65 fold, or about 0.60 fold, or about 0.55 fold change, relative to control. As used herein, the control may be a gastric cancer free subject.
The term "about" is used herein to indicate that a value includes the inherent variation of error as known in the art, which may occur from the use of devices, methods being employed to determine the value, or the variation that exists among the study subjects. Thus, in one example, the term "about", in the context of fold change in expression, as used throughout the present disclosure as described herein, may mean+/-5% of the stated value, or +/-4% of the stated value, or +/-3% of the stated value, or +/-2% of the stated value, or +/-1% of the stated value, or +/-0.5% of the stated value.
In one example, the method as described herein may measures the differential expression of one or more miRNAs as listed in Table 18. Thus, in one example, the method may measure the differential expression of at least two, or at least three, or at least four, or at least five, or at least six, or at least seven, or at least eight, or at least nine, or at least 10, or at least 11, or at least 12, or at least 13, or at least 14, or at least 15, or at least 20, or at least 25, or at least 30, or at least 35, or at least 40, or at least 45, or at least 50, or at least 55, or at least 60, or at least 65, or at least 70, or at least 75, or at least 80, or at least 85, or at least 90, or at least 95, or at least 100, or at least 105, or at least 107 or all of the miRNA as listed in Table 18. In one example, the method may measure from one to 108 miRNAs listed in Table 18, or from two to 10, or from 11 to 30, or from 31 to 50, or from 50 to 70, or from 71 to 90, or from 91 to 108 miRNAs as listed in Table 18. In one example, the method may measure differential expression of all miRNAs listed in Table 18.
In one example, the method as described herein may measure the differential expression of at least one miRNA as listed as "up-regulated" in Table 18 and at least one miRNA as listed as "down-regulated in Table 18. In one example, the method may measure the differential expression of at least two, or at least three, or at least four, or at least five, or at least six, or at least seven, or at least eight, or at least nine, or at least 10, or at least 11, or at least 12, or at least 13, or at least 14, or at least 15, or at least 20, or at least 25, or at least 30, or at least 35, or at least 40, or at least 45, or at least 50, or at least 55, or at least 60, or at least 65, or 70 of the miRNA as listed as "up-regulated" in Table 18; and at least two, or at least three, or at least four, or at least five, or at least six, or at least seven, or at least eight, or at least nine, or at least 10, or at least 11, or at least 12, or at least 13, or at least 14, or at least 15, or at least 20, or at least 25, or at least 30, or at least 35, or 38 of the miRNA as listed as "down-regulated" in Table 18.
In one example, the method as described herein may comprise measuring the expression level of at least one microRNA (miRNA) as listed in Table 14 in a non-cellular biofluid sample obtained from the subject.
Table 14 lists miRNA which may be used to determine the likelihood of a patient developing or having gastric cancer and is as follows:
TABLE-US-00002 Up-regulated Down-regulated hsa-miR-101-3p hsa-miR-107 hsa-miR-106b-3p hsa-miR-122-5p hsa-miR-128 hsa-miR-126-3p hsa-miR-1280 hsa-miR-136-5p hsa-miR-140-3p hsa-miR-139-5p hsa-miR-140-5p hsa-miR-146a-5p hsa-miR-142-5p hsa-miR-154-5p hsa-miR-148a-3p hsa-miR-181a-5p hsa-miR-15b-3p hsa-miR-193b-3p hsa-miR-183-5p hsa-miR-23c hsa-miR-186-5p hsa-miR-26a-5p hsa-miR-18b-5p hsa-miR-30a-5p hsa-miR-197-3p hsa-miR-30b-5p hsa-miR-19a-3p hsa-miR-337-5p hsa-miR-19b-3p hsa-miR-339-5p hsa-miR-20b-5p hsa-miR-382-5p hsa-miR-21-3p hsa-miR-409-3p hsa-miR-23a-5p hsa-miR-411-5p hsa-miR-25-3p hsa-miR-485-3p hsa-miR-27a-5p hsa-miR-487b hsa-miR-29a-3p hsa-miR-495 hsa-miR-29b-2-5p hsa-miR-885-5p hsa-miR-29b-3p hsa-miR-99a-5p hsa-miR-29c-3p hsa-miR-99b-5p hsa-miR-29c-5p hsa-miR-338-5p hsa-miR-424-5p hsa-miR-425-3p hsa-miR-4306 hsa-miR-450a-5p hsa-miR-486-5p hsa-miR-500a-3p hsa-miR-501-5p hsa-miR-532-3p hsa-miR-550a-5p hsa-miR-579 hsa-miR-589-5p hsa-miR-590-5p hsa-miR-598 hsa-miR-616-5p hsa-miR-627 hsa-miR-629-3p hsa-miR-629-5p hsa-miR-93-3p hsa-miR-93-5p
As known in the art, when a proliferative disease progress (with or without treatment), the clinical presentation of the disease will vary between stages of the progression. Thus, to assist the skilled person in determining how a gastric/stomach cancer has progressed, the National Cancer Institute at the National Institute of Health has published a generalized clinical presentation of stages observed in gastric/stomach cancer. The stages of a gastric cancer include, but are not strictly limited within its definition to, the following stages described as follows:
Stage I: In stage I, cancer has formed in the inside lining of the mucosa (innermost layer) of the stomach wall. Stage I is divided into stage IA and stage IB, depending on where the cancer has spread.
Stage IA: Cancer may have spread into the submucosa (layer of tissue next to the mucosa) of the stomach wall.
Stage IB: Cancer may have spread into the submucosa (layer of tissue next to the mucosa) of the stomach wall and is found in 1 or 2 lymph nodes near the tumor; or has spread to the muscle layer of the stomach wall.
Stage II: Stage II gastric cancer is divided into stage IIA and stage IIB, depending on where the cancer has spread.
Stage IIA: Cancer has spread to the subserosa (layer of tissue next to the serosa) of the stomach wall; or has spread to the muscle layer of the stomach wall and is found in 1 or 2 lymph nodes near the tumor; or may have spread to the submucosa (layer of tissue next to the mucosa) of the stomach wall and is found in 3 to 6 lymph nodes near the tumor.
Stage IIB: Cancer has spread to the serosa (outermost layer) of the stomach wall; or has spread to the subserosa (layer of tissue next to the serosa) of the stomach wall and is found in 1 or 2 lymph nodes near the tumor; or has spread to the muscle layer of the stomach wall and is found in 3 to 6 lymph nodes near the tumor; or may have spread to the submucosa (layer of tissue next to the mucosa) of the stomach wall and is found in 7 or more lymph nodes near the tumor.
Stage III: Stage III gastric cancer is divided into stage IIIA, stage IIIB, and stage IIIC, depending on where the cancer has spread.
Stage IIIA: Cancer has spread to the serosa (outermost) layer of the stomach wall and is found in 1 or 2 lymph nodes near the tumor; or has spread to the subserosa (layer of tissue next to the serosa) of the stomach wall and is found in 3 to 6 lymph nodes near the tumor; or has spread to the muscle layer of the stomach wall and is found in 7 or more lymph nodes near the tumor.
Stage IIIB: Cancer has spread to nearby organs such as the spleen, transverse colon, liver, diaphragm, pancreas, kidney, adrenal gland, or small intestine, and may be found in 1 or 2 lymph nodes near the tumor; or has spread to the serosa (outermost layer) of the stomach wall and is found in 3 to 6 lymph nodes near the tumor; or the subserosa (layer of tissue next to the serosa) of the stomach wall and is found in 7 or more lymph nodes near the tumor.
Stage IIIC: Cancer has spread to nearby organs such as the spleen, transverse colon, liver, diaphragm, pancreas, kidney, adrenal gland, or small intestine, and may be found in 3 or more lymph nodes near the tumor; or has spread to the serosa (outermost layer) of the stomach wall and is found in 7 or more lymph nodes near the tumor.
Stage IV: In stage IV, cancer has spread to distant parts of the body.
As would be appreciated by a skilled person in the art, the determination on whether a subject has a particular stage would be useful in providing the clinician a clear guideline on how to best approach any treatment or palliative care. Thus, in one aspect, the present disclosure provides a method of detecting or diagnosing gastric cancer stage in a subject. In one example, the method determines the likelihood of a subject having a stage of gastric cancer. In this aspect, the method comprising measuring the expression level of at least one microRNA (miRNA) having at least 90% sequence identity with an miRNA as listed in at least one of the tables selected from the group consisting of Table 8; Table 9 or Table 15; Table 10 or Table 16; and Table 11 or Table 17, in a non-cellular biofluid sample obtained from the subject, wherein a differential expression of miRNA expression in the sample obtained from the subject, as compared to a control, may be indicative of the likelihood of a subject having any one of stage 1, stage 2, stage 3 or stage 4 gastric cancer, or may diagnose the subject to have any one of stage 1, stage 2, stage 3 or stage 4 gastric cancer. As used herein, the control may be a gastric cancer free subject. In one example, FIG. 13 summarizes the steps of the method for determining the likelihood of a subject developing or having one of the stages of gastric cancer.
In one example, differential expression is observed when an miRNA as listed as "up-regulated" in Table 8, as compared to the control, may be indicative of the subject to have stage 1 gastric cancer or may diagnose the subject to have stage 1 gastric cancer, and wherein the miRNA may include at least one of the miRNA as listed as "up-regulated" in Table 8. Table 8 is detailed further in the Experimental section. In one example, an miRNA may be considered to be "up-regulated"if the level of expression is at least about 1.01 fold change to about 2.5 fold change, relative to control more. In one example, the p-values in a statistical test for the change may be lower than 0.05. In one example, the p-values may be calculated using a statistical test known in the art such as a t-test (p-value<0.01). In another example, the statistical test is a t-test (p-value<0.01) that is corrected for false discovery rate (FDR) estimation using Bonferroni-type multiple comparison procedures as known in the art. This was exemplarily used in the examples below. In one example, the miRNA may be considered to be "up-regulated" if the level of expression may have about 1.10 fold, or about 1.15 fold, or about 1.20 fold, or about 1.25 fold, or about 1.30 fold, or about 1.35 fold, or about 1.40 fold, or about 1.45 fold, or about 1.50 fold change, relative to control. In one example, as exemplified in Table 8, an miRNA may be considered to be "up-regulated" if the level of expression is at least about 1.11 fold change to about 1.57 fold change, relative to control.
In one example, the method as described herein may measures the differential expression of one or more miRNAs as listed as "up-regulated" in Table 8. Thus, in one example, the method may measure the differential expression of at least two, or at least three, or at least four, or at least five, or at least six, or at least seven, or eight miRNAs as listed as "up-regulated" in Table 8.
In one example, differential expression is observed when an miRNA as listed as "down-regulated" in Table 8, as compared to the control, may be indicative of the subject to have stage 1 gastric cancer or may diagnose the subject to have stage 1 gastric cancer. In one example, the miRNA may include at least one of the miRNA as listed as "down-regulated" in Table 8. In one example, an miRNA may be considered to be "down-regulated" if the level of expression has at least about 0.9 fold change or less, relative to control more. In one example, the p-values in a statistical test for the change may be lower than 0.05. In one example, the p-values may be calculated using a statistical test known in the art such as a t-test (p-value<0.01). In another example, the statistical test is a t-test (p-value<0.01) that is corrected for false discovery rate (FDR) estimation using Bonferroni-type multiple comparison procedures as known in the art. This was exemplarily used in the examples below. In one example, the miRNA expression may be considered to be "down-regulated" if the level of expression may have about 0.95 fold, or about 0.90 fold, or about 0.85 fold, or about 0.80 fold, or about 0.75 fold, or about 0.70 fold, or about 0.65 fold, or about 0.60 fold, or about 0.55 fold change, relative to control. In one example, as exemplified in Table 8, an miRNA may be considered to be "down-regulated" if the level of expression has at least about 0.68 fold change to about 0.84 fold change, relative to control.
In one example, the method as described herein may measure the differential expression of one or more miRNAs as listed as "down-regulated" in Table 8. Thus, in one example, the method may measure the differential expression of at least two, or at least three, or at least four, or at least five, or at least six, or at least seven, or at least eight, or at least nine, or at least ten, or at least eleven or twelve miRNAs as listed as "down-regulated" in Table 8.
In one example, the method as described herein may measure the differential expression of at least one miRNA as listed as "up-regulated" in Table 8 and at least one miRNA as listed as "down-regulated in Table 8. In one example, the method may measure the differential expression of at least two, or at least three, or at least four, or at least five, or at least six, or at least seven, or 8 of the miRNA as listed as "up-regulated" in Table 8; and at least two, or at least three, or at least four, or at least five, or at least six, or at least seven, or at least eight, or at least nine, or at least 10, or at least 11, or 12 of the miRNA as listed as "down-regulated" in Table 8.
In one example, differential expression is observed when an miRNA as listed as "up-regulated" in Table 9 or Table 15, as compared to the control, may be indicative of the subject to have stage 2 gastric cancer or may diagnose the subject to have stage 2 gastric cancer. Table 9 is detailed further in the Experimental section. In one example, the miRNA may include at least one of the miRNA as listed as "up-regulated" in Table 15.
Table 15 lists miRNA which may be used to determine the likelihood of a patient developing (or having) or having stage 2 gastric cancer and is as follows:
TABLE-US-00003 Up-regulated Down-regulated hsa-miR-27a-5p hsa-miR-126-3p hsa-miR-183-5p hsa-miR-107 hsa-miR-629-5p hsa-miR-320a hsa-miR-424-5p hsa-miR-339-5p hsa-miR-1280 hsa-miR-337-5p hsa-miR-18b-5p hsa-miR-99b-5p hsa-miR-195-5p hsa-miR-193b-3p hsa-miR-18a-3p hsa-miR-885-5p hsa-miR-550a-5p hsa-miR-197-3p hsa-miR-363-3p hsa-miR-450a-5p hsa-miR-20b-5p hsa-miR-15b-3p hsa-miR-142-5p hsa-miR-93-5p hsa-miR-501-5p hsa-miR-4306 hsa-miR-181a-2-3p hsa-miR-16-5p hsa-miR-128 hsa-miR-500a-3p hsa-miR-501-3p hsa-miR-19a-3p hsa-miR-629-3p hsa-miR-25-3p hsa-miR-140-5p hsa-miR-29a-3p hsa-miR-23a-5p hsa-miR-148a-3p hsa-miR-598 hsa-miR-186-5p hsa-miR-93-3p hsa-miR-23a-3p hsa-miR-339-3p hsa-miR-15a-5p hsa-miR-29b-3p hsa-miR-140-3p hsa-miR-29c-5p hsa-miR-320b hsa-miR-15b-5p hsa-miR-221-3p hsa-miR-29b-2-5p hsa-miR-532-3p hsa-miR-374b-5p hsa-miR-29c-3p hsa-miR-589-5p hsa-miR-106b-3p
In one example, an miRNA may be considered to be "up-regulated" if the level of expression is at least about 1.01 fold change to about 2.5 fold change, relative to control more. In one example, the p-values in a statistical test for the change may be lower than 0.05. In one example, the p-values may be calculated using a statistical test known in the art such as a t-test (p-value<0.01). In another example, the statistical test is a t-test (p-value<0.01) that is corrected for false discovery rate (FDR) estimation using Bonferroni-type multiple comparison procedures as known in the art. This was exemplarily used in the examples below. In one example, the miRNA may be considered to be "up-regulated" if the level of expression may have about 1.10 fold, or about 1.15 fold, or about 1.20 fold, or about 1.25 fold, or about 1.30 fold, or about 1.35 fold, or about 1.40 fold, or about 1.45 fold, or about 1.50 fold change, relative to control. In one example, as exemplified in Table 9, an miRNA may be considered to be "up-regulated" if the level of expression is at least about 1.13 fold change to about 2.13 fold change, relative to control.
In one example, the method as described herein may measures the differential expression of one or more miRNAs as listed as "up-regulated" in Table 9 or Table 15. Thus, in one example, the method may measure the differential expression of at least two, or at least three, or at least four, or at least five, or at least six, or at least seven, or at least eight, or at least nine, or at least 10, or at least 11, or at least 12, or at least 13, or at least 14, or at least 15, or at least 20, or at least 25, or at least 30, or at least 35, or at least 40, or at least 45, or at least 50, or 54 miRNAs as listed as "up-regulated" in Table 9 or Table 15.
In one example, differential expression is observed when an miRNA as listed as "down-regulated" in Table 9 or Table 15, as compared to the control, may be indicative of the subject to have stage 2 gastric cancer or may diagnose the subject to have stage 2 gastric cancer. In one example, the miRNA may include at least one of the miRNA as listed as "down-regulated" in Table 15. In one example, an miRNA may be considered to be "down-regulated" if the level of expression has at least about 0.9 fold change or less, relative to control more. In one example, the p-values in a statistical test for the change may be lower than 0.05. In one example, the p-values may be calculated using a statistical test known in the art such as a t-test (p-value<0.01). In another example, the statistical test is a t-test (p-value<0.01) that is corrected for false discovery rate (FDR) estimation using Bonferroni-type multiple comparison procedures as known in the art. This was exemplarily used in the examples below. In one example, the miRNA expression may be considered to be "down-regulated" if the level of expression may have about 0.95 fold, or about 0.90 fold, or about 0.85 fold, or about 0.80 fold, or about 0.75 fold, or about 0.70 fold, or about 0.65 fold, or about 0.60 fold, or about 0.55 fold change, relative to control. In one example, as exemplified in Table 9, an miRNA may be considered to be "down-regulated" if the level of expression has at least about 0.56 fold change to about 0.87 fold change, relative to control.
In one example, the method as described herein may measures the differential expression of one or more miRNAs as listed as "down-regulated" in Table 9 or 15. Thus, in one example, the method may measure the differential expression of at least two, or at least three, or at least four, or at least five, or at least six, or at least seven, or eight miRNAs as listed as "down-regulated" in Table 9 or 15.
In one example, the method as described herein may measure the differential expression of at least one miRNA as listed as "up-regulated" in Table 9 or 15 and at least one miRNA as listed as "down-regulated in Table 9 or 15. In one example, the method may measure the differential expression of at least two, or at least three, or at least four, or at least five, or at least six, or at least seven, or at least eight, or at least nine, or at least 10, or at least 11, or at least 12, or at least 13, or at least 14, or at least 15, or at least 20, or at least 25, or at least 30, or at least 35, or at least 40, or at least 45, or at least 50, or 54 miRNAs as listed as "up-regulated" in Table 9 or Table 15; and at least two, or at least three, or at least four, or at least five, or at least six, or at least seven, or eight of the miRNA as listed as "down-regulated" in Table 9 or Table 15.
In one example, when the method as described herein that may provide a diagnosis or an indication on whether a subject may have stage 2 gastric cancer uses Table 15, the method may further comprise comparing the expression level of any one or more of miRNAs including, but not limited to, of miR-20a-5p, miR-223-3p, miR-17-5p, miR-106b-5p, miR-423-5p, and miR-21-5p.
In one example, differential expression is observed when an miRNA as listed as "up-regulated" in Table 10 or Table 16, as compared to the control, may be indicative of the subject to have stage 3 gastric cancer or may diagnose the subject to have stage 3 gastric cancer. Table 10 is detailed further in the Experimental section. In one example, the miRNA may include at least one of the miRNA as listed as "up-regulated" in Table 16.
Table 16 lists miRNA which may be used to determine the likelihood of a patient developing (or having) or having stage 3 gastric cancer and is as follows:
TABLE-US-00004 Up-regulated Down-regulated hsa-miR-629-5p hsa-miR-126-5p hsa-miR-650 hsa-miR-126-3p hsa-miR-1280 hsa-miR-27a-3p hsa-miR-27a-5p hsa-miR-99b-5p hsa-miR-18b-5p hsa-miR-107 hsa-miR-424-5p hsa-miR-30a-5p hsa-miR-500a-3p hsa-miR-629-3p hsa-miR-550a-5p hsa-miR-4306 hsa-miR-197-3p hsa-miR-616-5p hsa-miR-128 hsa-miR-450a-5p hsa-miR-148a-3p hsa-miR-598 hsa-miR-15b-3p hsa-miR-1290 hsa-miR-93-3p hsa-miR-22-3p hsa-miR-23a-5p hsa-miR-320c hsa-miR-130a-3p hsa-miR-320b hsa-miR-320e hsa-miR-19a-3p hsa-miR-378a-3p hsa-miR-9-5p hsa-miR-29b-2-5p hsa-miR-532-3p hsa-miR-590-5p hsa-miR-589-5p hsa-miR-140-5p hsa-miR-29c-5p
In one example, an miRNA may be considered to be "up-regulated" if the level of expression is at least about 1.01 fold change to about 2.5 fold change, relative to control more. In one example, the p-values in a statistical test for the change may be lower than 0.05. In one example, the p-values may be calculated using a statistical test known in the art such as a t-test (p-value<0.01). In another example, the statistical test is a t-test (p-value<0.01) that is corrected for false discovery rate (FDR) estimation using Bonferroni-type multiple comparison procedures as known in the art. This was exemplarily used in the examples below. In one example, the miRNA may be considered to be "up-regulated" if the level of expression may have about 1.10 fold, or about 1.15 fold, or about 1.20 fold, or about 1.25 fold, or about 1.30 fold, or about 1.35 fold, or about 1.40 fold, or about 1.45 fold, or about 1.50 fold change, relative to control. In one example, as exemplified in Table 10, an miRNA may be considered to be "up-regulated" if the level of expression is at least about 1.20 fold change to about 1.93 fold change, relative to control.
In one example, the method as described herein may measures the differential expression of one or more miRNAs as listed as "up-regulated" in Table 10 or Table 16. Thus, in one example, the method may measure the differential expression of at least two, or at least three, or at least four, or at least five, or at least six, or at least seven, or at least eight, or at least nine, or at least 10, or at least 11, or at least 12, or at least 13, or at least 14, or at least 15, or at least 20, or at least 25, or at least 30, or at least 35, or 37 miRNAs as listed as "up-regulated" in Table 10 or Table 16.
In one example, differential expression is observed when an miRNA as listed as "down-regulated" in Table 10 or Table 16, as compared to the control, may be indicative of the subject to have stage 3 gastric cancer or may diagnose the subject to have stage 3 gastric cancer. In one example, the miRNA may include at least one of the miRNA as listed as "down-regulated" in Table 16. In one example, an miRNA may be considered to be "down-regulated" if the level of expression has at least about 0.9 fold change or less, relative to control. In one example, the p-values in a statistical test for the change may be lower than 0.05. In one example, the p-values may be calculated using a statistical test known in the art such as a t-test (p-value<0.01). In another example, the statistical test is a t-test (p-value<0.01) that is corrected for false discovery rate (FDR) estimation using Bonferroni-type multiple comparison procedures as known in the art. This was exemplarily used in the examples below. In one example, the miRNA expression may be considered to be "down-regulated" if the level of expression may have about 0.95 fold, or about 0.90 fold, or about 0.85 fold, or about 0.80 fold, or about 0.75 fold, or about 0.70 fold, or about 0.65 fold, or about 0.60 fold, or about 0.55 fold change, relative to control. In one example, as exemplified in Table 10, an miRNA may be considered to be "down-regulated" if the level of expression has at least about 0.72 fold change to about 0.88 fold change, relative to control.
In one example, the method as described herein may measures the differential expression of one or more miRNAs as listed as "down-regulated" in Table 10 or 16. Thus, in one example, the method may measure the differential expression of at least two, or at least three, or at least four, or at least five, or six miRNAs as listed as "down-regulated" in Table 10 or 16.
In one example, the method as described herein may measure the differential expression of at least one miRNA as listed as "up-regulated" in Table 10 or 16 and at least one miRNA as listed as "down-regulated in Table 10 or 16. In one example, the method may measure the differential expression of at least two, or at least three, or at least four, or at least five, or at least six, or at least seven, or at least eight, or at least nine, or at least 10, or at least 11, or at least 12, or at least 13, or at least 14, or at least 15, or at least 20, or at least 25, or at least 30, or at least 35, or 37 miRNAs as listed as "up-regulated" in Table 10 or Table 16; and at least two, or at least three, or at least four, or at least five, or six of the miRNA as listed as "down-regulated" in Table 10 or Table 16.
In one example, the method as described herein that may provide a diagnosis or an indication on whether a subject may have stage 3 gastric cancer uses Table 16, the method may further comprise comparing the expression level of any one or more of miRNAs including, but not limited to, miR-21-5pm, miR-223-3p and miR-423-5p.
In one example, differential expression is observed when an miRNA as listed as "up-regulated" in Table 11 or Table 17, as compared to the control, may be indicative of the subject to have stage 4 gastric cancer or may diagnose the subject to have stage 4 gastric cancer. Table 10 is detailed further in the Experimental section. In one example, the miRNA may include at least one of the miRNA as listed as "up-regulated" in Table 17.
Table 17 lists miRNA which may be used to determine the likelihood of a patient developing (or having) stage 4 gastric cancer and is as follows:
TABLE-US-00005 Up-regulated Down-regulated hsa-miR-27a-5p hsa-miR-181a-5p hsa-miR-338-5p hsa-miR-30d-5p hsa-miR-450a-5p hsa-miR-30b-5p hsa-miR-183-5p hsa-miR-126-3p hsa-miR-579 hsa-miR-146a-5p hsa-miR-616-5p hsa-miR-107 hsa-miR-424-5p hsa-miR-99b-5p hsa-miR-200b-3p hsa-miR-10a-5p hsa-miR-148a-3p hsa-miR-139-5p hsa-miR-142-5p hsa-miR-10b-5p hsa-miR-629-3p hsa-miR-23c hsa-miR-4306 hsa-miR-497-5p hsa-miR-15b-3p hsa-miR-154-5p hsa-miR-627 hsa-miR-26a-5p hsa-miR-20b-5p hsa-miR-339-5p hsa-miR-197-3p hsa-miR-382-5p hsa-miR-101-3p hsa-miR-134 hsa-miR-598 hsa-miR-409-3p hsa-miR-23a-5p hsa-miR-487b hsa-miR-141-3p hsa-miR-136-5p hsa-miR-19a-3p hsa-miR-150-5p hsa-miR-550a-5p hsa-miR-193b-3p hsa-miR-140-5p hsa-miR-30a-5p hsa-miR-29c-3p hsa-miR-99a-5p hsa-miR-18b-5p hsa-miR-337-5p hsa-miR-590-5p hsa-miR-495 hsa-miR-1280 hsa-miR-885-5p hsa-miR-191-5p hsa-miR-122-5p hsa-miR-589-5p hsa-miR-140-3p hsa-miR-93-5p hsa-miR-29b-3p hsa-miR-628-5p hsa-miR-93-3p hsa-miR-106b-3p hsa-miR-484 hsa-miR-29a-3p hsa-miR-29b-2-5p hsa-miR-29c-5p hsa-miR-425-5p hsa-miR-425-3p
In one example, an miRNA may be considered to be "up-regulated" if the level of expression is at least about 1.01 fold change to about 2.5 fold change, relative to control more. In one example, the p-values in a statistical test for the change may be lower than 0.05. In one example, the p-values may be calculated using a statistical test known in the art such as a t-test (p-value<0.01). In another example, the statistical test is a t-test (p-value<0.01) that is corrected for false discovery rate (FDR) estimation using Bonferroni-type multiple comparison procedures as known in the art. This was exemplarily used in the examples below. In one example, the miRNA may be considered to be "up-regulated" if the level of expression may have about 1.10 fold, or about 1.15 fold, or about 1.20 fold, or about 1.25 fold, or about 1.30 fold, or about 1.35 fold, or about 1.40 fold, or about 1.45 fold, or about 1.50 fold change, relative to control. In one example, as exemplified in Table 11, an miRNA may be considered to be "up-regulated" if the level of expression is at least about 1.12 fold change to about 1.86 fold change, relative to control.
In one example, the method as described herein may measures the differential expression of one or more miRNAs as listed as "up-regulated" in Table 11 or Table 17. Thus, in one example, the method may measure the differential expression of at least two, or at least three, or at least four, or at least five, or at least six, or at least seven, or at least eight, or at least nine, or at least 10, or at least 11, or at least 12, or at least 13, or at least 14, or at least 15, or at least 20, or at least 25, or at least 30, or at least 35, or at least 40, or at least 45 or 46 miRNAs as listed as "up-regulated" in Table 11 or Table 17.
In one example, differential expression is observed when an miRNA as listed as "down-regulated" in Table 11 or Table 17, as compared to the control, may be indicative of the subject to have stage 4 gastric cancer or may diagnose the subject to have stage 4 gastric cancer. In one example, the miRNA may include at least one of the miRNA as listed as "down-regulated" in Table 17. In one example, an miRNA may be considered to be "down-regulated" if the level of expression has at least about 0.9 fold change or less, relative to control more. In one example, the p-values in a statistical test for the change may be lower than 0.05. In one example, the p-values may be calculated using a statistical test known in the art such as a t-test (p-value<0.01). In another example, the statistical test is a t-test (p-value<0.01) that is corrected for false discovery rate (FDR) estimation using Bonferroni-type multiple comparison procedures as known in the art. This was exemplarily used in the examples below. In one example, the miRNA expression may be considered to be "down-regulated" if the level of expression may have about 0.95 fold, or about 0.90 fold, or about 0.85 fold, or about 0.80 fold, or about 0.75 fold, or about 0.70 fold, or about 0.65 fold, or about 0.60 fold, or about 0.55 fold change, relative to control. In one example, as exemplified in Table 11, an miRNA may be considered to be "down-regulated" if the level of expression has at least about 0.48 fold change to about 0.90 fold change, relative to control.
In one example, the method as described herein may measures the differential expression of one or more miRNAs as listed as "down-regulated" in Table 11 or 17. Thus, in one example, the method may measure the differential expression of at least two, or at least three, or at least four, or at least five, or at least six, or at least seven, or at least eight, or at least nine, or at least 10, or at least 11, or at least 12, or at least 13, or at least 14, or at least 15, or at least 20, or at least 25, or 28 miRNAs as listed as "down-regulated" in Table 11 or 17.
In one example, the method as described herein may measure the differential expression of at least one miRNA as listed as "up-regulated" in Table 11 or 17 and at least one miRNA as listed as "down-regulated in Table 11 or 17. In one example, the method may measure the differential expression of at least two, or at least three, or at least four, or at least five, or at least six, or at least seven, or at least eight, or at least nine, or at least 10, or at least 11, or at least 12, or at least 13, or at least 14, or at least 15, or at least 20, or at least 25, or at least 30, or at least 35, or at least 40, or at least 45 or 46 miRNAs as listed as "up-regulated" in Table 11 or Table 17; and at least two, or at least three, or at least four, or at least five, or at least six, or at least seven, or at least eight, or at least nine, or at least 10, or at least 11, or at least 12, or at least 13, or at least 14, or at least 15, or at least 20, or at least 25, or 28 of the miRNA as listed as "down-regulated" in Table 11 or Table 17.
In one example, the method as described herein that may provide a diagnosis or an indication on whether a subject may have stage 4 gastric cancer uses Table 17, the method may further comprise comparing the expression level of any one or more of miRNAs including, but not limited to, miR-21-5pm, miR-223-3pm, miR-20a-5pm, miR-106b-5p, and miR-17-5p.
In yet another aspect, there is provided a method of detecting or diagnosing gastric cancer in a subject or determining the likelihood of a subject having gastric cancer or, comprising the steps of: (a) measuring the expression level of at least one miRNAs having at least 90% sequence identity with an miRNA as listed in Table 12 or Table 19 in a non-cellular biofluid sample; (b) generating a score based on the expression level of the miRNAs measured in step (a); and (c) using the score to predict the likelihood of the subject having gastric cancer, wherein the score is calculated by a classification algorithm that compares the expression level of the subject with that of a positive control (sample from gastric cancer subject) or a negative control (sample from gastric cancer free subject), and the score identifies the likelihood of the subject to either: (i) have gastric cancer, which score would fall within the score of the positive control, or (ii) have no gastric cancer (i.e. gastric cancer free), which score would fall within the score of the negative control. In one example, the miRNA may include at least one of the miRNA as listed as in Table 19. In one example, this method of detecting or diagnosing gastric cancer in a subject or determining the likelihood of a subject having gastric cancer may be referred to as a multivariant method. In one example, the multivariant method may use miRNAs that have been determined by a clinical data to be representative of a sub-population or group. In one example, the multivariant biomarker panel may comprise biomarkers as listed in Table 12, which comprises both miRNAs found to be associated with gastric cancer and miRNAs found to be not associated with gastric cancer. In one example, the miRNAs that may be used in the multivariant method that are associated with gastric cancer may be comprised in Table 19. Table 12 is detailed further in the Experimental section. In one example, FIG. 14 summarizes the steps of the multivariant method for determining the likelihood of a subject developing (or having) gastric cancer.
Table 19 lists miRNAs frequently selected for use in multivariant biomarker panel where the expression levels of the miRNAs were altered in the gastric cancer subjects and is as follows:
TABLE-US-00006 miRNA altered in gastric cancer hsa-miR-103a-3p hsa-miR-181a-5p hsa-miR-142-5p hsa-miR-27a-5p hsa-miR-26a-5p hsa-miR-616-5p hsa-miR-30a-5p hsa-miR-484 hsa-miR-4306 hsa-miR-590-5p hsa-miR-362-5p hsa-miR-106b-3p hsa-miR-497-5p hsa-miR-18b-5p hsa-miR-122-5p hsa-miR-200b-3p hsa-miR-197-3p hsa-miR-486-5p hsa-miR-99a-5p hsa-miR-885-5p hsa-miR-598 hsa-miR-454-3p hsa-miR-130a-3p hsa-miR-29c-3p hsa-miR-126-3p hsa-miR-107 hsa-miR-140-5p hsa-miR-150-5p hsa-miR-30d-5p hsa-miR-10b-5p hsa-miR-532-3p hsa-miR-23a-5p hsa-miR-29b-3p hsa-miR-21-3p hsa-miR-148a-3p hsa-miR-136-5p hsa-miR-1280 hsa-miR-16-5p
As mentioned above, the multivariant method may comprise may comprise determination of biomarkers as listed in Table 12, which comprises both miRNAs found to be associated with gastric cancer and miRNAs found to be not associated with gastric cancer. Thus, if in one example, the multivariant method uses miRNAs as listed in Table 19, the method would further comprises measuring the expression level of at least one miRNAs, which when compared to the negative control, the expression level is not altered in the subject. In one example, the miRNAs, which when compared to the negative control, the expression level is not altered in the subject, may be any one of the miRNAs as listed in Table 20.
Table 20 lists miRNAs frequently selected for use in multivariant biomarker panel where the expression levels of the miRNAs were not associated with gastric cancer subjects and is as follows:
TABLE-US-00007 gastric cancer unrelated miRNA hsa-miR-532-5p hsa-miR-30e-5p hsa-miR-340-5p hsa-miR-23b-3p hsa-miR-224-5p hsa-miR-185-5p hsa-miR-320d hsa-miR-374a-5p hsa-miR-584-5p hsa-miR-194-5p
In one example, in the multivariant method as described herein, as known in the art, the score may calculate using a classification algorithm. In one example, the classification algorithm may include, but is not limited to, support vector machine algorithm, logistic regression algorithm, multinomial logistic regression algorithm, Fisher's linear discriminant algorithm, quadratic classifier algorithm, perceptron algorithm, k-nearest neighbors algorithm, artificial neural network algorithm, random forests algorithm, decision tree algorithm, naive Bayes algorithm, adaptive Bayes network algorithm, and ensemble learning method combining multiple learning algorithms. As would be appreciated by the skilled person in the art, the classification algorithm may be pre-trained using the expression level of the positive control and the negative control.
In the particular aspect of the multivariant method as described herein, the positive control may be a sample obtained from a subject with gastric cancer and the negative control is a sample obtained from a gastric cancer free control. In one example, the gastric cancer free control may be as described above. That is, in one example, the gastric cancer free control may be a subject without any gastric cancer related diseases. In one example, the gastric cancer free control may be a healthy subject without any existing diseases. In one example, the gastric cancer free control may be a subject known to have non-gastric cancer related diseases, such as, but is not limited to, gastritis, intestinal metaplasia, intestinal atrophy and the like. In one example, the control may vary on the nature of the sample as well as other factors such as the gender, age, ethnicity of the subjects based on whom the training data set was obtained from. In one example, the control subject may be of a Chinese ethnicity or ethnic Chinese descent.
As would be appreciated by those skilled in the art, the expression level of the miRNAs may be any one of concentration, log(concentration), Ct/Cq number, two to the power of Ct/Cq number and the like.
In one example, the method as described herein may use a data-trained formula that may be able to determine the likelihood of a subject having gastric cancer. In one example, the algorithm combines the measurement of multiple miRNA to give a score for the prediction of the risk of a subject having gastric cancer. It may combine the information of multiple genetic target and gives a better prediction accuracy than using single miRNA biomarker. In one example, the minimum number of miRNA biomarker to build a useful panel is 4. For example, it is shown in FIG. 11 that the biomarker panel with 4 miRNAs has an average AUC>0.8 in the validation set which is considered to be useful biomarker panel. The improvement on the performance of the biomarker panel (in terms of AUC values) does not increase significantly when the miRNA is more than 7. Accordingly, in one example, the minimum number of miRNA to build an optimum panel with maximized performance is 7 miRNAs. In one example, the formula that may be used for calculating the score for determining the likelihood of a subject having gastric cancer may be as follows: A.times.miRNA1+B.times.miRNA2+C.times.miRNA3+D, wherein miRNA1, miRNA2, miRNA3 were values related with the expression level of miRNA which can be the copy number, the log(copy number), the Ct/Cq number or others numbers; and A, B, C, D were the coefficients which can be positive or negative. For example, the score for determining the likelihood of a subject having gastric cancer (i.e. cancer risk score) may be calculated by combining 12 miRNAs (Table 21) frequently selected in the multivariant biomarker panel identification process with prevalence >20%, as described in the examples below and in FIG. 15. In one example, when a score is obtained from the formula, the higher/lower the score, the higher the chance of a subject having gastric cancer. In one example, the range may not be clearly defined as the coefficients may be scaled. For example, all coefficients (i.e. A, B, or C) may be half the amount or the value of D may be changed depending on training by the training data set. In one example, the value of the score may be positively or negatively correlated with the risk of having gastric cancer. The actual correlation would depend on the training data set and the skilled person in the art would be familiar with the necessary adjustment required upon establishment of the training data set.
In one example, the range may not be clearly defined as the coefficients may be scaled. For example, all coefficients (i.e. A, B, or C) may be twice the amount or the value of D may be changed depending on training by the training data set. In one example, the value of the score may be positively or negatively correlated with the risk of having gastric cancer. The actual correlation would depend on the training data set and the skilled person in the art would be familiar with the necessary adjustment required upon establishment of the training data set.
In one example, all coefficients (i.e. A, B, or C) may be purposely adjusted to half the amount and/or the value of D may be purposely changed to scale the range of the calculated value based on the formula for most of the subjects from 0 to 100. In one example, the value of the score may be positively or negatively correlated with the risk of having gastric cancer. The actual correlation would depend on the training data set and the skilled person in the art would be familiar with the necessary adjustment required upon establishment of the training data set.
In one example, the method as described herein may measure the expression level of at least one miRNA as listed as "significant" in Table 12 or as listed in Table 19 and at least one miRNA as listed as "insignificant" in Table 12 or as listed in Table 20. In one example, the method may measure the differential expression of at least two, or at least three, or at least four, or at least five, or at least six, or at least seven, or at least eight, or at least nine, or at least 10, or at least 11, or at least 12, or at least 13, or at least 14, or at least 15, or at least 20, or at least 25, or at least 30, or at least 35, or 42 miRNAs as listed as "significant" in Table 12 or at least two, or at least three, or at least four, or at least five, or at least six, or at least seven, or at least eight, or at least nine, or at least 10, or at least 11, or at least 12, or at least 13, or at least 14, or at least 15, or at least 20, or at least 25, or at least 30, or at least 35, or 38 of the miRNAs as listed in Table 19; and at least two, or at least three, or at least four, or at least five, or at least six, or at least seven, or at least eight, or at least nine, or 12 of the miRNAs as listed as "insignificant" in Table 12 or at least two, or at least three, or at least four, or at least five, or at least six, or at least seven, or at least eight, or at least nine, or 10 of the miRNAs as listed in Table 20.
In one example, when the multivariant method as described herein uses miRNAs related to gastric cancer as listed in Table 19, the method may further comprise measuring the expression level of any one or more of miRNAs selected from the group consisting of miR-21-5p, miR-20a-5pm, miR-17-5p, miR-423-5p and miR-223-3p.
In one example, wherein the multivariant method as described herein uses unrelated miRNAs as listed in Table 20, the method as described herein may further comprise measuring the expression level of any one or more of miRNAs selected from the group consisting of miR-34a-5p and miR-27b-3p.
An exemplary approach to arrive at miRNA sets that correlate with gastric cancer is summarized below. In addition, the general workflow is shown in FIGS. 1, 2 and 14.
Step 1: Total RNA (or subfractions thereof) is extracted from a sample (such as plasma, serum, or other blood fractions) of a subject or subjects with gastric cancer using suitable kits and/or purification methods.
Step 2: From the respective sample, the quantity (expression level) of one miRNA or sets of at least one miRNAs selected from the group consisting of SEQ ID NO: 1 to SEQ ID NO: 191 is measured using experimental techniques. In one example, the at least one miRNA may be selected from the group as listed in Tables 12, 19 and 20. These techniques are techniques known in the art, which may include, but are not limited to, array based approaches, amplification methods (PCR, RT-PCR, or qPCR), sequencing, next generation sequencing, and/or mass spectroscopy.
Step 3: In order to gather information on the diagnostic value and the redundancy of each of the single miRNA biomarkers, mathematical methods are applied. These methods are known methods in the art and may include, but are not limited to, basic mathematic approaches (e.g. Fold Quotients, Signal-to-Noise ratios, Correlation), statistical methods as hypothesis tests (e.g. t-test, Wilcoxon-Mann-Whitney test), the Area under the Receiver operator Characteristics Curve, information theory approaches, (e.g. the Mutual Information, Cross-entropy), probability theory (e.g. joint and conditional probabilities) or combinations and modifications of the previously mentioned methods.
Step 4: The information gathered in step 3) is used to estimate for each miRNA biomarker the diagnostic content or value. Usually, however, this diagnostic value is too small to get a highly accurate diagnosis with accuracy rates, specificities and sensitivities beyond the 80% barrier. The diagnostic content of the miRNAs suitable for diagnosing gastric cancer is listed in FIG. 1. This Figure includes the miRNAs as listed in Tables 12, 19, and 20.
Step 5: In order to increase the performance for diagnosing of individuals suffering from gastric cancer, more than one miRNA biomarker may be employed. Thus statistical learning/machine learning/bioinformatics/computational approaches are applied for set selection in order to select/define sets of miRNA biomarkers (may comprising miRNAs as listed in Table 12 or Tables 19 and 20) that are tailored for the detection of gastric cancer. These techniques include, but are not limited to, Wrapper subset selection techniques (e.g. forward step-wise, backward step-wise, combinatorial approaches, optimization approaches), filter subset selection methods (e.g. the methods mentioned in Step 3), principal component analysis, or combinations and modifications of such methods (e.g. hybrid approaches).
Step 6: The subsets, selected/defined in Step 5, which may range from only a small number (at least one, or at least two, or more for the set) to all measured miRNA, are then used to carry out a diagnosis of gastric cancer. To this end, statistical learning/machine learning/bioinformatics/computational approaches are applied that include, but are not limited to, any type of supervised or unsupervised analysis: classification techniques (e.g. naive Bayes, Linear Discriminant Analysis, Quadratic Discriminant Analysis Neural Nets, Tree based approaches, Support Vector Machines, Nearest Neighbor Approaches), Regression techniques (e.g. linear Regression, Multiple Regression, logistic regression, probit regression, ordinal logistic regression ordinal Probit-Regression, Poisson Regression, negative binomial Regression, multinomial logistic Regression, truncated regression), Clustering techniques (e.g. k-means clustering, hierarchical clustering, PCA), Adaptations, extensions, and combinations of the previously mentioned approaches.
Step 7: By combination of subset selection (Step 5) and machine learning approaches (Step 6) an algorithm or a mathematical function for diagnosing gastric cancer is obtained. This algorithm or mathematical function is applied to a miRNA expression profile (miRNA expression profile data) of an individual (subject) to be diagnosed for gastric cancer.
In any of the methods as described herein, the non-cellular biofluid may include any bodily fluid that does not include any cellular component of the fluid. Thus, in one example, upon extraction from the subject, the biofluid or bodily fluid may comprise cellular components generally found in a bodily fluid or biofluid of a subject. However, this biofluid or bodily fluid may be processed with methods known in the art to remove any cellular components contained within the biofluid or bodily fluid. For example, a centrifugation or purification process to remove cellular components of the bodily fluid or biofluid may be performed before the methods of the present disclosure may be conducted. Thus, in one example, the bodily fluid or non-cellular biofluid may include, but is not limited to non-cellular components of amniotic fluid, breast milk, bronchial lavage, cerebrospinal fluid, colostrum, interstitial fluid, peritoneal fluids, pleural fluid, saliva, seminal fluid, urine, tears, whole blood, including plasma, red blood cells, white blood cells and serum. In one example, the non-cellular biofluid may be serum or plasma.
As used herein, in any of the methods as described herein, the terms "subject" and "patient" may be used interchangeably to refer to an animal (e.g., a mammal, a fish, an amphibian, a reptile, a bird and an insect). In one example, the subject may be a mammal (e.g., a non-human mammal (such as a dog, a cat, or a primate) and a human). In one example, the subject may be a primate (e.g., a chimpanzee and a human). In one example, the subject may be a human. In one example, the subject may be a human with or without gastric (or stomach) cancer. In the Experimental section of the present disclosure, the training data set was obtained from subjects of Chinese ethnicity or Chinese descent. Thus, in one example, the subject may be of an Asian descent. In one example, the subject may be of a Chinese ethnicity or ethnic Chinese descent.
In one example, the methods as described herein may be provided as a kit. The kit may comprise components necessary or detecting the miRNAs as described herein. Components may include primers/probes that may hybridizes with the miRNAs as described herein, reagents, containers and/or equipment configured to detect miRNAs and primer/probes as described herein. In one example, the container within the kit may contain a primer/probe set that may detect or determine the level of the miRNAs as described herein that is radiolabelled before use. The kit may comprise containers of substances for reverse transcribing and amplifying one or more miRNAs, such as containers comprising dNTPs (each of the four deoxynucleotides dATP, dCTP, dGTP, and dTTP), buffers, reverse transcriptase and DNA polymerase. The kit may also comprise nucleic acid template(s) for a positive control and/or negative control reaction. The kits may further include any reaction components or buffer necessary for isolation of miRNAs from samples obtained from subjects.
The invention illustratively described herein may suitably be practiced in the absence of any element or elements, limitation or limitations, not specifically disclosed herein. Thus, for example, the terms "comprising", "including", "containing", etc. shall be read expansively and without limitation. Additionally, the terms and expressions employed herein have been used as terms of description and not of limitation, and there is no intention in the use of such terms and expressions of excluding any equivalents of the features shown and described or portions thereof, but it is recognized that various modifications are possible within the scope of the invention claimed. Thus, it should be understood that although the present invention has been specifically disclosed by preferred embodiments and optional features, modification and variation of the inventions embodied therein herein disclosed may be resorted to by those skilled in the art, and that such modifications and variations are considered to be within the scope of this invention.
The invention has been described broadly and generically herein. Each of the narrower species and subgeneric groupings falling within the generic disclosure also form part of the invention. This includes the generic description of the invention with a proviso or negative limitation removing any subject matter from the genus, regardless of whether or not the excised material is specifically recited herein.
Other embodiments are within the following claims and non-limiting examples. In addition, where features or aspects of the invention are described in terms of Markush groups, those skilled in the art will recognize that the invention is also thereby described in terms of any individual member or subgroup of members of the Markush group.
Experimental Section
Methods
Pre-Analytics (Sample Collection and microRNA Extraction):
Serum samples from normal (i.e. gastric cancer free control) and gastric cancer subjects were centrally collected by Singapore Gastric Cancer Consortium, processed and stored frozen at -80.degree. C. Total RNA from 200 .mu.l of serum were isolated using the well-established column based miRNeasy kit (Qiagen, Hilden, Germany), on a semi-automated QiaCube system. Serum contains minute amount of RNA. To reduce the loss of RNA and monitor extraction efficiency, rationally designed isolation enhancers (MS2) and spike-in control RNAs (MiRXES) were added to the specimen prior to isolation.
RT-qPCR:
The isolated total RNAs and synthetic RNA standards were converted to cDNA in optimized multiplex reverse transcription reactions with a second set of spike-in control RNAs to detect the presence of inhibitors and monitor the RT-qPCR efficiency. The Impron II (Promega.RTM.) reverse transcriptase was used to perform the reverse transcription following manufacture's instruction. The synthesized cDNA was then subjected to a multiplex augmentation step and quantified using a Sybr Green based single-plex qPCR assays (MIQE compliant) (MiRXES.RTM.). ABI.RTM. ViiA-7 384 machine was used for qPCR reactions. The overview and details of miRNA RT-qPCR measurement workflow is summarized in FIG. 2.
Data Processing:
The raw Cycles to Threshold (Ct) values were processed and the absolute copy numbers of the target miRNAs in each sample were determined through intra-polation of the synthetic miRNA standard curves. The technical variations introduced during RNA isolation and the processes of RT-qPCR were normalized by the spike-in control RNAs. For the analysis of single miRNA, the biological variations were further normalized by a set of validated endogenous reference miRNAs stably expressed across all control and disease samples.
Study Design
A well-designed clinical study (case-control study) was carried out to ensure the accurate identification of biomarkers for the diagnosis of gastric cancer. A total of 237 Chinese patients with gastric cancer of average age of 68.0.+-.10.9 years old (stage 1 to 4) were used in this study and comparisons were made with another 236 age and sex matched normal (healthy/gastric cancer free) Chinese subjects, serving as the control group. All the cancer subjects were confirmed by endoscopy as well as biopsy and the serum samples were collected before any treatment. All the normal (healthy) subjects were confirmed gastric cancer free by endoscopy at the time when samples were collected and were followed up for 3-5 years with endoscopy screening every 2 years to ensure the subjects did not develop gastric cancer within this period of time. The detailed clinical information of the subjects was listed in Tables 2 and 3. All serum samples were stored at -80.degree. C. prior to use. The characteristics of the studied subjects are summarized in Table 5. A large numbers of the control (normal/healthy/gastric cancer free subjects) subjects had gastric diseases such as gastritis, intestinal metaplasia and atrophy. Thus, the control group represented the high-risk population for gastric cancer. Although, the percentage of gastric cancer patients with Helicobacter pylori (78.8%) was more than that in the control group (55.7%), the marginal difference was insufficient to support the use Helicobacter pylori as a biomarker for gastric cancer.
TABLE-US-00008 TABLE 2 Clinical information of gastric cancer subjects H Intestinal S/N Sex Age Classification Stage Gastritis Pylori Metaplasia Atrophy 1 Female 69 Intestinal 1a Yes Yes Yes No 2 Male 64 Intestinal 1a Yes Yes Yes No 3 Male 60 Intestinal 1a Yes Yes Yes No 4 Female 77 Intestinal 1a Yes Yes Yes No 5 Female 79 Intestinal 1a Yes Yes Yes No 6 Female 78 Intestinal 1a Yes Yes Yes No 7 Female 80 Intestinal 1a Yes No Yes No 8 Female 83 Intestinal 1a Yes Yes Yes No 9 Male 59 Intestinal 1a Yes Yes Yes No 10 Male 78 Intestinal 1a Yes Yes Yes No 11 Female 77 Intestinal 1a Yes Yes Yes No 12 Male 56 Intestinal 1a Yes Yes Yes No 13 Male 56 Intestinal 1a Yes Yes Yes No 14 Male 67 Intestinal 1a Yes Yes Yes No 15 Female 76 Intestinal 1a Yes Yes Yes No 16 Male 62 Intestinal 1a No Yes Yes No 17 Male 65 Intestinal 1a Yes Yes No No 18 Female 68 Intestinal 1b Yes Yes Yes No 19 Male 77 Intestinal 1b Yes Yes Yes No 20 Male 78 Intestinal 1b Yes Yes Yes No 21 Female 52 Intestinal 1b Yes No No No 22 Male 65 Intestinal 1b Yes Yes Yes No 23 Female 78 Intestinal 1b Yes Yes Yes No 24 Male 82 Intestinal 1b Yes Yes Yes No 25 Male 67 Intestinal 1b Yes Yes Yes Yes 26 Male 77 Intestinal 1b No Yes Yes No 27 Male 80 Intestinal 1b Yes Yes Yes No 28 Female 78 Intestinal 1b Yes Yes Yes No 29 Male 73 Intestinal 1b Yes Yes Yes No 30 Male 56 Intestinal 1b Yes Yes Yes No 31 Female 49 Intestinal 1b Yes No No No 32 Male 78 Intestinal 1b Yes Yes Yes No 33 Female 68 Intestinal 1b Yes Yes No No 34 Male 71 Intestinal 1b Yes Yes Yes No 35 Female 44 Intestinal 1b Yes Yes Yes No 36 Male 72 Intestinal 1b Yes Yes Yes No 37 Female 81 Intestinal 2 Yes Yes Yes No 38 Female 49 Intestinal 2 Yes Yes No No 39 Male 67 Intestinal 2 No Yes No No 40 Male 58 Intestinal 2 Yes No No No 41 Female 57 Intestinal 2 No Yes Yes No 42 Male 72 Intestinal 2 Yes Yes No No 43 Female 73 Intestinal 2 Yes Yes Yes No 44 Male 88 Intestinal 2 Yes Yes Yes No 45 Male 56 Intestinal 2 Yes Yes No No 46 Female 74 Intestinal 2 Yes Yes Yes No 47 Male 61 Intestinal 2 Yes Yes Yes No 48 Female 75 Intestinal 2 Yes Yes Yes No 49 Male 80 Intestinal 2 Yes Yes Yes No 50 Female 56 Intestinal 2 Yes Yes Yes No 51 Male 65 Intestinal 2 Yes Yes Yes No 52 Male 72 Intestinal 2 Yes Yes No Yes 53 Male 71 Intestinal 2 Yes Yes Yes No 54 Male 59 Intestinal 2 Yes Yes No No 55 Male 80 Intestinal 2 Yes Yes Yes No 56 Female 78 Intestinal 2 Yes No Yes Yes 57 Male 74 Intestinal 2 Yes Yes Yes No 58 Female 83 Intestinal 2 Yes Yes Yes No 59 Male 72 Intestinal 2 Yes Yes Yes No 60 Female 49 Intestinal 2 Yes Yes Yes No 61 Male 72 Intestinal 3a Yes No Yes No 62 Female 55 Intestinal 3a Yes Yes No Yes 63 Male 75 Intestinal 3a Yes Yes Yes No 64 Male 67 Intestinal 3a Yes Yes Yes No 65 Male 76 Intestinal 3a Yes Yes Yes No 66 Male 72 Intestinal 3a Yes Yes Yes No 67 Female 70 Intestinal 3a Yes Yes Yes No 68 Male 63 Intestinal 3a Yes Yes Yes No 69 Male 75 Intestinal 3a Yes Yes Yes No 70 Male 66 Intestinal 3a Yes Yes No No 71 Female 71 Intestinal 3a Yes Yes No No 72 Female 75 Intestinal 3a No Yes Yes No 73 Female 67 Intestinal 3a Yes Yes No No 74 Male 81 Intestinal 3a Yes Yes Yes No 75 Male 66 Intestinal 3a Yes Yes Yes No 76 Male 54 Intestinal 3a Yes Yes Yes No 77 Male 72 Intestinal 3a Yes Yes Yes No 78 Male 76 Intestinal 3a Yes Yes Yes No 79 Male 65 Intestinal 3a Yes No Yes No 80 Female 80 Intestinal 3b Yes No Yes No 81 Male 77 Intestinal 3b Yes Yes No No 82 Male 69 Intestinal 3b Yes Yes Yes No 83 Male 70 Intestinal 3b No Yes No No 84 Female 85 Intestinal 3b Yes Yes Yes No 85 Male 60 Intestinal 3b Yes Yes No No 86 Male 79 Intestinal 3b Yes Yes Yes No 87 Female 68 Intestinal 3b Yes Yes No No 88 Male 78 Mixed 3b Yes Yes Yes No 89 Male 50 Mixed 1a Yes No Yes No 90 Male 90 Mixed 1b Yes Yes Yes No 91 Female 60 Mixed 4 No Yes No No 92 Female 56 Mixed 4 Yes Yes Yes No 93 Female 78 Intestinal 1b No No No No 94 Male 66 Intestinal 2 Yes No Yes No 95 Male 81 Mixed 3a Yes No Yes No 96 Male 68 Intestinal 4 Yes Yes Yes No 97 Female 69 Intestinal 4 Yes No Yes No 98 Male 89 Intestinal 1a Yes Yes Yes Yes 99 Male 79 Intestinal 1a Yes No Yes Yes 100 Male 81 Intestinal 4 Yes No Yes Yes 101 Male 67 Intestinal 4 Yes No No No 102 Male 76 Diffuse 3a Yes Yes Yes Yes 103 Male 62 Diffuse 4 Yes Yes Yes Yes 104 Male 71 Intestinal 1a Yes No Yes Yes 105 Female 78 Diffuse 3b No Yes No No 106 Male 57 Intestinal 2 Yes No No No 107 Female 68 Diffuse 3b Yes Yes Yes No 108 Female 68 Diffuse 4 Yes Yes Yes No 109 Male 58 Diffuse 3a Yes No No No 110 Male 86 Mixed 4 No Yes Yes No 111 Female 56 Diffuse 1a Yes Yes Yes No 112 Male 68 Diffuse 4 Yes Yes No No 113 Female 83 Diffuse 1a Yes Yes Yes No 114 Male 73 Diffuse 2 Yes Yes Yes No 115 Male 79 Diffuse 3b Yes Yes No No 116 Male 58 Diffuse 3a Yes Yes Yes No 117 Male 74 Mixed 4 No Yes No No 118 Male 64 Diffuse 1a Yes No Yes No 119 Male 66 Intestinal 4 Yes No Yes No 120 Female 76 Diffuse 4 Yes Yes Yes No 121 Female 79 Diffuse 2 Yes Yes No No 122 Female 71 Intestinal 4 No Yes No No 123 Female 64 Diffuse 4 Yes Yes Yes No 124 Female 57 Diffuse 3b Yes Yes Yes No 125 Female 60 Diffuse 4 No Yes No No 126 Male 63 Diffuse 1a No Yes Yes No 127 Female 71 Diffuse 3a Yes Yes No No 128 Male 57 Diffuse 1a Yes Yes No No 129 Male 75 Mixed 4 Yes Yes Yes No 130 Male 43 Mixed 4 Yes Yes No No 131 Male 29 Diffuse 3a Yes Yes Yes Yes 132 Male 59 Intestinal 4 Yes Yes Yes Yes 133 Male 63 Diffuse 2 Yes Yes Yes No 134 Male 72 Diffuse 4 No Yes Yes No 135 Male 54 Mixed 2 Yes No No No 136 Male 61 Mixed 3a Yes Yes Yes No 137 Female 58 Mixed 1a Yes Yes Yes No 138 Male 68 Intestinal 4 Yes Yes Yes No 139 Male 69 Intestinal 4 Yes Yes Yes No 140 Male 61 Intestinal 4 Yes No No No 141 Male 75 Intestinal 4 No Yes No No 142 Female 66 Diffuse 3a No No No Yes 143 Male 76 Diffuse 4 No No No No 144 Male 70 Intestinal 4 No Yes No No 145 Female 71 Diffuse 4 Yes Yes Yes No 146 Male 56 Intestinal 4 Yes Yes Yes No 147 Female 69 Mixed 1a Yes Yes Yes No 148 Male 71 Mixed 2 Yes Yes Yes No 149 Female 53 Intestinal 1a Yes No Yes No 150 Male 70 Mixed 4 Yes Yes No No 151 Male 71 Diffuse 1a Yes Yes No No 152 Female 72 Intestinal 4 No Yes No No 153 Male 64 Diffuse 3b Yes Yes No No 154 Female 55 Diffuse 1a Yes Yes Yes No 155 Male 44 Diffuse 4 Yes Yes Yes No 156 Male 77 Intestinal 4 Yes No Yes No 157 Female 75 Diffuse 4 Yes No No No 158 Male 78 Intestinal 4 Yes Yes Yes No 159 Female 68 Intestinal 4 No Yes Yes No 160 Female 69 Mixed 4 Yes Yes Yes Yes 161 Male 46 Intestinal 1b Yes No No No 162 Male 66 Diffuse 3a Yes No Yes No 163 Female 51 Mixed 1b Yes Yes Yes No 164 Male 54 Intestinal 4 No No No No 165 Female 61 Mixed 4 Yes Yes Yes No 166 Male 51 Diffuse 4 No Yes Yes No 167 Male 70 Diffuse 3a Yes Yes Yes No 168 Male 69 Mixed 3a Yes Yes No No 169 Male 73 Diffuse 3a Yes Yes Yes No 170 Male 89 Mixed 4 Yes Yes No No 171 Male 73 Mixed 2 Yes No Yes No 172 Female 69 Mixed 1a Yes No Yes No 173 Male 84 Intestinal 4 No Yes No No 174 Male 75 Intestinal 1b Yes Yes Yes No 175 Female 63 Mixed 3a Yes No No No 176 Male 80 Mixed 4 Yes No Yes No 177 Female 60 Diffuse 3a No Yes No No 178 Male 72 Diffuse 2 Yes Yes Yes No 179 Female 53 Diffuse 4 Yes Yes No No 180 Female 60 Diffuse 4 Yes Yes No No 181 Male 44 Diffuse 4 Yes No No No 182 Female 64 Intestinal 1a Yes No Yes No 183 Male 57 Mixed 1a Yes Yes Yes Yes 184 Male 61 Diffuse 1b Yes Yes Yes No 185 Female 59 Mixed 4 Yes Yes Yes No 186 Female 81 Diffuse 3b Yes Yes Yes Yes 187 Male 78 Diffuse 4 Yes Yes Yes No 188 Male 73 Diffuse 1b Yes No Yes No 189 Male 64 Mixed 3a Yes Yes No No 190 Male 73 Intestinal 4 No Yes Yes Yes 191 Female 76 Intestinal 4 Yes No Yes No 192 Female 72 Diffuse 4 No Yes No No 193 Male 82 Diffuse 1b Yes Yes Yes No 194 Male 55 Diffuse 1a Yes Yes Yes No 195 Male 70 Intestinal 4 Yes Yes Yes No 196 Male 67 Diffuse 1b Yes Yes No No 197 Male 64 Diffuse 4 Yes Yes No No 198 Male 67 Intestinal 4 Yes Yes Yes No 199 Female 68 Diffuse 4 Yes Yes No No 200 Female 62 Diffuse 4 No No No No 201 Female 74 Diffuse 4 Yes Yes Yes No 202 Male 77 Intestinal 4 No Yes Yes No 203 Female 73 Mixed 4 Yes Yes Yes No 204 Male 77 Intestinal 4 Yes Yes Yes No 205 Female 56 Diffuse 1a Yes Yes Yes No 206 Male 54 Diffuse 4 No Yes No No 207 Female 76 Intestinal 1b No Yes No No 208 Male 82 Diffuse 3a No Yes Yes No 209 Male 55 Diffuse 4 Yes No No No 210 Male 73 Diffuse 4 No Yes No No 211 Male 69 Intestinal 4 Yes Yes Yes Yes 212 Female 78 Diffuse 1b Yes No Yes No 213 Male 63 Intestinal 4 Yes Yes No No 214 Female 88 Intestinal 4 Yes Yes No No 215 Male 76 Mixed 3a Yes No No No 216 Female 50 Diffuse 1a Yes Yes Yes No 217 Male 75 Intestinal 4 Yes Yes Yes Yes 218 Male 37 Diffuse 4 No No Yes No 219 Male 64 Intestinal 4 Yes Yes No No 220 Female 85 Diffuse 4 Yes Yes Yes No 221 Female 52 Diffuse 2 Yes Yes No No 222 Female 67 Intestinal 2 Yes No Yes No 223 Male 86 Mixed 1a Yes Yes Yes No 224 Female 71 Diffuse 1a Yes Yes Yes Yes 225 Male 53 Diffuse 3a Yes Yes No No 226 Female 80 Diffuse 3b Yes No Yes No 227 Male 53 Diffuse 4 No Yes No No 228 Male 55 Diffuse 3b Yes No Yes No 229 Male 43 Diffuse 4 Yes Yes Yes No 230 Female 81 Intestinal 4 No Yes No No 231 Male 79 Intestinal 2 Yes No Yes No 232 Female 38 Intestinal 4 Yes Yes Yes No 233 Male 78 Mixed 4 Yes Yes No No 234 Female 81 Intestinal 1b Yes No Yes Yes 235 Male 78 Intestinal 1b Yes No Yes No 236 Male 48 Diffuse 4 Yes Yes No No
TABLE-US-00009 TABLE 3 Clinical information of control subjects H Intestinal S/N Sex Age Gastritis Pylori Metaplasia Atrophy 1 Female 55 Yes No Yes No 2 Female 71 Yes Yes Yes No 3 Male 60 Yes Yes Yes Yes 4 Female 60 Yes No Yes Yes 5 Male 70 Yes Yes Yes Yes 6 Male 55 Yes Yes Yes Yes 7 Male 51 Yes Yes Yes Yes 8 Female 56 Yes Yes Yes Yes 9 Male 64 Yes Yes Yes Yes 10 Male 72 Yes Yes No No 11 Female 60 Yes Yes Yes No 12 Female 50 Yes Yes Yes Yes 13 Male 70 Yes Yes Yes No 14 Female 55 Yes Yes Yes Yes 15 Female 69 Yes Yes Yes Yes 16 Male 71 Yes Yes Yes Yes 17 Female 72 Yes Yes Yes Yes 18 Male 60 Yes No Yes No 19 Female 67 Yes Yes Yes Yes 20 Male 62 Yes Yes No No 21 Male 60 Yes Yes No No 22 Male 70 Yes Yes Yes Yes 23 Male 71 Yes No No No 24 Female 50 Yes Yes Yes Yes 25 Male 71 Yes Yes Yes Yes 26 Male 50 Yes Yes No No 27 Male 64 Yes Yes Yes Yes 28 Male 50 Yes Yes Yes Yes 29 Female 50 Yes Yes Yes No 30 Male 68 Yes Yes No No 31 Female 73 Yes Yes No No 32 Male 68 Yes Yes Yes Yes 33 Female 63 Yes No No No 34 Male 69 Yes Yes Yes Yes 35 Female 50 Yes No No No 36 Male 70 Yes Yes Yes Yes 37 Male 64 Yes Yes Yes Yes 38 Male 72 Yes Yes Yes Yes 39 Female 65 Yes No Yes Yes 40 Female 55 Yes Yes No No 41 Male 63 Yes Yes Yes Yes 42 Male 65 Yes Yes Yes Yes 43 Male 66 Yes Yes Yes Yes 44 Male 74 Yes Yes Yes No 45 Male 62 Yes No Yes Yes 46 Female 63 Yes Yes Yes No 47 Female 65 Yes No No No 48 Male 60 Yes Yes Yes No 49 Male 50 Yes No No No 50 Female 50 Yes No No No 51 Male 50 Yes Yes Yes Yes 52 Female 50 Yes Yes Yes Yes 53 Male 69 Yes Yes Yes Yes 54 Female 55 Yes Yes Yes Yes 55 Female 50 Yes Yes Yes Yes 56 Female 50 Yes No Yes Yes 57 Male 74 Yes No No No 58 Male 72 Yes Yes Yes Yes 59 Female 50 Yes Yes Yes Yes 60 Male 82 Yes Yes Yes Yes 61 Male 69 Yes No Yes Yes 62 Male 68 Yes Yes Yes Yes 63 Male 61 Yes Yes Yes Yes 64 Male 68 Yes No No No 65 Male 50 Yes Yes Yes Yes 66 Female 61 Yes Yes Yes Yes 67 Male 67 Yes Yes Yes No 68 Male 65 Yes Yes Yes Yes 69 Female 62 Yes Yes Yes Yes 70 Male 77 Yes No Yes Yes 71 Male 62 Yes Yes Yes Yes 72 Male 63 Yes No No No 73 Male 64 Yes Yes Yes Yes 74 Male 50 Yes Yes No No 75 Male 62 Yes Yes Yes Yes 76 Female 60 Yes Yes No No 77 Male 63 Yes Yes Yes Yes 78 Female 55 No No No No 79 Male 66 Yes Yes Yes Yes 80 Female 75 Yes Yes Yes Yes 81 Male 71 Yes Yes Yes Yes 82 Male 61 Yes No No No 83 Female 54 Yes No No No 84 Female 50 Yes No No No 85 Male 63 Yes Yes Yes Yes 86 Male 66 Yes Yes Yes Yes 87 Female 60 Yes No Yes Yes 88 Male 65 Yes Yes Yes Yes 89 Female 82 Yes Yes Yes No 90 Male 63 Yes No No No 91 Male 57 Yes No No No 92 Male 65 Yes Yes No Yes 93 Female 62 Yes Yes No No 94 Male 79 Yes Yes Yes No 95 Male 51 Yes Yes Yes Yes 96 Male 52 Yes No No No 97 Male 52 Yes Yes Yes Yes 98 Male 52 Yes Yes Yes Yes 99 Male 51 Yes No No No 100 Male 53 No No No No 101 Male 60 Yes No Yes No 102 Female 70 Yes No No No 103 Female 52 Yes No No No 104 Male 55 Yes No No No 105 Male 66 Yes No No No 106 Female 50 Yes Yes No No 107 Male 65 Yes Yes Yes Yes 108 Male 55 Yes No No No 109 Female 71 Yes Yes Yes Yes 110 Female 42 Yes Yes Yes Yes 111 Male 50 Yes No Yes No 112 Male 56 Yes No No No 113 Male 71 Yes No No Yes 114 Male 67 Yes Yes Yes Yes 115 Female 63 Yes No No No 116 Male 76 Yes Yes Yes Yes 117 Female 50 Yes Yes No No 118 Male 56 No No No No 119 Male 52 Yes No No No 120 Male 40 Yes Yes Yes Yes 121 Female 69 Yes No No No 122 Male 68 Yes Yes Yes Yes 123 Female 56 Yes No No No 124 Female 51 Yes No No No 125 Male 63 Yes Yes Yes Yes 126 Male 57 Yes No No No 127 Male 48 Yes Yes Yes Yes 128 Female 51 Yes Yes No No 129 Male 60 Yes No No No 130 Female 67 Yes Yes Yes Yes 131 Female 52 Yes No No No 132 Male 63 Yes Yes Yes Yes 133 Female 57 Yes Yes No No 134 Male 63 Yes Yes Yes Yes 135 Female 50 Yes No Yes No 136 Female 60 Yes No No No 137 Female 62 Yes No No No 138 Male 70 Yes Yes Yes Yes 139 Female 51 Yes No No No 140 Male 64 Yes Yes Yes Yes 141 Female 59 Yes No No No 142 Male 68 Yes Yes Yes Yes 143 Male 65 Yes No No No 144 Male 69 Yes No No No 145 Male 66 Yes Yes Yes Yes 146 Male 81 Yes No No No 147 Male 73 Yes Yes Yes Yes 148 Male 67 Yes No No No 149 Female 61 Yes No Yes No 150 Female 53 Yes No No No 151 Male 50 Yes No No No 152 Male 67 Yes Yes Yes Yes 153 Male 52 Yes Yes Yes Yes 154 Male 52 Yes No No No 155 Male 60 Yes No No No 156 Male 62 Yes No No No 157 Male 53 Yes No No No 158 Male 51 Yes Yes Yes Yes 159 Female 57 No No No No 160 Female 54 Yes No No No 161 Female 77 Yes Yes Yes Yes 162 Female 54 Yes No No No 163 Female 51 Yes Yes No No 164 Female 56 Yes No No No 165 Male 68 Yes Yes Yes No 166 Female 52 Yes No No No 167 Female 73 Yes Yes Yes Yes 168 Male 50 Yes Yes Yes Yes 169 Male 63 Yes Yes Yes Yes 170 Male 71 Yes Yes Yes Yes 171 Female 52 Yes No No No 172 Male 76 Yes No No No 173 Female 54 Yes No No No 174 Male 56 Yes No No No 175 Male 62 Yes No No No 176 Male 64 Yes No No No 177 Female 51 Yes No No No 178 Male 76 Yes Yes Yes Yes 179 Female 53 No No No Yes 180 Male 61 Yes No No No 181 Female 56 No No No No 182 Male 56 Yes No No No 183 Male 60 Yes No No No 184 Male 54 Yes Yes No No 185 Male 67 Yes No No No 186 Female 58 No No No No 187 Male 56 Yes No No No 188 Male 67 Yes No No No 189 Female 61 Yes No No No 190 Female 60 Yes Yes No No 191 Female 52 Yes No No No 192 Female 55 Yes No No No 193 Male 69 Yes No Yes No 194 Male 69 Yes Yes Yes Yes 195 Female 51 Yes Yes No No 196 Male 52 Yes Yes No Yes 197 Male 54 Yes No No No 198 Male 66 Yes Yes Yes Yes 199 Female 50 Yes Yes No No 200 Female 58 Yes No No No 201 Female 59 Yes Yes Yes No 202 Female 65 Yes No No No 203 Female 73 Yes Yes Yes Yes 204 Male 67 Yes Yes Yes Yes 205 Male 66 Yes Yes Yes Yes 206 Male 78 Yes Yes No No 207 Female 69 Yes Yes No No 208 Male 57 Yes No No No 209 Male 66 Yes Yes Yes Yes 210 Male 51 Yes No No No 211 Male 67 Yes Yes Yes Yes 212 Female 77 Yes Yes Yes No 213 Male 66 Yes No No No 214 Male 74 Yes Yes Yes Yes 215 Male 71 Yes Yes Yes Yes 216 Male 65 Yes Yes Yes Yes 217 Male 68 Yes Yes Yes Yes 218 Female 61 Yes No No No 219 Male 54 Yes Yes No No 220 Female 55 Yes No No No 221 Female 61 Yes No No No 222 Male 53 Yes No No No 223 Male 55 Yes No No No 224 Male 51 Yes Yes Yes Yes 225 Male 51 Yes No No No 226 Male 50 Yes Yes Yes Yes 227 Male 64 Yes No Yes No 228 Female 74 Yes No No No 229 Male 52 Yes No No No 230 Male 63 Yes No No No 231 Male 51 Yes Yes No No 232 Male 67 Yes Yes Yes Yes 233 Male 68 Yes Yes Yes Yes 234 Male 74 Yes Yes No No 235 Male 63 Yes No No No 236 Male 61 Yes No No No 237 Female 69 Yes No No No
TABLE-US-00010 TABLE 5 Characteristics of the studied subjects Healthy control Gastric Cancer Total Number 237 236 Stage -- Stage 1 = 71 (30.1%) Stage 2 = 36 (15.3%) Stage 3 = 54 (22.9%) Stage 4 = 75 (31.8%) Subtype -- Intestinal = 134 (56.8%) Diffuse = 70 (29.7%) Mixed = 32 (13.6%) Sex (Male) 150 (63.6%) 148 (62.7%) Age 61.2 .+-. 8.4 68.0 .+-. 10.9 Gastritis 230 (97.0%) 200 (84.7%) H Pylori 132 (55.7%) 186 (78.8%) Intestinal metaplasia 121 (51.1%) 161 (68.2%) Atrophy 104 (43.9%) 21 (8.9%)
It is known that circulating cell-free miRNAs in the blood may be originated from different tissue sources. As a result, the change in the levels of a miRNA caused by the presence of solid gastric tumor can be complicated by the presence of the same miRNA from other sources. Thus, determining the differences in the level of expressions of miRNAs found in cancers and the control group will be challenging and predictably less distinct. In addition, because of the dilution effect of the large volume of blood (5 L in adult human), it is known that most of the cell-free miRNAs are of exceptionally low abundance in blood. Therefore, the accurate measurement of multiple miRNA targets from limited volume of serum/plasma samples is critical and presents a highly significant challenge. To best facilitate the discovery of significantly altered expressions of miRNAs and the identification of multivariate miRNA biomarker panels for the diagnosis of gastric cancer, instead of using low sensitivity or semi-quantitative screening methods (microarray, sequencing), the present Experimental study chose to perform qPCR-based assays with a workflow as summarized in FIG. 2.
In the workflow used in the present Experimental section, all the reactions were performed at least twice in a single-plex manner for miRNA targets and at least four times for synthetic RNA `spike-in` controls. To ensure the accuracy of the results in such high-throughput qPCR studies, the present study was designed and established, after much iteration, a robust workflow for the discovery of circulating biomarkers (see "Method" section and FIG. 2). In this workflow, various artificially designed `spike-in` controls were used to monitor and correct for technical variations in isolation, reverse transcription, augmentation and the qPCR processes. All spike-in controls were non-natural synthetic miRNAs mimics (small single-stranded RNA with length range from 22-24 bases), which were designed in silico to have exceptionally low similarity in sequence to all known human miRNAs, thus minimizing cross-hybridization to the primers used in the assays. In addition, the miRNA assays were deliberately divided into a number of multiplex groups in silico to minimize non-specific amplifications and primer-primer interactions. Synthetic miRNAs were used to construct standard curves for the interpolation of absolute copy numbers in all the measurements, thus further correcting for technical variations. Predictably, with this workflow with multiple levels of controls, low levels of expression of miRNAs in circulation could be detected reliably and reproducibly.
MiRNA Biomarkers
A step towards identifying biomarkers is to compare the expression levels of each miRNA in normal (control) and disease state. The expression levels of 578 (miRBase Version 10 release) human miRNAs in all 472 serum samples (gastric cancer and normal/control) were quantitatively measured using the robust workflow and highly sensitive qPCR assays (MiRXES, Singapore).
In the present experimental design, 200 .mu.L of serum was extracted and the total RNA was reversed transcribed and augmented by touch-down amplification to increase the amount of cDNA but yet do not change the representation of the miRNA expression levels (FIG. 2). The augmented cDNA was then diluted for qPCR measurement. A simple calculation based on the effect of dilution revealed that an miRNA, which is expressed at levels .ltoreq.500 copies/ml in the serum will be quantified at levels close to the detection limit of the single-plex qPCR assay (.ltoreq.10 copies/well). At such a concentration, measurements will be a significant challenge due to the technical limitations (errors in pipetting and qPCR). Thus, miRNAs expressed at concentration of .ltoreq.500 copies/ml were excluded from analyses and considered undetectable in the present studies.
About 33% of the total miRNAs assayed (578 total miRNA assayed) was found to be highly expressed. These 191 miRNAs were reliably detected in more than 90% of the serum samples (expression levels .gtoreq.500 copies/ml; Table 4) and this was many more than previously reported using other technologies, highlighting the importance of the use of a robust experimental design and well-controlled workflow.
TABLE-US-00011 TABLE 4 Sequence of 191 reliable detected mature miRNA SEQ Name Sequence ID NO: hsa-miR-99b-5p CACCCGUAGAACCGACCUUGCG 1 hsa-miR-486-5p UCCUGUACUGAGCUGCCCCGAG 2 hsa-miR-23b-3p AUCACAUUGCCAGGGAUUACC 3 hsa-miR-140-3p UACCACAGGGUAGAACCACGG 4 hsa-miR-101-3p UACAGUACUGUGAUAACUGAA 5 hsa-miR-107 AGCAGCAUUGUACAGGGCUAUCA 6 hsa-miR-130b-3p CAGUGCAAUGAUGAAAGGGCAU 7 hsa-miR-369-3p AAUAAUACAUGGUUGAUCUUU 8 hsa-miR-133a UUUGGUCCCCUUCAACCAGCUG 9 hsa-miR-222-3p AGCUACAUCUGGCUACUGGGU 10 hsa-miR-320d AAAAGCUGGGUUGAGAGGA 11 hsa-miR-30a-5p UGUAAACAUCCUCGACUGGAAG 12 hsa-miR-181a-5p AACAUUCAACGCUGUCGGUGAGU 13 hsa-miR-140-5p CAGUGGUUUUACCCUAUGGUAG 14 hsa-miR-425-3p AUCGGGAAUGUCGUGUCCGCCC 15 hsa-miR-106b-3p CCGCACUGUGGGUACUUGCUGC 16 hsa-miR-192-5p CUGACCUAUGAAUUGACAGCC 17 hsa-miR-10a-3p CAAAUUCGUAUCUAGGGGAAUA 18 hsa-miR-17-5p CAAAGUGCUUACAGUGCAGGUAG 19 hsa-miR-590-5p GAGCUUAUUCAUAAAAGUGCAG 20 hsa-miR-1299 UUCUGGAAUUCUGUGUGAGGGA 21 hsa-miR-365a-3p UAAUGCCCCUAAAAAUCCUUAU 22 hsa-miR-500a-5p UAAUCCUUGCUACCUGGGUGAGA 23 hsa-miR-32-5p UAUUGCACAUUACUAAGUUGCA 24 hsa-miR-340-5p UUAUAAAGCAAUGAGACUGAUU 25 hsa-miR-374b-5p AUAUAAUACAACCUGCUAAGUG 26 hsa-miR-27a-3p UUCACAGUGGCUAAGUUCCGC 27 hsa-miR-627 GUGAGUCUCUAAGAAAAGAGGA 28 hsa-miR-539-5p GGAGAAAUUAUCCUUGGUGUGU 29 hsa-miR-342-5p AGGGGUGCUAUCUGUGAUUGA 30 hsa-miR-484 UCAGGCUCAGUCCCCUCCCGAU 31 hsa-miR-132-3p UAACAGUCUACAGCCAUGGUCG 32 hsa-miR-379-5p UGGUAGACUAUGGAACGUAGG 33 hsa-miR-125a-3p ACAGGUGAGGUUCUUGGGAGCC 34 hsa-miR-29a-3p UAGCACCAUCUGAAAUCGGUUA 35 hsa-miR-363-3p AAUUGCACGGUAUCCAUCUGUA 36 hsa-miR-376b AUCAUAGAGGAAAAUCCAUGUU 37 hsa-miR-589-5p UGAGAACCACGUCUGCUCUGAG 38 hsa-miR-432-5p UCUUGGAGUAGGUCAUUGGGUGG 39 hsa-miR-1280 UCCCACCGCUGCCACCC 40 hsa-miR-103a-3p AGCAGCAUUGUACAGGGCUAUGA 41 hsa-miR-122-5p UGGAGUGUGACAAUGGUGUUUG 42 hsa-miR-93-5p CAAAGUGCUGUUCGUGCAGGUAG 43 hsa-miR-25-3p CAUUGCACUUGUCUCGGUCUGA 44 hsa-miR-9-5p UCUUUGGUUAUCUAGCUGUAUGA 45 hsa-miR-579 UUCAUUUGGUAUAAACCGCGAUU 46 hsa-miR-136-3p CAUCAUCGUCUCAAAUGAGUCU 47 hsa-miR-146a-5p UGAGAACUGAAUUCCAUGGGUU 48 hsa-miR-144-5p GGAUAUCAUCAUAUACUGUAAG 49 hsa-miR-15a-5p UAGCAGCACAUAAUGGUUUGUG 50 hsa-miR-150-5p UCUCCCAACCCUUGUACCAGUG 51 hsa-miR-152 UCAGUGCAUGACAGAACUUGG 52 hsa-miR-29c-5p UGACCGAUUUCUCCUGGUGUUC 53 hsa-miR-320c AAAAGCUGGGUUGAGAGGGU 54 hsa-miR-127-3p UCGGAUCCGUCUGAGCUUGGCU 55 hsa-miR-331-5p CUAGGUAUGGUCCCAGGGAUCC 56 hsa-miR-378a-3p ACUGGACUUGGAGUCAGAAGG 57 hsa-miR-374a-5p UUAUAAUACAACCUGAUAAGUG 58 hsa-miR-409-3p GAAUGUUGCUCGGUGAACCCCU 59 hsa-miR-411-3p UAUGUAACACGGUCCACUAACC 60 hsa-miR-505-3p CGUCAACACUUGCUGGUUUCCU 61 hsa-miR-628-5p AUGCUGACAUAUUUACUAGAGG 62 hsa-miR-629-3p GUUCUCCCAACGUAAGCCCAGC 63 hsa-miR-4732-3p GCCCUGACCUGUCCUGUUCUG 64 hsa-miR-501-5p AAUCCUUUGUCCCUGGGUGAGA 65 hsa-miR-616-5p ACUCAAAACCCUUCAGUGACUU 66 hsa-miR-454-3p UAGUGCAAUAUUGCUUAUAGGGU 67 hsa-miR-485-3p GUCAUACACGGCUCUCCUCUCU 68 hsa-miR-133b UUUGGUCCCCUUCAACCAGCUA 69 hsa-miR-186-5p CAAAGAAUUCUCCUUUUGGGCU 70 hsa-miR-20b-5p CAAAGUGCUCAUAGUGCAGGUAG 71 hsa-miR-30d-5p UGUAAACAUCCCCGACUGGAAG 72 hsa-miR-375 UUUGUUCGUUCGGCUCGCGUGA 73 hsa-miR-16-5p UAGCAGCACGUAAAUAUUGGCG 74 hsa-miR-106b-5p UAAAGUGCUGACAGUGCAGAU 75 hsa-miR-139-5p UCUACAGUGCACGUGUCUCCAG 76 hsa-miR-141-3p UAACACUGUCUGGUAAAGAUGG 77 hsa-miR-185-5p UGGAGAGAAAGGCAGUUCCUGA 78 hsa-miR-181b-5p AACAUUCAUUGCUGUCGGUGGGU 79 hsa-miR-199a-3p ACAGUAGUCUGCACAUUGGUUA 80 hsa-miR-19b-3p UGUGCAAAUCCAUGCAAAACUGA 81 hsa-miR-148b-3p UCAGUGCAUCACAGAACUUUGU 82 hsa-miR-29b-3p UAGCACCAUUUGAAAUCAGUGUU 83 hsa-miR-338-5p AACAAUAUCCUGGUGCUGAGUG 84 hsa-miR-584-5p UUAUGGUUUGCCUGGGACUGAG 85 hsa-miR-382-5p GAAGUUGUUCGUGGUGGAUUCG 86 hsa-miR-151a-3p CUAGACUGAAGCUCCUUGAGG 87 hsa-miR-1290 UGGAUUUUUGGAUCAGGGA 88 hsa-miR-200b-3p UAAUACUGCCUGGUAAUGAUGA 89 hsa-miR-411-5p UAGUAGACCGUAUAGCGUACG 90 hsa-miR-126-5p CAUUAUUACUUUUGGUACGCG 91 hsa-miR-101-5p CAGUUAUCACAGUGCUGAUGCU 92 hsa-miR-125b-5p UCCCUGAGACCCUAACUUGUGA 93 hsa-miR-362-5p AAUCCUUGGAACCUAGGUGUGAGU 94 hsa-miR-197-3p UUCACCACCUUCUCCACCCAGC 95 hsa-miR-221-3p AGCUACAUUGUCUGCUGGGUUUC 96 hsa-miR-501-3p AAUGCACCCGGGCAAGGAUUCU 97 hsa-miR-671-3p UCCGGUUCUCAGGGCUCCACC 98 hsa-miR-181a-2-3p ACCACUGACCGUUGACUGUACC 99 hsa-miR-9-3p AUAAAGCUAGAUAACCGAAAGU 100 hsa-miR-452-5p AACUGUUUGCAGAGGAAACUGA 101 hsa-miR-598 UACGUCAUCGUUGUCAUCGUCA 102 hsa-miR-320b AAAAGCUGGGUUGAGAGGGCAA 103 hsa-miR-328 CUGGCCCUCUCUGCCCUUCCGU 104 hsa-miR-650 AGGAGGCAGCGCUCUCAGGAC 105 hsa-miR-134 UGUGACUGGUUGACCAGAGGGG 106 hsa-miR-130a-3p CAGUGCAAUGUUAAAAGGGCAU 107 hsa-miR-21-5p UAGCUUAUCAGACUGAUGUUGA 108 hsa-miR-424-5p CAGCAGCAAUUCAUGUUUUGAA 109 hsa-miR-99a-5p AACCCGUAGAUCCGAUCUUGUG 110 hsa-miR-18a-3p ACUGCCCUAAGUGCUCCUUCUGG 111 hsa-miR-195-5p UAGCAGCACAGAAAUAUUGGC 112 hsa-miR-205-5p UCCUUCAUUCCACCGGAGUCUG 113 hsa-miR-206 UGGAAUGUAAGGAAGUGUGUGG 114 hsa-miR-500a-3p AUGCACCUGGGCAAGGAUUCUG 115 hsa-miR-18b-5p UAAGGUGCAUCUAGUGCAGUUAG 116 hsa-miR-181d AACAUUCAUUGUUGUCGGUGGGU 117 hsa-miR-339-3p UGAGCGCCUCGACGACAGAGCCG 118 hsa-miR-93-3p ACUGCUGAGCUAGCACUUCCCG 119 hsa-miR-10b-5p UACCCUGUAGAACCGAAUUUGUG 120 hsa-miR-497-5p CAGCAGCACACUGUGGUUUGU 121 hsa-miR-27b-3p UUCACAGUGGCUAAGUUCUGC 122
hsa-miR-128 UCACAGUGAACCGGUCUCUUU 123 hsa-miR-183-5p UAUGGCACUGGUAGAAUUCACU 124 hsa-miR-22-3p AAGCUGCCAGUUGAAGAACUGU 125 hsa-miR-26a-5p UUCAAGUAAUCCAGGAUAGGCU 126 hsa-miR-223-3p UGUCAGUUUGUCAAAUACCCCA 127 hsa-miR-629-5p UGGGUUUACGUUGGGAGAACU 128 hsa-miR-92a-3p UAUUGCACUUGUCCCGGCCUGU 129 hsa-miR-29b-2-5p CUGGUUUCACAUGGUGGCUUAG 130 hsa-miR-21-3p CAACACCAGUCGAUGGGCUGU 131 hsa-miR-199a-5p CCCAGUGUUCAGACUACCUGUUC 132 hsa-miR-148a-3p UCAGUGCACUACAGAACUUUGU 133 hsa-miR-193a-5p UGGGUCUUUGCGGGCGAGAUGA 134 hsa-miR-27a-5p AGGGCUUAGCUGCUUGUGAGCA 135 hsa-miR-200c-3p UAAUACUGCCGGGUAAUGAUGGA 136 hsa-miR-20a-5p UAAAGUGCUUAUAGUGCAGGUAG 137 hsa-miR-194-5p UGUAACAGCAACUCCAUGUGGA 138 hsa-miR-532-3p CCUCCCACACCCAAGGCUUGCA 139 hsa-miR-19a-3p UGUGCAAAUCUAUGCAAAACUGA 140 hsa-miR-142-5p CAUAAAGUAGAAAGCACUACU 141 hsa-miR-144-3p UACAGUAUAGAUGAUGUACU 142 hsa-miR-145-5p GUCCAGUUUUCCCAGGAAUCCCU 143 hsa-miR-10a-5p UACCCUGUAGAUCCGAAUUUGUG 144 hsa-miR-23a-3p AUCACAUUGCCAGGGAUUUCC 145 hsa-miR-23a-5p GGGGUUCCUGGGGAUGGGAUUU 146 hsa-miR-15b-3p CGAAUCAUUAUUUGCUGCUCUA 147 hsa-miR-301a-3p CAGUGCAAUAGUAUUGUCAAAGC 148 hsa-miR-660-5p UACCCAUUGCAUAUCGGAGUUG 149 hsa-miR-30b-5p UGUAAACAUCCUACACUCAGCU 150 hsa-miR-30e-5p UGUAAACAUCCUUGACUGGAAG 151 hsa-miR-550a-5p AGUGCCUGAGGGAGUAAGAGCCC 152 hsa-miR-425-5p AAUGACACGAUCACUCCCGUUGA 153 hsa-miR-4306 UGGAGAGAAAGGCAGUA 154 hsa-miR-532-5p CAUGCCUUGAGUGUAGGACCGU 155 hsa-miR-335-5p UCAAGAGCAAUAACGAAAAAUGU 156 hsa-miR-483-5p AAGACGGGAGGAAAGAAGGGAG 157 hsa-miR-1226-3p UCACCAGCCCUGUGUUCCCUAG 158 hsa-miR-431-5p UGUCUUGCAGGCCGUCAUGCA 159 hsa-miR-324-5p CGCAUCCCCUAGGGCAUUGGUGU 160 hsa-miR-487b AAUCGUACAGGGUCAUCCACUU 161 hsa-miR-451a AAACCGUUACCAUUACUGAGUU 162 hsa-miR-493-5p UUGUACAUGGUAGGCUUUCAUU 163 hsa-miR-136-5p ACUCCAUUUGUUUUGAUGAUGGA 164 hsa-miR-23c AUCACAUUGCCAGUGAUUACCC 165 hsa-miR-95 UUCAACGGGUAUUUAUUGAGCA 166 hsa-miR-423-5p UGAGGGGCAGAGAGCGAGACUUU 167 hsa-miR-320e AAAGCUGGGUUGAGAAGG 168 hsa-miR-224-5p CAAGUCACUAGUGGUUCCGUU 169 hsa-miR-28-3p CACUAGAUUGUGAGCUCCUGGA 170 hsa-miR-29c-3p UAGCACCAUUUGAAAUCGGUUA 171 hsa-miR-326 CCUCUGGGCCCUUCCUCCAG 172 hsa-miR-596 AAGCCUGCCCGGCUCCUCGGG 173 hsa-miR-885-5p UCCAUUACACUACCCUGCCUCU 174 hsa-miR-146b-5p UGAGAACUGAAUUCCAUAGGCU 175 hsa-miR-34a-5p UGGCAGUGUCUUAGCUGGUUGU 176 hsa-miR-330-3p GCAAAGCACACGGCCUGCAGAGA 177 hsa-miR-154-5p UAGGUUAUCCGUGUUGCCUUCG 178 hsa-miR-191-5p CAACGGAAUCCCAAAAGCAGCUG 179 hsa-miR-193b-3p AACUGGCCCUCAAAGUCCCGCU 180 hsa-miR-301b CAGUGCAAUGAUAUUGUCAAAGC 181 hsa-miR-30e-3p CUUUCAGUCGGAUGUUUACAGC 182 hsa-miR-320a AAAAGCUGGGUUGAGAGGGCGA 183 hsa-miR-199b-3p ACAGUAGUCUGCACAUUGGUUA 184 hsa-miR-502-3p AAUGCACCUGGGCAAGGAUUCA 185 hsa-miR-450a-5p UUUUGCGAUGUGUUCCUAAUAU 186 hsa-miR-495 AAACAAACAUGGUGCACUUCUU 187 hsa-miR-126-3p UCGUACCGUGAGUAAUAAUGCG 188 hsa-miR-15b-5p UAGCAGCACAUCAUGGUUUACA 189 hsa-miR-339-5p UCCCUGUCCUCCAGGAGCUCACG 190 hsa-miR-337-5p GAACGGCUUCAUACAGGAGUU 191
A heat-map was then constructed to represent the expression levels of all detected serum miRNAs (191 detected miRNAs, FIG. 3). Although various subgroups of miRNAs were clustered together, there did not appear to be clear distinction between the cancer and control groups by unsupervised hierarchical clustering based on total number of detected miRNAs. Thus, without any feature selection, the overall miRNA profiles for both groups appeared similar.
The expressions of the 191 serum miRNAs were then compared A] Between normal/control and gastric cancer (regardless of stage or subtypes), B] Between the various stages of the disease (stage 1-4), and C] Between normal/control and the various stages of the disease.
Significance in differential expressions between two groups were calculated based on the t-test (p-value<0.01) corrected for false discovery rate (FDR) estimation using Bonferroni-type multiple comparison procedures as known in the art.
A] Identification of miRNAs Differentially Expressed in Normal/Control and Gastric Cancer (Regardless of Stage or Subtypes)
Samples from patients clinically confirmed to have either diffuse, intestinal or mixed type of gastric cancers were grouped together and compared to samples from normal/control donors. A pool of 75 miRNAs that showed significant differential expression between control and cancer groups was identified (p-value<0.01; Table 6). Unlike other reports where most of the expression of the putative biomarkers was found to be higher in gastric cancer subjects (Table 1), the present study demonstrated that 51 miRNAs were up-regulated in cancer subjects while 24 were down-regulated (Table 6). Thus, the present experimental design identified of more regulated biomarkers.
TABLE-US-00012 TABLE 1 Summary of serum/plasma microRNA biomarkers known in the art for being correlated to gastric cancer Up regulated Down regulated Method Samples miR-199a-3p -- RT- Plasma/80GC/70C qPCR -- miR-195-5p RT- Serum/20GC/190C qPCR miR-106b, miR- -- RT- Plasma/90GC/90C 20a, miR-221 qPCR miR-181c -- RT- Plasma/30GC/60C qPCR miR-199a-3p, -- RT- Plasma/180GC/100C miR-151-5p qPCR miR-221, miR- -- RT- Serum/82GC/82C 744, miR-376c, qPCR miR-191, miR- 27a, let-7e, miR-27b, and miR-222 miR-223, miR-21 miR-218 RT- Plasma/60GC/60C qPCR miR-200c -- RT- whole blood/52GC/15C qPCR -- miR-375 RT- Serum qPCR miR-370 -- RT- Plasma/33GC/33C qPCR miR-17-5p, miR- let-7a RT- Plasma/69GC/30C 21, miR-106a, qPCR miR-106b miR-1, miR-20a, -- RT- Serum/142GC/105C miR-27a, miR- qPCR 34a, miR-423-5p miR-187*, miR- -- RT- Serum/40GC/41C 371-5p, miR-378 qPCR
TABLE-US-00013 TABLE 6 MiRNAs differentially expressed between normal/control and gastric cancer P-value, FDR miRNA name AUC P-value correction Fold change Up-regulated hsa-miR-101-3p 0.61 1.80E-05 9.50E-05 1.27 hsa-miR-106b-3p 0.66 3.70E-09 4.10E-08 1.13 hsa-miR-106b-5p 0.61 5.10E-04 1.70E-03 1.21 hsa-miR-128 0.62 1.40E-06 8.80E-06 1.16 hsa-miR-1280 0.66 3.10E-09 3.90E-08 1.38 hsa-miR-140-3p 0.62 6.40E-06 3.50E-05 1.2 hsa-miR-140-5p 0.67 6.20E-10 1.20E-08 1.24 hsa-miR-142-5p 0.71 1.90E-14 3.70E-12 1.31 hsa-miR-148a-3p 0.67 2.20E-10 4.80E-09 1.32 hsa-miR-15b-3p 0.62 6.20E-06 3.50E-05 1.32 hsa-miR-17-5p 0.63 1.00E-05 5.50E-05 1.24 hsa-miR-183-5p 0.64 8.80E-07 6.20E-06 1.53 hsa-miR-186-5p 0.59 1.40E-03 3.70E-03 1.11 hsa-miR-18b-5p 0.64 1.50E-07 1.20E-06 1.38 hsa-miR-197-3p 0.68 8.10E-13 5.10E-11 1.32 hsa-miR-19a-3p 0.63 4.90E-07 3.60E-06 1.29 hsa-miR-19b-3p 0.59 1.10E-03 3.00E-03 1.18 hsa-miR-20a-5p 0.65 1.20E-07 1.10E-06 1.35 hsa-miR-20b-5p 0.60 2.90E-04 9.90E-04 1.3 hsa-miR-21-3p 0.60 7.90E-05 3.20E-04 1.13 hsa-miR-21-5p 0.63 2.60E-08 2.80E-07 1.23 hsa-miR-223-3p 0.66 7.00E-10 1.20E-08 1.36 hsa-miR-23a-5p 0.64 1.00E-07 9.20E-07 1.31 hsa-miR-25-3p 0.62 3.40E-05 1.60E-04 1.26 hsa-miR-27a-5p 0.69 1.00E-13 1.00E-11 1.76 hsa-miR-29a-3p 0.61 6.00E-05 2.60E-04 1.17 hsa-miR-29b-2-5p 0.59 4.70E-05 2.10E-04 1.16 hsa-miR-29b-3p 0.61 7.20E-05 3.00E-04 1.18 hsa-miR-29c-3p 0.65 2.00E-09 2.90E-08 1.23 hsa-miR-29c-5p 0.63 1.40E-06 8.80E-06 1.15 hsa-miR-338-5p 0.57 3.70E-03 9.40E-03 1.29 hsa-miR-423-5p 0.60 7.20E-05 3.00E-04 1.18 hsa-miR-424-5p 0.68 7.00E-11 1.90E-09 1.41 hsa-miR-425-3p 0.57 2.20E-03 5.70E-03 1.05 hsa-miR-4306 0.63 1.20E-06 8.00E-06 1.35 hsa-miR-450a-5p 0.67 2.10E-10 4.80E-09 1.53 hsa-miR-486-5p 0.61 9.60E-05 3.70E-04 1.32 hsa-miR-500a-3p 0.60 1.10E-04 4.20E-04 1.2 hsa-miR-501-5p 0.60 9.60E-04 2.80E-03 1.24 hsa-miR-532-3p 0.60 1.90E-04 7.00E-04 1.15 hsa-miR-550a-5p 0.63 9.00E-07 6.20E-06 1.38 hsa-miR-579 0.62 2.20E-05 1.10E-04 1.3 hsa-miR-589-5p 0.63 1.70E-06 1.00E-05 1.18 hsa-miR-590-5p 0.69 3.00E-12 1.40E-10 1.23 hsa-miR-598 0.67 7.10E-12 2.70E-10 1.27 hsa-miR-616-5p 0.65 3.40E-09 4.10E-08 1.35 hsa-miR-627 0.58 7.30E-04 2.30E-03 1.19 hsa-miR-629-3p 0.67 6.10E-11 1.90E-09 1.38 hsa-miR-629-5p 0.63 1.40E-04 5.10E-04 1.5 hsa-miR-93-3p 0.62 5.10E-06 3.00E-05 1.22 hsa-miR-93-5p 0.60 2.30E-04 8.00E-04 1.21 Down-regulated hsa-miR-107 0.65 4.40E-08 4.40E-07 0.8 hsa-miR-122-5p 0.61 8.10E-05 3.20E-04 0.66 hsa-miR-126-3p 0.66 1.70E-09 2.70E-08 0.87 hsa-miR-136-5p 0.61 2.30E-05 1.10E-04 0.72 hsa-miR-139-5p 0.60 8.60E-05 3.40E-04 0.84 hsa-miR-146a-5p 0.59 2.10E-03 5.60E-03 0.89 hsa-miR-154-5p 0.59 8.60E-04 2.60E-03 0.8 hsa-miR-181a-5p 0.60 2.30E-04 8.00E-04 0.92 hsa-miR-193b-3p 0.58 1.20E-03 3.20E-03 0.77 hsa-miR-23c 0.59 8.00E-04 2.40E-03 0.84 hsa-miR-26a-5p 0.60 4.40E-05 2.00E-04 0.86 hsa-miR-30a-5p 0.64 6.70E-08 6.40E-07 0.76 hsa-miR-30b-5p 0.59 9.50E-04 2.80E-03 0.9 hsa-miR-337-5p 0.63 4.80E-07 3.60E-06 0.74 hsa-miR-339-5p 0.64 4.90E-07 3.60E-06 0.79 hsa-miR-382-5p 0.59 1.00E-03 2.90E-03 0.81 hsa-miR-409-3p 0.59 5.00E-04 1.60E-03 0.77 hsa-miR-411-5p 0.6 7.30E-04 2.30E-03 0.74 hsa-miR-485-3p 0.6 6.40E-04 2.00E-03 0.77 hsa-miR-487b 0.59 1.10E-03 3.00E-03 0.76 hsa-miR-495 0.6 2.10E-04 7.40E-04 0.77 hsa-miR-885-5p 0.62 1.90E-05 9.60E-05 0.69 hsa-miR-99a-5p 0.58 2.90E-03 7.50E-03 0.82 hsa-miR-99b-5p 0.67 2.60E-09 3.50E-08 0.78
Comparing the results of the present study (Table 6) with the 30 miRNAs identified to be differentially expressed in blood by other reports (Table 1), only six miRNAs (hsa-miR-106b-5p, hsa-miR-17-5p, hsa-miR-20a-5p, hsa-miR-21-5p, hsa-miR-223-3p and hsa-miR-423-5p) were found to be commonly up-regulated (Table 7). Thus, the majority of the purported differentially regulated miRNAs in the literature were not confirmed in the present study. Interestingly, 69 novel miRNAs, which were potential biomarkers for gastric cancers, were identified here.
TABLE-US-00014 TABLE 7 Comparison between the current study and other literature reports miRNA name Regulation in Regulation in the in literature miRBase V18 name literature current study let-7e hsa-let-7e-5p up N.D. miR-1 hsa-miR-1 up N.D. miR-106a hsa-miR-106a-5p up N.D. miR-106b hsa-miR-106b-5p up up miR-151-5p hsa-miR-151a-5p up N.D. miR-17-5p hsa-miR-17-5p up up miR-181c hsa-miR-181c-5p up N.D. miR-187* hsa-miR-187-5p up N.D. miR-191 hsa-miR-191-5p up no change miR-199a-3p hsa-miR-199a-3p up no change miR-200c hsa-miR-200c-3p up no change miR-20a hsa-miR-20a-5p up up miR-21 hsa-miR-21-5p up up miR-221 hsa-miR-221-3p up no change miR-222 hsa-miR-222-3p up no change miR-223 hsa-miR-223-3p up up miR-27a hsa-miR-27a-3p up no change miR-27b hsa-miR-27b-3p up no change miR-34a hsa-miR-34a-5p up no change miR-370 hsa-miR-370 up N.D. miR-371-5p hsa-miR-371a-5p up N.D. miR-376c hsa-miR-376c up N.D. miR-378 hsa-miR-378a-3p up no change miR-423-5p hsa-miR-423-5p up up miR-744 hsa-miR-744-5p up N.D. miR-195-5p hsa-miR-195-5p down no change miR-218 hsa-miR-218-5p down N.D. miR-375 hsa-miR-375 down no change let-7a hsa-let-7a-5p down N.D.
Using this set of 75 biomarkers, a more distinct clustering between gastric cancer and normal/control subjects were observed in the heat-map of the miRNA profile (FIG. 4). Looking at the horizontal dimension, majority of gastric cancer subjects (black) were clustered into a focused area leaving majority of the normal/control subjects to the rest of the space in the map. The AUC values for the topped ranked up-regulated (hsa-miR-142-5p) and down-regulated (hsa-miR-99b-5p) miRNAs were only 0.71 and 0.67, respectively (FIG. 5). Each or the combination of a few of the 75 differentiated miRNAs may serve as biomarker or panels of biomarker (multivariant index assays) for the diagnosis of gastric cancer.
The expressions of miRNAs were found to cluster into subgroups as illustrated in the heat-maps (FIG. 3, 4). Each cluster has about 10-20 miRNAs (FIG. 3, 4 dashed lines). Analyses of all detectable miRNAs revealed a large number of these as positively correlated (Pearson correlation efficiency>0.5) (FIG. 6). The same observation was also found with the gastric cancer specific miRNAs (FIG. 7). The results demonstrated that certain groups of miRNAs were regulated similarly among all subjects. As a result, a panel of miRNAs could be assembled by substituting one or more distinct miRNAs with another so as to enhance the diagnostic performance and all the 75 significantly altered miRNA were critical for the development of a multivariant index diagnostic assay for gastric cancer.
B] Identification of Differentially Expressed miRNAs Between Normal/Control and Various Stages of Gastric Cancers.
The expressions of miRNAs between the various stages of the disease were then compared. With a two-way Anova test taking account the stages and subtypes, 36 miRNAs (from the pool of 191 serum miRNAs) were found to be differentially expressed between various stages of gastric cancer subjects (p-value of anova test<0.01 after false discovery rate correction, data not shown).
Knowing the difference between the various stages, the next attempt was made to identify differentially expressed miRNA between each stage of cancer and normal/control. The total number of distinct miRNAs found in this new search process was 113 (Tables 8-11, where the profiles overlapped). Among these, a pool of 20 (8 Up-regulated and 12 Down-regulated), 62 (54 Up-regulated and 8 Down-regulated), 43 (37 Up-regulated and 6 Down-regulated) or 74 (28 Up-regulated and 46 Down-regulated) miRNAs showed differential expression between normal/control and the corresponding stages of 1, 2, 3 and 4, respectively (p-value after FDR correction<0.01, Tables 8-11).
TABLE-US-00015 TABLE 8 MiRNAs differentially expressed between normal/control and stage 1 gastric cancer P-value, FDR miRNA name AUC P-value correction Fold change Up-regulated, N = 8 hsa-miR-27a-5p 0.66 5.4E-05 1.7E-03 1.57 hsa-miR-101-3p 0.63 8.0E-04 9.8E-03 1.31 hsa-miR-29c-3p 0.66 4.9E-05 1.7E-03 1.22 hsa-miR-29b-3p 0.63 1.0E-03 9.8E-03 1.21 hsa-miR-142-5p 0.67 1.7E-04 4.7E-03 1.21 hsa-miR-590-5p 0.65 3.2E-04 7.6E-03 1.16 hsa-miR-21-3p 0.63 4.0E-04 7.7E-03 1.16 hsa-miR-106b-3p 0.64 6.8E-04 9.8E-03 1.11 Down-regulated, N = 12 hsa-miR-146a-5p 0.65 1.0E-03 9.8E-03 0.84 hsa-miR-15b-5p 0.63 4.0E-04 7.7E-03 0.82 hsa-miR-103a-3p 0.65 5.1E-04 8.9E-03 0.82 hsa-miR-26a-5p 0.67 1.3E-05 8.5E-04 0.79 hsa-miR-362-5p 0.63 6.0E-04 9.6E-03 0.78 hsa-miR-671-3p 0.68 8.7E-04 9.8E-03 0.78 hsa-miR-454-3p 0.62 9.5E-04 9.8E-03 0.77 hsa-miR-328 0.67 5.4E-05 1.7E-03 0.74 hsa-miR-221-3p 0.69 3.5E-07 6.8E-05 0.74 hsa-miR-23c 0.69 2.3E-06 2.2E-04 0.70 hsa-miR-136-5p 0.63 9.8E-04 9.8E-03 0.68 hsa-miR-485-3p 0.64 9.7E-04 9.8E-03 0.68
TABLE-US-00016 TABLE 9 MiRNAs differentially expressed between normal/control and stage 2 gastric cancer P-value, FDR miRNA name AUC P-value correction Fold change Up-regulated, N = 54 hsa-miR-27a-5p 0.76 5.6E-07 1.2E-05 2.13 hsa-miR-183-5p 0.72 7.4E-05 5.9E-04 1.99 hsa-miR-629-5p 0.72 7.7E-04 3.3E-03 1.99 hsa-miR-424-5p 0.79 2.4E-08 1.2E-06 1.76 hsa-miR-1280 0.74 3.4E-07 9.2E-06 1.74 hsa-miR-18b-5p 0.74 3.6E-06 5.3E-05 1.74 hsa-miR-195-5p 0.73 1.9E-06 3.0E-05 1.70 hsa-miR-18a-3p 0.73 1.9E-05 2.1E-04 1.68 hsa-miR-550a-5p 0.72 8.6E-05 6.6E-04 1.67 hsa-miR-197-3p 0.81 1.4E-11 1.7E-09 1.63 hsa-miR-20a-5p 0.74 1.7E-05 1.9E-04 1.61 hsa-miR-363-3p 0.68 1.2E-03 4.5E-03 1.60 hsa-miR-450a-5p 0.69 4.3E-04 2.2E-03 1.60 hsa-miR-20b-5p 0.67 1.2E-03 4.7E-03 1.58 hsa-miR-15b-3p 0.71 1.7E-04 1.2E-03 1.58 hsa-miR-142-5p 0.82 1.8E-11 1.7E-09 1.57 hsa-miR-93-5p 0.73 2.2E-05 2.1E-04 1.55 hsa-miR-501-5p 0.70 1.0E-03 4.2E-03 1.54 hsa-miR-4306 0.70 2.9E-04 1.6E-03 1.53 hsa-miR-181a-2-3p 0.70 1.6E-04 1.1E-03 1.53 hsa-miR-16-5p 0.67 1.1E-03 4.2E-03 1.53 hsa-miR-128 0.82 5.9E-11 3.8E-09 1.49 hsa-miR-500a-3p 0.73 1.1E-05 1.3E-04 1.48 hsa-miR-223-3p 0.71 2.2E-05 2.1E-04 1.47 hsa-miR-501-3p 0.68 3.6E-04 1.9E-03 1.47 hsa-miR-19a-3p 0.72 6.9E-05 5.8E-04 1.46 hsa-miR-629-3p 0.70 5.8E-05 5.2E-04 1.46 hsa-miR-25-3p 0.69 7.0E-04 3.1E-03 1.46 hsa-miR-140-5p 0.79 3.7E-08 1.4E-06 1.43 hsa-miR-29a-3p 0.73 1.1E-05 1.3E-04 1.42 hsa-miR-23a-5p 0.65 2.2E-04 1.3E-03 1.41 hsa-miR-148a-3p 0.73 6.6E-05 5.7E-04 1.40 hsa-miR-598 0.76 4.9E-07 1.2E-05 1.38 hsa-miR-17-5p 0.71 4.4E-04 2.2E-03 1.38 hsa-miR-106b-5p 0.68 2.0E-03 6.5E-03 1.38 hsa-miR-186-5p 0.76 2.1E-07 6.7E-06 1.36 hsa-miR-93-3p 0.71 2.8E-04 1.6E-03 1.35 hsa-miR-23a-3p 0.72 1.7E-06 3.0E-05 1.34 hsa-miR-339-3p 0.65 1.9E-03 6.4E-03 1.33 hsa-miR-15a-5p 0.69 1.7E-03 6.0E-03 1.33 hsa-miR-29b-3p 0.70 1.9E-04 1.2E-03 1.33 hsa-miR-140-3p 0.68 4.7E-04 2.3E-03 1.33 hsa-miR-29c-5p 0.75 1.7E-06 3.0E-05 1.32 hsa-miR-320b 0.68 2.5E-03 8.0E-03 1.32 hsa-miR-423-5p 0.70 2.0E-04 1.2E-03 1.31 hsa-miR-15b-5p 0.69 6.3E-04 2.9E-03 1.27 hsa-miR-221-3p 0.68 1.9E-03 6.4E-03 1.27 hsa-miR-29b-2-5p 0.67 8.6E-04 3.7E-03 1.26 hsa-miR-532-3p 0.66 2.6E-03 8.2E-03 1.26 hsa-miR-374b-5p 0.67 4.9E-04 2.3E-03 1.25 hsa-miR-29c-3p 0.68 1.3E-03 4.9E-03 1.24 hsa-miR-21-5p 0.66 2.7E-03 8.5E-03 1.23 hsa-miR-589-5p 0.69 2.0E-03 6.7E-03 1.23 hsa-miR-106b-3p 0.67 1.6E-03 5.9E-03 1.13 Down-regulated, N = 8 hsa-miR-126-3p 0.68 3.7E-04 1.9E-03 0.87 hsa-miR-107 0.65 3.1E-03 9.5E-03 0.80 hsa-miR-320a 0.67 1.3E-03 4.9E-03 0.77 hsa-miR-339-5p 0.71 1.2E-04 9.1E-04 0.70 hsa-miR-337-5p 0.68 9.4E-04 3.9E-03 0.70 hsa-miR-99b-5p 0.74 7.0E-06 9.5E-05 0.69 hsa-miR-193b-3p 0.69 5.6E-04 2.6E-03 0.58 hsa-miR-885-5p 0.71 2.0E-04 1.2E-03 0.56
TABLE-US-00017 TABLE 10 MiRNAs differentially expressed between normal/control and stage 3 gastric cancer P-value, FDR miRNA name AUC P-value correction Fold change Up-regulated, N = 37 hsa-miR-629-5p 0.70 1.7E-04 1.3E-03 1.93 hsa-miR-650 0.66 3.1E-05 3.3E-04 1.79 hsa-miR-1280 0.75 5.4E-09 2.6E-07 1.67 hsa-miR-27a-5p 0.68 3.7E-05 3.5E-04 1.67 hsa-miR-18b-5p 0.70 1.3E-06 2.4E-05 1.66 hsa-miR-424-5p 0.72 1.1E-07 3.0E-06 1.60 hsa-miR-21-5p 0.78 1.7E-12 3.3E-10 1.57 hsa-miR-500a-3p 0.69 3.6E-08 1.1E-06 1.55 hsa-miR-629-3p 0.71 3.6E-07 8.7E-06 1.50 hsa-miR-223-3p 0.70 7.6E-07 1.6E-05 1.49 hsa-miR-550a-5p 0.65 4.9E-04 3.0E-03 1.48 hsa-miR-4306 0.65 2.1E-04 1.5E-03 1.46 hsa-miR-197-3p 0.73 1.2E-09 7.7E-08 1.45 hsa-miR-616-5p 0.68 5.7E-06 7.2E-05 1.44 hsa-miR-128 0.77 1.2E-11 1.1E-09 1.43 hsa-miR-450a-5p 0.63 1.4E-03 7.1E-03 1.42 hsa-miR-148a-3p 0.70 3.4E-06 5.2E-05 1.39 hsa-miR-598 0.74 7.9E-09 3.0E-07 1.38 hsa-miR-15b-3p 0.66 1.4E-03 6.9E-03 1.38 hsa-miR-423-5p 0.66 2.3E-06 3.9E-05 1.37 hsa-miR-1290 0.63 1.7E-03 7.7E-03 1.36 hsa-miR-93-3p 0.65 5.3E-05 4.8E-04 1.36 hsa-miR-22-3p 0.64 7.8E-05 6.5E-04 1.34 hsa-miR-23a-5p 0.65 2.6E-04 1.8E-03 1.32 hsa-miR-320c 0.63 6.3E-04 3.7E-03 1.31 hsa-miR-130a-3p 0.66 1.4E-05 1.6E-04 1.31 hsa-miR-320b 0.62 8.9E-04 4.7E-03 1.31 hsa-miR-320e 0.63 8.8E-04 4.7E-03 1.31 hsa-miR-19a-3p 0.64 1.5E-03 7.1E-03 1.30 hsa-miR-378a-3p 0.63 4.9E-04 3.0E-03 1.28 hsa-miR-9-5p 0.62 2.0E-03 8.9E-03 1.27 hsa-miR-29b-2-5p 0.64 1.6E-04 1.3E-03 1.27 hsa-miR-532-3p 0.64 6.7E-04 3.9E-03 1.25 hsa-miR-590-5p 0.69 6.8E-06 8.2E-05 1.24 hsa-miR-589-5p 0.62 9.5E-04 4.9E-03 1.20 hsa-miR-140-5p 0.65 8.9E-04 4.7E-03 1.20 hsa-miR-29c-5p 0.67 2.3E-04 1.6E-03 1.20 Down-regulated, N = 6 hsa-miR-126-5p 0.60 2.1E-03 9.5E-03 0.88 hsa-miR-126-3p 0.63 3.2E-04 2.1E-03 0.88 hsa-miR-27a-3p 0.64 3.9E-06 5.3E-05 0.78 hsa-miR-99b-5p 0.68 3.5E-05 3.5E-04 0.75 hsa-miR-107 0.68 3.6E-06 5.2E-05 0.74 hsa-miR-30a-5p 0.67 6.9E-05 6.0E-04 0.72
TABLE-US-00018 TABLE 11 MiRNAs differentially expressed between normal/control and stage 4 gastric cancer P-value, FDR miRNA name AUC P-value correction Fold change Up-regulated, N = 46 hsa-miR-27a-5p 0.70 7.5E-08 1.0E-06 1.86 hsa-miR-338-5p 0.70 2.0E-06 1.7E-05 1.86 hsa-miR-450a-5p 0.73 9.2E-09 1.8E-07 1.80 hsa-miR-183-5p 0.66 1.2E-04 6.3E-04 1.62 hsa-miR-579 0.69 5.6E-07 6.0E-06 1.59 hsa-miR-616-5p 0.71 5.0E-10 2.4E-08 1.55 hsa-miR-424-5p 0.72 1.0E-08 1.8E-07 1.52 hsa-miR-200b-3p 0.61 1.5E-04 7.0E-04 1.48 hsa-miR-148a-3p 0.74 7.7E-10 2.9E-08 1.48 hsa-miR-223-3p 0.68 2.5E-07 3.0E-06 1.46 hsa-miR-142-5p 0.77 1.1E-12 2.1E-10 1.43 hsa-miR-629-3p 0.67 9.4E-07 8.5E-06 1.42 hsa-miR-4306 0.63 1.5E-04 7.0E-04 1.40 hsa-miR-15b-3p 0.64 2.6E-04 1.1E-03 1.40 hsa-miR-20a-5p 0.65 7.0E-05 4.2E-04 1.40 hsa-miR-627 0.67 1.1E-05 7.8E-05 1.37 hsa-miR-20b-5p 0.61 2.7E-03 7.4E-03 1.37 hsa-miR-197-3p 0.71 5.4E-09 1.2E-07 1.37 hsa-miR-101-3p 0.64 1.3E-04 6.3E-04 1.36 hsa-miR-598 0.71 1.9E-09 5.2E-08 1.36 hsa-miR-23a-5p 0.65 1.4E-05 9.3E-05 1.36 hsa-miR-141-3p 0.57 1.3E-03 4.3E-03 1.34 hsa-miR-19a-3p 0.64 9.0E-05 5.1E-04 1.34 hsa-miR-550a-5p 0.62 2.8E-03 7.6E-03 1.33 hsa-miR-140-5p 0.70 4.2E-08 6.7E-07 1.33 hsa-miR-29c-3p 0.69 5.2E-08 7.6E-07 1.32 hsa-miR-18b-5p 0.62 2.3E-03 6.5E-03 1.31 hsa-miR-590-5p 0.73 4.1E-10 2.4E-08 1.31 hsa-miR-106b-5p 0.63 9.5E-04 3.3E-03 1.31 hsa-miR-1280 0.64 6.8E-04 2.6E-03 1.29 hsa-miR-191-5p 0.60 2.1E-03 6.1E-03 1.27 hsa-miR-589-5p 0.69 8.4E-07 8.0E-06 1.27 hsa-miR-140-3p 0.64 1.3E-04 6.3E-04 1.26 hsa-miR-93-5p 0.62 2.0E-03 5.9E-03 1.26 hsa-miR-17-5p 0.63 1.4E-03 4.5E-03 1.25 hsa-miR-29b-3p 0.62 2.5E-04 1.1E-03 1.25 hsa-miR-628-5p 0.62 3.5E-03 9.0E-03 1.23 hsa-miR-93-3p 0.63 7.5E-04 2.7E-03 1.23 hsa-miR-21-5p 0.63 8.3E-05 4.8E-04 1.23 hsa-miR-106b-3p 0.71 2.2E-09 5.2E-08 1.21 hsa-miR-484 0.63 1.7E-03 5.3E-03 1.20 hsa-miR-29a-3p 0.62 2.1E-03 6.1E-03 1.19 hsa-miR-29b-2-5p 0.61 1.5E-03 4.6E-03 1.18 hsa-miR-29c-5p 0.65 2.2E-04 9.6E-04 1.17 hsa-miR-425-5p 0.62 2.2E-03 6.3E-03 1.15 hsa-miR-425-3p 0.65 2.2E-06 1.8E-05 1.12 Down-regulated, N = 28 hsa-miR-181a-5p 0.61 1.3E-03 4.4E-03 0.90 hsa-miR-30d-5p 0.62 5.7E-04 2.2E-03 0.88 hsa-miR-30b-5p 0.62 1.2E-03 4.1E-03 0.85 hsa-miR-126-3p 0.72 2.2E-10 2.1E-08 0.82 hsa-miR-146a-5p 0.66 1.2E-04 6.3E-04 0.81 hsa-miR-107 0.64 2.1E-04 9.5E-04 0.81 hsa-miR-99b-5p 0.65 9.4E-05 5.1E-04 0.78 hsa-miR-10a-5p 0.66 3.9E-04 1.6E-03 0.77 hsa-miR-139-5p 0.66 2.1E-05 1.3E-04 0.77 hsa-miR-10b-5p 0.62 2.8E-03 7.6E-03 0.77 hsa-miR-23c 0.65 1.6E-04 7.2E-04 0.76 hsa-miR-497-5p 0.65 7.1E-04 2.6E-03 0.76 hsa-miR-154-5p 0.62 3.3E-03 8.7E-03 0.75 hsa-miR-26a-5p 0.68 1.0E-07 1.3E-06 0.74 hsa-miR-339-5p 0.67 1.7E-05 1.1E-04 0.74 hsa-miR-382-5p 0.64 7.2E-04 2.6E-03 0.73 hsa-miR-134 0.63 7.4E-04 2.7E-03 0.72 hsa-miR-409-3p 0.63 1.1E-03 3.8E-03 0.70 hsa-miR-487b 0.62 3.3E-03 8.7E-03 0.69 hsa-miR-136-5p 0.62 1.5E-03 4.6E-03 0.69 hsa-miR-150-5p 0.66 1.8E-06 1.6E-05 0.67 hsa-miR-193b-3p 0.64 4.9E-04 2.0E-03 0.66 hsa-miR-30a-5p 0.72 2.0E-09 5.2E-08 0.65 hsa-miR-99a-5p 0.67 8.1E-06 6.0E-05 0.65 hsa-miR-337-5p 0.69 2.9E-07 3.2E-06 0.64 hsa-miR-495 0.67 7.1E-06 5.4E-05 0.63 hsa-miR-885-5p 0.66 2.5E-05 1.5E-04 0.59 hsa-miR-122-5p 0.69 7.5E-07 7.5E-06 0.48
With the exception of three miRNAs (hsa-miR-486-5p, hsa-miR-19b-3p, hsa-miR-411-5p), the rest of the 75 miRNAs discovered from analysis using all stages of cancer collectively (Table 6) were found to be a subset of these 113 miRNAs identified when analyzing each stage of the cancer independently. Most of the 36 miRNAs (except one) found differentially regulated between various stages of gastric cancers were also found to be differentially expressed when comparing normal/control (N) and each stage (S1-S4) of gastric cancer (Tables 8-11). The differences between the stages resulted different pools of miRNAs to be useful for the detection of gastric cancer. Hence, the results from comparing expression levels in the different stages against normal/control resulted in a larger pool of informative miRNAs.
Clearly, lesser number of miRNAs was identified in early stage 1 than in later stages. The identity of the miRNAs which were ranked highest in AUC values were not always the same for all stages (FIG. 8). Large numbers of miRNAs were regulated (Table 8-11) and similar identities were repeatedly found across the stages (FIG. 10). Only one miRNA (hsa-miR-27a-5p) was found to be common among all four stages. These distinct miRNAs (Tables 8-11) can be used individually and the collective results of multiple miRNAs may be useful for the diagnosis of gastric cancers in a clinical setting where the stage of the cancer is unknown at point of presentation.
From the study above, a biomarker panel consisting of at least one miRNA from the each stage specific miRNA list could provide an alternative method for determining the likelihood of a subject having gastric cancer.
III, Search for Multivariant Biomarker Panels
An important criterion to assemble a multivariate panel is to include at least one miRNA from the specific list for each stage of cancer to ensure all cancer subgroups were covered. However, the miRNAs defining the four stages of cancer were not totally distinct as the same miRNAs were similarly found between them (FIG. 9). At the same time, large numbers of cancer related or non-related miRNAs were found to be positively correlated (FIGS. 6, 7) which makes the choice of the best miRNA combinations for gastric cancer diagnosis challenging.
In view of the complexity of the task, it was decided that the present study has to identify panels of miRNA with the highest AUC using sequence forward floating search algorithm. The state-of-the art linear support vector machine, a well utilized and recognized modeling tool for the construction of panels of variables, was also known to be used in the art to aid in the selection of the combinations of miRNAs. The model yields a score based on a linear formula accounting for the expression level of each member and their weightages. These linear models are easily accepted and applied in the clinical practice.
A critical requirement for the success of such process is the availability of high quality data. The quantitative data of all the detected miRNAs in a large number of well-defined clinical samples not only improved the accuracy as well as precision of the result but also ensured the consistency of the identified biomarker panels for further clinical application using qPCR.
With the large number of clinical samples (500+), the issue of over-fitting of data in modeling was minimized as there were only 191 candidate features to be selected from. In addition, to ensure the veracity of the result, multiple times of four fold cross validation were carried out to test the performance of the identified biomarker panel based on the discovery set (3/4 of the samples at each fold) in an independent set of validation samples (the rest 1/4 of the samples at each fold). During the cross validation process, the samples were matched for sex, subtype and stage.
The boxplots representative of the results (the AUC of the biomarker panel in both discovery phase and validation phase) were shown in FIG. 10. As predicted, there was a decrease in AUC values with the validation set for each search (0.04-0.06). Although the size of the box was larger with data in the validation phase, indicative of a spread of values, the difference was .ltoreq.0.1 AUC values. This spread of values was even tighter (<0.05) when the number of biomarkers included in the analysis was higher than 6. This observation indicated that a more robust result was obtained with 6 or more miRNAs.
A more quantitative representation of the results was shown in FIG. 11 where there were no improvements on the AUC values were observed when the numbers of biomarkers included in the analyses were greater than seven. Although the difference between six miRNAs and seven miRNAs biomarker panels was statically significant, the improvement was a mere 0.02 in AUC values. Thus, an AUC value of 0.855 using 6 miRNAs panel is sufficient for clinical use.
IV, Composition of Multivariant-miRNA Biomarker Panels
To examine the composition of multivariant biomarker panels, the occurrence of miRNAs in all the panels containing 6-10 miRNAs was counted, where the panels with the top 10% and bottom 10% AUC were excluded. The exclusion of the top 10% and bottom 10% AUC was carried out to avoid counting of falsely discovered biomarkers due to fitting of inaccurate data from subpopulations generated by the randomization process in cross-validation analysis. Excluding these miRNAs with lesser than four counts, a total of 55 miRNA were selected in the discovery process (Table 12) where the expression of 43 of these were also found to be significantly altered in cancers. The inclusion of 12 others, although not altered in cancers, was found to significantly improve the AUC values. Without a direct and quantitative measurement of all miRNA targets, these miRNAs would never have been selected in high-through put screening methods (microarray, sequencing) and would have been excluded for qPCR validation. These miRNAs were not selected randomly as the top two miRNA (hsa-miR-532-5p, hsa-miR-30e-5p) were consistently found in 57.8% and 48.4% of the panels.
TABLE-US-00019 TABLE 12 MiRNAs identified in multivariant biomarker panel identification process Changes in various stages of cancers stage stage stage all Prevalence stage 1 2 3 4 stages Significant group hsa-miR-21-5p 87.4% No Yes Yes Yes Yes hsa-miR-103a-3p 87.0% Yes No No No No hsa-miR-20a-5p 69.3% No Yes No Yes Yes hsa-miR-181a-5p 39.4% No No No Yes Yes hsa-miR-142-5p 32.1% Yes Yes No Yes Yes hsa-miR-27a-5p 29.6% Yes Yes Yes Yes Yes hsa-miR-26a-5p 27.4% Yes No No Yes Yes hsa-miR-17-5p 26.4% No Yes No Yes Yes hsa-miR-616-5p 23.1% No No Yes Yes Yes hsa-miR-30a-5p 20.9% No No Yes Yes Yes hsa-miR-484 17.3% No No No Yes No hsa-miR-423-5p 15.5% No Yes Yes No Yes hsa-miR-4306 13.4% No Yes Yes Yes Yes hsa-miR-590-5p 11.6% Yes No Yes Yes Yes hsa-miR-362-5p 11.2% Yes No No No No hsa-miR-106b-3p 9.7% Yes Yes No Yes Yes hsa-miR-497-5p 8.3% No No No Yes No hsa-miR-18b-5p 7.9% No Yes Yes Yes Yes hsa-miR-122-5p 6.9% No No No Yes Yes hsa-miR-200b-3p 6.1% No No No Yes No hsa-miR-197-3p 6.1% No Yes Yes Yes Yes hsa-miR-486-5p 5.1% No No No No Yes hsa-miR-99a-5p 5.1% No No No Yes Yes hsa-miR-885-5p 4.3% No Yes No Yes Yes hsa-miR-598 3.2% No Yes Yes Yes Yes hsa-miR-454-3p 2.9% Yes No No No No hsa-miR-130a-3p 2.9% No No Yes No No hsa-miR-29c-3p 2.9% Yes Yes No Yes Yes hsa-miR-126-3p 2.9% No Yes Yes Yes Yes hsa-miR-107 2.5% No Yes Yes Yes Yes hsa-miR-140-5p 2.2% No Yes Yes Yes Yes hsa-miR-150-5p 2.2% No No No Yes No hsa-miR-30d-5p 2.2% No No No Yes No hsa-miR-10b-5p 2.2% No No No Yes No hsa-miR-532-3p 2.2% No Yes Yes No Yes hsa-miR-23a-5p 2.2% No Yes Yes Yes Yes hsa-miR-29b-3p 1.8% Yes Yes No Yes Yes hsa-miR-21-3p 1.8% Yes No No No Yes hsa-miR-148a-3p 1.8% No Yes Yes Yes Yes hsa-miR-136-5p 1.8% Yes No No Yes Yes hsa-miR-1280 1.4% No Yes Yes Yes Yes hsa-miR-16-5p 1.4% No Yes No No No hsa-miR-223-3p 1.4% No Yes Yes Yes Yes Insignificant group hsa-miR-532-5p 57.8% No No No No No hsa-miR-30e-5p 48.4% No No No No No hsa-miR-340-5p 11.2% No No No No No hsa-miR-23b-3p 4.0% No No No No No hsa-miR-27b-3p 2.2% No No No No No hsa-miR-224-5p 2.2% No No No No No hsa-miR-185-5p 1.8% No No No No No hsa-miR-320d 1.4% No No No No No hsa-miR-374a-5p 1.4% No No No No No hsa-miR-584-5p 1.4% No No No No No hsa-miR-194-5p 1.4% No No No No No hsa-miR-34a-5p 1.4% No No No No No
The miRNAs selected to form the multivariate panels (Table 12) showed variability in detecting cancer at various stages (Tables 8-11). For the top 10 frequently chosen miRNAs in the list with occurrence higher than 20%, only three of the them were found to be commonly regulated in more than two different stages of cancers (hsa-miR-21-5p, hsa-miR-27a-5p, hsa-miR-142-5p) while for the rest, hsa-miR-103a-3p was only significant for stage 1, hsa-miR-181a-5p was only significant for stage 4, hsa-miR-26a-5p was significant for stage 1&4 hsa-miR-20a-5p and hsa-miR-17-5p were significant for stage 2 & 4 and hsa-miR-616-5p and hsa-miR-30a-5p were significant for stage 3 & 4. Excluding stage 4, where large numbers of miRNAs overlapped with lists for 3 other stages (FIG. 9), two specific miRNAs for each of stage 1-3 were frequently selected.
When comparing the identities of the chosen miRNAs for multivariate panels and single miRNA as diagnostic markers, they were not necessarily the same. For example, the top down-regulated (hsa-miR-99b-5p) miRNA for all cancers (FIG. 5) were not included in the list. Hence, it was not possible to merely to combine the best biomarker identified for various stages to form the optimal biomarker panel but rather a panel of markers providing complementary information that gives the best result.
Interestingly, five miRNAs were frequently selected for the multivariate panels (with >48% prevalence, see Table 12). Three of these were cancer specific (hsa-miR-21-5p, hsa-miR-103a-3p and hsa-miR-20a-5p) and two were from the other group (insignificant group; hsa-miR-532-5p and hsa-miR-30e-5p). The co-occurrence of these 5 miRNAs in all multivariant panels (Table 13) was analyzed and it was found that 85.9% of the panels had either hsa-miR-532-5p or hsa-miR-30e-5p. Thus, the use of either one of these two miRNAs may be sufficiently useful to increase the AUC values in the multivariate index panel.
In total, 93.8% of the miRNA biomarker panel had at least one miRNA from each group. Thus, in one example, the multivariate method for determining the likelihood of a subject having a gastric cancer may comprise at least one miRNA from each of these two frequently selected miRNA groups.
TABLE-US-00020 TABLE 13 Occurrence of frequently selected miRNAs Group: hsa-21-5p, -103a-3p, -20a-5p n = 0 n = 1 n = 2 n = 3 sum Group: hsa-miR- n = 0 0.7% 1.1% 2.2% 0.0% 4.0% 532-5p, -30e-5p n = 1 1.4% 7.6% 26.0% 50.9% 85.9% n = 2 0.0% 0.7% 2.9% 6.5% 10.1% sum 2.2% 9.4% 31.0% 57.4%
Calculation of Cancer Risk Score
MiRNAs can be combined to form a biomarker panel to calculate the cancer risk score (Formula 1). For example, the 12 miRNAs frequently selected in the multivariant biomarker panel identification process with prevalence >20% (Table 21) can be combined to form a biomarker panel to calculate the cancer risk score. The formula here demonstrates the use of a linear model for gastric cancer risk prediction, where the cancer risk score (unique for each subject) indicates the likelihood of a subject having gastric cancer. This is calculated by the summing the weighted measurements for the 12 miRNAs and a constant of 50.
.times..times..times..times..times..times..times..times..times. ##EQU00001##
log.sub.2 copy_miRNA.sub.i--log transformed copy numbers (copy/ml of serum) of the 12 individual miRNAs'). K.sub.i--the coefficients used to weight multiple miRNA targets which can be found in Table 21. The values of K.sub.i were optimized with support vector machine method and scaled to range from 0 to 100. Subjects with cancer risk score lower than 0 will be considered as 0 and subjects with cancer risk score higher than 100 will be considered as 100.
TABLE-US-00021 TABLE 21 12 MiRNAs frequently selected in the multivariant biomarker panel identification process with prevalence > 20% miRNA.sub.i K.sub.i hsa-miR-21-5p 13.9 hsa-miR-103a-3p -13.1 hsa-miR-20a-5p 13.3 hsa-miR-181a-5p -5.7 hsa-miR-142-5p 4.4 hsa-miR-27a-5p 1.9 hsa-miR-26a-5p -5.8 hsa-miR-17-5p 6.9 hsa-miR-616-5p 3.3 hsa-miR-30a-5p -4.2 hsa-miR-532-5p -6.1 hsa-miR-30e-5p -10.7
The control and cancer subjects in this studies have different cancer risk score values calculated based on the formula (FIG. 15A). The fitted probability distributions of the cancer risk scores for the control and cancer subjects can be found in FIG. 15B where a clear separation between the two groups can be found. In this study, the control subjects were non-cancer subjects selected from the high risk population which has a probability of 0.0067 to have gastric cancer. Based on this prior probability and the fitted probability distributions in FIG. 15B, the probability (risk) of an unknown subject having cancer can be calculated based on their cancer risk score values (FIG. 15C). With higher score, the subject has higher risk of having gastric cancer. Furthermore, the cancer risk score can tell the fold change of the probability (risk) of an unknown subject having gastric cancer compared to the cancer incidence rate in high risk population (FIG. 15D). For example, an unknown high risk subject having cancer risk score of 70 will have 14.6% probability to have gastric cancer which is about 22 times higher than the average risk of the high risk population.
Further applying two threshold values at 40 and 70, the subjects can be defined into three categories based on the cancer risk score FIG. 15C, D. Subjects with cancer risk score range of 0-40 belong to the low cancer risk group having 0.052% chance to have gastric cancer which is 13 fold lower than the average cancer incidence rate in high risk population. Subjects with cancer risk score range of 40-70 belong to the medium cancer risk group having 1.4% chance to have gastric cancer which is 2 times higher than the average cancer incidence rate in high risk population. Subjects with cancer risk score range of 70-100 belong to the high cancer risk group having 12.2% chance to have gastric cancer which is 18 folds higher than the average cancer incidence rate in high risk population.
SEQUENCE LISTINGS
1
191122RNAHomo sapiens 1cacccguaga accgaccuug cg 22222RNAHomo sapiens 2uccuguacug agcugccccg ag 22321RNAHomo sapiens 3aucacauugc cagggauuac c 21421RNAHomo sapiens 4uaccacaggg uagaaccacg g 21521RNAHomo sapiens 5uacaguacug ugauaacuga a 21623RNAHomo sapiens 6agcagcauug uacagggcua uca 23722RNAHomo sapiens 7cagugcaaug augaaagggc au 22821RNAHomo sapiens 8aauaauacau gguugaucuu u 21922RNAHomo sapiens 9uuuggucccc uucaaccagc ug 221021RNAHomo sapiens 10agcuacaucu ggcuacuggg u 211119RNAHomo sapiens 11aaaagcuggg uugagagga 191222RNAHomo sapiens 12uguaaacauc cucgacugga ag 221323RNAHomo sapiens 13aacauucaac gcugucggug agu 231422RNAHomo sapiens 14cagugguuuu acccuauggu ag 221522RNAHomo sapiens 15aucgggaaug ucguguccgc cc 221622RNAHomo sapiens 16ccgcacugug gguacuugcu gc 221721RNAHomo sapiens 17cugaccuaug aauugacagc c 211822RNAHomo sapiens 18caaauucgua ucuaggggaa ua 221923RNAHomo sapiens 19caaagugcuu acagugcagg uag 232022RNAHomo sapiens 20gagcuuauuc auaaaagugc ag 222122RNAHomo sapiens 21uucuggaauu cugugugagg ga 222222RNAHomo sapiens 22uaaugccccu aaaaauccuu au 222323RNAHomo sapiens 23uaauccuugc uaccugggug aga 232422RNAHomo sapiens 24uauugcacau uacuaaguug ca 222522RNAHomo sapiens 25uuauaaagca augagacuga uu 222622RNAHomo sapiens 26auauaauaca accugcuaag ug 222721RNAHomo sapiens 27uucacagugg cuaaguuccg c 212822RNAHomo sapiens 28gugagucucu aagaaaagag ga 222922RNAHomo sapiens 29ggagaaauua uccuuggugu gu 223021RNAHomo sapiens 30aggggugcua ucugugauug a 213122RNAHomo sapiens 31ucaggcucag uccccucccg au 223222RNAHomo sapiens 32uaacagucua cagccauggu cg 223321RNAHomo sapiens 33ugguagacua uggaacguag g 213422RNAHomo sapiens 34acaggugagg uucuugggag cc 223522RNAHomo sapiens 35uagcaccauc ugaaaucggu ua 223622RNAHomo sapiens 36aauugcacgg uauccaucug ua 223722RNAHomo sapiens 37aucauagagg aaaauccaug uu 223822RNAHomo sapiens 38ugagaaccac gucugcucug ag 223923RNAHomo sapiens 39ucuuggagua ggucauuggg ugg 234017RNAHomo sapiens 40ucccaccgcu gccaccc 174123RNAHomo sapiens 41agcagcauug uacagggcua uga 234222RNAHomo sapiens 42uggaguguga caaugguguu ug 224323RNAHomo sapiens 43caaagugcug uucgugcagg uag 234422RNAHomo sapiens 44cauugcacuu gucucggucu ga 224523RNAHomo sapiens 45ucuuugguua ucuagcugua uga 234623RNAHomo sapiens 46uucauuuggu auaaaccgcg auu 234722RNAHomo sapiens 47caucaucguc ucaaaugagu cu 224822RNAHomo sapiens 48ugagaacuga auuccauggg uu 224922RNAHomo sapiens 49ggauaucauc auauacugua ag 225022RNAHomo sapiens 50uagcagcaca uaaugguuug ug 225122RNAHomo sapiens 51ucucccaacc cuuguaccag ug 225221RNAHomo sapiens 52ucagugcaug acagaacuug g 215322RNAHomo sapiens 53ugaccgauuu cuccuggugu uc 225420RNAHomo sapiens 54aaaagcuggg uugagagggu 205522RNAHomo sapiens 55ucggauccgu cugagcuugg cu 225622RNAHomo sapiens 56cuagguaugg ucccagggau cc 225721RNAHomo sapiens 57acuggacuug gagucagaag g 215822RNAHomo sapiens 58uuauaauaca accugauaag ug 225922RNAHomo sapiens 59gaauguugcu cggugaaccc cu 226022RNAHomo sapiens 60uauguaacac gguccacuaa cc 226122RNAHomo sapiens 61cgucaacacu ugcugguuuc cu 226222RNAHomo sapiens 62augcugacau auuuacuaga gg 226322RNAHomo sapiens 63guucucccaa cguaagccca gc 226421RNAHomo sapiens 64gcccugaccu guccuguucu g 216522RNAHomo sapiens 65aauccuuugu cccuggguga ga 226622RNAHomo sapiens 66acucaaaacc cuucagugac uu 226723RNAHomo sapiens 67uagugcaaua uugcuuauag ggu 236822RNAHomo sapiens 68gucauacacg gcucuccucu cu 226922RNAHomo sapiens 69uuuggucccc uucaaccagc ua 227022RNAHomo sapiens 70caaagaauuc uccuuuuggg cu 227123RNAHomo sapiens 71caaagugcuc auagugcagg uag 237222RNAHomo sapiens 72uguaaacauc cccgacugga ag 227322RNAHomo sapiens 73uuuguucguu cggcucgcgu ga 227422RNAHomo sapiens 74uagcagcacg uaaauauugg cg 227521RNAHomo sapiens 75uaaagugcug acagugcaga u 217622RNAHomo sapiens 76ucuacagugc acgugucucc ag 227722RNAHomo sapiens 77uaacacuguc ugguaaagau gg 227822RNAHomo sapiens 78uggagagaaa ggcaguuccu ga 227923RNAHomo sapiens 79aacauucauu gcugucggug ggu 238022RNAHomo sapiens 80acaguagucu gcacauuggu ua 228123RNAHomo sapiens 81ugugcaaauc caugcaaaac uga 238222RNAHomo sapiens 82ucagugcauc acagaacuuu gu 228323RNAHomo sapiens 83uagcaccauu ugaaaucagu guu 238422RNAHomo sapiens 84aacaauaucc uggugcugag ug 228522RNAHomo sapiens 85uuaugguuug ccugggacug ag 228622RNAHomo sapiens 86gaaguuguuc gugguggauu cg 228721RNAHomo sapiens 87cuagacugaa gcuccuugag g 218819RNAHomo sapiens 88uggauuuuug gaucaggga 198922RNAHomo sapiens 89uaauacugcc ugguaaugau ga 229021RNAHomo sapiens 90uaguagaccg uauagcguac g 219121RNAHomo sapiens 91cauuauuacu uuugguacgc g 219222RNAHomo sapiens 92caguuaucac agugcugaug cu 229322RNAHomo sapiens 93ucccugagac ccuaacuugu ga 229424RNAHomo sapiens 94aauccuugga accuaggugu gagu 249522RNAHomo sapiens 95uucaccaccu ucuccaccca gc 229623RNAHomo sapiens 96agcuacauug ucugcugggu uuc 239722RNAHomo sapiens 97aaugcacccg ggcaaggauu cu 229821RNAHomo sapiens 98uccgguucuc agggcuccac c 219922RNAHomo sapiens 99accacugacc guugacugua cc 2210022RNAHomo sapiens 100auaaagcuag auaaccgaaa gu 2210122RNAHomo sapiens 101aacuguuugc agaggaaacu ga 2210222RNAHomo sapiens 102uacgucaucg uugucaucgu ca 2210322RNAHomo sapiens 103aaaagcuggg uugagagggc aa 2210422RNAHomo sapiens 104cuggcccucu cugcccuucc gu 2210521RNAHomo sapiens 105aggaggcagc gcucucagga c 2110622RNAHomo sapiens 106ugugacuggu ugaccagagg gg 2210722RNAHomo sapiens 107cagugcaaug uuaaaagggc au 2210822RNAHomo sapiens 108uagcuuauca gacugauguu ga 2210922RNAHomo sapiens 109cagcagcaau ucauguuuug aa 2211022RNAHomo sapiens 110aacccguaga uccgaucuug ug 2211123RNAHomo sapiens 111acugcccuaa gugcuccuuc ugg 2311221RNAHomo sapiens 112uagcagcaca gaaauauugg c 2111322RNAHomo sapiens 113uccuucauuc caccggaguc ug 2211422RNAHomo sapiens 114uggaauguaa ggaagugugu gg 2211522RNAHomo sapiens 115augcaccugg gcaaggauuc ug 2211623RNAHomo sapiens 116uaaggugcau cuagugcagu uag 2311723RNAHomo sapiens 117aacauucauu guugucggug ggu 2311823RNAHomo sapiens 118ugagcgccuc gacgacagag ccg 2311922RNAHomo sapiens 119acugcugagc uagcacuucc cg 2212023RNAHomo sapiens 120uacccuguag aaccgaauuu gug 2312121RNAHomo sapiens 121cagcagcaca cugugguuug u 2112221RNAHomo sapiens 122uucacagugg cuaaguucug c 2112321RNAHomo sapiens 123ucacagugaa ccggucucuu u 2112422RNAHomo sapiens 124uauggcacug guagaauuca cu 2212522RNAHomo sapiens 125aagcugccag uugaagaacu gu 2212622RNAHomo sapiens 126uucaaguaau ccaggauagg cu 2212722RNAHomo sapiens 127ugucaguuug ucaaauaccc ca 2212821RNAHomo sapiens 128uggguuuacg uugggagaac u 2112922RNAHomo sapiens 129uauugcacuu gucccggccu gu 2213022RNAHomo sapiens 130cugguuucac augguggcuu ag 2213121RNAHomo sapiens 131caacaccagu cgaugggcug u 2113223RNAHomo sapiens 132cccaguguuc agacuaccug uuc 2313322RNAHomo sapiens 133ucagugcacu acagaacuuu gu 2213422RNAHomo sapiens 134ugggucuuug cgggcgagau ga 2213522RNAHomo sapiens 135agggcuuagc ugcuugugag ca 2213623RNAHomo sapiens 136uaauacugcc ggguaaugau gga 2313723RNAHomo sapiens 137uaaagugcuu auagugcagg uag 2313822RNAHomo sapiens 138uguaacagca acuccaugug ga 2213922RNAHomo sapiens 139ccucccacac ccaaggcuug ca 2214023RNAHomo sapiens 140ugugcaaauc uaugcaaaac uga 2314121RNAHomo sapiens 141cauaaaguag aaagcacuac u 2114220RNAHomo sapiens 142uacaguauag augauguacu 2014323RNAHomo sapiens 143guccaguuuu cccaggaauc ccu 2314423RNAHomo sapiens 144uacccuguag auccgaauuu gug 2314521RNAHomo sapiens 145aucacauugc cagggauuuc c 2114622RNAHomo sapiens 146gggguuccug gggaugggau uu 2214722RNAHomo sapiens 147cgaaucauua uuugcugcuc ua 2214823RNAHomo sapiens 148cagugcaaua guauugucaa agc 2314922RNAHomo sapiens 149uacccauugc auaucggagu ug 2215022RNAHomo sapiens 150uguaaacauc cuacacucag cu 2215122RNAHomo sapiens 151uguaaacauc cuugacugga ag 2215223RNAHomo sapiens 152agugccugag ggaguaagag ccc 2315323RNAHomo sapiens 153aaugacacga ucacucccgu uga 2315417RNAHomo sapiens 154uggagagaaa ggcagua 1715522RNAHomo sapiens 155caugccuuga guguaggacc gu 2215623RNAHomo sapiens 156ucaagagcaa uaacgaaaaa ugu 2315722RNAHomo sapiens 157aagacgggag gaaagaaggg ag 2215822RNAHomo sapiens 158ucaccagccc uguguucccu ag 2215921RNAHomo sapiens 159ugucuugcag gccgucaugc a 2116023RNAHomo sapiens 160cgcauccccu agggcauugg ugu 2316122RNAHomo sapiens 161aaucguacag ggucauccac uu 2216222RNAHomo sapiens 162aaaccguuac cauuacugag uu 2216322RNAHomo sapiens 163uuguacaugg uaggcuuuca uu 2216423RNAHomo sapiens 164acuccauuug uuuugaugau gga 2316522RNAHomo sapiens 165aucacauugc cagugauuac cc 2216622RNAHomo sapiens 166uucaacgggu auuuauugag ca 2216723RNAHomo sapiens 167ugaggggcag agagcgagac uuu 2316818RNAHomo sapiens 168aaagcugggu ugagaagg 1816921RNAHomo sapiens 169caagucacua gugguuccgu u 2117022RNAHomo sapiens 170cacuagauug ugagcuccug ga 2217122RNAHomo sapiens 171uagcaccauu ugaaaucggu ua 2217220RNAHomo sapiens 172ccucugggcc cuuccuccag 2017321RNAHomo sapiens 173aagccugccc ggcuccucgg g 2117422RNAHomo sapiens 174uccauuacac uacccugccu cu 2217522RNAHomo sapiens 175ugagaacuga auuccauagg cu 2217622RNAHomo sapiens 176uggcaguguc uuagcugguu gu 2217723RNAHomo sapiens 177gcaaagcaca cggccugcag aga 2317822RNAHomo sapiens 178uagguuaucc guguugccuu cg 2217923RNAHomo sapiens 179caacggaauc ccaaaagcag cug 2318022RNAHomo sapiens 180aacuggcccu caaagucccg cu 2218123RNAHomo sapiens 181cagugcaaug auauugucaa agc 2318222RNAHomo sapiens 182cuuucagucg gauguuuaca gc 2218322RNAHomo sapiens 183aaaagcuggg uugagagggc ga 2218422RNAHomo sapiens 184acaguagucu gcacauuggu ua 2218522RNAHomo sapiens 185aaugcaccug ggcaaggauu ca 2218622RNAHomo sapiens 186uuuugcgaug uguuccuaau au 2218722RNAHomo sapiens 187aaacaaacau ggugcacuuc uu 2218822RNAHomo sapiens 188ucguaccgug aguaauaaug cg 2218922RNAHomo sapiens 189uagcagcaca ucaugguuua ca
2219023RNAHomo sapiens 190ucccuguccu ccaggagcuc acg 2319121RNAHomo sapiens 191gaacggcuuc auacaggagu u 21
* * * * *
D00001
D00002
D00003
D00004
D00005
D00006
D00007
D00008
D00009
D00010
D00011
M00001
S00001
XML
uspto.report is an independent third-party trademark research tool that is not affiliated, endorsed, or sponsored by the United States Patent and Trademark Office (USPTO) or any other governmental organization. The information provided by uspto.report is based on publicly available data at the time of writing and is intended for informational purposes only.
While we strive to provide accurate and up-to-date information, we do not guarantee the accuracy, completeness, reliability, or suitability of the information displayed on this site. The use of this site is at your own risk. Any reliance you place on such information is therefore strictly at your own risk.
All official trademark data, including owner information, should be verified by visiting the official USPTO website at www.uspto.gov. This site is not intended to replace professional legal advice and should not be used as a substitute for consulting with a legal professional who is knowledgeable about trademark law.