Systems and methods for ranking data visualizations using different data fields
Mackinlay , et al.
U.S. patent number 10,712,903 [Application Number 15/436,706] was granted by the patent office on 2020-07-14 for systems and methods for ranking data visualizations using different data fields. This patent grant is currently assigned to Tableau Software, Inc.. The grantee listed for this patent is Tableau Software Inc.. Invention is credited to Patrick Hanrahan, Jock Douglas Mackinlay, Christopher Richard Stolte.


View All Diagrams
| United States Patent | 10,712,903 |
| Mackinlay , et al. | July 14, 2020 |
Systems and methods for ranking data visualizations using different data fields
Abstract
The implementations described herein include methods and systems for ranking data visualizations. A method is performed at a computing device having one or more processors and memory storing programs for execution by the processors. The method receives user selection of a set of data fields and identifies data visualizations that use each data field in the user-selected set. The method automatically forms modified sets of data fields that each differ from the user-selected set by at most two atomic operations, each selected from: removing or adding a data field; replacing a user-selected data field with a hierarchically narrower or broader data field; or adding, removing, or modifying a filter for a data field. The method identifies alternative data visualizations using each respective modified set, computes a score for each data visualization and alternative data visualization, and presents high scoring data visualizations and high scoring alternative data visualizations to the user.
| Inventors: | Mackinlay; Jock Douglas (Seattle, WA), Stolte; Christopher Richard (Seattle, WA), Hanrahan; Patrick (Portola Valley, CA) | ||||||||||
|---|---|---|---|---|---|---|---|---|---|---|---|
| Applicant: |
|
||||||||||
| Assignee: | Tableau Software, Inc.
(Seattle, WA) |
||||||||||
| Family ID: | 37836577 | ||||||||||
| Appl. No.: | 15/436,706 | ||||||||||
| Filed: | February 17, 2017 |
Prior Publication Data
| Document Identifier | Publication Date | |
|---|---|---|
| US 20170249369 A1 | Aug 31, 2017 | |
Related U.S. Patent Documents
| Application Number | Filing Date | Patent Number | Issue Date | ||
|---|---|---|---|---|---|
| 14549482 | Nov 20, 2014 | 10386989 | |||
| 13352137 | Jan 17, 2012 | 9600528 | |||
| 11223658 | Jan 17, 2012 | 8099674 | |||
| Current U.S. Class: | 1/1 |
| Current CPC Class: | G06F 16/248 (20190101); G06F 16/24578 (20190101); G06F 16/2393 (20190101); G06F 16/283 (20190101); G06F 3/04817 (20130101); G06F 16/2379 (20190101); G06Q 40/025 (20130101); G06F 16/9535 (20190101); G06F 16/252 (20190101); G06T 11/206 (20130101); G06F 3/0482 (20130101) |
| Current International Class: | G06F 16/248 (20190101); G06F 3/0481 (20130101); G06F 16/25 (20190101); G06F 16/28 (20190101); G06F 16/23 (20190101); G06F 16/9535 (20190101); G06Q 40/02 (20120101); G06F 16/2457 (20190101); G06F 3/0482 (20130101); G06T 11/20 (20060101) |
References Cited [Referenced By]
U.S. Patent Documents
| 4800810 | January 1989 | Masumoto |
| 5036314 | July 1991 | Barillari et al. |
| 5060980 | October 1991 | Johnson et al. |
| 5143888 | September 1992 | Olbrich |
| 5144452 | September 1992 | Abuyama |
| 5169713 | December 1992 | Kumurdjian |
| 5265244 | November 1993 | Ghosh et al. |
| 5265246 | November 1993 | Li et al. |
| 5377348 | December 1994 | Lau et al. |
| 5383029 | January 1995 | Kojima |
| 5416895 | May 1995 | Anderson et al. |
| 5461708 | October 1995 | Kahn |
| 5560007 | September 1996 | Thai |
| 5577241 | November 1996 | Spencer |
| 5581677 | December 1996 | Myers et al. |
| 5664172 | September 1997 | Antoshenkov |
| 5664182 | September 1997 | Nierenberg et al. |
| 5668987 | September 1997 | Schneider |
| 5794246 | August 1998 | Sankaran et al. |
| 5864856 | January 1999 | Young |
| 5893088 | April 1999 | Hendricks et al. |
| 5894311 | April 1999 | Jackson |
| 5933830 | August 1999 | Williams |
| 6014661 | January 2000 | Ahlberg |
| 6031632 | February 2000 | Yoshihara et al. |
| 6032158 | February 2000 | Mukhopadhyay et al. |
| 6044374 | March 2000 | Nesamoney et al. |
| 6100901 | August 2000 | Mohda et al. |
| 6115744 | September 2000 | Robins et al. |
| 6137488 | October 2000 | Kraft et al. |
| 6154766 | November 2000 | Yost et al. |
| 6173310 | January 2001 | Yost et al. |
| 6188403 | February 2001 | Sacerdoti et al. |
| 6208990 | March 2001 | Suresh et al. |
| 6222540 | April 2001 | Sacerdoti |
| 6247008 | June 2001 | Cambot et al. |
| 6253257 | June 2001 | Dundon |
| 6260050 | July 2001 | Yost et al. |
| 6269393 | July 2001 | Yost et al. |
| 6300957 | October 2001 | Rao et al. |
| 6301579 | October 2001 | Becker |
| 6317750 | November 2001 | Tortolani et al. |
| 6327628 | December 2001 | Anuff et al. |
| 6339775 | January 2002 | Zamanian et al. |
| 6377259 | April 2002 | Tenev et al. |
| 6397195 | May 2002 | Pinard et al. |
| 6397204 | May 2002 | Liu et al. |
| 6400366 | June 2002 | Davies et al. |
| 6405195 | June 2002 | Ahlberg |
| 6405208 | June 2002 | Raghavan et al. |
| 6411313 | June 2002 | Conlon et al. |
| 6424933 | July 2002 | Agrawala et al. |
| 6490593 | December 2002 | Proctor |
| 6492989 | December 2002 | Wilkinson |
| 6505205 | January 2003 | Kothuri et al. |
| 6522342 | February 2003 | Gagnon et al. |
| 6528217 | March 2003 | Cutter et al. |
| 6529217 | March 2003 | Maguire, III et al. |
| 6581068 | June 2003 | Bensoussan et al. |
| 6590577 | July 2003 | Yonts |
| 6601075 | July 2003 | Huang |
| 6611825 | August 2003 | Billheimer et al. |
| 6626959 | September 2003 | Moise et al. |
| 6643646 | November 2003 | Su et al. |
| 6701485 | March 2004 | Igra et al. |
| 6707454 | March 2004 | Barg et al. |
| 6714897 | March 2004 | Whitney et al. |
| 6725230 | April 2004 | Ruth et al. |
| 6750864 | June 2004 | Anwar |
| 6763308 | July 2004 | Chu et al. |
| 6768986 | July 2004 | Cras et al. |
| 6867788 | March 2005 | Takeda |
| 6906717 | June 2005 | Couckuyt et al. |
| 6920608 | July 2005 | Davis |
| 6928433 | August 2005 | Goodman et al. |
| 6961716 | November 2005 | Rhodes |
| 6985905 | January 2006 | Prompt et al. |
| 7009609 | March 2006 | Miyadai |
| 7089266 | August 2006 | Stolte et al. |
| 7117058 | October 2006 | Lin et al. |
| 7168035 | January 2007 | Bell et al. |
| 7176923 | February 2007 | Vignet |
| 7181450 | February 2007 | Malloy et al. |
| 7250951 | July 2007 | Hurley et al. |
| 7315305 | January 2008 | Crotty et al. |
| 7328407 | February 2008 | MacLaurin |
| 7346839 | March 2008 | Acharya |
| 7366993 | April 2008 | Joffrain |
| 7379601 | May 2008 | Yang et al. |
| 7420562 | September 2008 | Shinohara et al. |
| 7630971 | December 2009 | Arrouye et al. |
| 7694278 | April 2010 | Pasumansky et al. |
| 7716225 | May 2010 | Dean |
| 7725483 | May 2010 | Poyourow et al. |
| 7761784 | July 2010 | Parks et al. |
| 7853456 | December 2010 | Soto et al. |
| 7999809 | August 2011 | Beers et al. |
| 8140391 | March 2012 | Jacobi et al. |
| 8250012 | August 2012 | Whitman |
| 8269773 | September 2012 | Gregg, III |
| 8321781 | November 2012 | Tolle |
| 8412726 | April 2013 | Yan |
| 8860727 | October 2014 | Beers et al. |
| 9053149 | June 2015 | Ebenstein et al. |
| 9792017 | October 2017 | Landefeld et al. |
| 2002/0016699 | February 2002 | Hoggart et al. |
| 2002/0032682 | March 2002 | Kobayashi |
| 2002/0070953 | June 2002 | Barg et al. |
| 2002/0118192 | August 2002 | Couckuyt et al. |
| 2002/0123865 | September 2002 | Whitney et al. |
| 2002/0133441 | September 2002 | Tanaka |
| 2002/0138636 | September 2002 | Buttner et al. |
| 2002/0154118 | October 2002 | McCarthy et al. |
| 2002/0161664 | October 2002 | Shaya et al. |
| 2003/0042928 | March 2003 | Tsai |
| 2003/0071814 | April 2003 | Jou et al. |
| 2003/0154443 | August 2003 | Papierniak |
| 2003/0200034 | October 2003 | Fellenberg et al. |
| 2003/0204511 | October 2003 | Brundage et al. |
| 2004/0181543 | September 2004 | Wu |
| 2004/0183800 | September 2004 | Peterson |
| 2004/0210491 | October 2004 | Sadri |
| 2004/0224577 | November 2004 | Kaji |
| 2004/0227759 | November 2004 | McKnight et al. |
| 2004/0243593 | December 2004 | Stolte et al. |
| 2005/0035966 | February 2005 | Pasquarette et al. |
| 2005/0035967 | February 2005 | Joffrain et al. |
| 2005/0038717 | February 2005 | McQueen, III et al. |
| 2005/0060300 | March 2005 | Stolte et al. |
| 2005/0099423 | May 2005 | Brauss |
| 2005/0210389 | September 2005 | Middelfart |
| 2005/0231392 | October 2005 | Meehan |
| 2005/0234688 | October 2005 | Pinto et al. |
| 2005/0234920 | October 2005 | Rhodes |
| 2006/0020586 | January 2006 | Prompt et al. |
| 2006/0020641 | January 2006 | Walsh et al. |
| 2006/0031187 | February 2006 | Pyrce et al. |
| 2006/0053363 | March 2006 | Bargh et al. |
| 2006/0100873 | May 2006 | Bittner et al. |
| 2006/0101391 | May 2006 | Ulke et al. |
| 2006/0112123 | May 2006 | Clark et al. |
| 2006/0129913 | June 2006 | Vigesaa et al. |
| 2006/0136819 | June 2006 | Tolle et al. |
| 2006/0136825 | June 2006 | Cory et al. |
| 2006/0143205 | June 2006 | Fuchs |
| 2006/0206512 | September 2006 | Hanrahan |
| 2006/0212412 | September 2006 | Sapir |
| 2006/0218499 | September 2006 | Matthews |
| 2006/0229753 | October 2006 | Seskin et al. |
| 2007/0055487 | March 2007 | Habitz et al. |
| 2007/0061344 | March 2007 | Dickerman et al. |
| 2007/0100824 | May 2007 | Richardson et al. |
| 2007/0112844 | May 2007 | Tribble et al. |
| 2008/0059422 | March 2008 | Tenni et al. |
| 2008/0115049 | May 2008 | Tolle et al. |
| 2008/0133573 | June 2008 | Haft et al. |
| 2009/0276399 | November 2009 | Irmak |
| 2009/0300547 | December 2009 | Bates |
| 2010/0191582 | July 2010 | Dicker |
| 2013/0080444 | March 2013 | Wakefield et al. |
| 215657 | Jan 1994 | HU | |||
| WO 1997/012334 | Apr 1997 | WO | |||
| WO 2006/060773 | Jun 2006 | WO | |||
Other References
|
Mackinlay, Pre-Interview Office Action, U.S. Appl. No. 15/632,253, dated Dec. 31, 2018, 4 pgs. cited by applicant . Mackinlay, Final Office Action, U.S. Appl. No. 14/549,482, dated Aug. 23, 2017, 14 pgs. cited by applicant . Mackinlay, Office Action, U.S. Appl. No. 14/549,482, dated Jan. 10, 2018, 13 pgs. cited by applicant . Mackinlay, Office Action, U.S. Appl. No. 14/549,482, dated Sep. 10, 2018, 15pgs. cited by applicant . Mackinlay, First Action Interview Office Action, U.S. Appl. No. 15/632,253, dated Sep. 6, 2019, 20 pgs. cited by applicant . Mackinlay, Notice of Allowance, U.S. Appl. No. 14/549,482, dated Jun. 12, 2019, 7 pgs. cited by applicant . Mackinlay, Office Action, U.S. Appl. No. 16/162,332, dated Jan. 29, 2020, 22 pgs. cited by applicant . Becker, Trellis Graphics Displays: A Multi-Dimensional Data Visualization Tool for Data Mining, 1997, 13 pgs. cited by applicant . Becker, Visualizing Decision Table Classifiers, 1998, 4 pgs. cited by applicant . Beers, Notice of Allowance, U.S. Appl. No. 11/787,761, dated Apr. 8, 2011, 8 pgs. cited by applicant . Beers, Office Action, U.S. Appl. No. 11/787,761, dated Dec. 1, 2010, 16 pgs. cited by applicant . Beers, Office Action, U.S. Appl. No. 11/787,761, dated Jul. 8, 2009, 14 pgs. cited by applicant . Beers, Office Action, U.S. Appl. No. 11/787,761, dated Jun. 12, 2008, 12 pgs. cited by applicant . Beers, Office Action, U.S. Appl. No. 11/787,761, dated Sep. 14, 2010, 12 pgs. cited by applicant . Beers, Office Action, U.S. Appl. No. 11/787,761, dated Dec. 17, 2008, 13 pgs. cited by applicant . Beers, Office Action, U.S. Appl. No. 11/787,761, dated Apr. 28, 2010, 10 pgs. cited by applicant . Beers, Office Action, U.S. Appl. No. 11/787,761, dated Nov. 30, 2009, 14 pgs. cited by applicant . Beers, Office Action, U.S. Appl. No. 14/514,319, dated Jun. 4, 2015, 14 pgs. cited by applicant . Beers, Office Action, U.S. Appl. No. 13/211,048, dated Oct. 11, 2012, 13 pgs. cited by applicant . Beers, Notice of Allowance, U.S. Appl. No. 13/211,048, dated Feb. 3, 2014, 5 pgs. cited by applicant . Beers, Notice of Allowance, U.S. Appl. No. 13/211,048, dated Jun. 3, 2014, 9 pgs. cited by applicant . Bosch, Performance Analysis and Visualization of Parallel Systems Using SimOS and Rivet: A Case Study, Jan. 2000, 12 pgs. cited by applicant . Bosch, Rivet: A Flexible Environment for Computer Systems Visualization, Jan. 2000, 9 pgs. cited by applicant . Brunk, MineSet: An Integrated System for Data Mining, 1997, 4 pgs. cited by applicant . Cleveland, Graphical Perception: Theory, Experimentation, and Application to the Development of Graphical Methods, Sep. 1984, 24 pgs. cited by applicant . Derthick, An Interactive Visual Query Environment for Exploring Data, 1997, 11 pgs. cited by applicant . Freeze, Unlocking OLAP with Microsoft SQL Server and Excel 2000, 2000, pp. 155-332 and 379-422. cited by applicant . Fu, Implementation of Three-dimensional Scagnostics, University of Waterloo, 2009, 61 pgs. cited by applicant . Goldstein, A Framework for Knowledge-Based Interactive Data Exploration, Dec. 1994, 30 pgs. cited by applicant . Gotz, Behavior-Driven Visualization Recommendation, IBM T.J. Watson Research Center, Feb. 8-11, 2009, 10 pgs. cited by applicant . Gray, Data Cube: A Relational Aggregation Operator Generalizing Group-By, Cross-Tab, and Sub-Total, 1997, 25 pgs. cited by applicant . Hanrahan, Notice of Allowance, U.S. Appl. No. 11/005,652, dated May 18, 2010, 4 pgs. cited by applicant . Hanrahan, Office Action, U.S. Appl. No. 11/005,652, dated Feb. 20, 2009, 12 pgs. cited by applicant . Hanrahan, Office Action, U.S. Appl. No. 11/005,652, dated Oct. 23, 2009, 14 pgs. cited by applicant . Hanrahan, Office Action, U.S. Appl. No. 11/005,652, dated Jul. 24, 2008, 11 pgs. cited by applicant . Hanrahan, Office Action, U.S. Appl. No. 11/005,652, dated Dec. 27, 2007, 11 pgs. cited by applicant . Hanrahan, Specification, U.S. Appl. No. 11/005,652, Dec. 2, 2004, 104 pgs. cited by applicant . Healey, on the Use of Perceptual Cues and Data Mining for Effective Visualization of Scientific Datasets, 1998, 8 pgs. cited by applicant . Key, VizDeck: Self-Organizing Dashboards for Visual Analytics, SIGMOD, May 20-24, 2012, 4 pgs. cited by applicant . Kohavi, Data Mining and Visualization, 2000, 8 pgs. cited by applicant . Livny, DEVise: Integrated Querying and Visual Exploration of Large Datasets, May 1997, 12 pgs. cited by applicant . MacDonald, Creating Basic Charts, 2006, 46 pgs. cited by applicant . MacKinlay, Notice of Allowance, U.S. Appl. No. 12/214,818, dated May 13, 2014, 9 pgs. cited by applicant . MacKinlay, Automating the Design of Graphical Presentations of Relational Information, 1986, 34 pgs. cited by applicant . MacKinlay, Show Me: Automatic Presentation for Visual Analysis, 2007, 8 pgs. cited by applicant . MacKinlay, Final Office Action, U.S. Appl. No. 13/352,137, dated Aug. 30, 2016, 14 pgs. cited by applicant . MacKinlay, Office Action, U.S. Appl. No. 13/352,137, dated Feb. 11, 2016, 14 pgs. cited by applicant . MacKinlay, Office Action, U.S. Appl. No. 13/352,137, dated Jul. 27, 2015, 15 pgs. cited by applicant . MacKinlay, Final Office Action, U.S. Appl. No. 13/352,137, dated Apr. 22, 2015, 15 pgs. cited by applicant . MacKinlay, Office Action, U.S. Appl. No. 13/352,137, dated Dec. 12, 2014, 11 pgs. cited by applicant . MacKinlay, Notice of Allowance, U.S. Appl. No. 13/352,137, dated Jan. 17, 2017, 7 pgs. cited by applicant . MacKinlay, Office Action, U.S. Appl. No. 11/223,658, dated Jun. 10, 2010, 22 pgs. cited by applicant . MacKinlay, Office Action, U.S. Appl. No. 11/223,658, dated Nov. 12, 2009, 22 pgs. cited by applicant . MacKinlay, Office Action, U.S. Appl. No. 11/223,658, dated Jan. 21, 2011, 22 pgs. cited by applicant . Mackinlay, Office Action, U.S. Appl. No. 11/223,658, dated May 21, 2008, 20 pgs. cited by applicant . MacKinlay, Office Action, U.S. Appl. No. 11/223,658, dated Feb. 23, 2009, 19 pgs. cited by applicant . MacKinlay, Office Action, U.S. Appl. No. 14/549,482, dated Aug. 6, 2015, 9 pgs. cited by applicant . MacKinlay, Final Office Action, U.S. Appl. No. 14/549,482, dated Mar. 10, 2016, 10 pgs. cited by applicant . MacKinlay, Office Action, U.S. Appl. No. 14/549,482, dated Jun. 10, 2016, 10 pgs. cited by applicant . MacKinlay, Final Office Action, U.S. Appl. No. 14/549,482, dated Sep. 22, 2016, 12 pgs. cited by applicant . MacKinlay, Office Action, U.S. Appl. No. 14/549,482, dated Jan. 13, 2017, 12 pgs. cited by applicant . MacKinlay, Specification, U.S. Appl. No. 11/223,658, Sep. 5, 2005, 58 pgs. cited by applicant . Magyar Szabadalmi Hivatal, HU Search Report, HU P0700460, dated Oct. 9, 2007, 1 pg. cited by applicant . Matching and ranking legal citations, Publication No. WO1997012334A1, Google Patents, https://www.google.com/patents/WO1997012334A1?cl=en&dq=user+ranking+docum- ent+type&hl=en&sa=X&ved=OahUKEwin5K_19YILAhVP&mMKHeU2DO . . . Downloaded on Feb. 20, 2016, 11 pgs. cited by applicant . Miller, The Magical Number Seven, Plus or Minus Two: Some Limits on Our Capacity for Processing Information, Mar. 2014, 19 pgs. cited by applicant . Perlin, An Alternative Approach to the Computer Interface, 1993, 11 pgs. cited by applicant . Rao, The Table Lens: Merging Graphical and Symbolic Representations in an Interactive Focus+Context Visualization for Tabular Information, Apr. 1994, 7 pgs. cited by applicant . Roth, Interactive Graphics Design Using Automatic Presentation Knowledge, Apr. 24-28, 1994, 7 pgs. cited by applicant . Roth, Visage: A User Interface Environment for Exploring Information, Oct. 28-29, 2006, 9 pgs. cited by applicant . Screen Dumps for Microsoft Office Excel 2003 SP2, figures 1-24, 2003, 19 pgs. cited by applicant . Spenke, Focus: The Interactive Table for Product Comparison and Selection, Nov. 6-8, 1996, 10 pgs. cited by applicant . Stevens, On the Theory of Scales of Measurement, Jun. 7, 1946, 4 pgs. cited by applicant . Stolte, Multiscale Visualization Using Data Cubes, 2002, 8 pgs. cited by applicant . Stolte, Notice of Allowance, U.S. Appl. No. 10/453,834, dated Mar. 27, 2006, 3 pgs. cited by applicant . Stolte, Notice of Allowance, U.S. Appl. No. 10/667,194, dated Mar. 5, 2010, 4 pgs. cited by applicant . Stolte, Notice of Allowance, U.S. Appl. No. 11/488,407, dated Dec. 29, 2009, 8 pgs. cited by applicant . Stolte, Notice of Allowance, U.S. Appl. No. 12/821,029, dated Sep. 24, 2012, 8 pgs. cited by applicant . Stolte, Office Action, U.S. Appl. No. 10/667,194, dated Jan. 7, 2008, 10 pgs. cited by applicant . Stolte, Office Action, U.S. Appl. No. 10/667,194, dated Feb. 9, 2009, 11 pgs. cited by applicant . Stolte, Office Action, U.S. Appl. No. 10/667,194, dated Aug. 14, 2007, 16 pgs. cited by applicant . Stolte, Office Action, U.S. Appl. No. 10/667,194, dated Aug. 14, 2008, 10 pgs. cited by applicant . Stolte, Office Action, U.S. Appl. No. 10/667,194, dated Jan. 18, 2007, 15 pgs. cited by applicant . Stolte, Office Action, U.S. Appl. No. 10/667,194, dated Sep. 25, 2009, 10 pgs. cited by applicant . Stolte, Office Action, U.S. Appl. No. 10/667,194, dated Jun. 26, 2006, 13 pgs. cited by applicant . Stolte, Office Action, U.S. Appl. No. 11/488,407, dated Apr. 3, 2009, 6 pgs. cited by applicant . Stolte, Office Action, U.S. Appl. No. 12/821,029, dated Apr. 12, 2011, 9 pgs. cited by applicant . Stolte, Office Action, U.S. Appl. No. 12/821,029, dated Feb. 24, 2012, 10 pgs. cited by applicant . Stolte Office Action, U.S. Appl. No. 13/753,452, dated Feb. 26, 2014, 8 pgs. cited by applicant . Stolte, Final Office Action, U.S. Appl. No. 13/753,452, dated Sep. 16, 2014, 10 pgs. cited by applicant . Stolte, Office Action, U.S. Appl. No. 13/753,452, dated Dec. 2, 2014, 6 pgs. cited by applicant . Stolte, Notice of Allowance, U.S. Appl. No. 13/753,452, dated Mar. 23, 2015, 8 pgs. cited by applicant . Stolte, Polaris: A System for Query, Analysis, and Visualization of Multidimensional Relational Databases, Jan. 2002, 14 pgs. cited by applicant . Stolte, Query, Analysis, and Visualization of Hierarchically Structured Data Using Polaris, Jul. 2002, 11 pgs. cited by applicant . Stolte, Specification, U.S. Appl. No. 10/453,834, Jun. 2, 2003, 114 pgs. cited by applicant . Stolte, Visualizing Application Behavior on Superscalar Processors, 1999, 9 pgs. cited by applicant . Savva, ReVision: Automated Classification, Analysis and Redesign of Chart Images, Oct. 16-19, 2011, 10 pgs. cited by applicant . Sun, Articulate: A Semi-automated Model for Translating Natural Language Queries into Meaningful Visualizations, 2010, 184 pgs. cited by applicant . Tableau Software Inc., IPRP, PCT/US07/009810, Oct. 22, 2008, 7 pgs. cited by applicant . Tableau Software Inc., ISR, PCT/US07/009810, Jul. 7, 2008, 8 pgs. cited by applicant . Tableau Software LLC, IPRP, PCT/US06/35300, Mar. 24, 2009, 5 pgs. cited by applicant . Tableau Software LLC, IPRP, PCT/US2005/043937, Jun. 5, 2007, 9 pgs. cited by applicant . Tableau Software LLC, ISR/WO, PCT/US06/35300, Jul. 7, 2008 6 pgs. cited by applicant . Tableau Software LLC, ISR/WO, PCT/US2005/043937, Apr. 18, 2007, 9 pgs. cited by applicant . The Board of Trustees of the Leland Stanford Jr. University, IPER, PCT/US04/18217, Oct. 19, 2006, 4 pgs. cited by applicant . The Board of Trustees of the Leland Stanford Jr. University, IPRP, PCT/US04/30396, Apr. 19, 2007, 5 pgs. cited by applicant . The Board of Trustees of the Leland Stanford Jr. University, ISR/WO, PCT/US04/18217, Feb. 7, 2006, 6 pgs. cited by applicant . The Board of Trustees of the Leland Stanford Jr. University, ISR/WO, PCT/US04/30396, Aug. 24, 2006, 5 pgs. cited by applicant . The Board of Trustees of the Leland Stanford Jr. University, Supplemental EP Search Report, EP 04754739.3, dated Dec. 17, 2007 , 4 pgs. cited by applicant . Thearling, Visualizing Data Mining Models, 2001, 14 pgs. cited by applicant . Welling, Visualization of Large Multi-Dimensional Datasets, Aug. 11, 2000, 6 pgs. cited by applicant . Wilkinson, nViZn: An Algebra-Based Visualization System, Mar. 21-23, 2001, 7 pgs. cited by applicant . Wilkinson, Graph-Theoretic Scagnostics, Proceedings of the IEEE Information Visualization, 2005, 8 pgs. cited by applicant . Wilkinson, Statistics and Computing--The Grammar of Graphics, New York, 1999, 418 pgs. cited by applicant. |
Primary Examiner: Savla; Arpan P.
Assistant Examiner: Stitt; Erik V
Attorney, Agent or Firm: Morgan, Lewis & Bockius LLP
Parent Case Text
RELATED APPLICATIONS
This application is a continuation of U.S. patent application Ser. No. 14/549,482, filed Nov. 20, 2014, entitled "Computer Systems and Methods for Automatically Viewing Multidimensional Databases," which is a continuation of U.S. patent application Ser. No. 13/352,137, filed Jan. 17, 2012, entitled "Computer Systems and Methods for Automatically Viewing Multidimensional Databases," which is a continuation of U.S. patent application Ser. No. 11/223,658, filed Sep. 9, 2005, entitled "Computer Systems and Methods for Automatically Viewing Multidimensional Databases," now U.S. Pat. No. 8,099,674, each of which is hereby incorporated by reference in its entirety.
Claims
What is claimed is:
1. A method of ranking data visualizations, comprising: at a computing device having one or more processors and memory, wherein the memory stores one or more programs for execution by the one or more processors: receiving user selection of a set of data fields from a set of data; identifying a plurality of data visualizations that use each data field in the user-selected set of data fields; automatically forming a plurality of modified sets of data fields, each differing from the user-selected set by a limited sequence of at most two atomic operations, wherein each of the atomic operations is selected from the group consisting of: removing a single data field from the user-selected set; adding a single data field to the user-selected set; replacing a user-selected data field with a hierarchically narrower data field from the set of data; replacing a user-selected data field with a hierarchically broader data field from the set of data; adding a filter to a data field that limits values retrieved to a specified subset of values; removing a user-selected filter from a data field so that there is no limit on values retrieved for the data field; and modifying a filter for a data field, thereby altering values retrieved for the data field; identifying a plurality of respective alternative data visualizations, each respective alternative data visualization using each data field in a respective one of the modified sets of data fields; for each of the data visualizations and each of the alternative data visualizations, computing a score based on a set of ranking criteria, wherein at least one ranking criterion used to compute each score is based on patterns of data values of one or more of the data fields in the set of data; and presenting data visualization options to the user, wherein the presented options correspond to high scoring data visualizations and high scoring alternative data visualizations.
2. The method of claim 1, wherein the data visualization options are presented to the user in a single ranked list that is ordered according to the computed scores of the data visualizations and the computed scores of the alternative data visualizations.
3. The method of claim 1, wherein the data visualization options are presented to the user in two ranked lists, a first ranked list comprising high scoring data visualizations, ordered according to corresponding computed scores, and a second ranked list comprising high scoring alternative data visualizations, ordered according to corresponding computed scores.
4. The method of claim 1, wherein at least one of the alternative data visualizations is based on a modified set of data fields that differs from the user-selected set of data fields by including an additional data field from the set of data.
5. The method of claim 1, wherein at least one of the alternative data visualizations is based on a modified set of data fields that differs from the user-selected set of data fields by removing a user-selected data field.
6. The method of claim 1, wherein at least one of the alternative data visualizations is based on a modified set of data fields that differs from the user-selected set of data fields by replacing a first user-selected data field with a different data field that is hierarchically narrower than the first user-selected data field.
7. The method of claim 1, wherein at least one of the alternative data visualizations is based on a modified set of data fields that differs from the user-selected set of data fields by replacing a first user-selected data field with a different data field that is hierarchically broader than the first user-selected data field.
8. The method of claim 1, wherein at least one of the alternative data visualizations is based on a modified set of data fields that differs from the user-selected set of data fields by applying a filter to a user-selected data field, thereby limiting values of the user-selected data field to a first set of values, wherein the filter is not selected by the user.
9. The method of claim 1, wherein at least one of the alternative data visualizations is based on a modified set of data fields that differs from the user-selected set of data fields by removing a user-selected filter for a user-selected data field.
10. The method of claim 1, wherein at least one of the alternative data visualizations is based on a modified set of data fields that differs from the user-selected set of data fields by modifying a user-selected filter for a data field, thereby altering values retrieved for the data field.
11. The method of claim 1, further comprising: receiving user selection from the presented data visualization options; and displaying a data visualization on the computing device corresponding to the user-selected option.
12. A computer system for ranking data visualizations, comprising: one or more processors; memory; and one or more programs stored in the memory for execution by the one or more processors, the one or more programs comprising instructions for: receiving user selection of a set of data fields from a set of data; identifying a plurality of data visualizations that use each data field in the user-selected set of data fields; automatically forming a plurality of modified sets of data fields, each differing from the user-selected set by a limited sequence of at most two atomic operations, wherein each of the atomic operations is selected from the group consisting of: removing a single data field from the user-selected set; adding a single data field to the user-selected set; replacing a user-selected data field with a hierarchically narrower data field from the set of data; replacing a user-selected data field with a hierarchically broader data field from the set of data; adding a filter to a data field that limits values retrieved to a specified subset of values; removing a user-selected filter from a data field so that there is no limit on values retrieved for the data field; and modifying a filter for a data field, thereby altering values retrieved for the data field; identifying a plurality of respective alternative data visualizations, each respective alternative data visualization using each data field in a respective one of the modified sets of data fields; for each of the data visualizations and each of the alternative data visualizations, computing a score based on a set of ranking criteria, wherein at least one ranking criterion used to compute each score is based on patterns of data values of one or more of the data fields in the set of data; and presenting data visualization options to the user, wherein the presented options correspond to high scoring data visualizations and high scoring alternative data visualizations.
13. The computer system of claim 12, wherein the data visualization options are presented to the user in a single ranked list that is ordered according to the computed scores of the data visualizations and the computed scores of the alternative data visualizations.
14. The computer system of claim 12, wherein the data visualization options are presented to the user in two ranked lists, a first ranked list comprising high scoring data visualizations, ordered according to corresponding computed scores, and a second ranked list comprising high scoring alternative data visualizations, ordered according to corresponding computed scores.
15. The computer system of claim 12, wherein at least one of the alternative data visualizations is based on a modified set of data fields that differs from the user-selected set of data fields by replacing a first user-selected data field with a different data field that is hierarchically narrower than the first user-selected data field.
16. The computer system of claim 12, wherein at least one of the alternative data visualizations is based on a modified set of data fields that differs from the user-selected set of data fields by replacing a first user-selected data field with a different data field that is hierarchically broader than the first user-selected data field.
17. A non-transitory computer readable storage medium storing one or more programs configured for execution by a computer system having one or more processors and memory storing one or more programs for execution by the one or more processors, the one or more programs comprising instructions for: receiving user selection of a set of data fields from a set of data; identifying a plurality of data visualizations that use each data field in the user-selected set of data fields; automatically forming a plurality of modified sets of data fields, each differing from the user-selected set by a limited sequence of at most two atomic operations, wherein each of the atomic operations is selected from the group consisting of: removing a single data field from the user-selected set; adding a single data field to the user-selected set; replacing a user-selected data field with a hierarchically narrower data field from the set of data; replacing a user-selected data field with a hierarchically broader data field from the set of data; adding a filter to a data field that limits values retrieved to a specified subset of values; removing a user-selected filter from a data field so that there is no limit on values retrieved for the data field; and modifying a filter for a data field, thereby altering values retrieved for the data field; identifying a plurality of respective alternative data visualizations, each respective alternative data visualization using each data field in a respective one of the modified sets of data fields; for each of the data visualizations and each of the alternative data visualizations, computing a score based on a set of ranking criteria, wherein at least one ranking criterion used to compute each score is based on patterns of data values of one or more of the data fields in the set of data; and presenting data visualization options to the user, wherein the presented options correspond to high scoring data visualizations and high scoring alternative data visualizations.
18. The computer readable storage medium of claim 17, wherein the data visualization options are presented to the user in two ranked lists, a first ranked list comprising high scoring data visualizations, ordered according to corresponding computed scores, and a second ranked list comprising high scoring alternative data visualizations, ordered according to corresponding computed scores.
19. The computer readable storage medium of claim 17, wherein at least one of the alternative data visualizations is based on a modified set of data fields that differs from the user-selected set of data fields by replacing a first user-selected data field with a different data field that is hierarchically narrower than the first user-selected data field.
20. The computer readable storage medium of claim 17, wherein at least one of the alternative data visualizations is based on a modified set of data fields that differs from the user-selected set of data fields by replacing a first user-selected data field with a different data field that is hierarchically broader than the first user-selected data field.
Description
FIELD OF THE INVENTION
This invention relates generally to computer systems and methods for displaying data such as database information. The invention relates specifically to a computer system and method for displaying data clearly and effectively based upon the types of data found in a dataset.
BACKGROUND OF THE INVENTION
Data is more than the numbers, values, or predicates of which it is comprised. Data resides in multi-dimensional spaces which harbor rich and variegated landscapes that are not only strange and convoluted, but are not readily comprehendible by the human brain. The most complicated data arises from measurements or calculations that depend on many apparently independent variables. Data sets with hundreds of variables arise today in many contexts, including, for example: gene expression data for uncovering the link between the genome and the various proteins for which it codes; demographic and consumer profiling data for capturing underlying sociological and economic trends; sales and marketing data for huge numbers of products in vast and ever-changing marketplaces; and environmental measurements for understanding phenomena such as pollution, meteorological changes and resource impact issues. International research projects such as the Human Genome Project and the Sloan Digital Sky Survey are also forming massive scientific databases. Furthermore, corporations are creating large data warehouses of historical data on key aspects of their operations. Corporations are also using desktop applications to create many small databases for examining specific aspects of their business.
One challenge with any of these databases is the extraction of meaning from the data they contain: to discover structure, find patterns, and derive causal relationships. Often, the sheer size of these data sets complicates this task and means that interactive calculations that require visiting each record are not plausible. It may also be infeasible for an analyst to reason about or view the entire data set at its finest level of detail. Even when the data sets are small, however, their complexity often makes it difficult to glean meaning without aggregating the data or creating simplifying summaries.
Among the principal operations that may be carried out on data, such as regression, clustering, summarization, dependency modeling, and classification, the ability to see patterns rapidly is of paramount importance. Data comes in many forms, and the most appropriate way to display data in one form may not be the best for another. In the past, where it has been recognized that many methods of display are possible, it has been a painstaking exercise to select the most appropriate one. However, identifying the most telling methods of display can be intimately connected to identifying the underlying structure of the data itself.
Business intelligence is one rapidly growing area that benefits considerably from tools for interactive visualization of multi-dimensional databases. A number of approaches to visualizing such information are known in the art. However, although software programs that implement such approaches are useful, they are often unsatisfactory. Such programs have interfaces that require the user to select the most appropriate way to display the information.
Visualization is a powerful tool for exploring large data, both by itself and coupled with data mining algorithms. However, the task of effectively visualizing large databases imposes significant demands on the human-computer interface to the visualization system. The exploratory process is one of hypothesis, experiment, and discovery. The path of exploration is unpredictable, and analysts need to be able to easily change both the data being displayed and its visual representation. Furthermore, the analyst should be able to first reason about the data at a high level of abstraction, and then rapidly drill down to explore data of interest at a greater level of detail. Thus, a good interface both exposes the underlying hierarchical structure of the data and supports rapid refinement of the visualization.
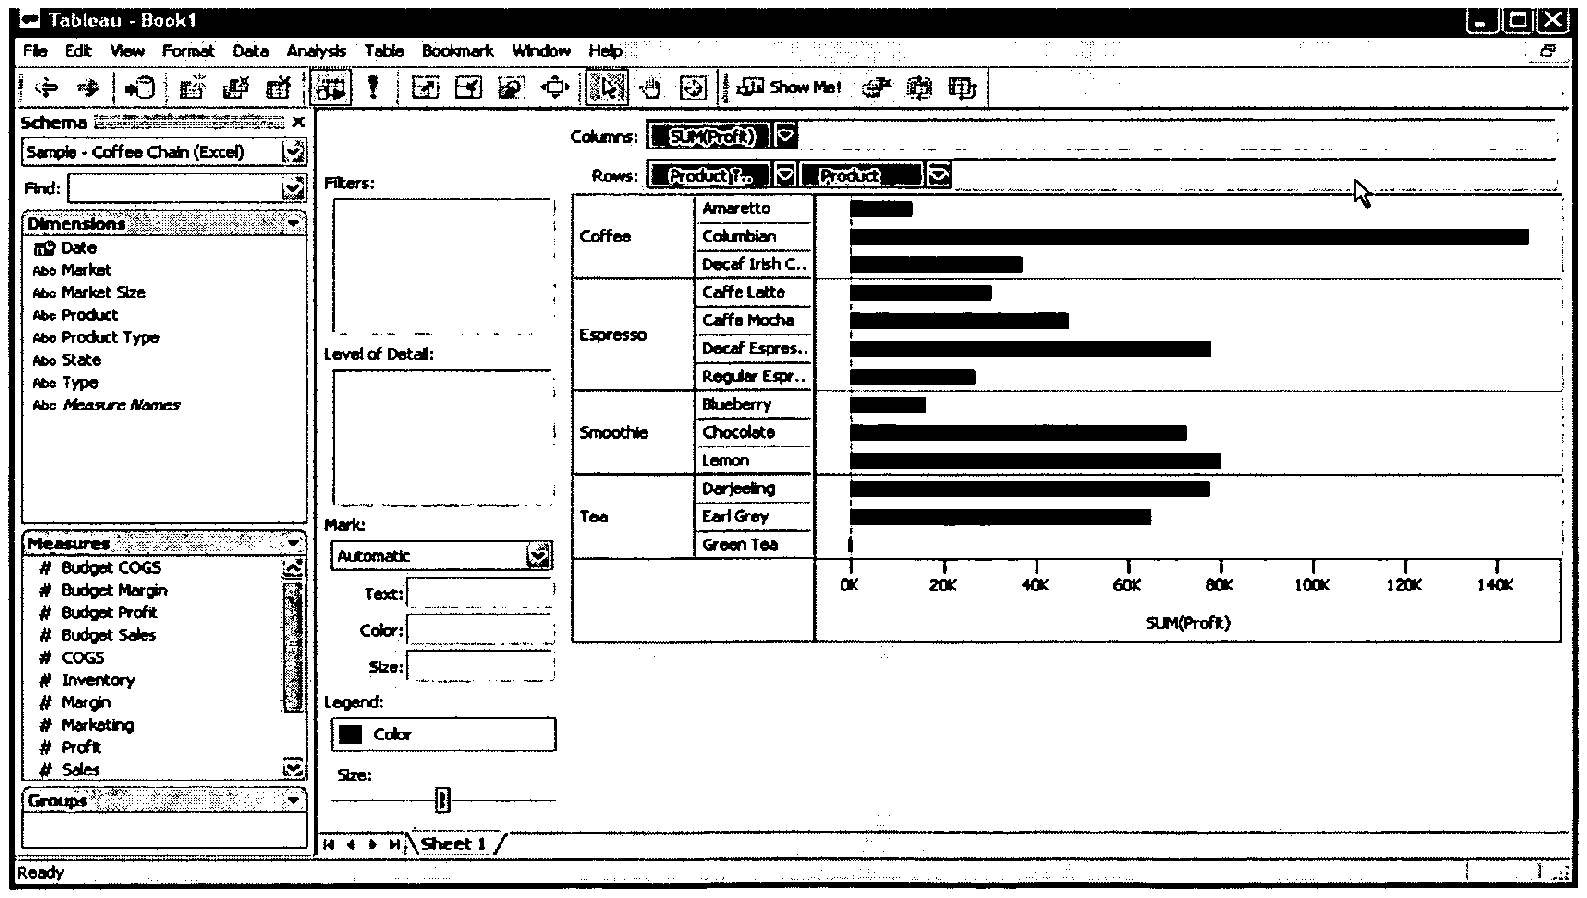
Currently, Tableau's software and Microsoft's Excel are examples of visualization software that create views of datasets. Specifically, Tableau Table Drop allows users to drag data fields onto a Tableau view to create a graphical views. When the view was a text table, the behavior was similar to the drags supported by Excel Pivot Tables. For example, dragging a quantitative data type (Q) onto a text table (X=O Y=O T=Q, where "O" stands for ordinal data), would extend the table to put the two measures next to each other (X=O Y=O,Om T=Qm, where "Om" stands for measure ordinal data and "Qm" stands for measure quantitative data). However, Tableu's Table Drop has functionality not found in Excel's Pivot Tables in that it may change the view type of a view when fields are dragged onto the view. For example, dragging a Q onto a bar chart (X=O Y=Q) created a stacked bar chart (X=O Y=Qm C=Om). Or, if there was already a field with a color encoding (X=O Y=Q C=F) in the view, then the software would transform the Q data into Qm data, and would place the measure names on the Level of Detail encoding (X=O Y=Qm C=F L=Om). With scatter plots, the logic was similar, except the transformation of Q to Qm and placement of measure names on the Level of Detail encoding would be triggered if an existing field already had a shape encoding.
In addition to various software programs, the known art further provides formal graphical presentations. Bertin's Semiology of Graphics, University of Wisconsin Press, Madison Wis., (1983), is an early attempt at formalizing graphic techniques. Bertin developed a vocabulary for describing data and techniques for encoding the data into a graphic. Bertin identified retinal variables (position, color, size, etc.) in which data can be encoded. Cleveland (The Elements of Graphing Data, Wadsworth Advanced Books and Software, (1985), Pacific Grove, Calif.; and Visualizing Data, (1993), Hobart Press) used theoretical and experimental results to determine how well people can use these different retinal properties to compare quantitative variations.
Mackinlay's APT system (ACM Trans. Graphics, 5, 110-141, (1986)) was one of the first applications of formal graphical specifications to computer generated displays. APT uses a graphical language and a hierarchy of composition rules that are searched through in order to generate two-dimensional displays of relational data. The Sage system (Roth, et al., (1994), Proc. SIGCHI '94, 112-117) extends the concepts of APT, providing a richer set of data characterizations and forming a wider range of displays. The existing art also provides for the assignment of a mark based upon the innermost data column and row of a dataset (Hanrahan, et al., U.S. patent application Ser. No. 11/005,652, "Computer System and Methods for Visualizing Data with Generation of Marks"). Heuristically guided searches have also been used to generate visualizations of data (Agrawala, et al., U.S. Pat. No. 6,424,933, "System and Method for Non-Uniform Scaled Mapping").
A drawback with the formal graphical specifications of the art is that they do not provide any guidance to a user as to useful and clear visual formats in which a set of data could be rendered. The rendering of the data is such that there is no analysis to examine the resulting visualization for clarity or usefulness. Further, in the use of heuristic searches (trial-and-error method), the searches fail, leaving the user with the problem of finding clear or useful views. Heuristic algorithms can have complex behavior that creates a poor user experience. When a user does not understand why a heuristic algorithm generates certain views, the algorithm becomes unpredictable to the user and the user will not be inclined to use the algorithm.
Based on the background state of the art, as described herein, what is needed are improved methods and graphical interfaces wherein the initial visualization of data has been determined to be a clear and useful visualization, and this visualization is then automatically presented to the user.
SUMMARY OF THE INVENTION
The present invention provides improved methods for visualizing data.
A first aspect of the invention provides a computer implemented method for automatically and visually displaying a graphical representation of a dataset, comprising: receiving a user selected and ordered plurality of fields; selecting a resulting view for displaying the dataset based on the order of the user selected fields; and displaying the dataset or a transformation of the dataset according to the resulting view. In one embodiment, the dataset is retrieved from a remote database. In another embodiment, rules are used to select the resulting view. In yet another embodiment, the rules are predetermined. In other embodiments, the rules are determined by the user's preferences or usage. In a further embodiment, heuristics are used to select the resulting view.
A second aspect of the invention provides a computer implemented method for automatically and visually displaying a graphical representation of a dataset with a plurality of tuples, comprising: forming a plurality of rated alternative views, each alternative view showing all tuples, or a transformation of all tuples, in the dataset; selecting a resulting view from the plurality of alternative views, based upon a user selected option; and displaying the dataset according to the resulting view. In one embodiment, the dataset is retrieved from a remote database. In another embodiment, rules are used to select the resulting view. In yet another embodiment, the rules are predetermined. In other embodiments, the rules are determined by the user's preferences or usage. In a further embodiment, heuristics are used to select the resulting view. In yet a further embodiment, when the user selected option is a first option, the selecting step further comprises: ranking the plurality of alternative views according to a rating system; and assigning the resulting view as the highest ranked alternative view. In still another embodiment, when the user selected option is a second option, the selecting step further comprises: displaying a list of the alternative views; receiving the user's selection of an alternative view; and assigning the resulting view as the alternative view selected by the user.
A third aspect of the invention provides a computer program product for use in conjunction with a computer system, the computer program product comprising a computer readable storage medium and a computer program mechanism embedded therein, the computer program mechanism for automatically and visually displaying a graphical representation of a dataset, the computer program mechanism comprising: a field receiver for receiving a user selected and ordered plurality of fields; a resulting view selector for selecting a resulting view for displaying the dataset based on the order of the user selected fields; and a dataset displayer for displaying the dataset or a transformation of the dataset according to the resulting view. In one embodiment, the dataset is retrieved from a remote database. In another embodiment, rules are used to select the resulting view. In yet another embodiment, the rules are predetermined. In other embodiments, the rules are determined by the user's preferences or usage. In a further embodiment, heuristics are used to select the resulting view.
A fourth aspect of the invention provides a computer program product for use in conjunction with a computer system, the computer program product comprising a computer readable storage medium and a computer program mechanism embedded therein, the computer program mechanism for automatically and visually displaying a graphical representation of a dataset with a plurality of tuples, the computer program mechanism comprising: an alternative view former for forming a plurality of rated alternative views, each alternative view showing all tuples, or a transformation of all tuples, in the dataset; a resulting view selector for selecting a resulting view from the plurality of alternative views, based upon a user selected option; and a dataset displayer for displaying the dataset according to the resulting view. In one embodiment, the dataset is retrieved from a remote database. In another embodiment, rules are used to select the resulting view. In yet another embodiment, the rules are predetermined. In other embodiments, the rules are determined by the user's preferences or usage. In a further embodiment, heuristics are used to select the resulting view. In yet a further embodiment, when the user selected option is a first option, the resulting view selector further comprises: an alternative view ranker for ranking the plurality of alternative views according to a rating system; and a view assignor for assigning the resulting view as the highest ranked alternative view. In still another embodiment, when the user selected option is a second option, the resulting view selector further comprises: a list displayer for displaying a list of the alternative views; a selection receiver for receiving the user's selection of an alternative view; and a view assignor for assigning the resulting view as the alternative view selected by the user.
A fifth aspect of the invention provides a computer system for automatically and visually displaying a graphical representation of a dataset, the computer system comprising: a central processing unit; a memory, coupled to the central processing unit, the memory storing: the dataset; a programming module comprising, comprising: instructions for receiving a user selected and ordered plurality of fields; instructions for selecting a resulting view for displaying the dataset based on the order of the user selected fields; and instructions for displaying the dataset or a transformation of the dataset according to the resulting view. In one embodiment, the dataset is retrieved from a remote database. In another embodiment, rules are used to select the resulting view. In yet another embodiment, the rules are predetermined. In other embodiments, the rules are determined by the user's preferences or usage. In a further embodiment, heuristics are used to select the resulting view.
A sixth aspect of the invention provides a computer system for automatically and visually displaying a graphical representation of a dataset with a plurality of tuples, the computer system comprising: a central processing unit; a memory, coupled to the central processing unit, the memory storing: the dataset; a programming module comprising: instructions for forming a plurality of rated alternative views, each alternative view showing all tuples, or a transformation of all tuples, in the dataset; instructions for selecting a resulting view from the plurality of alternative views, based upon a user selected option; and instructions for displaying the dataset according to the resulting view. In one embodiment, the dataset is retrieved from a remote database. In another embodiment, rules are used to select the resulting view. In yet another embodiment, the rules are predetermined. In other embodiments, the rules are determined by the user's preferences or usage. In a further embodiment, heuristics are used to select the resulting view. In yet a further embodiment, when the user selected option is a first option, the instructions for selecting further comprises: instructions for ranking the plurality of alternative views according to a rating system; and instructions for assigning the resulting view as the highest ranked alternative view. In still another embodiment, when the user selected option is a second option, the instructions for selecting further comprises: instructions for displaying a list of the alternative views; instructions for receiving the user's selection of an alternative view; and instructions for assigning the resulting view as the alternative view selected by the user.
BRIEF DESCRIPTION OF THE DRAWINGS
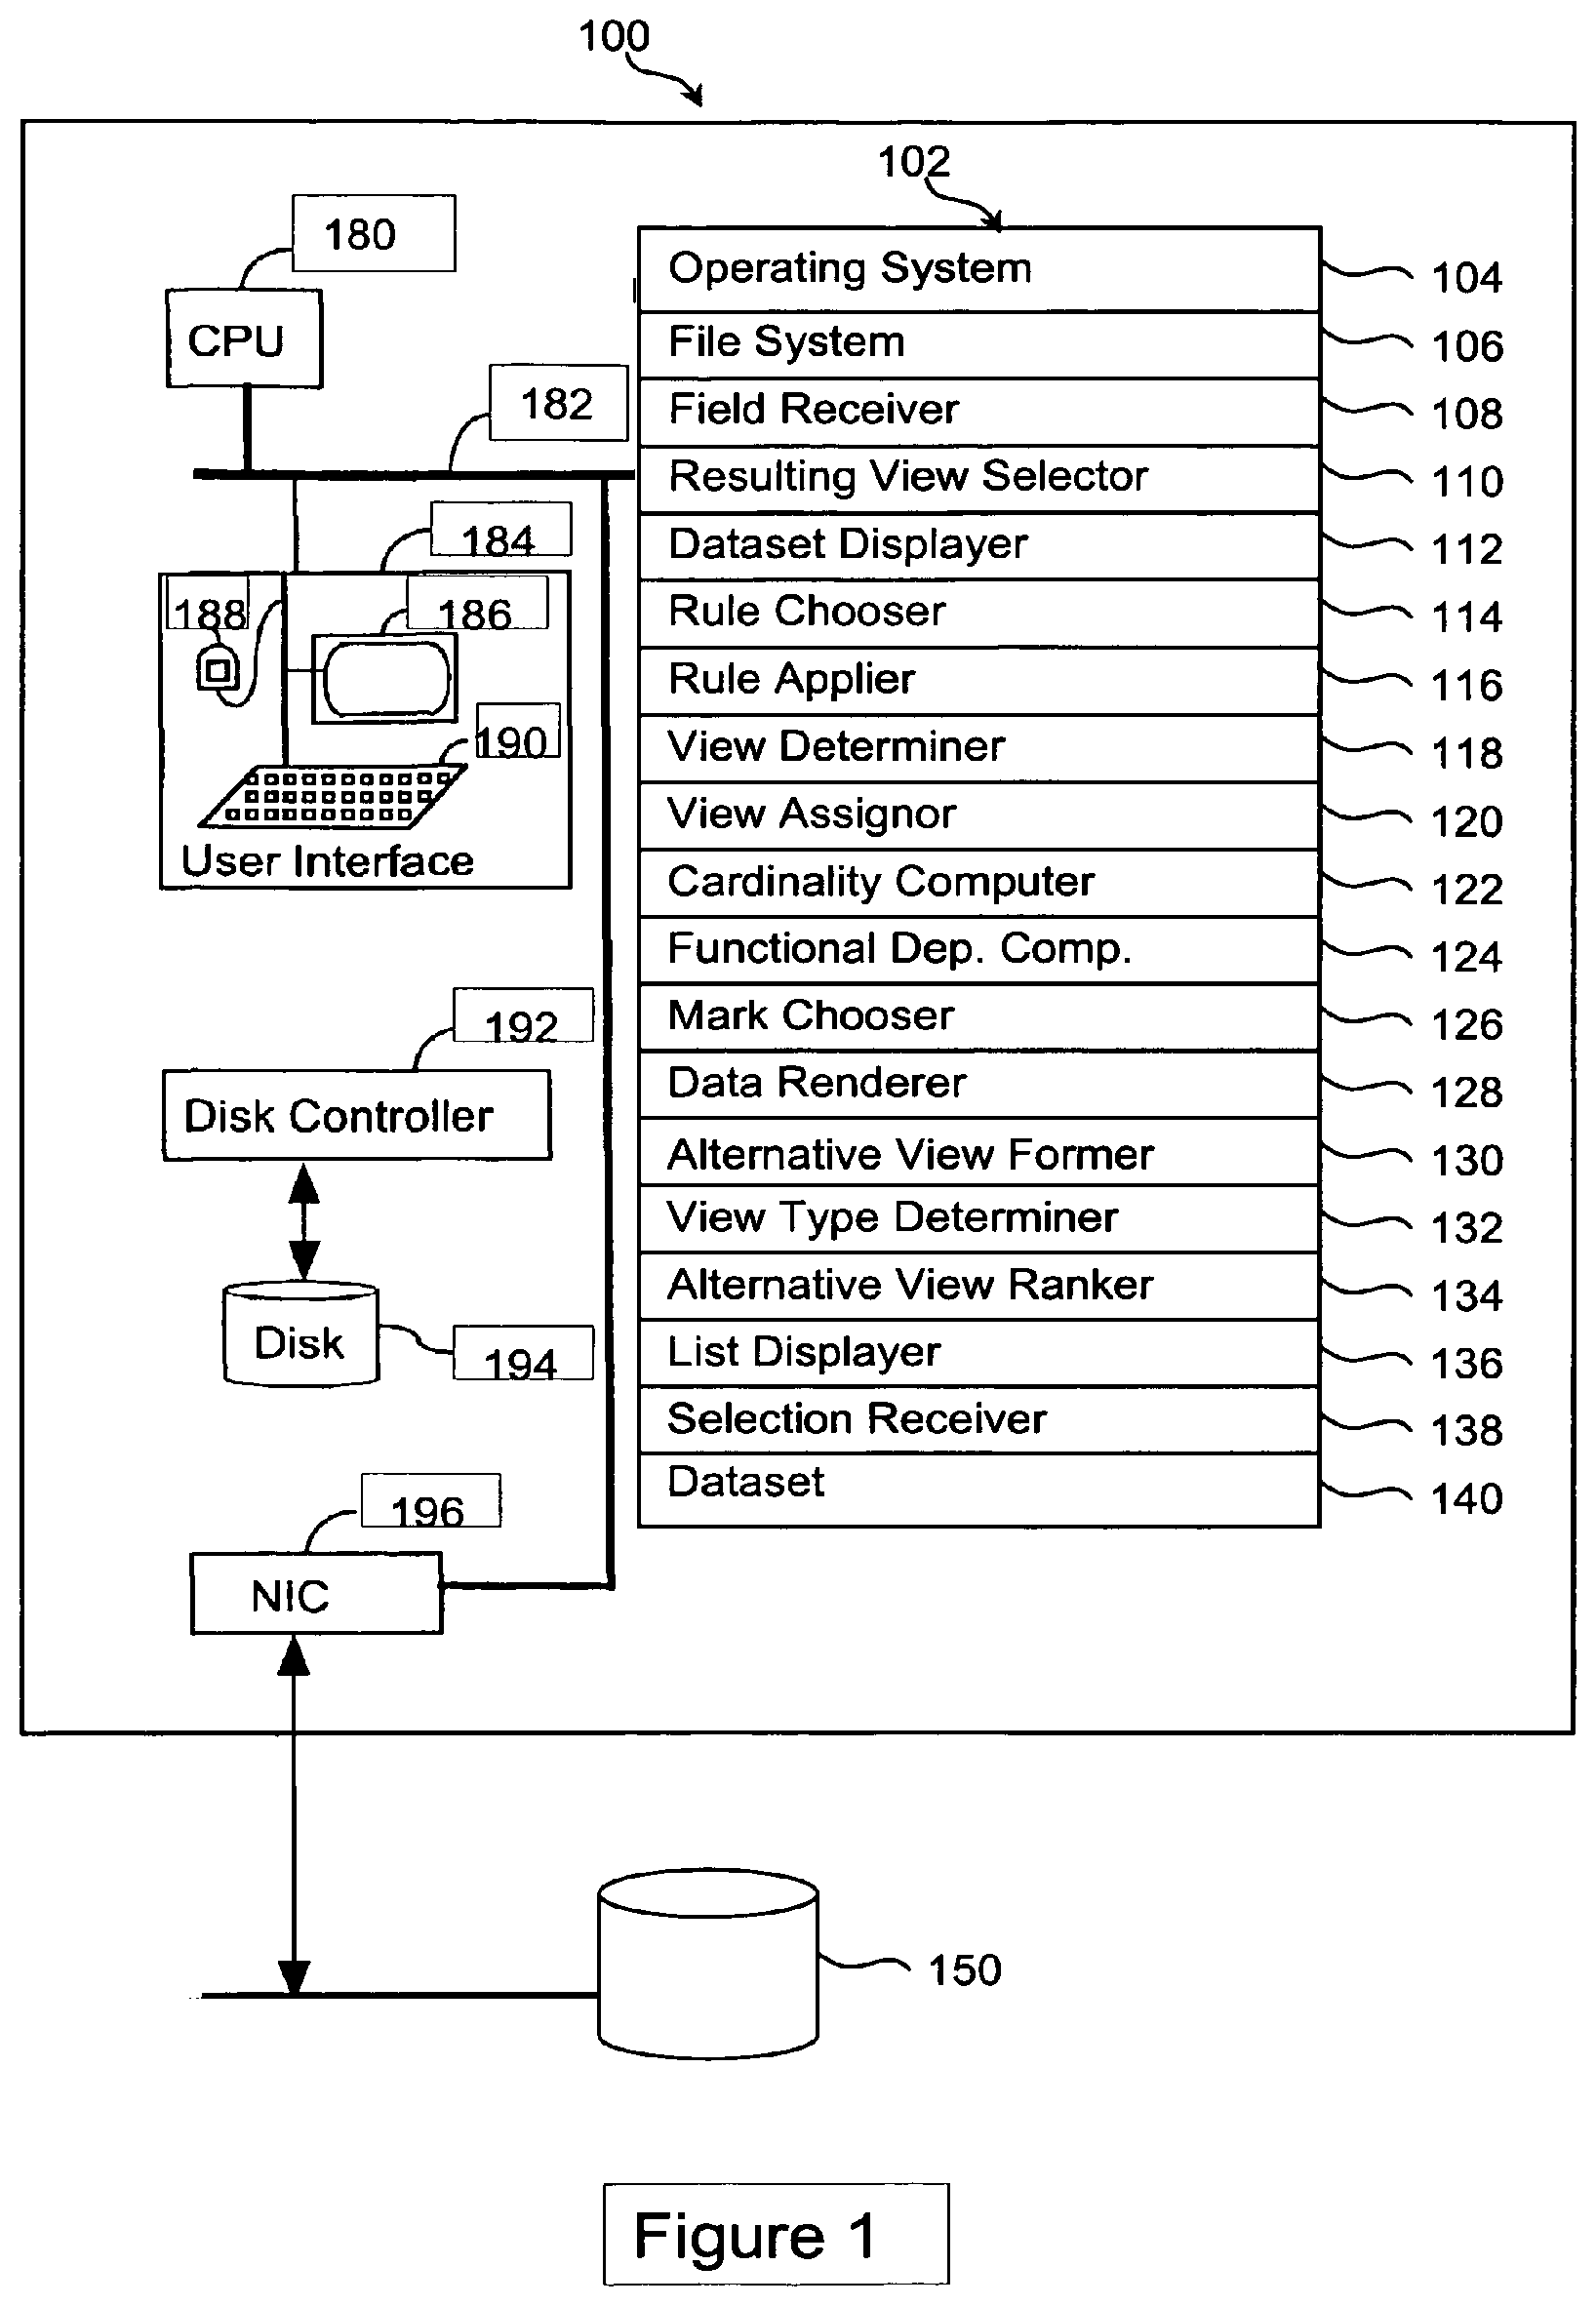
FIG. 1 is an illustration of a computer system that facilitates the visualization of a dataset in a clear and useful form.
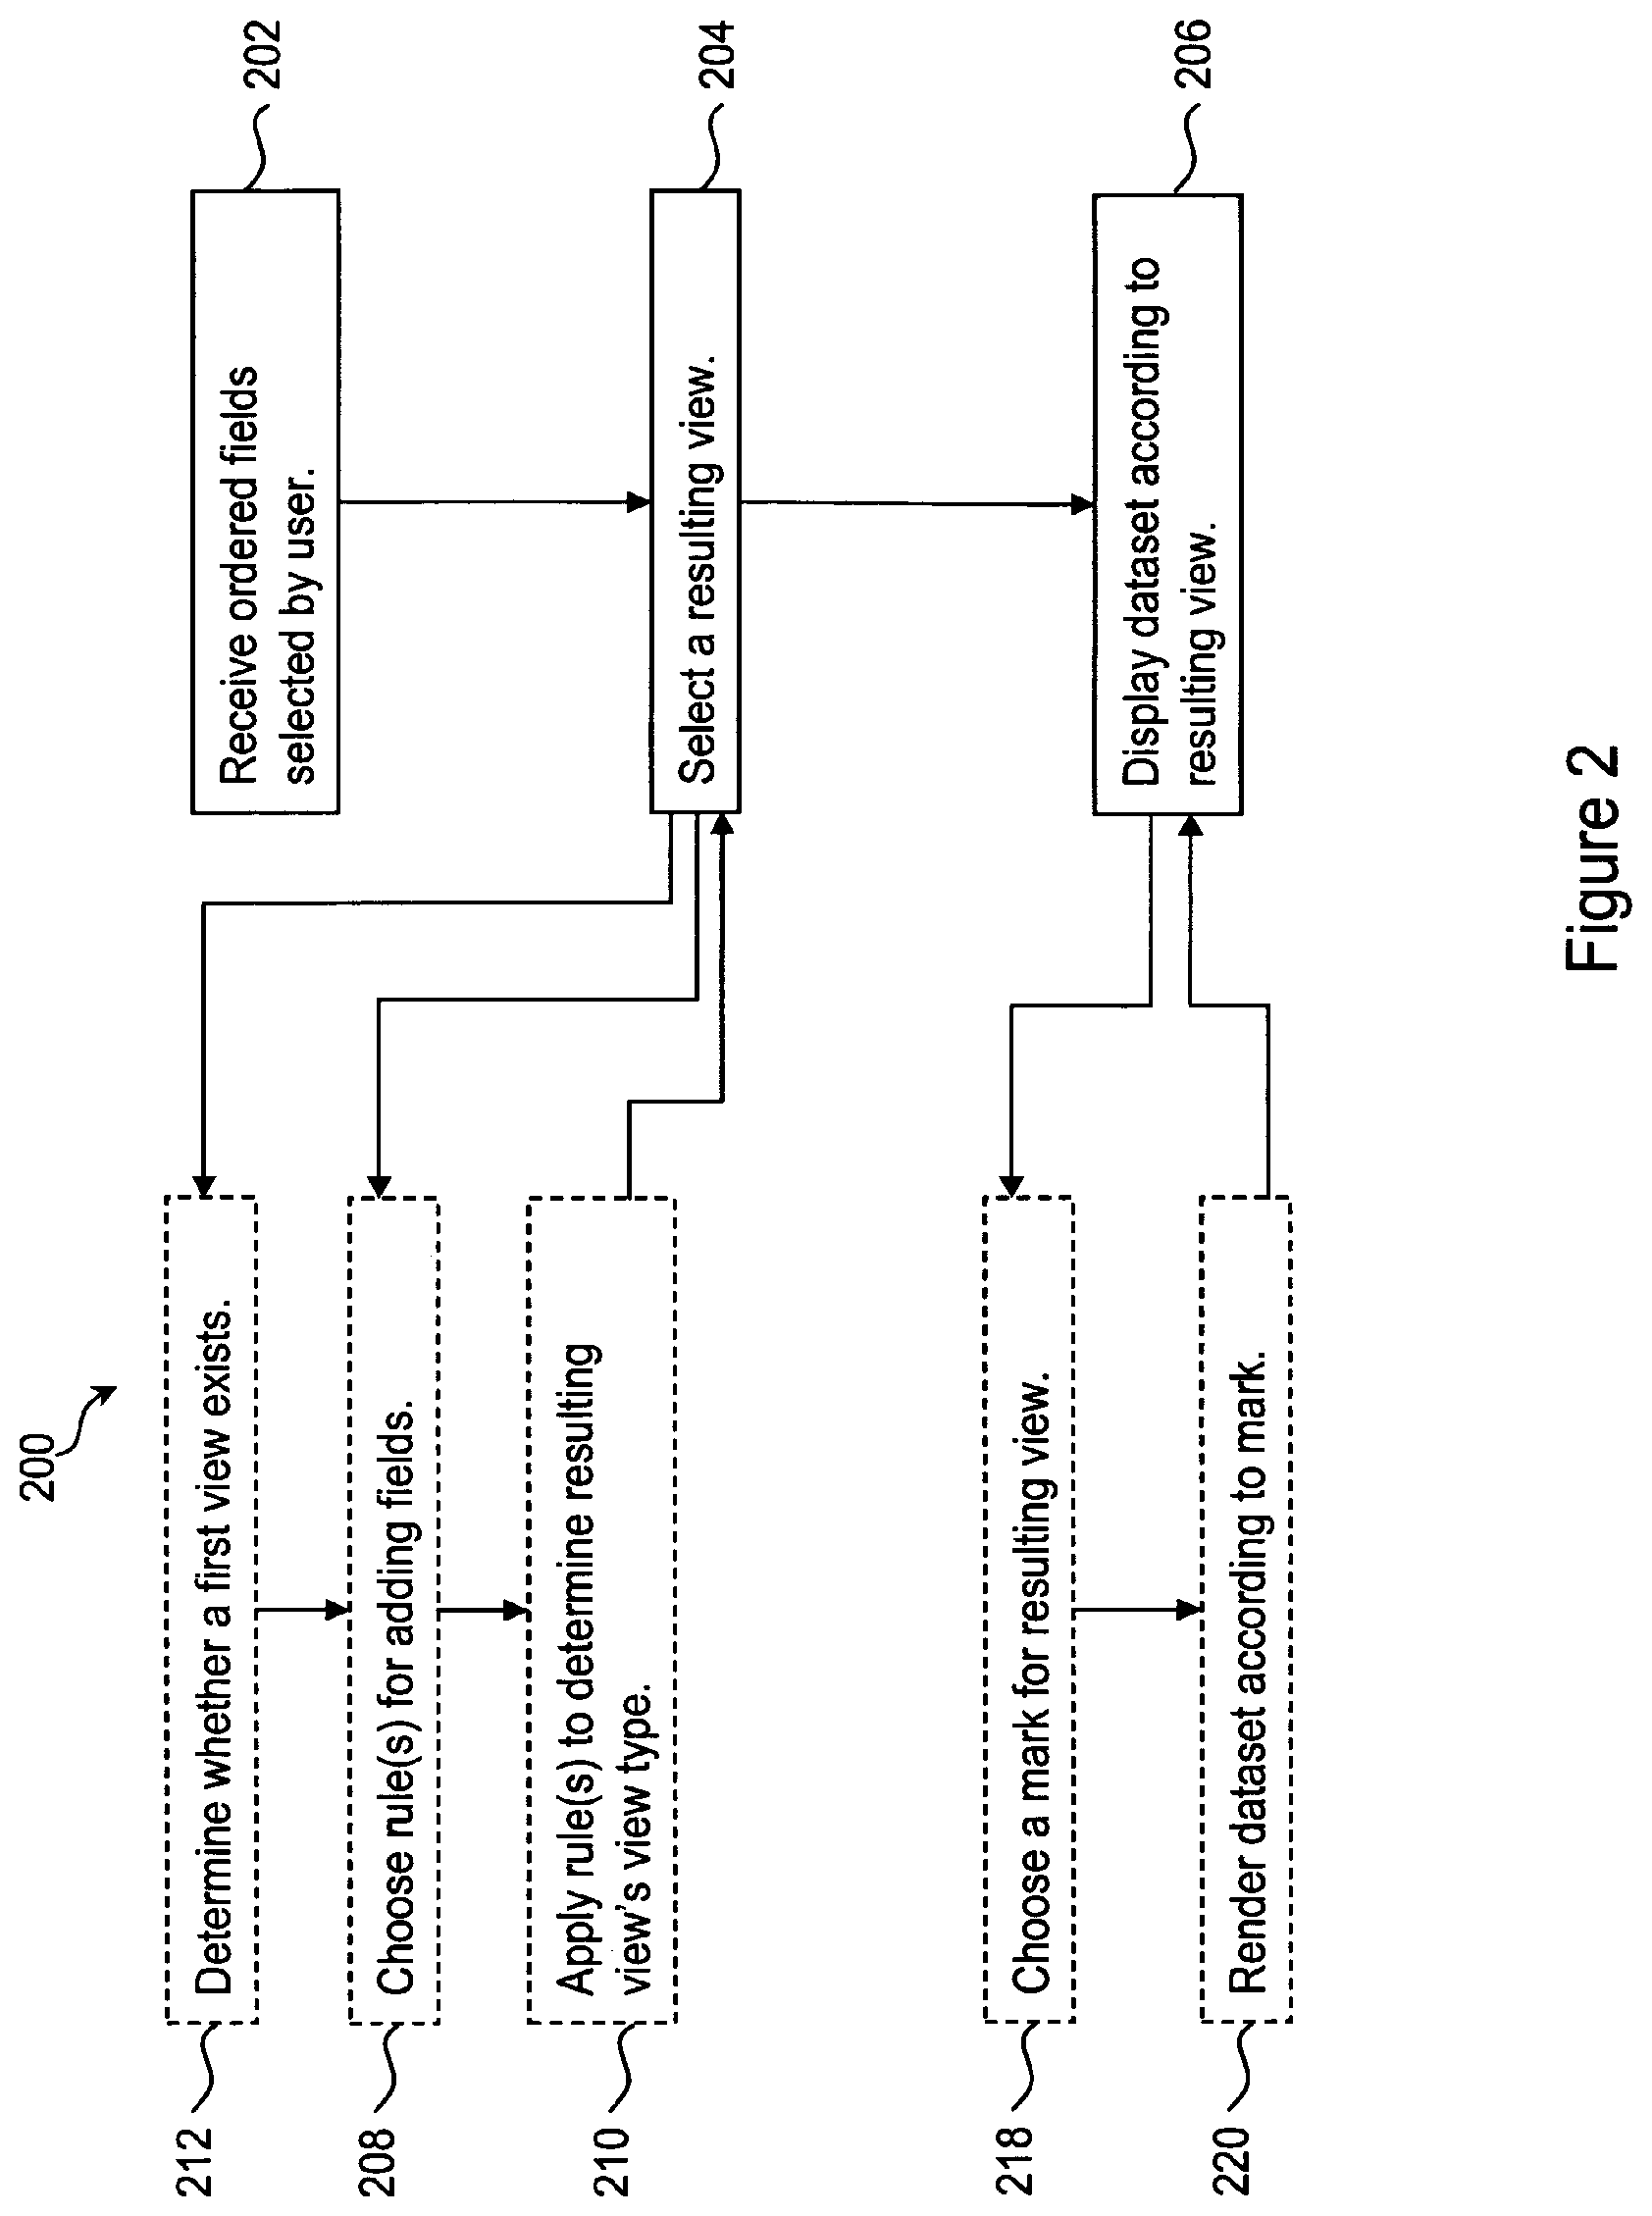
FIG. 2 is a flowchart of the steps through which a system proceeds in one embodiment of the present invention.
FIGS. 3a and 3b are illustrations of one way of presenting an embodiment of the present invention to a user.
FIGS. 4a-4i are rules whereby a field may be added to an existing view or whereby a field may be used as the only field in a view.
FIGS. 5a-5c are examples of different views of a single dataset.
FIGS. 6a and 6b are flowcharts of the steps through which a system proceeds in another embodiment of the present invention.
FIG. 7 is a table showing the criteria for forming views of a dataset and a rating system for one embodiment of the present invention.
FIGS. 8a-8l are resulting views, based upon an embodiment of the present invention.
Like reference numerals refer to corresponding parts throughout the several views of the drawings.
DETAILED DESCRIPTION OF THE INVENTION
The present invention provides methods, computer program products, and computer systems for automatically providing a user with a clear and useful view of a dataset. In a typical embodiment, the present invention builds and displays a view of a dataset as a user adds fields to the dataset or as a dataset is accessed, such that the view is clear and useful, and is automatically presented to the user. An advantage of the present invention is that data is presented in a clear and useful form automatically.
The present invention operates on a set of data, called a dataset, that are made up of tuples. As one skilled in the art will realize, the dataset can be a relational database, a multidimensional database, a semantic abstraction of a relational database, or an aggregated or unaggregated subset of a relational database, multidimensional database, or semantic abstraction. Fields are categorizations of data in a dataset. A tuple is an item of data (such as a record) from a dataset, specified by attributes from fields in the dataset. A search query across the dataset will return one or more tuples. Fields contain data that are of particular types, and each field is of a particular type. These types include:
TABLE-US-00001 Data Type Symbol Ordinal O Ordinal time (date) Ot Dependent ordinal Od (categorical measure) Measure names Om Quantitative Q Independent Quantitative Qi (dimension) Dependent Quantitative Qd (measure) Measure values Qm Quantitative time Qt Quantitative position Qx
Measure names may include an ordinal field whose domain is the name of one or more Qd fields. Measure values may include a dependent quantitative field whose domain and values are the blending of the Qd fields whose names appear in the domain of measure names.
A view is a visual representation of a dataset or a transformation of that dataset. Text table, bar chart, and scatter plots are all examples of types of views. Views contain marks that represent one or more tuples in a dataset. In other words, marks are visual representations of tuples in a view. A mark is typically associated with a type of graphical display. Some examples of views and their associated marks are as follows:
TABLE-US-00002 View Type Associated Mark Table Text Scatter Plot Shape Bar Chart Bar Gantt Plot Bar Line Graph Line Segment Circle Graph Circle
FIG. 1 is an illustration of a computer system that facilitates the visualization of a dataset in a clear and useful form. System 100 includes memory 102, CPU 180, user interface 184, storage unit 194, disk controller 192, and bus 182 that connects all of system 100's elements together. System 100 may also have network connection 196 for communication with other systems on a network. System 100 also includes memory 102, which stores operating system 104, file system 106, as well as various other modules related to the present invention. Additionally, memory 102 may also store dataset 140, which contains tuples. System 100 may also be connected to database 150 where a dataset may be retrieved and stored in memory 102. Memory 102 also stores computer program mechanisms that are necessary to some embodiments of the present invention.
In FIG. 2, flowchart 200 describes the steps through which a system proceeds in one embodiment of the invention. At step 202, ordered fields selected by a user are received. A resulting view is selected at step 204, and the dataset is displayed at step 206 according to the resulting view.
The computer system modules used to perform this embodiment of the invention are shown in FIG. 1. Field receiver 108 performs step 202 by receiving ordered fields selected by the user. Resulting view selector 110 performs step 204 and selects a resulting view. Dataset displayer 112 performs step 206 and displays the dataset according to the resulting view.
According to one embodiment of the invention, resulting view selector 110 selects the resulting view by choosing rule(s) for adding the user selected ordered fields (step 208). This is accomplished by rule chooser 114. Rule applier 116 then applies the rule(s) to determine the resulting view's view type (step 210). In another embodiment of the invention, before rule chooser 114 chooses rule(s), view determiner 118 determines whether a first view exists (step 212). In yet another embodiment of the invention, the dataset is displayed in step 206 when mark chooser 126 chooses a mark for the resulting view (step 218), and dataset renderer 128 renders the dataset according to the mark (step 220).
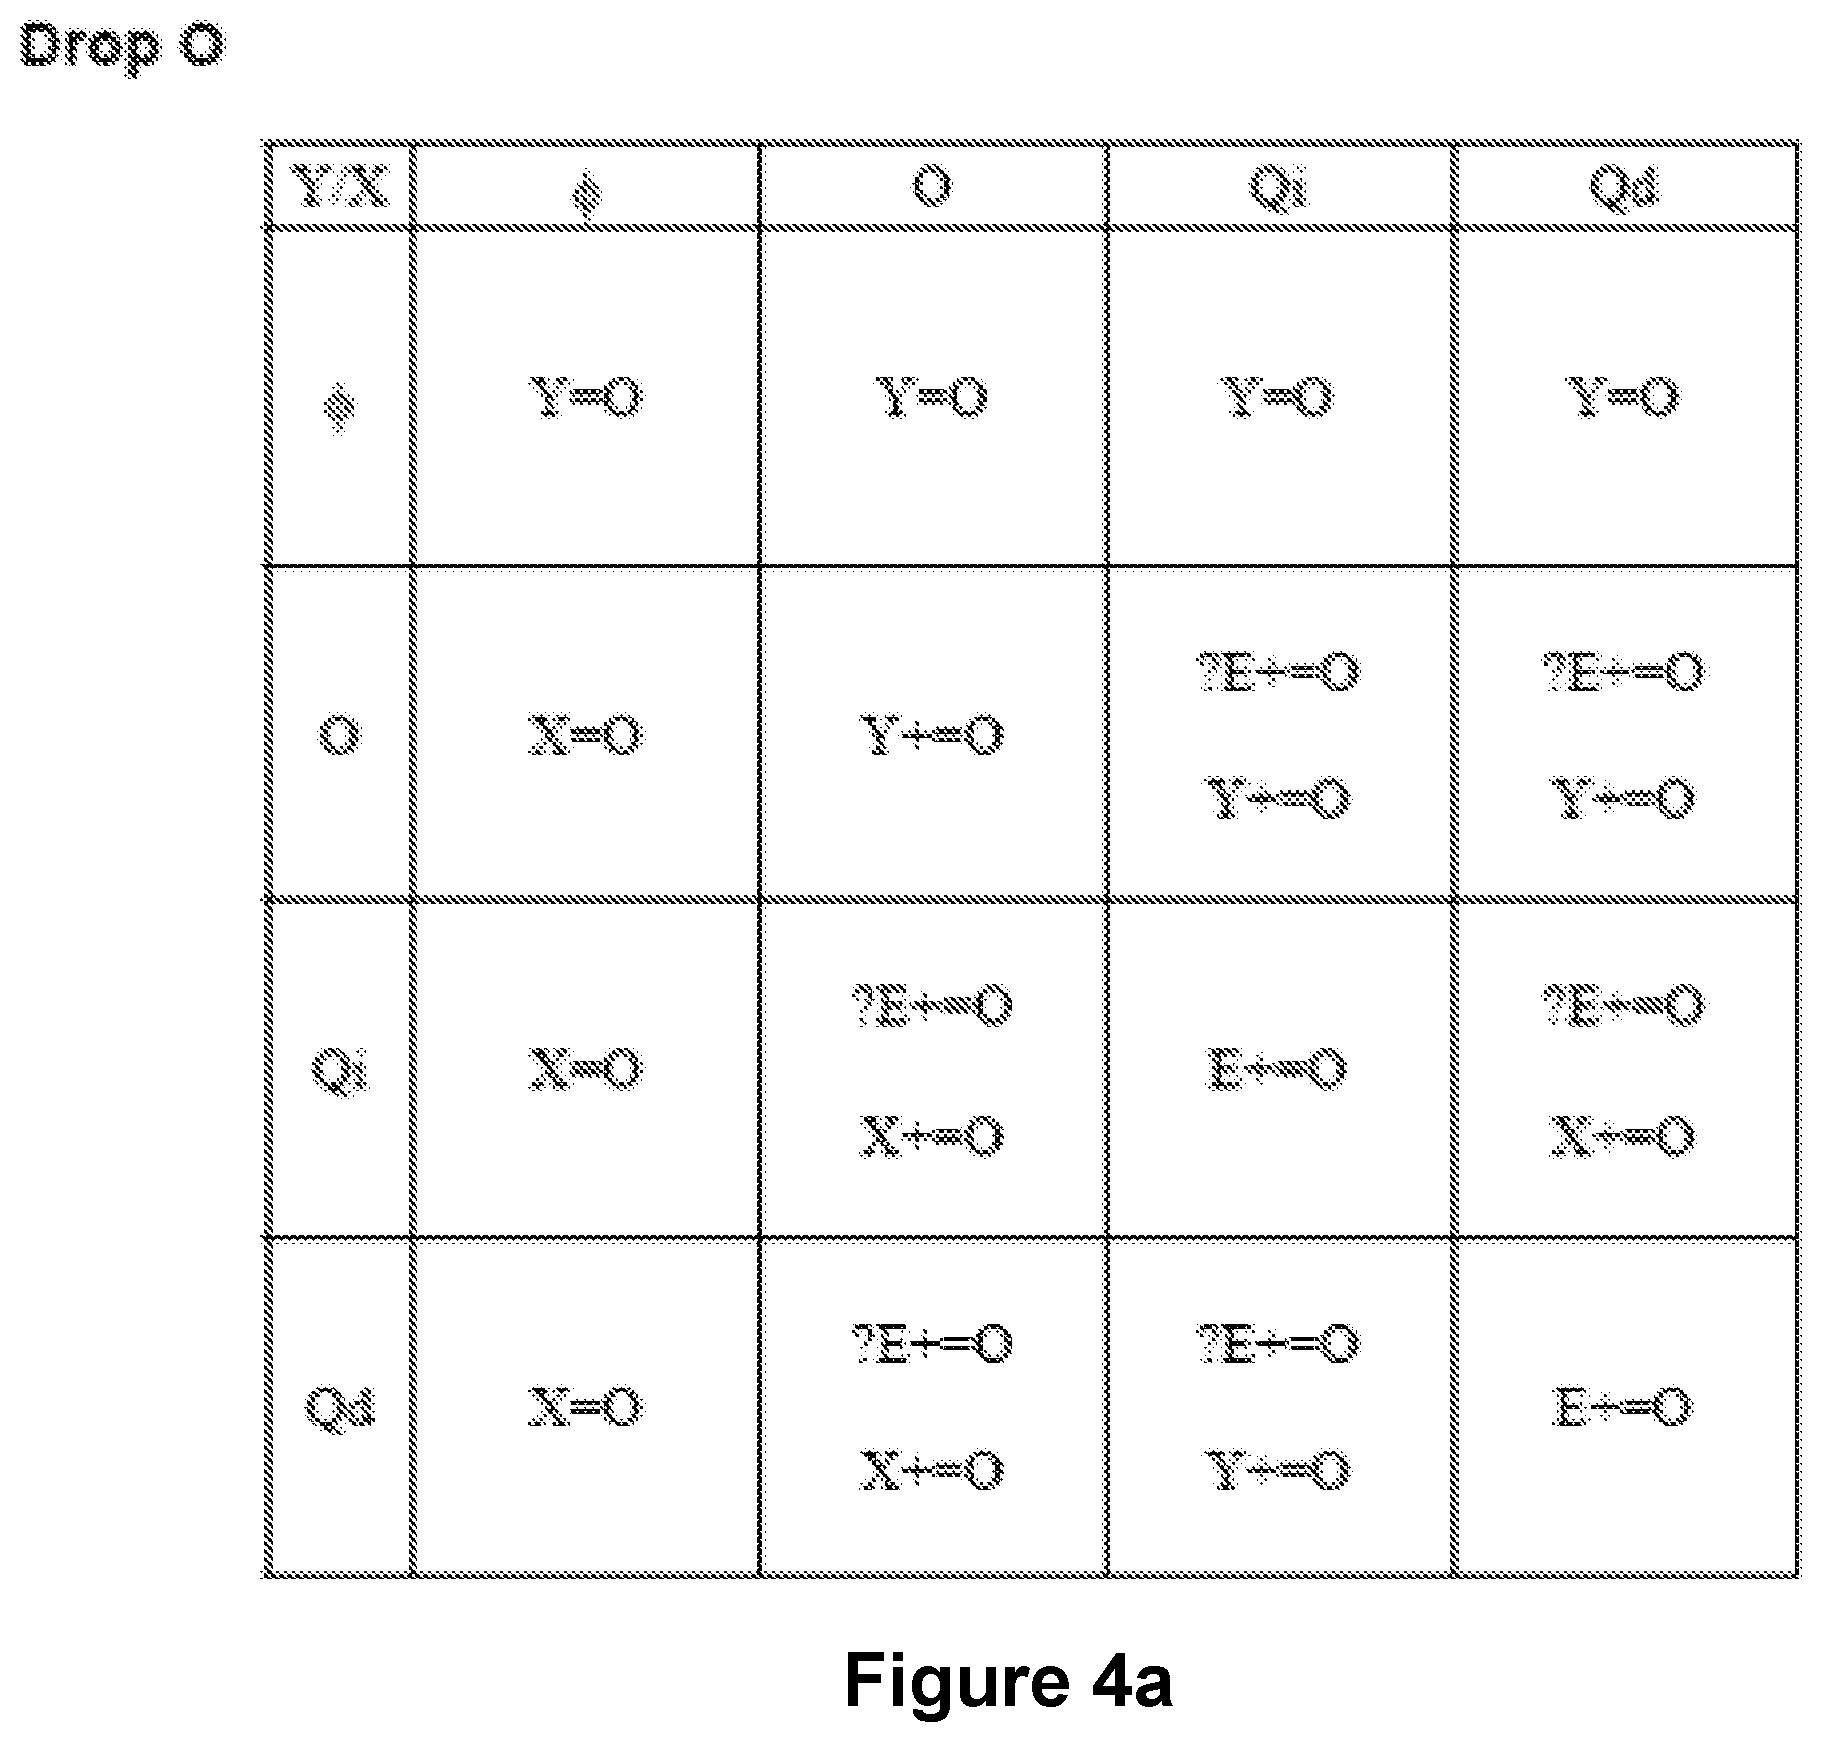
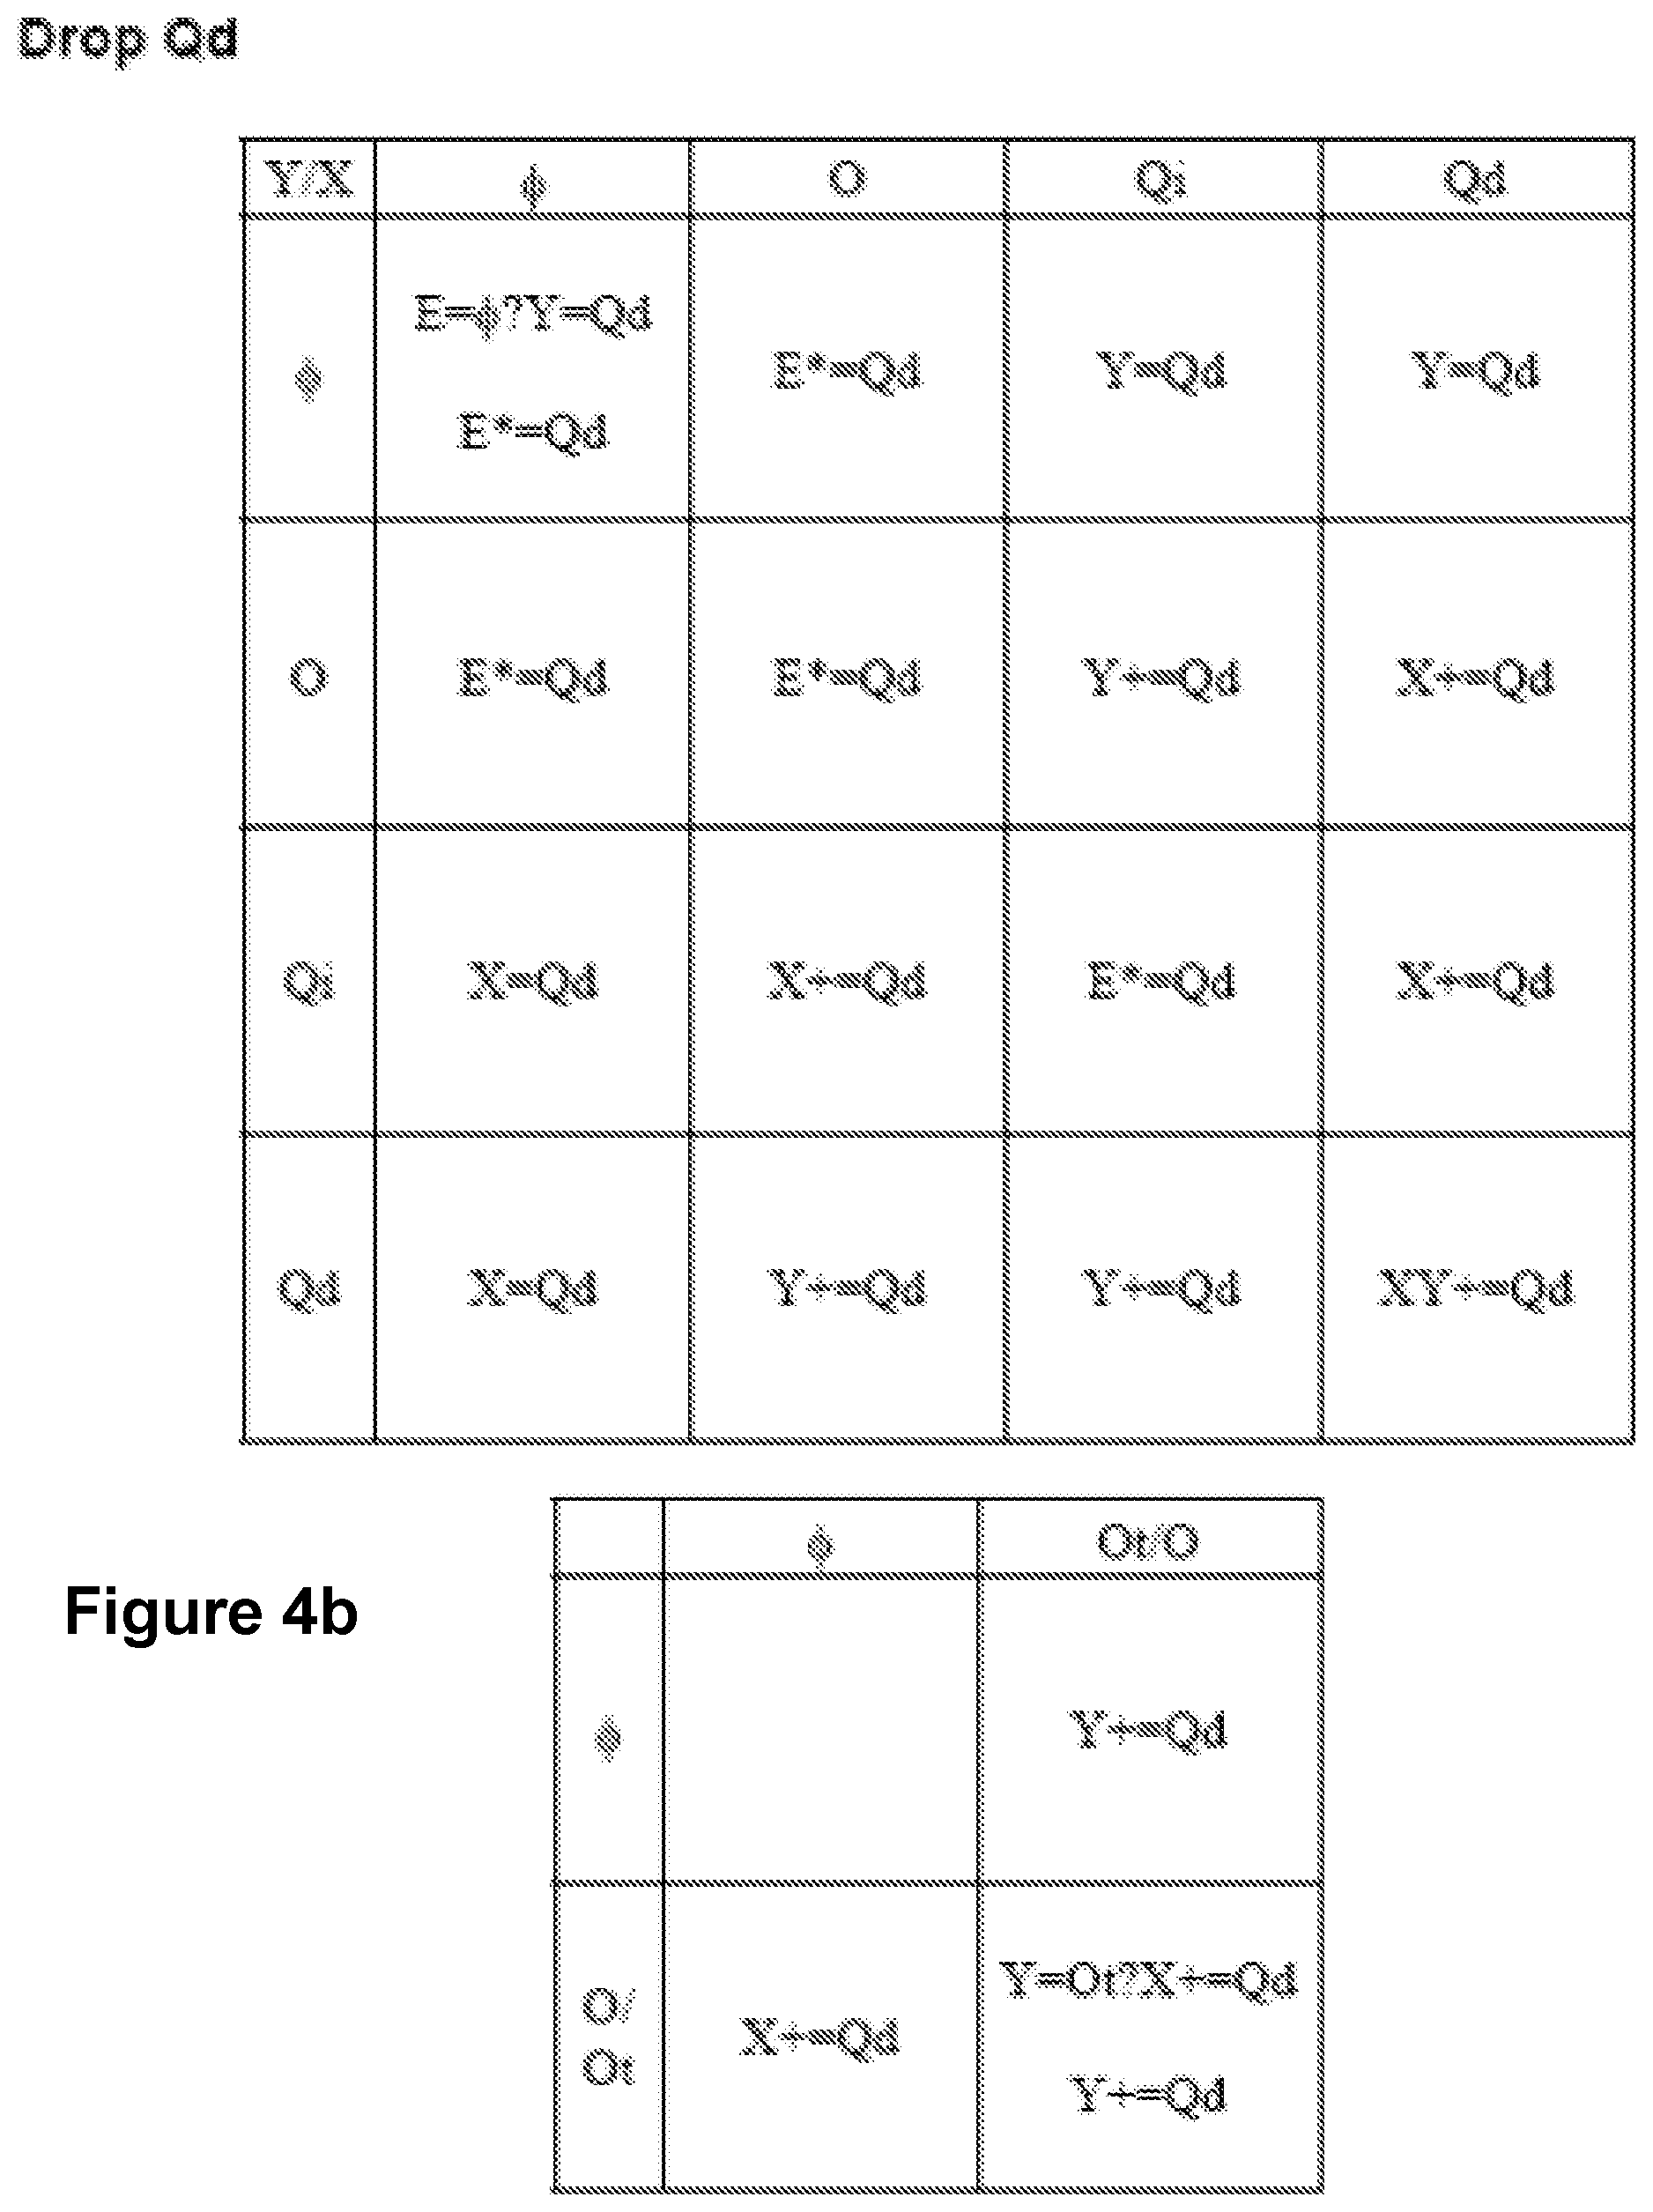
FIGS. 4a-4i show sets of rules that are associated with adding (or "dropping") fields with particular data types. The field may be the only field in a view, or the field may be in addition to fields already in an existing view. When dropping a field, the field is added either as a column or a row, or it may be encoded. Encodings include color, size, and shape to represent a value. For example, red may represent all values between 1 and 10. The following convention is used for operators in the rules shown in FIGS. 4a-4i ("E" designates encoding):
TABLE-US-00003 Operator Limitations = Assign field to a clause Left hand side is a column or row += Add field to the end of the clause Right hand side must be (some rearrangements may occur) O or Qd *= Blend field with column or row Right hand side must be Qd (blend Qd with first E accepting/containing a Qd). The blend will result in Qm being on column or row, and an Om being added to the view. ? Guard the action. Only add if the Unary column or row accepts the field and the cardinality of the field is less than the cardinality associated with the column or row.
The sets of rules are organized first by the type of the field that is dropped (e.g. O or Qd), and then by the type of the view that the field is being dropped onto. The rules are further broken down by the type of the view. The type of a view depends on their innermost row and column. For example, OO is a view with ordinal fields in the row and column; OQ is a view with an ordinal field in the row and a quantitative field in the column; and .PHI. is an empty view with no fields. For each type of field being dropped, a rule table is shown containing the rules for each type of view into which the field is being dropped. The columns of the rule tables represent the contents of the innermost field on the column (X), and the rows of the rules table the innermost field on the row (Y).
In step 208, rule(s) for adding the user selected field's data type are chosen. For example, if a user selected field is an ordinal, then the set of rules in FIG. 4a would be used. Or, if a user selected field is an independent quantitative, then the set of rules in FIG. 4d would be used. If in step 212 view determiner 118 determines that no first view exists, then rule chooser 114 would choose the rule in row 1 column 1 of FIG. 4a as the rule in step 208. If in step 212 view determiner 118 determines that a first view exists, and the first view contains an independent quantitative field in the innermost column and an independent quantitative field in the innermost row of the first view, then rule chooser 114 would select the rule in row 3 column 3 of FIG. 4a as the rule in step 208. Finally, in step 210, rule applier 116 applies the rule selected by rule chooser 114. If no first view exists, then the resulting view will contain a single column (Y=O). If the first view was of the QiQi type, then the resulting view will contain an encoded field (E+=O).
Notes for FIG. 4a: E+=O adds to shape then color then Z. The O is always added. ?E+=O conditionally adds to shape then color. O is only added if the encoding is empty. And if the cardinality of the field is less than the cardinality supported by the encoding. In the above rules, the shape shelf is only considered if the mark is shape. Nothing is dropped on an encoding if the mark is a bar. That is, the guarded rule always fails. We try to avoid stacking of bars (more generally, nothing is dropped if we are stacking because we don't know if the field supports stacking (is additive)). The Qi row represents Qi on the Y axis. These cases are rare because Qi is normally placed on the X axis.
Notes for FIG. 4b: The guard E=.PHI.? checks whether the encoding (text or size) is empty. E*=Qd first tries to add to text then size then color then Z. ?E*=Qd first tries to add to text then size. In the above rules, the text shelf is only considered if the mark is text. An encoding accepts the Qd if it is empty or already contains a Qd. It does not accept the Qd if it contains an O. If the field accepting the encoding contains a Qd or a Qm, then the new Qd is blended with the contents to produce a Qm. If an Om is generated by the blend, it is added to the column shelf if that shelf is empty, otherwise it is added to the row shelf. The Ot rules take precedence over the O rules. The guard Y=Ot? checks whether the Y shelf contains an Ot. The Ot rows represent Ot on the Y axis. This should be rare since best practices dictate that Ot should be on the X axis. XY+=Qd converts to a matrix of scatterplots. All Qds on the rows and columns are the same.
Conversions for FIG. 4b: The .PHI..PHI. rules will drop Qd on the Y axis, unless the text or size encoding contains a Qd. That is, if we are building a text table, continue to build a text table; otherwise make a chart. The OO rules continue to add measures to the text table. The Qi.PHI. and QiO rules create QiQd (line) graphs. The .PHI.Qd rules create QdQd scatterplots. The OQd rules create stacked charts. The QdQd rule creates a matrix of scatterplots.
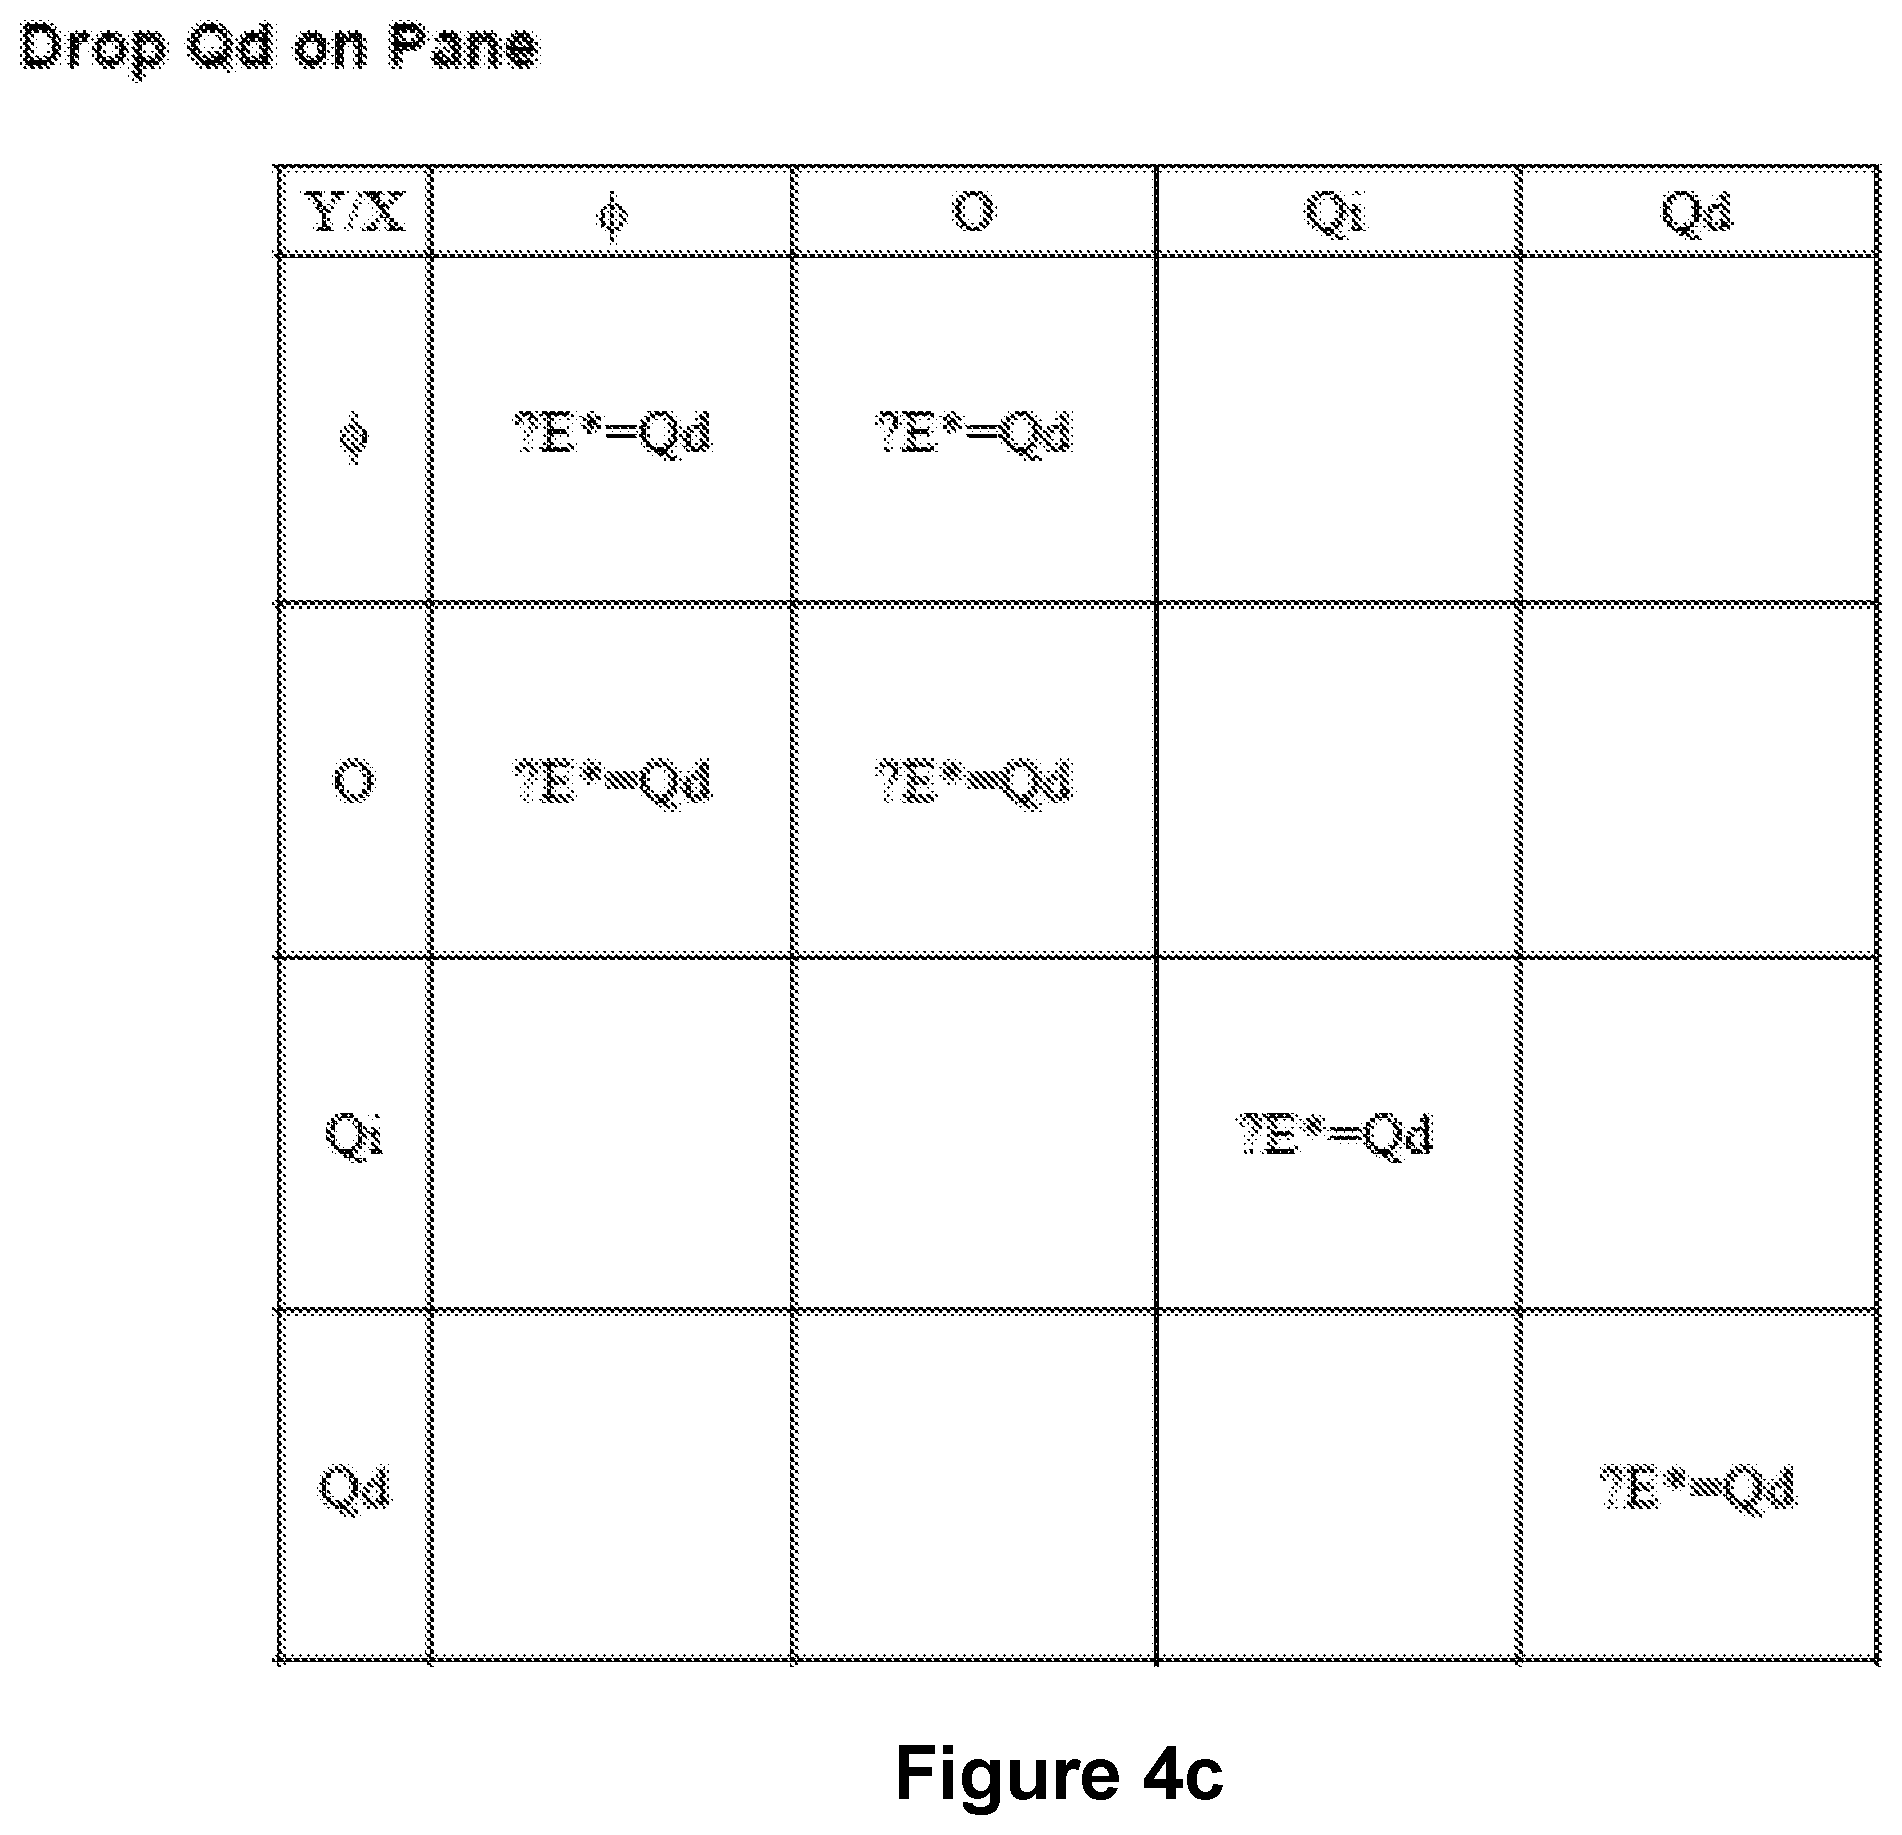
Notes for FIG. 4c: This set of rules is used when dropping a Qd on a pane. If no match is found, then we use the more general rules for dropping a Qd. The goal is to try to add the Qd to the encodings when Qd is dropped on the pane. The guarded version of the *=operator only adds Qd to text or size. If it can't, that operator is not applied.
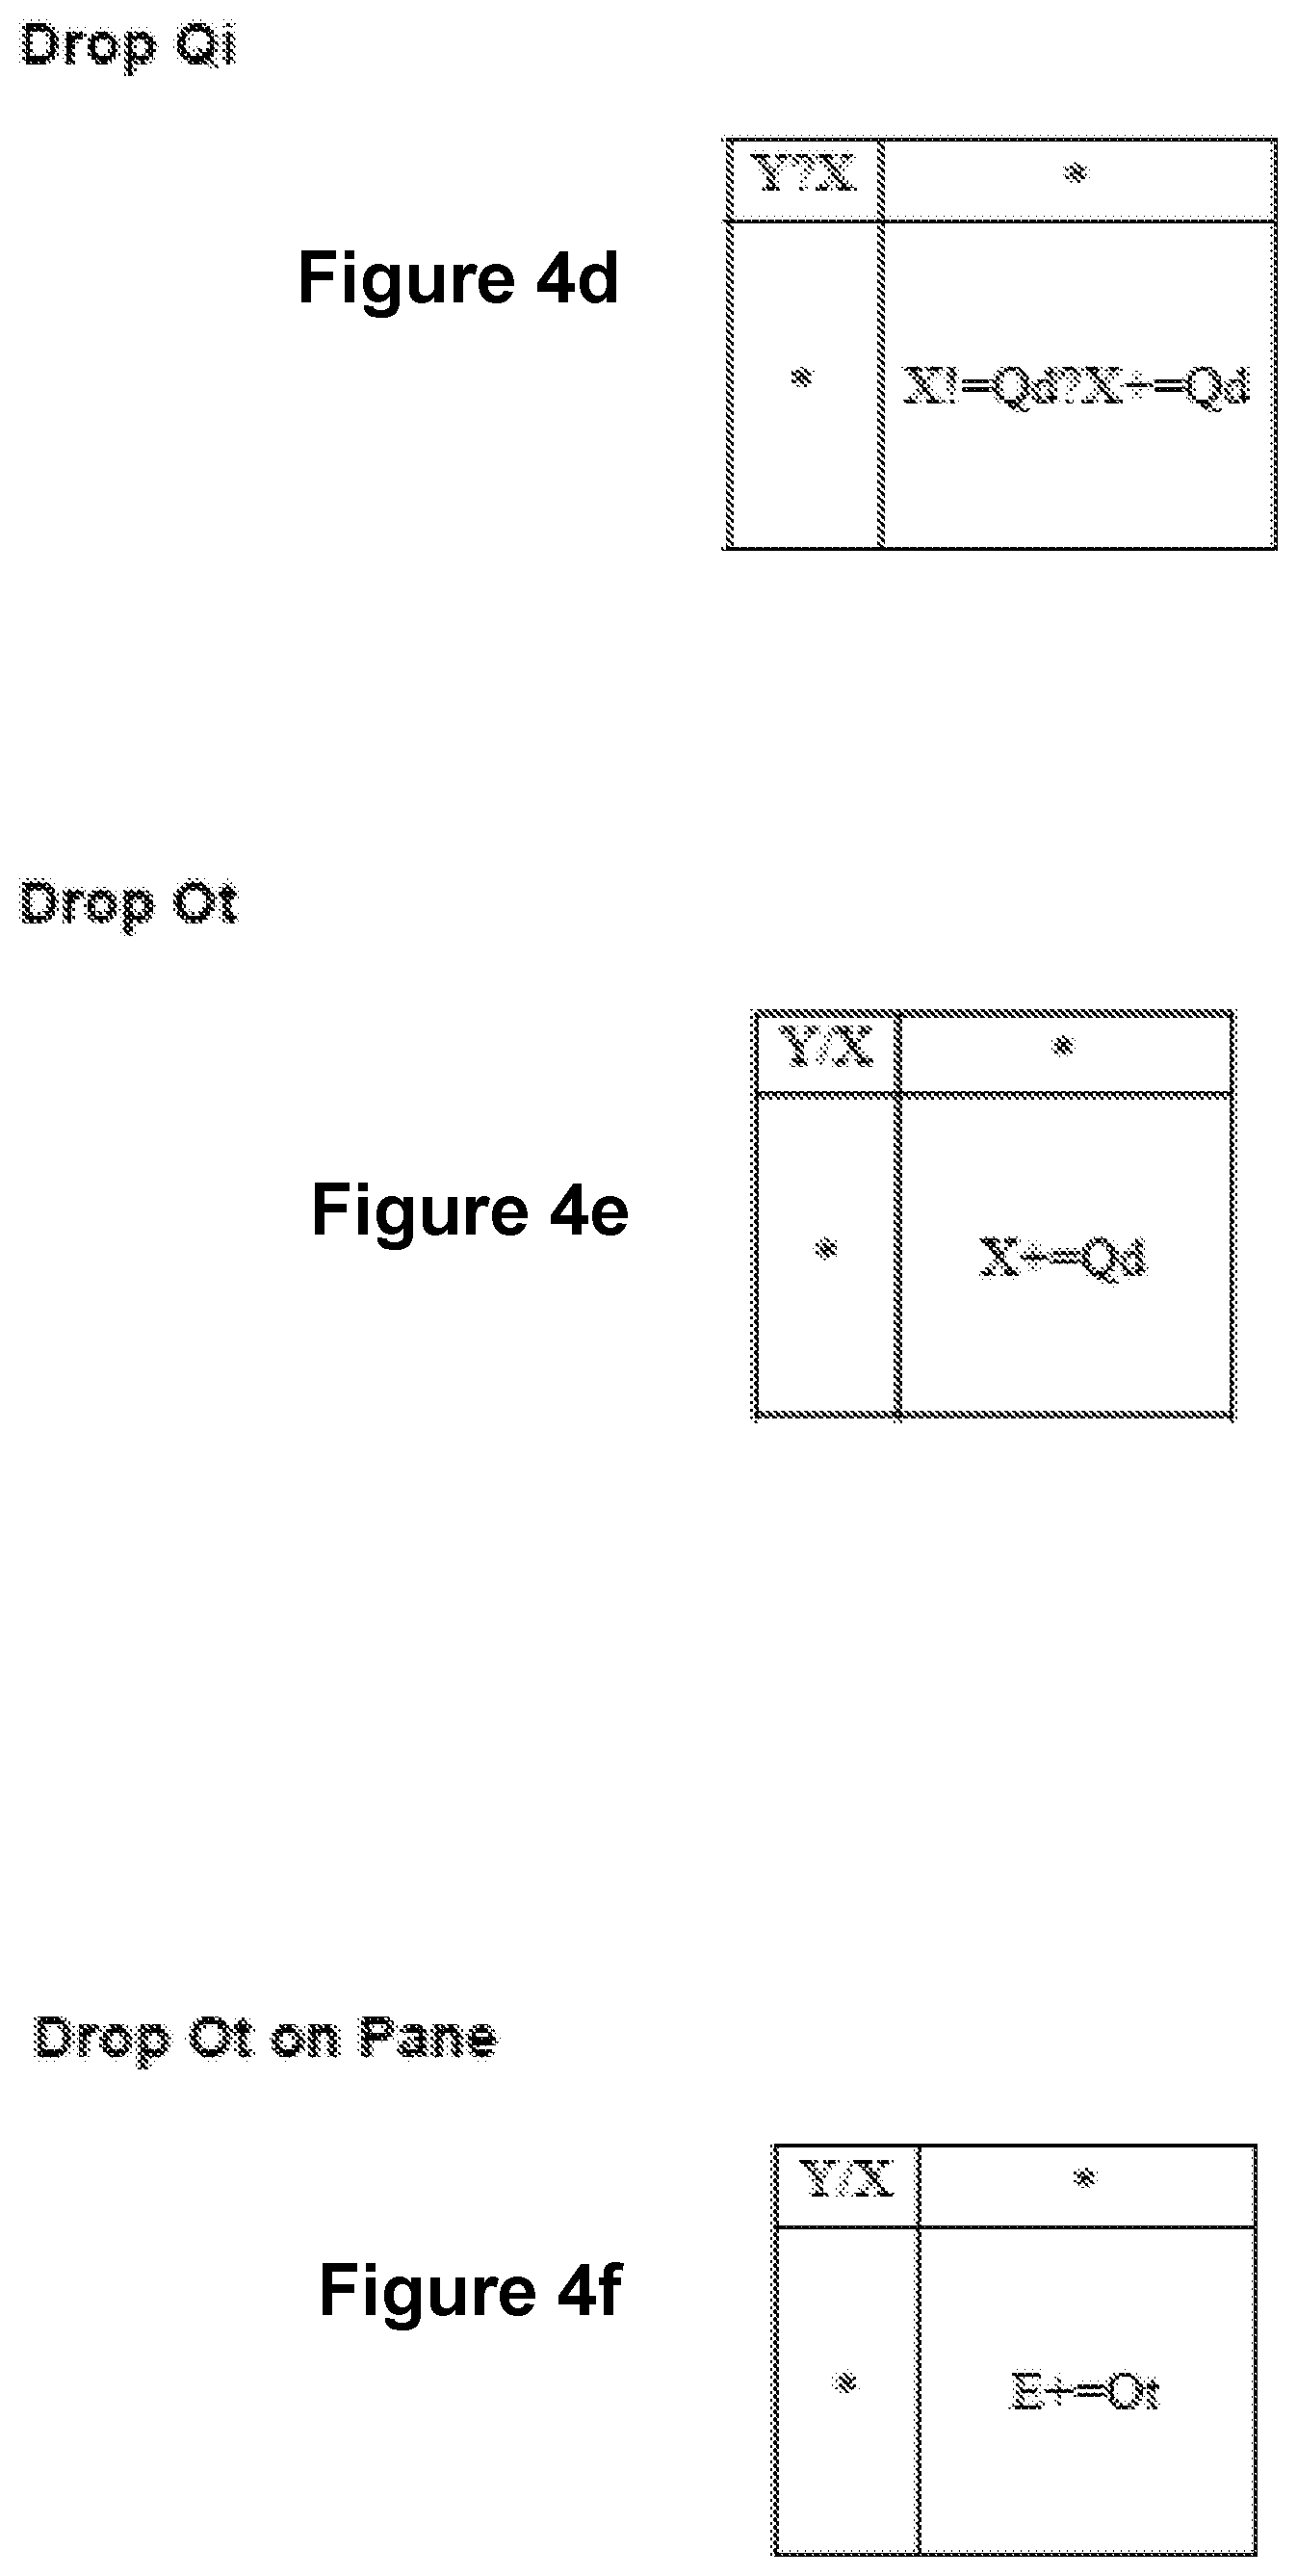
Notes for FIG. 4d: Always drop Qi on the X axis. But don't do it if the X axis contains a Qd. If there is an existing Qi, then the Qi's are concatenated.
Notes for FIG. 4e: Always drop Ot on the X axis. If there is an existing Qi or Qd, then move the Ot leftward until all of the Q's are to the right.
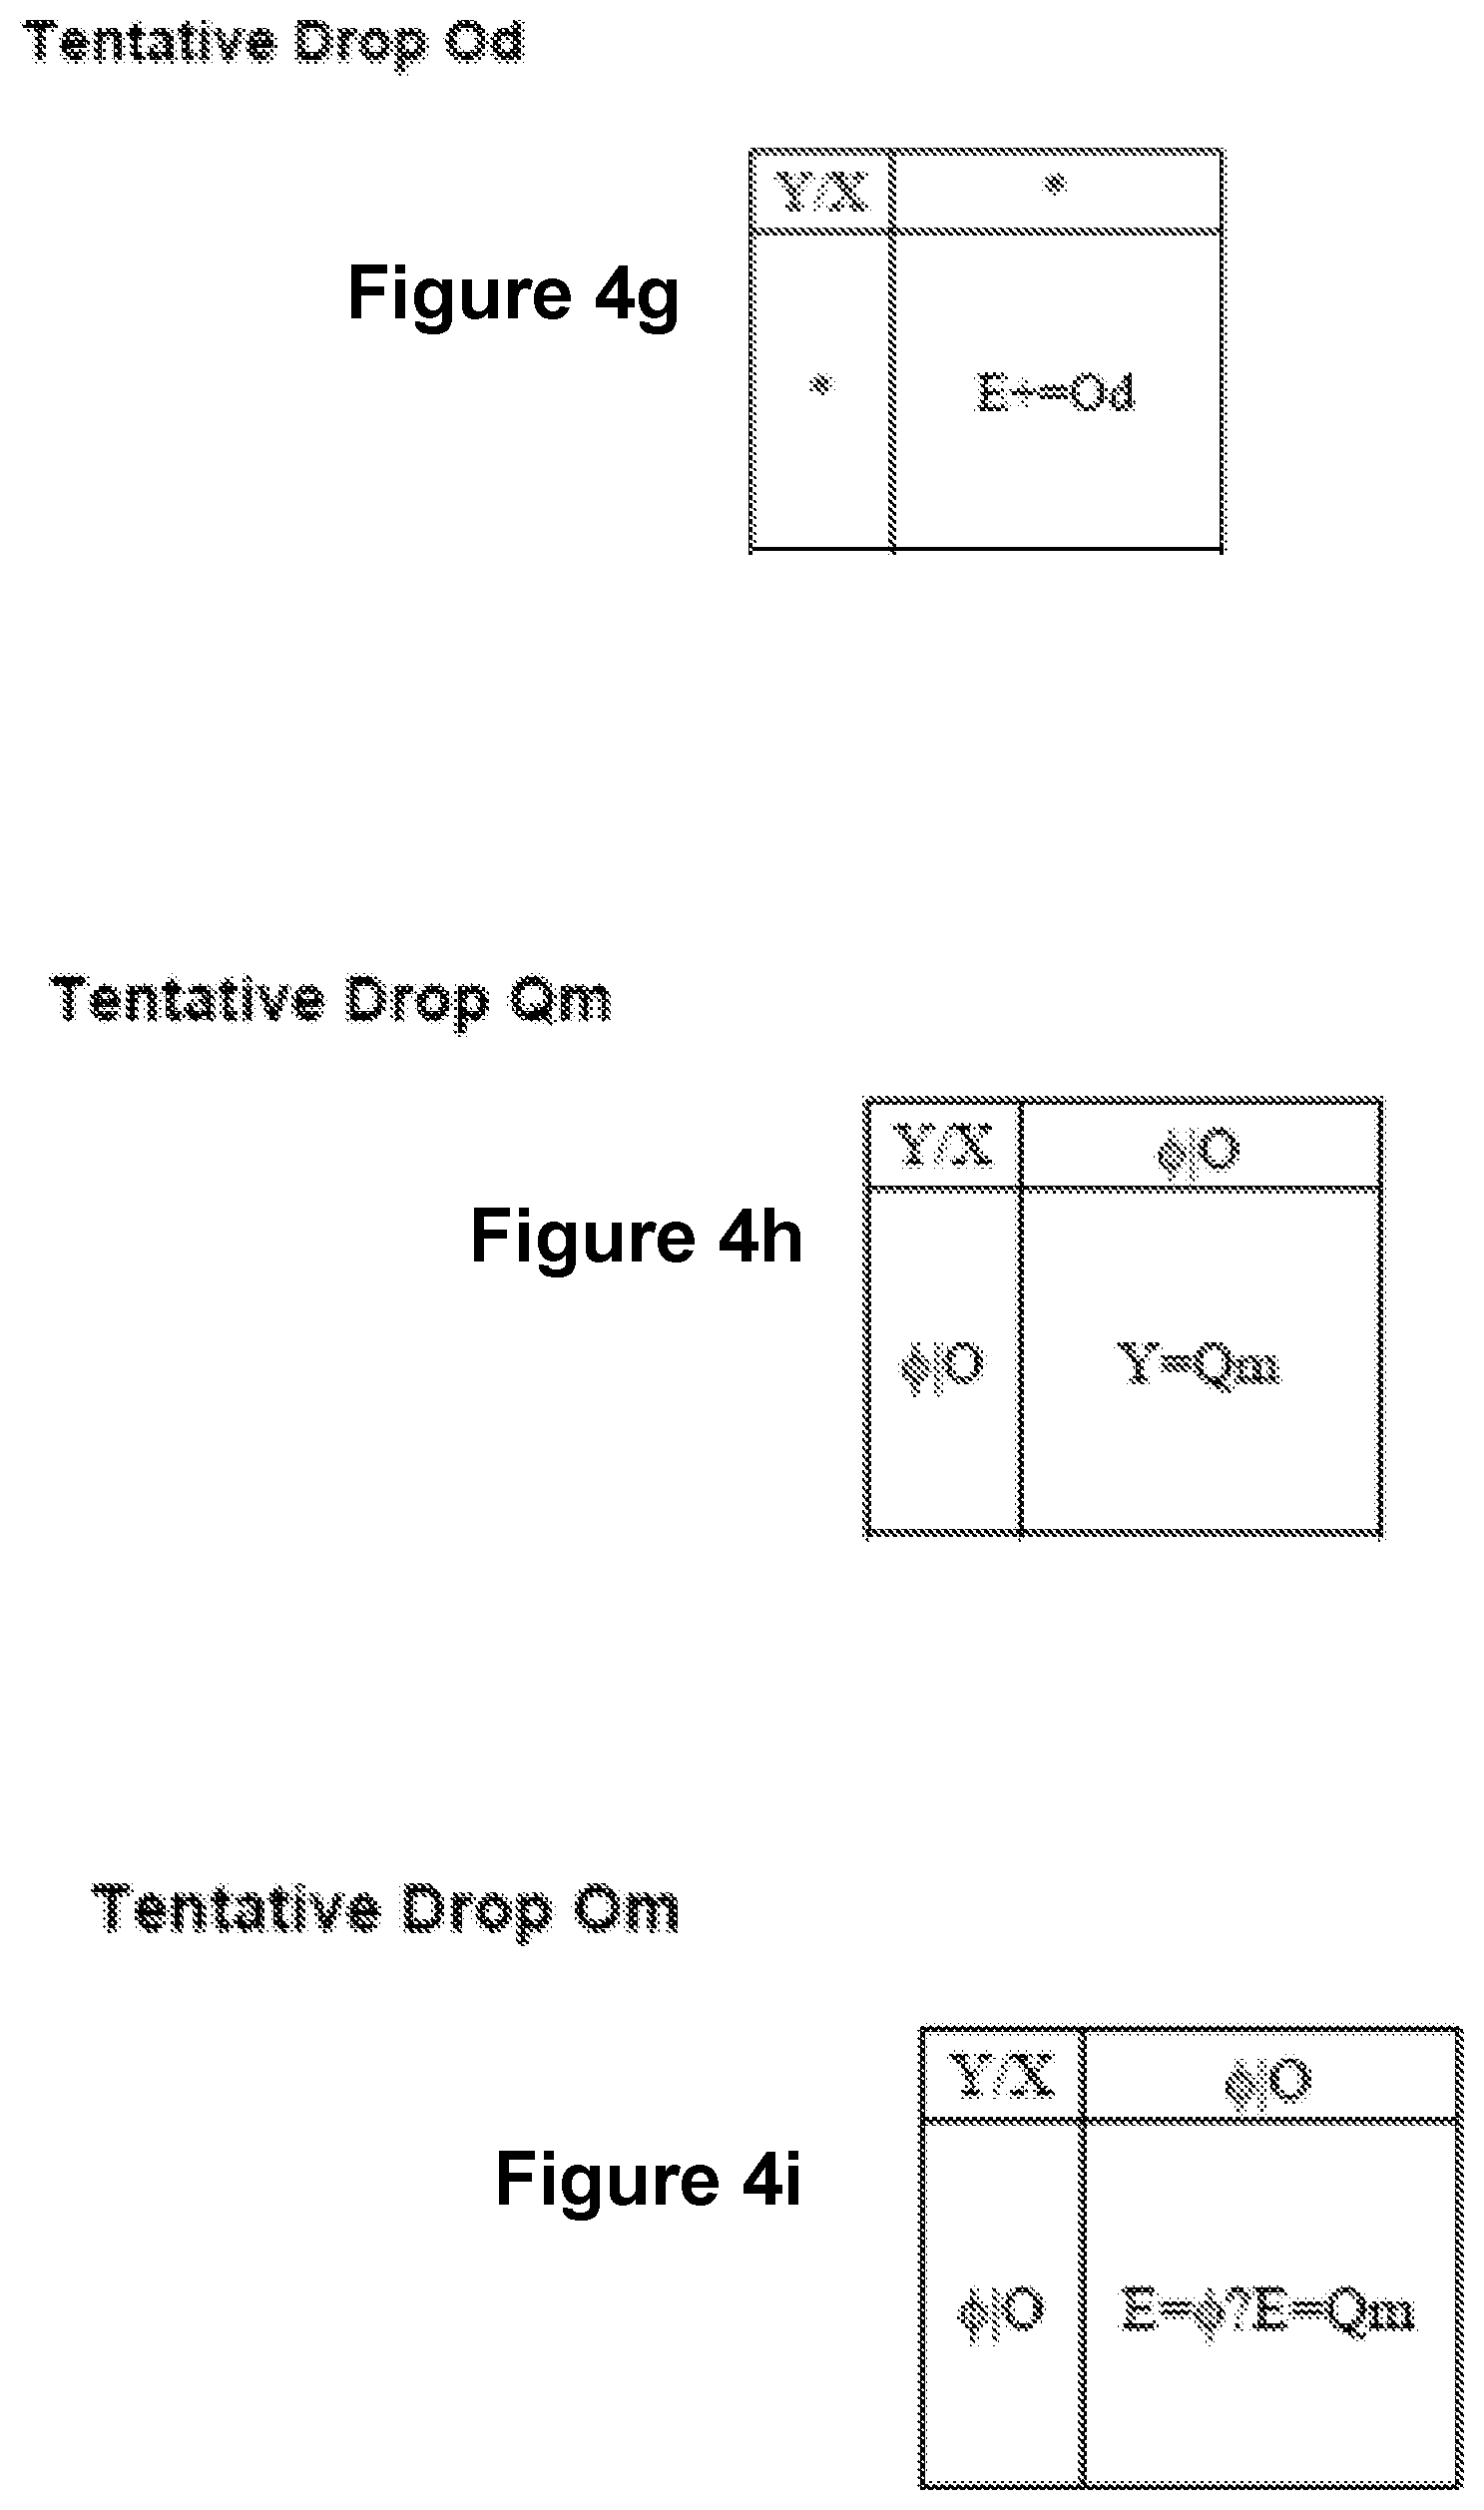
Notes for FIG. 4g: The +=operator only adds Od to shape or color. If it can't, that operator is not applied. If no match is found, then we don't add the Od. We really want to put Od on an encoding.
Notes for FIG. 4i: Do nothing if a Q is already being used. Apply Qd rules if one of the O's is an Ot. Adding a Qd makes a bar chart. Adding an Om makes a text table.
The order in which fields are added affect the view type of the resulting view. For example, if a measure data type field is added to an empty view, and is subsequently followed by a dimension data type field, the resulting view will be a bar chart. However, if a measure data type field is added to an empty view subsequent to a dimension data type field, then the resulting view will be a text table. The resulting view's view type is thusly selected based upon a set of rules. The view type is then assigned to the resulting view and the view is then populated with data from the dataset. In one embodiment, the set of rules are predetermined. In another embodiment, the set of rules are based upon a user's preferences or actual usage. For example, a user may be given the opportunity to designate the best view type for various sequences of the addition of fields to views. Or, after the visual plot is populated and rendered for the user, the user is allowed to choose a different rendering. The user's choice as to the ultimate resulting view, if recorded, may indicate the user's preference for what view type the user considers the clear and/or useful. In yet another embodiment, heuristics may be used instead of a set of rules for selecting a resulting view.
In one embodiment, the cardinalities of the fields in the resulting view are computed and are considered in determining how the user selected fields are added. In set theory, cardinality is the size of a set. In the present invention, cardinality refers to the number of distinct instances that are associated with a field's type. For example, if a field type is "States of America", then the cardinality of such a field would be 50.
In another embodiment, the functional dependency of the fields in the resulting view are computed and are considered in determining how the user selected fields are added. Functional dependency refers to the determination of one field by another field. For example, if one field is of the type "States of America," and a second field is "Inches of Rainfall of the States of America," then the second field depends upon the first. Another example is shown in FIGS. 5a-5c. Referring to FIGS. 5a-5c, there is a functional dependency from the Product field to the Product Type field because each product has a unique product type. This can be seen in FIG. 5a because each product (in the column where the product field resides) has a single product type (in the column where the product type field resides) to its right. When the columns are reversed in FIG. 5b, it is apparent that there is no functional dependency from the Product Type field to the Product Field because each product type has multiple products. Finally, when the fields that form a functional dependency are placed in both rows and columns (FIG. 5c), the resulting view contains much empty space, which makes the resulting view less effective.
In yet another embodiment, in the application of the selected rule to populate the resulting view with data from the dataset, a mark is chosen for the resulting view's view type and the data from the dataset is rendered according to the mark. This is shown in FIG. 2, where, in step 218, mark chooser 126 chooses a mark for the resulting view, and data renderer 128 renders the dataset according to the mark in step 220.
FIGS. 3a and 3b show ways of operating an embodiment of the present invention. A user may drag a new field from a list of available fields and drop the field onto a view. Another way of operating an embodiment of the present invention is for the user to double click on a new field from a list of available fields. This automatically adds the new field to an existing view or automatically forms a new view if there is not an existing view. Other ways of adding or dropping fields include double clicking on a field, selecting fields, typing field names, and creating a specification for a set of fields using statistical analysis, historical analysis, or heuristic algorithms.
Now, referring to FIG. 6a a flowchart is provided for the steps through which a system proceeds in another embodiment of the present invention. First, alternative view former 130 forms alternative views of the tuples of the dataset (step 602). Resulting view selector 110 then selects a resulting view from the alternative views (step 604). Finally, dataset displayer 112 displays the dataset according to the resulting view (step 606).
In another embodiment, alternative views are formed based upon a set of criteria. FIG. 7 is a table showing the criteria for forming alternative views of a dataset and a rating system for one embodiment of the present invention. For example, if all the data in a dataset is aggregated and does not contain any independent quantitative data, then one of the possible views is a text table as determined by the first rule. Its rating is 1 meaning that it will only be the highest ranking view if other views such as Line (Measure), which was a higher rating of 9, is not applicable to the selected fields. As one skilled in the art will realize, these ratings could also be based on other criteria such as user preference, usage patterns, and statistical analysis of the data.
In one embodiment, if the user selected a first option, then the alternative views are ranked according to a rating system by alternative view ranker 134 in step 608. View assignor 120 then assigns the resulting view as the highest ranked alternative view at step 610. Dataset displayer 112 then displays the dataset according to the resulting view in step 606. For example, if all the data in a dataset is aggregated and does not contain any independently quantitative data, then alternative views of all the view types listed in FIG. 7 are generated at step 602. Then, at step 604, the text table alternative view is selected to be the resulting view, and the dataset is displayed as a text table in step 606. In another embodiment, in accomplishing step 602 (forming rated alternative views showing all tuples), view determiner 118 determines applicable view types according to the dataset's data types. Mark chooser 126 then identifies an associated mark for each applicable view type at step 620, which is then used to form alternative views for each applicable view type at step 622.
In another embodiment, if the user selected a second option, then a list of alternative views would be displayed by list displayer 136 at step 622 for the user's selection. After the user's selection is received at step 624 by selection receiver 138, the resulting view is assigned as the alternative view that the user selected by view assignor 120 at step 616, and dataset displayer 112 then displays the dataset according to the resulting view in step 606.
In yet another embodiment of the invention, cardinality computer 122 computes the cardinality of the fields in the plurality of tuples when forming the alternative views. In a further embodiment, functional dependency computer 124 computes the functional dependency of the fields in the plurality of tuples when forming the alternative views.
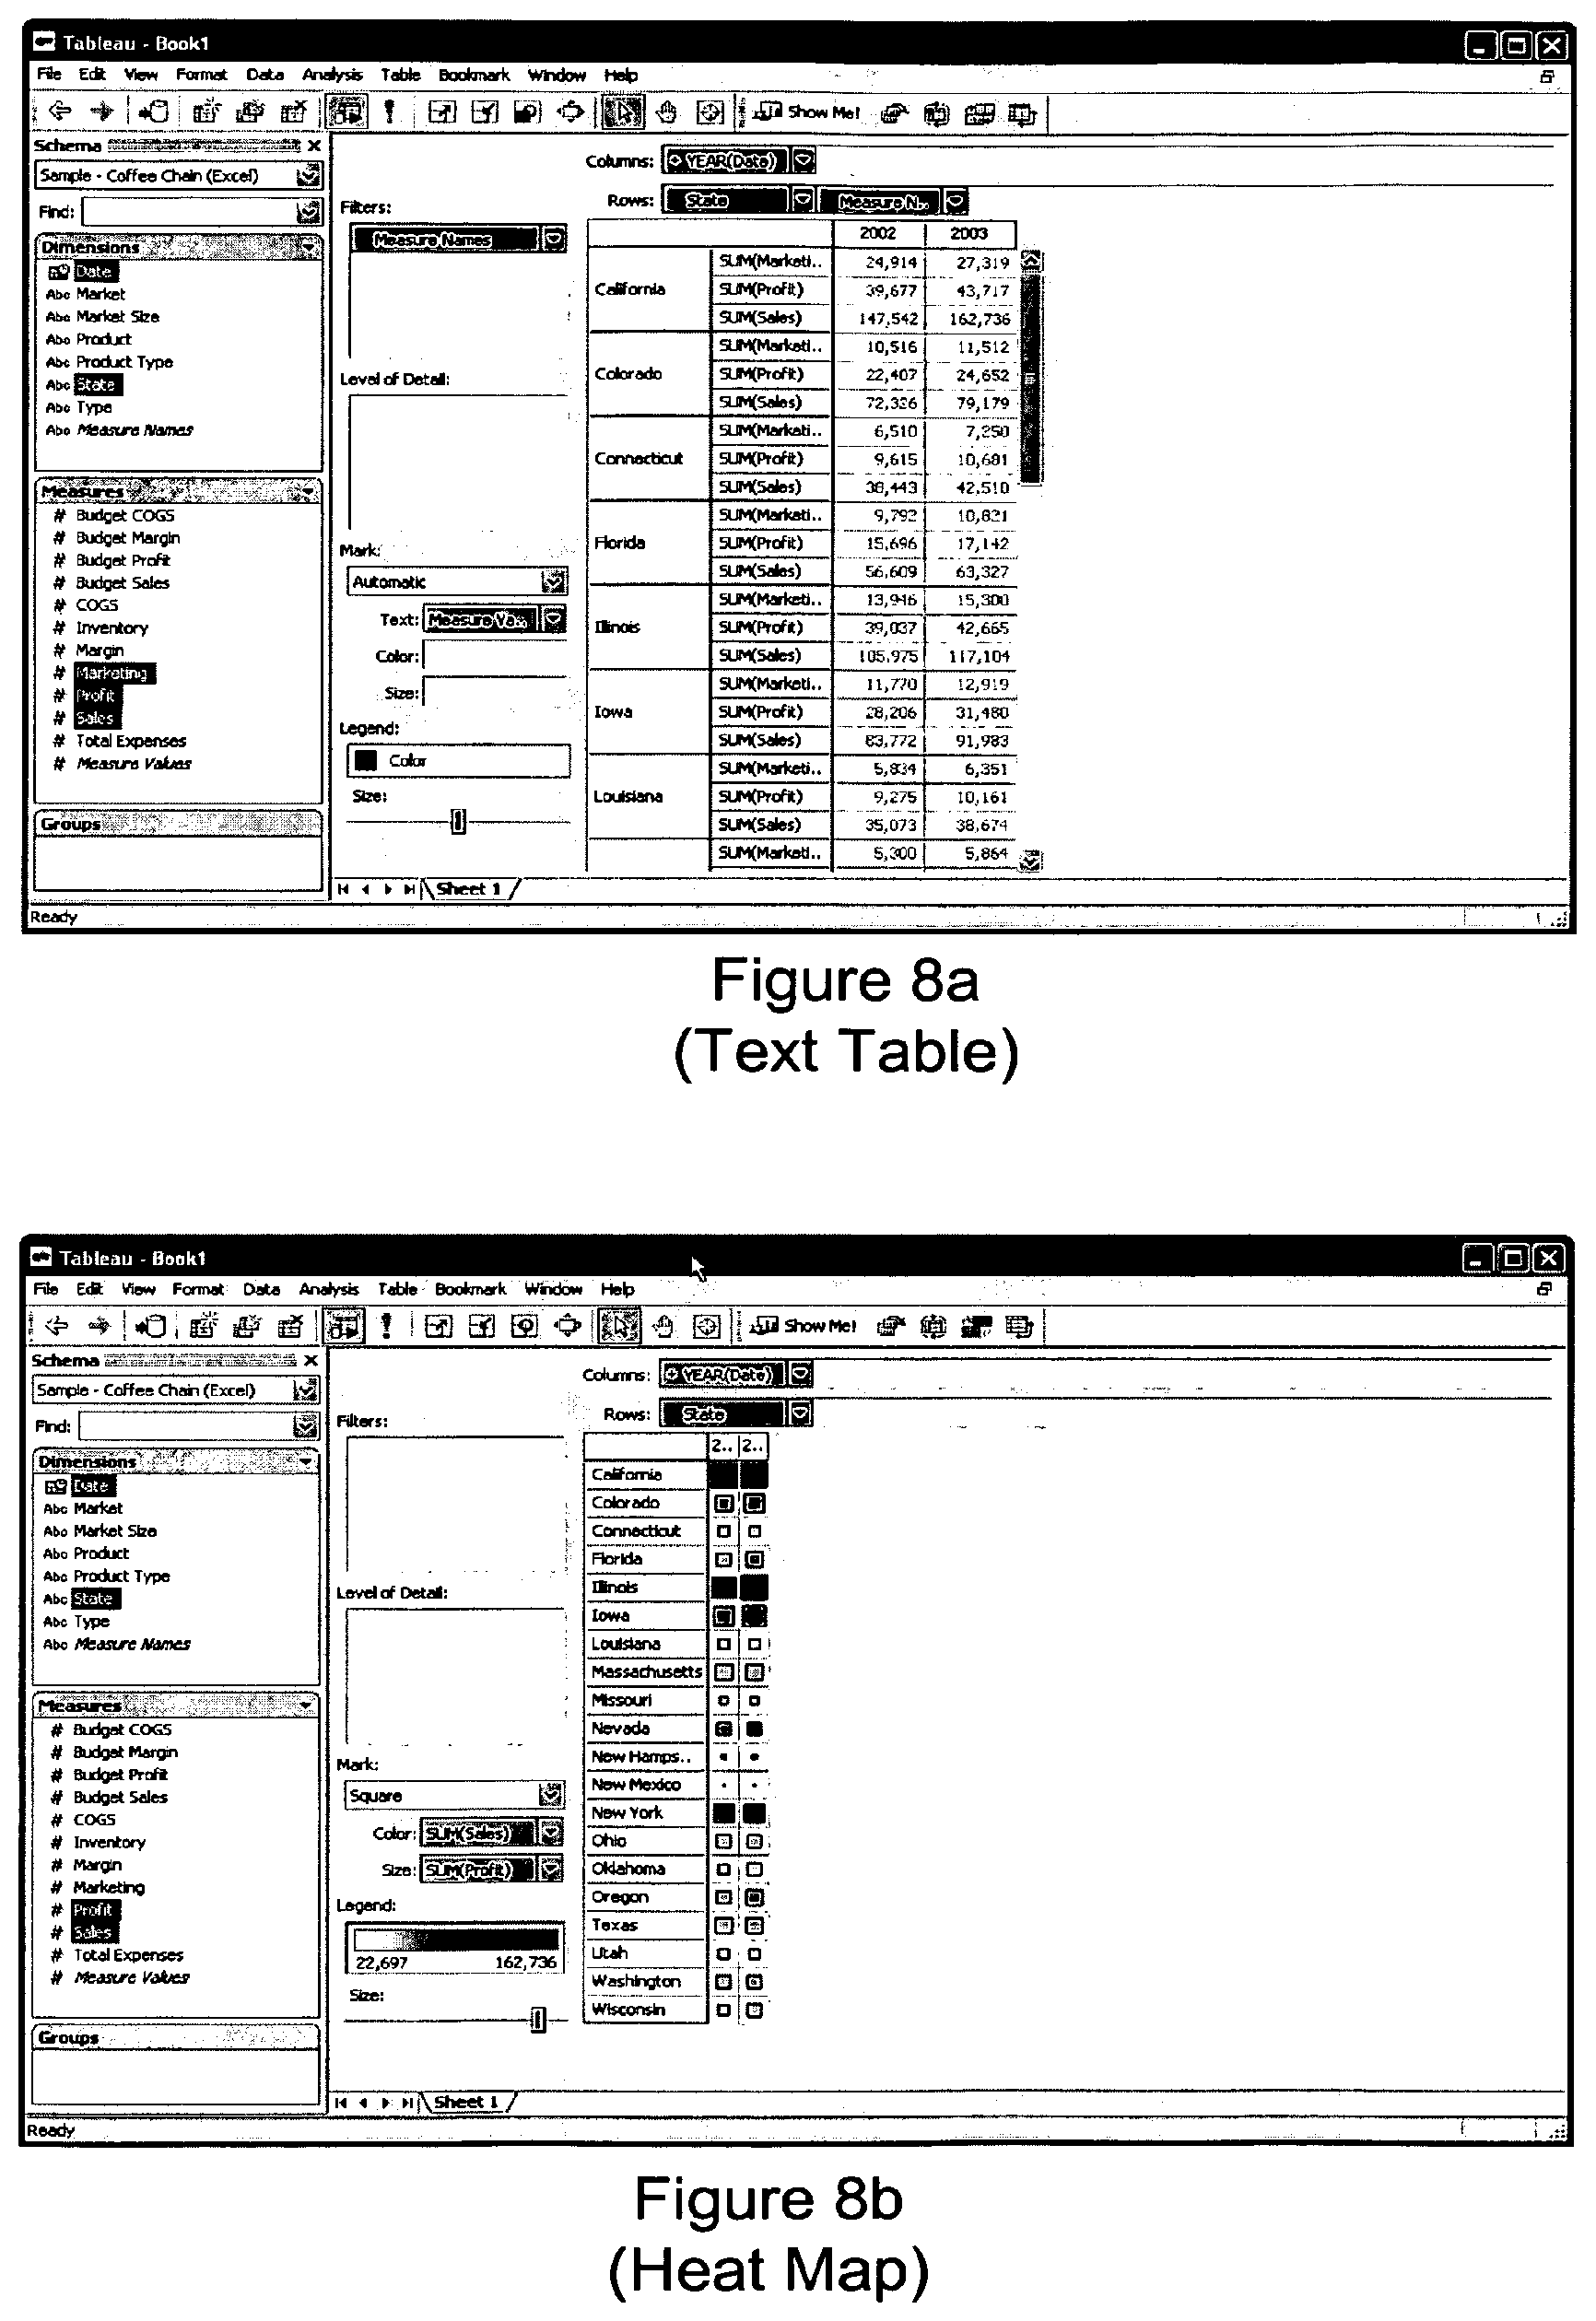
FIG. 8a shows a rendering of the data in a dataset in an resulting view where either the highest ranked view type was a text table, or the user selected the alternative text table view. The dataset must include only aggregated data and no independently quantitative data.
FIG. 8b shows a rendering of the data in a dataset in an resulting view where either the highest ranked view type was a heat map, or the user selected the alternative heat map view. The dataset must include only aggregated data, at least one field of ordinal data, one to two fields of dependant quantitative data, and no independent quantitative data.
FIG. 8c shows a rendering of the data in a dataset in an resulting view where either the highest ranked view type was a side-by-side bar chart, or the user selected the alternative side-by-side bar chart view. The dataset must include only aggregated data, at least one field of ordinal data, at least one field of dependant quantitative data, and no independent quantitative data.
FIG. 8d shows a rendering of the data in a dataset in an resulting view where either the highest ranked view type was a stacked bar chart, or the user selected the alternative stacked bar chart view. The dataset must include only aggregated data, at least two fields of ordinal data, at least one dependent quantitative data, and no independent quantitative data.
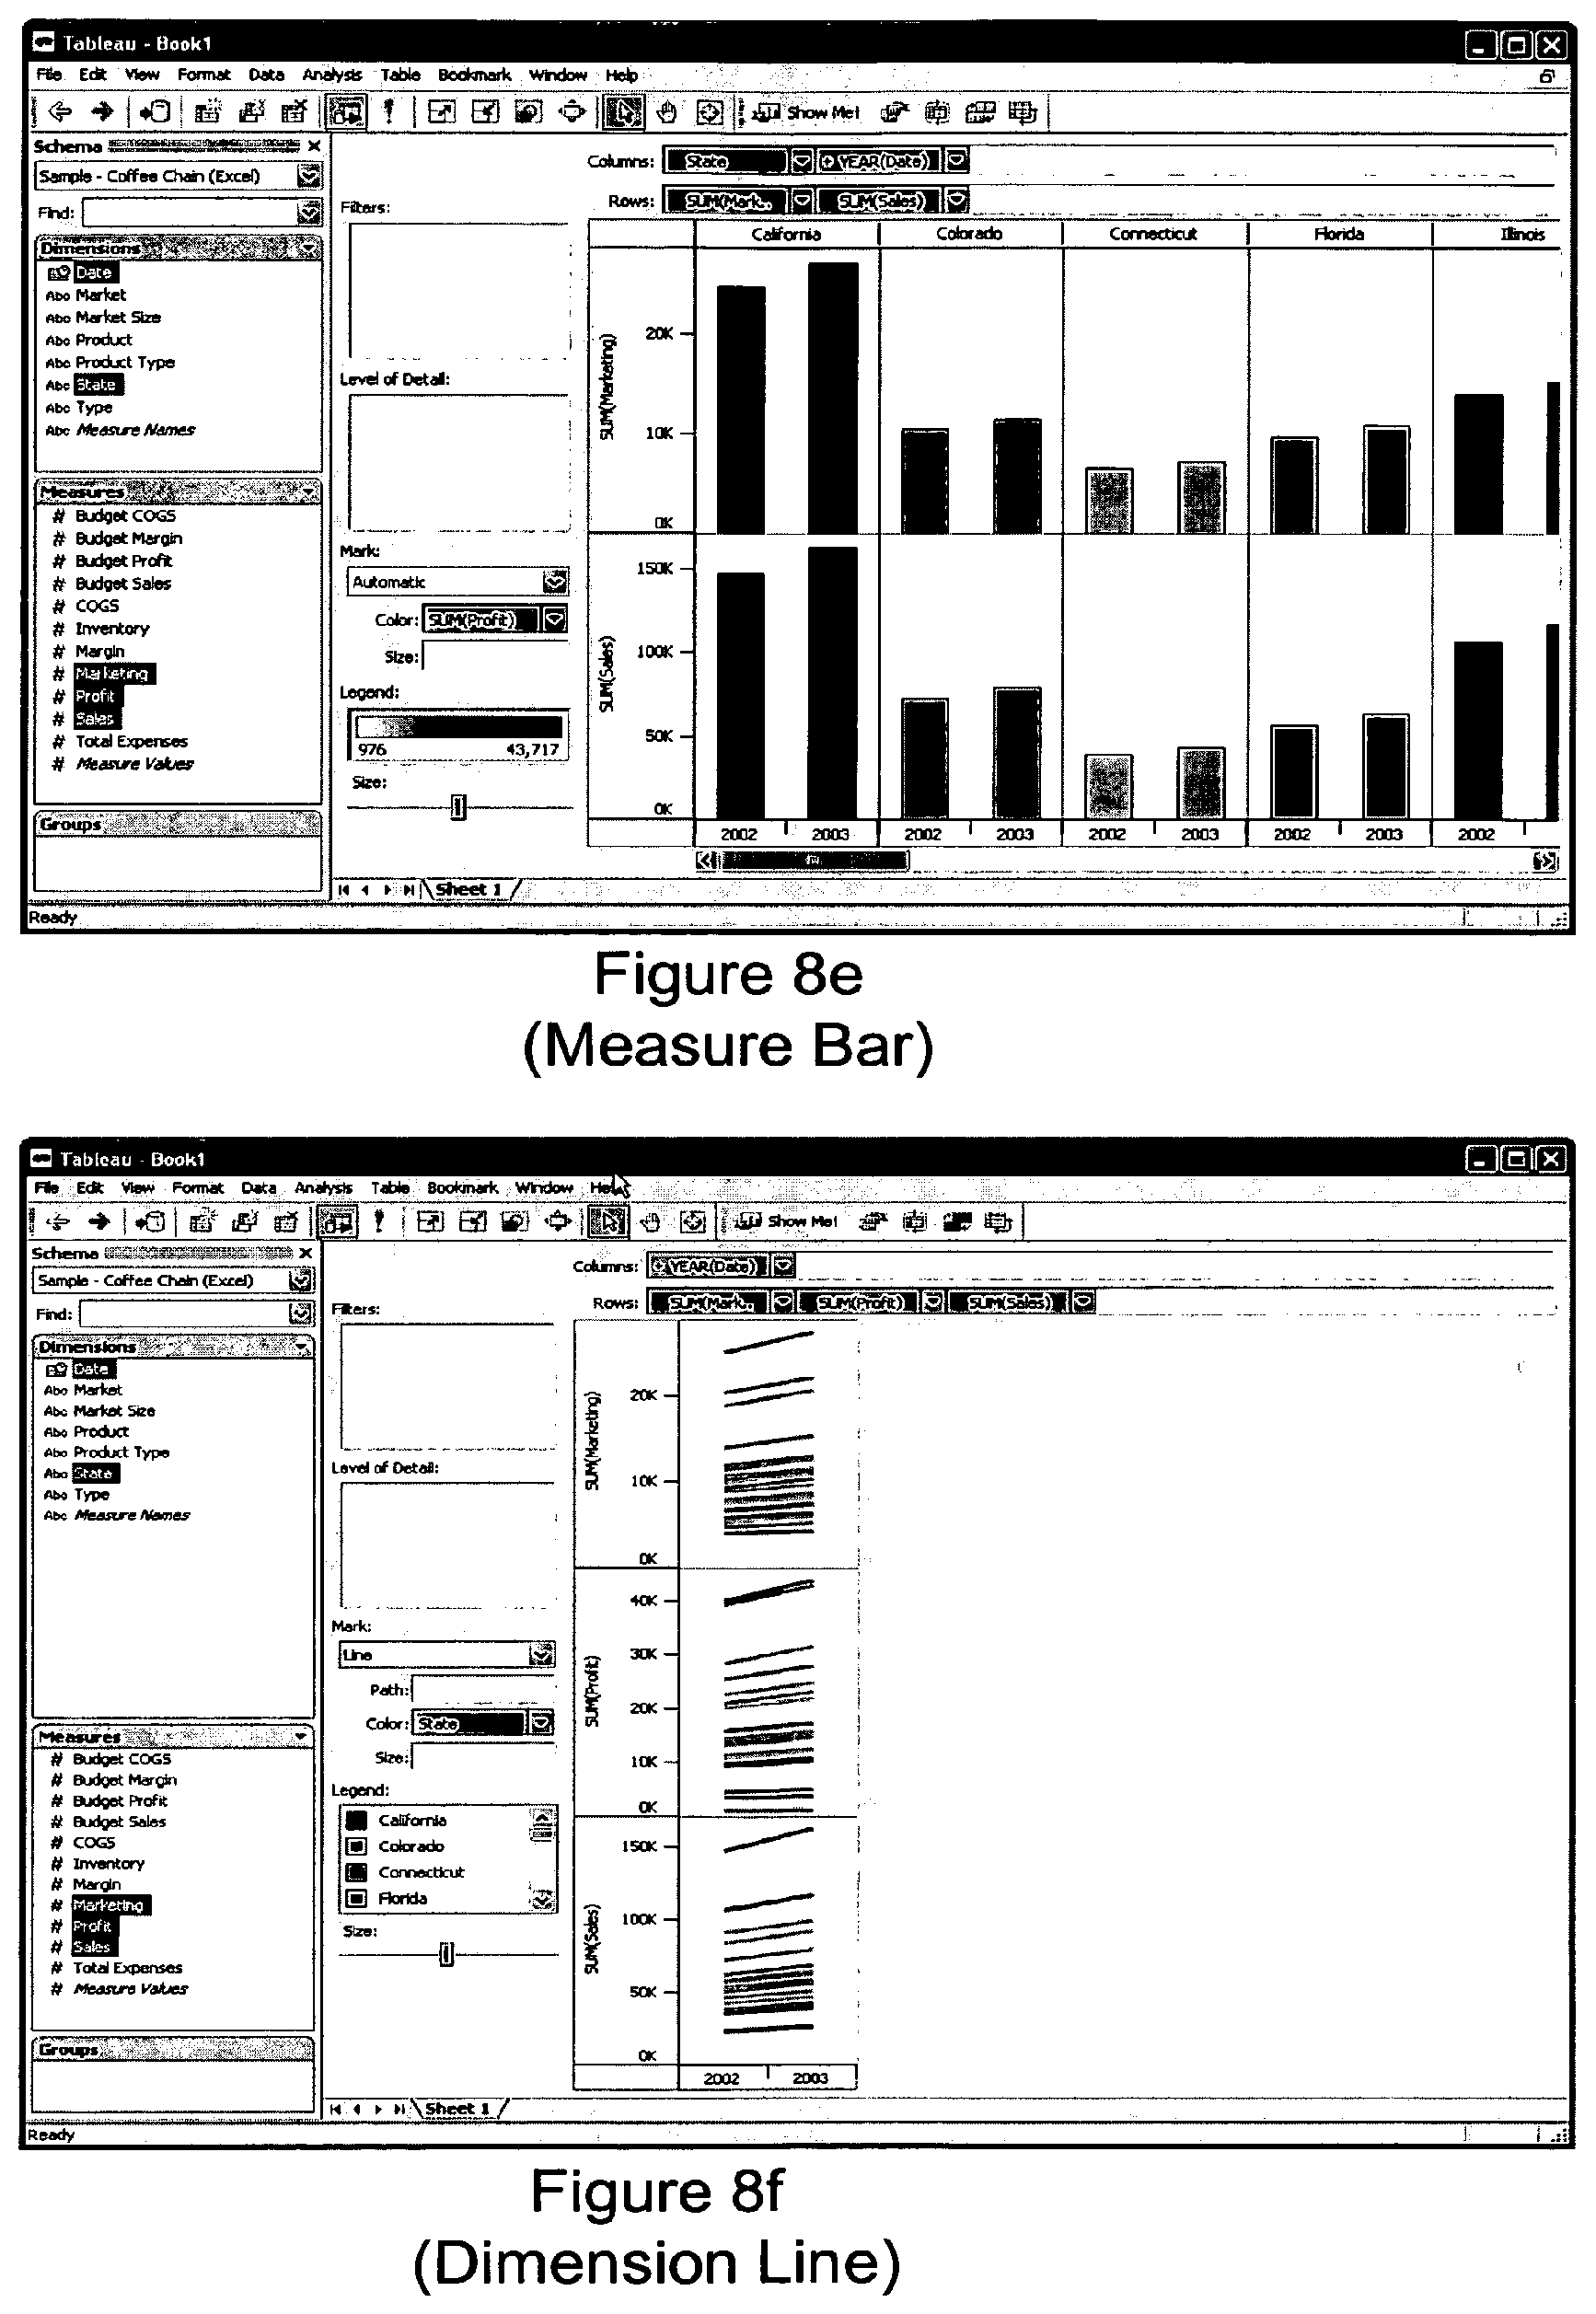
FIG. 8e shows a rendering of the data in a dataset in an resulting view where either the highest ranked view type was a measure bar chart, or the user selected the alternative measure bar chart view. The dataset must include only aggregated data, at least one field of ordinal data, at least two fields of dependent quantitative data, and no independent quantitative data.
FIG. 8f shows a rendering of the data in a dataset in an resulting view where either the highest ranked view type was a dimension line graph, or the user selected the alternative dimension line graph view. The dataset must include only aggregated data, at least one field of dependent quantitative data, at least one field of dates, and no independent quantitative data.
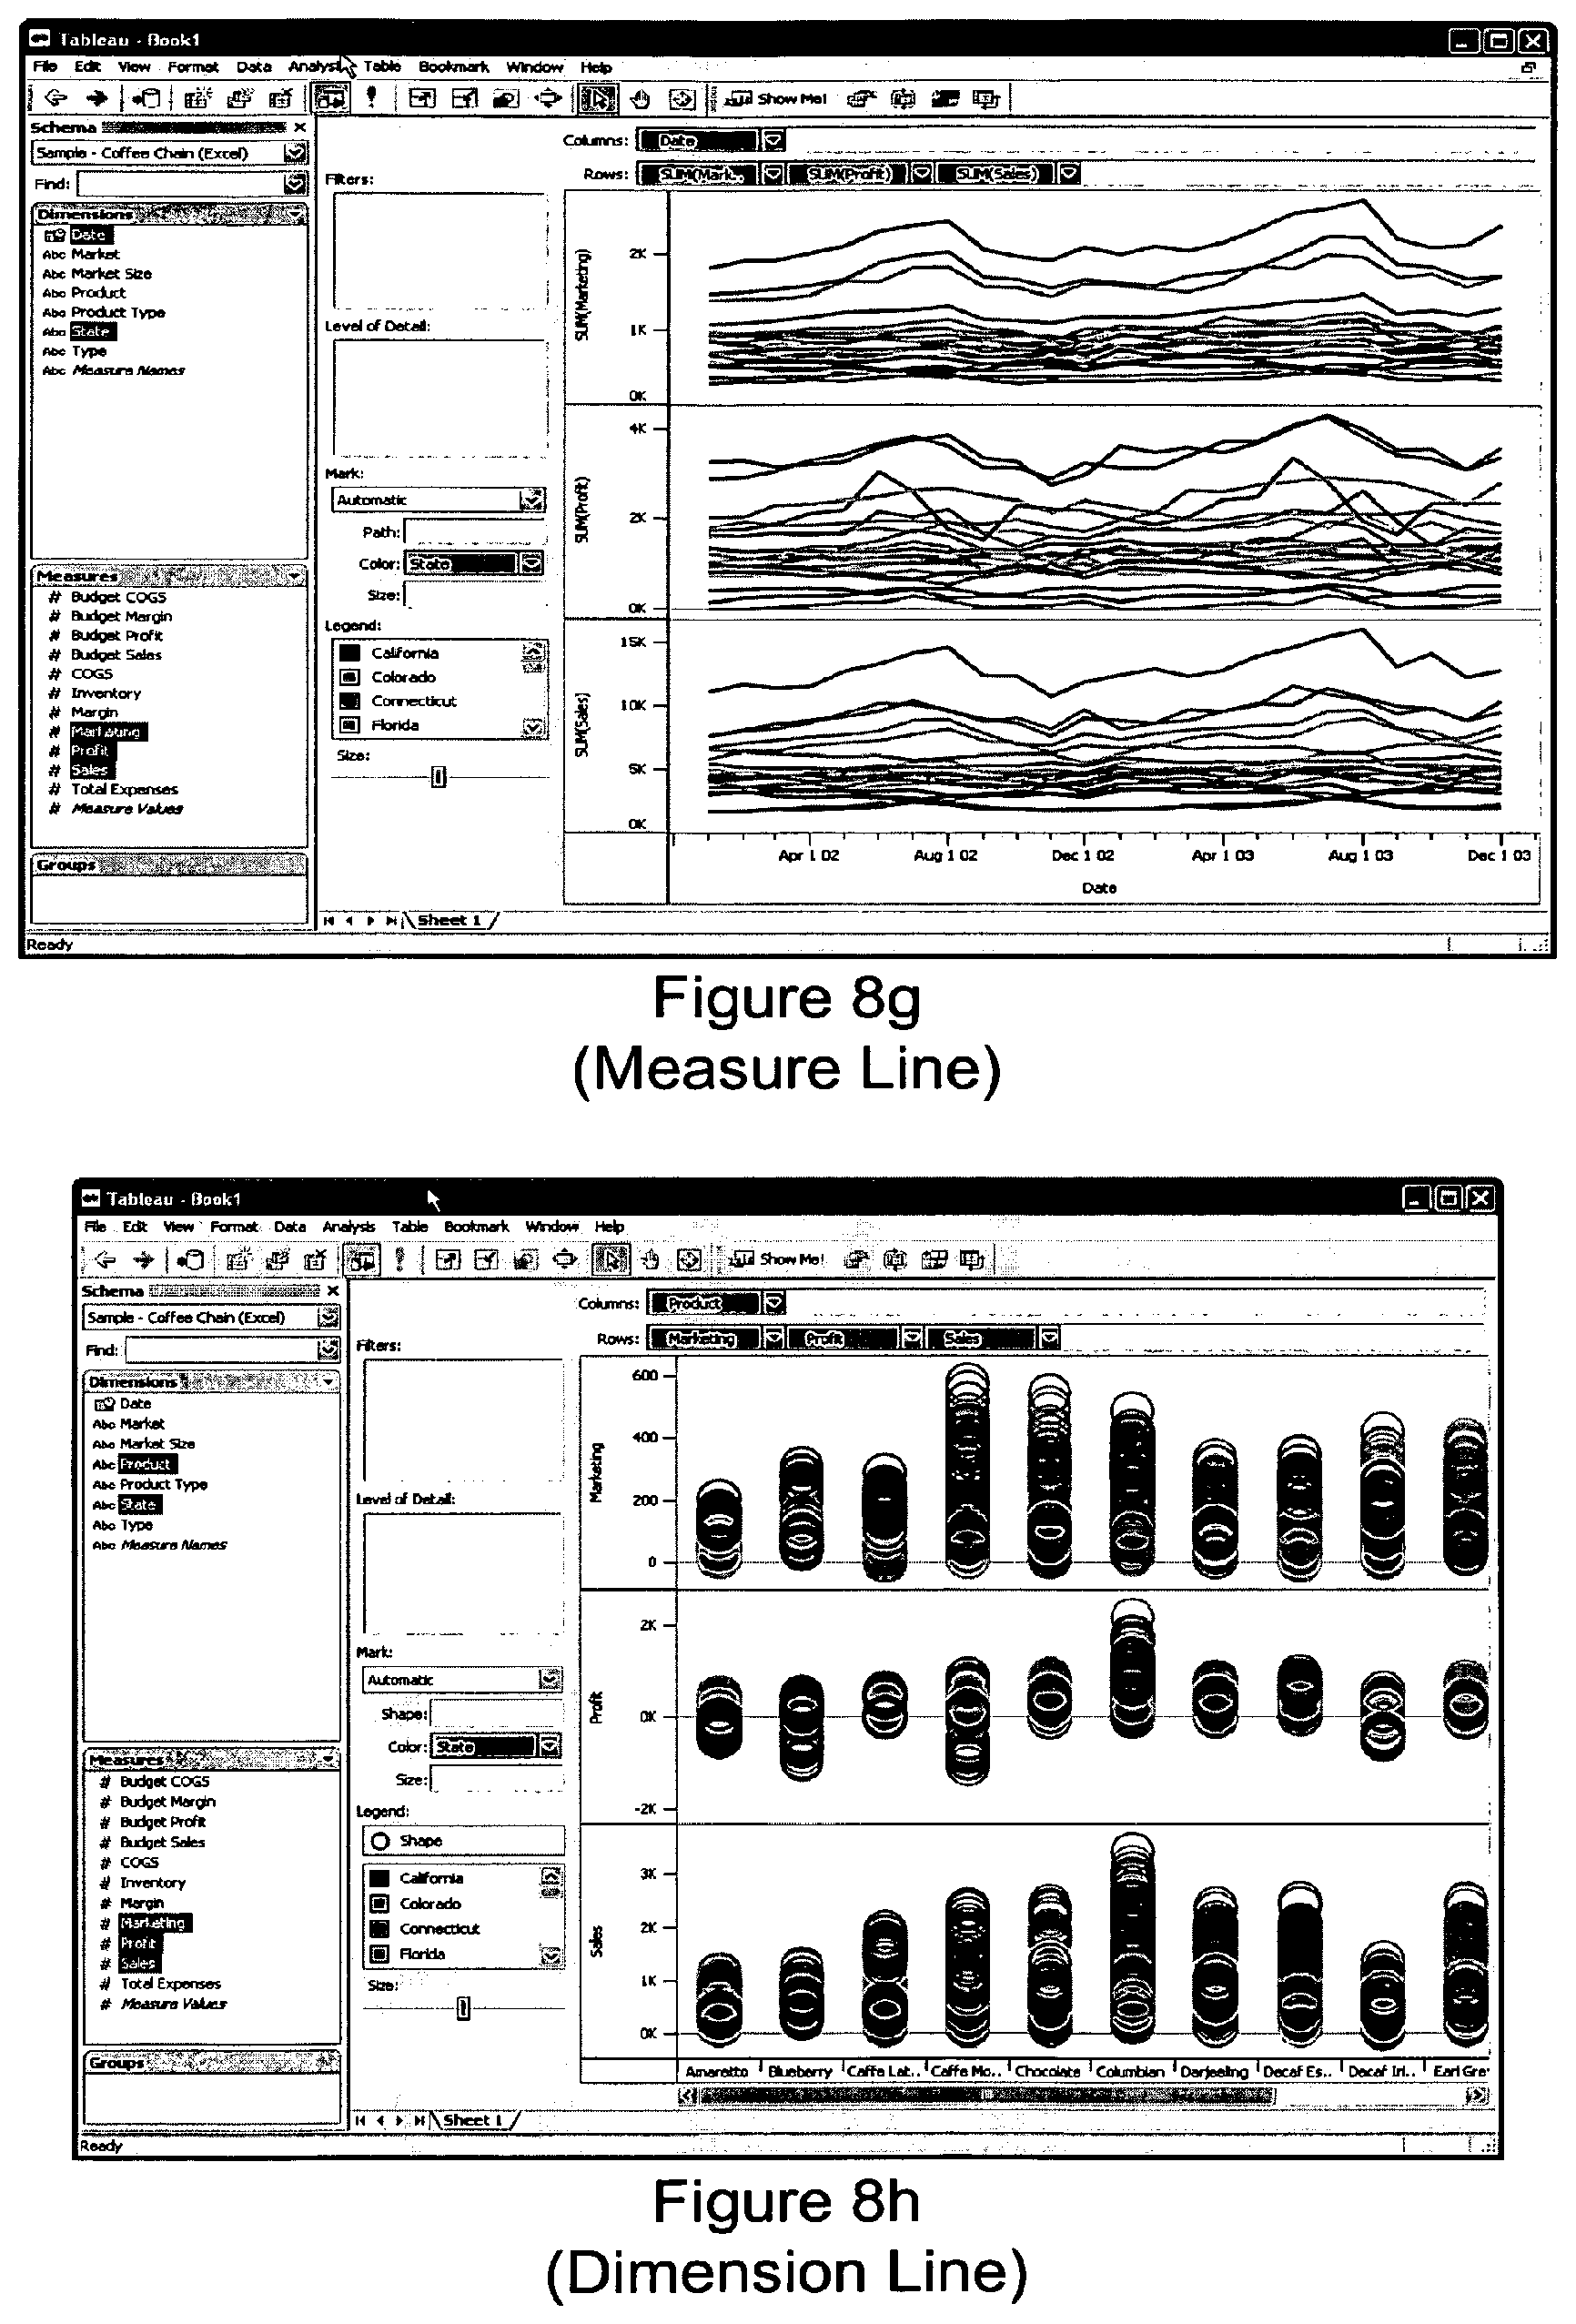
FIG. 8g shows a rendering of the data in a dataset in an resulting view where either the highest ranked view type was a measure line graph, or the user selected the alternative measure line graph view. The dataset must include only aggregated data, at least one field of dependent quantitative data, and at least one field of independent quantitative data or dates.
FIG. 8h shows a rendering of the data in a dataset in an resulting view where either the highest ranked view type was a circle graph, or the user selected the alternative circle graph view. The dataset must not include any aggregated data or independent quantitative data, and must include at least one field each of ordinal and dependent quantitative data.
FIG. 8i shows a rendering of the data in a dataset in an resulting view where either the highest ranked view type was a Gantt chart, or the user selected the alternative Gantt chart view. The dataset must include only aggregated data, at least one field of ordinal data, less than three fields of dependent quantitative data, and at least one field of independently quantitative data or of relational dates.
FIG. 8j shows a rendering of the data in a dataset in an resulting view where either the highest ranked view type was a single scatter plot, or the user selected the alternative single scatter plot view. The dataset must include two to four fields of dependent quantitative data, and at least one field of independent quantitative data.
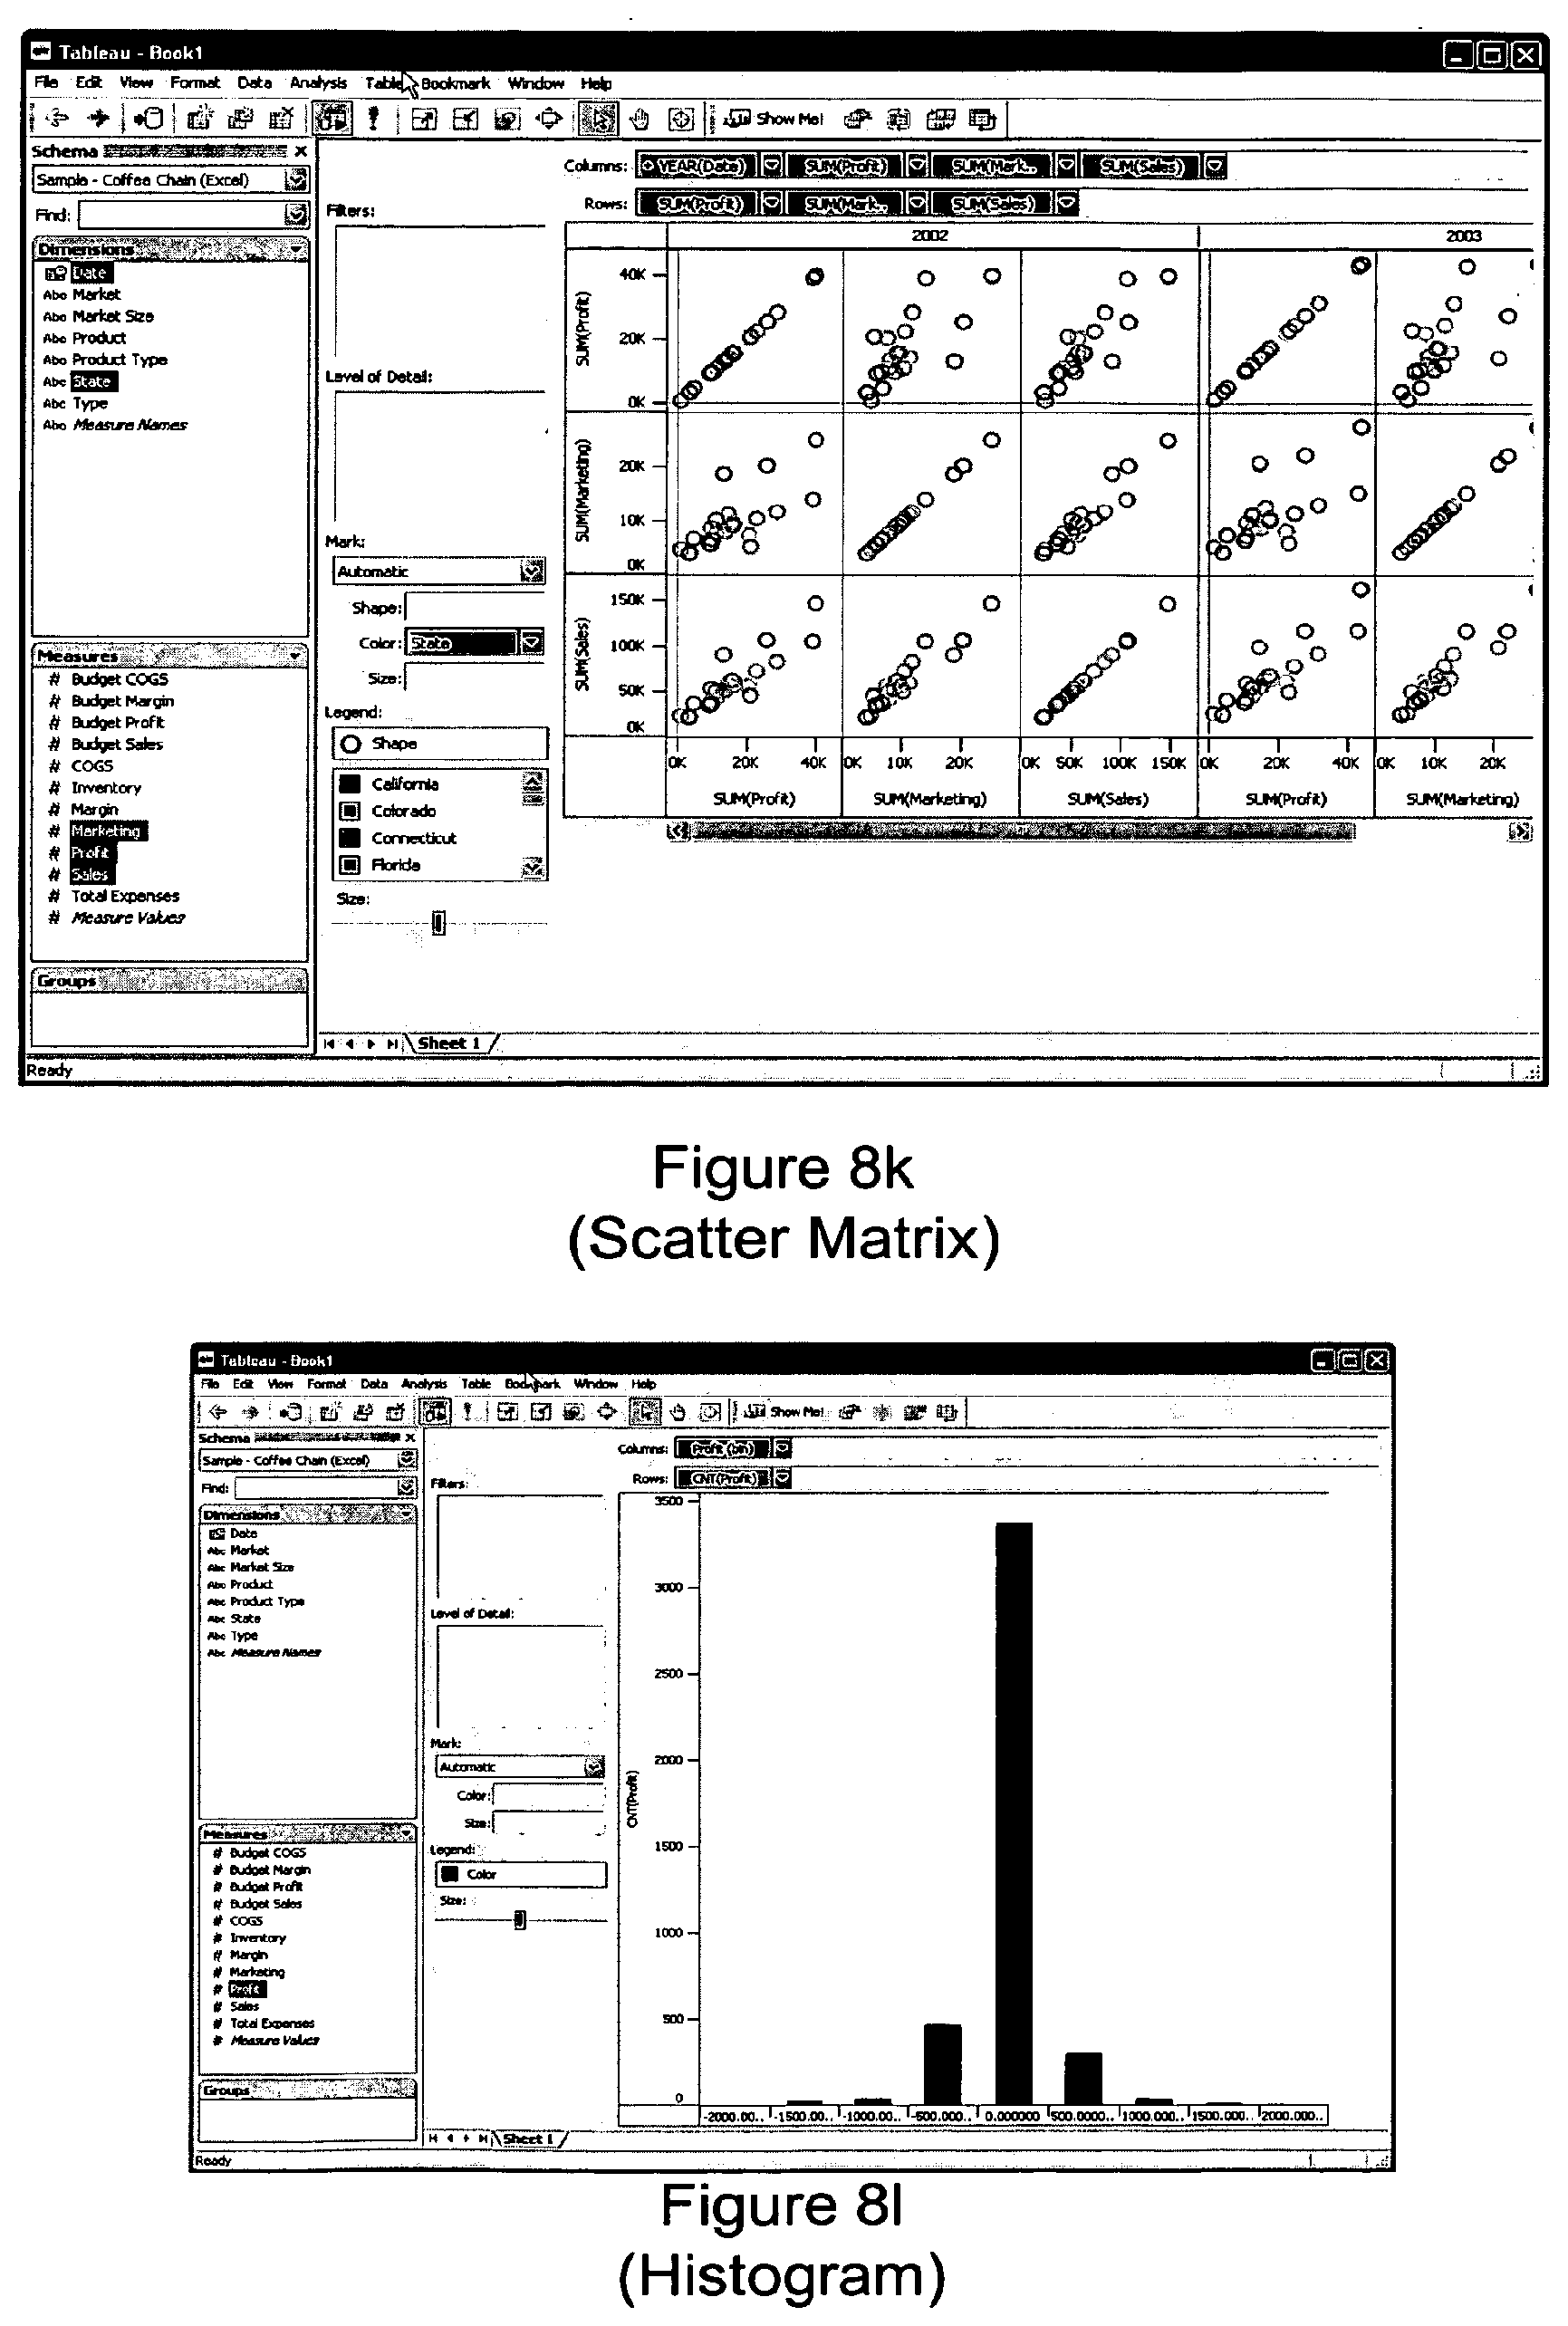
FIG. 8k shows a rendering of the data in a dataset in an resulting view where either the highest ranked view type was a matrix scatter plot, or the user selected the alternative matrix scatter plot view. The dataset must include three to six fields of dependent quantitative data, and at least one field of independent quantitative data.
FIG. 8l shows a rendering of the data in a dataset in an resulting view where either the highest ranked view type was a histogram, or the user selected the alternative histogram view. The dataset must include only aggregated and relational data, must have exactly one field of dependent quantitative data, and must have no independent quantitative data.
The present invention not only accepts datasets and databases as inputs, it also accepts views as inputs. A view can be used to represent a set of fields. Resulting views can also depend on the existing view. For example, rules or operators can take into account the current view to generate a new view that is related to the current view. Also, as one skilled in the art will realize, many other rules are possible, include ones to generate statistical, maps, pie charts, and three dimensional views of data.
The present invention can be implemented as a computer program product that comprises a computer program mechanism embedded in a computer readable storage medium. For instance, the computer program product could contain the program modules shown in FIG. 1. These program modules may be stored on a CD-ROM, magnetic disk storage product, or any other computer readable data or program storage product. The software modules in the computer program product can also be distributed electronically, via the Internet or otherwise, by transmission of a computer data signal (in which the software modules are embedded) on a carrier wave.
Many modifications and variations of this invention can be made without departing from its spirit and scope, as will be apparent to those skilled in the art. The specific embodiments described herein are offered by way of example only, and the invention is to be limited only by the terms of the appended claims, along with the full scope of equivalents to which such claims are entitled.
All references cited herein are incorporated herein by reference in their entirety and for all purposes to the same extent as if each individual publication or patent or patent application was specifically and individually indicated to be incorporated by reference in its entirety for all purposes.
* * * * *
References
D00000
D00001
D00002
D00003
D00004
D00005
D00006
D00007
D00008
D00009
D00010
D00011
D00012

D00013

D00014
D00015

D00016
D00017
D00018

D00019
XML
uspto.report is an independent third-party trademark research tool that is not affiliated, endorsed, or sponsored by the United States Patent and Trademark Office (USPTO) or any other governmental organization. The information provided by uspto.report is based on publicly available data at the time of writing and is intended for informational purposes only.
While we strive to provide accurate and up-to-date information, we do not guarantee the accuracy, completeness, reliability, or suitability of the information displayed on this site. The use of this site is at your own risk. Any reliance you place on such information is therefore strictly at your own risk.
All official trademark data, including owner information, should be verified by visiting the official USPTO website at www.uspto.gov. This site is not intended to replace professional legal advice and should not be used as a substitute for consulting with a legal professional who is knowledgeable about trademark law.