Biomarkers for the molecular classification of bacterial infection
Tsalik , et al.
U.S. patent number 10,689,701 [Application Number 14/214,853] was granted by the patent office on 2020-06-23 for biomarkers for the molecular classification of bacterial infection. This patent grant is currently assigned to Duke University. The grantee listed for this patent is Duke University. Invention is credited to Sun Hee Ahn, Vance Fowler, Geoffrey S. Ginsburg, Joseph E. Lucas, Ephraim Tsalik, Christopher W. Woods.


View All Diagrams
| United States Patent | 10,689,701 |
| Tsalik , et al. | June 23, 2020 |
Biomarkers for the molecular classification of bacterial infection
Abstract
Disclosed herein are biomarkers useful for identifying and/or classifying bacterial infections in a subject.
| Inventors: | Tsalik; Ephraim (Durham, NC), Fowler; Vance (Durham, NC), Woods; Christopher W. (Durham, NC), Lucas; Joseph E. (Chapel Hill, NC), Ginsburg; Geoffrey S. (Durham, NC), Ahn; Sun Hee (Gwangju, KR) | ||||||||||
|---|---|---|---|---|---|---|---|---|---|---|---|
| Applicant: |
|
||||||||||
| Assignee: | Duke University (Durham,
NC) |
||||||||||
| Family ID: | 51789725 | ||||||||||
| Appl. No.: | 14/214,853 | ||||||||||
| Filed: | March 15, 2014 |
Prior Publication Data
| Document Identifier | Publication Date | |
|---|---|---|
| US 20140323391 A1 | Oct 30, 2014 | |
Related U.S. Patent Documents
| Application Number | Filing Date | Patent Number | Issue Date | ||
|---|---|---|---|---|---|
| 61788266 | Mar 15, 2013 | ||||
| Current U.S. Class: | 1/1 |
| Current CPC Class: | C12Q 1/6883 (20130101); C12Q 1/689 (20130101); C12Q 2600/112 (20130101); C12Q 2600/158 (20130101) |
| Current International Class: | C12Q 1/6883 (20180101); C12Q 1/689 (20180101) |
References Cited [Referenced By]
U.S. Patent Documents
| 2004/0083084 | April 2004 | West |
| 2005/0170528 | August 2005 | West et al. |
| 2007/0059720 | March 2007 | Fuqua et al. |
| 2007/0154931 | July 2007 | Radich et al. |
| 2009/0155180 | June 2009 | Jump et al. |
| 2009/0319244 | December 2009 | West et al. |
| 2014/0128277 | May 2014 | Moller et al. |
| WO 2004/037996 | May 2004 | WO | |||
| WO 2004/038376 | May 2004 | WO | |||
| WO 2010/096331 | Aug 2010 | WO | |||
Other References
|
Acharya CR, Hsu DS, Anders CK, et al. "Gene expression signatures, clinicopathological features, and individualized therapy in breast cancer." Jama 2008, 299:1574-1587. cited by applicant . Ahn et al., "Two genes on A/J chromosome 18 are associated with susceptibility to Staphylococcus aureus infection by combined microarray and QTL analyses," PLoS Pathog, 2010, 6:e1001088, 14 pages. cited by applicant . Ahn, S. H. et al., "Gene Expression-Based Classifiers Identify Staphylococcus aureus Infection in Mice and Humans," PLoS ONE 2013, 8(1): e48979, 16 pages. cited by applicant . Alam, et al., "Comparative evaluation of (1,3)-beta-D-glucan, mannan and anti-mannan antibodies, and candida species-specific snPCR in patients with candidemia" BMC Infect. Dis. 7, 103 (2007), 9 pages. cited by applicant . Ardura et al., "Enhanced monocyte response and decreased central memory T cells in children with invasive Staphylococcus aureus infections," PLoS One, 2009, 4:e5446, 17 pages. cited by applicant . Arruda E, Pitkaranta A, Witek TJ, Jr., et al., "Frequency and natural history of rhinovirus infections in adults during autumn." J Clin Microbial 1997, 35:2864-2868. cited by applicant . Aziz H, Zaas A, Ginsburg GS, "Peripheral blood gene expression profiling for cardiovascular disease assessment." Genomic Med 2007, 1: 105-112. cited by applicant . Barenco, et al., Correction of scaling mismatches in oligonucleotide microarray data. BMC Bioinformatics 7, 251 (2006), 13 pages. cited by applicant . Barrett B, Brown R, Voland R, et al., "Relations among questionnaire and laboratory measures of rhinovirus infection." Eur Respir J 2006, 28:358-363. cited by applicant . Bassetti M, Righi E, Tumbarello M, et al., "Candida infections in the intensive care unit: epidemiology, risk factors and therapeutic strategies" Expert Rev Anti Infect Ther 2006, 4:875-885. cited by applicant . Berenguer J, Buck M, Witebsky F, et at., "Lysis-centrifugation blood cultnres in the detection of tissue-proven invasive candidiasis. Disseminated versus single organ infection" Diagn Microbiol Infect Dis 1993, 17: 103-109. cited by applicant . Berry et al., "An interferon-inducible neutrophil-driven blood transcriptional signature in human tuberculosis," Nature, 2010, 446:973-977. cited by applicant . Bhoj VG, Sun Q, Bhoj EJ, et al., "MAVS and MyD88 are essential for innate immunity but not cytotoxic T lymphocyte response against respiratory syncytial virus." Proc Natl Acad Sci US A 2008, 105:14046-14051. cited by applicant . Boldrick JC, Alizadeh AA, Diehn M, et al., "Stereotyped and specific gene expression programs in human innate immune responses to bacteria." Proc Natl Acad Sci USA 2002, 99:972-977. cited by applicant . Bone et al., "Definitions for sepsis and organ failure and guidelines for the use of innovative therapies in sepsis. The ACCP/SCCM Consensus Conference Committee American College of the Chest Physicians/Society of Critical Care Medicine," Chest, 1992, 101:1644-1655. cited by applicant . Botterel, et al., "Real-time PCR on the first galactomannan-positive serum sample for diagnosing invasive aspergillosis in liver transplant recipients" Transpl. Infect. Dis. 10, 333-338 (2008). cited by applicant . Boucher, H. W. et al., "Bad bugs, no drugs: no ESKAPE! An update from the Infections Diseases Society of America," Clin Infect Dis, 2009, 48:1-12. cited by applicant . Breiman L, "Statistical Modeling: The Two Cultures." Statistical Science 2001, 16:199-231. cited by applicant . Breiman L, Friedman JH, Olshen LA, et al., "Classification and regression trees," Chapman and Hall/CRC; 1984, 5 pages. cited by applicant . Brocker et al., "Evolutionary divergence and functions of the human interleukin (IL) gene family," Human Genomics, 2010, 5:30-55. cited by applicant . Bryant PA, Venter D, Robins-Browne R, et al., "Chips with everything: DNA microarrays in infectious diseases." Lancet Infect Dis 2004, 4:100-111. cited by applicant . Cameron, C. M.. et al., "Gene expression analysis of host innate immune responses during lethal H5N1 infection in ferrets," J. Virol. (2008) 29 pages. cited by applicant . Campbell and Ghazal, "Molecular signatures for diagnosis of infection: application of microarray technology," J Appl Microbial (2004) vol. 96, 18-23. cited by applicant . Carvalho et al., "High dimensional sparse factor modeling: applications in gene expression genomics," Journal of American Statistical Association (2008) pp. 1-51. cited by applicant . Chan et al., "Integrating Transcriptomics and Proteomics," G&P magazine, 6(3): 20-26, 2006. cited by applicant . Chang et al., "A genomic strategy to elucidate modules of ocogenic pathway signaling networks," Mol Cell, 2009, 34:104-114. cited by applicant . Chang, et al., "GATHER: A systems approach to interpreting genomic signatures." Bioinformatics 22, 2926-2933 (2006). cited by applicant . Chaussabel et al., "A modular analysis framework for blood genomics studies: application to systemic lupus erythematosus," Immunity, 2008, 29:150-164. cited by applicant . Chen et al., "Detection of viruses via statistical gene expression analysis," IEEE Transactions on Biomedical Engineering, 2011, 58: 468-479. cited by applicant . Chen et al., "Predicting Viral Infection from High-Dimensional Biomarker Trajectories," Journal of the American Statistical Association in Press, 2011, 46 pages. cited by applicant . Chiarini A, Palmeri A, Amato T, et al., "Detection of bacteria and yeast species by the BACTEC 9120 automated system with the routine use of aerobic, anaerobic, and fungal media." J Clin Microbial 2008, 4029-4033. cited by applicant . Chin et al., "Genome wide transcriptome profiling of a murine acute melioidosis model reveals new insights into how Burkholderia pseudomallei overcomes host innate immunity," BMC Genomics, 2010, 11:672, 14 pages. cited by applicant . Chin KC, Cresswell P, "Viperin (cig5), an IFN-inducible antiviral protein directly induced by human cytomegalovirus." Proc Natl Acad Sci USA 2001 , 98:15125-15130. cited by applicant . Chipman H, George E, McCulloch RE, "Bayesian CART model search." Theory and Methods, No. 443, 1998, 93:935-960. cited by applicant . Cross et al., "Patterns of cytokine induction by gram-positive and gram-negative probiotic bacteria," FEMS Immunol Med Microbiol, 2004, 42:173-180. cited by applicant . Cyr et al., "Characterization of serum proteins associated with IL28B genotype among patients with chronic hepatitis C," PLoS One, 2011, 6:e21854. cited by applicant . Deitch et al., "Animal models of sepsis and shock: a review and lessons learned," Shock, 1998, 9:1-11. cited by applicant . Desai et al., "Chipping away at breast cancer: insights from microarray studies of human and mouse mammary cancer," Endocr Relat Cancer, 2002, 9:207-220. cited by applicant . Downey, T., "Analysis of a multifactor microarray study using Partek genomics solution," Methods Enzymol, 2006, 411:256-270. cited by applicant . Drake CL, Roehrs TA, Royer H, et al., "Effects of an experimentally induced rhinovirus cold on sleep, performance, and daytime alertness." Physiol Behav 2000, 71:75-81. cited by applicant . Dressman HK, Muramoto GG, Chao NJ, et al., "Gene expression signatures that predict radiation exposure in mice and humans" PLoS Med 2007, 4:e106, 12 pages. cited by applicant . Dyson, "Animal models of sepsis: why does preclinical efficacy fail to translate to the clinical setting?," Crit Care Med, 2009, 37:S30-37. cited by applicant . Dziarski et al., "MD-2 enables Toll-like receptor 2 (TLR2)-mediated responses to lipopolysaccharide and enhances TLR2-mediated responses to Gram-positive and Gram-negative bacteria and their cell wall components," J Immunol, 2001, 166:1938-1944. cited by applicant . Esmon, "Why do animal models (sometimes) fail to mimic human sepsis?," Crit Care Med, 2004, 34:S219-222. cited by applicant . Falsey AR, Hennessey PA, Fmmica MA, et al., "Respiratory syncytial virus infection in elderly and high-risk adults." N Engl J Med 2005, 352:1749-1759. cited by applicant . Feezor, R. J. et al., "Molecular characterization of the acute inflammatory response to infections with gram-negative versus gram-positive bacteria," Infect Immun, 2003, 71:5803-5813. cited by applicant . Fernandez-Arenas et al. "Integrated proteomics and genomics strategies bring new insight into Candida albicans response upon macrophage interaction" Mol Cell Proteom 2007, 6(3):460-478. cited by applicant . Finlay et al., "Common Themes in Microbial Pathogenicity Revisited," Microbiology and Molecular Biology Reviews, 1997, 61 (2): 136-169. cited by applicant . Fisher et al, "Treatment of septic shock with the tumor necrosis factor receptor: Fc fusion protein. The Soluble TNF Receptor Sepsis Study Group," N Engl J Med, 1996, 334:1697-1702. cited by applicant . Fjaerli, H-O. et la., "Whole blood gene expression in infants with respiratory syncytial virus bronchiolitis," BMC Infectious Diseases (2006) 6(175):7 pages. cited by applicant . Fradin, et al., "Granulocytes govern the transcriptional response, morphology and proliferation of Candida albicans in human blood" Mol. Microbial. 56, 397-415 (2005). cited by applicant . Fradin, et al., "Stage-specific gene expression of Candida albicans in human blood." Mol. Microbial. 47, 1523-1543 (2003). cited by applicant . Garey K W, Rege M, Pai MP, et al., "Time to initiation of fluconazole therapy impacts mortality in patients with candidemia: a multi-institutional study" Clin Infect Dis 2006, 43:25-31. cited by applicant . Garman KS, Acharya CR, Edelman E, et al. "A genomic approach to colon cancer risk stratification yields biologic insights into therapeutic opportunities." Proc Natl Acad Sci USA 2008, 105:19432-19437. cited by applicant . Glickman et al., "Disease progression in hemodynamically stable patients presenting to the emergency department with sepsis," Acad Emerg Med, 2010, 17:383-390. cited by applicant . Goodridge, et al., "Dectin-1 stimulation by Candida albicans yeast or zymosan triggers NF AT activation in macrophages and dendritic cells." J lmmunol. 178, 3107-3115 (2007). cited by applicant . Gums JG, Pelletier EM, Blumentals WA, "Oseltamivir and influenza-related complications, hospitalization and healthcare expenditure in healthy adults and children." Expert Opin Pharmacother 2008,9:151-161. cited by applicant . Gwaltney JM, Jr., Hendley, Hayden FG, et al., "Updated recommendations for safety-testing of viral inocula used in volunteer experiments on rhinovirus colds." Prog Med Virol 1992, 39:256-263. cited by applicant . Hans, et al., "Shotgun stochastic search for "Large p" regression" J Am. Stat. Assoc. 102, 507-516 (2007). cited by applicant . He et al., "Expression signature developed from a complex series of mouse models accurately predicts human breast cancer survival," Clin Cancer Res, 2010, 16:249-259. cited by applicant . Hessle et al., "Gram-positive and Gram-negative bacteria elicit different patterns of pro-inflamatory cytokines in human monocytes," Cytokine, 2005, 30:311-318. cited by applicant . Hong CY, Lin RT, Tan ES, et al., "Acute respiratory symptoms in adults in general practice." Fam Pract 2004, 21:317-323. cited by applicant . How to: Find a homolog for a gene in another organism (Retrieved on Dec. 12, 2013 from the internet: <http://www.ncbi. nl m. n i h.gov/guide/howto/find-homolog-gene/> ), 2 pages. cited by applicant . Jackson GG, Dowling HF, Spiesman IG, et al., "Transmission of the common cold to volunteers under controlled conditions. I. The common cold as a clinical entity." AMA Arch Intern Med 1959, 101:762-769. cited by applicant . Japour et al. "Standardized Peripheral Blood Mononuclear Cell Culture Assay for Determination of Drug Susceptibilities of Clinical Human Immunodeficiency Virus Type 1 Isolates" Antimicrob. Agen. Chemother. May 1993, vol. 37, No. 5, p. 1095-1101. cited by applicant . Jenner RG, Young RA, "Insights into host responses against pathogens from transcriptional profiling." Nat Rev Microbiol 2005, 3:281-294. cited by applicant . Jiang D, Guo H, Xu C, et al., "Identification of three interferon-inducible cellular enzymes that inhibit the replication of hepatitis C virus." J Virol 2008, 82:1665-1678. cited by applicant . Johnston SL, "Natural and experimental rhinovirus infections of the lower respiratory tract." Am J Respir Crit Care Med 1995, 152:S46-S52. cited by applicant . Johnstone J, Majumdar SR, Fox JD, et al., "Viral Infection in Adults Hospitalized with Community Acquired Pneumonia: Prevalence, Pathogens and Presentation." Chest 2008, 1141-1148. cited by applicant . Jonathan, "Diagnostic utility of BINAX NOW RSV--an evaluation of the diagnostic performance of BINAX NOW RSV in comparison with cell culture and direct immunofluorescence," Ann Clin Microbial Antimicrob (2006) vol. 5, 13, 5 pages. cited by applicant . Kawada et al., "Analysis of gene-expression profiles by oligonucleotide microarray in children with influenza," J Gen Virol, 2006, 87:1677-1683. cited by applicant . Kim et al. "Expression of genes encoding innate host defense molecules in normal human monocytes in response to Candida albicans." Infect lmmun 2005, 73(6):3714-3724. cited by applicant . Kim, J. H. et al., "Observations on spiraling empiricism: its causes, allure, and perils, with particular reference to antibiotic therapy," Am J Med, 1989, 87:201-206. cited by applicant . Kirchberger S, Majdic O, Stockl J, "Modulation of the immune system by human rhinoviruses." Int Arch Allergy Immunol 2007, 142:1-10. cited by applicant . Klein, E. et al., "Hospitalizations and deaths caused by methicillin-resistant Staphylococcus aureus, United States 1999-2005," Emerg Infect Dis, 2007, 13:1840-1846. cited by applicant . Kobayashi SD, Braughton KR, Whitney AR, et al., "Bacterial pathogens modulate an apoptosis differentiation program in human neutrophils." Proc Natl Acad Sci US A 2003, 100:10948-10953. cited by applicant . Kollef, M. H. et al., "Inadequate antimicrobial treatment of infections: a risk factor for hospital mortality among critically ill patients," Chest, 1999, 115:462-474. cited by applicant . Kooperberg C, Ruczinski I, LeBlanc ML, et al., "Sequence analysis using logic regression." Gen. Epidem. 2001, 21:626-631. cited by applicant . Kumar, A. et al., "Initiation of inappropiate antimicrobial therapy results in a fivefold reduction of survival in human septic shock," Chest, 2009, 136:1237-1248. cited by applicant . Labreche et al., "Integrating factor analysis and a transgenic mouse model to reveal a peripheral blood predictor of breast tumors," BMC Med Genomics, 2011, 4:61. cited by applicant . Lambert SB, Whiley DM, O'Neill NT, et al., "Comparing nose-throat swabs and nasopharyngeal aspirates collected from children with symptoms for respiratory virus identification using real-time polymerase chain reaction." Pediatrics 2008, 122:e615-620. cited by applicant . Landry ML, Cohen S, Ferguson D: "Real-time PCR compared to Binax NOW and cytospin-immunofluorescence for detection of influenza in hospitalized patients." J Clin Virol 2008, 43:148-151. cited by applicant . Larsson et al., "Kinetics of senescence-associated changes of gene expression in an epithelial, temperature-sensitive SV40 large T antigen model," Cancer Res, 2004, 64:482-489. cited by applicant . Lee et al. "Systems-Level Comparison of Host-Responses Elicited by Avian H5N1 and Seasonal H1N1 Influenza Viruses in Primary Human Macrophages" PLoS ONE, 2009, 4(12): e8072, 11 pages. cited by applicant . Lee, A. et al., "Detection of bloodstream infections in adults: how many blood cultures are needed?," J Clin Microbiol, 2007, 45:3546-3548. cited by applicant . Lorenz, et al., "Transcriptional response of Candida albicans upon internalization by macrophages" Eukaryot. Cell 3,1076-1087 (2004). cited by applicant . Lucas et al., "Sparse statistical modeling in gene expression genomics" Bayesian Inference for Gene Expression and Proteomics (Cambridge Univ. Press, New York, 2006), pp. 155-176. cited by applicant . Lucas et al., "A bayesian analysis strategy for cross-study translation of gene expression biomarkers," Stat Appl genet Mol Biol, 2009, 8: Article 11, 28 pages. cited by applicant . Lucas JE, Carvalho CM, Merl D, et al., "In-Vitro to In-Vivo factor profiling in expression genomics." Bayesian Modeling in Bioinformatics. Edited by Dey D, Ghosh S, Mallick B: Taylor-Francis; 2008, 11-35. cited by applicant . Luther, et al., "Characterisation of the phagocytic uptake of Aspergillusfumigatus conidia by macrophages" Microbes Infect. 10, 175-184 (2000). cited by applicant . Lytkin et al., "Expanding the understanding of biases in development of clinical-grade molecular signatures: a case study in acute respiratory viral infections," PLoS One, 2011, 6:e20662, 10 pages. cited by applicant . MacCallum, "Massive induction of innate immune response to Candida albicans in the kidney in a murine intravenous challenge model." FEMS Yeast Res 9, 1111-1122 (2009). cited by applicant . Martin, G. S. et al., "The epidemiology of sepsis in the United States from 1979 through 2000," N Engl J Med, 2003, 348:1546-1554. cited by applicant . Mashimo T, Simon-Chazottes D, Guenet JL, "Innate resistance to flavivirus infections and the functions of 2'-5' oligoadenylate synthetases." Curr Top Microbial Immunol 2008, 321:85-100. cited by applicant . McDunn et al., "Plasticity of the systemic inflammatory response to acute infection during critical illness: development of the riboleukogram," PLoS One, 2008, 3:e1564, 14 pages. cited by applicant . Meadows et al., "Diagnosis of partial body radiation exposure in mice using peripheral blood gene expression profiles," PLoS One, 2010, 5:e11535, 9 pages. cited by applicant . Meadows SK, Dressman HK, Muramoto GG, et al., "Gene expression signatures of radiation response are specific, durable and accurate in mice and humans." PLoS ONE 2008, 3:e1912. cited by applicant . Memoli MJ, Morens DM, Taubenberger JK, "Pandemic and seasonal influenza: therapeutic challenges." Drug Discov Today 2008, 13:590-595. cited by applicant . Merl et al., "Trans-study Projection of Genomic Biomarkers in Analysis of Oncogene Deregulation and Breast Cancer," The Oxford Handbook of Applied Bayesian Analysis (2009), 35 pages. cited by applicant . Mestas et al., "Of mice and not men: differences between mouse and human immunology," J Immunol, 2004, 172:2731-2738. cited by applicant . Miller et al., "Guanine phosphoribosyltransferase from Escherichia coli, specificity and properties," Biochemistry, 1972, 11:4723-4731. cited by applicant . Min JY, Krug RM, "The primary function of RNA binding by the influenza A virus NS1 protein in infected cells: Inhibiting the 2'-5' oligo (A) synthetase/RNase L pathway." Proc Natl Acad Sci US A 2006, 103:7100-7105. cited by applicant . Mohler et al., "Soluble tumor necrosis factor (TNF) receptors are effective therapeutic agents in lethal endotoxemia and function simultaneously as both TNF carriers and TNF antagonists," J Immunol, 1993, 1548-1561. cited by applicant . Mueller et al., "Distinct gene expression profiles characterize the histopathological stages of disease in helicobacter-induced mucosa-associated lymphoid tissue lymphoma," Proc Natl Acad Sci USA, 2003, 100:1292-1297. cited by applicant . Mullick et al. "Cardiac failure in C5-deficient AIJ mice after Candida albicans infection." Infect lmmun 2006, 74(8):4439-4451. cited by applicant . Nau et al., "Cummulative Toll-like receptor activation in human macrophages treated with whole bacteria," J Immunol, 2003, 170:5203-5209. cited by applicant . Netea et al., "An integrated model of the recognition of Candida albicans by the innate immune system," Nature Review: Microbiology, 2008, 6:67-78. cited by applicant . Netea, et al., "Immune sensing of Candida aibicans requires cooperative recognition of mannans and glucans by lectin and Toll-like receptors." J Clin. Invest. 116, 1642-1650 (2006). cited by applicant . Ng et al., "Gene expression profiling of mouse host response to Listeria monocytogenes infection," Genomics, 2005, 86:657-667. cited by applicant . Ostrosky-Zeichner L, Alexander BD, Kelt DH et al., "Multicenter clinical evaluation of the (1->3) beta-D-glucan assay as an aid to diagnosis of fungal infections in humans" Clin Infect Dis 2005, 41:654-659. cited by applicant . Overland, G., et al., "Cytokine responses to fungal pathogens in Kupffer cells are Toll-like receptor 4 independent and mediated by tyrosine kinases" Scand. J. Immunol 62, 148-154 (2005). cited by applicant . Pankla et al., "Genomic transcriptional profiling identifies a candidate blood biomarker for the diagnosis of septicemic melioidosis," Genome Biol, 2009, 10:R127, 22 pages. cited by applicant . Peltola V, Waris M, Osterback R, et al., "Rhinovirus transmission within families with children: incidence of symptomatic and asymptomatic infections." J Infect Dis 2008, 197:382-389. cited by applicant . Proud D, et al., "Gene Expression Profiles During In Vivo Human Rhinovirus Infection: Insights into the Host Response." Am J Respir Crit Care Med, Jul. 31, 2008, (pp. 1-42). cited by applicant . Raftery, et al., "Bayesian model averaging for linear regression models" J Am. Stat. Assoc 92, 179-191 (1997). cited by applicant . Rahman M, Vandermause MF, Kieke BA, et al., "Performance of Bin ax NOW Flu A and B and direct fluorescent assay in comparison with a composite of viral culture or reverse transcription polymerase chain reaction for detection of influenza infection during the 2006 to 2007 season." Diagn Microbial Infect Dis 2008, 62:162-166. cited by applicant . Rakes GP, Arruda E, Ingram JM, et al., "Rhinovirus and respiratory syncytial virus in wheezing children requiring emergency care. lgE and eosinophil analyses." Am J Respir Crit Care Med 1999, 159:785-790. cited by applicant . Ramilo et al., "Gene expression patterns in blood leukocytes discriminate patients with acute infections," Blood (2007) vol. 109, 2066-2077. cited by applicant . Rice et al., "The Staphylococcus aureus cidAB operon: evaluation of its role in regulation of murein hydrolase activity and penicillin tolerance," J Bacteriol, 2003, 185:2635-2643. cited by applicant . Rigamonti et al., Regulation of Macrophage Functions by PPAR-.alpha., PPAR-.gamma. and LXRs in Mice and Men, Arteriosclerosis, Thrombosis, and Vascular Biology, 2008, 28:1050-1059. cited by applicant . Rios JJ, Perelygin AA, Long MT, et al., "Characterization of the equine 2'-5' oligoadenylate synthetase 1 (OAS1) and ribonuclease L (RNASEL) innate immunity genes." BMC Genomics 2007, 8:313, 14 pages. cited by applicant . Robinson JL, Lee BE, Kothapalli S, et al., "Use of throat swab or saliva specimens for detection of respiratory viruses in children." Clin Infect Dis 2008, 46:e61-64. cited by applicant . Rubin-Bejerano, et al., "Phagocytosis by neutrophils induces an amino acid deprivation response in Saccharomyces cerevisiae and Candida albicans" Proc Natl. Acad. Sci. U.S.A 100, 11007-11012 (2003). cited by applicant . Ruczinski I, Kooperberg C, LeBlanc ML, "Logic regression." J. Comp. Graph. Statist. 2003, 475-511. cited by applicant . Schaller M, Hogaboam CM, Lukacs N, et al., "Respiratory viral infections drive chemokine expression and exacerbate the asthmatic response." J Allergy Clin Immunol 2006, 118:295-302. cited by applicant . Scheper et al. "Farnesol, a fungal quorum-sensing molecule triggers apoptosis in human oral squamous carcinoma cells" Neoplasia 2008, 10 (9):954-963. cited by applicant . Seo D, Ginsburg GS, Goldschmidt-Clermont PJ, "Gene expression analysis of cardiovascular diseases: novel insights into biology and clinical applications." J Am Call Cardiol 2006, 48:227-235. cited by applicant . Seo, et al., "Of mice and men: Sparse statistical modeling in cardiovascular genomics" Ann. Appl. Stat. 1, 152-178 (2007). cited by applicant . Shanley et al., "Genome-level longitudinal expression os signaling pathways and gene networks in pediatric septic shock," Mol Med, 2007, 495-508. cited by applicant . Simmons CP, Popper S, Dolocek C, et al., "Patterns of host genome-wide gene transcript abundance in the peripheral blood of patients with acute dengue hemorrhagic fever." J Infect Dis 2007, 195:1097-1107. cited by applicant . Spellberg, et al., "Mice with disseminated candidiasis die of progressive sepsis" J. Infect. Dis. 192, 336-343 (2005). cited by applicant . Sriskandan et al., "Gram-positive sepsis, Mechanisms and differences from gram-negative sepsis," Infect Dis Clin North Am, 1999, 13:397-412. cited by applicant . Steinbach, et al., "Calcineurin inhibition or mutation enhances cell wall inhibitors against Aspergillus fumigatus" Antimicrob. Agents Chemother. 51, 2979-2981 (2007). cited by applicant . Subauste et al., "Infection of a Human Respiratory Epithelial Cell Line with Rhinovirus--Induction of Cytokine Release and Modulation of Susceptibility to Infection by Cytokine Exposure." J. Clin. Invest. 1995. 96:549-557. cited by applicant . Szabo et al., "The contribution of mouse models to our understanding of systemic candidiasis," FEMS Microbial Lett, 2011, 320: 1-8. cited by applicant . Takeuchi et al., "Differential roles of TLR2 and TLR4 in recognition of gram-negative and gram-positive bacterial cell wall components," Immunity, 1999, 11:443-451. cited by applicant . Tang et al., "Gene-expression profiling of gram-posistive and gram-negative sepsis in critically ill patients," Crit Care Med, 2008, pp. 1125-1128. cited by applicant . Thanaraj et al., "Conservation of human alternative splice events in mouse," Nucleic Acids Research, 2003, vol. 31, No. 10, 2544-2552. cited by applicant . Thankker et al., "Staphylococcus aureus serotype 5 capsular polysaccharide is antiphagocytic and enhances bacterial virulence in a murine cateremia model," Infect Immun, 1998, 66:5183-5189. cited by applicant . Timofeeva et al., "Comparative transcriptome analysis of human aorta atherosclerotic lesions and peripheral blood leukocytes from essential hypertension patients," Kardiologiia, 2009, 49:27-38. cited by applicant . Tompkins et al., "Identification of Candidate B-Lymphoma Genes by Cross-Species Gene Expression Profiling," PLOS ONE, Oct. 2013, vol. 8, Issue 10, e76889, 15 pages. cited by applicant . Tsalik et al., "Multiplex PCR to diagnose bloodstream infections in patients admitted from the emergency department with sepsis," J Clin Microbiol, 2010, 48:26-33. cited by applicant . Turner RB, "Ineffectiveness of intranasal zinc gluconate for prevention of experimental rhinovirus colds." Clin Infect Dis 2001 , 33:1865-1870. cited by applicant . UC Davis' Gene Expression Resource Webpage (retrieved on Jul. 25, 2013 from the internet: <http://www.ucdmc.ucdavis.edu/ctsc/docu ments/geneexpression .pdf>; dated Jul. 12, 2007), 14 pages. cited by applicant . Unsinger et al., "Sepsis-induced human lymphocyte apoptosis and cytokine production in "humanized" mice," J Leukoc Biol, 2009, 86:219-227. cited by applicant . Von Bernuth et al., "Pyogenic bacterial infections in humans with MyD88 deficiency," Science, 2008, 321:691-696. cited by applicant . Von Kockritz-Blickwede et al., "Immunological mechanisms underlying the genetic predisposition to serve Staphylococcus aureus infection in the mouse model," Am J Pathol, 2008, 173:1657-1668. cited by applicant . Voora et al., "A Whole Blood RNS Signature Accurately Classifies Multiple Measures of Platelet Function on Aspirin in Healthy Volunteers and Highlights a Common Underlying Pathway," Circulation, 2010, Abstract 16293, 122:A16293, 3 pages. cited by applicant . Wang et al., "Bayesian factor regression modeling," Bulletin of the International Society of Bayesian Analysis, 2007, 14:4-5, 10 pages. cited by applicant . Wang F, Gao X, Barrett JW, et al., "RIG-I mediates the co-induction of tumor necrosis factor and type I interferon elicited by myxoma virus in primary human macrophages." PLoS Pathog 2008, 4:e1000099, 13 pages. cited by applicant . Wang Q, Carvalho CM, Lucas JE, et al., "BFRM: Bayesian factor regression modeling." Bulletin of the International Society of Bayesian Analysis 2007, 14:4-5, 1 page. cited by applicant . Wang X, Hinson ER, Cresswell P, "The interferon-inducible protein viperin inhibits influenza virus release by perturbing lipid rafts." Cell Host Microbe 2007, 2:96-105. cited by applicant . Wang Z, Neuburg D, Li C, et al., "Global gene expression profiling in whole-blood samples from individuals exposed to metal fumes." Environ Health Perspect 2005, 113:233-241. cited by applicant . Weindruch et al., "Microarray profiling of gene expression in aging and its alteration by caloric restriction in mice," J Nutr, 2001, 131:918S-923S. cited by applicant . Wennmalm et al., "The expression signature of in vitro senescence resembles mouse but not human aging," Genome Biol, 2005, 6:R109. cited by applicant . West, "Bayesian Factor Regression Models in the "Large p, Small n" Paradigm," Bayesian Statistics 7, 2003, p. 1-11. cited by applicant . Xu et al., "Cloning and characterization of human protease-activated receptor 4," Proceedings of the National Academy of Sciences, 1998, 95:6642-6646. cited by applicant . Xu M, Kao MC, Nunez-Iglesias J, et al., "An integrative approach to characterize disease-specific pathways and their coordination: a case study in cancer." BMC Genomics 2008, 9 Suppl 1:S12. cited by applicant . Yu et al., "Differential gene expression in gram-negative and gram-positive sepsis," Am J Respir Crit Care, 2004, 169:1135-1143. cited by applicant . Zaas et al. "Blood Gene Expression Signatures Predict Invasive Candidiasis" Sci Transl Med EPub Mar. 3, 2010, 2(21):1-10 and Supplemental Data Pages. cited by applicant . Zaas et al., "A Host-Based RT-PCR Gene Expression Signature to Identify Acute Respiratory Viral Infection," www.ScienceTranslationalMedicine.org, Sep. 18, 2013, vol. 5, Issue 203, 1-10. cited by applicant . Zass et al., "Gene Expression Signatures Diagnose Influenza and Other Symptomatic Respiratory Viral Infections in Humans" Cell Host & Microbe Sep. 17, 2009, 6, 207-217. cited by applicant . Zeni et al., "Anti-inflamatory therapies to treat sepsis and septic shock: a reassessment," Crit Care Med, 1997, 25:1095-1100. cited by applicant . Zhang, H. et al., "Signature patters revealed by microarray analyses of mice infected with influenza virus A and Streptococcus pneumoniae," Microbes and Infection (2006) 8:2172-2185. cited by applicant . United States Patent Office Action for U.S. Appl. No. 14/880,668 dated Nov. 4, 2016 (27 pages). cited by applicant . United States Patent Office Action for U.S. Appl. No. 14/880,668 dated Feb. 2, 2016 (25 pages). cited by applicant . Ramilo et al. Gene Expression Patterns in Blood Leukocyte discriminate patients with acute infections. Mar. 1, 2007. Blood. vol. 109, No. 5, pp. 2066-2077. cited by applicant . De Repentigny, "Animal models in the analysis of Candida host-pathogen interactions" Current Opinion in Microbiology. 2004. 7: 324-329. cited by applicant . Miranda et al., "Candida colonisation as a source for candidaemia" Journal of Hospital Infection. 2009. 72: 9-16. cited by applicant . Conti et al., "Host responses to Candida albicans: Th17 cells and mucosal Candidiasis" Microbes and Infection. 2010. 12: 518-527. cited by applicant . Ingersoll et al., "Comparison of gene expression profiles between human and mouse monocyte subsets" Blood. 2010. 115(3): e10-9. cited by applicant . Dix et al. "Biomarker-based classification of bacterial and fungal whole-blood infections in a genome-wide expression study," Frontiers in Microbiology. 2015. 8: Article 171 and Supplementary Materials. cited by applicant . Bailey et al., "IFITM-Family Proteins: The Cell's First Line of Antiviral Defense," Annu Rev Virol., 2014, 1:261-283. cited by applicant . "Human Genome U133A Annotated Chip--Broad Institute. Accessed on Mar. 1, 2017 at https ://software.broadinstitute.org/cancer/software/genepattern/tutorial/1 inked Files/HG_ U 133A _ an not.chip; pp. 1-223." cited by applicant . Loughner et al., "Organization, evolution and functions of the human and mouse Ly6/uPAR family genes," Human Genetics. 2016. 10:10, 19 pages. cited by applicant . MGI. Retrieved on Sep. 14, 2017 from the internet: http://www.informatics.jax.org/marker/MGI:105983, 2 pages. cited by applicant . NCBI. Retrieved on Sep. 14, 2017 from the internet: https://www.ncbi.nlm.nih.gov/IEB/Research/Acembly/av.cgi?db=mouse&c=Gene&- I =NGP, 2 pages. cited by applicant . UniProtKB--O08692, Retreived on Sep. 14, 2017 from the internet: http://www.uniprot.org/unioprot/O08692, 5 pages. cited by applicant . United States Patent Office Summary of Applicant Initiated Interview for U.S. Appl. No. 14/880,668 dated Mar. 7, 2017 (4 pages). cited by applicant . United States Patent Office Notice of Allowance for U.S. Appl. No. 14/880,668 dated Aug. 2, 2017 (10 pages). cited by applicant. |
Primary Examiner: Mahatan; Channing S
Attorney, Agent or Firm: Michael Best & Friedrich LLP
Government Interests
STATEMENT OF GOVERNMENT INTEREST
This invention was made with government support under federal grant numbers R01-AI068804, K24-A1093969, 5U01AI066569-05, 3U01AI066569-05 S1 awarded by the National Institutes of Health and N66001-09-C-2082 awarded by Defense Advanced Research Projects Agency of the Department of Defense. The U.S. Government has certain rights to this invention.
Parent Case Text
CROSS REFERENCE TO RELATED APPLICATION
This application claims priority to U.S. Provisional Application No. 61/788,266, filed Mar. 15, 2013, which is incorporated herein by reference in its entirety.
Claims
What is claimed is:
1. A method of developing a diagnostic assay for identifying and/or classifying a bacterial infection in a subject and treating the subject, the method comprising: (a) determining the gene expression levels of biomarkers in a blood sample from the subject using microarray analysis, or PCR, or a combination thereof, wherein the biomarkers comprise the biomarkers of Factor 20 and Factor 74 listed in Table 8 and Table 10, and wherein the gene expression levels in the subject are up-regulated or down-regulated more than 1-fold compared to a control population with known bacterial infection status, with a regression model based on weighted gene expression levels that provides a classification accuracy or an area under the curve (AUC) value of about 0.8100 to about 0.9999 compared to a probability of infection in the control population; (b) identifying the subject as having a bacterial infection based on the gene expression levels in the subject determined in step (a); and (c) administering an effective amount of antibiotic therapy to the subject identified as having a bacterial infection in step (b).
2. The method of claim 1, wherein the subject has a Staphylococcus aureus blood stream infection and the control is healthy, the subject has a Staphylococcus aureus blood stream infection and the control has an Escherichia coli blood stream infection, or the subject has an Escherichia coli blood stream infection and the control is healthy.
3. The method of claim 1, wherein the subject has a gram positive blood stream infection and the control has a gram negative blood stream infection, or the subject has a gram negative blood stream infection and the control has a gram positive blood stream infection.
4. The method of claim 1, wherein the subject has a Staphylococcus aureus blood stream infection and the control is healthy.
5. The method of claim 1, wherein the subject is a mammal.
6. A method of using a diagnostic assay with a subject suspected of having a bacterial infection and treating the subject, the method comprising: (a) determining in the assay the gene expression levels of biomarkers in a blood sample from the subject suspected of having a bacterial infection using microarray analysis, or PCR, or a combination thereof, wherein the biomarkers comprise the biomarkers of Factor 20 and Factor 74 listed in Table 8 and Table 10, and wherein the gene expression levels of the biomarkers in the subject are up-regulated or down-regulated more than 1-fold compared to a control population with known bacterial infection status, using combined weighted values of the gene expression levels in a regression model with a classification accuracy or an area under the curve (AUC) value of about 0.8100 to about 0.9999; (b) diagnosing the subject as having a bacterial infection based on the gene expression levels of the biomarkers in the subject determined in step (a); and (c) administering an effective amount of antibiotic therapy to the subject diagnosed as having a bacterial infection in step (b).
7. The method of claim 6, wherein the subject has a Staphylococcus aureus blood stream infection and the control is healthy the subject has a Staphylococcus aureus blood stream infection and the control has an Escherichia coli blood stream infection, or the subject has an Escherichia coli blood stream infection and the control is healthy.
8. The method of claim 6, wherein the subject has a gram positive blood stream infection and the control has a gram negative blood stream infection, or the subject has a gram negative blood stream infection and the control has a gram positive blood stream infection.
9. The method of claim 6, wherein the subject has a Staphylococcus aureus blood stream infection and the control is healthy.
10. A method of diagnosing and treating a bacterial infection in a subject, the method comprising: (a) determining the gene expression levels of biomarkers in a blood sample from the subject using microarray analysis, or PCR, or a combination thereof, wherein the biomarkers comprise the biomarkers of Factor 20 and Factor 74 listed in Table 8 and Table 10, wherein the gene expression levels in the subject are up-regulated or down-regulated more than 1-fold compared to a control population with known bacterial infection status, with a regression model based on weighted gene expression levels that provides a classification accuracy or an area under the curve (AUC) value of about 0.8100 to about 0.9999; (b) diagnosing the subject as having a bacterial infection based on the gene expression levels in the subject determined in step (a); and (c) administering an effective amount of antibiotic therapy to the subject diagnosed as having a bacterial infection in step (b).
11. The method of claim 10, wherein the subject has a Staphylococcus aureus blood stream infection and the control is healthy, the subject has a Staphylococcus aureus blood stream infection and the control has an Escherichia coli blood stream infection, or the subject has an Escherichia coli blood stream infection and the control is healthy.
12. The method of claim 10, wherein the subject has a gram positive blood stream infection and the control has a gram negative blood stream infection, or the subject has a gram negative blood stream infection and the control has a gram positive blood stream infection.
13. The method of claim 10, wherein the subject has a Staphylococcus aureus blood stream infection and the control is healthy.
Description
TECHNICAL FIELD
The present invention relates to methods of identifying and treating subjects suffering from bacterial infection.
BACKGROUND
Septicemia causes substantial morbidity and mortality among patients in the United States, with a rising burden of Staphylococcus aureus infection. Although blood cultures are the diagnostic gold standard for blood stream infection (BSI), sensitivity is limited and results are not rapidly available. Such diagnostic delays can extend the time to administration of effective antibiotics, which is an independent risk factor for mortality. Conversely, diagnostic uncertainty also leads to high rates of empiric overtreatment, fueling the burden of antimicrobial resistance. Thus, novel approaches that are faster and more accurate are needed to differentiate between the major pathogens causing sepsis and BSI.
Whereas conventional diagnostic approaches have focused on identifying the infecting pathogen, a growing body of evidence suggests that the host's inflammatory response to the pathogen also represents a potential diagnostic tool. In vitro and In vivo experiments have revealed fundamental differences in host response to Gram-positive and Gram-negative bacterial infection, including significant differences in Toll-like receptor (TLR) signaling and cytokine production. Distinctive gene expression profiles exist for viral, bacterial, and fungal infections in both animal model systems and ex vivo stimulation of human peripheral blood leukocytes. Peripheral blood mononuclear cell (PBMC) gene expression signatures have also been evaluated in humans for a variety of conditions including severe infection, bacterial vs. viral illness, systemic lupus erythematosus, atherosclerosis, and radiation exposure. Taken together, these studies provide strong evidence that global changes in host blood gene expression patterns can be used to differentiate disease states.
Staphylococcus aureus causes a spectrum of human infection. Diagnostic delays and uncertainty lead to treatment delays and inappropriate antibiotic use. Early diagnostic strategies for S. aureus BSI could improve patient care by reducing the time required to establish the diagnosis and provide appropriate treatment while avoiding unnecessary anti-MRSA antibiotics. There is a need in the art to have alternative methods for diagnosing and treating patients with bacterial infection, such as sepsis.
SUMMARY
The present invention is directed to a method of developing a diagnostic assay for identifying and/or classifying a bacterial infection in a subject. The method comprising determining the gene expression levels of at least two biomarkers in a subject infected with bacterial infection, wherein the biomarkers are selected from one or more of Tables 3-17; comparing the gene expression levels of the biomarkers in the subject with the gene expression levels of the biomarkers in a control; identifying factors, wherein each factor comprises differentially expressed biomarkers that have the greatest ability to differentiate between gene expression in the subject and the control; providing a weighted value for the differentially expressed biomarkers within the factor; and determining a relationship between the factor and the bacterial infection using the weighted values of the differentially expressed biomarkers with an algorithm, wherein a relationship between the factor and the bacterial infection is used to develop the diagnostic assay. The method may distinguish a subject that has a Staphylococcus aureus blood stream infection from a healthy subject. The biomarkers may be selected from Table 8 and Table 10. The factor may comprise about 5 to about 250 biomarkers. The relationship may have an AUC value of 0.9898. The method may distinguish a subject that has a Staphylococcus aureus blood stream infection from a subject that has an Escherichia coli blood stream infection. The biomarkers may be selected from Table 8 and Table 10. The factor may comprise about 5 to about 250 biomarkers. The relationship may have an AUC value of 0.8372. The method may distinguish a subject that has an Escherichia coli blood stream infection from a healthy subject. The biomarkers may be selected from Table 8 and Table 10. The factor may comprise about 5 to about 250 biomarkers. The relationship may have an AUC value of 0.9229. The method may distinguish a subject that has a gram positive blood stream infection from a subject that has a gram negative blood stream infection. The biomarkers may be selected from Table 9. The factor may comprise about 5 to about 250 biomarkers. The relationship may have an AUC value of 0.8503. The method may distinguish a subject that has a Staphylococcus aureus blood stream infection from a healthy subject. The biomarkers may be selected from Table 7. The factor may comprise about 5 to about 250 biomarkers. The relationship may have an AUC value of 0.9217. The method may distinguish a subject that has a Staphylococcus aureus blood stream infection from a healthy subject. The biomarkers may be selected from Tables 3, 4, and 6. The factor may comprise about 5 to about 250 biomarkers. The relationship may have an AUC value of 0.9522. The method may distinguish a subject that has a Staphylococcus aureus blood stream infection from a healthy subject. The biomarkers may be selected from Tables 3, 4, 5 and 6. The factor may comprise about 5 to about 250 biomarkers. The relationship may have an AUC value of 0.9964. The method may distinguish a subject that has a Staphylococcus aureus blood stream infection from a subject that has an Escherichia coli blood stream infection. The biomarkers may be selected from Tables 3, 4, 5 and 6. The factor may comprise about 5 to about 250 biomarkers. The relationship may have an AUC value of 0.9935. The method may distinguish a subject that has an Escherichia coli blood stream infection from a healthy subject. The biomarkers may be selected from Tables 3, 4, 5 and 6. The factor may comprise about 5 to about 250 biomarkers. The relationship may have an AUC value of 0.9484. At least one of the differentially expressed biomarkers may have an increased expression level compared to the control. At least one of the differentially expressed biomarkers may have a decreased expression level compared to the control. At least one of the differentially expressed biomarkers may have an increased expression level compared to the control and at least one of the differentially expressed biomarkers may have a decreased expression level compared to the control. The factor may comprise about 10 biomarkers. The method of any one of the preceding claims, wherein the factor may comprise about 20 biomarkers. The factor may comprise about 50 biomarkers. The factor may comprise about 100 biomarkers. The factor may comprise about 150 biomarkers. The factor may comprise about 200 biomarkers. The factor may comprise about 250 biomarkers. The subject may be a mammal. The subject may be a human. The subject may be a mouse. The biological sample may be selected from the group consisting of tissues, cells, biopsies, blood, lymph, serum, plasma, urine, saliva, mucus, and tears. The sample may comprise plasma. The RNA gene expression levels may be determined.
The present invention is directed to method of identifying and treating a bacterial infection in a subject. The method comprises performing the diagnostic assay as developed by the methods, as described above, and administrating an antibacterial therapy to the subject diagnosed with a bacterial infection. The method further comprising quantifying the amount of at least one biomarker present in a biological sample derived from the subject, wherein the biomarker may be associated with a factor. At least one of the differentially expressed biomarkers may have an increased expression level compared to the control. At least one of the differentially expressed biomarkers may have a decreased expression level compared to the control. At least one of the differentially expressed biomarkers may have an increased expression level compared to the control and at least one of the differentially expressed biomarkers may have a decreased expression level compared to the control. The factor may comprise about 10 biomarkers. The method of any one of the preceding claims, wherein the factor may comprise about 20 biomarkers. The factor may comprise about 50 biomarkers. The factor may comprise about 100 biomarkers. The factor may comprise about 150 biomarkers. The factor may comprise about 200 biomarkers. The factor may comprise about 250 biomarkers. The subject may be a mammal. The subject may be a human. The subject may be a mouse. The biological sample may be selected from the group consisting of tissues, cells, biopsies, blood, lymph, serum, plasma, urine, saliva, mucus, and tears. The sample may comprise plasma. The RNA gene expression levels may be determined.
The present invention is also directed towards a method of identifying and treating a subject suspected of having a bacterial blood stream infection (BSI). The method comprises determining gene expression levels of at least two biomarkers in a peripheral blood cell sample of the subject, wherein the biomarkers are selected from any one of Tables 3-17; comparing the gene expression levels of the at least two biomarkers to standard gene expression levels wherein the standard gene expression levels correspond to the gene expression levels for the biomarkers in a control; identifying the subject as having a bacterial BSI if the gene expression levels of the biomarkers are different than the standard gene expression levels; and administering an effective amount of antibiotic therapy to treat the subject identified as having a bacterial BSI. The bacterial BSI may be Staphylococcus aureus BSI or Escherichia coli BSI. The bacterial blood stream infection may be S. aureus BSI and the biomarkers may be selected from one of Tables 3-8 or 10. At least about 2 to about 250 biomarkers may be selected from one of Tables 3-8 or 10. The bacterial blood stream infection may be E. coli BSI and the biomarkers may be selected from one of Tables 3-6, 8 or 10. At least about 2 to about 250 biomarkers may be selected from one of Tables 3-6, 8 or 10. The control may be a healthy subject. At least one of the biomarkers may have an increased gene expression level compared to the control. At least one of the biomarkers may have a decreased gene expression level compared to the control. At least one of the biomarkers may have an increased gene expression level compared to the control and at least one of the biomarkers has a decreased gene expression level compared to the control. The gene expression levels of about 10 biomarkers may be determined. The gene expression levels of about 20 biomarkers may be determined. The gene expression levels of about 50 biomarkers may be determined. The gene expression levels of about 100 biomarkers may be determined. The gene expression levels of about 150 biomarkers may be determined. The gene expression levels of about 200 biomarkers may be determined. The gene expression levels of about 250 biomarkers may be determined. The subject may be a mammal. The subject may be a human. The subject may be a mouse. The biological sample may be selected from the group consisting of tissues, cells, biopsies, blood, lymph, serum, plasma, urine, saliva, mucus, and tears. The sample may comprise plasma. The RNA gene expression levels may be determined.
The present invention is directed to method of distinguishing and treating Staphylococcus aureus blood stream infection (BSI) from Escherichia coli BSI in a subject suspected of having a bacterial infection. The method comprises determining gene expression levels of at least two biomarkers in a peripheral blood cell sample of the subject, wherein the biomarkers are selected from any one of Tables 8 and 10 or Tables 3-6; comparing the gene expression levels of the at least two biomarkers to standard gene expression levels wherein the standard gene expression levels correspond to the gene expression levels for the biomarkers in a control; identifying the subject as having a S. aureus BSI if the gene expression levels of the biomarkers are different than the standard gene expression levels and identifying the subject as having an E. coli BSI if the gene expression levels of the biomarkers are the same as the standard gene expression levels; and administering an effective amount of appropriate antibacterial therapy to treat the subject identified as having a S. aureus BSI or E. coli. The control may be a subject having an E. coli BSI. At least one of the biomarkers may have an increased gene expression level compared to the control. At least one of the biomarkers may have a decreased gene expression level compared to the control. At least one of the biomarkers may have an increased gene expression level compared to the control and at least one of the biomarkers has a decreased gene expression level compared to the control. The gene expression levels of about 10 biomarkers may be determined. The gene expression levels of about 20 biomarkers may be determined. The gene expression levels of about 50 biomarkers may be determined. The gene expression levels of about 100 biomarkers may be determined. The gene expression levels of about 150 biomarkers may be determined. The gene expression levels of about 200 biomarkers may be determined. The gene expression levels of about 250 biomarkers may be determined. The subject may be a mammal. The subject may be a human. The subject may be a mouse. The biological sample may be selected from the group consisting of tissues, cells, biopsies, blood, lymph, serum, plasma, urine, saliva, mucus, and tears. The sample may comprise plasma. The RNA gene expression levels may be determined.
The present invention is directed to method of distinguishing and treating a gram positive bacterial infection from a gram negative bacterial infection in a subject suspected of having a bacterial infection. The method comprises determining gene expression levels of at least two biomarkers in a peripheral blood cell sample of the subject, wherein the biomarkers are selected from Table 9; comparing the gene expression levels of the at least two biomarkers to standard gene expression levels wherein the standard gene expression levels correspond to the gene expression levels for the biomarkers in a control; identifying the subject as having a gram positive bacterial infection if the gene expression levels of the biomarkers are different than the standard gene expression levels in a control; and administering an effective amount of appropriate antibacterial therapy to treat the subject identified as a gram positive bacterial infection. The gram positive bacterial infection may be Staphylococcus aureus. The control may be a subject having a gram negative bacterial infection. The gram negative bacterial infection may be Escherichia coli. At least one of the biomarkers may have an increased gene expression level compared to the control. At least one of the biomarkers may have a decreased gene expression level compared to the control. At least one of the biomarkers may have an increased gene expression level compared to the control and at least one of the biomarkers has a decreased gene expression level compared to the control. The gene expression levels of about 10 biomarkers may be determined. The gene expression levels of about 20 biomarkers may be determined. The gene expression levels of about 50 biomarkers may be determined. The gene expression levels of about 100 biomarkers may be determined. The gene expression levels of about 150 biomarkers may be determined. The gene expression levels of about 200 biomarkers may be determined. The gene expression levels of about 250 biomarkers may be determined. The subject may be a mammal. The subject may be a human. The subject may be a mouse. The biological sample may be selected from the group consisting of tissues, cells, biopsies, blood, lymph, serum, plasma, urine, saliva, mucus, and tears. The sample may comprise plasma. The RNA gene expression levels may be determined.
The present invention is directed method of identifying and treating a subject suspected of having a methicillin-resistant Staphylococcus aureus (MRSA) infection. The method comprises determining gene expression levels of at least one biomarker in a peripheral blood cell sample of the subject wherein the biomarker is selected from Table 11; comparing the gene expression levels of the biomarker to a standard gene expression level of the biomarker, wherein the standard gene expression level corresponds to the gene expression level of the biomarker in a subject that has a methicillin-sensitive Staphylococcus aureus (MSSA) infection; identifying the subject as having MRSA if the gene expression levels of the biomarkers are different than the standard gene expression levels; and administering an effective amount of an antibiotic therapy to treat the subject identified as having MRSA. The antibiotic therapy may be mupirocine or vancomycin. At least one of the biomarkers may have an increased gene expression level compared to the control. At least one of the biomarkers may have a decreased gene expression level compared to the control. At least one of the biomarkers may have an increased gene expression level compared to the control and at least one of the biomarkers has a decreased gene expression level compared to the control. The gene expression levels of about 10 biomarkers may be determined. The gene expression levels of about 20 biomarkers may be determined. The gene expression levels of about 50 biomarkers may be determined. The gene expression levels of about 100 biomarkers may be determined. The gene expression levels of about 150 biomarkers may be determined. The gene expression levels of about 200 biomarkers may be determined. The gene expression levels of about 250 biomarkers may be determined. The subject may be a mammal. The subject may be a human. The subject may be a mouse. The biological sample may be selected from the group consisting of tissues, cells, biopsies, blood, lymph, serum, plasma, urine, saliva, mucus, and tears. The sample may comprise plasma. The RNA gene expression levels may be determined.
The present invention is also directed to a method for determining the efficacy of an anti-bacterial treatment regime in a subject. The method comprises determining a baseline gene expression level for at least one biomarker selected from Tables 3-17; administering to the subject a therapeutic regimen; and redetermining the gene expression level of the at least one biomarker in the subject. A difference in the gene expression level of the at least one biomarker indicates the efficacy of the therapeutic regimen. At least one of the biomarkers may have an increased gene expression level compared to the control. At least one of the biomarkers may have a decreased gene expression level compared to the control. At least one of the biomarkers may have an increased gene expression level compared to the control and at least one of the biomarkers has a decreased gene expression level compared to the control. The gene expression levels of about 10 biomarkers may be determined. The gene expression levels of about 20 biomarkers may be determined. The gene expression levels of about 50 biomarkers may be determined. The gene expression levels of about 100 biomarkers may be determined. The gene expression levels of about 150 biomarkers may be determined. The gene expression levels of about 200 biomarkers may be determined. The gene expression levels of about 250 biomarkers may be determined. The subject may be a mammal. The subject may be a human. The subject may be a mouse. The biological sample may be selected from the group consisting of tissues, cells, biopsies, blood, lymph, serum, plasma, urine, saliva, mucus, and tears. The sample may comprise plasma. The RNA gene expression levels may be determined.
The present invention is also directed to a composition of matter comprising (a) a probe array for determining a biomarker level in a sample, the array comprising of a plurality of probes that hybridizes to one or more biomarkers selected from Tables 3-17; or (b) a kit for determining a biomarker level in a sample, comprising the probe array of (a) and instructions for carrying out the determination of biomarker expression level in the sample. The composition may further comprise a solid support with the plurality of probes attached thereto.
BRIEF DESCRIPTION OF THE DRAWINGS
FIG. 1 shows a schematic of derivation and validation cohorts.
FIG. 2 shows that murine S. aureus classifier accurately identifies S. aureus infection under a variety of conditions. Conditions represented include different murine hosts (A), bacterial genetic backgrounds (B), and time from inoculation (C). Animals with S. aureus infection are depicted by a red "x". Uninfected control mice are depicted by black circles.
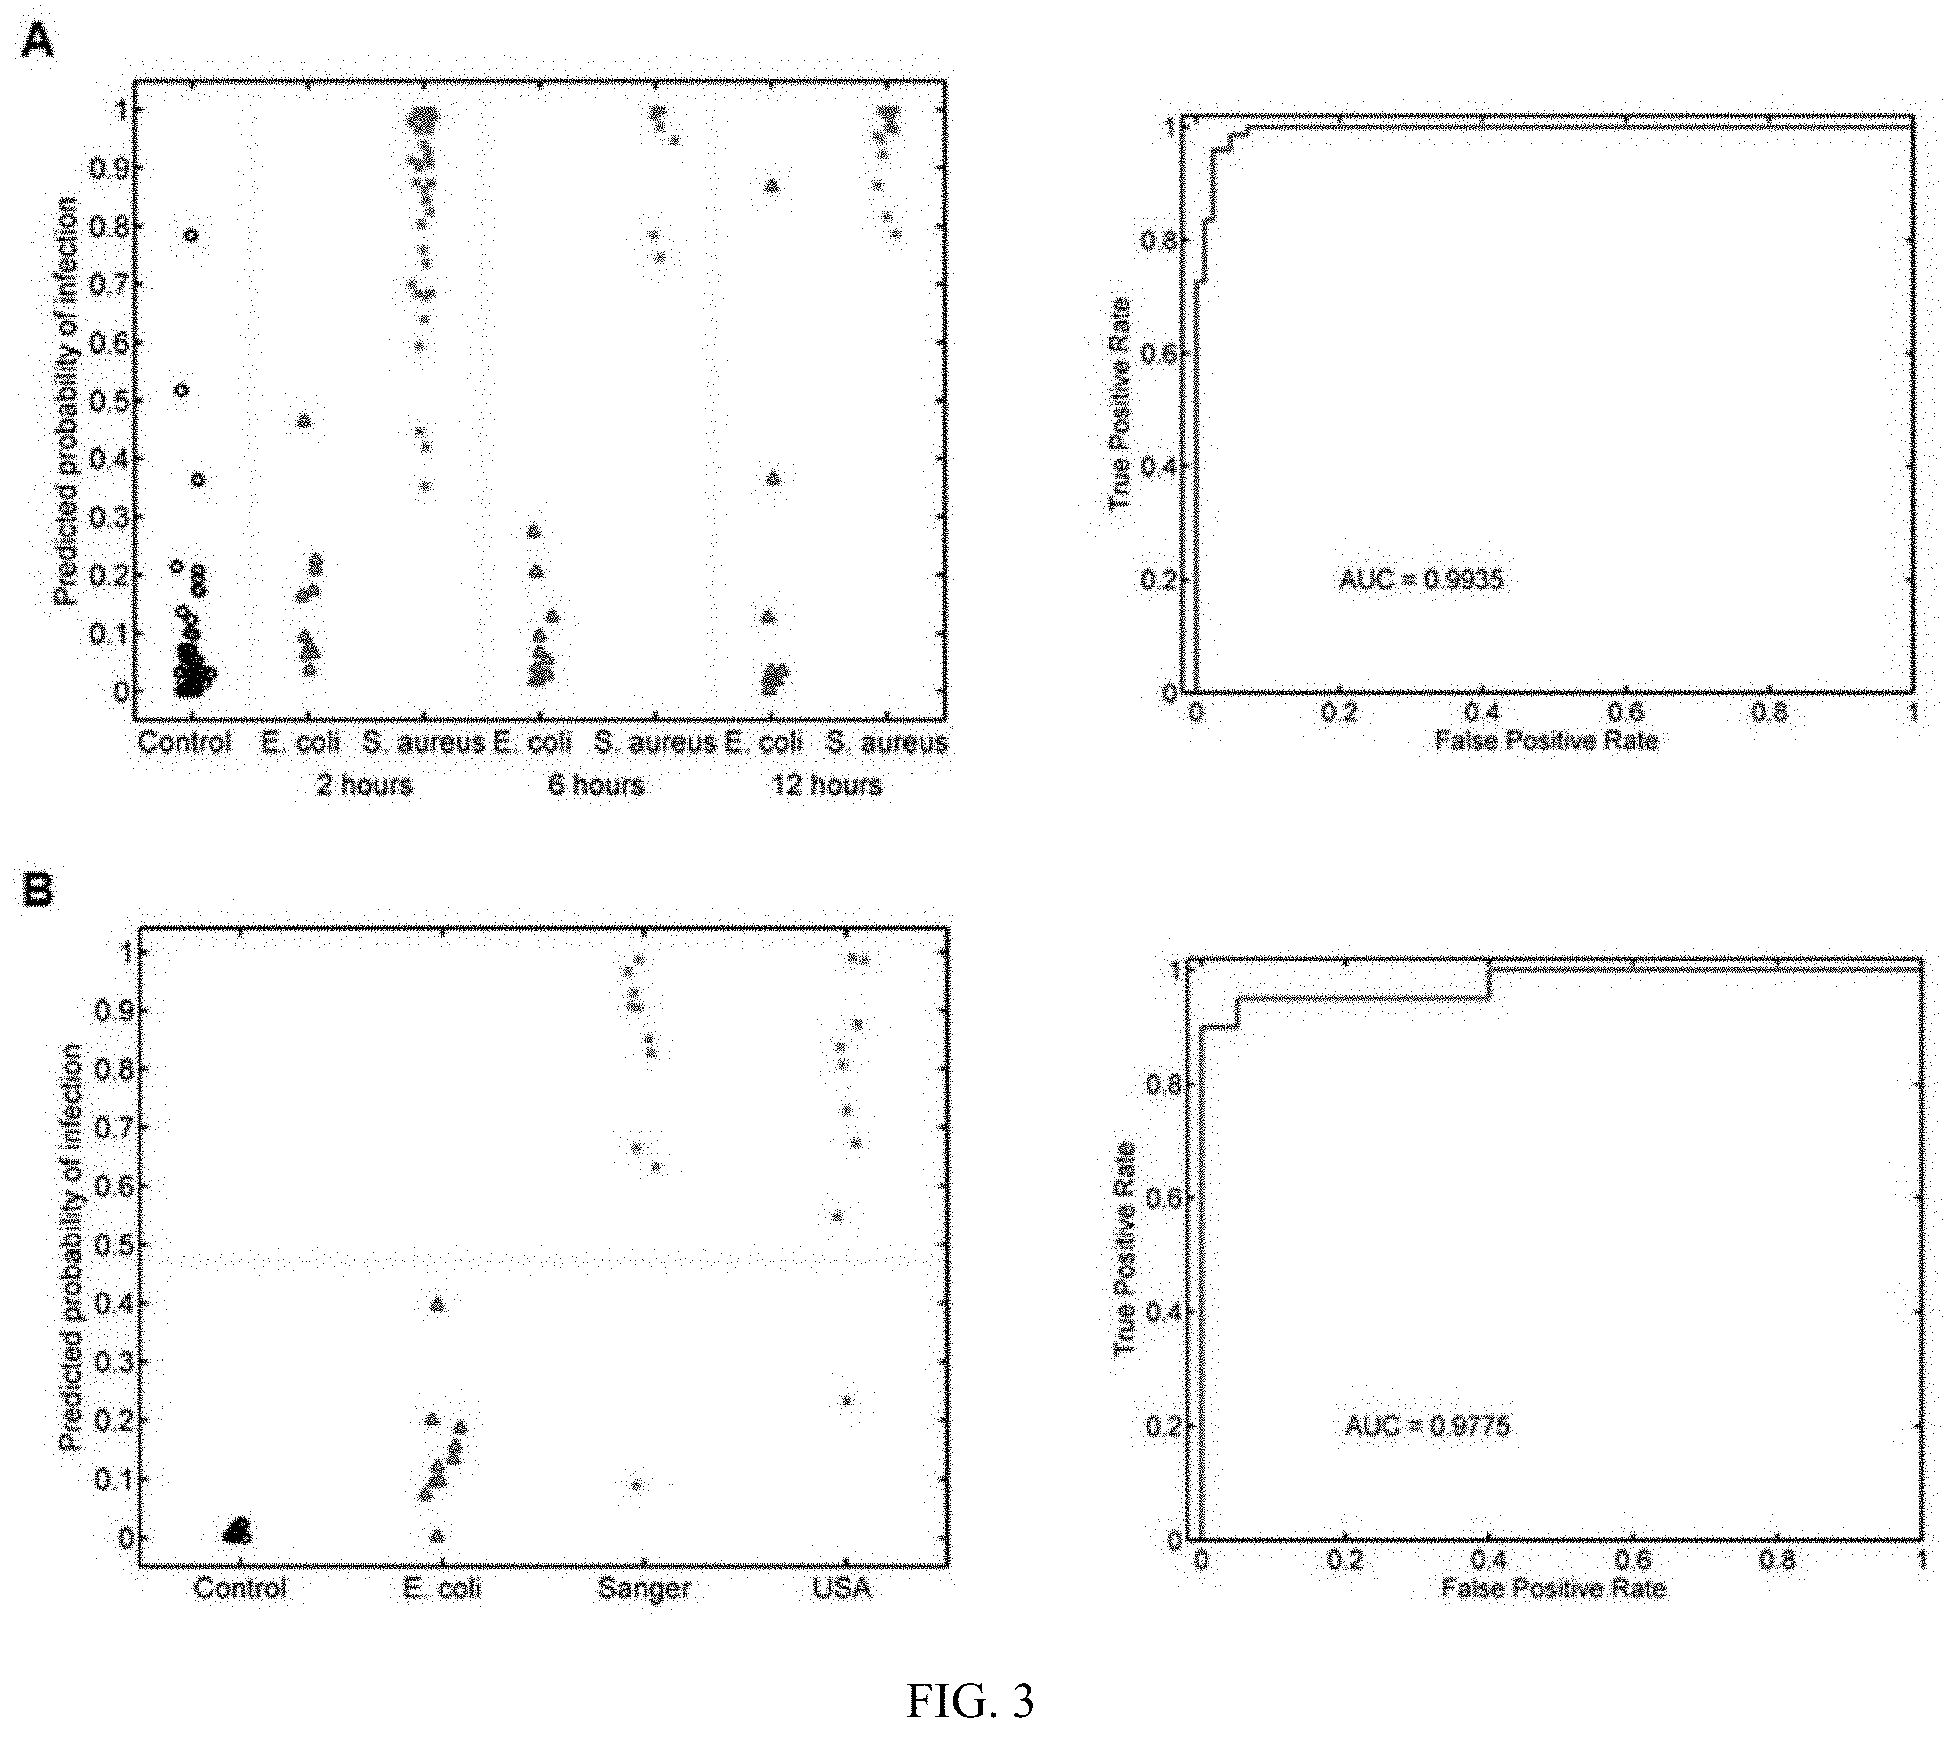
FIG. 3 shows that the murine S. aureus classifier differentiates S. aureus from E. coli infection. (A) Inbred mice were tested under three conditions: uninfected controls (black circles), S. aureus infected (red "x"), and E. coli infected (blue triangles). The y-axis represents the predicted probability that a given animal was infected with S. aureus. (B) The murine S. aureus classifier is validated in outbred CD-1 mice where it differentiates S. aureus infection from E. coli infection and uninfected controls.
FIG. 4 shows the performance of the human S. aureus classifier. (A) The human S. aureus classifier differentiates S. aureus BSI from both uninfected controls and E. coli BSI. (B) A separate classifier was generated using only S. aureus and E. coli-infected human subjects and tested using leave-one-out cross-validation.
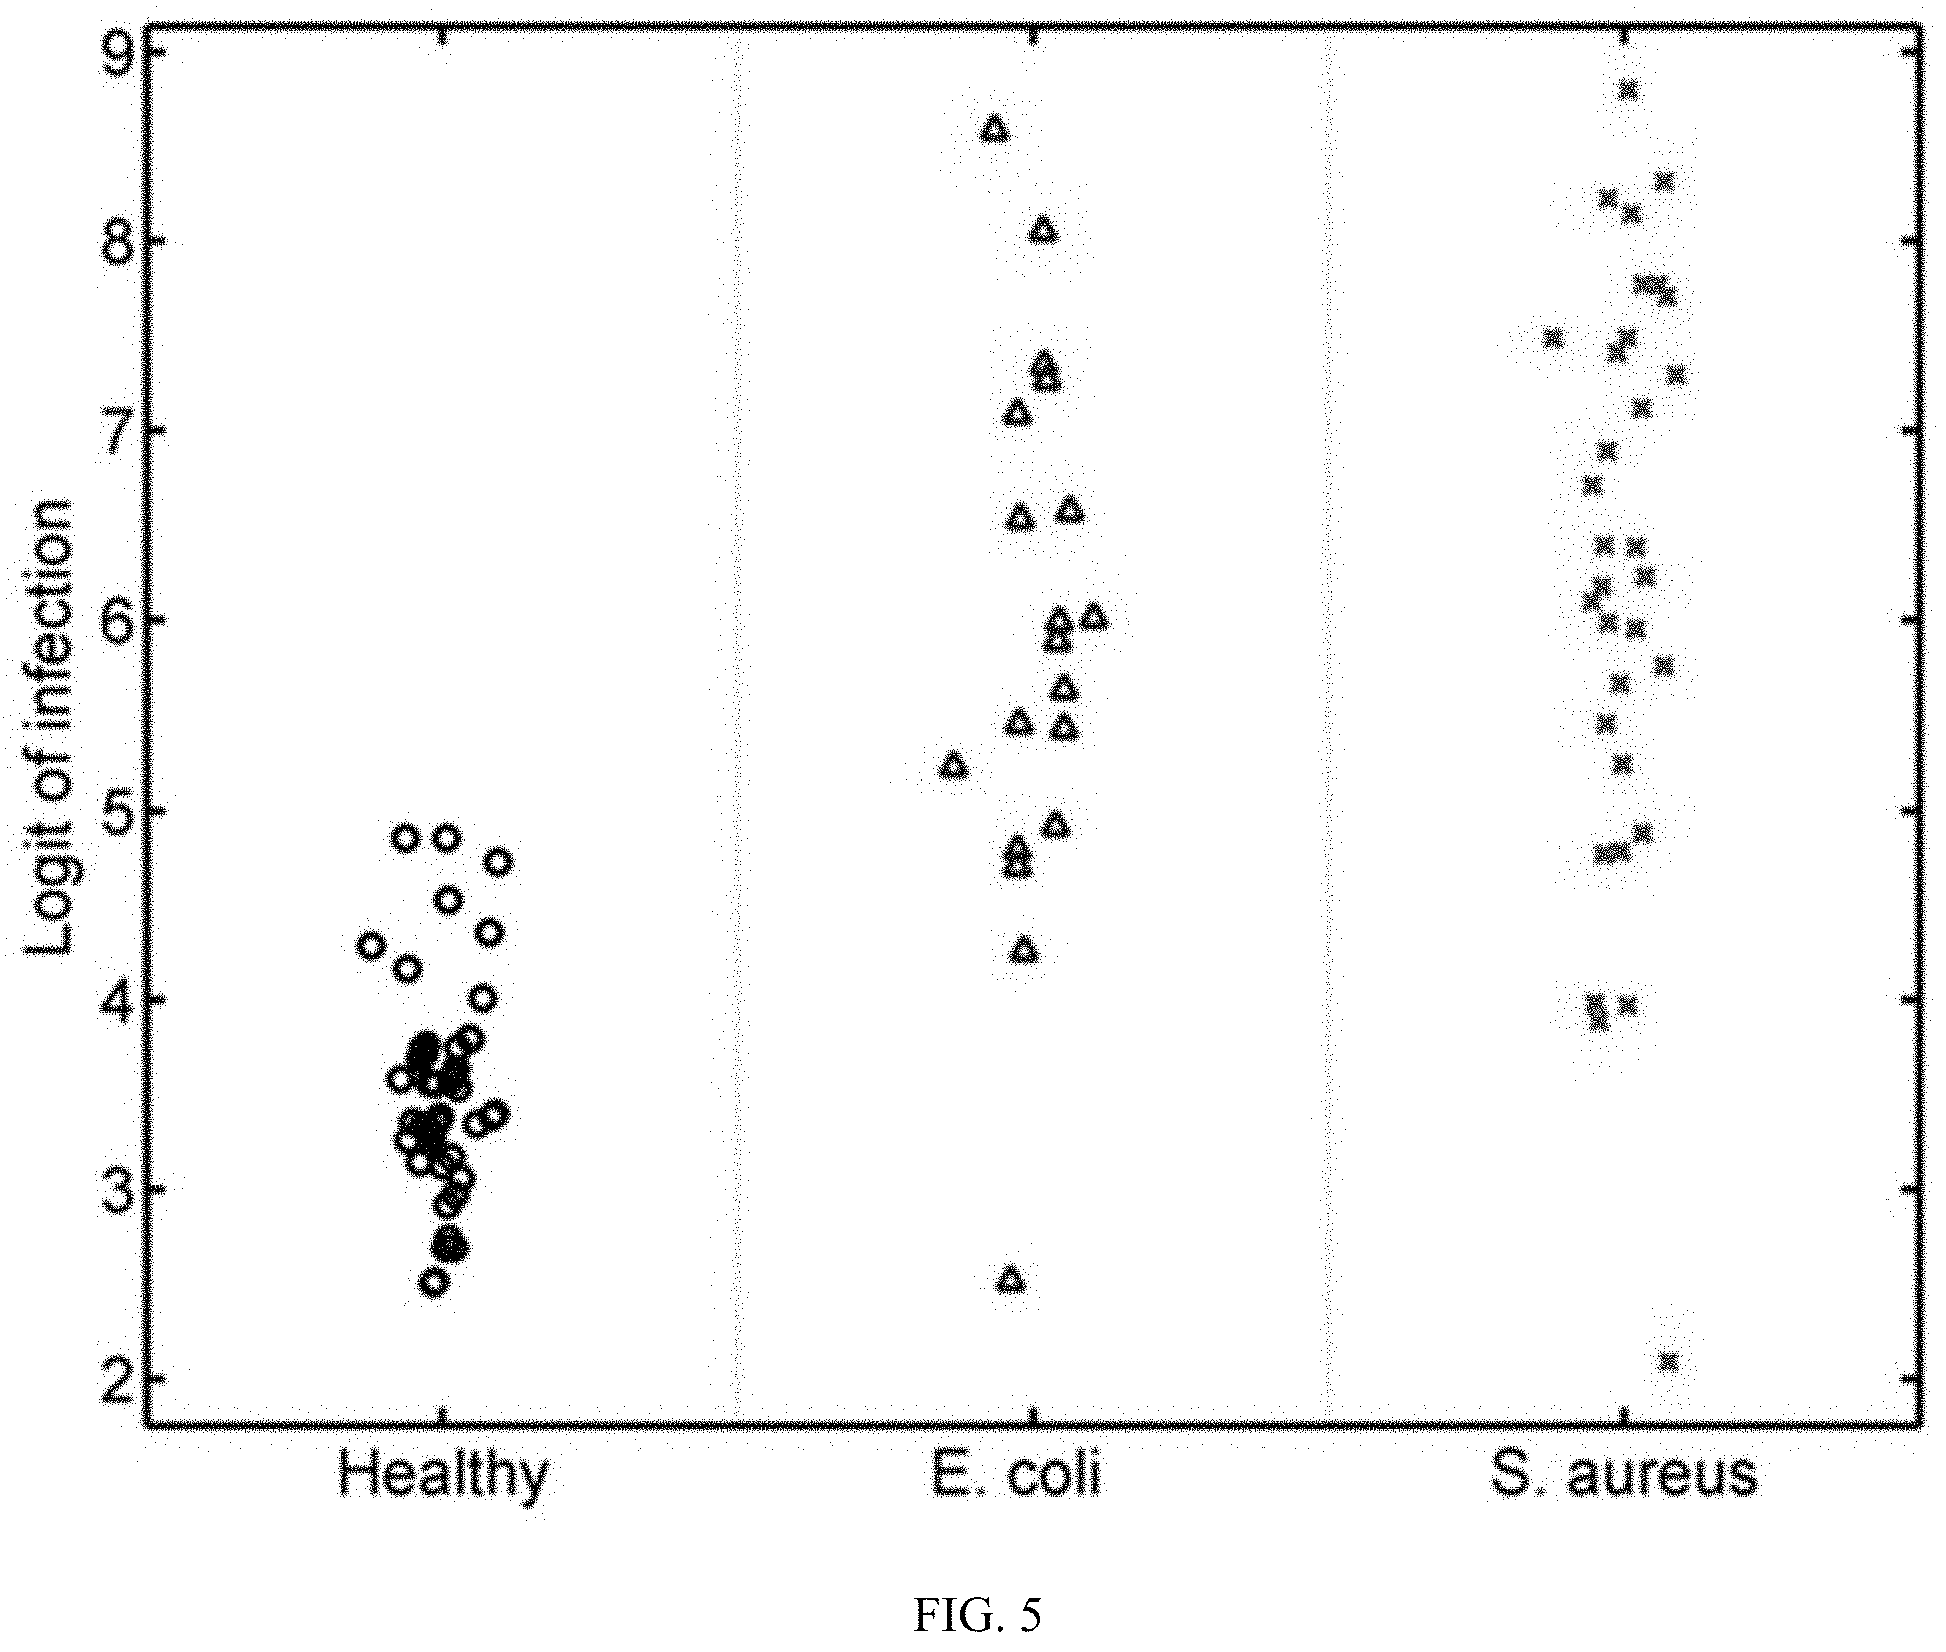
FIG. 5 shows the projection of the mouse S. aureus classifier onto human subjects. The murine S. aureus classifier identifies humans with S. aureus BSI, but does not differentiate S. aureus from E. coli BSI.
FIG. 6 shows validation in an independent human cohort. (A) The murine S. aureus classifier differentiates between S. aureus infection and healthy. (B) The human S. aureus classifier differentiates between S. aureus infection and healthy.
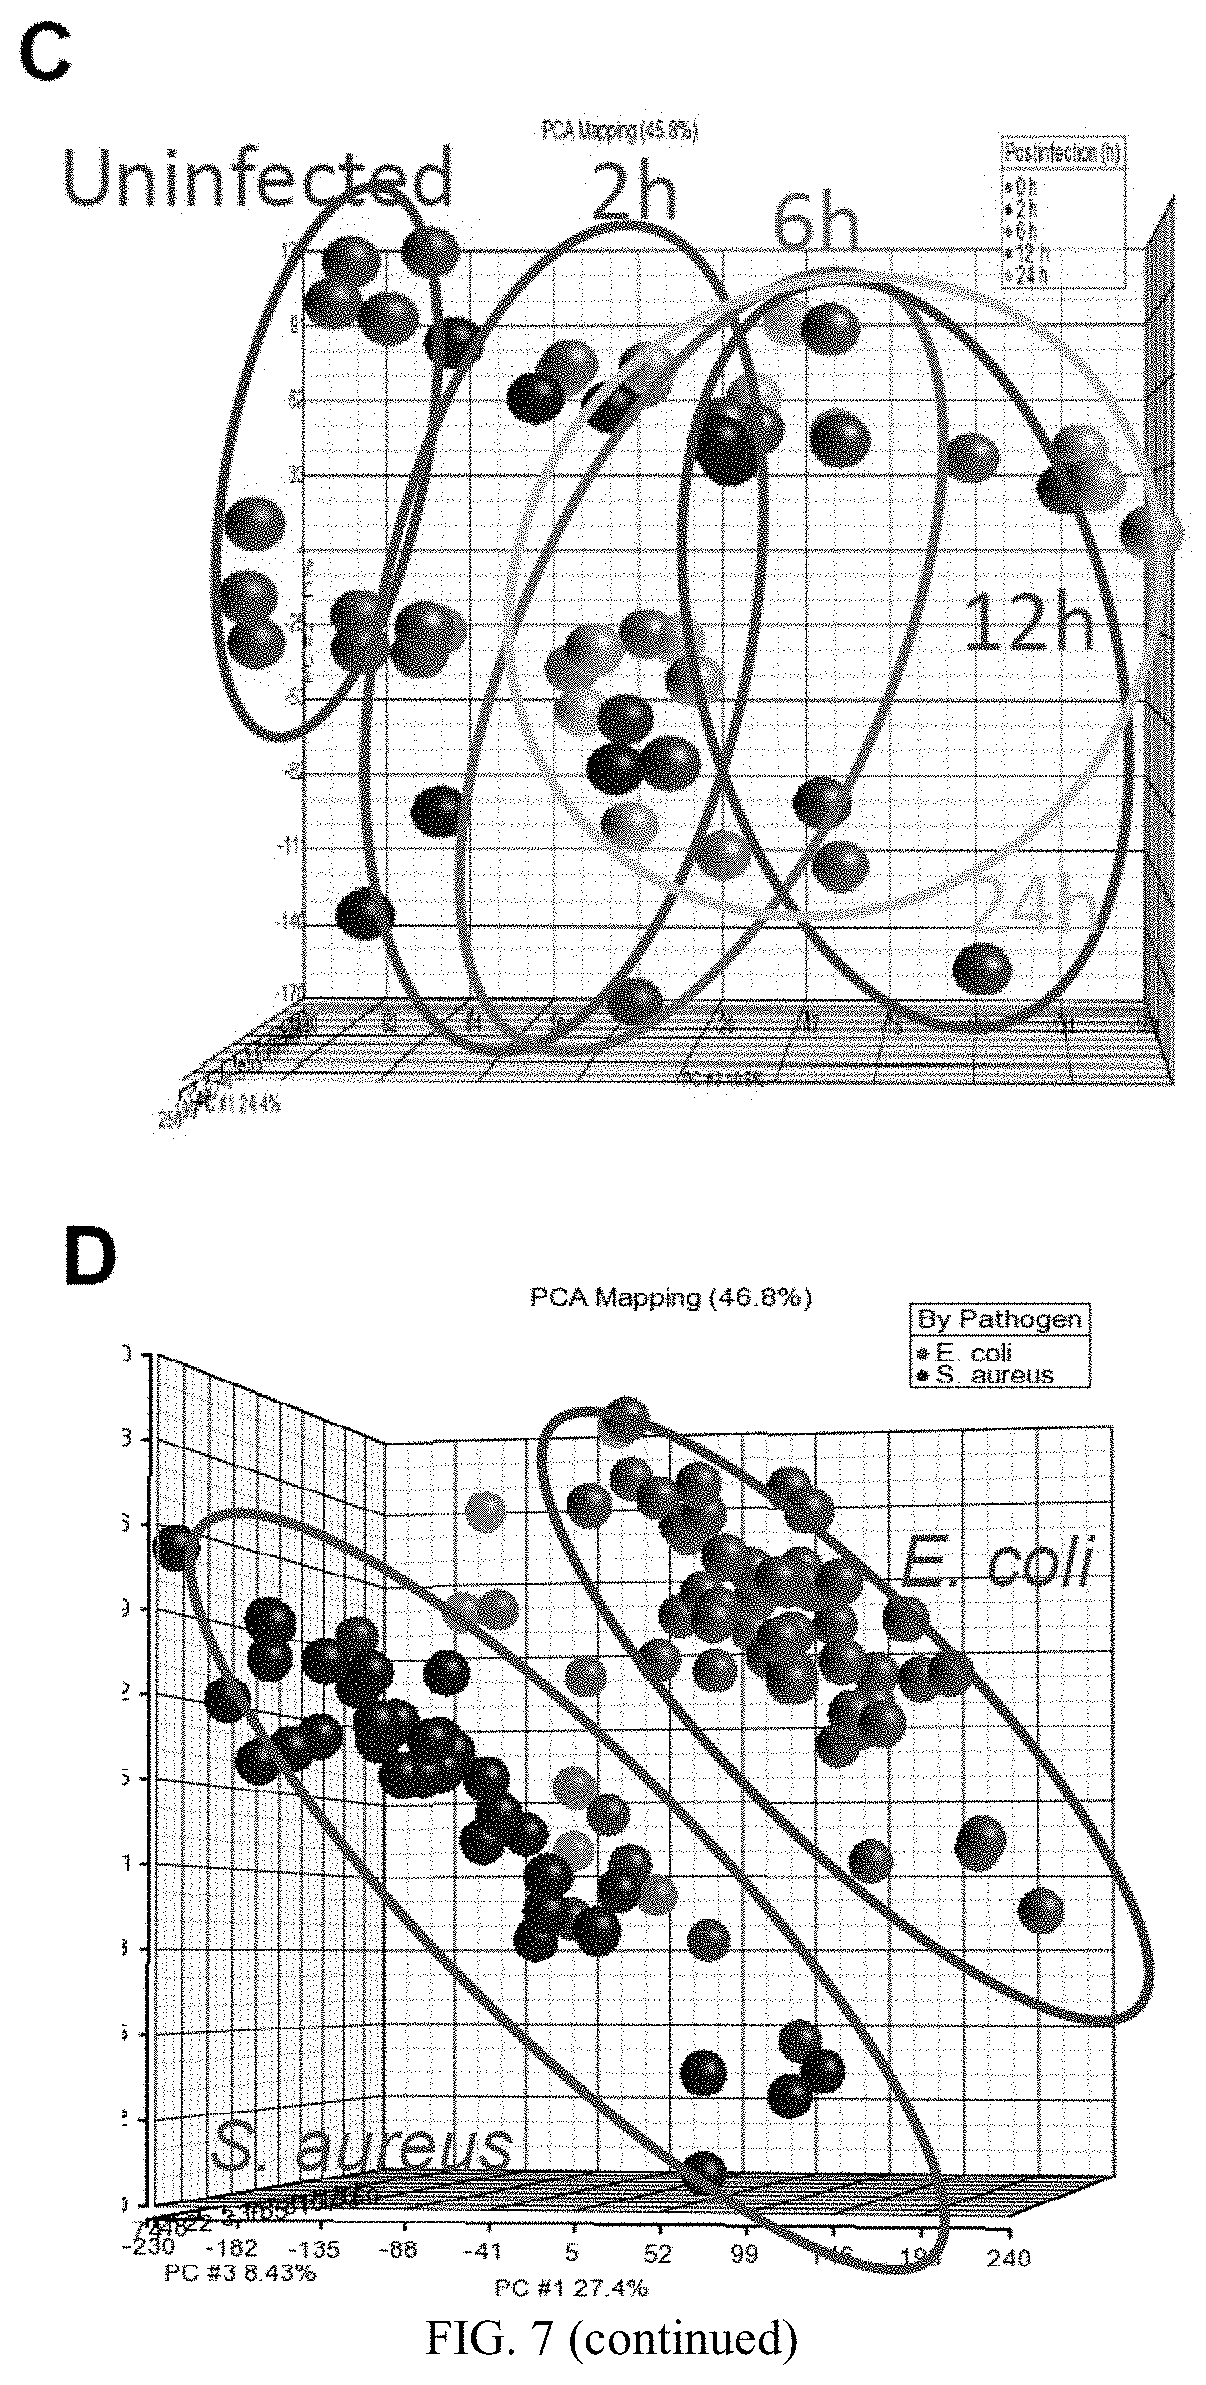
FIG. 7 shows bacterial challenge experiments. (A) Survival curves for A/J and C57BL/6J mice following an intra-peritoneal infection with S. aureus (16107 CFU/g) or E. coli (66104 CFU/g). Principal Components Analysis plots of the samples in the dataset. Samples are colored by infection status and pathogen. (B) S. aureus infection by time after inoculation (n=10 animals/time point). (C) E. coli infection by time after inoculation (n=10 animals/time point). (D) PCA differentiated by pathogen.
FIG. 8 shows heat maps of genes contributing to the murine S. aureus classifier. (A) Genes within the top five factors contributing to the murine S. aureus classifier were identified and ranked by p-value after Bonferroni correction. A subset of genes (393 after removing duplicates) is depicted here, stratified by pathogen. (B) The same genes depicted in part (A) are categorized first pathogen and then by time since infection.
FIG. 9 shows a Venn diagram demonstrating the number of overlapping probes in each murine experimental group pairwise comparison. Probes were included that had significantly different levels of expression after Bonferroni correction.
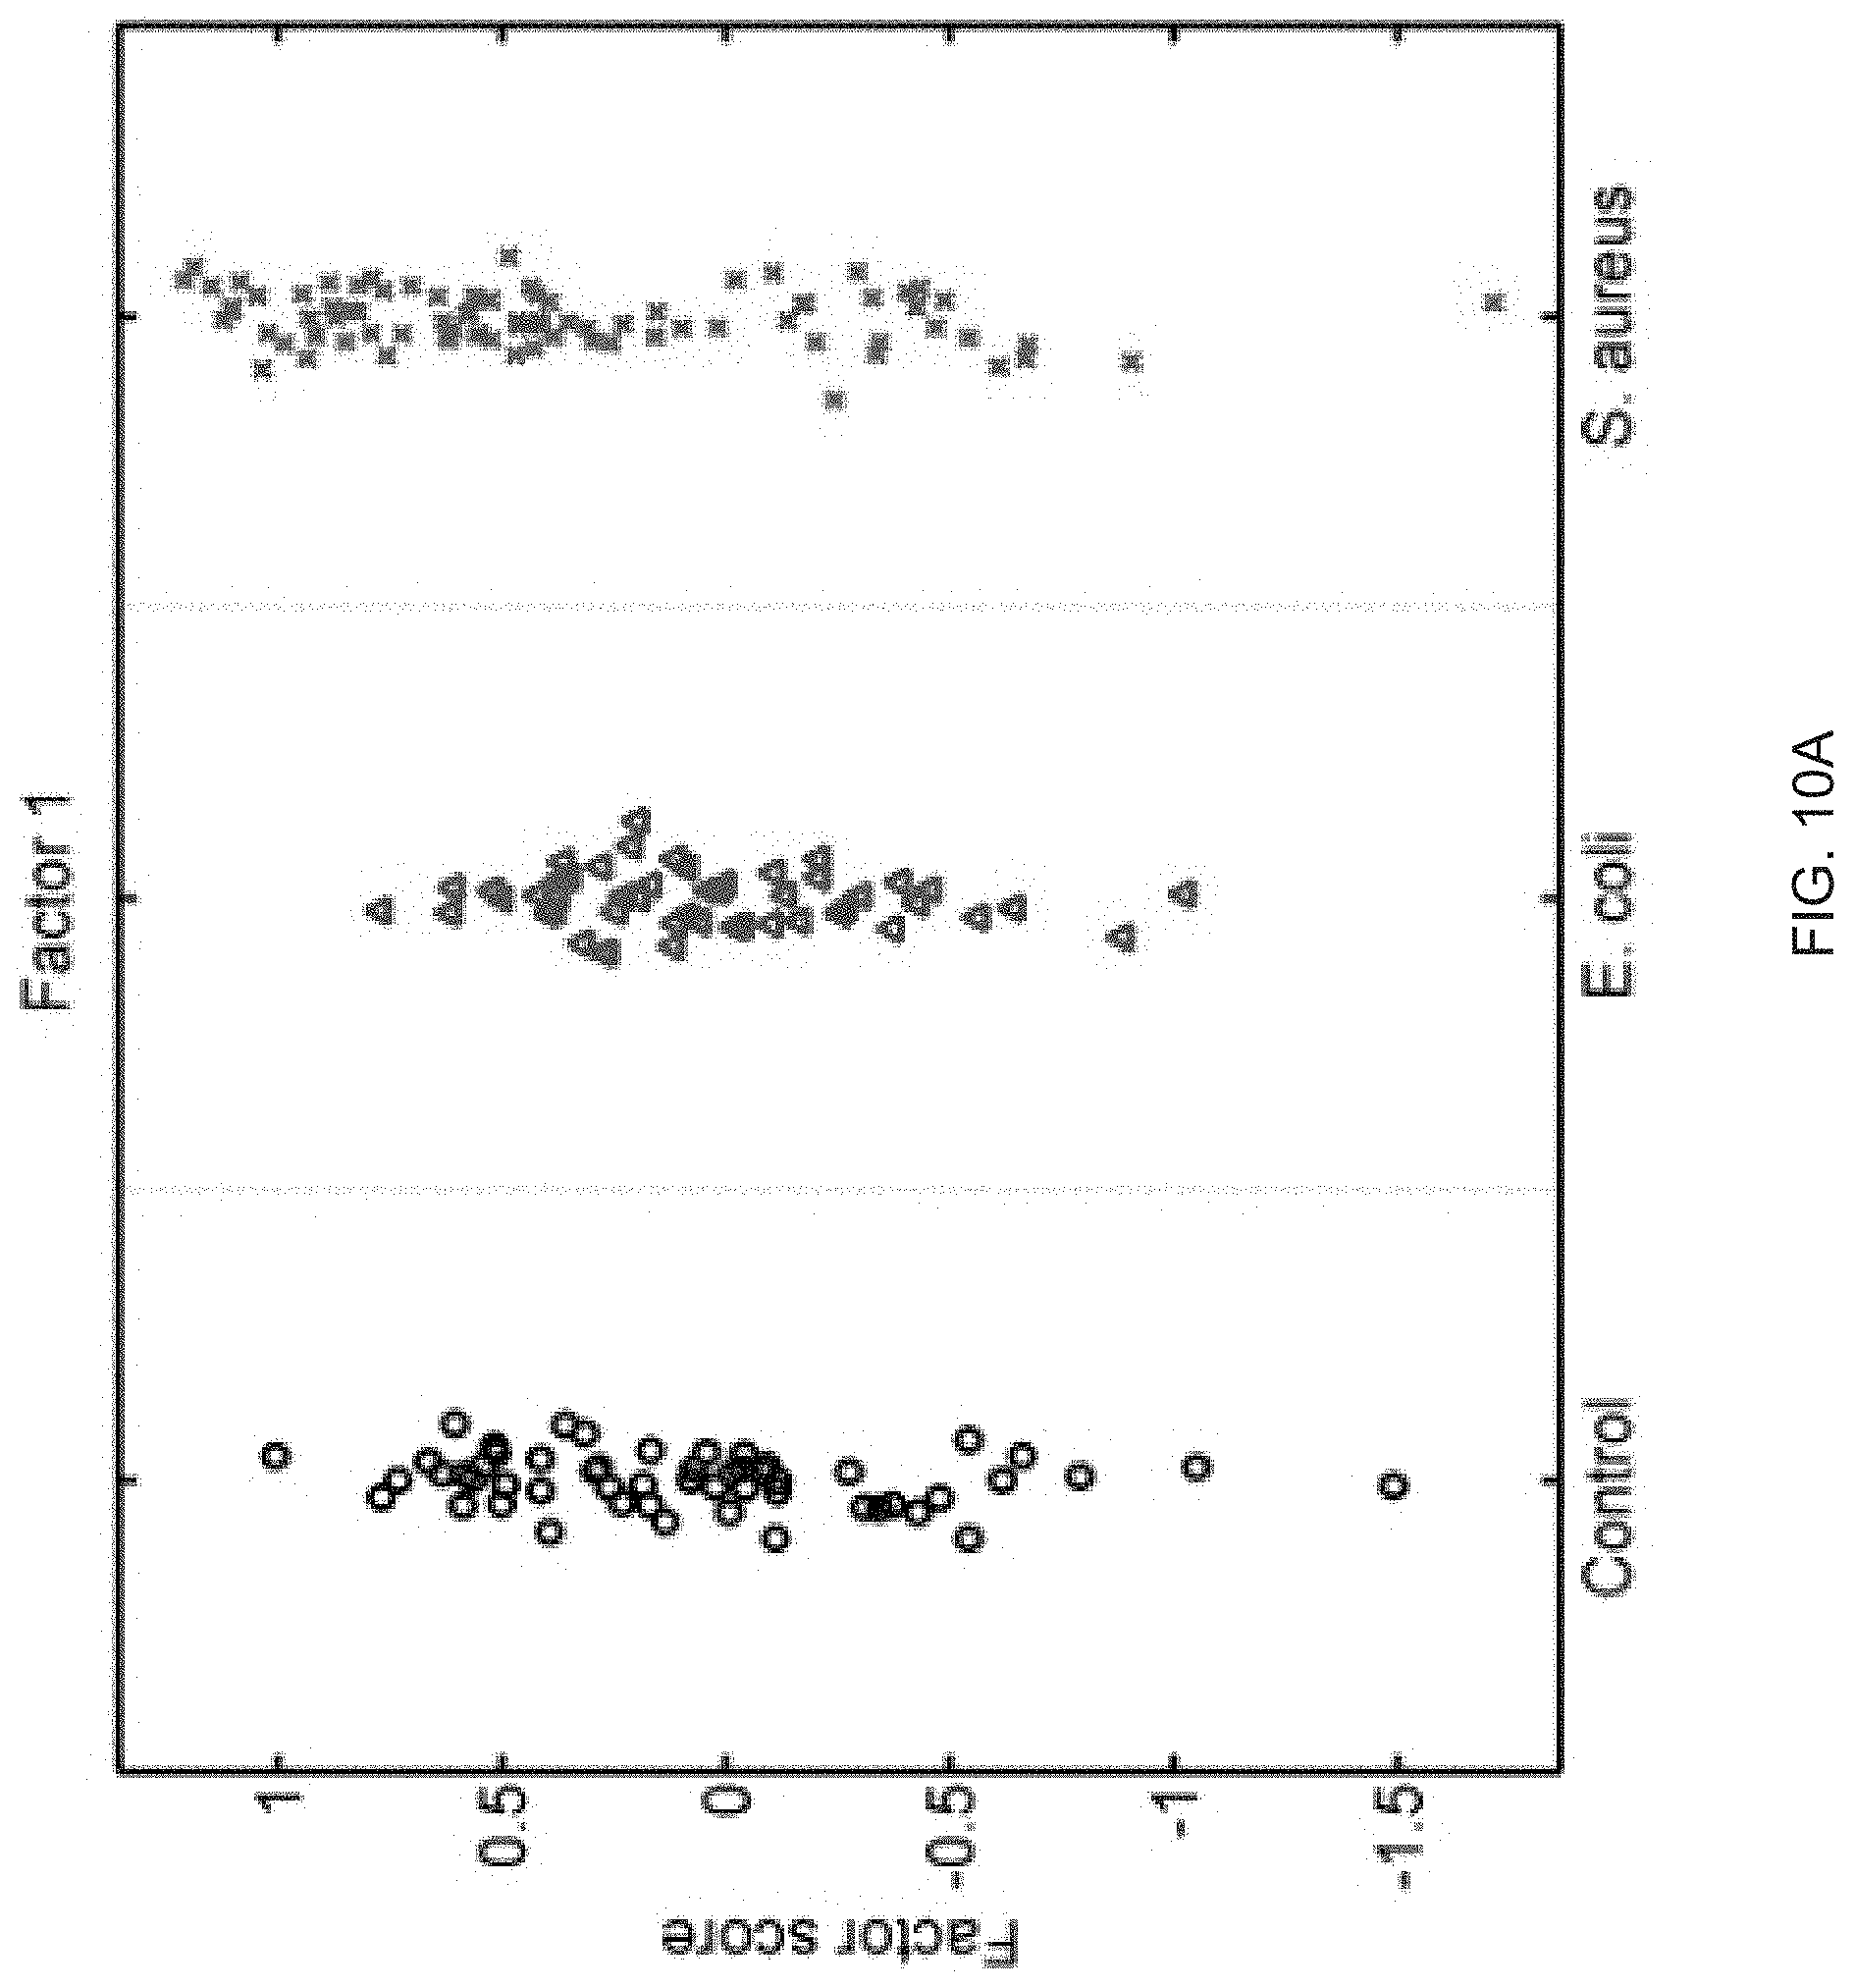
FIGS. 10A-10P show that sixteen murine factors independently associated with S. aureus infection projected onto healthy controls (left panel, black circles), animals with E. coli infection (middle panel, blue triangles), and animals with S. aureus infection (right panel, red "x"). The y-axis represents the factor score.
FIG. 11 shows that a factor-based classifier distinguishes MRSA from MSSA infection in mice. An ROC curve is shown for this classification.
FIG. 12 shows Venn diagram demonstrating the number of overlapping probes in each human experimental group pairwise comparison. Probes were included that had significantly different levels of expression after Bonferroni correction. No probes met this cutoff for the S. aureus vs. E. coli comparison.
FIGS. 13A-13S show seventeen human factors independently associated with S. aureus BSI projected onto healthy controls (left panel, black circles), subjects with E. coli BSI (middle panel, blue triangles), and subjects with S. aureus BSI (right panel, red "x"). The y-axis represents the factor score.
FIG. 14 shows heat map of genes contributing to the human S. aureus classifier. Genes within the top two factors contributing to the human S. aureus classifier were identified and ranked by p-value after Bonferroni correction. A subset of genes (86 after removing duplicates) is depicted here, stratified by pathogen.
DETAILED DESCRIPTION
The present disclosure provides biomarkers useful for identifying and/or classifying a bacterial infection a subject. S. aureus and Escherichia coli were used as prototypical Gram-positive and Gram-negative bacteria due to their prevalence and clinical relevance. Host gene expression was measured in mice with bacterial infection across multiple conditions. From these data, a molecular classifier was derived for S. aureus infection in inbred mice and validated in a cohort of outbred mice. Host gene expression data from a well-characterized cohort of septic human subjects was used to identify a molecular classifier that accurately distinguished S. aureus BSI from E. coli BSI or uninfected controls. Murine and human S. aureus classifiers exhibited significant similarity particularly in comparing S. aureus infection to the healthy state. Furthermore, both murine and human classifiers were validated in an independent human cohort. The present disclosure demonstrates that the in vivo host response to Gram-positive infections is conserved from mouse to human and can be harnessed as a novel diagnostic strategy in patients with bacterial sepsis.
This study takes significant steps forward on multiple levels in the ongoing effort to understand this pathogen; the host response to it; and identify new diagnostic and therapeutic avenues. A diagnostic modality capable of differentiating infection from health across species is described. Host gene expression classifiers can differentiate infection due to S. aureus from that of E. coli but this effect is less pronounced in the complex human host. The approach described here also affords great insight into the conserved and disparate pathways utilized by mice and humans in response to these infections. Evidence to support the paradigm shift in how diagnostics are thought about is provided as well as new areas for research into the pathways that subserve sepsis pathophysiology have been identified.
For the purposes of promoting an understanding of the principles of the present disclosure, reference will now be made to preferred embodiments and specific language will be used to describe the same. It will nevertheless be understood that no limitation of the scope of the disclosure is thereby intended, such alteration and further modifications of the disclosure as illustrated herein, being contemplated as would normally occur to one skilled in the art to which the disclosure relates.
Articles "a" and "an" are used herein to refer to one or to more than one (i.e. at least one) of the grammatical object of the article. By way of example, "an element" means at least one element and can include more than one element.
Unless otherwise defined, all technical terms used herein have the same meaning as commonly understood by one of ordinary skill in the art to which this disclosure belongs.
1. Definitions
The terms "comprise(s)," "include(s)," "having," "has," "can," "contain(s)," and variants thereof, as used herein, are intended to be open-ended transitional phrases, terms, or words that do not preclude the possibility of additional acts or structures. The singular forms "a," "and" and "the" include plural references unless the context clearly dictates otherwise. The present disclosure also contemplates other embodiments "comprising," "consisting of" and "consisting essentially of," the embodiments or elements presented herein, whether explicitly set forth or not.
For the recitation of numeric ranges herein, each intervening number there between with the same degree of precision is explicitly contemplated. For example, for the range of 6-9, the numbers 7 and 8 are contemplated in addition to 6 and 9, and for the range 6.0-7.0, the number 6.0, 6.1, 6.2, 6.3, 6.4, 6.5, 6.6, 6.7, 6.8, 6.9, and 7.0 are explicitly contemplated.
Unless otherwise defined, all technical and scientific terms used herein have the same meaning as commonly understood by one of ordinary skill in the art. In case of conflict, the present document, including definitions, will control. Preferred methods and materials are described below, although methods and materials similar or equivalent to those described herein can be used in practice or testing of the present invention. All publications, patent applications, patents and other references mentioned herein are incorporated by reference in their entirety. The materials, methods, and examples disclosed herein are illustrative only and not intended to be limiting.
"About" is used to provide flexibility to a numerical range endpoint by providing that a given value may be "slightly above" or "slightly below" the endpoint without affecting the desired result.
The term "antibiotic" as used herein refers to an agent that either kills or inhibits the growth of a microorganism. Antibiotics may include beta-lactam antibiotics, such as penicillin, which are produced by fungi in the genus Penicillium, cephalosporins, carbapenems, aminoglycosides, sulfonamides, quinolones, oxazolidinones, fluoroquinolone, marcolide, ketolide, rifampin, chloramphenicol, glycopeptide, and trimethoprim. The antibiotics may be ciproflaxacin, levofloxacin, gatifloxacin, moxifloxacin, ofloxacin, norflaxacin, erythromycin, azithromycin, clarithromycin, telithromycin, rifamipin, tetracycline, minocycline, chloramphenicol, gentamicin, linezolid, penicillin, amoxicillin, ceftriaxone, imipenem, vancomycin, teicoplainin, sulfamethoxazole, isoniazid, ethambutol, para-aminosalicylic acid, mupicorin, or cycloserine.
The "area under curve" or "AUC" refers to area under a ROC curve. AUC under a ROC curve is a measure of accuracy. An area of 1 represents a perfect test, whereas an area of 0.5 represents an insignificant test. A preferred AUC may be at least approximately 0.700, at least approximately 0.750, at least approximately 0.800, at least approximately 0.850, at least approximately 0.900, at least approximately 0.910, at least approximately 0.920, at least approximately 0.930, at least approximately 0.940, at least approximately 0.950, at least approximately 0.960, at least approximately 0.970, at least approximately 0.980, at least approximately 0.990, or at least approximately 0.995.
As used herein, the term "biomarker" refers to a naturally occurring biological molecule present in a subject at varying concentrations useful in identifying and/or classifying a disease or a condition, such as a bacterial infection. For example, the biomarker can be a gene that is upregulated or downregulated in a subject that has a disease, such as a bacterial infection. The biomarker can include genes, proteins, nucleic acids, ribonucleic acids, or a polypeptide used as an indicator or marker for bacterial infection. In some embodiments, the biomarker is a gene. In one embodiment where the bacterial infection comprises S. aureus, the biomarker is selected from the group consisting of the biomarkers provided in Tables 3-17, and combinations thereof. In another embodiment where the bacterial infection comprises E. coli, the biomarker is selected from the group consisting of the biomarkers provided in Tables 3-17, and combinations thereof.
As used herein, the term "bacterial infection" refers to those disease states characterized by the presence of a pathogenic bacteria. Such bacteria may be gram-positive or gram-negative. Examples of gram-positive bacteria include, but are not limited to, S. aureus. Examples of gram-negative bacteria include, but are not limited to, E. coli. A bacterial infection may be sepsis.
As used herein, the term "factor" refers to a group of co-expressed genes. A factor becomes a term in binary regression model to distinguish or predict subjects with and without infection, or distinguish the type of infection
"Sample," "test sample," "specimen," "sample from a subject," and "patient sample" as used herein may be used interchangeable and may be a sample of blood, tissue, urine, serum, plasma, amniotic fluid, cerebrospinal fluid, placental cells or tissue, endothelial cells, leukocytes, or monocytes. The sample can be used directly as obtained from a patient or can be pre-treated, such as by filtration, distillation, extraction, concentration, centrifugation, inactivation of interfering components, addition of reagents, and the like, to modify the character of the sample in some manner as discussed herein or otherwise as is known in the art.
As used herein, the term "subject" and "patient" are used interchangeably herein and refer to both human and nonhuman animals. The term "nonhuman animals" of the disclosure includes all vertebrates, e.g., mammals and non-mammals, such as nonhuman primates, sheep, dog, cat, horse, cow, chickens, amphibians, reptiles, and the like. Preferably, the subject is a human patient that has a bacterial infection.
The term "biological sample" as used herein includes, but is not limited to, a sample containing tissues, cells, and/or biological fluids isolated from a subject. Examples of biological samples include, but are not limited to, tissues, cells, biopsies, blood, lymph, serum, plasma, urine, saliva, mucus and tears. In one embodiment, the biological sample is a blood sample (such as a plasma sample). A biological sample may be obtained directly from a subject (e.g., by blood or tissue sampling) or from a third party (e.g., received from an intermediary, such as a healthcare provider or lab technician).
Any cell type, tissue, or bodily fluid may be utilized to obtain a sample. Such cell types, tissues, and fluid may include sections of tissues such as biopsy and autopsy samples, frozen sections taken for histologic purposes, blood (such as whole blood), plasma, serum, sputum, stool, tears, mucus, saliva, bronchoalveolar lavage (BAL) fluid, hair, skin, red blood cells, platelets, interstitial fluid, ocular lens fluid, cerebral spinal fluid, sweat, nasal fluid, synovial fluid, menses, amniotic fluid, semen, etc. Cell types and tissues may also include lymph fluid, ascetic fluid, gynecological fluid, urine, peritoneal fluid, cerebrospinal fluid, a fluid collected by vaginal rinsing, or a fluid collected by vaginal flushing. A tissue or cell type may be provided by removing a sample of cells from an animal, but can also be accomplished by using previously isolated cells (e.g., isolated by another person, at another time, and/or for another purpose). Archival tissues, such as those having treatment or outcome history, may also be used. Protein or nucleotide isolation and/or purification may not be necessary.
"Sepsis" as used herein is a condition characterized by a whole-body inflammatory state that is triggered by either a proven (on the basis of sampling or radiology) or probable (considering the patient's clinical presentation, white cell count, CRP, radiology) infection. The infection may be caused by bacteria, virus or fungi. Triggers of sepsis include pneumonia, such as ventilator-associated pneumonia, abdominal infection, kidney infection, and bloodstream infection. The body may develop this inflammatory response by the immune system to microbes in the blood, urine, lungs, skin, or other tissues. A lay term for sepsis is blood poisoning, also used to describe septicaemia. Septicaemia is a related medical term referring to the presence of pathogenic organisms in the bloodstream, leading to sepsis.
Symptoms related to the provoking infection, sepsis is characterized by presence of acute inflammation present throughout the entire body, and is, therefore, frequently associated with fever and elevated white blood cell count (leukocytosis) or low white blood cell count (leukopenia) and lower-than-average temperature, and vomiting. The modern concept of sepsis is that the host's immune response to the infection causes most of the symptoms of sepsis, resulting in hemodynamic consequences and damage to organs. This immunological response causes widespread activation of acute-phase proteins, affecting the complement system and the coagulation pathways, which then cause damage to the vasculature as well as to the organs. Various neuroendocrine counter-regulatory systems are then activated as well, often compounding the problem. Even with immediate and aggressive treatment, this may progress to multiple organ dysfunction syndrome and eventually death.
"Subject" and "patient" as used herein interchangeably refers to any vertebrate, including, but not limited to, a mammal (e.g., cow, pig, camel, llama, horse, goat, rabbit, sheep, hamsters, guinea pig, cat, dog, rat, and mouse, a non-human primate (for example, a monkey, such as a cynomolgous or rhesus monkey, chimpanzee, etc.) and a human). In some embodiments, the subject may be a human or a non-human. The subject or patient may be undergoing other forms of treatment.
As used herein, "treatment," "therapy" and/or "therapy regimen" refer to the clinical intervention made in response to a disease, disorder or physiological condition manifested by a patient or to which a patient may be susceptible. The aim of treatment includes the alleviation or prevention of symptoms, slowing or stopping the progression or worsening of a disease, disorder, or condition and/or the remission of the disease, disorder or condition. In certain embodiments, the treatment comprises anti-bacterial therapy, such as the administration of antibiotics.
The term "effective amount" or "therapeutically effective amount" refers to an amount sufficient to effect beneficial or desirable biological and/or clinical results.
2. Factors and Biomarkers for Bacterial Infection
One aspect of the present disclosure provides biomarkers useful for the identification and/or classification of a bacterial infection. In one embodiment, the present disclosure provides biomarkers that are differentially expressed, such as upregulated, down-regulated, or disregulated in a bacterial infection, as compared to normal populations who do not have the condition, such a bacterial infection.
In some embodiments, the bacterial infection comprises a gram-positive bacteria, such as S. aureus. In those embodiments where the bacterial infection comprises S. aureus, the biomarker is selected from the group consisting of the biomarkers provided in Tables 3-17, and combinations thereof. In other embodiments, the bacterial infection comprises a gram-negative bacteria, such as E. coli. In those embodiments where the bacterial infection comprises E. coli, the biomarker is selected from the group consisting of the biomarkers provided in Tables 3-17, and combinations thereof.
In some embodiments, the biomarkers are selected from one or more biomarkers that are up-regulated, down-regulated or over-expressed in a subject suffering from a bacterial infection.
In some specific embodiments, the biomarkers are selected from one or more biomarkers up-regulated, down-regulated or over-expressed more than 50-fold, 40-fold, 30-fold, 20-fold, 15-fold, 10-fold, 9-fold, 8-fold, 7-fold, 6-fold, 5-fold, 4-fold, 3-fold, 2-fold, or 1-fold in a subject suffering from a bacterial infection, when compared to a control. In some embodiments, the biomarker comprises one or more biomarkers found in Tables 3-17, wherein the up-regulation, down-regulating or over-expression of one or more of the biomarker in the subject's biological sample, when compared to a control, indicates that the subject is suffering from a bacterial infection comprising S. aureus. In other embodiments, the biomarker comprises one or more biomarkers found in Tables 3-17, wherein the up-regulation, down-regulation, or over-expression of one or more of the biomarkers indicates the subject is suffering from a bacterial infection comprising E. coli.
In some embodiments, at least about one of the differentially expressed biomarkers may have an increased expression level compared to the control. In some embodiments, at least about one of the differentially expressed biomarkers may have a decreased expression level compared to the control. In some embodiments, at least about one of the differentially expressed biomarkers may have an increased expression level compared to the control and at least about one of the differentially expressed biomarkers may have a decreased expression level compared to the control.
3. Methods Using Biomarkers of the Present Disclosure
The present disclosure describes how different hosts respond differently to S. aureus than to E. coli infection in a quantifiable way, providing a new diagnostic avenue. Bayesian sparse factor modeling and penalized binary regression were used to define peripheral blood gene-expression classifiers of murine and human S. aureus infection. The murine-derived classifier distinguished S. aureus infection from healthy controls and Escherichia coli-infected mice across a range of conditions (mouse and bacterial strain, time post infection) and was validated in outbred mice (AUC>0.97). A S. aureus classifier derived from a cohort of 94 human subjects distinguished S. aureus blood stream infection (BSI) from healthy subjects (AUC 0.99) and E. coli BSI (AUC 0.84). Murine and human responses to S. aureus infection share common biological pathways, allowing the murine model to classify S. aureus BSI in humans (AUC 0.84). Both murine and human S. aureus classifiers were validated in an independent human cohort (AUC 0.95 and 0.92, respectively). The approach described here lends insight into the conserved and disparate pathways utilized by mice and humans in response to these infections. Furthermore, this study advances the understanding of S. aureus infection; the host response to it; and identifies new diagnostic and therapeutic avenues.
A series of genes or biomarkers may be selected from Tables 3-17 and optimized for diagnosis. The number of genes may be at least 1 gene, at least 5 genes, at least 10 genes, at least 25 genes, at least 30 genes, at least 35 genes, at least 40 genes, at least 45 genes, at least 50 genes, at least 55 genes, at least 60 genes, at least 65 genes, at least 70 genes, at least 75 genes, at least 80 genes, at least 85 genes, at least 90 genes, at least 95 genes, at least 100 genes, at least 125 genes, at least 150 genes, at least 175 genes, at least 200 gene, or at least 250 genes selected from Tables 3-17. RNA probes may be developed for the selected genes. A patient sample may be obtained and examined. For example, RNA may be examined after extraction from the sample or directed from the sample without extraction. The RNA may be measured by PCR or another RNA detection platform. The RNA expression may be measure and compared to control level for these selected genes. An algorithm may be used to produce a probability or score. Cut-off values or scores may be established and used to make a definitive diagnosis. For example, if the patient's gene expression levels are above the cut-off value or score, the patient is diagnosed as having infection. After the diagnosis is made, the subject may be treated for the infection.
In one embodiment, the present disclosure provides a method for identifying and/or classifying a bacterial infection in a subject comprising, consisting of, or consisting essentially of:
(a) determining a biomarker expression profile (expression level) in a biological sample from the subject;
(b) characterizing the subject's biomarker profile; and
(c) comparing the subject's biomarker profile with the biomarker profile of a control from subjects not suffering from a bacterial infection (e.g., a healthy subject); and
(d) administering an appropriate ant-bacterial therapy if one or more of the biomarkers are upregulated, down-regulated or overexpressed.
In one embodiment, the method further includes obtaining the biological sample from the subject. In one embodiment, the identification and/or classification of a condition such as a bacterial infection can be determined by comparing the subjects biomarker profile to a reference biomarker profile, such as one that corresponds to biological samples obtained from a normal population (e.g., healthy population) that do not have a condition such as a bacterial infection, or that corresponds to biological samples obtained from a population that have a condition such as a bacterial infection. Optionally, the reference profile comprises multiple biomarker expression profiles, with each corresponding to a type of a condition such as a bacterial infection with a gram-negative or gram-positive bacteria.
In some embodiments, the present disclosure provides methods for identifying and/or classifying a condition such as bacterial infection by characterizing a biomarker found in Tables 3-17.
4. Methods of Developing a Diagnostic Assay
The present invention is directed to a method of developing a diagnostic assay for identifying and/or classifying a bacterial infection in a subject. The method comprising determining the gene expression levels of at least about two biomarkers in a subject infected with bacterial infection, wherein the biomarkers are selected from one or more of the top 200 genes of mouse factors 7, 15, 23, and 26, human factors 4, 20, 40, and 74, as shown in Tables 3-10; genes discriminating infection due to MRSA or MSSA, as shown in Table 11, a gene from the 50 most significant biological pathways arising from the pairwise comparisons, as shown in Tables 12-16, or one of the genes in common between mice and humans, as shown in Table 17. The method comprises comparing the gene expression levels of the biomarkers in the subject with the gene expression levels of the biomarkers in a control; identifying factors, wherein each factor comprises differentially expressed biomarkers that have the greatest ability to differentiate between gene expression in the subject and the control; providing a weighted value for the differentially expressed biomarkers within the factor; and determining a relationship between the factor and the bacterial infection using the weighted values of the differentially expressed biomarkers with an algorithm, wherein a relationship between the factor and the bacterial infection is used to develop the diagnostic assay.
The diagnostic assay may distinguish a subject that has a Staphylococcus aureus blood stream infection from a healthy subject. The biomarkers may be selected from human factor 20 (56 genes) and/or human factor 74 (137 genes), which are shown in Tables 8 and 10, respectively. The factor may comprise about 1 to about 193 biomarkers. For example, the factor may comprise at least about 1, at least about 2, at least about 3, at least about 4, at least about 5, at least about 10, at least about 15, at least about 20, at least about 25, at least about 30, at least about 35, at least about 40, at least about 45, at least about 50, at least about 55, at least about 60, at least about 65, at least about 70, at least about 75, at least about 80, at least about 85, at least about 90, at least about 95, at least about 100, at least about 105, at least about 110, at least about 115, at least about 120, at least about 125, at least about 130, at least about 135, at least about 140, at least about 145, at least about 150, at least about 155, at least about 160, at least about 165, at least about 170, at least about 175, at least about 180, at least about 185, at least about 190, or at least about 193 of the biomarkers listed in Tables 8 and 10. The relationship may have an AUC value of about 0.9500 to about 0.9999. For example, the AUC value may be at least about 0.9500, at least about 0.9550, at least about 0.9600, at least about 0.9650, at least about 0.9750, at least about 0.9800, at least about 0.9850, at least about 0.9860, at least about 0.9870, at least about 0.9880, at least about 0.9885, at least about 0.9890, at least about 0.9898, at least about 0.9900, or at least about 0.9999. The relationship may have an AUC value of at least about 0.9898.
The diagnostic assay may distinguish a subject that has a Staphylococcus aureus blood stream infection from a subject that has an Escherichia coli blood stream infection. The biomarkers may be selected from human factor 20 (56 genes) and/or human factor 74 (137 genes), which are shown in Tables 8 and 10, respectively. The factor may comprise about 1 to about 193 biomarkers. For example, the factor may comprise at least about 1, at least about 2, at least about 3, at least about 4, at least about 5, at least about 10, at least about 15, at least about 20, at least about 25, at least about 30, at least about 35, at least about 40, at least about 45, at least about 50, at least about 55, at least about 60, at least about 65, at least about 70, at least about 75, at least about 80, at least about 85, at least about 90, at least about 95, at least about 100, at least about 105, at least about 110, at least about 115, at least about 120, at least about 125, at least about 130, at least about 135, at least about 140, at least about 145, at least about 150, at least about 155, at least about 160, at least about 165, at least about 170, at least about 175, at least about 180, at least about 185, at least about 190, or at least about 193 of the biomarkers listed in Tables 8 and 10. The relationship may have an AUC value of about 0.8100 to about 0.9999. For example, the AUC value may be at least about 0.8100, at least about 0.8150, at least about 0.8200, at least about 0.8250, at least about 0.8300, at least about 0.8350, at least about 0.8360, at least about 0.8370, at least about 0.8380, at least about 0.8400, at least about 0.8500, at least about 0.8550, at least about 0.8600, at least about 0.8650, at least about 0.8700, at least about 0.8750, at least about 0.8800, at least about 0.8850, at least about 0.8900, at least about 0.8950, at least about 0.9000, at least about 0.9100, at least about 0.9200, at least about 0.9300, at least about 0.9400, at least about 0.9500, at least about 0.9600, at least about 0.9700, at least about 0.9800, at least about 0.9900, or at least about 0.9999. The relationship may have an AUC value of at least 0.8372.
The diagnostic assay may distinguish a subject that has an Escherichia coli blood stream infection from a healthy subject. The biomarkers may be selected from human factor 20 (56 genes) and/or human factor 74 (137 genes), which are shown in Tables 8 and 10, respectively. The factor may comprise about 1 to about 193 biomarkers. For example, the factor may comprise at least about 1, at least about 2, at least about 3, at least about 4, at least about 5, at least about 10, at least about 15, at least about 20, at least about 25, at least about 30, at least about 35, at least about 40, at least about 45, at least about 50, at least about 55, at least about 60, at least about 65, at least about 70, at least about 75, at least about 80, at least about 85, at least about 90, at least bout 95, at least about 100, at least about 105, at least about 110, at least about 115, at least about 120, at least about 125, at least about 130, at least about 135, at least about 140, at least about 145, at least about 150, at least about 155, at least about 160, at least about 165, at least about 170, at least about 175, at least about 180, at least about 185, at least about 190, or at least about 193 of the biomarkers listed in Tables 8 and 10. The relationship may have an AUC value of about 0.9000 to about 0.9999. For example, the AUC value may be at least about 0.9000, at least about 0.9050, at least about 0.9100, at least about 0.9150, at least about 0.9200, at least about 0.9210, at least about 0.9220, at least about 0.9230, at least about 0.9240, at least about 0.9250, at least about 0.9260, at least about 0.9270, at least about 0.9280, at least about 0.9300, at least about 0.9350, at least about 0.9400, at least about 0.9500, at least about 0.9600, at least about 0.9700, at least about 0.9800, at least about 0.9900, or at least about 0.9999. The relationship may have an AUC value of at least about 0.9229.
The diagnostic assay may distinguish a subject that has a gram positive blood stream infection from a subject that has a gram negative blood stream infection. The biomarkers may be selected from human factor 40 (26 genes), as shown in Table 9. The factor may comprise about 1 to about 26 biomarkers. For example, the factor may comprise at least about 1, at least about 2, at least about 3, at least about 4, at least about 5, at least about 6, at least about 7, at least about 8, at least about 9, at least about 10, at least about 11, at least about 12, at least about 13, at least about 14, at least about 15, at least about 16, at least about 17, at least about 18, at least about 19, at least about 20, at least about 21, at least about 22, at least about 23, at least about 24, at least about 25, or at least about 26 of the biomarkers listed in Table 9. The relationship may have an AUC value of about 0.8100 to about 0.9999. For example, the AUC value may be 0.8100, at least about 0.8150, at least about 0.8200, at least about 0.8250, at least about 0.8300, at least about 0.8350, at least about 0.8400, at least about 0.8450, at least about 0.8480, at least about 0.8490, at least about 0.8500, at least about 0.8510, at least about 0.8520, at least about 0.8550, at least about 0.8600, at least about 0.8650, at least about 0.8700, at least about 0.8750, at least about 0.8800, at least about 0.8850, at least about 0.8900, at least about 0.8950, at least about 0.9000, at least about 0.9100, at least about 0.9200, at least about 0.9300, at least about 0.9400, at least about 0.9500, at least about 0.9600, at least about 0.9700, at least about 0.9800, at least about 0.9900, or at least about 0.9999. The relationship may have an AUC value of at least about 0.8503.
The diagnostic assay may distinguish a subject that has a Staphylococcus aureus blood stream infection from a healthy subject. The biomarkers may be selected from human factor 4 (349 genes), as shown in Table 7. The factor may comprise about 1 to about 349 biomarkers. For example, the factor may comprise at least about 1, at least about 2, at least about 3, at least about 4, at least about 5, at least about 10, at least about 15, at least about 20, at least about 25, at least about 30, at least about 35, at least about 40, at least about 45, at least about 50, at least about 55, at least about 60, at least about 65, at least about 70, at least about 75, at least about 80, at least about 85, at least about 90, at least about 95, at least about 100, at least about 105, at least about 110, at least about 115, at least about 120, at least about 125, at least about 130, at least about 135, at least about 140, at least about 145, at least about 150, at least about 155, at least about 160, at least about 165, at least about 170, at least about 175, at least about 180, at least about 185, at least about 190, at least about 195, at least about 200, at least about 205, at least about 210, at least about 215, at least about 220, at least about 225, at least about 230, at least about 235, at least about 240, at least about 245, at least about 250, at least about 255, at least about 260, at least about 265, at least about 270, at least about 275, at least about 280, at least about 285, at least about 290, at least about 295, at least about 300, at least about 305, at least about 310, at least about 315, at least about 320, at least about 325, at least about 330, at least about 335, at least about 340, at least about 345, at least about 349 of the biomarkers listed in Table 7. The relationship may have an AUC value of about 0.9000 to about 0.9999. For example, the AUC value may be at least about 0.9000, at least about 0.9050, at least about 0.9100, at least about 0.9150, at least about 0.9200, at least about 0.9210, at least about 0.9215, at least about 0.9220, at least about 0.9230, at least about 0.9240, at least about 0.9250, at least about 0.9260, at least about 0.9270, at least about 0.9280, at least about 0.9300, at least about 0.9350, at least about 0.9400, at least about 0.9500, at least about 0.9600, at least about 0.9700, at least about 0.9800, at least about 0.9900, or at least about 0.9999. The relationship may have an AUC value of at least about 0.9217.
The diagnostic assay may distinguish a subject that has a Staphylococcus aureus blood stream infection from a healthy subject. The biomarkers may be selected from mouse factors 7, 15, and/or 26, of which the top 200 of each factor are shown in Tables 3, 4, and 6. The factor may comprise about 1 to about 250 biomarkers. For example, the factor may comprise at least about 1, at least about 2, at least about 3, at least about 4, at least about 5, at least about 10, at least about 15, at least about 20, at least about 25, at least about 30, at least about 35, at least about 40, at least about 45, at least about 50, at least about 55, at least about 60, at least about 65, at least about 70, at least about 75, at least about 80, at least about 85, at least about 90, at least about 95, at least about 100, at least about 105, at least about 110, at least about 115, at least about 120, at least about 125, at least about 130, at least about 135, at least about 140, at least about 145, at least about 150, at least about 155, at least about 160, at least about 165, at least about 170, at least about 175, at least about 180, at least about 185, at least about 190, at least about 195, at least about 200, at least about 205, at least about 210, at least about 215, at least about 220, at least about 225, at least about 230, at least about 235, at least about 240, at least about 245, or at least about 250 of the biomarkers listed in Tables 3, 4, and 6. The relationship may have an AUC value of about 0.9200 to about 0.9999. For example, the AUC value may be at least about 0.9200, at least about 0.9250, at least about 0.9300, at least about 0.9350, at least about 0.9400, at least about 0.9450, at least about 0.9500, at least about 0.9510, at least about 0.9520, at least about 0.9530, at least about 0.9540, at least about 0.9550, at least about 0.9600, at least about 0.9650, at least about 0.9700, at least about 0.9750, at least about 0.9800, at least about 0.9850, at least about 0.9900, at least about 0.9950, or at least about 0.9999. The relationship may have an AUC value of at least about 0.9522.
The diagnostic assay may distinguish a subject that has a Staphylococcus aureus blood stream infection from a healthy subject. The biomarkers may be selected from mouse factors 7, 15, 23, and/or 26, of which the top 200 of each factor are shown in Tables 3, 4, 5, and 6. The factor may comprise about 1 to about 250 biomarkers. For example, the factor may comprise at least about 1, at least about 2, at least about 3, at least about 4, at least about 5, at least about 10, at least about 15, at least about 20, at least about 25, at least about 30, at least about 35, at least about 40, at least about 45, at least about 50, at least about 55, at least about 60, at least about 65, at least about 70, at least about 75, at least about 80, at least about 85, at least about 90, at least about 95, at least about 100, at least about 105, at least about 110, at least about 115, at least about 120, at least about 125, at least about 130, at least about 135, at least about 140, at least about 145, at least about 150, at least about 155, at least about 160, at least about 165, at least about 170, at least about 175, at least about 180, at least about 185, at least about 190, at least about 195, at least about 200, at least about 205, at least about 210, at least about 215, at least about 220, at least about 225, at least about 230, at least about 235, at least about 240, at least about 245, or at least about 250 of the biomarkers listed in Tables 3, 4, 5, and 6. The relationship may have an AUC value of about 0.9500 to about 0.9999. For example, the AUC value may be at least about 0.9500, at least about 0.9550, at least about 0.9600, at least about 0.9650, at least about 0.9700, at least about 0.9750, at least about 0.9800, at least about 0.9850, at least about 0.9900, at least about 0.9910, at least about 0.9920, at least about 0.9930, at least about 0.9940, at least about 0.9950, at least about 0.9960, at least about 0.9970, at least about 0.9980, at least about 0.9990, or at least about 0.9999. The relationship may have an AUC value of at least about 0.9964.
The diagnostic assay may distinguish a subject that has a Staphylococcus aureus blood stream infection from a subject that has an Escherichia coli blood stream infection. The biomarkers may be selected from mouse factors 7, 15, 23, and/or 26, of which the top 200 of each factor are shown in Tables 3, 4, 5, and 6. The factor may comprise about 1 to about 250 biomarkers. For example, the factor may comprise at least about 1, at least about 2, at least about 3, at least about 4, at least about 5, at least about 10, at least about 15, at least about 20, at least about 25, at least about 30, at least about 35, at least about 40, at least about 45, at least about 50, at least about 55, at least about 60, at least about 65, at least about 70, at least about 75, at least about 80, at least about 85, at least about 90, at least about 95, at least about 100, at least about 105, at least about 110, at least about 115, at least about 120, at least about 125, at least about 130, at least about 135, at least about 140, at least about 145, at least about 150, at least about 155, at least about 160, at least about 165, at least about 170, at least about 175, at least about 180, at least about 185, at least about 190, at least about 195, at least about 200, at least about 205, at least about 210, at least about 215, at least about 220, at least about 225, at least about 230, at least about 235, at least about 240, at least about 245, or at least about 250 of the biomarkers listed in Tables 3, 4, 5, and 6. The relationship may have an AUC value of about 0.9500 to about 0.9999. For example, the AUC value may be at least about 0.9500, at least about 0.9550, at least about 0.9600, at least about 0.9650, 0.9700, at least about 0.9750, at least about 0.9800, at least about 0.9850, at least about 0.9900, at least about 0.9910, at least about 0.9920, at least about 0.9930, at least about 0.9940, at least about 0.9950, at least about 0.9960, at least about 0.9970, at least about 0.9980, at least about 0.9990, or at least about 0.9999. The relationship may have an AUC value of at least about 0.9935.
The diagnostic assay may distinguish a subject that has an Escherichia coli blood stream infection from a healthy subject. The biomarkers may be selected from mouse factors 7, 15, 23, and/or 26, of which the top 200 of each factor are shown in Tables 3, 4, 5, and 6. The factor may comprise about 1 to about 250 biomarkers. For example, the factor may comprise at least about 1, at least about 2, at least about 3, at least about 4, at least about 5, at least about 10, at least about 15, at least about 20, at least about 25, at least about 30, at least about 35, at least about 40, at least about 45, at least about 50, at least about 55, at least about 60, at least about 65, at least about 70, at least about 75, at least about 80, at least about 85, at least about 90, at least about 95, at least about 100, at least about 105, at least about 110, at least about 115, at least about 120, at least about 125, at least about 130, at least about 135, at least about 140, at least about 145, at least about 150, at least about 155, at least about 160, at least about 165, at least about 170, at least about 175, at least about 180, at least about 185, at least about 190, at least about 195, at least about 200, at least about 205, at least about 210, at least about 215, at least about 220, at least about 225, at least about 230, at least about 235, at least about 240, at least about 245, or at least about 250 of the biomarkers listed in Tables 3, 4, 5, and 6. The relationship may have an AUC value of about 0.9200 to about 0.9999. For example, the AUC value may be at least about 0.9200, at least about 0.9250, at least about 0.9300, at least about 0.9350, at least about 0.9400, at least about 0.9440, at least about 0.9450, at least about 0.9460, at least about 0.9470, at least about 0.9480, at least about 0.9490, at least about 0.9500, at least about 0.9510, at least about 0.9520, at least about 0.9530, at least about 0.9540, at least about 0.9550, at least about 0.9600, at least about 0.9650, at least about 0.9700, at least about 0.9750, at least about 0.9800, at least about 0.9850, at least about 0.9900, at least about 0.9950, or at least about 0.9999. The relationship may have an AUC value of at least about 0.9484.
5. Methods of Identifying and Treating a Bacterial Infection
The present invention is directed to method of identifying and treating a bacterial infection in a subject. The method comprises performing the diagnostic assay as developed by the methods, as described above, and administrating an antibacterial therapy to the subject diagnosed with a bacterial infection. The method further comprising quantifying the amount of at least about one biomarker present in a biological sample derived from the subject, wherein the biomarker may be associated with a factor.
The present invention is also directed towards a method of identifying and treating a subject suspected of having a bacterial blood stream infection (BSI). The method comprises determining gene expression levels of at least about two biomarkers in a peripheral blood cell sample of the subject, wherein the biomarkers are selected from any one of Tables 3-17; comparing the gene expression levels of the at least about two biomarkers to standard gene expression levels wherein the standard gene expression levels correspond to the gene expression levels for the biomarkers in a control; identifying the subject as having a bacterial BSI if the gene expression levels of the biomarkers are different than the standard gene expression levels; and administering an effective amount of antibiotic therapy to treat the subject identified as having a bacterial BSI. The bacterial BSI may be Staphylococcus aureus BSI or Escherichia coli BSI. The bacterial blood stream infection may be S. aureus BSI and the biomarkers may be selected from one of Tables 3-8 or 10.
The present invention is directed to method of distinguishing and treating Staphylococcus aureus blood stream infection (BSI) from Escherichia coli BSI in a subject suspected of having a bacterial infection. The method comprises determining gene expression levels of at least about two biomarkers in a peripheral blood cell sample of the subject, wherein the biomarkers are selected from any one of Tables 8 and 10 or Tables 3-6; comparing the gene expression levels of the at least about two biomarkers to standard gene expression levels wherein the standard gene expression levels correspond to the gene expression levels for the biomarkers in a control; identifying the subject as having a S. aureus BSI if the gene expression levels of the biomarkers are different than the standard gene expression levels and identifying the subject as having an E. coli BSI if the gene expression levels of the biomarkers are the same as the standard gene expression levels; and administering an effective amount of appropriate antibacterial therapy to treat the subject identified as having a S. aureus BSI or E. coli. The control may be a subject having an E. coli BSI. The present invention is directed to method of distinguishing and treating a gram positive bacterial infection from a gram negative bacterial infection in a subject suspected of having a bacterial infection. The method comprises determining gene expression levels of at least about two biomarkers in a peripheral blood cell sample of the subject, wherein the biomarkers are selected from Table 9; comparing the gene expression levels of the at least about two biomarkers to standard gene expression levels wherein the standard gene expression levels correspond to the gene expression levels for the biomarkers in a control; identifying the subject as having a gram positive bacterial infection if the gene expression levels of the biomarkers are different than the standard gene expression levels in a control; and administering an effective amount of appropriate antibacterial therapy to treat the subject identified as a gram positive bacterial infection. The gram positive bacterial infection may be Staphylococcus aureus. The control may be a subject having a gram negative bacterial infection. The gram negative bacterial infection may be Escherichia coli.
The present invention is directed method of identifying and treating a subject suspected of having a methicillin-resistant Staphylococcus aureus (MRSA) infection. The method comprises determining gene expression levels of at least about one biomarker in a peripheral blood cell sample of the subject wherein the biomarker is selected from Table 11; comparing the gene expression levels of the biomarker to a standard gene expression level of the biomarker, wherein the standard gene expression level corresponds to the gene expression level of the biomarker in a subject that has a methicillin-sensitive Staphylococcus aureus (MSSA) infection; identifying the subject as having MRSA if the gene expression levels of the biomarkers are different than the standard gene expression levels; and administering an effective amount of an antibiotic therapy to treat the subject identified as having MRSA. The antibiotic therapy may be mupirocine or vancomycin.
6. Methods of Determining Efficacy of Treatment Using Biomarkers
Another aspect of the present disclosure provides for methods for monitoring the treatment of conditions such as a bacterial infection. In one embodiment, the method comprises a method of determining the efficacy of treatment regime (e.g., anti-bacterial therapy) in a subject comprising, consisting of, or consisting essentially of: (a) determining a baseline value for the expression of one or more biomarkers associated with bacterial infection; (b) administering to the subject an anti-bacterial therapy regime; and (c) redetermining the expression levels of one or more biomarkers in the subject, wherein observed changes in one or more or the biomarker expression levels as compared to a control is correlated with the efficacy of the therapeutic regimen.
In instances where a change in the biomarker expression is not seen, a change in treatment may be warranted. Such a determination, and the different type of treatment to employ, can be made readily determined by one skilled in the art.
7. Probability and Threshold
A probability score could be produced using various methods, such as those methods using a ENet score as described in Chen et al., IEEE Transactions on Biomedical Engineering 58: 468-479 (2011). For example, one method of determining the probability score is the following: Let X be a p.times.n matrix of observed data in the real number domain, where each column corresponds to one of n samples, quantifying the associated gene-expression values for all p genes under investigation. To address the "large p, small n" problem in an unsupervised setting the data are assumed to satisfy X=AS+E, where A is a p.times.r matrix, S is r.times.n and E is p.times.n. The columns of A represent the factor "loadings" and each column of S represents factor "scores" for the associated sample (column of X); the rows of S are called factors. E is the usual error matrix.
Thresholds may be defined based on how the classifier performs using the final testing platform that would be implemented clinically. This will require a balance of sensitivity, specificity, and input from end-users. An alternative to a threshold is determining the probability that the patient in question has a S. aureus infection.
8. Treatment
Treatment may include being administered oxygen, either by a tube that is placed near the nose or through a clear plastic mask. Depending on the results of the tests, the physician may order medications. These medications may include antibiotics given intravenously (given directly into the vein). Initially, the antibiotics may be those that kill many different bacteria because the exact kind of infection the patient has is not known. Once the blood culture results show the identity of the bacteria, the doctor may select a different antibiotic that kills the specific organism responsible for the infection. The doctor may also order IV salt solution saline and medications to increase the blood pressure it is too low. The patient may be admitted to the hospital at least until the blood culture results are known. If the patient is very ill and with low blood pressure, the doctor may admit the patient to the intensive care unit (ICU) and may consult specialist doctors to help in the management of the illness. If results show an infection in the abdomen, either drainage of the infection by the placement of tubes or surgery may be necessary. The physician will administer anti-autoimmune drugs or biologics as well to modify the body's aggressive immune response to microbes, which leads to sepsis.
Treatment for sepsis or severe sepsis/septic shock may further include early goal directed therapy, antibiotic, a vasopressor, such as norepinephrine and dopamine, a steroid, such as corticosteroids, insulin, painkillers, sedatives, oxygen, cerebrospinal fluid, and intravenous fluid to the subject. For application of these therapies, a central venous catheter and an arterial catheter may be used. Other hemodynamic variables (such as cardiac output, mixed venous oxygen saturation, or stroke volume variation) may also be used.
Treatment of organ dysfunction may include hemodialysis in kidney failure, mechanical ventilation in pulmonary dysfunction, transfusion of blood products, and drug and fluid therapy for circulatory failure. Ensuring adequate nutrition may further be required by enteral feeding, but if necessary by parenteral nutrition during a prolonged illness.
a. S. aureus
S. aureus bacterial infection may be treated with an antibiotic, such as penicillin and penicillinase-resistant .beta.-lactam antibiotics, such as methicillin, dicloxacillin, nafcillin, oxacillin, and flucloxacillin, cephalosporin, gentamicin, or combinations thereof. S. aureus infection may also be treated with a combination therapy of a penicillinase-resistant penicillin or cephalosporin (in case the organism is MSSA) and clindamycin or a quinolone. Other therapies include clindamycin, trimethoprim-sulfamethoxazole (TMP-SMX), rifampin, doxycycline, or a quinolone. Combination of TMP-SMX and rifampin may also be used
i. MRSA
In some embodiments, the subject has MRSA and is resistant to .beta.-lactam antibiotic, such as methicillin. MRSA is also called oxacillin-resistant S. aureus. MRSA may be treated with mupirocine or vancomycin.
b. E. coli
E. coli bacterial infection may be treated with antibiotics.
9. Composition of Matter
Another aspect of the present disclosure provides a composition of matter comprising, consisting of, or consisting essentially of: (a) a probe array for determining a biomarker level in a sample, the array comprising of a plurality of probes that hybridizes to one or more biomarkers that are associated with bacterial infection; or (b) a kit for determining a biomarker level in a sample, comprising the probe array of (a) and instructions for carrying out the determination of biomarker expression level in the sample. In certain embodiments the probe array of (a) further comprises a solid support with the plurality of probes attached thereto.
10. Sample
The present disclosure provides a method of determining the identification and/or classification of a bacterial infection on at least one sample obtained from an individual. The individual may be any mammal, but is preferably a human.
The present disclosure may involve obtaining more than one sample, such as two samples, such as three samples, four samples or more from individuals, and preferably the same individual. This allows the relative comparison of expression both as in the presence or absence of at least one biomarker between the two samples. Alternatively, a single sample may be compared against a "standardized" sample, such a sample comprising material or data from several samples, preferably also from several individuals.
11. Sample Preparation
Before analyzing the sample, it will often be desirable to perform one or more sample preparation operations upon the sample. Typically, these sample preparation operations will include such manipulations as concentration, suspension, extraction of intracellular material, e.g., nucleic acids from tissue/whole cell samples and the like, amplification of nucleic acids, fragmentation, transcription, labeling and/or extension reactions.
Any method required for the processing of a sample prior to detection by any of the methods noted herein falls within the scope of the present disclosure. These methods are typically well known by a person skilled in the art.
12. Detection
It is within the general scope of the present disclosure to provide methods for the detection of gene expression as a biomarker. An aspect of the present disclosure relates to the detection of the gene expression as described in the plots and graphs of the figures contained herein. As used herein, the term "detect" or "determine the presence of" refers to the qualitative measurement of undetectable, low, normal, or high concentrations of one or more biomarkers such as, for example, nucleic acids, ribonucleic acids, or polypeptides and other biological molecules. Detection may include 1) detection in the sense of presence versus absence of one or more biomarkers as well as 2) the registration/quantification of the level or degree of expression of one or more biomarkers, depending on the method of detection employed. The term "quantify" or "quantification" may be used interchangeable, and refer to a process of determining the quantity or abundance of a substance in a sample (e., a biomarker), whether relative or absolute. For example, quantification may be determined by methods including but not limited to, micro-array analysis, qRT-PCR, band intensity on a Northern or Western blot, or by various other methods known in the art.
The detection of one or more biomarker molecules allows for the identification and/or classification of a condition such as a bacterial infection. The classification of such conditions is of relevance both medically and scientifically and may provide important information useful for the diagnosis, prognosis and treatment of the condition. The diagnosis of a condition such as a bacterial infection is the affirmation of the presence of the condition, as is the object of the present disclosure, on the expression of at least one biomarker herein. Prognosis is the estimate or prediction of the probable outcome of a condition such as a bacterial infection and the prognosis of such is greatly facilitated by increasing the amount of information on the particular condition. The method of detection is thus a central aspect of the present disclosure.
Any method of detection falls within the general scope of the present disclosure. The detection methods may be generic for the detection of gene expression, nucleic acids, polypeptides and the like. The detection methods may be directed towards the scoring of a presence or absence of one or more biomarker molecules or may be useful in the detection of expression levels.
The detection methods can be divided into two categories herein referred to as in situ methods or screening methods. The term in situ method refers to the detection of nucleic acid and/or protein molecules in a sample wherein the structure of the sample has been preserved. This may thus be a biopsy wherein the structure of the tissue is preserved. In situ methods are generally histological i.e. microscopic in nature and include but are not limited to methods such as: in situ hybridization techniques and in situ PCR methods.
Screening methods generally employ techniques of molecular biology and most often require the preparation of the sample material in order to access the nucleic acid and/or polypeptide molecules to be detected. Screening methods include, but are not limited to methods such as: Array systems, affinity matrices, Northern blotting and PCR techniques, such as real-time quantitative RT-PCR.
13. Probe
One aspect of the present disclosure is to provide a probe which can be used for the detection of a gene, a nucleic acid and/or polypeptide molecule as defined herein. A probe as defined herein is a specific sequence of a nucleic acid and/or polypeptide used to detect nucleic acids and/or polypeptides by hybridization. For example, a nucleic acid is also here any nucleic acid, natural or synthetic such as DNA, RNA, LNA or PNA. A probe may be labeled, tagged or immobilized or otherwise modified according to the requirements of the detection method chosen. A label or a tag is an entity making it possible to identify a compound to which it is associated. It is within the scope of the present disclosure to employ probes that are labeled or tagged by any means known in the art such as but not limited to: radioactive labeling, fluorescent labeling and enzymatic labeling. Furthermore the probe, labeled or not, may be immobilized to facilitate detection according to the detection method of choice and this may be accomplished according to the preferred method of the particular detection method.
14. Detection Methods
Another aspect of the present disclosure regards the detection of nucleic acid and/or polypeptide molecules by any method known in the art. In the following are given examples of various detection methods that can be employed for this purpose, and the present disclosure includes all the mentioned methods, but is not limited to any of these. In some embodiments, the RNA gene expression levels may be determined.
c. In Situ Hybridization
In situ hybridization (ISH) applies and extrapolates the technology of nucleic acid and/or polypeptide hybridization to the single cell level, and, in combination with the art of cytochemistry, immunocytochemistry and immunohistochemistry, permits the maintenance of morphology and the identification of cellular markers to be maintained and identified, allows the localization of sequences to specific cells within populations, such as tissues and blood samples. ISH is a type of hybridization that uses a complementary nucleic acid to localize one or more specific nucleic acid sequences in a portion or section of tissue (in situ), or, if the tissue is small enough, in the entire tissue (whole mount ISH). DNA ISH can be used to determine the structure of chromosomes and the localization of individual genes and optionally their copy numbers. Fluorescent DNA ISH (FISH) can for example be used in medical diagnostics to assess chromosomal integrity. RNA ISH is used to assay expression and gene expression patterns in a tissue/across cells, such as the expression of miRNAs/nucleic acid molecules. Sample cells are treated to increase their permeability to allow the probe to enter the cells, the probe is added to the treated cells, allowed to hybridize at pertinent temperature, and then excess probe is washed away. A complementary probe is labeled with a radioactive, fluorescent or antigenic tag, so that the probe's location and quantity in the tissue can be determined using autoradiography, fluorescence microscopy or immunoassay, respectively. The sample may be any sample as herein described. The probe is likewise a probe according to any probe based upon the biomarkers mentioned herein.
An aspect of the present disclosure includes the method of detection by in situ hybridization as described herein.
d. In Situ PCR
In situ PCR is the PCR based amplification of the target nucleic acid sequences prior to ISH. For detection of RNA, an intracellular reverse transcription (RT) step is introduced to generate complementary DNA from RNA templates prior to in situ PCR. This enables detection of low copy RNA sequences.
Prior to in situ PCR, cells or tissue samples are fixed and permeabilized to preserve morphology and permit access of the PCR reagents to the intracellular sequences to be amplified. PCR amplification of target sequences is next performed either in intact cells held in suspension or directly in cytocentrifuge preparations or tissue sections on glass slides. In the former approach, fixed cells suspended in the PCR reaction mixture are thermally cycled using conventional thermal cyclers. After PCR the cells are cytocentrifugated onto glass slides with visualization of intracellular PCR products by ISH or immunohistochemistry. In situ PCR on glass slides is performed by overlaying the samples with the PCR mixture under a coverslip which is then sealed to prevent evaporation of the reaction mixture. Thermal cycling is achieved by placing the glass slides either directly on top of the heating block of a conventional or specially designed thermal cycler or by using thermal cycling ovens. Detection of intracellular PCR-products is achieved by one of two entirely different techniques. In indirect in situ PCR by ISH with PCR-product specific probes, or in direct in situ PCR without ISH through direct detection of labeled nucleotides (e.g. digoxigenin-11-dUTP, fluorescein-dUTP, 3H-CTP or biotin-16-dUTP) which have been incorporated into the PCR products during thermal cycling.
An embodiment of the present disclosure concerns the method of in situ PCR as mentioned herein above for the detection of nucleic acid molecules as detailed herein.
e. Microarray
A microarray is a microscopic, ordered array of nucleic acids, proteins, small molecules, cells or other substances that enables parallel analysis of complex biochemical samples. A DNA microarray consists of different nucleic acid probes, known as capture probes that are chemically attached to a solid substrate, which can be a microchip, a glass slide or a microsphere-sized bead. Microarrays can be used e.g. to measure the expression levels of large numbers of polypeptides/proteins/nucleic acids simultaneously.
Microarrays can be fabricated using a variety of technologies, including printing with fine-pointed pins onto glass slides, photolithography using pre-made masks, photolithography using dynamic micromirror devices, ink-jet printing, or electrochemistry on microelectrode arrays.
An aspect of the present disclosure regards the use of microarrays for the expression profiling of biomarkers in conditions such as bacterial infection. For this purpose, and by way of example, RNA is extracted from a cell or tissue sample, the small RNAs (18-26-nucleotide RNAs) are size-selected from total RNA using denaturing polyacrylamide gel electrophoresis (PAGE). Then oligonucleotide linkers are attached to the 5' and 3' ends of the small RNAs and the resulting ligation products are used as templates for an RT-PCR reaction with 10 cycles of amplification. The sense strand PCR primer has a Cy3 fluorophore attached to its 5' end, thereby fluorescently labeling the sense strand of the PCR product. The PCR product is denatured and then hybridized to the microarray. A PCR product, referred to as the target nucleic acid that is complementary to the corresponding RNA capture probe sequence on the array will hybridize, via base pairing, to the spot at which the capture probes are affixed. The spot will then fluoresce when excited using a microarray laser scanner. The fluorescence intensity of each spot is then evaluated in terms of the number of copies of a particular biomarker, using a number of positive and negative controls and array data normalization methods, which will result in assessment of the level of expression of a particular biomarker.
Several types of microarrays can be employed such as spotted oligonucleotide microarrays, pre-fabricated oligonucleotide microarrays or spotted long oligonucleotide arrays.
In spotted oligonucleotide microarrays the capture probes are oligonucleotides complementary to nucleic acid sequences. This type of array is typically hybridized with amplified.
PCR products of size-selected small RNAs from two samples to be compared that are labeled with two different fluorophores. Alternatively, total RNA containing the small RNA fraction is extracted from the abovementioned two samples and used directly without size-selection of small RNAs, and 3' end labeled using T4 RNA ligase and short RNA linkers labeled with two different fluorophores. The samples can be mixed and hybridized to one single microarray that is then scanned, allowing the visualization of up-regulated and down-regulated biomarker genes in one go. The downside of this is that the absolute levels of gene expression cannot be observed, but the cost of the experiment is reduced by half. Alternatively, a universal reference can be used, comprising of a large set of fluorophore-labelled oligonucleotides, complementary to the array capture probes.
In pre-fabricated oligonucleotide microarrays or single-channel microarrays, the probes are designed to match the sequences of known or predicted biomarkers. There are commercially available designs that cover complete genomes from companies such as Affymetrix, or Agilent. These microarrays give estimations of the absolute value of gene expression and therefore the comparison of two conditions requires the use of two separate microarrays.
Spotted long oligonucleotide arrays are composed of 50 to 70-mer oligonucleotide capture probes, and are produced by either ink-jet or robotic printing. Short Oligonucleotide Arrays are composed of 20-25-mer oligonucleotide probes, and are produced by photolithographic synthesis (Affymetrix) or by robotic printing. More recently, Maskless Array Synthesis from NimbleGen Systems has combined flexibility with large numbers of probes. Arrays can contain up to 390,000 spots, from a custom array design.
An embodiment of the present disclosure concerns the method of microarray use and analysis as described herein.
f. PCR
The terms "PCR reaction", "PCR amplification", "PCR", "pre-PCR", "Q-PCR", "real-time quantitative PCR" and "real-time quantitative RT-PCR" are interchangeable terms used to signify use of a nucleic acid amplification system, which multiplies the target nucleic acids being detected. Examples of such systems include the polymerase chain reaction (PCR) system and the ligase chain reaction (LCR) system. Other methods recently described and known to the person of skill in the art are the nucleic acid sequence based amplification and Q Beta Replicase systems. The products formed by said amplification reaction may or may not be monitored in real time or only after the reaction as an end-point measurement.
g. Real-Time Quantitative RT-PCR
Real-time quantitative RT-PCR is a modification of polymerase chain reaction used to rapidly measure the quantity of a product of polymerase chain reaction. It is preferably done in real-time, thus it is an indirect method for quantitatively measuring starting amounts of DNA, complementary DNA or ribonucleic acid (RNA). This is commonly used for the purpose of determining whether a genetic sequence is present or not, and if it is present the number of copies in the sample. There are 3 methods which vary in difficulty and detail. Like other forms of polymerase chain reaction, the process is used to amplify DNA samples, using thermal cycling and a thermostable DNA polymerase.
The three commonly used methods of quantitative polymerase chain reaction are through agarose gel electrophoresis, the use of SYBR Green, a double stranded DNA dye, and the fluorescent reporter probe. The latter two of these three can be analysed in real-time, constituting real-time polymerase chain reaction method.
Agarose gel electrophoresis is the simplest method, but also often slow and less accurate then other methods, depending on the running of an agarose gel via electrophoresis. It cannot give results in real time. The unknown sample and a known sample are prepared with a known concentration of a similarly sized section of target DNA for amplification. Both reactions are run for the same length of time in identical conditions (preferably using the same primers, or at least primers of similar annealing temperatures). Agarose gel electrophoresis is used to separate the products of the reaction from their original DNA and spare primers. The relative quantities of the known and unknown samples are measured to determine the quantity of the unknown. This method is generally used as a simple measure of whether the probe target sequences are present or not, and rarely as `true` Q-PCR.
Using SYBR Green dye is more accurate than the gel method, and gives results in real time. A DNA binding dye binds all newly synthesized double stranded (ds)DNA and an increase in fluorescence intensity is measured, thus allowing initial concentrations to be determined. However, SYBR Green will label all dsDNA including any unexpected PCR products as well as primer dimers, leading to potential complications and artifacts. The reaction is prepared as usual, with the addition of fluorescent dsDNA dye. The reaction is run, and the levels of fluorescence are monitored; the dye only fluoresces when bound to the dsDNA. With reference to a standard sample or a standard curve, the dsDNA concentration in the PCR can be determined.
The fluorescent reporter probe method is the most accurate and most reliable of the methods. It uses a sequence-specific nucleic acid based probe so as to only quantify the probe sequence and not all double stranded DNA. It is commonly carried out with DNA based probes with a fluorescent reporter and a quencher held in adjacent positions, so-called dual-labeled probes. The close proximity of the reporter to the quencher prevents its fluorescence; it is only on the breakdown of the probe that the fluorescence is detected. This process depends on the 5' to 3' exonuclease activity of the polymerase involved. The real-time quantitative PCR reaction is prepared with the addition of the dual-labeled probe. On denaturation of the double-stranded DNA template, the probe is able to bind to its complementary sequence in the region of interest of the template DNA (as the primers will too). When the PCR reaction mixture is heated to activate the polymerase, the polymerase starts synthesizing the complementary strand to the primed single stranded template DNA. As the polymerization continues it reaches the probe bound to its complementary sequence, which is then hydrolyzed due to the 5'-3' exonuclease activity of the polymerase thereby separating the fluorescent reporter and the quencher molecules. This results in an increase in fluorescence, which is detected. During thermal cycling of the real-time PCR reaction, the increase in fluorescence, as released from the hydrolyzed dual-labeled probe in each PCR cycle is monitored, which allows accurate determination of the final, and so initial, quantities of DNA.
Any method of PCR that can determine the expression of a nucleic acid molecule as defined herein falls within the scope of the present disclosure. A preferred embodiment of the present disclosure includes the real-time quantitative RT-PCR method, based on the use of either SYBR Green dye or a dual-labeled probe for the detection and quantification of nucleic acids according to the herein described.
h. Northern Blot Analysis
An aspect of the present disclosure includes the detection of the nucleic acid molecules herein disclosed by techniques such as Northern blot analysis. Many variations of the protocol exist.
The following examples are offered by way of illustration and not by way of limitation.
The present invention has multiple aspects, illustrated by the following non-limiting examples.
15. Examples
The foregoing may be better understood by reference to the following examples, which are presented for purposes of illustration and are not intended to limit the scope of the invention.
Example 1
Materials and Methods
Preparation of Bacterial Cells.
One methicillin-susceptible S. aureus (Sanger 476) and three methicillin-resistant S. aureus genetic backgrounds (USA100, USA300, and MW2) were used. Overnight S. aureus cultures were inoculated into fresh tryptic soy broth and incubated aerobically at 30.degree. C. to log-phase growth (optical density 600 nm of .about.1.0). Cells were harvested by centrifugation, rinsed, and resuspended in phosphate-buffered saline (PBS). E. coli O18:K1:H7 was grown at 30.degree. C. overnight in Luria-Bertani broth. Cultures were then diluted with fresh medium and grown for an additional 1 to 2 hours. Upon reaching log phase, cells were treated as described for S. aureus.
Human Subjects.
Subjects were enrolled at Duke University Medical Center (DUMC; Durham, N.C.), Durham VAMC (Durham, N.C.), UNC Hospitals (Chapel Hill, N.C.), and Henry Ford Hospital (Detroit, Mich.) as part of a prospective, NIH-sponsored study to develop novel diagnostic tests for severe sepsis and community acquired pneumonia (ClinicalTrials.gov NCT00258869). Enrolled patients had a known or suspected infection and exhibited two or more Systemic Inflammatory Response Syndrome criteria. Patients were excluded if they had an imminently terminal co-morbid condition, advanced AIDS (CD4 count, 50), were being appropriately treated with an antibiotic pre-enrollment, or were enrolled in another clinical trial. Blood was drawn for microarray analysis on the day of hospital presentation with the exception of two subjects (S19 and S29). In these latter two cases, blood was not available for microarray preparation from that time point. However, blood drawn 24 hours into the hospitalization was available and so was used. Subjects in the current report had culture-confirmed monomicrobial BSI due to S. aureus (n=32; median age 58 years; range 24-91) or E. coli (n=19; median age 58; range 25-91). Uninfected controls (n=43; median age 30 years; range 23-59) were enrolled at DUMC as part of a study on the effect of aspirin on platelet function among healthy volunteers. Subjects were recruited through advertisements posted on the Duke campus. Blood used to derive gene expression data in these healthy controls was drawn prior to aspirin challenge.
Murine Sepsis Experiments.
Except where noted, mice were purchased from The Jackson Laboratory (Bar Harbor, Me.) and allowed to acclimate for 7 days. All experiments were performed on 6-8 week old mice. For the murine S. aureus classifier, seven inbred mouse strains (3 mice/strain: 129S1/SvImJ, A/J, AKR/J, BALB/cByJ, C57BL/6J, C3H/HeJ, and NOD/LtJ) were IP inoculated with 10.sup.7 CFU/g of S. aureus Sanger476, euthanized at 2 h after injection, and bled. This was repeated using the four different S. aureus genetic backgrounds (USA100, USA300, MW2, and Sanger476) in A/J mice (n=3 per S. aureus background). For time series experiments, both A/J and C57BL/6J mouse strains were IP inoculated with S. aureus Sanger476 as above, and sacrificed at 2, 4, 6, and 12 h after injection (n=5 per mouse strain at each time point). For survival experiments, mice were monitored twice daily after injection and culled upon reaching a moribund state. Animal sacrifice was carried out by carbon dioxide inhalation. Blood was collected by intracardiac puncture and stored in RNAlater at -70.degree. C. for microarray experiments.
The murine E. coli infection model was carried out as described above except a smaller inoculum (6.times.10.sup.4 CFU/g) was used. Furthermore, the time at which animals were sickest but still alive was 24 hours for E. coli inoculation, which is later than for S. aureus. Consequently, A/J and C57BL/6J mice inoculated with E. coli were sacrificed 24 h after challenge (n=5 per mouse strain). Control mice were not injected.
Outbred CD-1 mice were purchased from Charles River Laboratories (Wilmington, Mass.) to validate the murine S. aureus classifier. CD-1 mice were IP inoculated with 10.sup.7 CFU/g of S. aureus (USA300 and Sanger 476) and 6.times.10.sup.4 CFU/g of E. coli. Animals including controls were sacrificed at 2 and 24 h postinfection (n=10 mice per pathogen at each time point). Blood was collected and stored as described for the derivation cohort.
Example 2
Microarray Preparation
Total RNA was extracted from mouse blood using the Mouse RiboPure Blood RNA kit (Ambion, Austin, Tex.) according to the manufacturer's instructions. Globin mRNA was removed from whole blood RNA using the Globinclear kit (Ambion, Austin, Tex.). All samples passed the quality criteria of the Agilent Bioanalyzer and were used for microarray analysis. Since the total RNA yield of many samples was low, one round of linear amplification was performed for all samples using the MessageAmp Premier kit (Ambion, Austin, Tex.). RNA integrity numbers were calculated for all samples and found to be within tolerance limits. Microarrays were normalized using Robust Multichip Average (RMA). Affymetrix GeneChip Mouse Genome 430 2.0 Arrays were used (Santa Clara, Calif.). Biotin-labeled cDNA was hybridized to the arrays for 16 hours at 45.degree. C. according to the manufacturer's instructions. Arrays were then washed and labeled with streptavidin-phycoerythrin (strep-PE), and the signal was amplified using biotinylated antistreptavidin followed by another round of staining with strep-PE. These steps were performed on the Affymetrix fluidics station according to the recommended protocol. Amplification and microarray hybridization were performed at the Duke University Microarray Core. Labeled gene chips were scanned using an Affymetrix Genechip Scanner 7G (Santa Clara, Calif.). This array contains 45,101 probe sets to analyze the expression level of over 39,000 transcripts and variants from over 34,000 mouse genes.
Human microarrays were prepared by first extracting total RNA from human blood using the PAXgene Blood RNA Kit (Qiagen, Valencia, Calif.) according to the manufacturer's recommended protocol including DNase treatment. Following isolation, RNA quantity was determined via a Nanodrop UV-Vis Spectrophotometer (Thermo Fisher Scientific, Pittsburgh, Pa.) and quality via capillary electrophoresis using the Agilent 2100 Bioanalyzer (Agilent, Santa Clara, Calif.). RNA quantity and quality was assessed using the Agilent 2100 Bioanalyzer (Agilent, Santa Clara, Calif.). RNA integrity numbers were calculated for all samples and found to be within tolerance limits. Microarrays were normalized using RMA. Hybridization and microarray data collection was then performed at Expression Analysis (Durham, N.C.) using the GeneChip.RTM. Human Genome U 33A 2.0 Array (Affymetrix, Santa Clara, Calif.) according to the "Affymetrix Technical Manual."
Target was prepared and hybridized according to the "Affymetrix Technical Manual". A set of four peptide nucleic acid (PNA) oligomers (Applied Biosystems, Foster City, Calif.) with sequences complimentary to globin mRNA were added to 2.5 ug of total RNA to reduce globin RNA transcription, then converted into cDNA using Reverse Transcriptase (Invitrogen) and a modified oligo(dT)24 primer that contains T7 promoter sequences (GenSet). After first strand synthesis, residual RNA was degraded by the addition of RNaseH and a double-stranded cDNA molecule was generated using DNA Polymerase I and DNA Ligase. The cDNA was then purified and concentrated using a phenol:chloroform extraction followed by ethanol precipitation. The cDNA products were incubated with T7 RNA Polymerase and biotinylated ribonucleotides using an In vitroTranscription kit (Affymetrix). The resultant cRNA product was purified using an RNeasy column (Qiagen) and quantified with a spectrophotometer. The cRNA target (20 ug) was incubated at 94.degree. C. for 35 minutes in fragmentation buffer (Tris, MgOAc, KOAc). The fragmented cRNA was diluted in hybridization buffer (MES, NaCl, EDTA, Tween 20, Herring Sperm DNA, Acetylated BSA) containing biotin-labeled OligoB2 and Eukaryotic Hybridization Controls (Affymetrix). The hybridization cocktail was denatured at 99.degree. C. for 5 minutes, incubated at 45.degree. C. for 5 minutes and then injected into a GeneChip cartridge. The GeneChip array was incubated at 42.degree. C. for at least 16 hours in a rotating oven at 60 rpm. GeneChips were washed with a series of nonstringent (25.degree. C.) and stringent (50.degree. C.) solutions variable amounts of MES, Tween20 and SSPE. The microarrays were then stained with Streptavidin Phycoerythrin and the fluorescent signal was amplified using a biotinylated antibody solution. Fluorescent images were detected in a GeneChip.RTM. Scanner 3000 and expression data was extracted using the GeneChip Operating System v 1.1 (Affymetrix). All GeneChips were scaled to a median intensity setting of 500.
Fluorescent images were detected in a GeneChip Scanner 3000 and expression data was extracted using the GeneChip Operating System v 1.1 (Affymetrix). All Gene-Chips were scaled to a median intensity setting of 500. Murine and human microarray data have been deposited in the NCBI GEO (accession # GSE33341).
Example 3
Deriving the Murine and Human S. aureus Classifiers
Microarray data was analyzed in two steps following the analysis strategy previously outlined and utilized. First, a Bayesian sparse factor model was fit to the expression data without regard to phenotype. Second, factors were then used as independent variables to build a penalized binary regression with variable selection model trained to identify S. aureus infection. In order to minimize issues with overfitting, batch was not included in the regression models. A Bayesian penalized regression technique was used for variable selection which allows for weighted model averaging of the resultant models, such that weights are computed from model fit on the training data. The model averaging approach incorporates uncertainty in choice of model as well as regression coefficient. This has been shown to lead to out of sample predictive accuracies that are superior to penalized maximum likelihood approaches. Assumptions for this approach are typical of probit regression including a linear response surface between predictors and the transformed latent probability variable. Genes were filtered for analysis using nonspecific filtering for genes with high mean expression and high variance across samples. Samples with a high number of outlying genes were removed during the factor analysis. Mice were batched into discrete experiments with each experiment containing the relevant controls to avoid confounding. The development and application of this methodological approach has been previously described. Using the same murine experimental data, another classifier was derived to classify methicillin resistant vs. methicillin-sensitive S. aureus infection. The methodology was otherwise the same as that described above.
A factor model was fitted on the human data independently from the mouse data. The factor model was fit to 9,109 genes after nonspecific filtering to remove unexpressed and uniformly expressed genes. Z-scores were computed independently for each gene without regard to experimental design. Subjects with absolute zscores greater than 3 in more than 5% of the genes on the array were identified as outliers and were not used to fit the factor model. The factor model was trained on the 91 samples (after removal of three outliers) from three batches of expression data, and this resulted in 79 factors. These 79 factors were then projected onto the full data set (including the three subjects removed for validation) with the goal of distinguishing S. aureus BSI from healthy controls or E. coli BSI. Leave-one-out cross-validation was utilized in order to control for overfitting of the penalized binary regression model. In order to minimize issues with overfitting, batch was not included in the regression models. Matlab (Natick, Mass., USA) scripts to perform these operations are available. Nonparametric testing was used to evaluate model performance (Wilcoxon rank sum for 2-group comparisons or Kruskal-Wallis for 3 or more-group comparisons) unless otherwise indicated.
One limitation of this approach is that the marginal significance of genes within the factor-based classifier cannot be defined. Instead, gene lists were created to identify genes with differential expression between specified groups with respect to gene-level and factor-level analyses. For 3-group comparisons (S. aureus vs. E. coli vs. Healthy controls) one-way analysis of variance (ANOVA) was used. For pairwise comparisons, Student's t-test was used. Results were statistically significant at p<0.05 after Bonferroni correction for multiple testing. Spreadsheets of gene/factor lists are provided as supplemental material.
Example 4
Creating a Human Ortholog of the Murine S. aureus Classifier
Chip Comparer available from URL: chipcomparer.genome.duke.edu/) was used to identify human orthologs for all possible mouse genes. When there were multiple orthologs, the anti-sense target probes that shared the fewest probes with other genes as identified by the probe label. Chip Comparer identified 17,600 probe sets on the Affymetrix GeneChip Human Genome U133A 2.0 Array that have orthologs in the Affymetrix GeneChip Mouse Genome 430 2.0 Array. Factor scores from the mouse factor model were estimated using this set of 17,600 genes as follows: Given a matrix of expression values, X, and a factor model X=BF+e, missing values were first replaced by mean expression levels for those genes. Step 2: Inverse regression was utilized to compute F, to estimate the factor scores. Step 3: X was estimated by computing BF* and replaced missing values with the corresponding values from this matrix. Steps 2 and 3 were then repeated until the estimates for the missing values converged.
Example 5
External Validation in an Independent Cohort
To externally validate the murine and human S. aureus classifiers, publically available expression data from a pediatric cohort with S. aureus infection and healthy controls were used. Hospitalized children with invasive S. aureus infection were enrolled with sample collection occurring after microbiological confirmation. Healthy controls included children undergoing elective surgical procedures and at healthy outpatient clinic visits. This dataset includes multiple expression platforms. For the purposes of consistency, subjects with Affymetrix U133A data yielding 46 S. aureus-infected patients and 10 healthy controls were included. Given the absence of subjects with E. coli infection in the validation cohort, new murine and human S. aureus classifiers were derived that excluded animals or subjects with E. coli infection. These classifiers were derived and then projected onto the 56-sample validation cohort as described heretofore.
Example 6
Heat Map Generation
In order to generate heat maps of gene expression, the factors from the murine and human S. aureus classifiers were used. Probes from each factor were identified and tested for differential expression in a one-way ANOVA. Probes with significantly different levels of expression after Bonferroni correction were retained. For the murine data, there were thousands of probes (.about.1000-3000, typically) meeting these criteria. Consequently, the p-values were sorted in ascending order and the 100 most significant probes from each factor were retained. Duplicate probes across the factors were removed. The human expression heat map was created in the same manner except all significant probes are presented considering there were fewer factors and genes in the human S. aureus classifier as compared to the murine classifier. Heat maps were generated using Matlab (Natick, Mass., USA).
Example 7
Pathway Analysis
Pathway analysis for functional annotation of genes was performed with the MetaCore tool of the GeneGO package (GeneGo, Inc., St. Joseph, Mich., USA) available from URL: www.genego.com). P-values were assigned to pathways based on the number of genes mapping to a particular pathway relative to the total number of genes in that pathway. Statistically significant pathways were defined as a p-value <0.05 (False Discovery Rate [FDR]-adjusted) based on hypergeometric distributions.
Example 8
Murine Sepsis Due to S. aureus and E. coli
Clinically relevant S. aureus infections in humans typically arise from a primary focus with secondary dissemination. To mimic this process, mice were inoculated via the intraperitoneal (IP) route. Infection-susceptible and infection-resistant inbred mouse strains (A/J and C57BL/6J, respectively) were inoculated with S. aureus (Sanger476) or E. coli (018:K1:H7) (n=5 per mouse strain and bacterial species). A survival analysis was carried out to determine the optimal duration of infection for subsequent experiments (FIG. 7A). Based on this data, A/J and C57BL/6J mice were infected with S. aureus (sacrificed at t=0, 2, 4, 6, and 12 hours post-infection; n=10 animals/time point) or E. coli (t=0, 2, 6, 12, and 24 hours post-infection; n=10 animals/time point). The effect of infection status, bacterial pathogen, and duration of infection on global patterns of gene expression was assessed using principal component analysis (PCA) (Partek Genomics Suite) (FIG. 7B-D). Gene expression patterns clustered by infection status and by pathogen (S. aureus vs. E. coli). Animals infected with S. aureus demonstrated a time-dependent change in gene expression that first manifested at two hours, by which time bacteremia has occurred. This pattern remained stable through 12 hours, when most animals have succumbed to sepsis. E. coli-infected animals did not reveal this time-dependent progression based on the time points sampled, but had a distinctly different pattern of gene expression that was evident at 2 hours and persisted through 24 hours following infection. A heat map depicting the time-dependent nature of these gene expression changes is presented in FIG. 8.
Example 9
Peripheral Blood Gene Expression Signatures Classify S. aureus-Infected from Uninfected Mice
To create a host gene expression-based classifier for S. aureus infection, mice from a variety of experimental conditions were utilized (n=187 total). Seven strains of inbred mice were challenged with 4 S. aureus genetic backgrounds via IP inoculation and sacrificed at various time points as described in Experimental Procedures. The comparator group for model derivation included 50 A/J or C57BL/6J mice inoculated with E. coli (018:K1:H7) as well as 54 non-inoculated mice. Whole blood mRNA was used to generate microarray expression data. A list of differentially expressed genes is presented in Tables 3-17. FIG. 9 presents the number of overlapping genes in each pairwise comparison. Patterns of co-expressing genes were defined using sparse latent factor regression in an unsupervised manner (i.e. without knowledge of the source animal's infection status). Factor models are a well-known technique for describing correlation structure in high dimension, low sample size data sets. The sparse latent factor model works by collecting genes that are highly correlated into groups. Predictive models are then built from the latent factors--vectors that describe the aggregate behavior of the group. Subsequently, these factors served as independent variables in a variable selection, binary regression model to distinguish animals with and without S. aureus infection. This approach was taken in lieu of using individual gene expression changes for several reasons. A given gene with biological relevance may be differentially expressed in response to S. aureus infection but not to the degree that would meet statistical significance. Considering this altered gene expression exists amid a network of other such changes, the collective perturbations in that particular pathway would be more easily detected using factor analysis. Furthermore, changes across multiple biological pathways will be reflected across multiple factors. These can then be collectively harnessed for their diagnostic potential using a binary regression model.
Thirty factors were identified, of which 16 demonstrated a pattern of expression significantly associated with infection status (mFactors 15, 7, 23, 13, 9, 29, 28, 2, 17, 16, 21, 1, 5, 4, 26, and 19 in order of greatest significance; ANOVA; p<0.0017 for S. aureus vs. control vs. E. coli after Bonferroni correction; FIG. 10). These 30 factors were fitted into a penalized binary regression model, termed the "murine S. aureus classifier". The best performing model, as defined by the model with the largest log likelihood value, included four factors (mFactors 7, 15, 23, and 26). Other models may be just as adequate, but this "top" model is referred to. Leave-one-out cross-validation was used to control overfitting and to estimate the model's performance in subgroups of experimental conditions as described below (mouse strain, S. aureus genetic background, duration of infection, and bacterial species [S. aureus vs. E. coli]). A schematic of the derivation and validation experiments is depicted in FIG. 1.
The Murine Derivation Cohort includes S. aureus infection (n=83), healthy control mice (n=54), and E. coli infection (n=50). It served as a validation cohort to assess Mouse Strain Effect, S. aureus Genetic Background Effect, Time Course, and to compare S. aureus vs. E. coli and E. coli vs. Healthy. The murine S. aureus classifier was externally validated in Outbred Mice (n=30) and the CAPSOD Human Cohort. The CAPSOD Human Cohort includes S. aureus BSI (n=32), healthy volunteers (n=43), and E. coli BSI (n=19). It served as a validation cohort to compare S. aureus vs. Healthy, S. aureus vs. E. coli, and E. coli vs. Healthy. Model derivation and validation using the entire cohort of animals or humans is depicted by the blue outline and arrows. An independent classifier was generated using only subjects with S. aureus or E. coli BSI (green outline). This classifier was validated using leave one out cross validation (green arrow). The Human Pediatric Cohort (n=46 S. aureus, 10 Healthy) used for external validation does not include patients with E. coli infection. Therefore, S. aureus classifiers were generated from the murine and CAPSOD cohorts that excluded E. coli data (red outline and thick red arrow). The Human Pediatric Cohort was used to derive a Human S. aureus vs. Healthy classifier which was validated in the S. aureus-infected and Healthy populations within the murine and CAPSOD human cohorts (thin red arrow).
The ability of the murine-derived host gene expression classifier to identify S. aureus infection was tested in 7 inbred mouse strains of varying infection susceptibilities. In all 7 strains, the murine S. aureus classifier accurately differentiated S. aureus-infected from control mice (p=4.89.times.10.sup.-16; AUC=0.9964) (FIG. 2A). The ability to characterize S. aureus infection persisted when A/J mice (infection-susceptible) were challenged with four different S. aureus backgrounds: USA100 (the predominant US nosocomial methicillin resistant S. aureus [MRSA] genetic background); USA300 (the predominant US community-acquired MRSA genetic background); USA400 (MW2); and Sanger 476 (a methicillin susceptible genetic background) (p=1.92.times.10.sup.-10 vs. control mice; AUC=1.00) (FIG. 2B). Furthermore, the murine S. aureus classifier consistently discriminated S. aureus infected mice from controls at 2, 4, 6, and 12 hours post-inoculation (p=4.41.times.10.sup.-16 vs. uninfected mice; AUC 1.00) (FIG. 2C). This time interval was selected because two hours is the earliest time point at which S. aureus can be cultured from blood; while 12 hours was the point at which animals began to die of S. aureus sepsis (FIG. 7A). In summary, a classifier based on murine-derived host gene expression accurately identified the presence of S. aureus infection in mice under a variety of host, pathogen, and temporal conditions.
Example 10
Murine S. aureus Classifier Distinguishes S. aureus Infected from E. coli-Infected Mice
Next, it was determined whether the murine S. aureus classifier could differentiate S. aureus from E. coli infection. Both the infection-susceptible A/J and infection-resistant C57BL/6J strains were infected with either S. aureus (Sanger 476) or E. coli (018:K1:H7). Animals were sacrificed at 2, 6, and 12 hours after inoculation. The murine S. aureus classifier correctly identified 50 of 53 (94.3%) animals as either infected with S. aureus or not at 2 hours (50/53), 100% of animals at 6 hours (n=20), and 96.7% of animals at 12 hours (29/30) (FIG. 3A). This corresponded to an overall p-value of 7.94.times.10.sup.-26 by Kruskal-Wallis test (comparing S. aureus vs. E. coli vs. Healthy controls) with an AUC of 0.9935 across all time points. Next, the murine S. aureus classifier was independently validated in outbred CD-1 mice with S. aureus infection (Sanger 476 or USA300), E. coli infection (018:K1:H7), or uninfected controls (10 animals per condition). The murine derived S. aureus model accurately classified 95% of all animals where the reference standard was the known experimental condition (38/40; p=1.47.times.10.sup.-6; 90% sensitivity and 100% specificity; AUC=0.9775) (FIG. 3B).
The murine S. aureus classifier was generated to identify S. aureus infection within a population including both healthy and E. coli infected animals. However, it is possible this classifier is primarily distinguishing "sick" from "not-sick" phenotypes. In such a case, it would be expected that the classifier would still differentiate animals with E. coli infection from uninfected controls. However, this was not observed (AUC 0.5089; p=0.8785) demonstrating the specificity of this classifier for S. aureus infection. Thus, a murine derived host gene expression classifier accurately distinguished S. aureus-infected from E. coli-infected or uninfected mice across multiple host strains, pathogens, post-infection time points, and was validated in outbred mice.
Given this ability to discriminate infection due to different bacterial species, the potential for a factor based classifier was further explored to distinguish infection due to methicillin-resistant (MRSA) or methicillin-sensitive S. aureus (MSSA), which have been shown to differ in their pathogenicity and virulence. The same 30 factors described above were fitted into a penalized binary regression model with the specific aim of differentiating MRSA from MSSA infection. Leave-one-out cross-validation was used to control overfitting and to estimate the model's performance in a population of 19 MRSA-infected and 84 MSSA-infected mice (FIG. 11). Despite some overlap, this classifier accurately differentiated infection due to MRSA or MSSA (AUC 0.8396; p=4.14.times.10.sup.-6). Genes discriminating infection due to MRSA or MSSA that remained significant after adjusting for multiple tests are presented in Table 11. Table 11 shows the probes and corresponding genes that were differentially expressed (after Bonferroni correction) in mice with MRSA vs. MSSA infection.
Example 11
Human S. aureus Classifier
It was determined whether peripheral blood gene expression in humans could yield a classifier for S. aureus BSI. Peripheral whole blood mRNA from 32 patients with S. aureus BSI, 19 patients with E. coli BSI, and 43 healthy control subjects were used to generate microarray data (Table 1). Also presented is the average probe expression in each comparator group and the fold-change within the pairwise comparison. A list of differentially expressed genes is presented in Tables 7-10. FIG. 12 presents the number of overlapping genes in each pairwise comparison. Seventy-nine factors were defined and fitted into a linear regression model trained to identify the presence of S. aureus BSI. Although 17 factors were independently associated with S. aureus BSI (FIG. 13), only two factors remained in the best performing model (hFactors 20 and 74). Similar to the murine S. aureus classifier, the human S. aureus classifier was generated blind to microbiological diagnosis in an unsupervised manner. Gender was controlled for in the model's derivation considering the predilection for female sex in E. coli BSI (Table 2). The model's performance in phenotypic subgroups was estimated using leave-one-out cross-validation. The classifier accurately differentiated those with S. aureus BSI from healthy controls (72/75 correctly classified; AUC=0.9898; p=5.41.times.10.sup.-13) (FIG. 4A). The human S. aureus classifier also correctly distinguished S. aureus from E. coli BSI in 82% (42/51) of cases (AUC=0.8372; p=6.77.times.10.sup.-4). When the human S. aureus classifier was applied to subjects with E. coli BSI vs. healthy controls, an intermediate level of discrimination (56/62 correctly classified; AUC 0.9229; p=1.38.times.10.sup.-7) was observed. This suggests that the human classifier is partially pathogen specific since E. coli BSI could also be distinguished from healthy controls but not with the same degree of accuracy as S. aureus BSI. A heat map depicting these gene expression changes is presented in FIG. 14.
In the human S. aureus classifier described above, it is the inclusion of healthy controls that drives the discrimination from S. aureus BSI. Considering the clinical importance of differentiating Gram-positive from Gram-negative infections, rather than sick vs. healthy, a penalized binary regression model was created with the specific aim of differentiating human S. aureus (n=32) from E. coli (n=19) BSI. In this cohort, 52 factors were identified (different from the 79 factors identified when Healthy was included) of which only hFactor 40 remained in the top performing model after controlling for gender. Using leave-one-out cross-validation (FIG. 4B), this model had a sensitivity of 62.5% (20/32 S. aureus BSIs correctly classified) but a specificity of 94.7% (18/19 E. coli BSIs correctly classified). This corresponds to an AUC of 0.8503 (p=3.47.times.10.sup.-5).
Example 11
A Murine S. aureus Classifier Identifies S. aureus Infection in Humans
It was determined whether the murine S. aureus classifier could identify S. aureus BSI in humans. To accomplish this, the murine S. aureus classifier was projected onto human gene expression data. Specifically, Chip Comparer (available from URL: chipcomparer.genome.duke.edu/) provided a modified representation of the Affymetrix Mouse Genome 430 2.0 Array that only included orthologs of transcripts represented on the Affymetrix Human Genome U133A 2.0 Array. This resulted in a murine S. aureus classifier consisting only of genes with human orthologs (68.6% of the total array representation). This classifier was evaluated in the human cohort. To account for potential species specific variation in gene expression, predicted probabilities were plotted on a log it rather than a probabilistic scale. Using this murine S. aureus classifier, human patients with S. aureus BSI were distinguished from healthy controls (AUC=0.9484; p=4.00.times.10.sup.-11) (FIG. 5). Thus, the host response to S. aureus infection was sufficiently conserved that a predictive model generated in one species (Mus musculus) identified S. aureus BSI in another (Homo sapiens). However, the murine-derived S. aureus classifier did not differentiate between S. aureus and E. coli BSI in humans (AUC=0.5905; p=0.2883).
Example 11
Validation of Murine and Human Classifiers in an Independent Pediatric Population
The murine and human S. aureus classifiers were externally validated in an independent human cohort. This validation cohort consisted of pediatric patients hospitalized due to invasive S. aureus infection (n=46) and healthy controls (n=10) who had gene expression data generated on a compatible platform (U133A array) with that used in this study. This cohort did not enroll children with E. coli infections. For this reason, E. coli infection was excluded from both classifiers. New murine and human S. aureus classifiers were developed in the same manner described above but without E. coli-related expression data. This modified murine S. aureus classifier was comprised of mFactors 7, 15, and 26 but not mFactor23. The modified human S. aureus classifier only contained hFactor4. Both the murine and human S. aureus classifiers differentiated children with S. aureus infection from healthy controls in this validation cohort (murine classifier AUC=0.9522, p-value=9.03.times.10.sup.-6 (FIG. 6A); human classifier AUC 0.9217, p-value 3.48.times.10.sup.-5 (FIG. 6B)). The converse was also true. A S. aureus classifier trained on this independent pediatric cohort accurately discriminated S. aureus infection from healthy controls in the CAPSOD human cohort (70/75 correctly classified; AUC=0.9775, p-value=2.03610212) and murine cohort (123/137 correctly classified; AUC=0.9255; p=4.56.times.10.sup.-17).
Example 11
S. aureus Infection Induces Similar Host Gene-Expression Responses in Mouse and Human
Pairwise comparisons were performed to identify genes with significantly different levels of expression (after Bonferroni correction). Comparisons included S. aureus infection vs. Healthy, E. coli infection vs. Healthy, and S. aureus vs. E. coli infection in mice and humans. Genes from each pairing were entered into the GeneGo pathway map database. The 50 most significant biological pathways arising from the pairwise comparisons are presented in Tables 12-16, which show the pathway analysis for the genes from pairwise comparisons in the mouse and human study. The top 50 ranked pathways from GeneGo MetaCore pathway analysis based upon p-value are shown. Pathways marked with an asterisk (*) correspond to pathways that are present in both the mouse and human response to the specified pathogen. The genes represented within common pathways are presented in Table 17. Table 17 shows the genes in pathways common to murine and human responses to infection. Human genes are in the top row for each pathway. Murine genes are in the bottom row for each pathway.
A similar number of pathways overlapped between the murine and human responses to S. aureus (12 of the top 50) and E. coli (14 of the top 50) infection. Most of the overlapping pathways in the murine and human responses to both S. aureus and E. coli belonged to the broad category of immune response including CD28, ICOS, and the MEF2 pathway. Cytoskeletal remodeling (TGF and WNT) and apoptosis were also common to both infection types in mice and humans. Some pathways were highly significant in the S. aureus vs. Healthy comparison but not manifest in E. coli vs. Healthy such as NF-kB-associated pathways; the CD40 immune response pathway; and clathrin-coated vesicle transport. As expected, these pathways were also differentially manifest in the direct comparison of murine S. aureus and E. coli infection. No statistically significant probes were identified that distinguished human S. aureus from E. coli BSI. One probe, corresponding to the F2RL3 gene, nearly met this statistical cutoff (p-value 5.94.times.10.sup.-6 with a cutoff of 2.24.times.10.sup.-6). F2RL3 encodes proteinase-activated receptor 4. This molecule is a G-protein coupled receptor activated by thrombin and trypsin but has not previously been implicated in the sepsis or immune response. It is expressed in multiple tissues with high levels in the lung, pancreas, thyroid, testis, and small intestine but not peripheral blood or lymphoid tissues.
Example 12
Discussion of Examples 1-11
The current investigation contributes to this goal through three key findings. First, S. aureus infection induces conserved host gene expression responses in mice that can differentiate from E. coli-infected or uninfected mice. This discovery was consistent and robust across multiple inbred mouse strains, S. aureus genetic backgrounds, time points, and was validated in outbred mice. The validation step strengthens generalizability and is an important improvement over previous murine gene-expression based classifiers that were developed and tested in only a single inbred mouse strain including the fields of infectious diseases; cancer progression; and aging. Furthermore, this murine predictor was specific for S. aureus infection and not simply a marker of illness based on the observation that mice with E. coli sepsis could not be distinguished from healthy, uninfected animals. The murine S. aureus classifier performed equally well at multiple time points despite progression of illness lending additional support to the specificity of this classifier. Second, human-derived host gene expression signatures differentiated S. aureus BSI from E. coli BSI or uninfected controls. In contrast to the murine-based classifier, the human-based model was less pathogen specific but still provided a significant degree of differentiation between S. aureus and E. coli BSI. Finally, the responses to S. aureus infection were highly conserved at the transcriptional and pathway level. This conserved response allowed the validation of the murine- and human-derived S. aureus classifiers in an independent cohort of S. aureus-infected patients.
Previous efforts to identify a discriminatory host gene expression signature for Gram-positive versus Gram-negative infections have yielded inconsistent results. This is likely due to the observation that transcriptional data derived from complex phenotypes such as infection do not produce just one predictive gene set, but rather generate multiple gene sets associated with the phenotype in question. In the current investigation, well-established methodologies were utilized to derive predictors for S. aureus infection in both mice and humans from gene expression data. A key component of this methodology was a dimensional reduction step generating sets of co-expressed genes, termed "factors." Multiple, individual factors differentiated between various infection states were observed although none performed universally well. For example, mFactor15 was associated with the lowest overall p-value during model generation. The AUC was 0.9587 for S. aureus vs. uninfected control mice but only 0.7942 for S. aureus vs. E. coli. In contrast, mFactor23 had an AUC of 0.9800 for S. aureus vs. E. coli but an AUC of 0.5926 for S. aureus vs. uninfected control mice. In order to generate a more robust classifier, factors were used as independent variables to generate a binary regression model. Factor models are an excellent technique for estimating correlation structure in very high dimensional data sets. This comprised the second step in generating the S. aureus predictors. It was only by including all factors to build the classifier that the model could be validated in the broadest set of conditions including different bacterial pathogens. Although redundancy among the genes in a molecular classifier is expected and is a potential limitation, such redundancy can also improve robustness for a specific phenotype as is likely to be the case in discriminating S. aureus from E. coli infection in mice. Comparisons at the individual gene level, as with pairwise comparisons, are likely to reveal differences in relatively simple biological responses. In contrast, dimension reduction with factor modeling as utilized in this study incorporates differences across multiple pathways, allowing for the detection of changes in a more complex pathobiology. Additionally, the factor model construction does not incorporate known biological pathways. This leads to gene groupings that are sometimes difficult to interpret. The advantage of the approach is the extreme dimension reduction which allows for discovery and cross-validation on very small data sets. This is one possible explanation for why the human S. aureus classifier differentiated S. aureus from E. coli whereas no genes met the threshold for differential expression after Bonferroni correction in a pairwise comparison between these two patient populations. The strength of this approach is offset by the possibility that smaller or transient changes in gene expression might be missed. Furthermore, there are likely many combinations of genes and factors that would perform similarly to that described here. This study presents findings related to the best performing classifier using the described methodologies.
The murine model has been effectively used to gain insights into the pathophysiology of sepsis in general and S. aureus in particular. Murine-derived gene expression signatures have also been successfully translated to non-infectious human conditions such as radiation exposure and breast cancer. Here, the robust performance of a murine-derived S. aureus classifier in both mice and humans was described and also offer several lines of evidence supporting a partially conserved host response to S. aureus infection in both host species. First, the murine-based predictor could differentiate human S. aureus BSI from uninfected controls. Second, the genetic pathways were highly conserved. For example, most of the relevant murine pathways were also significantly associated with S. aureus BSI in humans. Finally, the murine-based predictor was highly accurate in classifying S. aureus infection in an independent human cohort.
The data presented here also indicates that the S. aureus classifiers are not being driven by lineage-specific transcript abundance. Specifically, the total leukocyte count and cell lineage distribution (based on routine automated differential measurements) were not different between patients with S. aureus infection and E. coli infection (15.7.times.10.sup.9/L with 86.2% neutrophils vs. 14.1.times.10.sup.9/L with 85.8% neutrophils, respectively). However, the human S. aureus classifier was still able to differentiate infection due to the two pathogens. The murine S. aureus classifier was highly successful in differentiating S. aureus infection from healthy and from E. coli infection yet was unable to differentiate E. coli from healthy. This result would not be expected if transcript abundance was driving the derivation of the classifier.
The overlap observed in the gene expression response to S. aureus infection in mouse and human was also consistent with published studies. NF-kB signaling pathways have been identified as a critical component of the murine response to infection, which was mirrored in the murine and human data presented here. Similar gene expression-based analyses of the human response to bacterial infection have also revealed the importance of other biological pathways including MHC class I and II antigen presentation, immunological synapse formation, TGF-b receptor signaling, TGF and WNT-dependent cytoskeleton remodeling, and T-cell receptor signaling, all of which were significantly associated with S. aureus infection in this study. Hence, mice and humans utilize many of the same or overlapping pathways in response to bacterial sepsis supporting the potential utility of murine-based diagnostics for human disease.
Example 13
Gene Subsets for Diagnostic Assay
The mouse factors 7, 15, 23 and 26 together classify mice infected with S. aureus as distinct from healthy mice with an area-under-the-curve (AUC or classification accuracy) of 0.996 (where 1 is perfect). In another scenario, mouse factors 7, 15, and 26 translated to their human equivalent are sufficient to distinguish between humans infected with S. aureus and those who are healthy with an AUC of 0.9484.
In order to determine the subset of genes used in a diagnostic test, the relative contribution each gene makes to the factor's classification performance will be determined. Specifically, the number of genes required to achieve greater than 90%, 95%, 97%, and 99% of the factor's classification performance will be defined. Depending on the number of genes necessary to achieve these performance levels, a more limited gene set for diagnostic test development may be used.
An overview of the steps necessary for diagnostic test development is as follows: the optimal subset of genes will be identified from the presented factors that retains classification performance (as described above). As an example, the 200 top performing genes from each murine factor are presented. mRNA-specific probes will be generated for each. Patients with known diagnoses will be tested to verify the selected gene's mRNA can be detected by PCR or some other detection platform. Target gene expression will be measured relative to internal controls. Subsequently, an algorithm will produce a score or probability of S. aureus infection. Thresholds will be defined, above and below which a diagnosis will be made. This report would then be reported to the user.
It is understood that the foregoing detailed description and accompanying examples are merely illustrative and are not to be taken as limitations upon the scope of the invention, which is defined solely by the appended claims and their equivalents.
Various changes and modifications to the disclosed embodiments will be apparent to those skilled in the art. Such changes and modifications, including without limitation those relating to the chemical structures, substituents, derivatives, intermediates, syntheses, compositions, formulations, or methods of use of the invention, may be made without departing from the spirit and scope thereof.
Any patents or publications mentioned in this specification are indicative of the levels of those skilled in the art to which the invention pertains. These patents and publications are herein incorporated by reference to the same extent as if each individual publication was specifically and individually indicated to be incorporated by reference.
One skilled in the art will readily appreciate that the present invention is well adapted to carry out the objects and obtain the ends and advantages mentioned, as well as those inherent therein. The present examples along with the methods described herein are presently representative of preferred embodiments, are exemplary, and are not intended as limitations on the scope of the invention. Changes therein and other uses will occur to those skilled in the art which are encompassed within the spirit of the invention as defined by the scope of the claims.
TABLE-US-00001 TABLE 1 Subject Source of Positive Culture PMN Subject Category Race Age Gender Infection Sources WBC % S1 S. aureus White 82 Male Endocarditis Blood 23.6 96.4 S2 S. aureus White 70 Female Skin Blood, Wound, 11.6 N/A.sup.a Operative cultures S3 S. aureus Black 41 Male Catheter.sup.b Blood 14.8 N/A S4 S. aureus White 81 Male Skin Blood, Pleural fluid 16.2 N/A S5 S. aureus White 81 Male Bone Blood 17.3 N/A S6 S. aureus Black 55 Male Catheter Blood, Vascular 14.3 89.8 catheter site S7 S. aureus Black 69 Female Catheter Blood 13 N/A S8 S. aureus Black 44 Female Catheter Blood 13 90 S9 S. aureus Black 51 Male Skin Blood 6.9 73 S10 S. aureus Black 47 Male Skin Blood 12 87 S11 S. aureus White 36 Female Endocarditis Blood 22.7 85 S12 S. aureus White 54 Male Bone Blood 9.8 88 S13 S. aureus Black 55 Male Bone Blood, Skin, 18.3 87 Synovial fluid S14 S. aureus Black 42 Male Unknown Blood, Urine, 7.6 82 Sputum S15 S. aureus Black 52 Male Bone Blood 10.9 79 S16 S. aureus Black 55 Male Bone Blood, Skin 28.6 95 S17 S. aureus White 52 Male Skin Blood, Skin 17.9 84 S18 S. aureus N/A 51 Female Lung Blood 19.8 78 S19.sup.c S. aureus Black 40 Male Skin Blood, Skin 14.7 93 S20 S. aureus White 60 Male Skin Blood N/A N/A S21 S. aureus Black 59 Male Catheter Blood 7.5 75.5 S22 S. aureus Black 58 Male Bone Blood 27.9 N/A S23 S. aureus Black 77 Male Urinary tract Blood, Urine, Skin 9.8 80.3 S24 S. aureus Black 91 Male Bone Blood 15.1 93 S25 S. aureus White 75 Female Catheter Blood 6 92 S26 S. aureus Black 58 Male Catheter Blood 23.9 87 S27 S. aureus Black 24 Male Urinary tract Blood, Urine, 16 76.4 Sputum S28 S. aureus White 74 Male Skin Blood, Abscess 33.2 89 529.sup.c S. aureus Black 70 Male Skin Blood 19.6 82 S30 S. aureus White 61 Male Bone/CNS.sup.d Blood, Abscess 10.4 86 S31 S. aureus Black 52 Male Lung Blood (S. aureus); 6.1 93 Antigen test (S. pneumoniae) S32 S. aureus Black 38 Male Endocarditis Blood 16.8 94 E1 E. coli Black 43 Female Urinary tract Blood, Urine 32.6 87.3 E2 E. coli White 49 Female Urinary tract Blood 14 92.4 E3 E. coli Black 44 Female Urinary tract Blood, Urine 15.7 N/A E4 E. coli White 70 Female Urinary tract Blood, Urine 20.7 88 E5 E. coli Black 40 Male Urinary tract Blood, Urine 15 83 E6 E. coli White 91 Female Urinary tract Blood, Urine 5.6 N/A E7 E. coli Black 25 Female Urinary tract Blood, Urine 11.1 88 E8 E. coli White 62 Male Urinary tract Blood, Urine 13.3 N/A E9 E. coli Black 70 Male Urinary tract Blood 2.4 94 E10 E. coli Black 32 Female Urinary tract Blood, Urine 25.1 N/A E11 E. coli White 54 Female Urinary tract Blood, Urine 10.8 90 E12 E. coli White 74 Female Urinary tract Blood, Urine 7.3 97 E13 E. coli Black 79 Female Lung Blood 16.9 77 E14 E. coli Black 41 Male Urinary tract Blood, Urine 14.3 77.6 E15 E. coli White 65 Male Urinary tract Blood, Urine 21.6 85 E16 E. coli White 63 Female Urinary tract Blood, Urine 8.5 N/A E17 E. coli White 81 Female Urinary tract Blood, Urine 14.1 86.5 E18 E. coli Black 69 Female Urinary tract Blood, Urine 11.1 67.6 E19 E. coli White 55 Female Urinary tract Blood, Urine 7.2 87.5 H1 Healthy Black 27 Male H2 Healthy White 24 Female H3 Healthy White 29 Female H4 Healthy White 26 Male H5 Healthy Asian 30 Male H6 Healthy Black 24 Male H7 Healthy White N/A Male H8 Healthy Asian 24 Male H9 Healthy Asian 23 Male H10 Healthy White 50 Female H11 Healthy White 23 Female H12 Healthy White 24 Female H13 Healthy White 44 Male H14 Healthy White 24 Female H15 Healthy White 28 Female H16 Healthy White 26 Male H17 Healthy Asian 30 Female H18 Healthy Black 26 Male H19 Healthy White 25 Male H20 Healthy White 24 Male H21 Healthy White 24 Male H22 Healthy Asian 25 Female H23 Healthy Black 24 Female H24 Healthy White 43 Female H25 Healthy White 26 Female H26 Healthy Black 59 Male H27 Healthy Black 25 Female H28 Healthy White 24 Male H29 Healthy White 25 Male H30 Healthy White 26 Male H31 Healthy White 24 Male H32 Healthy White 26 Male H33 Healthy N/A 25 Male H34 Healthy White 53 Female H35 Healthy Black 45 Female H36 Healthy White 23 Male H37 Healthy White 26 Female H38 Healthy White 27 Male H39 Healthy Asian 43 Female H40 Healthy Black 32 Female H41 Healthy N/A 25 Female H42 Healthy Black 43 Female H43 Healthy White N/A Female .sup.aN/A -- Not available. .sup.bCatheter refers to vascular catheters. .sup.cGene expression data for S19 and S29 was generated from blood drawn on the second hospital day. Blood drawn on the day of admission was otherwise used for all other infected subjects. .sup.dThis subject had vertebral osteomyelitis associated with an epidural abscess.
TABLE-US-00002 TABLE 2 Characteristics of human subjects used for S. aureus classifier derivation. S. aureus Gram-negative Healthy (n = 32) (n = 19) (n = 43) Age in years, mean .sup. 58 (24-91) .sup. 58 (25-91) .sup. 30 (23-59) (range) Gender, n (%) Female 6 (19) 14 (74) 21 (49) Male 26 (81) 5 (26) 22 (51) Race, n (%) Black 20 (63) 9 (47) 9 (21) White 11 (34) 10 (53) 26 (60) Asian 0 0 6 (14) Unknown 1 (3) 0 2 (5) Dialysis, n (%) 12 (38) 0 0 Diabetes, n (%) 13 (41) 3 (16) 0 Immunosuppression, 2 (6) 2 (11) 0 n (%)
TABLE-US-00003 TABLE 3 Mouse Factor 7 PROBE ID SYMBOL GENE NAME 1415741_at Tmem165 transmembrane protein 165 1415856_at Emb embigin 1415899_at Junb Jun-B oncogene 1416010_a_at Ehd1 EH-domain containing 1 1416035_at Hif1a hypoxia inducible factor 1 alpha subunit 1416119_at Txn1 thioredoxin 1 1416249_at Nadk NAD kinase 1416281_at Wdr45l Wdr45 like 1416360_at Snx18 sorting nexin 18 1416378_at Pnkp polynucleotide kinase 3'-phosphatase 1416381_a_at Prdx5 peroxiredoxin 5 1416440_at Cd164 CD164 antigen 1416442_at Ier2 immediate early response 2 1416522_a_at Grcc10 gene rich cluster C10 gene 1416527_at Rab32 RAB32 member RAS oncogene family 1416654_at Slc31a2 solute carrier family 31 member 2 1416983_s_at Foxo1 forkhead box O1 1417068_a_at Ptpn1 protein tyrosine phosphatase non-receptor type 1 1417190_at Nampt nicotinamide phosphoribosyltransferase 1417230_at Ralgps2 Ral GEF with PH domain and SH3 binding motif 2 1417408_at F3 coagulation factor III 1417409_at Jun Jun oncogene 1417478_a_at Ppp2r3c protein phosphatase 2 regulatory subunit B'' gamma 1417564_at Med7 mediator complex subunit 7 1417730_at Ext1 exostoses (multiple) 1 1418154_at N4bp1 NEDD4 binding protein 1 1418300_a_at Mknk2 MAP kinase-interacting serine/threonine kinase 2 1418465_at Ncf4 neutrophil cytosolic factor 4 1418539_a_at Ptpre protein tyrosine phosphatase receptor type E 1418797_at Ms4a8a membrane-spanning 4-domains subfamily A member 8A 1418847_at Arg2 arginase type II 1418992_at F10 coagulation factor X 1418993_s_at F10 coagulation factor X 1419004_s_at NA NA 1419006_s_at Peli2 pellino 2 1419178_at Cd3g CD3 antigen gamma polypeptide 1419180_at Bcl9l B-cell CLL/lymphoma 9-like 1419208_at Map3k8 mitogen-activated protein kinase kinase kinase 8 1419627_s_at Clec4n C-type lectin domain family 4 member n 1419691_at Camp cathelicidin antimicrobial peptide 1419766_at Sik1 salt inducible kinase 1 1420012_at Xbp1 X-box binding protein 1 1420197_at Gadd45b growth arrest and DNA-damage-inducible 45 beta 1420631_a_at Blcap bladder cancer associated protein homolog (human) 1420867_at Tmed2 transmembrane emp24 domain trafficking protein 2 1420868_s_at Tmed2 transmembrane emp24 domain trafficking protein 2 1421235_s_at Recql5 RecQ protein-like 5 1421326_at Csf2rb colony stimulating factor 2 receptor beta low-affinity (granulocyte-macrophage) 1421411_at Pstpip2 proline-serine-threonine phosphatase-interacting protein 2 1421547_at Cd180 CD180 antigen 1422084_at Bmx BMX non-receptor tyrosine kinase 1422506_a_at Cstb cystatin B 1422508_at Atp6v1a ATPase H+ transporting lysosomal V1 subunit A 1422791_at Pafah1b2 platelet-activating factor acetylhydrolase isoform 1b subunit 2 1423100_at Fos FBJ osteosarcoma oncogene 1423135_at Thy1 thymus cell antigen 1 theta 1423213_at Plxnc1 plexin C1 1423326_at Entpd1 ectonucleoside triphosphate diphosphohydrolase 1 1423346_at Degs1 degenerative spermatocyte homolog 1 (Drosophila) 1423411_at Rbm47 RNA binding motif protein 47 1423722_at Vmp1 vacuole membrane protein 1 1423904_a_at Pvr poliovirus receptor 1423996_a_at Il4ra interleukin 4 receptor alpha 1424256_at Rdh12 retinol dehydrogenase 12 1424302_at Lilrb3 leukocyte immunoglobulin-like receptor subfamily B (with TM and ITIM domains) member 3 1424424_at Slc39a1 solute carrier family 39 (zinc transporter) member 1 1424444_a_at 1600014C10Rik RIKEN cDNA 1600014C10 gene 1424509_at Cd177 CD177 antigen 1424996_at Cflar CASP8 and FADD-like apoptosis regulator 1425406_at Clec4a2 C-type lectin domain family 4 member a2 1425587_a_at Ptprj protein tyrosine phosphatase receptor type J 1425674_a_at Ssu72 Ssu72 RNA polymerase II CTD phosphatase homolog (yeast) 1425822_a_at Dtx1 deltex 1 homolog (Drosophila) 1426227_s_at Vps37c vacuolar protein sorting 37C (yeast) 1426370_at Far1 fatty acyl CoA reductase 1 1426440_at Dhrs7 dehydrogenase/reductase (SDR family) member 7 1426575_at Sgms1 sphingomyelin synthase 1 1426600_at Slc2a1 solute carrier family 2 (facilitated glucose transporter) member 1 1426680_at Sepn1 selenoprotein N1 1426786_s_at Dhx38 DEAH (Asp-Glu-Ala-His) box polypeptide 38 1426808_at Lgals3 lectin galactose binding soluble 3 1427164_at Il13ra1 interleukin 13 receptor alpha 1 1427327_at Pilra paired immunoglobin-like type 2 receptor alpha 1427683_at Egr2 early growth response 2 1428094_at Lamp2 lysosomal-associated membrane protein 2 1428191_s_at Mettl17 methyltransferase like 17 1428381_a_at Ppdpf pancreatic progenitor cell differentiation and proliferation factor homolog (zebrafish)RIKEN cDNA 2700038C09 gene 1428466_at Chd3 chromodomain helicase DNA binding protein 3 1428579_at Fmnl2 formin-like 2 1428663_at Sgms2 sphingomyelin synthase 2 1428749_at Dmxl2 Dmx-like 2 1428750_at Cdc42ep2 CDC42 effector protein (Rho GTPase binding) 2 1428781_at Dmkn dermokine 1428902_at Chst11 carbohydrate sulfotransferase 11 1428985_at Ints12 integrator complex subunit 12 1429352_at Mocos molybdenum cofactor sulfurase 1429503_at Fam69a family with sequence similarity 69 member A 1429527_a_at Plscr1 phospholipid scramblase 1 1429782_at Grcc10 gene rich cluster C10 gene 1429889_at Faim3 Fas apoptotic inhibitory molecule 3 1430289_a_at Wdr77 WD repeat domain 77 1431339_a_at Efhd2 EF hand domain containing 2 1433634_at Irf2bp2 interferon regulatory factor 2 binding protein 2 1433699_at Tnfaip3 tumor necrosis factor alpha-induced protein 3 1433968_a_at Megf9 multiple EGF-like-domains 9 1434015_at Slc2a6 solute carrier family 2 (facilitated glucose transporter) member 6 1434025_at NA NA 1434310_at Bmpr2 bone morphogenic protein receptor type II (serine/threonine kinase) 1434334_at Prkd2 protein kinase D2 1434378_a_at Mxd4 Max dimerization protein 4 1434402_at Samd8 sterile alpha motif domain containing 8 1434418_at Lass6 LAG1 homolog ceramide synthase 6 1434758_at Crispld2 cysteine-rich secretory protein LCCL domain containing 2 1434774_at Rhbdf2 rhomboid 5 homolog 2 (Drosophila) 1434920_a_at Evl Ena-vasodilator stimulated phosphoprotein 1435260_at Akt3 thymoma viral proto-oncogene 3 1435477_s_at Fcgr2b Fc receptor IgG low affinity IIb 1435546_a_at 1810013L24Rik RIKEN cDNA 1810013L24 gene 1436499_at Sgms1 sphingomyelin synthase 1 1436590_at Ppp1r3b protein phosphatase 1 regulatory (inhibitor) subunit 3B 1436819_at SEPT6 septin 6 1437152_at Mex3b mex3 homolog B (C. elegans) 1437313_x_at Hmgb2 high mobility group box 2 1437421_at 6330509M05Rik RIKEN cDNA 6330509M05 gene 1438796_at Nr4a3 nuclear receptor subfamily 4 group A member 3 1438855_x_at Tnfaip2 tumor necrosis factor alpha-induced protein 2 1439814_at Atp8b4 ATPase class I type 8B member 4 1440458_at Cmah cytidine monophospho-N-acetylneuraminic acid hydroxylase 1442122_at AI451458 expressed sequence AI451458 1444122_at Sycp2 synaptonemal complex protein 2 1445687_at Gm885 predicted gene 885 1447685_x_at Ets2 E26 avian leukemia oncogene 2 3' domain 1448123_s_at Tgfbi transforming growth factor beta induced 1448213_at Anxa1 annexin A1 1448231_at Fkbp5 FK506 binding protein 5 1448297_a_at Tnk2 tyrosine kinase non-receptor2 1448333_at Adprh ADP-ribosylarginine hydrolase 1448443_at Serpini1 serine (or cysteine) peptidase inhibitor clade I member 1 1448462_at Tdg thymine DNA glycosylase 1448561_at Ncf2 neutrophil cytosolic factor 2 1448573_a_at Ceacam10 carcinoembryonic antigen-related cell adhesion molecule 10 1448618_at Mvp major vault protein 1448700_at G0s2 G0/G1 switch gene 2 1448724_at Cish cytokine inducible SH2-containing protein 1448993_at Atg3 autophagy-related 3 (yeast) 1449028_at Rhou ras homolog gene family member U 1449037_at Crem cAMP responsive element modulator 1449184_at Pglyrp1 peptidoglycan recognition protein 1 1449310_at Ptger2 prostaglandin E receptor 2 (subtype EP2) 1449317_at Cflar CASP8 and FADD-like apoptosis regulator 1449336_a_at Slk STE20-like kinase (yeast) 1449731_s_at Nfkbia nuclear factor of kappa light polypeptide gene enhancer in B-cells inhibitor alpha 1450081_x_at Gpi1 glucose phosphate isomerase 1 1450214_at Adora2b adenosine A2b receptor 1450829_at Tnfaip3 tumor necrosis factor alpha-induced protein 3 1451037_at Ptpn9 protein tyrosine phosphatase non-receptor type 9 1451201_s_at Rnh1 ribonuclease/angiogenin inhibitor 1 1451335_at Plac8 placenta-specific 8 1451340_at Arid5a AT rich interactive domain 5A (MRF1-like) 1451507_at Mef2c myocyte enhancer factor 2C 1451537_at CM3l1 chitinase 3-like 1 1451775_s_at Il13ra1 interleukin 13 receptor alpha 1 1452197_at Smc4 structural maintenance of chromosomes 4 1452237_at Agfg1 ArfGAP with FG repeats 1 1452301_at Aldh3b1 aldehyde dehydrogenase 3 family member B1 1452732_at Asprv1 aspartic peptidase retroviral-like 1 1453009_at Cpm carboxypeptidase M 1453851_a_at Gadd45g growth arrest and DNA-damage-inducible 45 gamma 1454654_at Dirc2 disrupted in renal carcinoma 2 (human) 1454713_s_at Hdc histidine decarboxylase 1454799_at Agpat9 1-acylglycerol-3-phosphate O-acyltransferase 9 1454897_at 6330509M05Rik RIKEN cDNA 6330509M05 gene 1455009_at Cpd carboxypeptidase D 1455081_at Txnl4b thioredoxin-like 4B 1455170_at 2810001G20Rik RIKEN cDNA 2810001G20 gene 1455197_at Rnd1 Rho family GTPase 1 1455229_x_at Pgs1 phosphatidylglycerophosphate synthase 1 1455332_x_at Fcgr2b Fc receptor IgG low affinity IIb 1455353_at Tmcc1 transmembrane and coiled coil domains 1 1455405_at Pstpip2 proline-serine-threonine phosphatase-interacting protein 2 1455658_at Cggbp1 CGG triplet repeat binding protein 1 1455660_at Csf2rb colony stimulating factor 2 receptor beta low-affinity (granulocyte-macrophage) 1455665_at Lonrf1 LON peptidase N-terminal domain and ring finger 1 1455860_at Pigh phosphatidylinositol glycan anchor biosynthesis class H 1456028_x_at Marcks myristoylated alanine rich protein kinase C substrate 1456055_x_at Pold1 polymerase (DNA directed) delta 1 catalytic subunit 1457035_at AI607873 expressed sequence AI607873 1457708_at Mbd4 methyl-CpG binding domain protein 4 1457728_at Fam129c family with sequence similarity 129 member C 1458206_at NA NA 1458351_s_at NA NA 1459522_s_at Gyg glycogenin 1459903_at Sema7a sema domain immunoglobulin domain (Ig) and GPI membrane anchor (semaphorin) 7A 1460006_at Zfhx3 zinc finger homeobox 3 1460116_s_at Spred1 sprouty protein with EVH-1 domain 1 related sequence 1460227_at Timp1 tissue inhibitor of metalloproteinase 1 1460251_at Fas Fas (TNF receptor superfamily member 6) 1460282_at Trem1 triggering receptor expressed on myeloid cells 1 1460329_at B4galt6 UDP-Gal: betaGlcNAc beta 14-galactosyltransferase polypeptide 6 1460335_at Lysmd3 LysM putative peptidoglycan-binding domain containing 3
TABLE-US-00004 TABLE 4 Mouse Factor 15 PROBE ID SYMBOL GENE NAME 1415741_at Tmem165 transmembrane protein 165 1415871_at Tgfbi transforming growth factor beta induced 1415922_s_at Marcksl1 MARCKS-like 1 1416010_a_at Ehd1 EH-domain containing 1 1416298_at Mmp9 matrix metallopeptidase 9 1416359_at Snx18 sorting nexin 18 1416369_at Hiatl1 hippocampus abundant transcript-like 1 1416381_a_at Prdx5 peroxiredoxin 5 1416472_at Syap1 synapse associated protein 1 1416522_a_at Grcc10 gene rich cluster C10 gene 1416576_at Socs3 suppressor of cytokine signaling 3 1416908_s_at Tsn translin 1417191_at Dnajb9 DnaJ (Hsp40) homolog subfamily B 1417250_at Rlim ring finger protein LIM domain interacting member 9 1417266_at Ccl6 chemokine (C-C motif) ligand 6 1417288_at Plekha2 pleckstrin homology domain-containing family A (phosphoinositide binding specific) member 2 1417291_at Tnfrsf1a tumor necrosis factor receptor superfamily member 1a 1417297_at Itpr3 inositol 14 1417434_at Gpd2 glycerol phosphate dehydrogenase 2 mitochondrial5- triphosphate receptor 3 1417457_at Cks2 CDC28 protein kinase regulatory subunit 2 1417483_at Nfkbiz nuclear factor of kappa light polypeptide gene enhancer in B-cells inhibitor zeta 1417508_at Rnf19a ring finger protein 19A 1417542_at Rps6ka2 ribosomal protein S6 kinase polypeptide 2 1417544_a_at Flot2 flotillin 2 1417566_at Abhd5 abhydrolase domain containing 5 1417586_at Timeless timeless homolog (Drosophila) 1417588_at Galnt3 UDP-N-acetyl-alpha-D-galactosamine: polypeptide N- acetylgalactosaminyltransferase 3 1417730_at Ext1 exostoses (multiple) 1 1418054_at Neurod4 neurogenic differentiation 4 1418133_at Bcl3 B-cell leukemia/lymphoma 3 1418154_at N4bp1 NEDD4 binding protein 1 1418300_a_at Mknk2 MAP kinase-interacting serine/threonine kinase 2 1418398_a_at Tspan32 tetraspanin 32 1418465_at Ncf4 neutrophil cytosolic factor 4 1418576_at Yipf5 Yip1 domain family member 5 1418578_at Dgka diacylglycerol kinase alpha 1418992_at F10 coagulation factor X 1418993_s_at F10 coagulation factor X 1419208_at Map3k8 mitogen-activated protein kinase kinase kinase 8 1419406_a_at Bcl11a B-cell CLL/lymphoma 11A (zinc finger protein) 1419432_at Spam1 sperm adhesion molecule 1 1419998_at NA NA 1420197_at Gadd45b growth arrest and DNA-damage-inducible 45 beta 1420394_s_at NA NA 1420498_a_at Dab2 disabled homolog 2 (Drosophila) 1420631_a_at Blcap bladder cancer associated protein homolog (human) 1421065_at Jak2 Janus kinase 2 1421326_at Csf2rb colony stimulating factor 2 receptor beta 1421479_at Zfp318 zinc finger protein 318 low-affinity (granulocyte- macrophage) 1421895_at NA NA 1422491_a_at Bnip2 BCL2/adenovirus E1B interacting protein 2 1422507_at Cstb cystatin B 1422508_at Atp6v1a ATPase H+ transporting 1422953_at Fpr2 formyl peptide receptor 2 lysosomal V1 subunit A 1423053_at Arf4 ADP-ribosylation factor 4 1423326_at Entpd1 ectonucleoside triphosphate diphosphohydrolase 1 1423345_at Degs1 degenerative spermatocyte homolog 1 (Drosophila) 1423558_at Ifngr2 interferon gamma receptor 2 1423588_at Arpc4 actin related protein 2/3 complex subunit 4 1423596_at Nek6 NIMA (never in mitosis gene a)-related expressed kinase 6 1423612_at Clp1 CLP1 cleavage and polyadenylation factor I subunit 1423989_at Tecpr1 tectonin beta-propeller repeat containing 1 homolog (S. cerevisiae) 1424141_at Hectd1 HECT domain containing 1 1424444_a_at 1600014C10Rik RIKEN cDNA 1600014C10 gene 1424724_a_at D16Ertd472e DNA segment Chr 16 1424727_at Ccr5 chemokine (C-C motif) receptor 5 ERATO Doi 472 expressed 1424779_at Reep3 receptor accessory protein 3 1424852_at Mef2c myocyte enhancer factor 2C 1424990_at Orai1 ORAI calcium release-activated calcium modulator 1 1425289_a_at Cr2 complement receptor 2 1425485_at Mtmr6 myotubularin related protein 6 1425486_s_at Mtmr6 myotubularin related protein 6 1425493_at Bmpr1a bone morphogenetic protein receptor type 1A 1425611_a_at Cux1 cut-like homeobox 1 1425706_a_at Ddb2 damage specific DNA binding protein 2 1426369_at Far1 fatty acyl CoA reductase 1 1426373_at Ski ski sarcoma viral oncogene homolog (avian) 1426377_at Zfp281 zinc finger protein 281 1426390_a_at Arf1 ADP-ribosylation factor 1 1426473_at Dnajc9 DnaJ (Hsp40) homolog subfamily C 1426550_at Sidt1 SID1 transmembrane family member 1 member 9 1426565_at Igf1r insulin-like growth factor I receptor 1426818_at Arrdc4 arrestin domain containing 4 1426977_at Usp47 ubiquitin specific peptidase 47 1427164_at Il13ra1 interleukin 13 receptor alpha 1 1427532_at Trat1 T cell receptor associated transmembrane adaptor 1 1427689_a_at Tnip1 TNFAIP3 interacting protein 1 1428141_at Gga2 golgi associated gamma adaptin ear containing 1428191_s_at Mettl17 methyltransferase like 17 ARF binding protein 2 1428207_at Bcl7a B-cell CLL/lymphoma 7A 1428214_at Tomm7 translocase of outer mitochondrial membrane 7 homolog (yeast) 1428381_a_at Ppdpf pancreatic progenitor cell differentiation and proliferation factor homolog (zebrafish)RIKEN cDNA 2700038C09 gene 1428545_at 0610007L01Rik RIKEN cDNA 0610007L01 gene 1428579_at Fmnl2 formin-like 2 1428669_at Bmyc brain expressed myelocytomatosis oncogene 1429321_at Rnf149 ring finger protein 149 1429400_at Clcn5 chloride channel 5 1433864_at Lrp12 low density lipoprotein-related protein 12 1433939_at Aff3 AF4/FMR2 family member 3 1433943_at NA NA 1434054_at NA NA 1434123_at Fut11 fucosyltransferase 11 1434175_s_at Tecpr1 tectonin beta-propeller repeat containing 1 1434402_at Samd8 sterile alpha motif domain containing 8 1434521_at Rfx7 regulatory factor X7 1434547_at Cpd carboxypeptidase D 1434573_at Traf3ip3 TRAF3 interacting protein 3 1434705_at Ctbp2 C-terminal binding protein 2 1435260_at Akt3 thymoma viral proto-oncogene 3 1435517_x_at Ralb v-ral simian leukemia viral oncogene homolog B (ras related) 1435793_at Aph1b anterior pharynx defective 1b homolog (C. elegans) 1436511_at BC031781 cDNA sequence BC031781 1436921_at Atp7a ATPase Cu++ transporting 1436999_at Pid1 phosphotyrosine interaction domain containing 1 alpha polypeptide 1437152_at Mex3b mex3 homolog B (C. elegans) 1437270_a_at Clcf1 cardiotrophin-like cytokine factor 1 1437421_at 6330509M05Rik RIKEN cDNA 6330509M05 gene 1437591_a_at Wdr1 WD repeat domain 1 1437870_at Slco4c1 solute carrier organic anion transporter family member 4C1 1437992_x_at Gja1 gap junction protein alpha 1 1438044_at 1700047M11Rik RIKEN cDNA 1700047M11 gene 1438670_at Ptpn1 protein tyrosine phosphatase non-receptor type 1 1439160_at Pramef8 PRAME family member 8 1439443_x_at Tkt transketolase 1439457_x_at Atg12 autophagy-related 12 (yeast) 1439814_at Atp8b4 ATPase class I 1440458_at Cmah cytidine monophospho-N-acetylneuraminic acid hydroxylase type 8B member 4 1443021_at Mthfs 5 10-methenyltetrahydrofolate synthetase 1444459_at NA NA 1448204_at Sav1 salvador homolog 1 (Drosophila) 1448443_at Serpini1 serine (or cysteine) peptidase inhibitor clade I 1448561_at Ncf2 neutrophil cytosolic factor 2 member 1 1448573_a_at Ceacam10 carcinoembryonic antigen-related cell adhesion molecule 10 1448617_at Cd53 CD53 antigen 1448700_at G0s2 G0/G1 switch gene 2 1448742_at Snai1 snail homolog 1 (Drosophila) 1448758_at Nrbf2 nuclear receptor binding factor 2 1448786_at Plbd1 phospholipase B domain containing 1 1449037_at Crem cAMP responsive element modulator 1449324_at Ero1l ERO1-like (S. cerevisiae) 1449336_a_at Slk STE20-like kinase (yeast) 1449677_s_at Tmem38b transmembrane protein 38B 1449947_s_at Zfhx3 zinc finger homeobox 3 1450116_at Fam48a family with sequence similarity 48 member A 1450214_at Adora2b adenosine A2b receptor 1450377_at Thbs1 thrombospondin 1 1450424_a_at Il18bp interleukin 18 binding protein 1450459_at 2010106G01Rik RIKEN cDNA 2010106G01 gene 1451079_at Adpgk ADP-dependent glucokinase 1451486_at Slc46a3 solute carrier family 46 member 3 1451507_at Mef2c myocyte enhancer factor 2C 1451767_at Ncf1 neutrophil cytosolic factor 1 1452093_at Tmem185b transmembrane protein 185B 1452197_at Smc4 structural maintenance of chromosomes 4 1452205_x_at NA NA 1452301_at Aldh3b1 aldehyde dehydrogenase 3 family member B1 1452316_at Ints12 integrator complex subunit 12 1452414_s_at Ccdc86 coiled-coil domain containing 86 1452922_at Ppp1r3d protein phosphatase 1 regulatory subunit 3D 1453283_at Pgm1 phosphoglucomutase 1 1454976_at Sod2 superoxide dismutase 2 mitochondrial 1454984_at Lifr leukemia inhibitory factor receptor 1455019_x_at Ckap4 cytoskeleton-associated protein 4 1455089_at Gng12 guanine nucleotide binding protein (G protein) gamma 12 1455104_at Mxd1 MAX dimerization protein 1 1455133_s_at AI848100 expressed sequence AI848100 1455197_at Rnd1 Rho family GTPase 1 1455660_at Csf2rb colony stimulating factor 2 receptor beta 1455729_at Gnaq guanine nucleotide binding protein alpha q polypeptide low-affinity (granulocyte-macrophage) 1455899_x_at Socs3 suppressor of cytokine signaling 3 1456135_s_at Pxn paxillin 1456545_at Il18rap interleukin 18 receptor accessory protein 1456700_x_at Marcks myristoylated alanine rich protein kinase C substrate 1457404_at Nfkbiz nuclear factor of kappa light polypeptide gene enhancer in B-cells inhibitor zeta 1457579_at D11Ertd717e DNA segment Chr 11 1457644_s_at Cxcl1 chemokine (C-X-C motif) ligand 1 ERATO Doi 717 expressed 1457753_at Tlr13 toll-like receptor 13 1457793_a_at Whsc1l1 Wolf-Hirschhorn syndrome candidate 1-like 1 (human) 1457825_x_at Tcn2 transcobalamin 2 1457976_at 2010002M12Rik RIKEN cDNA 2010002M12 gene 1458308_at Sbno2 strawberry notch homolog 2 (Drosophila) 1458351_s_at NA NA 1458518_at Cpeb2 cytoplasmic polyadenylation element binding protein 2 1458525_at NA NA 1458668_at Tpd52 tumor protein D52 1458933_at Slc22a15 solute carrier family 22 (organic anion/cation transporter) member 15 1459522_s_at Gyg glycogenin 1459718_x_at Klf6 Kruppel-like factor 6 1459961_a_at Stat3 signal transducer and activator of transcription 3 1460006_at Zfhx3 zinc finger homeobox 3 1460033_at A330023F24Rik RIKEN cDNA A330023F24 gene 1460197_a_at Steap4 STEAP family member 4 1460227_at Timp1 tissue inhibitor of metalloproteinase 1 1460251_at Fas Fas (TNF receptor superfamily member 6) 1460282_at Trem1 triggering receptor expressed on myeloid cells 1 1460338_a_at Crlf3 cytokine receptor-like factor 3 1460458_at Crispld2 cysteine-rich secretory protein LCCL domain containing 2 1460510_a_at Coq10b coenzyme Q10 homolog B (S. cerevisiae) 1460573_at AI848100 expressed sequence AI848100 1460598_at Il28ra interleukin 28 receptor alpha
TABLE-US-00005 TABLE 5 Mouse Factor 23 PROBE ID SYMBOL GENE NAME 1415734_at Rab7 RAB7 member RAS oncogene family 1415778_at Morf4l2 mortality factor 4 like 2 1415826_at Atp6v1h ATPase H+ transporting lysosomal V1 subunit H 1415856_at Emb embigin 1415871_at Tgfbi transforming growth factor beta induced 1416011_x_at Ehd1 EH-domain containing 1 1416012_at Ehd1 EH-domain containing 1 1416067_at Ifrd1 interferon-related developmental regulator 1 1416082_at Rab1 RAB1 member RAS oncogene family 1416459_at Arf2 ADP-ribosylation factor 2 1416466_at Vapa vesicle-associated membrane protein associated protein A 1416467_at Ddx3x DEAD/H (Asp-Glu-Ala-Asp/His) box polypeptide 3 X- linked 1416496_at Mrfap1 Morf4 family associated protein 1 1417218_at Calhm2 calcium homeostasis modulator 2 1417268_at Cd14 CD14 antigen 1417291_at Tnfrsf1a tumor necrosis factor receptor superfamily member 1a 1417392_a_at Slc7a7 solute carrier family 7 (cationic amino acid transporter y+ system) member 7 1417478_a_at Ppp2r3c protein phosphatase 2 regulatory subunit B'' gamma 1417564_at Med7 mediator complex subunit 7 1417591_at Ptges2 prostaglandin E synthase 2 1417597_at Cd28 CD28 antigen 1417730_at Ext1 exostoses (multiple) 1 1417741_at Pygl liver glycogen phosphorylase 1418300_a_at Mknk2 MAP kinase-interacting serine/threonine kinase 2 1418465_at Ncf4 neutrophil cytosolic factor 4 1418468_at Anxa11 annexin A11 1418841_s_at Cdk11b cyclin-dependent kinase 11B 1418992_at F10 coagulation factor X 1418993_s_at F10 coagulation factor X 1419091_a_at Anxa2 annexin A2 1419180_at Bcl9l B-cell CLL/lymphoma 9-like 1419607_at Tnf tumor necrosis factor 1419609_at Ccr1 chemokine (C-C motif) receptor 1 1419722_at Klk8 kallikrein related-peptidase 8 1420012_at Xbp1 X-box binding protein 1 1420361_at Slc11a1 solute carrier family 11 (proton-coupled divalent metal ion transporters) member 1 1420886_a_at Xbp1 X-box binding protein 1 1420997_a_at Gpi1 glucose phosphate isomerase 1 1421291_at Il18rap interleukin 18 receptor accessory protein 1421463_at Siglece sialic acid binding Ig-like lectin E 1421478_a_at Zfp318 zinc finger protein 318 1421855_at Fgl2 fibrinogen-like protein 2 1422002_at Mxd1 MAX dimerization protein 1 1422013_at Clec4a2 C-type lectin domain family 4 member a2 1422046_at Itgam integrin alpha M 1422573_at Ampd3 adenosine monophosphate deaminase 3 1422631_at Ahr aryl-hydrocarbon receptor 1422791_at Pafah1b2 platelet-activating factor acetylhydrolase isoform 1b subunit 2 1422879_at Sypl synaptophysin-like protein 1422880_at Sypl synaptophysin-like protein 1422887_a_at Ctbp2 C-terminal binding protein 2 1422931_at Fosl2 fos-like antigen 2 1423053_at Arf4 ADP-ribosylation factor 4 1423100_at Fos FBJ osteosarcoma oncogene 1423112_at Ube2d3 ubiquitin-conjugating enzyme E2D 3 (UBC4/5 homolog yeast) 1423135_at Thy1 thymus cell antigen 1 theta 1423170_at Taf7 TAF7 RNA polymerase II TATA box binding protein (TBP)-associated factor 1423326_at Entpd1 ectonucleoside triphosphate diphosphohydrolase 1 1423361_at Yme1l1 YME1-like 1 (S. cerevisiae) 1423383_a_at Osbpl9 oxysterol binding protein-like 9 1423466_at Ccr7 chemokine (C-C motif) receptor 7 1423558_at Ifngr2 interferon gamma receptor 2 1423596_at Nek6 NIMA (never in mitosis gene a)-related expressed kinase 6 1423706_a_at Pgd phosphogluconate dehydrogenase 1423854_a_at Rasl11b RAS-like family 11 member B 1423903_at Pvr poliovirus receptor 1424027_at Pxn paxillin 1424441_at Slc27a4 solute carrier family 27 (fatty acid transporter) member 4 1424942_a_at Myc myelocytomatosis oncogene 1425128_at B3gnt8 UDP-GlcNAc: betaGal beta-13-N- acetylglucosaminyltransferase 8 1425346_at Zfp318 zinc finger protein 318 1425347_a_at Zfp318 zinc finger protein 318 1425485_at Mtmr6 myotubularin related protein 6 1425486_s_at Mtmr6 myotubularin related protein 6 1425663_at Il1rn interleukin 1 receptor antagonist 1425674_a_at Ssu72 Ssu72 RNA polymerase II CTD phosphatase homolog (yeast) 1426112_a_at Cd72 CD72 antigen 1426227_s_at Vps37c vacuolar protein sorting 37C (yeast) 1426299_at Snx20 sorting nexin 20 1426312_at Bre brain and reproductive organ-expressed protein 1426377_at Zfp281 zinc finger protein 281 1426396_at Cd247 CD247 antigen 1426473_at Dnajc9 DnaJ (Hsp40) homolog subfamily C member 9 1426501_a_at Tifa TRAF-interacting protein with forkhead-associated domain 1426554_a_at Pgam1 phosphoglycerate mutase 1 1426565_at Igf1r insulin-like growth factor I receptor 1426648_at Mapkapk2 MAP kinase-activated protein kinase 2 1426722_at Slc38a2 solute carrier family 38 member 2 1426755_at Ckap4 cytoskeleton-associated protein 4 1426798_a_at Ppp1r15b protein phosphatase 1 regulatory (inhibitor) subunit 15b 1426808_at Lgals3 lectin galactose binding soluble 3 1426988_at Klhdc5 kelch domain containing 5 1427102_at Slfn4 schlafen 4 1427227_at Gabrg1 gamma-aminobutyric acid (GABA) A receptor subunit gamma 1 1427314_at Tmed7 transmembrane emp24 protein transport domain containing 7 1427747_a_at Lcn2 lipocalin 2 1427899_at Rnf6 ring finger protein (C3H2C3 type) 6 1428141_at Gga2 golgi associated gamma adaptin ear containing ARF binding protein 2 1428192_at Kbtbd7 kelch repeat and BTB (POZ) domain containing 7 1428243_at 1700021K19Rik RIKEN cDNA 1700021K19 gene 1428720_s_at NA NA 1428875_at Golim4 golgi integral membrane protein 4 1428942_at Mt2 metallothionein 2 1429413_at Cpm carboxypeptidase M 1429527_a_at Plscr1 phospholipid scramblase 1 1429693_at Dab2 disabled homolog 2 (Drosophila) 1430443_at Anxa10 annexin A10 1431339_a_at Efhd2 EF hand domain containing 2 1431774_a_at Lyrm1 LYR motif containing 1 1433508_at Klf6 Kruppel-like factor 6 1433939_at Aff3 AF4/FMR2 family member 3 1433943_at NA NA 1434402_at Samd8 sterile alpha motif domain containing 8 1434418_at Lass6 LAG1 homolog ceramide synthase 6 1434432_at Rffl ring finger and FYVE like domain containing protein 1434502_x_at Slc4a1 solute carrier family 4 (anion exchanger) member 1 1434556_at Tmem170b transmembrane protein 170B 1435176_a_at Id2 inhibitor of DNA binding 2 1435260_at Akt3 thymoma viral proto-oncogene 3 1435449_at Bcl2l11 BCL2-like 11 (apoptosis facilitator) 1435517_x_at Ralb v-ral simian leukemia viral oncogene homolog B (ras related) 1435644_at Sh3pxd2b SH3 and PX domains 2B 1436333_a_at Synj1 synaptojanin 1 1436590_at Ppp1r3b protein phosphatase 1 regulatory (inhibitor) subunit 3B 1436763_a_at Klf9 Kruppel-like factor 9 1436921_at Atp7a ATPase Cu++ transporting alpha polypeptide 1436986_at Sntb2 syntrophin basic 2 1436999_at Pid1 phosphotyrosine interaction domain containing 1 1437152_at Mex3b mex3 homolog B (C. elegans) 1437270_a_at Clcf1 cardiotrophin-like cytokine factor 1 1437271_at Clcf1 cardiotrophin-like cytokine factor 1 1437313_x_at Hmgb2 high mobility group box 2 1437363_at Homer1 homer homolog 1 (Drosophila) 1437870_at Slco4c1 solute carrier organic anion transporter family member 4C1 1438021_at Rbm47 RNA binding motif protein 47 1438044_at 1700047M11Rik RIKEN cDNA 1700047M11 gene 1438627_x_at Pgd phosphogluconate dehydrogenase 1438650_x_at Gja1 gap junction protein alpha 1 1438657_x_at NA NA 1440458_at Cmah cytidine monophospho-N-acetylneuraminic acid hydroxylase 1441843_s_at NA NA 1444402_at Zc3h12c zinc finger CCCH type containing 12C 1445687_at Gm885 predicted gene 885 1448165_at Casp2 caspase 2 1448190_at Mrpl33 mitochondrial ribosomal protein L33 1448199_at Ankrd10 ankyrin repeat domain 10 1448210_at Rab1 RAB1 member RAS oncogene family 1448231_at Fkbp5 FK506 binding protein 5 1448291_at Mmp9 matrix metallopeptidase 9 1448318_at Plin2 perilipin 2 1448377_at Slpi secretory leukocyte peptidase inhibitor 1448511_at Ptprcap protein tyrosine phosphatase receptor type C polypeptide- associated protein 1448617_at Cd53 CD53 antigen 1448648_at Fam114a1 family with sequence similarity 114 member A1 1448728_a_at Nfkbiz nuclear factor of kappa light polypeptide gene enhancer in B-cells inhibitor zeta 1448795_a_at NA NA 1448861_at Traf5 TNF receptor-associated factor 5 1448898_at Ccl9 chemokine (C-C motif) ligand 9 1449303_at Sesn3 sestrin 3 1449310_at Ptger2 prostaglandin E receptor 2 (subtype EP2) 1449336_a_at Slk STE20-like kinase (yeast) 1449342_at Ptplb protein tyrosine phosphatase-like (proline instead of catalytic arginine) member b 1450513_at Cd33 CD33 antigen 1450654_a_at Dhdds dehydrodolichyl diphosphate synthase 1450858_a_at Ube2d3 ubiquitin-conjugating enzyme E2D 3 (UBC4/5 homolog yeast) 1451097_at Vasp vasodilator-stimulated phosphoprotein 1452045_at Zfp281 zinc finger protein 281 1452163_at Ets1 E26 avian leukemia oncogene 1 5' domain 1452181_at Ckap4 cytoskeleton-associated protein 4 1452443_s_at Helz helicase with zinc finger domain 1452922_at Ppp1r3d protein phosphatase 1 regulatory subunit 3D 1453985_at 0610007P08Rik RIKEN cDNA 0610007P08 gene 1454064_a_at Rnf138 ring finger protein 138 1454699_at Sesn1 sestrin 1 1454762_at Xkrx X Kell blood group precursor related X linked 1454896_at Rbpj recombination signal binding protein for immunoglobulin kappa J region 1454976_at Sod2 superoxide dismutase 2 mitochondrial 1454984_at Lifr leukemia inhibitory factor receptor 1455229_x_at Pgs1 phosphatidylglycerophosphate synthase 1 1455353_at Tmcc1 transmembrane and coiled coil domains 1 1455729_at Gnaq guanine nucleotide binding protein alpha q polypeptide 1456037_x_at Preb prolactin regulatory element binding 1456307_s_at Adcy7 adenylate cyclase 7 1456388_at Atp11a ATPase class VI type 11A 1456545_at Il18rap interleukin 18 receptor accessory protein 1457035_at AI607873 expressed sequence AI607873 1457645_at C130079G13Rik RIKEN cDNA C130079G13 gene 1457917_at Lck lymphocyte protein tyrosine kinase 1458067_at Fam179b family with sequence similarity 179 member B 1458518_at Cpeb2 cytoplasmic polyadenylation element binding protein 2 1458668_at Tpd52 tumor protein D52 1460197_a_at Steap4 STEAP family member 4 1460227_at Timp1 tissue inhibitor of metalloproteinase 1 1460271_at Trem3 triggering receptor expressed on myeloid cells 3 1460329_at B4galt6 UDP-Gal: betaGlcNAc beta 14-galactosyltransferase polypeptide 6 1460335_at Lysmd3 LysM putative peptidoglycan-binding domain containing 3 1460408_at Gabrg1 gamma-aminobutyric acid (GABA) A receptor subunit gamma 1 1460510_a_at Coq10b coenzyme Q10 homolog B (S. cerevisiae) 1460573_at AI848100 expressed sequence AI848100 1460735_at Svil supervillin
TABLE-US-00006 TABLE 6 Mouse Factor 26 PROBE ID SYMBOL GENE NAME 1415686_at Rab14 RAB14 member RAS oncogene family 1415800_at Gja1 gap junction proteinalpha 1 1415830_at Orc5 origin recognition complex subunit 5 1415871_at Tgfbi transforming growth factor beta induced 1416019_at Dr1 down-regulator of transcription 1 1416234_at Lrrc59 leucine rich repeat containing 59 1416360_at Snx18 sorting nexin 18 1416369_at Hiatl1 hippocampus abundant transcript-like 1 1416435_at Ltbr lymphotoxin B receptor 1416502_a_at Preb prolactin regulatory element binding 1416522_a_at Grcc10 gene rich cluster C10 gene 1416527_at Rab32 RAB32 member RAS oncogene family 1416543_at Nfe2l2 nuclear factor erythroid derived 2 like 2 1416573_at Pofut2 protein O-fucosyltransferase 2 1416576_at Socs3 suppressor of cytokine signaling 3 1416700_at Rnd3 Rho family GTPase 3 1416881_at Mcl1 myeloid cell leukemia sequence 1 1416981_at Foxo1 forkhead box O1 1416983_s_at Foxo1 forkhead box O1 1417297_at Itpr3 inositol 145-triphosphate receptor 3 1417392_a_at Slc7a7 solute carrier family 7 (cationic amino acid transporter y+ system) member 7 1417446_at Slc12a4 solute carrier family 12 member 4 1417460_at Ifitm2 interferon induced transmembrane protein 2 1417509_at Rnf19a ring finger protein 19A 1417566_at Abhd5 abhydrolase domain containing 5 1417661_at Rdm1 RAD52 motif 1 1417696_at Soat1 sterol O-acyltransferase 1 1417744_a_at Ralb v-ral simian leukemia viral oncogene homolog B (ras related) 1417859_at Gas7 growth arrest specific 7 1417890_at Pdxp pyridoxal (pyridoxine vitamin B6) phosphatase 1417985_at Nrarp Notch-regulated ankyrin repeat protein 1418133_at Bcl3 B-cell leukemia/lymphoma 3 1418468_at Anxa11 annexin A11 1418574_a_at Shfm1 split hand/foot malformation (ectrodactyly) type 1 1418612_at Slfn1 schlafen 1 1418798_s_at Srpk3 serine/arginine-rich protein specific kinase 3 1418901_at Cebpb CCAAT/enhancer binding protein (C/EBP) beta 1418930_at Cxcl10 chemokine (C-X-C motif) ligand 10 1419006_s_at Peli2 pellino 2 1419178_at Cd3g CD3 antigen gamma polypeptide 1419508_at Ripk1 receptor (TNFRSF)-interacting serine-threonine kinase 1 1419641_at Purb purine rich element binding protein B 1419709_at Stfa3 stefin A3 1419721_at Niacr1 niacin receptor 1 1419722_at Klk8 kallikrein related-peptidase 8 1420369_a_at Csn2 casein beta 1420394_s_at NA NA 1420591_at Gpr84 G protein-coupled receptor 84 1420873_at Twf1 twinfilin actin-binding protein homolog 1 (Drosophila) 1421366_at Clec5a C-type lectin domain family 5 member a 1421547_at Cd180 CD180 antigen 1421863_at Vamp1 vesicle-associated membrane protein 1 1422013_at Clec4a2 C-type lectin domain family 4 member a2 1422506_a_at Cstb cystatin B 1422519_at Cask calcium/calmodulin-dependent serine protein kinase (MAGUK family) 1422557_s_at Mt1 metallothionein 1 1423167_at Mobkl3 MOB1 Mps One Binder kinase activator-like 3 (yeast) 1423313_at Pde7a phosphodiesterase 7A 1423383_a_at Osbpl9 oxysterol binding protein-like 9 1423632_at Gpr146 G protein-coupled receptor 146 1423670_a_at Srpr signal recognition particle receptor (`docking protein`) 1423743_at Arcn1 archain 1 1423754_at Ifitm3 interferon induced transmembrane protein 3 1423838_s_at 2400003C14Rik RIKEN cDNA 2400003C14 gene 1423989_at Tecpr1 tectonin beta-propeller repeat containing 1 1424032_at Hvcn1 hydrogen voltage-gated channel 1 1424254_at Ifitm1 interferon induced transmembrane protein 1 1424256_at Rdh12 retinol dehydrogenase 12 1424564_at 2410001C21Rik RIKEN cDNA 2410001C21 gene 1424573_at Tmed5 transmembrane emp24 protein transport domain containing 5 1424906_at Pqlc3 PQ loop repeat containing 1425128_at B3gnt8 UDP-GlcNAc: betaGal beta-13-N- acetylglucosaminyltransferase 8 1425407_s_at NA NA 1425492_at Bmpr1a bone morphogenetic protein receptor type 1A 1425587_a_at Ptprj protein tyrosine phosphatase receptor type J 1425933_a_at Nt5c2 5'-nucleotidase cytosolic II 1425977_a_at Slk STE20-like kinase (yeast) 1426063_a_at Gem GTP binding protein (gene overexpressed in skeletal muscle) 1426368_at Rin2 Ras and Rab interactor 2 1426369_at Far1 fatty acyl CoA reductase 1 1426708_at Antxr2 anthrax toxin receptor 2 1426865_a_at Ncam1 neural cell adhesion molecule 1 1426899_at Tbc1d23 TBC1 domain family member 23 1426978_at NA NA 1427243_at Rell1 RELT-like 1 1428141_at Gga2 golgi associated gamma adaptin ear containing ARF binding protein 2 1428214_at Tomm7 translocase of outer mitochondrial membrane 7 homolog (yeast) 1428231_at Cpsf6 cleavage and polyadenylation specific factor 6 1428357_at 2610019F03Rik RIKEN cDNA 2610019F03 gene 1428702_at Ddx28 DEAD (Asp-Glu-Ala-Asp) box polypeptide 28 1428719_at NA NA 1428985_at Ints12 integrator complex subunit 12 1429115_at NA NA 1429321_at Rnf149 ring finger protein 149 1429466_s_at NA NA 1429527_a_at Plscr1 phospholipid scramblase 1 1429775_a_at NA NA 1433454_at Abtb2 ankyrin repeat and BTB (POZ) domain containing 2 1433815_at Jakmip1 janus kinase and microtubule interacting protein 1 1434025_at NA NA 1434054_at NA NA 1434070_at Jag1 jagged 1 1434126_at 4930402H24Rik RIKEN cDNA 4930402H24 gene 1434310_at Bmpr2 bone morphogenic protein receptor type II (serine/threonine kinase) 1434311_at Cnot6l CCR4-NOT transcription complex subunit 6-like 1434431_x_at Adora2b adenosine A2b receptor 1434484_at 1100001G20Rik RIKEN cDNA 1100001G20 gene 1434487_at Mef2d myocyte enhancer factor 2D 1434773_a_at Slc2a1 solute carrier family 2 (facilitated glucose transporter) member 1 1434814_x_at Gpi1 glucose phosphate isomerase 1 1435077_at Asxl1 additional sex combs like 1 (Drosophila) 1435176_a_at Id2 inhibitor of DNA binding 2 1435231_at Coq4 coenzyme Q4 homolog (yeast) 1435458_at Pim1 proviral integration site 1 1435996_at Card11 caspase recruitment domain family member 11 1436077_a_at Fcho1 FCH domain only 1 1436103_at Rab3ip RAB3A interacting protein 1436666_at NA NA 1437111_at Zc3h12c zinc finger CCCH type containing 12C 1437225_x_at Gnai3 guanine nucleotide binding protein (G protein) alpha inhibiting 3 1437270_a_at Clcf1 cardiotrophin-like cytokine factor 1 1437313_x_at Hmgb2 high mobility group box 2 1438031_at Rasgrp3 RAS guanyl releasing protein 3 1438627_x_at Pgd phosphogluconate dehydrogenase 1439443_x_at Tkt transketolase 1439662_at Homer1 homer homolog 1 (Drosophila) 1439799_at NA NA 1441079_at Mbd4 methyl-CpG binding domain protein 4 1441962_at Alox5 arachidonate 5-lipoxygenase 1442122_at AI451458 expressed sequence AI451458 1444090_at Pram1 PML-RAR alpha-regulated adaptor molecule 1 1444985_at NA NA 1447918_x_at Iglv1 immunoglobulin lambda variable 1 1448159_at Rab7 RAB7 member RAS oncogene family 1448306_at Nfkbia nuclear factor of kappa light polypeptide gene enhancer in B-cells inhibitor alpha 1448333_at Adprh ADP-ribosylarginine hydrolase 1448377_at Slpi secretory leukocyte peptidase inhibitor 1448543_at Slmo2 slowmo homolog 2 (Drosophila) 1448559_at Flot1 flotillin 1 1448604_at Uck2 uridine-cytidine kinase 2 1448856_a_at Msra methionine sulfoxide reductase A 1448948_at Slc50a1 solute carrier family 50 (sugar transporter) member 1 1448957_at Rbpj recombination signal binding protein for immunoglobulin kappa J region 1449028_at Rhou ras homolog gene family member U 1449455_at Hck hemopoietic cell kinase 1449591_at Casp4 caspase 4 apoptosis-related cysteine peptidase 1449712_s_at Atp6v1e1 ATPase H+ transporting lysosomal V1 subunit E1 1449829_at Itgb2l integrin beta 2-like 144985 8_at Cd86 CD86 antigen 1450295_s_at Pvr poliovirus receptor 1450459_at 2010106G01Rik RIKEN cDNA 2010106G01 gene 1450742_at Bysl bystin-like 1450786_x_at Pdlim5 PDZ and LIM domain 5 1450882_s_at NA NA 1450913_at B4galt6 UDP-Gal: betaGlcNAc beta 14-galactosyltransferase polypeptide 6 1450937_at Lin7c lin-7 homolog C (C. elegans) 1450971_at Gadd45b growth arrest and DNA-damage-inducible 45 beta 1451015_at Tkt transketolase 1451037_at Ptpn9 protein tyrosine phosphatase non-receptor type 9 1451079_at Adpgk ADP-dependent glucokinase 1451171_at 2310008H04Rik RIKEN cDNA 2310008H04 gene 1451275_at Uhrf1bp1l UHRF1 (ICBP90) binding protein 1-like 1451317_at Ythdf2 YTH domain family 2 1451387_s_at Cuta cutA divalent cation tolerance homolog (E. coli) 1451436_at Sbno1 sno strawberry notch homolog 1 (Drosophila) 1451458_at Tmem2 transmembrane protein 2 1451537_at Chi3l1 chitinase 3-like 1 1451713_a_at Fcer2a Fc receptor IgE low affinity II alpha polypeptide 1451767_at Ncf1 neutrophil cytosolic factor 1 1452024_a_at Ldb1 LIM domain binding 1 1452118_at Rrp1b ribosomal RNA processing 1 homolog B (S. cerevisiae) 1452162_at Wdr48 WD repeat domain 48 1452163_at Ets1 E26 avian leukemia oncogene 1 5' domain 1452306_at Zfyve26 zinc finger FYVE domain containing 26 1452408_at NA NA 1452483_a_at Cd44 CD44 antigen 1452732_at Asprv1 aspartic peptidase retroviral-like 1 1453009_at Cpm carboxypeptidase M 1454197_a_at Ccdc86 coiled-coil domain containing 86 1454654_at Dirc2 disrupted in renal carcinoma 2 (human) 1454711_at Trio triple functional domain (PTPRF interacting) 1454880_s_at Bmf BCL2 modifying factor 1454979_at Diap1 diaphanous homolog 1 (Drosophila) 1455000_at Gpr68 G protein-coupled receptor 68 1455002_at Ptp4a1 protein tyrosine phosphatase 4a1 1455032_at Ccnyl1 cyclin Y-like 1 1455300_at Tet2 tet oncogene family member 2 1455332_x_at Fcgr2b Fc receptor IgG low affinity IIb 1456037_x_at Preb prolactin regulatory element binding 1456341_a_at Klf9 Kruppel-like factor 9 1456875_at Gm19906 predicted gene19906 1457376_at NA NA 1457753_at Tlr13 toll-like receptor 13 1457825_x_at Tcn2 transcobalamin 2 1459903_at Sema7a sema domain immunoglobulin domain (Ig) and GPI membrane anchor (semaphorin) 7A 1459916_at Gm19980 predicted gene 19980 1460257_a_at NA NA 1460282_at Trem1 triggering receptor expressed on myeloid cells 1 1460287_at Timp2 tissue inhibitor of metalloproteinase 2 1460351_at S100a11 S100 calcium binding protein A11 (calgizzarin)
TABLE-US-00007 TABLE 7 Human Factor 4 PROBE ID SYMBOL GENE NAME 200060_s_at RNPS1 RNA binding protein S1 serine-rich domain 200633_at UBB ubiquitin B 200675_at CD81 CD81 molecule 200693_at YWHAQ tyrosine 3-monooxygenase/tryptophan 5-monooxygenase activation protein theta polypeptide 200702_s_at DDX24 DEAD (Asp-Glu-Ala-Asp) box polypeptide 24 200717_x_at RPL7 ribosomal protein L7 200739_s_at SUMO3 SMT3 suppressor of mif two 3 homolog 3 (S. cerevisiae) 200741_s_at RPS27 ribosomal protein S27 200743_s_at TPP1 tripeptidyl peptidase I 200764_s_at CTNNA1 catenin (cadherin-associated protein) alpha 1 102 kDa 200766_at CTSD cathepsin D 200767_s_at FAM120A family with sequence similarity 120A 200874_s_at NOP56 NOP56 ribonucleoprotein homolog (yeast) 200875_s_at NOP56 NOP56 ribonucleoprotein homolog (yeast) 200881_s_at DNAJA1 DnaJ (Hsp40) homolog subfamily A member 1 200886_s_at PGAM1 phosphoglycerate mutase 1 (brain) 200947_s_at GLUD1 glutamate dehydrogenase 1 200951_s_at CCND2 cyclin D2 200954_at ATP6V0C ATPase H+ transporting lysosomal 16 kDa V0 subunit c 200955_at IMMT inner membrane protein mitochondrial 200968_s_at PPIB peptidylprolyl isomerase B (cyclophilin B) 200969_at SERP1 stress-associated endoplasmic reticulum protein 1 200984_s_at CD59 CD59 molecule complement regulatory protein 200985_s_at CD59 CD59 molecule complement regulatory protein 200998_s_at CKAP4 cytoskeleton-associated protein 4 201015_s_at JUP junction plakoglobin 201055_s_at HNRNPA0 heterogeneous nuclear ribonucleoprotein A0 201087_at PXN paxillin 201243_s_at ATP1B1 ATPase Na+/K+ transporting beta 1 polypeptide 201260_s_at SYPL1 synaptophysin-like 1 201332_s_at STAT6 signal transducer and activator of transcription 6 201353_s_at BAZ2A bromodomain adjacent to zinc finger domain 2A 201369_s_at ZFP36L2 zinc finger protein 36 C3H type-like 2 201395_at RBM5 RNA binding motif protein 5 201396_s_at SGTA small glutamine-rich tetratricopeptide repeat (TPR)-containing alpha 201449_at TIA1 TIA1 cytotoxic granule-associated RNA binding protein 201525_at APOD apolipoprotein D 201530_x_at EIF4A1 eukaryotic translation initiation factor 4A1 201532_at PSMA3 proteasome (prosome macropain) subunit alpha type 3 201556_s_at VAMP2 vesicle-associated membrane protein 2 (synaptobrevin 2) 201601_x_at IFITM1 interferon induced transmembrane protein 1 (9-27) 201602_s_at PPP1R12A protein phosphatase 1 regulatory (inhibitor) subunit 12A 201614_s_at RUVBL1 RuvB-like 1 (E. coli) 201650_at KRT19 keratin 19 201699_at PSMC6 proteasome (prosome macropain) 26S subunit ATPase 6 201700_at CCND3 cyclin D3 201701_s_at PGRMC2 progesterone receptor membrane component 2 201737_s_at 6-Mar membrane-associated ring finger (C3HC4) 6 201751_at JOSD1 Josephin domain containing 1 201840_at NEDD8 neural precursor cell expressed developmentally down-regulated 8 201881_s_at ARIH1 ariadne homolog ubiquitin-conjugating enzyme E2 binding protein 1 (Drosophila) 201903_at UQCRC1 ubiquinol-cytochrome c reductase core protein I 201960_s_at MYCBP2 MYC binding protein 2 201984_s_at EGFR epidermal growth factor receptor 202007_at NID1 nidogen 1 202008_s_at NID1 nidogen 1 202054_s_at ALDH3A2 aldehyde dehydrogenase 3 family member A2 202056_at KPNA1 karyopherin alpha 1 (importin alpha 5) 202057_at KPNA1 karyopherin alpha 1 (importin alpha 5) 202162_s_at CNOT8 CCR4-NOT transcription complex subunit 8 202234_s_at SLC16A1 solute carrier family 16 member 1 (monocarboxylic acid transporter 1) 202240_at PLK1 polo-like kinase 1 202273_at PDGFRB platelet-derived growth factor receptor beta polypeptide 202329_at CSK c-src tyrosine kinase 202360_at MAML1 mastermind-like 1 (Drosophila) 202368_s_at TRAM2 translocation associated membrane protein 2 202382_s_at GNPDA1 glucosamine-6-phosphate deaminase 1 202426_s_at RXRA retinoid X receptor alpha 202508_s_at SNAP25 synaptosomal-associated protein 25 kDa 202548_s_at ARHGEF7 Rho guanine nucleotide exchange factor (GEF) 7 202566_s_at SVIL supervillin 202623_at EAPP E2F-associated phosphoprotein 202624_s_at CABIN1 calcineurin binding protein 1 202636_at RNF103 ring finger protein 103 202693_s_at STK17A serine/threonine kinase 17a 202694_at STK17A serine/threonine kinase 17a 202709_at FMOD fibromodulin 202750_s_at TFIP11 tuftelin interacting protein 11 202756_s_at GPC1 glypican 1 202787_s_at MAPKAPK3 mitogen-activated protein kinase-activated protein kinase 3 202795_x_at TRIOBP TRIO and F-actin binding protein 202796_at SYNPO synaptopodin 202830_s_at SLC37A4 solute carrier family 37 (glucose-6-phosphate transporter) member 4 202859_x_at IL8 interleukin 8 202972_s_at FAM13A family with sequence similarity 13 member A 202973_x_at FAM13A family with sequence similarity 13 member A 202985_s_at BAG5 BCL2-associated athanogene 5 203023_at NOP16 NOP16 nucleolar protein homolog (yeast) 203199_s_at MTRR 5-methyltetrahydrofolate-homocysteine methyltransferase reductase 203236_s_at LGALS9 lectin galactoside-binding soluble 9 203376_at CDC40 cell division cycle 40 homolog (S. cerevisiae) 203460_s_at PSEN1 presenilin 1 203610_s_at TRIM38 tripartite motif containing 38 203693_s_at E2F3 E2F transcription factor 3 203718_at PNPLA6 patatin-like phospholipase domain containing 6 203764_at DLGAP5 discs large (Drosophila) homolog-associated protein 5 203794_at CDC42BPA CDC42 binding protein kinase alpha (DMPK-like) 203863_at ACTN2 actinin alpha 2 203864_s_at ACTN2 actinin alpha 2 204217_s_at RTN2 reticulon 2 204218_at C11orf51 chromosome 11 open reading frame 51 204237_at GULP1 GULP engulfment adaptor PTB domain containing 1 204238_s_at C6orf108 chromosome 6 open reading frame 108 204242_s_at ACOX3 acyl-CoA oxidase 3 pristanoyl 204249_s_at LMO2 LIM domain only 2 (rhombotin-like 1) 204250_s_at CEP164 centrosomal protein 164 kDa 204287_at SYNGR1 synaptogyrin 1 204447_at ProSAPiP1 ProSAPiP1 protein 204464_s_at EDNRA endothelin receptor type A 204491_at PDE4D phosphodiesterase 4D cAMP-specific 204496_at STRN3 striatin calmodulin binding protein 3 204497_at ADCY9 adenylate cyclase 9 204597_x_at STC1 stanniocalcin 1 204697_s_at CHGA chromogranin A (parathyroid secretory protein 1) 205053_at PRIM1 primase DNA polypeptide 1 (49 kDa) 205064_at SPRR1B small proline-rich protein 1B 205067_at IL1B interleukin 1 beta 205144_at NA NA 205151_s_at TRIL TLR4 interactor with leucine-rich repeats 205182_s_at ZNF324 zinc finger protein 324 205225_at ESR1 estrogen receptor 1 205243_at SLC13A3 solute carrier family 13 (sodium-dependent dicarboxylate transporter) member 3 205296_at RBL1 retinoblastoma-like 1 (p107) 205340_at ZBTB24 zinc finger and BTB domain containing 24 205364_at ACOX2 acyl-CoA oxidase 2 branched chain 205396_at SMAD3 SMAD family member 3 205483_s_at ISG15 ISG15 ubiquitin-like modifier 205590_at RASGRP1 RAS guanyl releasing protein 1 (calcium and DAG-regulated) 205680_at MMP10 matrix metallopeptidase 10 (stromelysin 2) 205734_s_at AFF3 AF4/FMR2 family member 3 205887_x_at MSH3 mutS homolog 3 (E. coli) 206099_at PRKCH protein kinase C eta 206147_x_at SCML2 sex comb on midleg-like 2 (Drosophila) 206266_at GPLD1 glycosylphosphatidylinositol specific phospholipase D1 206421_s_at SERPINB7 serpin peptidase inhibitor clade B (ovalbumin) member 7 206614_at GDF5 growth differentiation factor 5 206653_at POLR3G polymerase (RNA) III (DNA directed) polypeptide G (32 kD) 206931_at ZNF141 zinc finger protein 141 206932_at CH25H cholesterol 25-hydroxylase 207022_s_at LDHC lactate dehydrogenase C 207076_s_at ASS1 argininosuccinate synthase 1 207086_x_at NA NA 207160_at IL12A interleukin 12A (natural killer cell stimulatory factor 1 cytotoxic lymphocyte maturation factor 1 p35) 207174_at GPC5 glypican 5 207385_at TFDP3 transcription factor Dp family member 3 207588_at NA NA 207759_s_at NA NA 207908_at KRT2 keratin 2 208043_at NA NA 208113_x_at PABPC3 poly(A) binding protein cytoplasmic 3 208114_s_at ISG20L2 interferon stimulated exonuclease gene 20 kDa-like 2 208334_at NDST4 N-deacetylase/N-sulfotransferase (heparan glucosaminyl) 4 208340_at NA NA 208381_s_at SGPL1 sphingosine-1-phosphate lyase 1 208556_at GPR31 G protein-coupled receptor 31 208683_at CAPN2 calpain 2 (m/II) large subunit 208709_s_at NRD1 nardilysin (N-arginine dibasic convertase) 208710_s_at AP3D1 adaptor-related protein complex 3 delta 1 subunit 208729_x_at HLA-B major histocompatibility complex class I B 208738_x_at SUMO2 SMT3 suppressor of mif two 3 homolog 2 (S. cerevisiae) 208748_s_at FLOT1 flotillin 1 208750_s_at ARF1 ADP-ribosylation factor 1 208765_s_at HNRNPR heterogeneous nuclear ribonucleoprotein R 208786_s_at MAP1LC3B microtubule-associated protein 1 light chain 3 beta 208800_at SRP72 signal recognition particle 72 kDa 208817_at COMT catechol-O-methyltransferase 208820_at PTK2 PTK2 protein tyrosine kinase 2 208852_s_at CANX calnexin 208853_s_at CANX calnexin 208856_x_at RPLP0 ribosomal protein large P0 208857_s_at PCMT1 protein-L-isoaspartate (D-aspartate) O-methyltransferase 208875_s_at PAK2 p21 protein (Cdc42/Rac)-activated kinase 2 209021_x_at ATG13 ATG13 autophagy related 13 homolog (S. cerevisiae) 209047_at AQP1 aquaporin 1 (Colton blood group) 209055_s_at CDC5L CDC5 cell division cycle 5-like (S. pombe) 209087_x_at MCAM melanoma cell adhesion molecule 209088_s_at UBN1 ubinuclein 1 209169_at GPM6B glycoprotein M6B 209170_s_at GPM6B glycoprotein M6B 209197_at SYT11 synaptotagmin XI 209225_x_at TNPO1 transportin 1 209253_at SORBS3 sorbin and SH3 domain containing 3 209352_s_at SIN3B SIN3 homolog B transcription regulator (yeast) 209393_s_at EIF4E2 eukaryotic translation initiation factor 4E family member 2 209479_at CCDC28A coiled-coil domain containing 28A 209556_at NCDN neurochondrin 209623_at MCCC2 methylcrotonoyl-CoA carboxylase 2 (beta) 209666_s_at CHUK conserved helix-loop-helix ubiquitous kinase 209689_at CCDC93 coiled-coil domain containing 93 209726_at CA11 carbonic anhydrase XI 209822_s_at VLDLR very low density lipoprotein receptor 209865_at SLC35A3 solute carrier family 35 (UDP-N-acetylglucosamine (UDP- GlcNAc) transporter) member A3 209866_s_at LPHN3 latrophilin 3 209972_s_at AIMP2 aminoacyl tRNA synthetase complex-interacting multifunctional protein 2 209973_at NFKBIL1 nuclear factor of kappa light polypeptide gene enhancer in B-cells inhibitor-like 1 210158_at ERCC4 excision repair cross-complementing rodent repair deficiency complementation group 4 210163_at CXCL11 chemokine (C-X-C motif) ligand 11 210251_s_at RUFY3 RUN and FYVE domain containing 3 210344_at OSBPL7 oxysterol binding protein-like 7 210346_s_at CLK4 CDC-like kinase 4 210377_at ACSM3 acyl-CoA synthetase medium-chain family member 3 210470_x_at NONO non-POU domain containing octamer-binding 210613_s_at SYNGR1 synaptogyrin 1 210627_s_at MOGS mannosyl-oligosaccharide glucosidase 210677_at SOAT2 sterol O-acyltransferase 2 210731_s_at LGALS8 lectin galactoside-binding soluble 8 210732_s_at LGALS8 lectin galactoside-binding soluble 8 210823_s_at PTPRS protein tyrosine phosphatase receptor type S 210919_at PHLPP1 PH domain and leucine rich repeat protein phosphatase 1 211054_at INVS inversin 211055_s_at INVS inversin 211070_x_at DBI diazepam binding inhibitor (GABA receptor modulator acyl-CoA binding protein) 211165_x_at EPHB2 EPH receptor B2 211190_x_at CD84 CD84 molecule 211224_s_at ABCB11 ATP-binding cassette sub-family B (MDR/TAP) member 11
211334_at MRE11A MRE11 meiotic recombination 11 homolog A (S. cerevisiae) 211375_s_at ILF3 interleukin enhancer binding factor 3 90 kDa 211380_s_at PRKG1 protein kinase cGMP-dependent type I 211413_s_at PADI4 peptidyl arginine deiminase type IV 211555_s_at GUCY1B3 guanylate cyclase 1 soluble beta 3 211775_x_at MGC13053 hypothetical MGC13053 211794_at FYB FYN binding protein 211833_s_at BAX BCL2-associated X protein 211954_s_at IPO5 importin 5 211964_at COL4A2 collagen type IV alpha 2 211995_x_at ACTG1 actin gamma 1 211996_s_at NA NA 212037_at PNN pinin desmosome associated protein 212075_s_at CSNK2A1 casein kinase 2 alpha 1 polypeptide 212152_x_at ARID1A AT rich interactive domain 1A (SWI-like) 212154_at SDC2 syndecan 2 212274_at LPIN1 lipin 1 212282_at TMEM97 transmembrane protein 97 212307_s_at OGT O-linked N-acetylglucosamine (GlcNAc) transferase (UDP-N- acetylglucosamine: polypeptide-N-acetylglucosaminyl transferase) 212328_at LIMCH1 LIM and calponin homology domains 1 212387_at TCF4 transcription factor 4 212439_at IP6K1 inositol hexakisphosphate kinase 1 212440_at SNRNP27 small nuclear ribonucleoprotein 27 kDa (U4/U6.U5) 212738_at ARHGAP19 Rho GTPase activating protein 19 212854_x_at NA NA 212938_at COL6A1 collagen type VI alpha 1 212951_at GPR116 G protein-coupled receptor 116 212966_at HIC2 hypermethylated in cancer 2 213022_s_at UTRN utrophin 213039_at ARHGEF18 Rho/Rac guanine nucleotide exchange factor (GEF) 18 213067_at MYH10 myosin heavy chain 10 non-muscle 213073_at ZFYVE26 zinc finger FYVE domain containing 26 213135_at TIAM1 T-cell lymphoma invasion and metastasis 1 213168_at SP3 Sp3 transcription factor 213185_at KIAA0556 KIAA0556 213188_s_at MINA MYC induced nuclear antigen 213334_x_at HAUS7 HAUS augmin-like complex subunit 7 213351_s_at TMCC1 transmembrane and coiled-coil domain family 1 213395_at MLC1 megalencephalic leukoencephalopathy with subcortical cysts 1 213397_x_at NA NA 213436_at CNR1 cannabinoid receptor 1 (brain) 213439_x_at RUNDC3A RUN domain containing 3A 213659_at ZNF75D zinc finger protein 75D 213687_s_at RPL35A ribosomal protein L35a 213816_s_at MET met proto-oncogene (hepatocyte growth factor receptor) 213874_at SERPINA4 serpin peptidase inhibitor clade A (alpha-1 antiproteinase antitrypsin) member 4 214319_at FRY furry homolog (Drosophila) 214349_at NA NA 214380_at PRPF31 PRP31 pre-mRNA processing factor 31 homolog (S. cerevisiae) 214387_x_at SFTPC surfactant protein C 214565_s_at NA NA 214727_at BRCA2 breast cancer 2 early onset 214915_at ZNF362 zinc finger protein 362 214952_at NCAM1 neural cell adhesion molecule 1 215067_x_at PRDX2 peroxiredoxin 2 215240_at ITGB3 integrin beta 3 (platelet glycoprotein IIIa antigen CD61) 215254_at RCAN1 regulator of calcineurin 1 215510_at ETV2 ets variant 2 215727_x_at NA NA 215974_at HCG4B HLA complex group 4B (non-protein coding) 216048_s_at RHOBTB3 Rho-related BTB domain containing 3 216752_at PIK3R4 phosphoinositide-3-kinase regulatory subunit 4 216971_s_at PLEC plectin 217455_s_at SSTR2 somatostatin receptor 2 217544_at NA NA 217640_x_at SKA1 spindle and kinetochore associated complex subunit 1 217641_at GPR135 G protein-coupled receptor 135 217740_x_at RPL7A ribosomal protein L7a 217799_x_at UBE2H ubiquitin-conjugating enzyme E2H 217889_s_at CYBRD1 cytochrome b reductase 1 217903_at STRN4 striatin calmodulin binding protein 4 217924_at C6orf106 chromosome 6 open reading frame 106 217928_s_at PPP6R3 protein phosphatase 6 regulatory subunit 3 217941_s_at ERBB2IP erbb2 interacting protein 217992_s_at EFHD2 EF-hand domain family member D2 217996_at PHLDA1 pleckstrin homology-like domain family A member 1 218006_s_at ZNF22 zinc finger protein 22 (KOX 15) 218028_at ELOVL1 ELOVL fatty acid elongase 1 218048_at COMMD3 COMM domain containing 3 218049_s_at MRPL13 mitochondrial ribosomal protein L13 218358_at CRELD2 cysteine-rich with EGF-like domains 2 218380_at NA NA 218390_s_at FAM204A family with sequence similarity 204 member A 218541_s_at C8orf4 chromosome 8 open reading frame 4 218580_x_at AURKAIP1 aurora kinase A interacting protein 1 218625_at NRN1 neuritin 1 218694_at ARMCX1 armadillo repeat containing X-linked 1 218710_at TTC27 tetratricopeptide repeat domain 27 218771_at PANK4 pantothenate kinase 4 218920_at FAM193B family with sequence similarity 193 member B 219051_x_at METRN meteorin glial cell differentiation regulator 219058_x_at TINAGL1 tubulointerstitial nephritis antigen-like 1 219388_at GRHL2 grainyhead-like 2 (Drosophila) 219485_s_at PSMD10 proteasome (prosome macropain) 26S subunit non-ATPase 10 219495_s_at ZNF180 zinc finger protein 180 219528_s_at BCL11B B-cell CLL/lymphoma 11B (zinc finger protein) 219829_at ITGB1BP2 integrin beta 1 binding protein (melusin) 2 219975_x_at OLAH oleoyl-ACP hydrolase 219988_s_at RNF220 ring finger protein 220 220156_at EFCAB1 EF-hand calcium binding domain 1 220243_at ZBTB44 zinc finger and BTB domain containing 44 220357_s_at SGK2 serum/glucocorticoid regulated kinase 2 220403_s_at TP53AIP1 tumor protein p53 regulated apoptosis inducing protein 1 220650_s_at SLC9A5 solute carrier family 9 (sodium/hydrogen exchanger) member 5 220663_at IL1RAPL1 interleukin 1 receptor accessory protein-like 1 220750_s_at LEPRE1 leucine proline-enriched proteoglycan (leprecan) 1 220769_s_at WDR78 WD repeat domain 78 220991_s_at RNF32 ring finger protein 32 221036_s_at APR1B anterior pharynx defective 1 homolog B (C. elegans) 221066_at RXFP3 relaxin/insulin-like family peptide receptor 3 221080_s_at DENND1C DENN/MADD domain containing 1C 221102_s_at TRPM6 transient receptor potential cation channel subfamily M member 6 221280_s_at PARD3 par-3 partitioning defective 3 homolog (C. elegans) 221296_at TECTA tectorin alpha 221510_s_at GLS glutaminase 221625_at ZNF506 zinc finger protein 506 221888_at CC2D1A coiled-coil and C2 domain containing 1A 221896_s_at HIGD1A HIG1 hypoxia inducible domain family member 1A 222014_x_at MTO1 mitochondrial translation optimization 1 homolog (S. cerevisiae) 222015_at CSNK1E casein kinase 1 epsilon 222062_at IL27RA interleukin 27 receptor alpha 222144_at KIF17 kinesin family member 17 222158_s_at PPPDE1 PPPDE peptidase domain containing 1 222165_x_at C9orf16 chromosome 9 open reading frame 16 222226_at SAA3P serum amyloid A3 pseudogene 31845_at ELF4 E74-like factor 4 (ets domain transcription factor) 34063_at RECQL5 RecQ protein-like 5 35160_at LDB1 LIM domain binding 1 37943_at ZFYVE26 zinc finger FYVE domain containing 26 38398_at MADD MAP-kinase activating death domain 40359_at RASSF7 Ras association (RalGDS/AF-6) domain family (N-terminal) member 7 41512_at BRAP BRCA1 associated protein 54632_at THADA thyroid adenoma associated 65635_at ENGASE endo-beta-N-acetylglucosaminidase
TABLE-US-00008 TABLE 8 Human Factor 20 PROBE ID SYMBOL GENE NAME 200992_at IPO7 importin 7 201034_at ADD3 adducin 3 (gamma) 201149_s_at TIMP3 TIMP metallopeptidase inhibitor 3 201412_at LRP10 low density lipoprotein receptor-related protein 10 201565_s_at ID2 inhibitor of DNA binding 2 dominant negative helix-loop-helix protein 201651_s_at PACSIN2 protein kinase C and casein kinase substrate in neurons 2 201662_s_at ACSL3 acyl-CoA synthetase long-chain family member 3 201721_s_at LAPTM5 lysosomal protein transmembrane 5 201761_at MTHFD2 methylenetetrahydrofolate dehydrogenase (NADP+ dependent) 2 methenyltetrahydrofolate cyclohydrolase 202350_s_at MATN2 matrilin 2 202628_s_at SERPINE1 serpin peptidase inhibitor clade E (nexin plasminogen activator inhibitor type 1) member 1 203191_at ABCB6 ATP-binding cassette sub-family B (MDR/TAP) member 6 203216_s_at MYO6 myosin VI 203229_s_at CLK2 CDC-like kinase 2 203879_at PIK3CD phosphoinositide-3-kinase catalytic delta polypeptide 203884_s_at RAB11FIP2 RAB11 family interacting protein 2 (class I) 203950_s_at CLCN6 chloride channel 6 204025_s_at PDCD2 programmed cell death 2 204060_s_at NA NA 204215_at C7orf23 chromosome 7 open reading frame 23 204316_at RGS10 regulator of G-protein signaling 10 204387_x_at MRP63 mitochondrial ribosomal protein 63 206541_at KLKB1 kallikrein B plasma (Fletcher factor) 1 208461_at HIC1 hypermethylated in cancer 1 208742_s_at SAP18 Sin3A-associated protein 18 kDa 209043_at PAPSS1 3'-phosphoadenosine 5'-phosphosulfate synthase 1 209115_at UBA3 ubiquitin-like modifier activating enzyme 3 209146_at MSMO1 methylsterol monooxygenase 1 209227_at TUSC3 tumor suppressor candidate 3 209743_s_at ITCH itchy E3 ubiquitin protein ligase homolog (mouse) 210545_at ITSN2 intersectin 2 212027_at RBM25 RNA binding motif protein 25 212668_at SMURF1 SMAD specific E3 ubiquitin protein ligase 1 212871_at MAPKAPK5 mitogen-activated protein kinase-activated protein kinase 5 212969_x_at EML3 echinoderm microtubule associated protein like 3 212983_at HRAS v-Ha-ras Harvey rat sarcoma viral oncogene homolog 213336_at BAZ1B bromodomain adjacent to zinc finger domain 1B 214140_at SLC25A16 solute carrier family 25 (mitochondrial carrier; Graves disease autoantigen) member 16 214355_x_at NA NA 215169_at NA NA 215420_at IHH Indian hedgehog 216975_x_at NPAS1 neuronal PAS domain protein 1 217837_s_at VPS24 vacuolar protein sorting 24 homolog (S. cerevisiae) 217891_at C16orf58 chromosome 16 open reading frame 58 217994_x_at CPSF3L cleavage and polyadenylation specific factor 3-like 218136_s_at SLC25A37 solute carrier family 25 member 37 218478_s_at ZCCHC8 zinc finger CCHC domain containing 8 218675_at SLC22A17 solute carrier family 22 member 17 218756_s_at DHRS11 dehydrogenase/reductase (SDR family) member 11 218882_s_at WDR3 WD repeat domain 3 221087_s_at APOL3 apolipoprotein L3 221778_at JHDM1D jumonji C domain containing histone demethylase 1 homolog D (S. cerevisiae) 221823_at C5orf30 chromosome 5 open reading frame 30 222255_at PRX periaxin 40472_at LPCAT4 lysophosphatidylcholine acyltransferase 4 44617_at OGFOD2 2-oxoglutarate and iron-dependent oxygenase domain containing 2
TABLE-US-00009 TABLE 9 Human Factor 40 PROBE ID SYMBOL GENE NAME 200989_at HIF1A hypoxia inducible factor 1 alpha subunit (basic helix-loop-helix transcription factor) 201772_at AZIN1 antizyme inhibitor 1 202116_at DPF2 D4 zinc and double PHD fingers family 2 202552_s_at CRIM1 cysteine rich transmembrane BMP regulator 1 (chordin-like) 203607_at INPP5F inositol polyphosphate-5-phosphatase F 203643_at ERF Ets2 repressor factor 204161_s_at ENPP4 ectonucleotide pyrophosphatase/phosphodiesterase 4 (putative) 204284_at PPP1R3C protein phosphatase 1 regulatory (inhibitor) subunit 3C 204452_s_at FZD1 frizzled family receptor 1 207583_at ABCD2 ATP-binding cassette sub-family D (ALD) member 2 208701_at APLP2 amyloid beta (A4) precursor-like protein 2 209054_s_at WHSC1 Wolf-Hirschhorn syndrome candidate 1 209593_s_at TOR1B torsin family 1 member B (torsin B) 209840_s_at LRRN3 leucine rich repeat neuronal 3 210736_x_at DTNA dystrobrevin alpha 213611_at AQP5 aquaporin 5 214062_x_at NFKBIB nuclear factor of kappa light polypeptide gene enhancer in B-cells inhibitor beta 214952_at NCAM1 neural cell adhesion molecule 1 216222_s_at MYO10 myosin X 216869_at PDE1C phosphodiesterase 1C calmodulin-dependent 70 kDa 220585_at HKDC1 hexokinase domain containing 1 221402_at OR1F1 olfactory receptor family 1 subfamily F member 1 221651_x_at NA NA 221708_s_at UNC45A unc-45 homolog A (C. elegans) 222296_at NA NA 222316_at NA NA
TABLE-US-00010 TABLE 10 Human Factor 74 PROBE ID SYMBOL GENE NAME 1487_at ESRRA estrogen-related receptor alpha 201045_s_at RAB6A RAB6A member RAS oncogene family 201046_s_at RAD23A RAD23 homolog A (S. cerevisiae) 201751_at JOSD1 Josephin domain containing 1 201752_s_at ADD3 adducin 3 (gamma) 201753_s_at ADD3 adducin 3 (gamma) 201951_at ALCAM activated leukocyte cell adhesion molecule 202058_s_at KPNA1 karyopherin alpha 1 (importin alpha 5) 202579_x_at HMGN4 high mobility group nucleosomal binding domain 4 202786_at STK39 serine threonine kinase 39 202813_at TARBP1 TAR (HIV-1) RNA binding protein 1 202814_s_at HEXIM1 hexamethylene bis-acetamide inducible 1 202954_at UBE2C ubiquitin-conjugating enzyme E2C 203092_at TIMM44 translocase of inner mitochondrial membrane 44 homolog (yeast) 203100_s_at CDYL chromodomain protein Y-like 203276_at LMNB1 lamin B1 203694_s_at DHX16 DEAH (Asp-Glu-Ala-His) box polypeptide 16 203763_at DYNC2LI1 dynein cytoplasmic 2 light intermediate chain 1 203806_s_at FANCA Fanconi anemia complementation group A 203848_at AKAP8 A kinase (PRKA) anchor protein 8 203984_s_at CASP9 caspase 9 apoptosis-related cysteine peptidase 203991_s_at KDM6A lysine (K)-specific demethylase 6A 204056_s_at MVK mevalonate kinase 204109_s_at NFYA nuclear transcription factor Y alpha 204244_s_at DBF4 DBF4 homolog (S. cerevisiae) 204403_x_at FAM115A family with sequence similarity 115 member A 204535_s_at REST RE1-silencing transcription factor 204632_at RPS6KA4 ribosomal protein S6 kinase 90 kDa polypeptide 4 205000_at DDX3Y DEAD (Asp-Glu-Ala-Asp) box polypeptide 3 Y-linked 205098_at CCR1 chemokine (C-C motif) receptor 1 205150_s_at TRIL TLR4 interactor with leucine-rich repeats 205315_s_at SNTB2 syntrophin beta 2 (dystrophin-associated protein A1 59 kDa basic component 2) 205345_at BARD1 BRCA1 associated RING domain 1 205513_at TCN1 transcobalamin I (vitamin B12 binding protein R binder family) 205591_at OLFM1 olfactomedin 1 205718_at ITGB7 integrin beta 7 205848_at GAS2 growth arrest-specific 2 205908_s_at OMD osteomodulin 205948_at PTPRT protein tyrosine phosphatase receptor type T 205980_s_at NA NA 206045_s_at NOL4 nucleolar protein 4 206173_x_at GABPB1 GA binding protein transcription factor beta subunit 1 206253_at DLG2 discs large homolog 2 (Drosophila) 206302_s_at NA NA 206445_s_at PRMT1 protein arginine methyltransferase 1 206525_at GABRR1 gamma-aminobutyric acid (GABA) receptor rho 1 206805_at SEMA3A sema domain immunoglobulin domain (Ig) short basic domain secreted (semaphorin) 3A 206806_at DGKI diacylglycerol kinase iota 207029_at KITLG KIT ligand 207700_s_at NCOA3 nuclear receptor coactivator 3 207864_at SCN7A sodium channel voltage-gated type VII alpha 207871_s_at ST7 suppression of tumorigenicity 7 208017_s_at MCF2 MCF.2 cell line derived transforming sequence 208311_at GPR50 G protein-coupled receptor 50 208955_at DUT deoxyuridine triphosphatase 209192_x_at KAT5 K(lysine) acetyltransferase 5 209346_s_at PI4K2A phosphatidylinositol 4-kinase type 2 alpha 209412_at TRAPPC10 trafficking protein particle complex 10 209598_at PNMA2 paraneoplastic antigen MA2 209620_s_at ABCB7 ATP-binding cassette sub-family B (MDR/TAP) member 7 209621_s_at PDLIM3 PDZ and LIM domain 3 209658_at CDC16 cell division cycle 16 homolog (S. cerevisiae) 209829_at FAM65B family with sequence similarity 65 member B 210033_s_at SPAG6 sperm associated antigen 6 210034_s_at RPL5 ribosomal protein L5 210078_s_at KCNAB1 potassium voltage-gated channel shaker-related subfamily beta member 1 210386_s_at MTX1 metaxin 1 210394_x_at NA NA 210470_x_at NONO non-POU domain containing octamer-binding 210491_at NA NA 210493_s_at MFAP3L microfibrillar-associated protein 3-like 210697_at ZNF257 zinc finger protein 257 211238_at ADAM7 ADAM metallopeptidase domain 7 211691_x_at NA NA 212125_at RANGAP1 Ran GTPase activating protein 1 212338_at MYO1D myosin ID 212340_at YIPF6 Yip1 domain family member 6 212408_at TOR1AIP1 torsin A interacting protein 1 212412_at PDLIM5 PDZ and LIM domain 5 212413_at 6-Sep septin 6 212614_at ARID5B AT rich interactive domain 5B (MRF1-like) 212615_at CHD9 chromodomain helicase DNA binding protein 9 212696_s_at RNF4 ring finger protein 4 212739_s_at NME4 non-metastatic cells 4 protein expressed in 212774_at ZNF238 zinc finger protein 238 212849_at AXIN1 axin 1 213370_s_at SFMBT1 Scm-like with four mbt domains 1 213621_s_at GUK1 guanylate kinase 1 213793_s_at HOMER1 homer homolog 1 (Drosophila) 213912_at TBC1D30 TBC1 domain family member 30 214937_x_at PCM1 pericentriolar material 1 215367_at KIAA1614 KIAA1614 215927_at ARFGEF2 ADP-ribosylation factor guanine nucleotide-exchange factor 2 (brefeldin A-inhibited) 215945_s_at TRIM2 tripartite motif containing 2 216064_s_at AGA aspartylglucosaminidase 216718_at LINC00302 long intergenic non-protein coding RNA 302 216753_at NA NA 217436_x_at NA NA 217440_at NA NA 217496_s_at IDE insulin-degrading enzyme 217892_s_at LIMA1 LIM domain and actin binding 1 217996_at PHLDA1 pleckstrin homology-like domain family A member 1 218111_s_at CMAS cytidine monophosphate N-acetylneuraminic acid synthetase 218962_s_at TMEM168 transmembrane protein 168 218987_at ATF7IP activating transcription factor 7 interacting protein 219045_at RHOF ras homolog gene family member F (in filopodia) 219086_at ZNF839 zinc finger protein 839 219136_s_at LMF1 lipase maturation factor 1 219507_at RSRC1 arginine/serine-rich coiled-coil 1 219508_at GCNT3 glucosaminyl (N-acetyl) transferase 3 mucin type 219569_s_at TMEM22 transmembrane protein 22 219677_at SPSB1 splA/ryanodine receptor domain and SOCS box containing 1 219680_at NLRX1 NLR family member X1 219744_at FN3K fructosamine 3 kinase 219747_at NDNF neuron-derived neurotrophic factor 220068_at VPREB3 pre-B lymphocyte 3 220077_at CCDC134 coiled-coil domain containing 134 220385_at JPH2 junctophilin 2 221240_s_at B3GNT4 UDP-GlcNAc: betaGal beta-13-N-acetylglucosaminyltransferase 4 221245_s_at FZD5 frizzled family receptor 5 221428_s_at TBL1XR1 transducin (beta)-like 1 X-linked receptor 1 221592_at NA NA 221607_x_at ACTG1 actin gamma 1 221608_at WNT6 wingless-type MMTV integration site family member 6 221630_s_at DDX4 DEAD (Asp-Glu-Ala-Asp) box polypeptide 4 222150_s_at PION pigeon homolog (Drosophila) 222285_at NA NA 222288_at NA NA 222289_at KCNC2 potassium voltage-gated channel Shaw-related subfamily member 2 35201_at HNRNPL heterogeneous nuclear ribonucleoprotein L 38487_at STAB1 stabilin 1 38703_at DNPEP aspartyl aminopeptidase 39549_at NPAS2 neuronal PAS domain protein 2 41657_at STK11 serine/threonine kinase 11 41858_at PGAP2 post-GPI attachment to proteins 2 52255_s_at COL5A3 collagen type V alpha 3 74694_s_at RABEP2 rabaptin RAB GTPase binding effector protein 2
TABLE-US-00011 TABLE 11 MRSA v. MSSA Gene Entrez Probe Set ID Symbol Gene Title Gene ID p-value 1420021_s_at Suz12 suppressor of zeste 12 homolog (Drosophila) 52615 5.54E-07 1422842_at Xrn2 5'-3' exoribonuclease 2 24128 9.49E-07 1429432_at Bat2l2 HLA-B associated transcript 2-like 2 226562 7.86E-07 1434391_at AI503316 expressed sequence AI503316 105860 1.02E-06 1439247_at Dock10 dedicator of cytokinesis 10 210293 1.02E-06 1444279_at Huwe1 HECT, UBA and WWE domain containing 1 59026 3.22E-07 1446384_at -- (Unannotated) -- 1.33E-07 1446512_at Zc3h15 zinc finger CCCH-type containing 15 69082 2.34E-07 1449578_at Supt16h suppressor of Ty 16 homolog (S. cerevisiae) 114741 2.91E-07 1450051_at Atrx alpha thalassemia/mental retardation syndrome 22589 6.07E-07 X-linked homolog (human) 1451685_at Mllt6 myeloid/lymphoid or mixed-lineage leukemia 246198 8.09E-07 (trithorax homolog, Drosophila); translocated to, 6 1452470_at Cep350 centrosomal protein 350 74081 1.03E-06 1456112_at Tpr translocated promoter region 108989 8.10E-07 1457731_at Snapc3 small nuclear RNA activating complex, 77634 3.80E-07 polypeptide 3 1459398_at Peli1 Pellino 1 67245 7.47E-07
TABLE-US-00012 TABLE 12 Pathway analysis for the genes from pairwise comparisons in the mouse and human study. Pathways marked with an asterisk (*) correspond to pathways that are present in both the mouse and human response to specified pathogen. MOUSE S. aureus VS. HEALTHY CONTROLS # Pathway p-value 1 Immune response_HMGB1/RAGE signaling pathway 1.58E-14 2 Immune response_T cell receptor signaling pathway 7.40E-14 3 Immune response_CD28 signaling 2.75E-13 4 Transcription_NF-kB signaling pathway 5.45E-13 5 Immune response_Oncostatin M signaling via MAPK in human cells 1.24E-12 6 Transport_Clathrin-coated vesicle cycle 1.29E-12 7 Signal transduction_JNK pathway 5.29E-12 8 Apoptosis and survival_APRIL and BAFF signaling 5.95E-12 9 Immune response_Regulation of T cell function by CTLA-4 6.32E-12 10 Immune response_ICOS pathway in T-helper cell 8.69E-12 11 Immune response_TCR and CD28 co-stimulation in activation of NF-kB 1.24E-11 12 Immune response_IL-3 activation and signaling pathway 1.38E-11 13 Development_Flt3 signaling 2.06E-11 14 Immune response_IL-1 signaling pathway 2.06E-11 15 Immune response_CD137 signaling in immune cell 3.03E-11 16 Immune response_Oncostatin M signaling via MAPK in mouse cells 3.18E-11 17 G-protein signaling_Regulation of p38 and JNK signaling mediated by G- 5.86E-11 proteins 18 Immune response_IL-17 signaling pathways 5.88E-11 19 Reproduction_GnRH signaling 7.27E-11 20 Immune response_CD40 signaling 1.05E-10 21 Development_TGF-beta-dependent induction of EMT via MAPK 1.30E-10 22 Development_Prolactin receptor signaling 1.39E-10 23 Apoptosis and survival_Lymphotoxin-beta receptor signaling 4.08E-10 24 Immune response_Gastrin in inflammatory response 6.02E-10 25 Development_GM-CSF signaling 6.76E-10 26 Immune response_Function of MEF2 in T lymphocytes 6.76E-10 27 Immune response_IL-22 signaling pathway 7.58E-10 28 Immune response_CCR5 signaling in macrophages and T lymphocytes 8.59E-10 29 Immune response_MIF in innate immunity response 9.71E-10 30 Immune response_Fc epsilon RI pathway 1.27E-09 31 Immune response_Immunological synapse formation 1.36E-09 32 Immune response_CXCR4 signaling via second messenger 1.52E-09 33 Chemotaxis_CXCR4 signaling pathway 1.52E-09 34 Immune response_MIF-mediated glucocorticoid regulation 1.68E-09 35 Cytoskeleton remodeling_TGF, WNT and cytoskeletal remodeling 1.68E-09 36 Apoptosis and survival_Anti-apoptotic TNFs/NF-kB/Bcl-2 pathway 1.76E-09 37 Immune response_IL-15 signaling 2.14E-09 38 Immune response_CD16 signaling in NK cells 3.12E-09 39 Cell adhesion_Chemokines and adhesion 3.81E-09 40 Cytokine production by Th17 cells in CF 4.20E-09 41 Mucin expression in CF via TLRs, EGFR signaling pathways 4.38E-09 42 G-protein signaling_Ras family GTPases in kinase cascades (scheme) 4.44E-09 43 Immune response_HMGB1/TLR signaling pathway 5.51E-09 44 Chemotaxis_Leukocyte chemotaxis 6.15E-09 45 Apoptosis and survival_Regulation of Apoptosis by Mitochondrial Proteins 6.98E-09 46 G-protein signaling_N-RAS regulation pathway 6.98E-09 47 Immune response_NFAT in immune response 7.06E-09 48 Immune response_TREM1 signaling pathway 7.58E-09 49 Immune response_IL-27 signaling pathway 1.01E-08 50 Development_NOTCH1-mediated pathway for NF-KB activity modulation 1.31E-08
TABLE-US-00013 TABLE 13 Pathway analysis for the genes from pairwise comparisons in the mouse and human study. Pathways marked with an asterisk (*) correspond to pathways that are present in both the mouse and human response to specified pathogen. HUMAN S. aureus VS. HEALTHY CONTROLS # Pathway p-value 1 Cytoskeleton remodeling_TGF, WNT and cytoskeletal remodeling 5.45E-11 2 Immune response_NFAT in immune response 1.13E-10 3 Cytoskeleton remodeling_Cytoskeleton remodeling 1.45E-09 4 Protein folding and maturation_POMC processing 1.79E-09 5 Immune response_IL-4 signaling pathway 1.43E-08 6 Oxidative phosphorylation 1.47E-08 7 Immune response_CD28 signaling 2.13E-08 8 Immune response_T cell receptor signaling pathway 3.90E-08 9 Immune response_ICOS pathway in T-helper cell 4.51E-08 10 Immune response_TCR and CD28 co-stimulation in activation of NF-kB 4.70E-08 11 Immune response_Function of MEF2 in T lymphocytes 7.12E-08 12 Transcription_Role of heterochromatin protein 1 (HP1) family in 1.31E-07 transcriptional silencing 13 Signal transduction_Activation of PKC via G-Protein coupled receptor 1.90E-07 14 Signal transduction_AKT signaling 2.59E-07 15 Development_TGF-beta receptor signaling 3.47E-07 16 Development_Role of HDAC and calcium/calmodulin-dependentkinase 4.73E-07 (CaMK) in control of skeletal myogenesis 17 Immune response_BCR pathway 4.73E-07 18 Some pathways of EMT in cancer cells 5.51E-07 19 Regulation of degradation of deltaF508 CFTR in CF 8.47E-07 20 Apoptosis and survival_Granzyme A signaling 9.21E-07 21 Immune response_NF-AT signaling and leukocyte interactions 1.16E-06 22 Apoptosis and survival_Endoplasmic reticulum stress response pathway 1.32E-06 23 Development_WNT signaling pathway. Part 2 1.32E-06 24 Immune response_Antigen presentation by MHC class I 1.67E-06 25 Development_PIP3 signaling in cardiac myocytes 1.83E-06 26 Immune response_CD40 signaling 2.34E-06 27 Cytoskeleton remodeling_Regulation of actin cytoskeleton by Rho GTPases 2.68E-06 28 Immune response_IL-10 signaling pathway 3.01E-06 29 Development_PDGF signaling via STATs and NF-kB 3.09E-06 30 Immune response_Immunological synapse formation 3.58E-06 31 Immune response_IL-2 activation and signaling pathway 4.34E-06 32 Translation_Regulation of EIF4F activity 5.37E-06 33 Immune response_IL-27 signaling pathway 5.44E-06 34 Immune response_Bacterial infections in normal airways 6.52E-06 35 Immune response_Th1 and Th2 cell differentiation 7.07E-06 36 Development_Leptin signaling via PI3K-dependent pathway 7.86E-06 38 Development_NOTCH1-mediated pathway for NF-KB activity modulation 9.05E-06 37 Immune response_CXCR4 signaling via second messenger 9.05E-06 39 CFTR folding and maturation (norm and CF) 9.76E-06 40 Immune response _CCR3 signaling in eosinophils 1.02E-05 41 PGE2 pathways in cancer 1.14E-05 42 Development_IGF-1 receptor signaling 1.41E-05 43 Immune response_Antigen presentation by MHC class II 1.51E-05 44 Transport_Clathrin-coated vesicle cycle 1.67E-05 45 Translation_Insulin regulation of translation 1.71E-05 46 Signal transduction_IP3 signaling 1.73E-05 47 Apoptosis and survival_nAChR in apoptosis inhibition and cell cycle 1.82E-05 progression 48 Transcription_NF-kB signaling pathway 2.03E-05 49 G-protein signaling_Regulation of RAC1 activity 2.37E-05 50 Development_GM-CSP signaling 2.52E-05
TABLE-US-00014 TABLE 14 Pathway analysis for the genes from pairwise comparisons in the mouse and human study. Pathways marked with an asterisk (*) correspond to pathways that are present in both the mouse and human response to specified pathogen. MOUSE E. coli VS. HEALTHY CONTROLS # Pathway p-value 1 Development_VEGF signaling via VEGFR2 - generic cascades 5.51E-14 2 Immune response_CCR5 signaling in macrophages and T lymphocytes 4.40E-13 3 Immune response_CD28 signaling 6.16E-12 4 Development_A2A receptor signaling 3.10E-11 5 Cytoskeleton remodeling_Role of PKA in cytoskeleton reorganisation 7.11E-11 6 Apoptosis and survival_Granzyme B signaling 1.13E-10 7 Immune response_Gastrin in inflammatory response 2.52E-10 8 Development_Prolactin receptor signaling 2.63E-10 9 Immune response_HMGB1/RAGE signaling pathway 2.97E-10 10 Apoptosis and survival_BAD phosphorylation 1.82E-09 11 Immune response_TREM1 signaling pathway 2.69E-09 12 Apoptosis and survival_Anti-apoptotic action of Gastrin 2.81E-09 13 Cytoskeleton remodeling_TGF, WNT and cytoskeletal remodeling 3.96E-09 14 Immune response_IL-1 signaling pathway 4.27E-09 15 Development_GM-CSF signaling 5.64E-09 16 Immune response_Function of MEF2 in T lymphocytes 5.64E-09 17 Development_Growth hormone signaling via STATs and PLC/IP3 6.47E-09 18 Cytoskeleton remodeling_Reverse signaling by ephrin B 9.11E-09 19 Immune response_HMGB1 release from the cell 1.04E-08 20 Immune response_HMGB1/TLR signaling pathway 1.04E-08 21 Immune response_Inhibitory action of Lipoxins on pro-inflammatory TNF- 1.38E-08 alpha signaling 22 Blood coagulation_GPCRs in platelet aggregation 1.73E-08 23 Immune response_Histamine H1 receptor signaling in immune response 2.00E-08 24 Immune response _IFN gamma signaling pathway 2.29E-08 25 Immune response_IL-22 signaling pathway 2.45E-08 26 Signal transduction_cAMP signaling 2.51E-08 27 Cell adhesion_Chemokines and adhesion 3.31E-08 28 Development_Flt3 signaling 3.40E-08 29 Signal transduction_Erk Interactions: Inhibition of Erk 3.89E-08 30 G-protein signaling_G-Protein alpha-q signaling cascades 3.89E-08 31 Development_Gastrin in cell growth and proliferation 4.41E-08 32 Chemotaxis_Leukocyte chemotaxis 5.03E-08 33 Development_EGFR signaling pathway 5.89E-08 34 Chemotaxis_Lipoxin inhibitory action on fMLP-induced neutrophil 7.04E-08 chemotaxis 35 Immune response_ICOS pathway in T-helper cell 7.04E-08 36 Immune response_IL-15 signaling 7.81E-08 37 Signal transduction_Activation of PKC via G-Protein coupled receptor 7.83E-08 38 Regulation of CFTR activity (norm and CF) 8.05E-08 39 Immune response_Fc gamma R-mediated phagocytosis in macrophages 9.96E-08 40 G-protein signaling_G-Protein alpha-12 signaling pathway 1.39E-07 41 Cell adhesion_Role of tetraspanins in the integrin-mediated cell adhesion 1.39E-07 42 Apoptosis and survival_HTR1A signaling 2.65E-07 43 Immune response_Bacterial infections in normal airways 2.65E-07 44 HIV-1 signaling via CCR5 in macrophages and T lymphocytes 2.99E-07 45 Transcription_NF-kB signaling pathway 2.99E-07 46 Immune response_CXCR4 signaling via second messenger 3.39E-07 47 Cell adhesion_Ephrin signaling 3.44E-07 48 Cell adhesion_Histamine H1 receptor signaling in the interruption of cell 3.44E-07 barrier integrity 49 Immune response_NFAT in immune response 3.60E-07 50 Some pathways of EMT in cancer cells 3.60E-07
TABLE-US-00015 TABLE 15 Pathway analysis for the genes from pairwise comparisons in the mouse and human study. Pathways marked with an asterisk (*) correspond to pathways that are present in both the mouse and human response to specified pathogen. HUMAN E. coli VS. HEALTHY CONTROLS # Pathway p-value 1 Cytoskeleton remodeling_TGF, WNT and cytoskeletal remodeling 2.76E-10 2 Immune response_HMGB1/RAGE signaling pathway 1.15E-09 3 Development_EPO-induced Jak-STAT pathway 6.64E-09 4 Immune response_Oncostatin M signaling via MAPK in mouse cells 6.64E-09 5 Cytoskeleton remodeling_Cytoskeleton remodeling 7.59E-09 6 Protein folding and maturation_POMC processing 9.88E-09 7 Development_Prolactin receptor signaling 1.59E-08 8 Immune response_IL-2 activation and signaling pathway 2.29E-08 9 Immune response_ICOS pathway in T-helper cell 2.48E-08 10 Immune response_Immunological synapse formation 2.56E-08 11 Immune response_Oncostatin M signaling via MAPK in human cells 2.64E-08 12 Immune response_NFAT in immune response 6.40E-08 13 Transcription_Role of heterochromatin protein 1 (HP1) family in 8.70E-08 transcriptional silencing 14 Immune response_T cell receptor signaling pathway 1.04E-07 15 Immune response_Function of MEF2 in T lymphocytes 1.95E-07 16 Immune response_IL-4 signaling pathway 2.55E-07 18 Immune response _IFN gamma signaling pathway 2.63E-07 19 Immune response_BCR pathway 2.63E-07 17 Immune response_CD28 signaling 2.63E-07 20 Immune response_Histamine H1 receptor signaling in immune response 3.65E-07 21 Immune response_CD16 signaling in NK cells 3.87E-07 22 PGE2 pathways in cancer 4.07E-07 23 Development_VEGF signaling via VEGFR2 - generic cascades 4.14E-07 24 Development_Thrombopoietin-regulated cell processes 4.21E-07 25 Immune response_IL-4 - antiapoptotic action 5.94E-07 26 Normal and pathological TGF-beta-mediated regulation of cell proliferation 5.96E-07 27 Immune response_Th1 and Th2 cell differentiation 8.97E-07 28 Development_TGF-beta receptor signaling 9.11E-07 29 Chemotaxis_CXCR4 signaling pathway 1.07E-06 30 Development_PIP3 signaling in cardiac myocytes 1.09E-06 31 Development_Role of HDAC and calcium/calmodulin-dependent kinase 1.15E-06 (CaMK) in control of skeletal myogenesis 32 Immune response_Gastrin in inflammatory response 1.44E-06 33 Cell adhesion_Chemokines and adhesion 1.52E-06 34 Transcription_Role of AP-1 in regulation of cellular metabolism 1.69E-06 35 Transcription_Sin3 and NuRD in transcription regulation 1.69E-06 37 Development_Growth hormone signaling via PI3K/AKT and MAPK cascades 2.40E-06 36 Translation_Insulin regulation of translation 2.40E-06 38 Signal transduction_IP3 signaling 2.61E-06 39 Translation _Regulation of EIF2 activity 2.78E-06 40 Immune response_NF-AT signaling and leukocyte interactions 3.16E-06 43 Immune response_IL-12-induced IFN-gamma production 3.17E-06 42 Immune response_IL-9 signaling pathway 3.17E-06 41 Immune response_Regulation of T cell function by CTLA-4 3.17E-06 44 Translation _Regulation of EIF4F activity 3.18E-06 45 Immune response_IL-15 signaling 3.32E-06 47 G-protein signaling_N-RAS regulation pathway 3.52E-06 46 Immune response_IL-22 signaling pathway 3.52E-06 48 Immune response_IL-27 signaling pathway 3.77E-06 49 Apoptosis and survival_Granzyme A signaling 3.78E-06 50 Immune response_Signaling pathway mediated by IL-6 and IL-1 3.78E-06
TABLE-US-00016 TABLE 16 Pathway analysis for the genes from pairwise comparisons in the mouse and human study. MOUSE S. aureus VS. E. coli # Pathway p-value 1 Cytoskeleton remodeling_TGF, WNT and cytoskeletal remodeling 4.98E-13 2 Development_IGF-1 receptor signaling 1.17E-12 3 Transport_Clathrin-coated vesicle cycle 1.27E-12 4 Development_PIP3 signaling in cardiac myocytes 2.24E-12 5 Immune response_HMGB1/RAGE signaling pathway 2.32E-12 6 Immune response_IL-15 signaling 6.07E-12 7 Immune response_IL-2 activation and signaling pathway 9.24E-12 8 Development_GM-CSF signaling 1.80E-11 9 Immune response_HMGB1/TLR signaling pathway 2.74E-11 10 Apoptosis and survival_APRIL and BAFF signaling 3.22E-11 11 Immune response_IL-3 activation and signaling pathway 3.84E-11 12 Cell adhesion_Chemokines and adhesion 4.55E-11 13 Immune response_CD40 signaling 6.24E-11 14 Signal transduction_AKT signaling 7.25E-11 15 Immune response_Gastrin in inflammatory response 8.44E-11 16 Cytoskeleton remodeling_Cytoskeleton remodeling 3.97E-10 17 Development_NOTCH1-mediated pathway for NF-KB activity modulation 5.11E-10 18 Cell cycle_Influence of Ras and Rho proteins on G1/S Transition 7.37E-10 19 Apoptosis and survival_HTR1A signaling 8.53E-10 20 Immune response_IL-1 signaling pathway 1.06E-09 21 Transcription_NF-kB signaling pathway 2.25E-09 22 Immune response_Regulation of T cell function by CTLA-4 2.27E-09 23 Immune response_IL-17 signaling pathways 4.61E-09 24 Immune response_Bacterial infections in normal airways 5.21E-09 25 Mucin expression in CF via TLRs, EGFR signaling pathways 5.21E-09 26 Development_TGF-beta-dependent induction of EMT via MAPK 6.16E-09 27 Apoptosis and survival_Anti-apoptotic TNFs/NF-kB/Bcl-2 pathway 7.98E-09 28 Development_EPO-induced Jak-STAT pathway 9.02E-09 29 Development_VEGF signaling via VEGFR2 - generic cascades 1.01E-08 30 Immune response_Histamine H1 receptor signaling in immune response 1.06E-08 31 Apoptosis and survival_Regulation of Apoptosis by Mitochondrial Proteins 1.80E-08 32 Apoptosis and survival_Endoplasmic reticulum stress response pathway 2.37E-08 33 Immune response_Oncostatin M signaling via MAPK in human cells 3.27E-08 34 Development_Role of HDAC and calcium/calmodulin-dependent kinase 3.79E-08 (CaMK) in control of skeletal myogenesis 35 Development_FGFR signaling pathway 3.79E-08 36 Immune response_BCR pathway 3.79E-08 37 Development_Flt3 signaling 4.37E-08 38 Immune response_CCR5 signaling in macrophages and T lymphocytes 4.62E-08 39 Apoptosis and survival_Granzyme B signaling 7.07E-08 40 NGF activation of NF-kB 7.15E-08 41 Development_Thrombopoietin-regulated cell processes 7.35E-08 42 Apoptosis and survival_Lymphotoxin-beta receptor signaling 8.88E-08 43 Development_Growth hormone signaling via PI3K/AKT and MAPK cascades 8.88E-08 44 Development_PEDF signaling 9.68E-08 45 Development_A3 receptor signaling 9.68E-08 46 Transcription_Receptor-mediated HIF regulation 1.05E-07 47 IL-1 beta-dependent CFTR expression 1.19E-07 48 Translation _Regulation of EIF4F activity 1.20E-07 49 Immune response_ICOS pathway in T-helper cell 1.21E-07 50 Proteolysis_Role of Parkin in the Ubiquitin-Proteasomal Pathway 1.31E-07
TABLE-US-00017 TABLE 17 Genes in pathways common to murine and human responses to infection. Human genes are in the top row for each pathway. Murine genes are in the bottom row for each pathway. Pairwise comparison Pathway Genes S. aureus Cytoskeleton AKT1 AKT3 ACTG1 ACTR3 ACTR3B ARPC1A ARPC2 vs. Healthy remodeling_TGF, WNT AXIN1 CRK CSNK2A1 CSNK2B COL4A2 COL4A3 and cytoskeletal DSTN DVL1 DVL2 DVL3 PTK2 FZD3 FZD5 FZD7 remodeling GSK3B CHUK LIMK2 LAMA1 LAMC1 MYL6 MYL6B PPP1CB PPP1R12A MMP13 MKNK1 MYL12A MYL12B RPS6KA5 NCL PIK3CB PIK3R1 PIK3R3 PLAUR PPARD RHEB ROCK2 SMAD3 SOS2 TAB1 TCF7L2 TGFB1 TGFBR1 TLN2 LEF1 TCF7 TSC2 VAV1 VEGFA VCL MYC SRC MTOR CDKN2B MAPK13 MAPK14 tP53 Akt1 Akt3 Acta2 Actb Actg1 Actn4 Actr2 Actr3 Arpc1b Arpc4 Arpc5 Axin2 Ctnnb1 Cdc42 Crk Col4a2 Dstn Dvl2 Mapk1 Fzd1 Fzd7 Grb2 Mdm2 Ppp1r12a Map3k11 Rps6ka5 Nlk Serpine1 Pak1 Plaur Ppard Pxn Rheb Rhoa Sos1 Sos2 Map3k7 Tgfbr2 Lef1 Tcf7 Vav1 Jun Myc Raf1 Eif4e Cdkn1a Mapk11 Mapk13 Immune response_NFAT AKT1 AKT3 BLNK CD28 CD247 CD3D CD3E CD3G in immune response CD79A CD79B PPP3CC CALM1 CALM3 FCER1A FCER1G GSK3B NFKBIA CHUK IKBKB ITPR1 ITPR3 ITK IGHV3-23 IGKC IGK@ IGL@ IGHM LAT LCK LYN HLA-DMA HLA-DMB HLA-DOA HLA-DOB HLA-DPA1 HLA-DPB1 HLA-DQA1 HLA-DQA2 HLA-DQB1 HLA- DRA HLA-DRB1 HLA-DRB3 HLA-DRB4 HLA-DRB5 NFAT5 NFATC1 NFATC3 REL RELA PIK3CB PIK3R1 PIK3R3 PRKCQ PLCG1 TRAC TRA@ TRAT1 VAV1 ZAP70 Akt1 Akt3 Blnk Cd28 Cd247 Cd3d Cd3e Cd3g Cd79a Cd79b Cd80 Cd86 Fcer1g Ms4a2 Nfkbia Nfkbib Nfkbie Ikbkb Itpr2 Itpr3 Itk Igk Lat Lck H2-Eb2 Nfatc2 Nfatc3 Relb Nfkb2 Rel Rela Prkcq Plcg1 Lcp2 Tcrb-J Trat1 Vav1 Zap70 Immune response_CD28 AKT1 AKT3 BAD BCL2L1 CD28 CD247 CD3D CD3E signaling CD3G PPP3CC CALM1 CALM3 FYN GRAP2 GSK3B NFKBIA CHUK IKBKB ITPR1 ITPR3 ITK LAT LCK NFAT5 NFATC1 NFATC3 REL RELA PIK3CB PIK3R1 PIK3R3 PRKCQ PLCG1 TRAC TRA@ VAV1 ZAP70 Akt1 Akt3 Bad Bc2al1 Cd28 Cd247 Cd3d Cd3e Cd3g Cd80 Cd86 Fyn Grap2 Grb2 Nfkbia Nfkbib Nfkbie Ikbkb Itpr2 Itpr3 Itk Mapk8 Lat Lck Map2k4 Map2k7 Nfatc2 Nfatc3 Relb Nfkb2 Rel Rela Pak1 Prkcq Plcg1 Lcp2 Tcrb-J Vav1 Zap70 Jun Immune response_T cell CD247 CD3D CD3E CD3G CD4 RASGRP1 PPP3CC receptor signaling CALM1 CALM3 ELK1 FYN NFKBIA CHUK IKBKB pathway ITPR1 ITPR3 ITK LAT LCK MALT1 HLA-DMA HLA- DMB HLA-DOA HLA-DOB HLA-DPA1 HLA-DPB1 HLA-DQA1 HLA-DQA2 HLA-DQB1 HLA-DRA HLA- DRB1 HLA-DRB3 HLA-DRB4 HLA-DRB5 NFATC1 NFATC3 REL RELA PRKCQ PLCG1 SOS2 TRAC TRA@ TRAT1 VAV1 ZAP70 Bcl10 Card11 Cd247 Cd3d Cd3e Cd3g Cd4 Rasgrp1 Mapk1 Elk1 Fyn Grb2 Nfkbia Nfkbib Nfkbie Ikbkb Itpr2 Itpr3 Itk Lat Lck H2-Eb2 Ube2v2 Nfatc2 Nfatc3 Relb Nfkb2 Rel Rela Prkcq Plcg1 Sos1 Sos2 Lcp2 Tcrb-J Trat1 Vav1 Zap70 Fos Raf1 Immune response_ICOS AKT1 AKT3 BAD CD28 CD247 CD3D CD3E CD3G pathway in T-helper cell PPP3CC CALM1 CALM3 GNA15 GNB5 GNB1 GNG10 GNG3 GNG5 NFKBIA ICOS IKBKB ITPR1 ITPR3 ITK LAT LCK HLA-DMA HLA-DMB HLA-DOA HLA-DOB HLA-DPA1 HLA-DPB1 HLA-DQAI HLA-DQA2 HLA- DQB1 HLA-DRA HLA-DRB1 HLA-DRB3 HLA-DRB4 HLA-DRB5 REL RELA PIK3CB PIK3R1 PIK3R3 PRKCQ PLCG1 TRAC TRA@ TRAT1 VAV1 ZAP70 Akt1 Akt3 Bad Cd28 Cd247 Cd3d Cd3e Cd3g Cd80 Cd86 Cdc42 Gnb1 Gnb2 Gng12 Gng2 Gab2 Grb2 Nflcbia Nfkbib Nfkbie Ikbkb Itpr2 Itpr3 Itk Lat Lck H2-Eb2 Nfatc2 Relb Nfkb2 Rel Rela Pik3r5 Prkcq Plcg1 Lcp2 Tcrb-J Trat1 Vav1 Zap70 Immune response_TCR AKT1 AKT3 CD28 CD247 CD3D CD3E CD3G CD4 and CD28 co-stimulation GRAP2 NFKBIA CHUK IKBKB ITK LAT LCK MALT1 in activation of NF-kB HLA-DMA HLA-DMB HLA-DOA HLA-DOB HLA-DPA1 HLA-DPB1 HLA-DQA1 HLA-DQA2 HLA-DQB1 HLA- DRA HLA-DRB1 HLA-DRB3 HLA-DRB4 HLA-DRB5 REL RELA PIK3CB PIK3R1 PIK3R3 PRKCQ PLCG1 TRAC TRA@ VAV1 ZAP70 Akt1 Akt3 Bcl10 Card11 Cd28 Cd247 Cd3d Cd3e Cd3g Cd4 Cd80 Cd86 Grap2 Grb2 Nfkbia Nfkbib Nfkbie Ikbkb Itk Lat Lck H2-Eb2 Ube2v2 Relb Nfkb2 Rel Rela Prkcq Plcg1 Lcp2 Tcrb-J Vav1 Zap70 Immune CABIN1 CALM1 CALM3 CAMK4 CAMKK2 CARM1 response_Function of CD247 CD3D CD3E CD3G HDAC1 HDAC4 HDAC5 MEF2 in T lymphocytes HDAC9 ITPR1 ITPR3 LAT LCK MAP2K5 MAP2K6 MAPK14 MEF2A MEF2B MEF2C NCOA2 PLCG1 PPP3CC PRKCA PRKCG PRK CH PRKCQ PRKCZ PRKD3 TRA@ TRAC YWHAQ ZAP70 Cabin1 Camk4 Camkk1 Cd247 Cd3d Cd3e Cd3g Hdac4 Hdac7 IL2 Itpr2 Itpr3 Jun Lat Lck Map2k6 Map3k3 Mapk11 Mef2c Mef2d Ncoa2 Nfatc2 Nr4a1 Plcg1 Prkcd Prkce Prkcq Prkd2 Prkd3 Tcrb-J Ywhab Ywhae Ywhag Zap70 Immune response_CD40 AKT1 AKT3 BCL2L1 CCND2 CD40LG CFLAR CHUK signaling FAS FASLG FCER2 ICAM1 IKBKB JAK2 JAK3 LTA LYN MAP3K14 MAPK13 MAPK14 NFKBIA PIK3CB PIK3R1 REL RELA TNFAIP3 TP53 TRAF1 TRAF3IP2 TRAF5 Akt1 Akt3 Bcl211 Cbl Cc112 Cd80 Cd86 Cflar Fas Fcer2a Icam1 Ikbkb Il6 Irf1 Jak2 Jun Map2k4 Map3k14 Map3k7 Mapk11 Mapk13 Mapk8 Nfkb2 Nfkbia Nfkbib Nfkbie Ptgs2 Rel Rela Relb Smpd1 Stat3 Tnfaip3 Traf1 Traf5 Traf6 Immune ACTG1 ACTR3 ACTR3B ARF6 ARPC1A ARPC2 CD2 response_Immunological CD247 CD28 CD3D CD3E CD3G CD4 CD58 CRKL synapse formation CXCR4 CYTH1 DOCK2 FYN GNB1 GNB5 GNG10 GNG3 GNG5 HLA-DMA HLA-DMB HLA-DOA HLA- DOB HLA-DPA1 HLA-DPBI HLA-DQA1 HLA-DQA2 HLA-DQB1 HLA-DRA HLA-DRB1 HLA-DRB3 HLA- DRB4 HLA-DRB5 ICAM1 ICAM2 ITPR1 ITPR3 PIK3CB PIK3R1 PIK3R3 PLCG1 RASGRP2 SKAP1 TLN2 TRA@ TRAC VAV1 VCL Actb Actg1 Actn4 Actr2 Actr3 Arf6 Arpc1b Arpc4 Arpc5 Cb1 Cd2 Cd247 Cd28 Cd3d Cd3e Cd3g Cd4 Cd80 Cd86 Cdc42 Cxcr4 Fyn Gnb1 Gnb2 Gng12 Gng2 Grb2 H2-Eb2 Icam1 Icam2 Itgb2 Itpr2 Itpr3 Lcp2 Pik3r5 Plcg1 Rac2 Rasgrp2 Skapl Tcrb-J Vav1 Immune response_IL-27 CD28 ICAM1 IFNGR1 IL10 IL12RB2 EB13 IL27RA IL6ST signaling pathway JAK1 JAK2 REL RELA SOCS3 STAT1 TBX21 MYC Cd28 Icam1 Ifng Ifngr2 Il10 Il2 Ebi3 Ill27ra Il6st Jak2 Relb Nfkb2 Rel Rela Pim1 Socs3 Stat1 Stat3 Itgb2 Myc Development_NOTCH1- ADAM17 HDAC1 RBBP4 RBBP7 H3F3A H3F3B mediated pathway for HIST1H4B HIST1H4D HIST1H4E HIST1H4F HIST1H4H NF-KB activity HIST1H4J HIST1H4K HIST2H4A HIST2H4B NFKBIA modulation CHUK IKBKB ILIA IL1R1 JAG1 NCOR1 REL RELA MAP3K14 RBPJ SAP30 NCOR2 APH1B PSEN1 PSENEN Adam17 Rbbp4 H3f3b Hist1 h4j Nfkbia Nfkbib Nfkbie Ikbkb Il1a Irak2 Jag1 Ncor1 Relb Nfkb2 Rel Rela Map3k14 Notch1 Rbpj Sap30 Traf6 Aph1a Aph1b Aph1c Ncstn Psen1 Immune AKT1 AKT3 CXCR4 FYN GNAI3 GNAZ GNB5 GNB1 response_CXCR4 GNG10 GNG3 GNG5 NFKBIA CHUK IKBKB ITPR1 signaling via second ITPR3 ITK LAT LCK REL RELA PRKCQ PLCG1 ZAP70 messenger Akt1 Akt3 Cxcr4 Fyn Gnai1 Gnai2 Gnai3 Gnb1 Gnb2 Gng12 Gng2 Nfkbia Nfkbib Nfkbie Ikbkb Itpr2 Itpr3 Itk Lat Lck Relb Nfkb2 Rel Rela Pik3r5 Prkcq Plcb3 Plcg1 Ptk2b Lcp2 Zap70 Transport_Clathrin- AP1G1 AP1S1 AP2M1 ACTG1 BIN1 SAR1A SAR1B coated vesicle cycle SEC24A SEC24C SEC24D SEC31A SEC31B CLTC COPA COPB1 COPZ1 SH3GLB1 EPN1 HIP1R MYOIE NSF PIK3C3 PIK3R4 RABGEF1 RAB11A RAB4A RAB7A RAB11FIP1 STX12 STX16 STX7 STX8 PLIN3 VAMP2 VAMP4 VAMP7 YKT Ap1b1 Ap1g1 Ap1g2 Ap2a2 Ap2b1 Arf1 Acta2 Actb Actg1 Bin1 Sar1a Sec23b Sec24b Sec24d Cltc Cltb Arcn1 Copb1 Dab2 Eeal Gosr1 Hip1 Hip1r Nsf Picalm Pikfyve Preb Rabgef1 Rab4b Rab5a Rab7 Rab8a Rab11 fip1 Stx12 Stx16 Stx6 Stx7 Vamp2 Vamp4 Vamp8 Vti1a Vti1b Ykt6 Transcription_NF-kB AKT1 AKT3 CD28 NFKBIA IKBKAP CHUK IKBKB signaling pathway ILIA IL1R1 IRAK3 LY96 MYD88 REL RELA MAP3K14 PRKCQ TRAC TRA@ TNFRSF1B LTA TRADD Akt1 Akt3 Cd14 Cd28 Nfkbia Nfkbib Nfkbie Ikbkb I11a Il1rap Irak2 Irak3 Lbp Ltbr Ly96 Myd88 Relb Nfkb2 Rel Rela Map3k14 Prkcq Ripk2 Tcrb-J Tlr4 Tnfrsf1a Tnfrsf1b Tnf Traf6 Development_GM-CSF AKT1 AKT3 BAD BCL2 BCL2L1 CSF2RA CASP3 ELK1 signaling HCK NFKBIA CHUK IKBKB JAK2 LYN REL RELA PIK3CB PIK3R1 GNB2L1 SOS2 STAT5B MYC Akt1 Akt3 Bad Bc12 Bcl211 Ccl12 Cish Csf2ra Csf2rb Egr1 Mapk1 Elk1 Grb2 Hck Nfkbia Nfkbib Nfkbie Ikbkb Jak2 Mcl1 Relb Nfkb2 Rel Rela Pim1 Sos1 Sos2 Stat3 Fos Myc E. coli vs. Cytoskeleton AKT1 AKT3 ACTG1 ARPC1A ARPC2 SERPING1 CRK Healthy remodeling_TGF, WNT CSNK2A1 CCND1 DVL2 DVL3 MAPK1 PTK2 FZD5 and cytoskeletal GRB2 GSK3B LIMK2 LAMA1 MYL6 MYL6B PPP1R12A remodeling MMP13 MKNKI MYL12A MYL12B RPS6KA5 NCL PIK3CB PIK3R1 PIK3R3 PLAUR PPARD SMAD2 SMAD3 SOS2 SHC1 TCF7L2 TGFB1 TGFBR1 LEF1 TCF7 TSC2 VAV1 VCL WNT11 WNT8B XIAP JUN MYC SRC MTOR CDKN2B MAPK13 MAPK14 TP53 Akt1 Akt2 Akt3 Acta2 Actb Actg1 Actr2 Arpc4 Ctnnb1 Cdc42 Crk Csnk2a1 Csnk2a2 Cfl2 Col4a2 Dock1 Dstn Dvl3 Ptk2 Foxo3 Fn1 Fzd1 Fzd3 Grb2 Chuk Limk2 Lamc1 Mdm2 Ppp1cb Ppp1r12a Map3k11 Mknk1 My12 Rps6ka5 Ncl Serpine1 Pik3r3 Plaur Pxn Rheb Rock1 Rock2 Smad2 Sos1 Sos2 Shc1 Map3k7 Tgfbr1 Vcl Wnt8b Wnt16 Wnt5a Jun Myc Raf1 Eif4e Mtor Cdkn1a Mapk13 Mapk14 Immune AKT1 AKT3 DIAPH1 MAPK1 PTK2 HMGB1 NFKBIA response_HMGB1/RAGE NFKBIB ICAM1 IL1A IL1B IL1RN MAPK9 KRAS signaling pathway MEF2A MEF2C MAP2K6 MYOG RELB PIK3CB PIK3R1 AGER TLR2 TNF JUN SRC NOS2 MAPK13 MAPK14 Akt1 Akt2 Akt3 Cdc42 Diap1 Ptk2 Nfkbia Nfkbib Icam1 Il1a Il1b Il6 Il1rn Kras Mef2a Mef2c Map2k6 Cc14 Relb Nfkb2 Rel Rela Serpine1 Pxn Scg2 Tlr2 Tlr4 Tnf F3 Vcam1 Jun Raf1 Mapk13 Mapk14 Rps6ka3 Development_Prolactin AKT1 AKT3 BCL2 CEBPB CREBBP CCND1 MAPK1 receptor signaling FYN GRB2 IRS1 JAK2 NEK3 NMI PIK3CB PIK3R1 PLCG1 PRL PTPN11 SOCS1 SOCS3 SOS2 STAT1 STAT5B SHC1 VAV1 CBL JUN MYC SRC Akt1 Akt2 Akt3 Bcl2 Bcl211 Csn2 Cebpb Nr3c1 Grb2 Jak2 Rela Socs1 Socs3 Sos1 Sos2 Stat3 Stat5a Shc1 Vav2 Cb1 Jun Myc Raf1 Immune response_ICOS AKT1 AKT3 BAD CD28 CD247 CD3D CD3E CD3G pathway in T-helper cell PPP3CC CALM1 GNA15 GNB5 GNB1 GNG10 GNG5 GRB2 NFKBIA NFKBIB ICOS IKBKB ITPR1 ITPR2 ITPR3 ITK LAT LCK HLA-DMA HLA-DMB HLA-DOB HLA-DPA1 HLA-DPB1 HLA-DQA1 HLA-DQA2 HLA- DQB1 HLA-DRA HLA-DRB1 HLA-DRB3 HLA-DRB4 HLA-DRB5 RELB PIK3CB PIK3CG PIK3R1 PIK3R3 PRKCQ PLCG1 TRAC TRA@ VAV1 ZAP70 Akt1 Akt2 Akt3 Cd247 Cd3g Cd80 Cd86 Cdc42 Ppp3ca Ppp3cb Gnb1 Gnb5 Gng10 Gng12 Gng13 Gngt1 Gngt2 Gab2 Grb2 Nfkbia Nfkbib Icosl Ikbkb Itpr3 Lat Lck H2-Eb2 Nfatc2 Relb Nfkb2 Rel Rela Pdpk1 Pik3r3 Pik3r5 Lcp2 Tcrb-J Tratl Zap70 Immune response_NFAT AKT1 AKT3 BLNK CD28 CD247 CD3D CD3E CD3G in immune response CD79A CD79B PPP3CC CALM1 FCER1A FCER1G GSK3B NFKBIA NFKBIB IKBKB ITPR1 ITPR2 ITPR3 ITK IGHV3-23 1GKC IGK@ IGL@ IGHM LAT LCK LYN HLA-DMA HLA-DMB HLA-DOB HLA-DPA1 HLA- DPB1 HLA-DQA1 HLA-DQA2 HLA-DQB1 HLA-DRA HLA-DRB1 HLA-DRB3 HLA-DRB4 HLA-DRB5 NFAT5 NFATC1 NFATC3 RELB PIK3CB P1K3R1 PIK3R3 PRKCQ PLCG1 TRAC TRA@ VAV1 ZAP70 Akt1 Akt2 Akt3 Cd247 Cd3g Cd79a Cd79b Cd80 Cd86 Ppp3ca Ppp3cb Ms4a2 Nfkbia Nfkbib Chuk Ikbkb Itpr3 Igk Lat Lck Lyn H2-Eb2 Nfat5 Nfatc2 Relb Nfkb2 Rel Rela Pik3r3 Lcp2 Syk Tcrb-J Trat1 Zap70 Immune CABIN1 CALM1 CAMK4 CAMKK2 CD247 CD3D CD3E response_Function of CD3G HDAC1 HDAC4 HDAC9 ITPR1 ITPR2 ITPR3 JUN MEF2 in T lymphocytes LAT LCK MAP2K5 MAP2K6 MAPK14 MEF2A MEF2B MEF2C NCOA2 PLCG1 PPP3CC PRKCA PRKCH PRKCQ PRICD3 TRA@ TRAC YWHAQ ZAP70 Cd247 Cd3g Hdac2 Hdac7 Itpr3 Jun Kat2b Lat Lck Map2k5 Map2k6 Mapk14 Mapk7 Mef2a Mef2c Mef2d Ncoa2 Nfatc2 Ppp3ca Ppp3cb Prkci Prkd2 Tcrb-J Ywhab Ywhae Ywhag Ywhaq Ywhaz Zap70 Immune response _IFN AKT1 AKT3 CALM1 CAMK2G CBL CEBPB CREBBP gamma signaling pathway CRKL ICAM1 IFNGR1 IFNGR2 ITPR1 ITPR2 ITPR3 JAK1 JAK2 MAP2K6 MAP3K4 MAPK1 MAPK13 MAPK14 MCM5 MYC PIK3CB PIK3R1 PIK3R3 PRKCA PTPN11 SMAD7 SOCS1 SRC STAT1 STAT2 Afap1 Akt1 Akt2 Akt3 Cebpb Crkl Icam1 Itpr3 Stat2 Jak2 Mcm5 Map2k6 Map3k4 Pdpk1 Pik3r3 Ptk2b Smad7 Socs1 Cbl Myc Cdkn1a Mapk13 Mapk14 Immune response_CD28 AKT1 AKT3 BAD CALM1 CD247 CD28 CD3D CD3E signaling CD3G FYN GRB2 GSK3B IKBKB ITK ITPR1 ITPR2 ITPR3 JUN LAT LCK MAPK9 NFAT5 NFATC1 NFATC3 NFKBIA NFKBIB PIK3CB PIK3R1 PIK3R3 PLCG1 PPP3CC PRKCQ RELB TRA@ TRAC VAV1 ZAP70 Akt1 Akt2 Akt3 Bcl211 Cd247 Cd3g Cd80 Cd86 Chuk Grap2 Grb2 Ikbkb Itpr3 Jun Lat Lck Lcp2 Map2k4 Nfat5 Nfatc2 Nfkb2 Nfkbia Nfkbib Pik3r3 Pip5k1a Ppp3ca Ppp3cb Rel Rela Relb Tcrb-J Zap70 Immune CALM1 GNA11 GNB1 GNB5 GNG10 GNG5 ICAM1 response_Histamine H1 IKBKB ITPR1 ITPR2 ITPR3 JUN MAPK1 MAPK13 receptor signaling in MAPK14 MAPK9 MMP1 MMP13 MMP3 MMP9 NFATC1 immune response NFKBIA NFKBIB NOS2 PLA2G4A PLCB2 PPP3CC PRKCA TNF Chuk F3 Fos Gnaq Gnb1 Gnb5 Gng10 Gng12 Gng13 Gngt1 Gngt2 Icam1 Ikbkb Il6 Itpr3 Jun Mapk13 Mapk14 Mmp1a
Nfkbia Nfkbib Nos3 Pla2g4a Pla2g4c Plcb1 Plcb4 Ppp3ca Ppp3cb Ppp3r1 Raf1 Rela Tnf Vcam1 Development_VEGF ACTG1 AKT1 AKT3 FYN GRB2 GSK3B HSP90AA1 signaling via VEGFR2 - HSPB1 IKBKB ITPR1 ITPR2 ITPR3 JUN MAPK1 generic cascades MAPK13 MAPK14 MAPKAPK2 NF1 NFATC1 NFKBIA NFKBIB NOS2 PIK3CB PIK3R1 PIK3R3 PLAUR PLCG1 PPP3CC PRKCA PRKCH PRKCQ PRKD3 PTGS1 PTK2 SH2D2A SHC1 SOS2 SRC TCF7L2 TRAP1 VCL Actb Actg1 Akt1 Akt2 Akt3 Cdc42 Chuk Ctnnb1 Fos Grb2 Hsp90aa1 Hsp90b1 Hspb1 Ikbkb Itpr3 Jun Mapk13 Mapk14 Mapkapk2 Nck1 Nfl Nfkbia Nfkbib Nos3 Pak2 Pdpk1 Pik3r3 Plaur Ppp3ca Ppp3cb Prkci Prkd2 Ptgs2 Ptk2 Pxn Raf1 Rela Rock1 Shc1 Sos1 Sos2 Sphkl Vc1 Immune AKT1 AKT3 ELAVL1 GNA11 GRB2 IKBKB IRS1 ITPR1 response_Gastrin in ITPR2 ITPR3 JUN MAP2K5 MAP2K6 MAP3K14 MAPK1 inflammatory response MAPK14 MAPK9 MEF2A MEF2B MEF2C MMP3 NFKBIA NFKBIB PIK3CB PIK3R1 PLCG1 PRKCA PTK2 SERPINB2 SHC1 SOS2 SRC Akt1 Akt2 Akt3 Chuk Cxcl1 Elavl1 Elk1 Fos Gnaq Grb2 Hbegf Ikbkb Itpr3 Jun Map2k4 Map2k5 Map2k6 Map3k14 Map3k7 Mapk14 Mapk7 Mef2a Mef2c Mef2d Nfkbia Nfkbib Pdpk1 Ptgs2 Ptk2 Raf1 Rela Serpinb2 Shc1 Sos1 Sos2 Traf6 Cell ACTG1 AKT1 AKT3 ARPC1A ARPC2 CAV2 CCR1 CD44 adhesion_Chemokines CD47 CRK FLNA FLOT2 GNAI3 GNB1 GNB5 GNG10 and adhesion GNG5 GRB2 GSK3B ITGA6 ITGB1 JUN LAMA1 LEF1 LIMK2 MAPK1 MMP1 MMP13 MSN MYC PIK3CB PIK3CG PIK3R1 PIK3R3 PLAUR PTEN PTK2 RAP1GAP RELB SDC2 SHC1 SOS2 SRC TCF7 TCF7L2 TRIO VAV1 VCL Acta2 Actb Actg1 Actr2 Akt1 Akt2 Akt3 Arpc4 Braf Cav2 Ccr1 Cd44 Cd47 Cdc42 Cfl2 Col1a2 Col4a2 Crk Ctnnb1 Cxcl3 Cxcl5 Dock1 Flot2 Fn1 Gnai1 Gnai2 Gnai3 Gnb1 Gnb5 Gng10 Gng12 Gng13 Gngt1 Gngt2 Grb2 Itgb1 Jun Lamc1 Limk2 Mmp1a Msn Myc Nfkb2 Pik3r3 Pik3r5 Plaur Pten Ptk2 Pxn Raf1 Rap1gap Rel Rela Relb Rock1 Rock2 Serpine1 Shc1 Sos1 Sos2 Thbs1 Trio Vcl Immune response _IL-15 ADAM17 AKT1 AKT3 BCL2 FKBP1A GRB2 IKBKB signaling IL15RA IL2RB LCK MAP2K6 MAP3K14 MAPK1 MAPK13 MAPK14 MKNK1 MTOR MYB MYC NFKBIA NFKBIB PIK3CB PIK3R1 PLCG1 PTK2 SHC1 SOS2 Adam17 Akt1 Akt2 Akt3 Bcl2 Bcl2l1 Chuk Eif4e Ets1 Fkbp1a Fos Gab2 Grb2 Ikbkb Il15ra Il6 Lck Map2k4 Map2k6 Map3k14 Mapk13 Mapk14 Mcl1 Mknk1 Mtor Myc Nfkbia Nfkbib Pdpk1 Plcbl Ptk2 Raf1 Rela Rps6kbl Shc1 Sos1 Sos2 Syk Immune response_IL-22 BCL2 CD28 CD4 HLA-DMA HLA-DMB HLA-DOB HLA- signaling pathway DPA1 HLA-DPB1 HLA-DQA1 HLA-DQA2 HLA-DQB1 HLA-DRA HLA-DRB1 HLA-DRB3 HLA-DRB4 HLA- DRB5 IL10RB IL12RB2 IL2RA IL2RB JAK1 JAK2 JAK3 JUN MAPK1 MAPK13 MAPK14 MAPK9 MYC SOCS3 STAT1 STAT4 STAT5B TRA@ TRAC Bcl2 Bcl2l1 Cd86 Fos H2-Eb2 Il10rb Il2ra Jak2 Jak3 Jun Mapk13 Mapk14 Mcl1 Myc Socs3 Stat3 Stat5a Tcrb-J
* * * * *
References
-
ncbi
-
ucdmc.ucdavis.edu/ctsc/documents/geneexpression.pdf
-
ScienceTranslationalMedicine.org
-
software.broadinstitute.org/cancer/software/genepattern/tutorial/1inkedFiles/HG_U133A_annot.chip
-
informatics.jax.org/marker/MGI:105983
-
ncbi.nlm.nih.gov/IEB/Research/Acembly/av.cgi?db=mouse&c=Gene&I=NGP
-
uniprot.org/unioprot/O08692
-
genego.com
D00001
D00002
D00003
D00004
D00005
D00006
D00007
D00008
D00009
D00010
D00011
D00012
D00013

D00014

D00015

D00016

D00017
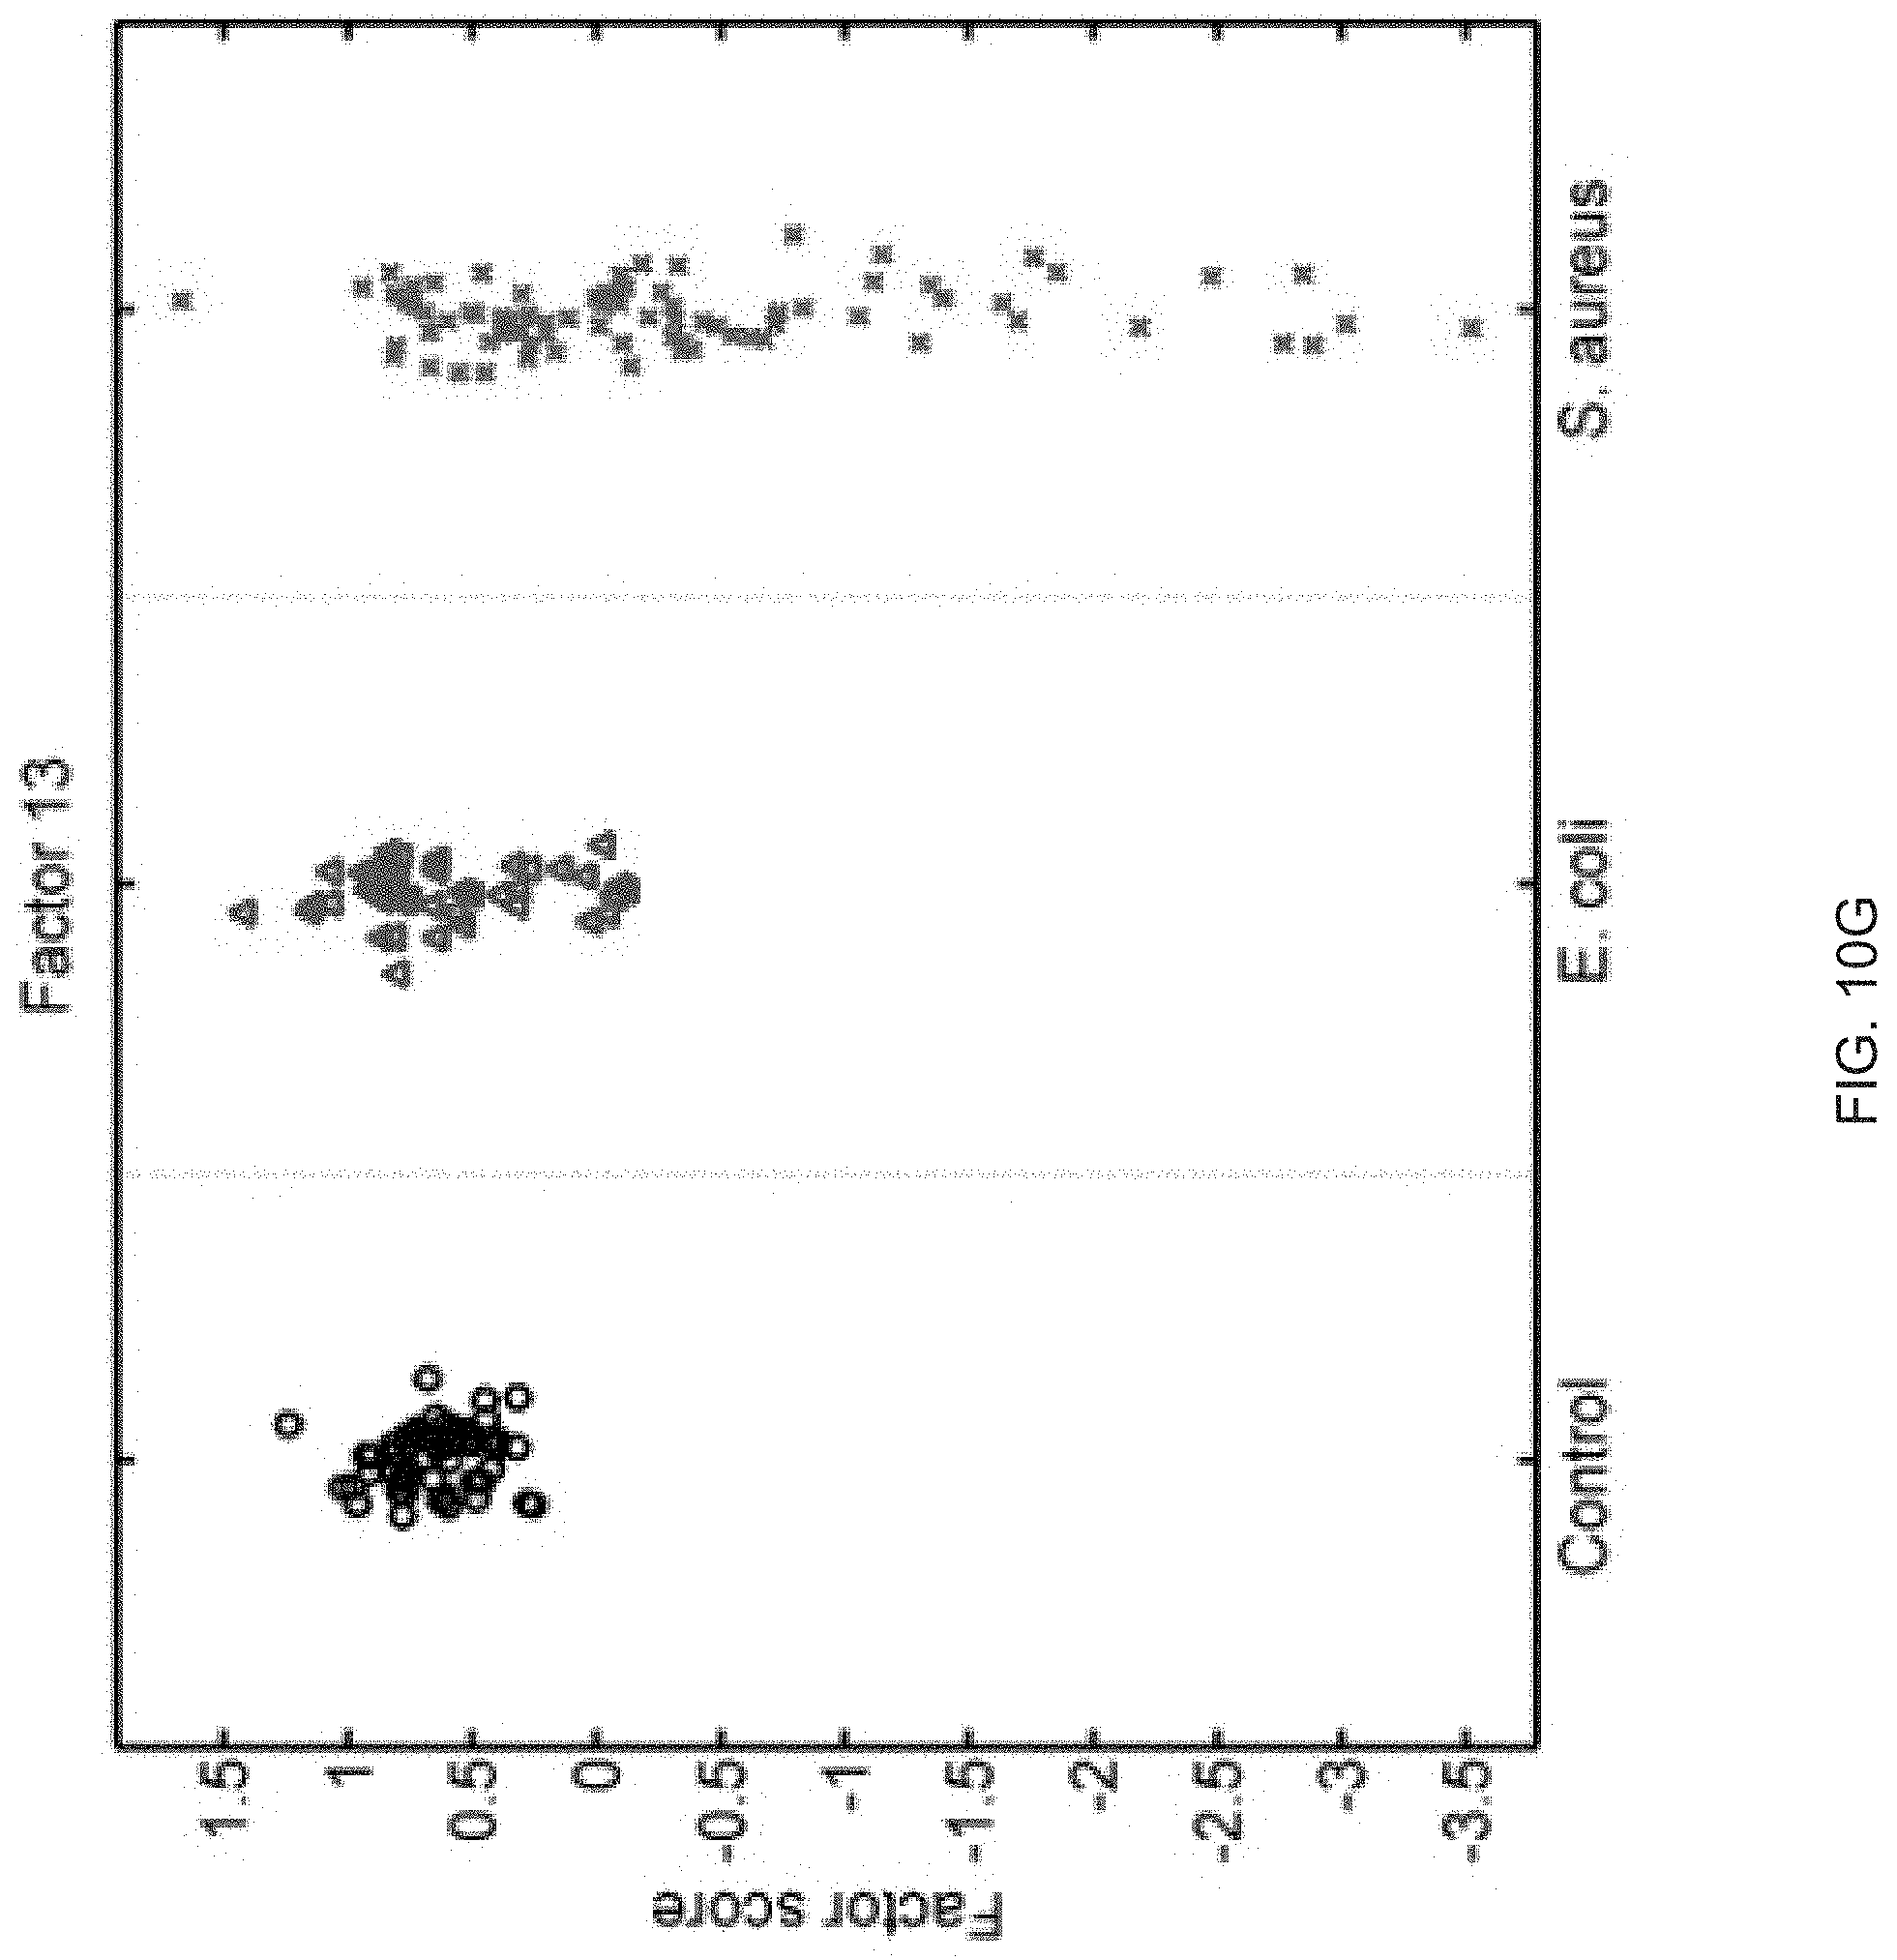
D00018
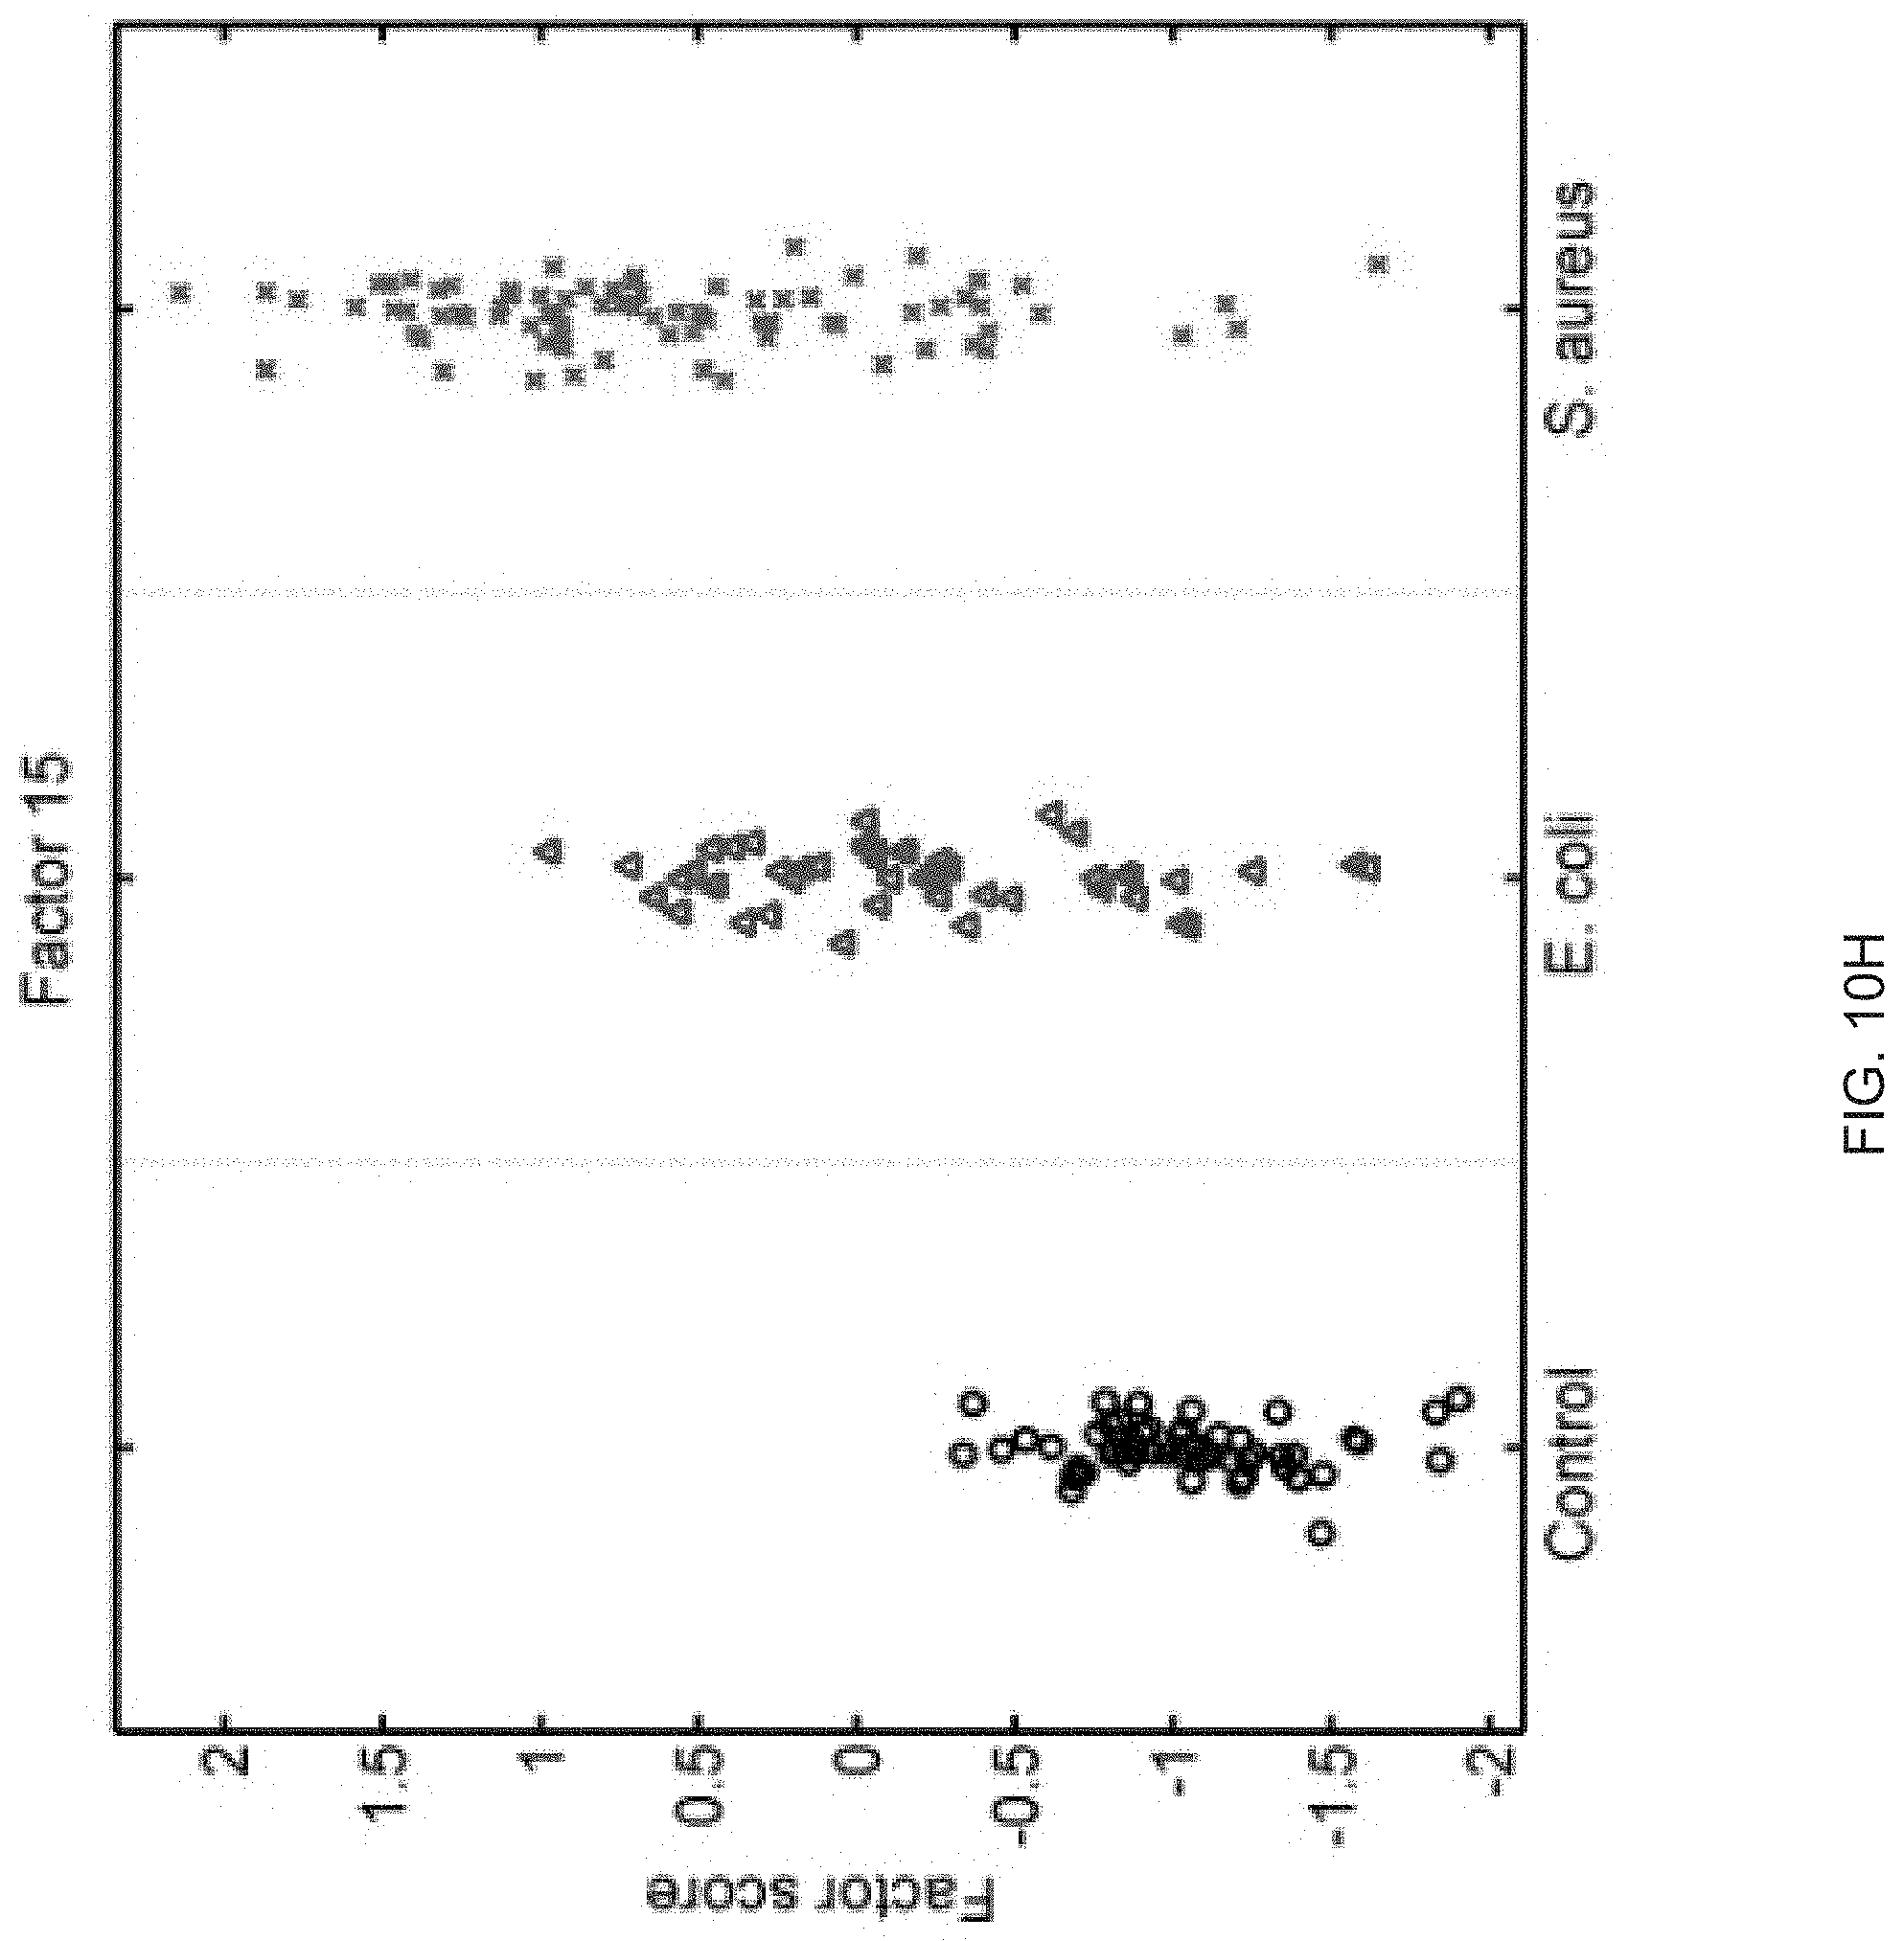
D00019

D00020

D00021
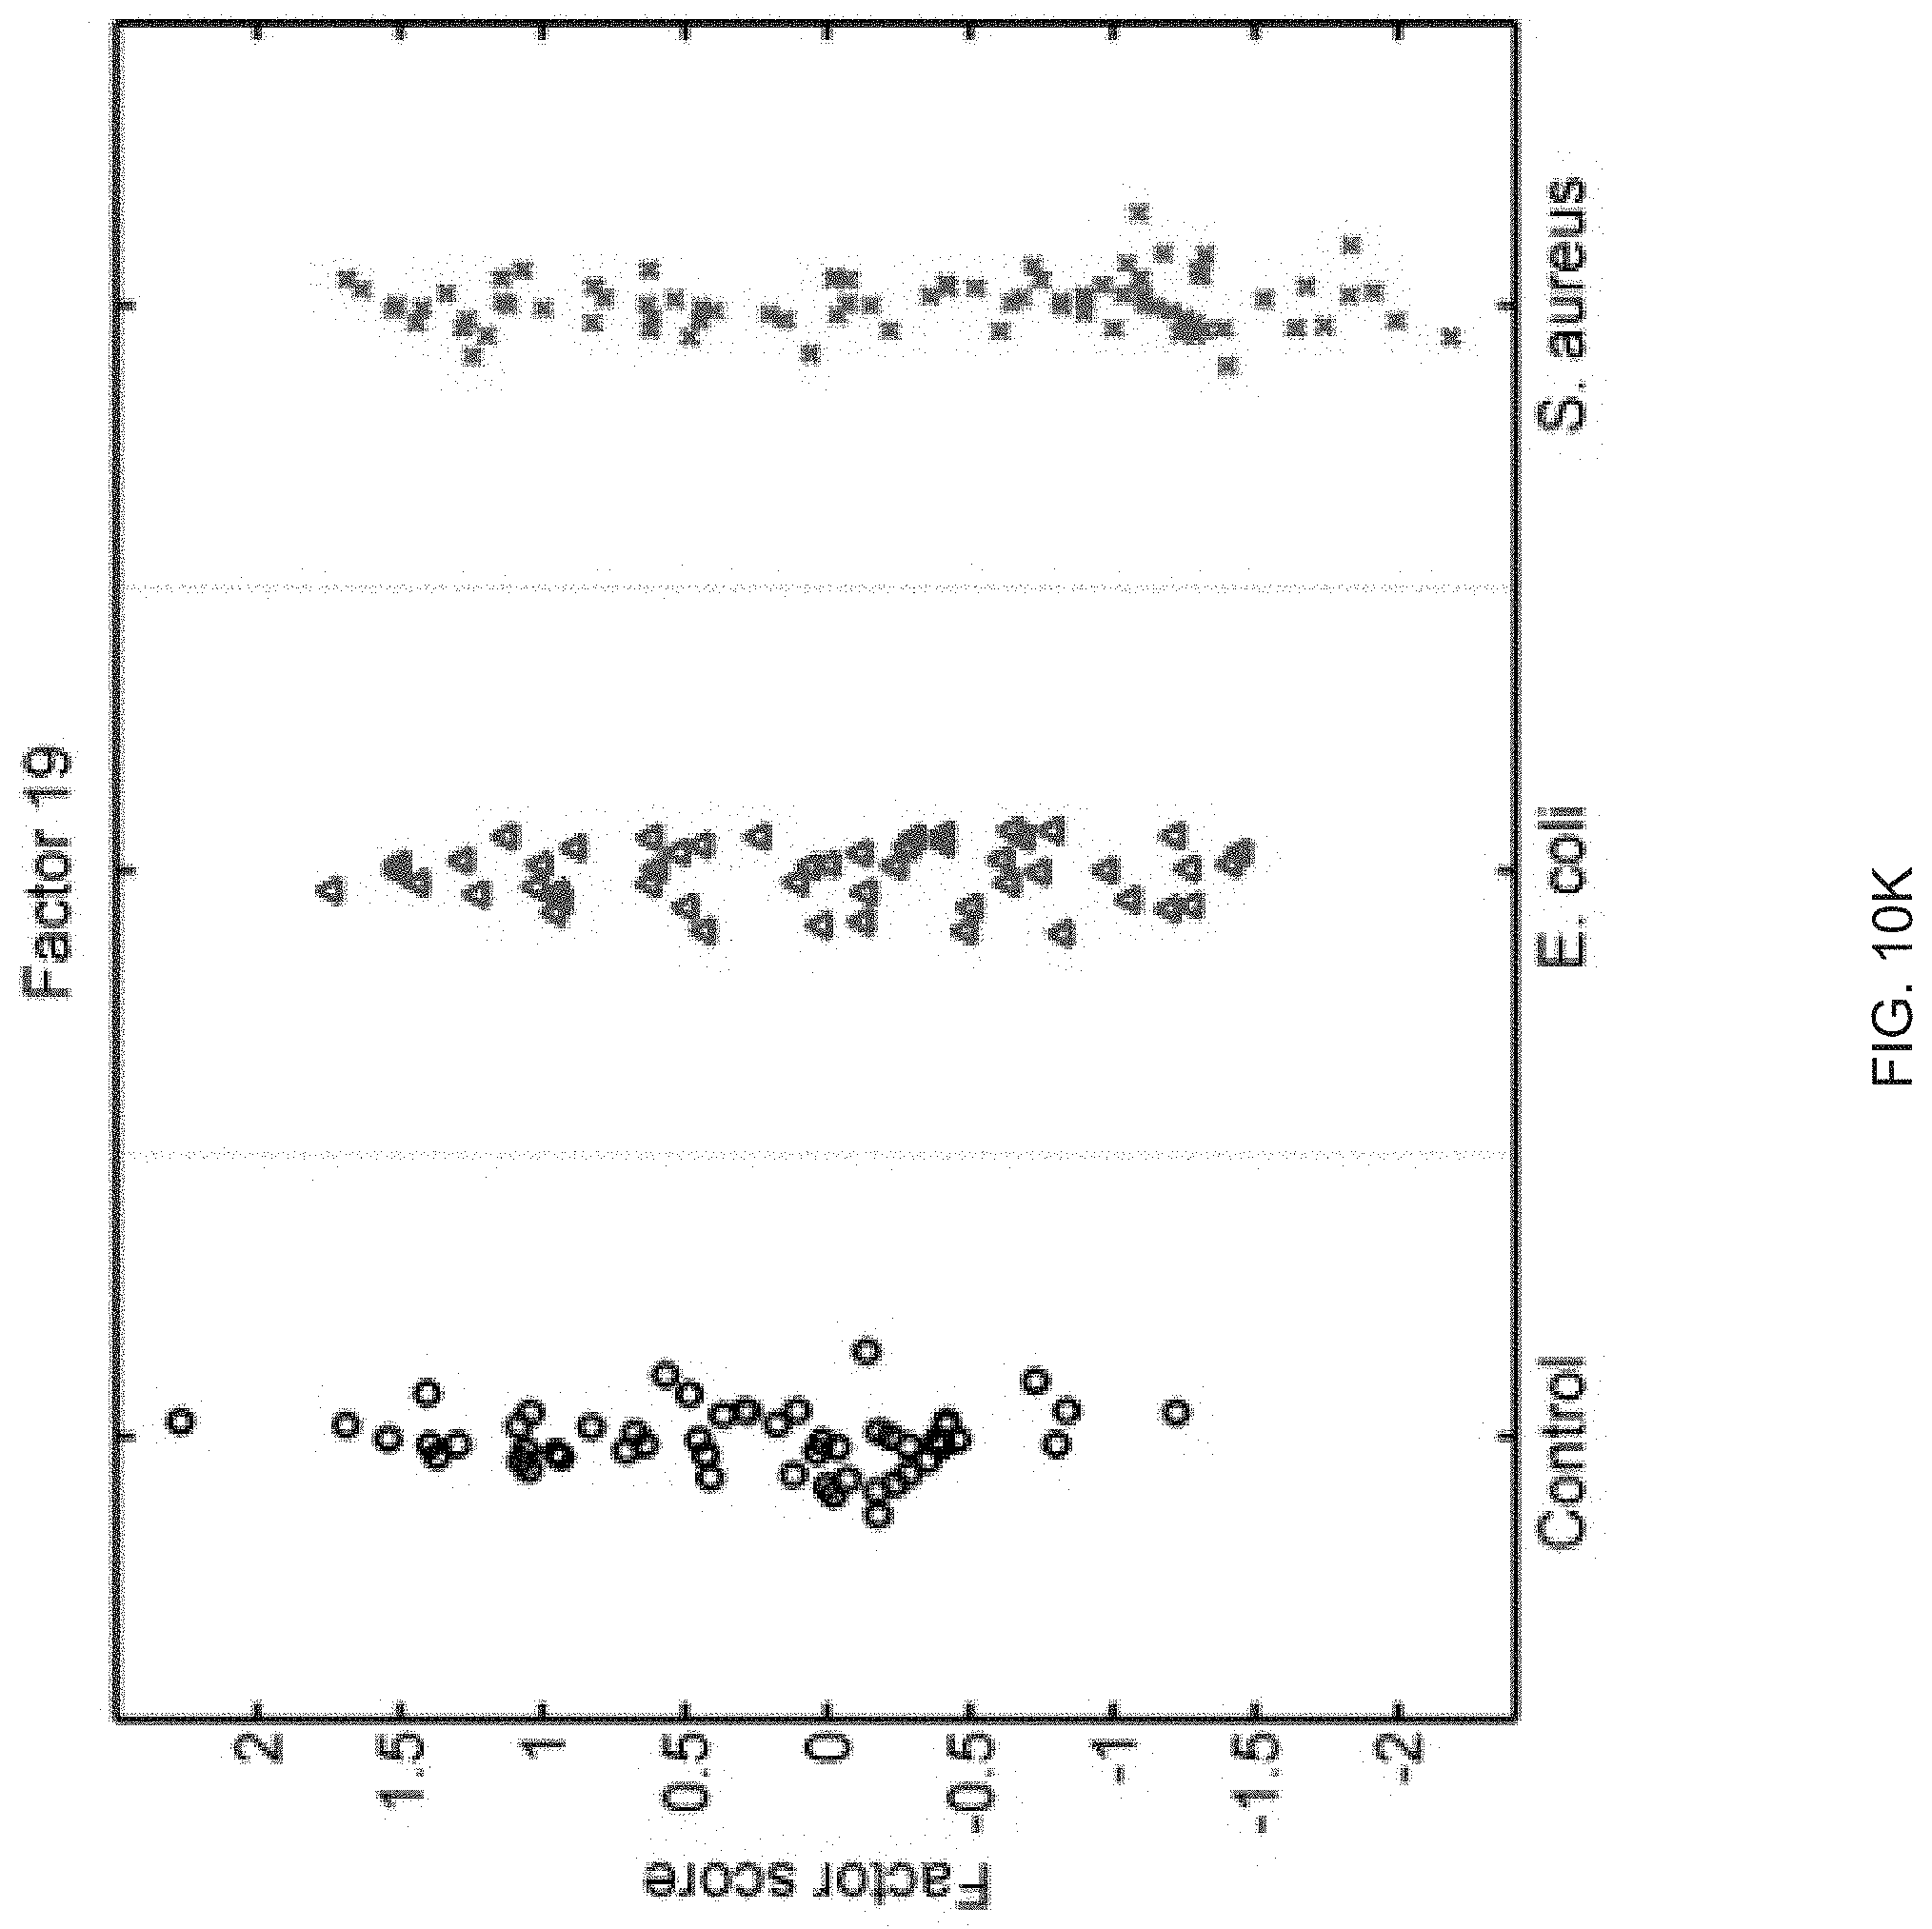
D00022

D00023
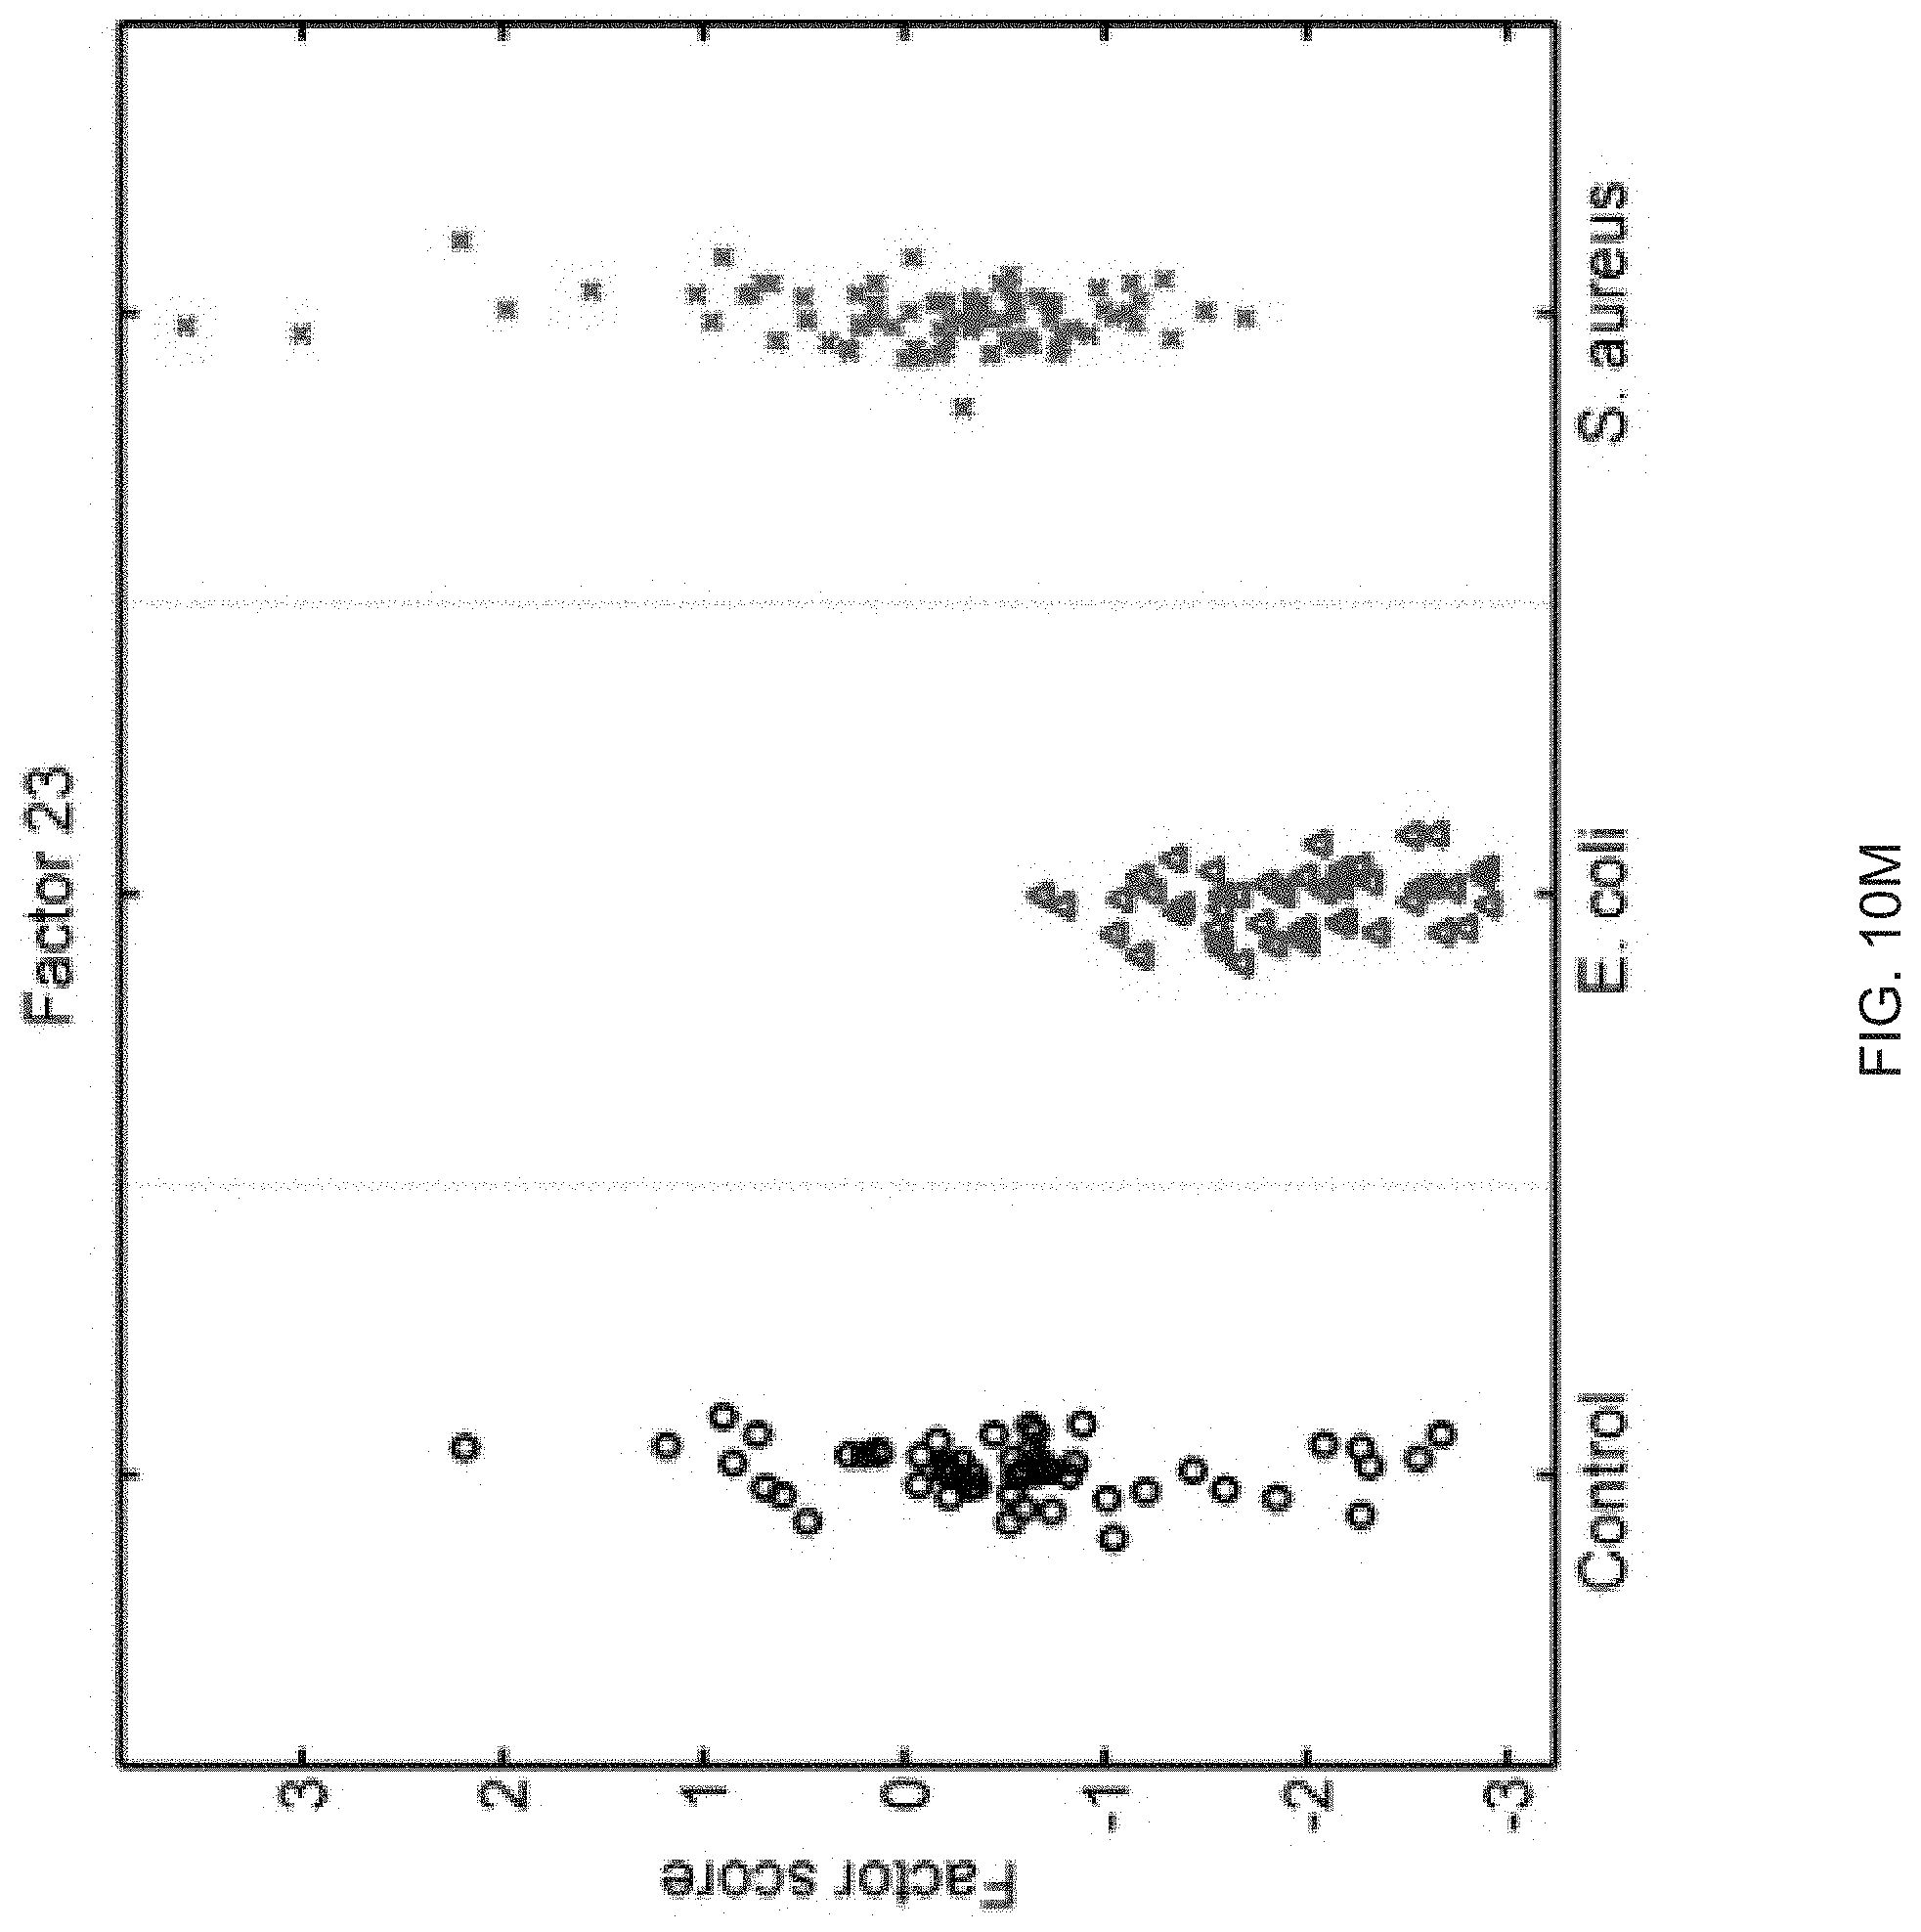
D00024

D00025
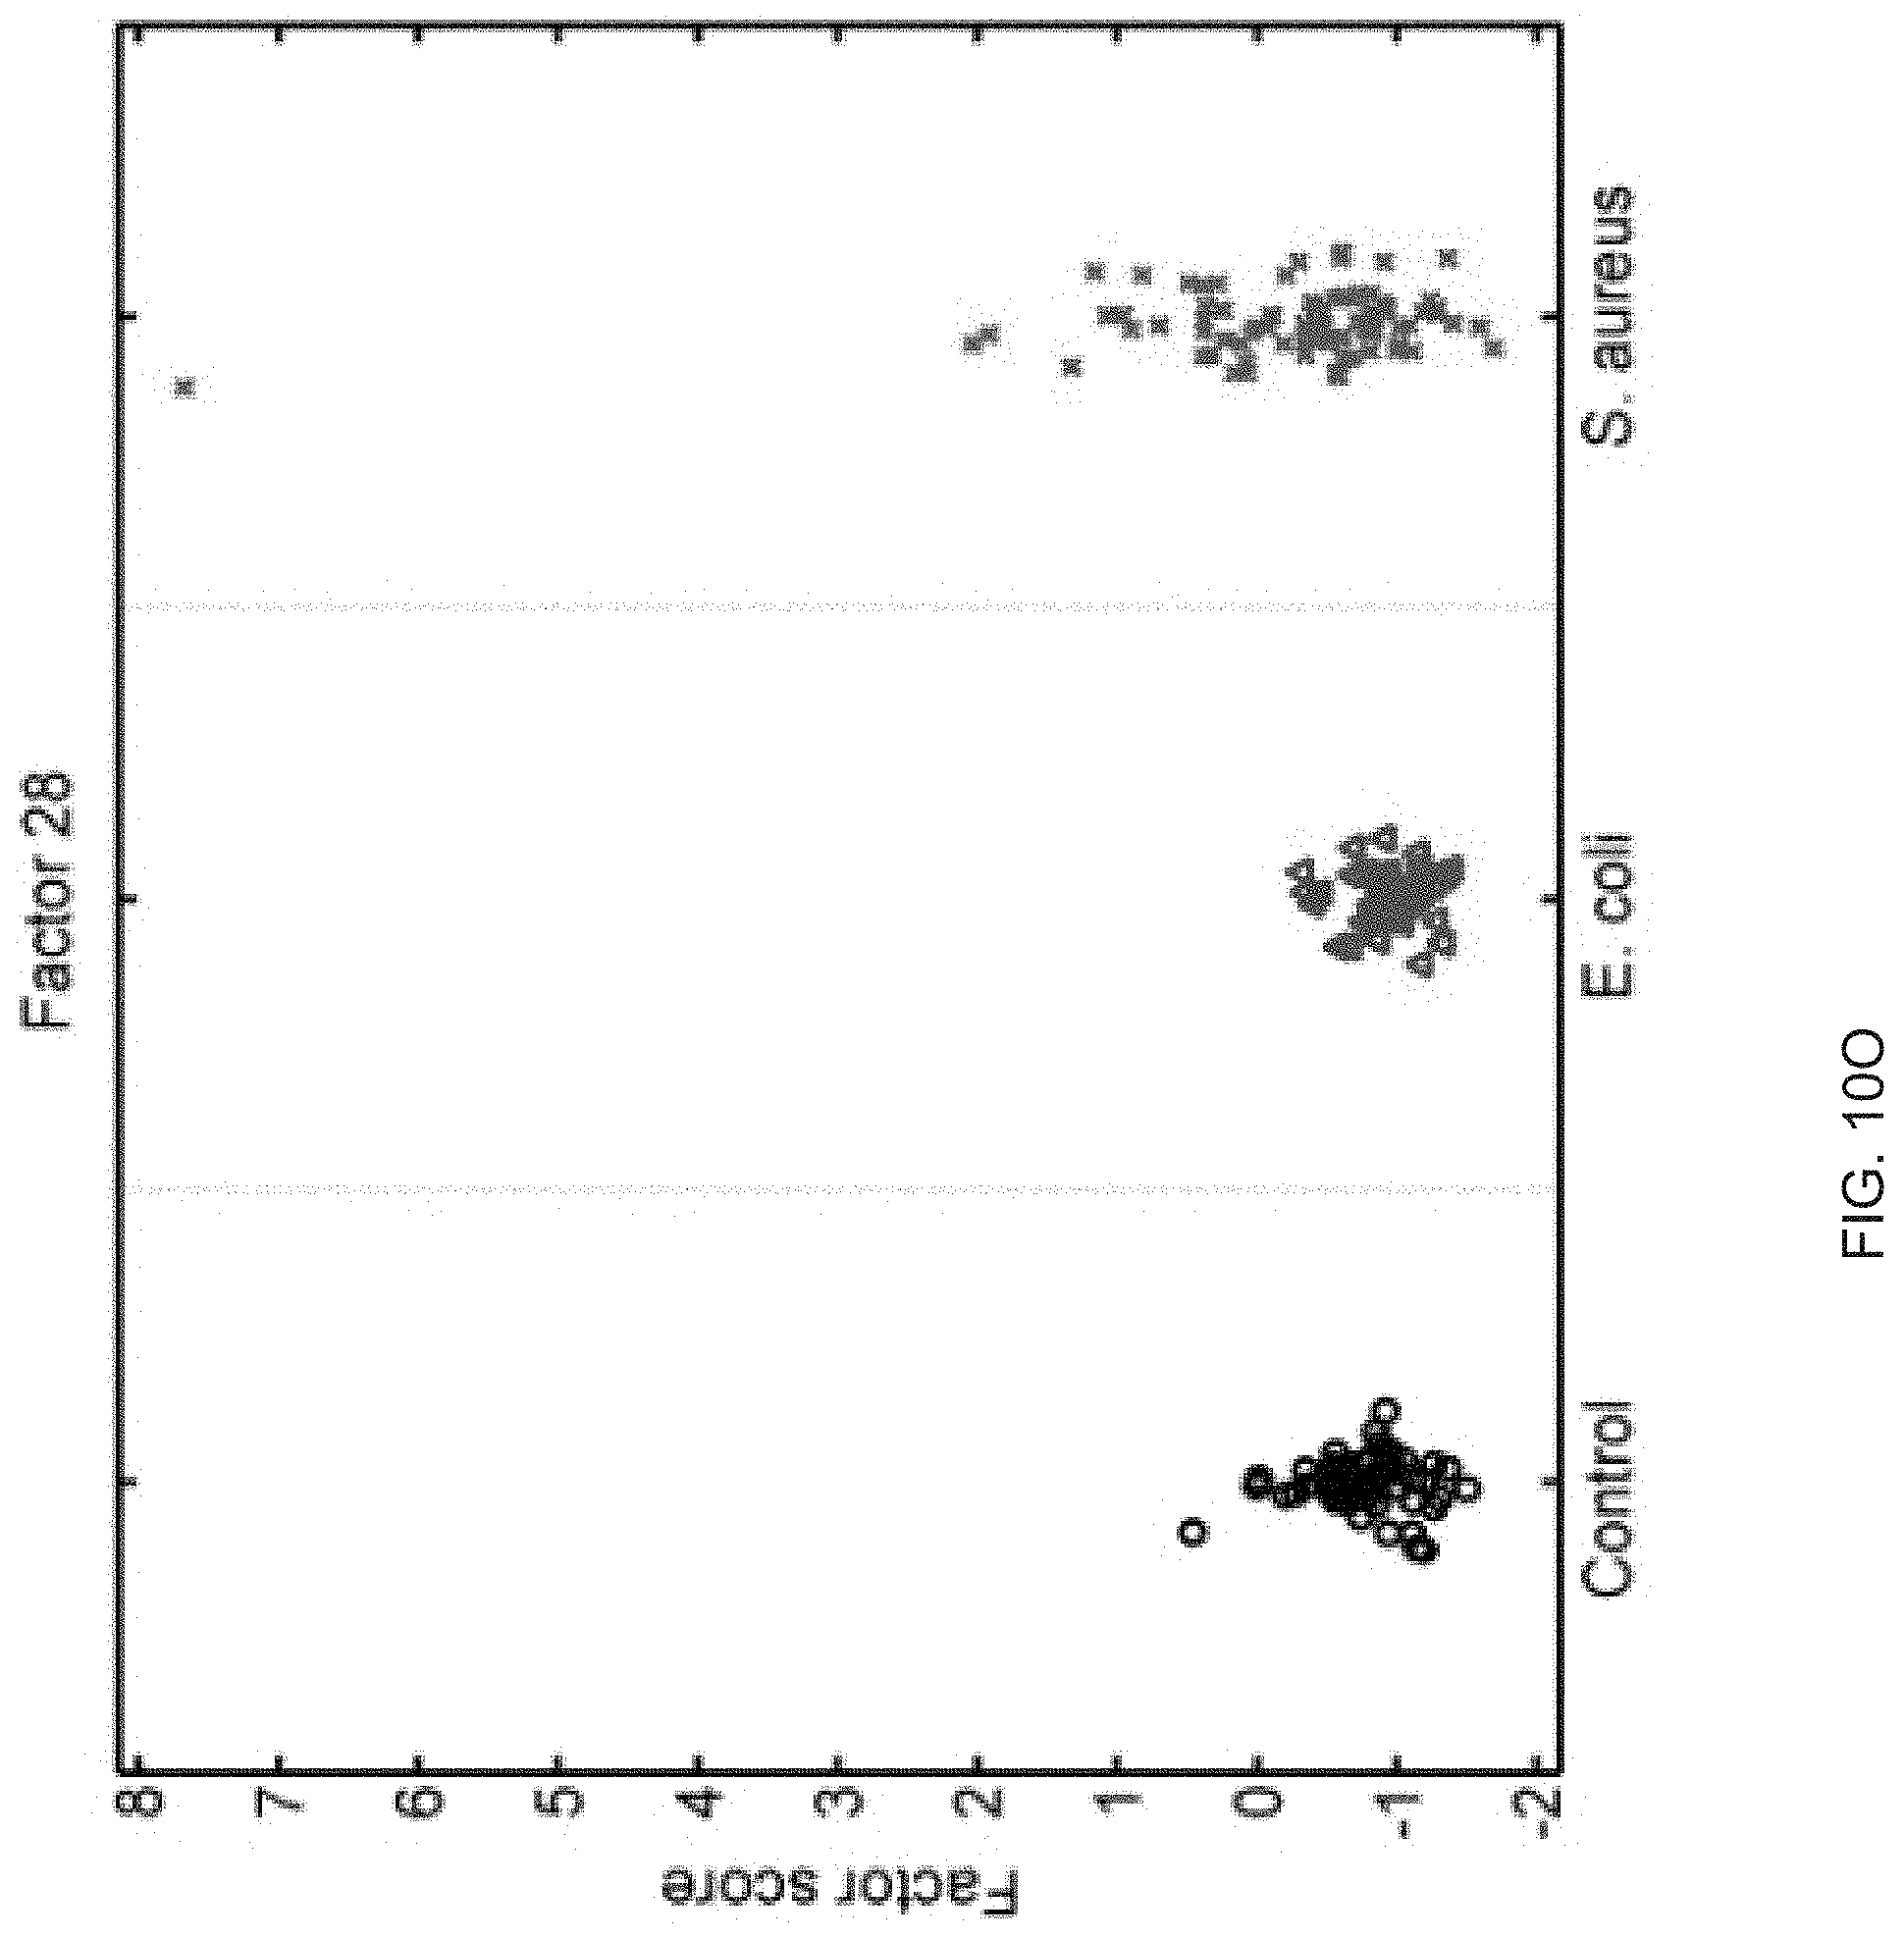
D00026
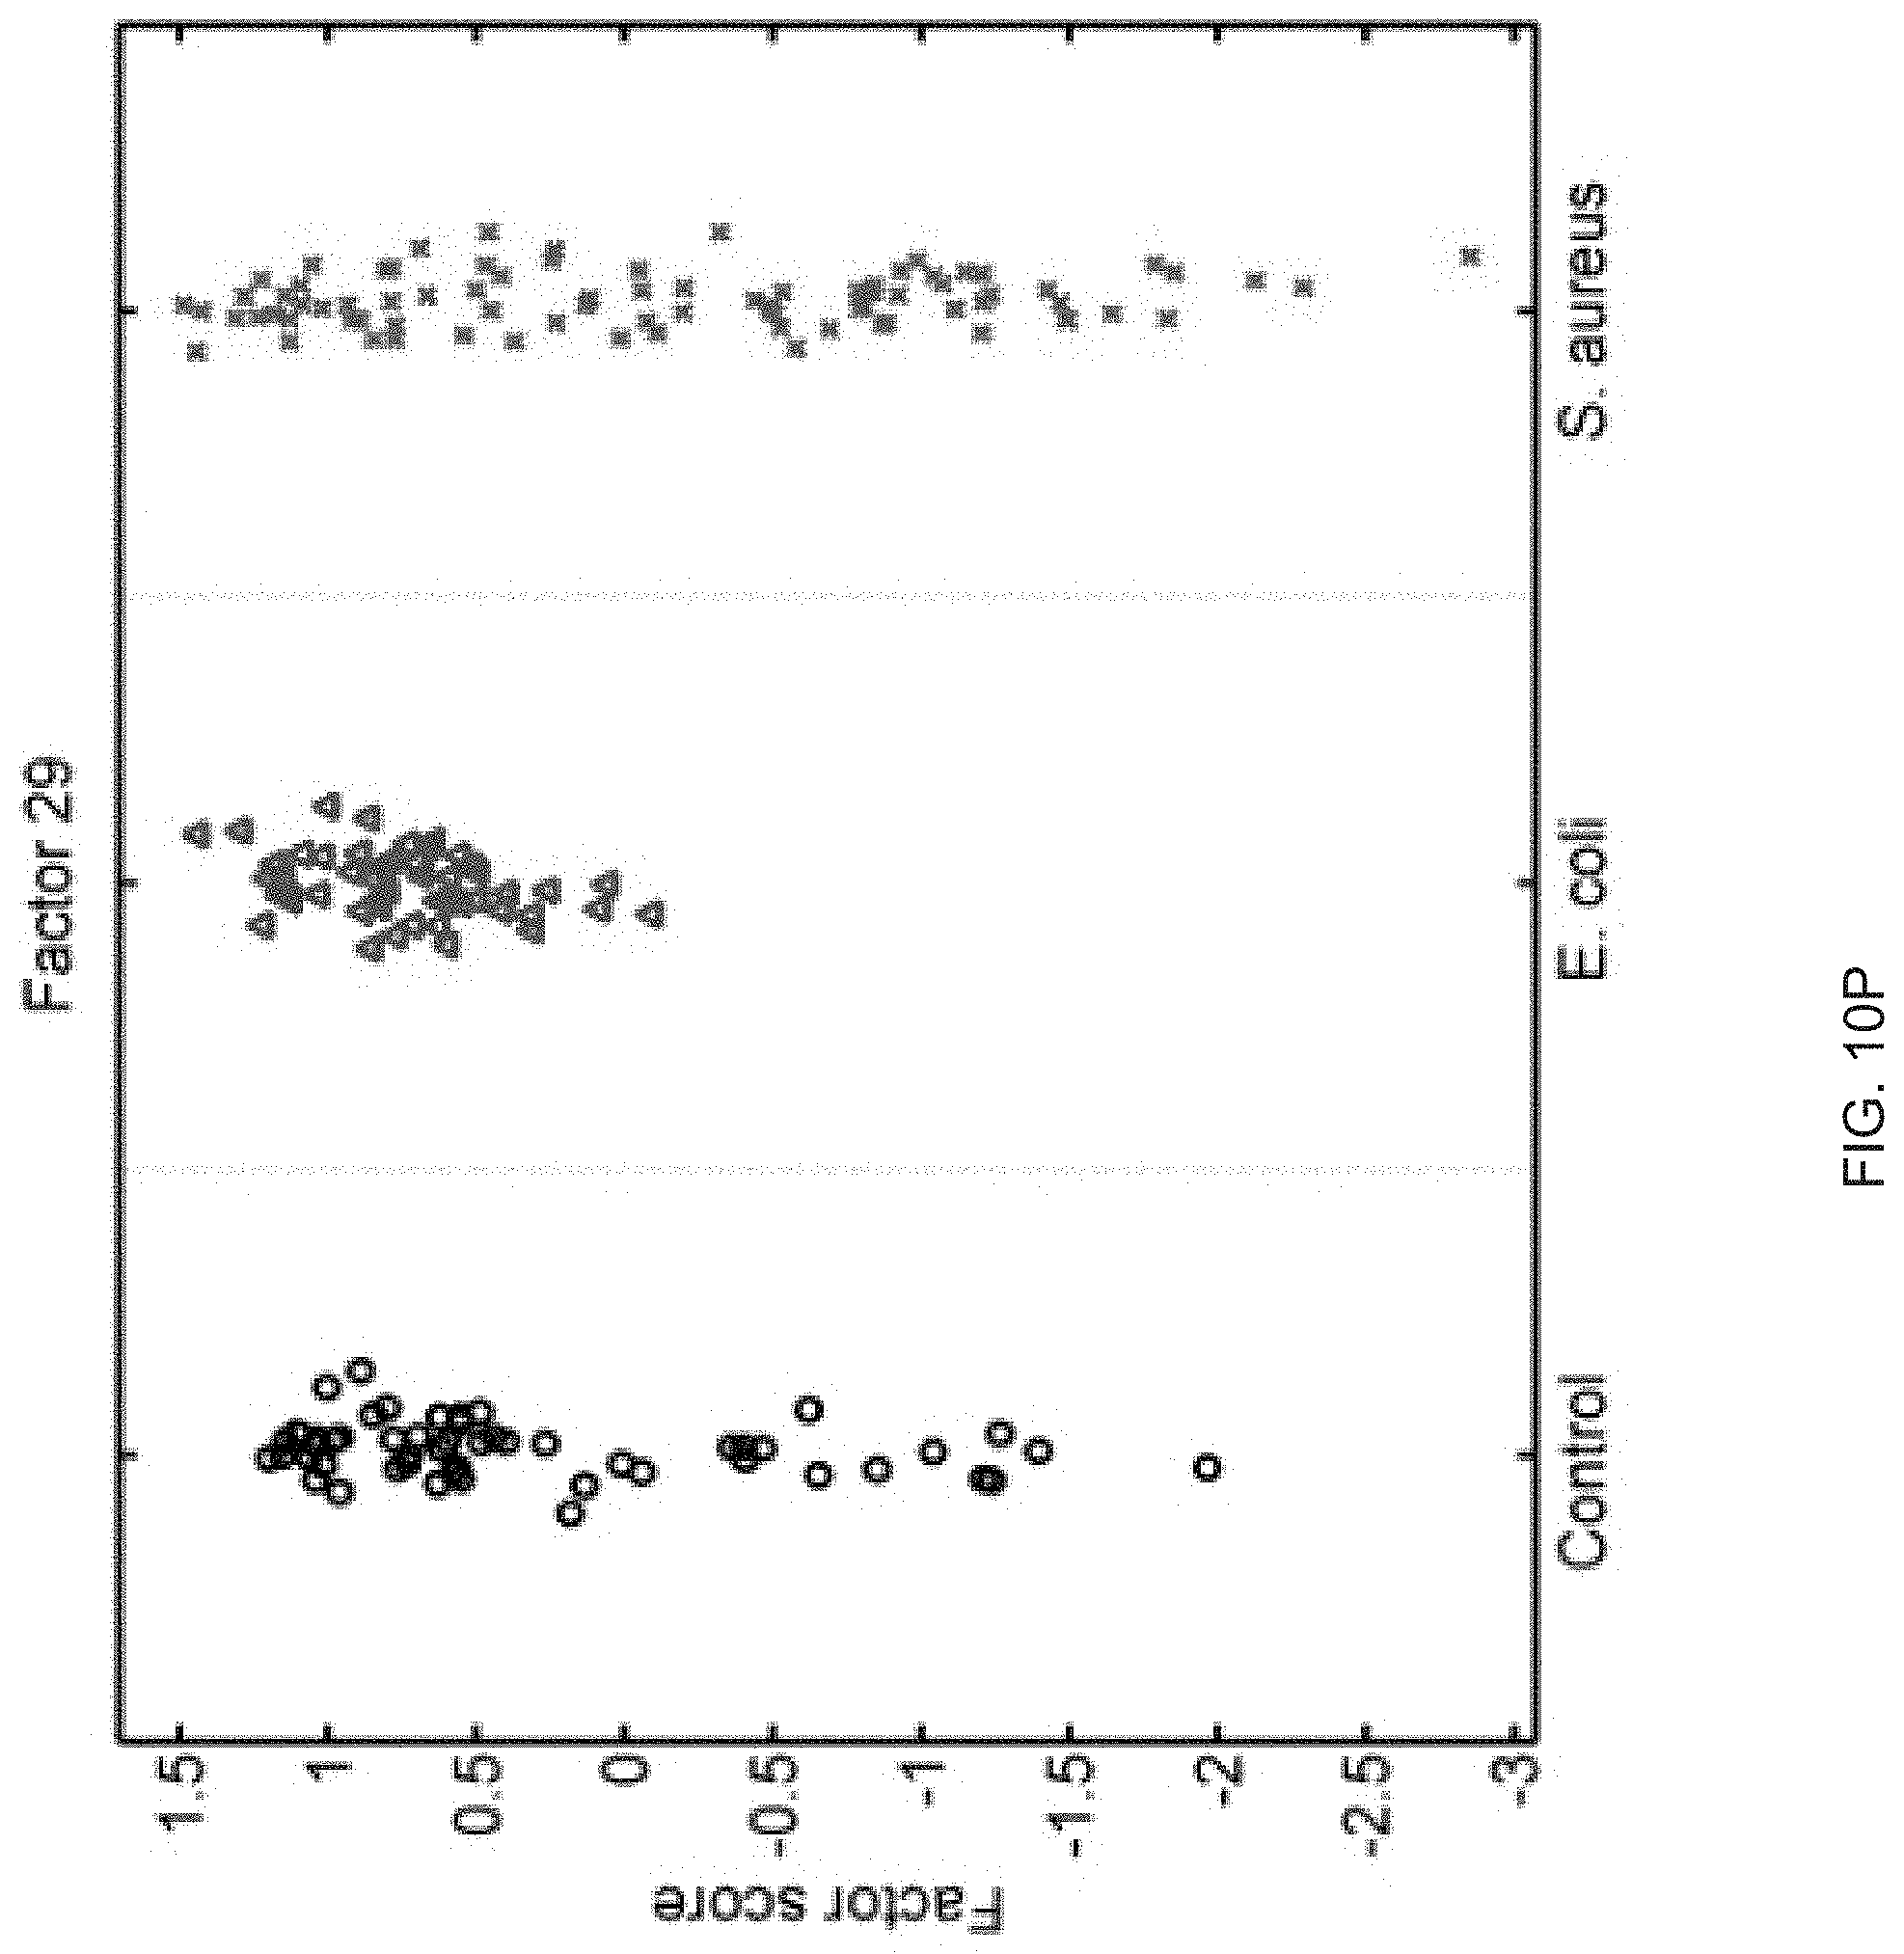
D00027

D00028

D00029
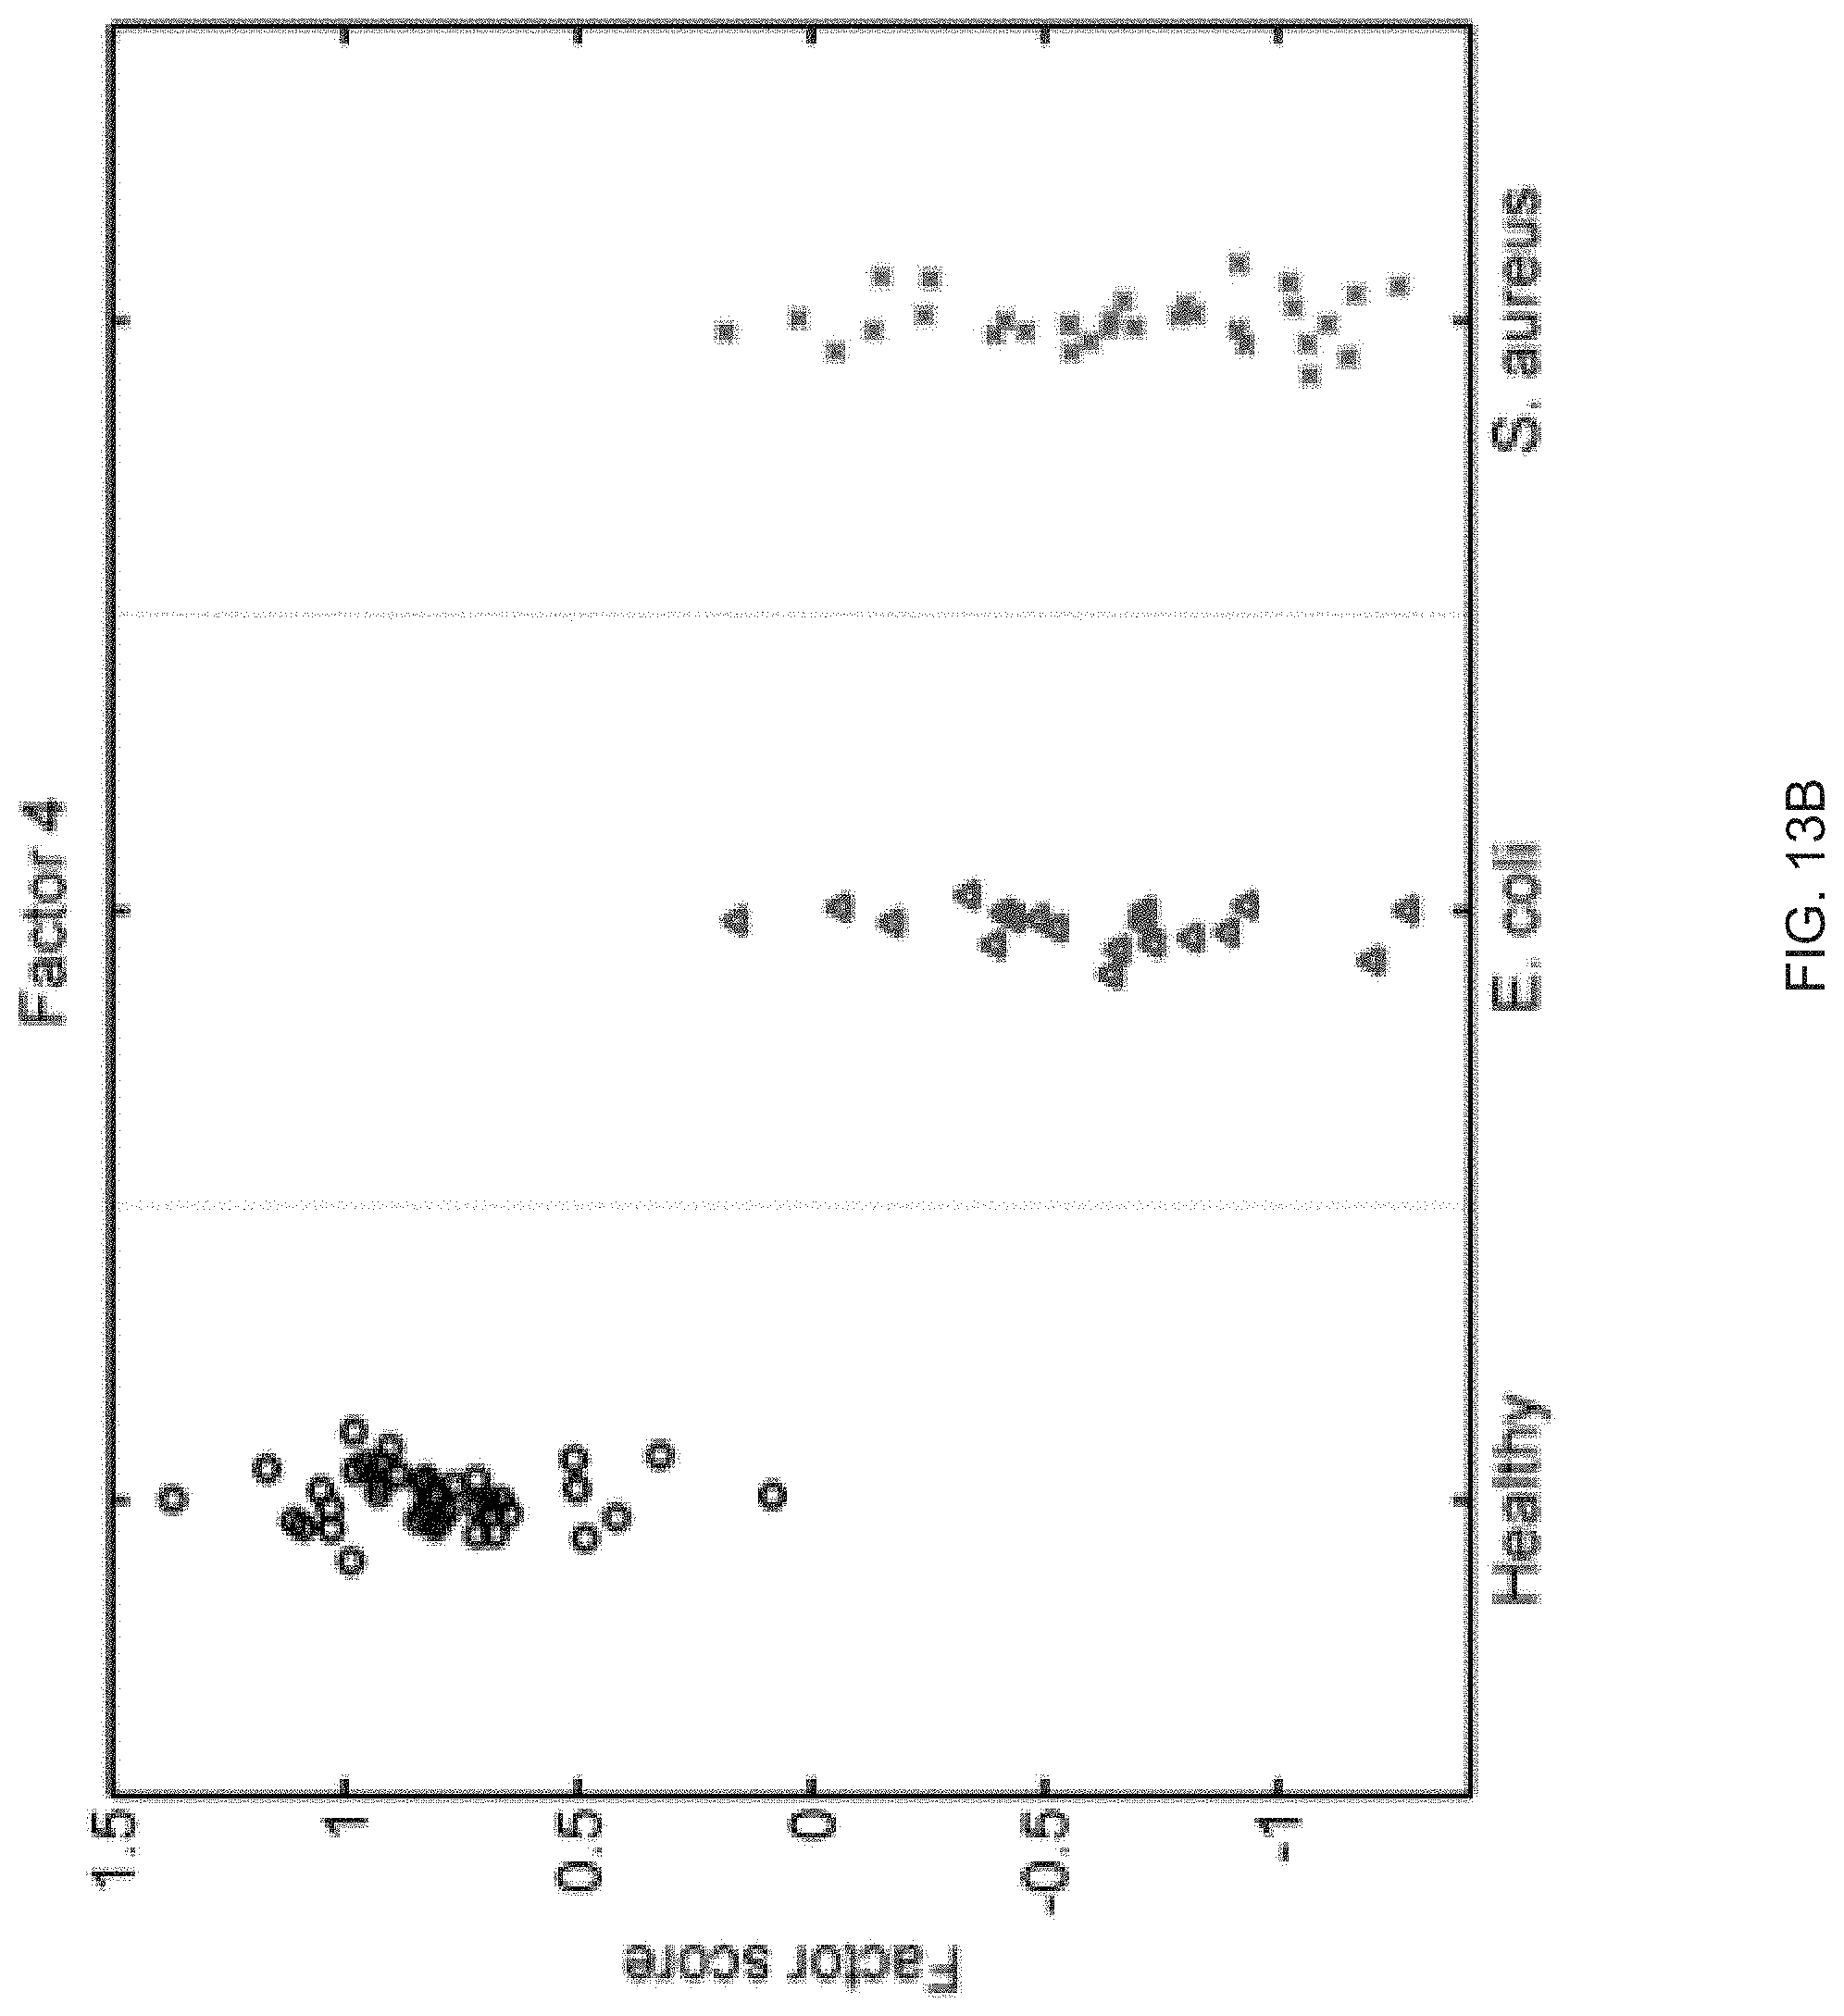
D00030

D00031

D00032
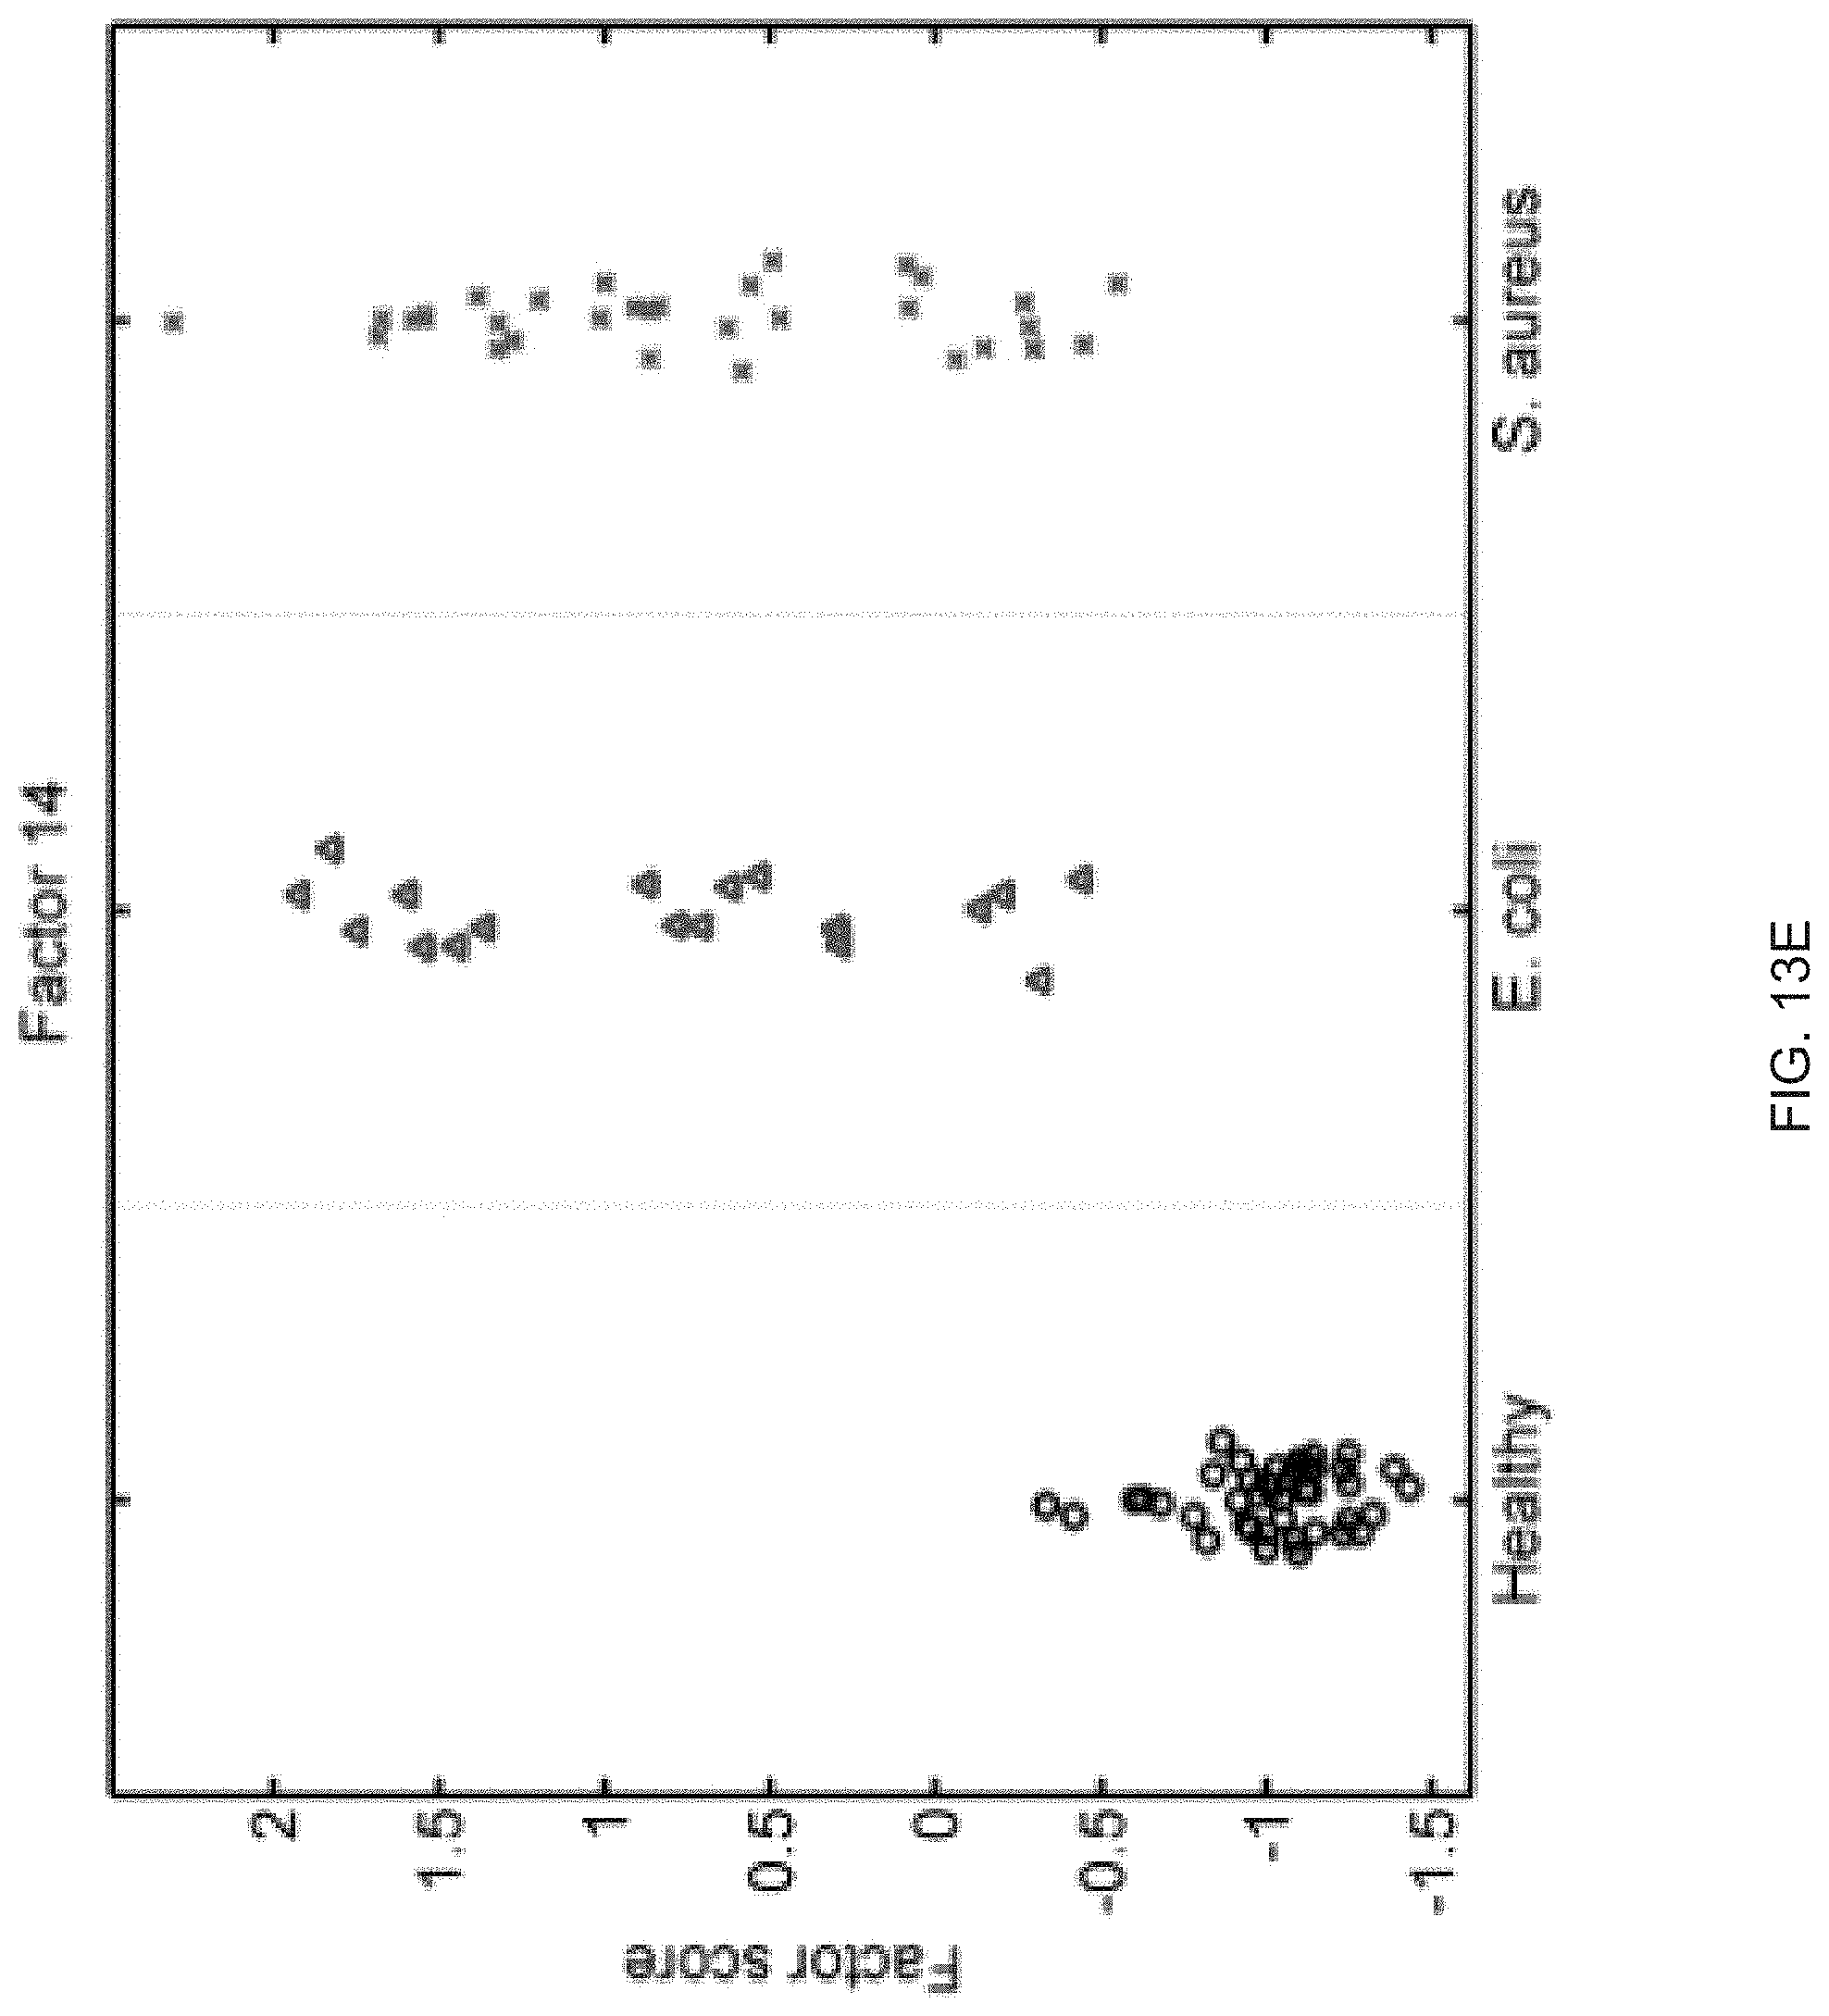
D00033
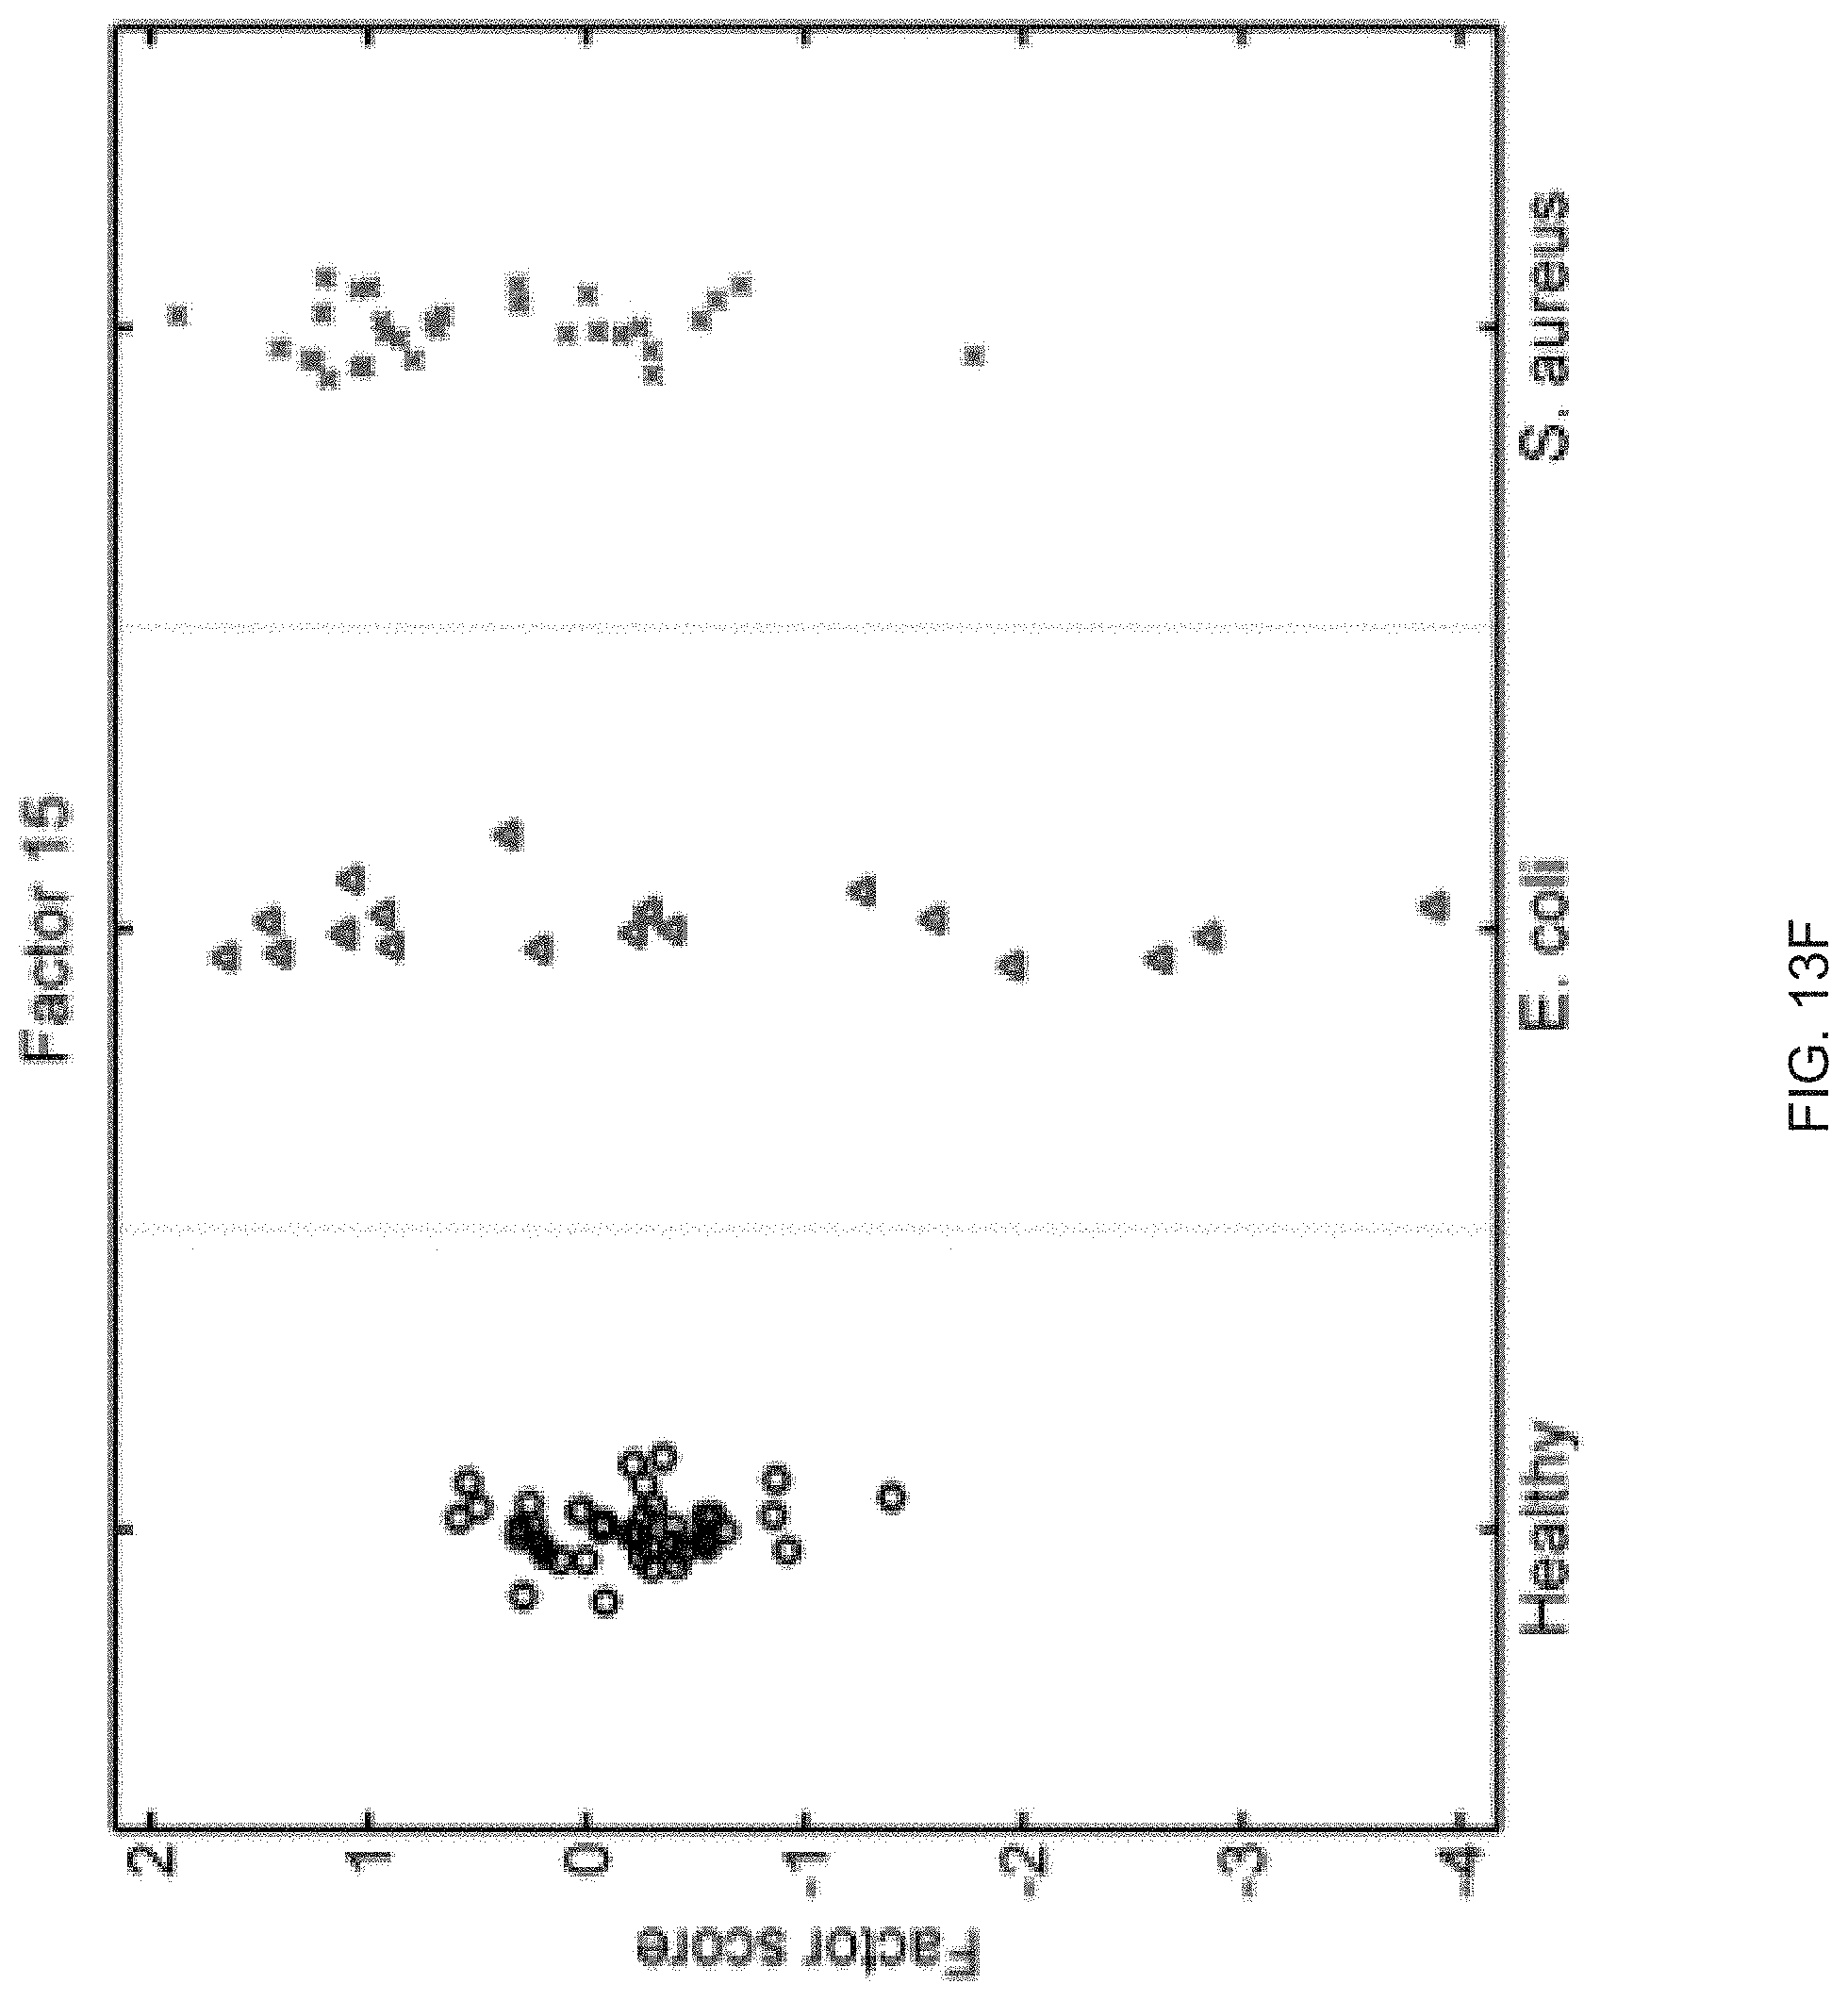
D00034

D00035

D00036

D00037

D00038

D00039
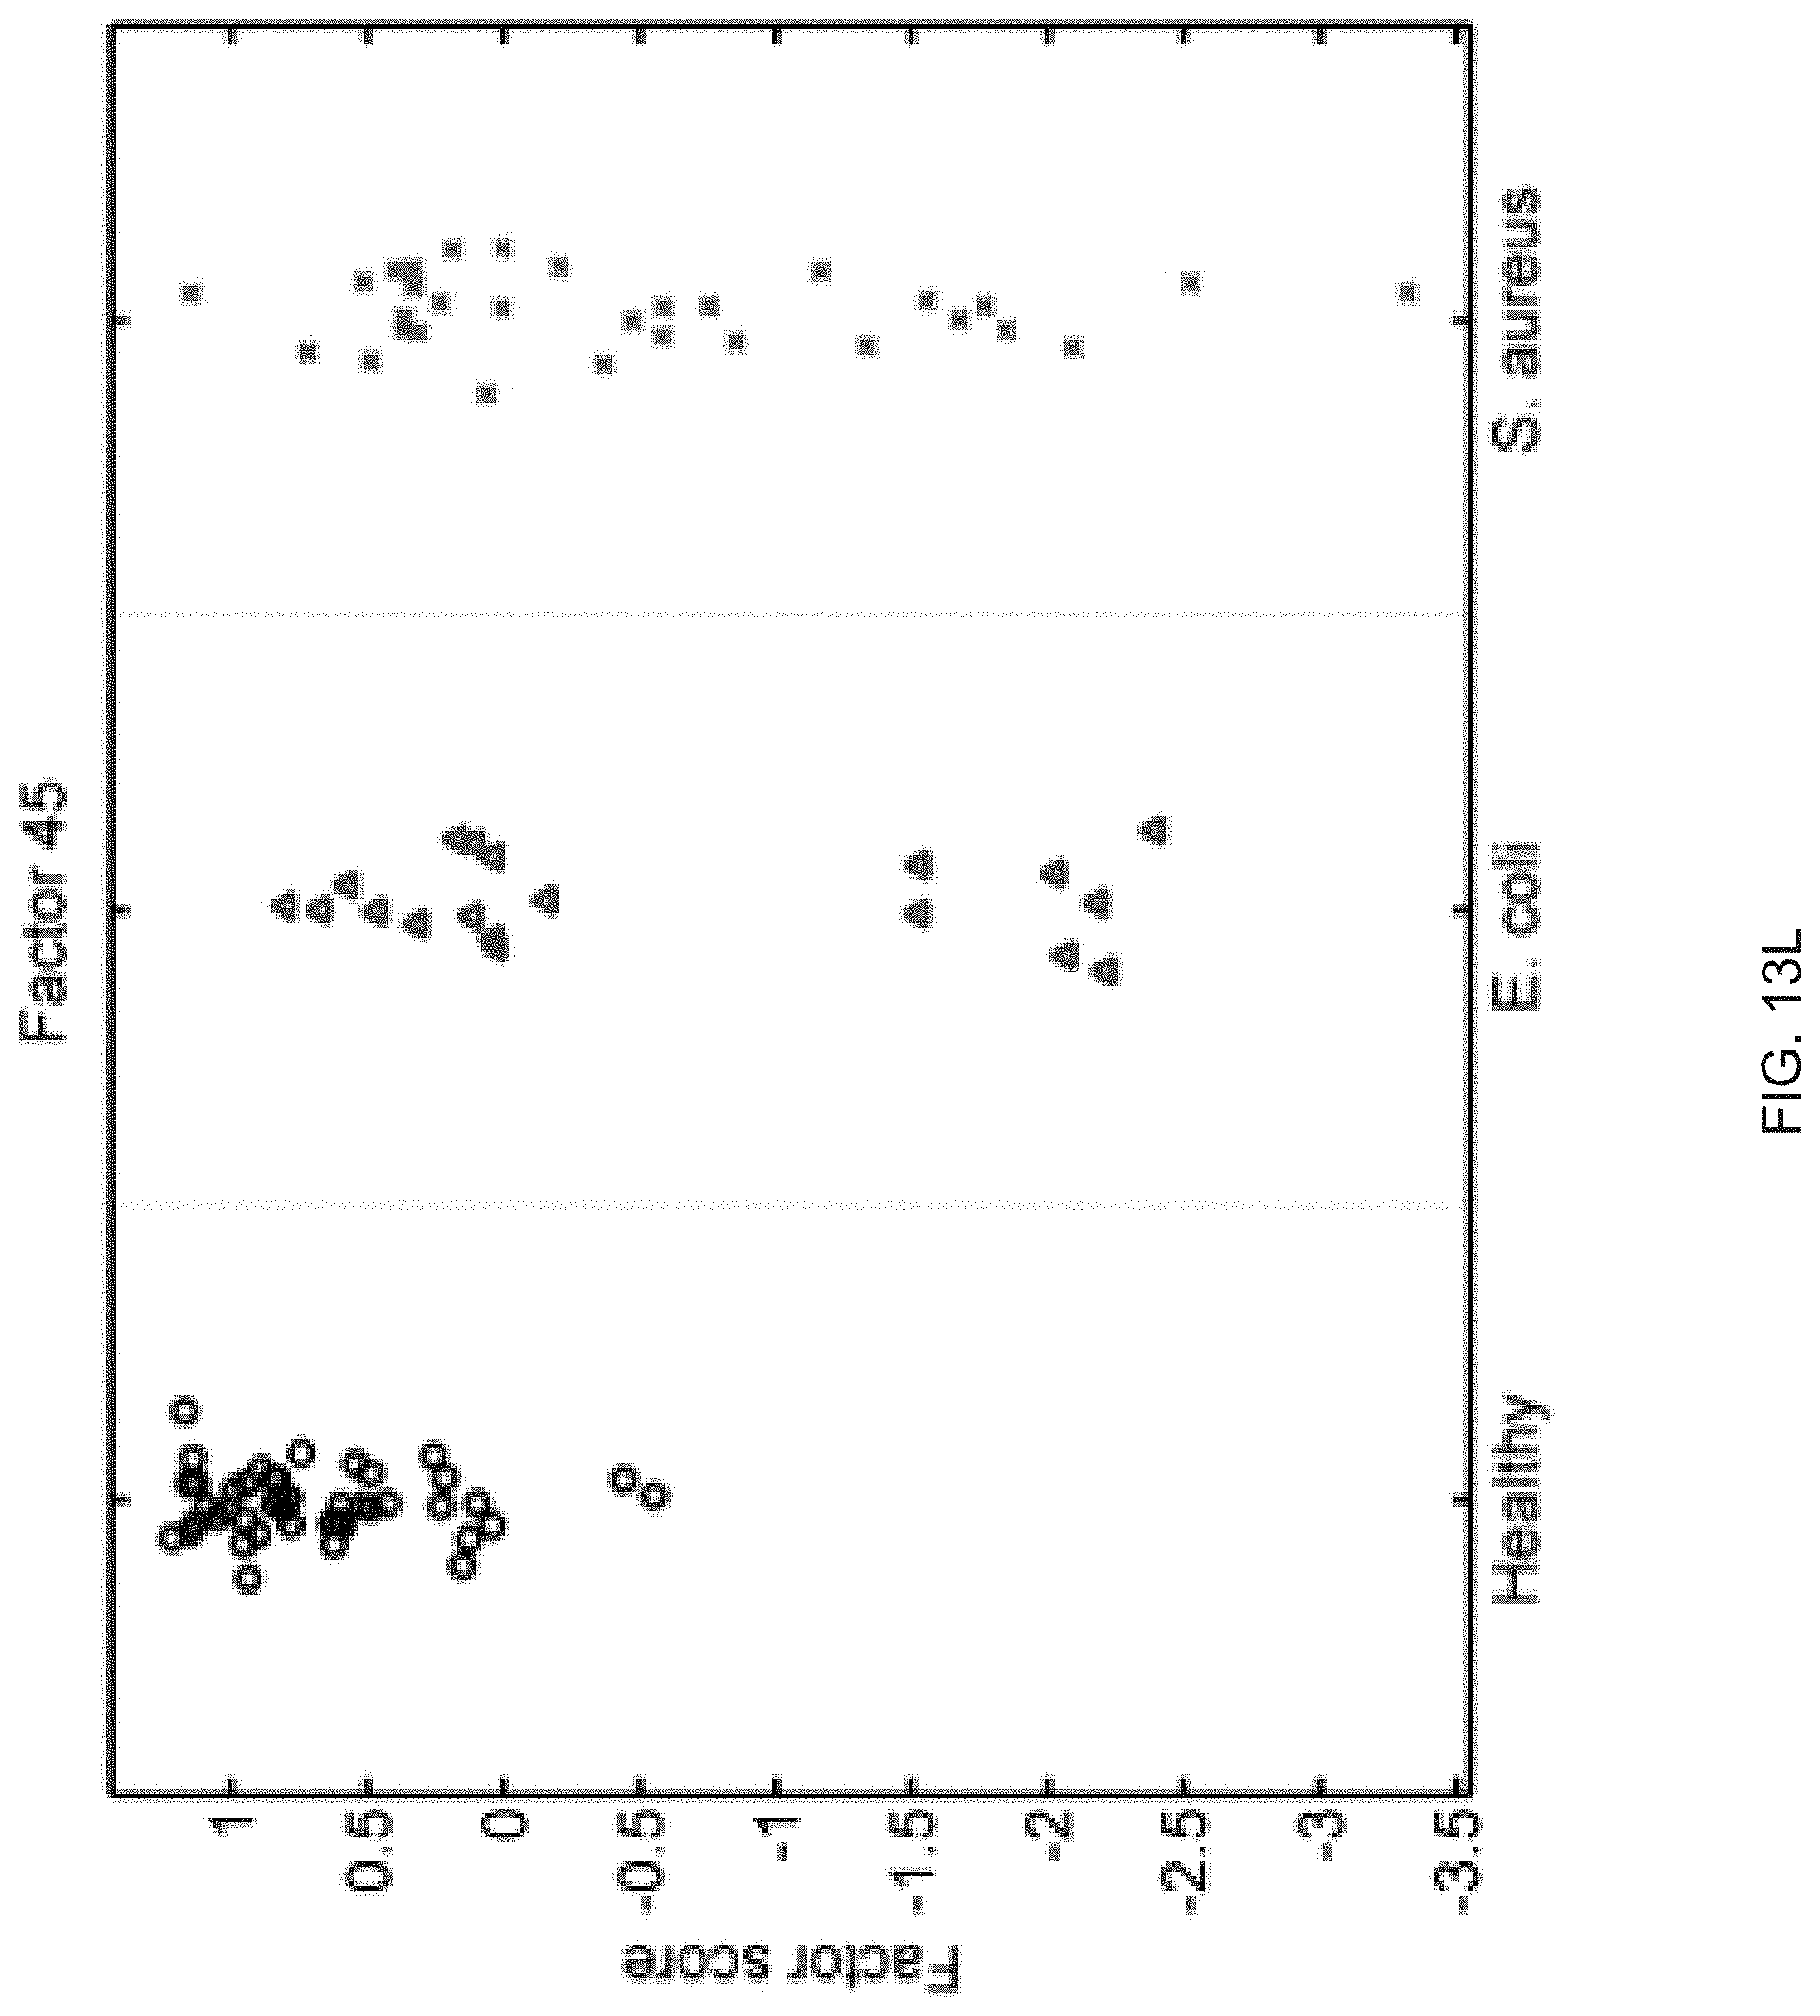
D00040

D00041

D00042

D00043

D00044

D00045
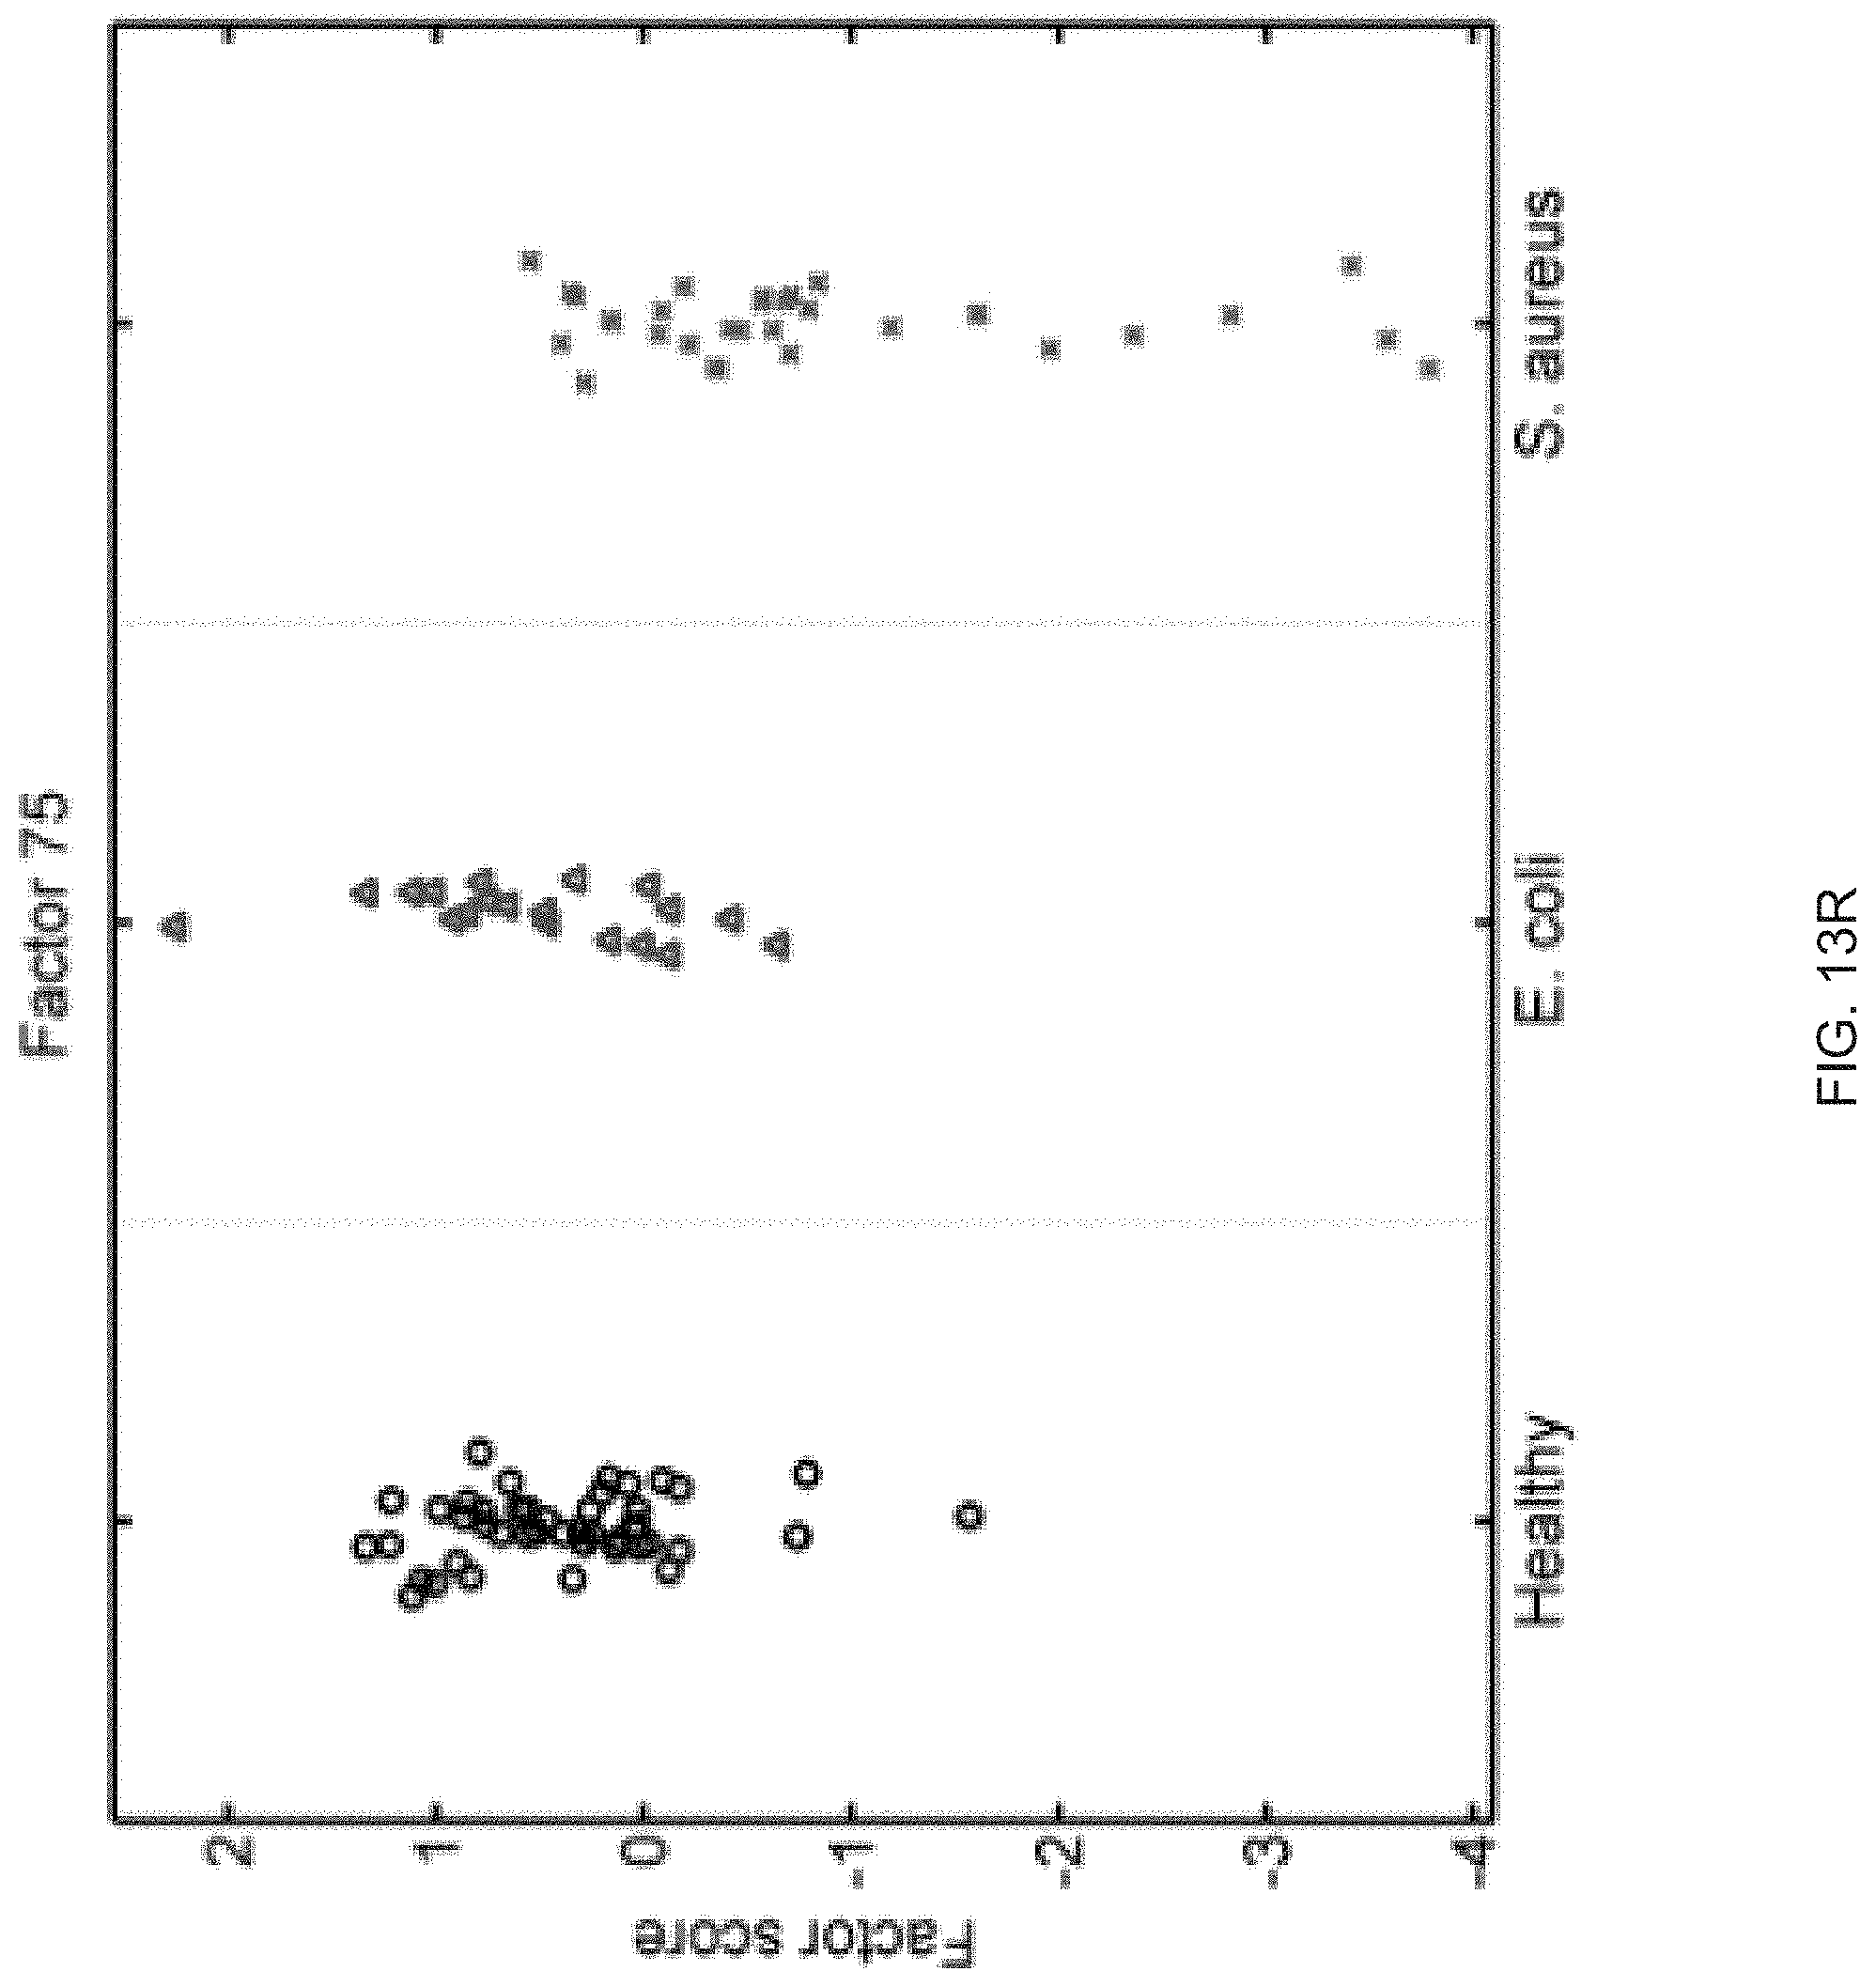
D00046
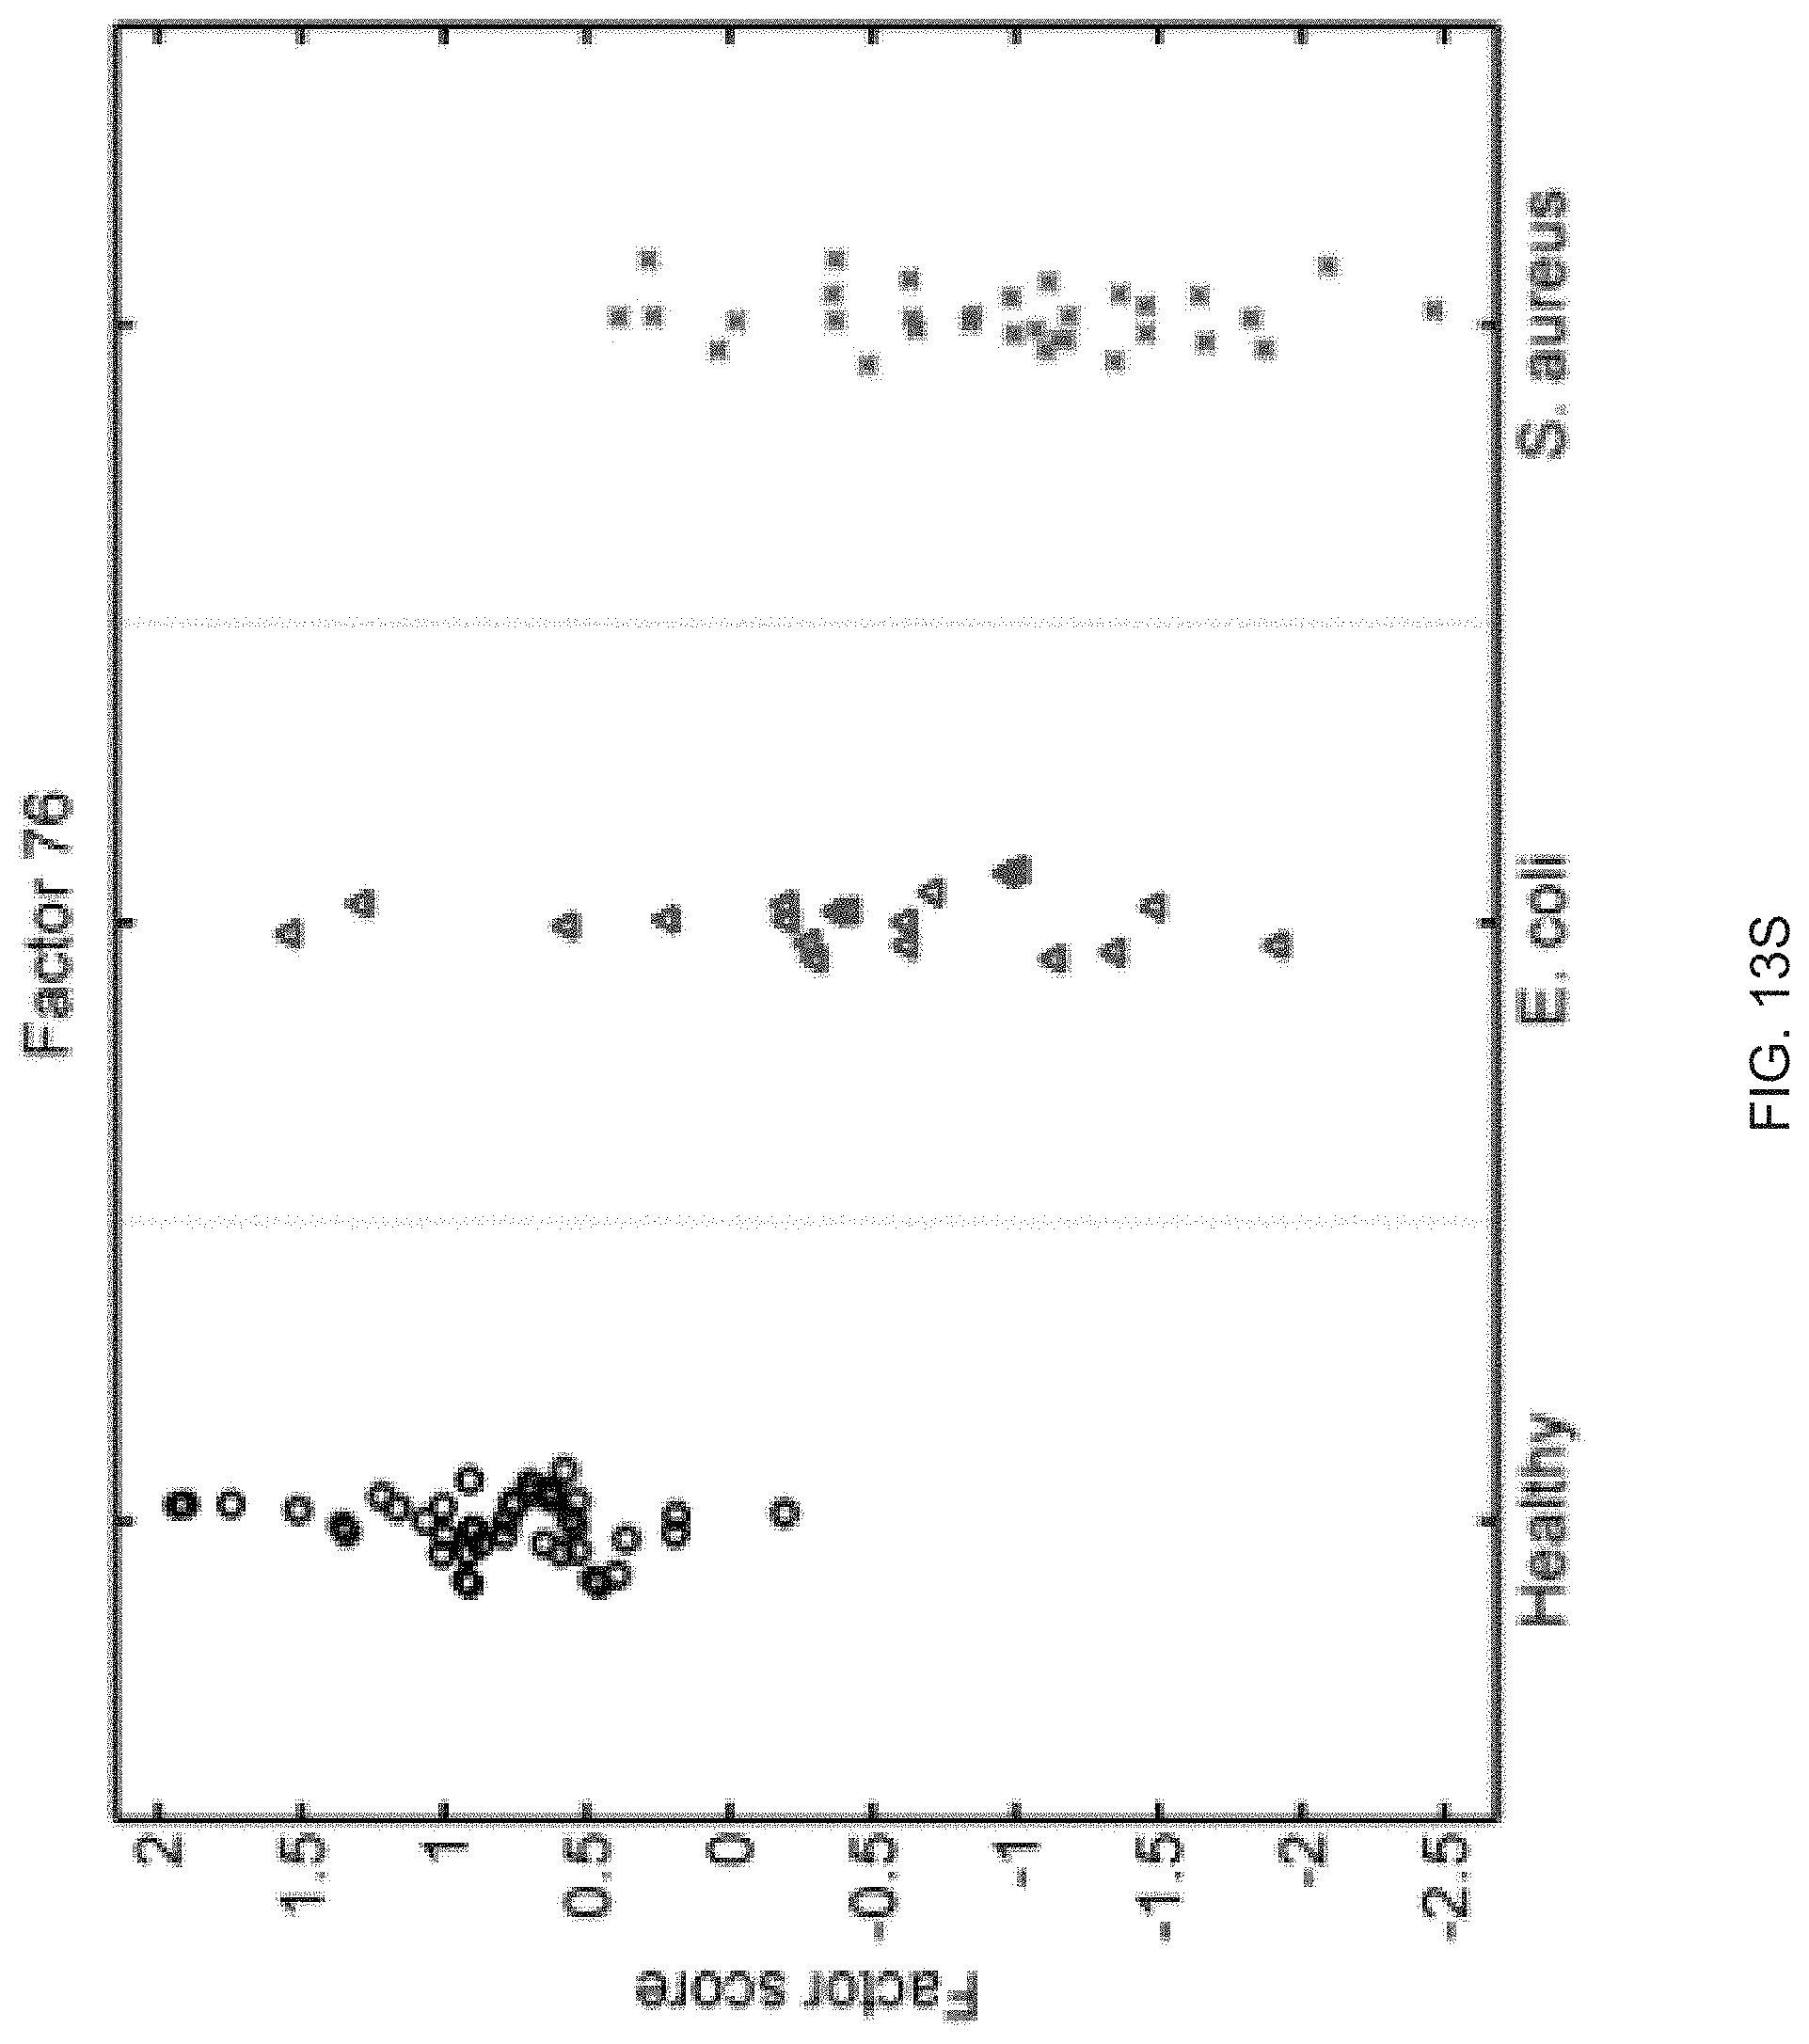
D00047

XML
uspto.report is an independent third-party trademark research tool that is not affiliated, endorsed, or sponsored by the United States Patent and Trademark Office (USPTO) or any other governmental organization. The information provided by uspto.report is based on publicly available data at the time of writing and is intended for informational purposes only.
While we strive to provide accurate and up-to-date information, we do not guarantee the accuracy, completeness, reliability, or suitability of the information displayed on this site. The use of this site is at your own risk. Any reliance you place on such information is therefore strictly at your own risk.
All official trademark data, including owner information, should be verified by visiting the official USPTO website at www.uspto.gov. This site is not intended to replace professional legal advice and should not be used as a substitute for consulting with a legal professional who is knowledgeable about trademark law.