Method and system for detecting information of brain-heart connectivity by using pupillary variation
Park , et al.
U.S. patent number 10,667,714 [Application Number 15/869,722] was granted by the patent office on 2020-06-02 for method and system for detecting information of brain-heart connectivity by using pupillary variation. This patent grant is currently assigned to CENTER OF HUMAN-CENTERED INTERACTION FOR COEXISTENCE, SANGMYUNG UNIVERSITY INDUSTRY-ACADEMY COOPERATION FOUNDATION. The grantee listed for this patent is CENTER OF HUMAN-CENTERED INTERACTION FOR COEXISTENCE, SANGMYUNG UNIVERSITY INDUSTRY-ACADEMY COOPERATION FOUNDATION. Invention is credited to Dong Won Lee, Sungchul Mun, Sang In Park, Min Cheol Whang, Myoung Ju Won.

View All Diagrams
| United States Patent | 10,667,714 |
| Park , et al. | June 2, 2020 |
Method and system for detecting information of brain-heart connectivity by using pupillary variation
Abstract
Provided are a method and system for detecting information of brain-heart connectivity, the method comprising: obtaining moving images of a pupil and an electrocardiogram (ECG) signal from a subject; acquiring a pupil size variation (PSV) from the moving images by separating the moving images at a predetermined time range after R-peak of the ECG signal; extracting signals of a first period and a second period from the PSV; calculating alpha powers of the signals of the first and second periods at predetermined frequencies respectively.
| Inventors: | Park; Sang In (Seoul, KR), Mun; Sungchul (Seoul, KR), Lee; Dong Won (Seongnam-si, KR), Won; Myoung Ju (Cheonan-si, KR), Whang; Min Cheol (Goyang-si, KR) | ||||||||||
|---|---|---|---|---|---|---|---|---|---|---|---|
| Applicant: |
|
||||||||||
| Assignee: | SANGMYUNG UNIVERSITY
INDUSTRY-ACADEMY COOPERATION FOUNDATION (Seoul, KR) CENTER OF HUMAN-CENTERED INTERACTION FOR COEXISTENCE (Seoul, KR) |
||||||||||
| Family ID: | 63166273 | ||||||||||
| Appl. No.: | 15/869,722 | ||||||||||
| Filed: | January 12, 2018 |
Prior Publication Data
| Document Identifier | Publication Date | |
|---|---|---|
| US 20180235498 A1 | Aug 23, 2018 | |
Foreign Application Priority Data
| Feb 17, 2017 [KR] | 10-2017-0021520 | |||
| Nov 7, 2017 [KR] | 10-2017-0147608 | |||
| Current U.S. Class: | 1/1 |
| Current CPC Class: | A61B 5/04012 (20130101); A61B 5/04845 (20130101); A61B 5/163 (20170801); A61B 5/0456 (20130101); A61B 5/4064 (20130101); A61B 5/048 (20130101); A61B 5/7264 (20130101); A61B 5/0478 (20130101) |
| Current International Class: | A61B 5/0456 (20060101); A61B 5/04 (20060101); A61B 5/0484 (20060101); A61B 3/11 (20060101); A61B 5/16 (20060101); A61B 5/0478 (20060101); A61B 5/048 (20060101); A61B 5/00 (20060101) |
References Cited [Referenced By]
U.S. Patent Documents
| 10290139 | May 2019 | Won |
| 104586386 | May 2015 | CN | |||
| 105030258 | Nov 2015 | CN | |||
| 10-1357800 | Feb 2014 | KR | |||
| 10-2017-0004547 | Jan 2017 | KR | |||
| 10-2017-0004914 | Jan 2017 | KR | |||
Other References
|
Ohl, S., Microsaccades are coupled to heartbeat, 2016, Journal of Neuroscience , 36(4), 1237-1241 (Year: 2016). cited by examiner . Machine translation of KR 101357800 (Year: 2014). cited by examiner . Machine translation of KR 1020170004914 (Year: 2016). cited by examiner . Office Action dated Mar. 6, 2019, by the Korean Intellectual Property Office in corresponding Korean Patent Application No. 10-2017-0147608. (42 pages). cited by applicant . Russell, "A Circumplex Model of Affect", Journal of Personality and Social Psychology, 1980, pp. 1161-1178, vol. 39, No. 6, American Psychological Association, Inc. cited by applicant . Tekalp et al., "Face and 2-D Mesh Animation in MPEG-4", Signal Processing: Image Communication, 2000, pp. 387-421, vol. 15, Elsevier Science B.V. cited by applicant . Daugman, "How Iris Recognition Works", IEEE Transactions on Circuits and Systems for Video Technology, Jan. 2004, pp. 21-30, vol. 14, No. 1, IEEE. cited by applicant . Lee et al., "Measuring the Degree of Eyestrain Caused by Watching LCD and PDP Devices", International Journal of Industrial Ergonomics, 2009, pp. 798-806, vol. 39, Elsevier B.V. cited by applicant . Schandry et al., "Event-Related Brain Potentials and the Processing of Cardiac Activity", Biological Psychology 1996, pp. 75-85, vol. 42, Elsevier Science B.V. cited by applicant . Park et al., "Does Visual Fatigue from 3D Displays Affect Autonomic Regulation and Heart Rhythm", International Journal of Psychophysiology, 2014, pp. 42-48, vol. 92, Elsevier B.V. cited by applicant . Park et al., "Evaluation of 3D Cognitive Fatigue using Heart-Brain Synchronization", International Journal of Psychophysiology, 2015, pp. 120-130, vol. 97, Elsevier B.V. cited by applicant . Montoya et al., "Heartbeat Evoked Potentials (HEP): Topography and Influence of Cardiac Awareness and Focus of Attention", Electroencephalography and Clinical Neurophysiology, 1993, pp. 163-172, vol. 88, Elsevier Scientific Publishers Ireland, Ltd. cited by applicant . Janig, "Neurobiology of Visceral Afferent Neurons: Neuroanatomy, Functions, Organ Regulations and Sensations", Biological Psychology, 1996, pp. 29-51, vol. 42, Elsevier Science B.V. cited by applicant . Rau et al., "Baroreceptor Stimulation Alters Cortical Activity", Psychophysiology, 1993, pp. 322-325, vol. 30, Society of Psychophysiological Research. cited by applicant . Hansen et al., "Vagal Influence on Working Memory and Attention", International Journal of Psychophysiology, 2003, pp. 263-274, vol. 48, Elsevier Science B.V. cited by applicant . McCraty et al., The Coherent Heart Heart-Brain Interactions, Psychophysiological Coherence, and the Emergence of System-Wide Order, Integral Review, Dec. 2009, pp. 10-115, vol. 5, No. 2. cited by applicant . Pan et al., "A Real-Time QRS Detection Algorithm", IEEE Transactions on Biomedical Engineering, Mar. 1985, pp. 230-236, vol. BME-32, No. 3, IEEE. cited by applicant . Dunnett, "A Multiple Comparison Procedure for Comparing Several Treatments with a Control", Journal of the American Statistical Association, Dec. 1955, pp. 1096-1121, vol. 50, No. 242, American Statistical Association. cited by applicant . Cohen, Statistical Power Analysis for the Behavioral Sciences, Biometrics, Sep. 1970, pp. 588, vol. 26, No. 3, International Biometric Society. cited by applicant . Office Action (First Office Action) dated Dec. 3, 2019, by the State Intellectual Property Office of People's Republic of China in corresponding Chinese Patent Application No. 201810109055.4 and an English Translation of the Office Action. (Summary of Office Action, 1 page), (20 pages). cited by applicant. |
Primary Examiner: McCrosky; David J.
Assistant Examiner: Jhin; Chanel J
Attorney, Agent or Firm: Buchanan Ingersoll & Rooney PC
Claims
What is claimed is:
1. A method of detecting information of brain-heart connectivity, the method comprising: obtaining moving images of a pupil and an electrocardiogram (ECG) signal from a subject; acquiring a pupil size variation (PSV) from the moving images by separating the moving images based on a predetermined time range after R-peak of the ECG signal; extracting signals of a first period and a second period from the PSV and calculating alpha powers of the signals of the first and second periods at predetermined frequencies, respectively, wherein the first period ranges between 56 ms-348 ms after the R-peak, the second period ranges between 248 ms-600 ms after the R-peak, and each of the alpha powers is obtained from a ratio of a power of the respective frequency thereof to a total power of a total frequency ranging from 0 Hz to 62.5 Hz.
2. The method of claim 1, further comprising repeating the acquiring a predetermined number of times to obtain a plurality of the PSV; and integrating the plurality of the PSV into a PSV based on a grand average technique.
3. The method of claim 1, wherein the frequency of the alpha power of the first period is 10 Hz, and the frequency of the alpha power of the second period is 9 Hz or 11 Hz.
4. A system of detecting information of brain-heart connectivity, the system comprising: a video capturing unit configured to capture the moving images of the subject; and a computer architecture based analyzing unit, including analysis tools provided by software, configured to perform: obtaining moving images of a pupil and an electrocardiogram (ECG) signal from a subject; acquiring a pupil size variation (PSV) from the moving images by separating the moving images based on a predetermined time range after R-peak of the ECG signal; extracting signals of a first period and a second period from the PSV; and calculating alpha powers of the signals of the first and second periods at predetermined frequencies, respectively, wherein the first period ranges between 56 ms-348 ms after the R-peak, and the second period ranges between 248 ms-600 ms after the R-peak, and each of the alpha powers is obtained from a ratio of a power of the respective frequency thereof to a total power of a total frequency ranging from 0 Hz to 62.5 Hz.
5. The system of claim 4, wherein the analyzing unit is configured to perform repeating of the acquiring a predetermined number of times to obtain a plurality of the PSV; and integrating the plurality of the PSV into a PSV based on a grand average technique.
6. The system of claim 4, wherein the frequency of the alpha power of the first period is 10 Hz, and the frequency of the alpha power of the second period is 9 Hz or 11 Hz.
Description
CROSS-REFERENCE TO RELATED APPLICATION
This application claims the benefit of Korean Patent Application Nos. 10-2017-0021520, filed on Feb. 17, 2017, and 10-2017-0147608, filed on Nov. 7, 2017, in the Korean Intellectual Property Office, the disclosures of which are incorporated herein in their entirety by reference.
BACKGROUND
1. Field
One or more embodiments relate to a method of detecting physiological information by using a pupillary response, and a system using the method, and more particularly, to method of detecting parameters of brain-heart connectivity from a pupil size variation, and a system using the method.
2. Description of the Related Art
In vital signal monitoring (VSM), physiological information can be acquired by a sensor attached to a human body. Such physiological information includes electrocardiogram (ECG), photo-plethysmograph (PPG), blood pressure (BP), galvanic skin response (GSR), skin temperature (SKT), respiration (RSP) and electroencephalogram (EEG).
The heart and brain are two main organs of the human body and analysis thereof provide the ability to evaluate human behavior and obtain information that may be used in response to events and in medical diagnosis. The VSM may be applicable in various fields such as ubiquitous healthcare (U-healthcare), emotional information and communication technology (e-ICT), human factor and ergonomics (HF&E), human computer interfaces (HCIs), and security systems.
Regarding ECG and EEG, sensors attached to the body are used to measure physiological signals and thus, may cause inconvenience to patients. That is, the human body experiences considerable stress and inconvenience when using sensors to measure such signals. In addition, there are burdens and restrictions with respect to the cost of using the attached sensors and to the movement of the subject, due to attached sensor hardware.
Therefore, VSM technology is required in the measurement of physiological signals by using non-contact, non-invasive, and non-obtrusive methods while providing unfettered movement at low cost.
Recently, VSM technology has been incorporated into wireless wearable devices allowing for the development of portable measuring equipment. These portable devices can measure the heart rate (HR) and RSP by using VSM embedded into accessories such as watches, bracelets, or glasses.
Wearable device technology is predicted to develop from portable devices to "attachable" devices shortly. It is also predicted that attachable devices will be transferred to "eatable" devices.
VSM technology has been developed to measure physiological signals by using non-contact, non-invasive, and non-obtrusive methods that provide unfettered movement at low cost. While VSM will continue to advance technologically, innovative vision-based VSM technology is required to be developed also.
SUMMARY
One or more embodiments include a system and method for inferring and detecting human vital signs by non-invasive and non-obstructive method at low cost.
In detail, one or more embodiments include a system and method for detecting parameters of brain-heart connectivity by using a pupil rhythm or pupillary variation.
Additional aspects will be set forth in part in the description which follows and, in part, will be apparent from the description, or may be learned by practice of the presented embodiments.
According to one or more exemplary embodiments, the method of detecting information of brain-heart connectivity, the method comprises obtaining moving images of a pupil and an electrocardiogram (ECG) signal from a subject; acquiring a pupil size variation (PSV) from the moving images by separating the moving images based on a predetermined time range after R-peak of the ECG signal; extracting signals of a first period and a second period from the PSV; calculating alpha powers of the signals of the first and second periods at predetermined frequencies, respectively.
According to one or more exemplary embodiments, the method further comprises repeating the acquiring a predetermined number of times to obtain a plurality of the PSV; and integrating the plurality of the PSV into a PSV based on a grand average technique.
According to one or more exemplary embodiments, the predetermined time range is between 56 ms to 600 ms.
According to one or more exemplary embodiments, the first period ranges between 56 ms-348 ms after the R-peak.
According to one or more exemplary embodiments, the second period ranges between 248 ms-600 ms after the R-peak.
According to one or more exemplary embodiments, the frequency of the alpha power of the first period is 10 Hz, and the frequency of the alpha power of the second period is 9 Hz or 11 Hz.
According to one or more exemplary embodiments, the first period ranges between 56 ms-348 ms after the R-peak, and the second period ranges between 248 ms-600 ms after the R-peak. According to one or more exemplary embodiments,
According to one or more exemplary embodiments, the frequency of the alpha power of the first period is 10 Hz, and the frequency of the alpha power of the second period is 9 Hz or 11 Hz.
According to one or more exemplary embodiments, each of the alpha powers is obtained from a ratio of power of the respective frequency thereof to a total power of a total frequency ranging from 0 Hz to 62.5 Hz.
According to one or more exemplary embodiments, the system adopting the method comprises a video capturing unit configured to capture the moving images of the subject; and a computer architecture based analyzing unit, including analysis tools, configured to process, analyze the moving images, and calculate the alpha powers of the signals of the first and second periods.
BRIEF DESCRIPTION OF THE DRAWINGS
In these and/or other aspects will become apparent and more readily appreciated from the following description of the embodiments, taken in conjunction with the accompanying drawings in which:
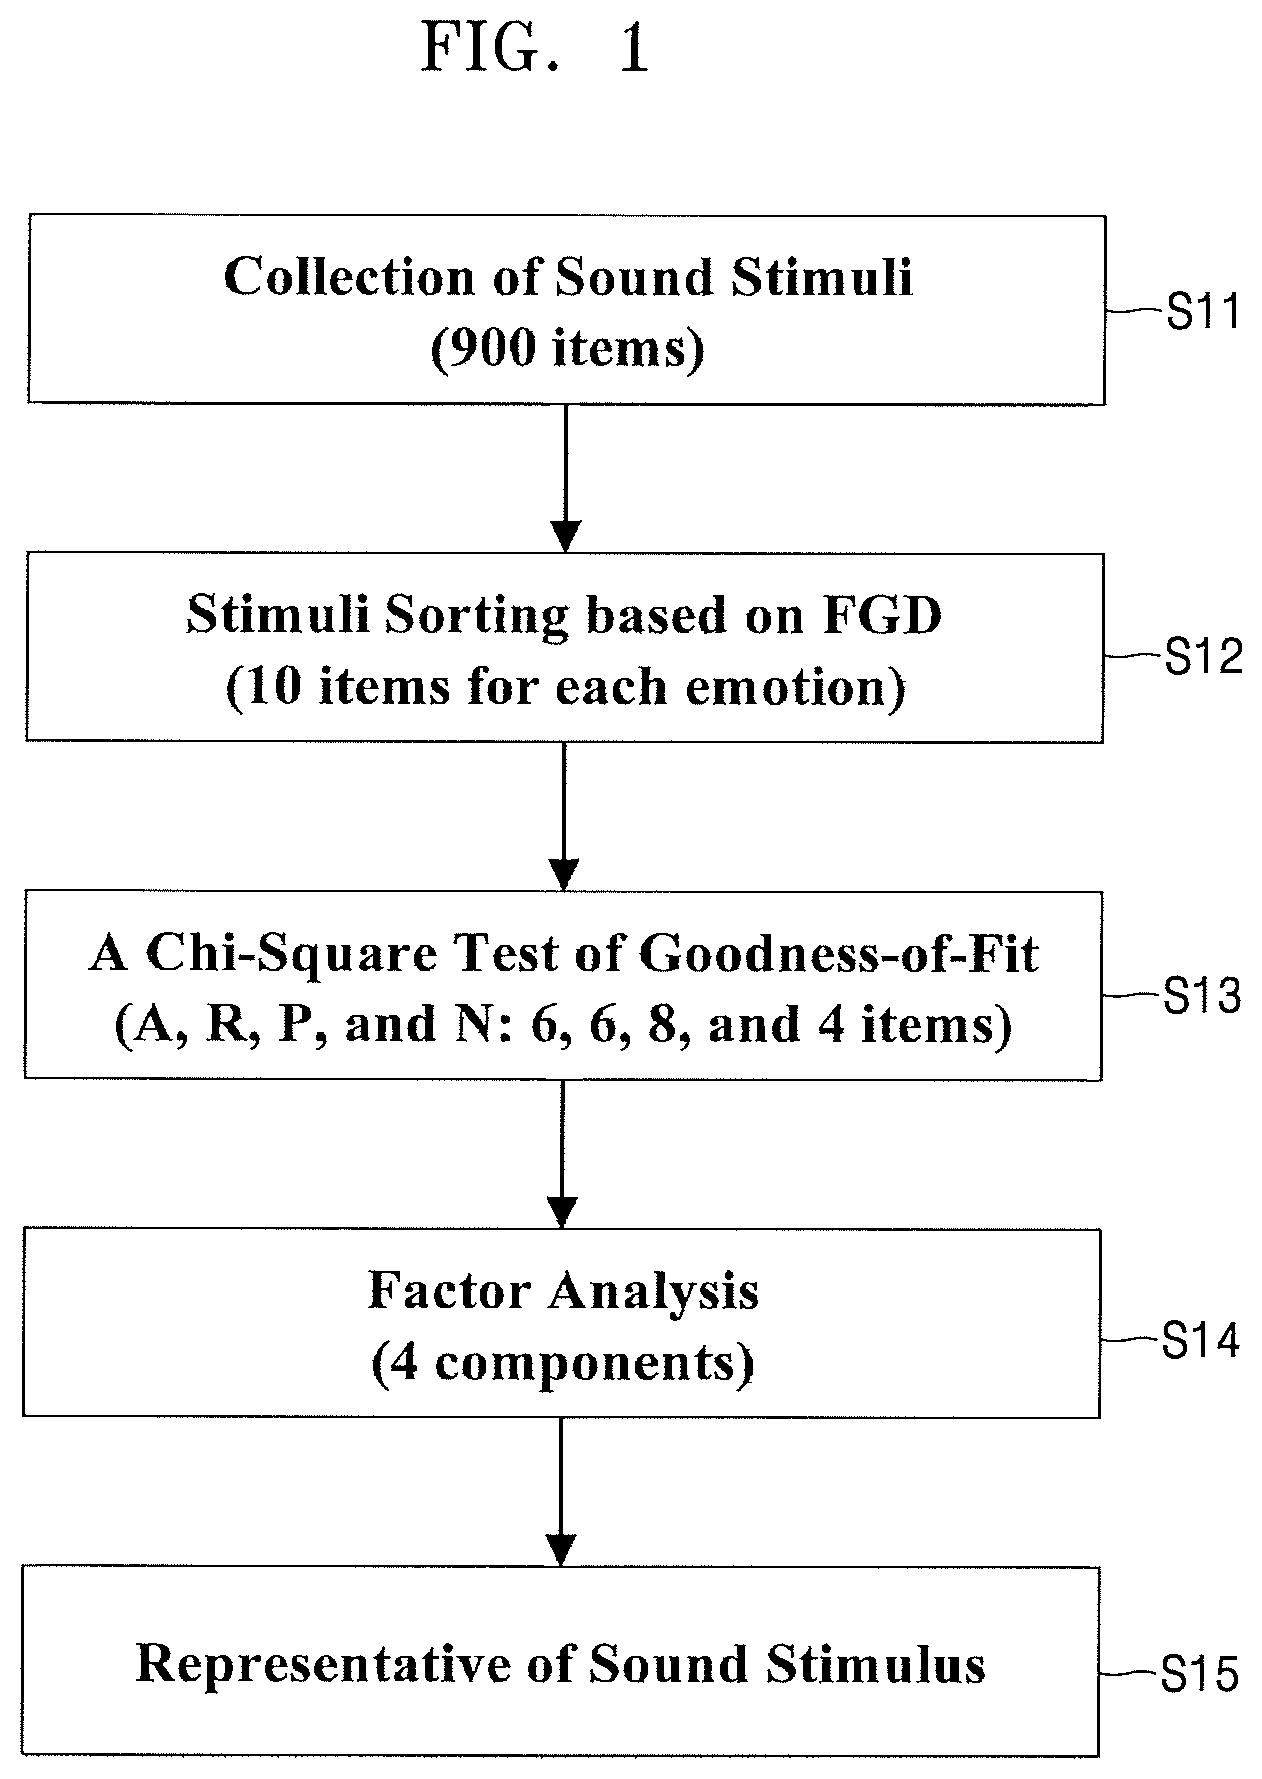
FIG. 1 shows a procedure for selecting a representative of sound stimulus used in an example test, according to one or more embodiments;
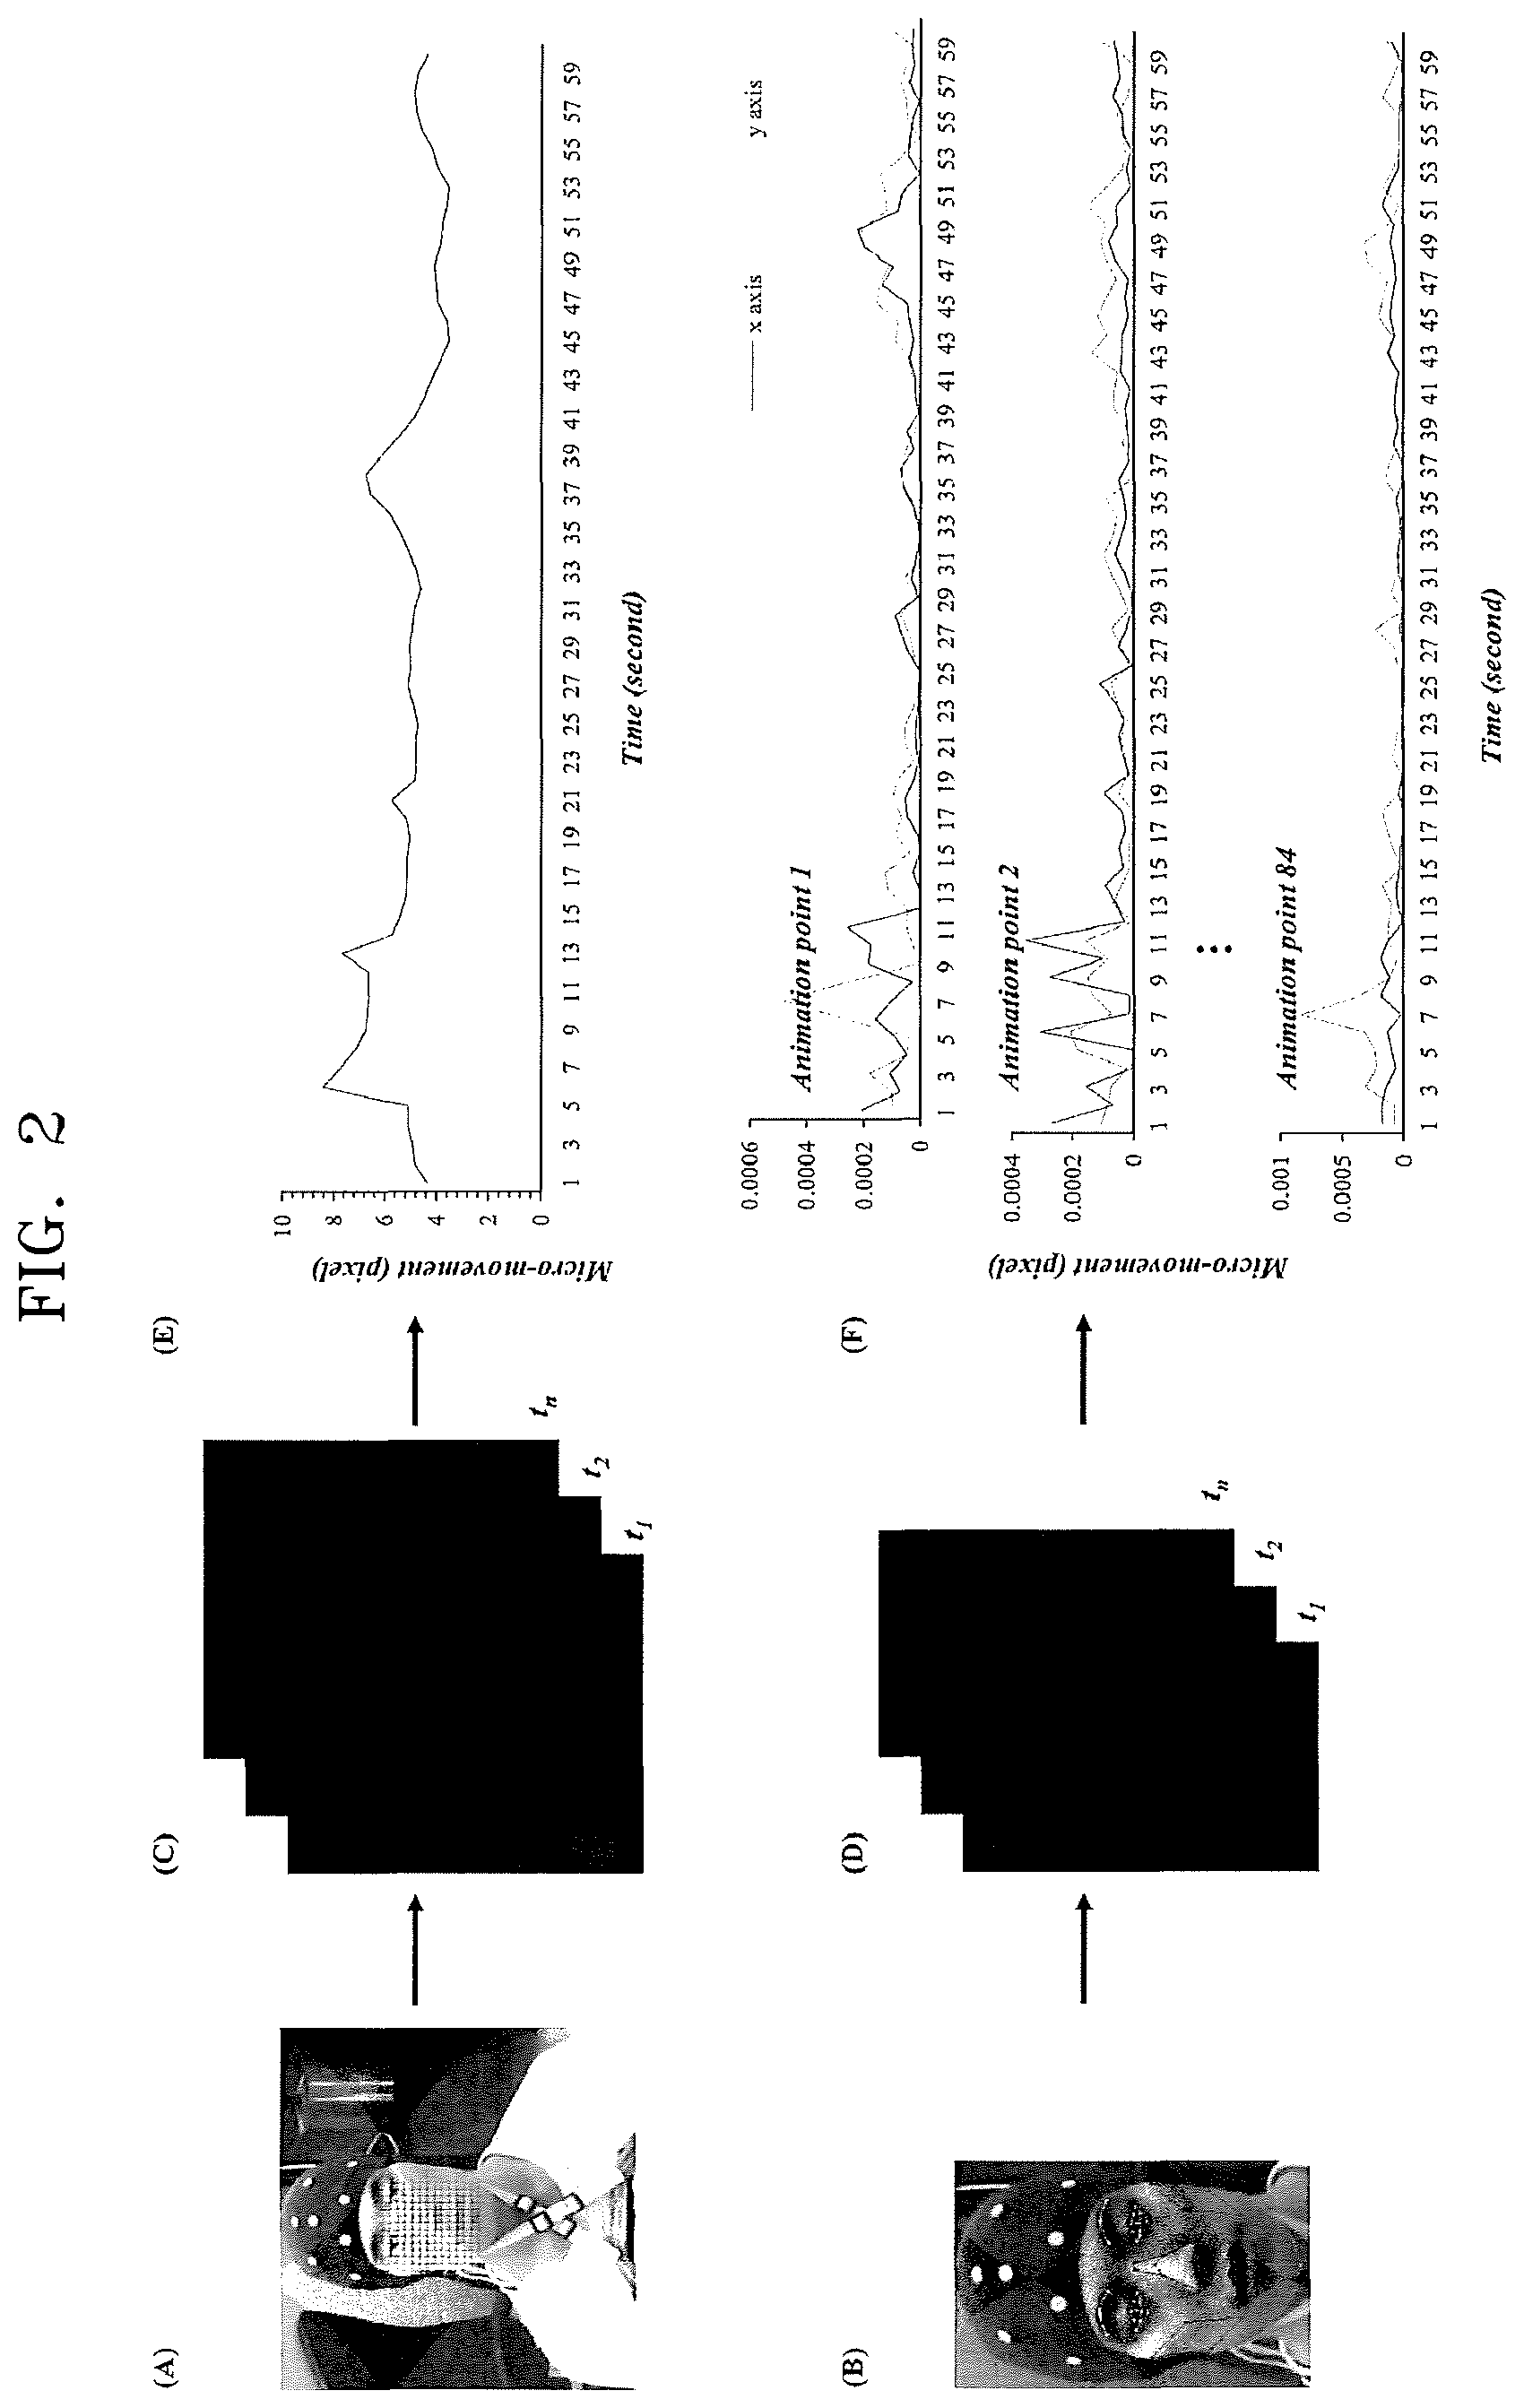
FIG. 2 shows an experimental procedure for measuring the amount of movement in an upper body, according to one or more embodiments;
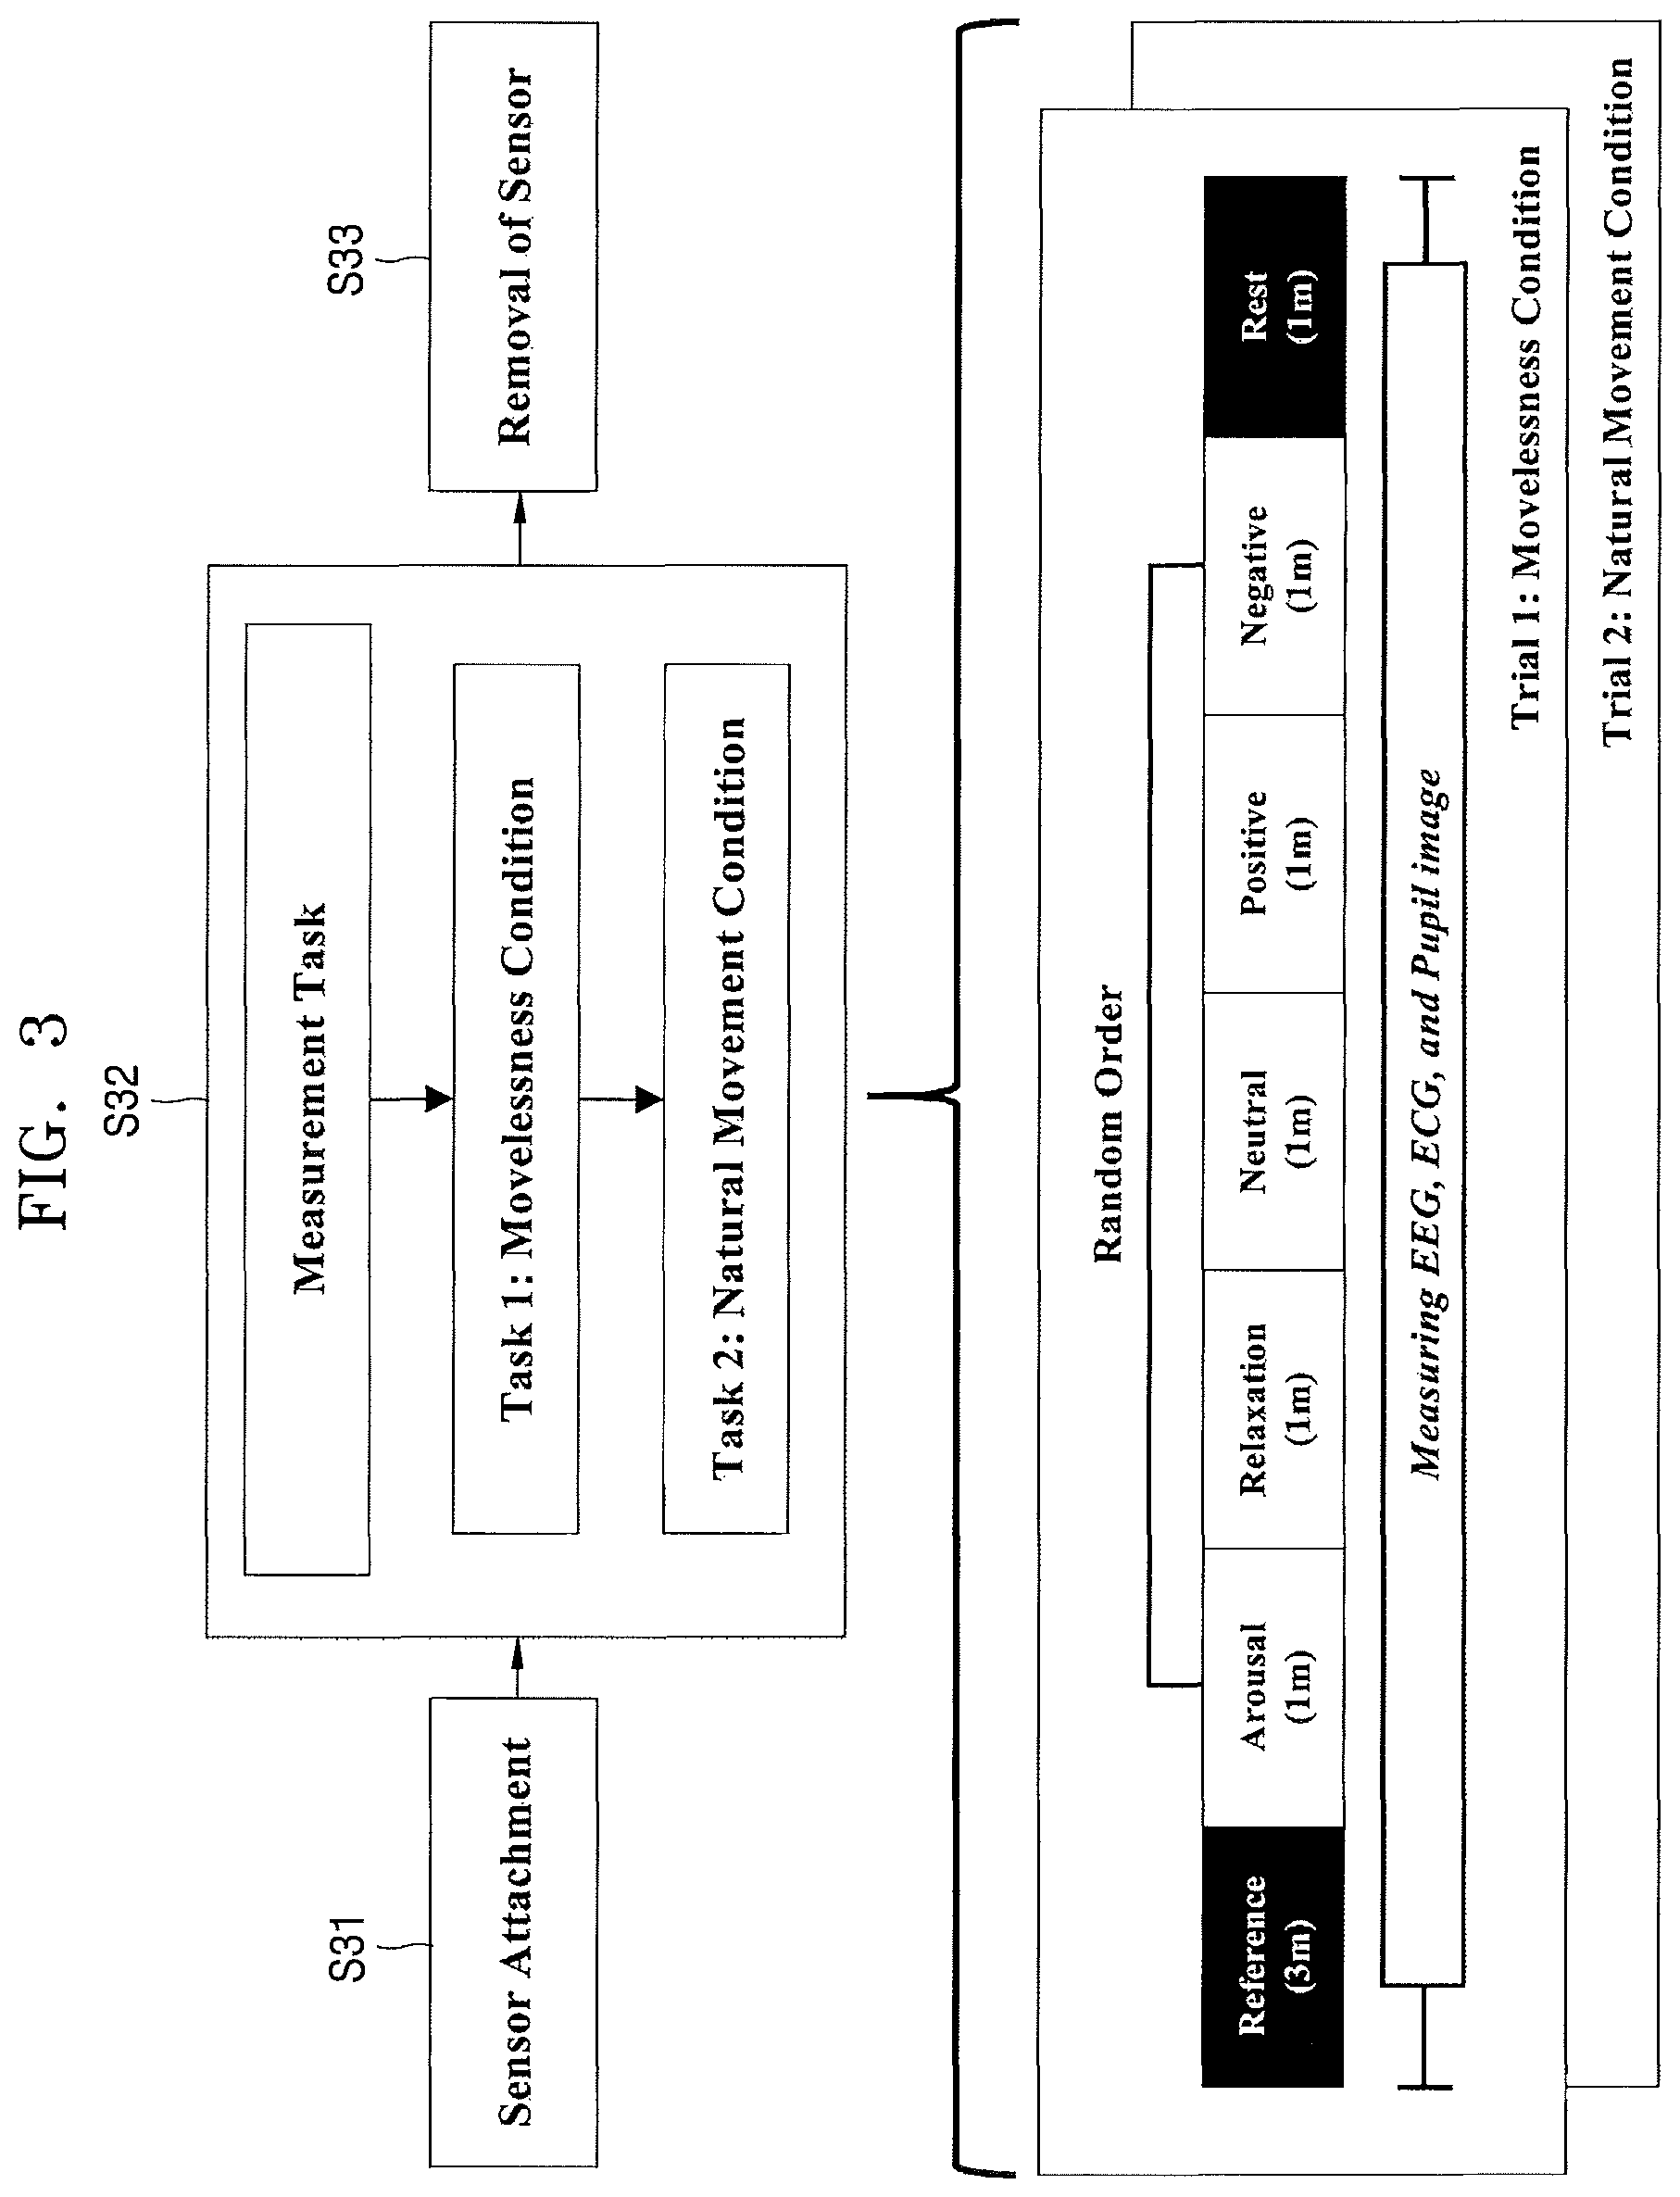
FIG. 3 is a block diagram for explaining an experimental procedure, according to one or embodiments;
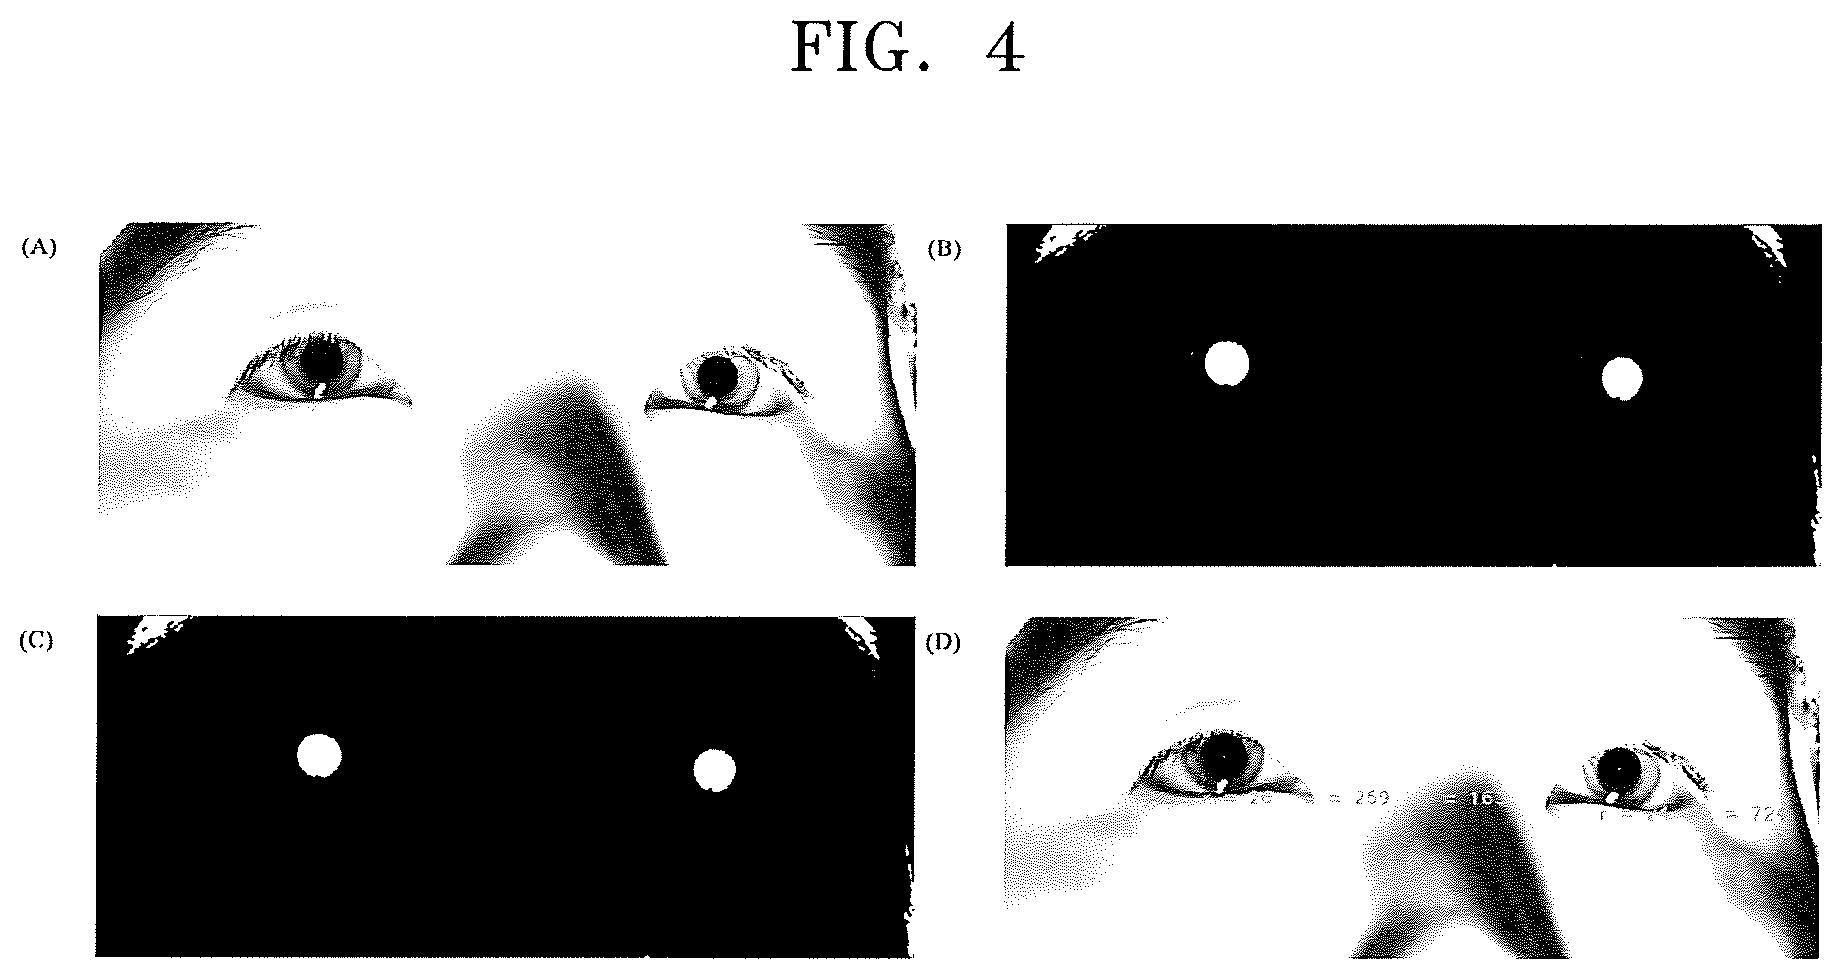
FIG. 4 shows a procedure for detecting a pupil region, according to one or more embodiments;
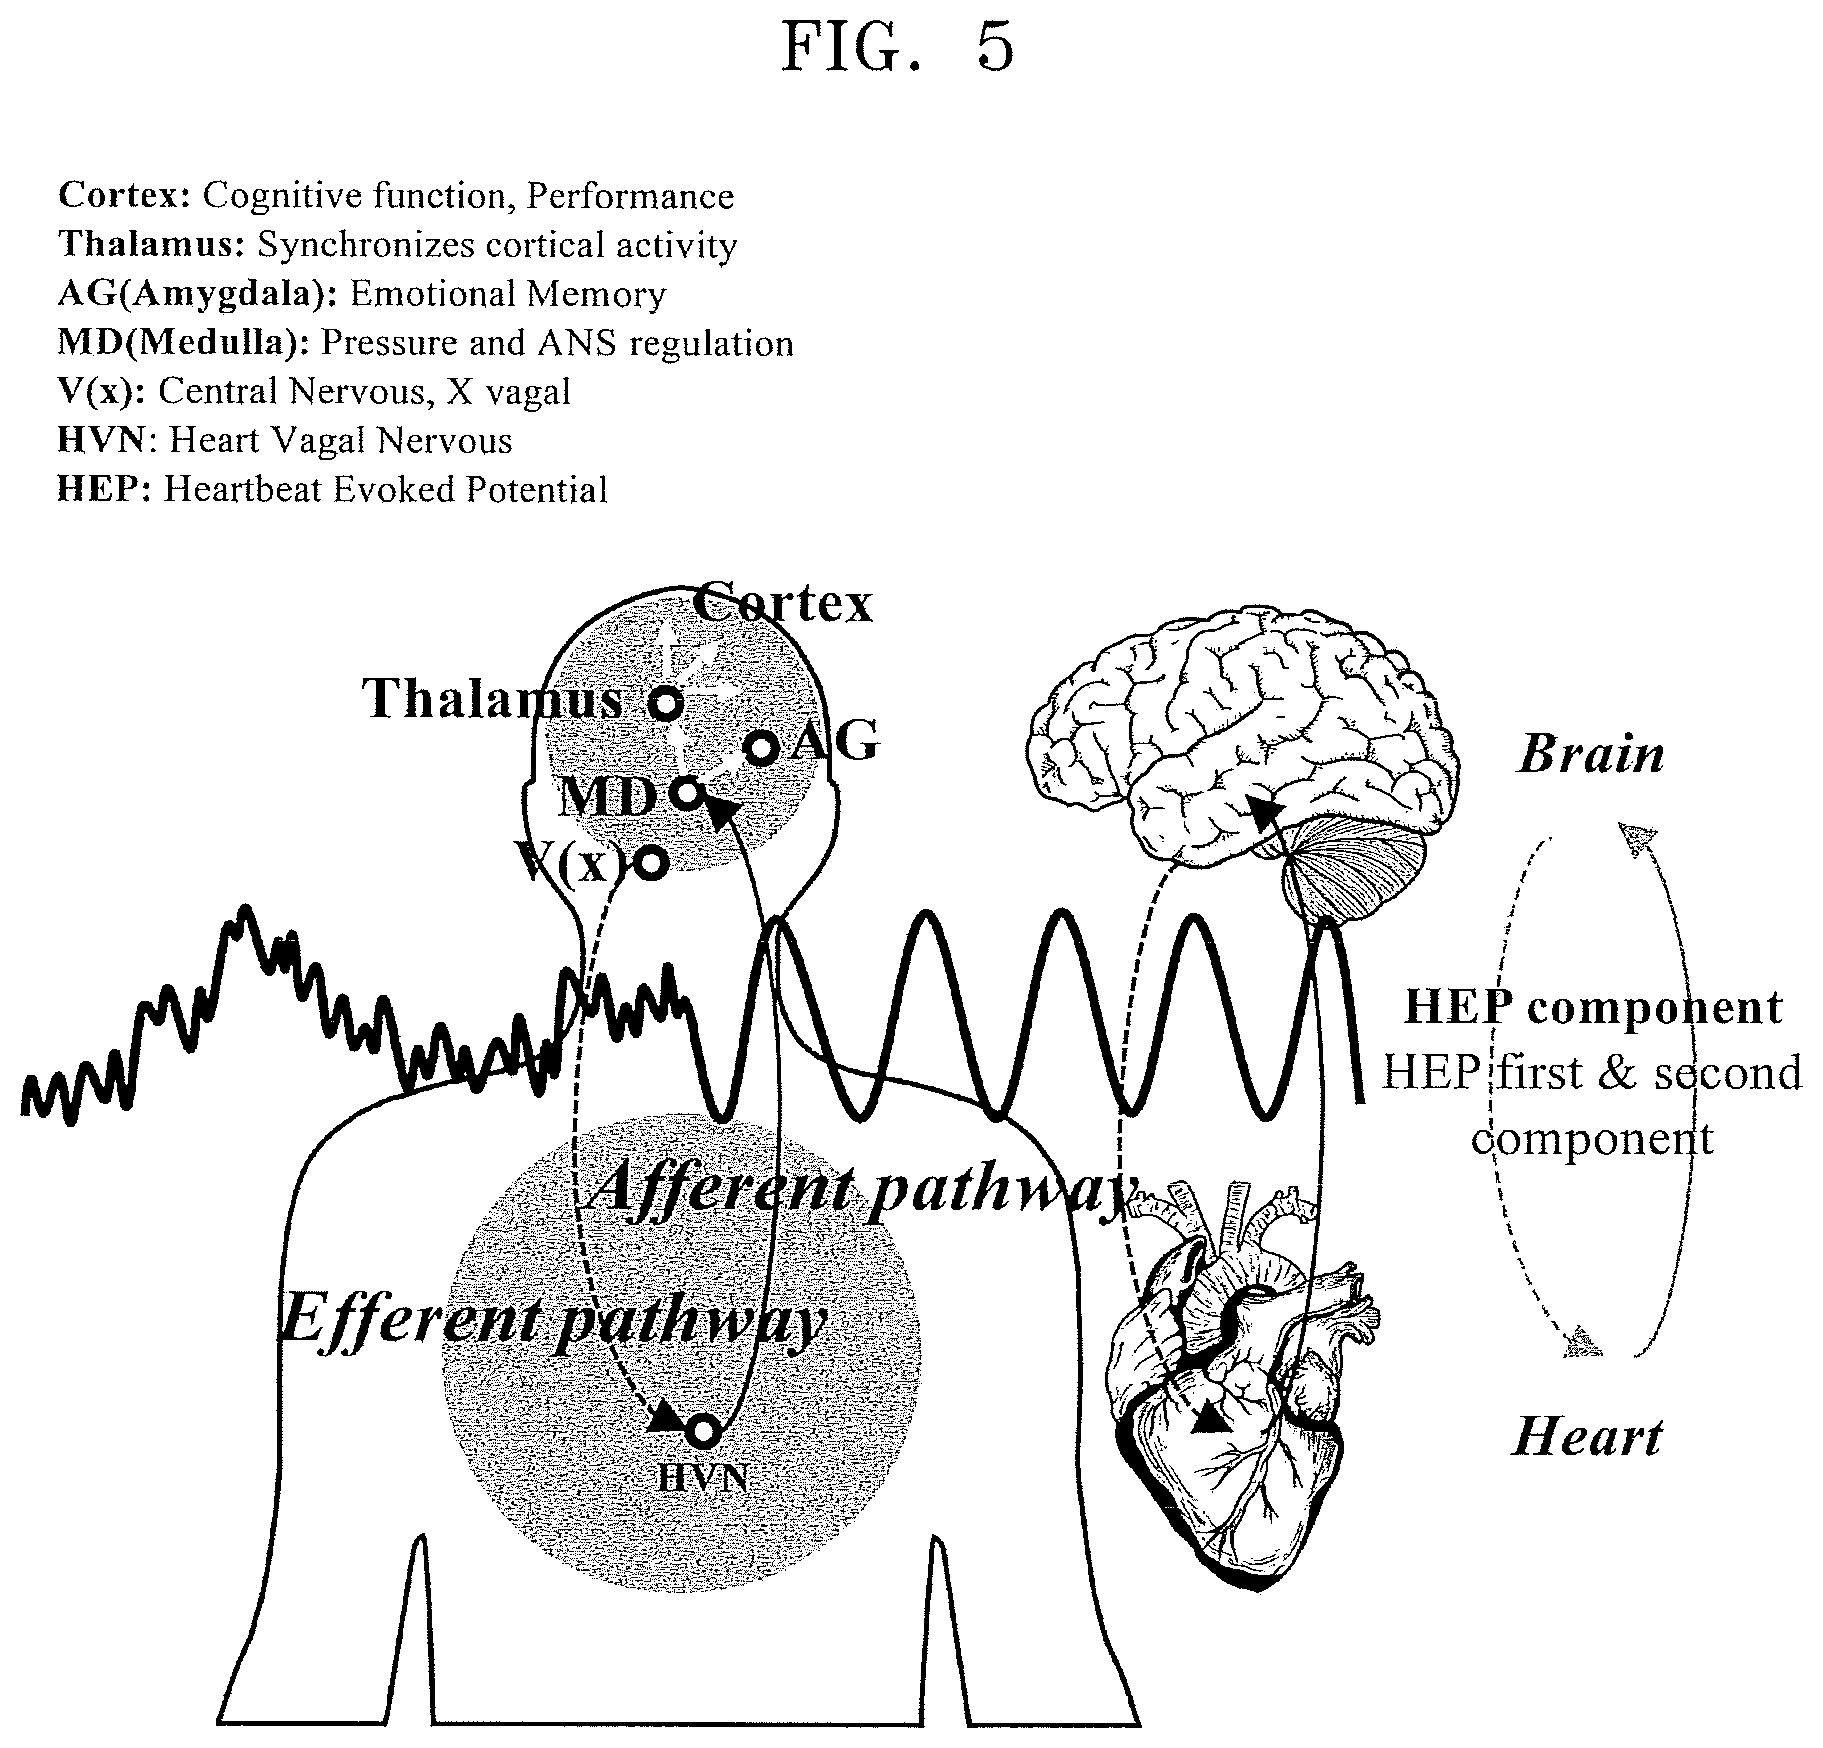
FIG. 5 schematically explains a theory of brain-heart connectivity, according to one or more embodiments.
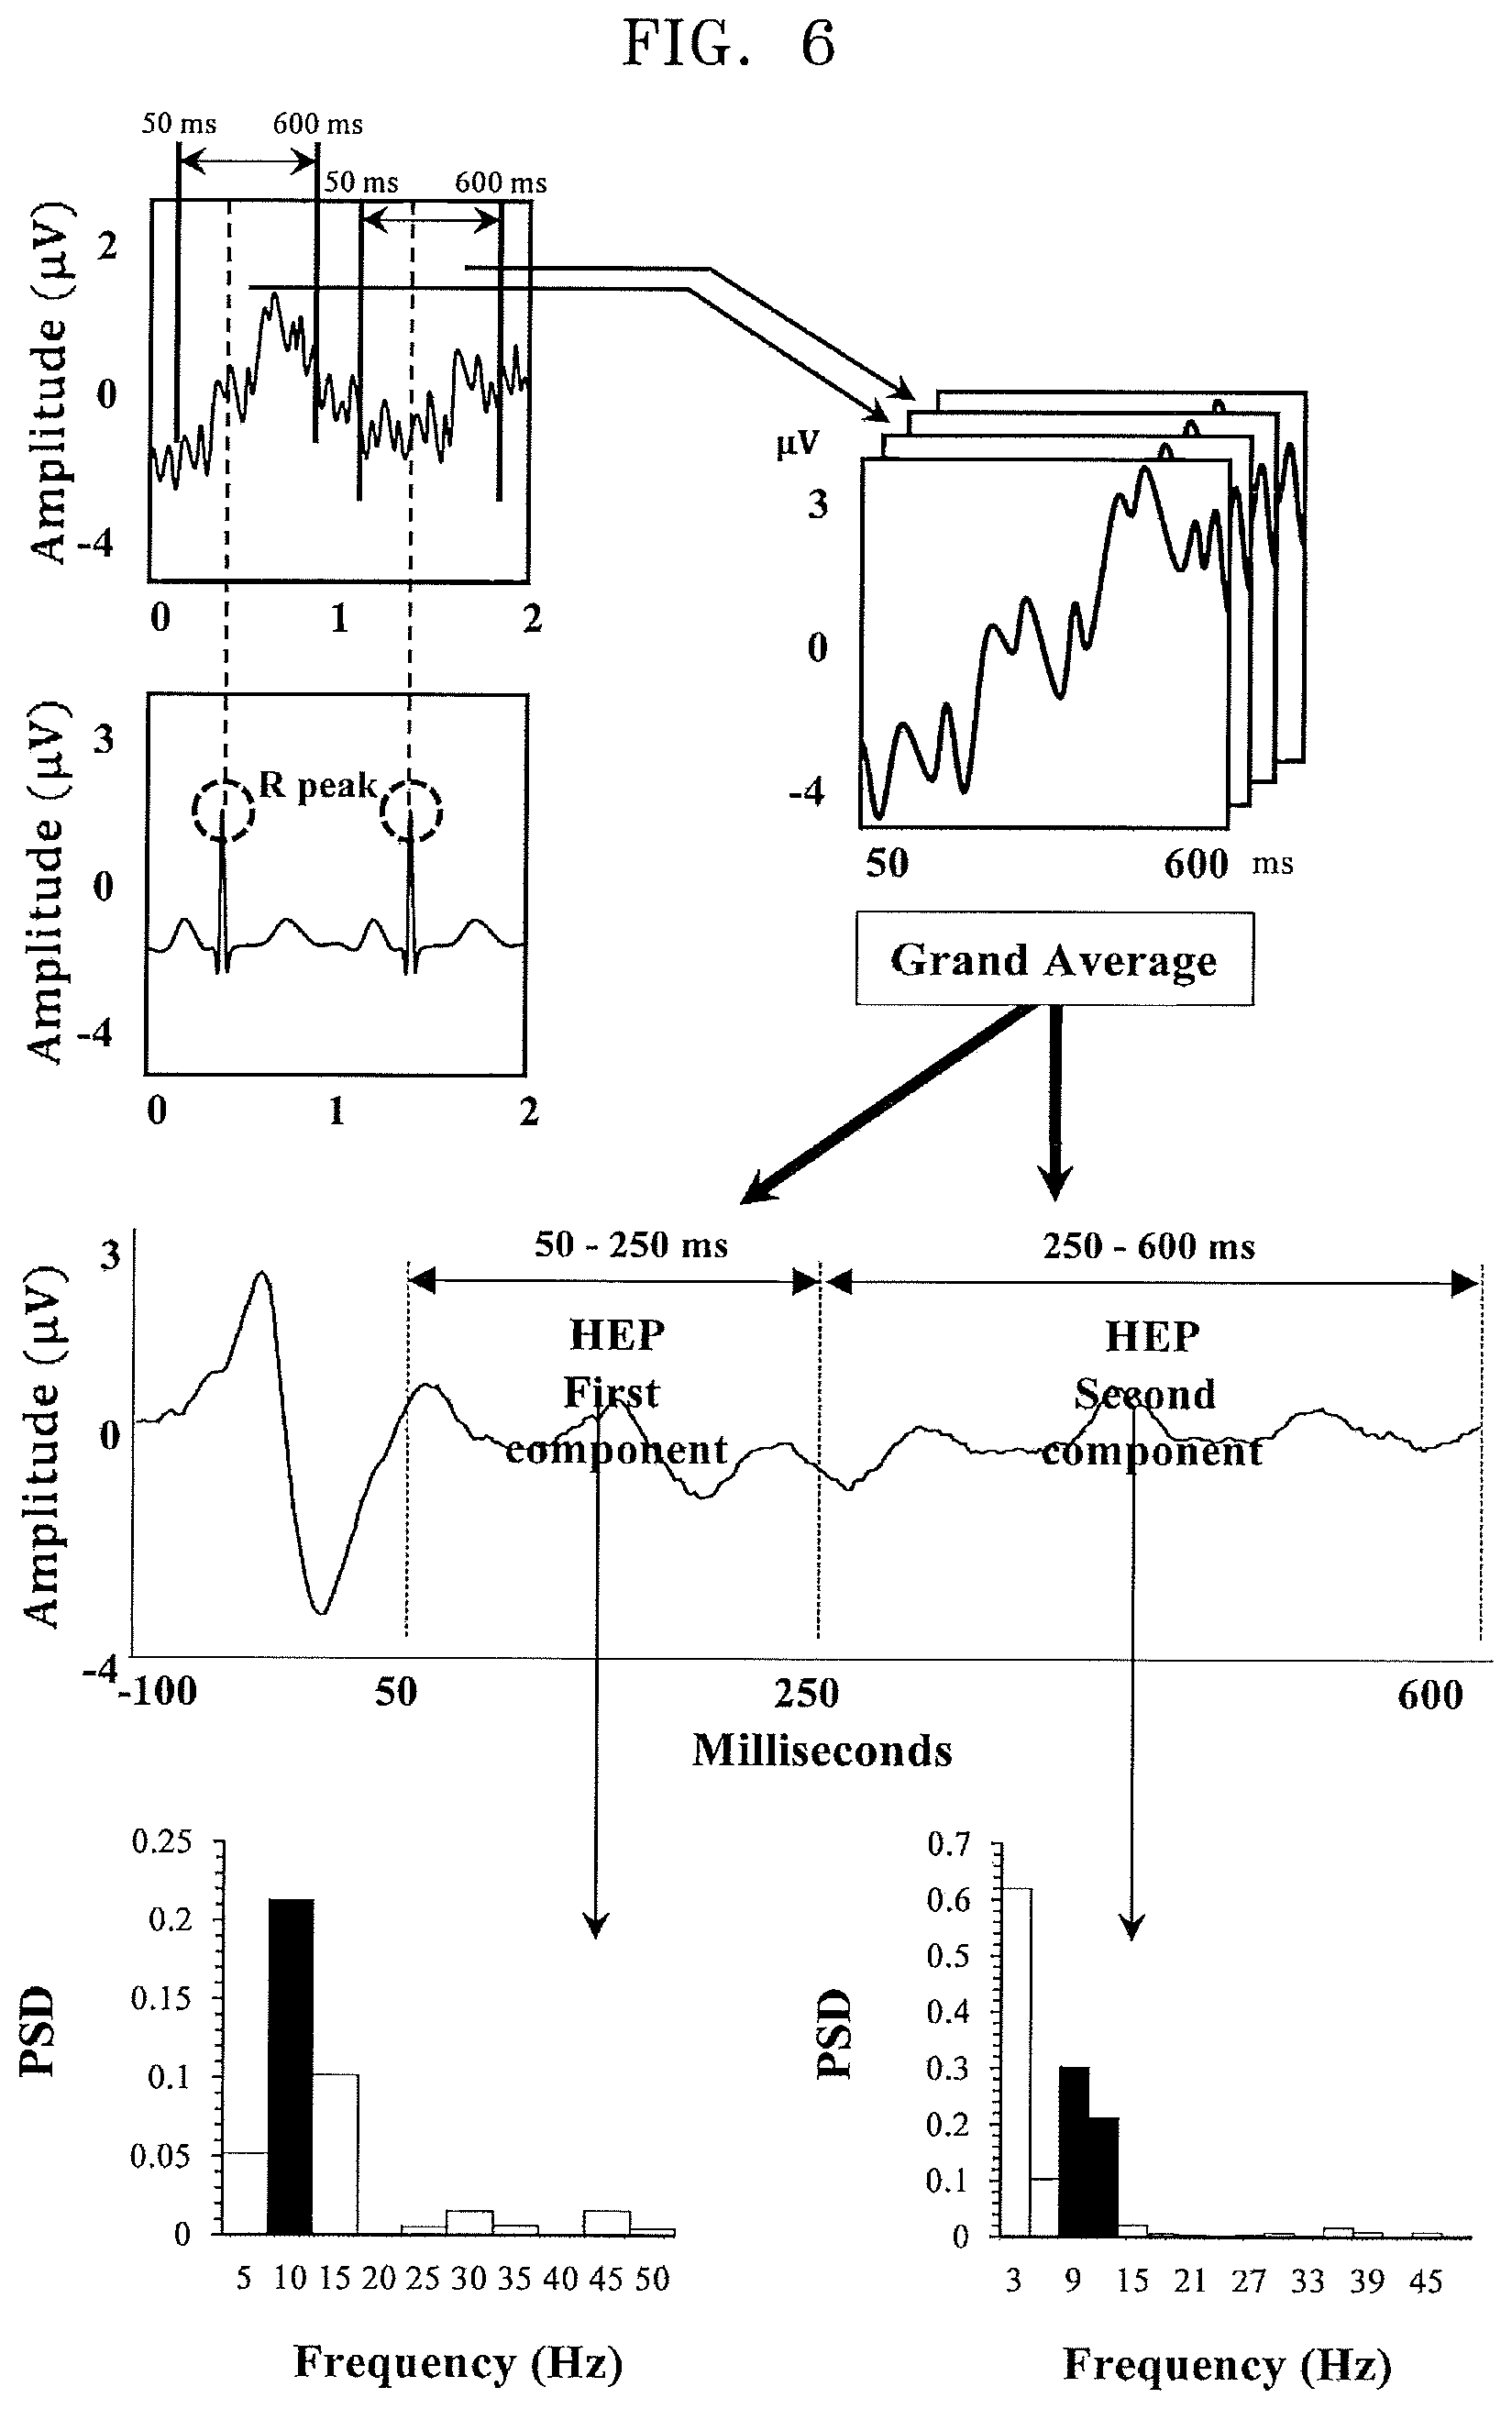
FIG. 6 shows an extraction process of a heartbeat evoked potential (HEP) waveform signal, according to one or more embodiments.
FIG. 7 shows procedures for processing the HEP waveform signals, according to one or more embodiments.
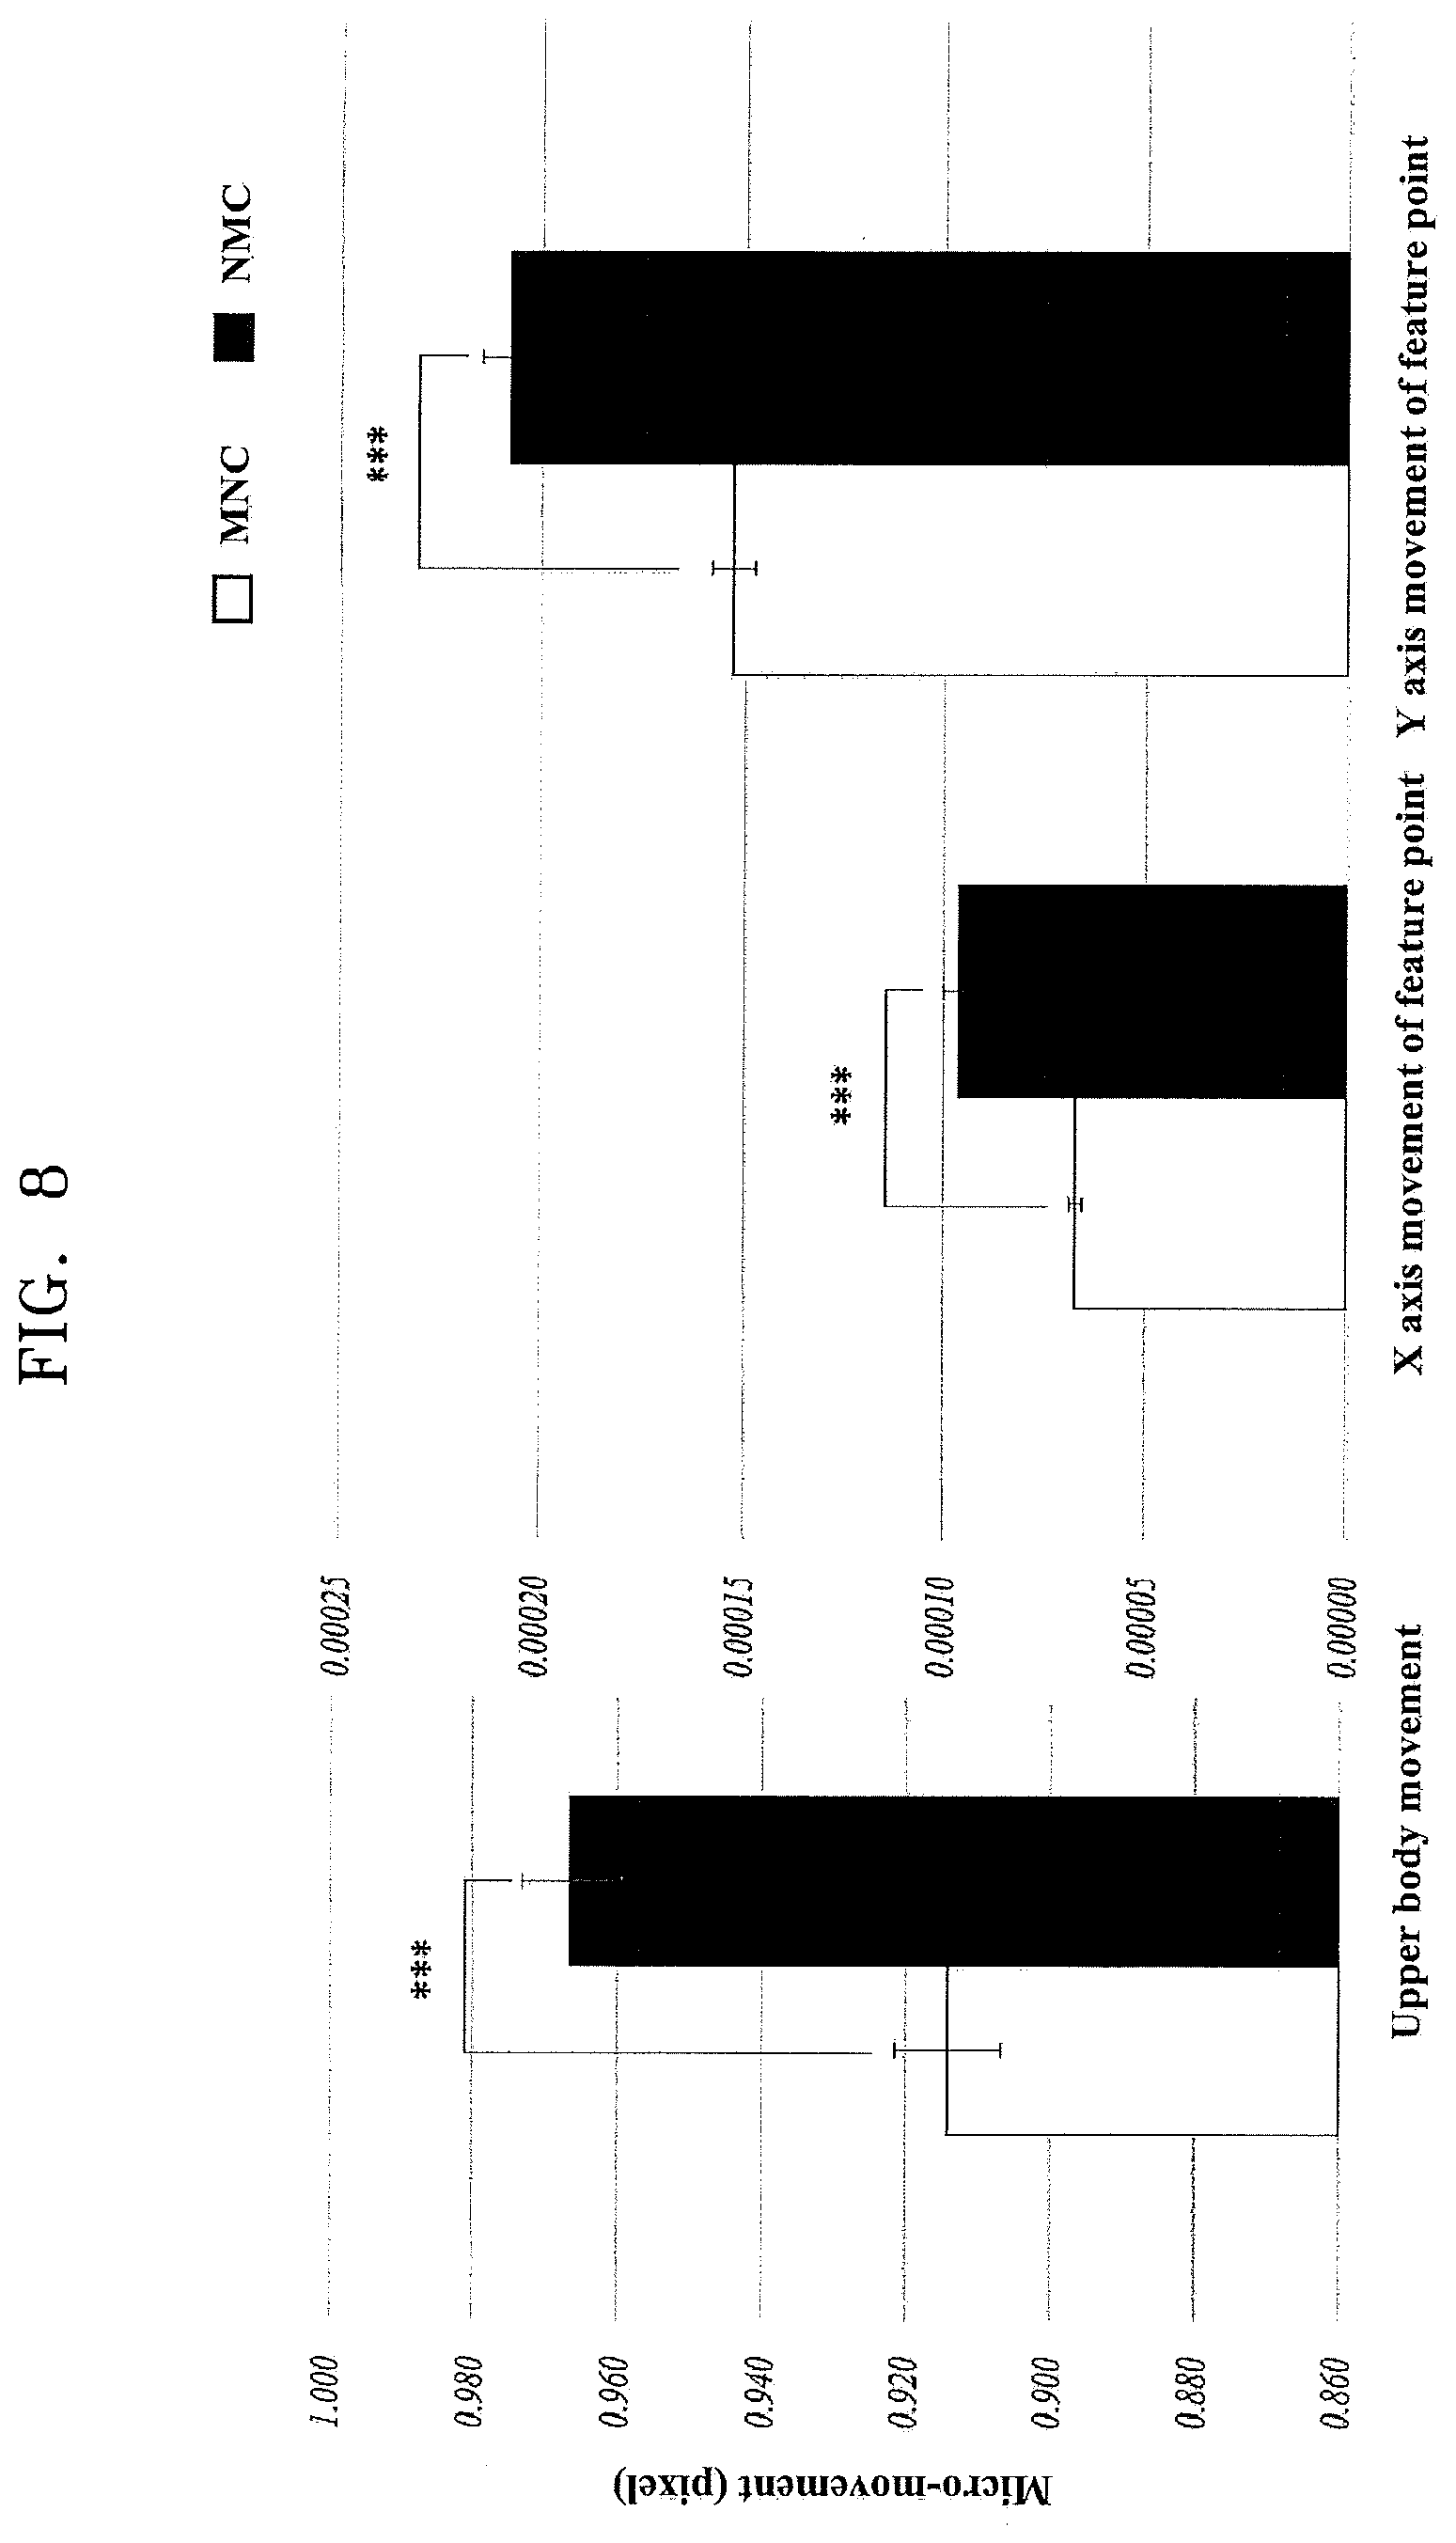
FIG. 8 shows averages of amounts of movement in an upper body.
FIG. 9 shows experimental procedures for detecting an HEP index from a pupillary response and EEG signals, according to one or more embodiments;
FIGS. 10a and 10b show comparison examples of first and second HEP indexes in a movelessness condition (MNC), according to one or more embodiments;
FIG. 11 shows comparison results for correlation and error in the first and second HEP indexes (MNC) for the ground truth, according to one or more embodiments;
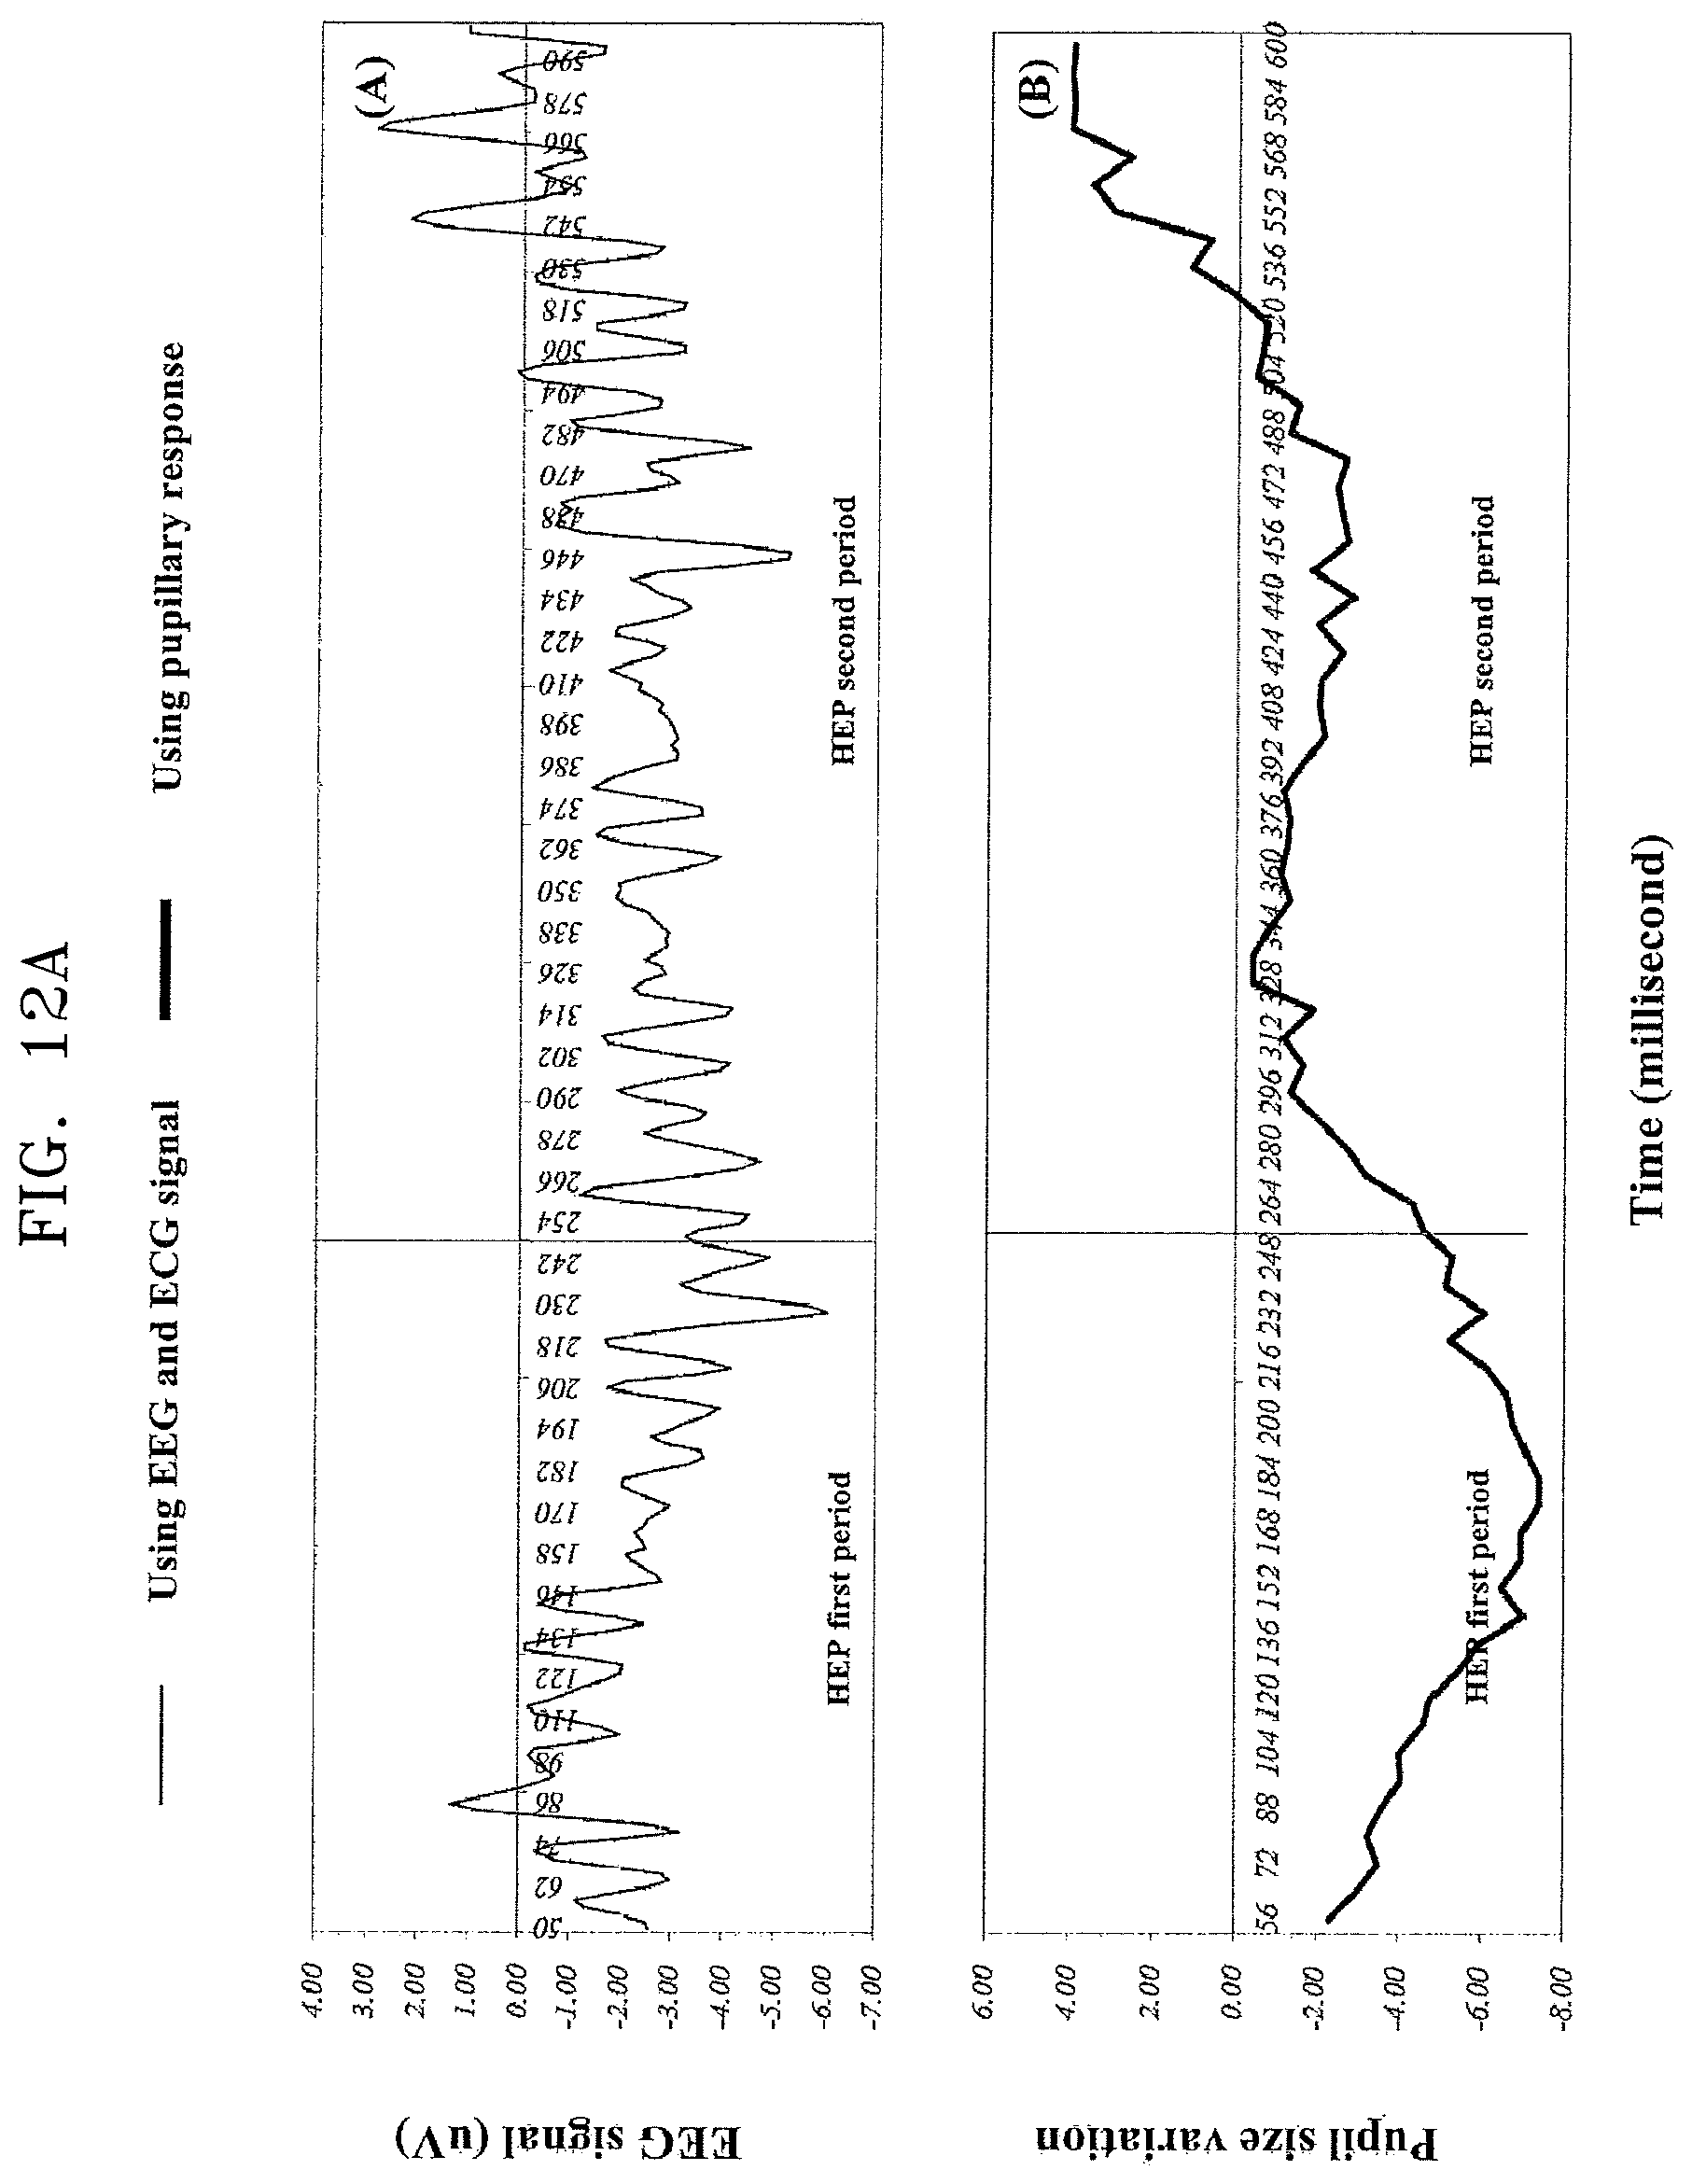
FIGS. 12a and 12b show examples of extracting the HEP index from a pupillary response signal (PSV) and sensor signals (EEG) of test subjects, according to one or more embodiments.
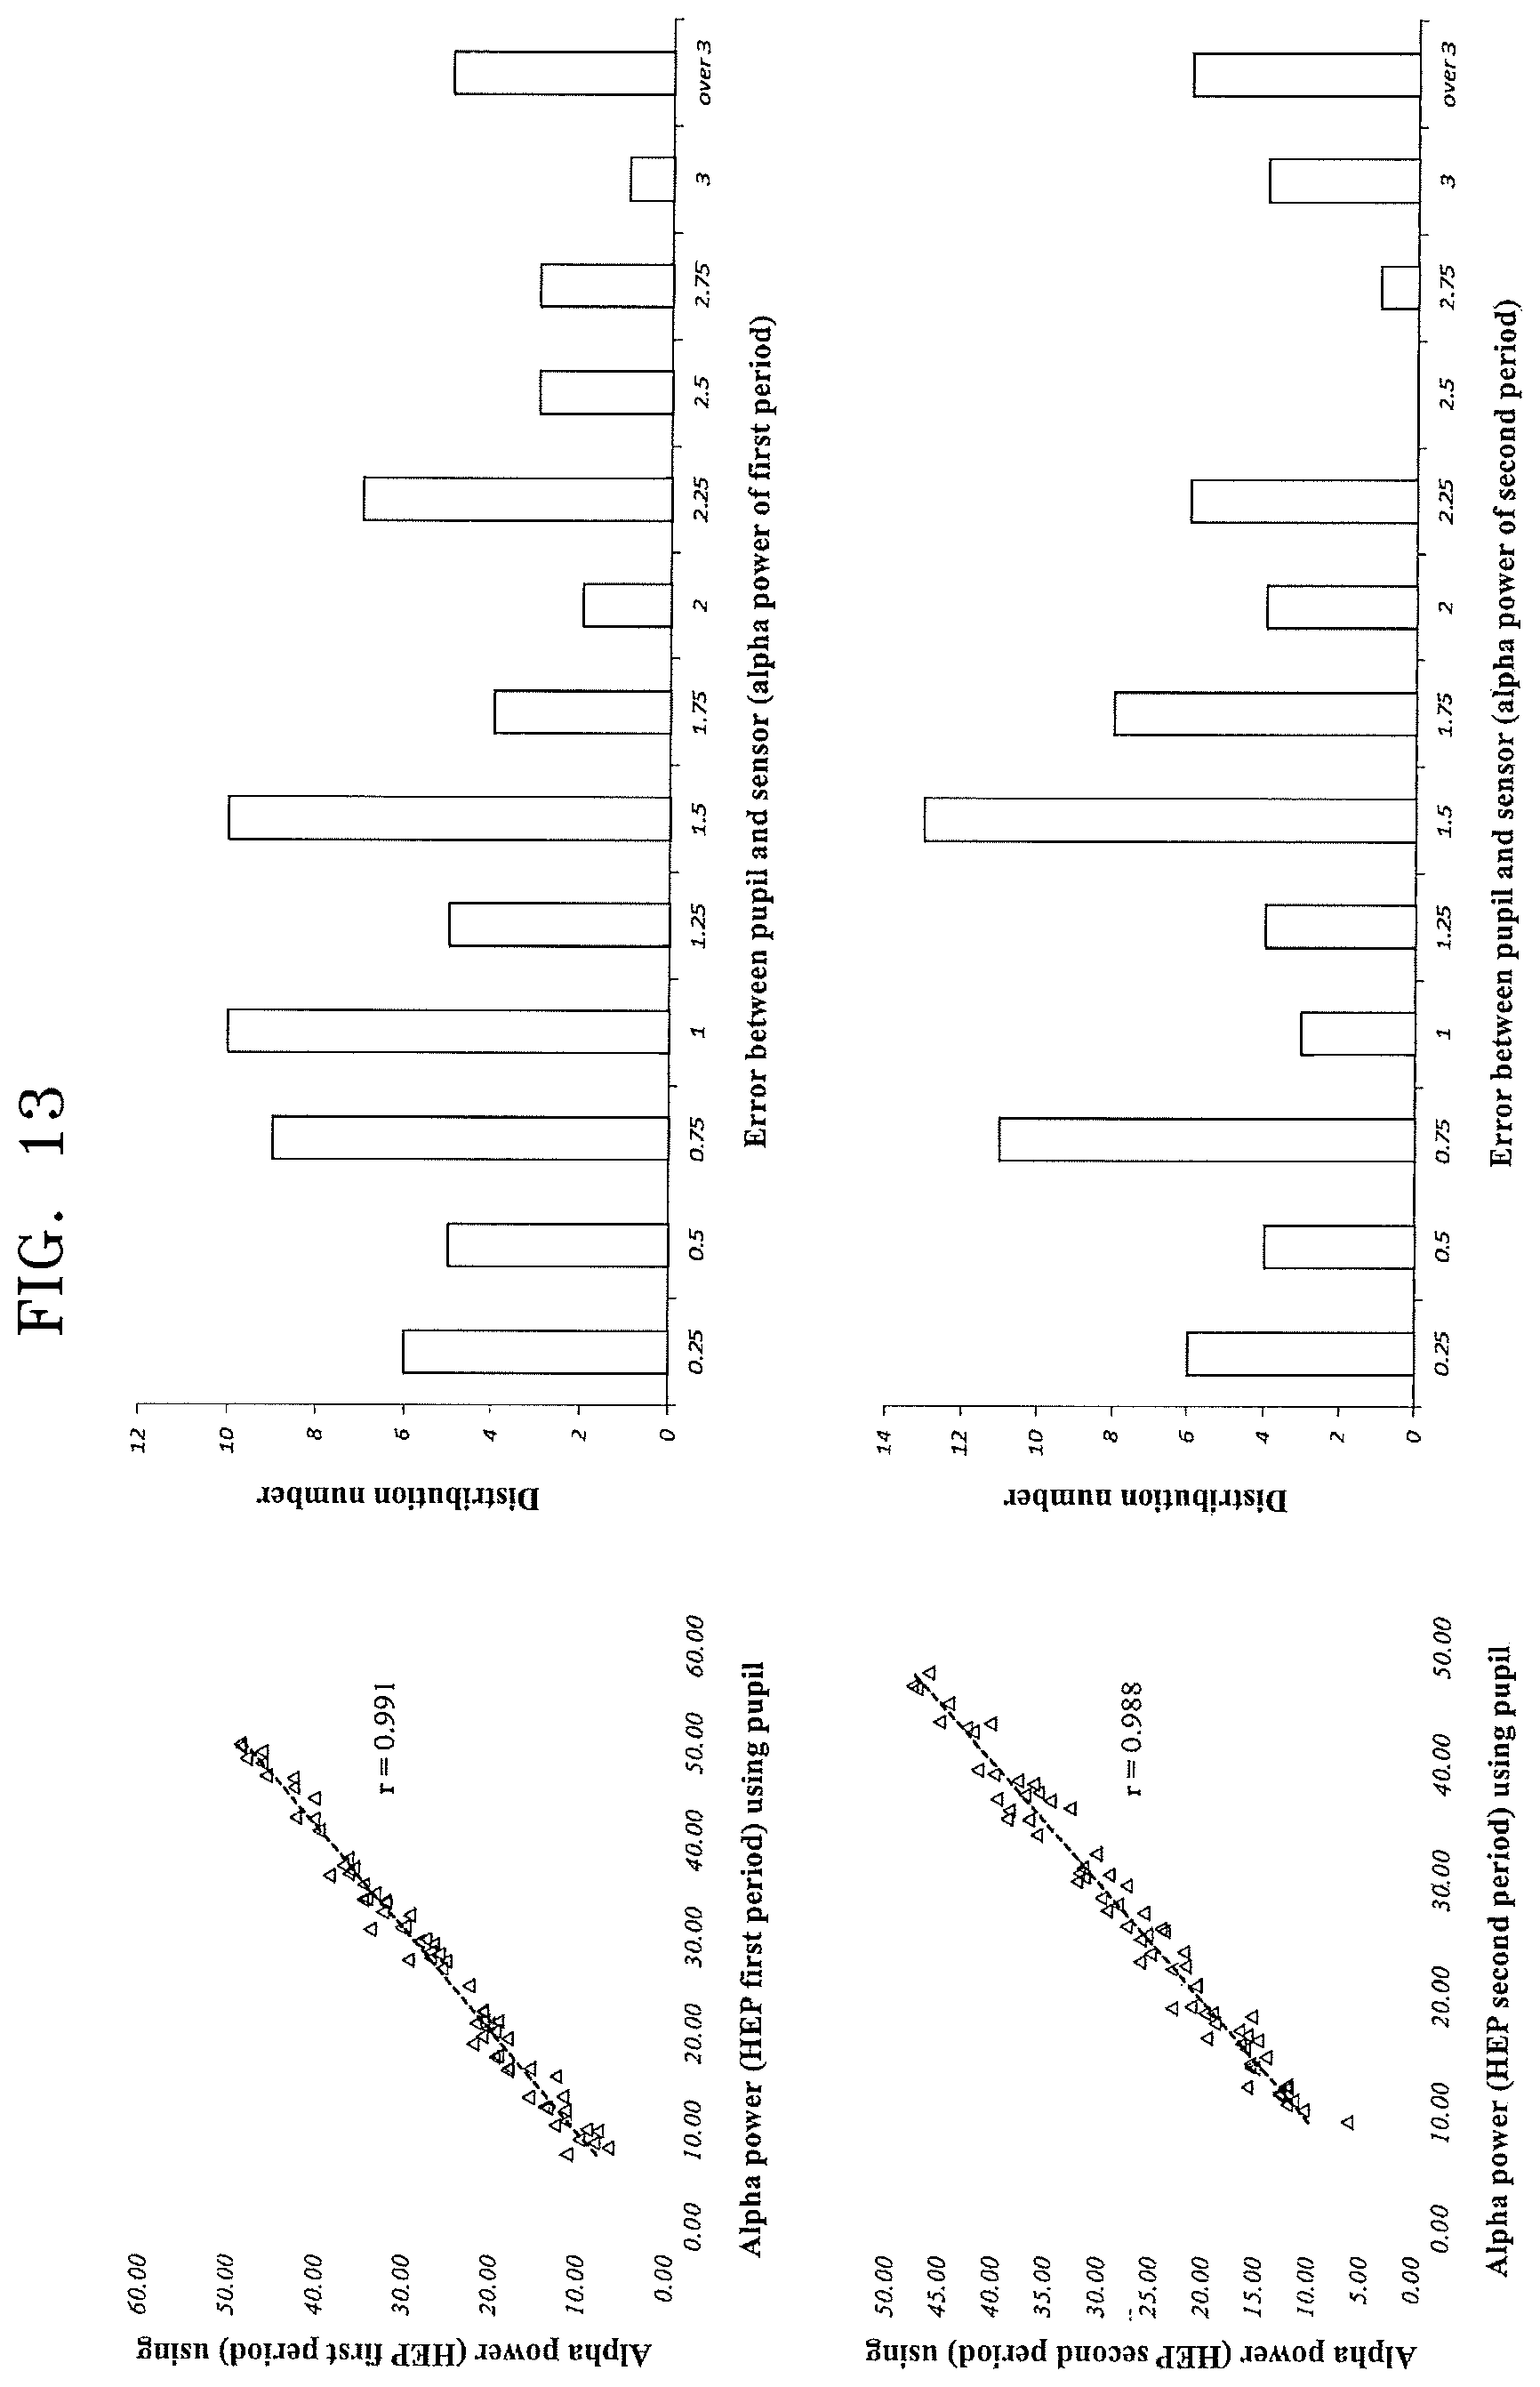
FIG. 13 shows a comparison of the results for the ground truth in the MNC, according to one or more embodiments.
FIG. 14 shows an infrared webcam system for capturing pupil images, according to one or more embodiments.
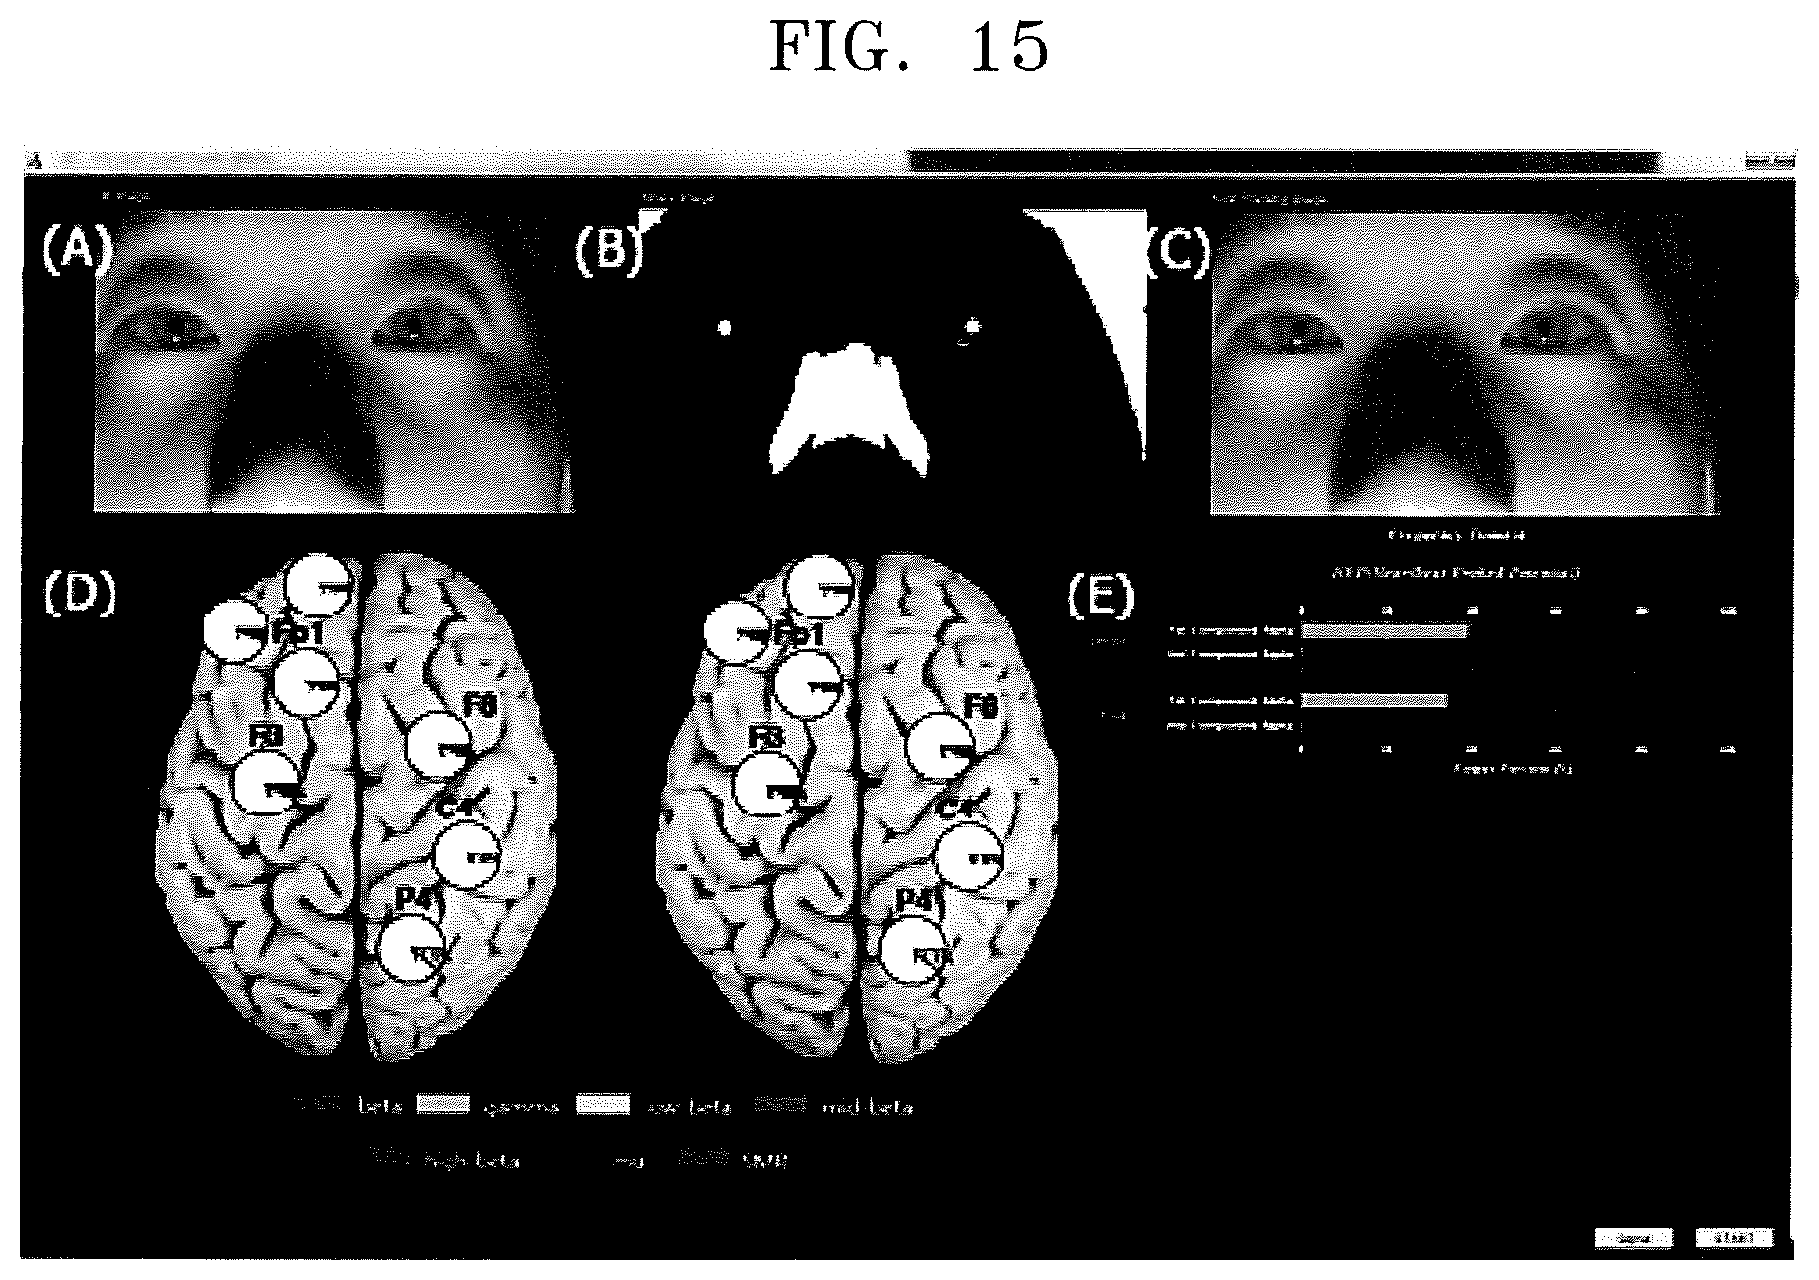
FIG. 15 shows an interface screen of a real-time system, according to one or more embodiments.
DETAILED DESCRIPTION
In Reference will now be made in detail to embodiments, examples of which are illustrated in the accompanying drawings, wherein like reference numerals refer to like elements throughout. In this regard, the present embodiments may have different forms and should not be construed as being limited to the descriptions set forth herein. Accordingly, the embodiments are merely described below, by referring to the figures, to explain aspects of the present description.
Hereinafter, a method and system for inferring and detecting physiological signals according to the present inventive concept is described with reference to the accompanying drawings.
The invention may, however, be embodied in many different forms and should not be construed as being limited to the embodiments set forth herein; rather, these embodiments are provided so that this disclosure will be thorough and complete, and will fully convey the concept of the invention to those skilled in the art. Like reference numerals in the drawings denote like elements. In the drawings, elements and regions are schematically illustrated. Accordingly, the concept of the invention is not limited by the relative sizes or distances shown in the attached drawings.
The terminology used herein is for the purpose of describing particular embodiments only and is not intended to be limiting of the invention. As used herein, the singular forms "a", "an" and "the" are intended to include the plural forms as well, unless the context clearly indicates otherwise. It will be further understood that the terms "comprises" and/or "comprising," or "includes" and/or "including" when used in this specification, specify the presence of stated features, numbers, steps, operations, elements, and/or components, but do not preclude the presence or addition of one or more other features, numbers, steps, operations, elements, components, and/or groups thereof.
Unless otherwise defined, all terms (including technical and scientific terms) used herein have the same meaning as commonly understood by one of ordinary skill in the art to which this invention belongs. It will be further understood that terms, such as those defined in commonly used dictionaries, should be interpreted as having a meaning that is consistent with their meaning in the context of the relevant art and/or the present application, and will not be interpreted in an overly formal sense unless expressly so defined herein.
The embodiments described below involve processing brain frequency information from pupillary response which is obtained from video information
The present invention, which may be sufficiently understood through the embodiments described below, involve extraction brain frequency information from the pupillary response by using a vision system equipped with a video camera such as a webcam without any physical restriction or psychological pressure on the subject, Especially, the pupillary response is detected from the image information and information of brain-heart connectivity is extracted from it.
In the experiment of the present invention, the reliability of the parameters of the brain-heart connectivity extracted from the pupil size variation (PSV) acquired through moving images was compared with the ground truth signal by EEG sensors.
The experiment of the present invention has been performed by video equipment, and computer architecture based analyzing system for processing and analyzing the moving image which includes analysis tools provided by software.
Experimental Stimuli
In order to cause variation of the physiological state, this experiment used sound stimuli based on the Russell's cir-complex model (Russell, 1980). The sound stimuli included a plurality of factors, including arousal, relaxation, positive, negative, and neutral sounds. The neutral sound was defined by an absence of acoustic stimulus. The steps for selecting sound stimulus are shown in FIG. 1 and listed as follows:
(S11) Nine hundred sound sources were collected from the broadcast media such as advertisements, dramas, and movies.
(S12) The sound sources were then categorized into four groups (i.e., arousal, relaxation, positive, and negative). Each group was comprised of 10 commonly selected items based on a focus group discussion for a total of forty sound stimuli.
(S13) These stimuli were used to conduct surveys for suitability for each emotion (i.e., A: arousal, R: relaxation, P: positive, and N: negative) based on data gathered from 150 subjects that were evenly split into 75 males and 75 females. The mean age was 27.36 years.+-.1.66 years. A subjective evaluation was required to select each item for the four factors, which could result in duplicates of one or more of the items.
(S14) A chi-square test for goodness-of-fit was performed to determine whether each emotion sound was equally preferred. Preference for each emotion sound was equally distributed in the population (arousal: 6 items, relaxation: 6 items, positive: 8 items, and negative: 4 items) as shown in Table 1.
Table 1 shows the chi-square test results for goodness-of-fit in which the items selected for each emotion are based on comparisons of observation and expectation values.
TABLE-US-00001 TABLE 1 N Chi-Square Sig. Arousal arousal 1 150 83.867 .000 arousal 2 150 45.573 .000 arousal 3 150 58.200 .000 arousal 5 150 83.440 .000 arousal 9 150 10.467 .000 arousal 10 150 70.427 .000 Relaxation relaxation 1 150 131.120 .000 relaxation 2 150 163.227 .000 relaxation 5 150 80.720 .000 relaxation 6 150 11.640 .000 relaxation 7 150 82.587 .000 relaxation 10 150 228.933 .000 Positive positive 2 150 35.040 .000 positive 3 150 90.533 .000 positive 4 150 101.920 .000 positive 5 150 66.040 .000 positive 7 150 143.813 .000 positive 8 150 128.027 .000 positive 9 150 47.013 .000 positive 10 150 138.053 .000 Negative negative 1 150 119.920 .000 negative 2 150 59.440 .000 negative 5 150 117.360 .000 negative 9 150 62.080 .000
Resurveys of the sound stimuli were conducted for relation to each emotion from the 150 subjects by using a seven-point scale based on 1 indicating strong disagreement to 7 indicating strong agreement.
Valid sounds relating to each emotion were analyzed using PCA (Principal Component Analysis) based on Varimax (orthogonal) rotation. The analysis yielded four factors explaining of the variance for the entire set of variables. Following the analysis result, representative sound stimuli for each emotion were derived, as shown in Table 2.
In Table 2, the bold type is the same factor, the blur character is the communalities<0.5, and the thick, light gray lettering with shading in the background represents the representative acoustic stimulus for each emotion.
TABLE-US-00002 TABLE 2 Component 1 2 3 4 positive 9 .812 .065 .021 -.033 arousal 9 .751 -.353 -.157 .107 relaxation 7 .717 .355 .084 .133 positive 2 .531 -.202 .203 .107 positive 3 -.528 .222 .406 -.003 positive 8 .520 .142 .161 .074 relaxation 2 .192 .684 .109 .004 relaxation 1 .028 .649 .168 -.147 relaxation 5 -.290 .629 -.008 .132 relaxation 6 .025 .628 -.061 .107 relaxation 10 .052 .569 -.320 -.187 arousal 10 -.201 .529 -.111 .409 positive 10 -.145 .424 .342 -.020 negative 1 -.257 -.009 .672 .123 positive 4 .111 .096 .608 -.185 negative 2 -.503 .108 .580 .104 negative 9 .289 -.252 .566 -.051 negative 5 .216 -.232 .528 -.094 positive 5 .377 .014 .439 -.019 positive 7 .002 .193 .403 .128 arousal 1 -.158 .209 -.042 .774 arousal 2 .129 -.049 .015 .765 arousal 5 .210 -.043 .097 .672 arousal 3 .566 -.159 -.140 .617
Experimental Procedure
In Seventy undergraduate volunteers of both genders, evenly split between males and females, ranging in age from 20 to 30 years old with a mean of 24.52 years.+-.0.64 years participated in this experiment. All subjects had normal or corrected-to-normal vision (i.e., over 0.8), and no family or medical history of disease involving visual function, cardiovascular system, or the central nervous system. Informed written consent was obtained from each subject prior to the study. This experimental study was approved by the Institutional Review Board of Sangmyung University, Seoul, South Korea (2015 Aug. 1).
The experiment was composed of two trials where each trail was conducted for a duration of 5 min. The first trail was based on the movelessness condition (MNC), which involves not moving or speaking. The second trial was based on the natural movement condition (NMC) involving simple conversations and slight movements. Participants repeatedly conducted the two trials and the order was randomized across the subjects. In order to verify the difference of movement between the two conditions, this experiment quantitatively measured the amount of movement during the experiment by using webcam images of each subject. In the present invention, the moving image may include at least one pupil, that is, one pupil or both pupils image.
The images were recorded at 30 frames per second (fps) with a resolution of 1920.times.1080 by using a HD Pro C920 camera from Logitech Inc. The movement measured the upper body and face based on MPEG-4 (Tekalp and Ostermann, 2000; JPandzic and Forchheimer, 2002). The movement in the upper body was extracted from the whole image based on frame differences. The upper body line was not tracking because the background was stationary.
The movement in the face was extracted from 84 MPEG-4 animation points based on frame differences by using visage SDK 7.4 software from Visage Technologies Inc. All movement data used the mean value from each subject during the experiment and was compared to the difference of movement between the two trails, as shown in FIG. 2.
FIG. 2 shows an example of measuring the amount of motion of the subject's upper body in a state of the face is located at the intersection of the X axis and the Y axis,
In FIG. 2, (A) is an upper body image, (B) is a tracked face image at 84 MPEG-4 animation points, (C) and (D) shows the difference between before and after frames, (E) is a movement signal from the upper body, and (F) shows movement signals from 84 MPEG-4 animation points.
In order to cause the variation of physiological states, sound stimuli were presented to the participants during the trails. Each sound stimulus was randomly presented for 1 min for a total of five stimuli over the 5 min trial. A reference stimulus was presented for 3 min prior to the initiation of the task. The detailed experimental procedure is shown in FIG. 3.
The experimental procedure includes the sensor attachment S31, the measurement task S32 and the sensor removal S33 as shown in FIG. 3, and the measurement task S32 proceed as follows.
The experiment was conducted indoors with varying illumination caused by sunlight entering through the windows. The participants gazed at a black wall at a distance of 1.5 m while sitting in a comfortable chair. Sound stimuli were equally presented in both the trials by using earphones. The subjects were asked to constrict their movements and speaking during the movelessness trial (MNC). However, the natural movement trial (NMC) involved a simple conversation and slight movement by the subjects. The subjects were asked to introduce themselves to another person as part of the conversation for sound stimuli thereby involving feelings and thinking of the sound stimuli. During the experiment, EEG, ECG signal and pupil image data were obtained.
EEG signals were recorded at a 500 Hz sampling rate from nineteen channels (FP1, FP2, F3, Fz, F4, F7, F8, C3, Cz, C4, T7 (T3), T8 (T4), P7 (T5), P8 (T6), P3, Pz, P4, O1, and O2 regions) based on the international 10-20 system (ground: FAz, reference: average between electrodes on the two ears, and DC level: 0 Hz-150 Hz). The electrode impedance was kept below 3 k.OMEGA.. EEG signals were recorded at a 500 Hz sampling rate using a Mitsar-EEG 202 Machine.
ECG signals were sampled and recorded at a 500 Hz sampling rate through one channel with the lead-I method by an amplifier system including ECG 100C amplifiers and a MP100 power supply from BIOPAC System Inc. The ECG signals were digitalized by a NI-DAQ-Pad 9205 of National Instrument Inc.
Pupil images were recorded at 125 fps with a resolution of 960.times.400 by GS3-U3-23S6M-C infrared camera from Point Grey Research Inc.
Hereinafter, a method for extracting or constructing (recovering) vital signs from a pupillary response will be described.
Extraction of a Pupillary Response
The pupil detection procedure acquires moving images using the infrared video camera system as shown in FIG. 12, and then requires a specific image processing procedure
The pupil detection procedure required following certain image processing steps since the images were captured using an infrared video camera, as shown in FIG. 4.
FIG. 4 shows a process of detecting a pupil region from the face image of a subject. In FIG. 4, (A) shows an input image (gray scale) obtained from a subject, (B) shows a binarized image based on an auto threshold, (C) shows pupil positions by the circular edge detection, and (D) shows the real-time detection result of the pupil region including the information about the center coordinates and the diameter of the pupil region. The threshold value was defined by a linear regression model that used a brightness value of the whole image, as shown in Equation 1. Threshold=(-0.418.times.B.sub.mean+1.051.times.B.sub.max)+7.973 B=Brightness value <Equation 1>
The next step to determine the pupil position involved processing the binary image by using a circular edge detection algorithm, as shown in Equation 2 (Daugman, 2004; Lee et al., 2009).
.times..times..times..sigma..function..delta..delta..times..times..times. .times..function..times..times..pi..times..times..times..times..times..ti- mes..times. ##EQU00001##
I(x,y)=a grey level at the (x,y) position
(x.sub.0,y.sub.0)=center position of pupil
r=radius of pupil
In case that multiple pupil positions were selected, the reflected light caused by the infrared lamp was used. Then an accurate pupil position was obtained, including centroid coordinates (x, y) and a diameter.
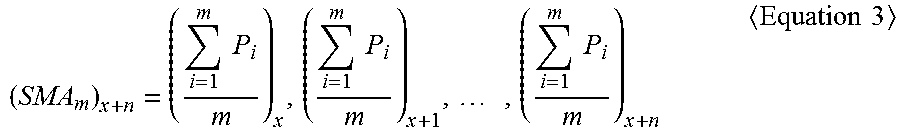
Pupil diameter data (signal) was resampled at a frequency range of 1 Hz-30 Hz, as shown in Equation 3. The resampling procedure for the pupil diameter data involved a sampling rate of 30 data points, which then calculated the mean value during 1-s intervals by using a common sliding moving average technique (i.e., a window size of 1 second and a resolution of 1 second). However, non-tracked pupil diameter data caused by the eye closing was not involved in the resampling procedure.
.times..times..times..times..times..times..times..times..times. ##EQU00002##
SMA=sliding moving average
P=pupil diameter
Detecting Heartbeat Evoked Potential Index
The detection of the heartbeat evoked potential (HEP) index is now described. The HEP includes alpha activity of first and second components of the HEP which is extracted or determined from the pupillary response. The HEP is a phenomenon related to change of brain alpha activity which can be caused by heart rhythm and blood flow (Schandry and Montoya, 1996; Park et al., 2014; Park et al., 2015).
The major organs of human body, such as the heart, have visceral neurons known as vagus nervous which transmits cardiac information from the heart to the brain through the visceral afferent pathway. (Montoya et al., 1993; Park et al., 2014; Park et al., 2015). The afferent information in the heart is integrated at the nucleus tractus solitarius and then is transmitted to mid-brain areas such as the hypothalamus, thalamus, and amygdala (Janig, 1996; Park et al., 2014; Park et al., 2015). The mid-brain area communicates with the neocortex specifically with the prefrontal brain areas (Fuster, 1980; Nauta and Feirtag, 1986; Nieuwenhuys et al., 2007; Park et al., 2015). This phenomenon is closely related to cognitive functions, human performance, emotional state (Rau et al., 1993; Hansen et al., 2003; McCraty et al., 2009; Park et al., 2015).
FIG. 5 schematically explains a theory of the brain-heart connectivity. As shown in FIG. 5, heartbeat evoked potential is focused on the vagus nervous in heart by the neurological circulation of afferent and efferent pathway.
The HEP is divided into two periods. The first HEP period is the mean time interval required to transmit the cardiac afferent information from the heart to the brain and is 50 ms-250 ms after the R-peak. To increase the alpha power at 10 Hz means, the activation of the communication between the heart and the brain is increased. The second period of the HEP reflects the time interval required to transmit the cardiac blood pressure wave from the heart to the brain and is 250 ms-600 ms after the R-peak. To increase the alpha power at 9 Hz and 12 Hz, the means higher cognitive processing is occurred based on the sensory input. This phenomenon is concerned with brain alpha rhythm in prefrontal cortex such as FP1 and FP2 (Wolk et al., 1989; McCraty et al., 2009; Park et al., 2015). The HEP waveform is extracted by grand average technique of all trial signals based on the R-peak value. The quantification of the alpha power is obtained using by FFT analysis of each component of the first and second period, as shown in FIG. 6 (Wolk et al., 1989; McCraty et al., 2009; Park et al., 2015).
FIG. 6 shows a extraction progress of HEP waveform signal including a first and second components of HEP from the pupillary response. The signal of the pupil diameter at 125 fps was calculated from the PSV by using the frame difference of the pupil diameter, as shown in Equation (4).
.times..times..times..times. ##EQU00003##
PSV=pupil size variation
P=pupil diameter
The PSV data was separated based on the R-peak signals from the ECG signal in the range of 56 ms-600 ms after R-peak. This procedure was repeated over the 100 trials. All trial signals were integrated into the one signal (PSV data) by using the grand average technique (Park et al., 2015). This signal was divided into the first period represented by the time frame of 56 ms-248 ms after the R-peak, and the second period represented by the time frame of 256 ms-600 ms after the R-peak. Each period was processed using FFT analysis, as shown in Equation (5).
.times..times..times..times..times..times..pi..times..times..times..times- ..times..times..times..times. ##EQU00004##
The alpha power of the first period (i.e., 10 Hz) and second period (i.e., 9 Hz and 11 Hz) periods was calculated from the ratio of alpha power to total power of a total frequency band ranging from 0 Hz to 62.5 Hz) as shown in Equation (6).
.times..times..times..times..times..times..times..times..times. ##EQU00005## .times..times..times..times..times..times..times..times..times. ##EQU00005.2##
FAP=A power of HBP 1st period
SAP=A power of HBP 2nd period
The EEG signals in the FP1 and FP2 regions were extracted from a specific range of 50 ms-600 ms after the R-peak based on the R-peak location. The R-peak was detected from ECG signals by using the QRS detection algorithm (Pan and Tompkins, 1985). All trials extracted EEG signals that were processed by the grand average (Park et al., 2015). The FP1 and FP2 signals were integrated into the HEP waveform signal by using the grand average. The HEP waveform was divided into the first period of 50 ms-250 ms after the R-peak and the second period of 250 ms-600 ms after the R-peak where each period was processed using FFT analysis, as shown in Equation (5). The alpha power of the first and second periods was calculated from the ratio between the alpha power and total power in the range of 0 Hz-250 Hz as shown in Equation (6).
The detailed procedures for processing the HEP waveform signals based each of the pupillary response, and EEG/ECG signals are shown in FIG. 7. In FIG. 7, (I) shows a procedure for HEP waveform signal from the pupillary response, and (II) shows a procedure for HEP waveform from the ECG and EEG signals.
Result
The pupillary response was processed to extract the vital signs from the cardiac time domain index, cardiac frequency domain index, EEG spectral index, and the HEP index of the test subjects. These components were compared with each index from the sensor signals (i.e., ground truth) based on correlation coefficient (r) and mean error value (ME). The data was analyzed in both MNC and NMC for the test subjects.
To verify the difference of the amount movement between the two conditions of MNC and NMC, the movement data was quantitatively analyzed. The movement data was a normal distribution based on a normality test of probability-value (p)>0.05, and from an independent t-test. A Bonferroni correction was performed for the derived statistical significances (Dunnett, 1955). The statistical significance level was controlled based on the number of each individual hypothesis (i.e., .alpha.=0.05/n). The statistical significant level of the movement data sat up 0.0167 (upper body, X and Y axis in face, .alpha.=0.05/3). The effect size based on Cohen's d was also calculated to confirm practical significance. In Cohen's d, standard values of 0.10, 0.25, and 0.40 for effect size are generally regarded as small, medium, and large, respectively (Cohen, 2013).
FIG. 8 shows averages of amount movement in upper body, X and Y axis in face for MNC and NMC (n=140, *** p<0.001). Table 3 shows all subjects data of amount movement in upper body, X and Y axis in face for MNC and NMC.
Referring FIG. 8 and Table 3 according to the analysis, the amount of movement in MNC (upper body, X and Y axis for the face) was significantly increased compared to the NMC for the upper body (t(138)=-5.121, p=0.000, Cohen's d=1.366 with large effect size), X axis for the face (t(138)=-6.801, p=0.000, Cohen's d=1.158 with large effect size), and Y axis for the face (t(138)=-6.255, p=0.000, Cohen's d=1.118 with large effect size).
TABLE-US-00003 TABLE 3 Natural Movement Condition Movelessness Condition (MNC) (NMC) Subjects Upper Upper Subjects body X axis Y axis body X axis Y axis S1 0.972675 0.000073 0.000158 1.003305 0.000117 0.000237 S2 0.961020 0.000081 0.000170 1.002237 0.000101 0.000243 S3 0.942111 0.000071 0.000206 0.945477 0.000081 0.000220 S4 0.955444 0.000067 0.000189 0.960506 0.000072 0.000191 S5 0.931979 0.000056 0.000106 0.972033 0.000070 0.000153 S6 0.910416 0.000057 0.000103 0.999692 0.000086 0.000174 S7 0.862268 0.000055 0.000216 0.867949 0.000071 0.000249 S8 0.832109 0.000056 0.000182 0.884868 0.000068 0.000277 S9 0.890771 0.000099 0.000188 0.890783 0.000099 0.000242 S10 0.869373 0.000073 0.000168 0.872451 0.000089 0.000206 S11 0.908724 0.000057 0.000128 0.963280 0.000102 0.000187 S12 0.954168 0.000091 0.000180 0.964322 0.000181 0.000190 S13 0.846164 0.000070 0.000144 0.917798 0.000079 0.000172 S14 0.953219 0.000062 0.000116 1.024050 0.000093 0.000185 S15 0.936300 0.000068 0.000202 0.952505 0.000101 0.000287 S16 0.943040 0.000077 0.000220 0.958412 0.000106 0.000308 S17 0.852292 0.000099 0.000199 0.901039 0.000077 0.000310 S18 0.901182 0.000082 0.000278 0.920493 0.000084 0.000262 S19 0.943810 0.000075 0.000156 0.974675 0.000099 0.000386 S20 0.988983 0.000070 0.000162 1.029716 0.000175 0.000184 S21 0.952451 0.000065 0.000102 1.005191 0.000081 0.000141 S22 0.965017 0.000064 0.000099 0.999090 0.000183 0.000150 S23 1.068848 0.000101 0.000200 1.090858 0.000108 0.000255 S24 0.993841 0.000092 0.000184 1.052424 0.000111 0.000247 S25 0.883615 0.000064 0.000258 0.913927 0.000077 0.000283 S26 0.870531 0.000051 0.000221 0.906540 0.000074 0.000252 S27 0.955718 0.000064 0.000126 0.963460 0.000071 0.000169 S28 0.968524 0.000061 0.000142 0.985782 0.000075 0.000184 S29 0.794718 0.000067 0.000119 0.918873 0.000074 0.000136 S30 0.817818 0.000064 0.000105 0.914591 0.000073 0.000148 S31 0.937005 0.000053 0.000138 0.979654 0.000080 0.000203 S32 0.974895 0.000067 0.000204 1.011137 0.000072 0.000215 S33 0.877308 0.000073 0.000134 0.899194 0.000087 0.000196 S34 0.867672 0.000063 0.000127 0.894298 0.000077 0.000188 S35 0.948874 0.000099 0.000182 0.952532 0.000105 0.000217 S36 0.968912 0.000109 0.000217 1.020322 0.000115 0.000240 S37 0.811181 0.000063 0.000204 0.964774 0.000071 0.000244 S38 0.921204 0.000061 0.000160 0.966262 0.000071 0.000213 S39 0.907618 0.000060 0.000151 0.951832 0.000076 0.000188 S40 0.907953 0.000061 0.000169 0.920784 0.000071 0.000188 S41 0.907145 0.000055 0.000151 0.937417 0.000171 0.000196 S42 0.909996 0.000055 0.000163 0.995645 0.000072 0.000222 S43 0.940886 0.000061 0.000137 0.971473 0.000082 0.000188 S44 0.979163 0.000059 0.000127 1.058006 0.000184 0.000244 S45 0.946343 0.000056 0.000109 1.029439 0.000082 0.000156 S46 0.951810 0.000061 0.000154 0.977621 0.000087 0.000256 S47 0.809073 0.000060 0.000147 0.961375 0.000065 0.000252 S48 0.961124 0.000073 0.000176 0.997457 0.000083 0.000189 S49 0.994281 0.000074 0.000172 1.020115 0.000094 0.000222 S50 0.853841 0.000075 0.000194 0.978026 0.000104 0.000247 S51 0.818171 0.000059 0.000168 0.850567 0.000091 0.000255 S52 0.845488 0.000072 0.000134 0.895100 0.000105 0.000293 S53 0.899975 0.000081 0.000150 0.967366 0.000094 0.000179 S54 0.819878 0.000057 0.000106 0.907099 0.000108 0.000193 S55 0.824809 0.000061 0.000119 0.854062 0.000062 0.000125 S56 0.829834 0.000067 0.000126 0.915019 0.000169 0.000157 S57 0.836302 0.000066 0.000126 0.892036 0.000083 0.000172 S58 0.876029 0.000065 0.000155 0.988827 0.000186 0.000163 S59 0.876581 0.000065 0.000149 0.924143 0.000117 0.000296 S60 0.881068 0.000101 0.000252 1.063924 0.000109 0.000381 S61 0.880455 0.000055 0.000093 1.007333 0.000080 0.000190 S62 0.900065 0.000055 0.000087 1.028052 0.000076 0.000176 S63 1.045809 0.000056 0.000102 1.061254 0.000096 0.000161 S64 1.067929 0.000052 0.000105 1.070771 0.000111 0.000162 S65 0.949971 0.000055 0.000101 1.004960 0.000068 0.000143 S66 0.964054 0.000053 0.000093 1.068673 0.000169 0.000140 S67 0.828268 0.000054 0.000082 0.886462 0.000061 0.000117 S68 0.922679 0.000049 0.000079 0.945291 0.000061 0.000102 S69 0.946723 0.000063 0.000112 1.069926 0.000114 0.000119 S70 0.977655 0.000064 0.000113 0.999438 0.000065 0.000119 mean 0.914217 0.000067 0.000153 0.966343 0.000096 0.000208 SD 0.061596 0.000014 0.000044 0.057911 0.000033 0.000058
The HEP index for heart-brain synchronization, the alpha activity of the first and second HEP periods, was extracted from the pupillary response. These components were compared with the HEP index from the EEG and ECG signals (i.e., ground truth).
This research was able to determine the HEP alpha activity for the first and second periods from the pupillary response by the synchronization between the cardiac and brain rhythms. The alpha activity of the first period within the range of 56 ms-248 ms in the HEP waveform from the pupillary response was synchronized with the alpha activity from the first period within the range or 50 ms-250 ms in HEP waveform from the ECG and EEG signal. The alpha activity of the second period within the range of 256 ms-600 ms in the HEP waveform from the pupillary response was synchronized with the alpha activity of the first period in the range of 250 ms-600 ms in the HEP waveform from the ECG and EEG signal.
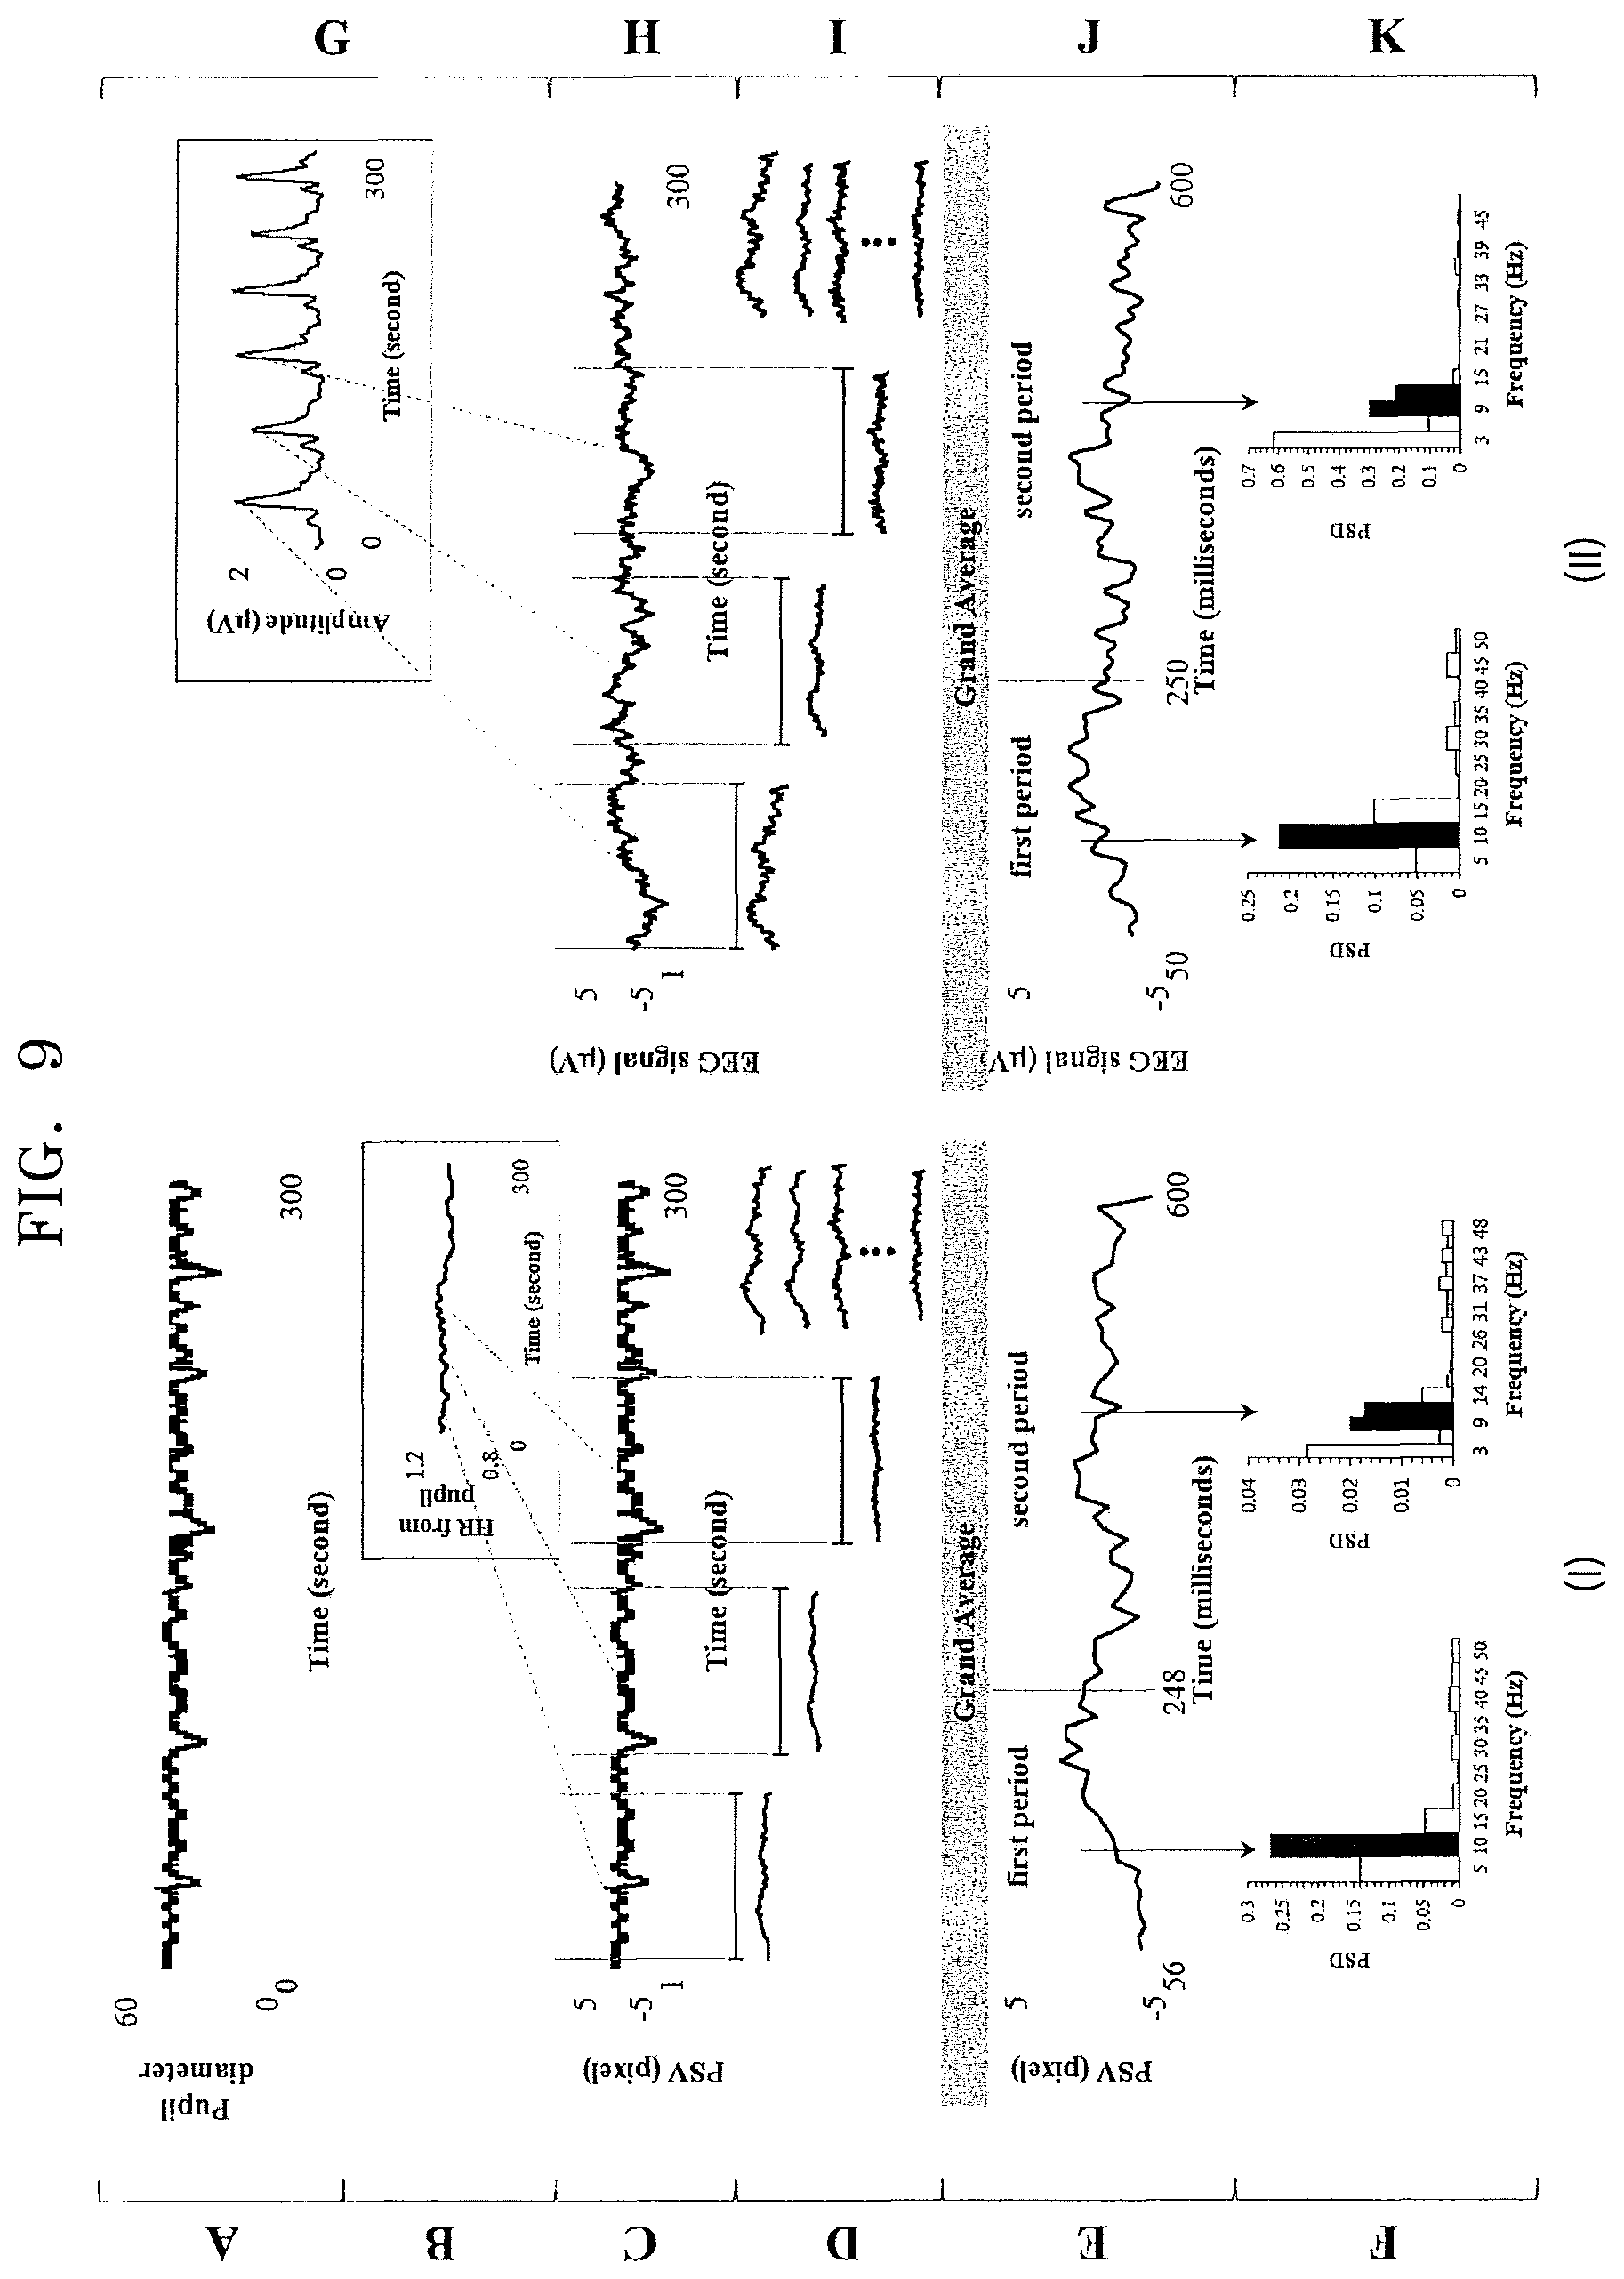
FIG. 9 shows exemplary processes of extracting the HEP indexes from each of the pupillary response (I) and ECG signals (II). In FIG. 9, (A) shows a pupil diameter signal (pupillary response), (B) shows a heart rate (HR) signal from the pupillary response, (C) shows a pupil size variation, (D) shows data separation (trial) based on the HR from pupillary response, (E) shows grand average signal in all trial and divided into first and second period from PSV, and (F) shows alpha powers of first and second period using by FFT analysis from pupillary response. In FIG. 9, (G) shows a heart rate (HR) signal from ECG signal, (H) shows EEG signal, (I) shows Data separation (trial) based on HR from ECG signal, (J) shows a grand average signal in all trial and divided into first and second period from the EEG signal, and (K) shows alpha powers of first and second period using by FFT analysis from the EEG signal.
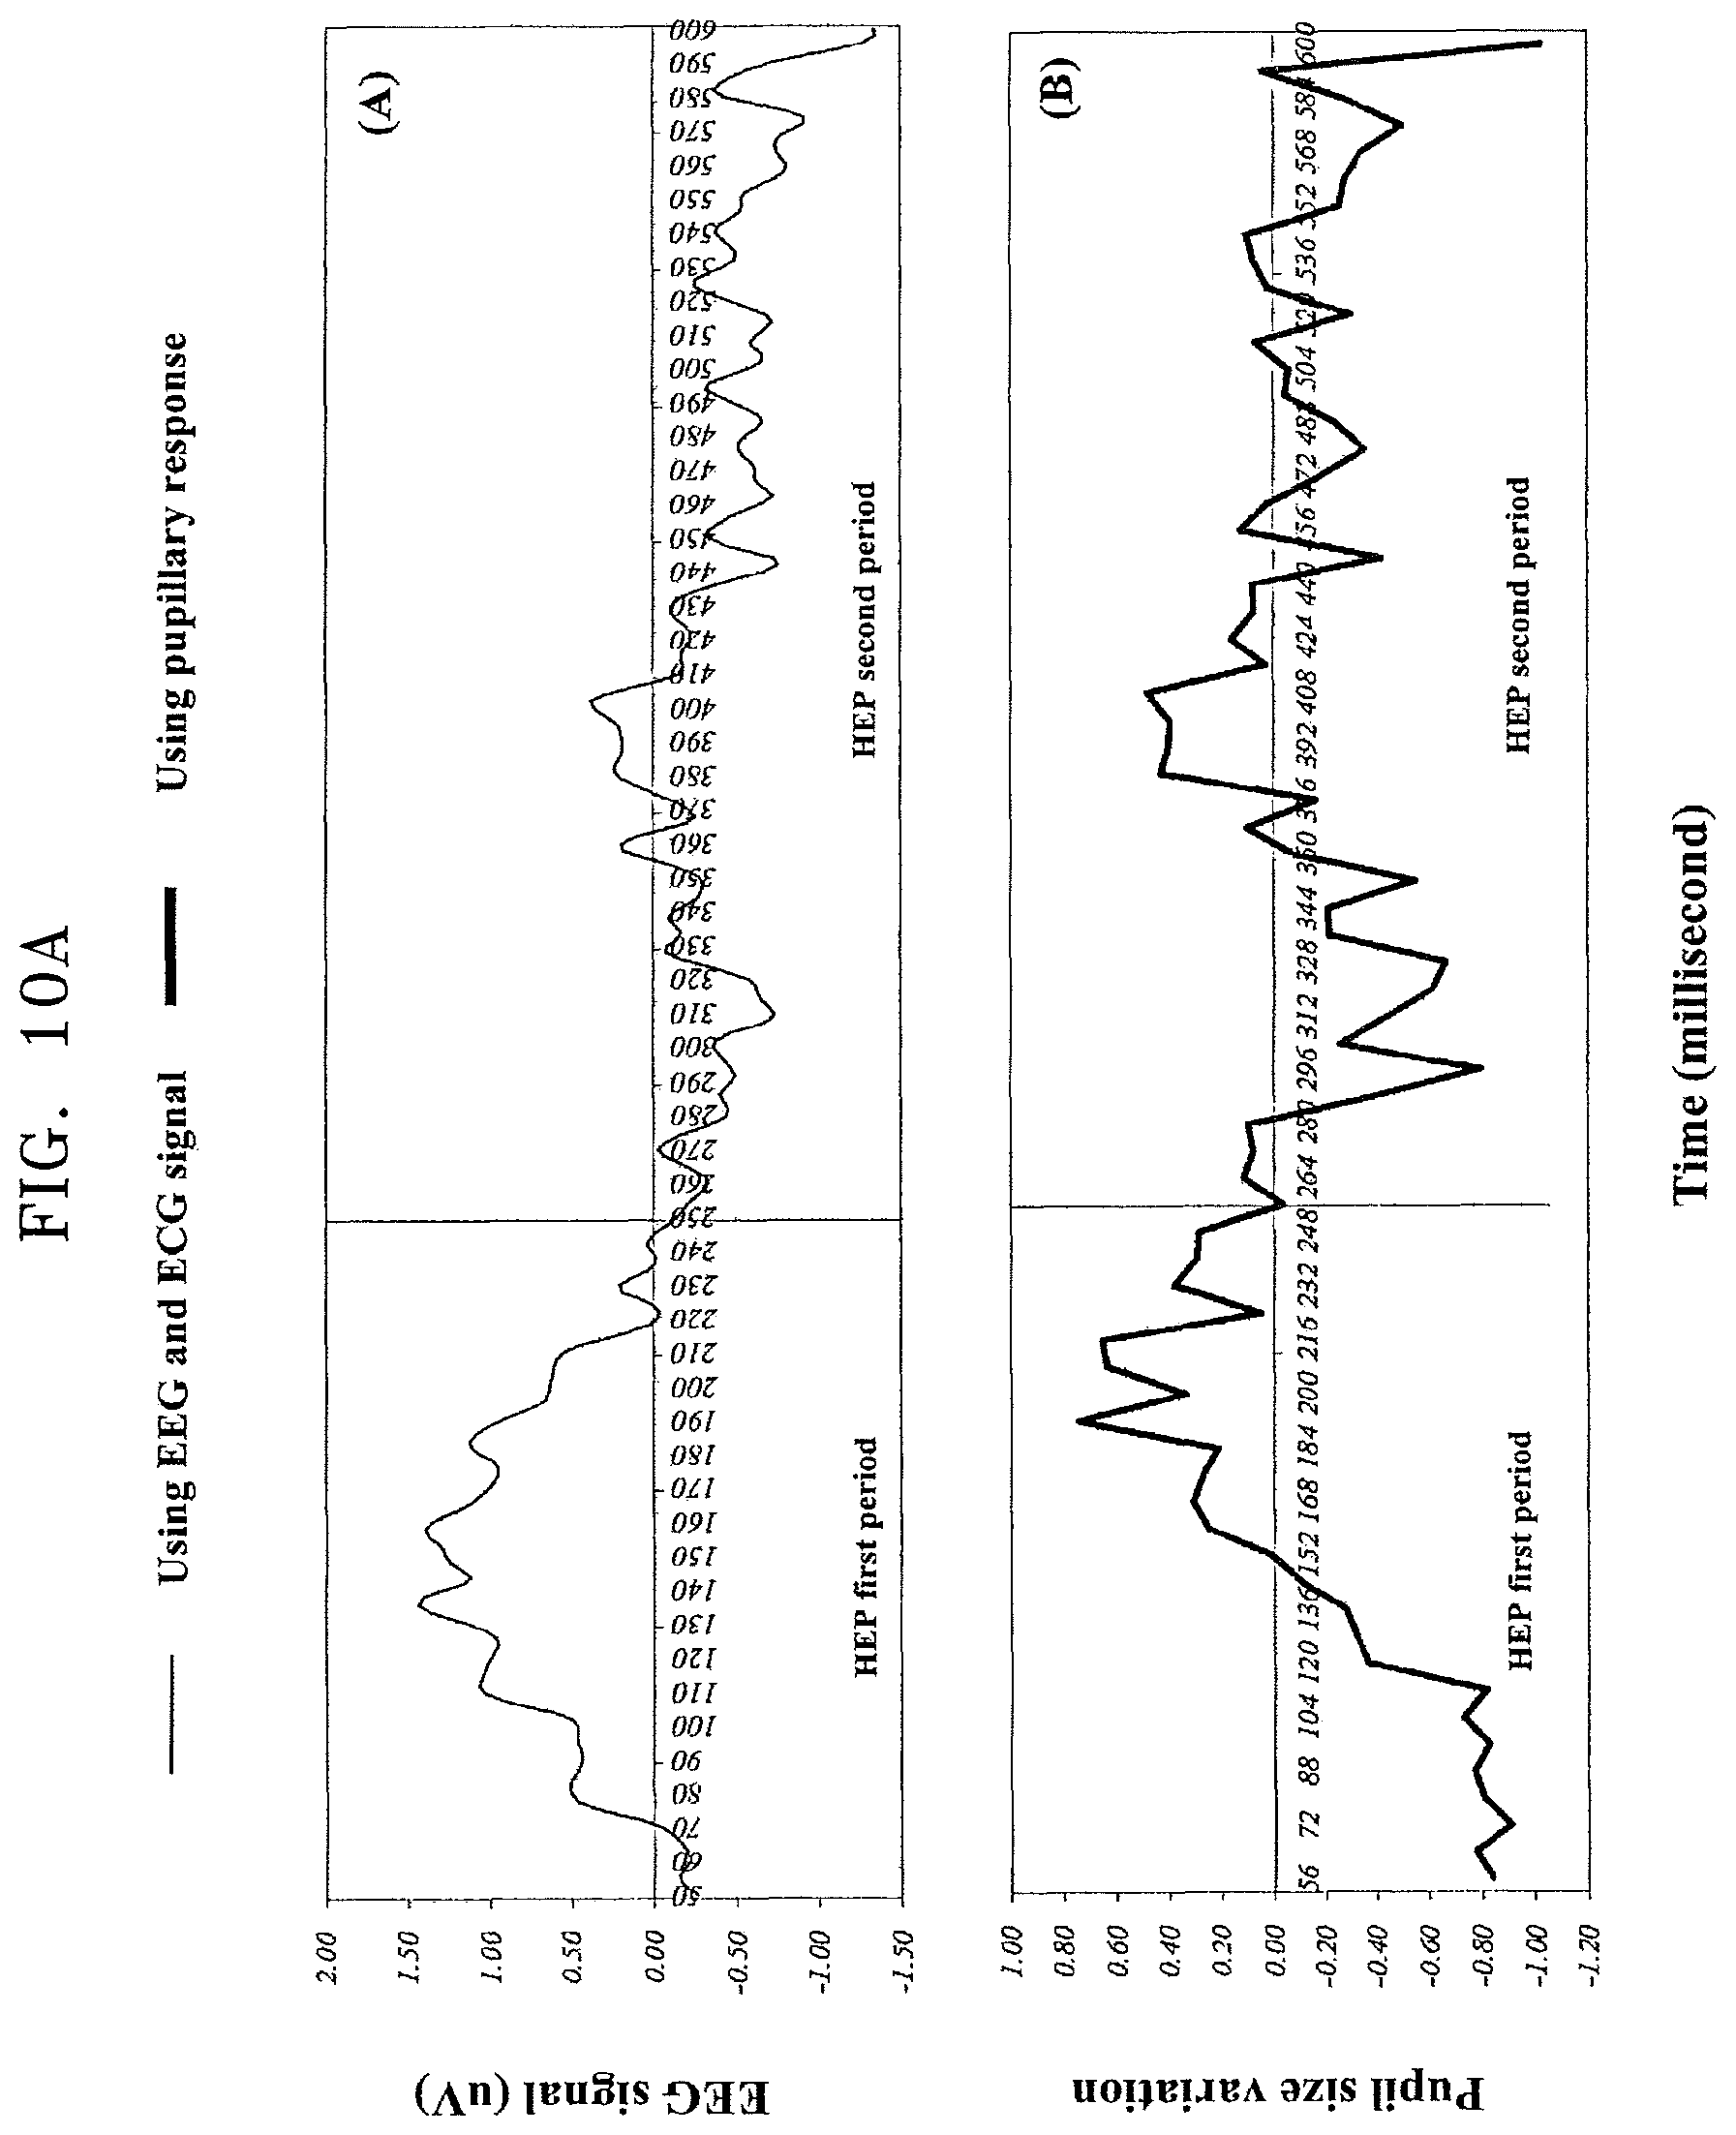
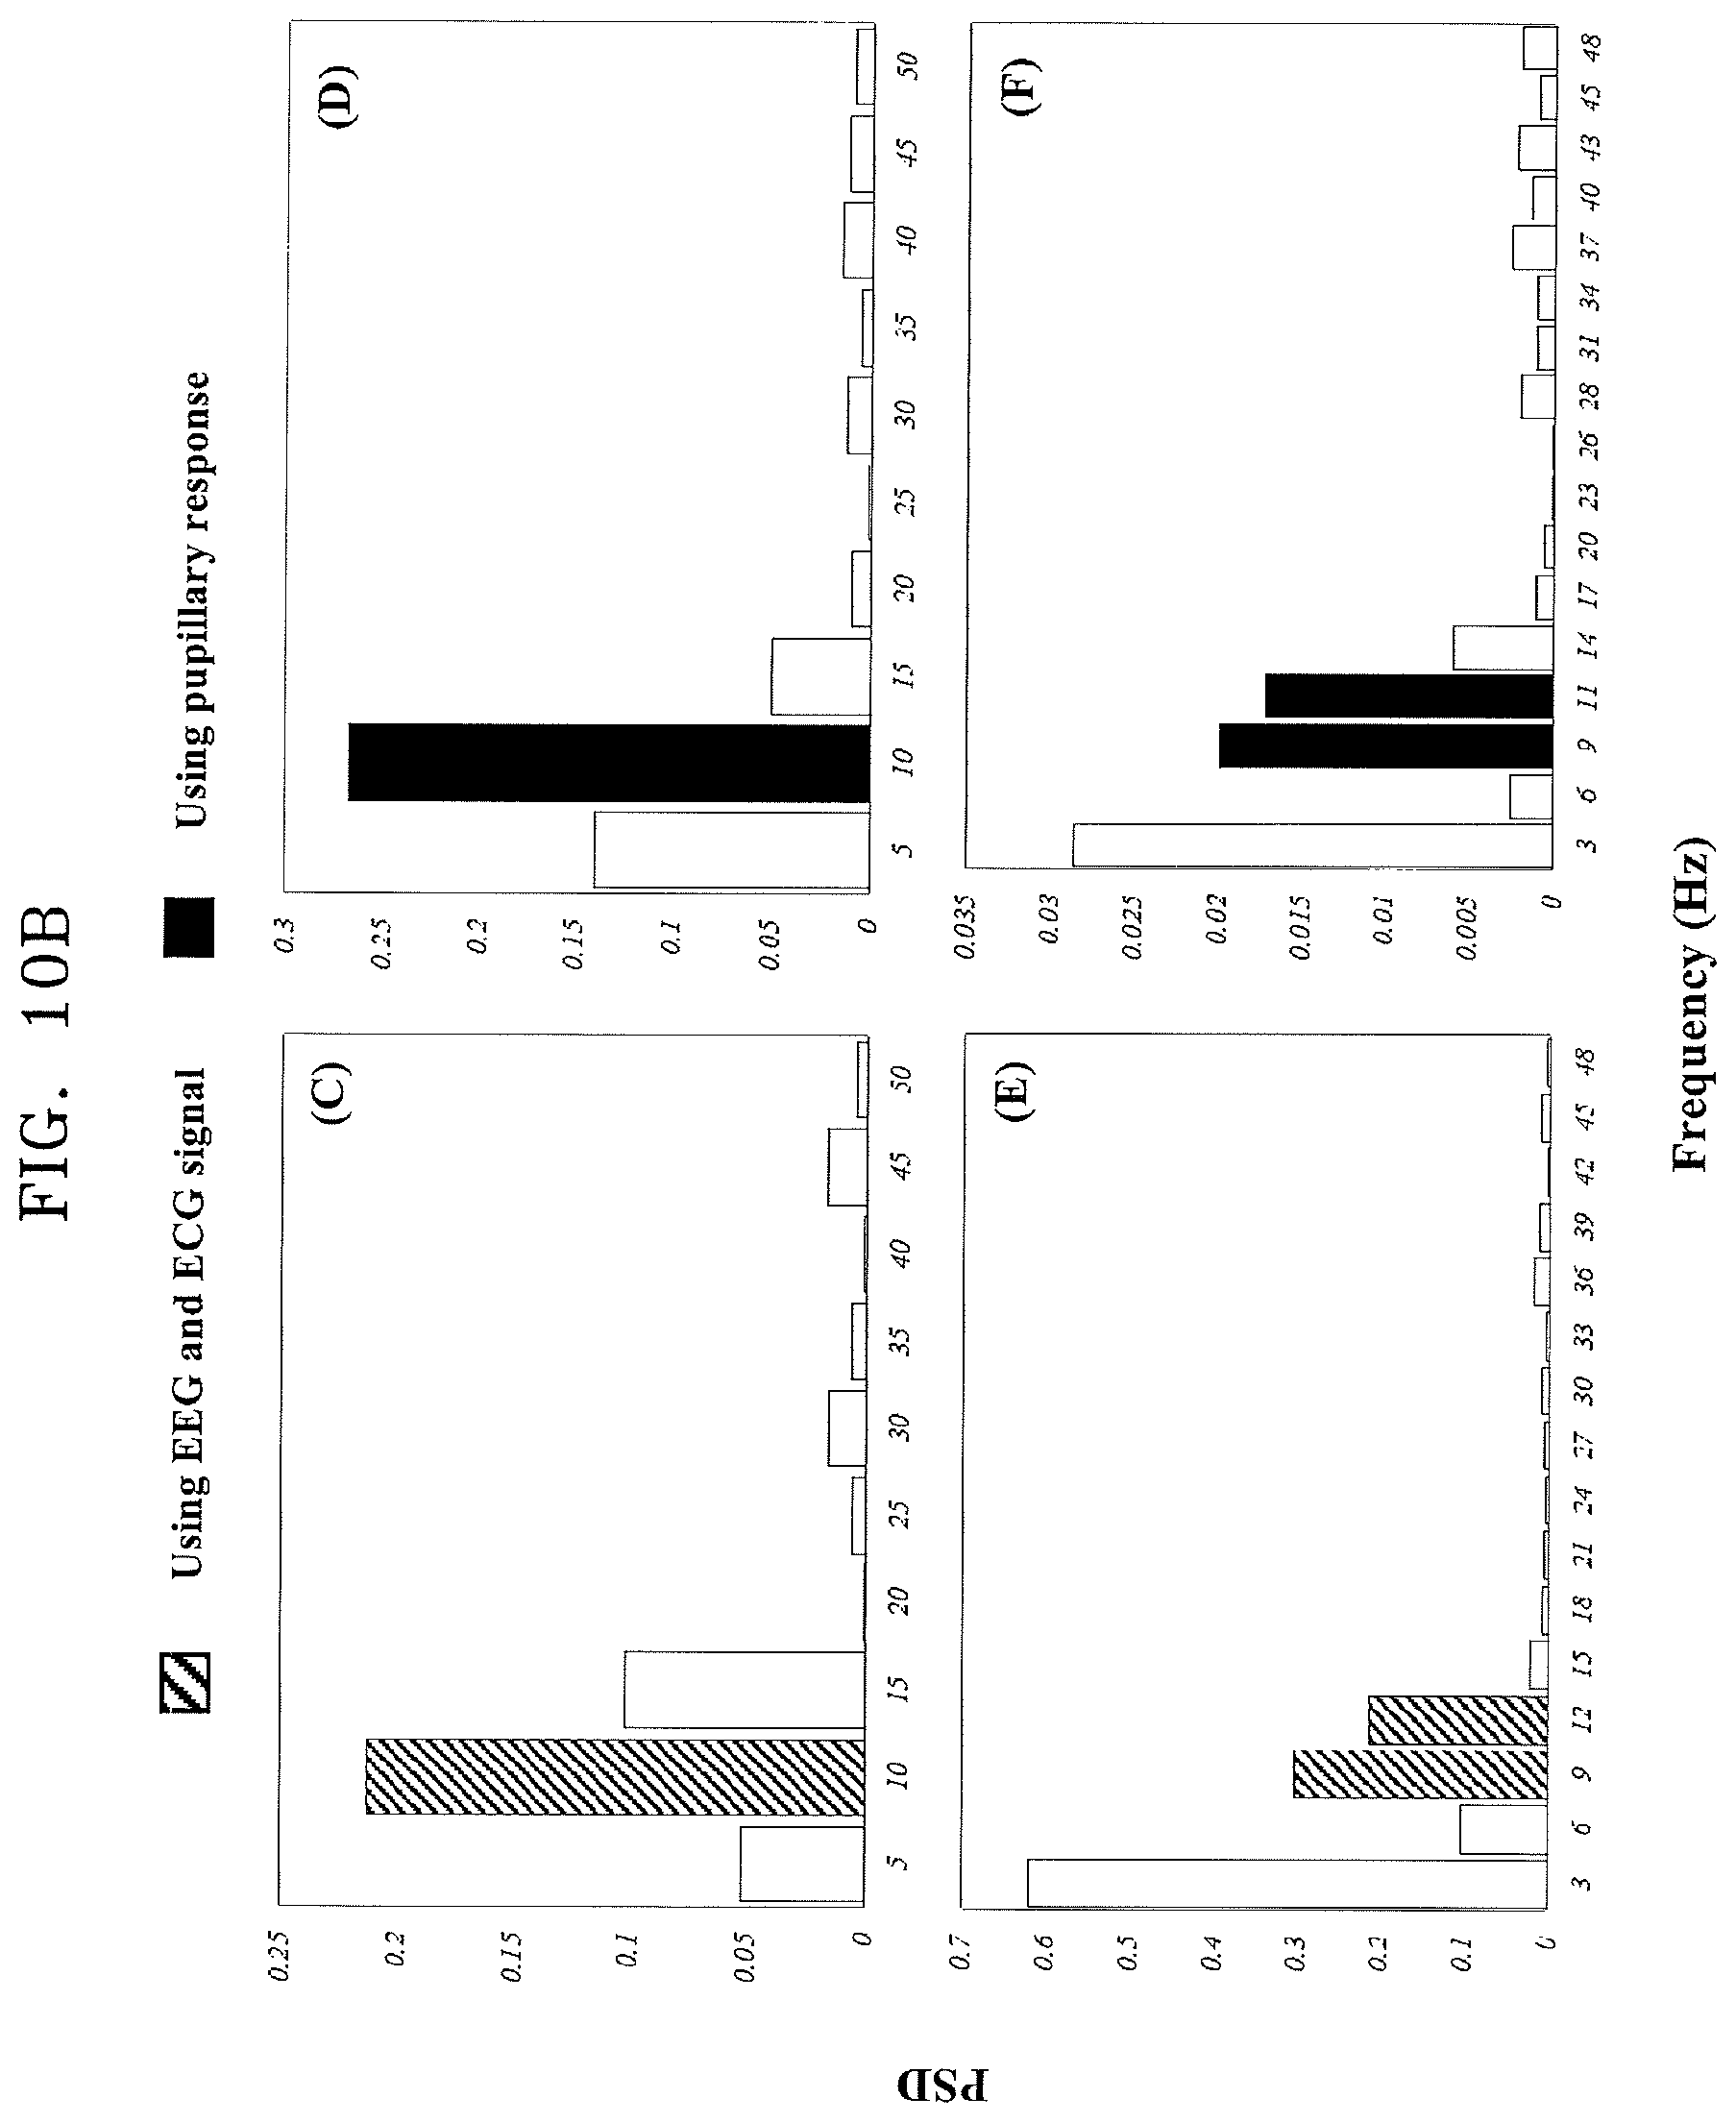
FIGS. 10a and 10b show comparison examples of the first and second index of the HEP in MNC, where A and B: Grand average signal from EEG and PSV, C and D: The alpha powers of first period from EEG (50.276%) and pupil (51.293%), E and F: the alpha power of second period from EEG (37.673%) and pupil (36.636%).
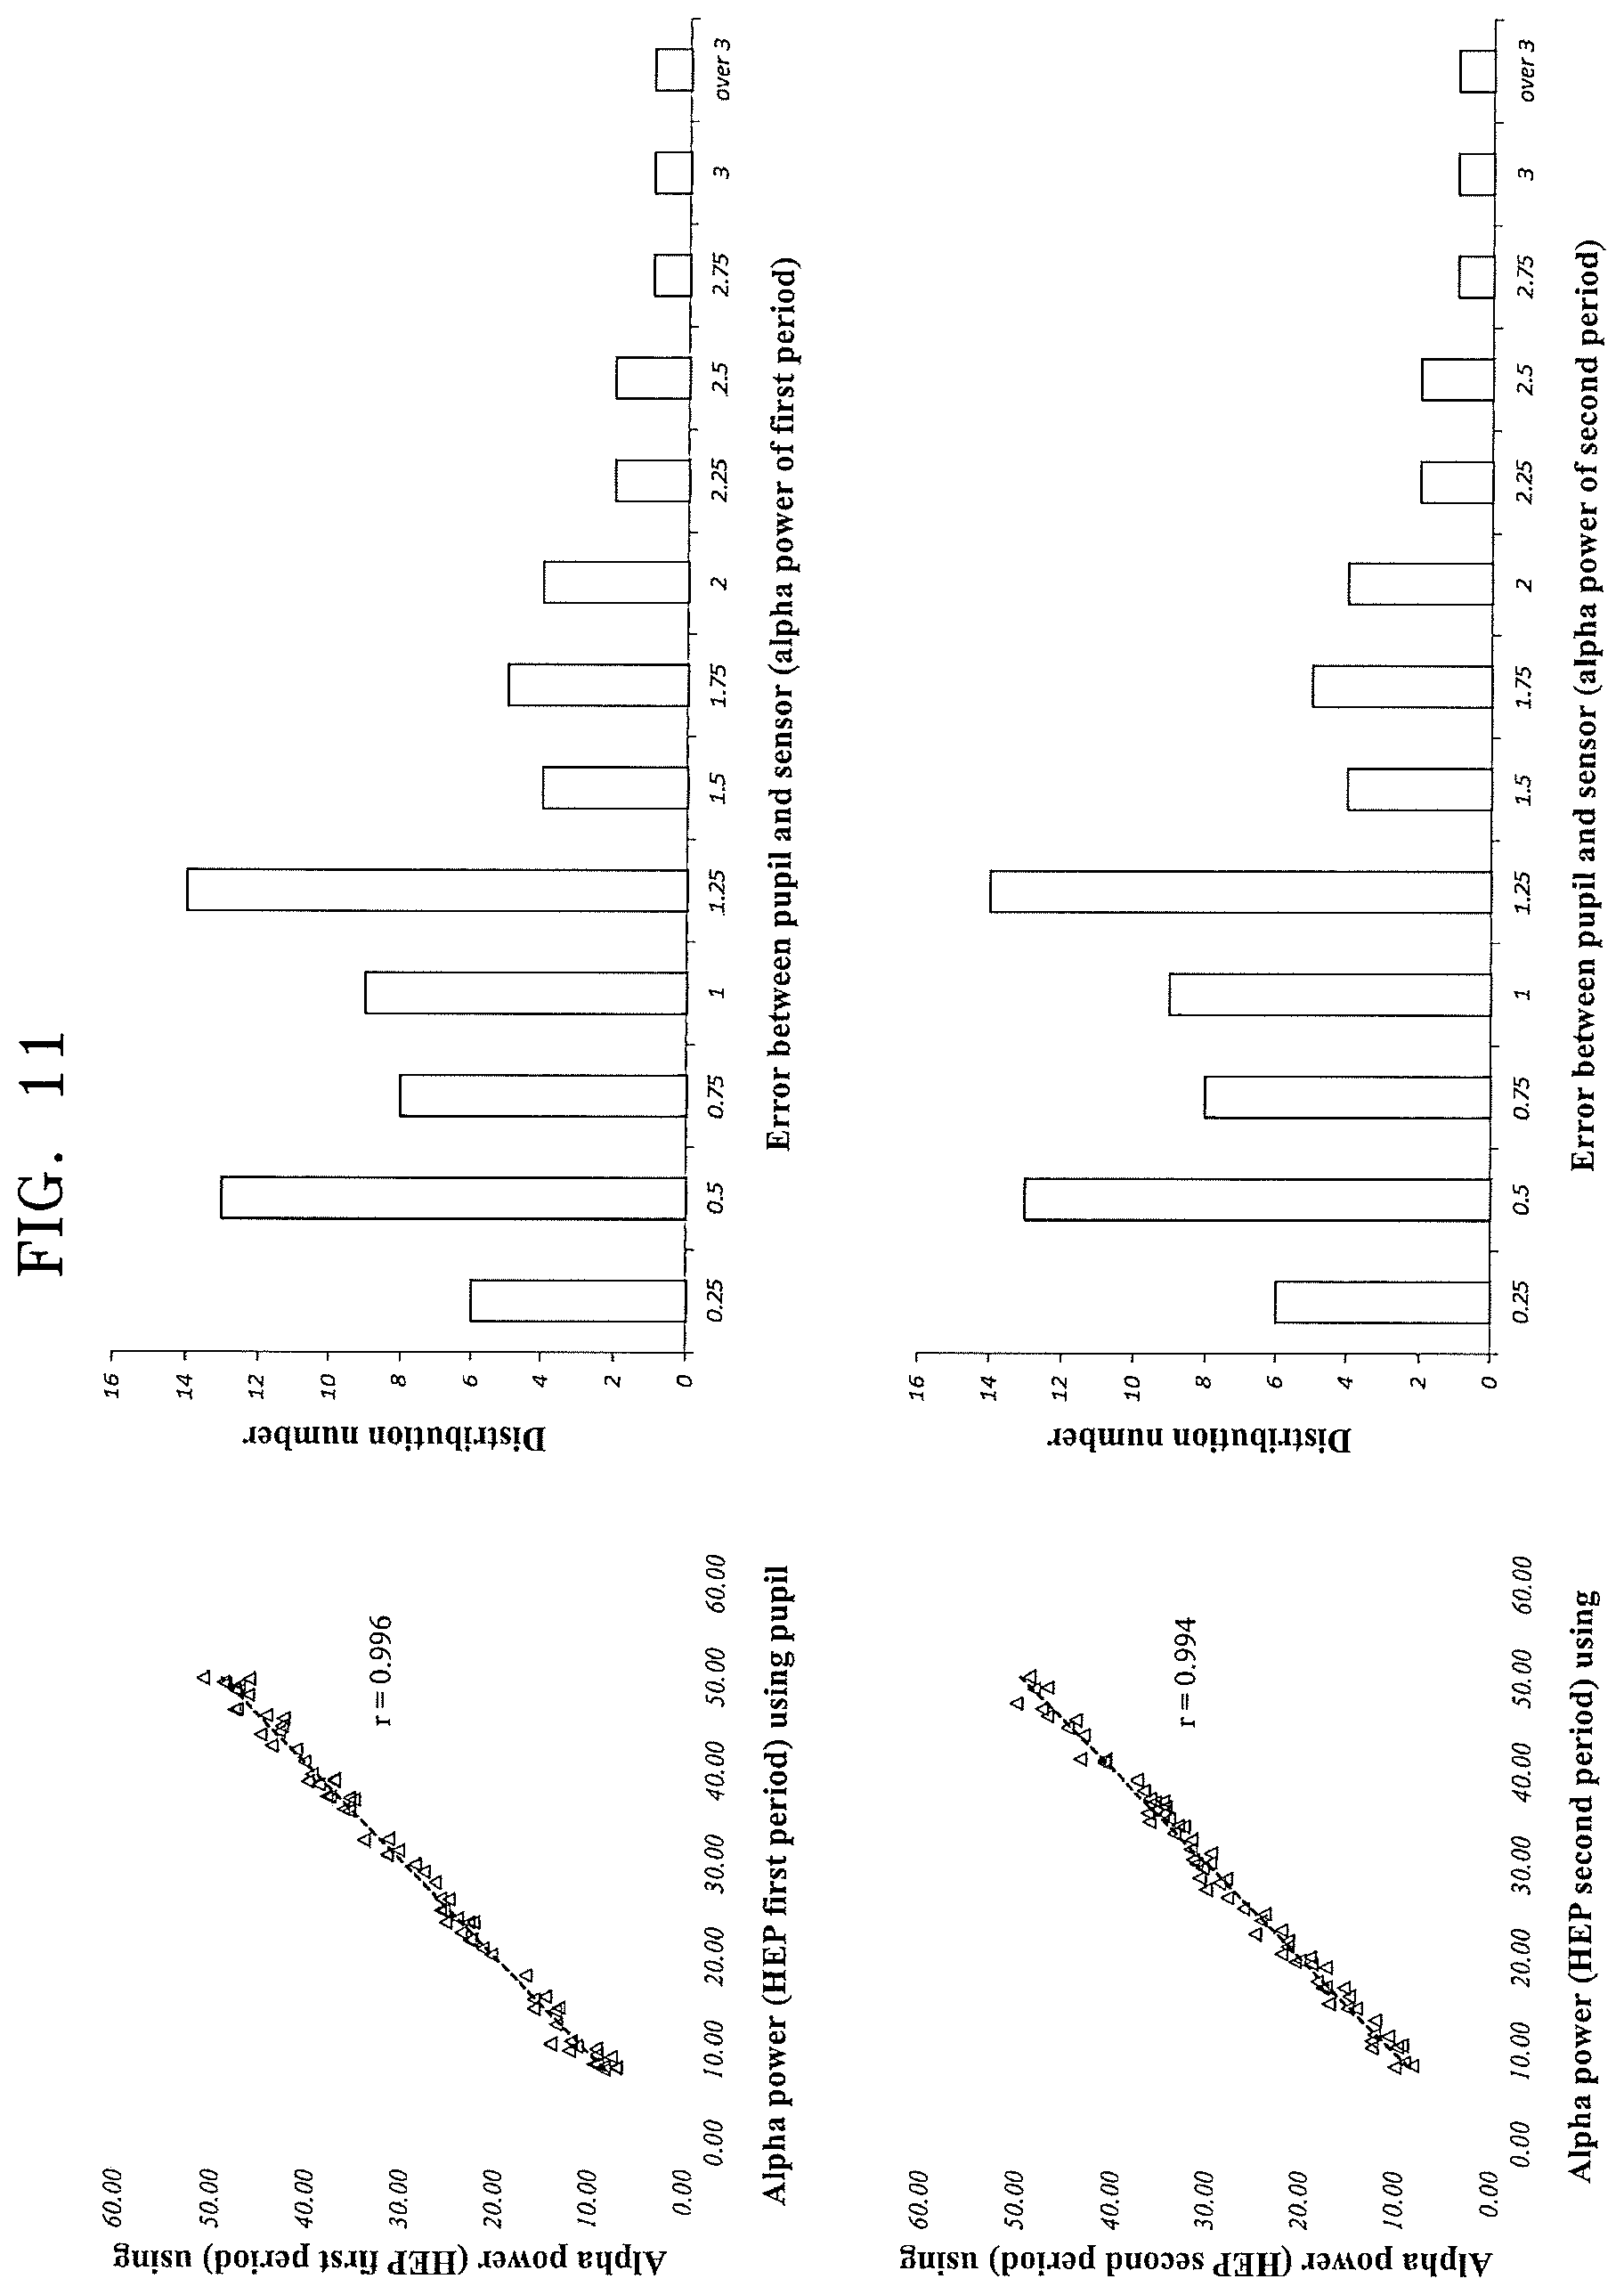
FIG. 11 shows comparison results for correlation and error in the first and second indexes of the HEP (MNC) for the ground truth. Referring FIG. 1, the alpha power of the HEP index from the pupillary response indicated a strong correlation for all parameters with r=0.996 for the first period and r=0.994 for the second period. The difference between the mean error of all the parameters was low with ME=1.071 (in range of 0.100 to 3.600) for the first period and ME=1.048 (in range of 0.060 to 3.090) for the second period. The error of the alpha power in the first period was distributed as follows: 1 (35), 1.25 to 3 (33), and over 3 (2). The error of alpha power in the second period was distributed as follows: 1 (36), 1.25 to 3 (33), and over 3 (1). This procedure used recorded data for 300 s. The correlation and mean error were the mean value for the 70 test subjects (N=70), as shown in Table 4.
TABLE-US-00004 TABLE 4 Alpha power of first period Alpha power of second period Using Using Error Using Using Error Subjects pupil sensor (diff) pupil sensor (diff) S1 8.16 9.37 1.210 27.71 28.48 0.770 S2 36.63 35.37 1.260 36.46 34.35 2.110 S3 10.52 11.70 1.180 31.31 31.50 0.190 S4 49.51 50.82 1.310 29.82 29.50 0.320 S5 48.94 48.47 0.470 14.25 14.74 0.490 S6 9.80 9.10 0.700 16.46 17.09 0.630 S7 49.11 48.69 0.420 12.92 11.89 1.030 S8 42.26 43.56 1.300 17.11 18.01 0.900 S9 43.45 44.71 1.260 29.79 30.94 1.150 S10 30.62 31.30 0.680 29.25 30.25 1.000 S11 23.26 25.13 1.870 10.06 12.17 2.110 S12 15.15 15.71 0.560 46.89 49.98 3.090 S13 38.49 39.74 1.250 11.43 11.92 0.490 S14 41.87 41.01 0.860 32.32 31.37 0.950 S15 38.66 37.07 1.590 36.78 35.77 1.010 S16 36.85 37.42 0.570 24.32 23.75 0.570 S17 38.48 37.07 1.410 19.23 20.36 1.130 S18 8.14 8.98 0.840 38.73 37.21 1.520 S19 13.80 13.38 0.420 18.63 17.08 1.550 S20 8.89 7.57 1.320 23.63 24.06 0.430 S21 28.72 27.50 1.220 16.44 17.46 1.020 S22 21.46 22.31 0.850 40.93 43.26 2.330 S23 35.46 35.94 0.480 40.55 40.78 0.230 S24 27.57 26.31 1.260 33.80 32.80 1.000 S25 24.63 25.31 0.680 46.32 47.27 0.950 S26 38.13 38.62 0.490 43.54 42.89 0.650 S27 36.52 34.86 1.660 20.89 21.21 0.320 S28 25.86 25.71 0.150 34.26 35.90 1.640 S29 35.30 35.41 0.110 30.89 29.41 1.480 S30 30.55 31.37 0.820 44.36 44.58 0.220 S31 15.34 14.46 0.880 22.18 24.70 2.520 S32 24.62 25.72 1.100 35.17 36.08 0.910 S33 48.33 47.55 0.780 28.09 27.75 0.340 S34 21.36 22.51 1.150 35.85 34.18 1.670 S35 10.01 11.14 1.130 33.01 33.25 0.240 S36 23.29 22.59 0.700 28.22 30.61 2.390 S37 45.43 44.18 1.250 49.78 48.60 1.180
FIGS. 12a and 12b show examples of extracting the HEP indexes from the pupillary response signal (PSV) and sensor signals (EEG) in the test subjects.
In FIG. 12a, (A) and (B) show grand average signal from the EEG and PSV respectively. In FIG. 12b, (C) and (D) show alpha power (15.665%, 17.143%) of HEP first period from EEG and PSV respectively, and (E) and (F) show alpha power (14.886%, 16.505%) of HEP second period from EEG and PSV respectively.
FIG. 13 shows a comparison of the results for the ground truth in MNC. Referring FIG. 13, the alpha power of the HEP index from the pupillary response indicated a strong correlation for all parameters with r=0.991 for first period and r=0.988 for the second period. The difference between the mean error of all parameters was low with ME=1.415 (in range of 0.010 to 3.900) for first period and ME=1.489 (in range of 0.040 to 4.160) for the second period. The error of the alpha power in the first period was distributed as follows: 1 (30), 1.25 to 3 (35), and over 3 (5). The error of the alpha power in the second period was distributed as follows: 1 (24), 1.25 to 3 (40), and over 3 (6). This procedure used recorded data for 300 s. The correlation and mean error were the mean value for the 70 test subjects (N=70), as shown in Table 5.
Table 5 shows averages of mean error in alpha power of first and second periods of the HEP in NMC (N=70)
TABLE-US-00005 TABLE 5 Alpha power of first period Alpha power of second period Using Using Error Using Error Subjects pupil sensor (diff) Using pupil sensor (diff) S1 12.10 13.59 1.490 43.25 44.96 1.710 S2 8.35 7.96 0.390 11.18 12.59 1.410 S3 19.83 19.27 0.560 42.40 41.79 0.610 S4 24.58 22.40 2.180 34.90 38.62 3.720 S5 33.16 31.88 1.280 38.27 37.53 0.740 S6 17.14 19.35 2.210 34.89 36.53 1.640 S7 20.67 21.51 0.840 27.13 29.07 1.940 S8 20.89 18.89 2.000 25.71 27.20 1.490 S9 13.14 11.47 1.670 15.18 15.81 0.630 S10 17.27 18.88 1.610 13.55 14.91 1.360 S11 45.98 42.61 3.370 28.17 29.61 1.440 S12 9.57 7.55 2.020 30.80 31.35 0.550 S13 31.85 29.13 2.720 12.05 11.88 0.170 S14 29.32 27.37 1.950 42.73 42.36 0.370 S15 16.00 15.26 0.740 18.83 20.98 2.150 S16 43.94 40.18 3.760 11.87 15.61 3.740 S17 37.61 36.29 1.320 16.13 19.50 3.370 S18 20.60 19.88 0.720 22.00 22.87 0.870 S19 27.32 26.74 0.580 43.15 40.21 2.940 S20 20.99 20.57 0.420 47.52 46.00 1.520 S21 28.78 26.44 2.340 37.96 36.01 1.950 S22 30.68 29.67 1.010 15.87 14.67 1.200 S23 26.35 25.41 0.940 16.76 16.43 0.330 S24 15.83 17.84 2.010 13.85 15.37 1.520 S25 41.78 40.19 1.590 30.35 31.66 1.310 S26 33.30 32.00 1.300 46.37 47.47 1.100 S27 16.06 17.65 1.590 29.25 27.18 2.070 S28 36.10 36.17 0.070 24.99 25.24 0.250 S29 10.18 12.39 2.210 33.58 35.71 2.130 S30 32.20 32.21 0.010 9.96 10.33 0.370 S31 30.35 33.66 3.310 15.64 16.24 0.600 S32 33.48 34.48 1.000 25.31 23.59 1.720 S33 36.01 38.43 2.420 36.48 34.47 2.010 S34 19.37 20.77 1.400 29.63 31.87 2.240 S35 46.24 45.66 0.580 25.54 23.93 1.610 S36 33.55 34.04 0.490 46.11 47.08 0.970 S37 40.56 39.58 0.980 38.84 39.82 0.980 S38 7.83 6.44 1.390 11.29 12.54 1.250 S39 48.05 47.87 0.180 18.29 19.69 1.400 S40 7.14 11.04 3.900 23.36 24.86 1.500 S41 47.50 46.13 1.370 27.57 28.07 0.500 S42 19.10 17.81 1.290 36.69 39.59 2.900 S43 37.01 36.84 0.170 11.79 11.83 0.040 S44 36.52 35.96 0.560 18.70 22.86 4.160 S45 34.09 33.10 0.990 37.04 36.84 0.200 S46 44.99 42.47 2.520 26.88 25.52 1.360 S47 41.89 42.22 0.330 17.99 15.19 2.800 S48 8.72 9.60 0.880 22.64 25.93 3.290 S49 29.16 28.08 1.080 35.65 38.37 2.720 S50 27.10 25.02 2.080 20.60 20.53 0.070 S51 18.58 21.92 3.340 10.46 11.90 1.440 S52 28.07 26.78 1.290 13.61 15.33 1.720 S53 27.80 25.80 2.000 37.26 35.55 1.710 S54 13.02 15.33 2.310 14.47 13.91 0.560 S55 49.28 48.48 0.800 10.69 11.27 0.580 S56 11.76 11.24 0.520 39.16 41.38 2.220 S57 12.04 13.25 1.210 11.91 12.06 0.150 S58 48.74 46.10 2.640 23.48 21.68 1.800 S59 22.02 20.75 1.270 22.27 21.56 0.710 S60 21.81 20.73 1.080 30.17 28.89 1.280 S61 9.76 8.80 0.960 16.32 15.59 0.730 S62 35.02 34.40 0.620 44.86 44.12 0.740 S63 29.07 28.11 0.960 18.23 18.93 0.700 S64 15.18 12.28 2.900 17.43 18.69 1.260 S65 20.18 20.12 0.060 35.85 32.62 3.230 S66 30.56 30.13 0.430 24.57 25.83 1.260 S67 10.63 11.16 0.530 31.90 30.08 1.820 S68 27.16 29.30 2.140 29.95 31.18 1.230 S69 49.50 48.53 0.970 8.96 6.13 2.830 S70 36.73 35.56 1.170 11.34 12.66 1.320 Mean error 1.415 Mean error 1.489
Real-Time System for Detecting the Cardiac Time Domain Parameters
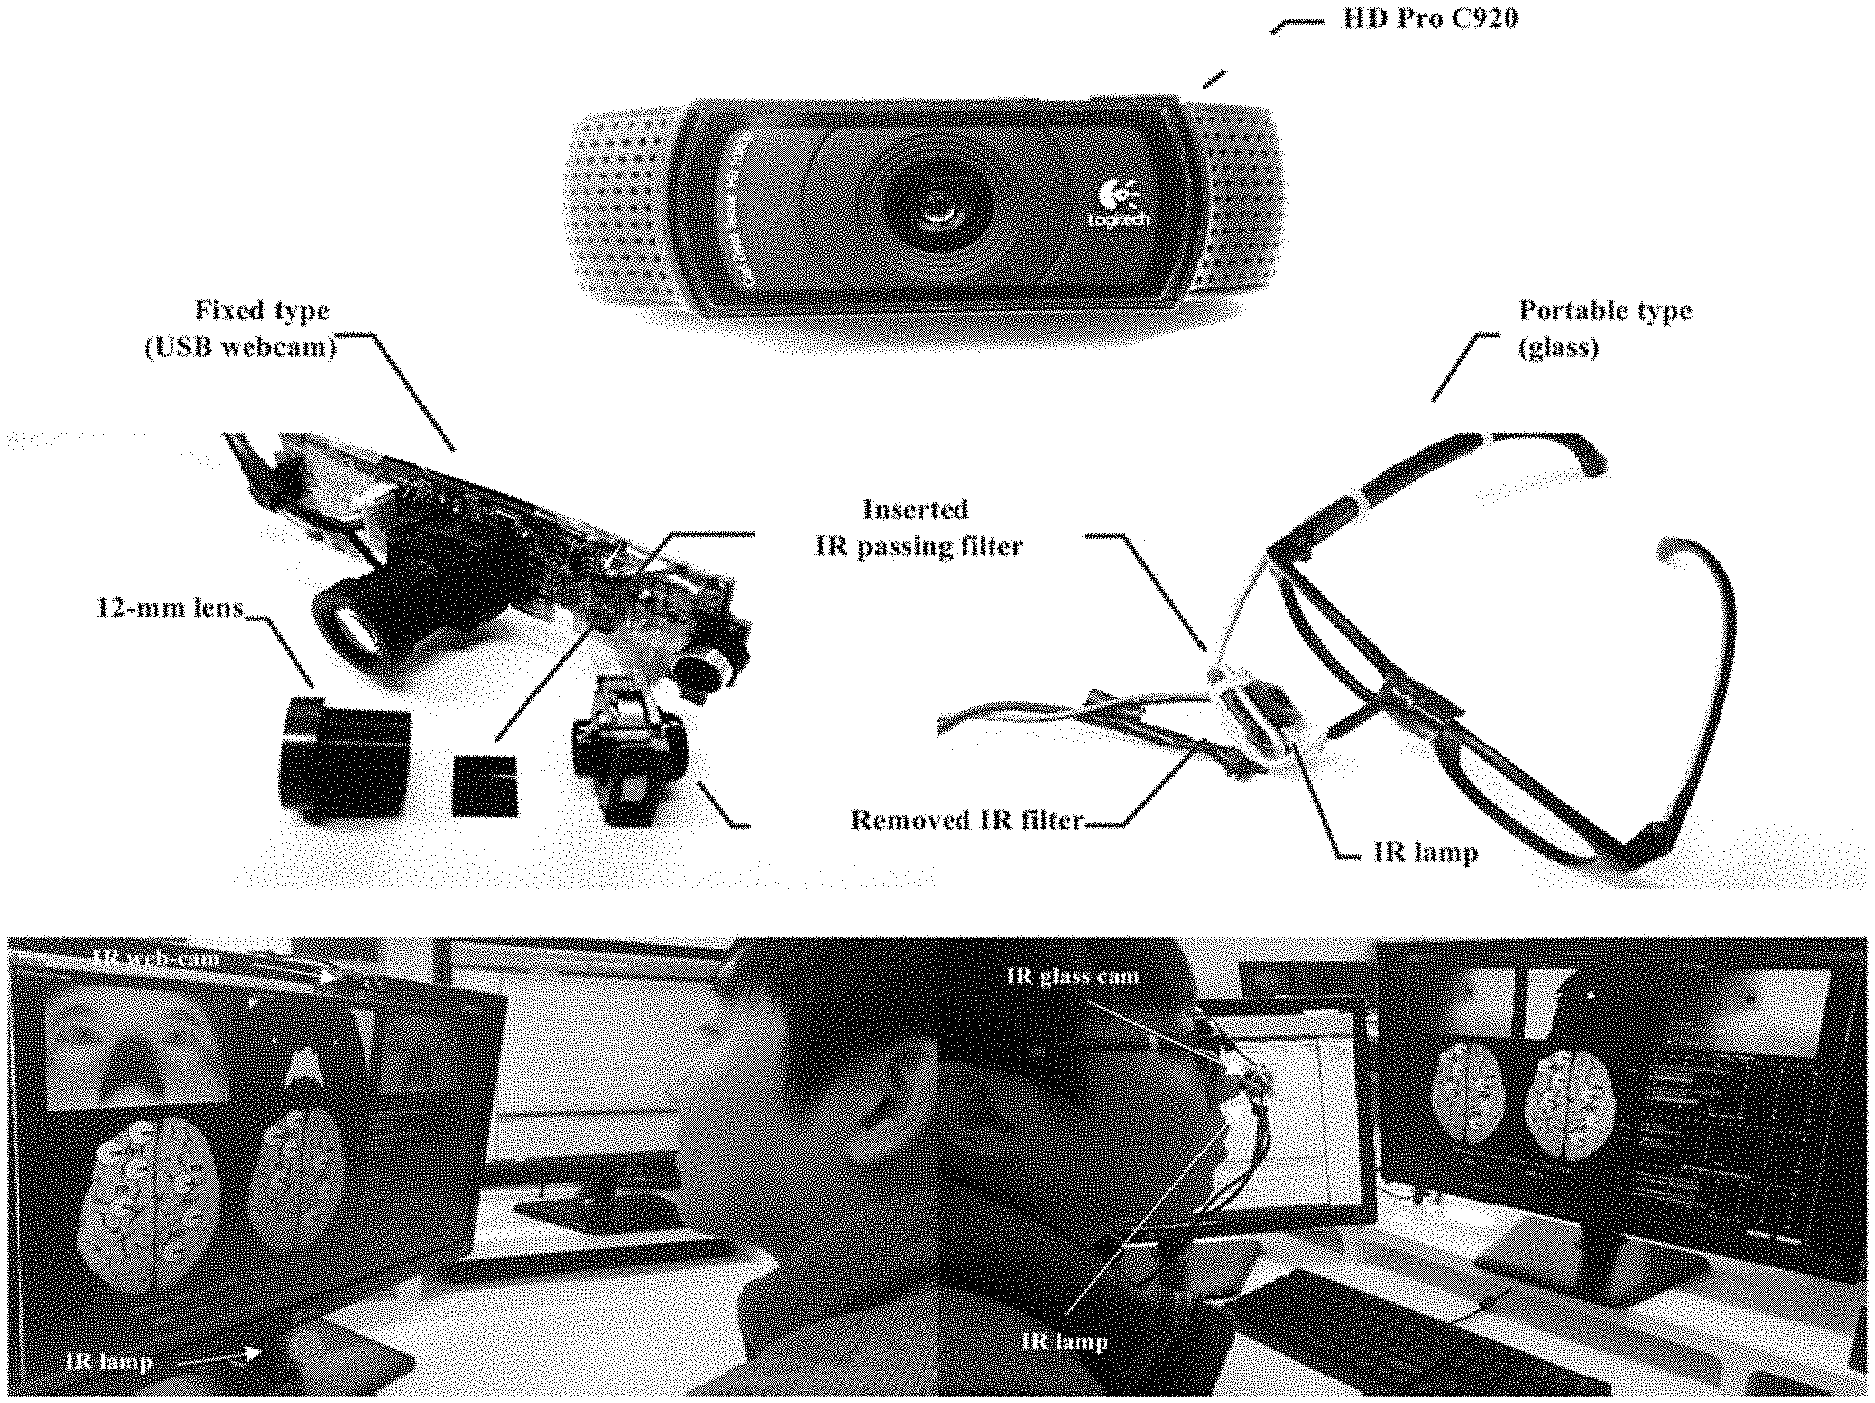
The real-time system for detecting human vital signs was developed using the pupil image from an infrared webcam. This system includes an infrared webcam, near IR (InfraRed light) illuminator (IR lamp) and personal computer for analysis.
The infrared webcam was divided into two types, the fixed type, which is a common USB webcam, and the portable type, which are represented by wearable devices. The webcam was a HD Pro C920 from Logitech Inc. converted into an infrared webcam to detect the pupil area.
The IR filter inside the webcam was removed and an IR passing filter used for cutting visible light from Kodac Inc., was inserted into the webcam to allow passage of IR wavelength longer than 750 nm, as shown in FIG. 14. The 12-mm lens inside the webcam was replaced with a 3.6-mm lens to allow for focusing on the image when measuring the distance from 0.5 m to 1.5 m.
FIG. 14 shows an infrared webcam system for taking pupil images.
The conventional 12 mm lens of the USB webcam shown in FIG. 12 was replaced with a 3.6 mm lens so that the subject could be focused when a distance of 0.5 m to 1.5 m was photographed.
FIG. 15 shows an interface screen of a real-time system for detecting and analyzing a biological signal from an infrared webcam and a sensor, where (A): Infrared pupil image (input image), (B): binarized pupil image, (C): Detecting the pupil area, (D): Output of cardiac time parameters, (E): Output of cardiac frequency parameters (VLF power, LF power, HF power, VLF/HF ratio, and LF/HF ratio). (F): Output of EEG spectral parameters (low beta power in FP1, mid beta power in FP1, SMR power in FP1, beta power in F3, high beta power in F8, mu power in C4, and gamma power in P4), and (G): Output of HEP parameters (alpha power of HEP first and second components).
As described in the above, the present invention develops and provides an advanced method for measurements of human vital signs from moving images of the pupil. Thereby, the measurement of parameters in cardiac time domain can be performed by using a low-cost infrared webcam system that monitored pupillary response (rhythm). The HEP index represents the alpha power of the first and second components of the HEP.
This result was verified for both the conditions of noise (MNC and NMC) and various physiological states (variation of arousal and valence level by emotional stimuli of sound) for seventy subjects.
The research for this invention examined the variation in human physiological conditions caused by the stimuli of arousal, relaxation, positive, negative, and neutral moods during verification experiments. The method based on pupillary response according to the present invention is an advanced technique for vital sign monitoring that can measure vital signs in either static or dynamic situations.
The proposed method according to the present invention is capable of measuring parameters in cardiac time domain with a simple, low-cost and non-invasive measurement system. The present invention may be applied to various industries such as U-health care, emotional ICT, human factors, HCl, and security that require VSM technology.
It should be understood that embodiments described herein should be considered in a descriptive sense only and not for purposes of limitation. Descriptions of features or aspects within each embodiment should typically be considered as available for other similar features or aspects in other embodiments.
While one or more embodiments have been described with reference to the figures, it will be understood by those of ordinary skill in the art that various changes in form and details may be made therein without departing from the spirit and scope of the disclosure as defined by the following claims.
* * * * *
D00000
D00001
D00002
D00003
D00004
D00005
D00006
D00007
D00008
D00009
D00010
D00011
D00012
D00013
D00014

D00015
D00016

D00017
M00001

M00002
M00003

M00004

M00005

XML
uspto.report is an independent third-party trademark research tool that is not affiliated, endorsed, or sponsored by the United States Patent and Trademark Office (USPTO) or any other governmental organization. The information provided by uspto.report is based on publicly available data at the time of writing and is intended for informational purposes only.
While we strive to provide accurate and up-to-date information, we do not guarantee the accuracy, completeness, reliability, or suitability of the information displayed on this site. The use of this site is at your own risk. Any reliance you place on such information is therefore strictly at your own risk.
All official trademark data, including owner information, should be verified by visiting the official USPTO website at www.uspto.gov. This site is not intended to replace professional legal advice and should not be used as a substitute for consulting with a legal professional who is knowledgeable about trademark law.