System and method of detecting hidden processes by analyzing packet flows
Deen , et al.
U.S. patent number 10,623,282 [Application Number 15/171,930] was granted by the patent office on 2020-04-14 for system and method of detecting hidden processes by analyzing packet flows. This patent grant is currently assigned to CISCO TECHNOLOGY, INC.. The grantee listed for this patent is Cisco Technology, Inc.. Invention is credited to Shih-Chun Chang, Khawar Deen, Shashidhar Gandham, Anubhav Gupta, Rohit Chandra Prasad, Abhishek Ranjan Singh, Navindra Yadav.

| United States Patent | 10,623,282 |
| Deen , et al. | April 14, 2020 |
System and method of detecting hidden processes by analyzing packet flows
Abstract
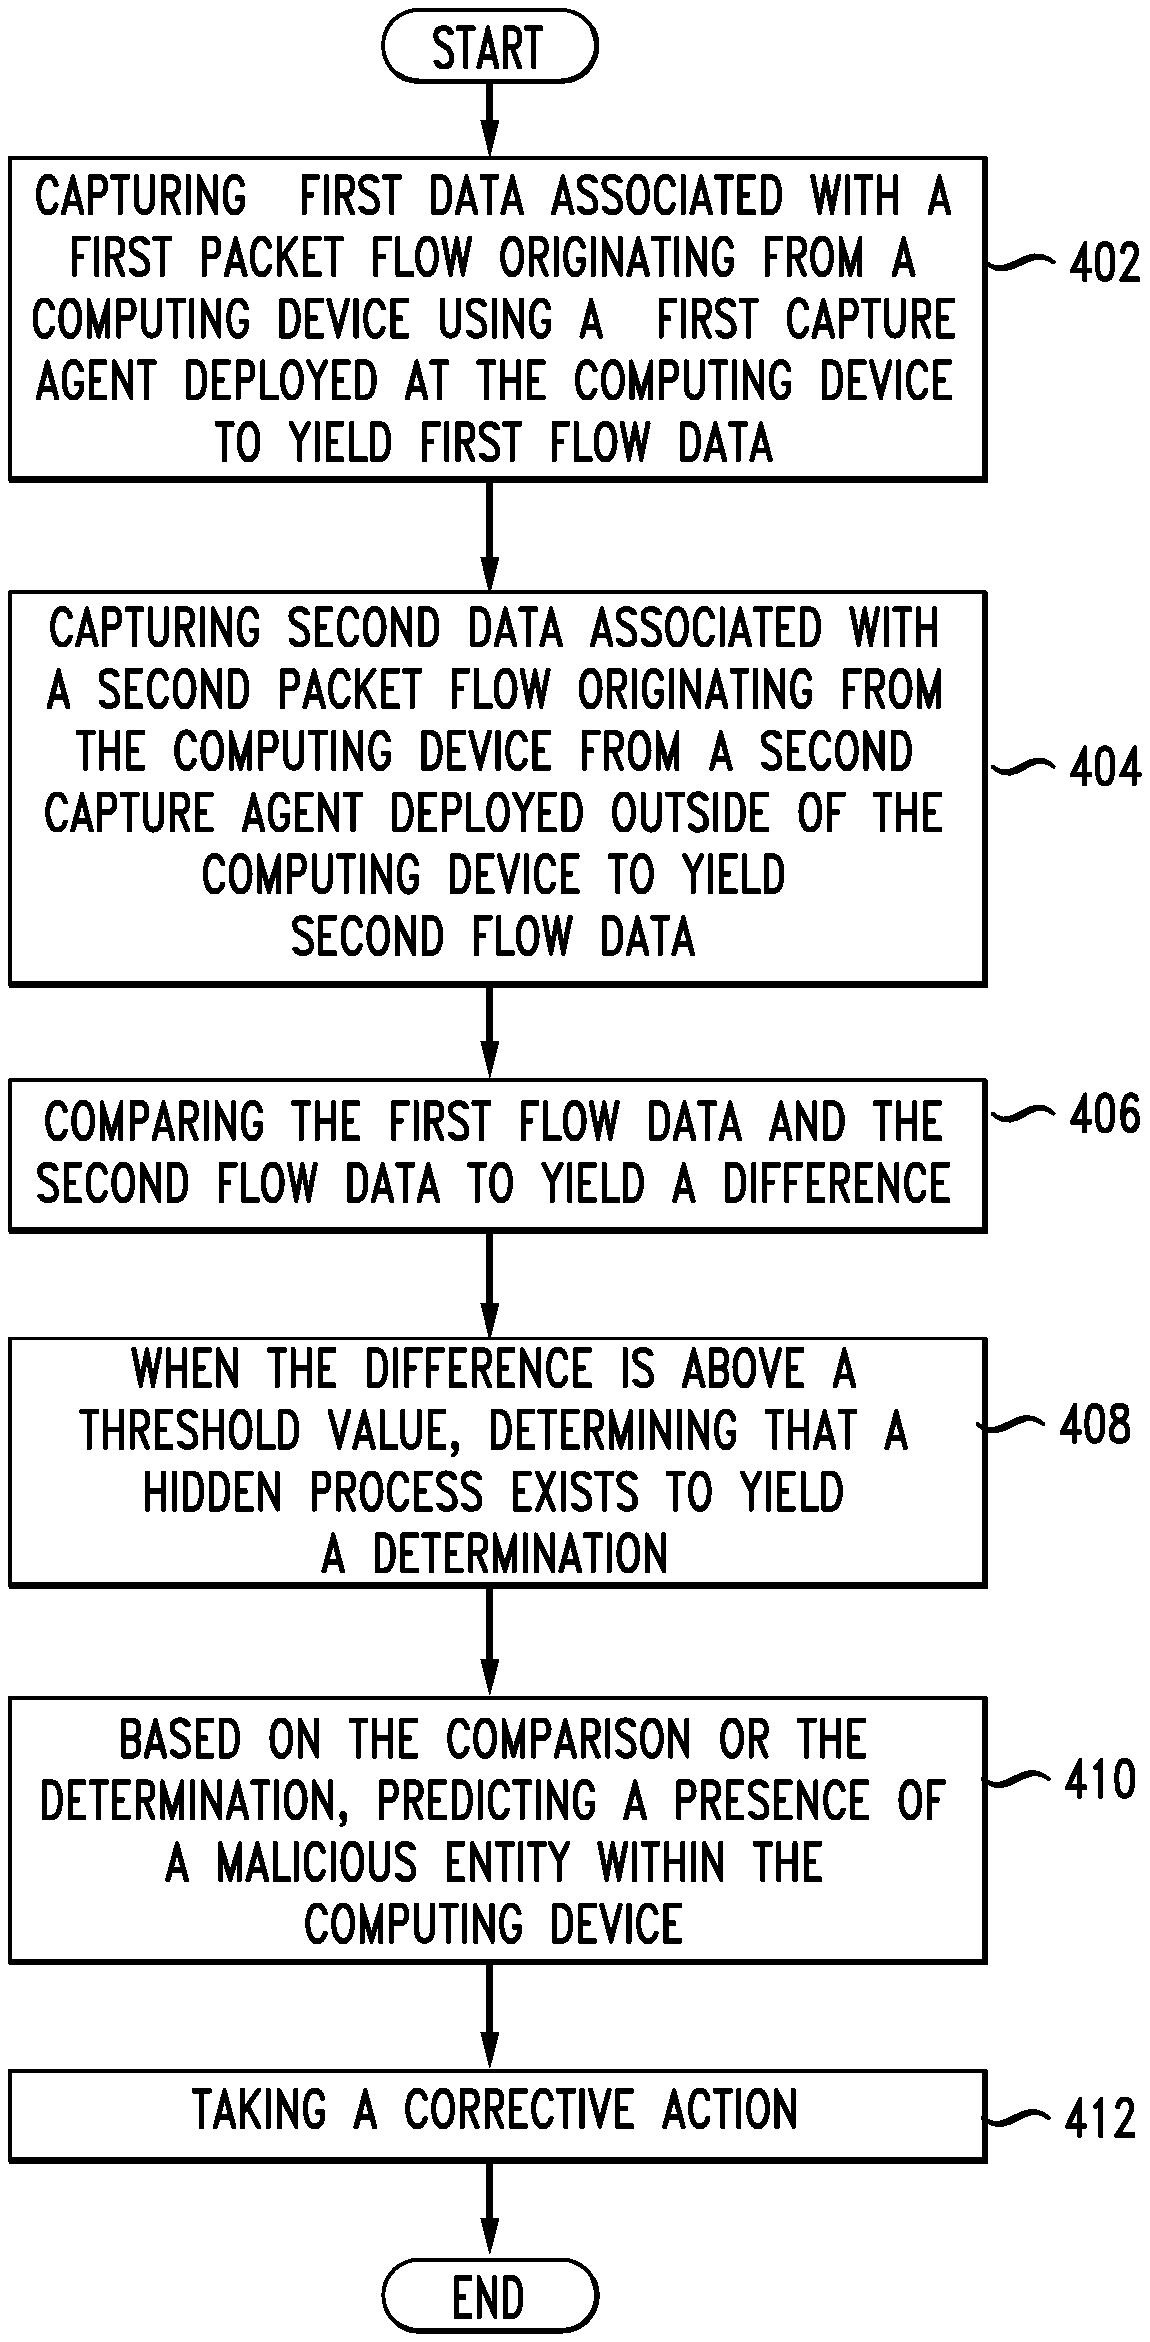
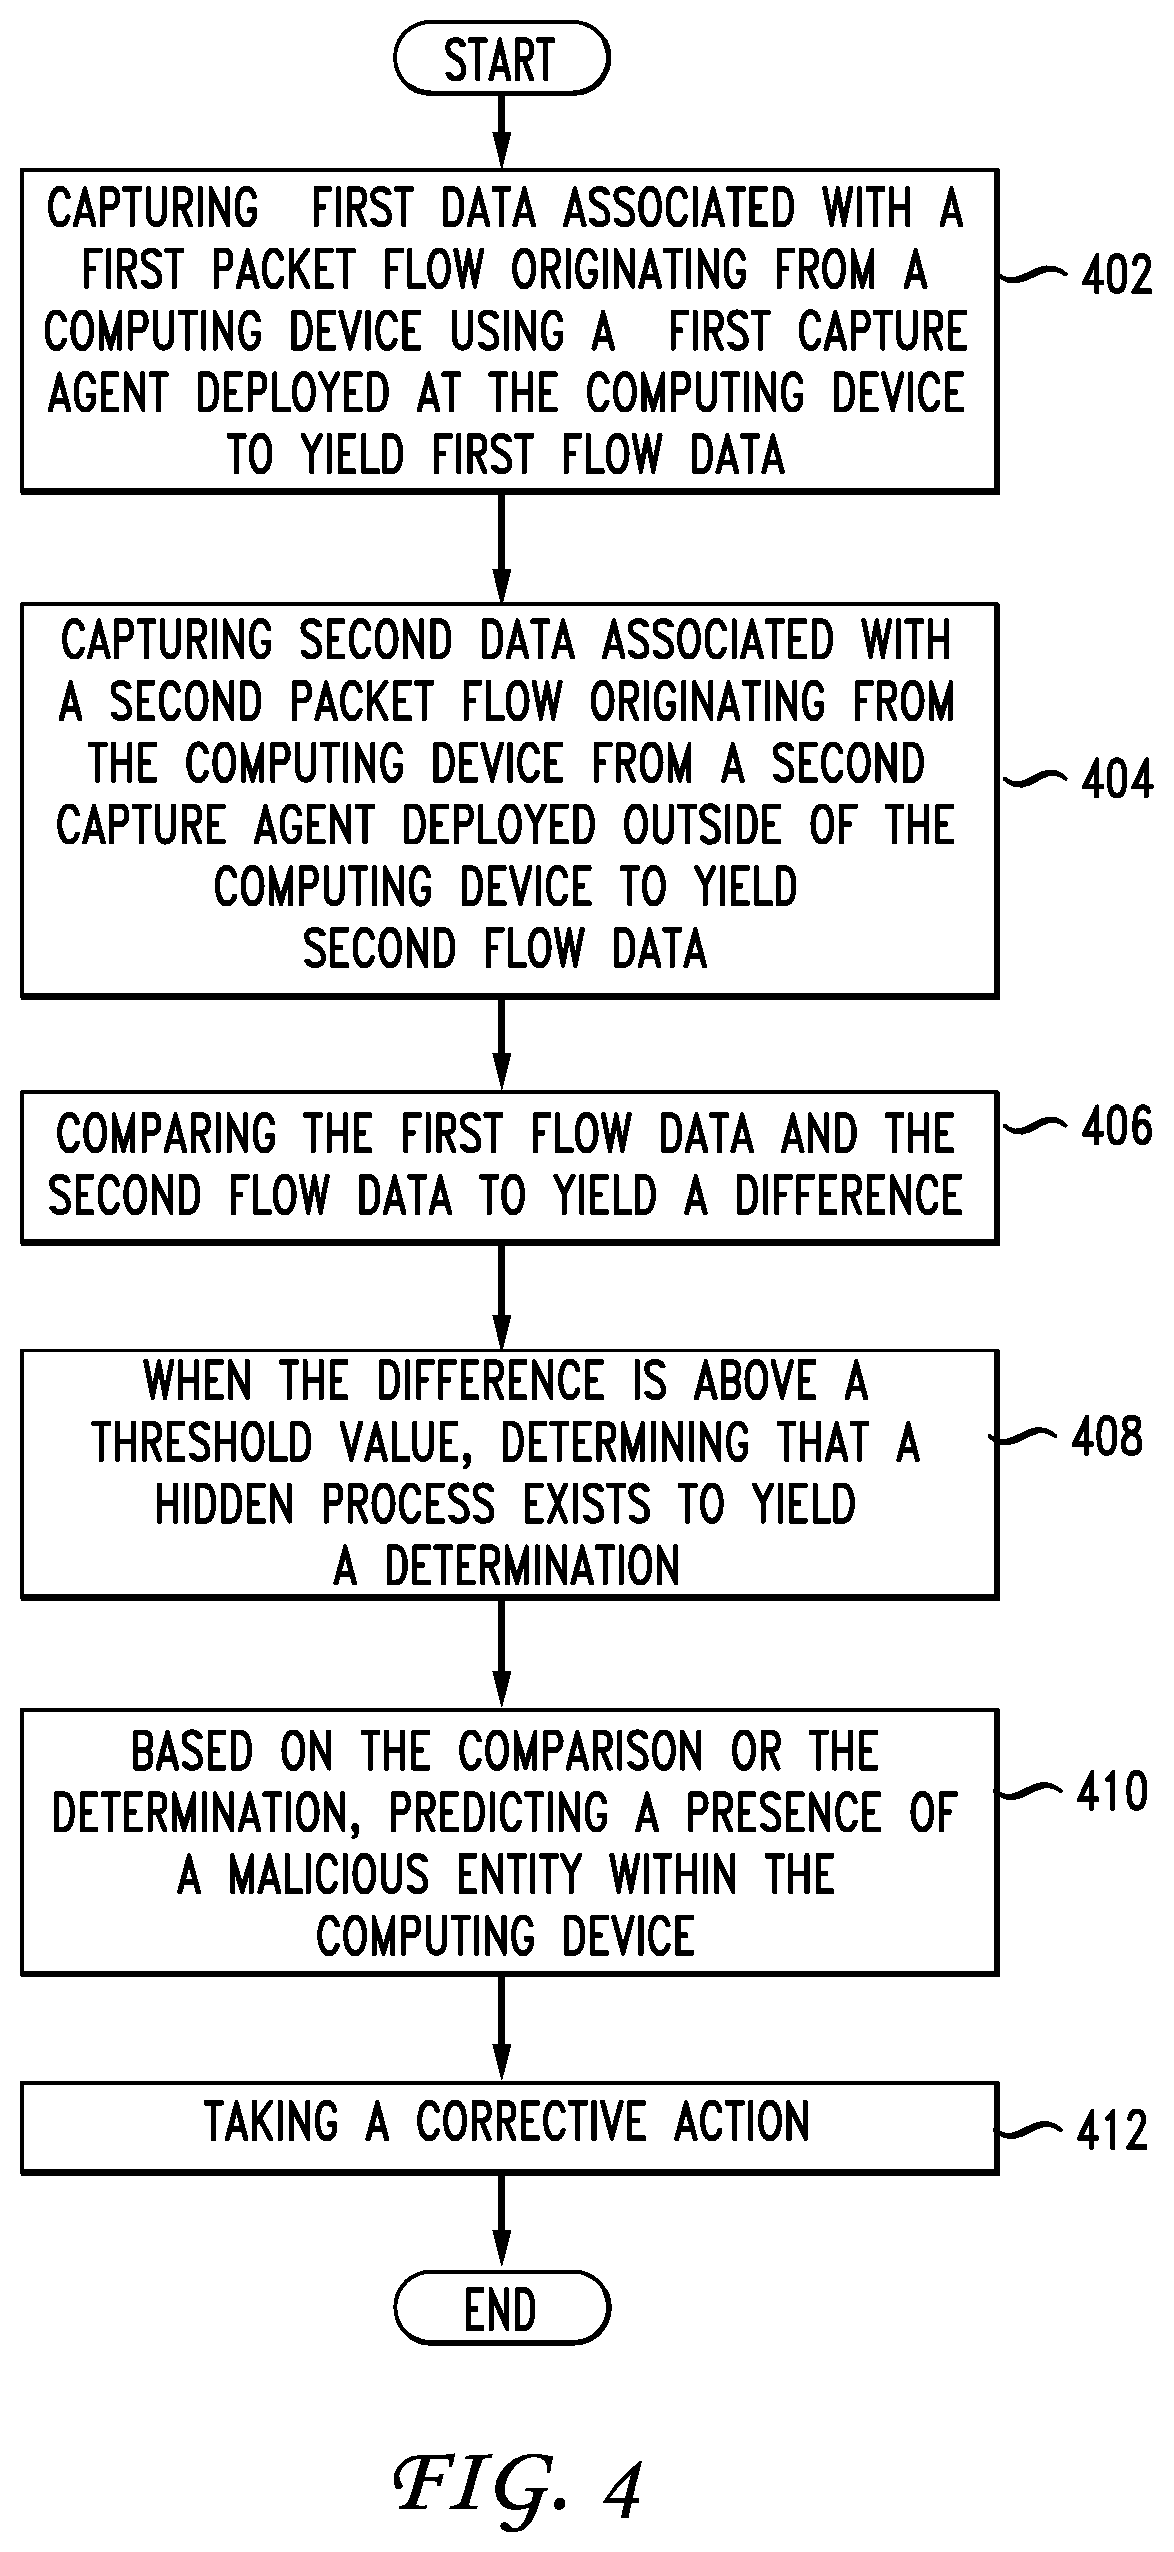
A method includes capturing first data associated with a first packet flow originating from a first host using a first capture agent deployed at the first host to yield first flow data, capturing second data associated with a second packet flow originating from the first host from a second capture agent deployed outside of the first host to yield second flow data and comparing the first flow data and the second flow data to yield a difference. When the difference is above a threshold value, the method includes determining that a hidden process exists and corrective action can be taken.
| Inventors: | Deen; Khawar (Sunnyvale, CA), Yadav; Navindra (Cupertino, CA), Gupta; Anubhav (Sunnyvale, CA), Gandham; Shashidhar (Fremont, CA), Prasad; Rohit Chandra (Sunnyvale, CA), Singh; Abhishek Ranjan (Pleasanton, CA), Chang; Shih-Chun (San Jose, CA) | ||||||||||
|---|---|---|---|---|---|---|---|---|---|---|---|
| Applicant: |
|
||||||||||
| Assignee: | CISCO TECHNOLOGY, INC. (San
Jose, CA) |
||||||||||
| Family ID: | 57451053 | ||||||||||
| Appl. No.: | 15/171,930 | ||||||||||
| Filed: | June 2, 2016 |
Prior Publication Data
| Document Identifier | Publication Date | |
|---|---|---|
| US 20160359879 A1 | Dec 8, 2016 | |
Related U.S. Patent Documents
| Application Number | Filing Date | Patent Number | Issue Date | ||
|---|---|---|---|---|---|
| 62171899 | Jun 5, 2015 | ||||
| Current U.S. Class: | 1/1 |
| Current CPC Class: | H04L 61/2007 (20130101); G06T 11/206 (20130101); H04L 43/04 (20130101); H04L 47/2483 (20130101); H04L 63/1441 (20130101); H04L 63/0263 (20130101); H04L 67/10 (20130101); H04L 43/0888 (20130101); H04L 41/22 (20130101); H04L 67/1002 (20130101); H04L 67/16 (20130101); H04L 69/22 (20130101); G06F 21/53 (20130101); H04L 45/38 (20130101); H04L 45/66 (20130101); H04W 72/08 (20130101); G06F 9/45558 (20130101); H04L 43/02 (20130101); H04L 43/062 (20130101); H04L 43/10 (20130101); H04L 1/242 (20130101); H04L 47/20 (20130101); H04L 43/0841 (20130101); H04L 47/28 (20130101); H04L 63/1433 (20130101); G06F 21/566 (20130101); H04L 43/0829 (20130101); H04L 63/1416 (20130101); H04L 63/145 (20130101); G06F 16/29 (20190101); H04L 63/1466 (20130101); H04L 47/11 (20130101); H04L 63/1425 (20130101); H04L 67/36 (20130101); H04L 43/08 (20130101); H04L 43/0882 (20130101); H04L 63/1408 (20130101); H04L 41/16 (20130101); G06F 3/04842 (20130101); G06F 3/0482 (20130101); G06F 16/2365 (20190101); G06F 16/24578 (20190101); H04L 41/046 (20130101); H04L 43/0876 (20130101); H04J 3/0661 (20130101); H04L 41/12 (20130101); H04L 43/045 (20130101); H04L 69/16 (20130101); H04L 63/0876 (20130101); H04L 45/306 (20130101); H04L 45/74 (20130101); G06F 16/285 (20190101); H04L 41/0816 (20130101); H04L 63/0227 (20130101); H04L 63/16 (20130101); H04L 9/0866 (20130101); H04W 84/18 (20130101); H04L 43/0864 (20130101); H04L 43/12 (20130101); G06F 16/288 (20190101); H04J 3/14 (20130101); H04L 47/2441 (20130101); H04L 63/20 (20130101); H04L 41/0803 (20130101); H04L 41/0893 (20130101); H04L 43/16 (20130101); H04L 9/3242 (20130101); H04L 41/0806 (20130101); H04L 47/31 (20130101); G06F 3/04847 (20130101); G06N 20/00 (20190101); H04L 47/32 (20130101); H04L 63/06 (20130101); G06F 16/248 (20190101); G06F 21/552 (20130101); H04L 67/22 (20130101); G06F 2221/033 (20130101); G06F 2009/45591 (20130101); G06F 2221/2105 (20130101); G06F 2009/45595 (20130101); G06F 2009/4557 (20130101); G06F 2221/2145 (20130101); G06F 2221/2101 (20130101); G06F 2009/45587 (20130101); G06F 2221/2111 (20130101); G06F 2221/2115 (20130101) |
| Current International Class: | H04L 9/00 (20060101); H04J 3/06 (20060101); H04J 3/14 (20060101); H04L 29/12 (20060101); H04L 12/833 (20130101); H04L 12/721 (20130101); G06F 3/0482 (20130101); G06T 11/20 (20060101); H04L 12/841 (20130101); H04L 12/725 (20130101); H04L 12/715 (20130101); G06F 16/16 (20190101); G06F 16/17 (20190101); G06F 16/11 (20190101); G06F 16/13 (20190101); G06N 99/00 (20190101); G06F 16/174 (20190101); G06F 16/23 (20190101); H04L 12/26 (20060101); H04L 29/06 (20060101); G06F 9/455 (20180101); G06N 20/00 (20190101); G06F 16/29 (20190101); G06F 16/248 (20190101); G06F 16/28 (20190101); G06F 16/9535 (20190101); G06F 16/2457 (20190101); G06F 21/55 (20130101); G06F 21/56 (20130101); H04L 12/851 (20130101); H04L 12/24 (20060101); H04W 84/18 (20090101); H04L 12/813 (20130101); H04L 12/823 (20130101); H04L 12/801 (20130101); H04L 12/741 (20130101); H04L 29/08 (20060101); G06F 21/53 (20130101); H04L 12/723 (20130101); G06F 3/0484 (20130101); H04L 1/24 (20060101); H04W 72/08 (20090101); H04L 9/08 (20060101); H04L 9/32 (20060101) |
References Cited [Referenced By]
U.S. Patent Documents
| 5086385 | February 1992 | Launey et al. |
| 5319754 | June 1994 | Meinecke et al. |
| 5400246 | March 1995 | Wilson et al. |
| 5436909 | July 1995 | Dev et al. |
| 5555416 | September 1996 | Owens et al. |
| 5726644 | March 1998 | Jednacz et al. |
| 5742829 | April 1998 | Davis et al. |
| 5831848 | November 1998 | Rielly et al. |
| 5903545 | May 1999 | Sabourin et al. |
| 6012096 | January 2000 | Link et al. |
| 6141595 | October 2000 | Gloudeman et al. |
| 6144962 | November 2000 | Weinberg et al. |
| 6239699 | May 2001 | Ronnen |
| 6247058 | June 2001 | Miller et al. |
| 6249241 | June 2001 | Jordan et al. |
| 6330562 | December 2001 | Boden et al. |
| 6353775 | March 2002 | Nichols |
| 6525658 | February 2003 | Streetman et al. |
| 6611896 | August 2003 | Mason, Jr. et al. |
| 6654750 | November 2003 | Adams et al. |
| 6728779 | April 2004 | Griffin et al. |
| 6801878 | October 2004 | Hintz et al. |
| 6816461 | November 2004 | Scrandis et al. |
| 6847993 | January 2005 | Novaes et al. |
| 6848106 | January 2005 | Hipp |
| 6925490 | August 2005 | Novaes et al. |
| 6958998 | October 2005 | Shorey |
| 6983323 | January 2006 | Cantrell et al. |
| 6996817 | February 2006 | Birum et al. |
| 6999452 | February 2006 | Drummond-Murray et al. |
| 7002464 | February 2006 | Bruemmer et al. |
| 7111055 | September 2006 | Falkner |
| 7120934 | October 2006 | Ishikawa |
| 7181769 | February 2007 | Keanini et al. |
| 7185103 | February 2007 | Jain |
| 7203740 | April 2007 | Putzolu et al. |
| 7302487 | November 2007 | Ylonen et al. |
| 7349761 | March 2008 | Cruse |
| 7353511 | April 2008 | Ziese |
| 7356679 | April 2008 | Le et al. |
| 7360072 | April 2008 | Soltis et al. |
| 7370092 | May 2008 | Aderton et al. |
| 7395195 | July 2008 | Suenbuel et al. |
| 7444404 | October 2008 | Wetherall et al. |
| 7466681 | December 2008 | Ashwood-Smith et al. |
| 7467205 | December 2008 | Dempster et al. |
| 7496040 | February 2009 | Seo |
| 7496575 | February 2009 | Buccella et al. |
| 7530105 | May 2009 | Gilbert et al. |
| 7539770 | May 2009 | Meier |
| 7568107 | July 2009 | Rathi et al. |
| 7610330 | October 2009 | Quinn et al. |
| 7633942 | December 2009 | Bearden et al. |
| 7644438 | January 2010 | Dash et al. |
| 7676570 | March 2010 | Levy et al. |
| 7681131 | March 2010 | Quarterman et al. |
| 7693947 | April 2010 | Judge et al. |
| 7743242 | June 2010 | Oberhaus et al. |
| 7752307 | July 2010 | Takara |
| 7783457 | August 2010 | Cunningham |
| 7787480 | August 2010 | Mehta et al. |
| 7788477 | August 2010 | Huang et al. |
| 7844696 | November 2010 | Labovitz et al. |
| 7844744 | November 2010 | Abercrombie et al. |
| 7864707 | January 2011 | Dimitropoulos et al. |
| 7873025 | January 2011 | Patel et al. |
| 7873074 | January 2011 | Boland |
| 7874001 | January 2011 | Beck et al. |
| 7885197 | February 2011 | Metzler |
| 7895649 | February 2011 | Brook et al. |
| 7904420 | March 2011 | Ianni |
| 7930752 | April 2011 | Hertzog et al. |
| 7934248 | April 2011 | Yehuda et al. |
| 7957934 | June 2011 | Greifeneder |
| 7961637 | June 2011 | McBeath |
| 7970946 | June 2011 | Djabarov et al. |
| 7975035 | July 2011 | Popescu et al. |
| 8005935 | August 2011 | Pradhan et al. |
| 8040232 | October 2011 | Oh et al. |
| 8040822 | October 2011 | Proulx et al. |
| 8115617 | February 2012 | Thubert et al. |
| 8135657 | March 2012 | Kapoor et al. |
| 8156430 | April 2012 | Newman |
| 8160063 | April 2012 | Maltz et al. |
| 8179809 | May 2012 | Eppstein et al. |
| 8185824 | May 2012 | Mitchell et al. |
| 8250657 | August 2012 | Nachenberg et al. |
| 8255972 | August 2012 | Azagury et al. |
| 8266697 | September 2012 | Coffman |
| 8281397 | October 2012 | Vaidyanathan et al. |
| 8291495 | October 2012 | Burns et al. |
| 8296847 | October 2012 | Mendonca et al. |
| 8370407 | February 2013 | Devarajan et al. |
| 8381289 | February 2013 | Pereira et al. |
| 8391270 | March 2013 | Van Der Stok et al. |
| 8407164 | March 2013 | Malik et al. |
| 8442073 | May 2013 | Skubacz et al. |
| 8451731 | May 2013 | Lee et al. |
| 8462212 | June 2013 | Kundu et al. |
| 8489765 | July 2013 | Vasseur et al. |
| 8516590 | August 2013 | Ranadive et al. |
| 8527977 | September 2013 | Cheng et al. |
| 8570861 | October 2013 | Brandwine et al. |
| 8572600 | October 2013 | Chung et al. |
| 8572734 | October 2013 | McConnell et al. |
| 8572735 | October 2013 | Ghosh et al. |
| 8588081 | November 2013 | Salam et al. |
| 8600726 | December 2013 | Varshney et al. |
| 8615803 | December 2013 | Dacier et al. |
| 8630316 | January 2014 | Haba |
| 8640086 | January 2014 | Bonev et al. |
| 8656493 | February 2014 | Capalik |
| 8661544 | February 2014 | Yen et al. |
| 8677487 | March 2014 | Balupari et al. |
| 8683389 | March 2014 | Bar-Yam et al. |
| 8706914 | April 2014 | Duchesneau |
| 8719452 | May 2014 | Ding et al. |
| 8719835 | May 2014 | Kanso et al. |
| 8750287 | June 2014 | Bui et al. |
| 8752042 | June 2014 | Ratica |
| 8755396 | June 2014 | Sindhu et al. |
| 8762951 | June 2014 | Kosche et al. |
| 8769084 | July 2014 | Westerfeld et al. |
| 8775577 | July 2014 | Alford et al. |
| 8776180 | July 2014 | Kumar et al. |
| 8812725 | August 2014 | Kulkarni |
| 8813236 | August 2014 | Saha et al. |
| 8825848 | September 2014 | Dotan et al. |
| 8832013 | September 2014 | Adams et al. |
| 8832461 | September 2014 | Saroiu et al. |
| 8849926 | September 2014 | Marzencki et al. |
| 8881258 | November 2014 | Paul et al. |
| 8887238 | November 2014 | Howard et al. |
| 8904520 | December 2014 | Nachenberg et al. |
| 8908685 | December 2014 | Patel et al. |
| 8914497 | December 2014 | Xiao et al. |
| 8931043 | January 2015 | Cooper et al. |
| 8954610 | February 2015 | Berke et al. |
| 8966021 | February 2015 | Allen |
| 8973147 | March 2015 | Pearcy et al. |
| 8990386 | March 2015 | He et al. |
| 8996695 | March 2015 | Anderson et al. |
| 8997227 | March 2015 | Mhatre et al. |
| 9014047 | April 2015 | Alcala et al. |
| 9015716 | April 2015 | Fletcher et al. |
| 9071575 | June 2015 | Lemaster et al. |
| 9088598 | July 2015 | Zhang et al. |
| 9110905 | August 2015 | Polley et al. |
| 9130836 | September 2015 | Kapadia et al. |
| 9160764 | October 2015 | Stiansen et al. |
| 9178906 | November 2015 | Chen et al. |
| 9197654 | November 2015 | Ben-Shalom et al. |
| 9225793 | December 2015 | Dutta et al. |
| 9237111 | January 2016 | Banavalikar et al. |
| 9246702 | January 2016 | Sharma et al. |
| 9246773 | January 2016 | Degioanni |
| 9253042 | February 2016 | Lumezanu et al. |
| 9258217 | February 2016 | Duffield et al. |
| 9281940 | March 2016 | Matsuda et al. |
| 9286047 | March 2016 | Avramov et al. |
| 9317574 | April 2016 | Brisebois et al. |
| 9319384 | April 2016 | Yan et al. |
| 9369435 | June 2016 | Short et al. |
| 9378068 | June 2016 | Anantharam et al. |
| 9405903 | August 2016 | Xie et al. |
| 9417985 | August 2016 | Baars et al. |
| 9418222 | August 2016 | Rivera et al. |
| 9426068 | August 2016 | Dunbar et al. |
| 9454324 | September 2016 | Madhavapeddi |
| 9462013 | October 2016 | Boss et al. |
| 9465696 | October 2016 | McNeil et al. |
| 9501744 | November 2016 | Brisebois et al. |
| 9531589 | December 2016 | Clemm et al. |
| 9563517 | February 2017 | Natanzon et al. |
| 9634915 | April 2017 | Bley |
| 9645892 | May 2017 | Patwardhan |
| 9684453 | June 2017 | Holt et al. |
| 9697033 | July 2017 | Koponen et al. |
| 9733973 | August 2017 | Prasad et al. |
| 9749145 | August 2017 | Banavalikar et al. |
| 9800608 | October 2017 | Korsunsky et al. |
| 9904584 | February 2018 | Konig et al. |
| 2001/0028646 | October 2001 | Arts et al. |
| 2002/0053033 | May 2002 | Cooper et al. |
| 2002/0097687 | July 2002 | Meiri et al. |
| 2002/0103793 | August 2002 | Koller et al. |
| 2002/0107857 | August 2002 | Teraslinna |
| 2002/0141343 | October 2002 | Bays |
| 2002/0184393 | December 2002 | Leddy et al. |
| 2003/0023601 | January 2003 | Fortier, Jr. et al. |
| 2003/0065986 | April 2003 | Fraenkel et al. |
| 2003/0097439 | May 2003 | Strayer et al. |
| 2003/0126242 | July 2003 | Chang |
| 2003/0145232 | July 2003 | Poletto et al. |
| 2003/0151513 | August 2003 | Herrmann et al. |
| 2003/0154399 | August 2003 | Zuk et al. |
| 2003/0177208 | September 2003 | Harvey, IV |
| 2004/0019676 | January 2004 | Iwatsuki et al. |
| 2004/0030776 | February 2004 | Cantrell et al. |
| 2004/0213221 | October 2004 | Civanlar et al. |
| 2004/0243533 | December 2004 | Dempster et al. |
| 2004/0255050 | December 2004 | Takehiro et al. |
| 2004/0268149 | December 2004 | Aaron |
| 2005/0028154 | February 2005 | Smith et al. |
| 2005/0039104 | February 2005 | Shah et al. |
| 2005/0063377 | March 2005 | Bryant et al. |
| 2005/0083933 | April 2005 | Fine et al. |
| 2005/0108331 | May 2005 | Osterman |
| 2005/0166066 | July 2005 | Ahuja et al. |
| 2005/0177829 | August 2005 | Vishwanath |
| 2005/0198247 | September 2005 | Perry et al. |
| 2005/0198371 | September 2005 | Smith et al. |
| 2005/0198629 | September 2005 | Vishwanath |
| 2005/0207376 | September 2005 | Ashwood-Smith et al. |
| 2005/0257244 | November 2005 | Joly et al. |
| 2005/0289244 | December 2005 | Sahu et al. |
| 2006/0048218 | March 2006 | Lingafelt et al. |
| 2006/0077909 | April 2006 | Saleh et al. |
| 2006/0080733 | April 2006 | Khosmood et al. |
| 2006/0095968 | May 2006 | Portolani et al. |
| 2006/0101516 | May 2006 | Sudaharan |
| 2006/0143432 | June 2006 | Rothman et al. |
| 2006/0156408 | July 2006 | Himberger et al. |
| 2006/0159032 | July 2006 | Ukrainetz et al. |
| 2006/0173912 | August 2006 | Lindvall et al. |
| 2006/0195448 | August 2006 | Newport |
| 2006/0272018 | November 2006 | Fouant |
| 2006/0274659 | December 2006 | Ouderkirk |
| 2006/0280179 | December 2006 | Meier |
| 2006/0294219 | December 2006 | Ogawa et al. |
| 2007/0025306 | February 2007 | Cox et al. |
| 2007/0044147 | February 2007 | Choi et al. |
| 2007/0097976 | May 2007 | Wood et al. |
| 2007/0118654 | May 2007 | Jamkhedkar et al. |
| 2007/0127491 | June 2007 | Verzijp et al. |
| 2007/0162420 | July 2007 | Ou et al. |
| 2007/0169179 | July 2007 | Narad |
| 2007/0195729 | August 2007 | Li et al. |
| 2007/0195794 | August 2007 | Fujita et al. |
| 2007/0201474 | August 2007 | Isobe |
| 2007/0211637 | September 2007 | Mitchell |
| 2007/0214348 | September 2007 | Danielsen |
| 2007/0230415 | October 2007 | Malik |
| 2007/0250930 | October 2007 | Aziz et al. |
| 2007/0300061 | December 2007 | Kim et al. |
| 2008/0022385 | January 2008 | Crowell et al. |
| 2008/0046708 | February 2008 | Fitzgerald et al. |
| 2008/0082662 | April 2008 | Danliker et al. |
| 2008/0101234 | May 2008 | Nakil |
| 2008/0120350 | May 2008 | Grabowski et al. |
| 2008/0126534 | May 2008 | Mueller et al. |
| 2008/0155245 | June 2008 | Lipscombe et al. |
| 2008/0250122 | October 2008 | Zsigmond et al. |
| 2008/0270199 | October 2008 | Chess et al. |
| 2008/0295163 | November 2008 | Kang |
| 2008/0301765 | December 2008 | Nicol et al. |
| 2009/0059934 | March 2009 | Aggarwal et al. |
| 2009/0064332 | March 2009 | Porras et al. |
| 2009/0241170 | September 2009 | Kumar et al. |
| 2009/0300180 | December 2009 | Dehaan et al. |
| 2009/0307753 | December 2009 | Dupont et al. |
| 2009/0313373 | December 2009 | Hanna et al. |
| 2009/0313698 | December 2009 | Wahl |
| 2009/0328219 | December 2009 | Narayanaswamy |
| 2010/0005288 | January 2010 | Rao et al. |
| 2010/0049839 | February 2010 | Parker et al. |
| 2010/0077445 | March 2010 | Schneider et al. |
| 2010/0095293 | April 2010 | O'Neill et al. |
| 2010/0095367 | April 2010 | Narayanaswamy |
| 2010/0095377 | April 2010 | Krywaniuk |
| 2010/0138526 | June 2010 | DeHaan et al. |
| 2010/0138810 | June 2010 | Komatsu et al. |
| 2010/0148940 | June 2010 | Gelvin et al. |
| 2010/0153316 | June 2010 | Duffield et al. |
| 2010/0153696 | June 2010 | Beachem et al. |
| 2010/0157809 | June 2010 | Duffield |
| 2010/0180016 | July 2010 | Bugwadia et al. |
| 2010/0220584 | September 2010 | DeHaan et al. |
| 2010/0235514 | September 2010 | Beachem |
| 2010/0235879 | September 2010 | Burnside et al. |
| 2010/0235915 | September 2010 | Memon et al. |
| 2010/0287266 | November 2010 | Asati et al. |
| 2010/0303240 | December 2010 | Beachem |
| 2010/0319060 | December 2010 | Aiken et al. |
| 2011/0010585 | January 2011 | Bugenhagen et al. |
| 2011/0022641 | January 2011 | Werth et al. |
| 2011/0055381 | March 2011 | Narasimhan et al. |
| 2011/0055388 | March 2011 | Yumerefendi et al. |
| 2011/0066719 | March 2011 | Miryanov et al. |
| 2011/0069685 | March 2011 | Tofighbakhsh |
| 2011/0083125 | April 2011 | Komatsu et al. |
| 2011/0103259 | May 2011 | Aybay et al. |
| 2011/0107074 | May 2011 | Chan et al. |
| 2011/0107331 | May 2011 | Evans et al. |
| 2011/0126136 | May 2011 | Abella et al. |
| 2011/0126275 | May 2011 | Anderson et al. |
| 2011/0145885 | June 2011 | Rivers et al. |
| 2011/0153811 | June 2011 | Jeong et al. |
| 2011/0158088 | June 2011 | Lofstrand et al. |
| 2011/0170860 | July 2011 | Smith et al. |
| 2011/0173490 | July 2011 | Narayanaswamy et al. |
| 2011/0185423 | July 2011 | Sallam |
| 2011/0196957 | August 2011 | Ayachitula et al. |
| 2011/0202655 | August 2011 | Sharma et al. |
| 2011/0214174 | September 2011 | Herzog et al. |
| 2011/0225207 | September 2011 | Subramanian et al. |
| 2011/0228696 | September 2011 | Agarwal et al. |
| 2011/0246663 | October 2011 | Melsen et al. |
| 2011/0277034 | November 2011 | Hanson |
| 2011/0302652 | December 2011 | Westerfeld |
| 2011/0314148 | December 2011 | Petersen et al. |
| 2012/0005542 | January 2012 | Petersen et al. |
| 2012/0079592 | March 2012 | Pandrangi |
| 2012/0089664 | April 2012 | Igelka |
| 2012/0102361 | April 2012 | Sass et al. |
| 2012/0102543 | April 2012 | Kohli et al. |
| 2012/0117226 | May 2012 | Tanaka et al. |
| 2012/0136996 | May 2012 | Seo et al. |
| 2012/0137278 | May 2012 | Draper et al. |
| 2012/0137361 | May 2012 | Yi et al. |
| 2012/0140626 | June 2012 | Anand et al. |
| 2012/0195198 | August 2012 | Regan |
| 2012/0197856 | August 2012 | Banka et al. |
| 2012/0198541 | August 2012 | Reeves |
| 2012/0216271 | August 2012 | Cooper et al. |
| 2012/0218989 | August 2012 | Tanabe et al. |
| 2012/0219004 | August 2012 | Balus et al. |
| 2012/0233348 | September 2012 | Winters |
| 2012/0233473 | September 2012 | Vasseur et al. |
| 2012/0240232 | September 2012 | Azuma |
| 2012/0246303 | September 2012 | Petersen et al. |
| 2012/0254109 | October 2012 | Shukla et al. |
| 2012/0260227 | October 2012 | Shukla et al. |
| 2012/0278021 | November 2012 | Lin et al. |
| 2012/0281700 | November 2012 | Koganti et al. |
| 2013/0003538 | January 2013 | Greenburg et al. |
| 2013/0003733 | January 2013 | Venkatesan et al. |
| 2013/0006935 | January 2013 | Grisby |
| 2013/0007435 | January 2013 | Bayani |
| 2013/0038358 | February 2013 | Cook et al. |
| 2013/0086272 | April 2013 | Chen et al. |
| 2013/0103827 | April 2013 | Dunlap et al. |
| 2013/0107709 | May 2013 | Campbell et al. |
| 2013/0124807 | May 2013 | Nielsen et al. |
| 2013/0125107 | May 2013 | Bandakka et al. |
| 2013/0145099 | June 2013 | Liu et al. |
| 2013/0148663 | June 2013 | Xiong |
| 2013/0159999 | June 2013 | Chiueh et al. |
| 2013/0174256 | July 2013 | Powers |
| 2013/0179487 | July 2013 | Lubetzky et al. |
| 2013/0179879 | July 2013 | Zhang et al. |
| 2013/0198839 | August 2013 | Wei et al. |
| 2013/0201986 | August 2013 | Sajassi et al. |
| 2013/0205293 | August 2013 | Levijarvi et al. |
| 2013/0219161 | August 2013 | Fontignie et al. |
| 2013/0232498 | September 2013 | Mangtani et al. |
| 2013/0242999 | September 2013 | Kamble et al. |
| 2013/0246925 | September 2013 | Ahuja et al. |
| 2013/0247201 | September 2013 | Alperovitch et al. |
| 2013/0254879 | September 2013 | Chesla et al. |
| 2013/0268994 | October 2013 | Cooper et al. |
| 2013/0275579 | October 2013 | Hernandez et al. |
| 2013/0283374 | October 2013 | Zisapel et al. |
| 2013/0290521 | October 2013 | Labovitz |
| 2013/0297771 | November 2013 | Osterloh et al. |
| 2013/0301472 | November 2013 | Allan |
| 2013/0304900 | November 2013 | Trabelsi et al. |
| 2013/0305369 | November 2013 | Karta et al. |
| 2013/0318357 | November 2013 | Abraham et al. |
| 2013/0326623 | December 2013 | Kruglick |
| 2013/0333029 | December 2013 | Chesla et al. |
| 2013/0336164 | December 2013 | Yang et al. |
| 2013/0346736 | December 2013 | Cook et al. |
| 2013/0347103 | December 2013 | Veteikis et al. |
| 2014/0006610 | January 2014 | Formby et al. |
| 2014/0006871 | January 2014 | Lakshmanan et al. |
| 2014/0012814 | January 2014 | Bercovici et al. |
| 2014/0019972 | January 2014 | Yahalom et al. |
| 2014/0033193 | January 2014 | Palaniappan |
| 2014/0040343 | February 2014 | Nickolov et al. |
| 2014/0047185 | February 2014 | Peterson et al. |
| 2014/0047372 | February 2014 | Gnezdov et al. |
| 2014/0059200 | February 2014 | Nguyen et al. |
| 2014/0074946 | March 2014 | Dirstine et al. |
| 2014/0089494 | March 2014 | Dasari et al. |
| 2014/0092884 | April 2014 | Murphy et al. |
| 2014/0096058 | April 2014 | Molesky et al. |
| 2014/0105029 | April 2014 | Jain et al. |
| 2014/0115219 | April 2014 | Ajanovic et al. |
| 2014/0137109 | May 2014 | Sharma et al. |
| 2014/0140244 | May 2014 | Kapadia et al. |
| 2014/0143825 | May 2014 | Behrendt et al. |
| 2014/0149490 | May 2014 | Luxenberg et al. |
| 2014/0156814 | June 2014 | Barabash et al. |
| 2014/0156861 | June 2014 | Cruz-Aguilar et al. |
| 2014/0164607 | June 2014 | Bai et al. |
| 2014/0165200 | June 2014 | Singla |
| 2014/0173623 | June 2014 | Chang et al. |
| 2014/0192639 | July 2014 | Smirnov |
| 2014/0201717 | July 2014 | Mascaro et al. |
| 2014/0215573 | July 2014 | Cepuran |
| 2014/0215621 | July 2014 | Xaypanya et al. |
| 2014/0280499 | September 2014 | Basavaiah et al. |
| 2014/0281030 | September 2014 | Cui et al. |
| 2014/0286354 | September 2014 | Van De Poel et al. |
| 2014/0289854 | September 2014 | Mahvi |
| 2014/0298461 | October 2014 | Hohndel et al. |
| 2014/0317278 | October 2014 | Kersch et al. |
| 2014/0317737 | October 2014 | Shin et al. |
| 2014/0331276 | November 2014 | Frascadore et al. |
| 2014/0331280 | November 2014 | Porras et al. |
| 2014/0331304 | November 2014 | Wong |
| 2014/0351203 | November 2014 | Kunnatur et al. |
| 2014/0351415 | November 2014 | Harrigan et al. |
| 2014/0359695 | December 2014 | Chari et al. |
| 2015/0006714 | January 2015 | Jain |
| 2015/0009840 | January 2015 | Pruthi et al. |
| 2015/0033305 | January 2015 | Shear et al. |
| 2015/0036480 | February 2015 | Huang et al. |
| 2015/0036533 | February 2015 | Sodhi et al. |
| 2015/0039751 | February 2015 | Harrigan et al. |
| 2015/0046882 | February 2015 | Menyhart et al. |
| 2015/0058976 | February 2015 | Carney et al. |
| 2015/0067143 | March 2015 | Babakhan et al. |
| 2015/0082151 | March 2015 | Liang et al. |
| 2015/0085665 | March 2015 | Kompella et al. |
| 2015/0095332 | April 2015 | Beisiegel et al. |
| 2015/0112933 | April 2015 | Satapathy |
| 2015/0113133 | April 2015 | Srinivas et al. |
| 2015/0124608 | May 2015 | Agarwal et al. |
| 2015/0138993 | May 2015 | Forster et al. |
| 2015/0142962 | May 2015 | Srinivas et al. |
| 2015/0195291 | July 2015 | Zuk et al. |
| 2015/0222939 | August 2015 | Gallant et al. |
| 2015/0249622 | September 2015 | Phillips et al. |
| 2015/0256555 | September 2015 | Choi et al. |
| 2015/0261842 | September 2015 | Huang et al. |
| 2015/0261886 | September 2015 | Wu et al. |
| 2015/0271008 | September 2015 | Jain et al. |
| 2015/0271255 | September 2015 | Mackay et al. |
| 2015/0295945 | October 2015 | Canzanese, Jr. et al. |
| 2015/0347554 | December 2015 | Vasantham et al. |
| 2015/0358352 | December 2015 | Chasin et al. |
| 2016/0006753 | January 2016 | McDaid |
| 2016/0019030 | January 2016 | Shukla et al. |
| 2016/0021131 | January 2016 | Heilig |
| 2016/0026552 | January 2016 | Holden et al. |
| 2016/0036636 | February 2016 | Erickson et al. |
| 2016/0036837 | February 2016 | Jain et al. |
| 2016/0050132 | February 2016 | Zhang et al. |
| 2016/0072815 | March 2016 | Rieke et al. |
| 2016/0080414 | March 2016 | Kolton et al. |
| 2016/0087861 | March 2016 | Kuan et al. |
| 2016/0094394 | March 2016 | Sharma et al. |
| 2016/0103692 | April 2016 | Guntaka et al. |
| 2016/0105350 | April 2016 | Greifeneder et al. |
| 2016/0112284 | April 2016 | Pon et al. |
| 2016/0119234 | April 2016 | Valencia Lopez et al. |
| 2016/0127395 | May 2016 | Underwood et al. |
| 2016/0162308 | June 2016 | Chen et al. |
| 2016/0162312 | June 2016 | Doherty et al. |
| 2016/0173446 | June 2016 | Nantel |
| 2016/0173535 | June 2016 | Barabash et al. |
| 2016/0205002 | July 2016 | Rieke et al. |
| 2016/0216994 | July 2016 | Sefidcon et al. |
| 2016/0217022 | July 2016 | Velipasaoglu et al. |
| 2016/0218933 | July 2016 | Porras |
| 2016/0269442 | September 2016 | Shieh |
| 2016/0269482 | September 2016 | Jamjoom et al. |
| 2016/0294691 | October 2016 | Joshi |
| 2016/0308908 | October 2016 | Kirby et al. |
| 2016/0337204 | November 2016 | Dubey et al. |
| 2016/0357424 | December 2016 | Pang et al. |
| 2016/0357546 | December 2016 | Chang et al. |
| 2016/0357587 | December 2016 | Yadav et al. |
| 2016/0357957 | December 2016 | Deen et al. |
| 2016/0359592 | December 2016 | Kulshreshtha et al. |
| 2016/0359628 | December 2016 | Singh et al. |
| 2016/0359658 | December 2016 | Yadav et al. |
| 2016/0359673 | December 2016 | Gupta et al. |
| 2016/0359677 | December 2016 | Kulshreshtha et al. |
| 2016/0359678 | December 2016 | Madani et al. |
| 2016/0359679 | December 2016 | Parasdehgheibi et al. |
| 2016/0359680 | December 2016 | Parasdehgheibi et al. |
| 2016/0359686 | December 2016 | Parasdehgheibi et al. |
| 2016/0359695 | December 2016 | Yadav et al. |
| 2016/0359696 | December 2016 | Yadav et al. |
| 2016/0359697 | December 2016 | Scheib et al. |
| 2016/0359698 | December 2016 | Deen et al. |
| 2016/0359699 | December 2016 | Gandham et al. |
| 2016/0359700 | December 2016 | Pang et al. |
| 2016/0359701 | December 2016 | Pang et al. |
| 2016/0359703 | December 2016 | Gandham et al. |
| 2016/0359704 | December 2016 | Gandham et al. |
| 2016/0359705 | December 2016 | Parasdehgheibi et al. |
| 2016/0359708 | December 2016 | Gandham et al. |
| 2016/0359709 | December 2016 | Deen et al. |
| 2016/0359711 | December 2016 | Deen et al. |
| 2016/0359712 | December 2016 | Alizadeh Attar et al. |
| 2016/0359740 | December 2016 | Parasdehgheibi et al. |
| 2016/0359759 | December 2016 | Singh et al. |
| 2016/0359872 | December 2016 | Yadav et al. |
| 2016/0359877 | December 2016 | Kulshreshtha et al. |
| 2016/0359878 | December 2016 | Prasad et al. |
| 2016/0359880 | December 2016 | Pang et al. |
| 2016/0359881 | December 2016 | Yadav et al. |
| 2016/0359888 | December 2016 | Gupta et al. |
| 2016/0359889 | December 2016 | Yadav et al. |
| 2016/0359890 | December 2016 | Deen et al. |
| 2016/0359891 | December 2016 | Pang et al. |
| 2016/0359897 | December 2016 | Yadav et al. |
| 2016/0359905 | December 2016 | Touboul et al. |
| 2016/0359912 | December 2016 | Gupta et al. |
| 2016/0359913 | December 2016 | Gupta et al. |
| 2016/0359914 | December 2016 | Deen et al. |
| 2016/0359915 | December 2016 | Gupta et al. |
| 2016/0359917 | December 2016 | Rao et al. |
| 2016/0373481 | December 2016 | Sultan et al. |
| 2017/0024453 | January 2017 | Raja et al. |
| 2017/0034018 | February 2017 | Parasdehgheibi et al. |
| 2017/0048121 | February 2017 | Hobbs et al. |
| 2017/0070582 | March 2017 | Desai et al. |
| 2017/0085483 | March 2017 | Mihaly et al. |
| 2017/0208487 | July 2017 | Ratakonda et al. |
| 2017/0250880 | August 2017 | Akens et al. |
| 2017/0250951 | August 2017 | Wang et al. |
| 2017/0289067 | October 2017 | Lu et al. |
| 2017/0295141 | October 2017 | Thubert et al. |
| 2017/0302691 | October 2017 | Singh et al. |
| 2017/0331747 | November 2017 | Singh et al. |
| 2017/0346736 | November 2017 | Chander et al. |
| 2017/0364380 | December 2017 | Frye, Jr. et al. |
| 2018/0006911 | January 2018 | Dickey |
| 2018/0007115 | January 2018 | Nedeltchev et al. |
| 2018/0013670 | January 2018 | Kapadia et al. |
| 2018/0145906 | May 2018 | Yadav et al. |
| 101093452 | Dec 2007 | CN | |||
| 101770551 | Jul 2010 | CN | |||
| 102521537 | Jun 2012 | CN | |||
| 103023970 | Apr 2013 | CN | |||
| 103716137 | Apr 2014 | CN | |||
| 104065518 | Sep 2014 | CN | |||
| 107196807 | Sep 2017 | CN | |||
| 0811942 | Dec 1997 | EP | |||
| 1076848 | Jul 2002 | EP | |||
| 1383261 | Jan 2004 | EP | |||
| 1450511 | Aug 2004 | EP | |||
| 2045974 | Apr 2008 | EP | |||
| 2043320 | Apr 2009 | EP | |||
| 2860912 | Apr 2015 | EP | |||
| 2887595 | Jun 2015 | EP | |||
| 2009-016906 | Jan 2009 | JP | |||
| 1394338 | May 2014 | KR | |||
| WO 2007/014314 | Feb 2007 | WO | |||
| WO 2007/070711 | Jun 2007 | WO | |||
| WO 2008/069439 | Jun 2008 | WO | |||
| WO 2013/030830 | Mar 2013 | WO | |||
| WO 2015/042171 | Mar 2015 | WO | |||
| WO 2016/004075 | Jan 2016 | WO | |||
| WO 2016/019523 | Feb 2016 | WO | |||
Other References
|
Bosch, Greg, "Virtualization," 2010, 33 pages. cited by applicant . Breen, Christopher, "MAC 911, How to dismiss Mac App Store Notifications," Macworld.com, Mar. 24, 2014, 3 pages. cited by applicant . Chou, C.W., et al., "Optical Clocks and Relativity," Science vol. 329, Sep. 24, 2010, pp. 1630-1633. cited by applicant . Huang, Hing-Jie, et al., "Clock Skew Based Node Identification in Wireless Sensor Networks," IEEE, 2008, 5 pages. cited by applicant . Ives, Herbert, E., et al., "An Experimental Study of the Rate of a Moving Atomic Clock," Journal of the Optical Society of America, vol. 28, No. 7, Jul. 1938, pp. 215-226. cited by applicant . Witze, Alexandra, "Special relativity aces time trial, `Time dilation` predicted by Einstein confirmed by lithium ion experiment," Nature, Sep. 19, 2014, 3 pages. cited by applicant . Zatrochova, Zuzana, "Analysis and Testing of Distributed NoSQL Datastore Riak," Spring, 2015, 76 pages. cited by applicant . Australian Government Department of Defence, Intelligence and Security, "Top 4 Strategies to Mitigate Targeted Cyber Intrusions," Cyber Security Operations Centre Jul. 2013, http://www.asd.gov.au/infosec/top-mitigations/top-4-strategies-explained.- htm. cited by applicant . Author Unknown, "Blacklists & Dynamic Reputation: Understanding Why the Evolving Threat Eludes Blacklists," www.dambaia.com, 9 pages, Dambala, Atlanta, GA, USA. cited by applicant . Aydin, Galip, et al., "Architecture and Implementation of a Scalable Sensor Data Storage and Analysis Using Cloud Computing and Big Data Technologies," Journal of Sensors, vol. 2015, Article ID 834217, Feb. 2015, 11 pages. cited by applicant . Backes, Michael, et al., "Data Lineage in Malicious Environments," IEEE 2015, pp. 1-13. cited by applicant . Bayati, Mohsen, et al., "Message-Passing Algorithms for Sparse Network Alignment," Mar. 2013, 31 pages. cited by applicant . Berezinski, Przemyslaw, et al., "An Entropy-Based Network Anomaly Detection Method," Entropy, 2015, vol. 17, www.mdpi.com/joumal/entropy, pp. 2367-2408. cited by applicant . Berthier, Robin, et al. "Nfsight: Netflow-based Network Awareness Tool," 2010, 16 pages. cited by applicant . Bhuyan, Dhiraj, "Fighting Bots and Botnets," 2006, pp. 23-28. cited by applicant . Blair, Dana, et al., U.S. Appl. No. 62/106,006, tiled Jan. 21, 2015, entitled "Monitoring Network Policy Compliance." cited by applicant . Chandran, Midhun, et al., "Monitoring in a Virtualized Environment," GSTF International Journal on Computing, vol. 1, No. 1, Aug. 2010. cited by applicant . Chari, Suresh, et al., "Ensuring continuous compliance through reconciling policy with usage," Proceedings of the 18.sup.th ACM symposium on Access control models and technologies (SACMAT '13). ACM, New York, NY, USA, 49-60. cited by applicant . Chen, Xu, et al., "Automating network application dependency discovery: experiences, limitations, and new solutions," 8th USENIX conference on Operating systems design and implementation (OSDI'08), USENIX Association, Berkeley, CA, USA, 117-130. cited by applicant . Cisco Systems, "Cisco Network Analysis Modules (NAM) Tutorial," Cisco Systems, Inc., Version 3.5. cited by applicant . Cisco Systems, Inc., "Addressing Compliance from One Infrastructure: Cisco Unified Compliance Solution Framework," 2014. cited by applicant . Cisco Systems, Inc., "Cisco Application Dependency Mapping Service," 2009. cited by applicant . Cisco Systems, Inc., "White Paper--New Cisco Technologies Help Customers Achieve Regulatory Compliance," 1992-2008. cited by applicant . Cisco Systems, Inc., "A Cisco Guide to Defending Against Distributed Denial of Service Attacks," May 3, 2016, 34 pages. cited by applicant . Cisco Technology, Inc., "Cisco Lock-and-Key:Dynamic Access Lists," http://www/cisco.com/c/en/us/support/docs/security-vpn/lock-key/7604-13.h- tml; Updated Jul. 12, 2006, 16 pages. cited by applicant . Di Lorenzo, Guisy, et al., "EXSED: An Intelligent Tool for Exploration of Social Events Dynamics from Augmented Trajectories," Mobile Data Management (MDM), pp. 323-330, Jun. 3-6, 2013. cited by applicant . Feinstein, Laura, et al., "Statistical Approaches to DDoS Attack Detection and Response," Proceedings of the DARPA Information Survivability Conference and Exposition (DISCEX '03), Apr. 2003, 12 pages. cited by applicant . George, Ashley, et al., "NetPal: A Dynamic Network Administration Knowledge Base," 2008, pp. 1-14. cited by applicant . Goldsteen, Abigail, et al., "A Tool for Monitoring and Maintaining System Trustworthiness at Run Time," REFSQ (2015), pp. 142-147. cited by applicant . Hamadi, S., et al., "Fast Path Acceleration for Open vSwitch in Overlay Networks," Global Information Infrastructure and Networking Symposium (GIIS), Montreal, QC, pp. 1-5, Sep. 15-19, 2014. cited by applicant . Hewlett-Packard, "Effective use of reputation intelligence in a security operations center," Jul. 2013, 6 pages. cited by applicant . Hideshima, Yusuke, et al., "STARMINE: A Visualization System for Cyber Attacks," https://www.researchgate.net/publication/221536306, Feb. 2006, 9 pages. cited by applicant . InternetPerils, Inc., "Control Your Internet Business Risk," 2003-2015, https://www.internetperils.com. cited by applicant . Janoff, Christian, et al., "Cisco Compliance Solution for HIPAA Security Rule Design and Implementation Guide," Cisco Systems, Inc., Updated Nov. 14, 2015, part 1 of 2, 350 pages. cited by applicant . Janoff, Christian, et al., "Cisco Compliance Solution for HIPAA Security Rule Design and Implementation Guide," Cisco Systems, Inc., Updated Nov. 14, 2015, part 2 of 2, 588 pages. cited by applicant . Kerrison, Adam, et al., "Four Steps to Faster, Better Application Dependency Mapping--Laying the Foundation for Effective Business Service Models," BMCSoftware, 2011. cited by applicant . Kraemer, Brian, "Get to know your data center with CMDB," TechTarget, Apr. 5, 2006, http://searchdatacenter.techtarget.com/news/118820/Get-to-know-y- our-data-center-with-CMDB. cited by applicant . Lab Sku, "VMware Hands-on Labs--HOL-SDC-1301" Version: Mar. 21, 2014-160709, 2013; http://docs.hol.vmware.com/HOL-2013/holsdc-1301_html_en/ (part 1 of 2). cited by applicant . Lab SKU, "VMware Hands-on Labs--HOL-SDC-1301" Version: Mar. 21, 2014-160709, 2013; http://docs.hol.vmware.com/HOL-2013/holsdc-1301_html_en/ (part 2 of 2). cited by applicant . Lachance, Michael, "Dirty Little Secrets of Application Dependency Mapping," Dec. 26, 2007. cited by applicant . Landman, Yoav, et al., "Dependency Analyzer," Feb. 14, 2008, http://jfrog.com/confluence/display/DA/Home. cited by applicant . Lee, Sihyung, "Reducing Complexity of Large-Scale Network Configuration Management," Ph.D. Dissertation, Carniege Mellon University, 2010. cited by applicant . Li, Ang, et al., "Fast Anomaly Detection for Large Data Centers," Global Telecommunications Conference (GLOBECOM 2010, Dec. 2010, 6 pages. cited by applicant . Li, Bingbong, et al, "A Supervised Machine Learning Approach to Classify Host Roles on Line Using sFlow," in Proceedings of the first edition workshop on High performance and programmable networking, 2013, ACM, New York, NY, USA, 53-60. cited by applicant . Liu, Ting, et al., "Impala: A Middleware System for Managing Autonomic, Parallel Sensor Systems," In Proceedings of the Ninth ACM SIGPLAN Symposium on Principles and Practice of Parallel Programming(PPoPP '03), ACM, New York, NY, USA, Jun. 11-13, 2003, pp. 107-118. cited by applicant . Lu, Zhonghai, et al., "Cluster-based Simulated Annealing for Mapping Cores onto 2D Mesh Networks on Chip," Design and Diagnostics of Electronic Circuits and Systems, pp. 1, 6, 16-18, Apr. 2008. cited by applicant . Matteson, Ryan, "Depmap: Dependency Mapping of Applications Using Operating System Events: a Thesis," Master's Thesis, California Polytechnic State University, Dec. 2010. cited by applicant . Natarajan, Arun, et al., "NSDMiner: Automated Discovery of Network Service Dependencies," Institute of Electrical and Electronics Engineers INFOCOM, Feb. 2012, 9 pages. cited by applicant . Navaz, A.S. Syed, et al., "Entropy based Anomaly Detection System to Prevent DDoS Attacks in Cloud," International Journal of computer Applications (0975-8887), vol. 62, No. 15, Jan. 2013, pp. 42-47. cited by applicant . Neverfail, "Neverfail IT Continuity Architect," https://web.archive.org/web/20150908090456/http://www.neverfailgroup.com/- products/it-continuity-architect. cited by applicant . Nilsson, Dennis K., et al., "Key Management and Secure Software Updates in Wireless Process Control Environments," In Proceedings of the First ACM Conference on Wireless Network Security (WiSec '08), ACM, New York, NY, USA, Mar. 31-Apr. 2, 2008, pp. 100-108. cited by applicant . Nunnally, Troy, et al., "P3D: A Parallel 3D Coordinate Visualization for Advanced Network Scans," IEEE 2013, Jun. 9-13, 2013, 6 pages. cited by applicant . O'Donnell, Glenn, et al., "The CMDB Imperative: How to Realize the Dream and Avoid the Nightmares," Prentice Hall, Feb. 19, 2009. cited by applicant . Ohta, Kohei, et al., "Detection, Defense, and Tracking of Internet-Wide Illegal Access in a Distributed Manner," 2000, pp. 1-16. cited by applicant . Pathway Systems International Inc., "How Blueprints does Integration," Apr. 15, 2014, 9 pages, http://pathwaysystems.com/company-blog/. cited by applicant . Pathway Systems International Inc., "What is Blueprints?" 2010-2016, http://pathwaysystems.com/blueprints-about/. cited by applicant . Popa, Lucian, et al., "Macroscope: End-Point Approach to Networked Application Dependency Discovery," CoNEXT'09, Dec. 1-4, 2009, Rome, Italy, 12 pages. cited by applicant . Prasad, K. Munivara, et al., "An Efficient Detection of Flooding Attacks to Internet Threat Monitors (ITM) using Entropy Variations under Low Traffic," Computing Communication & Networking Technologies (ICCCNT '12), Jul. 26-28, 2012, 11 pages. cited by applicant . Sachan, Mrinmaya, et al., "Solving Electrical Networks to incorporate Supervision in Random Walks," May 13-17, 2013, pp. 109-110. cited by applicant . Sammarco, Matteo, et al., "Trace Selection for Improved WLAN Monitoring," Aug. 16, 2013, pp. 9-14. cited by applicant . Shneiderman, Ben, et al., "Network Visualization by Semantic Substrates," Visualization and Computer Graphics, vol. 12, No. 5, pp. 733,740, Sep.-Oct. 2006. cited by applicant . Wang, Ru, et al., "Learning directed acyclic graphs via bootstarp aggregating," 2014, 47 pages, http://arxiv.org/abs/1406.2098. cited by applicant . Wang, Yongjun, et al., "A Network Gene-Based Framework for Detecting Advanced Persistent Threats," Nov. 2014, 7 pages. cited by applicant . Woodberg, Brad, "Snippet from Juniper SRX Series" Jun. 17, 2013, 1 page, O'Reilly Media, Inc. cited by applicant . Zhang, Yue, et al., "CANTINA: A Content-Based Approach to Detecting Phishing Web Sites," May 8-12, 2007, pp. 639-648. cited by applicant . Al-Fuqaha, Ala, et al., "Internet of Things: A Survey on Enabling Technologies, Protocols, and Applications," IEEE Communication Surveys & Tutorials. vol. 17, No. 4, Nov. 18, 2015, pp. 2347-2376. cited by applicant . Brocade Communications Systems, Inc., "Chapter 5--Configuring Virtual LANs (VLANs)," Jun. 2009, 38 pages. cited by applicant . Cisco Systems, Inc. "Cisco, Nexus 3000 Series NX-OS Release Notes, Release 5.0(3)U3(1)," Feb. 29, 2012, Part No. OL-26631-01, 16 pages. cited by applicant . Cisco Systems, Inc., "Cisco--VPN Client User Guide for Windows," Release 4.6, Aug. 2004, 148 pages. cited by applicant . Cisco Systems, Inc., "Cisco 4710 Application Control Engine Appliance Hardware Installation Guide," Nov. 2007, 66 pages. cited by applicant . Cisco Systems, Inc., "Cisco Data Center Network Architecture and Solutions Overview," Feb. 2006, 19 pages. cited by applicant . Cisco Systems, Inc., "Cisco IOS Configuration Fundamentals Configuration Guide: Using Autoinstall and Setup," Release 12.2, first published Apr. 2001, last updated Sep. 2003, 32 pages. cited by applicant . Cisco Systems, Inc., "Cisco VN-Link: Virtualization-Aware Networking," White Paper, Mar. 2009, 10 pages. cited by applicant . Cisco Systems, Inc., "Cisco, Nexus 5000 Series and Cisco Nexus 2000 Series Release Notes, Cisco NX-OS Release 5.1(3)N2(1b), NX-OS Release 5.1(3)N2(1a) and NX-OS Release 5.1(3)N2(1)," Sep. 5, 2012, Part No. OL-26652-03 CO, 24 pages. cited by applicant . Cisco Systems, Inc., "Nexus 3000 Series NX-OS Fundamentals Configuration Guide, Release 5.0(3)U3(1): Using PowerOn Auto Provisioning," Feb. 29, 2012, Part No. OL-26544-01, 10 pages. cited by applicant . Cisco Systems, Inc., "Quick Start Guide, Cisco ACE 4700 Series Application Control Engine Appliance," Software Ve740rsion A5(1.0), Sep. 2011, 138 pages. cited by applicant . Cisco Systems, Inc., "Routing and Bridging Guide, Cisco ACE Application Control Engine," Software Version A5(1.0), Sep. 2011, 248 pages. cited by applicant . Cisco Systems, Inc., "VMWare and Cisco Virtualization Solution: Scale Virtual Machine Networking," Jul. 2009, 4 pages. cited by applicant . Cisco Systems, Inc., "Cisco Remote Integrated Service Engine for Citrix NetScaler Appliances and Cisco Nexus 7000 Series Switches Configuration Guide," Last modified Apr. 29, 2014, 78 pages. cited by applicant . Cisco Technology, Inc., "Cisco IOS Software Release 12.4T Features and Hardware Support," Feb. 2009, 174 pages. cited by applicant . Cisco Systems, Inc., "Cisco Application Control Engine (ACE) Troubleshooting Guide--Understanding the ACE Module Architecture and Traffic Flow," Mar. 11, 2011, 6 pages. cited by applicant . Costa, Raul, et al., "An Intelligent Alarm Management System for Large-Scale Telecommunication Companies," In Portuguese Conference on Artificial Intelligence, Oct. 2009, 14 pages. cited by applicant . De Carvalho, Tiago Filipe Rodrigues, Dec. 2008, "Root Cause Analysis in Large and Complex Networks," Dec. 2008, Repositorio.ul.pt, pp. 1-55. cited by applicant . Foundation for Intelligent Physical Agents, "FIPA Agent Message Transport Service Specification," Dec. 3, 2002, http://www.fipa.org; 15 pages. cited by applicant . Gia, Tuan Nguyen, et al., "Fog Computing in Healthcare Internet of Things: A Case Study on ECG Feature Extraction," 2015 IEEE International Conference on Computer and Information Technology; Ubiquitous Computing and Communications; Dependable, Autonomic and Secure Computing; Pervasive Intelligence and Computing, Oct. 26, 2015, pp. 356-363. cited by applicant . Joseph, Dilip, et al., "Modeling Middleboxes," IEEE Network, Sep./Oct. 2008, pp. 20-25. cited by applicant . Kent, S., et al. "Security Architecture for the Internet Protocol," Network Working Group, Nov. 1998, 67 pages. cited by applicant . Online Collins English Dictionary, 1 page (Year: 2018). cited by applicant . Voris, Jonathan, et al., "Bait and Snitch: Defending Computer Systems with Decoys," Columbia University Libraries, Department of Computer Science, 2013, pp. 1-25. cited by applicant . Bauch, Petr, "Reader's Report of Master's Thesis, Analysis and Testing of Distributed NoSQL Datastore Riak," May 28, 2015, Brno. 2 pages. cited by applicant . Heckman, Sarah, et al., "On Establishing a Benchmark for Evaluating Static Analysis Alert Prioritization and Classification Techniques," IEEE, 2008; 10 pages. cited by applicant . Kim, Myung-Sup, et al. "A Flow-based Method for Abnormal Network Traffic Detection, " IEEE, 2004, pp. 599-612. cited by applicant . Thomas, R., "Bogon Dotted Decimal List," Version 7.0, Team Cymru NOC, Apr. 27, 2012, 5 pages. cited by applicant. |
Primary Examiner: Lagor; Alexander
Attorney, Agent or Firm: Polsinelli PC
Parent Case Text
CROSS-REFERENCE TO RELATED APPLICATIONS
This application claims priority to U.S. Provisional Application No. 62/171,899, entitled "SYSTEM FOR MONITORING AND MANAGING DATACENTERS," filed on Jun. 5, 2015, which is incorporated herein by reference in its entirety.
Claims
What is claimed:
1. A method comprising: capturing first data associated with a first packet flow originating from a first host using a first capture agent deployed at the first host to yield first flow data; capturing second data associated with a second packet flow originating from the first host from a second capture agent deployed at a second host to yield second flow data, wherein the first capture agent is deployed at a first layer of a network and the second capture agent is deployed at a second layer of the network, wherein the first layer and the second layer are different layers; comparing the first flow data and the second flow data to yield a difference; when the difference is above a threshold value, yielding a determination, the determination including that the second packet flow includes a hidden process and the second packet flow was transmitted by a component that bypassed an operating stack of the first host; and taking a corrective action based on the determination, the corrective action including isolating a container, isolating a virtual machine, or isolating the first host.
2. The method of claim 1, wherein the first data and the second data comprise metadata associated respectively with the first packet flow and the second packet flow.
3. The method of claim 1, wherein the first data comprises first packet content of the first packet flow and the second data comprise second packet content of the second packet flow.
4. The method of claim 1, wherein the first flow data and the second flow data are captured at a collector.
5. The method of claim 1, wherein a collector receives the first flow data and the second flow data and performs the step of comparing the first flow data and the second flow data.
6. The method of claim 1, further comprising: identifying the first host as a generator of the hidden process.
7. The method of claim 1, wherein the first flow data and the second flow data comprise network data.
8. The method of claim 1, further comprising: predicting a presence of a malicious entity within the first host based on the determination.
9. The method of claim 1, wherein the corrective action is shutting down the first host.
10. The method of claim 1, wherein the corrective action includes one or more of limiting packets to and from the first host, requiring all packets to and from the first host to flow through the operating stack of the first host, or notifying an administrator.
11. A system comprising: a processor; and a non-transitory computer-readable storage medium storing instructions which, when executed by the processor, cause the processor to perform operations comprising: capturing first data associated with a first packet flow originating from a first host using a first capture agent deployed at the first host to yield first flow data; capturing second data associated with a second packet flow originating from the first host from a second capture agent deployed on a second host to yield second flow data, wherein the first capture agent is deployed at a first layer of a network and the second capture agent is deployed at a second layer of the network, wherein the first layer and the second layer are different layers; comparing the first flow data and the second flow data to yield a difference; when the difference is above a threshold value, yielding a determination, the determination including that the second packet flow was transmitted by a component that bypassed an operating stack of the first host and the second packet flow includes a hidden packet; and taking a limiting action associated with a flow of packets to or from the first host based on the determination, the limiting action including isolating a container, isolating a virtual machine, or isolating the first host.
12. The system of claim 11, wherein the first data and the second data comprise metadata associated respectively with the first packet flow and the second packet flow.
13. The system of claim 11, wherein the first data comprises first packet content of the first packet flow and the second data comprise second packet content of the second packet flow.
14. The system of claim 11, wherein the first flow data and the second flow data are captured at a collector.
15. The system of claim 11, wherein a collector receives the first flow data and the second flow data and performs the step of comparing the first flow data and the second flow data.
16. The system of claim 11, wherein the operations include predicting a presence of a malicious entity within first host or the second host based on determination.
17. The system of claim 11, wherein the limiting action comprises one of limiting packets to and from the first host, requiring all packets to and from the first host to flow through the operating stack of the first host, shutting down the first host, or notifying an administrator.
18. A non-transitory computer-readable storage device that stores instructions which, when executed by a processor, cause the processor to perform further operations comprising: capturing first data associated with a first packet flow originating from a first host using a first capture agent deployed at the first host to yield first flow data; capturing second data associated with a second packet flow originating from the first host from a second capture agent deployed at a second host to yield second flow data, wherein the first capture agent is deployed at a first layer of a network and the second capture agent is deployed at a second layer of the network, wherein the first layer and the second layer are different layers; comparing the first flow data and the second flow data to yield a difference; when the difference is above a threshold value, yielding a determination, the determination including that the second packet flow was transmitted by a component that bypassed an operating stack of the first host and the second packet flow includes a hidden packet; and taking a limiting action associated with a flow of packets to or from the first host based on the determination, the limiting action including isolating a container, isolating a virtual machine, or isolating the first host.
19. The non-transitory computer-readable storage device of claim 18, wherein the first data and the second data comprise metadata associated respectively with the first packet flow and the second packet flow.
20. The non-transitory computer-readable storage device of claim 18, wherein the first packet flow and the second packet flow are captured at a collector, the collector configured to perform the comparing of the first packet flow and the second packet flow and to yield the difference.
Description
TECHNICAL FIELD
The present disclosure pertains to network analytics, and more specifically a system for detecting hidden processes within a network by analyzing data captured by sensors deployed at multiple layers throughout the network.
BACKGROUND
Network traffic produced by a compute environment (whether from a container, VM, hardware switch, hypervisor or physical server) is captured by entities called sensors or capture agents that can be deployed in or inside different environments as mentioned herein. Sensors export data or metadata of the observed network activity to collection agents called "collectors." Collectors can be a group of processes running on a single machine or a cluster of machines. For the sake of simplicity, all collectors are treated as one logical entity and referred to as one collector. In actual deployment on a datacenter scale, there will be more than just one collector, each responsible for handling export data from a group of sensors. Collectors are capable of doing preprocessing and analysis of the data collected from sensors. A collector is capable of sending the processed or unprocessed data to a cluster of processes responsible for analysis of network data. The entities which receive the data from collector can be a cluster of processes, which logical group can be referred to as a pipeline. Note that sensors and collectors are not limited to observing and processing just network data, but can also capture other system information like currently active processes, active file handles, socket handles, status of I/O devices, memory, etc.
There are deficiencies in the current use of collectors and sensors. Various techniques are used to hide the presence of malware and the network traffic generated by malware. Network traffic generated by a malware or any agent that wishes to send data out of the system can do so by placing itself at various levels in the Operating System (OS) stack. Data can be sent out by various means, some of which can bypass the OS stack altogether. For example, a compromised network device driver or firmware can send data out without being detected by the OS (either Guest or Host OS in a virtualized environment). Sometimes, a compromised device or service can generate and send packets which hide a process used by the malware which may otherwise indicate the system is compromised via the process). Network traffic can often be detected by analyzing packets on the wire or the physical medium. A packet analyzer system (hardware or software) placed on the wire can see all packets, but has no means for identifying a process in a packet if the process is hidden from the host OS, making it difficult to identify processes used or attacked by malware. Precisely, a packet analyzer cannot identify a hidden process when a portion of the flow associated with the process is hidden.
BRIEF DESCRIPTION OF THE DRAWINGS
In order to describe the manner in which the above-recited and other advantages and features of the disclosure can be obtained, a more particular description of the principles briefly described above will be rendered by reference to specific embodiments thereof which are illustrated in the appended drawings. Understanding that these drawings depict only exemplary embodiments of the disclosure and are not therefore to be considered to be limiting of its scope, the principles herein are described and explained with additional specificity and detail through the use of the accompanying drawings in which:
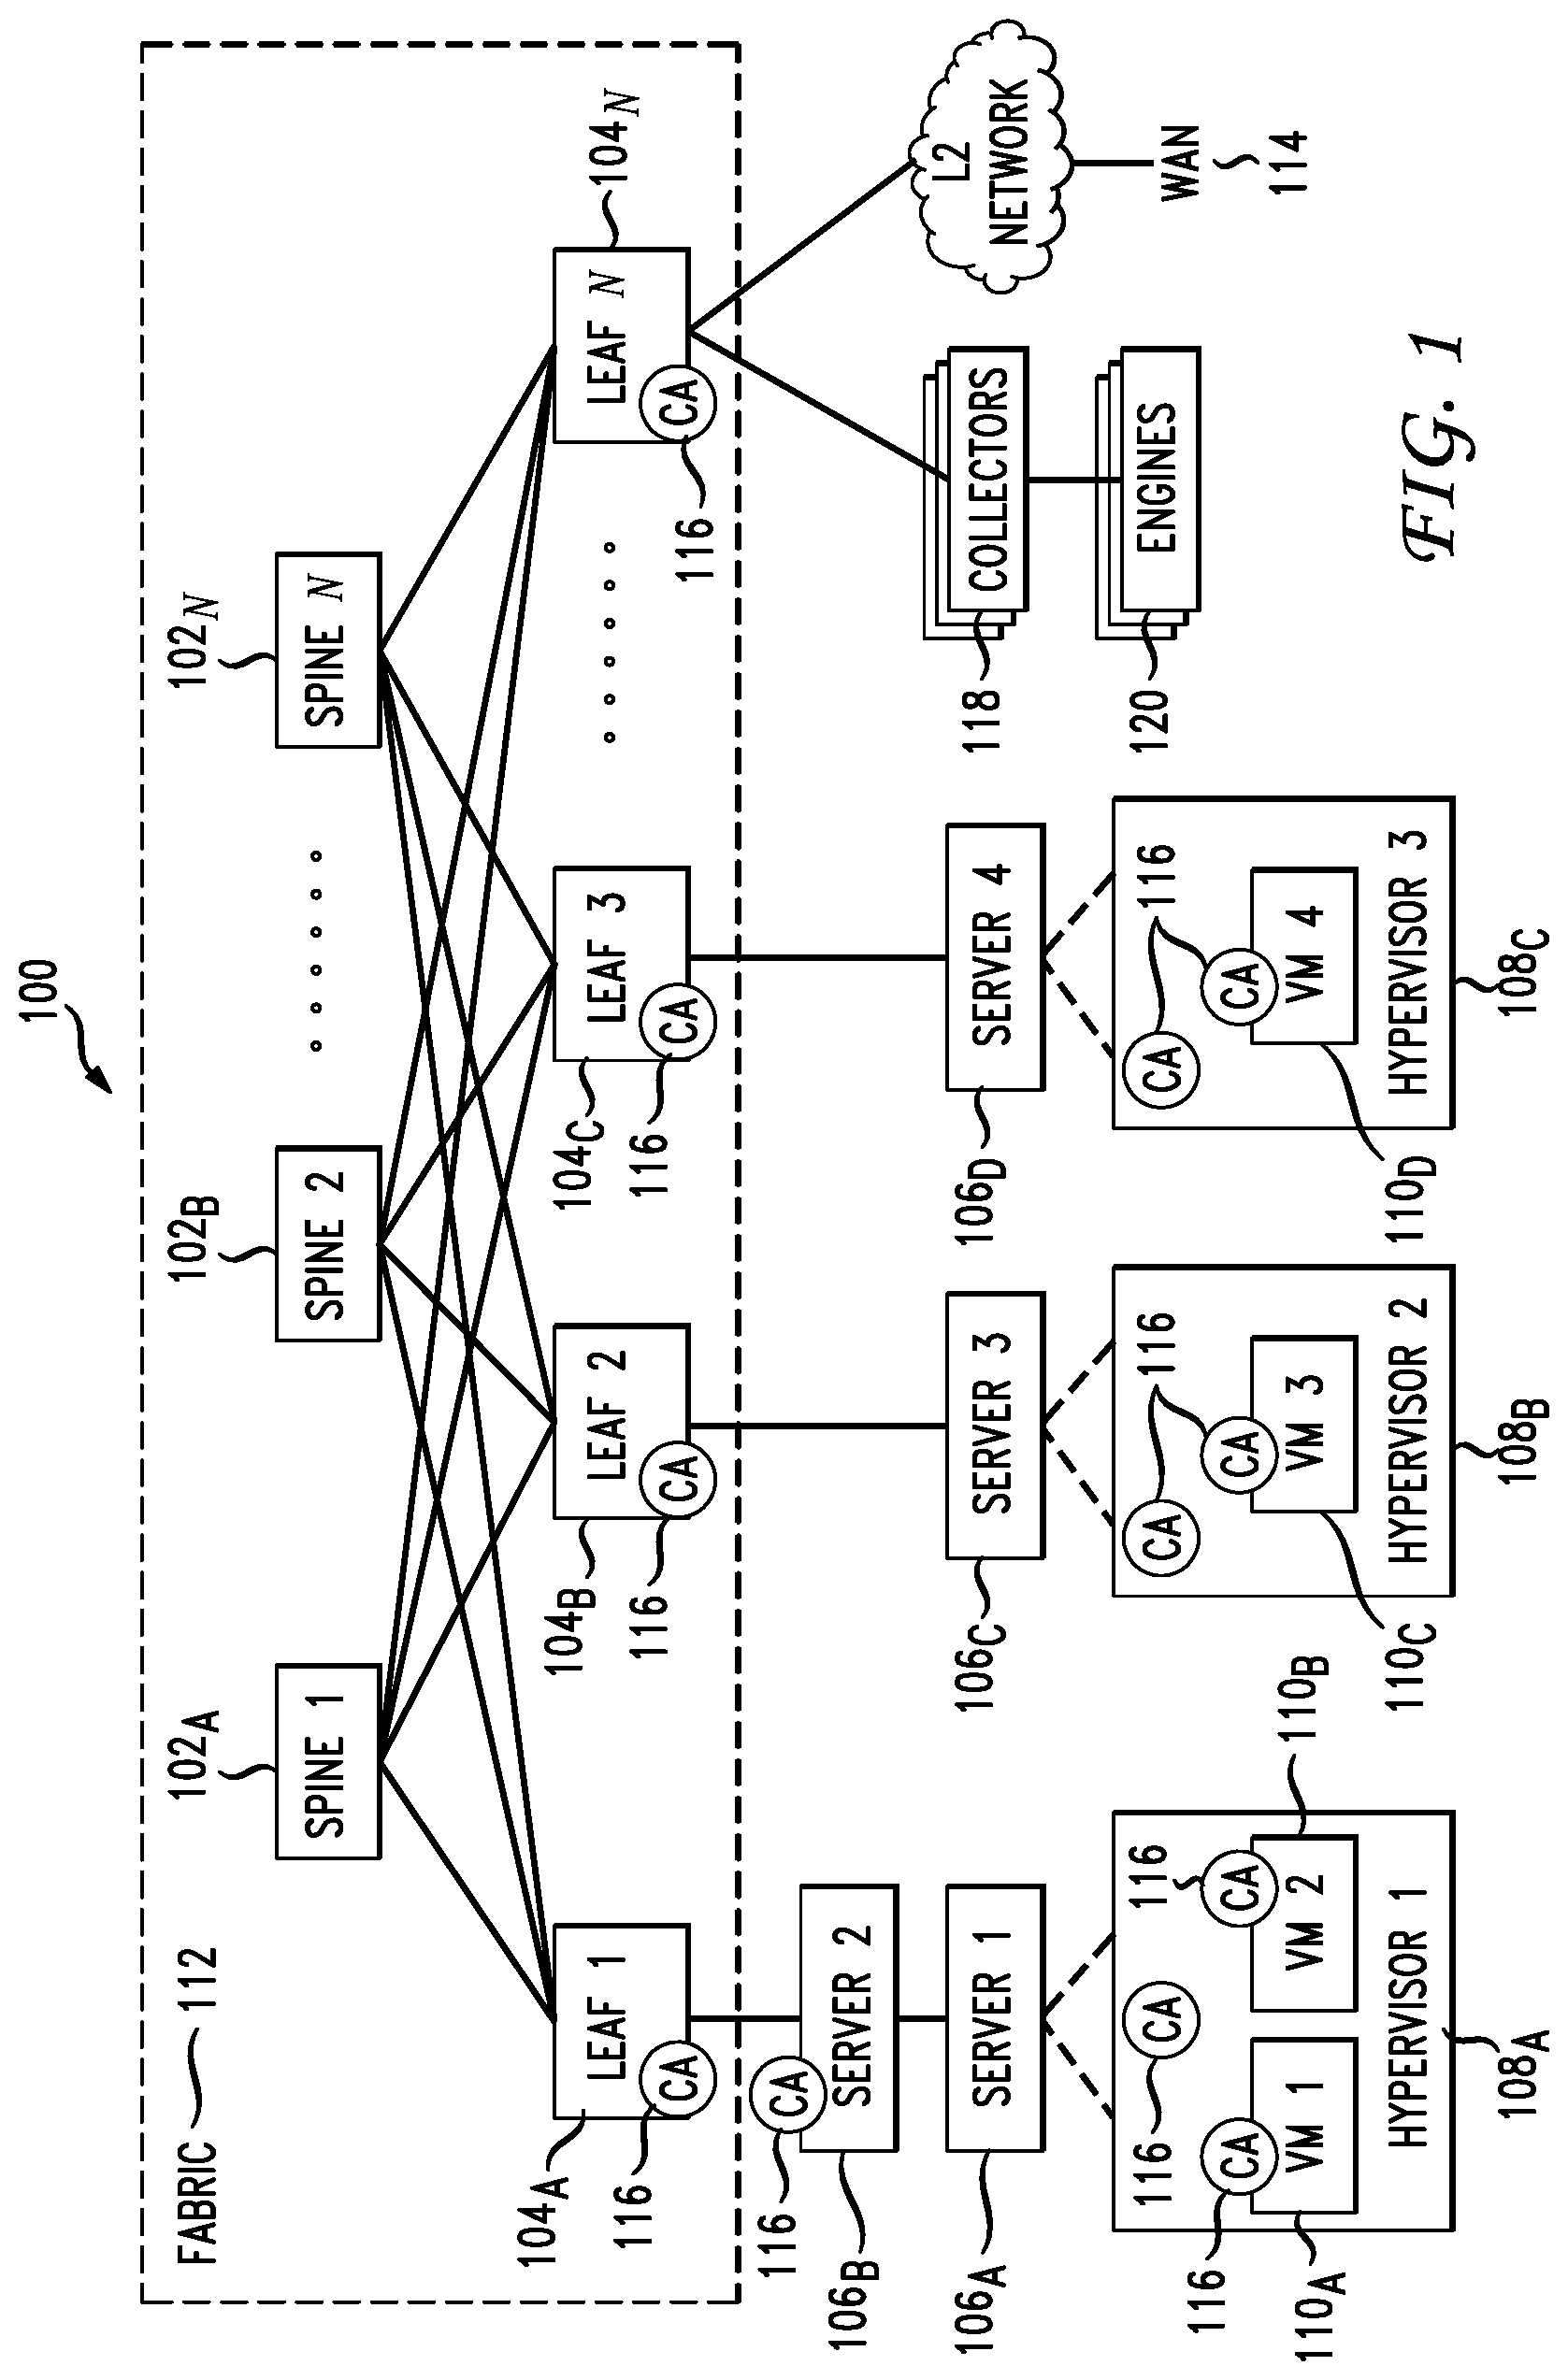
FIG. 1 illustrates a diagram of an example network environment;
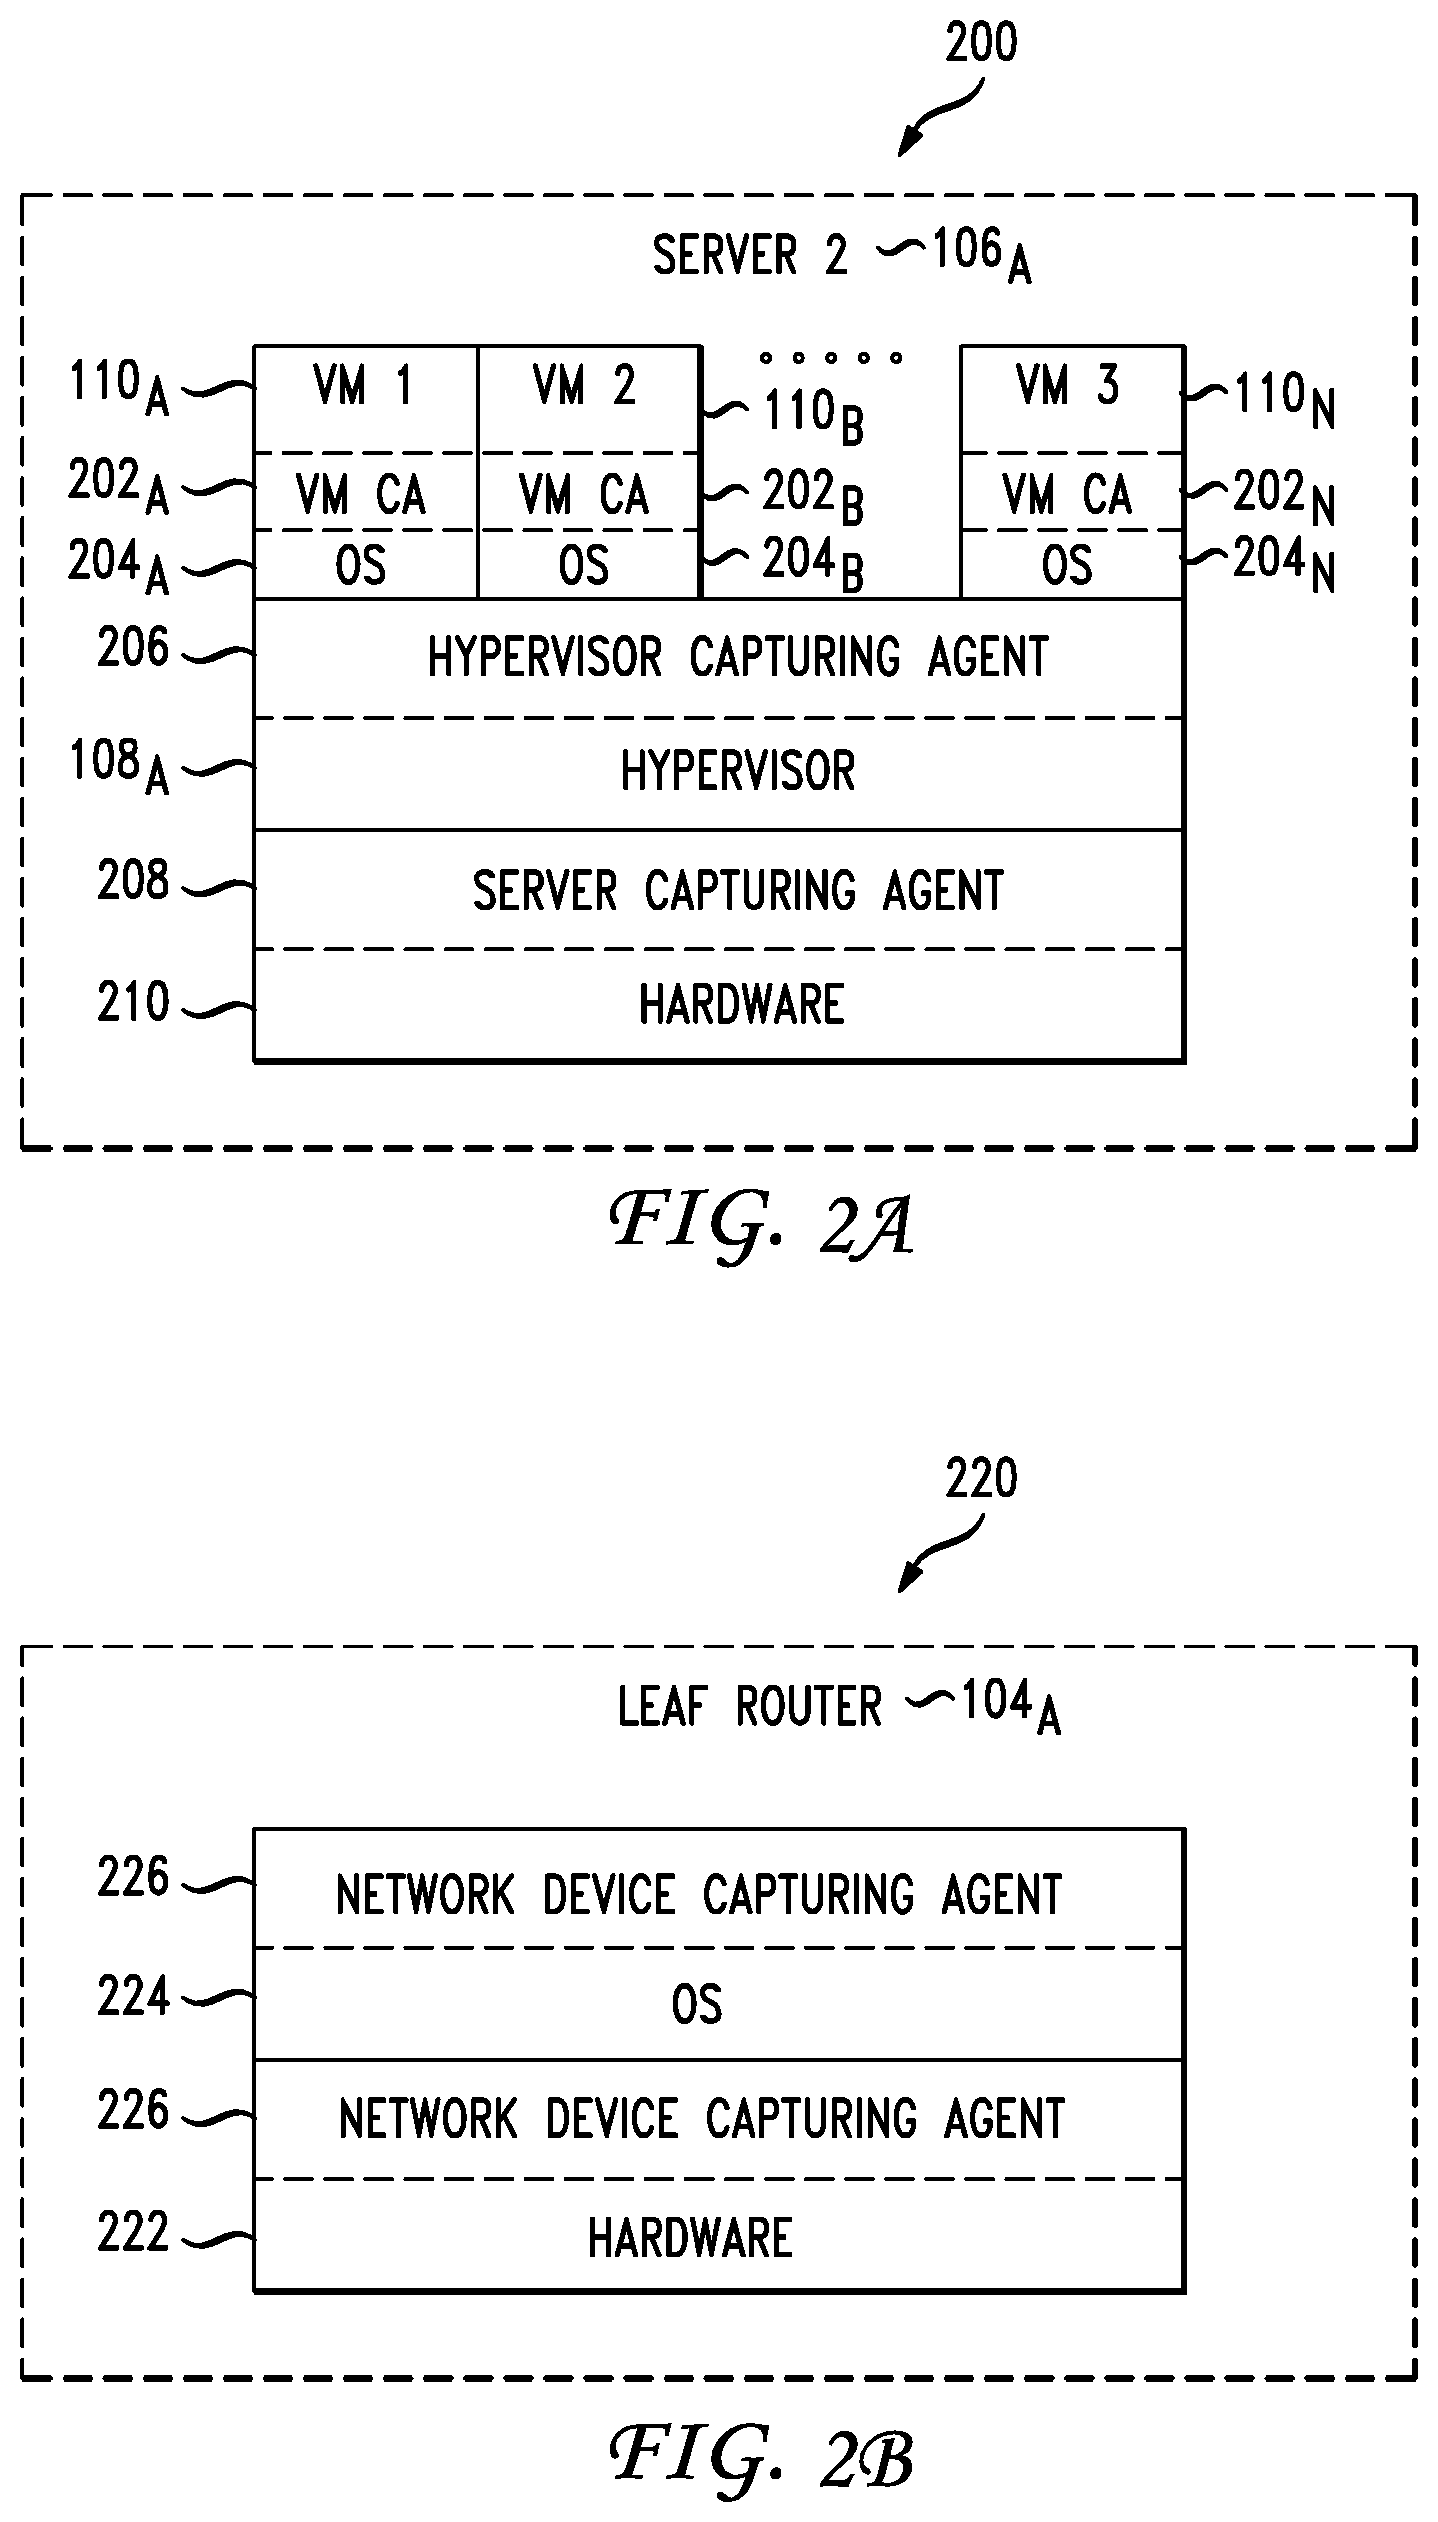
FIG. 2A illustrates a schematic diagram of an example capturing agent deployment a virtualized environment;
FIG. 2B illustrates a schematic diagram of an example capturing agent deployment in an example network device;
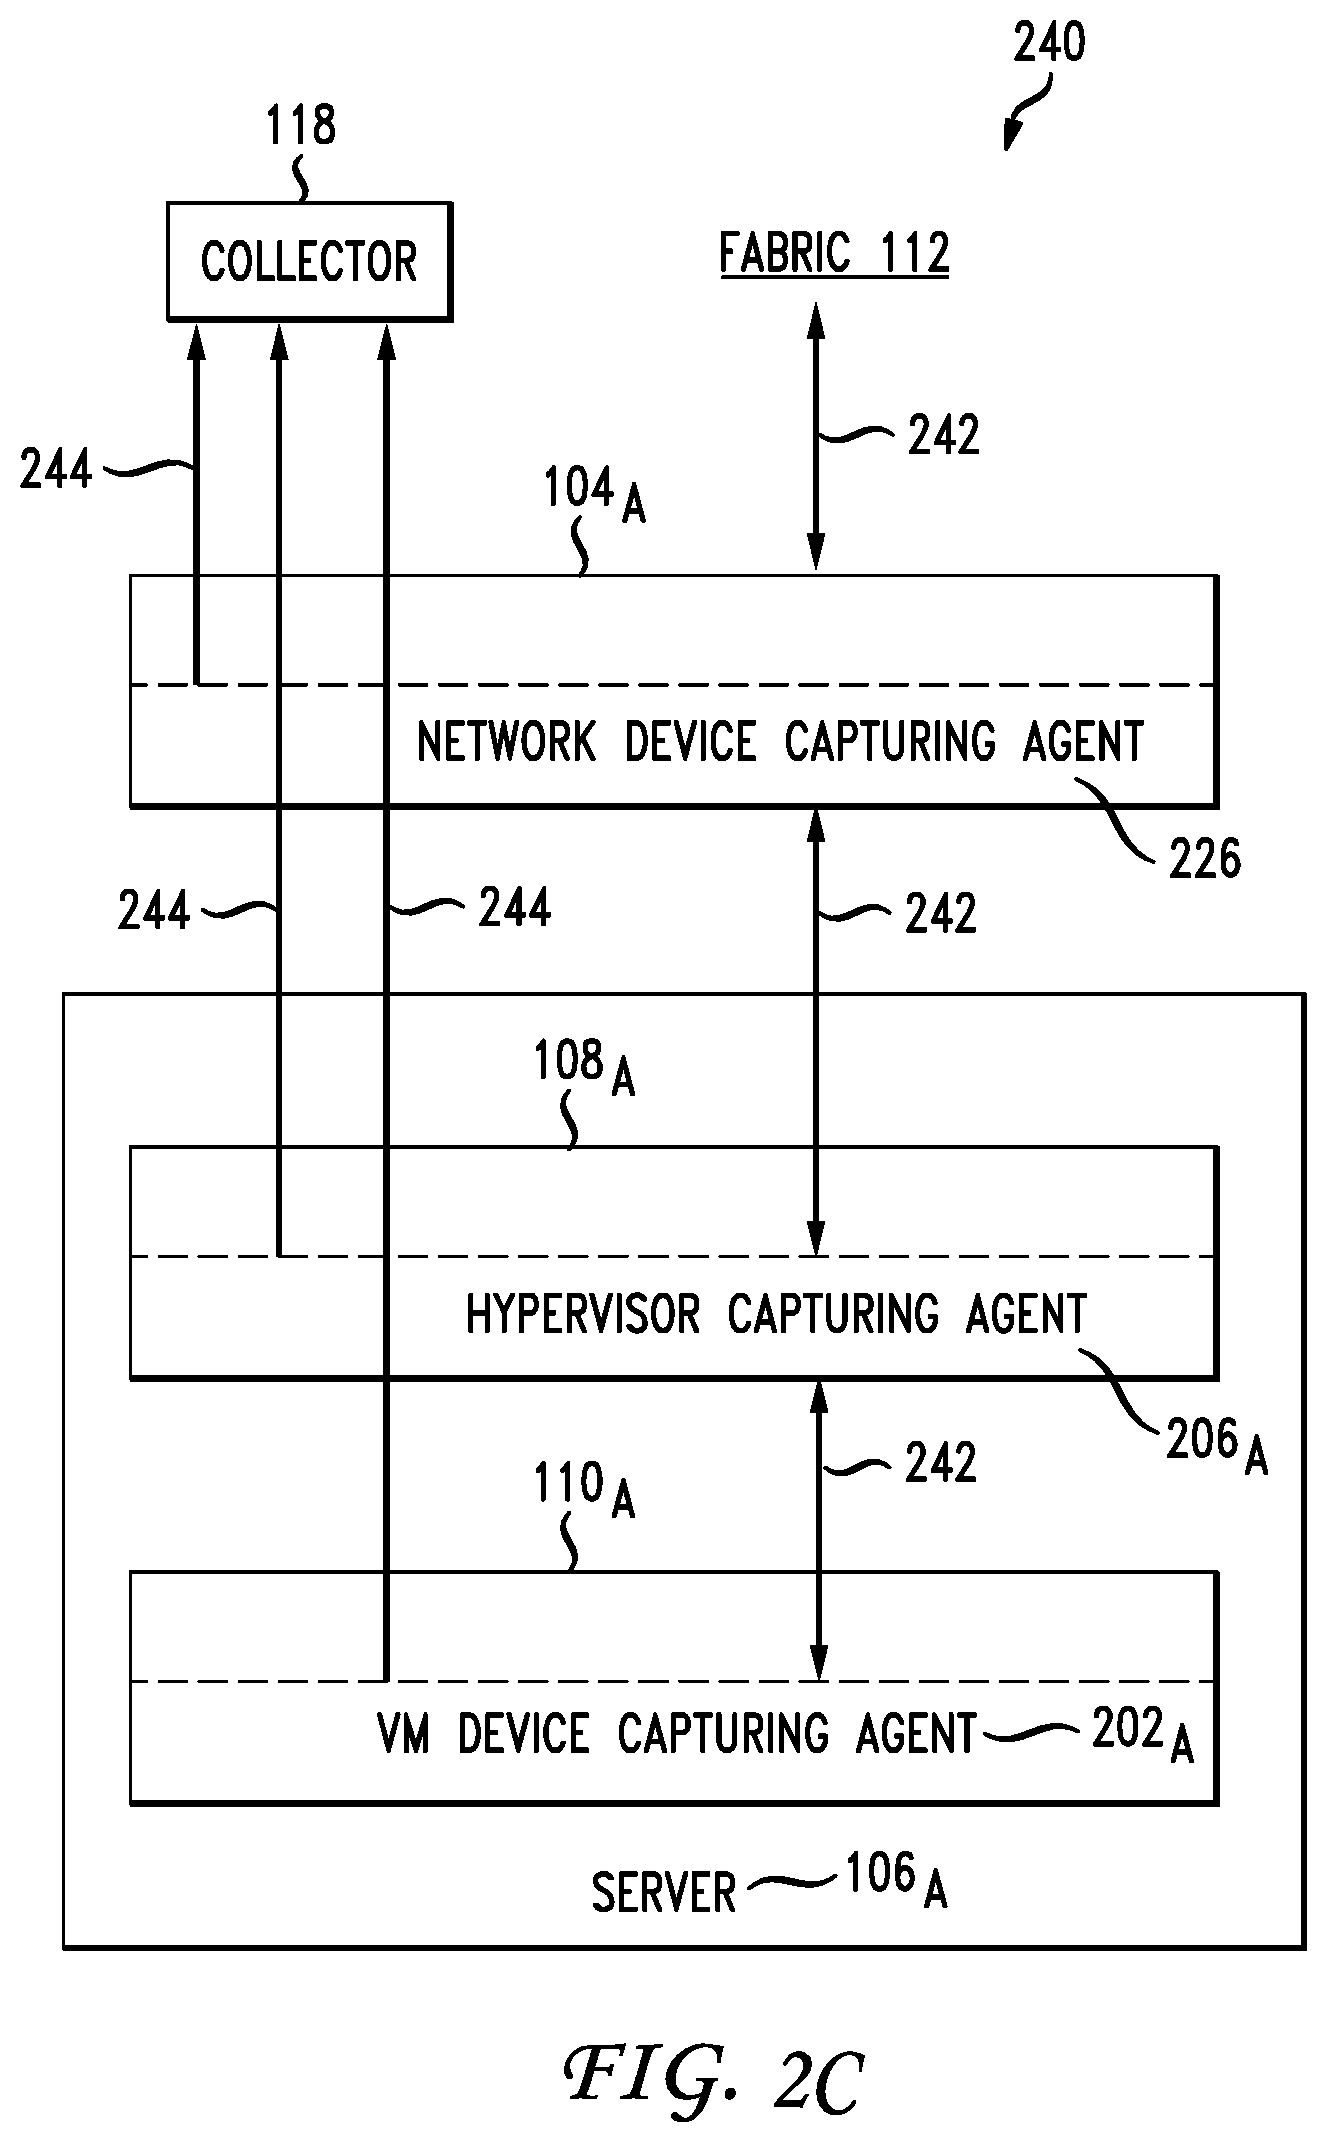
FIG. 2C illustrates a schematic diagram of an example reporting system in an example capturing agent topology;
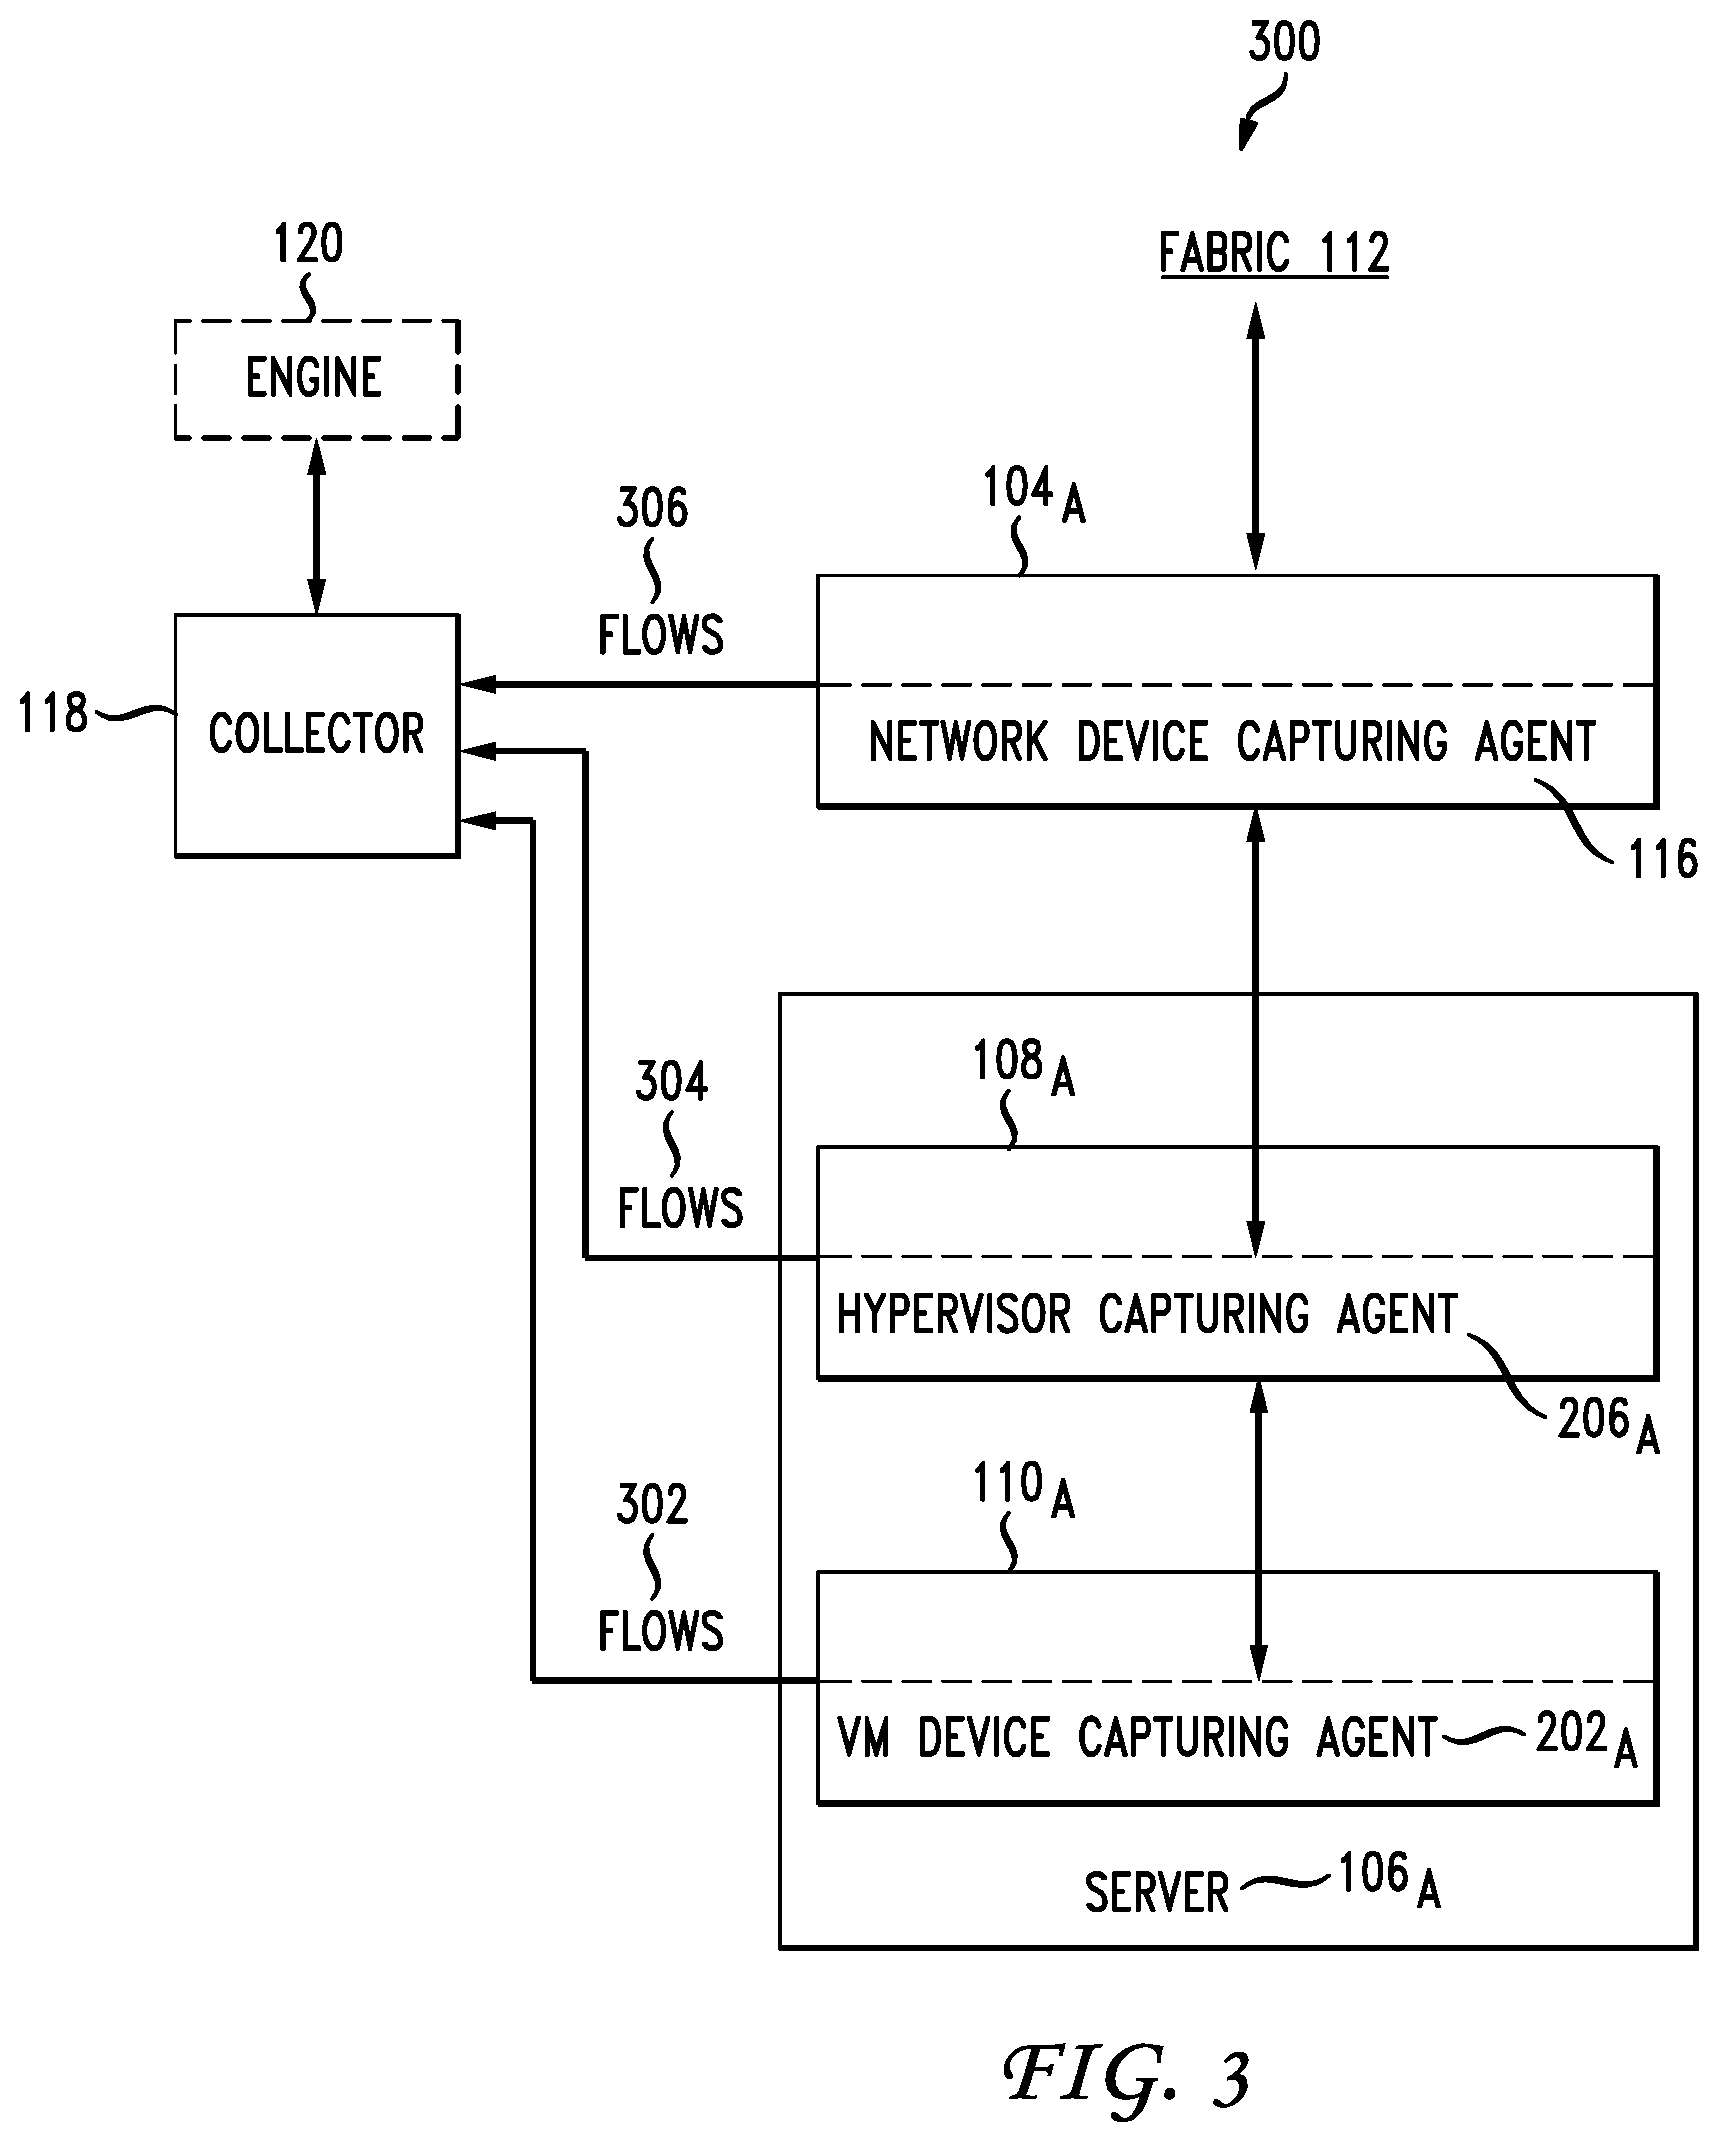
FIG. 3 illustrates a schematic diagram of an example configuration for collecting capturing agent reports;
FIG. 4 illustrates an example method embodiment;
FIG. 5 illustrates a listing of example fields on a capturing agent report;
FIG. 6 illustrates an example network device; and
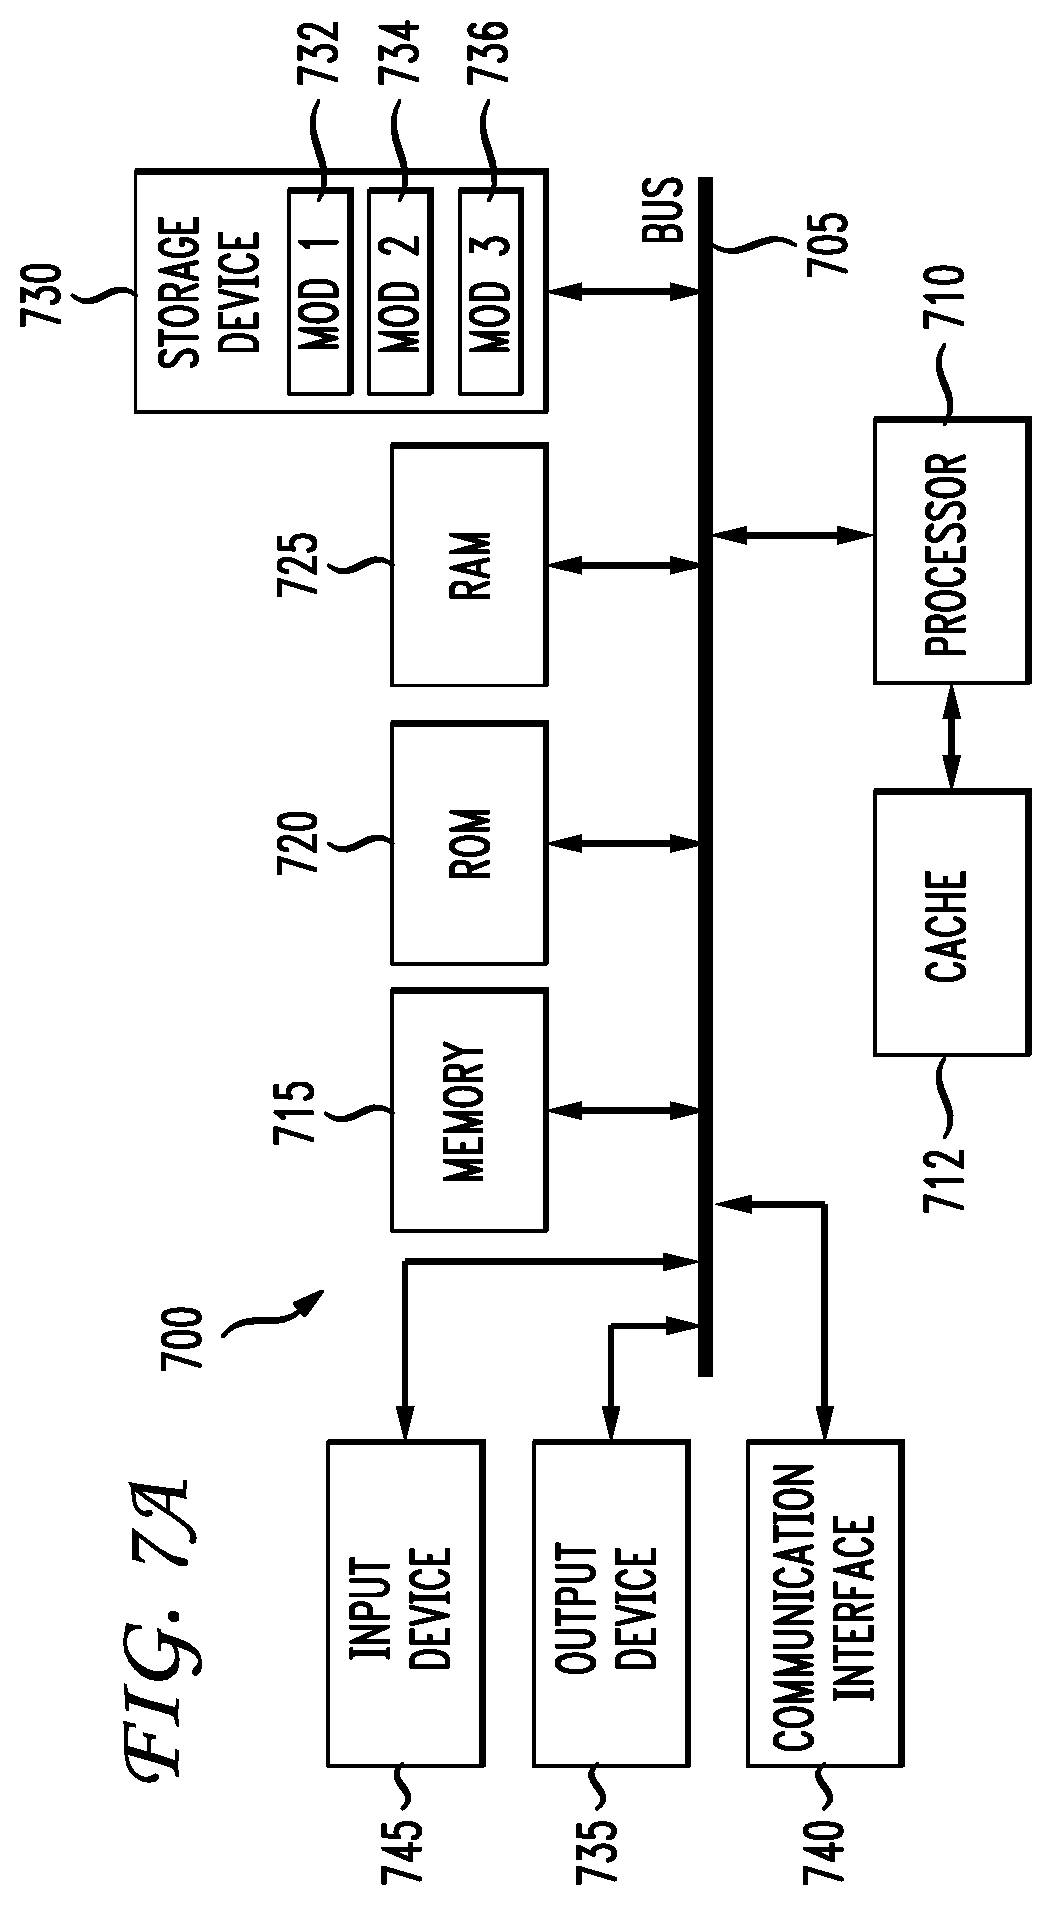
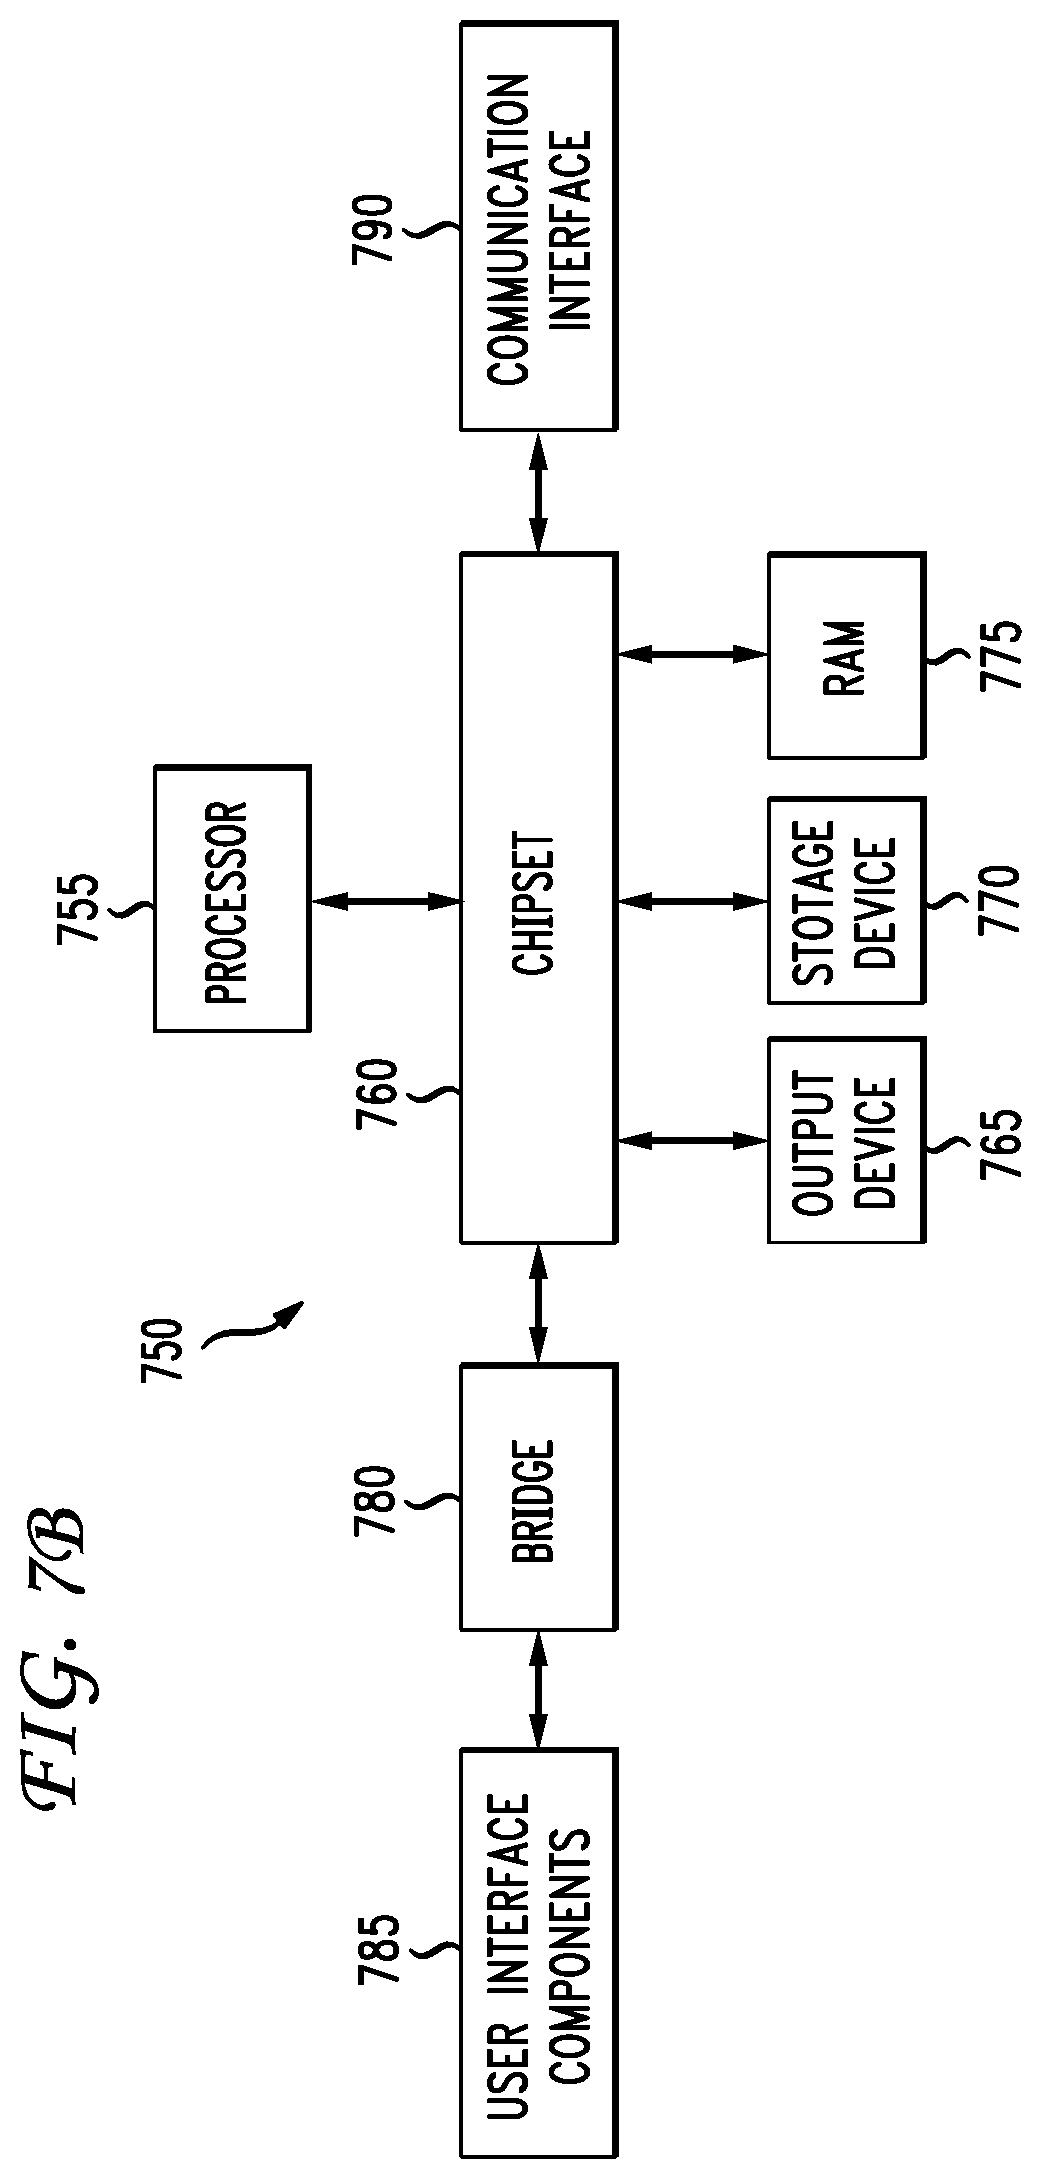
FIGS. 7A and 7B illustrate example system embodiments.
DESCRIPTION OF EXAMPLE EMBODIMENTS
Various embodiments of the disclosure are discussed in detail below. While specific implementations are discussed, it should be understood that this is done for illustration purposes only. A person skilled in the relevant art will recognize that other components and configurations may be used without parting from the spirit and scope of the disclosure.
Overview
It is advantageous to identify the amount of packet loss at each point in a network and to fine tune and improve the network. Prior art solutions noted above implement a request/reply model when trying to identify packet loss at different points. However, unlike the concepts disclosed herein, the prior model cannot be implemented in a live environment. Moreover, the model is not as efficient or accurate as the concepts disclosed herein. The present disclosure provides systems that detect malicious activity by capturing data associated with a packet flow from a location within the host generating the packet flow as well as capturing second data associated with the packet flow from a second host. The sets of data are compared to identify a hidden process in the packets by comparing the processes associated with the first data and the processes associated with the second data.
Additional features and advantages of the disclosure will be set forth in the description which follows, and in part will be obvious from the description, or can be learned by practice of the herein disclosed principles. The features and advantages of the disclosure can be realized and obtained by means of the instruments and combinations particularly pointed out in the appended claims. These and other features of the disclosure will become more fully apparent from the following description and appended claims, or can be learned by the practice of the principles set forth herein.
Disclosed are systems, methods, and computer-readable storage media for capturing first data associated with a first packet flow originating from a computing device (a first host) using a first capture agent deployed at the computing device to yield first flow data, capturing second data associated with a second packet flow originating from the computing device from a second capture agent deployed outside of the computing device (i.e., on a second host) to yield second flow data and comparing the first flow data and the second flow data to yield a difference. When the difference is above a threshold value, the method includes determining that a hidden process exists. The first data and the second data can include metadata associated respectively with the first packet flow and the second packet flow, network data or packet content data. The first flow data and the second flow data are preferably captured at a collector. The collector receives the first flow data and the second flow data and performs the step of comparing the first flow data and the second flow data.
Based on the comparison, the system can identify the computing device or host as a generator of the hidden process. The system could also identify a different compute environment as the source of the hidden process. Based on the comparison or the determination, the system can perform the step of predicting a presence of a malicious entity within the computing device or host. The system can also take a corrective action such as one or more of: isolating a virtual machine, isolating a container, limiting packets to and from the computing device, requiring all packets to and from the computing device to flow through an operating stack of the computing device, isolating the computing device, shutting down the computing device, blacklisting the hidden network traffic and/or any entities associated with the hidden network traffic such as a sender or source, tagging or flagging the hidden network traffic, adjusting the granularity of reported or captured data associated with the hidden network traffic or an associated entity, adjusting a network or security policy such as a routing or firewall policy, and notifying an administrator. The "computing device" can be any host or component, physical or virtual, in the network.
Description
The present disclosure addresses the need in the art for identifying malicious processes within a network. This disclosure provides a method and system of detecting a hidden process in a packet by observing traffic from two or more reference points. One of the reference points is the system X where the traffic was generated and the other reference point is a system Y through which all network traffic of system X must pass. The system detects such packets by collecting metadata of packets or the packet content itself that was seen at both reference point X and reference point Y, and computing the difference between them. The system identifies the hidden process by comparing the processes in the packets captured by system X with those captured by system Y. This methodology and system can detect such packets in a datacenter having different kinds of compute workloads ranging from containers, virtual machines, hypervisors, switches, and bare metal servers.
A description of an example network environment, as illustrated in FIG. 1, is first disclosed herein. A discussion of capturing agents will then follow. The disclosure continues with a discussion of the specific process for identifying a lineage for a process or processes and then determining through the study of the lineage whether a process is malicious. The discussion then concludes with a description of example systems and devices. These variations shall be described herein as the various embodiments are set forth. The disclosure now turns to FIG. 1.
FIG. 1 illustrates a diagram of example network environment 100. Fabric 112 can represent the underlay (i.e., physical network) of network environment 100. Fabric 112 can include spine routers 1-N (102.sub.A-N) (collectively "102") and leaf routers 1-N (104.sub.A-N) (collectively "104"). Leaf routers 104 can reside at the edge of fabric 112, and can thus represent the physical network edges. Leaf routers 104 can be, for example, top-of-rack ("ToR") switches, aggregation switches, gateways, ingress and/or egress switches, provider edge devices, and/or any other type of routing or switching device.
Leaf routers 104 can be responsible for routing and/or bridging tenant or endpoint packets and applying network policies. Spine routers 102 can perform switching and routing within fabric 112. Thus, network connectivity in fabric 112 can flow from spine routers 102 to leaf routers 104, and vice versa.
Leaf routers 104 can provide servers 1-4 (106.sub.A-D) (collectively "106"), hypervisors 1-3 (108.sub.A-108.sub.C) (collectively "108"), virtual machines (VMs) 1-4 (110.sub.A-110.sub.D) (collectively "110"), collectors 118, engines 120, and the Layer 2 (L2) network access to fabric 112. For example, leaf routers 104 can encapsulate and decapsulate packets to and from servers 106 in order to enable communications throughout environment 100. Leaf routers 104 can also connect other network-capable device(s) or network(s), such as a firewall, a database, a server, etc., to the fabric 112. Leaf routers 104 can also provide any other servers, resources, endpoints, external networks, VMs, services, tenants, or workloads with access to fabric 112.
VMs 110 can be virtual machines hosted by hypervisors 108 running on servers 106. VMs 110 can include workloads running on a guest operating system on a respective server. Hypervisors 108 can provide a layer of software, firmware, and/or hardware that creates and runs the VMs 110. Hypervisors 108 can allow VMs 110 to share hardware resources on servers 106, and the hardware resources on servers 106 to appear as multiple, separate hardware platforms. Moreover, hypervisors 108 and servers 106 can host one or more VMs 110. For example, server 106.sub.A and hypervisor 108.sub.A can host VMs 110.sub.A-B.
In some cases, VMs 110 and/or hypervisors 108 can be migrated to other servers 106. For example, VM 110.sub.A can be migrated to server 106.sub.C and hypervisor 108.sub.B. Servers 106 can similarly be migrated to other locations in network environment 100. For example, a server connected to a specific leaf router can be changed to connect to a different or additional leaf router. In some cases, some or all of servers 106, hypervisors 108, and/or VMs 110 can represent tenant space. Tenant space can include workloads, services, applications, devices, and/or resources that are associated with one or more clients or subscribers. Accordingly, traffic in network environment 100 can be routed based on specific tenant policies, spaces, agreements, configurations, etc. Moreover, addressing can vary between one or more tenants. In some configurations, tenant spaces can be divided into logical segments and/or networks and separated from logical segments and/or networks associated with other tenants.
Any of leaf routers 104, servers 106, hypervisors 108, and VMs 110 can include capturing agent 116 (also referred to as a "sensor" or a "capturing agent") configured to capture network data, and report any portion of the captured data to collector 118. Capturing agents 116 can be processes, agents, modules, drivers, or components deployed on a respective system or system layer (e.g., a server, VM, virtual container, hypervisor, leaf router, etc.), configured to capture network data for the respective system (e.g., data received or transmitted by the respective system), and report some or all of the captured data and statistics to collector 118.
For example, a VM capturing agent can run as a process, kernel module, software element, or kernel driver on the guest operating system installed in a VM and configured to capture and report data (e.g., network and/or system data) processed (e.g., sent, received, generated, etc.) by the VM.
A hypervisor capturing agent can run as a process, kernel module, software element, or kernel driver on the host operating system installed at the hypervisor layer and configured to capture and report data (e.g., network and/or system data) processed (e.g., sent, received, generated, etc.) by the hypervisor.
A container capturing agent can run as a process, kernel module, software element, or kernel driver on the operating system of a device, such as a switch or server, which can be configured to capture and report data processed by the container.
A server capturing agent can run as a process, kernel module, software element, or kernel driver on the host operating system of a server and configured to capture and report data (e.g., network and/or system data) processed (e.g., sent, received, generated, etc.) by the server.
A network device capturing agent can run as a process, software element, or component in a network device, such as leaf routers 104, and configured to capture and report data (e.g., network and/or system data) processed (e.g., sent, received, generated, etc.) by the network device.
Capturing agents 116 can be configured to report observed data, statistics, and/or metadata about one or more packets, flows, communications, processes, events, and/or activities to collector 118. For example, capturing agents 116 can capture network data and statistics processed (e.g., sent, received, generated, dropped, forwarded, etc.) by the system or host (e.g., server, hypervisor, VM, container, switch, etc.) of the capturing agents 116 (e.g., where the capturing agents 116 are deployed). The capturing agents 116 can also report the network data and statistics to one or more devices, such as collectors 118 and/or engines 120. For example, the capturing agents 116 can report an amount of traffic processed by their host, a frequency of the traffic processed by their host, a type of traffic processed (e.g., sent, received, generated, etc.) by their host, a source or destination of the traffic processed by their host, a pattern in the traffic, an amount of traffic dropped or blocked by their host, types of requests or data in the traffic received, discrepancies in traffic (e.g., spoofed addresses, invalid addresses, hidden sender, etc.), protocols used in communications, type or characteristics of responses to traffic by the hosts of the capturing agents 116, what processes have triggered specific packets, etc.
Capturing agents 116 can also capture and report information about the system or host of the capturing agents 116 (e.g., type of host, type of environment, status of host, conditions of the host, etc.). Such information can include, for example, data or metadata of active or previously active processes of the system, operating system user identifiers, kernel modules loaded or used, network software characteristics (e.g., software switch, virtual network card, etc.), metadata of files on the system, system alerts, number and/or identity of applications at the host, domain information, networking information (e.g., address, topology, settings, connectivity, etc.), session information (e.g., session identifier), faults or errors, memory or CPU usage, threads, filename and/or path, services, security information or settings, and so forth.
Capturing agents 116 may also analyze the processes running on the respective VMs, hypervisors, servers, or network devices to determine specifically which process is responsible for a particular flow of network traffic. Similarly, capturing agents 116 may determine which operating system user (e.g., root, system, John Doe, Admin, etc.) is responsible for a given flow. Reported data from capturing agents 116 can provide details or statistics particular to one or more tenants or customers. For example, reported data from a subset of capturing agents 116 deployed throughout devices or elements in a tenant space can provide information about the performance, use, quality, events, processes, security status, characteristics, statistics, patterns, conditions, configurations, topology, and/or any other information for the particular tenant space.
Collectors 118 can be one or more devices, modules, workloads, VMs, containers, and/or processes capable of receiving data from capturing agents 116. Collectors 118 can thus collect reports and data from capturing agents 116. Collectors 118 can be deployed anywhere in network environment 100 and/or even on remote networks capable of communicating with network environment 100. For example, one or more collectors can be deployed within fabric 112, on the L2 network, or on one or more of the servers 106, VMs 110, hypervisors. Collectors 118 can be hosted on a server or a cluster of servers, for example. In some cases, collectors 118 can be implemented in one or more servers in a distributed fashion.
As previously noted, collectors 118 can include one or more collectors. Moreover, a collector can be configured to receive reported data from all capturing agents 116 or a subset of capturing agents 116. For example, a collector can be assigned to a subset of capturing agents 116 so the data received by that specific collector is limited to data from the subset of capturing agents 116. Collectors 118 can be configured to aggregate data from all capturing agents 116 and/or a subset of capturing agents 116. Further, collectors 118 can be configured to analyze some or all of the data reported by capturing agents 116.
Environment 100 can include one or more analytics engines 120 configured to analyze the data reported to collectors 118. For example, engines 120 can be configured to receive collected data from collectors 118, aggregate the data, analyze the data (individually and/or aggregated), generate reports, identify conditions, compute statistics, visualize reported data, troubleshoot conditions, visualize the network and/or portions of the network (e.g., a tenant space), generate alerts, identify patterns, calculate misconfigurations, identify errors, generate suggestions, generate testing, detect compromised elements (e.g., capturing agents 116, devices, servers, switches, etc.), and/or perform any other analytics functions.
Engines 120 can include one or more modules or software programs for performing such analytics. Further, engines 120 can reside on one or more servers, devices, VMs, nodes, etc. For example, engines 120 can be separate VMs or servers, an individual VM or server, or a cluster of servers or applications. Engines 120 can reside within the fabric 112, within the L2 network, outside of the environment 100 (e.g., WAN 114), in one or more segments or networks coupled with the fabric 112 (e.g., overlay network coupled with the fabric 112), etc. Engines 120 can be coupled with the fabric 112 via the leaf switches 104, for example.
While collectors 118 and engines 120 are shown as separate entities, this is simply a non-limiting example for illustration purposes, as other configurations are also contemplated herein. For example, any of collectors 118 and engines 120 can be part of a same or separate entity. Moreover, any of the collector, aggregation, and analytics functions can be implemented by one entity (e.g., a collector 118 or engine 120) or separately implemented by multiple entities (e.g., engines 120 and/or collectors 118).
Each of the capturing agents 116 can use a respective address (e.g., internet protocol (IP) address, port number, etc.) of their host to send information to collectors 118 and/or any other destination. Collectors 118 may also be associated with their respective addresses such as IP addresses. Moreover, capturing agents 116 can periodically send information about flows they observe to collectors 118. Capturing agents 116 can be configured to report each and every flow they observe or a subset of flows they observe. For example, capturing agents 116 can report every flow always, every flow within a period of time, every flow at one or more intervals, or a subset of flows during a period of time or at one or more intervals.
Capturing agents 116 can report a list of flows that were active during a period of time (e.g., between the current time and the time of the last report). The consecutive periods of time of observance can be represented as pre-defined or adjustable time series. The series can be adjusted to a specific level of granularity. Thus, the time periods can be adjusted to control the level of details in statistics and can be customized based on specific requirements or conditions, such as security, scalability, bandwidth, storage, etc. The time series information can also be implemented to focus on more important flows or components (e.g., VMs) by varying the time intervals. The communication channel between a capturing agent and collector 118 can also create a flow in every reporting interval. Thus, the information transmitted or reported by capturing agents 116 can also include information about the flow created by the communication channel.
When referring to a capturing agent's host herein, the host can refer to the physical device or component hosting the capturing agent server, networking device, ASIC, etc.), the virtualized environment hosting the capturing agent (e.g., hypervisor, virtual machine, etc.), the operating system hosting the capturing agent (e.g., guest operating system, host operating system, etc.), and/or system layer hosting the capturing agent (e.g., hardware layer, operating system layer, hypervisor layer, virtual machine layer, etc.).
FIG. 2A illustrates a schematic diagram of an example capturing agent deployment 200 in a server 106.sub.A. Server 106.sub.A can execute and host one or more VMs 110.sub.A-N (collectively "110"). VMs 110 can be configured to run workloads (e applications, services, processes, functions, etc.) based on hardware resources 210 on server 106.sub.A. VMs 110 can run on guest operating systems 204.sub.A-N (collectively "204") on a virtual operating platform provided by hypervisor 108.sub.A. Each VM 110 can run a respective guest operating system 204 which can be the same or different as other guest operating systems 204 associated with other VMs 110 on server 106.sub.A. Each of guest operating systems 204 can execute one or more processes, which may in turn be programs, applications, modules, drivers, services, widgets, etc. Moreover, each VM 110 can have one or more network addresses, such as an internet protocol (IP) address. VMs 110 can thus communicate with hypervisor 108.sub.A, server 106.sub.A, and/or any remote devices or networks using the one or more network addresses.
Hypervisor 108.sub.A (otherwise known as a virtual machine manager or monitor) can be a layer of software, firmware, and/or hardware that creates and runs VMs 110. Guest operating systems 204 running on VMs 110 can share virtualized hardware resources created by hypervisor 108.sub.A. The virtualized hardware resources can provide the illusion of separate hardware components. Moreover, the virtualized hardware resources can perform as physical hardware components (e.g., memory, storage, processor, network interface, peripherals, etc.), and can be driven by hardware resources 210 on server 106.sub.A. Hypervisor 108.sub.A can have one or more network addresses, such as an internet protocol (IP) address, to communicate with other devices, components, or networks. For example, hypervisor 108.sub.A can have a dedicated IP address which it can use to communicate with VMs 110, server 106.sub.A, and/or any remote devices or networks.
Hypervisor 108.sub.A can be assigned a network address, such as an IP, with a global scope. For example, hypervisor 108.sub.A can have an IP that can be reached or seen by VMs 110.sub.A-N as well any other devices in the network environment 100 illustrated in FIG. 1. On the other hand. VMs 110 can have a network address, such as an IP, with a local scope. For example, VM 110.sub.A can have an IP that is within a local network segment where VM 110.sub.A resides and/or which may not be directly reached or seen from other network segments in the network environment 100.
Hardware resources 210 of server 106.sub.A can provide the underlying physical hardware that drive operations and functionalities provided by server 106.sub.A, hypervisor 108.sub.A, and VMs 110. Hardware resources 210 can include, for example, one or more memory resources, one or more storage resources, one or more communication interfaces, one or more processors, one or more circuit boards, one or more buses, one or more extension cards, one or more power supplies, one or more antennas, one or more peripheral components, etc.
Server 106.sub.A can also include one or more host operating systems (not shown). The number of host operating systems can vary by configuration. For example, some configurations can include a dual boot configuration that allows server 106.sub.A to boot into one of multiple host operating systems. In other configurations, server 106.sub.A may run a single host operating system. Host operating systems can run on hardware resources 210. In some cases, hypervisor 108.sub.A can run on, or utilize, a host operating system on server 106.sub.A. Each of the host operating systems can execute one or more processes, which may be programs, applications, modules, drivers, services, widgets, etc.
Server 106.sub.A can also have one or more network addresses, such as an IP address, to communicate with other devices, components, or networks. For example, server 106.sub.A can have an IP address assigned to a communications interface from hardware resources 210, which it can use to communicate with VMs 110, hypervisor 108.sub.A, leaf router 104.sub.A in FIG. 1, collectors 118 in FIG. 1, and/or any remote devices or networks.
VM capturing agents 202.sub.A-N (collectively "202") can be deployed on one or more of VMs 110. VM capturing agents 202 can be data and packet inspection agents or sensors deployed on VMs 110 to capture packets, flows, processes, events, traffic, and/or any data flowing into, out of, or through VMs 110. VM capturing agents 202 can be configured to export or report any data collected or captured by the capturing agents 202 to a remote entity, such as collectors 118, for example. VM capturing agents 202 can communicate or report such data using a network address of the respective VMs 110 VM IP address).
VM capturing agents 202 can capture and report any traffic (e.g., packets, flows, etc.) sent, received, generated, and/or processed by VMs 110. For example, capturing agents 202 can report every packet or flow of communication sent and received by VMs 110. Such communication channel between capturing agents 202 and collectors 108 creates a flow in every monitoring period or interval and the flow generated by capturing agents 202 may be denoted as a control flow. Moreover, any communication sent or received by VMs 110, including data reported from capturing agents 202, can create a network flow. VM capturing agents 202 can report such flows in the form of a control flow to a remote device, such as collectors 118 illustrated in FIG. 1.
VM capturing agents 202 can report each flow separately or aggregated with other flows. When reporting a flow via a control flow, VM capturing agents 202 can include a capturing agent identifier that identifies capturing agents 202 as reporting the associated flow. VM capturing agents 202 can also include in the control flow a flow identifier, an IP address, a timestamp, metadata, a process ID, an OS username associated with the process ID, a host or environment descriptor (e.g., type of software bridge or virtual network card, type of host such as a hypervisor or VM, etc.), and any other information, as further described below. In addition, capturing agents 202 can append the process and user information (i.e., which process and/or user is associated with a particular flow) to the control flow. The additional information as identified above can be applied to the control how as labels. Alternatively, the additional information can be included as part of a header, a trailer, or a payload.
VM capturing agents 202 can also report multiple flows as a set of flows. When reporting a set of flows, VM capturing agents 202 can include a flow identifier for the set of flows and/or a flow identifier for each flow in the set of flows. VM capturing agents 202 can also include one or more timestamps and other information as previously explained.
VM capturing agents 202 can run as a process, kernel module, or kernel driver on guest operating systems 204 of VMs 110. VM capturing agents 202 can thus monitor any traffic sent, received, or processed by VMs 110, any processes running on guest operating systems 204, any users and user activities on guest operating system 204, any workloads on VMs 110, etc.
Hypervisor capturing agent 206 can be deployed on hypervisor 108.sub.A. Hypervisor capturing agent 206 can be a data inspection agent or sensor deployed on hypervisor 108.sub.A to capture traffic (e.g., packets, flows, etc.) and/or data flowing through hypervisor 108.sub.A. Hypervisor capturing agent 206 can be configured to export or report any data collected or captured by hypervisor capturing agent 206 to a remote entity, such as collectors 118, for example. Hypervisor capturing agent 206 can communicate or report such data using a network address of hypervisor 108.sub.A, such as an IP address of hypervisor 108.sub.A.
Because hypervisor 108.sub.A can see traffic and data originating from VMs 110, hypervisor capturing agent 206 can also capture and report any data (e.g., traffic data) associated with VMs 110. For example, hypervisor capturing agent 206 can report every packet or flow of communication sent or received by VMs 110 and/or VM capturing agents 202. Moreover, any communication sent or received by hypervisor 108.sub.A, including data reported from hypervisor capturing agent 206, can create a network flow. Hypervisor capturing agent 206 can report such flows in the form of a control flow to a remote device, such as collectors 118 illustrated in FIG. 1. Hypervisor capturing agent 206 can report each flow separately and/or in combination with other flows or data.
When reporting a flow, hypervisor capturing agent 206 can include a capturing agent identifier that identifies hypervisor capturing agent 206 as reporting the flow. Hypervisor capturing agent 206 can also include in the control flow a flow identifier, an IP address, a timestamp, metadata, a process ID, and any other information, as explained below. In addition, capturing agents 206 can append the process and user information (i.e., which process and/or user is associated with a particular flow) to the control flow. The additional information as identified above can be applied to the control flow as labels. Alternatively, the additional information can be included as part of a header, a trailer, or a payload.
Hypervisor capturing agent 206 can also report multiple flows as a set of flows. When reporting a set of flows, hypervisor capturing agent 206 can include a flow identifier for the set of flows and/or a flow identifier for each flow in the set of flows. Hypervisor capturing agent 206 can also include one or more timestamps and other information as previously explained, such as process and user information.
As previously explained, any communication captured or reported by VM capturing agents 202 can flow through hypervisor 108.sub.A. Thus, hypervisor capturing agent 206 can observe and capture any flows or packets reported by VM capturing agents 202, including any control flows. Accordingly, hypervisor capturing agent 206 can also report any packets or flows reported by VM capturing agents 202 and any control flows generated by VM capturing agents 202. For example, VM capturing agent 202.sub.A on VM 1 (110.sub.A) captures flow 1 ("F1") and reports F1 to collector 118 on FIG. 1. Hypervisor capturing agent 206 on hypervisor 108.sub.A can also see and capture F1, as F1 would traverse hypervisor 108.sub.A when being sent or received by VM 1 (110.sub.A). Accordingly, hypervisor capturing agent 206 on hypervisor 108.sub.A can also report F1 to collector 118. Thus, collector 118 can receive a report of F1 from VM capturing agent 202.sub.A on VM 1 (110.sub.A) and another report of F1 from hypervisor capturing agent 206 on hypervisor 108.sub.A.
When reporting F1, hypervisor capturing agent 206 can report F1 as a message or report that is separate from the message or report of F1 transmitted by VM capturing agent 202.sub.A on VM 1 (110.sub.A). However, hypervisor capturing agent 206 can also, or otherwise, report F1 as a message or report that includes or appends the message or report of F1 transmitted by VM capturing agent 202.sub.A on VM 1 (110.sub.A). In other words, hypervisor capturing agent 206 can report F1 as a separate message or report from VM capturing agent 202.sub.A's message or report of F1, and/or a same message or report that includes both a report of F1 by hypervisor capturing agent 206 and the report of F1 by VM capturing agent 202.sub.A at VM 1 (110.sub.A). In this way, VM capturing agents 202 at VMs 110 can report packets or flows received or sent by VMs 110, and hypervisor capturing agent 206 at hypervisor 108.sub.A can report packets or flows received or sent by hypervisor 108.sub.A, including any flows or packets received or sent by VMs 110 and/or reported by VM capturing agents 202.
Hypervisor capturing agent 206 can run as a process, kernel module, or kernel driver on the host operating system associated with hypervisor 108.sub.A. Hypervisor capturing agent 206 can thus monitor any traffic sent and received by hypervisor 108.sub.A, any processes associated with hypervisor 108.sub.A, etc.
Server 106.sub.A can also have server capturing agent 208 running on it. Server capturing agent 208 can be a data inspection agent or sensor deployed on server 106.sub.A to capture data (e.g., packets, flows, traffic data, etc.) on server 106.sub.A. Server capturing agent 208 can be configured to export or report any data collected or captured by server capturing agent 206 to a remote entity, such as collector 118, for example. Server capturing agent 208 can communicate or report such data using a network address of server 106.sub.A, such as an IP address of server 106.sub.A.
Server capturing agent 208 can capture and report any packet or flow of communication associated with server 106.sub.A. For example, capturing agent 208 can report every packet or flow of communication sent or received by one or more communication interfaces of server 106.sub.A. Moreover, any communication sent or received by server 106.sub.A, including data reported from capturing agents 202 and 206, can create a network flow associated with server 106.sub.A. Server capturing agent 208 can report such flows in the form of a control flow to a remote device, such as collector 118 illustrated in FIG. 1. Server capturing agent 208 can report each flow separately or in combination. When reporting a flow, server capturing agent 208 can include a capturing agent identifier that identities server capturing agent 208 as reporting the associated flow. Server capturing agent 208 can also include in the control flow a flow identifier, an IP address, a timestamp, metadata, a process ID, and any other information. In addition, capturing agent 208 can append the process and user information (i.e., which process and/or user is associated with a particular flow) to the control flow. The additional information as identified above can be applied to the control flow as labels. Alternatively, the additional information can be included as part of a header, a trailer, or a payload.
Server capturing agent 208 can also report multiple flows as a set of flows. When reporting a set of flows, server capturing agent 208 can include a flow identifier for the set of flows and/or a flow identifier for each flow in the set of flows. Server capturing agent 208 can also include one or more timestamps and other information as previously explained.
Any communications captured or reported by capturing agents 202 and 206 can flow through server 106.sub.A. Thus, server capturing agent 208 can observe or capture any flows or packets reported by capturing agents 202 and 206. In other words, network data observed by capturing agents 202 and 206 inside VMs 110 and hypervisor 108.sub.A can be a subset of the data observed by server capturing agent 208 on server 106.sub.A. Accordingly, server capturing agent 208 can report any packets or flows reported by capturing agents 202 and 206 and any control flows generated by capturing agents 202 and 206. For example, capturing agent 202.sub.A on VM 1 (110.sub.A) captures flow 1 (F1) and reports F1 to collector 118 as illustrated on FIG. 1. Capturing agent 206 on hypervisor 108.sub.A can also observe and capture F1, as F1 would traverse hypervisor 108.sub.A when being sent or received by VM 1 (110.sub.A). In addition, capturing agent 206 on server 106.sub.A can also see and capture F1, as F1 would traverse server 106.sub.A when being sent or received by VM 1 (110.sub.A) and hypervisor 108.sub.A. Accordingly, capturing agent 208 can also report F1 to collector 118. Thus, collector 118 can receive a report (i.e., control flow) regarding F1 from capturing agent 202.sub.A on VM 1 (110.sub.A), capturing agent 206 on hypervisor 108.sub.A, and capturing agent 208 on server 106.sub.A.
When reporting F1, server capturing agent 208 can report F1 as a message or report that is separate from any messages or reports of F1 transmitted by capturing agent 202.sub.A on VM 1 (110.sub.A) or capturing agent 206 on hypervisor 108.sub.A. However, server capturing agent 208 can also, or otherwise, report F1 as a message or report that includes or appends the messages or reports or metadata of E1 transmitted by capturing agent 202.sub.A on VM 1 (110.sub.A) and capturing agent 206 on hypervisor 108.sub.A. In other words, server capturing agent 208 can report F1 as a separate message or report from the messages or reports of F1 from capturing agent 202.sub.A and capturing agent 206, and/or a same message or report that, includes a report of F1 by capturing agent 202.sub.A, capturing agent 206, and capturing agent 208. In this way, capturing agents 202 at VMs 110 can report packets or flows received or sent by VMs 110, capturing agent 206 at hypervisor 108.sub.A can report packets or flows received or sent by hypervisor 108.sub.A, including any flows or packets received or sent by VMs 110 and reported by capturing agents 202, and capturing agent 208 at server 106.sub.A can report packets or flows received or sent by server 106.sub.A, including any flows or packets received or sent by VMs 110 and reported by capturing agents 202, and any flows or packets received or sent by hypervisor 108.sub.A and reported by capturing agent 206.
Server capturing agent 208 can run as a process, kernel module, or kernel driver on the host operating system or a hardware component of server 106.sub.A. Server capturing agent 208 can thus monitor any traffic sent and received by server 106.sub.A, any processes associated with server 106.sub.A, etc.
In addition to network data, capturing agents 202, 206, and 208 can capture additional information about the system or environment in which they reside. For example, capturing agents 202, 206, and 208 can capture data or metadata of active or previously active processes of their respective system or environment, operating system user identifiers, metadata of files on their respective system or environment, timestamps, network addressing information, flow identifiers, capturing agent identifiers, etc. Capturing agents 202, 206, and 208
Moreover, capturing agents 202, 206, 208 are not specific to any operating system environment, hypervisor environment, network environment, or hardware environment. Thus, capturing agents 202, 206, and 208 can operate in any environment.
As previously explained, capturing agents 202, 206, and 208 can send information about the network traffic they observe. This information can be sent to one or more remote devices, such as one or more servers, collectors, engines, etc. Each capturing agent can be configured to send respective information using a network address, such as an IP address, and any other communication details, such as port number, to one or more destination addresses or locations. Capturing agents 202, 206, and 208 can send metadata about one or more flows, packets, communications, processes, events, etc.
Capturing agents 202, 206, and 208 can periodically report information about each flow or packet they observe. The information reported can contain a list of flows or packets that were active during a period of time (e.g., between the current time and the time at which the last information was reported). The communication channel between the capturing agent and the destination can create a flow in every interval. For example, the communication channel between capturing agent 208 and collector 118 can create a control flow. Thus, the information reported by a capturing agent can also contain information about this control flow. For example, the information reported by capturing agent 208 to collector 118 can include a list of flows or packets that were active at hypervisor 108.sub.A during a period of time, as well as information about the communication channel between capturing agent 206 and collector 118 used to report the information by capturing agent 206.
FIG. 2B illustrates a schematic diagram of example capturing agent deployment 220 in an example network device. The network device is described as leaf router 104.sub.A, as illustrated in FIG. 1. However, this is for explanation purposes. The network device can be any other network device, such as any other switch, router, etc.
In this example, leaf router 104.sub.A can include network resources 222, such as memory, storage, communication, processing, input, output, and other types of resources. Leaf router 104.sub.A can also include operating system environment 224. The operating system environment 224 can include any operating system, such as a network operating system, embedded operating system, etc. Operating system environment 224 can include processes, functions, and applications for performing networking, routing, switching, forwarding, policy implementation, messaging, monitoring, and other types of operations.
Leaf router 104.sub.A can also include capturing agent 226. Capturing agent 226 can be an agent or sensor configured to capture network data, such as flows or packets, sent received, or processed by leaf router 104.sub.A. Capturing agent 226 can also be configured to capture other information, such as processes, statistics, users, alerts, status information, device information, etc. Moreover, capturing agent 226 can be configured to report captured data to a remote device or network, such as collector 118 shown in FIG. 1, for example. Capturing agent 226 can report information using one or more network addresses associated with leaf router 104.sub.A or collector 118. For example, capturing agent 226 can be configured to report information using an IP assigned to an active communications interface on leaf router 104.sub.A.
Leaf router 104.sub.A can be configured to route traffic to and from other devices or networks, such as server 106.sub.A. Accordingly, capturing agent 226 can also report data reported by other capturing agents on other devices. For example, leaf router 104.sub.A can be configured to route traffic sent and received by server 106.sub.A to other devices. Thus, data reported from capturing agents deployed on server 106.sub.A, such as VM and hypervisor capturing agents on server 106.sub.A, would also be observed by capturing agent 226 and can thus be reported by capturing agent 226 as data observed at leaf router 104.sub.A. Such report can be a control flow generated by capturing agent 226. Data reported by the VM and hypervisor capturing agents on server 106.sub.A can therefore be a subset of the data reported by capturing agent 226.
Capturing agent 226 can run as a process or component (e.g., firmware, module, hardware device, etc.) in leaf router 104.sub.A. Moreover, capturing agent 226 can be installed on leaf router 104.sub.A as a software or firmware agent. In some configurations, leaf router 104.sub.A itself can act as capturing agent 226. Moreover, capturing agent 226 can run within operating system 224 and/or separate from operating system 224.
FIG. 2C illustrates a schematic diagram of example reporting system 240 in an example capturing agent topology. The capturing agent topology includes capturing agents along a path from a Virtualized environment (e.g., VM and hypervisor) to the fabric 112.
Leaf router 104.sub.A can route packets or traffic 242 between fabric 112 and server 106.sub.A, hypervisor 108.sub.A, and VM 110.sub.A. Packets or traffic 242 between VM 110.sub.A and leaf router 104.sub.A can flow through hypervisor 108.sub.A and server 106.sub.A. Packets or traffic 242 between hypervisor 108.sub.A and leaf router 104.sub.A can flow through server 106.sub.A. Finally, packets or traffic 242 between server 106.sub.A and leaf router 104.sub.A can flow directly to leaf router 104.sub.A. However, in some cases, packets or traffic 242 between server 106.sub.A and leaf router 104.sub.A can flow through one or inure intervening devices or networks, such as a switch or a firewall.
Moreover, VM capturing agent 202.sub.A at VM 110.sub.A, hypervisor capturing agent 206.sub.A at hypervisor 108.sub.A, network device capturing agent 226 at leaf router 104.sub.A, and any server capturing agent at server 106.sub.A (e.g., capturing agent running on host environment of server 106.sub.A) can send reports 244 (also refereed to as control flows) to collector 118 based on the packets or traffic 242 captured at each respective capturing agent. Reports 244 from VM capturing agent 202.sub.A to collector 118 can flow through VM 110.sub.A, hypervisor 108.sub.A, server 106.sub.A, and leaf router 104.sub.A. Reports 244 from hypervisor capturing agent 206.sub.A to collector 118 can flow through hypervisor 108.sub.A, server 106.sub.A, and leaf router 104.sub.A. Reports 244 from any other server capturing agent at server 106.sub.A to collector 118 can flow through server 106.sub.A and leaf router 104.sub.A. Finally, reports 244 from network device capturing agent 226 to collector 118 can flow through leaf router 104.sub.A. Although reports 244 are depicted as being routed separately from traffic 242 in FIG. 2C, one of ordinary skill in the art will understand that reports 244 and traffic 242 can be transmitted through the same communication channel(s).
Reports 244 can include any portion of packets or traffic 242 captured at the respective capturing agents. Reports 244 can also include other information, such as timestamps, process information, capturing agent identifiers, flow identifiers, flow statistics, notifications, logs, user information, system information, etc. Some or all of this information can be appended to reports 244 as one or more labels, metadata, or as part of the packet(s)' header, trailer, or payload. For example, if a user opens a browser on VM 110.sub.A and navigates to examplewebsite.com, VM capturing agent 202.sub.A of VM 110.sub.A can determine which user (i.e., operating system user) of VM 110.sub.A (e.g., username "johndoe85") and which process being executed on the operating system of VM 110.sub.A (e.g., "chrome.exe") were responsible for the particular network flow to and from examplewebsite.com. Once such information is determined, the information can be included in report 244 as labels for example, and report 244 can be transmitted from VM capturing agent 202.sub.A to collector 118. Such additional information can help system 240 to gain insight into flow information at the process and user level, for instance. This information can be used for security, optimization, and determining structures and dependencies within system 240.
In some examples, the reports 244 can include various statistics and/or usage information reported by the respective capturing agents. For example, the reports 244 can indicate an amount of traffic captured by the respective capturing agent, which can include the amount of traffic sent, received, and generated by the capturing agent's host; a type of traffic captured, such as video, audio, Web (e.g., HTTP or HTTPS), database queries, application traffic, etc.; a source and/or destination of the traffic, such as a destination server or application, a source network or device, a source or destination address or name (e.g., IP address, DNS name, FQDN, packet label, MAC address, VLAN, VNID, VxLAN, source or destination domain, etc.); a source and/or destination port (e.g., port 25, port 80, port 443, port 8080, port 22); a traffic protocol; traffic metadata; etc. The reports 244 can also include indications of traffic or usage patterns and information, such as frequency of communications, intervals, type of requests, type of responses, triggering processes or events (e.g., causality), resource usage, etc.
Each of the capturing agents 202.sub.A, 206.sub.A, 226 can include a respective unique capturing agent identifier on each of reports 244 it sends to collector 118, to allow collector 118 to determine which capturing agent sent the report. Capturing agent identifiers in reports 244 can also be used to determine which capturing agents reported what flows. This information can then be used to determine capturing agent placement and topology, as further described below, as well as mapping individual flows to processes and users. Such additional insights gained can be useful for analyzing the data in reports 244, as well as troubleshooting, security, visualization, configuration, planning, and management, and so forth.
As previously noted, the topology of the capturing agents can be ascertained from the reports 244. To illustrate, a packet received by VM 110.sub.A from fabric 112 can be captured and reported by VM capturing agent 202.sub.A. Since the packet received by VM 110.sub.A will also flow through leaf router 104.sub.A and hypervisor 108.sub.A, it can also be captured and reported by hypervisor capturing agent 206.sub.A and network device capturing agent 226. Thus, for a packet received by VM 110.sub.A from fabric 112, collector 118 can receive a report of the packet from VM capturing agent 202.sub.A, hypervisor capturing agent 206.sub.A, and network device capturing agent 226.
Similarly, a packet sent by VM 110.sub.A to fabric 112 can be captured and reported by VM capturing agent 202.sub.A. Since the packet sent by VM 110.sub.A will also flow through leaf router 104.sub.A and hypervisor 108.sub.A, it can also be captured and reported by hypervisor capturing agent 206.sub.A and network device capturing agent 226. Thus, for a packet sent by VM 110.sub.A to fabric 112, collector 118 can receive a report of the packet from VM capturing agent 202.sub.A, hypervisor capturing agent 206.sub.A, and network device capturing agent 226.
On the other hand, a packet originating at, or destined to, hypervisor 108.sub.A, can be captured and reported by hypervisor capturing agent 206.sub.A and network device capturing agent 226, but not VM capturing agent 202.sub.A, as such packet may not flow through VM 110.sub.A. Moreover, a packet originating at, or destined to, leaf router 104.sub.A, will be captured and reported by network device capturing agent 226, but not VM capturing agent 202.sub.A, hypervisor capturing agent 206.sub.A, or any other capturing agent on server 106.sub.A, as such packet may not flow through VM 110.sub.A, hypervisor 108.sub.A, or server 106.sub.A.
In another example, if the reports 244 indicate that the VM capturing agent 202 has been generating unexpected, improper, or excessive traffic, such as sending packets or commands to a new or different device other than collector 118--or other than any other system with which VM capturing agent 202 is expected or configured to communicate with--or sending the wrong types of packets (e.g., other than reports 244) or sending traffic at unexpected times or events (e.g., without being triggered by a predefined setting or event such as the capturing of a packet processed by the host), then one can assume that VM capturing agent 202 has been compromised or is being manipulated by an unauthorized user or device.
Reports 244 can be transmitted to collector 118 periodically as new packets or traffic 242 are captured by a capturing agent, or otherwise based on a schedule, interval, or event, for example. Further, each capturing agent can send a single report or multiple reports to collector 118 For example, each of the capturing agents can be configured to send a report to collector 118 for every flow, packet, message, communication, or network data received, transmitted, and/or generated by its respective host (e.g., VM 110.sub.A, hypervisor 108.sub.A, server 106.sub.A, and leaf router 104.sub.A). As such, collector 118 can receive a report of a same packet from multiple capturing agents. In other examples, one or more capturing agents can be configured to send a report to collector 118 for one or more flows, packets, messages, communications, network data, or subset(s) thereof, received, transmitted, and/or generated by the respective host during a period of time or interval.
FIG. 3 illustrates a schematic diagram of an example configuration 300 for collecting capturing agent reports (i.e., control flows). In configuration 300, traffic between fabric 112 and VM 110.sub.A is configured to flow through hypervisor 108.sub.A. Moreover, traffic between fabric 112 and hypervisor 108.sub.A is configured to flow through leaf router 104.sub.A.
VM capturing agent 202.sub.A can be configured to report to collector 118 traffic sent, received, or processed by VM 110.sub.A. Hypervisor capturing agent 210 can be configured to report to collector 118 traffic sent, received, or processed by hypervisor 108.sub.A. Finally, network device capturing agent 226 can be configured to report to collector 118 traffic sent, received, or processed by leaf router 104.sub.A.
Collector 118 can thus receive flows 302 from VM capturing agent 202.sub.A, flows 304 from hypervisor capturing agent 206.sub.A, and flows 306 from network device capturing agent 226. Flows 302, 304, and 306 can include control flows. Flows 302 can include flows captured by VM capturing agent 202.sub.A at VM 110.sub.A.
Flows 304 can include flows captured by hypervisor capturing agent 206.sub.A at hypervisor 108.sub.A. Flows captured by hypervisor capturing agent 206.sub.A can also include flows 302 captured by VM capturing agent 202.sub.A, as traffic sent and received by VM 110.sub.A will be received and observed by hypervisor 108.sub.A and captured by hypervisor capturing agent 206.sub.A.
Flows 306 can include flows captured by network device capturing agent 226 at leaf router 104.sub.A. Flows captured by network device capturing agent 226 can also include flows 302 captured by VM capturing agent 202.sub.A and flows 304 captured by hypervisor capturing agent 206.sub.A, as traffic sent and received by VM 110.sub.A and hypervisor 108.sub.A is routed through leaf router 104.sub.A and can thus be captured by network device capturing agent 226.
Collector 118 can collect flows 302, 304, and 306, and store the reported data. Collector 118 can also forward some or all of flows 302, 304, and 306, and/or any respective portion thereof to engine 120. Engine 120 can process the information, including any information about the capturing agents (e.g., agent placement, agent environment, etc.) and/or the captured traffic (e.g., statistics), received from collector 118 to identify patterns, conditions, network or device characteristics; log statistics or history details; aggregate and/or process the data; generate reports, timelines, alerts, graphical user interfaces; detect errors, events, inconsistencies; troubleshoot networks or devices; configure networks or devices; deploy services or devices; reconfigure services, applications, devices, or networks; etc.
Collector 118 and/or engine 120 can map individual flows that traverse VM 110.sub.A, hypervisor 108.sub.A, and/or leaf router 104.sub.A to the specific capturing agents at VM 110.sub.A, hypervisor 108.sub.A, and/or leaf router 104.sub.A. For example, collector 118 or engine 120 can determine that a particular flow that originated from VM 110.sub.A and destined for fabric 112 was sent by VM 110.sub.A and such flow was reported by VM capturing agent 202. It may be determined that the same flow was received by a process named Z on hypervisor 108.sub.A and forwarded to a process named W on leaf router 104.sub.A and also reported by hypervisor capturing agent 206.
While engine 120 is illustrated as a separate entity, other configurations are also contemplated herein. For example, engine 120 can be part of collector 118 and/or a separate entity. Indeed, engine 120 can include one or more devices, applications, nodules, databases, processing components, elements, etc. Moreover, collector 118 can represent one or more collectors. For example, in some configurations, collector 118 can include multiple collection systems or entities, which can reside in one or more networks.
Having disclosed some basic system components and concepts, the disclosure now turns to the exemplary method embodiment shown in FIG. 4. For the sake of clarity, the method is described in terms of collector 118 and capturing agents 116, as shown in FIG. 1, configured to practice the various steps in the method. However, the example methods can be practiced by any software or hardware components, devices, etc. heretofore disclosed. The steps outlined herein are exemplary and can be implemented in any combination thereof in any order, including combinations that exclude, add, or modify certain steps.
The current disclosure provides a methodology and technique for observing and capturing information about network traffic in a datacenter. While most network traffic is legitimate, some network traffic is generated by malicious code for the purpose of data theft or for other malicious intent like communication with a remote command and control server. Malicious entities (e.g., rootkits, malware) have it in their best interest to hide their associated processes in the flows from administrators, firewalls, or IDS systems. A process can be hidden at multiple levels depending on the sophistication of the malicious code and level of infection. It is possible to send traffic out of a compute environment without being detected by any packet capture agent or the OS itself installed on that compute node. It is also possible to send traffic out with one or more processes being hidden in the flow. However, once placed on the physical network, these packets will have to pass through the networking gear (switch, etc.) attached to the compute environment.
The present disclosure leverages the that packets must pass through the network to identify a hidden process in a flow. Note that for packets coming out of a virtual NIC, the packets will have to always pass through a virtual switch or virtual bridge, or something similar based on the hypervisor technology. In all cases, a network capture agent sitting outside the above mentioned compute environment, and observing packets on the interface which receives all the outgoing network traffic, can observe all packets including the ones that are hidden to an observer inside the compute environment or have any hidden processes.
Using at least two observation reference points, out of which at least one is inside the compute environment being monitored and one is outside the compute environment being monitored, the system disclosed herein can detect any hidden processes in network flows.
The goal is to detect a hidden process in a flow, and attribute it back to the compute environment generating such flows. The compute environment can be the same environment from which the packet flows originate or may be some separate environment. Such a compute environment has a high chance of being infected by a malware which is trying to send traffic while hiding a process in the flow to go undetected. Network traffic coming out of a compute environment (whether from a container, VM, hypervisor or physical server) is captured by entities called sensors or capture agents which can be deployed in or inside different environments. Sensors export data or metadata of the observed network activity to collection agents called "Collectors." Collectors can be a group of processes running on a single machine or a cluster of machines. For sake of simplicity we will treat all collectors as one logical entity and refer to it as one Collector in our discussion.
In actual deployment of datacenter scale, there will be more than just one collector, each responsible for handling export data from a group of sensors. The collector is capable of sending the processed or unprocessed data to a cluster of processes responsible for analysis of network data. Pipelines receive the data from collector can be referred to as a cluster of processes. Note that sensors and collectors are not limited to observing and processing just network data, but can also capture other system information like currently active processes, active file handles, socket handles, status of I/O devices, memory, etc.
This patent application focuses on detecting hidden processes in network traffic, and thus the disclosure is focused on just on network data captured by the sensors. Using the network data captured by sensors deployed at various levels and locations, the algorithm disclosed runs a comparison algorithm to solve the problem of detecting hidden processes in flows. The algorithm performs a differential analysis of packets and processes detected and captured at two reference points along a path in order to detect the hidden processes in flows. Once a hidden process in a flow has been identified, the system can take corrective actions and make adjustments to limit the harm caused by malware or threat.
FIG. 4 illustrates a method aspect of this disclosure. An exemplary method can be performed by a system or any computing device whether physical or virtual. The method includes capturing first data associated with a first packet flow originating from a computing device (a first host) using a first capture agent deployed at the computing device to yield first flow data (402), capturing second data associated with a second packet flow originating from the computing device from a second capture agent deployed outside of the computing device (such as a second host) to yield second flow data (404) and comparing the first flow data and the second flow data to yield a difference (406). When the difference is above a threshold value, the method includes determining that a hidden process exists to yield a determination (408). The first data and the second data can include metadata associated respectively with the first packet flow and the second packet flow, network data or packet content data. The first flow data and the second flow data are preferably captured at a collector. The collector receives the first flow data and the second flow data and performs the step of comparing the first flow data and the second flow data. Based on the comparison, the system can identify the computing device as a generator of the hidden process. The system could also identify a different compute environment as the source of the hidden process. Based on the comparison or the determination, the system can perform the step of predicting a presence of a malicious entity within the computing device (410). The system can also take a corrective action (412) such as one or more of: isolating a virtual machine, isolating a container, limiting packets to and from the computing device, requiring all packets to and from the computing device to flow through an operating stack of the computing device, isolating the computing device, shutting down the computing device, and notifying an administrator. Other correcting actions are contemplated herein. Non-limiting examples of correcting actions include, without limitation, blacklisting a source/sender, address, or flow; adjusting the granularity of data captured and/or reported by the capturing agents associated with the hidden traffic; adjusting one or more network or security rules or policies, such as a firewall rule, an access policy, a traffic or resource allocation policy, a policy defining the availability and/or use of resources by elements associated with the hidden traffic and/or for processing the hidden network traffic; flagging the hidden traffic; separating the hidden traffic from other traffic collected (e.g., maintaining the hidden traffic at a separate location, log, and/or storage), etc.
The malicious entity of course can be in any host whether it is a physical and/or software switch, a physical or virtual server, a computing device, a hypervisor, a virtual machine, a container, an operating system (e.g., host operating system, guest operating system, kernel, etc.), an ASIC (application specific integrated circuit), a controller (e.g., BMC), a memory device, a virtual workload, and so forth. The malicious entity or hidden traffic generator can infect any physical, virtual/software device or host. Additional information about the packet flows can be derived from one or more external, such as malware trackers or lookup databases (e.g., whois, etc.), and/or data obtained from the various layers of a network including a physical layer, a hypervisor layer and a virtual layer. The packet flow data from the various capture agents can be based, at least in part, on capture agents configured in a device hardware layer 104.sub.A, a hypervisor layer 108.sub.A, and/or a virtual machine layer 110.sub.A. The data obtained from these capture agents can also be coordinated with external data or other data to arrive at conclusions about the packet flow.
With the information at the various levels, increased fine tuning in terms of identifying hidden processes can occur with respect to identifying more specific details about the packet flow at various layers. For example, detecting traffic flow information between different layers such as at a hypervisor as well as one of its virtual machines, can provide data to identify a hidden process and particularly a process that seeks to bypass an operating system layer in the entity which is hosting the course of the hidden process.
The hypervisors will each have a virtual or software switch and each virtual machine can also have a virtual network interface. With the disclosure, one can analyze the behavior of these virtual switches and/or virtual network interfaces and use that data for identifying hidden processes. Various inferences can be made based on behavior detected at different layers and/or by different components (e.g., physical or virtual switches, virtual network interfaces, etc.). Information about the topology of the various hosts and/or capturing agents can be helpful when analyzing the reported data for determining malicious activity or hidden processes or traffic. For example, traffic captured by an agent residing at a virtual machine should also be reported by the agent residing at the hypervisor hosting the virtual machine.
With knowledge about the topology, identity, settings, and type of hosts involved in a reported communication, specific inferences can be made if the captured and/or reported data indicates a pattern or deviation from the activity or behavior expected based on such knowledge. In other examples, knowledge about the corresponding forwarding models or patterns for each of the different layers or switching elements (e.g., software switch at a hypervisor, virtual network interface at virtual machine, etc.) can be considered along with the reported data from the capturing agents to infer malicious activity or abnormal behavior.
FIG. 5 illustrates a listing 500 of example fields on a capturing agent report. The listing 500 can include one or more fields, such as:
Flow identifier (e.g., unique identifier associated with the flow).
Capturing agent identifier (e.g., data uniquely identifying reporting capturing agent).
Timestamp (e.g., time of event, report, etc.).
Interval (e.g., time between current report and previous report, interval between flows or packets, interval between events, etc.).
Duration (e.g., duration of event, duration of communication, duration of flow duration of report, etc.).
Flow direction (e.g., egress flow, ingress flow, etc.).
Application identifier (e.g., identifier of application associated with flow, process, event, or data).
Port (e.g., source port, destination port, layer 4 port, etc.).
Destination address (e.g., interface address associated with destination. IP address, domain name, network address, hardware address, virtual address, physical address, etc.).
Source address (e.g., interface address associated with source, IP address, domain name, network address, hardware address, virtual address, physical address, etc.).
Interface (e.g., interface address, interface information, etc.).
References
-
asd.gov.au/infosec/top-mitigations/top-4-strategies-explained.htm
-
dambaia.com
-
mdpi.com/joumal/entropy
-
www/cisco.com/c/en/us/support/docs/security-vpn/lock-key/7604-13.html
-
researchgate.net/publication/221536306
-
internetperils.com
-
searchdatacenter.techtarget.com/news/118820/Get-to-know-your-data-center-with-CMDB
-
docs.hol.vmware.com/HOL-2013/holsdc-1301_html_en
-
jfrog.com/confluence/display/DA/Home
-
neverfailgroup.com/products/it-continuity-architect
-
pathwaysystems.com/company-blog
-
-
arxiv.org/abs/1406.2098
-
fipa.org
D00000
D00001
D00002
D00003
D00004
D00005
D00006
D00007
D00008
XML
uspto.report is an independent third-party trademark research tool that is not affiliated, endorsed, or sponsored by the United States Patent and Trademark Office (USPTO) or any other governmental organization. The information provided by uspto.report is based on publicly available data at the time of writing and is intended for informational purposes only.
While we strive to provide accurate and up-to-date information, we do not guarantee the accuracy, completeness, reliability, or suitability of the information displayed on this site. The use of this site is at your own risk. Any reliance you place on such information is therefore strictly at your own risk.
All official trademark data, including owner information, should be verified by visiting the official USPTO website at www.uspto.gov. This site is not intended to replace professional legal advice and should not be used as a substitute for consulting with a legal professional who is knowledgeable about trademark law.