Detection of chromosomal abnormalities associated with endometrial cancer
Pestova , et al.
U.S. patent number 10,584,388 [Application Number 15/072,222] was granted by the patent office on 2020-03-10 for detection of chromosomal abnormalities associated with endometrial cancer. This patent grant is currently assigned to Abbott Molecular, Mayo Foundation for Medical Eduction And Research. The grantee listed for this patent is ABBOTT MOLECULAR, MAYO FOUNDATION FOR MEDICAL EDUCATION AND RESEARCH. Invention is credited to Kevin C. Halling, Larry E. Morrison, Ekaterina Pestova, Lisa M. Peterson, Jesse S. Voss.


View All Diagrams
| United States Patent | 10,584,388 |
| Pestova , et al. | March 10, 2020 |
Detection of chromosomal abnormalities associated with endometrial cancer
Abstract
The methods and compositions described herein address the need for diagnostic method that could be offered to women during yearly checkups to allow for early detection, diagnosis and classification, and treatment of endometrial cancer. In addition, these methods and compositions address the current need for improving diagnostic accuracy of biopsy procedures in symptomatic patients.
| Inventors: | Pestova; Ekaterina (Glenview, IL), Morrison; Larry E. (Oro Valley, AZ), Voss; Jesse S. (Rochester, MN), Peterson; Lisa M. (Rochester, MN), Halling; Kevin C. (Rochester, MN) | ||||||||||
|---|---|---|---|---|---|---|---|---|---|---|---|
| Applicant: |
|
||||||||||
| Assignee: | Mayo Foundation for Medical
Eduction And Research (Rochester, MN) Abbott Molecular (Des Plaines, IL) |
||||||||||
| Family ID: | 44914629 | ||||||||||
| Appl. No.: | 15/072,222 | ||||||||||
| Filed: | March 16, 2016 |
Prior Publication Data
| Document Identifier | Publication Date | |
|---|---|---|
| US 20160304963 A1 | Oct 20, 2016 | |
Related U.S. Patent Documents
| Application Number | Filing Date | Patent Number | Issue Date | ||
|---|---|---|---|---|---|
| 13951209 | Jul 25, 2013 | ||||
| 13068451 | May 10, 2011 | ||||
| 61395303 | May 10, 2010 | ||||
| Current U.S. Class: | 1/1 |
| Current CPC Class: | C12Q 1/6837 (20130101); C12Q 1/6841 (20130101); C12Q 1/6886 (20130101); C12Q 2600/156 (20130101); C12Q 2600/118 (20130101) |
| Current International Class: | C12Q 1/6886 (20180101); C12Q 1/6837 (20180101); C12Q 1/6841 (20180101) |
References Cited [Referenced By]
U.S. Patent Documents
| 4227537 | October 1980 | Suciu et al. |
| 5143854 | September 1992 | Pirrung et al. |
| 5713369 | February 1998 | Tao et al. |
| 8211634 | July 2012 | DePinho et al. |
| 2004/0248107 | December 2004 | Sokolova |
| 2007/0059747 | March 2007 | Bastian et al. |
| 2011/0281263 | November 2011 | Matthiesen et al. |
| 2012/0065085 | March 2012 | Pestova et al. |
| 2014/0031254 | January 2014 | Pestova et al. |
| WO 93/18186 | Sep 1993 | WO | |||
| WO 96/17958 | Jun 1996 | WO | |||
| WO 96/39154 | Dec 1996 | WO | |||
| WO 97/03211 | Jan 1997 | WO | |||
| WO 2011/142818 | Nov 2011 | WO | |||
Other References
|
Guled (Modern Pathology, 2008, 21, 770-778). cited by examiner . U.S. Office Action dated Mar. 25, 2013 issued in U.S. Appl. No. 13/068,451. cited by applicant . U.S. Office Action dated May 18, 2015 issued in U.S. Appl. No. 13/951,209. cited by applicant . U.S. Final Office Action dated Oct. 16, 2015 issued in U.S. Appl. No. 13/951,209. cited by applicant . PCT Invitation to pay Additional Fees dated Aug. 2, 2011 issued in PCT/US2011/000834 (WO/2011/142818). cited by applicant . PCT International Search Report and Written Opinion dated Oct. 11, 2011 issued in PCT/US2011/000834 (WO/2011/142818). cited by applicant . PCT International Preliminary Report on Patentability and Written Opinion dated Nov. 13, 2012 issued in PCT/US2011/000834 (WO/2011/142818). cited by applicant . European Supplementary Search Report dated Oct. 25, 2013 issued in EP 11 780 917.8. cited by applicant . European Office Action dated Oct. 16, 2014 issued in EP 11 780 917.8. cited by applicant . European Office Action dated Nov. 3, 2015 issued in EP 11 780 917.8. cited by applicant . Altekruse et al. SEER Cancer Statistics Review, 1975-2007, National Cancer Institute. Bethesda, MD, http://seer.cancer.gov/csr/1975_2007/, based on Nov. 2009 SEER data submission, posted to the SEER web site, 2010; pp. 1-3. cited by applicant . Baloglu et al. (2001) "Atypical endometrial hyperplasia shares genomic abnormalities with endometrioid carcinoma by comparative genomic hybridization," Human Pathology 32(6):615-22. cited by applicant . Bansal et al. (2009) "The molecular biology of endometrial cancers and the implications for pathogenesis, classification, and targeted therapies," Cancer Control 16:8-13. cited by applicant . Barringer et al. (1990) "Blunt-end and Single-strand Ligations by Escherichia coli Ligase: Influence on an in Vitro Amplification Scheme," Gene 89(1):117-122. cited by applicant . Bokhman (1983) "Two pathogenetic types of endometrial carcinoma," Gynecologic oncology 15:10-17. cited by applicant . Critchley et al. (2004) "Evaluation of abnormal uterine bleeding: comparison of three outpatient procedures within cohorts defined by age and menopausal status," Health Technol Assess 8(34):iii-iv, 1-158. cited by applicant . Crooke et al. (1993) "Antisense Research and Applications," CRC Press, Table of Contents, pp. 1-3. cited by applicant . Dafou et al. (2009) "Chromosomes 6 and 18 induce neoplastic suppression in epithelial ovarian cancer cells," International Journal of Cancer 124(5):1037-1044. cited by applicant . Del Priore et al. (2001) "Endometrial brush biopsy for the diagnosis of endometrial cancer," J Reprod Med 46(5):439-443. cited by applicant . Eckstein (1991) "Oligonucleotides and Analogues," IRL Press, Table of Contents, pp. 1-11. cited by applicant . Faruqi et al. (2008) "Mixed mullerian tumor of endometrium: A case study with sixteen DNA probes using fluorescent in situ hybridization," Cancer Ther. 6:389-394. cited by applicant . Fles et al. (2010) "Genomic Profile of Endometrial Tumors Depends on Morphological Subtype, Not on Tamoxifen Exposure," Genes, Chromosomes & Cancer 49:699-710. cited by applicant . Fodor et al. (1991) "Light-directed, Spatially Addressable Parallel Chemical Synthesis," Science 251(4995):767-773. cited by applicant . Furlan et al. (2005) "Allelotypes and fluorescence In situ hybridization profiles of poorly differentiated endocrine carcinomas of different sites," Clinical Cancer Research 11:1765-1775. cited by applicant . Grushko et al. (2008) "An exploratory analysis of HER-2 amplification and overexpression in advanced endometrial carcinoma: a Gynecologic Oncology Group study," Gynecologic Oncology 108: 3-9. cited by applicant . Guatelli et al. (1990) "Isothermal, in Vitro Amplification of Nucleic Acids by a Multienzyme Reaction Modeled after Retroviral Replication," PNAS 87(5):1874-1878. cited by applicant . Guido et al. (1995) "Pipelle endometrial sampling. Sensitivity in the detection of endometrial cancer," J Reprod Med 40(8):553-555. cited by applicant . Hirasawa et al. (2003) "Unfavorable prognostic factors associated with high frequency of microsatellite instability and comparative genomic hybridization analysis in endometrial cancer," Clin Cancer Res. 9(15):5675-82. cited by applicant . Innis et al. (1990) "PCR Protocols--A Guide to Methods and Applications," Academic Press Inc., Table of Contents, pp. 1-8. cited by applicant . Kawasaki et al. (2003) "11q23-24 loss is associated with chromosomal instability in endometrial cancer," Int J Mol Med. 12(5):727-731. cited by applicant . Kim et al. (2007) "Analysis of Chromosomal Changes in Serous Ovarian Carcinoma Using High-Resolution Array Comparative Genomic Hybridization: Potential Predictive Markers of Chemoresistant Disease," Genes, Chromosomes & Cancer 46:1-9. cited by applicant . Kipp et al. (2008) "Chromosomal alterations detected by fluorescence in situ hybridization in urothelial carcinoma and rarer histologic variants of bladder cancer," American journal of clinical pathology 130:552-559. cited by applicant . Kipp et al (2008) "Direct uterine sampling with the Tao brush sampler using a liquid-based preparation method for the detection of endometrial cancer and atypical hyperplasia: a feasibility study," Cancer 114(4):228-235. cited by applicant . Konig et al. (Jul. 1996) "Gain and Loss of Chromosomes 1, 7, 8, 10, 18, and Y in 46 Prostate Cancers," Human Pathology, 27(7):720-727. cited by applicant . Kwoh et al (1989) "Transcription-Based Amplification System and Detection of Amplified Human Immunodeficiency Virus Type 1 with a Bead-Based Sandwich Hybridization Format," PNAS 86(16):1173-1177. cited by applicant . Landegren et al. (1988) "A ligase-mediated Gene Detection Technique," Science 241(4869):1077-1080. cited by applicant . Levan et al. (2006) "Chromosomal alterations in 98 endometrioid adenocarcinomas analyzed with comparative genomic hybridization," Cytogenet Genome Res. 115(1):16-22. cited by applicant . Liehr (2004) "Multicolor FISH probe sets and their applications," Histology and Histopathology 19:227-237. cited by applicant . Llobet et al. (2009) "Molecular pathology of endometrial carcinoma: practical aspects from the diagnostic and therapeutic viewpoints," Journal of clinical pathology 62:777-785. cited by applicant . Maksem (2000) "Performance characteristics of the Indiana University Medical Center endometrial sampler (Tao Brush) in an outpatient office setting, first year's outcomes: recognizing histological patterns in cytology preparations of endometrial brushings," Diagn Cytopathol 22(3):186-195. cited by applicant . Mata et al. (1997) "A Hexameric Phosphorothioate Oligonucleotide Telomerase Inhibitor Arrests Growth of Burkitt's Lymphoma Cells in Vitro and in Vivo," Toxicology and Applied Pharmacology 144(1):189-197. cited by applicant . Mayr et al. (2006) "Analysis of Gene Amplification and Prognostic Markers in Ovarian Cancer Using Comparative Genomic Hybridization for Microarrays and Immunohistochemical Analysis for Tissue Microarrays," Am J Clin Pathol. 126(1):101-109. cited by applicant . Micci et al. (2004) "Genomic Aberrations in Carcinomas of Uterine Corpus," Genes, Chromosomes & Cancer 40:229-246. cited by applicant . Milligan et al. (1993) "Current Concepts in Antisense Drug Design," Journal of Medicinal Chemistry 36(14):1923-1937. cited by applicant . Morrison et al. (2002) "Labeling Fluorescence In Situ Hybridization Probes for Genomic Targets," Methods in Molecular Biology 204:21-40. cited by applicant . Morrison et al. (2006) "HER-2 is an independent prognostic factor in endometrial cancer: association with outcome in a large cohort of surgically staged patients," J Clin Oncol 24:2376-2385. cited by applicant . Morrison et al. (2010) "A GOG 210 aCGH study of gain at 1q23 in endometrioid endometrial cancer in the context of racial disparity and outcome," Genes, Chromosomes & Cancer 49:791-802. cited by applicant . Muresu et al. (2002) "Chromosomal abnormalities and microsatellite instability in sporadic endometrial cancer," Eur J Cancer 38:1802-1809. cited by applicant . Muslumanoglu et al. (2005) "Genetic imbalances in endometrial hyperplasia and endometrioid carcinoma detected by comparative genomic hybridization," Eur J Obstet Gynecol Reprod Biol. 120(1):107-114. cited by applicant . Odicino et al. (2008) "HER-2/neu overexpression and amplification in uterine serous papillary carcinoma: comparative analysis of immunohistochemistry, real-time reverse transcription-polymerase chain reaction, and fluorescence in situ hybridization," Inti Gynecol Cancer 18:14-21. cited by applicant . O'Toole et al. (2006) "Genome-wide analysis of deoxyribonucleic acid in endometrial cancer using comparative genomic hybridization microarrays," Int J Gynecol Cancer 16:834-42. cited by applicant . Peiro et al. (2002) "CAS (Cellular Apoptosis Susceptibility) Gene Expression in Ovarian Carcinoma: Correlation With 20q13.2 Copy Number and Cyclin D1, p53, and Rb Protein Expression," Am J Clin Pathol. 118(6): 922-929. cited by applicant . Qian et al. (2010) "Detection of chromosomal anomalies in endometrial atypical hyperplasia and carcinoma by using fluorescence in situ hybridization," Cancer cytopathology 118:97-104. cited by applicant . Riben et al. (1997) "Identification of HER-2/neu oncogene amplification by fluorescence in situ hybridization in stage I endometrial carcinoma," Mod Pathol 10:823-831. cited by applicant . Saffari et al. (1995) "Amplification and overexpression of HER-2/neu (c-erbB2) in endometrial cancers: correlation with overall survival," Cancer Research 55:5693-5698. cited by applicant . Samarnthai et al. (2010) "Molecular profiling of endometrial malignancies," Obstetrics and gynecology international Article ID 162363, 16 Pages. cited by applicant . Sambrook (2001) "Molecular Cloning: A Laboratory Manual," 3rd Edition, Cold Spring D Harbor Laboratory, Table of Contents pp. 1-18. cited by applicant . Samstag (1996) "Synthesis and Properties of New Antisense Oligodeoxynucleotides Containing Benzylphosphonate Linkages," Antisense and Nucleic Acid Drug Development 6(3):153-156. cited by applicant . Samuelson et al. (2008) "Recurrent gene amplifications in human type I endometrial adenocarcinoma detected by fluorescence in situ hybridization," Cancer Genet Cytogenet. 181(1):25-30. cited by applicant . Santin et al. (2005) "Amplification of c-erbB2 oncogene: a major prognostic indicator in uterine serous papillary carcinoma," Cancer 104:1391-1397. cited by applicant . Schulten et al. (2004) "Overrepresentation of 8q in carcinosarcomas and endometrial adenocarcinomas," Am J Clin Pathol. 122(4):546-551. cited by applicant . Shah et al. (1994) "Cytogenetic and FISH analysis of endometrial carcinoma," Cancer Genetics and Cytogenetics 73:142-146. cited by applicant . Sonoda et al. (1997) "Detection of DNA gains and losses in primary endometrial carcinomas by comparative genomic hybridization," Genes Chromosomes & Cancer 18(2):115-25. cited by applicant . Strauss-Soukup et al. (1997) "Effects of Neutralization Pattern and Stereochemistry on DNA Bending by Methylphosphonate Substitutions," Biochemistry 36(29): 8692-8698. cited by applicant . Suehiro et al. (2000) "Genetic aberrations detected by comparative genomic hybridization predict outcome in patients with endometrioid carcinoma," Genes, Chromosomes & Cancer 29:75-82. cited by applicant . Suehiro et al. (2008) "Aneuploidy predicts outcome in patients with endometrial carcinoma and is related to lack of CDH13 hypermethylation," Clin Cancer Res 14:3354-3361. cited by applicant . Susumu et at. (2005) "Diagnostic clinical application of two-color fluorescence in situ hybridization that detects chromosome 1 and 17 alterations to direct touch smear and liquid-based thin-layer cytologic preparations of endometrial cancers," Int J Gynecol Cancer 15:70-80. cited by applicant . Suzuki et al. (1997) "Frequent gains on chromosome aims lq and/or 8q in human endometrial cancer," Hum Genet. 100(5-6):629-36. cited by applicant . Tanner et al. (2000) "Frequent Amplification of Chromosomal Region 20q12-q13 in Ovarian Cancer," Clin Cancer Res. 6(5):1833-1839. cited by applicant . Tijssen et al. (1993) "Hybridization with Nucleic Acid Probes," Laboratory Techniques in Biochemistry and Molecular Biology; Van der VLIET P. C., ed, Elsevier Publisher 24(2):19-78. cited by applicant . Wiklund et al. (2004) "Genetic Analysis of the RNASEL Gene in Hereditary Familial, and Sporadic Prostate Cancer," Clinical Cancer Res. 10(21):7150-7156. cited by applicant . Williams et al. (1999) "Fluorescence in situ hybridization analysis of HER-2/neu, c-myc, and p53 in endometrial cancer," Experimental and molecular pathology 67:135-143. cited by applicant . Williams et al. (2008) "Factors affecting adequacy of Pipelle and Tao Brush endometrial sampling," Bjog 115(8):1028-1036. cited by applicant . Wu et al. (1989) "The Ligation Amplification Reaction (LAR)--Amplification of Specific DNA Sequences Using Sequential Rounds of Template-Dependent Ligation," Genomics 4:560-569. cited by applicant . Yang et al. (2000) "Endometrial biopsy using the Tao Brush method. A study of 50 women in a general gynecologic practice," J Reprod Med 45(2):109-114. cited by applicant . Canadian Office Action dated Feb. 21, 2017 issued in CA 2,798,190. cited by applicant . Canadian Office Action dated Mar. 7, 2018 issued in CA 2,798,190. cited by applicant . Fouladi et al. (2003) "Clear Cell Ependymoma: A Clinicopathologic and Radiographic Analysis of 10 Patients" Cancer 98:2232-44. cited by applicant . Ribeiro et al. (2007) "Relative Copy No. Gain of MYC in Diagnostic Needle Biopsies is an Independent Prognostic Factor for Prostate Cancer Patients" European Urology 52: 116-125. cited by applicant . Canadian Office Action dated Feb. 4, 2019 issued in CA 2,798,190. cited by applicant. |
Primary Examiner: Bausch; Sarae L
Attorney, Agent or Firm: Haliday; Emily M. Weaver Austin Villeneuve & Sampson LLP
Parent Case Text
CROSS-REFERENCE TO RELATED APPLICATIONS
This application is a continuation of U.S. application Ser. No. 13/951,209, filed Jul. 25, 2013, which is a continuation of U.S. application Ser. No. 13/068,451, filed May 10, 2011, which claims the benefit of U.S. provisional application No. 61/395,303, filed May 10, 2010, which are hereby incorporated by reference in their entireties.
Claims
What is claimed is:
1. A hybridization method comprising: contacting a biological sample from a subject with a set of detectably labeled or substrate-immobilized nucleic acid probes, the set consisting of: a) a probe for 1q24; b) a probe for the centromeric region of chromosome 18; c) a probe for 2q26; and d) a probe for 20q13; incubating the probes of the set with the sample under conditions in which each probe selectively hybridizes with a polynucleotide sequence in its target chromosomal region to form a stable hybridization complex; and detecting hybridization of the set of probes to determine a hybridization pattern.
2. The method of claim 1, wherein the hybridization pattern shows a gain in one or more chromosome regions selected from the group consisting of 1q24, CEP18, 2q26, or 20q13.
3. The method of claim 1, wherein the hybridization pattern shows a loss in one or more chromosome regions selected from the group consisting of 1q24, CEDP18, 2q26, or 20q13.
4. The method of claim 1, wherein the method is carried out by array comparative genomic hybridization (aCGH) to substrate-immobilized probes.
5. The method of claim 1, wherein the method is carried out by fluorescence in situ hybridization, and each probe in the set is labeled with a different fluorophore.
6. The method of claim 1, wherein the sample comprises an endometrial brushing specimen or an endometrial biopsy specimen.
Description
FIELD OF THE INVENTION
The present invention relates generally to the area of detecting, diagnosing, and monitoring of endometrial hyperplasia and carcinoma.
BACKGROUND OF THE INVENTION
Uterine cancer is the fourth most common malignancy diagnosed in women in the United States (estimated 42,793 cases in 2009) and is the seventh most common cause of cancer death among U.S. women. Over 95% of all uterine cancers are cancers of the endometrium (lining of the body of the uterus). Lifetime probability of developing cancer of the uterus is 1 in 40 (U.S.). 35-50% of women ages 35-70 present with one or more risk factors for endometrial cancer.
Two different clinicopathologic subtypes are recognized based on light microscopic appearance, clinical behavior, and epidemiology: the estrogen-related (type I, endometrioid) and the non-estrogen-related types (type II, nonendometrioid such as papillary serous and clear cell). Despite it aggressiveness, endometrial cancer is difficult to diagnose, thus many patients present with symptoms of the late-stage cancer.
SUMMARY OF THE INVENTION
In particular embodiments, the present invention provides a method of detecting the presence of endometrial carcinoma in a biological sample from a subject. The method entails contacting the sample with one or more probes for one or more chromosome regions selected from the group consisting of: 1q, 2p, 2q, 3p, 3q, 7p, 8p, 8q, 9p, 9q, the centromeric region of chromosome 10, 10q, 15q, 16q, 17p, the centromeric region of chromosome 18, 18q, 19p, 20q, and 22q. The one or more probes are incubated with the sample under conditions in which each probe binds selectively with a polynucleotide sequence on its target chromosome or chromosomal region to form a stable hybridization complex. Hybridization of the one or more probes is detected, wherein a hybridization pattern showing at least one gain or loss or imbalance at a chromosomal region targeted by the probes is indicative of endometrial carcinoma.
In certain embodiments, a hybridization pattern showing a gain in one or more chromosome regions selected from the group consisting of: 1q, 2p, 3q, 8q, 10q, and 20q is indicative of endometrial carcinoma. In specific embodiments, a hybridization pattern showing a gain in one or more chromosome regions selected from the group consisting of: 1q, 10p, and 10q is indicative of endometrioid carcinoma. In other specific embodiments, a hybridization pattern showing a gain in one or more chromosome regions selected from the group consisting of: 3q, 8q, 18q, and 20q is indicative of non-endometrioid carcinoma. In an illustrative embodiment, a hybridization pattern showing a gain in 1q31-qtel is indicative of endometrial carcinoma.
In certain embodiments, a hybridization pattern showing a loss in one or more chromosome regions selected from the group consisting of: 9p, 9q, 15q, 16q, 17p, 18q, 19p, and 22q is indicative of endometrial carcinoma. In illustrative embodiments, a hybridization pattern showing a loss in one or more chromosome regions selected from the group consisting of: 15q11-q13, 18q21, and 19ptel is indicative of endometrial carcinoma.
In certain embodiments, the one or more probes are for one or more chromosome subregions selected from the group consisting of: 1q25, 2p24, 2q26, 3p21, 3q27-q29, 7p21, 8p11, 8q24, 9q34, the centromeric region of chromosome 10, 10q23, 10q26, 15q11-q13, 16q24, the centromeric region of chromosome 18, 18q21, 20q12 and 20q13.
In particular embodiments, the sample is contacted with a combination of at least 3 probes for a set of chromosome subregions selected from the group consisting of: 1q25, 8q24, 15q11-q13; 1q25, 10q26, 15q11-q13; 1q25, 2p24, 8q24 1q25, 8q24, 10q26; 1q25, 8p11, 15q11-q13; 1q25, 2p24, 8p11; 1q25, 8p11, 10q26; 1q25, 8p11, 8q24; 1q25, 2p24, 10q26; 1q25, 2p24, 15q11-q13; 8q24, 10q26, 15q11-q13; 1q25, 8p11, 20q13; 1q25, 8q24, 20q13; 1q25, 15q11-q13, 20q13; 1 q25, 10q26, 20q13; 8p11, 10q26, 15q11-q13; 1q25, 2p24, 20q13; 2p24, 8p11, 10q26; 2p24, 8q24, 10q26; 2p24, 10q26, 15q11-q13; 2p24, 8q24, 15q11-q13; 10q26, 15q11-q13, 20q13; 1q25, 8p11, 18q21; 1q25, 8q24, 18q21; 1q25, 10q26, 18q21; 1q25, 15q11-q13, 18q21; 8p11, 8q24, 10q26; 8q24, 10q26, 20q13; 1q25, 2p24, 18q21; 2p24, 8p11, 8q24; 2p24, 8p11, 15q11-q13; 8p11, 8q24, 15q11-q13; 2p24, 10q26, 20q13; 8p11, 10q26, 20q13; 2p24, 8p11, 20q13; 2p24, 8q24, 20q13; 8q24, 15q11-q13, 20q13; and 8p11, 15q11-q13, 20q13.
In certain embodiments, the sample is contacted with a combination of at least 3 probes for a set of chromosome subregions selected from the group consisting of: 1q25, 18q21, CEP18, 8q24; 2p24, 2q26, 10q26, 2q13; and 10q23, CEP10, and 8p11.
In particular embodiments, the sample is contacted with a combination of at least 2 probes for a set of chromosome subregions selected from the group consisting of: 18q21, 1q24, 8q24, CEP18; 1q24, 8q24, 10q26, CEP18; 18q21, 1q24, 10q26, CEP18; 1q24, 8q24, CEP18, 3q27-q29; 18q21, 1q24, 8q24, 10q26; 1q24, 2p24, 10q26, CEP18; 1q24, 10q26, CEP18, 3q27-q29; 1q24, 10q26, CEP18, 20q13; 1q24, CEP18, 3q27-q29, 20q13; 1q24, 2p24, CEP18, 3q27-q29; 18q21, 1q24, 10q26, 20q13; 1q24, 8q24, CEP18; 18q21, 1q24, CEP18; and 1q24, CEP18.
In illustrative embodiments, the sample is contacted with a combination of at least 4 probes for a set of chromosome subregions selected from the group consisting of: 1q24, 8q24, CEP18, 20q13; 1q24, CEP18, 3q27-q29, 20q13; 1q24, CEP18, 20q13, 10q26; CEP10, 8q24, CEP18, 1q24; 10q26, CEP10, 1q24, 8q24; 8q24, 1q24, 20q13, CEP18; 10q26; 20q13, CEP10, 1q24, 10q26, wherein a hybridization pattern showing a gain in one or more of these chromosome subregions is indicative of endometrial carcinoma.
In specific embodiments, one or more of a gain at one of more of 1q24, 8q24, CEP18, and 20q13 are indicative of endometrial carcinoma. In alternative specific embodiments, one or more of a 20q13 gain, a 1q24 gain, a CEP10 imbalance, and a 10q26 gain are indicative of endometrial carcinoma.
In particular embodiments, the sample is contacted with a combination of at least 2 probes for a set of chromosome subregions selected from the group consisting of: 18q21, 1q25, 8q24, CEP18; 1q25, 8q24, 10q26, CEP18; 18q21, 1q25, 10q26, CEP18; 1q25, 8q24, CEP18, 3q27-q29; 18q21, 1q25, 8q24, 10q26; 1q25, 2p24, 10q26, CEP18; 1q25, 10q26, CEP18, 3q27-q29; 1q25, 10q26, CEP18, 20q13; 1q25, CEP18, 3q27-q29, 20q13; 1q25, 2p24, CEP18, 3q27-q29; 18q21, 1q25, 10q26, 20q13; 1q25, 8q24, CEP18; 18q21, 1q25, CEP18; and 1q25, CEP18.
In illustrative embodiments, the sample is contacted with a combination of at least 4 probes for a set of chromosome subregions selected from the group consisting of: 1q25, 8q24, CEP18, 20q13; 1q25, CEP18, 3q27-q29, 20q13; 1q25, CEP18, 20q13, 10q26; CEP10, 8q24, CEP18, 1q25; 10q26, CEP10, 1q25, 8q24; 8q24, 1q25, 20q13, CEP18; 10q26; 20q13, CEP10, 1q25, 10q26, wherein a hybridization pattern showing a gain in one or more of these chromosome subregions is indicative of endometrial carcinoma.
In specific embodiments, one or more of a gain at one of more of 1q25, 8q24, CEP18, and 20q13 are indicative of endometrial carcinoma. In alternative specific embodiments, one or more of a 20q13 gain, a 1q25 gain, a CEP10 imbalance, and a 10q26 gain are indicative of endometrial carcinoma.
In variations of any of the preceding embodiments, the probe combination can distinguish samples including endometrial carcinoma from samples that do not include endometrial carcinoma with a sensitivity of at least 93% and a specificity of at least 90%. For example, the sensitivity can be at least 95% and the specificity can be at least 90.4%. In specific embodiments, the sensitivity is least 96% and the specificity is at least 91%.
In variations of any of the preceding embodiments, the probe combination can include between 2 and 10 probes. In particular embodiments, the probe combination includes between 3 and 8 probes. In an illustrative embodiment, the probe combination includes 4 probes.
In any of preceding embodiments, the method can be carried out by array comparative genomic hybridization (aCGH) to probes immobilized on a substrate. Alternatively, the method can be carried out by fluorescence in situ hybridization, and each probe in the probe combination can be labeled with a different fluorophore.
In any of the preceding embodiments, the sample can be an endometrial brushing specimen or an endometrial biopsy specimen.
In any of the preceding claims, when the results of the method indicate endometrial carcinoma, the method can additionally include treating the subject for endometrial carcinoma.
The invention also provides, in certain embodiments, a combination of probes including between 2 and 10 probes selected from any of the groups set forth above, wherein the combination of probes has a sensitivity of at least 93% and a specificity of at least 90% for distinguishing samples including endometrial carcinoma from samples that do not include endometrial carcinoma. In particular embodiments, the combination of probes has a sensitivity of at least 95% and a specificity of at least 90.4%. In illustrative embodiments, the combination of probes has a sensitivity of at least 96% and a specificity of at least 91%. In various embodiments, the probe combination includes between 3 and 8 probes, e.g., 4 probes.
Another aspect of the invention includes a kit for diagnosing endometrial carcinoma, wherein the kit includes a combination of probes including between 2 and 10 probes selected from any of the groups set forth above, wherein the combination of probes has a sensitivity of at least 93% and a specificity of at least 90% for distinguishing samples including endometrial carcinoma from samples that do not include endometrial carcinoma. In particular embodiments, the combination of probes has a sensitivity of at least 95% and a specificity of at least 90.4%. In illustrative embodiments, the combination of probes has a sensitivity of at least 96% and a specificity of at least 91%. In various embodiments, the probe combination includes between 3 and 8 probes, e.g., 4 probes.
In various embodiments, a chromosomal gain, loss, or imbalance detected by at least 2, 3, 4, 5, 6, 7, 8, 9, or 10 probes is indicative of endometrial carcinoma.
BRIEF DESCRIPTION OF THE DRAWINGS
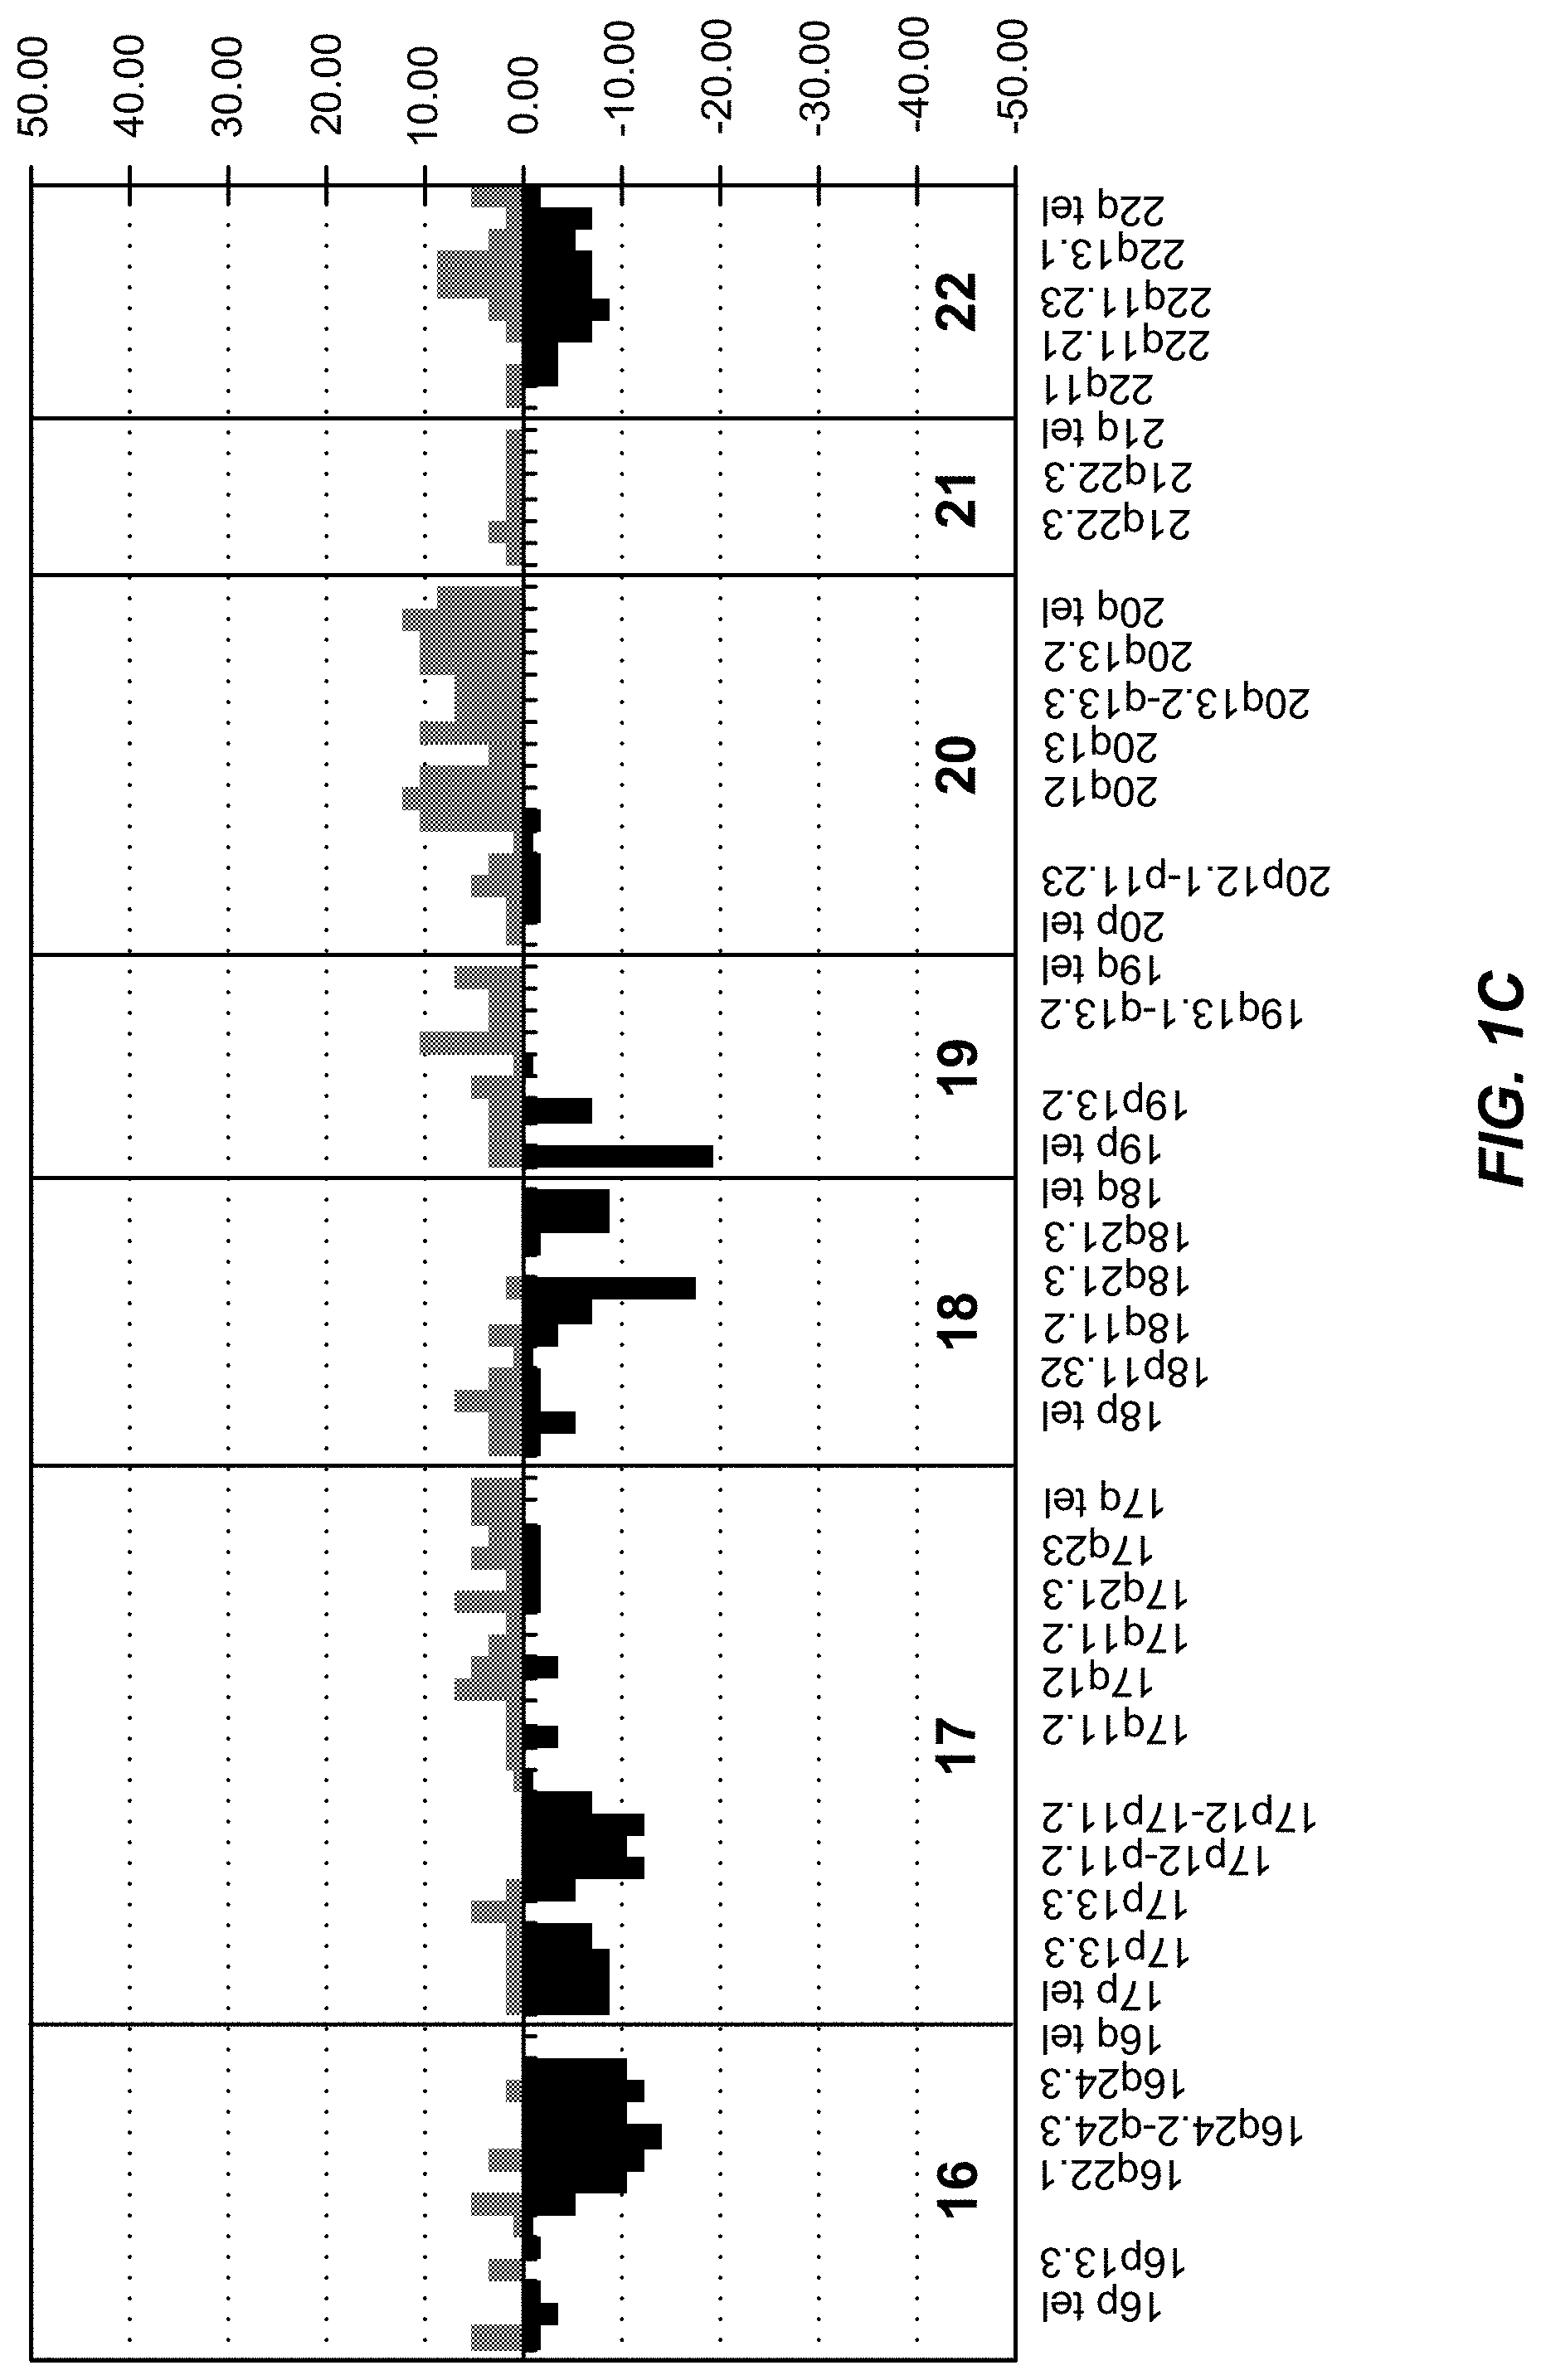
FIG. 1A-C: The frequency of genomic changes in all cancers from CGH data. A, 1ptel-7p12.3-p12.1; B, 7q11.23-15qtel; C, 16ptel-22qtel.
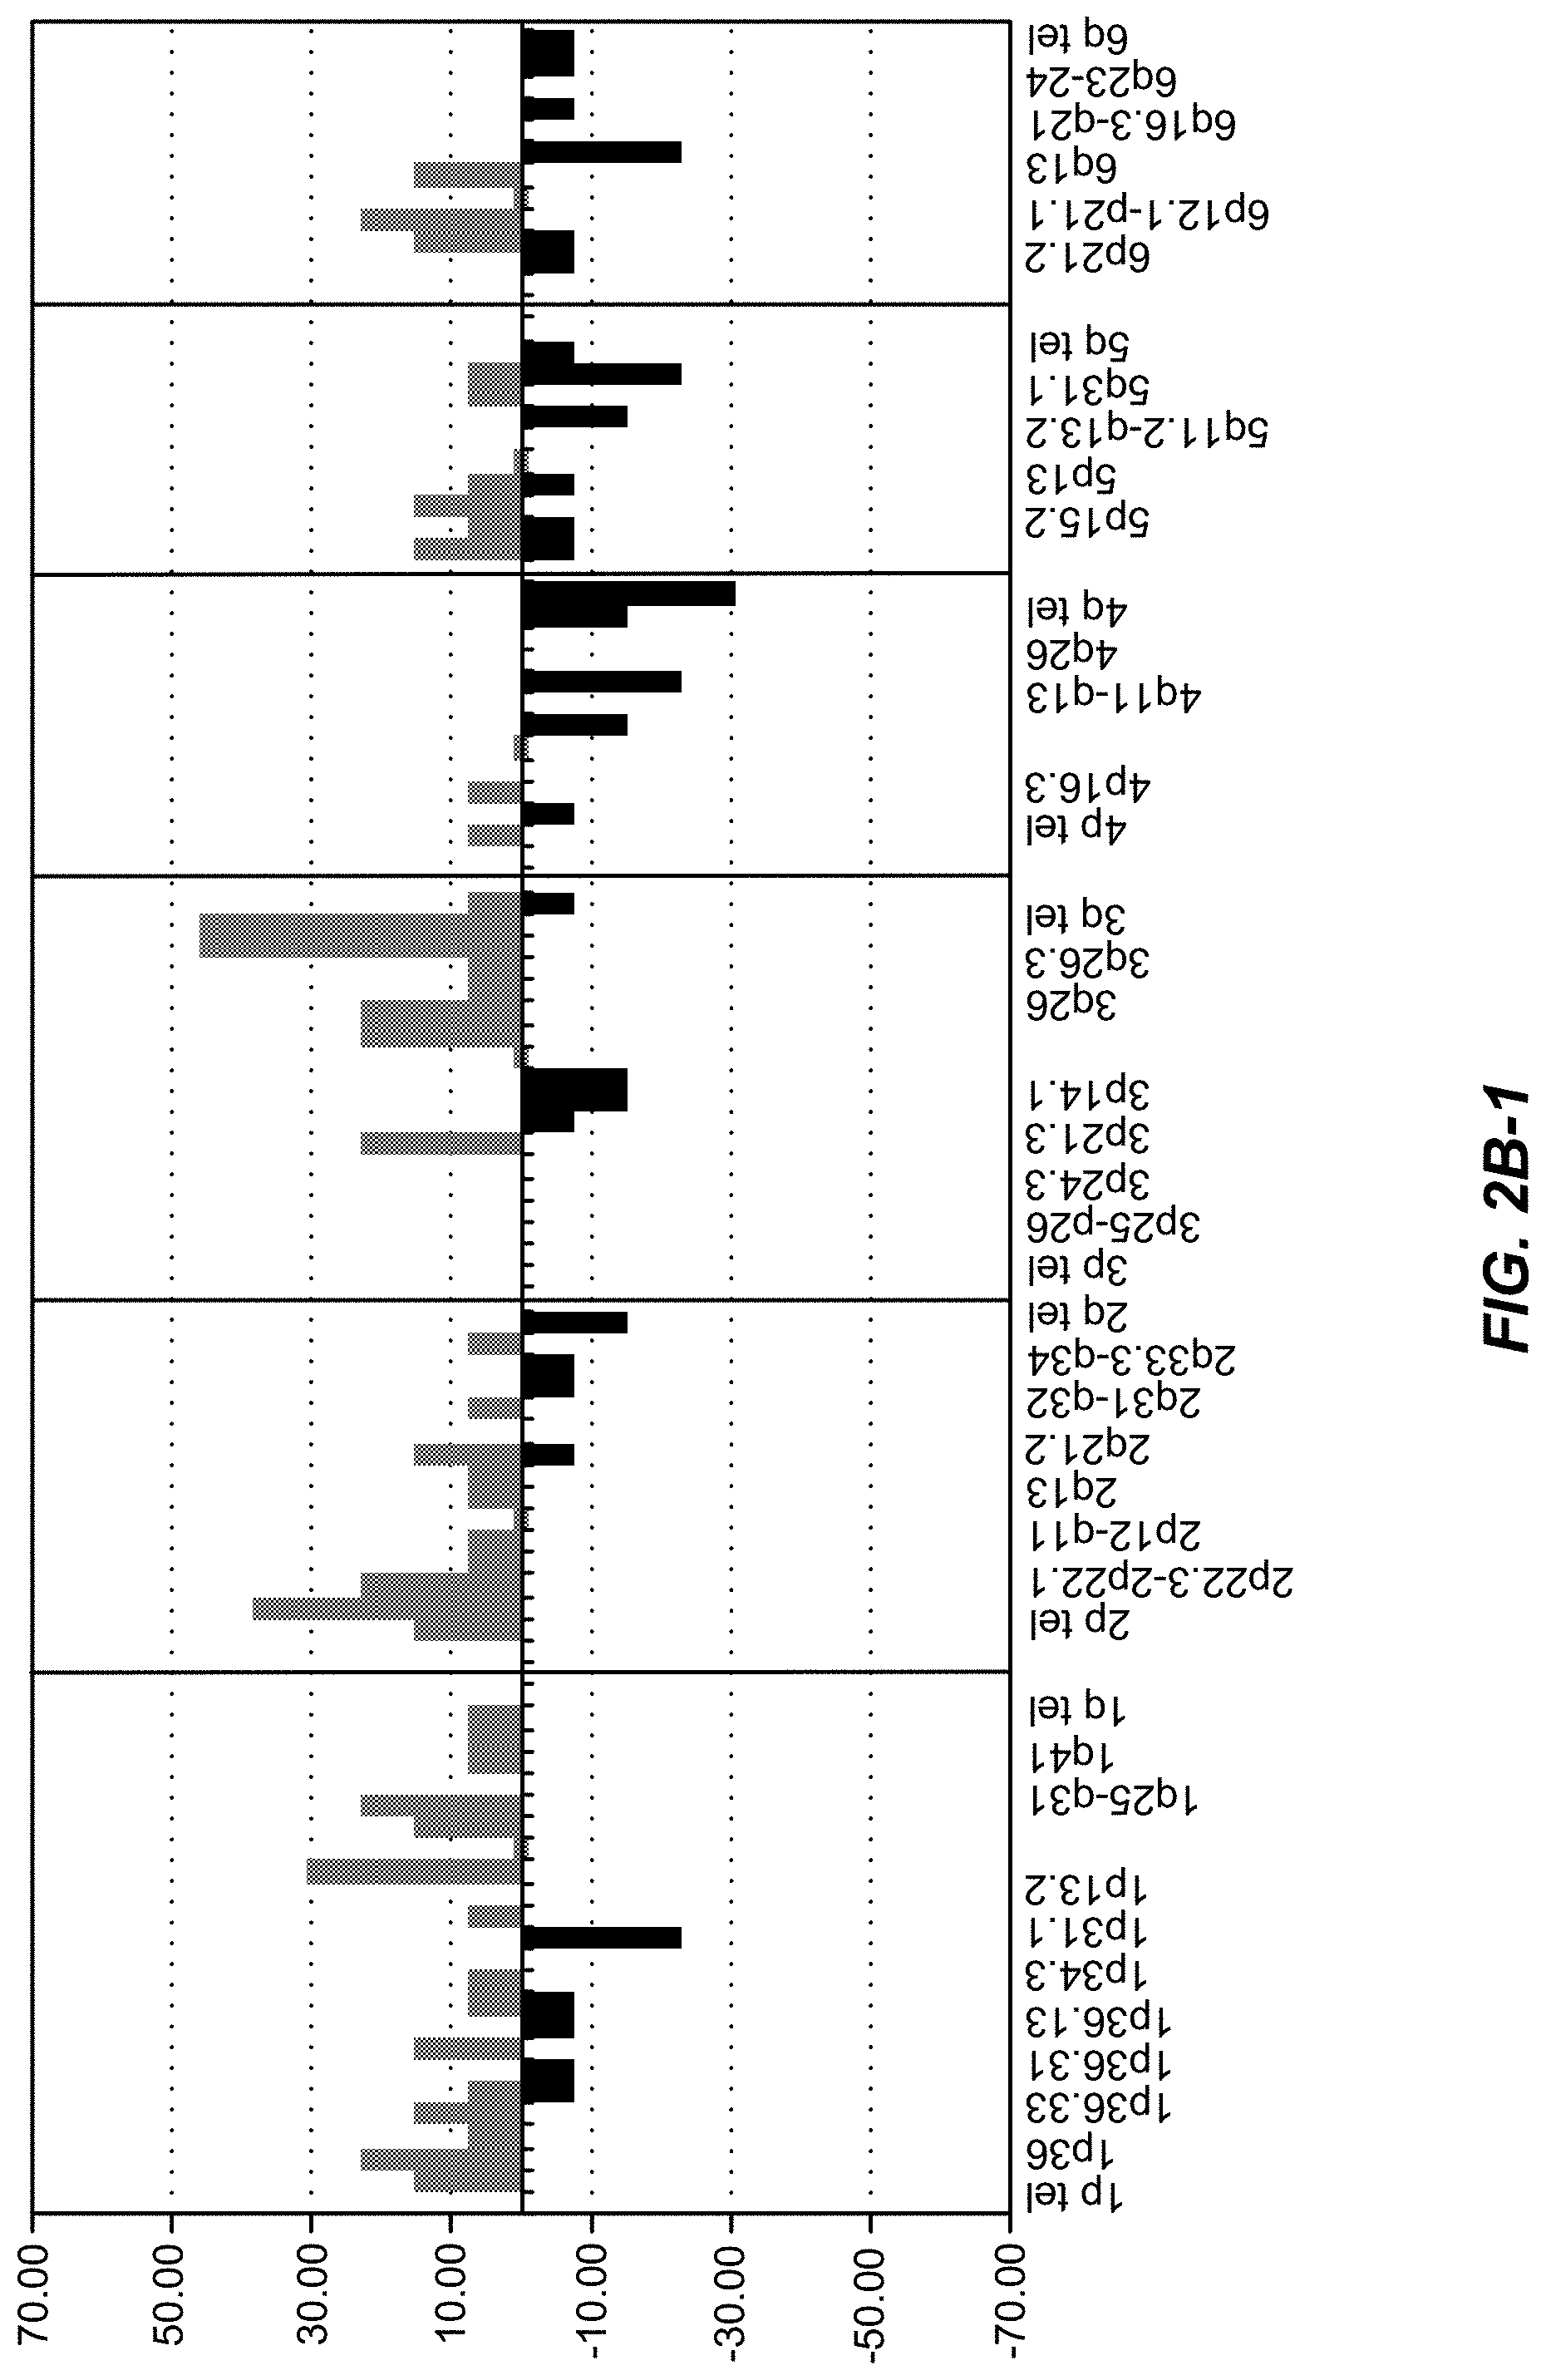
FIG. 2A(1-3)-B(1-3): The frequency of genomic changes in A, endometrioid cancers; B, non-endometrioid cancers from CGH data. A-1, 1ptel-6qtel; A-2, 7ptel-15q11.2-q12; A-3, 15q26.1-22qtel; B-1, 1ptel-6qtel; B-2, 7ptel-15q tel; B-3, 16ptel-22qtel.
FIG. 3: Complementation of selected genomic array clones. A, Abnormal (gain or loss); NC, no change in copy number.
FIG. 4A-I: Probe sets 1 and 2 shown on the aCGH data output; frequency of genomic changes in all cancers: A, 1ptel-7p12.3-p12.1; B, 7q11.23-15qtel; C, 16ptel-22qtel. Frequency of genomic changes in endometrioid cancers: D, 1ptel-6qtel; E, 7ptel-15q11.2-q12; F, 15q26.1-22qtel. Frequency of genomic changes in non-endometrioid cancers: G, 1ptel-6qtel; H, 7ptel-15q tel; I, 16ptel-22qtel.
FIG. 5: Representative example of cells with FISH signals (amplification).
FIG. 6A-C: Probe sets 1 and 2. Average % abnormal cells in all specimens evaluated. A, % Cells with Gain; B, % Cells with Loss; C, % Cells with Gains and Losses.
FIG. 7: ROC Curve for CEP18+1q24+MYC+DCC, % Abnormal (% cells with either copy number gain or copy number loss for at least 1 of 4 loci).
FIG. 8: Individual Probes and Combinations (ROC Curves, % Abnormal).
FIG. 9: ROC Curves, 4-Probe Combination, Gains of 1q24, MYC, CEP18 and 20q13.2.
FIG. 10: Evaluation of additional probes to improve sensitivity of endometrial cancer detection.
DETAILED DESCRIPTION
The present invention provides a method of detection of chromosomal abnormalities associated with endometrial carcinoma of both endometrioid and non-endometrioid types, as well as probe combinations and diagnostic kits. The methods can utilize techniques known as Comparative Genomic Hybridization on a microarray (aCGH) and in situ hybridization (e.g., Fluorescence In Situ Hybridization (FISH)) using a combination of Locus Specific Identifier (LSI) and Chromosome Enumerator (CEP) probes to detect cells that have chromosomal abnormalities consistent with a diagnosis of endometrial cancer. The methods described herein can be used to detect endometrial cancer in various types of specimens (e.g., endometrial brushing specimen or endometrial biopsy specimen) obtained in the doctors office or operating room.
There is currently no cytological diagnostic test for the early detection of endometrial cancer available today, and there is no test or procedure to routinely screen women at risk for endometrial cancer. Endometrial biopsy is recommended as the initial evaluation of women with abnormal uterine bleeding. The disadvantages of biopsy are that it an invasive and uncomfortable procedure for the patient. Moreover, tumors comprising <50% of the endometrium may be inadequately sampled by endometrial biopsy. Inadequate sampling by biopsy may result in false negative results and necessitate additional endometrial biopsies to determine the cause of persistent abnormal uterine bleeding. As endometrial cancers are relatively fast growing, patients often present after the cancers have already developed and spread locally.
Conventional cytology collected with an endometrial sampling device such as the Tao brush offers the advantage of being relatively non-invasive and therefore more comfortable for the patient. In addition, endometrial sampling for cytology is less likely than biopsy to result in false negative results due to inadequate sampling. The problem with conventional cytology is that most pathologists do not have experience with interpreting endometrial cytology and many consider it difficult to interpret. Furthermore, even experienced cytopathologists find that there are significant fraction of cases that cannot be definitely diagnosed as either positive or negative for cancer and which must be categorized as indeterminate for the presence of cancer.
The methods and compositions described herein will provide means for screening and improved diagnosis of endometrial cancer. Specifically, the methodology described herein can provide one or more of the following benefits: distinguish cancer from difficult benign conditions; distinguish benign tissue from pre-cancerous lesions and pre-cancerous lesions from cancer; distinguish endometrioid and non-endometrioid tumors; provide an early screening tool for outpatient tests on cytology specimens; aid in diagnosis of endometrial cancer in biopsy or surgical specimens (aid histological tissue evaluation); and provide an aid in monitoring of cancer and pre-cancerous conditions during therapy.
Advantages of the methods described herein can include one or more of the following: use of stable DNA for detection of chromosomal abnormalities (deletion, amplification, aneusomy, translocation); rapid detection: results could be obtained in 18-36 hours; implementation possibilities include multiplexed methods (e.g., microarray) and multicolor FISH; use as stand-alone test or as adjuncts to other tests (histology, PSA, nomogram, methylation, mutation); use on cytology specimens or biopsy (fresh-frozen or FFPE); combination of several probes increases sensitivity and specificity as compared to a single-analyte assay; increased sensitivity compared to conventional cytology.
Definitions
Terms used in the claims and specification are defined as set forth below unless otherwise specified.
The term "endometrial carcinoma" refers to a malignant neoplasm of the endometrium, which is the mucous membrane lining the uterus. Two different clinicopathologic subtypes are recognized based on light microscopic appearance, clinical behavior, and epidemiology: the estrogen-related (type I, "endometrioid") and the non-estrogen-related types (type II, "nonendometrioid", such as papillary serous and clear cell).
The terms "tumor" or "cancer" in an animal refer to the presence of cells possessing characteristics such as atypical growth or morphology, including uncontrolled proliferation, immortality, metastatic potential, rapid growth and proliferation rate, and certain characteristic morphological features. Often, cancer cells will be in the form of a tumor, but such cells may exist alone within an animal. The term tumor includes both benign and malignant neoplasms. The term "neoplastic" refers to both benign and malignant atypical growth.
The term "biological sample" or "specimen" is intended to mean a sample obtained from a subject suspected of having, or having endometrial carcinoma. In some embodiments, the sample includes a formalin-fixed paraffin-embedded biopsy. In addition to subjects suspected of having endometrial carcinoma, the biological sample may further be derived from a subject that has been diagnosed with endometrial carcinoma for confirmation of diagnosis or establishing that all of the tumor was removed ("clear margin"). The sample may be derived from a endometrial brushing specimen or endometrial biopsy specimen.
The terms "nucleic acid" or "polynucleotide," as used herein, refer to a deoxyribonucleotide or ribonucleotide in either single- or double-stranded form. The term encompasses nucleic acids, i.e., oligonucleotides, containing known analogues of natural nucleotides which have similar or improved binding properties, for the purposes desired. The term also encompasses nucleic-acid-like structures with synthetic backbones. DNA backbone analogues provided by the invention include phosphodiester, phosphorothioate, phosphorodithioate, methylphosphonate, phosphoramidate, alkyl phosphotriester, sulfamate, 3'-thioacetal, methylene(methylimino), 3'-N-carbamate, morpholino carbamate, and peptide nucleic acids (PNAs); see Oligonucleotides and Analogues, a Practical Approach, edited by F. Eckstein, IRL Press at Oxford University Press (1991); Antisense Strategies, Annals of the New York Academy of Sciences, Volume 600, Eds. Baserga and Denhardt (NYAS 1992); Milligan (1993) J. Med. Chem. 36:1923-1937; Antisense Research and Applications (1993, CRC Press). PNAs contain non-ionic backbones, such as N-(2-aminoethyl) glycine units. Phosphorothioate linkages are described in WO 97/03211; WO 96/39154; Mata (1997) Toxicol. Appl. Pharmacol. 144:189-197. Other synthetic backbones encompassed by the term include methyl-phosphonate linkages or alternating methylphosphonate and phosphodiester linkages (Strauss-Soukup (1997) Biochemistry 36: 8692-8698), and benzylphosphonate linkages (Samstag (1996) Antisense Nucleic Acid Drug Dev 6: 153-156).
The terms "hybridizing specifically to," "specific hybridization," and "selectively hybridize to," as used herein, refer to the binding, duplexing, or hybridizing of a nucleic acid molecule preferentially to a particular nucleotide sequence under stringent conditions. The term "stringent conditions" refers to conditions under which a probe will hybridize preferentially to its target sequence, and to a lesser extent to, or not at all to, other sequences. A "stringent hybridization" and "stringent hybridization wash conditions" in the context of nucleic acid hybridization (e.g., as in array, Southern or Northern hybridization, or FISH) are sequence-dependent, and are different under different environmental parameters. An extensive guide to the hybridization of nucleic acids is found in, e.g., Tijssen (1993) Laboratory Techniques in Biochemistry and Molecular Biology--Hybridization with Nucleic Acid Probes part I, Ch. 2, "Overview of principles of hybridization and the strategy of nucleic acid probe assays," Elsevier, N.Y. ("Tijssen"). Generally, highly stringent hybridization and wash conditions are selected to be about 5.degree. C. lower than the thermal melting point (T.sub.m) for the specific sequence at a defined ionic strength and pH. The T.sub.m is the temperature (under defined ionic strength and pH) at which 50% of the target sequence hybridizes to a perfectly matched probe. Very stringent conditions are selected to be equal to the T.sub.m for a particular probe. An example of stringent hybridization conditions for hybridization of complementary nucleic acids which have more than 100 complementary residues on an array or on a filter in a Southern or northern blot is 42.degree. C. using standard hybridization solutions (see, e.g., Sambrook and Russell (2001) Molecular Cloning: A Laboratory Manual (3rd ed.) Vol. 1-3, Cold Spring Harbor Laboratory, Cold Spring Harbor Press, N.Y., and detailed discussion, below).
A "chromosomal probe" or "chromosomal probe composition" refers to one or more polynucleotides that specifically hybridize to a region of a chromosome. The target sequences to which the probe can bind vary in length, e.g., from about 25,000 nucleotides to about 800,000 nucleotides. Smaller probes, e.g., that hybridize to a region of less than 100,000 nucleotides, or to a region of less than 10,000 nucleotides, can also be employed. Thus, in various embodiments, the probe can hybridize target sequences that are 25,000 nucleotides, 30,000 nucleotides, 50,000 nucleotides, 100,000 nucleotides, 150,000 nucleotides, 200,000 nucleotides, 250,000 nucleotides, 300,000 nucleotides, 350,000 nucleotides, 400,000 nucleotides, 450,000 nucleotides, 500,000 nucleotides, 550,000 nucleotides, 600,000 nucleotides, 650,000 nucleotides, 700,000 nucleotides, 750,000 nucleotides, or 800,00 nucleotides in length or that have a length falling in any range having any of these values as endpoints. A probe to a particular chromosomal region can include multiple polynucleotide fragments, e.g., ranging in size from about 50 to about 1,000 nucleotides in length.
A chromosome enumeration probe (CEP) is any probe able to enumerate the number of specific chromosomes in a cell.
The term "label containing moiety" or "detection moiety" generally refers to a molecular group or groups associated with a chromosomal probe, either directly or indirectly, that allows for detection of that probe upon hybridization to its target.
The term "target region" or "nucleic acid target" refers to a nucleotide sequence that resides at a specific chromosomal location whose loss and/or gain is indicative of the presence of endometrial carcinoma.
Introduction
The methods described herein are based, in part, on the identification of highly sensitive and specific chromosomal probe combinations that can be used to selectively detect endometrial carcinoma. The probe combinations provide higher sensitivity and specificity than individual probes. The probes encompass locus-specific probes as well as chromosome enumeration probes (CEPs), which typically hybridize to centromeric regions. The methods are carried by hybridizing one or more probes to nucleic acids from, e.g., cytology specimens (uterine brushings, washings, swabs) or cells from frozen specimens or fixed specimens, such as formalin-fixed, paraffin-embedded tissue.
Chromosomal Probes
Probes for use in the invention are used for hybridization to nucleic acids that are present in biological samples from subjects where there is some degree of suspicion of endometrial carcinoma. In certain embodiments, the probes are labeled with detectable labels, e.g., fluorescent labels.
Chromosome Enumeration Probe
A chromosome enumeration probe typically recognizes and binds to a region near to (referred to as "peri-centromeric") or at the centromere of a specific chromosome, typically a repetitive DNA sequence. The centromere of a chromosome is typically considered to represent that chromosome entity since the centromere is required for faithful segregation during cell division. Deletion or amplification of a particular chromosomal region can be differentiated from loss or gain of the whole chromosome (aneusomy), within which it normally resides, by comparing the number of signals corresponding to the particular locus (copy number) to the number of signals for the corresponding centromere. One method for making this comparison is to divide the number of signals representing the locus by the number of signals representing the centromere. Ratios of less than one indicate relative loss or deletion of the locus, and ratios greater than one indicate relative gain or amplification of the locus. Similarly, comparison can be made between two different loci on the same chromosome, for example on two different arms of the chromosome, to indicate imbalanced gains or losses within the chromosome.
In lieu of a centromeric probe for a chromosome, one of skill in the art will recognize that a chromosomal arm probe may alternately be used to approximate whole chromosomal loss or gain. However, such probes are not as accurate at enumerating chromosomes since the loss of signals for such probes may not always indicate a loss of the entire chromosomes. Examples of chromosome enumeration probes include CEP.RTM. probes (e.g., CEP.RTM. 12 and X/Y probes) commercially available from Abbott Molecular, DesPlaines, Ill. (formerly Vysis, Inc., Downers Grove, Ill.).
Chromosome enumerator probes and locus-specific probes that target a chromosome region or subregion can readily be prepared by those in the art or can be obtained commercially, e.g., from Abbott Molecular, Molecular Probes, Inc. (Eugene, Oreg.), or Cytocell (Oxfordshire, UK). Such probes are prepared using standard techniques. Chromosomal probes may be prepared, for example, from protein nucleic acids, cloned human DNA such as plasmids, bacterial artificial chromosomes (BACs), and P1 artificial chromosomes (PACs) that contain inserts of human DNA sequences. A region of interest may be obtained via PCR amplification or cloning. Alternatively, chromosomal probes may be prepared synthetically.
Locus-Specific Probes
Probes that can be used in the method described herein include probes that selectively hybridize to chromosome regions (e.g., 1q, 2p, 2q, 3p, 3q, 7p, 8p, 8q, 9p, 9q, 10q, 15q, 16q, 17p, 18q, 19p, 20q, and 22q) or subregions of the chromosome regions (e.g., 1q25, 2p24, 2q26, 3p21, 3q27-q29, 7p21, 8p11, 8q24, 9q34, 10q23, 10q26, 15q11-q13, 16q24, 18q21, 20q12 and 20q13). (The subregion designations as used herein include the designated band and typically about 10 megabases of genomic sequence to either side.) Such probes are also referred to as "locus-specific probes." A locus-specific probe selectively binds to a specific locus at a chromosomal region that is known to undergo gain or loss in endometrial carcinoma. A probe can target coding or non-coding regions, or both, including exons, introns, and/or regulatory sequences, such as promoter sequences and the like.
When targeting of a particular gene locus is desired, probes that hybridize along the entire length of the targeted gene are preferred in some embodiments, although not required. In specific embodiments, a locus-specific probe can be designed to hybridize to an oncogene or tumor suppressor gene, the genetic aberration of which is correlated with endometrial carcinoma.
Probes useful in the methods described herein generally include a collection of one or more nucleic acid fragments whose hybridization to a target can be detected. Probes can be produced from a source of nucleic acids from one or more particular (preselected) portions of the genome, for example one or more clones, an isolated whole chromosome or chromosome fragment, or a collection of polymerase chain reaction (PCR) amplification products. Probes useful in the method described herein can be produced from nucleic acids found in the regions described herein. The probe may be processed in some manner, for example, by blocking or removal of repetitive nucleic acids or enrichment with unique nucleic acids.
In certain embodiments, e.g., in in situ hybridization (e.g., FISH)-based embodiments, locus-specific probe targets preferably include at least 100,000 nucleotides. For cells of a given sample, relative to those of a control, increases or decreases in the number of signals for a probe indicate a gain or loss, respectively, for the corresponding region.
Probes may also be employed as isolated nucleic acids immobilized on a solid surface (e.g., nitrocellulose), as in aCGH. In some embodiments, the probes may be members of an array of nucleic acids as described, for instance, in WO 96/17958, which is hereby incorporated by reference it its entirety and specifically for its description of array CGH. Techniques capable of producing high density arrays are well-known (see, e.g., Fodor et al. Science 767-773 (1991) and U.S. Pat. No. 5,143,854), both of which are hereby incorporated by reference for this description.
As described in detail below, loci that were putatively associated with endometrial cancer were identified and the sensitivity and specificity of this association was examined in detail using array Comparative Genomic Hybridization (aCGH) and Fluorescence In Situ Hybridization (FISH). The clones selected from aCGH analysis included: LAMC2 (1q25-q31), MYCN (2p24.1), RASSF (3p21.3), TP63 (3q27-q29), IL6 (7p21), FGFR1 (8p11.2-p11.1), MYC (8q24), TSC1 (9q34), PTEN (10q23.3), FGFR2 (10q26), UBE3A/D15S10 (15q11-q13), FANCA (16q24.3), DCC (18q21.3), NCOA3 (20q12), and ZNF217 (20q13.2). The probes in FISH analysis included: 1q25, PTEN (10q23.3), DCC (18q21.2), CEP10, CEP18, FGFR1 (8p11.2), MYC (8q24), MYCN (2p24.3), PIK3CA (2q26.32), FGFR2 (10q26.13), and ZNF217 (20q13.2). New FISH probes were developed for NMYC, FGFR1, and FGFR2.
Probe Selection Methods
Probe combinations can be selected for their ability to simply detect endometrial carcinoma, but are typically selected for the ability to discriminate between endometrial carcinoma and other conditions. Thus, analyses of probe combinations are typically performed to determine the DFI values of different probe combinations for discriminating between endometrial carcinoma and other conditions or normal tissue. In particular embodiments, probe combinations can be analyzed to discriminate between endometrioid and non-endometrioid types of endometrial carcinoma.
Probe combinations for use in the methods of the present invention can be selected using the principles described in the examples. Combinations of chromosomal probes within a probe combination are chosen for sensitivity, specificity, and detectability regarding endometrial carcinoma. Sensitivity refers to the ability of a test (e.g. FISH) to detect disease (e.g. endometrial carcinoma) when it is present. More precisely, sensitivity is defined as True Positives/(True Positives+False Negatives). A test with high sensitivity has few false negative results, while a test with low sensitivity has many false negative results. In particular embodiments, the combination of probes has a sensitivity of least about: 93, 94, 95, 96, 97, 98, 99, or 100%, or a sensitivity falling in a range with any of these values as endpoints.
Specificity, on the other hand, refers to the ability of test (e.g. FISH) to give a negative result when disease is not present. More precisely, specificity is defined as True Negatives/(True Negatives+False Positives). A test with high specificity has few false positive results, while a test with a low specificity has many false positive results. In certain embodiments, the combination of probes has a specificity of at about: 88, 89, 90, 91, 92, 93, 94, or 95%, or a specificity falling in a range with any of these values as endpoints.
In general, chromosomal probe combinations with the highest combined sensitivity and specificity for the detection of endometrial carcinoma are preferred. In exemplary embodiments the combination of probes has a sensitivity and specificity of at least about: 93% and 88%, 95% and 90%, 96% and 91%, 97% and 92%, respectively, or any combination of sensitivity and specificity based on the values given above for each of these parameters.
The combined sensitivity and specificity of a probe combination can be represented by the parameter distance from ideal (DFI), defined as [(1-sensitivity).sup.2+(1-specificity).sup.2].sup.1/2 DFI values range from 0 to 1.414, with 0 representing a probe combination having 100% sensitivity and 100% specificity and 1.414 representing a probe combination with 0% sensitivity and 0% specificity.
There is no limit to the number of probes that can be employed in a combination, although, in certain embodiments, no more than ten probes are combined. Additionally, in some embodiments, the number of probes within a set that is to be viewed by a human observer (and not with computer assisted imaging techniques) may be restricted for practical reasons, e.g., by the number of unique fluorophores that provide visually distinguishable signals upon hybridization. For example, typically four or five unique fluorophores (e.g., which appear as red, green, aqua, and gold signals to the human eye) can be conveniently employed in a single probe combination. Generally, the sensitivity of an assay increases as the number of probes within a set increases. However, the increases in sensitivity become smaller and smaller with the addition of more probes and at some point the inclusion of additional probes to a probe combination is not associated with significant increases in the sensitivity of the assay ("diminishing returns"). Increasing the number of probes in a probe combination may decrease the specificity of the assay. Accordingly, a probe combination of the present invention typically includes two, three, or four chromosomal probes, as necessary to provide optimal balance between sensitivity and specificity.
Individual probes can be chosen for inclusion in a probe combination based on their ability to complement other probes within the combination. Specifically, they are targeted to chromosomes or chromosomal subregions that are not frequently altered simultaneously within a given endometrial carcinoma. Thus, each probe in a probe combination complements the other(s), i.e., identifies endometrial carcinoma where the other probes in the combination sometime fail to identify. One method for determining which probes complement one another is to identify single probes with the lowest DFI values for a group of tumor specimens. Then additional probes can be tested on the tumor samples that the initial probe failed to identify, and the probe with the lowest DFI value measured in combination with the initial probe(s) is added to the set. This may then be repeated until a full set of chromosomal probes with the desired DFI value is achieved.
Discrimination analysis is one method that can be used to determine which probes are best able to detect endometrial carcinoma. This method assesses if individual probes are able to detect a statistically different percentage of abnormal cells in test specimens (e.g., endometrial carcinoma) when compared to normal specimens. The detection of cells with chromosomal (or locus) gains or chromosomal (or locus) losses can both be used to identify neoplastic cells in endometrial carcinoma patients. However, chromosomal losses sometimes occur as an artifact in normal cells because of random signal overlap and/or poor hybridization. In sections of formalin-fixed paraffin-embedded material, commonly used to assess biopsies, truncation of nuclei in the sectioning process can also produce artifactual loss of chromosomal material. Consequently, chromosomal gains are often a more reliable indicator of the presence of neoplastic cells.
Cutoff values for individual chromosomal gains and losses must be determined when choosing a probe combination. The term "cutoff value" is intended to mean the value of a parameter associated with chromosomal aberration that divides a population of specimens into two groups--those specimens above the cutoff value and those specimens below the cutoff value. For example, the parameter may be the absolute number or percentage of cells in a population that have genetic aberrations (e.g., losses or gains for target regions). If the number or percentage of cells in the specimen harboring losses or gains for a particular probe is higher than the cutoff value, the sample is determined to be positive for endometrial carcinoma.
Useful probe combinations are discussed in detail in the Example below. In exemplary combinations, one or more of a gain at one of more of 1q24, 8q24, CEP18, and 20q13 are indicative of endometrial carcinoma, as are (i) one or more of a gain at one of more of 1q25, 8q24, CEP18, and 20q13 and (ii) one or more of a 20q13 gain, a 1q24 gain, a CEP10 imbalance, and a 10q26 gain. Also of note are that different genomic changes were observed when comparing endometrioid and non-endometrioid subtypes. Gains in chromosomal arms 1q, 10p and 10q were common in endometrioid carcinomas. Multiple gains across the genome were identified in non-endometrioid carcinomas with the most common gains seen in 3q, 8q and 20q.
Probe Hybridization
Conditions for specifically hybridizing the probes to their nucleic acid targets generally include the combinations of conditions that are employable in a given hybridization procedure to produce specific hybrids, the conditions of which may easily be determined by one of skill in the art. Such conditions typically involve controlled temperature, liquid phase, and contact between a chromosomal probe and a target. Hybridization conditions vary depending upon many factors including probe concentration, target length, target and probe G-C content, solvent composition, temperature, and duration of incubation. At least one denaturation step may precede contact of the probes with the targets. Alternatively, both the probe and nucleic acid target may be subjected to denaturing conditions together while in contact with one another, or with subsequent contact of the probe with the biological sample. Hybridization may be achieved with subsequent incubation of the probe/sample in, for example, a liquid phase of about a 50:50 volume ratio mixture of 2-4.times. SSC and formamide, at a temperature in the range of about 25 to about 55.degree. C. for a time that is illustratively in the range of about 0.5 to about 96 hours, or more preferably at a temperature of about 32 to about 40.degree. C. for a time in the range of about 2 to about 16 hours. In order to increase specificity, use of a blocking agent such as unlabeled blocking nucleic acid as described in U.S. Pat. No. 5,756,696 (the contents of which are herein incorporated by reference in their entirety, and specifically for the description of the use of blocking nucleic acid), may be used in conjunction with the methods of the present invention. Other conditions may be readily employed for specifically hybridizing the probes to their nucleic acid targets present in the sample, as would be readily apparent to one of skill in the art.
Upon completion of a suitable incubation period, non-specific binding of chromosomal probes to sample DNA may be removed by a series of washes. Temperature and salt concentrations are suitably chosen for a desired stringency. The level of stringency required depends on the complexity of a specific probe sequence in relation to the genomic sequence, and may be determined by systematically hybridizing probes to samples of known genetic composition. In general, high stringency washes may be carried out at a temperature in the range of about 65 to about 80.degree. C. with about 0.2.times. to about 2.times.SSC and about 0.1% to about 1% of a non-ionic detergent such as Nonidet P-40 (NP40). If lower stringency washes are required, the washes may be carried out at a lower temperature with an increased concentration of salt.
Detection of Probe Hybridization Patterns
The hybridization probes can be detected using any means known in the art. Label-containing moieties can be associated directly or indirectly with chromosomal probes. Different label-containing moieties can be selected for each individual probe within a particular combination so that each hybridized probe is visually distinct from the others upon detection. Where FISH is employed, the chromosomal probes can conveniently be labeled with distinct fluorescent label-containing moieties. In such embodiments, fluorophores, organic molecules that fluoresce upon irradiation at a particular wavelength, are typically directly attached to the chromosomal probes. A large number of fluorophores are commercially available in reactive forms suitable for DNA labeling.
Attachment of fluorophores to nucleic acid probes is well known in the art and may be accomplished by any available means. Fluorophores can be covalently attached to a particular nucleotide, for example, and the labeled nucleotide incorporated into the probe using standard techniques such as nick translation, random priming, PCR labeling, and the like. Alternatively, the fluorophore can be covalently attached via a linker to the deoxycytidine nucleotides of the probe that have been transaminated. Methods for labeling probes are described in U.S. Pat. No. 5,491,224 and Molecular Cytogenetics: Protocols and Applications (2002), Y.-S. Fan, Ed., Chapter 2, "Labeling Fluorescence In Situ Hybridization Probes for Genomic Targets," L. Morrison et al., p. 21-40, Humana Press, both of which are herein incorporated by reference for their descriptions of labeling probes.
Exemplary fluorophores that can be used for labeling probes include TEXAS RED (Molecular Probes, Inc., Eugene, Oreg.), CASCADE blue aectylazide (Molecular Probes, Inc., Eugene, Oreg.), SPECTRUMORANGE.TM. (Abbott Molecular, Des Plaines, Ill.) and SPECTRUMGOLD.TM. (Abbott Molecular).
One of skill in the art will recognize that other agents or dyes can be used in lieu of fluorophores as label-containing moieties. Suitable labels that can be attached to probes include, but are not limited to, radioisotopes, fluorophores, chromophores, mass labels, electron dense particles, magnetic particles, spin labels, molecules that emit luminescence, electrochemically active molecules, enzymes, cofactors, and enzyme substrates. Luminescent agents include, for example, radioluminescent, chemiluminescent, bioluminescent, and phosphorescent label containing moieties. Alternatively, detection moieties that are visualized by indirect means can be used. For example, probes can be labeled with biotin or digoxygenin using routine methods known in the art, and then further processed for detection. Visualization of a biotin-containing probe can be achieved via subsequent binding of avidin conjugated to a detectable marker. The detectable marker may be a fluorophore, in which case visualization and discrimination of probes may be achieved as described above for FISH.
Chromosomal probes hybridized to target regions may alternatively be visualized by enzymatic reactions of label moieties with suitable substrates for the production of insoluble color products. Each probe may be discriminated from other probes within the set by choice of a distinct label moiety. A biotin-containing probe within a set may be detected via subsequent incubation with avidin conjugated to alkaline phosphatase (AP) or horseradish peroxidase (HRP) and a suitable substrate. 5-bromo-4-chloro-3-indolylphosphate and nitro blue tetrazolium (NBT) serve as substrates for alkaline phosphatase, while diaminobenzidine serves as a substrate for HRP.
In embodiments where fluorophore-labeled probes or probe compositions are used, the detection method can involve fluorescence microscopy, flow cytometry, or other means for determining probe hybridization. Any suitable microscopic imaging method may be used in conjunction with the methods of the present invention for observing multiple fluorophores. In the case where fluorescence microscopy is employed, hybridized samples may be viewed under light suitable for excitation of each fluorophore and with the use of an appropriate filter or filters. Automated digital imaging systems such as the MetaSystems, BioView or Applied Imaging systems may alternatively be used.
In array CGH, the probes are not labeled, but rather are immobilized at distinct locations on a substrate, as described in WO 96/17958. In this context, the probes are often referred to as the "target nucleic acids." The sample nucleic acids are typically labeled to allow detection of hybridization complexes. The sample nucleic acids used in the hybridization may be detectably labeled prior to the hybridization reaction. Alternatively, a detectable label may be selected which binds to the hybridization product. In dual- or multi-color aCGH, the target nucleic acid array is hybridized to two or more collections of differently labeled nucleic acids, either simultaneously or serially. For example, sample nucleic acids (e.g., from endometrial carcinoma biopsy) and reference nucleic acids (e.g., from normal endometrium) are each labeled with a separate and distinguishable label. Differences in intensity of each signal at each target nucleic acid spot can be detected as an indication of a copy number difference. Although any suitable detectable label can be employed for aCGH, fluorescent labels are typically the most convenient.
Preferred methods of visualizing signals are described in WO 93/18186, which is hereby incorporated by reference for this description. To facilitate the display of results and to improve the sensitivity of detecting small differences in fluorescence intensity, a digital image analysis system can be used. An exemplary system is QUIPS (an acronym for quantitative image processing system), which is an automated image analysis system based on a standard fluorescence microscope equipped with an automated stage, focus control and filterwheel (Ludl Electronic Products, Ltd., Hawthorne, N.Y.). The filterwheel is mounted in the fluorescence excitation path of the microscope for selection of the excitation wavelength. Special filters (Chroma Technology, Brattleboro, Vt.) in the dichroic block allow excitation of the multiple dyes without image registration shift. The microscope has two camera ports, one of which has an intensified CCD camera (Quantex Corp., Sunnyvale, Calif.) for sensitive high-speed video image display which is used for finding interesting areas on a slide as well as for focusing. The other camera port has a cooled CCD camera (model 200 by Photometrics Ltd., Tucson, Ariz.) which is used for the actual image acquisition at high resolution and sensitivity. The cooled CCD camera is interfaced to a SUN 4/330 workstation (SUN Microsystems, Inc., Mountain View, Calif.) through a VME bus. The entire acquisition of multicolor images is controlled using an image processing software package SCIL-Image (Delft Centre for Image Processing, Delft, Netherlands).
Screening and Diagnosis of Patients for Endometrial Carcinoma
The detection methods of the invention include obtaining a biological sample from a subject having endometrial carcinoma or suspected of having endometrial carcinoma. The biological sample can be a cytology specimen, (e.g, uterine brushing, washing, or swab). In particular embodiments, the biological sample is a frozen or fixed specimen, such as formalin-fixed and paraffin embedded specimen. The sample is contacted with one or more chromosomal probe(s) to selectively detect endometrial carcinoma in the sample, if any, under conditions for specifically hybridizing the probes to their nucleic acid targets present in the sample. Probes of a combination can be hybridized concurrently or sequentially with the results of each hybridization imaged digitally, the probe or probes stripped, and the sample thereafter hybridized with the remaining probe or probes. Multiple probe combinations can also be hybridized to the sample in this manner.
The biological sample can be from a patient suspected of having endometrial carcinoma or from a patient diagnosed with endometrial carcinoma, e.g., for confirmation of diagnosis or establishing a clear margin, or for the detection of endometrial carcinoma cells in other tissues such as lymph nodes. The biological sample can also be from a subject with an ambiguous diagnosis in order to clarify the diagnosis. The biological sample can also be from a subject with a histopathologically benign lesion to confirm the diagnosis. Biological samples can be obtained using any of a number of methods known in the art.
As noted, a biological sample can be treated with a fixative such as formaldehyde and embedded in paraffin and sectioned for use in the methods of the invention. Alternatively, fresh or frozen tissue can be pressed against glass slides to form monolayers of cells known as touch preparations, which contain intact nuclei and do not suffer from the truncation artifact of sectioning. These cells may be fixed, e.g., in alcoholic solutions such as 100% ethanol or 3:1 methanol:acetic acid. Nuclei can also be extracted from thick sections of paraffin-embedded specimens to reduce truncation artifacts and eliminate extraneous embedded material. Typically, biological samples, once obtained, are harvested and processed prior to hybridization using standard methods known in the art. Such processing typically includes protease treatment and additional fixation in an aldehyde solution such as formaldehyde.
Prescreening of Samples
Prior to detection, cell samples may be optionally pre-selected based on apparent cytologic abnormalities. Pre-selection identifies suspicious cells, thereby allowing the screening to be focused on those cells. Pre-selection allows for faster screening and increases the likelihood that a positive result will not be missed. During pre-selection, cells from a biological sample can be placed on a microscope slide and visually scanned for cytologic abnormalities commonly associated with dysplastic and neoplastic cells. Such abnormalities include abnormalities in nuclear size, nuclear shape, and nuclear staining, as assessed by counterstaining nuclei with nucleic acid stains or dyes such as propidium iodide or 4,6-diamidino-2-phenylindole dihydrochloride (DAPI) usually following hybridization of probes to their target DNAs. Typically, neoplastic cells harbor nuclei that are enlarged, irregular in shape, and/or show a mottled staining pattern. Propidium iodide, typically used at a concentration of about 0.4 .mu.g/ml to about 5 .mu.g/ml, is a red-fluorescing DNA-specific dye that can be observed at an emission peak wavelength of 614 nm. DAPI, typically used at a concentration of about 125 ng/ml to about 1000 ng/ml, is a blue fluorescing DNA-specific stain that can be observed at an emission peak wavelength of 452 nm. In this case, only those cells pre-selected for detection are subjected to counting for chromosomal losses and/or gains. Preferably, pre-selected cells on the order of at least 20, and more preferably at least 30-40, in number are chosen for assessing chromosomal losses and/or gains. Preselection of a suspicious region on a tissue section may be performed on a serial section stained by conventional means, such as H&E or PAP staining, and the suspect region marked by a pathologist or otherwise trained technician. The same region can then be located on the serial section stained by FISH and nuclei enumerated within that region. Within the marked region, enumeration may be limited to nuclei exhibiting abnormal characteristics as described above.
Alternatively, cells for detection may be chosen independent of cytologic or histologic features. For example, all non-overlapping cells in a given area or areas on a microscope slide may be assessed for chromosomal losses and/or gains. As a further example, cells on the slide, e.g., cells that show altered morphology, on the order of at least about 50, and more preferably at least about 100, in number that appear in consecutive order on a microscope slide may be chosen for assessing chromosomal losses and/or gains.
Hybridization Pattern
In Situ Hybridization
The hybridization pattern for the set of chromosomal probes to the target regions is detected and recorded for cells chosen for assessment of chromosomal losses and/or gains. Hybridization is detected by the presence or absence of the particular signals generated by each of the chromosomal probes. The term "hybridization pattern" is intended to refer to the quantification of chromosomal losses/gains for those cells chosen for such assessment, relative to the number of the same in an evenly matched control sample, for each probe throughout a chosen cell sample. The quantification of losses/gains can include determinations that evaluate the ratio of one locus to another on the same or a different chromosome. Once the number of target regions within each cell is determined, as assessed by the number of regions showing hybridization to each probe, relative chromosomal gains and/or losses may be quantified.
The relative gain or loss for each probe is determined by comparing the number of distinct probe signals in each cell to the number expected in a normal cell, i.e., where the copy number should be two. Non-neoplastic cells in the sample, such as keratinocytes, fibroblasts, and lymphocytes, can be used as reference normal cells. More than the normal number of probe signals is considered a gain, and fewer than the normal number is considered a loss. Alternatively, a minimum number of signals per probe per cell can be required to consider the cell abnormal (e.g., 5 or more signals). Likewise for loss, a maximum number of signals per probe can be required to consider the cell abnormal (e.g., 0 signals, or one or fewer signals).
The percentages of cells with at least one gain and/or loss are to be recorded for each locus. A cell is considered abnormal if at least one of the identified genetic aberrations identified by a probe combination of the present invention is found in that cell. A sample may be considered positive for a gain or loss if the percentage of cells with the respective gain or loss exceeds the cutoff value for any probes used in an assay. Alternatively, two or more genetic aberrations can be required in order to consider the cell abnormal with the effect of increasing specificity. For example, wherein gains are indicative of a endometrial carcinoma, a sample is considered positive if it contains, for example, at least four cells showing gains of at least two or more probe-containing regions.
aCGH
Array CGH can be carried out in single-color or dual- or multi-color mode. In single-color mode, only the sample nucleic acids are labeled and hybridized to the nucleic acid array. Copy number differences can be detected by detecting a signal intensity at a particular target nucleic acid spot on the array that differs significantly from the signal intensity observed at one or more spots corresponding to one or more loci that are present in the sample nucleic acids at a normal copy number. To facilitate this determination, the array can include target elements for one or more loci that are not expected to show copy number difference(s) in endometrial carcinoma.
In dual- or multi-color mode, signal corresponding to each labeled collection of nucleic acids (e.g., sample nucleic acids and normal, reference nucleic acids) is detected at each target nucleic acid spot on the array. The signals at each spot can be compared, e.g., by calculating a ratio. For example, if the ratio of sample nucleic acid signal to reference nucleic acid signal exceeds 1, this indicates a gain in the sample nucleic acids at the locus corresponding to the target nucleic acid spot on the array. Conversely, if t if the ratio of sample nucleic acid signal to reference nucleic acid signal is less than 1, this indicates a loss in the sample nucleic acids at the corresponding locus.
Other Methods of Detecting Copy Number Variations Associated with Endometrial Carcinoma
Those of skill in the art appreciate that copy number variations at any of the loci described herein can be detected using other methods, including amplification-based methods and high-throughput DNA sequencing.
Amplification-Based Detection
In amplification-based assays, the target nucleic acids act as template(s) in amplification reaction(s) (e.g., Polymerase Chain Reaction (PCR)). In a quantitative amplification, the amount of amplification product is proportional to the amount of template in the original sample. Detailed protocols for quantitative PCR are provided in Innis et al. (1990) PCR Protocols, A Guide to Methods and Applications, Academic Press, Inc. N.Y.). A number of commercial quantitative PCR systems are available, for example the TaqMan system from Applied Biosystems.
Other suitable amplification methods include, but are not limited to, ligase chain reaction (LCR) (see Wu and Wallace (1989) Genomics 4: 560; Landegren et al. (1988) Science 241: 1077; and Barringer et al. (1990) Gene 89: 117), multiplex ligation-dependent probe amplification (MLPA), transcription amplification (Kwoh et al. (1989) Proc. Natl. Acad. Sci. USA 86: 1173), self-sustained sequence replication (Guatelli et al. (1990) Proc. Nat. Acad. Sci. USA 87: 1874), dot PCR, and linker adapter PCR, etc.
Amplification is typically carried out using primers that specifically amplify one or more loci within each chromosome or chromosomal subregion to be queried. Detection can be carried out by any standard means, including a target-specific probe, a universal probe that binds, e.g., to a sequence introduced into all amplicons via one or both primers, or a double-stranded DNA-binding dye (such as, e.g., SYBR Green). In illustrative embodiments, padlock probes or molecular inversion probes are employed for detection.
High-Throughput DNA Sequencing
In particular embodiments, amplification methods are employed to produce amplicons suitable for high-throughput (i.e., automated) DNA sequencing. Generally, amplification methods that provide substantially uniform amplification of target nucleotide sequences are employed in preparing DNA sequencing libraries having good coverage. In the context of automated DNA sequencing, the term "coverage" refers to the number of times the sequence is measured upon sequencing. The counts obtained are typically normalized relative to a reference sample or samples to determine relative copy number. Thus, upon performing automated sequencing of a plurality of target amplicons, the normalized number of times the sequence is measured reflects the number of target amplicons including that sequence, which, in turn, reflects the number of copies of the target sequence in the sample DNA.
Amplification for sequencing may involve emulsion PCR isolates in which individual DNA molecules along with primer-coated beads are present in aqueous droplets within an oil phase. Polymerase chain reaction (PCR) then coats each bead with clonal copies of the DNA molecule followed by immobilization for later sequencing. Emulsion PCR is used in the methods by Marguilis et al. (commercialized by 454 Life Sciences), Shendure and Porreca et al. (also known as "Polony sequencing") and SOLiD sequencing, (developed by Agencourt, now Applied Biosystems). Another method for in vitro clonal amplification for sequencing is bridge PCR, where fragments are amplified upon primers attached to a solid surface, as used in the Illumina Genome Analyzer. Some sequencing methods do not require amplification, for example, the single-molecule method developed by the Quake laboratory (later commercialized by Helicos). This method uses bright fluorophores and laser excitation to detect pyrosequencing events from individual DNA molecules fixed to a surface. Pacific Biosciences has also developed a single molecule sequencing approach that does not require amplification.
After in vitro clonal amplification (if necessary), DNA molecules that are physically bound to a surface are sequenced. Sequencing by synthesis, like dye-termination electrophoretic sequencing, uses a DNA polymerase to determine the base sequence. Reversible terminator methods (used by Illumina and Helicos) use reversible versions of dye-terminators, adding one nucleotide at a time, and detect fluorescence at each position in real time, by repeated removal of the blocking group to allow polymerization of another nucleotide. Pyrosequencing (used by 454) also uses DNA polymerization, adding one nucleotide species at a time and detecting and quantifying the number of nucleotides added to a given location through the light emitted by the release of attached pyrophosphates.
Pacific Biosciences Single Molecule Real Time (SMRT.TM.) sequencing relies on the processivity of DNA polymerase to sequence single molecules and uses phospholinked nucleotides, each type labeled with a different colored fluorophore. As the nucleotides are incorporated into a complementary DNA strand, each is held by the DNA polymerase within a detection volume for a greater length of time than it takes a nucleotide to diffuse in and out of that detection volume. The DNA polymerase then cleaves the bond that previously held the fluorophore in place and the dye diffuses out of the detection volume so that fluorescence signal returns to background. The process repeats as polymerization proceeds.
Sequencing by ligation uses a DNA ligase to determine the target sequence. Used in the Polony method and in the SOLiD technology, this method employs a pool of all possible oligonucleotides of a fixed length, labeled according to the sequenced position. Oligonucleotides are annealed and ligated; the preferential ligation by DNA ligase for matching sequences results in a signal informative of the nucleotide at that position.
Probe Combinations and Kits for Use in Diagnostic and/or Prognostic Applications
The invention includes highly specific and sensitive combinations of probes, as described herein, that can be used to detect endometrial carcinoma and kits for use in diagnostic, research, and prognostic applications. Kits include probe combinations and can also include reagents such as buffers and the like. The kits may include instructional materials containing directions (i.e., protocols) for the practice of the methods of this invention. While the instructional materials typically include written or printed materials they are not limited to such. Any medium capable of storing such instructions and communicating them to an end user is contemplated by this invention. Such media include, but are not limited to electronic storage media (e.g., magnetic discs, tapes, cartridges, chips), optical media (e.g., CD ROM), and the like. Such media may include addresses to internet sites that provide such instructional materials.
REFERENCES
1. Int J Mol Med. 2003 November; 12(5):727-31. 11q23-24 loss is associated with chromosomal instability in endometrial cancer. Kawasaki K, Suehiro Y, Umayahara K, Morioka H, Ito T, Saito T, Tsukamoto N, Sugino N, Kato H, Sasaki K. 2. Hum Genet. 1997 October; 100(5-6):629-36. Frequent gains on chromosome arms 1q and/or 8q in human endometrial cancer. Suzuki A, Fukushige S, Nagase S, Ohuchi N, Satomi S, Horii A. 3. Cancer Genet Cytogenet. 2008 February; 181(1):25-30. Recurrent gene amplifications in human type I endometrial adenocarcinoma detected by fluorescence in situ hybridization. Samuelson E, Levan K, Adamovic T, Levan G, Horvath G. 4. Cytogenet Genome Res. 2006; 115(1):16-22. Chromosomal alterations in 98 endometrioid adenocarcinomas analyzed with comparative genomic hybridization. Levan K, Partheen K, Osterberg L, Helou K, Horvath G. 5. Eur J Obstet Gynecol Reprod Biol. 2005 May 1; 120(1):107-14. Genetic imbalances in endometrial hyperplasia and endometrioid carcinoma detected by comparative genomic hybridization. Muslumanoglu H M, Oner U, Ozalp S, Acikalin M F, Yalcin O T, Ozdemir M, Artan S. 6. Am J Clin Pathol. 2004 October; 122(4):546-51. Overrepresentation of 8q in carcinosarcomas and endometrial adenocarcinomas. Schulten H J, Gunawan B, Enders C, Donhuijsen K, Emons G, Fuzesi L. 7. Hum Genet. 1997 October; 100(5-6):629-36. Frequent gains on chromosome arms 1q and/or 8q in human endometrial cancer. Suzuki A, Fukushige S, Nagase S, Ohuchi N, Satomi S, Horii A. 8. Genes Chromosomes Cancer. 1997 February; 18(2):115-25. Detection of DNA gains and losses in primary endometrial carcinomas by comparative genomic hybridization. Sonoda G, du Manoir S, Godwin A K, Bell D W, Liu Z, Hogan M, Yakushiji M, Testa J R. 9. U.S. Pat. No. 5,713,369 entitled "Uterine endometrial tissue sample brush." 10. U.S. Pat. No. 4,227,537 entitled "Endometrial brush with slidable protective sleeve." 11. Guido R S, Kanbour-Shakir A, Rulin M C, Christopherson W A. Pipelle endometrial sampling. Sensitivity in the detection of endometrial cancer. J Reprod Med 1995; 40(8):553-5. 12. Critchley H O, Warner P, Lee A J, Brechin S, Guise J, Graham B. Evaluation of abnormal uterine bleeding: comparison of three outpatient procedures within cohorts defined by age and menopausal status. Health Technol Assess 2004; 8(34):iii-iv, 1-139. 13. Del Priore G, Williams R, Harbatkin C B, Wan L S, Mittal K, Yang G C. Endometrial brush biopsy for the diagnosis of endometrial cancer. J Reprod Med 2001; 46(5):439-43. 14. Kipp B R, Medeiros F, Campion M B, Distad T J, Peterson L M, Keeney G L, et al. Direct uterine sampling with the Tao brush sampler using a liquid-based preparation method for the detection of endometrial cancer and atypical hyperplasia: a feasibility study. Cancer 2008; 114(4):228-35. 15. Maksem J A. Performance characteristics of the Indiana University Medical Center endometrial sampler (Tao Brush) in an outpatient office setting, first year's outcomes: recognizing histological patterns in cytology preparations of endometrial brushings. Diagn Cytopathol 2000; 22(3):186-95. 16. Williams A R, Brechin S, Porter A J, Warner P, Critchley H O. Factors affecting adequacy of Pipelle and Tao Brush endometrial sampling. Bjog 2008; 115(8):1028-36. 17. Yang G C, Wan L S. Endometrial biopsy using the Tao Brush method. A study of 50 women in a general gynecologic practice. J Reprod Med 2000; 45(2):109-14.
All publications cited herein are explicitly incorporated by reference.
EXAMPLES
The following examples are offered to illustrate, but not to limit the claimed invention.
Example 1
Array CGH Studies
Study Design
In a collaborative study of Abbott Molecular and Mayo Clinic carried out in 2007-2009, fresh-frozen, biopsy from proven endometrial carcinoma specimens from 62 patients were obtained with informed consent at the time of surgery from Rochester Methodist Hospital at Mayo Clinic, Rochester, Minn. Serial 5-.mu.m sections were cut from the collected tissue and sections were stained with hematoxylin and eosin (H&E) for histological analysis. Specimens with greater than 70% tumor were selected for aCGH analysis and remaining sections were left unstained for future clinical studies.
DNA from the selected specimens was extracted and amplified prior to CGH analysis by the GenoSensor.TM. system. Vysis GenoSensor DNA microarray slides obtained from Abbott Molecular (Des Plaines, Ill.) were used for CGH analysis. The microarray slides contained 287 DNA targets consisting of known oncogenes, tumor suppressor genes, and regions of gain, loss, or loss of heterozygosity commonly associated with cancer (Attachment 1). The targets were arrayed in triplicate from BAC libraries.
Test and normal reference DNA samples were random-prime labeled, using Vysis GeneSensor labeling reagents, with Cyanine3-dCTP, and Cyanine5-dCTP (Perkin Elmer/NEN), respectively. Random priming refers to the process whereby synthetic DNA octamers of random sequence bind to complementary DNA sequences (along a DNA template) and serve as templates for DNA synthesis and elongation by DNA Polymerase I (Klenow Fragment). Following additional purification, test and reference DNA were mixed in equal proportion (in hybridization buffer), denatured, and hybridized against the Vysis GenoSensor.TM. Array 300 human genomic DNA microarray. Hybridization proceeded at 30.degree. C. for 72 hours, followed by washing and scanning of arrays. Array images were analyzed with GenoSensor.TM. software, which segments and identifies each target using the blue (DAPI) image plane. The software measures mean intensities from the green and red image planes, subtracts background, determines mean ratio of green/red signal, and calculates the ratio most representative of the modal DNA copy number of the sample DNA. Gender mismatched (male/female or female/male) hybridizations provided control with respect to the detection of autosomal copy number imbalances. Arrays were hybridizes at Mayo Clinic and aCGH data obtained was analyzed by Abbott Molecular.
In total, data for 57 Cancer specimens (44 endometrioid and 13 non-endometrioid) and 9 normal specimens was available for analysis.
Results
The CGH data revealed several promising genomic targets for these investigational FISH probe sets (FIG. 1). The most frequent gains observed in all endometrial carcinomas included areas on chromosomal arms 1q, 2p, 3q, 8q, and 20q. Most common losses seen in all carcinomas included 9p, 9q, 16q, 17p, 18q, and 22q. Interestingly, different genomic changes were observed when comparing endometrioid and non-endometrioid subtypes. Gains in chromosomal arms 1q, 10p and 10q were common in endometrioid carcinomas. Multiple gains across the genome were identified in non-endometrioid carcinomas with the most common gains seen in 3q, 8q and 20q.
Gross analysis of chromosomal changes demonstrated that most frequent changes, of all cancers analyzed, were as follows:
1. Gains on 1q31-qtel (20-30%)
2. Gains on 3q, 8q and 10q (about 20%)
3. Gain on 2p (about 15%)
4. Losses on 9q (about 18%)
5. Losses on 15q11-q13 (about 18%)
6. Losses on 18q21.3 and 19ptel (about 18-19%)
7. Losses 16q and 17p (about 12%)
Table 1 provides details of the most frequently affected loci (by array clone).
TABLE-US-00001 TABLE 1 Loci with the frequently of genomic copy number imbalance of >10% in cancer specimens. FREQ FREQ FREQ FREQ FREQ FREQ FREQ FREQ FREQ GAIN LOSS IMBAL GAIN LOSS GAIN LOSS Clone Cyto GAIN LOSS Ca Ca Ca EN EN NE NE # Clone Name Location (%) (%) (%) (%) (%) (%) (%) (%) (%) 8 AMC2 q25-q31 7.27 .00 1.58 .00 1.58 4.09 .00 3.08 .00 0 GFB2 q41 2.73 .00 6.32 .00 6.32 1.82 .00 .69 .00 7 I-5663, I-13414 q21 1.21 .00 4.56 .00 4.56 7.27 .00 5.38 .00 1 KT3 q44 2.73 .00 4.56 .00 4.56 9.55 .00 .69 .00 2 HGC-18290 q tel 2.73 .00 4.56 .00 4.56 9.55 .00 .69 .00 36 29F16/SP6 9p tel .03 6.67 .51 9.30 2.81 .27 8.18 .69 3.08 3 QTEL10 q tel 6.67 .00 9.30 .00 9.30 5.00 .00 .00 .00 6 YCN(N-myc) p24.1 2.12 .55 4.04 .26 9.30 .82 .82 8.46 .00 4 FI2 q tel 6.67 .00 9.30 .00 9.30 1.36 .00 6.15 .00 10 YC g24.12- 6.67 .00 9.30 .00 9.30 .82 .00 1.54 .00 q24.13 11 TK2 q24-qter 6.67 .00 9.30 .00 9.30 .82 .00 1.54 .00 22 SC1 q34 .52 5.15 .75 7.54 9.30 .27 .09 .00 6.15 35 GFR2 0q26 6.67 .00 9.30 .00 9.30 0.45 .00 5.38 .00 82 BE3A, 15S10 5q11-q13 .52 5.15 .75 7.54 9.30 .27 3.64 .00 0.77 31 CC 8q21.3 .52 6.67 .75 7.54 9.30 .27 .82 .00 3.85 3 P63 q27-q29 5.15 .00 7.54 .00 7.54 .09 .00 6.15 .00 06 GFR1 p11.2- 2.12 .03 4.04 .51 7.54 .09 .27 0.77 .69 p11.1 21 BCCR1 q33.2 .52 3.64 .75 5.79 7.54 .27 .82 .00 6.15 6 QTEL11 q tel 0.61 .55 0.53 .26 5.79 3.64 .27 .00 5.38 02 8S596 p tel .58 .06 .77 .02 5.79 .82 .55 5.38 5.38 96 RA16D 6q23.2 .03 0.61 .51 2.28 5.79 .00 .09 5.38 3.08 70 F2 2q12.2 .58 .06 .77 .02 5.79 .82 .82 5.38 .69 71 DGFB( SIS) 2q13.1 .69 .15 .77 .02 5.79 .82 .27 5.38 3.08 9 TGS2(COX2) q31.1 3.64 .00 5.79 .00 5.79 0.45 .00 .00 .00 7 SH2, KCNK122 p22.3- 3.64 .00 5.79 .00 5.79 3.64 .00 3.08 .00 p22.1 09 XT1 g24.11- 3.64 .00 5.79 .00 5.79 .82 .00 6.15 .00 q24.13 12 HGC-3110 q tel 3.64 .00 5.79 .00 5.79 .55 .00 3.85 .00 6 1S2465, 1S3402 p12 0.61 .52 2.28 .75 4.04 .82 .27 0.77 .00 99 ANCA 6q24.3 .52 0.61 .75 2.28 4.04 .27 .09 .00 3.08 0 L6 p21 2.12 .00 4.04 .00 4.04 1.36 .00 3.08 .00 01 8S504 p tel .06 .06 .02 .02 4.04 .82 .55 .69 5.38 37 tSG27915 0q tel 2.12 .00 4.04 .00 4.04 5.91 .00 .69 .00 97 DH13 6g24.2- .00 2.12 .00 4.04 4.04 .00 .09 .00 0.77 q24.3 5 PTEL27 p tel 0.61 .00 2.28 .00 2.28 1.36 .00 5.38 .00 8 2S447 q tel .06 .55 .02 .26 2.28 .09 .27 .00 5.38 5 ASSF1 p21.3 0.61 .00 2.28 .00 2.28 .09 .00 3.08 .00 7 4S2930 q tel .03 .58 .51 .77 2.28 .55 .27 .00 0.77 8 84C11/T3 p tel .09 .52 0.53 .75 2.28 .09 .00 5.38 .69 2 TR1B q13 .09 .52 0.53 .75 2.28 .09 .27 5.38 .00 36 MBT1 0g25.3- .09 .52 0.53 .75 2.28 3.64 .00 .00 .69 q26.1 78 GH(D14S308) 4q tel 2.12 .00 2.28 .00 2.28 .09 .00 3.08 .00 08 17S125, 17S61 7p12-p11.2 .00 0.61 .00 2.28 2.28 .00 .55 .00 8.46 10 LGL1 7p12- .00 0.61 .00 2.28 2.28 .00 .82 .00 0.77 17p11.2 48 OP1 0q12-q13.1 .09 .52 0.53 .75 2.28 .55 .27 0.77 .00 49 COA3(AIB1) 0q12 0.61 .00 2.28 .00 2.28 .27 .00 6.15 .00 57 PD52L2, TOM 0q tel 0.61 .00 2.28 .00 2.28 .55 .00 8.46 .00 69 CR 2q11.23 .55 .58 .51 .77 2.28 .00 .82 5.38 5.38
As evident from FIG. 2, Non-Endometrioid (NE) tumors had overall greater number of genomic changes as compared to Endometrioid (EN) tumors. In addition, the pattern of changes was different between EN and NE tumors. For example, changes at 1q and 10q loci were more prevalent in EN tumors, while changes at 8q and 18q appeared more prevalent in NE tumors.
Sensitivity and Specificity Analysis
Analysis was carried out to determine changes in which loci are most abundant in cancers (both NE and EN) and give the highest sensitivity and specificity in detecting cancer.
First, analysis has been carried out on individual loci and the loci with the best sensitivity and specificity value as represented by the DFI parameter calculated as: DFI= {square root over ((1-SENS).sup.2+(1-SPEC).sup.2)} were selected. As shown below, the best performance was demonstrated by loci located on the long arm of chromosome 1.
TABLE-US-00002 case # SPEC vs DFI vs PROBE 1 specimens SENS norm norm LAMC2:18:1q25-q31 57 0.3158 1.0000 0.6842 TGFB2:20:1q41 57 0.2632 1.0000 0.7368 WI-5663, WI- 57 0.2456 1.0000 0.7544 13414:17:1q21 SHGC-18290:22:1q tel 57 0.2456 1.0000 0.7544 AKT3:21:1q44 57 0.2456 0.8889 0.7625
Then, we considered additional clones, and chosen a representative probe for a segment where several probes were located in one apparent contiguous region of rearrangement. It is evident (Table 2) that the sensitivity and specificity of the individual loci is low. Therefore, combinations of the loci listed below were evaluated.
TABLE-US-00003 TABLE 2 Individual clone performance for selected clones. control case Case Control # # SPEC DFI mark- mark- mark- mark- spec- spec- vs vs er er er er Clone imens SENS imens SENS norm norm (s)+ (s)- (s)+ (s)- chi sq prob LAMC2:18:1q25-q31 abnorm 9 0.0000 57 0.3158 1.0000 0.6842 18 39 0 9 4.8060- E-02 MYCN(N-myc):26:2p24.1 abnorm 9 0.0000 57 0.1930 1.0000 0.8070 11 46 0 9 1.- 4883E-01 RASSF1:45:3p21.3 abnorm 9 0.0000 57 0.1228 1.0000 0.8772 7 50 0 9 2.6617E-- 01 TP63:53:3q27-q29 abnorm 9 0.0000 57 0.1754 1.0000 0.8246 10 47 0 9 1.7252E- -01 IL6:90:7p21 abnorm 9 0.0000 57 0.1404 1.0000 0.8596 8 49 0 9 2.3056E-01 FGFR1:106:8p11.2-p11.1 abnorm 9 0.0000 57 0.1754 1.0000 0.8246 10 47 0 9 1- .7252E-01 MYC:110:8q24.12-q24.13 abnorm 9 0.0000 57 0.1930 1.0000 0.8070 11 46 0 9 1- .4883E-01 TSC1:122:9q34 abnorm 9 0.0000 57 0.1930 1.0000 0.8070 11 46 0 9 1.4883E-01- PTEN:134:10q23.3 abnorm 9 0.2222 57 0.0702 0.7778 0.9560 4 53 2 7 1.4034E-- 01 FGFR2:135:10q26 abnorm 9 0.0000 57 0.1930 1.0000 0.8070 11 46 0 9 1.4883E-- 01 UBE3A, D15S10:182:15q11-q13 abnorm 9 0.0000 57 0.1930 1.0000 0.8070 11 46 - 0 9 1.4883E-01 FANCA:199:16q24.3 abnorm 9 0.0000 57 0.1404 1.0000 0.8596 8 49 0 9 2.3056E- -01 DCC:231:18q21.3 abnorm 9 0.1111 57 0.1930 0.8889 0.8146 11 46 1 8 5.5398E-- 01 NCOA3(AIB1):249:20q12 abnorm 9 0.0000 57 0.1228 1.0000 0.8772 7 50 0 9 2.6- 617E-01 ZNF217(ZABC1):254:20q13.2 abnorm 9 0.0000 57 0.0702 1.0000 0.9298 4 53 0 9- 4.1224E-01
Complementation between the selected loci, in all of the tested specimens is represented in FIG. 3.
Sensitivity and specificity in tumor detection was then evaluated using JMP 8.0 statistical analysis software (SAS Institute), utilizing Fit X by Y contingency table analysis. In this analysis, all 13 loci, and groups of 10, 9 and 8 complimentary clones were evaluated. A sample was called positive when either one of the loci (at least one locus) in the group was positive.
TABLE-US-00004 1. A set of all 14 clones: Pos/Neg 14 Loci Row % NEG POS Tumor? NORMAL 88.89 11.11 TUMOR 28.07 71.93 Tests N DF -LogLike RSquare (U) 990 1 94.293904 0.1453 Test ChiSquare Prob > ChiSq Likelihood Ratio 188.588 <.0001* Pearson 186.366 <.0001* Fisher's Exact Test Prob Alternative Hypothesis Left 1.0000 Prob(Pos/Neg 14 Loci = POS) is greater for Tumor? = NORMAL than TUMOR Right <.0001* Prob(Pos/Neg 14 Loci = POS) is greater for Tumor? = TUMOR than NORMAL 2-Tail <.0001* Prob(Pos/Neg 14 Loci = POS) is different across Tumor? 2. A representative subset of 10 clones: DCC IL6 MYC PTEN TSC1 FGFR2 LAMC2 MYCN(N-myc) RASSF1 UBE3A, D15S10 Pos/Neg 10 Row % NEG POS Tumor? NORMAL 66.67 33.33 TUMOR 26.32 73.68 Tests N DF -LogLike RSquare (U) 924 1 37.838597 0.0655 Test ChiSquare Prob > ChiSq Likelihood Ratio 75.677 <.0001* Pearson 81.670 <.0001* Fisher's Exact Test Prob Alternative Hypothesis Left 1.0000 Prob(Pos/Neg 10 = POS) is greater for Tumor? = NORMAL than TUMOR Right <.0001* Prob(Pos/Neg 10 = POS) is greater for Tumor? = TUMOR than NORMAL 2-Tail <.0001* Prob(Pos/Neg 10 = POS) is different across Tumor? 3. A representative subset of 9 clones DCC LAMC2 RASSF1 FGFR2 MYC TSC1 IL6 MYCN(N-myc) UBE3A, D15S10 Pos/Neg 9 Row % NEG POS Tumor? NORMAL 88.89 11.11 TUMOR 28.07 71.93 Tests N DF -LogLike RSquare (U) 924 1 88.007643 0.1453 Test ChiSquare Prob > ChiSq Likelihood Ratio 176.015 <.0001* Pearson 173.942 <.0001* Fisher's Exact Test Prob Alternative Hypothesis Left 1.0000 Prob(Pos/Neg 9 = POS) is greater for Tumor? = NORMAL than TUMOR Right <.0001* Prob(Pos/Neg 9 = POS) is greater for Tumor? = TUMOR than NORMAL 2-Tail <.0001* Prob(Pos/Neg 9 = POS) is different across Tumor? 4. A representative subset of 8 clones FGFR2 LAMC2 MYCN(N-myc) TSC1 IL6 MYC RASSF1 UBE3A, D15S10 Pos/Neg 8 Row % NEG POS Tumor? NORMAL 100.00 0.00 TUMOR 29.82 70.18 Tests N DF -LogLike RSquare (U) 924 1 133.24371 0.2151 Test ChiSquare Prob > ChiSq Likelihood Ratio 266.487 <.0001* Pearson 224.453 <.0001* Fisher's Exact Test Prob Alternative Hypothesis Left 1.0000 Prob(Pos/Neg 8 = POS) is greater for Tumor? = NORMAL than TUMOR Right <.0001* Prob(Pos/Neg 8 = POS) is greater for Tumor? = TUMOR than NORMAL 2-Tail <.0001* Prob(Pos/Neg 8 = POS) is different across Tumor?
FISH Probe Set Selection
To select 4-color probe sets for further FISH experiments, we evaluated the selected loci in greater detail supplementing statistical analysis with literature review. From the further analysis, for the probe selection, we excluded loci that were previously implicated in benign endometrial diseases. In addition, we considered NCOA3 and ZNF217 to be potentially located on one segment of rearrangement and thus picked available probe, ZNF 217, for further FISH studies.
TABLE-US-00005 Clone on array: Vysis FISH probe availability: 1q25-q31, LAMC2 1q25 probe 18q21.3, DCC: loss probe available 1q24, MYC probe available 10q26, FGFR2: gain (10q23 in no probe/clone PTENq23.3 literature) 15q11, UBE3A: deletion PWS probe 3q27-q29, TP63: gain (3q24-26.4 2 clones or substitute by PIK3CA reported in literature) 3p21.3, RASSF1: gain 2 clones 7p21, IL6: gain 1 clone 2p24.1, MYCN: gain SG, SO probes 8p11.2, FGFR1: gain/deletion 2 clones 9q33-34 (TSC1): loss (found in endometriosis also) 20q12-q13 (NCOA3?): gain 20q11.2 HIRA, 20q13.2 ZNF217 (in literature q13.2) 16q24.2- q24.3: loss (16q literature)
As evident from the results outlined above, CGH data produced by the Genosenor array yielded several preliminary chromosomal targets which included LAMC2 (1q25), NMYC (2p24.1), PIK3CA (3q27-q29), MYC (8q24), FGFR2 (10q26), centromeric region of chromosome 18 (CEP18), DCC (18q21), and ZNF217 (20q13). Of these eight probes, numerous potential four-probe combinations have been identified and probes were grouped in probe sets.
Contingency table analysis was used to assess probe combinations, and the combinations were ranked by a chi square p value and by the DFI value. As at least some of the loci (such as DCC) represent deletions, we first assessed 3-probe combinations to allow one Chromosome Enumerator Probe (CEP) to be added to the probe set if required, as a control for a deletion probe. Shown below is the list of best 3-probe combination in detecting endometrial cancer (Table 3) with chi square p value of <0.05.
The following probe sets were selected and used in FISH experiments using Table 3 above as a guide. New probes were designed and manufactured in Abbott Molecular R&D as indicated below.
TABLE-US-00006 Probe Set #1 1q25 SpectrumGold DCC (18q21.2) SpectrumRed CEP18 SpectrumGreen MYC (8q24) SpectrumAqua Probe Set #2 MYCN (2p24.3) SpectrumGreen (new probe) PIK3CA (2q26.32) SpectrumGold FGFR2 (10q26.13) SpectrumAqua (new probe) ZNF217 (20q13.2) pectrumRed Probe Set #3 PTEN (10q23.3) SpectrumOrange CEP10 SpectrumGreen FGFR1 (8p11.2) SpectrumAqua (new probe)
TABLE-US-00007 TABLE 3 Selected best 3-probe combinations (p < 0.05) Normal Cancer # mark- mark- # SPEC DFI mark- mark- # spec- er er spec- vs vs er er chi sq PROBE 1 PROBE 2 PROBE 3 Probes imens SENS (s)+ (s)- imens SENS norm norm (s)+ (s)- prob LAMC2:18:1q25-q31 MYC:110:8q24.12-q24.13 UBE3A, D15S10:182:15q11- 3 9 0.0000 0 9 57 0.5439 1.0000 0.4561 31 26 0.0024 LAMC2:18:1q25-q31 FGFR2:135:10q26 UBE3A, D15S10:182:15q11- 3 9 0.0000 0 9 57 0.5439 1.0000 0.4561 31 26 0.0024 LAMC2:18:1q25-q31 MYCN(N-myc):26:2p24.1 MYC:110:8q24.12-q24.13 3 9 0.0000 - 0 9 57 0.5263 1.0000 0.4737 30 27 0.0032 LAMC2:18:1q25-q31 MYC:110:8q24.12-q24.13 FGFR2:135:10q26 3 9 0.0000 0 9 57- 0.5263 1.0000 0.4737 30 27 0.0032 LAMC2:18:1q25-q31 FGFR1:106:8p11.2-p11.1 UBE3A, D15S10:182:15q11- 3 9 0.0000 0 9 57 0.5263 1.0000 0.4737 30 27 0.0032 LAMC2:18:1q25-q31 MYCN(N-myc):26:2p24.1 FGFR1:106:8p11.2-p11.1 3 9 0.0000 - 0 9 57 0.5088 1.0000 0.4912 29 28 0.0043 LAMC2:18:1q25-q31 FGFR1:106:8p11.2-p11.1 FGFR2:135:10q26 3 9 0.0000 0 9 57- 0.5088 1.0000 0.4912 29 28 0.0043 LAMC2:18:1q25-q31 FGFR1:106:8p11.2-p11.1 MYC:110:8q24.12-q24.13 3 9 0.0000- 0 9 57 0.4912 1.0000 0.5088 28 29 0.0056 LAMC2:18:1q25-q31 MYCN(N-myc):26:2p24.1 FGFR2:135:10q26 3 9 0.0000 0 9 57 - 0.4912 1.0000 0.5088 28 29 0.0056 LAMC2:18:1q25-q31 MYCN(N-myc):26:2p24.1 UBE3A, D15S10:182:15q11- 3 9 0.0000 0 9 57 0.4737 1.0000 0.5263 27 30 0.0072 MYC:110:8q24.12-q24.1 FGFR2:135:10q26 UBE3A, D15S10:182:15q11- 3 9 0.0000 0 9 57 0.4737 1.0000 0.5263 27 30 0.0072 LAMC2:18:1q25-q31 FGFR1:106:8p11.2-p11.1 ZNF217(ZABC1):254:20q13 3 9 0.000- 0 0 9 57 0.4737 1.0000 0.5263 27 30 0.0072 LAMC2:18:1q25-q31 MYC:110:8q24.12-q24.13 ZNF217(ZABC1):254:20q13 3 9 0.000- 0 0 9 57 0.4737 1.0000 0.5263 27 30 0.0072 LAMC2:18:1q25-q31 UBE3A, D15S10:182:15q11 ZNF217(ZABC1):254:20q13 3 9 0.0000 0 9 57 0.4737 1.0000 - 0.5263 27 30 0.0072 LAMC2:18:1q25-q31 FGFR2:135:10q26 ZNF217(ZABC1):254:20q13 3 9 0.0000 0 9 5- 7 0.4561 1.0000 0.5439 26 31 0.0093 FGFR1:106:8p11.2-p11. FGFR2:135:10q26 UBE3A, D15S10:182:15q11- 3 9 0.0000 0 9 57 0.4386 1.0000 0.5614 25 32 0.0117 LAMC2:18:1q25-q31 MYCN(N-myc):26:2p24.1 ZNF217(ZABC1):254:20q13 3 9 0.0000- 0 9 57 0.4386 1.0000 0.5614 25 32 0.0117 MYCN(N-myc):26:2p24. FGFR1:106:8p11.2-p11.1 FGFR2:135:10q26 3 9 0.0000 0 9- 57 0.4211 1.0000 0.5789 24 33 0.0147 MYCN(N-myc):26:2p24. MYC:110:8q24.12-q24.13 FGFR2:135:10q26 3 9 0.0000 0 9- 57 0.4211 1.0000 0.5789 24 33 0.0147 MYCN(N-myc):26:2p24. FGFR2:135:10q26 UBE3A, D15S10:182:15q11- 3 9 0.0000 0 9 57 0.4035 1.0000 0.5965 23 34 0.0182 MYCN(N-myc):26:2p24. MYC:110:8q24.12-q24.13 UBE3A, D15S10:182:15q11- 3 9 0.0000 0 9 57 0.3860 1.0000 0.6140 22 35 0.0225 FGFR2:135:10q26 UBE3A, D15S10:182:15q11 ZNF217(ZABC1):254:20q13 3 9 0.0000 0 9 57 0.3860 1.0000 - 0.6140 22 35 0.0225 LAMC2:18:1q25-q31 FGFR1:106:8p11.2-p11.1 DCC:231:18q21.3 3 9 0.1111 1 8 57- 0.5088 0.8889 0.5036 29 28 0.0260 LAMC2:18:1q25-q31 MYC:110:8q24.12-q24.13 DCC:231:18q21.3 3 9 0.1111 1 8 57- 0.5088 0.8889 0.5036 29 28 0.0260 LAMC2:18:1q25-q31 FGFR2:135:10q26 DCC:231:18q21.3 3 9 0.1111 1 8 57 0.5088- 0.8889 0.5036 29 28 0.0260 LAMC2:18:1q25-q31 UBE3A, D15S10:182:15q11 DCC:231:18q21.3 3 9 0.1111 1 8 57 0.5088 0.8889 0.5036 2- 9 28 0.0260 FGFR1:106:8p11.2-p11. MYC:110:8q24.12-q24.13 FGFR2:135:10q26 3 9 0.0000 0 - 9 57 0.3684 1.0000 0.6316 21 36 0.0274 MYC:110:8q24.12-q24.1 FGFR2:135:10q26 ZNF217(ZABC1):254:20q13 3 9 0.0000 0- 9 57 0.3684 1.0000 0.6316 21 36 0.0274 LAMC2:18:1q25-q31 MYCN(N-myc):26:2p24.1 DCC:231:18q21.3 3 9 0.1111 1 8 57 - 0.4912 0.8889 0.5208 28 29 0.0327 MYCN(N-myc):26:2p24. FGFR1:106:8p11.2-p11.1 MYC:110:8q24.12-q24.13 3 9 0.0- 000 0 9 57 0.3509 1.0000 0.6491 20 37 0.0333 MYCN(N-myc):26:2p24. FGFR1:106:8p11.2-p11.1 UBE3A, D15S10:182:15q11- 3 9 0.0000 0 9 57 0.3509 1.0000 0.6491 20 37 0.0333 FGFR1:106:8p11.2-p11. MYC:110:8q24.12-q24.13 UBE3A, D15S10:182:15q11- 3 9 0.0000 0 9 57 0.3509 1.0000 0.6491 20 37 0.0333 MYCN(N-myc):26:2p24. FGFR2:135:10q26 ZNF217(ZABC1):254:20q13 3 9 0.0000 0 - 9 57 0.3509 1.0000 0.6491 20 37 0.0333 FGFR1:106:8p11.2-p11. FGFR2:135:10q26 ZNF217(ZABC1):254:20q13 3 9 0.0000 0- 9 57 0.3509 1.0000 0.6491 20 37 0.0333 MYCN(N-myc):26:2p24. FGFR1:106:8p11.2-p11.1 ZNF217(ZABC1):254:20q13 3 9 0.- 0000 0 9 57 0.3333 1.0000 0.6667 19 38 0.0401 MYCN(N-myc):26:2p24. MYC:110:8q24.12-q24.13 ZNF217(ZABC1):254:20q13 3 9 0.- 0000 0 9 57 0.3333 1.0000 0.6667 19 38 0.0401 MYC:110:8q24.12-q24.1 UBE3A, D15S10:182:15q11 ZNF217(ZABC1):254:20q13 3 9 0.0000 0 9 57 0.3333 1.0000 - 0.6667 19 38 0.0401 FGFR1:106:8p11.2-p11. UBE3A, D15S10:182:15q11 ZNF217(ZABC1):254:20q13 3 9 0.0000 0 9 57 0.3158 1.0000 - 0.6842 18 39 0.0481
Probe sets #1 and 2 in relation to aCGH data are shown in FIG. 4. The plot illustrates that the probes were chosen in such a manner as to be able to detect both endometrioid and non-endometrioid tumors.
Fluorescence In Situ Hybridization Studies
Study Design
A probe selection study is currently being performed to determine which four-probe combination of the eight FISH probes can most accurately detect endometrial carcinoma.
Archived formalin-fixed paraffin embedded endometrial tissue specimens taken from patients undergoing hysterectomy or Pipelle biopsy during 2000 to 2006 were utilized for this probe selection study. A variety of specimens diagnosed as endometrial carcinoma (endometrioid type and non-endometrioid type), simple and complex hyperplasia and normal endometrial epithelium were selected for FISH analysis (Table 4).
Ten histologically negative specimens from patients without a history of endometrial carcinoma were also evaluated as a normal value study. Six paraffin sectioned slides were prepared for each case, one was stained with hematoxylin and eosin (H&E) while five unstained slides were prepared for FISH analysis. The H&E slide was microscopically evaluated by a gynecologic pathologist and areas of interest (tumor in cancer specimens; normal epithelium in benign specimens) for FISH analysis were identified. This area of interest was concurrently marked on the unstained tissue slide and was hybridized with each of the two FISH probe sets (separate slides used for each of the two probe sets).
TABLE-US-00008 TABLE 4 Patient Population Genosensor Non Geno- cases sensor Total Normal 0 10 10 Simple Hyperplasia 0 5 5 Complex Hyperplasia 2 4 6 Endometrioid Grade 1 8 7 15 Endometrioid Grade 2 7 3 10 Endometrioid Grade 3 6 4 10 Serous 6 3 9 Clear Cell 1 1 2 MMMT 2 1 3 Total 32 38 70
Hybridized slides were evaluated using a fluorescence microscope. The area of interest was identified, 50 cells were evaluated (50 tumor cells for the cancer or pre-neoplastic cases and 50 normal cells for the normal cases) and the number of signals from each of the four probes was recorded. A representative example of endometrial cancer cells exhibiting multiple gains for these probes is shown in FIG. 5. A statistical analysis was performed by Abbott Molecular, Inc. using the signal patterns from all recorded cells. The ten histologically negative specimens were used to calculate the number of signals present in normal endometrial tissue. ROC curve analyses were performed to determine the optimal cutoff values used to discriminate chromosomal abnormalities (gains and losses) from cells with normal chromosomal content for each probe analyzed. Numerous different four-probe combinations were evaluated using this technique to determine the best probe combination to distinguish endometrial cancer from normal endometrial tissue and precursor lesions.
Results
Probe Sets #1 and #2
Two probe sets, #1 and #2, were evaluated on all specimens. FIG. 6 illustrates the proportion of cells with chromosomal abnormalities by histologic subtype for each of the eight probes. Normal endometrial specimens exhibited zero or very few cells with chromosomal gains and approximate 5-20% of cells showed a form of chromosomal loss. In additional very few (<10%) cells with chromosomal gains were identified in hyperplasia specimens.
The following FISH parameters were analyzed: 1. % Gain, percent of cells with a copy number gain (>2 copies per cell) of a locus out of 50 cells counted (50=100%) 2. % Loss, percent of cells with a copy number loss (<2 copies per cell) of a locus out of 50 cells counted (50=100%) 3. % Abnormal, percent of cells with either a copy number loss (<2 copies per cell) OR a copy number gain (>2 copies per cell) of a locus out of 50 cells counted (50=100%)
The conclusions drawn from FIG. 6 are: No gains were observed in Normal specimens for DCC, CEP18, MYC and 1q24. The increase in % cells with gains was observed from normal to hyperplasia to cancer, with most gains in Non-Endometrioid tumors. With losses, there is no clear separation between normal, hyperplasia and cancer. A trend is observed in the increase of % Abnormal from normal to hyperplasia to cancer, with the greatest number of abnormalities in Non-Endometrioid tumors. MYC and 1q24 appear to have the largest range of difference.
Probes directed to 1q25 and 8q24 had the highest percentage of abnormal cells in specimens with EN and NE cancers. All other probes detected approximately the same proportion of cells with gains in EN and NE cancers. For chromosomal losses, 18q (DCC) and CEP 18 exhibited the most cells with loss in EN and NE cancers, as well as normal and hyperplasia specimens.
A multivariate analysis was performed to determine which four-probe combination yielded the great combination of sensitivity and specificity for NE and NE cancers. Using JMP 8.0 Statistical Analysis software (SAS Institute, 2008) 70 4-probe combinations of 8 probes were tested. "% Abnormal" was chosen as FISH parameter for analysis (see definitions) and Nominal Logistic Regression platform was utilized with the Test specimens chosen as "all cancers" and Control specimens as hyperplasia+normal. ROCs were constructed, and 20 best combinations with the highest AUC were selected. The combinatorial Excel program was run on the selected combinations to obtain high-resolution data on sensitivity and specificity. The program constructed contingency tables and calculated DFI values for the 4-probe combinations at each cutoff level of % "abnormal" for each probe.
The results of these analyses revealed numerous possible candidate four-probe sets (Table 5). The best probe set combination included DCC, 1q24, MYC, and CEP18 which had a AUC of 0.952 with a sensitivity of 1.000 and a specificity of 0.9048. Three other combinations had a sensitivity of 0.979 and a specificity of 0.900 which included (set 2) 1q24, MYC, FGFR2, CEP18, (set 3) DCC, 1q24, FGFR2, CEP18, and (set 4) 1q24, MYC, CEP18 and PIK3CA.
TABLE-US-00009 TABLE 5 Probe combinations that discriminate Cancer from Normal and Hyperplasia. Analyzed % Cells with any abnormality (% abnormal) using JMP8.0 with combinatorial Excel program (contingency table analysis). AUC Best Best Locus 1 Locus 2 Locus 3 Locus 4 (JMP) Sens LM Spec LM DCC 1q24 MYC CEP18 0.95238 1.0000 0.9048 1q24 MYC FGFR2 CEP18 0.95918 0.9796 0.9000 DCC 1q24 FGFR2 CEP18 0.95867 0.9796 0.9000 1q24 MYC CEP18 PIK3CA 0.95306 0.9796 0.9000 DCC 1q24 MYC FGFR2 0.95714 0.9592 0.9000 1q24 NMYC FGFR2 CEP18 0.95714 0.9592 0.9000 1q24 FGFR2 CEP18 PIK3CA 0.95714 0.9592 0.9000 1q24 FGFR2 CEP18 20q13 0.95612 0.9592 0.9000 1q24 CEP18 PIK3CA 20q13 0.95612 0.9592 0.9000 1q24 NMYC CEP18 PIK3CA 0.9551 0.9592 0.9000 DCC 1q24 FGFR2 20q13 0.95408 0.9388 0.9000 1q24 MYC CEP18 0.9796 0.9048 DCC 1q24 CEP18 0.9796 0.9048 1q24 CEP18 0.9592 0.9048 Test = all cancers; Control = hyperplasia + normal
FIGS. 7 and 8 present Receiver Operator curves for the selected probe combination. It is evident from the figures that adding probes to a single-probe FISH assay improves sensitivity and specificity.
The distribution by tumor type and grade is shown below (Table 6):
TABLE-US-00010 TABLE 6 Tumor Type and Grade By FISH (4Best) % Abnormal: POS or NEG. Cutoffs used as listed in FIG. 7. Count Row % NEG POS Total Normal 10 0 10 100.00 0.00 Simple hyperplasia 4 1 5 80.00 20.00 Complex hyperplasia 5 1 6 83.33 16.67 Endometrioid Grade 1 0 15 15 0.00 100.00 Endometrioid Grade 2 0 10 10 0.00 100.00 Endometrioid Grade 3 0 10 10 0.00 100.00 Carcinosarcoma/MMMT 0 3 3 0.00 100.00 Clear cell 0 2 2 0.00 100.00 Serous 0 9 9 0.00 100.00 19 51 70
Detection of positives in the complex hyperplasia specimens could be due to heterogeneity in this category and could reflect risk of progression to cancer.
Comparison of FISH to CGH Array Data
Performance of the 1q24, CEP16, DCC and MYC FISH probe set was compared by contingency analysis in JMP 8.0 to the aCGH Probe Selection Set #1:
DCC (18q21.3)--frequency of loss in all cancers.about.17%
Cep18 included for FISH probe set (detection of deletions)
LAMC2 (1q25)--frequency of gain in all cancers >20%
MYC (8q24.12-q24.13)--frequency of gain in all cancers.about.17%
TABLE-US-00011 Contingency Table Array (Ca vs N) One of Loci Changed Count Row % NEG POS Ca/NoCa Ca 28 29 57 49.12 50.88 N 8 1 9 88.89 11.11 36 30 66 Sensitivity = 50.88% (29 out of 57) Specificity = 88.89% (8 out of 9)
TABLE-US-00012 Contingency Table FISH (Ca vs N + Hyperplasia) FISH (4Best) % Imbal: POS or NEG Count Row % NEG POS Test or Ref? Ca 0 49 49 0.00 100.00 N + Hyperpl 19 2 21 90.48 9.52 19 51 70 Sensitivity = 100% (49 out of 49) Specificity = 90.48% (19 out of 21)
It is apparent that FISH assay with probe designed based on microarray results has significantly improved on array performance. This is possibly due to influence of benign cells in the macro-dissected tumors that dilute the analyte tumor DNA and thus lead to lower sensitivity. This problem in microarray experiments could be overcome by careful selection of specimens with high percentage of tumor cells and by micro-dissection of the tumor area.
Analysis of Copy Number Gains Only, Best Combinations: Cancer Vs Normal+Hyperplasia
For a practical FISH application, an alternative probe combination was evaluated that avoids technically challenging detection of losses (looses and gains are considered in "% abnormal" parameter).
Following the procedure outlined above, all 4-probe combinations were analyzed, and best were selected (preliminary analysis using SD of % Cells in excel), Table 7 and FIG. 9.
TABLE-US-00013 TABLE 7 Best 4-probe combinations, Gains only. PROBE PROBE PROBE PROBE CUTOFF CUTOFF CUTOFF CUTOFF 1 2 3 4 SENS SPEC DFI 1 2 3 4 1q24 MYC CEP18 20q13.2 0.84 0.95 0.17 41.30 8.36 7.91 4.46 1q24 CEP18 PIK3CA 20q13.2 0.84 0.95 0.17 8.36 7.91 18.47 4.46 1q24 CEP18 20q13.2 FGFR2 0.84 0.90 0.19 8.36 7.91 4.46 15.71
Interestingly, the combinations listed above have improved on specificity of cancer detection but have decreased sensitivity, especially to early-stage endometrioid tumors (FIG. 9 and Table 8).
The distribution of positive and negative specimens using the 1q24, MYC, CEP18 and 20q13 probe set is shown in Table 8.
TABLE-US-00014 TABLE 8 Tumor Type and Grade By FISH: Gains of MYC, CEP18, 1q24, 20q13. Cutoffs used as listed in FIG. 9. Count Row % NEG POS Total Normal 10 0 10 100.00 0.00 Simple hyperplasia 4 1 5 80.00 20.00 Complex hyperplasia 5 1 6 83.33 16.67 Endometrioid Grade 1 3 12 15 20.00 80.00 Endometrioid Grade 2 1 9 10 10.00 90.00 Endometrioid Grade 3 0 10 10 0.00 100.00 Carcinosarcoma/MMMT 0 3 3 0.00 100.00 Clear cell 0 2 2 0.00 100.00 Serous 0 9 9 0.00 100.00 23 47 70
As evident from the table, this set (FISH gains) has lower sensitivity towards low-grade endometrial tumors.
Probe Set #3 Evaluation
Probe set #3 was evaluated on 16 early-stage endometrioid cancer specimens and 12 benign (normal and hyperplasia) specimens to determine whether it improves on sensitivity of detection of early-stage (grade 1 and 2) endometrioid tumors with the FISH assay that evaluates gains of MYC, CEP18, 1q24, 20q13.
The analysis of the FISH data has demonstrated that the addition of the PTEN loss to the selected probe set at a cutoff of 14% could increase the sensitivity of detection of endometrial cancer to 100%, however decreasing the specificity (FIG. 10). This finding is in agreement with aCGH data discussed above. In contrast, an addition of Chromosome 10 "% abnormal cells" to the selected probes at a cutoff of 10-12% of cells with any abnormality (gain or loss), allowed for increased sensitivity without sacrificing the specificity. Interestingly, a combination of CEP10 with MYC, CEP18, and 1q24 yielded the same 100% sensitivity for the 16 cancer specimens and 92% specificity against 12 normal+hyperplasia specimens. Therefore, an added assessment of aneusomy 10 to the FISH probe set could be a beneficial. Addition of FGFR1 did not significantly improve cancer detection, however, when used in combination with CEP10, 1q24 and MYC probes, FGFR1 gain at a cutoff of 2% cells yielded 100% sensitivity for the 16 cancer specimens and 92% specificity against 12 normal+hyperplasia specimens. However, when all the 70 specimens are considered (with limited data included for the probe set #3), the only probe that did not result in decrease in specificity when combined with the MYC, 1q24, 20q13, and CEP18 gain probes was FGFR1 at the cutoff of .gtoreq.2% cells with gain of the probe:
TABLE-US-00015 Test or Ref? By MYC gain, 1q24 gain, 20q13 gain, CEP18 gain, FGFR1 gain: Count Row % NEG POS Total Ca 2 47 49 4.08 95.92 N + Hyperpl 19 2 21 90.48 9.52 21 49 70
Interestingly though, a combination of 20q13.2, 1q24, CEP10 and FGFR1 on all 70 specimens (with the data available thus far) demonstrated sensitivity and specificity of 96% and 91%, as shown below:
Test or Ref? By 20q13, CEP10, 1q24, FGFR1
TABLE-US-00016 Count Row % NEG POS Total Ca 2 47 49 4.08 95.92 N + Hyperpl 19 2 21 90.48 9.52 21 49 70
As data for all of the specimens is unavailable at this point for Probe Set #3, it appears feasible that the combination of 4 probes that evaluate 20q13 gain, 1q24 gain, CEP10 imbalance, and FGFR1 gain could prove to be superior to the 1q24, MYC, CEP8 and 20q13.2 probe set in future experiments.
Probe Set #4 Evaluation
Probe set #4 was evaluated on the same set of endometrioid cancer specimens, normal and hyperplasia specimens described above to determine whether it improves on sensitivity of detection of low grade (grade 1 and 2) endometrioid tumors above that obtained with the FISH assay that evaluates gains of MYC, CEP18, 1q25, 20q13.
The analysis of the FISH data demonstrates that the substitution of the FGFR1 gain (with a cutoff of 4%) for 20q in the MYC, 1q25, and CEP18 probe set provided a sensitivity of 90%, which was similar to the MYC, 1q25, CEP18 and 20q probe set. However, the addition of FGFR1, resulted in one additional complex hyperplasia specimen to be diagnosed as positive. (Table 9).
Interestingly, further analyses revealed that FGFR1 could significantly increase the sensitivity of the four probe set over 20q. When the cutoff of FGFR1 was reduced to 2%, the probe combination of FGFR1, MYC, 1q25, and CEP18 had a sensitivity and specificity of 96% and 81% respectively.
TABLE-US-00017 TABLE 9 Evaluation of additional probes (probe set 3) to improve sensitivity of endometrial cancer detection over that obtained with MYC, CEP 18, 1q25 and 20q13. DCC/ PTEN/ FGFR1 MYC CEP18 1q25 20q13.2 FGFR1 FGFR1 CEP18 CEP10 PTEN CEP10 % Gain Type % % % % % % % % % % OR and Gain Gain Gain Gain Gain Gain Loss Loss Loss Loss Loss ID# Grade >4 >4 >6 >4 >4 >2 >16 >12 >18 >10 - >10 101 N NEG NEG NEG NEG NEG NEG NEG NEG NEG NEG NEG 102 N NEG NEG NEG NEG NEG NEG NEG NEG NEG NEG POS 103 N NEG NEG NEG NEG NEG NEG NEG NEG NEG NEG NEG 104 N NEG NEG NEG NEG NEG NEG POS NEG NEG NEG NEG 105 N NEG NEG NEG NEG NEG NEG NEG NEG NEG NEG NEG 106 N NEG NEG NEG NEG NEG NEG NEG NEG NEG NEG NEG 107 N NEG NEG NEG NEG NEG NEG NEG NEG NEG NEG NEG 108 N NEG NEG NEG NEG NEG NEG NEG NEG NEG NEG NEG 109 N NEG NEG NEG NEG NEG NEG NEG NEG NEG NEG NEG 110 N NEG NEG NEG NEG NEG NEG NEG NEG POS POS NEG 86 SH NEG NEG NEG NEG NEG NEG POS NEG POS POS NEG 88 SH POS POS POS NEG NEG NEG NEG NEG NEG NEG NEG 96 SH NEG NEG NEG NEG NEG NEG NEG NEG NEG NEG NEG 97 SH NEG NEG NEG NEG NEG NEG NEG NEG NEG NEG NEG 100 SH NEG NEG NEG NEG NEG NEG NEG NEG NEG NEG NEG 85 CH POS POS NEG NEG POS POS POS POS POS POS NEG 87 CH NEG NEG NEG NEG NEG NEG NEG NEG NEG NEG NEG 89 CH NEG NEG NEG NEG NEG NEG NEG NEG NEG NEG NEG 90 CH NEG NEG NEG NEG POS POS NEG NEG NEG NEG POS 91 CH NEG NEG NEG NEG POS NEG POS NEG NEG NEG NEG 93 CH NEG NEG NEG NEG NEG NEG NEG NEG NEG NEG NEG 2 EG1 NEG NEG NEG NEG NEG NEG POS NEG POS POS POS 3 EG1 POS POS POS NEG NEG NEG NEG NEG NEG POS NEG 4 EG1 POS POS POS POS POS NEG NEG NEG NEG NEG NEG 5 EG1 POS POS POS POS POS POS NEG NEG NEG POS NEG 14 EG1 POS POS POS POS POS POS NEG NEG NEG NEG POS 15 EG1 NEG NEG NEG POS POS NEG POS NEG NEG POS POS 16 EG1 NEG NEG NEG NEG POS POS POS NEG POS POS NEG 18 EG1 POS POS POS NEG NEG NEG POS NEG NEG NEG NEG 56 EG1 NEG NEG NEG NEG NEG NEG POS NEG POS POS NEG 57 EG1 POS NEG NEG NEG NEG NEG NEG NEG POS POS NEG 58 EG1 NEG POS NEG POS NEG POS NEG NEG NEG POS NEG 59 EG1 NEG NEG POS NEG NEG NEG NEG NEG POS POS NEG 61 EG1 NEG POS NEG NEG NEG NEG POS NEG NEG POS NEG 63 EG1 POS POS POS NEG NEG NEG NEG NEG NEG NEG NEG 65 EG1 NEG POS NEG NEG NEG POS NEG NEG POS POS NEG 7 EG2 POS POS POS NEG NEG POS NEG NEG NEG NEG NEG 8 EG2 POS POS NEG NEG NEG NEG NEG NEG NEG NEG NEG 33 EG2 POS POS POS NEG NEG NEG POS NEG POS POS NEG 34 EG2 POS NEG NEG NEG POS POS POS NEG NEG NEG POS 35 EG2 POS POS POS NEG POS NEG NEG NEG NEG NEG POS 36 EG2 POS POS POS POS POS POS NEG POS NEG NEG POS 37 EG2 POS POS POS NEG NEG NEG NEG NEG POS POS NEG 66 EG2 POS POS POS POS POS NEG POS NEG POS POS NEG 67 EG2 NEG NEG NEG NEG POS NEG NEG NEG NEG NEG NEG 70 EG2 POS POS POS NEG POS POS POS NEG POS POS POS 9 EG3 POS POS POS NEG NEG POS POS NEG POS POS NEG 42 EG3 POS POS POS POS POS NEG POS NEG NEG NEG POS 43 EG3 POS POS POS POS POS POS POS NEG NEG NEG POS 44 EG3 POS POS POS NEG POS NEG NEG NEG NEG NEG NEG 45 EG3 POS POS POS POS POS POS NEG NEG NEG NEG POS 47 EG3 POS POS POS POS POS POS POS POS POS NEG POS 75 EG3 POS POS POS POS POS POS NEG NEG NEG NEG POS 76 EG3 POS NEG POS POS NEG POS POS POS POS POS POS 77 EG3 POS POS POS POS POS POS NEG POS NEG NEG POS 83 EG3 POS POS POS POS POS POS POS NEG NEG POS POS 11 C/M POS NEG NEG POS POS POS NEG POS POS POS POS 12 C/M POS POS POS POS POS POS POS POS POS POS POS 78 C/M POS POS POS POS POS POS POS POS NEG NEG POS 54 Clear POS POS POS POS POS POS NEG POS NEG NEG POS cell 81 Clear POS POS POS POS POS POS POS POS NEG NEG POS cell 1 S POS POS POS POS POS POS POS POS NEG POS POS 6 S POS POS POS POS POS POS POS POS NEG NEG POS 10 S POS POS POS POS POS POS POS POS NEG NEG POS 49 S POS POS POS POS POS POS POS POS NEG NEG POS 50 S POS POS POS POS POS POS NEG NEG NEG NEG POS 51 S POS POS POS POS POS POS POS POS NEG NEG POS 79 S POS POS POS POS POS POS POS POS NEG NEG POS 80 S POS POS POS POS POS POS POS POS NEG NEG POS 94 S POS POS POS POS POS POS POS POS NEG POS POS Table Abbreviations: N = Normal; SH = Simple hyperplasia; CH = Complex hyperplasia; EG1 = Endometrioid Grade 1; EG2 = Endometrioid Grade 2; EG3 = Endometrioid Grade 3; Carcinosarcoma/MMMT = C/M; S = Serous; POS = Number of cells with abnormal sign patterns identified met or exceeded the threshold for the probe; NEG = Number of cells with abnormal sign patterns identified was less than the threshold for the probe
Analyses of other probes to increase the sensitivity of MYC, 1q25 and CEP18 are shown in Table 10. The addition of DCC, CEP10, PTEN, or FGFR1 increase the sensitivity of the combination probe set to 94-98%. However, the increase in sensitivity was achieved at the expense of decreased specificity (76-81%).
TABLE-US-00018 TABLE 10 Analysis of adding DCC, CEP10, PTEN or FGFR1 to a probe set of MYC, 1q25 and CEP18 to increase the sensitivity of endometrial cancer detection Gains Probe Probe Probe Losses Sensi- Spe- 1 2 3 Probe 4 tivity cificity Cutoff MYC 1q25 CEP18 DCC/CEP18 98% 76% >4 >6 >4 >16 Cutoff MYC 1q25 CEP18 CEP10 >10 98% 81% >4 >6 >4 Cutoff MYC 1q25 CEP18 PTEN >18 96% 81% >4 >6 >4 Cutoff MYC 1q25 CEP18 FGFR1 >10 94% 81% >4 >6 >4 (gains and loss)
Additional analyses were performed to determine the optimal probe set with cutoffs to attain very high specificity for endometrial carcinoma. Results from this analysis can be seen in Table 11. Numerous probe and abnormality combinations achieved at least 95% specificity. Those that produced the highest sensitivity with greater than 95% specificity are highlighted in yellow at the top of Table 11. All of these combinations included the evaluation of locus loss or combination of loss and gains (imbal). The best performing probe set that only evaluated gains had a sensitivity of 84% and specificity of 95%, which included FGFR1, 1q25, CEP18 and 20q13 with cutoffs of 8%, 8%, 8% and 8% respectively (highlighted in blue). Two other probe sets containing 1q25, MYC, CEP18 and FGFR1 or 20q13 using cutoffs of 12%, 12%, 12%, and 12%, respectively, achieved a sensitivity of 80% and specificity of 95% (highlighted in green).
The most appealing probe set included 4 LSI probes of 1q25, MYC, FGFR1 and 20q13 using similar cutoffs also had a sensitivity and specificity of 80% and 95%, respectively (seen in red). This probe set is ideal due because it performs nearly as well as other probe sets while only analyzing specimens for chromosomal gains. Chromosomal gains are easier to identify by technologists and would likely have a higher inter-observer reproducibility than when evaluating chromosomal losses.
TABLE-US-00019 TABLE 11 Analysis of different probes and cutoffs to achieve specificity of >95% for endometrial cancer detection ##STR00001## Abbreviations: Probe = locus of interest; Abn = Type of abnormality; loss = evaluates only loss of locus; gain = evaluates only gain of locus; imbal = evaluates gains or loss; cutoff = % of cells with abnormality to consider a specimen as positive.
TABLE-US-00020 ATTACHMENT 1. GeneSensor .TM. 300 Array Clone List Cyto Loc, Locus Link Utility 1 CEB108/T7 1p tel Sub Tel 2 1PTEL06 1p tel Sub Tel 3 CDC2L1(p58) 1p36 u DEL 4 PRKCZ 1p36.33 u DEL 5 TP73 1p36.33 u DEL/LOH 6 D1S2660 1p36.32 u DEL/LOH 7 D1S214 1p36.31 u DEL/LOH 8 D1S1635 1p36.22 LOH 9 D1S199 1p36.13 LOH 10 FGR(SRC2) 1p36.2-p36.1 AMP(1) 11 MYCL1(LMYC) 1p34.3 AMP(1) 12 D1S427, FAF1 1p32.3 LOH 13 D1S500 1p31.1 LOH 14 D1S418 1p13.1 LOH 15 NRAS 1p13.2 AMP(1) 16 D1S2465, D1S3402 1p12 17 WI-5663, WI-13414 1q21 18 LAMC2 1q25-q31 AMP(1) 19 PTGS2(COX2) 1q31.1 20 TGFB2 1q41 21 AKT3 1q44 AMP 22 SHGC-18290 1q tel Sub Tel 23 1QTEL10 1q tel Sub Tel 24 U32389 2p tel Sub Tel 25 2PTEL27 2p tel Sub Tel 26 MYCN(N-myc) 2p24.1 AMP(1) 27 MSH2, KCNK12 2p22.3-2p22.1 LOH 28 REL 2p13-p12 AMP(1) 29 GNLY 2p12-q11 M 30 SGC34236 2q13 M 31 BIN1 2q14 pTSG 32 LRP1B 2q21.2 pTSG 33 TBR1 2q23-q37 M 34 ITGA4 2q31-q32 M 35 CASP8 2q33-q34 LOH 36 ERBB4(HER-4) 2q33.3-q34 HER-2 homol 37 WI-6310 2q tel Sub Tel 38 D2S447 2q tel Sub Tel 39 3PTEL25 3p tel Sub Tel 40 3PTEL01, CHL1 3p tel Sub Tel 41 VHL 3p25-p26 TSG 42 RAF1 3p25 AMP(1) 43 THRB 3p24.3 LOH 44 MLH1 3p21.3-p23 Del 45 RASSF1 3p21.3 pTSG 46 FHIT 3p14.2 pTSG 47 p44S10 3p14.1 48 D3S1274, ROBO1 3p12-3p13 LOH 49 RBP1, RBP2 3q21-q22 50 TERC 3q26 AMP(1) 51 EIF5A2 3q26.2 52 PIK3CA 3q26.3 AMP(1) 53 TP63 3q27-q29 TSG 54 MFI2 3q tel Sub Tel 55 3QTEL05 3q tel Sub Tel 56 GS10K2/T7 4p tel Sub Tel 57 SHGC4-207 4p tel Sub Tel 58 D4S114 4p16.3 u DEL 59 WHSC1 4p16.3 u DEL 60 DDX15 4p15.3 M 61 KIT 4q11-q12 ONC 62 PDGFRA 4q11-q13 AMP(1) 63 EIF4E 4q24 (by AMP ucsc) 64 PGRMC2 4q26 65 PDZ-GEF1 4q32.1 M 66 4QTEL11 4q tel Sub Tel 67 D4S2930 4q tel Sub Tel 68 C84C11/T3 5p tel Sub Tel 69 D5S23 5p15.2 u DEL 70 D5S2064 5p15.2 u DEL 71 DAB2 5p13 pTSG 72 DHFR, MSH3 5q11.2-q13.2 gain/loss Ca 73 APC 5q21-q22 Del 74 EGR1 5q31.1 Del 75 CSF1R 5q33-q35 Del 76 NIB1408 5q tel Sub Tel 77 5QTEL70 5q tel Sub Tel 78 6PTEL48 6p tel Sub Tel 79 PIM1 6p21.2 M 80 CCND3 6p21 AMP 81 D6S414 6p12.1-p21.1 82 HTR1B 6q13 M 83 D6S434 6q16.3 Del 84 D6S268 6q16.3-q21 LOH 85 MYB 6q22-q23 AMP(1) 86 D6S311 6q23-24 LOH 87 ESR1 6q25.1 AMP(1) 88 6QTEL54 6q tel Sub Tel 89 G31341 7p tel Sub Tel 90 IL6 7p21 M 91 EGFR 7p12.3-p12.1 AMP(1) 92 ELN 7q11.23 u DEL 93 RFC2, CYLN2 7q11.23 u DEL 94 ABCB1(MDR1) 7q21.1 AMP(1) 95 CDK6 7q21-q22 AMP 96 SERPINE1 7q21.3-q22 pTSG 97 MET 7q31 AMP(1) 98 TIF1 7q32-q34 M 99 stSG48460 7q tel Sub Tel 100 7QTEL20 7q tel Sub Tel 101 D8S504 8p tel Sub Tel 102 D8S596 8p tel Sub Tel 103 CTSB 8p22 AMP(1) 104 PDGRL 8p22-p21.3 Del 105 LPL 8p22 Del 106 FGFR1 8p11.2-p11.1 AMP(1) 107 MOS 8q11 AMP(1) 108 E2F5 8p22-q21.3 M 109 EXT1 8q24.11-q24.13 TSG, uDel 110 MYC 8q24.12-q24.13 AMP(1) 111 PTK2 8q24-qter AMP 112 SHGC-31110 8q tel Sub Tel 113 U11829 8q tel Sub Tel 114 AF170276 9p tel Sub Tel 115 D9S913 9ptel Sub Tel 116 MTAP 9p21.3 LOH 117 CDKN2A(p16), MTAP 9p21 TSG 118 AFM137XA11 9p11.2 M 119 D9S166 9p12-q21 120 PTCH 9q22.3 TSG 121 DBCCR1 9q33.2 TSG 122 TSC1 9q34 TSG 123 ABL1 9q34.1 AMP(1) 124 H18962 9q tel Sub Tel 125 D9S325 9q tel Sub Tel 126 10PTEL006 10p tel Sub Tel 127 SHGC-44253 10p tel Sub Tel 128 D10S249, D10S533 10p15 TSG 129 GATA3 10p15 130 WI-2389, D10S1260 10p14-p13 u DEL 131 BMI1 10p13 gain 132 D10S167 10p11-10q11 near Cen 133 EGR2 10q21.3 M 134 PTEN 10q23.3 TSG 135 FGFR2 10q26 AMP(1) 136 DMBT1 10q25.3-q26.1 137 stSG27915 10q tel Sub Tel 138 10QTEL24 10q tel Sub Tel 139 11PTEL03 11p tel Sub Tel 140 INS 11p tel Sub Tel 141 HRAS 11p15.5 AMP(1) 142 CDKN1C(p57) 11p15.5 TSG 143 WT1 11p13 TSG 144 KAI1 11p11.2 145 D11S461 11q12.2 near cen 146 MEN1 11q13 147 CCND1 11q13 AMP(1) 148 FGF4, FGF3 11q13 AMP(1) 149 EMS1 11q13 AMP(1) 150 GARP 11q13.5-q14 AMP(1) 151 PAK1 11q13-q14 AMP(1) 152 RDX 11q22.3 LOH 153 ATM 11q22.3 LOH 154 MLL 11q23 AMP(1) 155 WI-6509 11q tel Sub Tel 156 AF240622 11q tel Sub Tel 157 8M16/SP6 12p tel Sub Tel 158 SHGC-5557 12p tel Sub Tel 159 CCND2 12p13 AMP(1) 160 CDKN1B(p27) 12p13.1-p12 TSG 161 KRAS2 12p11.2 AMP(1) 162 WNT1(INT1) 12q12-q13 AMP(1) 163 CDK2, ERBB3 12q13 AMP 164 GLI 12q13.2-q13.3 AMP(1) 165 SAS, CDK4 12q13-q14 AMP(1) 166 MDM2 12q14.3-q15 AMP(1) 167 DRIM, ARL1 12q23 168 stSG8935 12q tel Sub Tel 169 U11838 12q tel Sub Tel 170 BRCA2 13q12-q13 TSG 171 RB1 13q14 TSG 172 D13S319 13q14.2 LOH 173 D13S25 13q14.3 LOH 174 D13S327 13q tel Sub Tel 175 PNN(DRS) 14q13 176 TCL1A 14q32.1 gain/loss 177 AKT1 14q32.32 AMP(1) 178 IGH(D14S308) 14q tel Sub Tel 179 IGH(SHGC-36156) 14q tel Sub Tel 180 D15S11 15q11-q13 u DEL 181 SNRPN 15q12 u DEL 182 UBE3A, D15S10 15q11-q13 u DEL 183 GABRB3 15q11.2-q12 u DEL 184 MAP2K5 15q23 185 FES 15q26.1 AMP(1) 186 IGF1R 15q25-q26 AMP(1) 187 PACE4C 15q tel Sub Tel 188 WI-5214 15q tel Sub Tel 189 16PTEL03 16p tel Sub Tel 190 stSG48414 16p tel Sub Tel 191 CREBBP 16p13.3 u DEL 192 EMP2 16p13.3 193 ABCC1(MRP1) 16p13.1 AMP(1) 194 CYLD 16q12-q13 TSG 195 CDH1 16q22.1 LOH 196 FRA16D 16q23.2 197 CDH13 16q24.2-q24.3 LOH 198 LZ16 16q24.2 Del 199 FANCA 16q24.3 200 stSG30213 16q tel Sub Tel 201 16QTEL013 16q tel Sub Tel 202 282M15/SP6 17p tel Sub Tel 203 WI-14673 17p tel Sub Tel 204 HIC1 17p13.3 LOH 205 D17S379, MNT 17p13.3 u DEL/LOH 206 PAFAH1B1(LIS1) 17p13.3 u DEL 207 TP53(p53) 17p13.1 TSG 208 D17S125, D17S61 17p12-p11.2 u Del/u Dup 209 D17S1296, D17S1523 17p12-p11.2 u Del/u Dup 210 LLGL1 17p12-17p11.2 u DEL 211 FLI, TOP3A 17p12-17p11.2 u DEL 212 NF1 5' 17q11.2 213 NF1 3' 17q11.2 214 BRCA1 17q21 TSG 215 PPARBP(PBP) 17q12 AMP 216 ERBB2(HER-2) 17q11.2-17q12 AMP(1) 217 THRA 17q11.2 AMP 218 TOP2A 17q21-q22 AMP 219 NME1(NME23) 17q21.3 LOH? 220 RPS6KB1(STK14A) 17q23 AMP(1) 221 D17S1670 17q23 222 TK1 17q23.2-q25.3 AMP? 223 SHGC-103396 17q tel Sub Tel 224 AFM217YD10 17q tel Sub Tel 225 D18S552 18p tel Sub Tel 226 SHGC17327 18p tel Sub Tel 227 YES1 18p11.31-p11.21 AMP(1) 228 TYMS(TS) 18p11.32 AMP 229 LAMA3 18q11.2 230 FRA18A(D18S978) 18q12.3 231 DCC 18q21.3 Del 232 MADH4(DPC4) 18q21.1 TSG 233 BCL2 3' 18q21.3 AMP 234 CTDP1, SHGC-145820 18q tel Sub Tel 235 18QTEL11 18q tel Sub Tel 236 129F16/SP6 19p tel Sub Tel 237 stSG42796 19p tel Sub Tel 238 INSR 19p13.2 AMP(1) 239 JUNB 19p13.2 AMP(1) 240 CCNE1 19q12 AMP(1) 241 AKT2 19q13.1-q13.2 LOH 242 GLTSCR2, SULT2A1 19q13.32 243 D19S238E 19 q tel Sub Tel 244 20PTEL18 20p tel Sub Tel
245 SOX22 20p tel Sub Tel 246 JAG1 20p12.1-p11.23 uDel 247 MKKS, SHGC-79896 20p12.1-p11.23 uDel 248 TOP1 20q12-q13.1 AMP(1) 249 NCOA3(AIB1) 20q12 AMP(1) 250 MYBL2 20q13.1 AMP(1) 251 CSE1L(CAS) 20q13 AMP(1) 252 PTPN1 20q13.1-q13.2 AMP(1) 253 STK6(STK15) 20q13.2-q13.3 AMP(1) 254 ZNF217(ZABC1) 20q13.2 AMP(1) 255 CYP24 20q13.2 AMP 256 TNFRSF6B(DCR3) 20q13 AMP 257 TPD52L2, TOM 20q tel Sub Tel 258 20QTEL14 20q tel Sub Tel 259 D21S378 21q11.2 M 260 RUNX1(AML1) 21q22.3 AMP(1) 261 DYRK1A 21q22 gain 262 D21S341, D21S342 21q22.3 gain 263 PCNT2(KEN) 21q tel Sub Tel 264 21QTEL08 21q tel Sub Tel 265 D22S543 22q11 M 266 GSCL 22q11.21 u DEL 267 HIRA(TUPLE1) 22q11.21 u DEL 268 TBX1 22q11.2 u DEL 269 BCR 22q11.23 AMP(1) 270 NF2 22q12.2 TSG 271 PDGFB(SIS) 22q13.1 AMP(1) 272 ARHGAP8 22q13.3 273 ARSA 22q tel Sub Tel 274 22QTEL31 22q tel Sub Tel 275 DXYS129 X/Yp tel Sub Tel 276 STS 3' Xp22.3 u DEL 277 STS 5' Xp22.3 u DEL 278 KAL Xp22.3 u DEL 279 DMD exon 45-51 Xp21.1 280 DXS580 Xp11.2 281 DXS7132 Xq12 282 AR 3' Xq11-q12 AMP(1) 283 XIST Xq13.2 284 OCRL1 Xq25 285 EST CDY16c07 X/Yq tel Sub Tel 286 SRY Yp11.3 287 AZFa region Yq11 Sub Tel Single copy sequence near the telomere AMP(1) Cancer Amplicon previously placed on AmpliOncl Chip AMP Cancer Amplicon not previously placed on AmpliOncl Chip u DEL Region lost in microdeletion syndrome TSG Tumor Supressor Gene pTSG putqtive Tumor Supressor Gene M Marker added to reduce genomic gaps gain Region gained in cancer u Dup Micro Duplication LOH Region of Loss of Heterozygosity Del Deletion Region near Cen Single copy sequence near the centromere
* * * * *
References
C00001
D00001
D00002
D00003
D00004
D00005
D00006
D00007
D00008
D00009
D00010
D00011
D00012

D00013

D00014

D00015

D00016
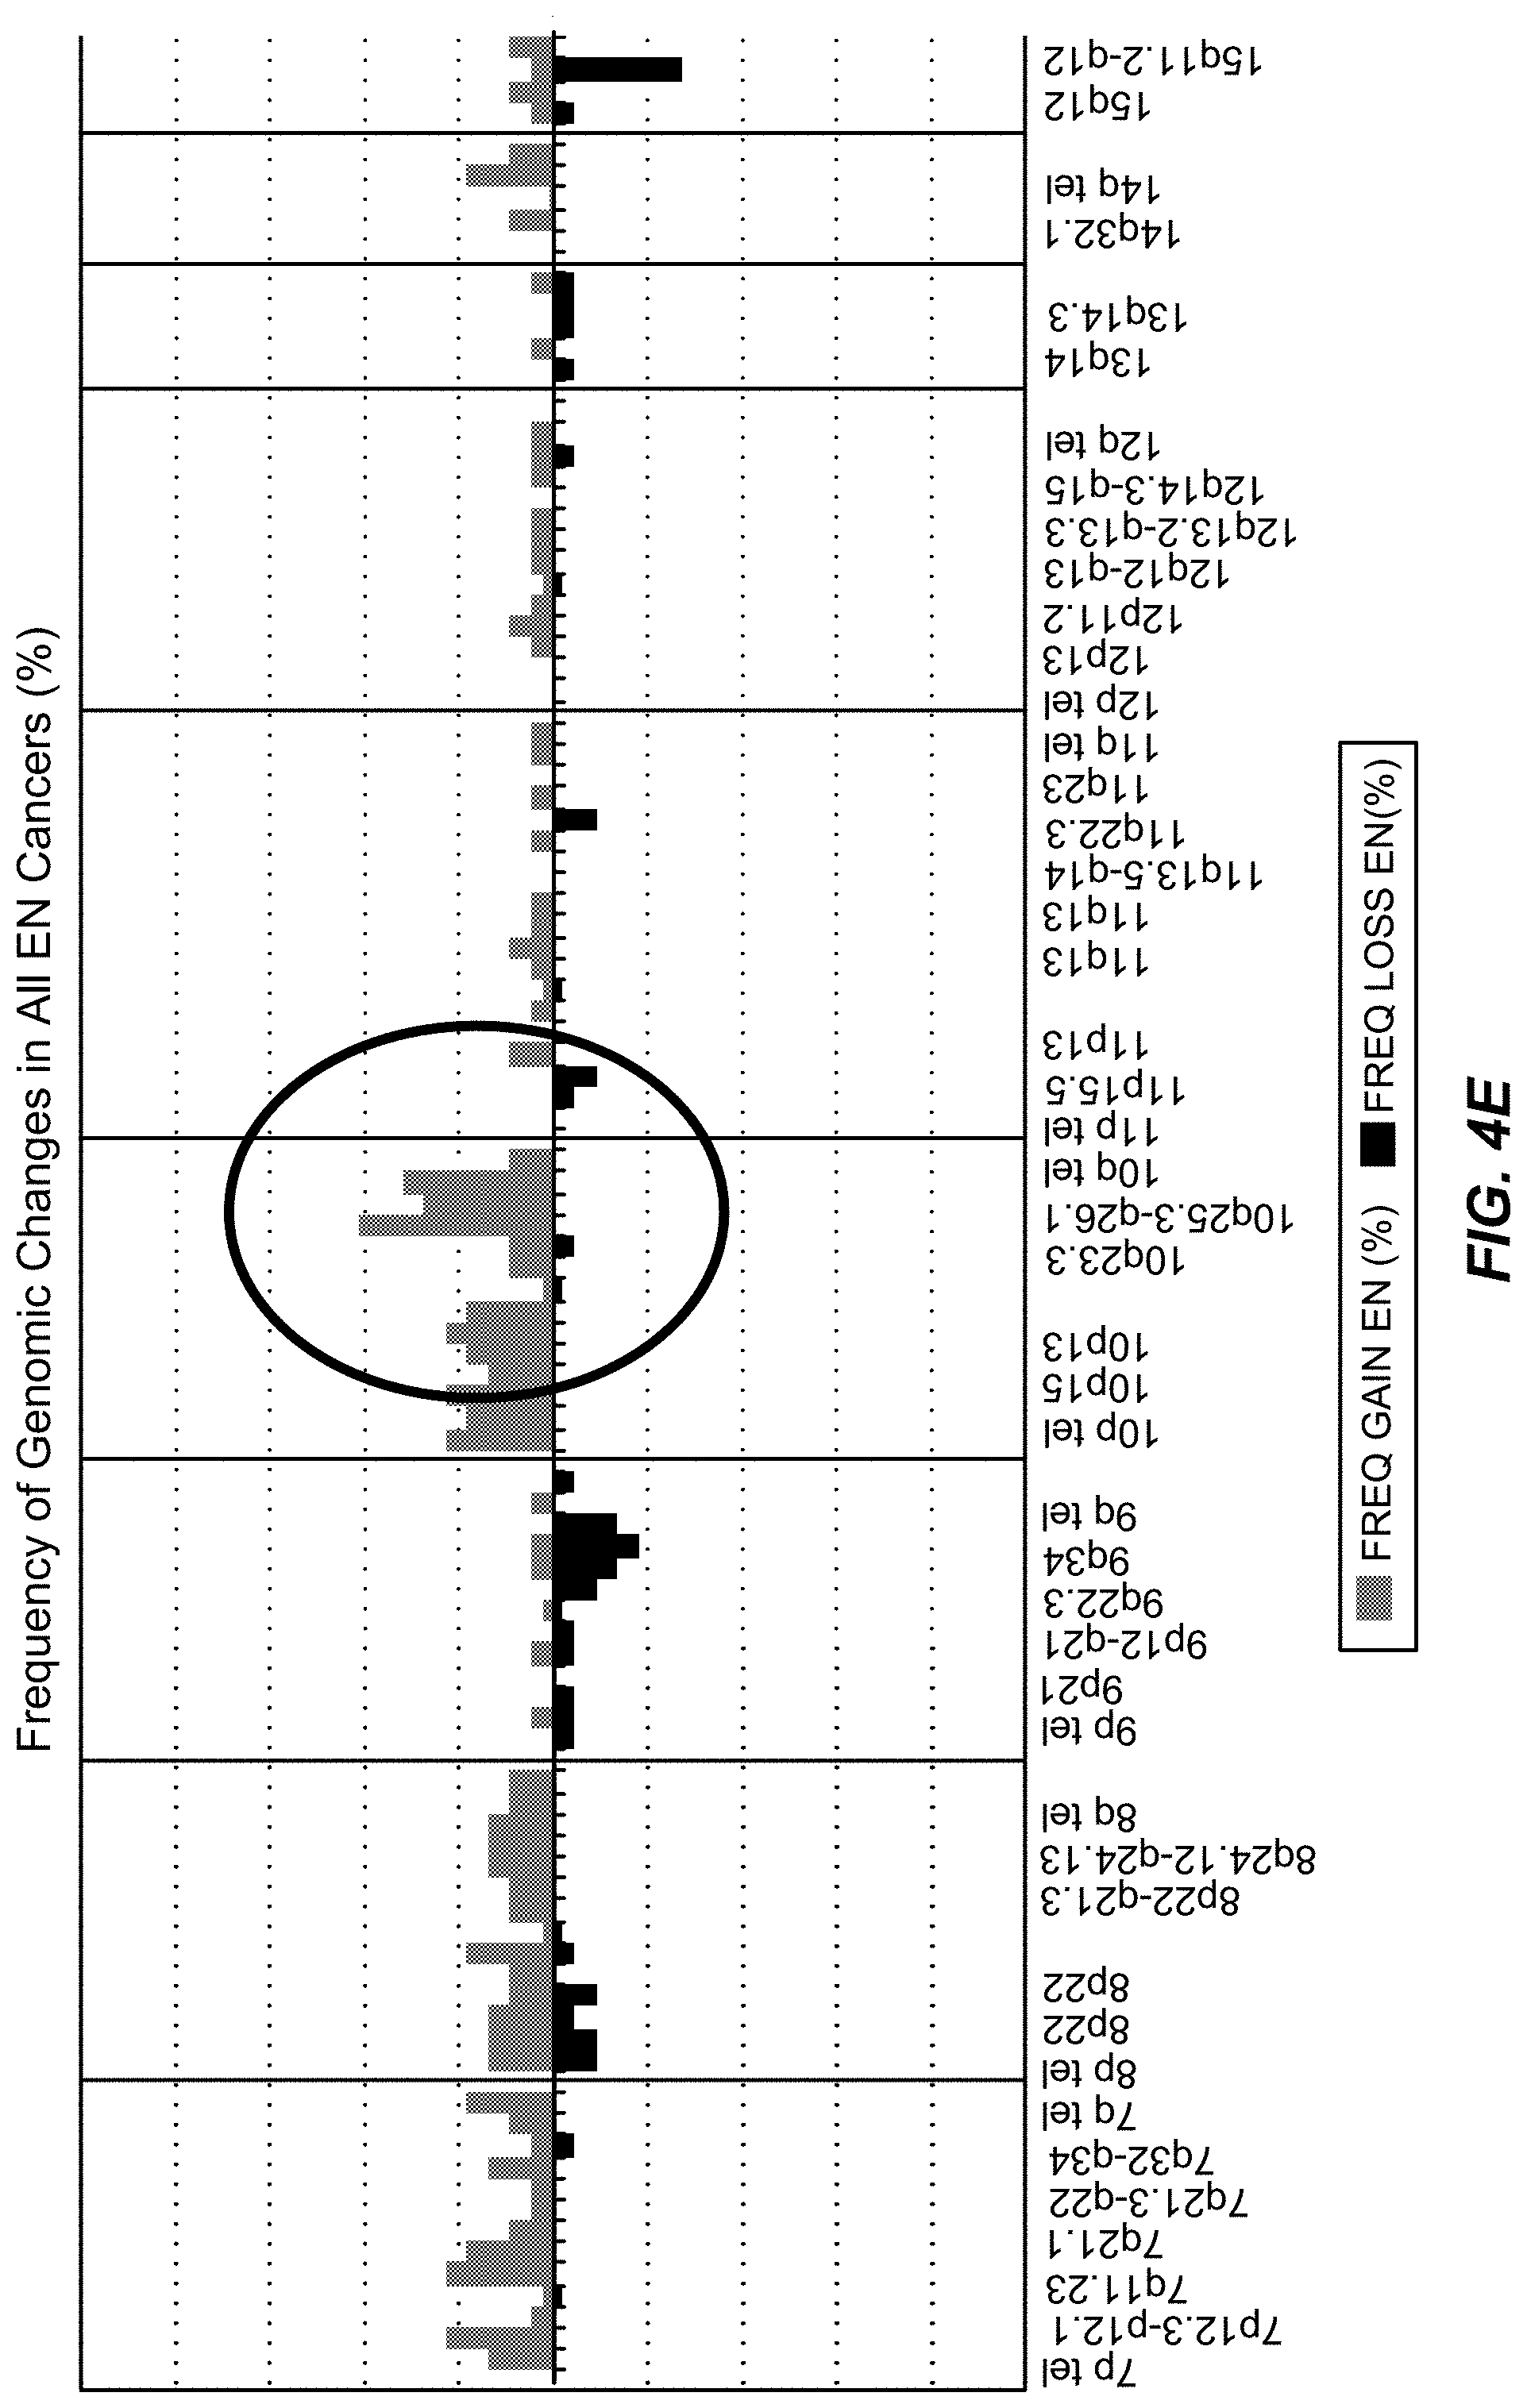
D00017

D00018

D00019

D00020

D00021

D00022

D00023

D00024

D00025

D00026

D00027

XML
uspto.report is an independent third-party trademark research tool that is not affiliated, endorsed, or sponsored by the United States Patent and Trademark Office (USPTO) or any other governmental organization. The information provided by uspto.report is based on publicly available data at the time of writing and is intended for informational purposes only.
While we strive to provide accurate and up-to-date information, we do not guarantee the accuracy, completeness, reliability, or suitability of the information displayed on this site. The use of this site is at your own risk. Any reliance you place on such information is therefore strictly at your own risk.
All official trademark data, including owner information, should be verified by visiting the official USPTO website at www.uspto.gov. This site is not intended to replace professional legal advice and should not be used as a substitute for consulting with a legal professional who is knowledgeable about trademark law.