Compositions and methods for modulating an immune response
Sharpe , et al.
U.S. patent number 10,577,586 [Application Number 15/888,344] was granted by the patent office on 2020-03-03 for compositions and methods for modulating an immune response. This patent grant is currently assigned to President and Fellows of Harvard College. The grantee listed for this patent is President and Fellows of Harvard College. Invention is credited to Loise M. Francisco, Peter T. Sage, Arlene H. Sharpe.


View All Diagrams
| United States Patent | 10,577,586 |
| Sharpe , et al. | March 3, 2020 |
Compositions and methods for modulating an immune response
Abstract
The invention provides methods of modulating follicular regulatory T (TFR) cell-mediated immune responses, follicular helper T (TFH) cell-mediated immune responses or both, and the use of those methods in the treatment of diseases or conditions mediated by TFR or TFH cells. The invention also provides novel methods for identifying TFR and TFH cells in a population of cells. The invention also provides compositions comprising TFR cells that have enhanced suppressive activity as compared wild type TFR cells. The invention also provides compositions comprising T follicular regulatory (TFR) cells isolated from the peripheral blood of a subject wherein the composition is enriched for TFR cells. Methods of making and using the compositions of the invention to modulate an immune response are also provided.
| Inventors: | Sharpe; Arlene H. (Cambridge, MA), Sage; Peter T. (Cambridge, MA), Francisco; Loise M. (Cambridge, MA) | ||||||||||
|---|---|---|---|---|---|---|---|---|---|---|---|
| Applicant: |
|
||||||||||
| Assignee: | President and Fellows of Harvard
College (Cambridge, MA) |
||||||||||
| Family ID: | 50685188 | ||||||||||
| Appl. No.: | 15/888,344 | ||||||||||
| Filed: | February 5, 2018 |
Prior Publication Data
| Document Identifier | Publication Date | |
|---|---|---|
| US 20180230428 A1 | Aug 16, 2018 | |
Related U.S. Patent Documents
| Application Number | Filing Date | Patent Number | Issue Date | ||
|---|---|---|---|---|---|
| 14707596 | May 8, 2015 | 9885016 | |||
| PCT/US2013/069197 | Nov 8, 2013 | ||||
| 61724424 | Nov 9, 2012 | ||||
| Current U.S. Class: | 1/1 |
| Current CPC Class: | A61K 39/0005 (20130101); A61P 37/00 (20180101); C12N 5/0637 (20130101); A61K 9/0019 (20130101); C12N 5/0636 (20130101); C12N 2501/599 (20130101); C12N 2501/515 (20130101) |
| Current International Class: | A61K 9/00 (20060101); C12N 5/0783 (20100101); A61K 39/00 (20060101) |
Attorney, Agent or Firm: Elmore Patent Law Group, P.C. Vanstone; Darlene Elmore; Carolyn
Government Interests
GOVERNMENT SUPPORT
This invention was made with government support under grant numbers T32 AI070085; R01 AI40614, P01 78897 and T32 HL007627 awarded by The National Institutes of Health. The Government has certain rights in the invention.
Parent Case Text
RELATED APPLICATIONS
This application is a continuation of U.S. application Ser. No. 14/707,596, filed May 8, 2015 which is a continuation of PCT/US2013/069197, filed Nov. 8, 2013, which claims the benefit of U.S. Provisional Application No. 61/724,424, filed on Nov. 9, 2012. The entire teachings of the above applications are incorporated herein by reference.
Claims
What is claimed is:
1. A composition comprising a population of T-follicular regulatory (TFR) cells isolated from the peripheral blood of a subject wherein the composition is enriched for TFR cells.
2. The composition of claim 1, comprising about 50% TFR cells or more of the total T-cells present in the composition.
3. The composition of claim 1, comprising about 90% TFR cells or more of the total T-cells present in the composition.
4. The composition of claim 1, wherein the TFR cells have been expanded.
5. The composition of claim 1, wherein the TFR cells have been expanded in the presence of a PD-1 receptor antagonist or PD-1 ligand inhibitor.
6. A method of modulating an immune response in a subject comprising administering to the subject, an effective amount of a composition of claim 1.
7. The method of claim 6, wherein after administration of the composition, the ratio of TFR cells to TFH cells found in the peripheral blood of the subject is higher as compared to the ratio of TFR cells to TFH cells in the patient prior to the administration of the composition.
8. The method of claim 6, wherein an immune response in the subject is suppressed.
9. The method of claim 6, wherein the subject has a disease or disorder selected from graft versus host disease (GVHD), organ rejection, autoimmune disease, and side effects of gene therapy.
10. A method of preparing a composition enriched for TFR cells comprising the steps of: a) obtaining an initial population of cells comprising T cells; b) enriching for TFR cells from the population wherein the TFR cells are sorted based on surface markers of CD4.sup.+CXCR5.sup.+ICOS.sup.+ and at least one surface marker selected from: GITR.sup.+, CD25.sup.hi, CD162, CD27, CD95, CD9, CD43, CD50, CD45RB, CD102, CD61, CD58, CD196, CD38, CD31, CD15, CD25, CD13, CD66a/c/e, CD11b CD63, CD32, CD97, HLA-HQ, CD150, Siglec-9, Integrin.beta.7, CD71, CD180, CD218a, CD193, CD235ab, CD35, CD140a, CD158b, CD33, CD210, HLA-G, CD167a, CD119, CX3CR1, CD146, HLA-DR, CD85, CD172b, SSEA-1, CD49c, CD170, CD66b, and CD86.
11. The method of claim 10, wherein the initial population of cells is isolated from the peripheral blood, tissues or organs of one or more subjects.
12. The method of claim 10, wherein the TFR cells comprise about 50% or more of the total T cells present in the composition.
13. The method of claim 10, wherein the TFR cells comprise about 90% or more of the total T cells present in the composition.
14. The method of claim 10, wherein the TFR cells further comprising the step of expanding the TFR cells of step (b).
15. The method of claim 14, wherein the TFR cells have been expanded in the presence of a PD-1 receptor antagonist or PD-1 ligand inhibitor.
Description
BACKGROUND OF THE INVENTION
Regulation of immune responses is central for the prevention of inflammatory and autoimmune disorders. While downregulation of the immune system can be achieved by way of immunosuppressive therapy, agents that generally suppress the immune system leave subjects susceptible to other disorders, including infections and cancers. A means for controlling the aberrant activation of an immune response to specific antigens would be a major advance in the treatment of autoimmune disorders, graft versus host disease and the side effects of gene therapy, as it would allow downregulation of the immune response against a particular target antigen, but would otherwise leave the immune system functional against invading pathogens and tumor associated antigens. Conversely, methods of specifically improving immunogenicity of specific antigens to which immune responses are desired would be of tremendous benefit in promoting desired immune responses; for example in the context of vaccination and promoting responsiveness to antigens including tumor antigens.
T helper (Th) cells are a class of CD4+ cells that function to regulate the proliferation of B cells and B cell responses. Th cells play an importance role in humoral immunity and immunopathology. Follicular helper T cells (TFH) are a recently defined subset of CD4+ T cells that are essential for helping cognate B cells form and maintain the germinal center (GC) reaction, and for development of humoral immune responses. These cells are universally defined by expression of the chemokine receptor CXCR5, which directs them to the B cell follicles via gradients of the chemokine CXCL13.sup.1. TFH cells also express the transcription factor Bcl6 (which represses Blimp-1/Prdm1) and high levels of the costimulatory receptor ICOS, which are both critical for their differentiation and maintenance.sup.1-4. In addition, TFH cells secrete large amounts of IL-21, which aids in GC formation, isotype switching and plasma cell formation.sup.5. In humans and mice functionally similar TFH cells can be found in secondary lymphoid organs. CXCR5.sup.+ TFH cells are also present in peripheral blood and seen at elevated levels in individuals with autoantibodies, including systemic lupus erythematosis, myasthenia gravis and juvenile dermatomyositis patients. However, the function of these circulating TFH remains unclear.sup.6-9.
Regulatory T cells (Tregs) have pluripotent anti-inflammatory effects on multiple cell types. In particular, they control the activation of innate and adaptive immune cells. Tregs acting in an antigen-specific manner reduce effector T cell activation and function, for example, after effector T cells have successfully mounted an attack against an invading pathogen, or to suppress reactivity to self-antigen and thereby prevent autoimmune disease.
Two subsets of Tregs are classified according to the location at which they develop in vivo. Naturally occurring Tregs (nTreg) develop in the thymus and suppress self-reactive immune responses in the periphery, whereas adaptive Tregs (aTreg) develop in the periphery from conventional CD4.sup.+ T cells to ensure tolerance to harmless antigens, including those derived from, for example, food and intestinal flora. Both subsets of Treg cells are characterized by expression of high levels of CD25 and the transcription factor Foxp3. Tregs are thought to inhibit the antigen-specific expansion and/or activation of self-reactive effector T cells and to secrete suppressive cytokines, including TGF or IL-10. Because of their potential to provide antigen-specific immune regulation without generalized immunosuppression, Tregs have been contemplated for use in cell-based therapy for inflammatory or autoimmune disorders.
T follicular regulatory (TFR) cells are newly defined subset of CD4.sup.+CXCR5.sup.+ cells which are positive for the transcription factors FoxP3, Bcl6 and Prdm1/Blimp1 and function to inhibit the germinal center response.sup.21-23.
PD-1 has been identified as a receptor which binds to PD-L1 and PD-L2. PD-1 is a member of the immunoglobulin gene superfamily. PD-1 (Ishida et al. (1992) EMBO J. 11:3887; Shinohara et al. (1994) Genomics 23:704; U.S. Pat. No. 5,698,520) has an extracellular region containing immunoglobulin superfamily domain, a transmembrane domain, and an intracellular region including an immunoreceptor tyrosine-based inhibitory motif (ITIM). PD-1 transmits a negative signal to immune cells, similar to CTLA4. PD-1 ligand proteins are expressed on the surface of antigen presenting cells, and other cell types; and can provide a costimulatory signal to immune cells or can transmit downmodulatory signals to immune cells, depending upon the protein to which they bind. While transmission of an inhibitory signal leads to downmodulation in immune cell responses (and a resulting downmodulation in the overall immune response), the prevention of an inhibitory signal (e.g., by using a non-activating antibody against PD-1) in immune cells leads to upmodulation of immune cell responses (and a resulting upmodulation of an immune response).
TFH cells express high levels of programmed death (PD) 1 receptor (CD279). Signaling through PD-1 attenuates TCR signals and inhibits T cell expansion, cytokine production and cytolytic function. In addition, PD-1 promotes the development of induced regulatory T (iTreg) cells from naive lymphocytes.sup.10-14. PD-1 has two ligands, PD-L1 (B7-H1) and PD-L2 (B7-DC). PD-L1 is more widely expressed than PD-L2, but PD-L1 and PD-L2 both can be expressed on GC B cells and dendritic cells.sup.15. Perturbation studies suggest critical roles for this pathway in regulating humoral immune responses. However, there are conflicting reports as to the function of the PD-1 pathway in controlling humoral immunity. Some studies have found that humoral responses are attenuated.sup.16-18, while others have seen that humoral responses are heightened.sup.19, 20 when PD-1:PD-L interactions are prevented.
PD-1 also is found on TFR cells. These cells originate from natural regulatory T cell precursors, but express similar levels of ICOS, CXCR5 and PD-1 as TFH cells. Since ICOS, CXCR5 and PD-1 have been widely used to identify and purify `TFH cells`, it seems likely that the inability to define clear functions for PD-1 in GC responses derives from experimental systems containing mixtures of stimulatory TFH cells and inhibitory TFR cells.
The present inventors have discovered that PD-1:PD-L1 interactions limit TFR cell differentiation and function. This discovery has elucidated novel approaches to modulating an immune response for use in therapy.
This discovery has also elucidated novel cell markers for identifying and separating TFR and TFH cells from all other cell types. These markers are also useful for selectively modifying TFR-mediated and/or TFH mediated immune responses in vivo and in vitro.
SUMMARY OF THE INVENTION
The invention is based, in part on the discovery that PD-1 regulates immune responses by inhibiting differentiation and function of TFR cells in both lymph nodes and blood. This discovery has led to strategies for modulating an immune response in vivo and in vitro by altering the interaction of PD-1 receptors on TFR cells with PD-1 ligands.
The invention is also based in part on the discovery of cell markers on TFH and THR cells that enable such cells to be more easily identified, distinguished and tracked in vivo and/or separated into highly purified homogenous cell populations of TFH cells or TFR cells. Such markers make it possible to add specificity and reliability in detecting TFR or TFH cells either in situ, in circulation, or as disseminated cells which is particularly useful for example in monitoring disease burden and in tracking the responses of TFH cells and TFR cells to particular stimuli such as agents intended to modulate TFH and TFR cell-mediated immune responses. These markers are also useful for selectively modifying TFR cell-mediated, and/or TFH cell-mediated immune responses in vivo and in vitro.
In one embodiment the invention provides TFR cells having enhanced suppressive activity as compared to wild type TFR cells. In one embodiment, the invention provides compositions comprising TFR cells having enhanced suppressive activity. TFR cells having enhanced suppressive activity as compared to wild type TFR cells are characterized by their greater capacity for antibody inhibition as compared to WT TFR, as measured by an in vivo or in vitro assays for antibody suppression. In one embodiment, the enhanced TFR cells have an increase in capacity of at least 2 fold to inhibit antibody production as compared to WT TFR cells.
In one embodiment the invention provides methods for generating TFR cells having enhanced suppressive activity. In accordance with the invention, TFR cells having enhanced suppressive activity may be prepared, ex vivo, from a starting population of cells which comprise TFR cells and/or TFR precursor cells such as FoxP3+T regulatory (Treg) cells, isolated from the blood, tissues or organs of one or more subjects. The starting population of cells may optionally be sorted based on surface markers for Tcells and Tcell subsets. The starting population of cells is expanded and/or activated in the presence of a PD-1 receptor antagonist or PD-1 ligand inhibitor. The expanded/activated cells may optionally be sorted based on surface markers for T cells and T cell subsets to obtain a composition of cells enriched for a particular T cell subset (e.g. TFR cells or TFH cells).
The present inventors have also discovered that TFR cells derived from the peripheral blood of a subject are potent inhibitors of TFH mediated antibody production but do no inhibit other arms of the immune system. Therefore, the invention provides compositions comprising TFR cells isolated from the peripheral blood of a subject. The compositions may be enriched for the peripheral blood TFR cells by purifying TFR cells from other PMBCs and optionally sorting for TFR cells based on surface markers. Compositions of TFR cells derived from peripheral blood may also be expanded and/or activated to produce a clonal population of TFR cells based on the original population of TFR cells derived from the peripheral blood of the patient.
Compositions comprising TFH cells which are also present in the peripheral blood of a subject may be provided in the same manner. The inventors have discovered that such compositions, particularly when enriched for TFH cells, are capable of rapidly upregulating an antibody response in vitro and in vivo.
The inventors have also discovered that increasing the ratio of TFR cells to TFH cells in a subject prior to, or during an immune response by the subject, inhibits antibody production. Therefore, the invention provides a method for suppressing an immune response in a subject wherein suppression of an immune response is desired, comprising increasing the ratio of TFR cells to TFH cells by administering a composition enriched with TFR cells derived from the peripheral blood of a subject (or an expanded/activated population thereof) or administering a composition comprising TFR cells having enhanced suppressive activity.
The invention also provides methods of promoting rapid antibody production in a subject comprising increasing the number of TFH cells in a patient by administering a composition enriched with TFH cells derived from the peripheral blood of a subject (or an expanded/activated population thereof).
The compositions of TFR cells and TFH cells of the invention are also useful as adjuvants as a part of a vaccination regimen. When used in this manner, the compositions enhance the efficacy of such vaccines.
The invention further provides compositions and methods for suppressing pathogenic antibody responses in a patient comprising selectively modulating differentially expressed receptors on TFR cells, TFH cells, or both TFR cells and TFH cells with agents capable of modulating such receptors in amounts effective to suppress a pathogenic antibody response.
The invention further provides compositions and methods for enhancing a protective antibody response in a patient comprising selectively modulating differentially expressed receptors on TFR cells, TFH cells, or both TFR cells and TFH cells with agents capable of modulating such receptors in amounts effective to enhance a protective antibody response in a patient.
BRIEF DESCRIPTION OF THE DRAWINGS
The foregoing and other objects, features and advantages of the invention will be apparent from the following more particular description of preferred embodiments of the invention, as illustrated in the accompanying drawings in which like reference characters refer to the same parts throughout the different views. The drawings are not necessarily to scale, emphasis instead being placed upon illustrating the principles of the invention.
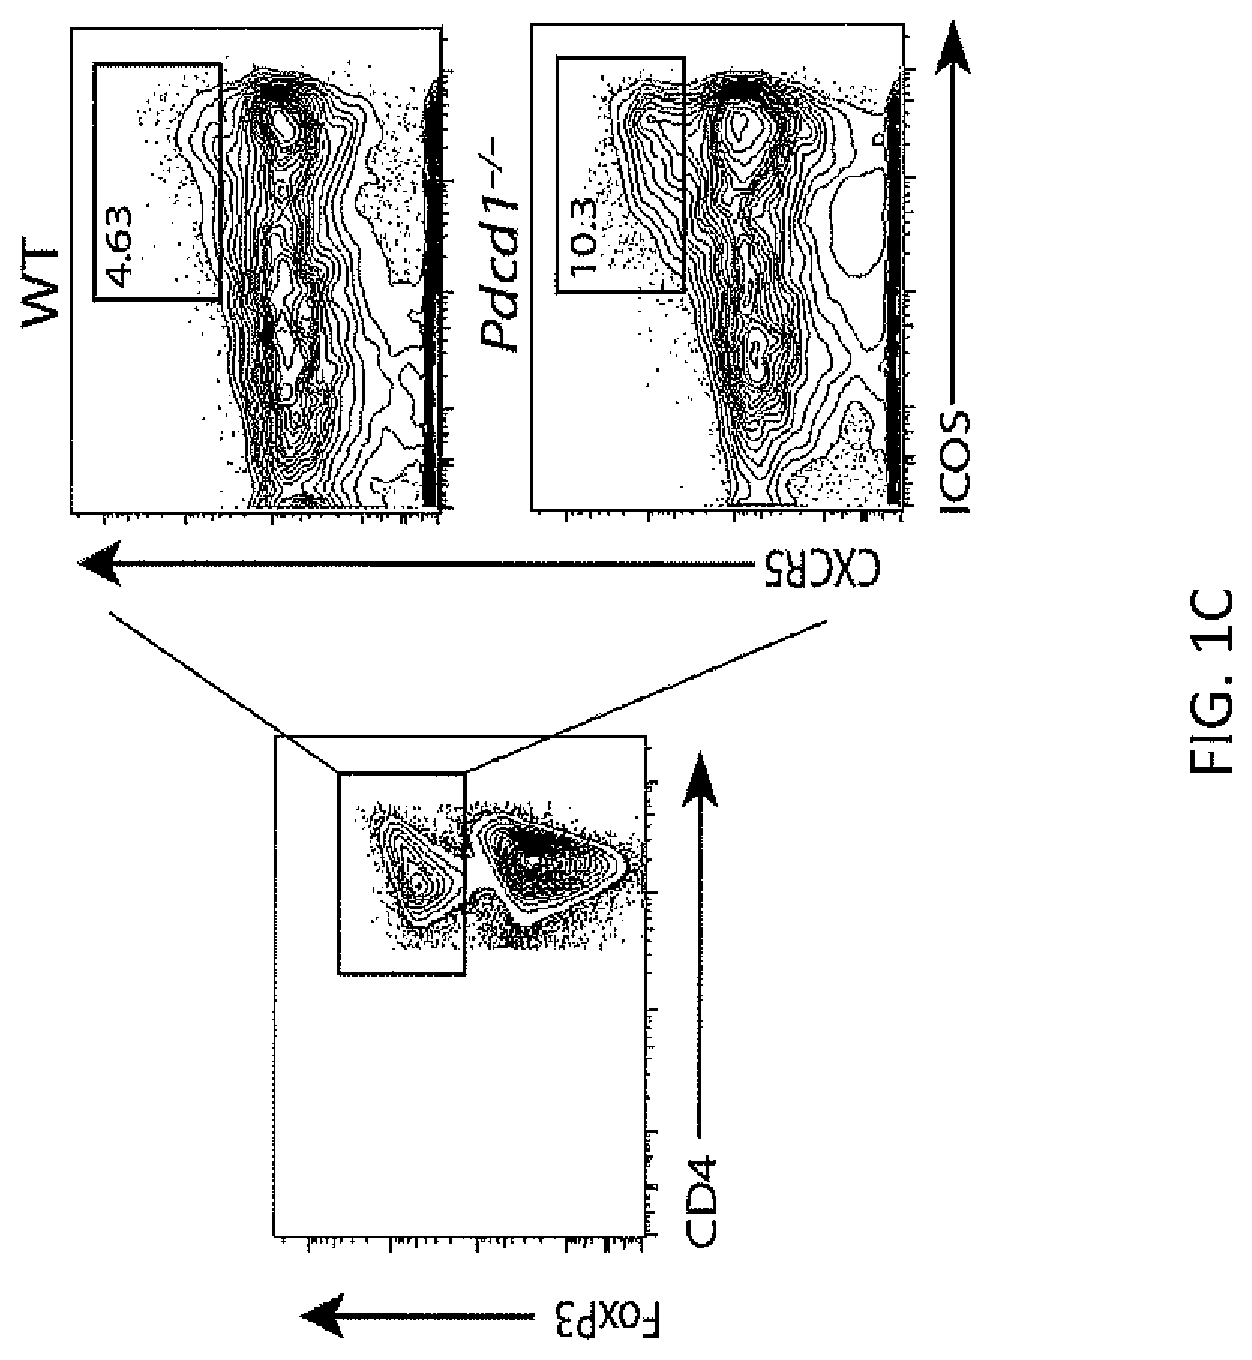
FIG. 1A. PD-1 signaling in FoxP3 Tregs limits the generation of T follicular regulatory cells. Quantitation of TFR cells. WT mice were immunized with MOG/CFA and 7 days later draining lymph nodes were isolated and immediately stained for CD4.sup.+FoxP3.sup.+ICOS.sup.+CXCR5.sup.+CD19.sup.- T follicular regulatory cells (TFR), CD4.sup.+FoxP3.sup.-ICOS.sup.+CXCR5.sup.+CD19.sup.- T follicular helper cells (TFH), CD4.sup.+ICOS.sup.-CXCR5.sup.-CD19.sup.- cells (naive) or CD4.sup.+ICOS.sup.+CXCR5.sup.-CD19.sup.- cells (ICOS+). Numbers indicate percentages of cells located within each gate.
FIG. 1B. PD-1 expression by flow cytometry on WT naive, ICOS+, TFR and TFH cells. Populations were gated as in FIG. 1A. Data represent means of 5 mice per group. All error bars indicate standard error
FIG. 1C Gating of TFR cells from total FoxP3.sup.+ cells in WT and PD-1.sup.-/- mice immunized with MOG/CFA and analyzed 7 days later and stained as in FIG. 1A.
FIG. 1D. Quantitation of WT or PD-1.sup.-/- TFR cells gated in FIG. 1C and expressed as a percentage of CD4.sup.+FoxP3.sup.+ (left), percentage of total CD4 T cells (middle), or percentage of CD4.sup.+ICOS.sup.+CXCR5.sup.+CD19.sup.- gate (right). Data represent means of 5 mice per group. All error bars indicate standard error
FIG. 1E. Quantitation of TFH cells as a percentage of total CD4 T cells. Data represent means of 5 mice per group. All error bars indicate standard error.
FIG. 1F. PD-1 on FoxP3.sup.+ cells has a cell-intrinsic role in inhibiting TFR differentiation in vivo. Schematic design of a transfer assay in which 2D2 TCR transgenic CD4.sup.+FoxP3.sup.+CXCR5.sup.- non-TFR Tregs were transferred into WT mice which were subsequently immunized with MOG/CFA. Draining lymph nodes were harvested 7 days later and analyzed for TFR cells.
FIG. 1G. representative gating of TFR cells from transfer experiments described in FIG. 1F.
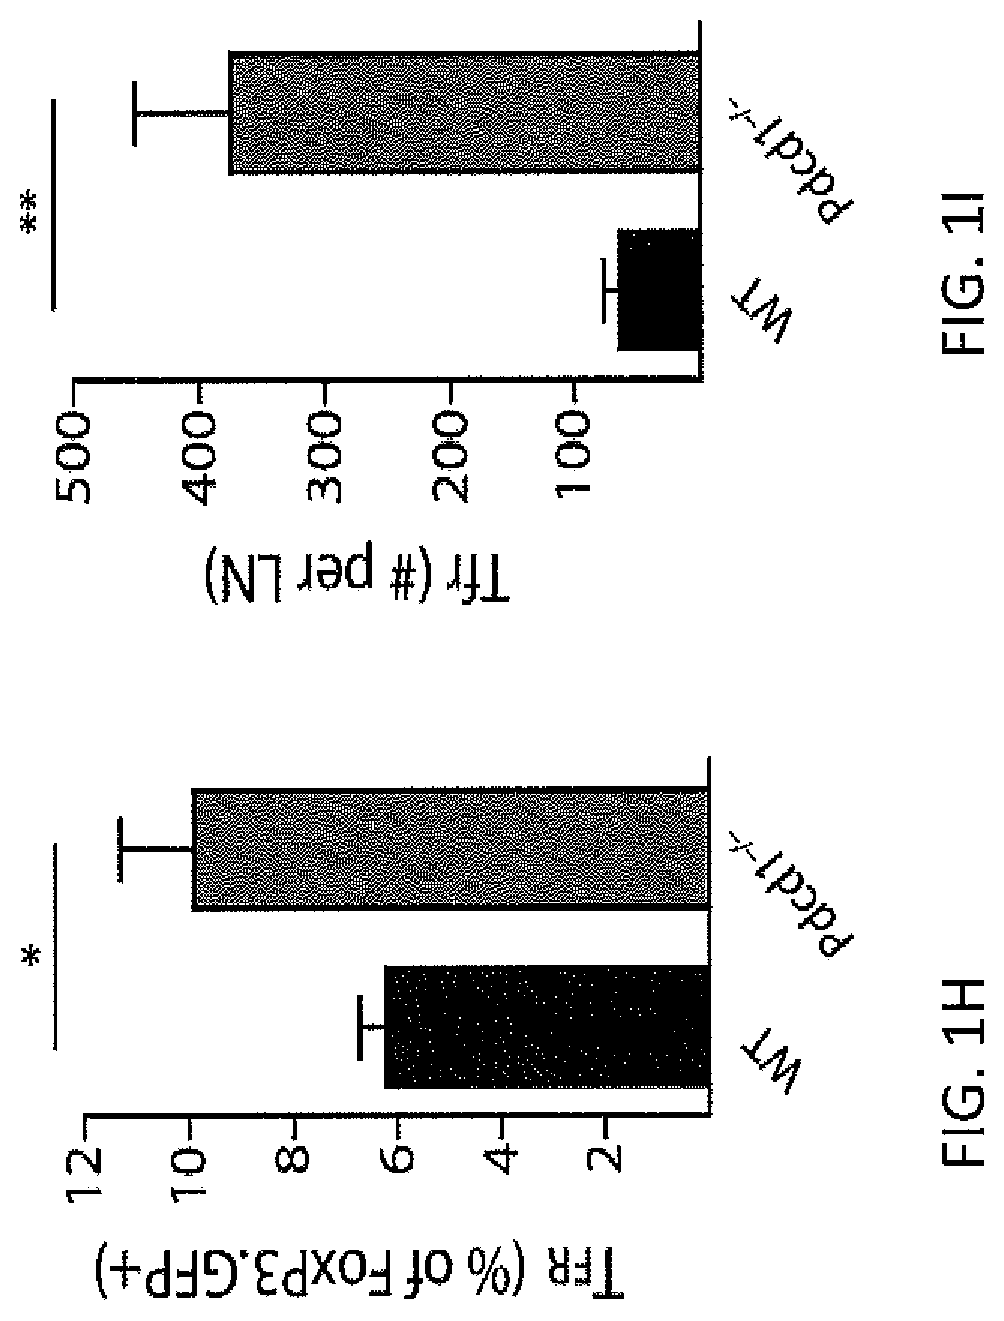
FIG. 1H. Quantitation of TFR cells from transfer experiments expressed as a percentage of FoxP3 GFP.sup.+ cells present on day 7 post immunization per lymph node. All data are representative of at least two independent experiments with at least 5 mice per group. All error bars indicate standard error. * P<0.05, ** P<0.005.
FIG. 1I. Quantitation of TFR cells from transfer experiments expressed as total cell number per lymph node. All data are representative of at least two independent experiments with at least 5 mice per group. All error bars indicate standard error. * P<0.05, ** P<0.005
FIG. 2A. PD-1 deficient TFR cells have altered expression of activation markers. TFR cell gating strategy. WT or PD-1.sup.-/- mice were immunized with MOG/CFA and draining lymph nodes were harvested 7 days later.
FIG. 2B. CD25 expression on WT and PD-1.sup.-/- CD4 subsets gated as in FIG. 2A. Overlay histograms of WT and PD-1.sup.-/- TFR cells (left) and mean fluorescence intensity (MFI) in CD4 subsets gated as in FIG. 1A (right). Data represent means of 5 mice per group.
FIG. 2C. CD69 expression on WT and PD-1.sup.-/- CD4 subsets gated as in FIG. 2A. Overlay histograms of WT and PD-1.sup.-/- TFR cells (left) and MFI (right). Data represent means of 5 mice per group.
FIG. 2D. Intracellular staining of cell cycle marker Ki67 in populations as in (a). Overlay histograms of WT and PD-1.sup.-/- TFR cells (left) and percent Ki67 high (right) in CD4 subsets gated as in FIG. 2A. Ki67 high was defined as the highest intensity peak on WT TFR cells and is denoted by a black bar on the histogram. Data represent means of 5 mice per group. All data are representative of at least two independent experiments. All error bars indicate standard error. * P<0.05, ** P<0.005, *** P<0.0005.
FIG. 3A. PD-1 deficient TFR cells are capable of homing to germinal centers (GCs). Micrographs of draining lymph node sections from WT mice immunized with MOG/CFA and harvested 7 days later. Sections were cut and stained for GL-7 (green), PNA (red) and IgD (blue). GCs were identified by PNA and GL7 positive, but IgD negative, staining. GCs are indicated with a white dotted line.
FIG. 3B. Ki67 staining in GCs. Sections were stained for the cell cycle marker Ki67 (blue), FoxP3 (red) and GL7 (green).
FIG. 3C. Colocalization of CD4 and FoxP3. Sections were stained for CD4 (blue), FoxP3 (red) and GL7 (green). Box indicates magnification highlighting CD4 positive staining on FoxP3.sup.+ cells.
FIG. 3D. Colocalization of FoxP3 in the nucleus. Sections were stained with the nuclear stain DAPI (blue), FoxP3 (red) and GL7 (green). Box indicates magnification highlighting FoxP3 protein within DAPI positive nuclei.
FIG. 3E. Comparison of FoxP3.sup.+ TFR cells in germinal centers of WT and PD-1.sup.-/- mice. Representative GC staining in WT and PD-1.sup.-/- lymph nodes 7 days after immunization with MOG/CFA.
FIG. 3F. Average GC area was determined by calculating the area within the dotted lines according to materials and methods. Data represent mean area per lymph node of 5 individual mice.
FIG. 3G. Numbers of FoxP3.sup.+ cells contained within GCs. Data represent mean per GC from 5 pooled mice.
FIG. 3H. Quantitation of the distance of each FoxP3.sup.+ cell to the GC border. The distance for each FoxP3.sup.+ cell in FIG. 3E from the GC borders (dotted line in FIG. 3E) was calculated as described in materials and methods.
FIG. 3I CXCR5 expression was quantified on WT and PD-1.sup.-/- CD4.sup.+ICOS.sup.+CXCR5.sup.+FoxP3.sup.-CD19.sup.- TFH and CD4.sup.+ICOS.sup.+CXCR5.sup.+FoxP3.sup.+CD19.sup.- TFR cells by flow cytometry 7 days after MOG/CFA immunization. Data represent means of 5 mice per group. * P<0.05, ** P<0.005, *** P<0.0005.
FIG. 4A. PD-1 deficient TFR cells have enhanced regulatory capacity. TFR cells express high levels of GITR. WT mice were immunized with MOG/CFA and 7 days later lymph node cells were isolated and expression of GITR on TFR (CD4.sup.+FoxP3.sup.+ICOS.sup.+CXCR5.sup.+CD19.sup.-, blue) and TFH (CD4.sup.+FoxP3.sup.-ICOS.sup.+CXCR5.sup.+CD19.sup.-, red) was quantified as shown by histogram overlays.
FIG. 4B. Expression of FoxP3 mRNA in sorted TFR (CD4.sup.+GITR.sup.+ICOS.sup.+CXCR5.sup.+CD19.sup.-), TFH (CD4.sup.+GITR.sup.-ICOS.sup.+CXCR5.sup.+CD19.sup.-) and naive (CD4.sup.+ICOS.sup.-CXCR5.sup.-CD19.sup.-) cells. Data represent fold change in mRNA normalized to Hprt.
FIG. 4C. Bcl6 expression analyzed by intracellular flow cytometry on TFH and TFR cells from WT (blue) and PD-1.sup.-/- (green) mice. Data represent means from at least three separate experiments in which cells were sorted from lymph nodes of 10 pooled mice.
FIG. 4D. mRNA expression of blimp-1/Prdm1 from sorted WT (blue) and PD-1.sup.-/- (green) TFR and TFH cells and in CD4-ICOS.sup.-CXCR5.sup.- (naive) cells quantified by qPCR analysis. Data represent means from at least three separate experiments in which cells were sorted from lymph nodes of 10 pooled mice.
FIG. 4E. mRNA expression of Rorc from sorted WT (blue) and PD-1.sup.-/- (green) TFR and TFH cells and in CD4-ICOS.sup.-CXCR5.sup.- (naive) cells quantified by qPCR analysis. Data represent means from at least three separate experiments in which cells were sorted from lymph nodes of 10 pooled mice.
FIG. 4F. mRNA expression of Irf4 from sorted WT (blue) and PD-1.sup.-/- (green) TFR and TFH cells and in CD4-ICOS.sup.-CXCR5.sup.- (naive) cells quantified by qPCR analysis. Data represent means from at least three separate experiments in which cells were sorted from lymph nodes of 10 pooled mice.
FIG. 4G. Design of assay to analyze capacity of TFR cells to inhibit activation of naive CD4 T cells. WT and PD-1.sup.-/- mice were immunized with MOG/CFA and TFR cells were sorted from draining lymph nodes and plated 1:1:1 with CF SE-labeled CD4 naive WT (CD4.sup.+CD62L.sup.+FoxP3.sup.-) responder cells and WT GL7.sup.-B220.sup.+ B cells from MOG/CFA immunized mice along with anti-CD3 and anti-IgM for 4 days. 3 days later samples were analyzed by flow cytometry.
FIG. 4H. TFR cells suppress activation of naive T cells to a greater extent than WT TFR cells. T responders from suppression assays from FIG. 4G were analyzed for CD69 expression by measuring CFSE dilution. % divided indicates percent of cells that have gone through at least one division.
FIG. 4I. PD-1.sup.-/- TFR cells suppress activation of naive T cells to a greater extent than WT TFR cells. T responders from suppression assays from FIG. 4G were analyzed for CD69 proliferation by measuring CFSE dilution. % divided indicates percent of cells that have gone through at least one division.
FIG. 4J. In vitro IgG suppression assay design. TFR cells sorted as in FIG. 4G were plated in a 1:1:1 ratio of TFR (CD4.sup.+ICOS.sup.+CXCR5.sup.+GITR.sup.+CD19.sup.-), TFH (CD4.sup.+ICOS.sup.+CXCR5.sup.+GITR.sup.-CD19.sup.-), and B (GL-7.sup.-B220.sup.+) cells from draining lymph nodes of MOG/CFA immunized mice in the presence of anti-CD3 and anti-IgM for 6 days. Total IgG was measured by ELISA from supernatants.
FIG. 4K. Suppression assay using two concentrations of anti-CD3.
FIG. 4L. PD-1 deficient TFR cells suppress IgG production to a greater extent than WT TFR cells at a 1:1 TFR:TFH ratio. Naive (CD4.sup.+ICOS.sup.-CXCR5.sup.-CD19.sup.-) cells from immunized mice were included as controls. Data indicates means+/-standard error of replicate wells and is representative of at least two experiments. * P<0.05, ** P<0.005, *** P<0.0005.
FIG. 4M. PD-1 deficient TFR cells suppress IgG production to a greater extent than WT TFR cells at a 1:5 TFR:TFH ratio. Data indicates means+/-standard error of replicate wells and is representative of at least two experiments. * P<0.05, ** P<0.005, *** P<0.0005.
FIG. 5A. PD-1 controls circulating blood TFR cells. Gating strategy to identify circulating TFH and TFR cells from blood. WT mice were immunized with MOG/CFA and blood was collected 7 days later by cardiac puncture. TFH and TFR populations were gated as shown.
FIG. 5B. Quantitation of blood TFH and TFR cells following MOG/CFA immunization. Mice were immunized as in FIG. 5A and sacrificed on the indicated days. Blood was collected and cells stained and gated as in FIG. 5A.
FIG. 5C. Ki67 expression in blood and lymph node TFH, TFR and naive (CD4.sup.+ICOS.sup.-CXCR5.sup.-) cells 7 days after MOG/CFA immunization. All data indicates means+/-standard error of 5 mice and is representative of at least two independent experiments. * P<0.05, ** P<0.005, *** P<0.0005.
FIG. 5D. Comparison of blood TFH and TFR cells in WT and PD-1.sup.-/- mice immunized as in FIG. 5A and harvested 7 days after immunization. Blood TFH cells are shown gated on FoxP3.sup.-CD4.sup.+CD19.sup.- (left) and TFR cells are shown gated on FoxP3.sup.+CD4.sup.+CD19.sup.- (right).
FIG. 5E. Comparison of blood TFH and TFR cells in WT and PD-1.sup.-/- mice immunized as in FIG. 5A and harvested 7 days after immunization. Quantitation of blood TFH and TFR cells from immunized WT and PD-1.sup.-/- mice gated as in FIG. 5D and expressed as a percent of CD4.sup.+CD19.sup.- cells. All data indicates means+/-standard error of 5 mice and is representative of at least two independent experiments. * P<0.05, ** P<0.005, *** P<0.0005.
FIG. 5F. Comparison of blood TFH and TFR cells in WT and PD-1.sup.-/- mice immunized as in FIG. 5A and harvested 7 days after immunization. Quantitation of CXCR5.sup.- FoxP3.sup.+ cells from immunized WT and PD-1.sup.-/- mice, expressed as a percentage of CXCR5.sup.- CD4.sup.+ cells. All data indicates means+/-standard error of 5 mice and is representative of at least two independent experiments. * P<0.05, ** P<0.005, *** P<0.0005.
FIG. 6A. PD-L1 but not PD-L2 controls blood TFR cells. PD-L1 and PD-L2 expression on B cell subsets. WT mice were immunized with NP-OVA subcutaneously and 12 days later germinal center B (GC B), GL7.sup.-, and plasma cells (PC) from draining lymph nodes were analyzed for PD-L1 (top) and PD-L2 (bottom) expression.
FIG. 6B. PD-L1 and PD-L2 expression on dendritic cells (DC). WT mice were immunized with NP-OVA and 3 days later CD8.alpha..sup.+ DC and CD8.alpha..sup.- DC subsets from draining lymph nodes were analyzed for PD-L1 (top) and PD-L2 (bottom) expression.
FIG. 6C. Lymph node and blood TFH and TFR cells in PD-1 ligand deficient mice. WT, PD-L1.sup.-/- and PD-L2.sup.-/- mice were immunized with MOG/CFA, and 7 days later draining lymph nodes and blood were harvested and analyzed for TFH CD4 T cells. Data represent means of 5 mice per group. All data are representative of at least two independent experiments. * P<0.05, ** P<0.005, *** P<0.0005.
FIG. 6D. Lymph node and blood TFH and TFR cells in PD-1 ligand deficient mice. WT, PD-L1.sup.-/- and PD-L2.sup.-/- mice were immunized with MOG/CFA, and 7 days later draining lymph nodes and blood were harvested and analyzed for TFR CD4 T cells. Data represent means of 5 mice per group. All data are representative of at least two independent experiments. * P<0.05, ** P<0.005, *** P<0.0005.
FIG. 6E. Lymph node and blood TFH and TFR cells in PD-1 ligand deficient mice. WT, PD-L1.sup.-/- and PD-L2.sup.-/- mice were immunized with MOG/CFA, and 7 days later draining lymph nodes and blood were harvested and analyzed for CXCR5.sup.- FoxP3.sup.+ CD4 T cells. Data represent means of 5 mice per group. All data are representative of at least two independent experiments. * P<0.05, ** P<0.005, *** P<0.0005.
FIG. 7A. Blood TFR cells require ICOS and CD28 costimulation. TFH and TFR gating in WT and ICOS.sup.-/- mice. Mice were immunized with MOG/CFA and 7 days later draining lymph nodes (dLN) and blood were harvested. TFH cells were gated as CD4.sup.+CD44.sup.+CXCR5.sup.+FoxP3.sup.-CD19.sup.-, and TFR cells as CD4.sup.+CD44.sup.+CXCR5.sup.+FoxP3.sup.+CD19.sup.- cells.
FIG. 7B TFH quantitation in lymph nodes (dLN) and blood of WT and ICOS.sup.-/- mice as in FIG. 7A.
FIG. 7C TFR quantitation in lymph nodes (dLN) and blood of WT and ICOS.sup.-/- mice as in FIG. 7A.
FIG. 7D. TFH and TFR gating strategy in WT and CD28.sup.-/- mice. Mice were immunized as in FIG. 7A and TFH cells were gated as CD4.sup.+ICOS.sup.+CXCR5.sup.+FoxP3.sup.- CD19.sup.- and TFR cells as CD4.sup.+ICOS.sup.+CXCR5.sup.+FoxP3.sup.+CD19.sup.-.
FIG. 7E. TFH quantitation in lymph nodes and blood of WT and CD28.sup.-/- mice gated as in FIG. 7D. All data are representative of at least two independent experiments. * P<0.05, ** P<0.005, *** P<0.0005.
FIG. 7F. TFR quantitation in lymph nodes and blood of WT and CD28.sup.-/- mice gated as in FIG. 7D. All data are representative of at least two independent experiments. * P<0.05, ** P<0.005, *** P<0.0005.
FIG. 8A. PD-1 deficient blood TFR cells more potently regulate antibody production in vivo. Experimental strategy to assess blood TFH and TFR cell function by transfer of blood TFH and/or TFR cells into mice that lack both lymph node and blood TFH/TFR cells. Blood TFH and/or TFR cells were isolated from 20 pooled mice immunized with NP-OVA 8 days previously and CD4.sup.+CXCR5.sup.+GITR.sup.-CD19.sup.- TFH and CD4.sup.+CXCR5.sup.+GITR.sup.+CD19.sup.- TFR cells were purified by cell sorting; recipient CD28.sup.-/- or TCR.alpha..sup.-/- mice received either no cells, 4.times.10.sup.4 TFH cells, or 4.times.10.sup.4 TFH plus 2.times.10.sup.4 TFR cells. One day later recipients were immunized with NP-OVA. 12 days later sera were collected and NP-specific antibody titers quantified by ELISA.
FIG. 8B. WT blood TFR cells potently suppress antibody production. NP-specific antibody titers from experiments as in FIG. 8A in which WT TFH or WT TFH plus WT TFR cells were transferred into CD28.sup.-/- recipients.
FIG. 8C. CD138.sup.+ plasma cell percentages in draining lymph nodes of CD28.sup.-/- recipients following no transfer (Control), Blood TFH transfer (Blood TFH) or Blood TFH plus TFR cell transfer (Blood TFH TFR) 24 days after immunization. Cells are gated as a percentage of CD11b.sup.-CD11c.sup.-Ly6c.sup.- (dump) cells.
FIG. 8D. Quantitation of CD138 plasma cells as gated in FIG. 8C in draining lymph node, spleen and bone marrow.
FIG. 8E. Blood TFH and/or TFR Transfer into TCR.alpha..sup.-/- recipients using experimental design as in FIG. 8A. Comparison of NP-specific antibody titers in (1) WT control mice, (2) TCR.alpha..sup.-/- recipients given no cells, (3) TCR.alpha..sup.-/- recipients given WT blood TFR cells alone, (4) TCR.alpha..sup.-/- recipients given total blood CD4 T cells from CXCR5.sup.-/- mice immunized with NP-OVA 8 days previously, (5) TCR.alpha..sup.-/- recipients given blood CD4.sup.+FoxP3.sup.- cells from unimmunized FoxP3-GFP mice, (6) TCR.alpha..sup.-/- recipients given WT blood TFH cells, and (7) TCR.alpha..sup.-/- recipients given WT blood TFH cells plus TFR cells. NP specific IgG levels were determined by ELISA.
FIG. 8F. CD138.sup.+ plasma cells from the spleen (gated as a percent of live cells) were quantified from experiments in FIG. 8E 12 days after secondary immunization. Error bars indicate standard error of at least three separate experiments.
FIG. 8G. CD4.sup.+FoxP3.sup.- TFH cells from the draining lymph node pre-gated on CD4.sup.+FoxP3.sup.- were quantified from experiments in FIG. 8E 12 days after secondary immunization. Error bars indicate standard error of at least three separate experiments.
FIG. 8H. Blood TFH cells can have an enhanced ability to stimulate antigen-specific antibody production compared to lymph node TFH cells. Blood TFH cells and draining lymph node TFH cells were isolated from WT mice immunized with NP-OVA 8 days previously and 4.times.10.sup.6 cells were transferred into TCR.alpha..sup.-/- mice and immunized as in FIG. 8E.
FIG. 8I. Blood TFR cell suppression is aided by the follicular program. Blood TFH cells were transferred to TCR.alpha..sup.-/- mice along with blood CXCR5- FoxP3 GFP.sup.+ cells from FoxP3 reporter mice or blood TFR cells. Antibody titers were quantified 12 days after NP-OVA immunization and NP IgG levels are expressed as a percent of TFH transfer group. Data indicate standard error of at least three independent experiments.
FIG. 8J. PD-1 deficient blood TFR cells more potently suppress antibody production in vivo compared to WT TFR cells. 4.times.10.sup.4 WT blood TFH and 1.5.times.10.sup.4 WT or PD-1 deficient blood TFR cells from mice immunized with NP-OVA 8 days previously were transferred into CD28.sup.-/- mice. Recipient mice were immunized with NP-OVA, and NP specific antibody titers were measured from serum 12 days later. Data are representative of two independent experiments.
FIG. 8K. PD-1 deficient blood TFR cells more potently suppress antibody production in vivo compared to WT TFR cells. 4.times.10.sup.4 WT blood TFH and 1.5.times.10.sup.4 WT or PD-1 deficient blood TFR cells from mice immunized with NP-OVA 8 days previously were transferred into TCR.alpha..sup.-/- mice. Recipient mice were immunized with NP-OVA, and NP specific antibody titers were measured from serum 12 days later. Data are representative of two independent experiments.
FIG. 9. Blood Tfh and Tfr cells are present in human blood. Peripheral blood mononuclear cells were isolated from the blood of a healthy individual by sucrose density centrifugation and stained for indicated proteins and were analyzed by flow cytometry. Numbers indicate percentages contained within gates.
FIG. 10A. PD-1 controls TFR cells in NP-OVA immunized mice. WT or PD-1.sup.-/- mice were immunized with NP-OVA emulsified in CFA and 7 days later draining lymph nodes were stained for CD4.sup.+FoxP3.sup.+ICOS.sup.+CXCR5.sup.+CD19.sup.- T follicular regulatory cells (TFR) and CD4.sup.+FoxP3.sup.-ICOS.sup.+CXCR5.sup.+CD19.sup.- T follicular helper cells (TFH) using gating strategy shown.
FIG. 10B TFH cells were gated and expressed as a percentage of CD4.sup.+FoxP3.sup.- cells.
FIG. 10C. TFR cells were gated and expressed as a percentage of all CD4.sup.+ cells.
FIG. 10D. TFR cells were gated and expressed as a percentage of CD4.sup.+FoxP3.sup.+ cells.
FIG. 10E. TFR cells were gated and expressed as a percentage of CD4.sup.+CXCR5.sup.+ICOS.sup.+ cells.
FIG. 11A. Comparison of PD-L1, CD103 and GITR expression on WT and PD-1.sup.-/- T Follicular Regulatory Cells. WT or PD-1.sup.-/- mice were immunized with MOG (35-55) and 7 days later draining lymph nodes were stained. TFR (CD4.sup.+ICOS.sup.+CXCR5.sup.+FoxP3.sup.+CD19.sup.-) cells were analyzed for surface expression of PD-L1.
FIG. 11B. Comparison of PD-L1, CD103 and GITR expression on WT and PD-1.sup.-/- T Follicular Regulatory Cells. WT or PD-1.sup.-/- mice were immunized with MOG (35-55) and 7 days later draining lymph nodes were stained. TFR (CD4.sup.+ICOS.sup.+CXCR5.sup.+FoxP3.sup.+CD19.sup.-) cells were analyzed for surface expression of CD103.
FIG. 11C. Comparison of PD-L1, CD103 and GITR expression on WT and PD-1.sup.-/- T Follicular Regulatory Cells. WT or PD-1.sup.-/- mice were immunized with MOG (35-55) and 7 days later draining lymph nodes were stained. TFR (CD4.sup.+ICOS.sup.+CXCR5.sup.+FoxP3.sup.+CD19.sup.-) cells were analyzed for surface expression of GITR.
FIG. 12. WT and PD-1 deficient TFR cells express similar levels of GITR. WT and PD-1.sup.-/- mice were immunized with NP-OVA and 7 days later populations were sorted according to gating strategy.
FIG. 13A. TFH and TFR cells can bind similar levels of anti-CD3. Gating of TFH, TFR and B cells from in vitro suppression assays as in FIG. 4K.
FIG. 13B. Cells gated as in FIG. 13A were stained with an anti-hamster secondary antibody to quantify the amount of anti-CD3 bound to the surface of the cells.
FIG. 14A. Blood TFH and TFR cells express central memory homing markers. WT and PD-1.sup.-/- mice were immunized with MOG/CFA and 7 days later populations from blood were analyzed for CD62L expression.
FIG. 14B. Blood TFH and TFR cells express central memory homing markers. WT and PD-1.sup.-/- mice were immunized with MOG/CFA and 7 days later populations from blood were analyzed for CD44 expression.
FIG. 14C. PD-1 expression was compared on WT and PD-1 deficient mice from draining lymph node and blood TFH and TFR cells 7 days after NP-OVA immunization.
FIG. 15A. Circulating TFH and TFR cells require dendritic cells for development. WT or CD11c.sup.DTR bone marrow chimeras were immunized with NP-OVA subcutaneously and diphtheria toxin (DT) was administered (or not) on days 0, 2, 4, and 6 to deplete DCs.
FIG. 15B. Draining lymph node analysis of CD11c.sup.+MHC II.sup.+ DCs Quantification of Ki67+TFH (CD4.sup.+ICOS.sup.+CXCR5.sup.+FoxP3.sup.-Ki67.sup.+CD19.sup.-) and TFR (CD4.sup.+ICOS.sup.+CXCR5.sup.+FoxP3.sup.+Ki67.sup.+CD19.sup.-) cells in the draining lymph node and blood. Data are means+/-standard error with 5 mice per group. Data are representative of at least 2 independent experiments.
FIG. 15C. WT or Ciita.sup.-/- bone marrow derived dendritic cells (BMDCs) were pulsed with NP-OVA in an overnight in vitro culture, washed and adoptively transferred subcutaneously to WT mice. 5 days later draining lymph nodes and blood were analyzed for ICOS and CXCR5 expression on CD4 T cells. WT mice that received no transfer were included as controls. Plots are pregated on CD4.sup.+CD19.sup.-. Representative plots are shown.
FIG. 15D. Quantification of draining lymph node and blood TFH (top) and TFR (bottom) cells in BMDC adoptive transfer experiments as in FIG. 15C. Data are means+/-standard error with 5 mice per group. Data are representative of at least 2 independent experiments.
FIG. 15E. mMT mice have normal circulating TFH and TFR cells. WT or Ighm.sup.-/- "mMT" mice were immunized with NP-OVA subcutaneously and 7 days later ICOS.sup.+CXCR5.sup.+ CD4 T cells were identified. Plots are pregated on CD4.sup.+CD19.sup.-. Representative plots are shown.
FIG. 15F. Quantification of total lymph node or blood CD4.sup.+ICOS.sup.+CXCR5.sup.+ (left; as gated in FIG. 15D), TFH (middle), or TFR (right) cells. Data are means+/-standard error with 5 mice per group. Data are representative of at least 2 independent experiments.
FIG. 15G. Analysis of the blood:lymph node ratio of TFH and TFR cells in WT and .mu.MT mice immunized as in FIG. 15E. Data are means+/-standard error with 5 mice per group. Data are representative of at least 2 independent experiments.
FIG. 16A. Circulating TFH and TFR cells depend on S1P signals to exit the lymph node. Analysis of CD69 expression on TFH and TFR cells. Gating of TFH and TFR cells from the lymph node and blood of WT mice immunized with NP-OVA 7 days previously (left). Plots are pregated on CD4.sup.+CD19.sup.-. Histograms (right) show CD69 expression on TFH and TFR cells from lymph node (blue) and blood (red) or on CD4.sup.+ICOS.sup.-CXCR5.sup.- cells. Data are means+/-standard error with 5 mice per group; data are representative of at least 2 independent experiments.
FIG. 16B. Quantification of CD69 on lymph node and blood TFH and TFR cells as in FIG. 16A. CD4.sup.+ICOS.sup.-CXCR5.sup.-CD19.sup.- cells are included as controls. Data are means+/-standard error with 5 mice per group; data are representative of at least 2 independent experiments.
FIG. 16C. Quantification of numbers of TFH cells in the lymph node (left; blue) and blood per ml (right; red) after FTY720 treatment for 5 days (on days 2, 4, and 6 post immunization followed by analysis on day 7) are shown. Data are means+/-standard error with 5 mice per group; data are representative of at least 2 independent experiments.
FIG. 16D. Quantification of numbers of TFR cells in the lymph node (left; blue) and blood (right; red) after FTY720 treatment for 5 days, as in FIG. 16C. Data are means+/-standard error with 5 mice per group; data are representative of at least 2 independent experiments.
FIG. 16E. Numbers of TFH (left) and TFR (right) cells (per ml blood) after FTY720 treatment during the last 3 or 6 hours of a 7 day immunization. Data are means+/-standard error with 5 mice per group; data are representative of at least 2 independent experiments.
FIG. 16F. Representative plots of total CD4.sup.+ICOS.sup.+CXCR5.sup.+ cells from the draining lymph node (dLN), efferent lymph (lymph) and blood of WT mice immunized 7 days previously. Plots are pregated on CD4+CD19-. Data are representative from at least 3 replicates.
FIG. 16G. Quantification of percentages of TFH and TFR cells in the draining lymph node (blue), efferent lymph (green) and blood (red) of WT mice immunized 7 days previously. Data are representative from at least 3 replicates.
FIG. 16H. Histograms showing ICOS expression on draining lymph node (blue), lymph (green) and blood (red) TFH (left) and TFR (right) cells as in FIG. 16G.
FIG. 17A. Circulating TFH and TFR cells migrate to diverse secondary lymphoid organs and tissues. 20, Actin.sup.CFP-Fox.sup.GFP mice were immunized with NP-OVA subcutaneously and 7 days later 2.times.10.sup.4 sorted blood CD4.sup.+CXCR5.sup.+CD19.sup.- cells were adoptively transferred into CD28 deficient mice which were immunized with NP-OVA. Organs were harvested 7 days later for analyses. Transferred cells from indicated organs were identified as CFP positive according to gates: iLN; draining inguinal lymph node, aLN; axillary lymph node, cLN; cervical lymph node, mLN; mesenteric lymph node, Skin; skin around site of immunization. Plots are pregated on CD4.sup.+CD19.sup.-.
FIG. 17B. Dual color overlay plots showing ICOS and CXCR5 expression on CFP positive transferred cells (red) or endogenous CD28 deficient CD4 T cells (blue) in organs as in FIG. 17A.
FIG. 17C. Quantification of the percentage of TFH cells of the CFP.sup.+CXCR5.sup.+ICOS.sup.+ transferred cells as in FIG. 17B.
FIG. 17D. Quantification of FoxP3+ cell percentages of the CFP.sup.+CXCR5.sup.+ICOS.sup.+ transferred cells.
FIG. 17E. Quantification of the percentage of FoxP3+ cells from the total transferred CFP.sup.+ population gated as in FIG. 17A.
FIG. 17F Interaction of blood TFH cells with IgG1.sup.+ B cells upon homing to lymph nodes. 2.times.10.sup.4 blood TFH (CD4.sup.+ICOS.sup.+CXCR5.sup.+GITR.sup.-CD19.sup.-) cells from NP-OVA immunized CD45.2 mice were adoptively transferred to CD45.1 mice that were then NP-OVA immunized. 7 days later dLN were stained for CD45.2 (Blood TFH), IgG1 or IgD.
FIG. 17G. Interaction of blood TFR cells with IgG1.sup.+ B cells upon homing to lymph nodes. 1.times.10.sup.4 blood TFR (CD4.sup.+ICOS.sup.+CXCR5.sup.+GITR.sup.+CD19.sup.-) cells from NP-OVA immunized CD45.2 mice were adoptively transferred to CD45.1 mice that were then NP-OVA immunized. 7 days later dLNs were stained for CD45.2 (Blood TFR), FoxP3 or IgG1. Data are from transfers of TFH or TFR cells from 20 pooled mice into a single mouse recipient and representative of at least 2 individual experiments.
FIG. 18A. Circulating TFH and TFR cells show enhanced activation upon reentering lymphoid organs of immunized mice in vivo. 20, Actin.sup.CFP-Fox.sup.GFP mice were immunized with NP-OVA subcutaneously and 7 days later 2.times.10.sup.4 sorted lymph node or blood CD4.sup.+CXCR5.sup.+CD19.sup.- cells were adoptively transferred to CD28 deficient mice that were then immunized. 7 days later CFP positive cells in draining lymph nodes were analyzed by flow cytometry. CD28 deficient mice that received no transfer ("No Trans") were used as controls.
FIG. 18B. Bcl6 expression in dLN FoxP3.sup.-CFP.sup.+ (TFH) cells in CD28.sup.-/- recipients of dLN CXCR5 or blood CXCR5 cells as described in FIG. 18A. WT dLN TFH (CD4+ICOS+CXCR5+FoxP3.sup.-CD19.sup.-) cells from WT mice immunized 7 days previously were used as positive controls and CD28.sup.-/- CD4 T cells from immunized LN were used as negative controls for Bcl6 expression, and shown for comparison.
FIG. 18C. ICOS expression on lymph node or blood FoxP3.sup.-CFP.sup.+ (TFH) cells (assayed population) which originated from either dLN or blood CXCR5 transfers (CXCR5 Transfer) as in FIG. 18A. Total CD4 T cells, dLN and blood TFH from WT immunized mice were included for comparison.
FIG. 18D. ICOS expression on lymph node or blood FoxP3.sup.+CFP.sup.+ (TFR) cells (assayed population) which originated from either dLN or blood CXCR5 transfers (CXCR5 Transfer) as in FIG. 18C.
FIG. 18E. CXCR5 expression on lymph node or blood FoxP3.sup.-CFP.sup.+ (TFH) cells as in FIG. 18C.
FIG. 18F. CXCR5 expression on lymph node or blood FoxP3.sup.+CFP.sup.+ (TFR) cells as in FIG. 18D.
FIG. 18G. Intracellular cytokine production of IL-21, IL-17A or IL-2 by transferred FoxP3.sup.-CFP.sup.+ (TFH cells) from dLN or blood CXCR5 transfers as in FIG. 18A. Data are from transfers of TFH or TFR cells from 20 pooled mice into a single mouse recipient and representative of at least 2 individual experiments.
FIG. 19A. Circulating TFH cells Require Dendritic Cells for Restimulation and Have Memory Properties In vitro activation assay in which draining lymph node (dLN) or blood TFH cells (sorted as CD4.sup.+ICOS.sup.+CXCR5.sup.+GITR.sup.-CD19.sup.-) were plated with B cells or DCs (isolated from lymph nodes of WT mice immunized 7 days previously) in the presence of anti-IgM and anti-CD3 for 6 days. Cells were stained for CD4+CD19- and intracellularly for Bcl6 and Ki67. Plots are pregated on CD4.sup.+CD19.sup.-. Data indicate means+/-standard error of at least 3 individual experiments.
FIG. 19B. Quantification of data presented in FIG. 19A. Data indicate means+/-standard error of at least 3 individual experiments.
FIG. 19C. Intracellular cytokine staining of samples as in FIG. 19A except samples were stimulated with PMA/Iono for 4 hours in the presence of golgistop. Data indicate means+/-standard error of at least 3 individual experiments.
FIG. 19D. Blood TFH cells require DCs for expansion in vivo. 1.5.times.10.sup.4 blood CD4+CXCR5+CD19- cells from immunized Actin.sup.CFP-Fox.sup.GFP mice were adoptively transferred to CD11cDTR bone marrow chimeric mice that were immunized with NP-OVA and treated or not with DT on days 0, 3 and 5. 7 days after immunization the draining lymph nodes were harvested for flow cytometric analysis of total CFP.sup.+ cells (left) and expression of CXCR5 on CFP.sup.+FoxP3.sup.- cells (right). data from transfer of TFH or TFR cells from 20 pooled mice into 3 recipients.
FIG. 19E. Circulating Memory blood CXCR5+ cells dominate the germinal center reaction upon homing to dLNs after challenge. Schematic diagram of parabiosis experiments (left). Actin.sup.CFP Fox.sup.GFP mice were immunized subcutaneously with NP-OVA at d0 or d7. At d0, mice were surgically joined to WT mice and circulatory systems were allowed to freely exchange for 19 days. Mice were then separated and 6 days later the WT "recipient" was immunized with NP-OVA. 7 days later organs were harvested for presence of CFP+ cells. Comparison of CFP+ cells in the non-draining lymph node naive gate or CXCR5 gate in specified organs (right). Data from 3 individual mice/parabiotants.
FIG. 19F. Blood TFH and TFR cells persist for 30 days in vivo. 2.times.10.sup.4 blood CFP.sup.+ICOS.sup.+CXCR5.sup.+CD19.sup.- (TFH+TFR) cells were adoptively transferred to WT mice that were immunized with NP-OVA 30 days later (left). Typical flow cytometry plots and quantification of data (right). "End"=endogenous CD4 T cells. Adoptive transfer recipients are compared to mice that did not receive CFP+ cells, "No Trans". Data from 25 pooled mice transferred to a single mouse recipient and repeated 4 times.
FIG. 20A. TFR cells suppress TFH activation and B cell class switch recombination in vitro. dLN TFR suppression assays in which dLN TFH CD4+ICOS+CXCR5+GITR-CD19-) and/or TFR (CD4+ICOS+CXCR5+GITR+CD19-) cells were plated with either B cells or DCs (isolated from the dLN of WT mice immunized with NP-OVA 7 days previously) for 5-6 days with anti-CD3 and anti-IgM. TFH cells were gated as CD4.sup.+CD19.sup.-FoxP3.sup.- and stained for surface expression of CXCR5. Representative histograms (left) and quantification (right) are shown. Data indicate means+/-standard error of replicate wells and representative of at least 3 independent experiments.
FIG. 20B. TFH cells gated as in FIG. 20A were intracellularly stained for (B) Bcl6 with representative histograms (left) and quantification (right) shown. Data indicate means+/-standard error of replicate wells and representative of at least 3 independent experiments.
FIG. 20C. TFH cells gated as in FIG. 20A were intracellularly stained for (Ki67, with representative histograms (left) and quantification (right) shown. Data indicate means+/-standard error of replicate wells and representative of at least 3 independent experiments.
FIG. 20D. Intracellular cytokine staining in TFH cells from suppression assays in which dLN TFH and/or TFR cells were plated with B cells as in FIG. 20A. Data indicate means+/-standard error of replicate wells and representative of at least 3 independent experiments.
FIG. 20E. B cells from suppression assays in which dLN TFH and/or TFR cells were plated with B cells as in FIG. 20A and quantified for surface expression of GL7. Data indicate means+/-standard error of replicate wells and representative of at least 3 independent experiments.
FIG. 20F. Analyses of B cells from suppression assays in which no TFH or TFR cells were added, TFH cells alone were added, TFH and dLN FoxP3+CXCR5- cells from WT unimmunized mice were added, or TFH and TFR cells were added; B cells were stained for GL7 and CD138. Plots are pregated on CD19.sup.+CD4.sup.-.
FIG. 20G. Intracellular expression of Ki67 in B cells from suppression assays in which dLN TFH and/or TFR cells were plated with B cells as in FIG. 20A. Data indicate means+/-standard error of replicate wells and representative of at least 3 independent experiments.
FIG. 20H. Intracellular expression of IgG1 in B cells from suppression assays in which dLN TFH and/or TFR cells were plated with B cells as in FIG. 20A. Data indicate means+/-standard error of replicate wells and representative of at least 3 independent experiments.
FIG. 20I. Surface staining of GL7 and intracellular staining of IgG1 in B cells from suppression assays in which B cells were cultured with dLN TFH cells alone or with CD4.sup.+FoxP3.sup.+CXCR5.sup.- cells from LN of unimmunized FoxP3 GFP reporter mice, or dLN TFR cells. B cells cultured with CD4.sup.+CXCR5.sup.-FoxP3.sup.-CD62L.sup.+ naive cells were included as controls. Data indicate means+/-standard error of replicate wells and representative of at least 3 independent experiments.
FIG. 21A. Blood TFR cells are less suppressive than LN TFR cells. GL7 and IgG1 expression in B cells from suppression assays in which dLN or blood TFR (CD4+ICOS+CXCR5+GITR+CD19-) cells from WT mice immunized 7 days previously were added to dLN TFH cells and B cells as in (FIG. 6A) for 6 days. Gating strategy (left) and quantification (right) are shown. Plots are pregated on CD4.sup.+CD19.sup.- FoxP3.sup.-. Data indicate means+/-standard error of at least 3 independent experiments.
FIG. 21B. GL7 expression on B cells from suppression assays with dLN TFR cells and blood TFR cells as in FIG. 21A.
FIG. 21C. Intracellular Ki67 staining in TFR cells from suppression assays in which dLN TFH cells were plated with either B cells or DCs along with dLN TFR cells or blood TFR cells. Histograms are pregated on CD4+CD19-FoxP3+. Data for individual plots that are representative of at least two experiments.
FIG. 21D. Blood TFH and TFR cells are capable of eliciting more potent B cell activation in vivo. Actin.sup.CFP-Fox.sup.GFP mice were immunized with NP-OVA and 7 days later 2.times.10.sup.4 blood or dLN CD4.sup.+ICOS.sup.+CXCR5.sup.+ (TFH and TFR) cells (with the same TFH/TFR ratio) were adoptively transferred to CD28 deficient mice that were then immunized with NP-OVA. 7 days later draining lymph nodes were harvested and B cells were stained for GL7 and FAS (plots are pregated on CD19) or (E) CD138 and CD19 (pregated on live cells). Data for individual plots that are representative of at least two experiments.
FIG. 21E. Blood TFH and TFR cells are capable of eliciting more potent B cell activation in vivo. Actin.sup.CFP-Fox.sup.GFP mice were immunized with NP-OVA and 7 days later 2.times.10.sup.4 blood or dLN CD4.sup.+ICOS.sup.+CXCR5.sup.+ (TFH and TFR) cells (with the same TFH/TFR ratio) were adoptively transferred to CD28 deficient mice that were then immunized with NP-OVA. 7 days later draining lymph nodes were harvested and B cells were stained for CD138 and CD19 (pregated on live cells). Data for individual plots that are representative of at least two experiments.
FIG. 22A. TFH and TFR cells from the circulation show decreased expression of CXCR5 and ICOS compared to lymph node TFH and TFR cells. WT mice were immunized (or not) with NP-OVA in CFA subcutaneously and 7 days later the draining lymph node and blood were collected and analyzed by flow cytometry. Populations of ICOS.sup.+CXCR5.sup.+ T follicular helper (TFH) cells in the lymph node (LN; left) and blood (right) of WT mice. Plots are pregated on CD4.sup.+FoxP3.sup.-CD19.
FIG. 22B. Quantification of TFH cells in lymph node (left) and blood (right) from plots as in FIG. 22A. Total CD4+CD19- cells "Total CD4" are included as controls.
FIG. 22C Quantification of CXCR5 expression, on lymph node and blood TFH cells gated as in FIG. 22A.
FIG. 22D. ICOS expression on lymph node and blood TFH cells gated as in FIG. 22A.
FIG. 22E. Quantification of Ki67 expression on lymph node and blood TFH cells gated as in FIG. 22A.
FIG. 22F. Populations of ICOS.sup.+CXCR5.sup.+ T follicular regulatory (TFR) cells in the lymph node and blood of WT mice immunized or not with NP-OVA 7 days previously. Plots are pregated on CD4.sup.+FoxP3.sup.+CD19.sup.-.
FIG. 22G. Draining LN TFR cells expressed lower levels of CXCR5 than dLN TFH cells.
FIG. 22H. Blood TFR cells expressed even lower levels of CXCR5 than dLN TFR cells.
FIG. 22I. ICOS expression was also greatly attenuated in blood TFR cells compared to dLN TFR cells.
FIG. 22J. Ki67 intracellular staining revealed that there were similar proportions of dLN and blood TFR cells in cell cycle.
FIG. 23. Comparison of TFR and Treg gene expression signatures (left) Top hits (oriented top to bottom) and (right) bottom hits (oriented bottom to top) of differentially expressed genes in WT CD4+ICOS+CXCR5+GITR+TFR cells (WT) compared to CD4+CXCR5-FoxP3+ non-TFR Tregs (Fox) in microarray analysis. PD-1 deficient TFR cells (PD1) (which have increased suppressive capacity) are also shown. Each row indicates one gene. Data indicate top 100 and bottom 100 hits comparing WT TFR to Tregs. Black indicates row maximum expression, white indicates row minimum expression.
FIG. 24. Surface receptors differentially expressed by human blood TFR cells. Top 56 hits from a survey of surface receptor expression on human blood CD4+CXCR5+ICOS+FoxP3+CD19- TFR, CD4+CXCR5+ICOS+FoxP3-CD19- TFH, CXCR5- CD4 (CD4) and CXCR5- Tregs (Treg) are assessed at the protein level by flow cytometry. Hits are sorted based on receptors differentially expressed by TFR and TFH cells. Id indicates gene name. Value indicates mean fluorescence intensity on TFR cells. Heat map indicates relative high expression (black) or low expression (white).
FIG. 25. Surface receptors differentially expressed by human blood TFH cells. Top 19 hits from a survey of surface receptor expression on human blood CD4+CXCR5+ICOS+FoxP3+CD19- TFR, CD4+CXCR5+ICOS+FoxP3-CD19- TFH, CXCR5- CD4 (CD4) and CXCR5- Tregs (Treg) are assessed at the protein level by flow cytometry. Hits are sorted based on receptors differentially expressed by TFH and TFR cells. Id indicates gene name. Fold change indicates MFI fold increase on TFH versus TFR cells. Value indicates mean fluorescence intensity on TFR cells. Heat map indicates relative high expression (black) or low expression (white).
FIG. 26. Blockade of the PD-1 pathway can heighten antibody stimulating capacity of TFH cells. In vitro class switch recombination assay in which murine B cells are plated with sorted murine TFH cells to induce IgG1 class switch recombination. In some wells an anti-PDL1 blocking antibody was added to inhibit the PD-1 pathway.
DETAILED DESCRIPTION OF THE INVENTION
I. Definitions
So that the invention may be more readily understood, certain terms are first defined.
T follicular regulatory (TFR) cells as used herein include, but are not limited to, the following cell surface markers: CD4+ICOS+CXCR5+FoxP3+CD19-. or CD4+ICOS+CXCR5+GITR+CD19-, or CD4+ICOS+CXCR5+CD25hiCD19-. In one embodiment, TFR cells have the following cell surface markers: CD4.sup.+CXCR5.sup.+ICOS.sup.+ and at least one surface marker selected from: GITR.sup.+, CD25.sup.hi, CD162, CD27, CD95, CD9, CD43, CD50, CD45RB, CD102, CD61, CD58, CD196, CD38, CD31, CD15, CD25, CD13, CD66a/c/e, CD1b CD63, CD32, CD97, HLA-HQ, CD150, Siglec-9, Integrin.beta.7, CD71, CD180, CD218a, CD193, CD235ab, CD35, CD140a, CD158b, CD33, CD210, HLA-G, CD167a, CD119, CX3CR1, CD146, HLA-DR, CD85, CD172b, SSEA-1, CD49c, CD170, CD66b, and CD86. In one embodiment, TFR cells have the following cell surface markers: CD4.sup.+CXCR5.sup.+ICOS.sup.+ and at least one surface marker selected from: CD27, CD278 (ICOS), CD150, Siglec-9, CD140a, CD158b, CD33.
T follicular helper (TFH) cells as used herein include, but are not limited to the following cell surface markers: CD4+ICOS+CXCR5+FoxP3-CD19-. In one embodiment, TFH cells have the following cell surface markers: CD4, CXCR5, ICOS positive and at least one marker selected from CD163, CD127, CD8a, CD89, CD197, CD161, CD6, CD229, CD96, CD272, CD148, CD107a, CD100, CD82, CD126, CD45RO, CD279, CD5, and CD99 and optionally wherein the TFH cells are negative for one or more of the following receptors GITR, CD25, CD162, CD27, CD95, CD9, CD43, CD50, CD45RB, CD102, CD61, CD58, CD196, CD38, CD31, CD15, CD25, CD13, CD66a/c/e, CD11b CD63, CD32, CD97, HLA-HQ, CD150, Siglec-9, Integrin.beta.7, CD71, CD180, CD218a, CD193, CD235ab, CD35, CD140a, CD158b, CD33, CD210, HLA-G, CD167a, CD119, CX3CR1, CD146, HLA-DR, CD85, CD172b, SSEA-1, CD49c, CD170, CD66b, and CD86. In one embodiment, TFH cells have the following cell surface markers: CD4, CXCR5, ICOS positive and at least one marker selected from CD163, CD127, CD161, CD6, CD229, CD272, CD100, CD126, PD-1 (CD279), and optionally wherein the TFH cells are negative for one or more of the following receptors GITR, CD25, CD162, CD27, CD95, CD9, CD43, CD50, CD45RB, CD102, CD61, CD58, CD196, CD38, CD31, CD15, CD25, CD13, CD66a/c/e, CD11b CD63, CD32, CD97, HLA-HQ, CD150, Siglec-9, Integrin.beta.7, CD71, CD180, CD218a, CD193, CD235ab, CD35, CD140a, CD158b, CD33, CD210, HLA-G, CD167a, CD119, CX3CR1, CD146, HLA-DR, CD85, CD172b, SSEA-1, CD49c, CD170, CD66b, and CD86.
In one embodiment, TFH cells have the following cell surface markers: CD4, CXCR5, ICOS positive and at least one marker selected from CD163, CD127, CD161, CD6, CD229, CD272, CD100, CD126, PD-1 (CD279), and optionally wherein the following markers are expressed a lower levels on TFH cells as compared to the levels of expression on TFR cells wherein such receptors are selected from: GITR, CD25, CD162, CD27, CD95, CD9, CD43, CD50, CD45RB, CD102, CD61, CD58, CD196, CD38, CD31, CD15, CD25, CD13, CD66a/c/e, CD11b CD63, CD32, CD97, HLA-HQ, CD150, Siglec-9, Integrin.beta.7, CD71, CD180, CD218a, CD193, CD235ab, CD35, CD140a, CD158b, CD33, CD210, HLA-G, CD167a, CD119, CX3CR1, CD146, HLA-DR, CD85, CD172b, SSEA-1, CD49c, CD170, CD66b, and CD8.
T regulatory cells (Tregs) as used herein include, but are not limited to the following cell surface markers: CD4+ GITR+ CXCR5.sup.- or CD4+FoxP3+ CXCR5.sup.- or CD4+ CD25hi CXCR5.sup.-.
Populations of TFH or TFR cells referred to herein as "isolated" or purified" from blood refers to cells that have been removed from the body as part of a sample taken from the peripheral blood, organs or tissues of a subject. "Isolated" and "purified" cell compositions may further be enriched for the desired cell type via known procedures for separating desired cell types from other cell populations in a sample including cell sorting. As used herein "enriched" means that the resulting sample comprises more of the desired cell type than other cell types in the sample.
The terms "inhibit", "inhibition, "suppress" and "suppression" in terms of an immune response includes the decrease, limitation or blockage of, for example a particular action, function or interaction (e.g. antibody suppression).
The terms "enhance", promote" or "stimulate" in terms of an immune response includes an increase, facilitation, proliferation, for example a particular action, function or interaction associated with an immune response (e.g. increase in antibody production).
As used herein, the term "modulate" includes up-regulation and down-regulation, e.g., enhancing or inhibiting an immune response. The term "modulate" when used with regard to modulation of a receptor includes up-regulation or down-regulation of the biological activity associated with that receptor when the receptor is activated, for example, by its ligand or inhibited, for example, with a blocking antibody.
As used herein, the term "immune cell" refers to cells that play a role in the immune response. Immune cells are of hematopoietic origin, and include lymphocytes, such as B cells and T cells; natural killer cells; myeloid cells, such as monocytes, macrophages, eosinophils, mast cells, basophils, and granulocytes.
As used herein, the term "T cell" includes CD4+ T cells and CD8+ T cells. The term "antigen presenting cell" includes professional antigen presenting cells (e.g., B lymphocytes, monocytes, dendritic cells, Langerhans cells) as well as other antigen presenting cells (e.g., keratinocytes, endothelial cells, astrocytes, fibroblasts, oligodendrocytes).
The term "native" cells or "wild-type" cells as used herein with reference to, for example, TFR cells, TFH cells or other cells, means that the cells are essentially phenotypically and functionally the same as those cells of the same cell-type generally found at the original source of the native or wild type cells, such as, for example, TFR cells normally found in the blood, organs or tissue of a subject.
The term TFR cells with "enhanced suppressive capacity" or "enhanced immune suppressive activity" or "enhanced regulatory capacity" refers to TFR cells that have been activated in the presence of a PD-1 or PD-1 ligand antagonist such that they have enhanced immune suppressive activity as compared to native TFR cells. Enhanced immune suppressive activity may be measured by standard in vivo and in vitro assays such as antibody suppression assays as are known in the art and described herein.
The term TFH cells with "enhanced stimulatory capacity", "enhanced immune stimulatory capacity" or "enhanced antibody stimulatory capacity" refers to TFH cells that have been activated in the presence of a PD-1 or PD-1 ligand antagonist such that they have enhanced stimulatory capacity as compared to native TFR cells. Enhanced stimulatory capacity may be measured, for example, by the novel in vivo and in vitro antibody proliferation assays of the invention as described herein.
As used herein, the term "immune response" includes T cell mediated and/or B cell mediated immune responses and include those immune responses that are mediated by TFR cells or TFH cells. Exemplary immune responses include T cell responses, e.g., cytokine production, and cellular cytotoxicity. In addition, the term immune response includes immune responses that are indirectly affected by T cell activation, e.g., antibody production (humoral responses) and activation of cytokine responsive cells, e.g., macrophages.
A "subject" is preferably a human subject but can also be any mammal, including an animal model; in which modulation of an autoimmune reaction is desired. Mammals of interest include, but are not limited to: rodents, e.g. mice, rats; livestock, e.g. pigs, horses, cows, etc., pets, e.g. dogs, cats; and primates. A subject may also be a donor of peripheral blood T cells who is not the subject in which modulation of an autoimmune reaction is desired also referred to herein as a "healthy donor". A subject may also be referred to herein as a "patient".
The terms "treatment" "treat" and "treating" encompasses alleviation, cure or prevention of at least one symptom or other aspect of a disorder, disease, illness or other condition (collectively referred to herein as a "condition"), or reduction of severity of the condition, and the like. A composition of the invention need not affect a complete cure, or eradicate every symptom or manifestation of a disease, to constitute a viable therapeutic agent. As is recognized in the pertinent field, drugs employed as therapeutic agents may reduce the severity of a given disease state, but need not abolish every manifestation of the disease to be regarded as useful therapeutic agents. Beneficial or desired clinical results include, but are not limited to, alleviation of symptoms, diminishment of extent of disease, stabilization (i.e., not worsening) of disease, delay or slowing of disease progression, amelioration or palliation of the disease state, remission (whether partial or total, whether detectable or undetectable) and prevention of relapse or recurrence of disease. Similarly, a prophylactically administered treatment need not be completely effective in preventing the onset of a condition in order to constitute a viable prophylactic agent. Simply reducing the impact of a disease (for example, by reducing the number or severity of its symptoms, or by increasing the effectiveness of another treatment, or by producing another beneficial effect), or reducing the likelihood that the disease will occur or worsen in a subject, is sufficient.
"Treatment" can also mean prolonging survival as compared to expected survival if not receiving treatment. In one embodiment, an indication that a therapeutically effective amount of a composition has been administered to the patient is a sustained improvement over baseline of an indicator that reflects the severity of the particular disorder.
By a "therapeutically effective amount" of a composition of the invention is meant an amount of the composition which confers a therapeutic effect on the treated subject, at a reasonable benefit/risk ratio applicable to any medical treatment. The therapeutic effect is sufficient to "treat" the patient as that term is used herein.
As used herein, "cell therapy" is a method of treatment involving the administration of live cells.
"Adoptive immunotherapy" is a treatment process involving removal of cells from a subject, the processing of the cells in some manner ex-vivo and the infusion of the processed cells into the same subject as a therapy.
As used herein, a vaccine is a composition that provides protection against a viral infection, cancer or other disorder or treatment for a viral infection, cancer or other disorder. Protection against a viral infection, cancer or other disorder will either completely prevent infection or the tumor or other disorder or will reduce the severity or duration of infection, tumor or other disorder if subsequently infected or afflicted with the disorder. Treatment will cause an amelioration in one or more symptoms or a decrease in severity or duration. For purposes herein, a vaccine results from co-infusion (either sequentially or simultaneously) of an antigen and a composition of cells produced by the methods herein. As used herein, amelioration of the symptoms of a particular disorder by administration of a particular composition refers to any lessening, whether permanent or temporary, lasting or transient that can be attributed to or associated with administration of the composition.
As used herein a "vaccination regimen" means a treatment regimen wherein a vaccine comprising an antigen and/or adjuvant is administered to a subject in combination with for example, composition of the invention comprising TFR cells and/or TFH cells, simultaneously, in either separate or combined formulations, or sequentially at different times separated by minutes, hours or days, but in some way act together to provide the desired enhanced immune response to the vaccine in the subject as compared to the subject's immune response in the absence of a TFR and/or TFH composition in accordance with the invention.
The term "adjuvant" is used in its broadest sense as any substance which enhances, increases, upwardly modulates or otherwise facilitates an immune response to an antigen. The immune response may be measured by any convenient means such as antibody titre or level of cell-mediated response.
"Immune-related disease" means a disease in which the immune system is involved in the pathogenesis of the disease. Subsets of immune-related diseases are autoimmune diseases. Autoimmune diseases include, but are not limited to, rheumatoid arthritis, myasthenia gravis, multiple sclerosis, psoriasis, systemic lupus erythematosus, autoimmune thyroiditis (Hashimoto's thyroiditis), Graves' disease, inflammatory bowel disease, autoimmune uveoretinitis, polymyositis, and certain types of diabetes. Other immune-related diseases are provided infra. In view of the present disclosure, one skilled in the art can readily perceive other autoimmune diseases treatable by the compositions and methods of the present invention.
A disease or condition wherein modulation of, and preferably selective modulation of, TFR cells and/or TFH cells is therapeutic, includes diseases wherein suppression of a pathogenic antibody response is desired and diseases where enhancement of a protective antibody response is desired. In some instances, for example, in a disease in which suppression of a pathogenic antibody response is therapeutic, it is contemplated herein that the disease may be treated by selectively up-regulating TFR cell-mediated antibody suppression while simultaneously selectively down-regulating TFH cell-mediated immune response.
Examples of diseases or conditions wherein suppression of a pathological antibody response is desired include diseases in which antibodies contribute to, or are primarily responsible for pathogenesis. Such diseases or conditions in which antibodies contribute to and/or are primarily responsible for pathogenesis include, but are not limited to, diabetes (Type 1), multiple sclerosis, systemic lupus erythematosus, allergy, asthma, multiple sclerosis, myasthenia gravis, lupus erythematosus, autoimmune hemolytic, scleroderma and systemic sclerosis, Sjogren's syndrom, undifferentiated connective tissue syndrome, antiphospholipid syndrome, vasculitis (polyarteritis nodosa, allergic granulomatosis and angiitis, Wegner's granulomatosis, hypersensitivity vasculitis, polymyositis systemic lupus erythematosus, collagen diseases, autoimmune hepatitis, primary (autoimmune) sclerosing cholangitis or other hepatic diseases, thyroiditis, glomerulonephritis, Devic's disease, autoimmune throbocytopenic purpura, pemphigus vulgaris, vasculitis caused by ANCA, Goodpasture's syndrome, rheumatic fever, Grave's disease (hyperthyroidism), insulin resistant diabetes, pernicious anemia, celiac disease, hemolytic disease of the newborn, cold aggutinin disease, IgA nephropathology, glomerulonephritis (including post-streptococcal), primary biliary cirhosis, and serum sickness. In one embodiment diseases in which pathogenic antibodies contribute to and/or are primarily responsible for pathogenesis are selected from multiple sclerosis, systemic lupus erythematosis, allergy, myasthenia gravis, collagen diseases, glomerulonephritis, Devic's disease, vasculitis caused by ANCA, and celiac disease.
Examples of diseases or conditions wherein enhancement of a protective antibody response is desired includes those diseases in which the presence of a robust antibody response reduces or eliminates the causes or pathogenesis of the disease. Examples of diseases or conditions benefiting from a protective antibody response include, but are not limited to viral infections and cancer.
While not a disease or condition, enhancement of a protective antibody response is also beneficial in a vaccine or as part of a vaccination regimen as is described herein.
An agent that is an "antagonist" of a cell surface receptor on a TFH cell or a TFR cell is an agent which down regulates or blocks the biological function of the cell surface receptor. As used herein, an agent which is an "antagonist" includes agents that bind or otherwise interfere with ligands of cell surface receptor thereby blocking the ability of the ligand to bind to the cell surface receptor and down-regulate or prevent the biological function of the cell surface receptor.
An agent that is an "agonist" of a cell surface receptor on a TFH cell or a TFR cell is an agent which upregulates or increases the biological function of the cell surface receptor.
II. Starting Population of Cells
In one embodiment TFR cells and TFR precursor cells, for example, T regulatory (Treg) progenitor cells are derived from a mixed cell population containing such cells (e.g. from peripheral blood, tissue or organs). Preferably the mixed cell population containing TFR cells or TFR cell precursors is enriched such that TFR cells or TFR cell precursors comprise more TFR cells than other cell types in the population. In one embodiment, an enriched composition of TFR cells is a composition wherein the TFR cells make up greater than about 50% (e.g., 55%, 60%, 65%, 70%, 75%, 80%, 85%, 90%, 95%, 98%, 99%, 99.5%, 99.9% or more) of the cell population in the composition. In some embodiments, the TFR cells comprise about 90%, 95%, 98%, 99%, 99.5%, 99.9% or more of the cells in the composition, and such compositions are referred to herein as "highly purified" or "substantially homogenous" TFR cell compositions.
While a starting population of TFR cells is described above, it is understood that similar procedures may be applied to obtaining a starting population of TFH cells. Accordingly in some embodiments a mixed cell population containing TFH is enriched such that the composition comprises more TFH cells than other cell types in the population. In one embodiment, an enriched composition of TFH cells is a composition wherein the TFH cells make up greater than about 50% (e.g., 55%, 60%, 65%, 70%, 75%, 80%, 85%, 90%, 95%, 98%, 99%, 99.5%, 99.9% or more) of the cell population in the composition. In some embodiments, the TFH cells comprise about 90%, 95%, 98%, 99%, 99.5%, 99.9% or more of the cells in the composition, and such compositions are referred to herein as "highly purified" or "substantially homogenous" TFH cell compositions. In some embodiments, TFR cells or TFH cells are enriched from a population of cells prior to an activating and/or expanding step. In some embodiments TFR cells or TFH cells are enriched from a population of cells after the activating and/or expanding step.
Such highly purified or substantially homogenous populations of TFR cells or TFH cells may be used for in-vivo and in-vitro diagnoses and examination of TFR cell-mediated, or TFH cell-mediated diseases.
TFR cells can be enriched by targeting for selection of cell surface markers specific for immune suppressive TFR cells and separating using automated cell sorting such as fluorescence-activated cell sorting (FACS), solid-phase magnetic beads, etc. To enhance enrichment, positive selection may be combined with negative selection against cells comprising surface makers specific to non-T-regulatory cell types, such as depletion of CD8, CD11b, CD16, CD19, CD36 and CD56-bearing cells.
In one embodiment TFR cells are sorted via flow cytometry based on surface markers of CD4.sup.+CXCR5.sup.+ICOS.sup.+GITR.sup.+, or CD4.sup.+CXCR5.sup.+ICOS.sup.+CD25.sup.+. In one embodiment, TFR cells are sorted via flow cytometry based on the following cell surface markers: CD4.sup.+CXCR5.sup.+ICOS.sup.+ and at least one surface marker selected from one or more of: GITR.sup.+, CD25.sup.hi, CD162, CD27, CD95, CD9, CD43, CD278, CD50, CD45RB, CD102, CD61, CD58, CD196, CD38, CD31, CD15, CD25, CD13, CD66a/c/e, CD11b CD63, CD32, CD97, HLA-HQ, CD150, Siglec-9, Integrin.beta.7, CD71, CD180, CD218a, CD193, CD235ab, CD35, CD140a, CD158b, CD33, CD210, HLA-G, CD167a, CD119, CX3CR1, CD146, HLA-DR, CD85, CD172b, SSEA-1, CD49c, CD170, CD66b, and CD86.
TFH cells may be sorted based on surface markers of CD4, CXCR5, ICOS positive; GITR negative, CD25 negative. In one embodiment, TFH cells are sorted via flow cytometry based on the following cell surface markers: CD4, CXCR5, ICOS positive and at least one marker selected from: CD163, CD127, CD8a, CD89, CD197, CD161, CD6, CD229, CD96, CD272, CD148, CD107a, CD100, CD82, CD126, CD45RO, CD279, CD5, and CD99, and optionally wherein the TFH cells are negative for one or more of the following receptors GITR, CD25, CD162, CD27, CD95, CD9, CD43, CD50, CD45RB, CD102, CD61, CD58, CD196, CD38, CD31, CD15, CD25, CD13, CD66a/c/e, CD11b CD63, CD32, CD97, HLA-HQ, CD150, Siglec-9, Integrin?7, CD71, CD180, CD218a, CD193, CD235ab, CD35, CD140a, CD158b, CD33, CD210, HLA-G, CD167a, CD119, CX3CR1, CD146, HLA-DR, CD85, CD172b, SSEA-1, CD49c, CD170, CD66b, and CD86.
It is believed that these sorting methodologies also contribute to the enhanced suppressive capacity of TFH cells and TFR cells alone or in combination with activating such cells in the presence of an antagonist of PD-1 or PD-1 ligand as is described herein.
In one embodiment, an initial population of TFR cells may also be isolated from the peripheral blood of a subject and further enriched for TFR cells. In one embodiment, an initial population of TFH cells may also be isolated from the peripheral blood of a subject and further enriched for TFH cells. Methods of purifying TFR cells or TFH cells from other PBMCs in the blood, using methods such as differential sedimentation through an appropriate medium, e.g. Ficoll-Hypaque [Pharmacia Biotech, Uppsala, Sweden], and/or methods of cell sorting, are well known and examples of such methods are described herein.
In one embodiment the invention provides a composition of TFR cells derived from the peripheral blood of a subject (also referred to herein as "blood TFR cells") wherein the composition comprises about 90%, 95%, 98%, 99%, 99.5%, 99.9% or more of the cells in the composition.
In one embodiment the invention provides a composition of TFH cells derived from the peripheral blood of a patient (also referred to herein as "blood TFH cells") wherein the composition comprises about 90%, 95%, 98%, 99%, 99.5%, 99.9% or more of the cells in the composition. Such high purity compositions of blood TFR cells or blood TFH cells may be used directly in methods of modulating the immune system as described herein. Alternatively such compositions may be further activated and/or expanded prior to use in modulating the immune system as described herein.
III. Activation/Expansion of Starting Population of Cells
In one embodiment, the activation of a starting cell population is achieved by contacting the starting population of TFH cells or TFR cells with T cell stimulatory composition and/or in the presence of a PD-1 or PD-1L antagonist. The activating step may further include an expanding step or the cell population may be expanded separately from the activating step. If an expanding step is desired, the cells are preferably expanded at least 50-fold, and preferably at least 100, 200, 300, 500 and 800-fold.
Preferred stimulatory compositions stimulate the T cells by binding and activating the T cell receptor complex on the cells. In one embodiment, stimulatory compositions may include agents capable of binding and activating selective TFR and selective TFH receptors as described herein. In one embodiment the stimulatory compositions comprise physiological antigen presenting cells (APCs), such as CD19+ B cells (preferably autologous from blood) a TCR/CD3 activator such as a multivalent antibody or ligand for TCR/CD3; a TCR costimulator activator such as multivalent antibody or ligand for CD28, GITR, CD5, ICOS, OX40 or CD40L; and optionally an interleukin such as IL-2. In one embodiment, the TCR/CD3 activator is an anti-CD3 antibody, and the TCR costimulator activator is an anti-CD28 antibody. The anti-CD3 and anti-CD28 antibodies are optionally immobilized on beads as are known in the art and provided in a cell:bead ratio of between 1:1 and 1:2.
In certain embodiments, the stimulatory composition may further include one or more additional agents, e.g., a costimulatory agent, a second regulatory T cell stimulatory agent, or agents that generally promote the survival and/or growth of T cells.
In certain embodiments, the costimulatory agent is an antibody or ligand specific for a T cell costimulator, such as CD28 or ICOS, as described below. In particular embodiments, the costimulatory agent is an agonist antibody, such as an agonist antibody which binds to CD28.
The stimulatory composition alternatively comprises a second regulatory T cell stimulatory agent. Exemplary stimulatory agents include granulocyte colony stimulating factor, interleukins such as IL-2, IL-6, IL-7, IL-13, and IL-15, and hepatocyte growth factor (HGF).
In particular embodiments, one or more components of the stimulatory composition is immobilized on a substrate, such as a cell or bead. Cells suitable for use as substrates include artificial antigen-presenting cells (AAPCs) (Kim, J V et al, Nat Biotechnol. April 2004; 22(4):403-10; and Thomas, A K et al, Clin Immunol. December 2002; 105(3):259-72). Beads can be plastic, glass, or any other suitable material, typically in the 1-20 micron range.
Examples of PD-1 and PD-1 ligand antagonists are disclosed in U.S. Pat. No. 7,722,868, incorporated herein by reference. Suitable PD-1 and PD-1 ligand antagonists include a PD1-ligand antibody, an anti-PD-1 antibody, a peptide or a small molecule wherein the agent inhibits the interaction between PD-1 and a PD-1 ligand. Other examples of PD-1 or PD-1 ligand antagonists are disclosed, for example in U.S. Pat. Nos. 8,168,757; 8,114,845; 8,008,449; 7,595,048; 7,488,802; and 7,029,674.
Optimal concentrations of each component of the stimulatory compositions, culture conditions and duration can be determined empirically using routine experimentation.
Populations of TFR cells expanded/activated in the presence of a PD-1 or PD-1 ligand antagonist have enhanced suppressive activity as demonstrated by their ability to inhibit TFH-mediated antibody production in vitro and in vivo as demonstrated in appropriate assays as are described herein.
Populations TFH cells expanded/activated in the presence of a PD-1 or PD-1 ligand antagonist have enhanced antibody stimulatory activity as demonstrated by their ability to enhance TFH-mediated antibody production in vitro and in vivo as demonstrated in appropriate assays described herein. Such TFH cells are referred to herein as "TFH cells having enhanced stimulatory capacity".
IV. Modulation of the Immune System
The expanded and/or activated TFR cells and compositions thereof as described herein may be introduced into the subject to treat immune related diseases, for example, by modulating an autoimmune reaction. For example, the subject may be afflicted with a disease or disorder characterized by having an ongoing or recurring autoimmune reaction, such as the diseases/disorders including, but not limited to, lupus erythematosus; myasthenia gravis; autoimmune hepatitis; rheumatoid arthritis; multiple sclerosis; Grave's disease, and graft versus host disease (GVHD).
In one embodiment, if upregulation of an immune response in a subject is desired, such as for example, increasing antibody proliferation in response to a vaccine, an enriched and optionally expanded and/or activated composition comprising a starting population of TFH cells may be administered to a subject.
In one embodiment modulation of the immune system is achieved when upon administration of a composition of the invention, the ratio of TFR cells to TFH cells in a subject is changed as compared to the ratio of TFR cells to TFH cells in a subject prior to administration of a composition of the invention. The ratios of TFR cells to TFH cells in a subject prior to, and after, administration of a composition of the invention may be measured by assaying for the presence of TFR cells or TFH cells in a patient's blood. Examples of suitable assays for measuring the ratio of TFR cells to TFH cells in a patient's blood are described herein.
In one embodiment, if downregulation of a subject's immune response is desired, such as, for example, when the subject has an autoimmune disease and inhibition of an antibody response is desired, a highly purified composition of blood derived TFR cells, or a composition enriched for TFR cells having enhanced suppressive activity may be administered to a patient. After administration of the composition, a blood sample from the patient may be tested to determine if the ratio of TFR cells to TFH cells is high.
In one embodiment, if upregulation of an immune response in a subject is desired, such as for example, increasing antibody proliferation in response to a vaccine, a highly purified composition of blood-derived TFH cells may be administered to a patient. After administration of TFH composition, a blood sample from the patient may be tested to determine if the ratio of TFH cells to TFR cells is high.
Accordingly, the invention provides methods and compositions for adoptive cellular immunotherapy comprising introducing into a patient in need thereof an effective amount of the subject's ex vivo expanded/activated TFR cells, for example. These applications generally involve reintroducing expanded/activated TFR cells extracted from the same patient, though the methods are also applicable to adoptive cellular immunotherapy for treatment of graft-versus-host disease associated with transplantation, particularly bone marrow transplantation using TFRs derived from donor tissue, and/or healthy individuals.
In an exemplary adoptive cell transfer protocol comprises a mixed population of cells is initially extracted from a target donor. Depending on the application, the cells may be extracted during a period of remission, or during active disease. Typically this is done by withdrawing whole blood and harvesting PMBCs by, for example, leukapheresis (leukopheresis). For example, large volume leukapherisis (LVL) has been shown to maximize blood leukocyte yield. Harvests reach 20.times.10.sup.6 cells/L using a continuous flow apheresis device (Spectra, COBE BCT). Symptoms of hypocalcemia are avoided by a continuous infusion of calcium administrated throughout leukapheresis. Typically 15-45 liters of fluid corresponding to about 4 total blood volumes are harvested during a period of time ranging from about 100 to 300 minutes.
The harvested PMBCs may be separated by flow cytometry or other cell separation techniques based on Treg and/or TFR-specific cell markers such as CD4, CD25, CXCR5, ICOS, and GITR and expanded/activated as described herein, and then transfused to a patient, preferably by the intravenous route, typically the cell donor (except in GVHD where the donor and recipient are different), for adoptive immune suppression. Alternatively, the cells may be frozen for storage and/or transport prior to and/or subsequent to expansion.
Effective and optimized dosages and treatment regimens using the expanded and/or enriched and optionally highly pure TFH or TFR cells are known in the art based on previous clinical experience with existing T-cell infusion therapies, and can be further determined empirically.
The preferred route of administration of the TFR and TFH cell compositions to a subject in accordance with the invention is by the intravenous route. However, depending on the application, cell compositions in accordance with the invention may be administered by other routes including, but not limited to, parenteral, oral or by inhalation.
V. Vaccination
The present invention also contemplates a method for enhancing an immune response to an antigen comprising the administration to a subject as part of a vaccination regimen, TFR cells having enhanced suppressive activity, TFR cell compositions derived from peripheral blood and/or TFH cells derived from peripheral blood. The present invention is particularly useful in pharmaceutical vaccines and genetic vaccines in humans.
Adjuvants promote the immune response in a number of ways such as to modify the activities of immune cells that are involved with generating and maintaining the immune response. Additionally, adjuvants modify the presentation of antigen to the immune system. The compositions of the invention may be used as adjuvants in a vaccination regimen.
In one embodiment, compositions of TFR cells in accordance with the invention may be used in a vaccination regimen. Without being limited to a specific theory, it is believed that TFR cells may control germinal center (GC) B cell differentiation into long-lived plasma cells versus memory B cells thereby enhancing the immune response to the antigen.
In one embodiment compositions of TFH cells, particularly TFH cells derived from the peripheral blood of a patient (also referred to herein as "blood TFH cells") may be used in a vaccination regimen to enhance TFH cell mediated antibody responses. Without being limited to any particular theory, it is believed that TFH cells derived from the blood migrate to lymph nodes and interact with cognate B cells rapidly upon antigen exposure, wherein naive T cells need at least two to four days to differentiate and upregulate CXCR5. Accordingly, TFH cells derived from blood have greater antibody stimulatory capacity.
In one embodiment, it may be desirable to upregulate an immune response or downregulate an immune response as part of a vaccination regimen. This can be accomplished by administering compositions enriched for or highly purified for TFR cells or compositions enriched for or highly purified TFH cells to change the ratio of TFR cells to TFH cells in a subject's blood in combination with the administration of a vaccine.
VI. Novel In-Vivo and In Vitro Assays
The invention also provides in vivo and in vitro assays to analyze the functions of the compositions of TFR cells and TFH cells in accordance with the invention.
In one exemplary embodiment the invention provides an assay to analyze the capacity of TFR cells to inhibit activation of naive CD4 T cells. Briefly, WT and PD-1.sup.-/- mice are immunized with MOG/CFA and TFR cells are sorted from draining lymph nodes and plated 1:1:1 with CF SE-labeled CD4 naive WT (CD4.sup.+CD62L.sup.+FoxP3.sup.-) responder cells and WT GL7.sup.-B220.sup.+ B cells from MOG/CFA immunized mice along with anti-CD3 and anti-IgM for 4 days. 3 days later samples are analyzed by flow cytometry. It is understood that any suitable antigen/adjuvant combinations may be used to immunize mice and that the cells may be stimulated by any suitable combinations of stimulatory factors for this assay.
In one exemplary embodiment the invention provides an assay to analyze capacity of TFR cells to inhibit activation of naive CD4 T cells. WT and PD-1.sup.-/- mice are immunized with MOG/CFA and TFR cells and sorted from draining lymph nodes and plated 1:1:1 with CF SE-labeled CD4 naive WT (CD4.sup.+CD62L.sup.+FoxP3.sup.-) responder cells and WT GL7.sup.- B220.sup.+ B cells from MOG/CFA immunized mice along with anti-CD3 and anti-IgM for 4 days. 3 days later samples are analyzed by flow cytometry. T responders are analyzed for CD69 expression and proliferation by measuring CFSE dilution.
In one embodiment the invention provides an assay for an in vitro IgG suppression. Briefly, TFR cells are sorted as in the assay to analyze capacity of TFR cells to inhibit activation of naive CD4 T cells and are plated in a 1:1:1 ratio of TFR (CD4.sup.+ICOS.sup.+CXCR5.sup.+GITR.sup.+CD19.sup.-), TFH (CD4.sup.+ICOS.sup.+CXCR5.sup.+GITR.sup.-CD19.sup.-), and B (GL-7.sup.-B220.sup.+) cells from draining lymph nodes of MOG/CFA immunized mice in the presence of anti-CD3 and anti-IgM for 6 days. Total IgG was measured by ELISA from supernatants. In one embodiment the in-vitro suppression assay may be performed over a range of concentrations of anti-CD3. Naive (CD4.sup.+ICOS.sup.-CXCR5.sup.-CD19.sup.-) cells from immunized mice may be included as controls. It is understood that any suitable antigen/adjuvant combinations may be used to immunize mice and that the cells may be stimulated by any suitable combinations of stimulatory factors for this assay.
Novel assays of the invention are useful as a diagnostic tool for measuring a subject's TFR cell function and TFH cell function. Such assays are useful in the identification and typing of autoimmune diseases.
The assays of the invention are also useful in measuring the ratio of TFR cells to TFH cells in a patient's blood prior to or during an immune response and/or prior to and after administration of a composition of the invention. Such assays are useful as a diagnostic to assist in determining whether an immune response in a subject should be upregulated or down-regulated or whether an immune modulating treatment regimen has had the desired effect. This assay also may be useful in the diagnosis or progression of specific diseases.
In accordance with the invention, an exemplary assay comprises a method for assaying the TFR cell function or the TFH cell function or both, in a patient comprising the steps of: a) Obtaining a sample of peripheral blood from a patient; b) Isolating a population of TFH cells and TFR cells from the blood sample; c) Contacting the TFH cells and TFR cells with a stimulatory composition comprising antigen present cells (e.g. B cells) in the presence of T-cell receptor stimulating factors and cofactors such as anti-CD3 and anti-IgM, for a time period sufficient to allow the production of antibody such as IgG; and d) measuring the total antibody produced using standard assays (e.g. ELISA).
VII. Modulation of TFR and TFH Cell-Mediated Immune Responses Via Selective TFR and TFH Cell Surface Receptors
The data in FIG. 23 shows that TFR cells are distinct in their gene expression as compared to Treg cells and TFH cells suggesting that TFR cells are capable of independently regulating immune responses. This knowledge may be applied to diagnose, monitor and treat diseases or conditions wherein TFR-immune responses may be selectively modulated such as in those diseases or conditions in which antibodies play a key role in the pathogenesis and enhanced immune suppression is therapeutic. Examples of such diseases are provided herein supra.
TFR cell function may be modulated by use of an agent such as an agonist or an antagonist of one or more of TFR cell surface receptors as described herein. Use of such an agent in an amount effective to inhibit or induce the differentiation of TFR cells and/or modulate the biological function of TFR cells can affect the TFR cell-mediated immune response.
In one embodiment, the invention provides a method suppressing a pathogenic antibody response in a patient in need thereof comprising, administering to the patient, an agent which modulates at least one receptor which is differentially expressed on TFR cells as compared to TFH cells at an increased mean fluorescence intensity (MFI) fold change of at least 1.17, and wherein the receptor has an MFI of at least 186 on TFR cells and wherein the agent administered in an amount that is effective to modulate the TFR receptor and increase TFR cell-mediated antibody suppression, as compared to the TFR cell-mediated antibody suppression in the absence of the agent. Such differentially expressed receptors are referred to herein as "selective TFR receptors". In one embodiment at least one selective TFR receptor is selected from one or more of: CD162, CD27, CD95, CD9, CD43, CD278 (ICOS), CD50, CD45RB, CD102, CD61, CD58, CD196, CD38, CD31, CD15, CD25, CD13, CD66a/c/e, CD11b CD63, CD32, CD97, HLA-HQ, CD150, Siglec-9, Integrin.beta.7, CD71, CD180, CD218a, CD193, CD235ab, CD35, CD140a, CD158b, CD33, CD210, HLA-G, CD167a, CD119, CX3CR1, CD146, HLA-DR, CD85, CD172b, SSEA-1, CD49c, CD170, CD66b, and CD86. In one embodiment, selective TFR receptors are selected from one or more of: CD27, CD278 (ICOS), CD150, Siglec-9, CD140a, CD158b, and CD33.
Methods of modulating TFR cell-mediated immune response through antagonizing or agonizing the biological function of a selective TFR receptor are useful in the treatment of diseases and conditions wherein a decreased or increased TFR cell-mediated immune response is useful. Examples of disorders or conditions which may be treated by increasing TFR cell-mediated immune response include those diseases and conditions in which antibodies contribute to and/or are primarily responsible for, pathogenesis such as in those diseases listed previously herein. In one embodiment the disease or condition in which antibodies contribute and/or are primarily responsible for pathogenesis include: multiple sclerosis, systemic lupus erythematosis, allergy, myasthenia gravis, collagen diseases, glomerulonephritis, Devic's disease, vasculitis caused by ANCA, and celiac disease.
In one embodiment, the agent is a blocking antibody capable of blocking/antagonizing a selective TFR receptor, or binding to the ligand of the receptor and thereby blocking its ability to bind its corresponding receptor. The agent may also be a small molecule, or a DNA or RNA molecule (e.g. dsRNA, or antisense molecule) capable of antagonizing or agonizing the biological function of the receptor, for example by causing overexpression of a receptor or by blocking expression of a receptor.
In addition to the known agonists and antagonists of various selective TFR receptors known generally, other agents may be tested for their ability to antagonize or agonize selective TFR receptors using known assays and screens.
Assays and screens of the invention useful for testing various agents for their ability to agonize or antagonize TFR cell surface receptors are used to identify agents of the invention. In one embodiment, the invention provides assays to specifically and sensitively determine the stimulatory function of TFH cells. Complementary assays are also provided which determine the inhibitory capacity of TFR cells. These assays which include both in vitro and in vivo experiments can be used to determine the functional consequences of sending agonist and/or antagonist signals through surface receptors on TFH and TFR cells.
In vitro murine TFH stimulation assays are performed by immunizing/vaccinating mice with an antigen/adjuvant. In some cases live or attenuated virus can be used. Seven to ten days later TFH cells defined as (CD4+ICOS+CXCR5+FoxP3+CD19-) or (CD4+ICOS+CXCR5+GITR+CD19-) (or alternative TFH marker) are sorted by flow cytometry. TFH cells are incubated with B cells along with anti-CD3 and anti-IgM (or alternatively with specific antigen). Agonists and/or antagonists for TFH surface receptors are also added into cultures. After 7 days antibody production and class switch recombination is assessed by either staining B cells from the culture for activation markers (B7-1, GL7, etc.) or intracellular for IgG isotypes. Activation status of the TFH cell can also be determined. Alternatively, the supernatants can be assessed for presence of IgGs via ELISA. Examples of this assay are included in FIGS. 4A-4M, 20A-20I and 21A-21E. Similar assays are performed using human cells isolated from blood or other tissues.
In vivo murine TFH stimulation assays are performed by immunizing/vaccinating mice with an antigen/adjuvant. In some cases live or attenuated virus can be used. Seven to ten days later TFH cells defined as (CD4+ICOS+CXCR5+FoxP3-CD19-) or (CD4+ICOS+CXCR5+GITR-CD19-) (or alternative TFH marker) are sorted by flow cytometry. Cells are either used right away, or incubated in vitro with agonists or antagonists as in in vitro assays. Cells are adoptively transferred intravenously to mice that are vaccinated or likewise challenged with antigen and/or virus. Ten days later serum is collected from mice and IgGs are detected by ELISA. Within these 10 days agonists or antagonists for TFH surface receptors can be administered.
Examples of this assay are in FIGS. 8A-8K and 21A-21E. These assays can also be used to determine how TFH cells change disease autoimmune pathology. As an example, mice can be immunized with collagen and then TFH cells can be sorted and transferred to a new mouse that is immunized with collagen. The resulting anti-collagen antibodies will cause arthritis which can be measured to determine how TFH cells function within this specific disease. Additionally, these assays can be used to determine TFH stimulation of B cell antibody production in the context of vaccination by using TFH cells from influenza infected mice and then adoptively transfer them to a new mouse that is infected with influenza. Extent of viral infection can be measured as a readout for antibody mediated clearance of virus.
In vitro murine TFR suppression assays are performed by immunizing/vaccinating mice with an antigen/adjuvant. In some cases live or attenuated virus can be used. Seven to ten days later TFH cells defined as (CD4+ICOS+CXCR5+FoxP3-CD19-) or (CD4+ICOS+CXCR5+GITR-CD19-) (or alternative TFH marker) and TFR cells defined as (CD4+ICOS+CXCR5+FoxP3+CD19-) or (CD4+ICOS+CXCR5+GITR+CD19-) (or alternative TFR marker) are sorted by flow cytometry. TFH and/or TFR cells are incubated with B cells along with anti-CD3 and anti-IgM (or alternatively with specific antigen). Agonists and/or antagonists for TFR surface receptors are also added into cultures. After 7 days antibody production and class switch recombination is assessed by either staining B cells from the culture for activation markers (B7-1, GL7, etc.) or intracellular for IgG isotypes. Activation status of the TFH cell can also be determined. Alternatively, the supernatants can be assessed for presence of IgGs via ELISA. Examples of this assay are included in FIGS. 4A-4M, 20A-20I and 21A-21E. Similar assays are performed using human cells isolated from blood or other tissues.
In vivo murine TFR suppression assays are performed by immunizing/vaccinating mice with an antigen/adjuvant. In some cases live or attenuated virus can be used. Seven to ten days later TFH cells defined as (CD4+ICOS+CXCR5+FoxP3+CD19-) or (CD4+ICOS+CXCR5+GITR+CD19-) (or alternative TFH marker) and TFR cells defined as (CD4+ICOS+CXCR5+FoxP3+CD19-) or (CD4+ICOS+CXCR5+GITR+CD19-) (or alternative TFR marker) are sorted by flow cytometry. Cells are either used right away, or incubated in vitro with agonists or antagonists as in in vitro assays. Cells are adoptively transferred intravenously to mice that are vaccinated or likewise challenged with antigen and/or virus. Ten days later serum is collected from mice and IgGs are detected by ELISA. Within these ten days agonists or antagonists for TFR surface receptors can be administered. Examples of this assay are in FIGS. 8A-8K and 21A-21E. These assays can also be used to determine how TFR cells change disease pathology. As an example, mice can be immunized with collagen and then TFH and TFR cells can be sorted and transferred to a new mouse that is immunized with collagen. The resulting anti-collagen antibodies will cause arthritis which can be measured to determine how TFR cells function to suppress the TFH mediated disease.
The present invention further provides agents identified in the assays described herein. Such agents are capable of up antagonizing or agonizing a selected TFR receptor and thereby modulate TFR cell-mediated immune function and to further treat diseases as described herein.
Animal model systems which can be used to screen the effectiveness of the selected agents and test agents of the present invention in protecting against or treating the disease are available. Methods for the testing of systemic lupus erythematosus (SLE) in susceptible mice are known in the art (Knight et al. (1978) J. Exp. Med., 147: 1653; Reinersten et al. (1978) New Eng. J. Med., 299: 515). Myasthenia Gravis (MG) is tested in SJL/J female mice by inducing the disease with soluble AchR protein from another species (Lindstrom et al. (1988) Adv. Immunol., 42: 233). Arthritis is induced in a susceptible strain of mice by injection of Type II collagen (Stuart et al. (1984) Ann. Rev. Immunol., 42: 233). A model by which adjuvant arthritis is induced in susceptible rats by injection of mycobacterial heat shock protein has been described (Van Eden et al. (1988) Nature, 331: 171). Thyroiditis is induced in mice by administration of thyroglobulin as described (Maron et al. (1980) J. Exp. Med., 152: 1115). Insulin dependent diabetes mellitus (IDDM) occurs naturally or can be induced in certain strains of mice such as those described by Kanasawa et al. (1984) Diabetologia, 27: 113. EAE in mouse and rat serves as a model for MS in human. In this model, the demyelinating disease is induced by administration of myelin basic protein (see Paterson (1986) Textbook of Immunopathology, Mischer et al., eds., Grune and Stratton, New York, pp. 179-213; McFarlin et al. (1973) Science, 179: 478: and Satoh et al. (1987) J. Immunol., 138: 179).
Generally, suitable agents identified and tested as described above will be used in purified form together with pharmacologically appropriate carriers. Typically, these carriers include aqueous or alcoholic/aqueous solutions, emulsions or suspensions, any including saline and/or buffered media. Parenteral vehicles include sodium chloride solution, Ringer's dextrose, dextrose and sodium chloride and lactated Ringer's. Suitable physiologically-acceptable adjuvants, if necessary to keep, for example, a polypeptide complex such as an antibody in suspension, may be chosen from thickeners such as carboxymethylcellulose, polyvinylpyrrolidone, gelatin and alginates. Intravenous vehicles include fluid and nutrient replenishers and electrolyte replenishers, such as those based on Ringer's dextrose. Preservatives and other additives, such as antimicrobials, antioxidants, chelating agents and inert gases, may also be present (Mack (1982) Remington's Pharmaceutical Sciences, 16th Edition).
The selected agents of the present invention may be used as separately administered compositions or in conjunction with other agents. These can include various immunotherapeutic drugs, such as cylcosporine, methotrexate, adriamycin or cisplatinum, and immunotoxins. Pharmaceutical compositions can include "cocktails" of various cytotoxic or other agents in conjunction with the agents of the present invention.
The route of administration of pharmaceutical compositions according to the invention may be any of those commonly known to those of ordinary skill in the art. For therapy, including without limitation immunotherapy, the selected agents can be administered to any patient in accordance with standard techniques. The administration can be by any appropriate mode, including parenterally, intravenously, intramuscularly, intraperitoneally, transdermally, via the pulmonary route, or also, appropriately, by direct infusion with a catheter. The dosage and frequency of administration will depend on the age, sex and condition of the patient, concurrent administration of other drugs, counter indications and other parameters to be taken into account by the clinician.
In certain therapeutic applications, an adequate amount to accomplish modulation of a TFR and/or TFH cell-mediated immune response will depend upon the severity of the disease and the general state of the patient's own immune system. Generally, if the agent is a blocking antibody, for example, a range from 0.01 mg-100 mg per kilogram of body weight, with doses of 1-10 mg/kg would be suitable.
A composition containing one or more selected agents according to the present invention may be used in prophylactic and therapeutic settings to aid in the modulation of a TFR and/or TFH cell-mediated response. In addition, the agents described herein may be used extracorporeally or in vitro to selectively modulate TFR and/or TFH cell-mediated immune responses.
The invention also provides agents and methods for modulating TFH cell-mediated immune responses. TFH cells are known in the prior art to be a subset of T helper cells that are genetically distinct from other types of T helper cells suggesting that TFR cells may independently regulate immune responses. This knowledge may be applied to diagnose, monitor and treat, for example, diseases or conditions wherein enhancement of a protective antibody response is therapeutic. Such diseases include but are not limited to treating viral infections and treating cancer. Enhancing and preferably selectively enhancing, TFH cell-mediated immune responses are also particularly beneficial as part of a vaccine or vaccination regimen.
TFH cell function may be modulated by use of an agent such as an agonist or an antagonist of one or more of TFH cell surface receptors as described herein. Use of such an agent in an amount effective to inhibit or induce the differentiation of TFH cells and/or modulate the biological function of TFH cells can affect the TFH cell-mediated immune response.
In one embodiment, the invention provides method of increasing a protective antibody response in a patient in need thereof comprising administering to the patient, an agent which modulates at least one receptor which is differentially expressed on TFH cells as compared to TFR cells at an increased mean fluorescence intensity (MFI) fold change of at least 1.17, and wherein the receptor has an MFI of at least 200 on TFH cells and wherein the agent is effective to modulate the receptor and increase the antibody response in the patient as compared to the antibody response when the agent is absent. Such differentially expressed receptors are referred to herein as "selective TFH receptors". In one embodiment at least one selective TFH receptor is selected from one or more of: CD163, CD127, CD8a, CD89, CD197, CD161, CD6, CD229, CD96, CD272, CD148, CD107a, CD100, CD82, CD126, CD45RO, PD-1 (CD279), CD5, and CD99. In one embodiment, at least one selective TFH receptor is selected from one or more of: CD163, CD127, CD161, CD6, CD229, CD272, CD100, CD126, PD-1 (CD279).
In one embodiment, the agent is a blocking/antagonizing antibody capable of blocking a selective TFH receptor, or binding to the ligand of the receptor and thereby blocking its ability to bind its corresponding receptor. The agent may also be a small molecule, or a DNA or RNA molecule (e.g. dsRNA, or antisense molecule) capable of antagonizing or agonizing the receptor.
In addition to the known agonists and antagonists the various selective TFH receptors described herein, other agents may be tested for their ability to antagonize or agonize selective TFH receptors using known assays and screens. Assays and screens for testing various agents for their ability to agonize or antagonize TFH cell surface receptors are described previously herein. Animal models may be used to test modulation of selective TFH receptors as described previously herein.
The present invention further provides agents identified in the assays described herein wherein such agents are capable of antagonizing or agonizing a selective TFH receptor and thereby modulate TFH cell-mediated immune function. Agents for modulating selective TFH receptors may be formulated and administered to patients as described above.
In one embodiment, the invention provides a method of decreasing a pathogenic antibody response in a patient in need thereof comprising administering to the patient a first agent capable of modulating a selective TFR receptor in an amount effective to increase TFR cell-mediated antibody suppression in the patient, in combination with an second agent capable of modulating a selective TFH receptor in an amount effective to decrease TFH cell-mediated antibody production, wherein the pathogenic antibody response is decreased as compared to the pathogenic antibody response in the absence of the first or second agents.
In one embodiment, the invention provides a method of increasing a protective antibody response in a patient in need thereof comprising administering to the patient a first agent capable of modulating a selective TFR receptor in an amount effective to decrease TFR cell-mediated antibody suppression in the patient, in combination with a second agent capable of modulating a selective TFH receptor in an amount effective to increase TFH cell-mediated antibody production, wherein the protective antibody response is increased as compared to the protective antibody response in the absence of the first or second agents.
VIII. Modulation of TFR and TFH Cell-Mediated Immune Responses Via PD-1 Receptors
The inventors' discovery that PD-1:PD-L1 interactions limit TFR cell differentiation and function has also elucidated another novel approach to modulating both TFR cell-mediated and TFH cell-mediated immune responses in a patient.
Therefore, in one embodiment the invention provides a method of decreasing a pathogenic antibody response in a patient in need thereof comprising administering to the patient, an agent which modulates the PD-1 receptor on a TFR cell. In one embodiment, the agent is an antagonist of the PD-1 receptor on a TFR cell. In one embodiment, the agent is an antibody capable of blocking the PD-1 receptor on a TFR cell. In one embodiment, the agent is an antibody capable of binding to a ligand selected from PD-L1 or PD-L2 and preventing the ligand from binding to the PD-1 receptor. The agent may also be a small molecule, or a DNA or RNA molecule (e.g., dsRNA, or antisense molecule) capable of antagonizing or agonizing the receptor.
In one embodiment a disease or condition wherein suppression of a pathogenic antibody response is therapeutic includes those diseases listed previously in which antibodies contribute to, or are primarily responsible for pathogenesis.
In another embodiment, the invention provides a method of increasing a protective antibody response in a patient in need thereof comprising administering to the patient, an agent which modulates the PD-1 receptor on a TFH cell. In one embodiment the agent is an agonist of the PD-1 receptor on a TFH cell. The agent may also be a small molecule, or a DNA or RNA molecule (e.g. dsRNA, or antisense molecule) capable of agonizing the PD-1 receptor.
In one embodiment, the invention provides a method of decreasing a pathogenic antibody response in a patient in need thereof comprising administering to the patient a first agent capable of modulating a PD-1 receptor on a TFR cell in an amount effective to increase TFR cell-mediated antibody suppression in the patient, in combination with an second agent capable of modulating a PD-1 receptor on a TFH cell in an amount effective to decrease TFH cell-mediated antibody production, wherein the pathogenic antibody response is decreased as compared to the pathogenic antibody response in the absence of the first or second agents.
In one embodiment, the invention provides a method of increasing a protective antibody response in a patient in need thereof comprising administering to the patient a first agent capable of modulating a PD-1 receptor on a TFR cell in an amount effective to decrease TFR cell-mediated antibody suppression in the patient, in combination with a second agent capable of modulating a PD-1 receptor on a TFH receptor in an amount effective to increase TFH cell-mediated antibody production, wherein the protective antibody response is increased as compared to the protective antibody response in the absence of the first or second agents.
In addition to the known agonists and antagonists of the PD1 receptor generally, other agents may be tested for their ability to antagonize or agonize PD-1 on TFH and TFR cells using known assays and screens. Assays and screens for testing various agents for their ability to agonize or antagonize PD-1 receptors are previously described. Animal models may be used to test modulation of selective TFH receptors as described above.
The present invention further provides agents identified in the assays described herein wherein such agents are capable of antagonizing or agonizing PD-1 receptors and thereby modulate TFR or TFH cell-mediated immune function or both.
Agents for modulating PD-1 receptors on TFR or TFH cells may be formulated and administered to patients as described above.
IX. EXAMPLES
Example 1 Introduction
Follicular helper T cells (TFH) are a recently defined subset of CD4 T cells that are essential for helping cognate B cells form and maintain the germinal center (GC) reaction, and for development of humoral immune responses. These cells are universally defined by expression of the chemokine receptor CXCR5, which directs them to the B cell follicles via gradients of the chemokine CXCL13.sup.1. TFH cells also express the transcription factor Bcl6 (which represses Blimp-1/Prdm1) and high levels of the costimulatory receptor ICOS, which are both critical for their differentiation and maintenance.sup.1-4. In addition, TFH cells secrete large amounts of IL-21, which aids in GC formation, isotype switching and plasma cell formation.sup.5. In humans and mice functionally similar TFH cells can be found in secondary lymphoid organs. Significantly, CXCR5.sup.+ TFH cells are also present in peripheral blood and seen at elevated levels in individuals with autoantibodies, including systemic lupus erythematosis, myasthenia gravis and juvenile dermatomyositis patients. However, the function of these circulating TFH remains unclear.sup.6-9.
TFH cells also express high levels of programmed death (PD) 1 receptor (CD279). Signaling through PD-1 attenuates TCR signals and inhibits T cell expansion, cytokine production and cytolytic function. In addition, PD-1 promotes the development of induced regulatory T (iTreg) cells from naive lymphocytes.sup.10-14. PD-1 has two ligands, PD-L1 (B7-H1) and PD-L2 (B7-DC). PD-L1 is more widely expressed than PD-L2, but PD-L1 and PD-L2 both can be expressed on GC B cells and dendritic cells.sup.15. Perturbation studies suggest critical roles for this pathway in regulating humoral immune responses. However, there are conflicting reports as to the function of the PD-1 pathway in controlling humoral immunity. Some studies have found that humoral responses are attenuated.sup.16-18, while others have seen that humoral responses are heightened.sup.19, 20 when PD-1:PD-L interactions are prevented.
PD-1 also is found on a newly defined subset of CD4.sup.+CXCR5.sup.+ cells called T follicular regulatory (TFR) cells, which are positive for the transcription factors FoxP3, Bcl6 and Prdm1/Blimp1 and function to inhibit the germinal center response.sup.21-23. These cells originate from natural regulatory T cell precursors, but express similar levels of ICOS, CXCR5 and PD-1 as TFH cells. Since ICOS, CXCR5 and PD-1 have been widely used to identify and purify `TFH cells`, it seems likely that the inability to define clear functions for PD-1 in GC responses derives from experimental systems containing mixtures of stimulatory TFH cells and inhibitory TFR cells. We provide a separate analyses of the function of PD-1 on TFH and TFR cells to elucidate how PD-1 controls humoral immunity and to gain insight into the individual roles of TFR cells and TFH cells in regulating antibody production.
Here we demonstrate that PD-1:PD-L1 interactions inhibit TFR, but not TFH, cell numbers in lymph nodes. PD-1 deficient mice have increased numbers of lymph node TFR cells compared to wild type mice. PD-1 deficient lymph node TFR cells have enhanced ability to suppress activation of naive T cells, as well as antibody production in vitro. In addition, we show for the first time that TFR cells are present in the peripheral blood of mice, and that these circulating cells can potently regulate humoral immune responses in vivo. Using transfer approaches, we demonstrate that blood TFH cells can promote antibody production, while blood TFR cells can strongly inhibit antibody production in vivo. We further show that the PD-1 pathway inhibits blood TFR cell function and PD-1 deficient blood TFR cells have enhanced suppressive capacity in vivo. Taken together, our studies reveal a new immunoregulatory role for the PD-1:PD-L1 pathway in limiting TFR cell differentiation and function, and further demonstrate the dynamic control of humoral immune responses by migration of TFR cells from the circulation into lymph nodes to control antibody production in vivo.
Methods
Mice.
6-10 week old mice were used for all experiments. WT C57BL/6 and TCR.alpha..sup.-/- mice were purchased from The Jackson Laboratory (Bar Harbor, Me.). PD-1.sup.-/-, PD-L1.sup.-/-, and PD-L2.sup.-/- mice on the C57BL/6 background were generated in our laboratory.sup.32-34. ICOS.sup.-/- 35 and CD28.sup.-/- mice.sup.36 were generated as described. 2D2 TCR Tg mice Foxp3-IRES-GFP knockin mice (Foxp3.GFP;.sup.37 were generated in our laboratory by crossing 2D2 TCR Tg mice.sup.38 with Foxp3.GFP reporter mice. All mice were used according to the Harvard Medical School Standing Committee on Animals and National Institutes of Animal Healthcare Guidelines. Animal protocols were approved by the Harvard Medical School Standing Committee on Animals.
Immunizations.
For MOG 35-55 immunizations (referred to as "MOG/CFA"), mice were injected subcutaneously with 100 .mu.g of MOG 35-55 (UCLA Biopolymers Facility) emulsified in a 1:1 emulsion of H37RA CFA (Sigma) on the mouse flanks. Seven days later mice were euthanized and inguinal lymph nodes (dLN) and/or spleen were harvested for flow cytometric analyses. Blood was collected via cardiac puncture with a 1 cc syringe and immune cells were isolated by sucrose density centrifugation using Lymphocyte Separation Media (LSM). For NP-OVA immunizations, 100 .mu.g NP.sub.18-OVA (Biosearch Technologies) was used in a 1:1 H37RA CFA emulsion and injected similarly as MOG/CFA.
ELISA.
For in vitro quantitation of antibody production, supernatants were taken from cultures and total IgG was quantified using pan-IgG capture antibody (Southern Biotech) and alkaline phosphatase conjugated pan-IgG detection antibody (Southern Biotech). To assess in vivo antibody production, sera were collected from mice at indicated time points. NP-specific antibody titers were measured by coating ELISA plates with NP.sub.16-BSA (Biosearch Technologies), and incubating serum for 1 hr followed by alkaline phosphatase-conjugated IgG detection antibodies. A standard curve was generated using antibody from an NP-specific IgG1 hybridoma (a kind gift of Dr. Michael Carroll). This standard curve was used to approximate all IgG subtype antibody levels in the linear range of detection using a Spectramax Elisa plate reader (Molecular Devices).
Flow Cytometry.
Cells from lymphoid organs were isolated and resuspended in staining buffer (PBS containing 1% fetal calf serum and 2 mM EDTA) and stained with directly labeled antibodies from Biolegend against CD4 (RM4-5), ICOS (15F9), CD19 (6D5), PD-1 (RMP1-30), PD-L1 (10F.9G2), CD69 (H1.2F3), from eBioscience against FoxP3 (FJK-165), Bcl6 (mGI191E), and from BD bioscience against FAS (Jo2), GL7, Ki67 (B56). For CXCR5 staining, biotinylated anti-CXCR5 (2G8, BD Biosciences) was used followed by streptavidin-brilliant violet 421 (Biolegend). For intracellular staining, the FoxP3 fix/perm kit was used (eBioscience) after surface staining was accomplished. All flow cytometry was analyzed with an LSR II (BD biosciences) using standard filter sets.
Confocal Microscopy.
Draining lymph nodes were embedded in OCT and 8 .mu.m sections were cut, fixed with 4% paraformaldehyde, and stained before imaging on a Zeiss LSM 510 confocal microscope by acquiring z-stacks of 0.5 um with a 40.times. oil objective. Germinal center quantitation was calculated by drawing outlines around GL7.sup.+ IgD.sup.- areas present within the B cell zone. FoxP3 quantitation was performed by determining germinal center zones and scrolling through z-stack images to identify large FoxP3 positive spots. Axiovision (Zeiss) software was used to measure distances from germinal center borders. For micrograph panels, single z slices were linearly contrasted and merged images were made in Adobe photoshop.
Quantitative PCR.
Q-PCR was performed using standard TaqMAN probes (Applied Biosystems) and an ABI FAST9500 QPCR machine according to the manufacturer's instructions. mRNA levels were normalized to HPRT or .beta.2M, and the 2.sup.-deltadeltaCT method was used to quantitate mRNA. Each bar graph represents mean values from more than three individual experiments consisting of cells sorted from 5-10 pooled mice.
In Vitro Suppression Assay.
Cell populations were sorted to 99% purity on an Aria II flow cytometer. For TFR suppression assays, sorted cells were counted on an Accuri cytometer (BD biosciences) by gating live cells only, and 1.times.10.sup.5 GL7.sup.- B cells from dLNs of WT mice immunized with MOG/CFA 7 days previously, 1.times.10.sup.5 CFSE labeled CD4.sup.+CD62L.sup.+FoxP3.sup.- T responder cells from unimmunized WT FoxP3 GFP reporter mice, and 1.times.10.sup.5 TFR cells from the draining dLN of 10 pooled mice immunized with MOG/CFA 7 days previously were plated with 2 .mu.g/ml soluble anti-CD3 (2C11, BioXcell) and 5 .mu.g/ml anti-IgM (Jackson Immunoresearch). After 3 days, cells were harvested and stained for CD4 and CD19. T cell responders were identified as CFSE positive, and percent divided was gated as the percent of cells with CFSE diluted compared to unstimulated T responders.
Adoptive Transfers.
For blood TFH/TFR adoptive transfers, 20 to 30 WT mice were immunized with NP-OVA subcutaneously as described above, and 8 days later blood was collected by cardiac puncture. TFH and TFR cells were sorted as described. 4.times.10.sup.4 blood TFH cells alone or together with 2.times.10.sup.4 blood TFR cells were transferred into CD28.sup.-/- or TCR.alpha..sup.-/- mice unless specified otherwise. These recipient mice were immunized with NP-OVA as described above. Serum and organs were harvested at indicated times and analyzed by ELISA or flow cytometry.
Statistical Analysis.
Unpaired Student's t test was used for all comparisons, data represented as mean+/-SD or SE are shown. P values <0.05 were considered statistically significant. * P<0.05, ** P<0.005, *** P<0.0005.
Results
PD-1 Controls T Follicular Regulatory Cells
To analyze the role of PD-1 in controlling T follicular regulatory (TFR) cells, we first compared PD-1 expression on CD4 T cell subsets in draining lymph nodes (dLN) of WT C57BL/6 mice subcutaneously immunized with myelin oligodendrocyte glycoprotein (MOG) peptide 35-55 emulsified in CFA (from herein simply referred to as "MOG/CFA"), an immunization that breaks tolerance and also results in effective TFH cell generation.sup.24. TFR cells were defined as CD4.sup.+ICOS.sup.+CXCR5.sup.+FoxP3.sup.+CD19.sup.-, a gating strategy that separates TFR cells from CD4.sup.+ICOS.sup.+CXCR5.sup.+FoxP3.sup.-CD19.sup.- TFH cells, the cell type that was until recently thought to solely comprise the CD4.sup.+CXCR5.sup.+gate (FIG. 1A). TFH cells showed higher expression of PD-1 compared to ICOS.sup.+CXCR5.sup.- effector-like cells and ICOS.sup.-CXCR5.sup.- naive (referred to as naive) cells in the draining lymph node on day 7 after immunization. Strikingly, TFR cells had even higher PD-1 expression when compared to the other CD4 T cell subsets examined, including TFH cells (FIG. 1B).
To determine the functional significance of PD-1 expression on TFR cells, we immunized WT and PD-1.sup.-/- mice and analyzed TFR cells 7 days later. The percentage of TFR cells contained within the CD4.sup.+FoxP3.sup.+ gate was about 4 percent in WT lymph nodes and less than 1 percent of all CD4 T cells. In marked contrast, the percentage of TFR cells in PD-1.sup.-/- mice was about 10 percent of the CD4.sup.+FoxP3.sup.+ gate and greater than 2 percent of all CD4 T cells (FIGS. 1C-D). Because total numbers of CD4 T cells are typically about two fold higher in the lymph nodes of PD-1 deficient animals, a two-fold increase in TFR cell frequency translates into a .about.4-fold increase in absolute numbers of TFR cells (data not shown). When expressed as a percentage of all CD4.sup.+ICOS.sup.+CXCR5.sup.+ cells (and therefore the percentage of CD4 T cells that respond to CXCL13 and migrate to the B cell zone), PD-1.sup.-/- TFR cells comprised half of this population, whereas WT TFR cells comprised only about 20 percent (FIG. 1D). The dramatic increase in the percentage of TFR cells in PD-1.sup.-/- mice also was observed when other classical B cell antigens, such as 4-hydroxy-3-nitrophenylacetyl hapten conjugated to ovalbumin (NP-OVA), were used (FIG. 10A-10E). We did not find a significant difference in the percentage of FoxP3.sup.- TFH (from hereon called "TFH") cells when expressed as a percentage of all CD4 T cells in WT and PD-1.sup.-/- mice on day 7 post immunization (FIG. 1E).
Since PD-1 can be expressed by a number of hematopoietic cell types including T cells, B cells, macrophages and some dendritic cells.sup.15, we next investigated whether PD-1 regulates TFR cells directly by controlling their generation from FoxP3.sup.+ T regulatory cells (Treg). To track the fate of FoxP3.sup.+ cells following transfer into WT mouse recipients, we used antigen-specific FoxP3.sup.+ T cells from TCR transgenic mice for these studies. We sorted FoxP3.sup.+ Tregs from WT or PD-1.sup.-/- 2D2 (MOGspecific) TCR transgenic FoxP3 GFP reporter mice and transferred 2.times.10.sup.5 2D2 WT or PD-1.sup.-/- CD4.sup.+CXCR5.sup.-FoxP3.sup.+ cells into WT recipient mice. We immunized these recipients with MOG/CFA and analyzed cells in the draining lymph node seven days later (FIG. 1F). There were a greater percentage (FIG. 1H) and absolute number (FIG. 1I) of 2D2 PD-1.sup.-/- Tregs upregulating CXCR5 and thus differentiating into TFR cells, compared to 2D2 WT Tregs. The increased percentage of PD-1.sup.-/- TFR cells in the immunized transfer recipients was similar, but less pronounced, than the increased percentage in TFR cells seen in immunized intact PD-1 deficient mice (FIG. 1D, H). These results demonstrate that PD-1 controls differentiation of FoxP3.sup.+ Tregs into TFR cells.
Since CD25 (the alpha chain of the IL-2 receptor) is frequently used as a marker for Tregs, we next compared CD25 expression on WT and PD-1.sup.-/- TFR cells directly ex vivo (FIG. 2A). PD-1.sup.-/- TFR cells expressed less CD25 than WT TFR cells (FIG. 2B). The attenuated CD25 expression in PD-1 deficient TFR cells is not likely due to decreased activation because the expression of the early activation marker CD69 was virtually identical on WT and PD-1.sup.-/- TFR cells (FIG. 2C). To compare the proportion of WT and PD-1.sup.-/- TFR cells proliferating at day 7 post immunization, we examined Ki67 expression, a marker widely used to identify cells that are actively dividing. WT ICOS.sup.+ CXCR5.sup.- effectors, TFH and TFR gated cells had high expression of Ki67. In contrast, the WT CXCR5.sup.-ICOS.sup.- "naive" cells, lacking CD69 and CD25 expression, had no Ki67 staining consistent with their designation as naive (FIG. 2D). WT TFR cells expressed significantly higher levels of Ki67 compared to PD-1.sup.-/- TFR cells, suggesting that the increased numbers of TFR cells in PD-1 deficient animals reflect increased differentiation, and not maintenance, of TFR cells. Ki67 expression was similarly greater in WT ICOS.sup.+ effectors and TFH cells compared to PD-1.sup.-/- ICOS.sup.+CXCR5.sup.- effectors and TFH cells. These points to an overall decrease in cell cycling in PD-1.sup.-/- effector cells at 7 days after immunization. Other Treg markers such as CD103 and GITR were not altered on TFR cells in PD-1 deficient mice (FIG. 11A-11C). Additionally, there was low, but significant expression of PD-L1 on WT and PD-1.sup.-/- TFR cells. Together, these data indicate that PD-1 is important in regulating numbers of TFR cells in vivo.
PD-1 Deficient TFR Cells are Capable of Homing to Germinal Centers
We next compared the capacity of TFR cells from WT and PD-1 deficient animals to enter the germinal center (GC) in order to inhibit the GC response. First, we evaluated GC formation in lymph node sections harvested 7 days after MOG/CFA immunization. GCs were identified by the presence of PNA/GL7 positively stained and IgD negatively stained B cell zones (FIG. 3A). These GCs were determined to be active, based on robust expression of the cell cycle marker Ki67 (FIG. 3B). Similar to previous reports.sup.21, 22, CD4.sup.+FoxP3.sup.+ TFR cells could be found within GCs of immunized mice (FIG. 3C). The FoxP3 protein within the TFR cells was judged to be largely nuclear based on its co-localization with the DAPI staining (FIG. 3D).
We then investigated whether the phenotypically distinct TFR cells from PD-1 deficient mice were able to migrate to GCs similarly to WT TFR cells, because PD-1 blockade can prolong the TCR stop signal and decrease T cell migration.sup.25. We immunized WT and PD-1 deficient mice with MOG/CFA and 7 days later analyzed lymph node sections for IgD, GL7 and FoxP3 expression (FIG. 3E). Although the average germinal center area (FIG. 3F) and numbers of germinal centers per lymph node (data not shown) were equivalent in WT and PD-1.sup.-/- mice, there were slightly more FoxP3.sup.+ cells (and therefore TFR cells) located within the GC borders in PD-1.sup.-/- mice as in WT mice (FIG. 3G). However, since this increase is proportional to the larger numbers of TFR cells in PD-1 deficient mice determined by flow cytometry, these data demonstrate that PD-1 deficient TFR cells are not defective in homing to GCs and can enter the GC similarly to WT TFR cells.
The relative location of FoxP3.sup.+ TFR cells within the GC did not differ significantly between WT and PD-1.sup.-/- TFR cells (FIG. 3H). In both WT and PD-1.sup.-/- mice the FoxP3.sup.+ cells tended to reside close to the GC border, with more than half of the FoxP3.sup.+ nuclei being positioned within 10 .mu.m of the border. Furthermore, when CXCR5 fluorescence was quantified by flow cytometry in TFR cells, there was similar CXCR5 expression on TFR cells in the WT and PD-1.sup.-/- mice, indicating similar potential for these cells to respond to chemokine cues to migrate to GCs (FIG. 3I). Taken together, these data indicate that TFR cells are increased in lymph nodes of immunized PD-1.sup.-/- mice, and these PD-1.sup.-/- TFR cells are capable of migrating into GCs to regulate B cell responses.
PD-1 Deficient TFR Cells More Potently Inhibit T Cell Activation
We next compared the function of TFR cells from WT and PD-1.sup.-/- mice. TFR cells express higher levels of GITR on the cell surface than do TFH cells, which allows for separation of the TFH and TFR cells in a similar manner to intracellular staining for FoxP3 (FIG. 4A). For functional studies, we sorted TFR cells from immunized mice by taking the lymph node CD4.sup.+ICOS.sup.+CXCR5.sup.+CD19.sup.-GITR.sup.+ population as TFR cells and the CD4.sup.+ICOS.sup.+CXCR5.sup.+CD19.sup.-GITR.sup.- population as TFH cells (FIG. 4B). Sorting in this fashion shows robust mRNA for FoxP3 in the GITR.sup.+ (TFR) population, but essentially no FoxP3 mRNA in the GITR.sup.- (TFH) population, validating the use of this gating strategy to isolate TFR and TFH cells for functional assays. Furthermore, this sorting strategy can be used to compare WT and PD-1 deficient TFR cells since GITR expression is identical on WT and PD-1 deficient TFR cells (FIG. 12).
TFR cells express high Blimp1/Prdm1 and moderate levels of Bcl6.sup.21. Bcl6 and Blimp1 reciprocally modulate each other.sup.2; Bcl6 inhibition of Blimp1 is essential for maintenance of the TFH phenotype, whereas Blimp1 is important in Treg homeostasis in general.sup.26, 27. Since relative expression of Bcl6 and Blimp1 determines function of TFH subsets, we compared Bcl6 expression in TFR cells from WT and PD-1.sup.-/- mice using flow cytometry to analyze intracellular Bcl6 expression at the protein level. Although TFR cells expressed less Bcl6 at the protein level than TFH cells, WT and PD-1.sup.-/- TFR had similar Bcl6 levels (FIG. 4C). We next compared the expression of Blimp1 (encoded by Prdm1) on TFR cells from WT and PD-1.sup.-/- mice. At the mRNA level, we did not find any consistent differences in Blimp1/Prdm1 expression between WT and PD-1.sup.-/- TFR cells (FIG. 4D). Since FoxP3 can directly interact with and negatively regulate the function of Ror.gamma.t.sup.28, we also examined Rorc (which encodes Ror.gamma.t) in WT and PD-1.sup.-/- TFR cells. Rorc mRNA levels were lower in TFR cells compared to TFH cells, but Rorc expression was increased in PD-1.sup.-/- TFR cells relative to WT TFR cells (FIG. 4E). In addition, we compared expression of the transcription factor IRF4 in WT and PD-1.sup.-/- TFR cells, since Blimp1 and IRF4 synergistically control the differentiation and effector functions of regulatory T cells.sup.26. We found an increase in IRF4 mRNA in PD-1.sup.-/- TFR cells compared to WT TFR cells (FIG. 4F).
IRF4 is essential for the suppressive capacity of regulatory T cells.sup.26. To determine if increased IRF4 mRNA in PD-1.sup.-/- TFR cells translates into an increase in suppression of naive T cell proliferation, we set up an in vitro suppression assay in which we cultured sorted WT GL7.sup.- B cells, CFSE labeled WT naive CD4.sup.+CD62L.sup.+FoxP3.sup.- responder T cells, and either WT or PD-1.sup.-/- TFR cells sorted from mice immunized with MOG/CFA together with anti-CD3 and anti-IgM (FIG. 4G). The responder T cells highly upregulated CD69 after 3 days of culture with WT B cells. However, when WT TFR cells were added in a 1:1:1 ratio, the CD69 expression on the responder T cells was much lower, consistent with the function of TFR cells in suppressing T cell activation (FIG. 4H). CD69 upregulation was inhibited to an even greater extent in responder T cells that were cultured with PD-1.sup.-/- TFR cells. Moreover, PD-1.sup.-/- TFR attenuated the proliferation of responder T cells (FIG. 4I), in contrast to WT TFR cells, which did not inhibit the proliferation of responder T cells during the day 3 culture period.
Although TFR cells are thought to inhibit the germinal response in vivo, it is unclear whether TFR cells directly inhibit T cell differentiation, TFH cell function, B cell activation or all three. To assess the capability of TFR cells to suppress B cell antibody production in vitro, we cultured WT GL7.sup.- B cells with WT FoxP3.sup.- TFH cells for 6 days in the presence or absence of TFR cells, anti-IgM and anti-CD3 (FIG. 4J). WT B cells produced large amounts of IgG when cultured with WT FoxP3.sup.- TFH cells plus anti-IgM and anti-CD3 (FIG. 4K). No significant IgG was present when CD4.sup.+FoxP3.sup.- naive T cells were used in these experiments (FIG. 4L). When TFR cells were added to the wells along with TFH cells, almost no IgG was produced. The TFR-mediated suppression was not due to sequestering of anti-CD3 because there was equally good suppression at the two doses of anti-CD3 tested (FIG. 4K), and the anti-CD3 could still be found on the surface of the TFH cells at the end of the suppression assay (FIG. 13A-FIG. 13B). PD-1.sup.-/- TFR cells suppressed IgG production more than WT TFR cells at both a 1:1 (FIG. 4L) and a 1:5 (FIG. 4M) TFR:TFH ratio, with PD-1 deficient TFR cells resulting in a 50% greater reduction in IgG production compared to WT TFR cells. Taken together, these data demonstrate not only that are there increased TFR cells in PD-1.sup.-/- mice, but that these PD-1.sup.-/- TFR cells have increased suppressive capacity.
PD-1 Controls Blood T Follicular Regulatory Cells
One possible explanation for the increase in TFR cells in lymph nodes of immunized PD-1 deficient mice is that PD-1.sup.-/- TFR cells are unable to exit the lymph node. Studies have demonstrated that functional TFH cells can be found in the blood of humans as well as mice.sup.6, 7, 9, but whether TFR cells circulate in the blood of humans or mice is not yet known. Strikingly, we found a significant population of TFH cells, as well as a smaller population of TFR cells, in the blood of WT mice immunized with MOG/CFA (FIGS. 5A-B). When we compared the kinetics of TFH and TFR cell expansion in the lymph node and blood of mice following MOG/CFA immunization, we found that both TFR and TFH cells increase in the draining lymph node of WT immunized mice over a 10 day period, and that TFH cells, but not TFR cells, increase substantially by percentage in the blood over this time (FIG. 5B). Thus, without antigenic stimulus, the blood TFR:TFH ratio is fairly high (sometimes greater than 1:1) but upon addition of a stimulus, blood TFH cells expand more than blood TFR cells so that the TFR:TFH ratio is about 1:5. To investigate whether WT blood TFH and TFR cells are quiescent or are actively in cell cycle, we compared Ki67 expression in draining lymph node and blood TFH and TFR cells 7 days after immunization. TFH cells from the draining lymph node had higher Ki67 expression than those found in the blood (FIG. 5C). Blood TFH and TFR and draining lymph node TFR cells expressed similar levels of Ki67.
Next we investigated whether TFR cells in the blood were inhibited to the same degree by PD-1 signaling as lymph node TFR cells. We immunized WT and PD-1.sup.-/- mice with MOG/CFA and 7 days later analyzed the blood for TFH and TFR cells. In WT mice .about.2-3 percent of CD4.sup.+FoxP3.sup.-CD19.sup.- cells in the blood were TFH cells, but in the PD-1.sup.-/- mice this increased to .about.4-5 percent (FIG. 5D). This increase in PD-1.sup.-/- TFH cells in blood markedly contrasts with the lymph node, where PD-1.sup.-/- mice have similar, if not less, TFH cells compared to WT mice (FIG. 1E). Importantly, TFR cells comprised .about.3 percent of all FoxP3 positive cells in the blood of WT mice, but more than 7 percent of FoxP3 positive cells in the blood of FD-1.sup.-/- mice (FIGS. 5D-E). The increase in FoxP3.sup.+ cells seems to be specific to the blood TFR subset, as the percentage of FoxP3.sup.+ cells in the ICOS.sup.+CXCR5.sup.- (ICOS.sup.+) and ICOS.sup.-CXCR5.sup.- naive cell gates were not increased in PD-1.sup.-/- mice (FIG. 5F). Taken together, these data indicate that both TFR and TFH cells are present in the blood of mice, and both subsets are repressed by PD-1 signals.
To investigate whether blood TFH and TFR cells have a central memory phenotype, we analyzed surface expression of CD62L and CD44. About 60% of WT and PD-1.sup.-/- blood TFR cells had high expression of CD62L (FIG. 14A). This contrasts with the greater than 90% of ICOS.sup.-CXCR5.sup.- naive cells that had high CD62L expression. PD-1.sup.-/- TFH cells had lower CD62L compared to WT TFH cells. CD44 was highly expressed on all WT and PD-1.sup.-/- blood TFR cells, but PD-1.sup.-/- blood TFR cells had slightly lower surface expression (FIG. 14B). Furthermore, PD-1 was expressed at lower levels on blood TFR cells than lymph node TFR cells (FIG. 14C). Taken together, these data indicate that blood TFR cells can have a central memory homing phenotype.
The increase in TFR cells in FD-1.sup.-/- mice led us to investigate which PD-1 ligand is critical for controlling lymph node and blood TFR generation. We first compared PD-L1 and PD-L2 expression on B cells and DCs present in dLNs of immunized WT mice because both B cells and dendritic cells (DCs) contribute to proper TFH differentiation and maintenance in the lymph node.sup.1. It is not yet clear whether B cells, DC or both are needed for TFR differentiation and/or maintenance. To study GC B cells, we immunized mice with NP-OVA subcutaneously and 12 days later compared PD-L1 and PD-L2 expression on FAS.sup.+GL7.sup.+CD19.sup.+ GC B cells, as well as CD138.sup.+ positive plasma cells (PC) from the dLN. We found that all B cell subsets expressed high levels of PD-L1, but only GC B cells expressed high levels of PD-L2 (FIG. 6A). To quantify PD-L1 and PD-L2 expression on DCs, we immunized mice with NP-OVA and analyzed DC populations from the draining lymph node 3 days later. Both CD8.alpha..sup.+ and CD8.alpha..sup.-DC populations expressed high levels of PD-L1 and moderate levels of PD-L2 (FIG. 6B). A subpopulation of CD8.alpha..sup.- DCs expressed high levels of PD-L2.
To determine which ligand is important for TFH and TFR generation, we immunized WT, PD-L1.sup.-/- and PD-L2.sup.-/- mice with MOG/CFA, and analyzed TFH and TFR cells 7 days post-immunization in the draining lymph node and blood. The percentages of lymph node TFH cells in PD-L1.sup.-/- and PD-L2.sup.-/- mice were comparable to WT mice (FIG. 6C) and PD-1.sup.-/- mice (FIG. 1E). PD-L1.sup.-/-, but not PD-L2.sup.-/- mice, had greater blood TFH cell numbers, which was similar to PD-1.sup.-/- mice (FIG. 5E). TFR cells, however, were increased in the lymph nodes as well as the blood of PD-L1.sup.-/-, but not PD-L2.sup.-/- mice (FIG. 6D). Similar to PD-1.sup.-/- mice, PD-L1.sup.-/- mice did not exhibit any increases in non-TFR FoxP3.sup.+ effector cells within the blood (FIG. 6E). These studies demonstrate that PD-L1, but not PD-L2, is responsible for controlling lymph node and blood TFR cells.
Blood TFH and TFR Cells Require CD28 and ICOS Signals
We further investigated the costimulatory requirements for blood TFR cells, focusing on the effects of CD28 and ICOS costimulation on CD4.sup.+ICOS.sup.+CXCR5.sup.+FoxP3.sup.+CD19.sup.- TFR populations in the blood due to the important roles of these costimulatory receptors in controlling lymph node TFH and TFR cells. CD28.sup.-/- mice are deficient in lymph node TFH and TFR cells.sup.21. ICOS.sup.-/- mice are deficient in lymph node TFH cells.sup.24. We analyzed CD28 and ICOS deficient animals for the presence of TFR cells in the lymph nodes and blood 7 days after immunization with MOG/CFA. In WT mice, there were fewer TFH and TFR cells in the blood compared to the draining lymph node (FIGS. 7A-B). Numbers of TFR (and TFH) cells were greatly attenuated in the blood, as well as lymph nodes, of ICOS deficient mice (FIGS. 7A-C). CD28 deficient mice had similar severe deficiencies in TFR and TFH cell percentages in both lymph nodes and blood (FIGS. 7E-F). Thus, ICOS and CD28 supply essential costimulatory signals for TFR and TFH cells in the blood as well as the lymph nodes.
PD-1 Deficient Blood TFR Cells More Potently Regulate Antibody Production In Vivo
We next investigated the function of blood TFR cells in humoral immune responses. Because TFH cells in human blood can function in B cell activation and antibody production in vitro.sup.6, 7, we analyzed whether circulating blood TFR cells contribute to suppression of antibody production in vivo. To assess this, we designed transfer experiments in which we immunized >20 WT donor mice with NP-OVA subcutaneously and 8 days later sorted TFR (CD4.sup.+ICOS.sup.+CXCR5.sup.+GITR.sup.+CD19.sup.-) and TFH (CD4.sup.+ICOS.sup.+CXCR5.sup.+GITR.sup.-CD19.sup.-) cells from the blood (FIG. 8A). We transferred these cells into CD28.sup.-/- or TCR.alpha..sup.-/- mice because they lack both blood and lymph node TFH and TFR cells. This approach enabled us to determine if blood TFR and TFH cells could regulate humoral responses. Since the transferred blood TFH and TFR cells are the only follicular T cells in CD28.sup.-/- and TCR.alpha..sup.-/- recipients, any responses in the draining lymph node would be due to trafficking of the blood TFR and TFH cells.
Initially, we adoptively transferred 4.times.10.sup.4 TFH cells alone or together with 2.times.10.sup.4 TFR cells into CD28.sup.-/- mice (approximately a two-fold higher ratio of TFR:TFH cells than is found in blood after immunization). We immunized recipients 1 day later with NP-OVA and analyzed NP-specific IgG titers 12 days after immunization (FIG. 8A). Without blood TFH or TFR cell transfer, CD28.sup.-/- mice were unable to produce significant amounts of NP-specific IgG (FIG. 8B). The transfer of blood TFH cells alone resulted in a substantial increase in NP-specific IgG titers. Transfer of blood TFH cells led to substantial production of IgG1, but also smaller increases in other isotypes (data not shown). Significantly, transfer of blood TFR cells along with blood TFH cells resulted in robust inhibition of NP-specific antibody production, demonstrating the potent regulatory capacity of blood TFR cells in suppressing antibody production (FIG. 8B). To evaluate the impact of TFR cells on plasma cell generation, draining lymph nodes, spleens and bone marrow were harvested 24 days after immunization and plasma cells were quantified. CD138.sup.+ plasma cells were absent from the lymph nodes of immunized CD28.sup.-/- mice (FIGS. 8C-D). Transfer of blood TFH cells resulted in a sizable population of plasma cells in the draining lymph node, spleen and bone marrow (FIGS. 8C-D). Blood TFR cells almost completely prevented plasma cell formation/survival in all organs tested.
Next we transferred blood TFH and/or TFR cells into TCR.alpha..sup.-/- recipients. Transfer of 4.times.10.sup.4 TFH cells resulted in high levels of NP-specific IgG and at a greater titer than an immunized WT mouse in most experiments (FIG. 8E). The robust antibody production elicited by blood TFH cells depends on the "follicular program" because transfer of total CD4 T cells from CXCR5.sup.-/- mice or CD4.sup.+CXCR5.sup.-FoxP3.sup.- naive cells resulted in near background levels of antibody production in these experiments (FIG. 8E). When blood TFR cells were transferred together with blood TFH cells, the NP-specific antibody titers were markedly reduced, demonstrating the suppressive capacity of these cells (FIG. 8E). The blood TFR cells resulted in both lower plasma cell percentages (FIG. 8F), as well as lower percentages of TFH cells within the lymph node (FIG. 8G). When we compared the functions of blood TFH cells and draining lymph node TFH cells following transfer into TCR.alpha..sup.-/- recipients, we found that blood TFH cells have an increased capacity to promote NP-specific IgG production (FIG. 8H). TFR suppression of TFH cells also depends on the "follicular program" in these cells because neither blood CD25.sup.+CD62L.sup.+ Tregs from CXCR5.sup.-/- mice (data not shown) nor blood CXCR5.sup.- FoxP3 GFP.sup.+ Tregs from FoxP3 reporter mice possess the same suppressive capacity as WT blood TFR cells (FIG. 8I).
Finally, we investigated the suppressive capacity of PD-1 deficient blood TFR cells in vivo since we have found that PD-1 deficient lymph node TFR cells more potently suppress antibody production in vitro. We adoptively transferred 4.times.10.sup.4 blood TFH cells alone or together with 1.5.times.10.sup.4 blood TFR cells from WT or PD-1 deficient mice into either CD28.sup.-/- or TCR.alpha..sup.-/- recipients and immunized as in FIG. 8A. PD-1 deficient TFR cells inhibited antibody production to a greater extent than WT TFR cells in CD28.sup.-/- (FIG. 8J) as well as TCR.alpha..sup.-/- (FIG. 8K) recipients, demonstrating that they have increased suppressive capacity. Together, these data show that blood TFR cells potently inhibit antibody production in vivo and PD-1 deficiency results in enhanced TFR cell suppressive capacity.
Discussion
A mechanistic understanding of TFR cell differentiation and function is provided to gain insight into how humoral immune responses are regulated by TFH and TFR cells. Although TFR cells originate from different precursors than TFH cells, TFR and TFH cells have nearly identical surface receptors. The shared expression of ICOS, CXCR5 and PD-1 by TFR and TFH cells means that functional studies of TFH cells have, in fact, examined mixtures of stimulatory TFH cells and inhibitory TFR cells. The PD-1 pathway regulates many effector arms of the immune response however biological complexity has led to inconsistencies regarding the role of this pathway in humoral immune responses.sup.16-20. In this Example 1, we identify a new mechanism by which PD-1 regulates humoral immunity: PD-1 controls the generation and function of suppressive TFR cells. We found that lack of PD-1, or its ligand PD-L1, resulted in greater numbers of TFR cells in the draining lymph node of immunized mice. These PD-1.sup.-/- lymph node TFR cells expressed more IRF4 and showed an enhanced ability to suppress antibody production. We also discovered that TFR cells are present in the blood of mice, and that PD-1 controls the numbers of blood TFR cells, as evidenced by the substantial increases in PD-1 deficient mice. Importantly, we demonstrated a functional role for blood TFH cells in promoting antibody production and blood TFR cells in suppressing antibody production in vivo. PD-1 deficient blood TFR cells more potently suppress antibody production compared to WT blood TFR cells. Thus, PD-1 limits the development and function of TFR cells in lymph nodes and in the circulation.
We have found that PD-1 signaling inhibits the numbers of TFR cells, but not TFH cells, in the lymph node, skewing the TFR to TFH ratio. It is possible that the greater suppressive capacity of PD-1.sup.-/- TFR cells, together with the increased ratio of TFR to TFH cells in PD-1.sup.-/- mice, results in inhibition of PD-1.sup.-/- TFH cells. Alternatively, there may be alterations in PD-1.sup.-/- TFH cells that promote their departure from the lymph node and homing to other sites to perform effector functions. These hypotheses are not mutually exclusive. Some studies have described increases in lymph node/spleen TFH cells in PD-1 deficient mice; however the contribution of TFR cells in these studies was not assessed.sup.16, 18, 19. It is likely that increased TFR cells in PD-1/PD-L1 knockout mice may have contributed to the increases in TFH cells observed in these studies, and may explain, at least in part, conflicting data regarding the role of PD-1 in regulating TFH cells and germinal center reactions. For example, Kawamoto et al. described increased CD4.sup.+CXCR5.sup.+ (TFH) cells in the Peyer's patches of PD-1 deficient mice. However, upon transfer, these cells were non-functional in supporting IgA production. Increases in TFR cells contained within the TFH gate in PD-1 deficient Peyer's patches may explain these data.
TFR cells depend on SAP, CD28 and Bcl6 for differentiation.sup.21, 22. However, the pathways that limit TFR cell differentiation are less clear. To date, only the transcription factor Blimp1 has been shown to inhibit TFR cell differentiation.sup.21. Here we identify PD-1 as the first surface receptor that inhibits TFR cell development and function. We also show that PD-1 predominantly interacts with PD-L1, and not PD-L2, to inhibit TFR generation. Our adoptive transfer studies demonstrate a cell intrinsic role for PD-1 in TFR cell differentiation from FoxP3.sup.+ Treg cells. Therefore, the increase in TFR cells in PD-1 deficient mice appears to reflect increased differentiation and not maintenance. We observed a general trend for a decrease in cell cycling of CD4 PD-1.sup.-/- effector cells, because ICOS.sup.+CXCR5.sup.+FoxP3.sup.- and ICOS.sup.+CXCR5.sup.- effector cells also had diminished Ki67 expression, at least at day 7 after immunization, which may temporally correspond to a maintenance phase. Based on these data, we believe that, rather than simply inhibiting responses, the PD-1:PD-L pathway can act as a molecular switch that controls cell fate decisions in naive CD4 T cells. Integration of signals through PD-1, the TCR and cytokine receptors may direct CD4 T cell subset differentiation. Likewise, PD-1 may limit differentiated effector T cell expansion, cytokine production and/or survival depending on how signals through the TCR, PD-1 and cytokine receptors are integrated. Thus, the PD-1 pathway can influence CD4 T cell lineage commitment in distinct ways, depending on molecular cues and the local environment. For instance, PD-L1 can promote induced Treg (iTreg) differentiation from naive T cell precursors.sup.10-14, 29. However, we find that PD-1 inhibits differentiation of TFR cells. TFR cells arise from natural T regulatory cell (nTreg) precursors (shown here and previously.sup.21). Therefore, our studies suggest that PD-1 may have distinct roles in iTreg and nTreg differentiation. In addition, genetic background may contribute to the effects of PD-1 deficiency.
Because of the recent discovery of TFR cells, there is a lack of fundamental knowledge about TFR cell biology, so we developed novel assays to analyze mechanisms by which PD-1 regulates TFR cell function. TFR cells have the potential to directly inhibit activation of naive T cells, TFH cell function, and/or B cell activation. TFR cells might regulate TFH or B cell responses either inside the B cell follicle and/or control activation and differentiation of T cells outside the B cell follicle. Here, we present the first specific assays for TFR cell function in vitro and show that sorted wild type TFR cells from the lymph node are extremely potent at inhibiting antibody production, but not very effective at suppressing activation of naive T cells. PD-1.sup.-/- TFR cells inhibit naive T cell activation and attenuate antibody production in vitro to a greater extent than WT TFR cells. Our studies also demonstrate the dynamic control of antibody production by lymph node TFH and TFR cells. Initially, our attempts to activate B cells in vitro with total CD4.sup.+CXCR5.sup.+ cells resulted in little IgG secretion. However, when we separated TFH cells from TFR cells and used these TFH cells in such experiments, we could detect robust IgG production. Of note, during an immune response to peptide/CFA, the in vivo dLN TFR:TFH ratio is .about.1:5. When we cultured TFR and TFH cells at this ratio, little antibody production was observed.
TFR cells tend to be present predominantly at the borders of germinal centers, which may be explained by their relatively lower expression of CXCR5 compared to TFH cells, though other chemokines also may have roles. It is possible that close proximity of TFR cells to germinal center borders enables them to interact with TFH cells as they enter. This could make TFR cells the "gate-keepers" of the germinal center, inhibiting TFH cells as they enter and gain access to B cells undergoing somatic hypermutation and class switch recombination. Furthermore, our studies suggest that the balance between TFR and TFH cells within the germinal center itself may modulate the type and extent of humoral responses. The relative roles of TFR and TFH cells also may depend on the source or strength of antigenic stimulus, cytokine milieu, and tissue microenvironment, and further work is needed to investigate these issues.
Surprisingly, we found substantial populations of TFR cells in the blood of mice. There are a number of reports describing TFH cells in the circulation of humans.sup.6, 7 and one in mice.sup.9. To our knowledge, our work is the first description of TFR cells in the blood of any organism. In humans, blood TFH cells have been shown to provide B cell help for the production of antibody in vitro. Some studies show more efficient B cell antibody production by blood TFH cells compared to blood CXCR5.sup.- cells.sup.6, 7 whereas other studies find no differences between blood TFH and CXCR5.sup.- cells.sup.30. Differences might relate to mixtures of blood TFH and TFR cells and their relative ratios in these experiments. Since most work describing blood TFH cells was done in humans, little is known about the requirements for blood TFH differentiation and function. Here we show that murine blood TFH and TFR cell generation requires signals through ICOS and CD28, two costimulatory receptors essential for controlling TFH cells in the lymph node. Previous work showed that CD28 is essential for TFR cells in lymph nodes.sup.21. Here we demonstrate lymph node TFR cell generation also requires ICOS signaling.
Our transfer studies show that blood TFR cells are functional and can regulate antibody production in vivo. To study TFH and TFR function, we transferred blood TFH cells alone or with TFR cells into CD28.sup.-/- or TCR.alpha..sup.-/- mice, which lack both blood and lymph node TFH and TFR cells. This approach allowed us to analyze TFH and TFR cell function separately from differentiation. Our transfer studies demonstrate effective and specific control of humoral responses by blood TFH and TFR cells. Blood TFR cells are extremely potent at inhibiting TFH cell mediated antibody production, even when relatively few cells are transferred. We hypothesize that blood TFR cells may represent a central memory pool that can be utilized to modulate humoral immunity, analogous to recently reported FoxP3.sup.+ cells with regulatory memory to self-antigens.sup.31 and similar to a proposed role for blood TFH cells.sup.7. High expression of CD62L and CD44 on blood TFR cells along with their ability to home back to lymph nodes strongly support this idea. Blood TFH cells may migrate to lymph nodes and interact with cognate B cells rapidly upon antigen exposure, whereas naive T cells need at least two to four days to differentiate and upregulate CXCR5. Additionally, blood TFR cells homing to lymph nodes would be able to suppress early B cell responses, before dLN nTregs could fully differentiate into TFR cells.
Beyond their ability to directly suppress antibody responses, TFR cells may be instrumental in determining B cell fates and control whether an immune response generates long-lived plasma cells or memory B cells. For example, cytokines produced by TFR cells may direct GC B cell differentiation into plasma cells versus memory B cells. PD-1 and PD-1 ligand deficiency result in decreased numbers of long-lived plasma cells.sup.16, and further work is needed to determine if this is related to the enhanced PD-1.sup.-/- TFR cell numbers and suppressive capacity. If TFR cells can direct B cell fates, this would have implications for rational design of vaccines. We have also identified some of the potential relative roles of TFH and TFR cells in autoimmunity. For example, PD-1 deficiency on autoimmune-prone backgrounds accelerates disease pathologies. It is possible that autoimmune-prone backgrounds may lead to inhibition of TFR differentiation and function. This information will be important for therapeutic strategies using TFR cells. By expanding either TFH or TFR cells from patient blood in vitro, it may be possible to enhance antibody responses by transferring TFH cells or to inhibit systemic autoimmunity by transferring TFR cells.
In summary, we define a new role for PD-1 in regulating immune responses, by inhibiting differentiation and function of T follicular regulatory cells in both lymph node and blood. Our research has provided a better understanding of TFR and TFH interactions, and has the potential to provide novel insights into mechanisms that regulate humoral immunity and applications of those mechanisms in, for example, a vaccination regimen. Our understanding of how PD-1 regulates humoral immunity suggests suggest strategies for manipulating this pathway to enhance protective immunity and long-term memory or to inhibit systemic autoimmunity.
REFERENCES
1. Crotty, S. Follicular helper CD4 T cells (TFH). Annu Rev Immunol 29, 621-663 (2011). 2. Johnston, R. J. et al. Bcl6 and Blimp-1 are reciprocal and antagonistic regulators of T follicular helper cell differentiation. Science 325, 1006-1010 (2009). 3. Nurieva, R. I. et al. Bcl6 mediates the development of T follicular helper cells. Science 325, 1001-1005 (2009). 4. Choi, Y. S. et al. ICOS receptor instructs T follicular helper cell versus effector cell differentiation via induction of the transcriptional repressor Bcl6. Immunity 34, 932-946 (2011). 5. Nurieva, R. I. et al. Generation of T follicular helper cells is mediated by interleukin-21 but independent of T helper 1, 2, or 17 cell lineages. Immunity 29, 138-149 (2008). 6. Morita, R. et al. Human blood CXCR5(+)CD4(+) T cells are counterparts of T follicular cells and contain specific subsets that differentially support antibody secretion. Immunity 34, 108-121 (2011). 7. Schaerli, P. et al. CXC chemokine receptor 5 expression defines follicular homing T cells with B cell helper function. J Exp Med 192, 1553-1562 (2000). 8. Saito, R. et al. Altered expression of chemokine receptor CXCR5 on T cells of myasthenia gravis patients. Journal of neuroimmunology 170, 172-178 (2005). 9. Simpson, N. et al. Expansion of circulating T cells resembling follicular helper T cells is a fixed phenotype that identifies a subset of severe systemic lupus erythematosus. Arthritis and rheumatism 62, 234-244 (2010). 10. Polanczyk, M. J., Hopke, C., Vandenbark, A. A. & Offner, H. Treg suppressive activity involves estrogen-dependent expression of programmed death-1 (PD-1). Int Immunol 19, 337-343 (2007). 11. Wang, L. et al. Programmed death 1 ligand signaling regulates the generation of adaptive Foxp3+CD4+ regulatory T cells. Proc Natl Acad Sci USA 105, 9331-9336 (2008). 12. Francisco, L. M. et al. PD-L1 regulates the development, maintenance, and function of induced regulatory T cells. J Exp Med 206, 3015-3029 (2009). 13. Wang, C., Li, Y., Proctor, T. M., Vandenbark, A. A. & Offner, H. Downmodulation of programmed death 1 alters regulatory T cells and promotes experimental autoimmune encephalomyelitis. Journal of neuroscience research 88, 7-15 (2010). 14. Amarnath, S. et al. The PDL1-PD1 axis converts human TH1 cells into regulatory T cells. Science translational medicine 3, 111ra120 (2011). 15. Francisco, L. M., Sage, P. T. & Sharpe, A. H. The PD-1 pathway in tolerance and autoimmunity. Immunol Rev 236, 219-242 (2009). 16. Good-Jacobson, K. L. et al. PD-1 regulates germinal center B cell survival and the formation and affinity of long-lived plasma cells. Nature immunology 11, 535-542 (2010). 17. Hamel, K. M. et al. B7-H1 expression on non-B and non-T cells promotes distinct effects on T- and B-cell responses in autoimmune arthritis. Eur J Immunol 40, 3117-3127 (2010). 18. Kawamoto, S. et al. The inhibitory receptor PD-1 regulates IgA selection and bacterial composition in the gut. Science 336, 485-489 (2012). 19. Hams, E. et al. Blockade of B7-H1 (programmed death ligand 1) enhances humoral immunity by positively regulating the generation of T follicular helper cells. J Immunol 186, 5648-5655 (2011). 20. Velu, V. et al. Enhancing SIV-specific immunity in vivo by PD-1 blockade. Nature 458, 206-210 (2009). 21. Linterman, M. A. et al. Foxp3+ follicular regulatory T cells control the germinal center response. Nat Med 17, 975-982 (2011). 22. Chung, Y. et al. Follicular regulatory T cells expressing Foxp3 and Bcl-6 suppress germinal center reactions. Nat Med 17, 983-988 (2011). 23. Wollenberg, I. et al. Regulation of the germinal center reaction by Foxp3+ follicular regulatory T cells. J Immunol 187, 4553-4560 (2011). 24. Bauquet, A. T. et al. The costimulatory molecule ICOS regulates the expression of c-Maf and IL-21 in the development of follicular T helper cells and TH-17 cells. Nature immunology 10, 167-175 (2009). 25. Fife, B. T. et al. Interactions between PD-1 and PD-L1 promote tolerance by blocking the TCR-induced stop signal. Nature immunology 10, 1185-1192 (2009). 26. Cretney, E. et al. The transcription factors Blimp-1 and IRF4 jointly control the differentiation and function of effector regulatory T cells. Nature immunology 12, 304-311 (2011). 27. Martins, G. A. et al. Transcriptional repressor Blimp-1 regulates T cell homeostasis and function. Nature immunology 7, 457-465 (2006). 28. Zhou, L. et al. TGF-beta-induced Foxp3 inhibits T(H)17 cell differentiation by antagonizing RORgammat function. Nature 453, 236-240 (2008). 29. Beswick, E. J., Pinchuk, I. V., Das, S., Powell, D. W. & Reyes, V. E. Expression of the programmed death ligand 1, B7-H1, on gastric epithelial cells after Helicobacter pylori exposure promotes development of CD4+ CD25+ FoxP3+ regulatory T cells. Infect Immun 75, 4334-4341 (2007). 30. Kim, C. H. et al. Subspecialization of CXCR5+ T cells: B helper activity is focused in a germinal center-localized subset of CXCR5+ T cells. J Exp Med 193, 1373-1381 (2001). 31. Rosenblum, M. D. et al. Response to self antigen imprints regulatory memory in tissues. Nature 480, 538-542 (2011). 32. Keir, M. E., Freeman, G. J. & Sharpe, A. PD-1 regulates self-reactive CD8+ T cell responses to antigen in lymph nodes and tissues. Journal of Immunology 179, 5064-5070 (2007). 33. Latchman, Y. E. et al. PD-L1-deficient mice show that PD-L1 on T cells, antigen-presenting cells, and host tissues negatively regulates T cells. Proc Natl Acad Sci USA 101, 10691-10696 (2004). 34. Keir, M. E. et al. Tissue expression of PD-L1 mediates peripheral T cell tolerance. J Exp Med 203, 883-895 (2006). 35. McAdam, A. J. et al. ICOS is critical for CD40-mediated antibody class switching. Nature 409, 102-105 (2001). 36. Shahinian, A. et al. Differential T cell costimulatory requirements in CD28-deficient mice. Science 261, 609-612 (1993). 37. Bettelli, E. et al. Reciprocal developmental pathways for the generation of pathogenic effector TH17 and regulatory T cells. Nature 441, 235-238 (2006). 38. Bettelli, E. et al. Myelin oligodendrocyte glycoprotein-specific T cell receptor transgenic mice develop spontaneous autoimmune optic neuritis. J Exp Med 197, 1073-1081 (2003).
Example 2. T Follicular Regulatory Cell (TFR) Cellular Therapy Strategies
1.) Enrichment and Injection of TFR Cells from Blood.
In order to skew the TFH:TFR balance, TFR cells will be purified from peripheral blood. First, lymphocytes from peripheral blood will be isolated by sucrose density centrifugation and stained with fluorescently labeled antibodies. TFR cells will be purified and separated from TFH cells by flow cytometry. TFR cells will be sorted via flow cytometry based on surface markers of CD4.sup.+CXCR5.sup.+ICOS.sup.+GITR.sup.+ and then administered intravenously to patients. These patients include a) individuals with autoimmune diseases with pathogenic antibodies (such as systemic lupus erythematosis) as a means to inhibit immunopathology related to these pathogenic antibodies, b) individuals undergoing transplantation (to prevent pathogenic effects of antibodies during transplant rejection), c) patients undergoing gene therapy or stem cell therapy to prevent development of antibodies that would abrogate the intended beneficial effects of the transferred gene or cell.
2.) Enrichment/Activation and Injection of TFR Cells from Blood.
In order to skew the TFH:TFR balance and to promote heightened suppressive function of TFR cells, TFR cells will be sorted and activated in vitro prior to administration into patients. Lymphocytes from peripheral blood will be isolated by sucrose density centrifugation and stained with fluorescently labeled antibodies. TFR cells will be sorted via flow cytometry based on surface markers of CD4.sup.+CXCR5.sup.+ICOS.sup.+GITR.sup.+ and activated in vitro by using a soluble anti-CD3 antibody along with autologous CD19+ B cells from blood to trigger TCR signaling and activation. After activation, TFR cells will be given to patients intravenously.
3.) Enhanced Activation of TFR Cells by Blocking PD-1 Pathway.
In order to skew the TFH:TFR balance and to promote heightened suppressive function of TFR cells, TFR cells will be sorted and activated in vitro in the presence of PD-1 or PD-L1 antagonists, which should enhance TFR cell numbers and suppressive capacity. Lymphocytes from peripheral blood will be isolated by sucrose density centrifugation and stained with fluorescently labeled antibodies. TFR cells will be sorted via flow cytometry based on surface markers of CD4.sup.+CXCR5.sup.-ICOS.sup.+GITR.sup.+ and activated in vitro by using a soluble anti-CD3 antibody along with autologous CD19+ B cells from blood to trigger TCR signaling. PD-1 antagonists (monoclonal antibodies and/or small molecule inhibitors) are added during activation to enhance activation of TFR cells. After activation, TFR cells are administered to patients intravenously.
4.) Enrichment and Injection of Tfr Cells to Induce Long Term Memory During Vaccination.
The goal of this strategy is to skew TFH:TFR balance in the blood during B cell memory development and preferentially promote development of long lived B cell memory cells by inhibiting plasma cell differentiation. TFR cells will be sorted via flow cytometry and injected intravenously into individuals at the time of vaccination. Lymphocytes from peripheral blood will be isolated by sucrose density centrifugation and stained with fluorescently labeled antibodies. TFR cells will be sorted via flow cytometry based on surface markers of CD4.sup.+CXCR5.sup.+ICOS.sup.+GITR.sup.+ and reinjected intravenously.
5.) Induction of TFR Cells from nTreg Precursors by Blocking PD-1 Pathway in Vitro.
In order to generate de novo TFR cells from Treg progenitors, naive Tregs are sorted from human blood by CD4+CXCR5-GITR+(or CD25+). These cells are activated with autologous CD19+ B cells with anti-CD3. During this activation, PD-1 antagonists (blocking antibodies or small molecule inhibitors) are used to block the PD-1 pathway. TFR cells are then sorted by flow cytometry as CD4+CXCR5+ICOS+GITR+ or and injected into patients.
Example 3. Summary
T Follicular Regulatory (TFR) cells inhibit whereas T Follicular Helper (TFH) cells stimulate antibody production. Both TFR and TFH cells are found in blood, however relatively little is known about the developmental signals for these cells or their functions. Here we demonstrate a new mechanism of control of antibody responses mediated by TFR and TFH cells. We find that circulating TFH and TFR cells are distinct from lymph node effector TFR/TFH cells, and represent memory-like cells that have specialized function to patrol diverse sites of potential antigen encounter. Circulating TFH cells can be potently activated by DCs, home to germinal centers and produce large amounts of
D00001
D00002
D00003
D00004
D00005
D00006
D00007
D00008
D00009
D00010
D00011
D00012
D00013

D00014

D00015
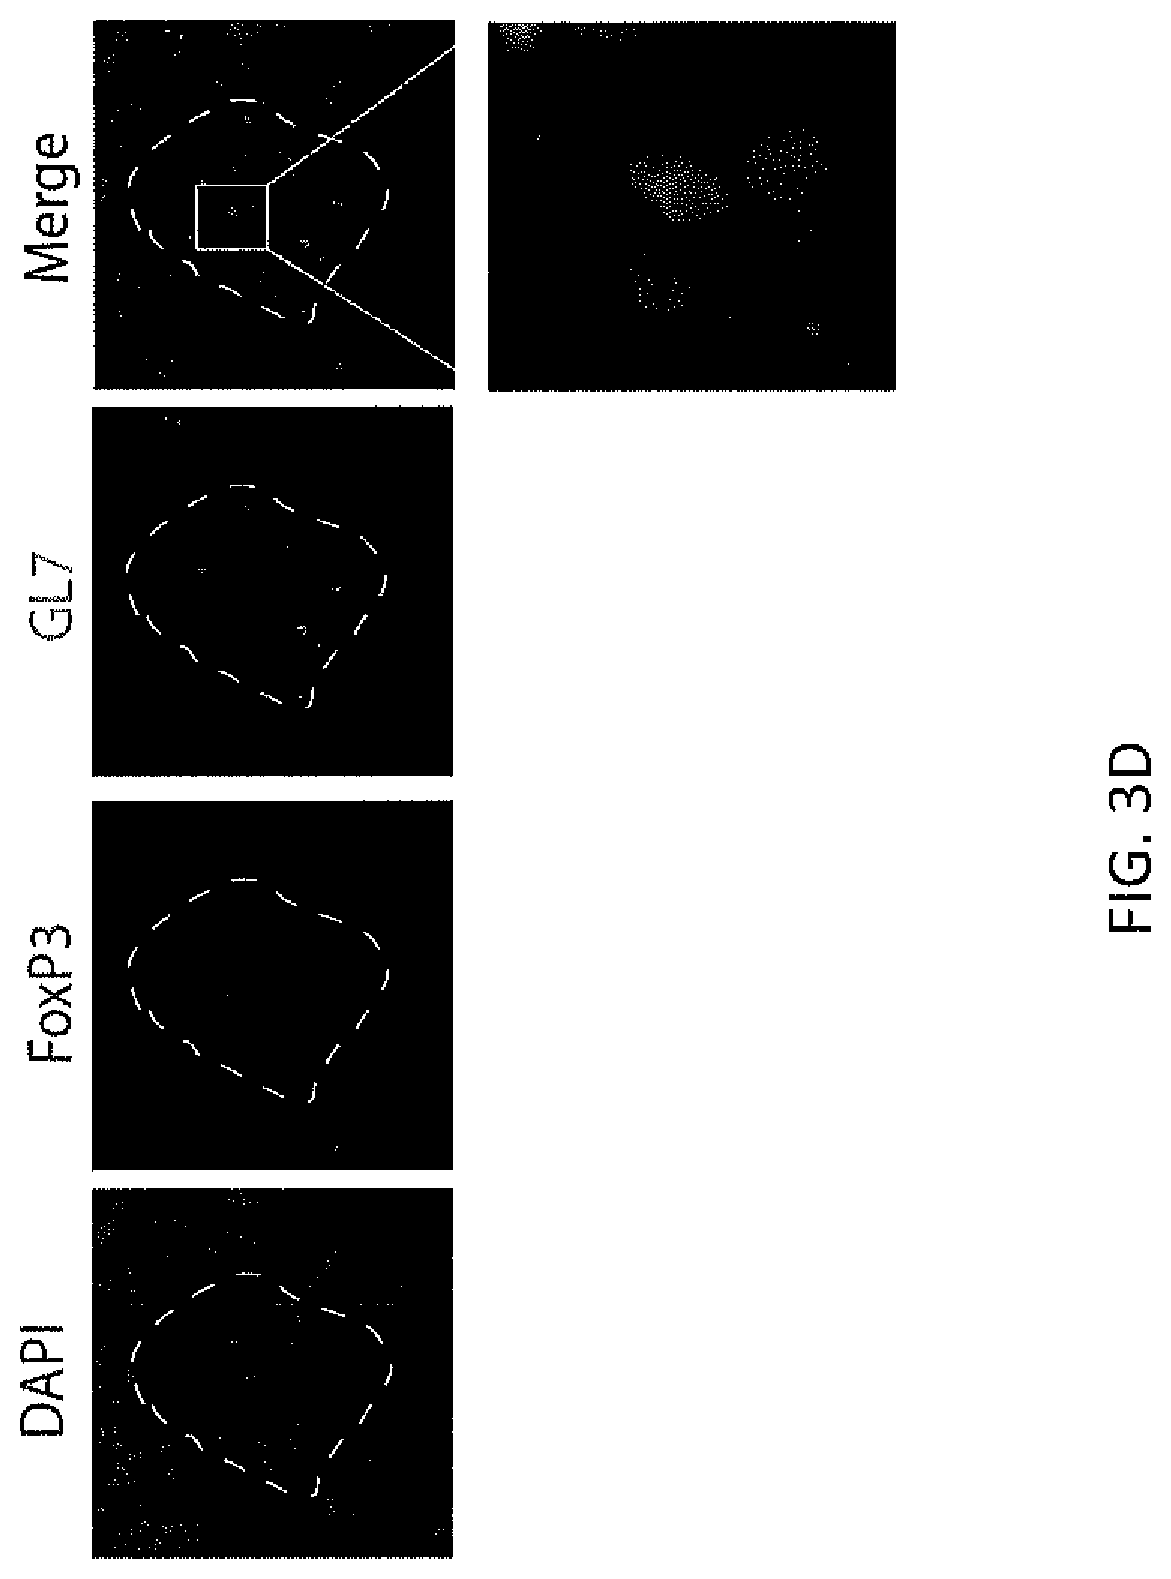
D00016

D00017

D00018

D00019

D00020

D00021

D00022

D00023

D00024

D00025

D00026

D00027

D00028
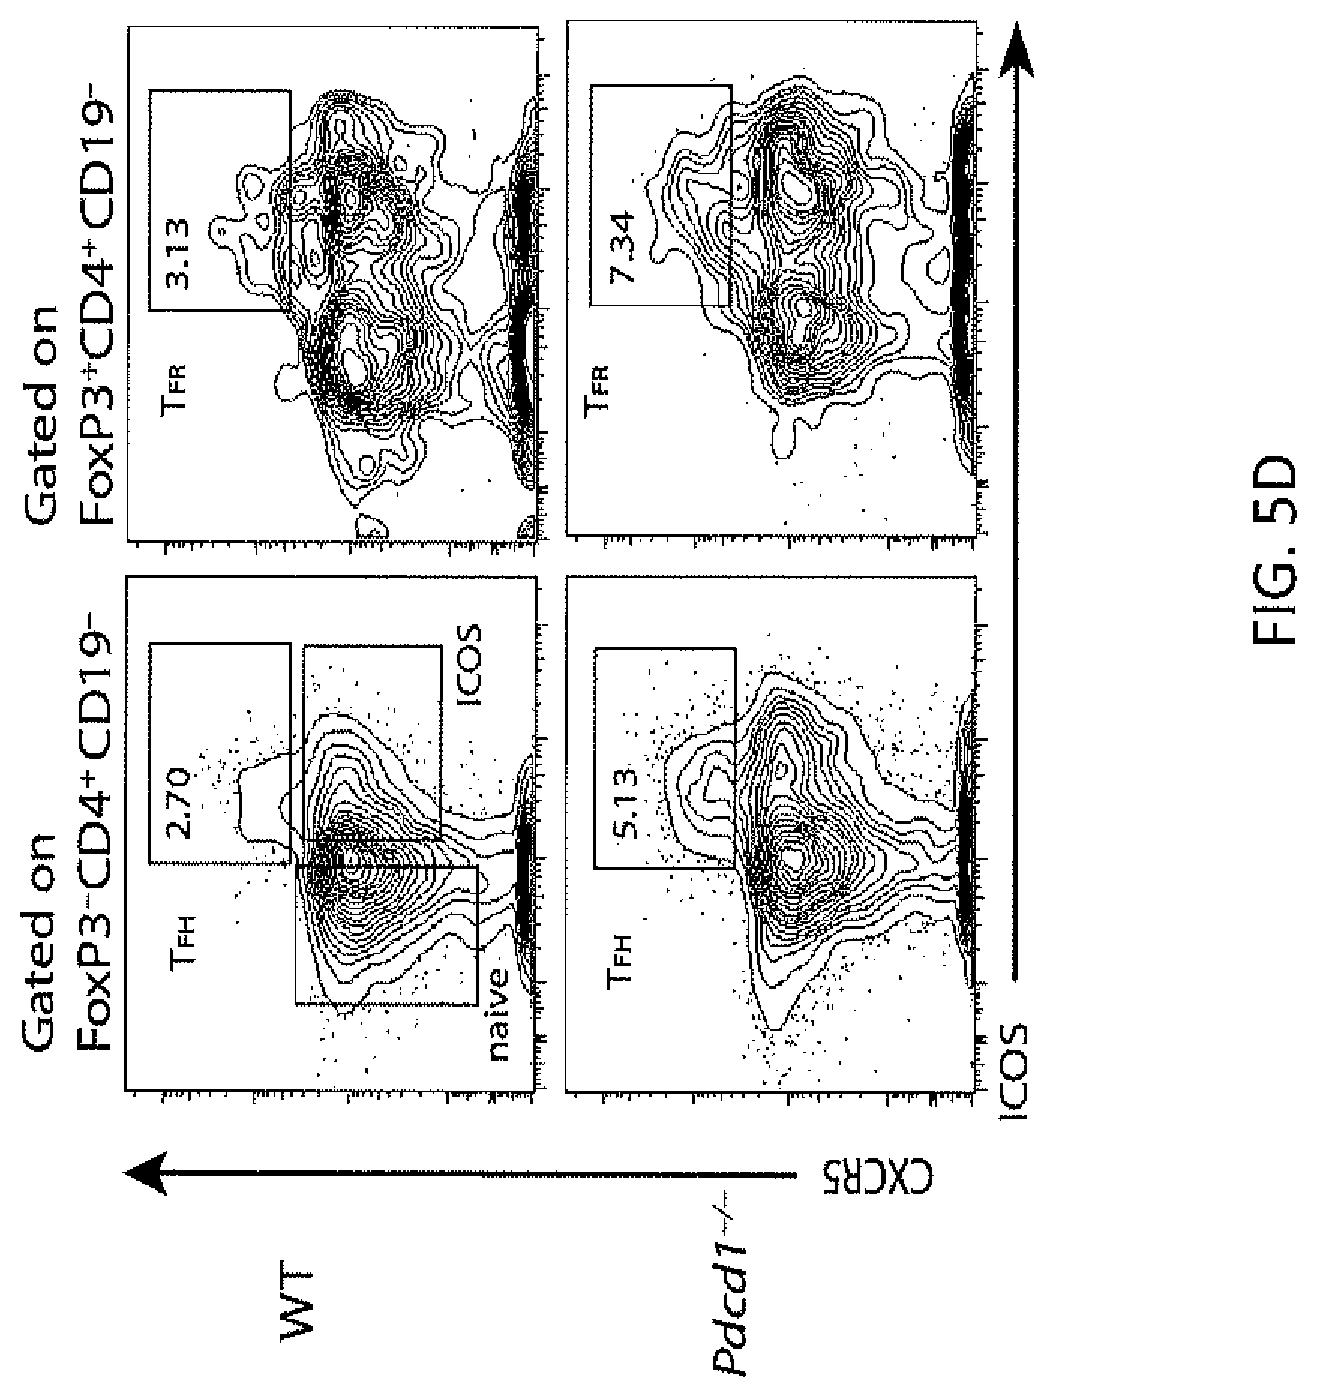
D00029

D00030

D00031

D00032

D00033

D00034

D00035

D00036

D00037

D00038
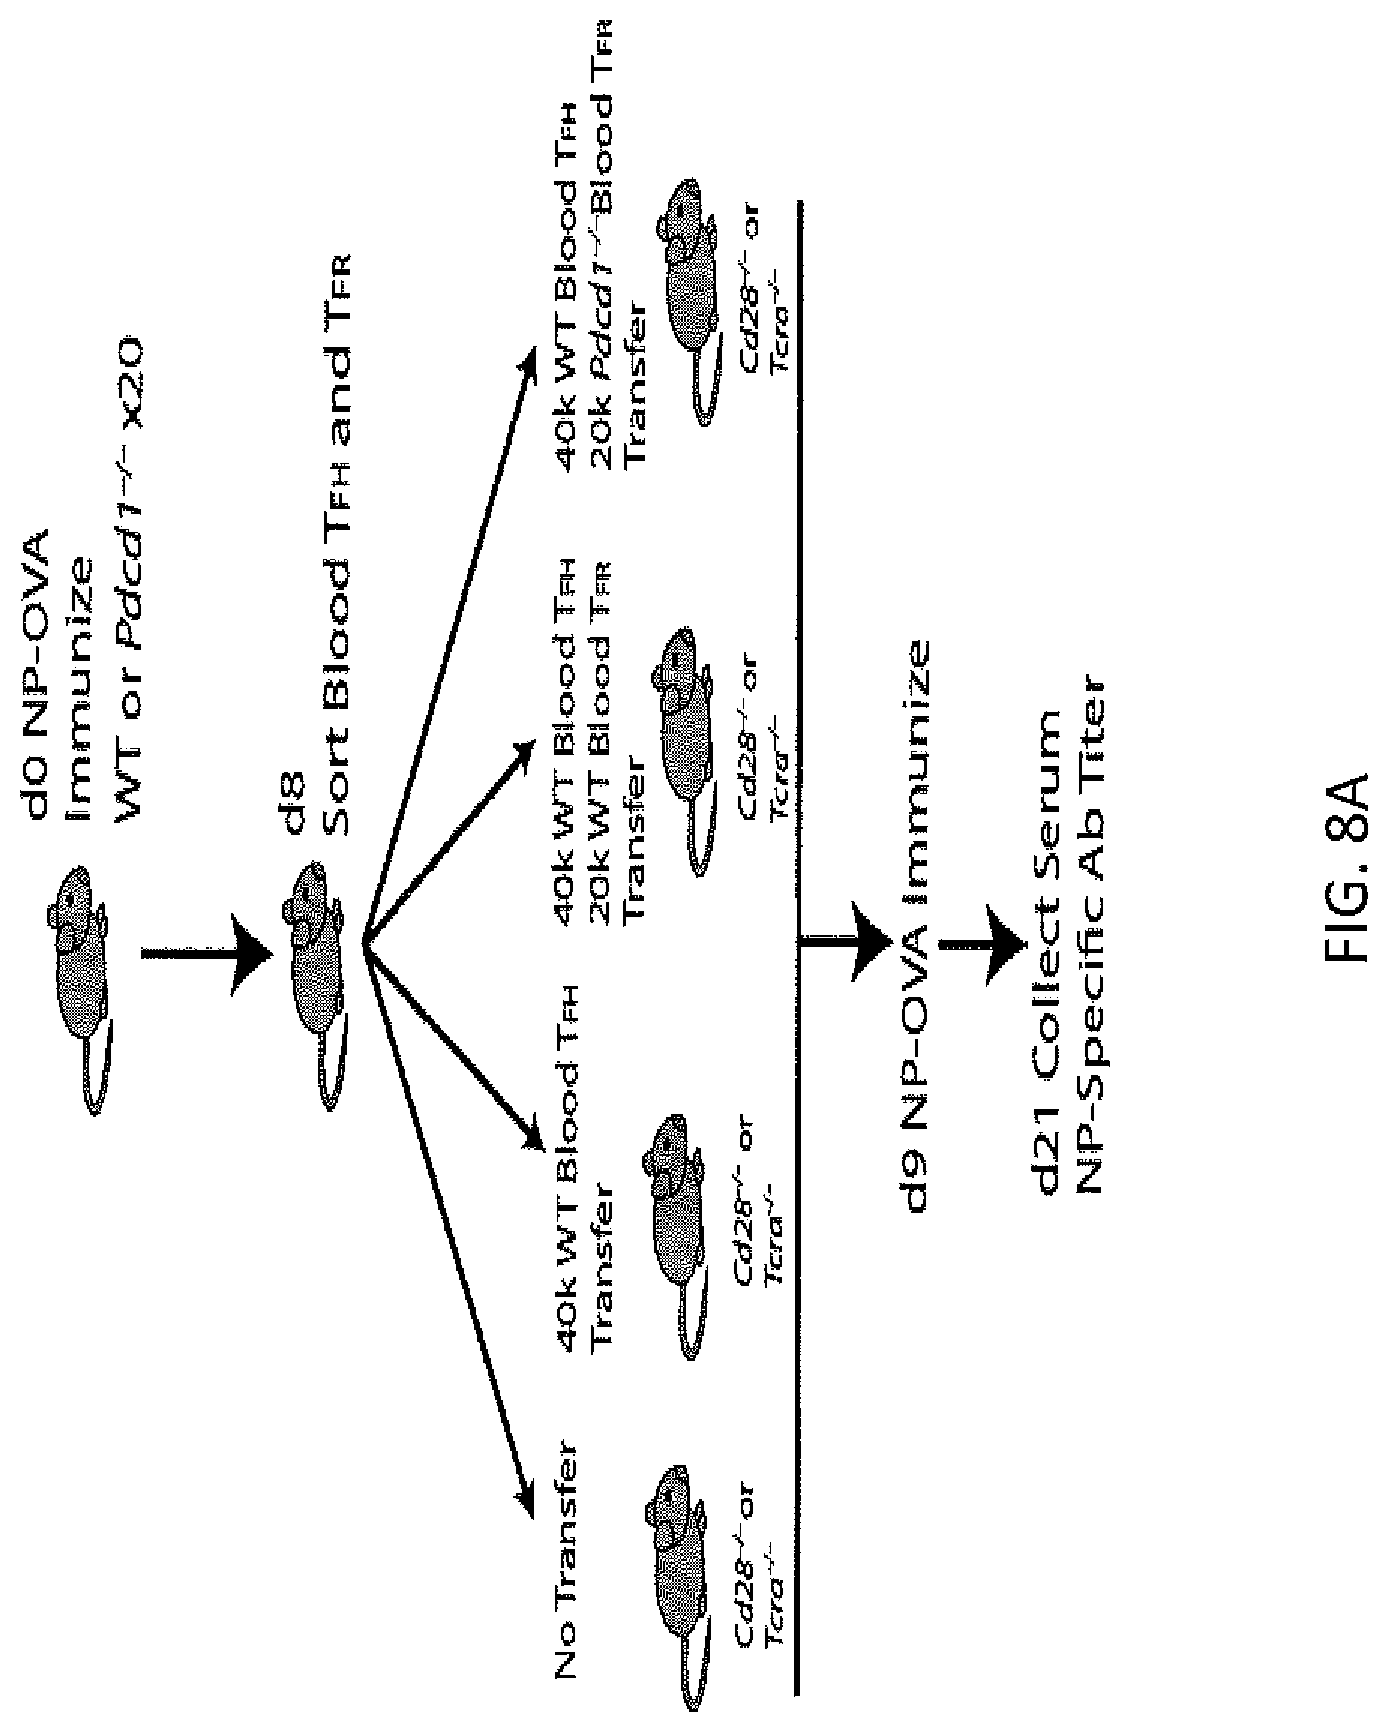
D00039

D00040

D00041

D00042

D00043

D00044
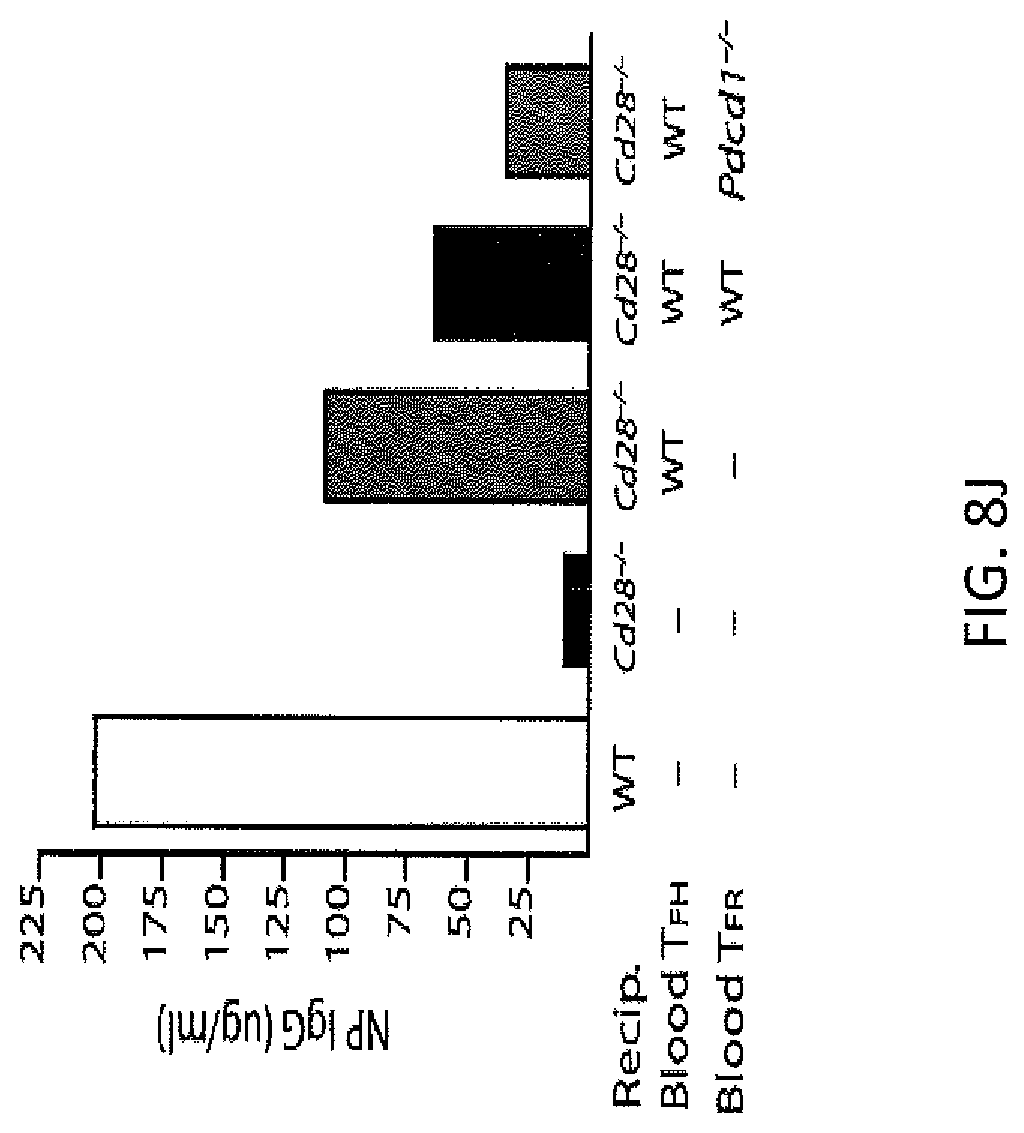
D00045

D00046

D00047

D00048

D00049

D00050

D00051

D00052

D00053
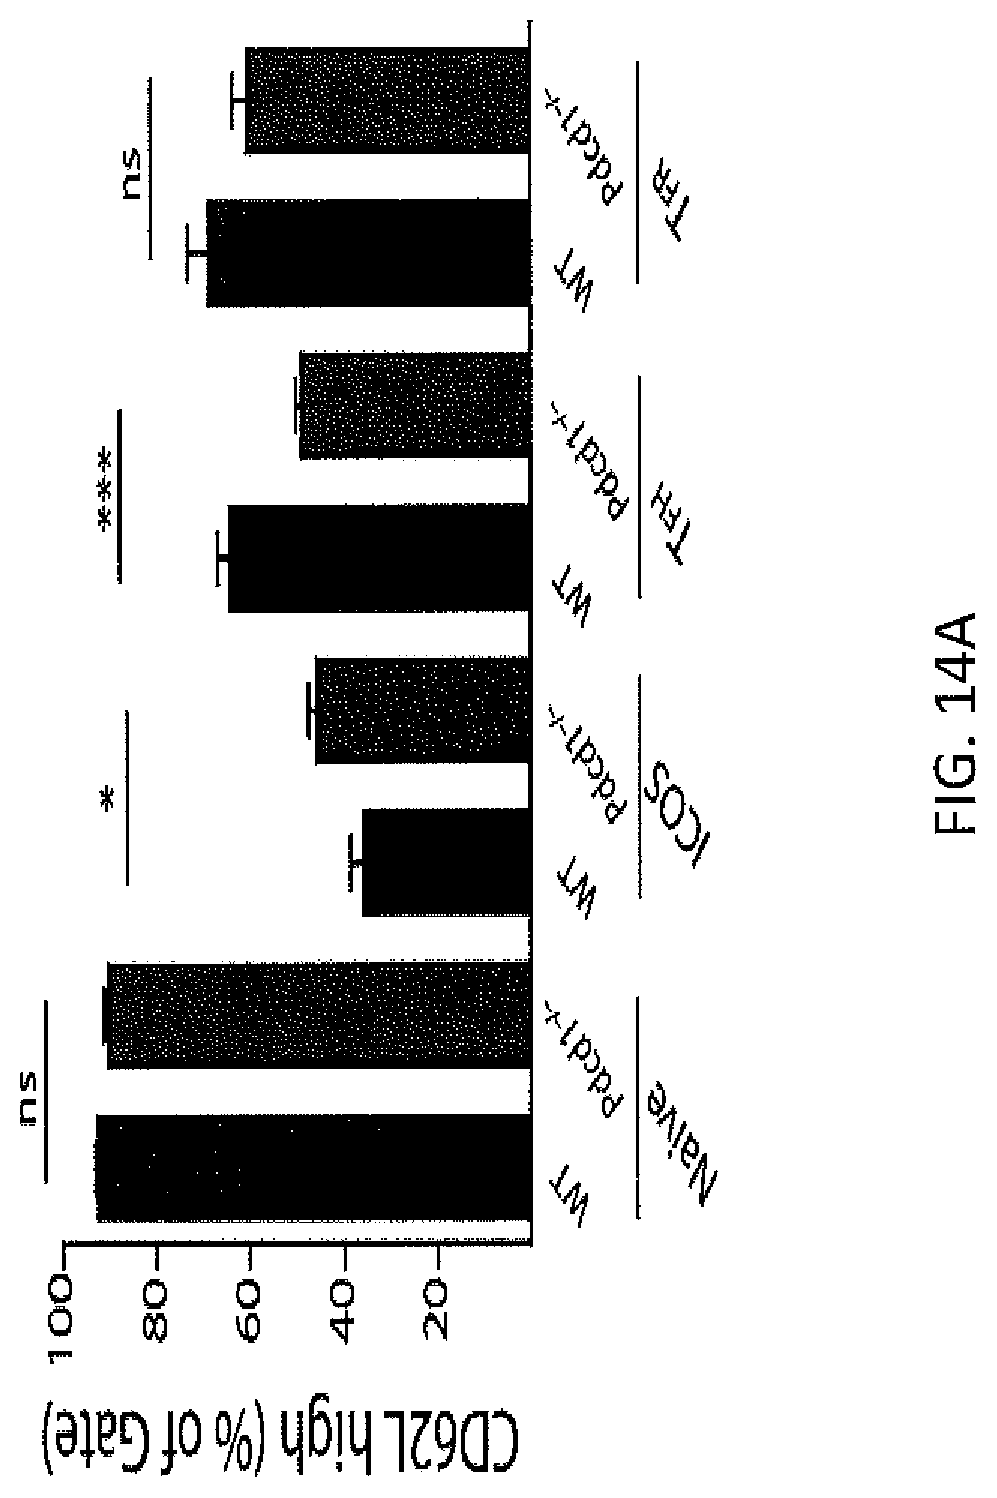
D00054

D00055

D00056

D00057

D00058
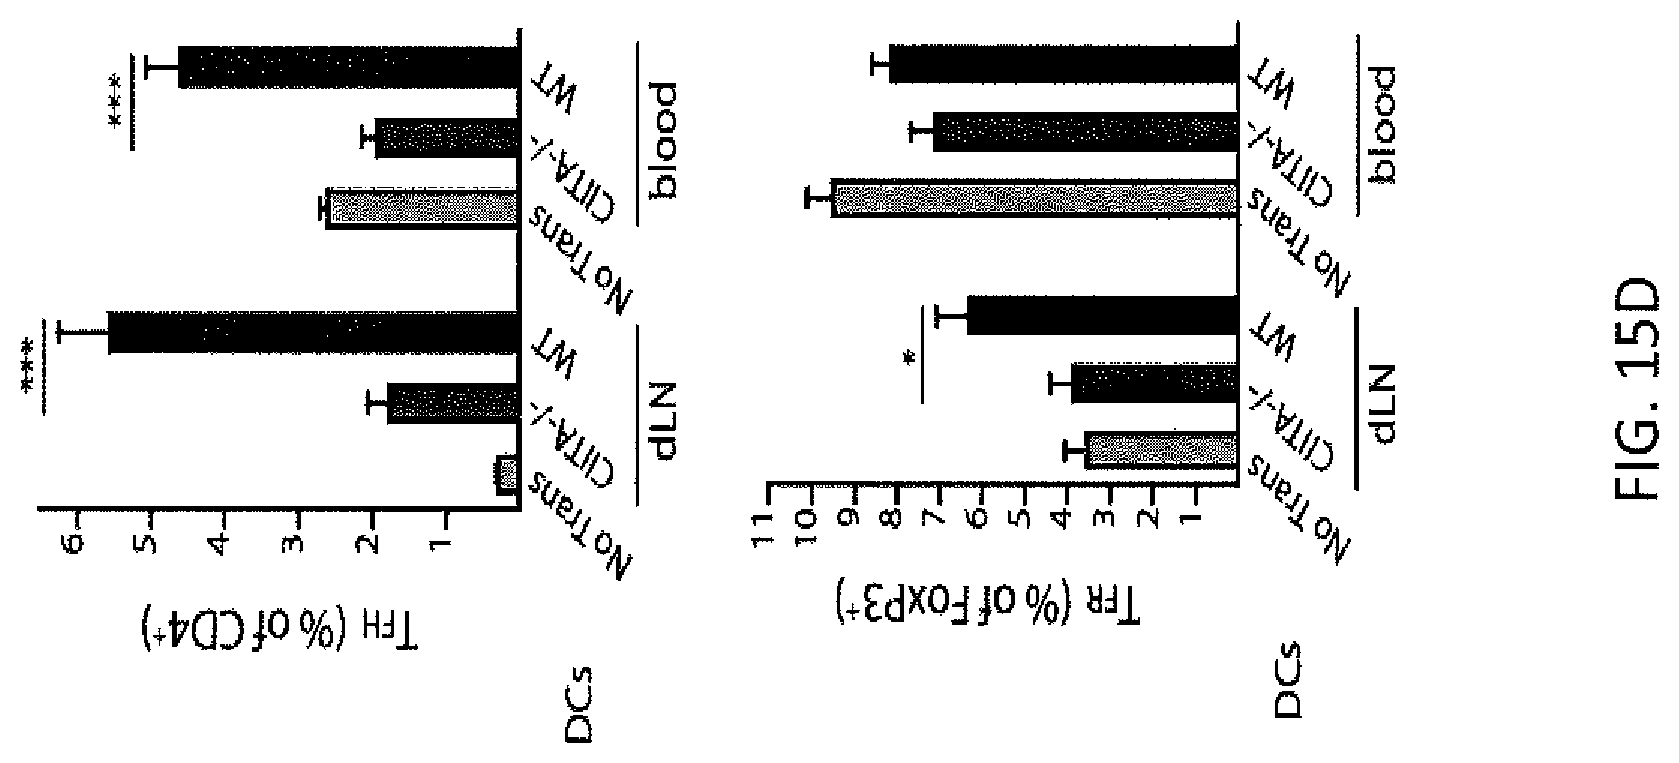
D00059

D00060

D00061

D00062

D00063

D00064

D00065

D00066

D00067

D00068

D00069

D00070

D00071

D00072
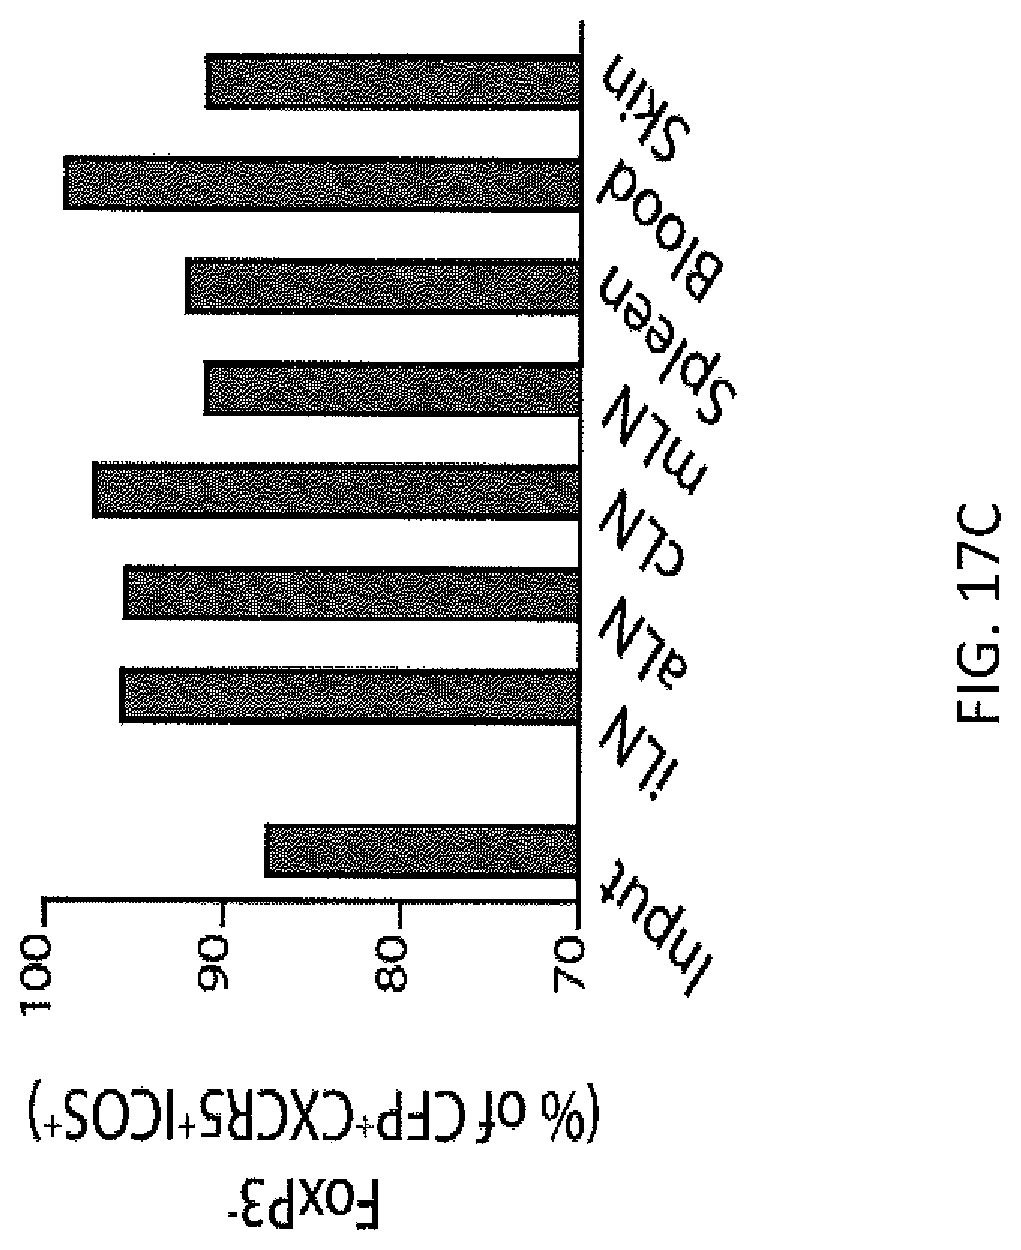
D00073

D00074

D00075

D00076

D00077

D00078

D00079

D00080

D00081

D00082

D00083
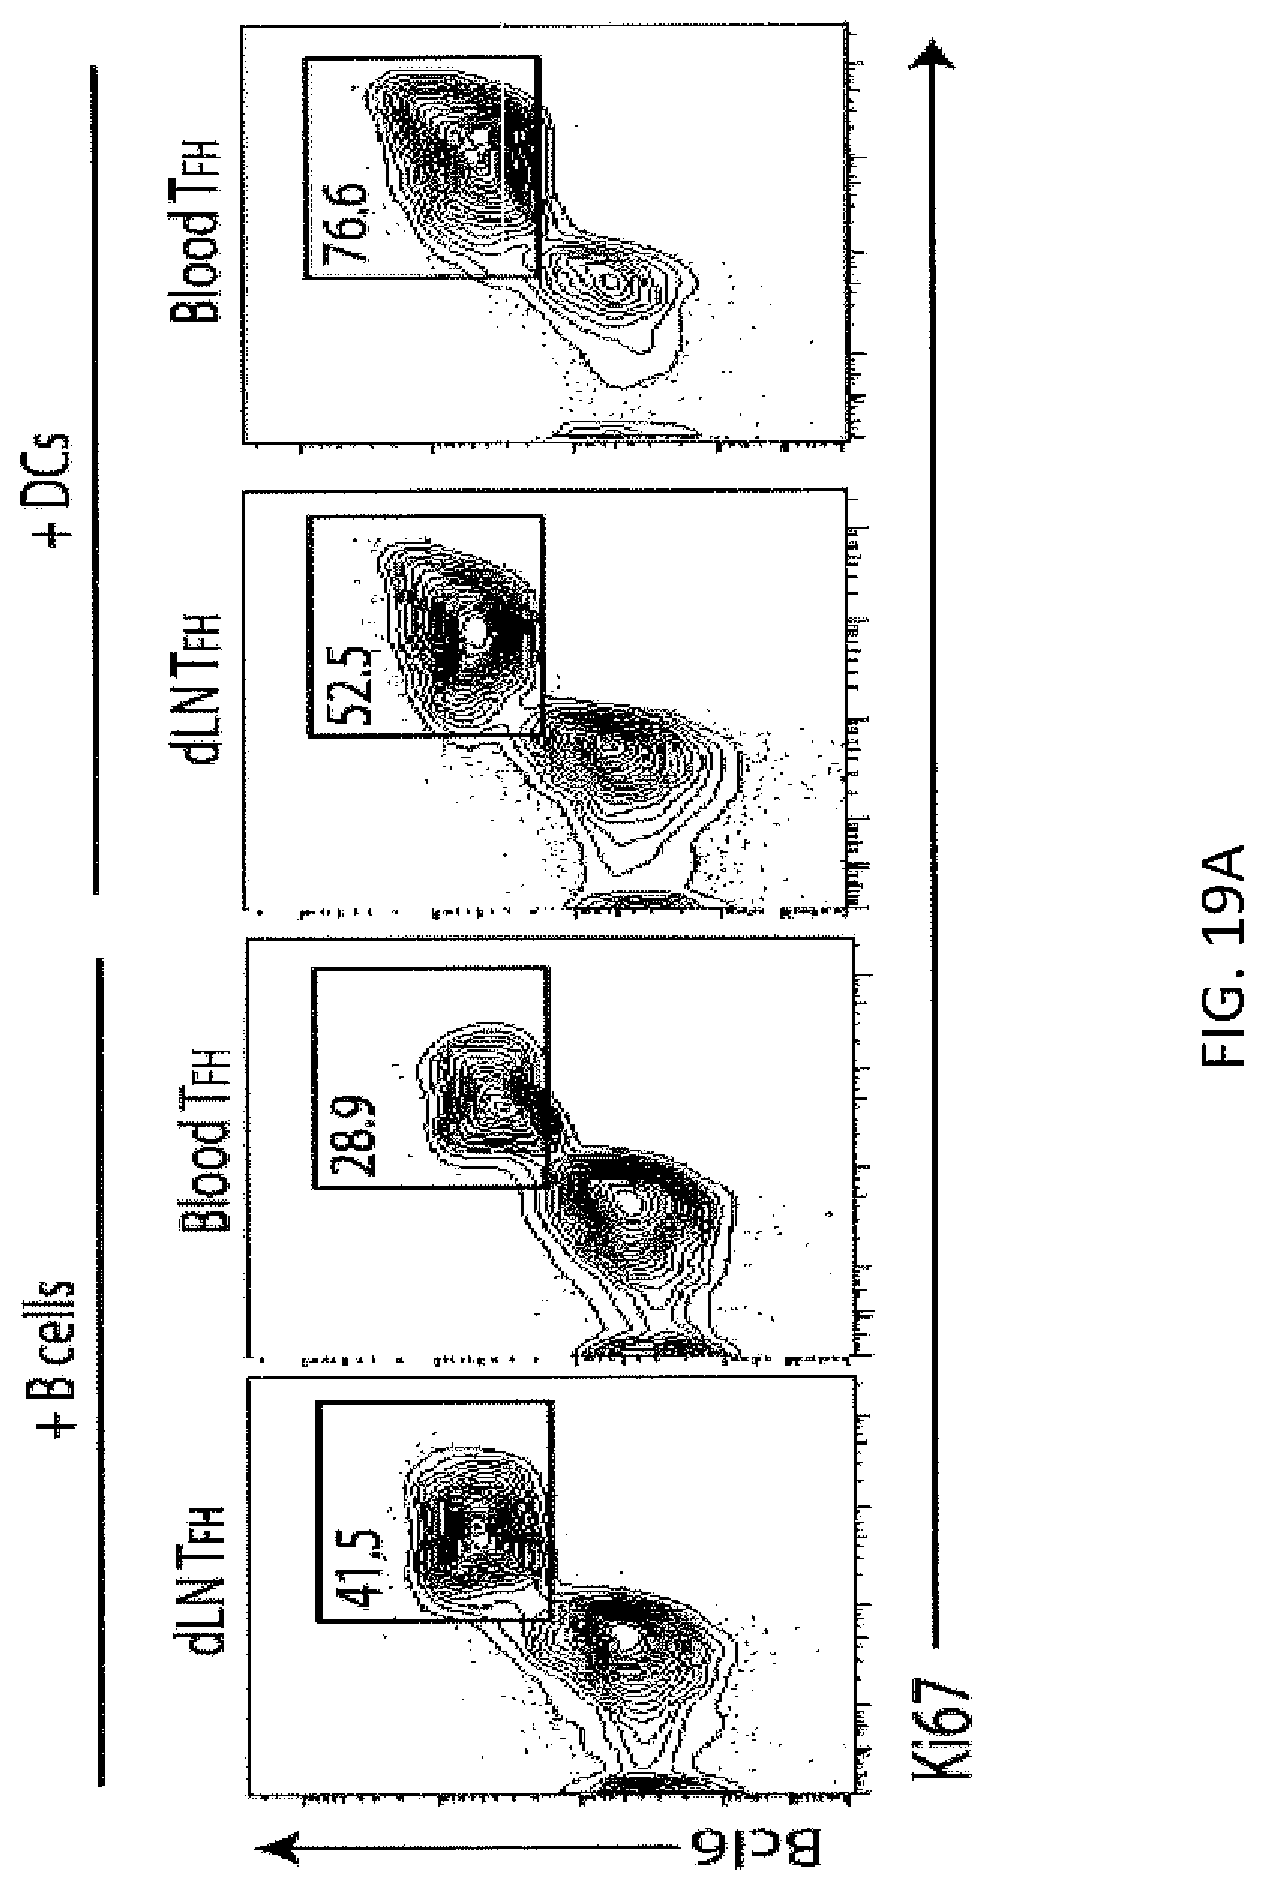
D00084

D00085

D00086

D00087

D00088
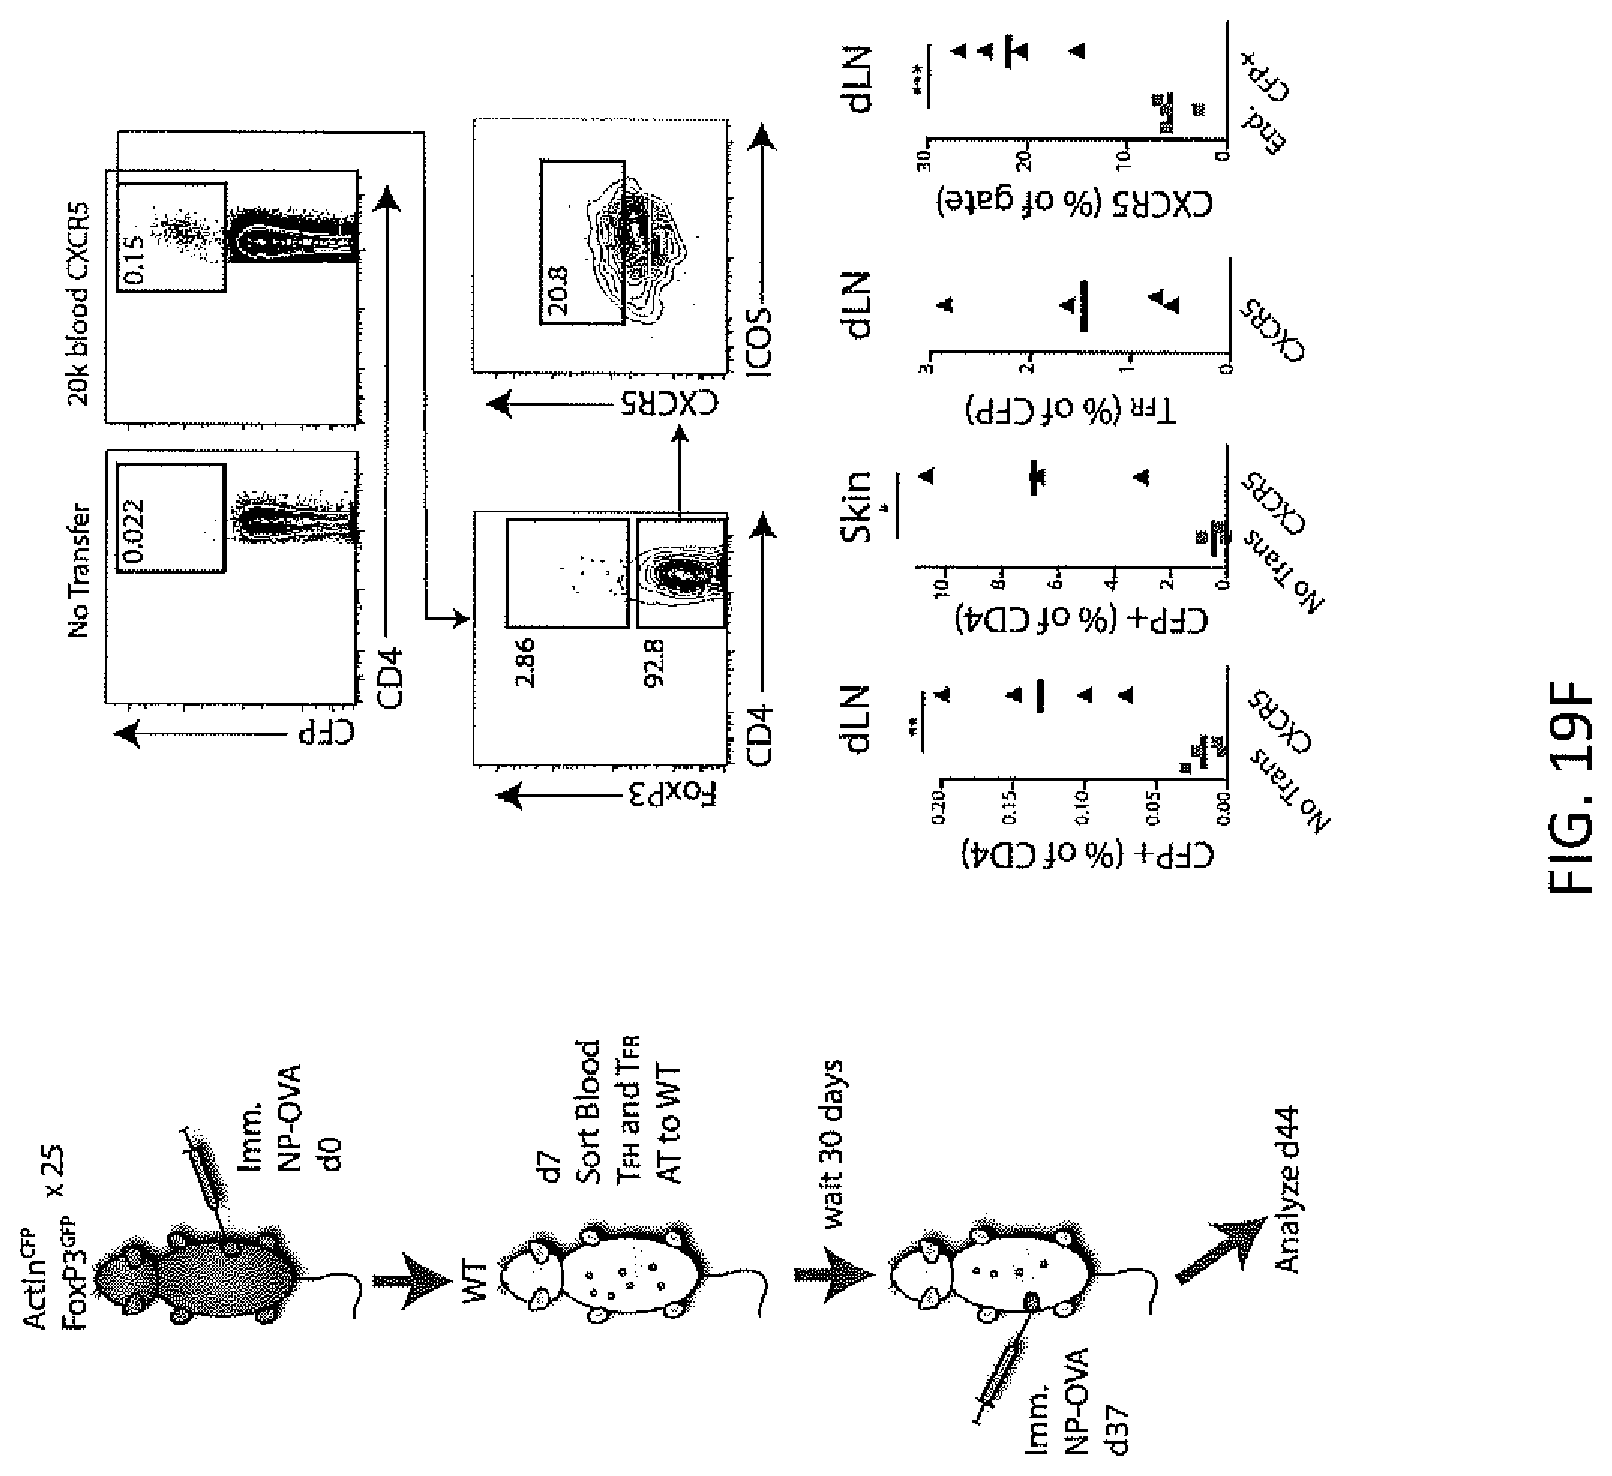
D00089

D00090

D00091

D00092
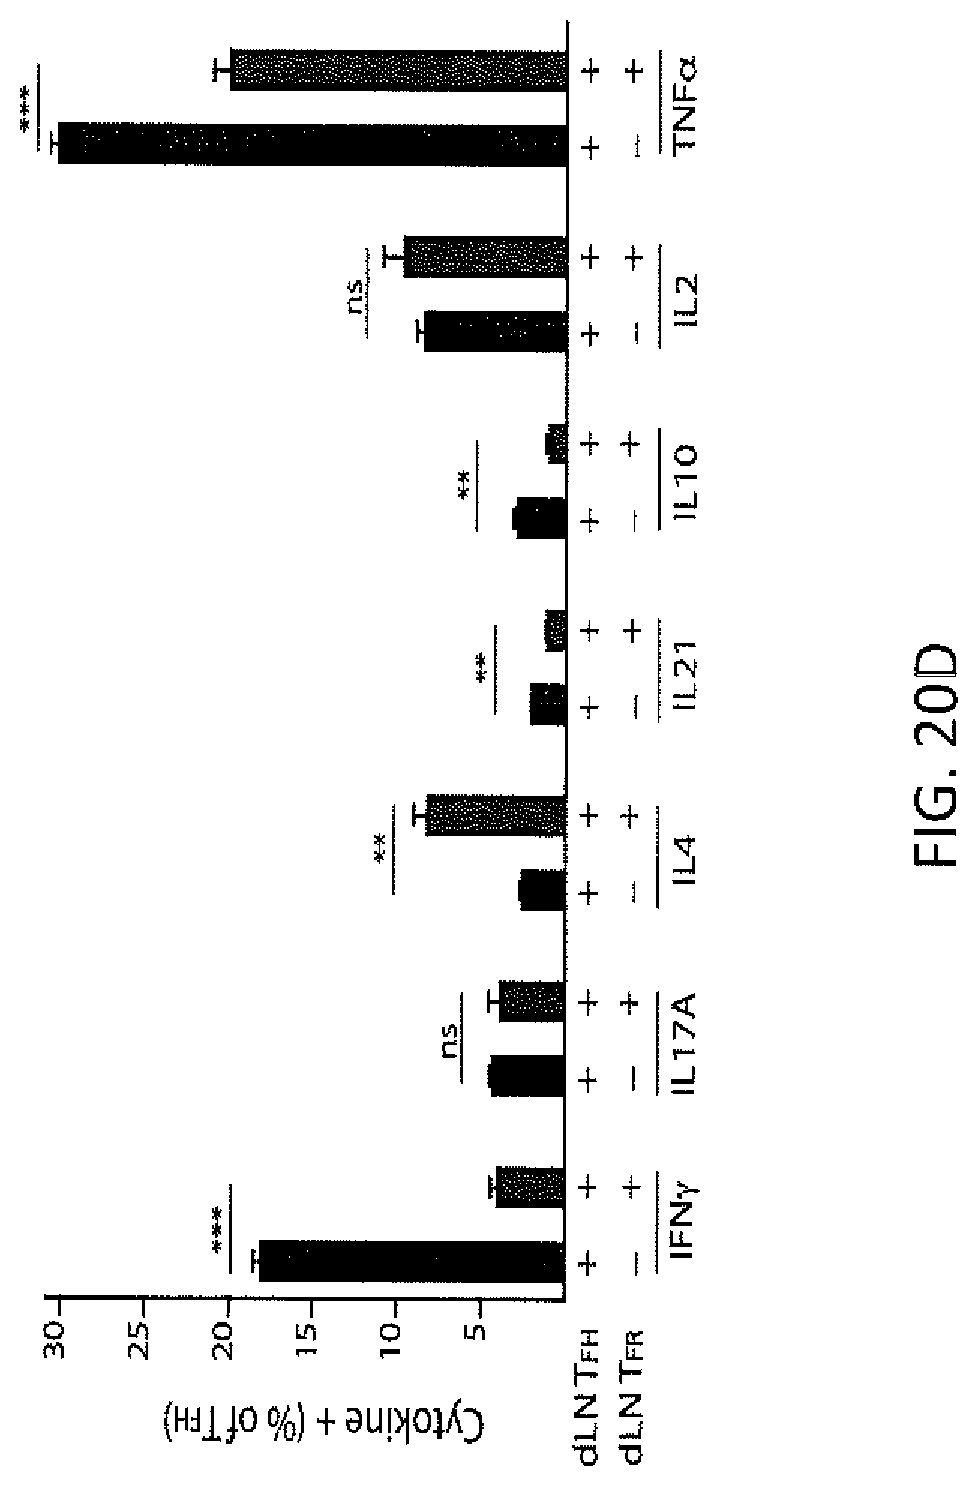
D00093

D00094

D00095

D00096
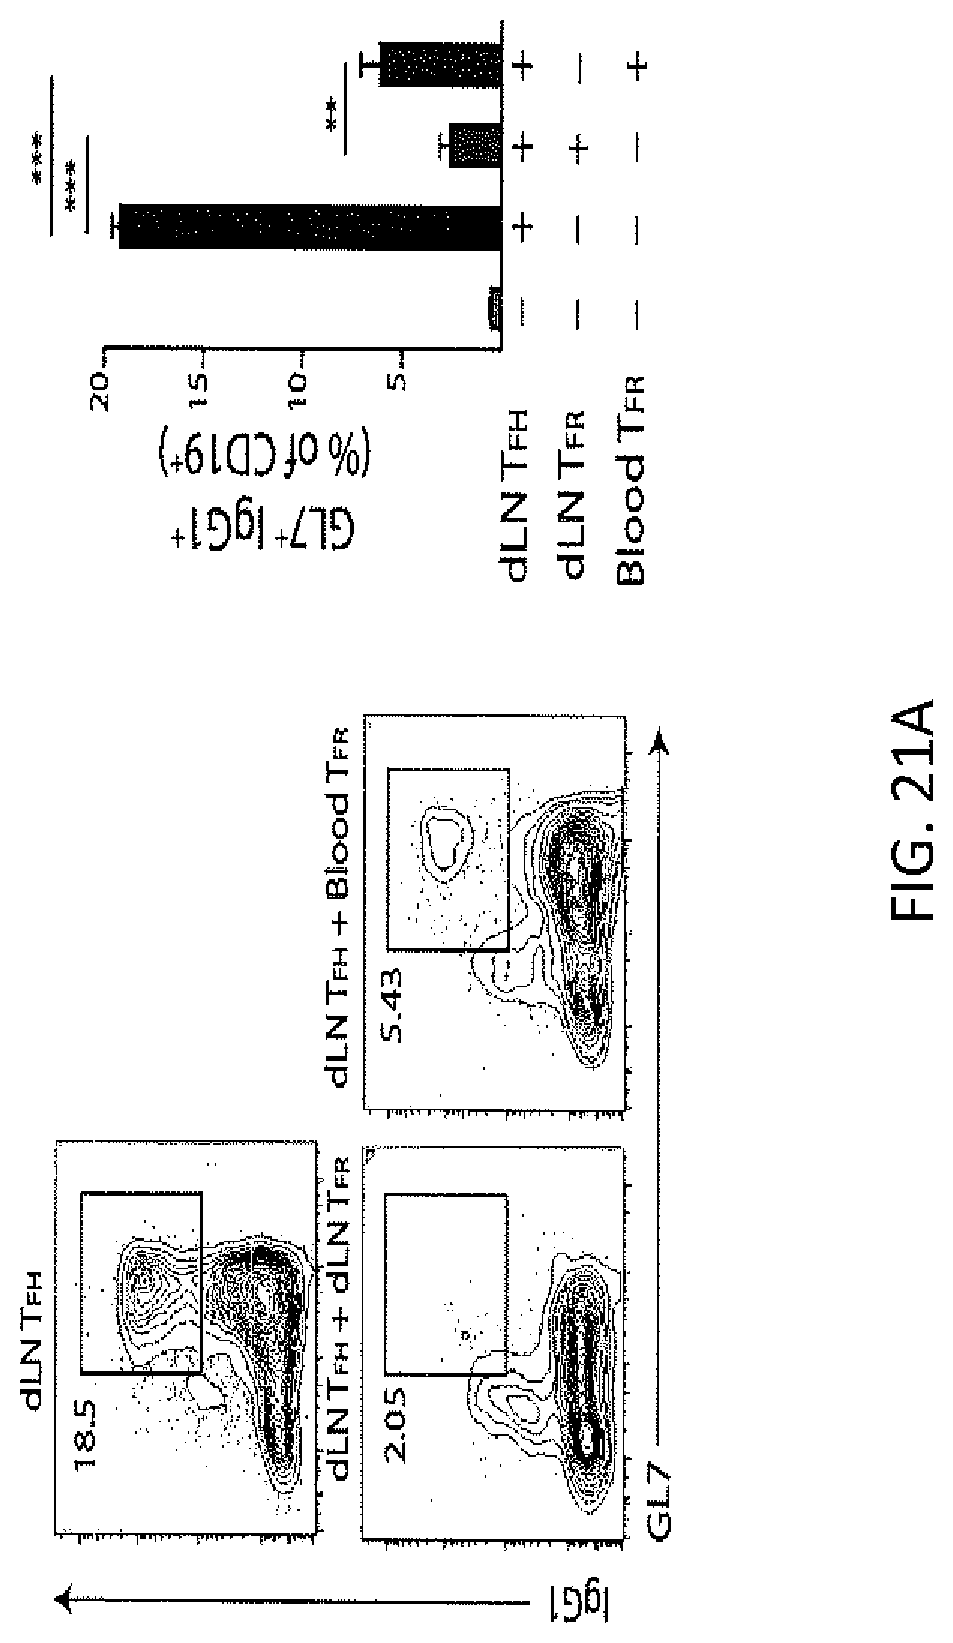
D00097

D00098

D00099

D00100
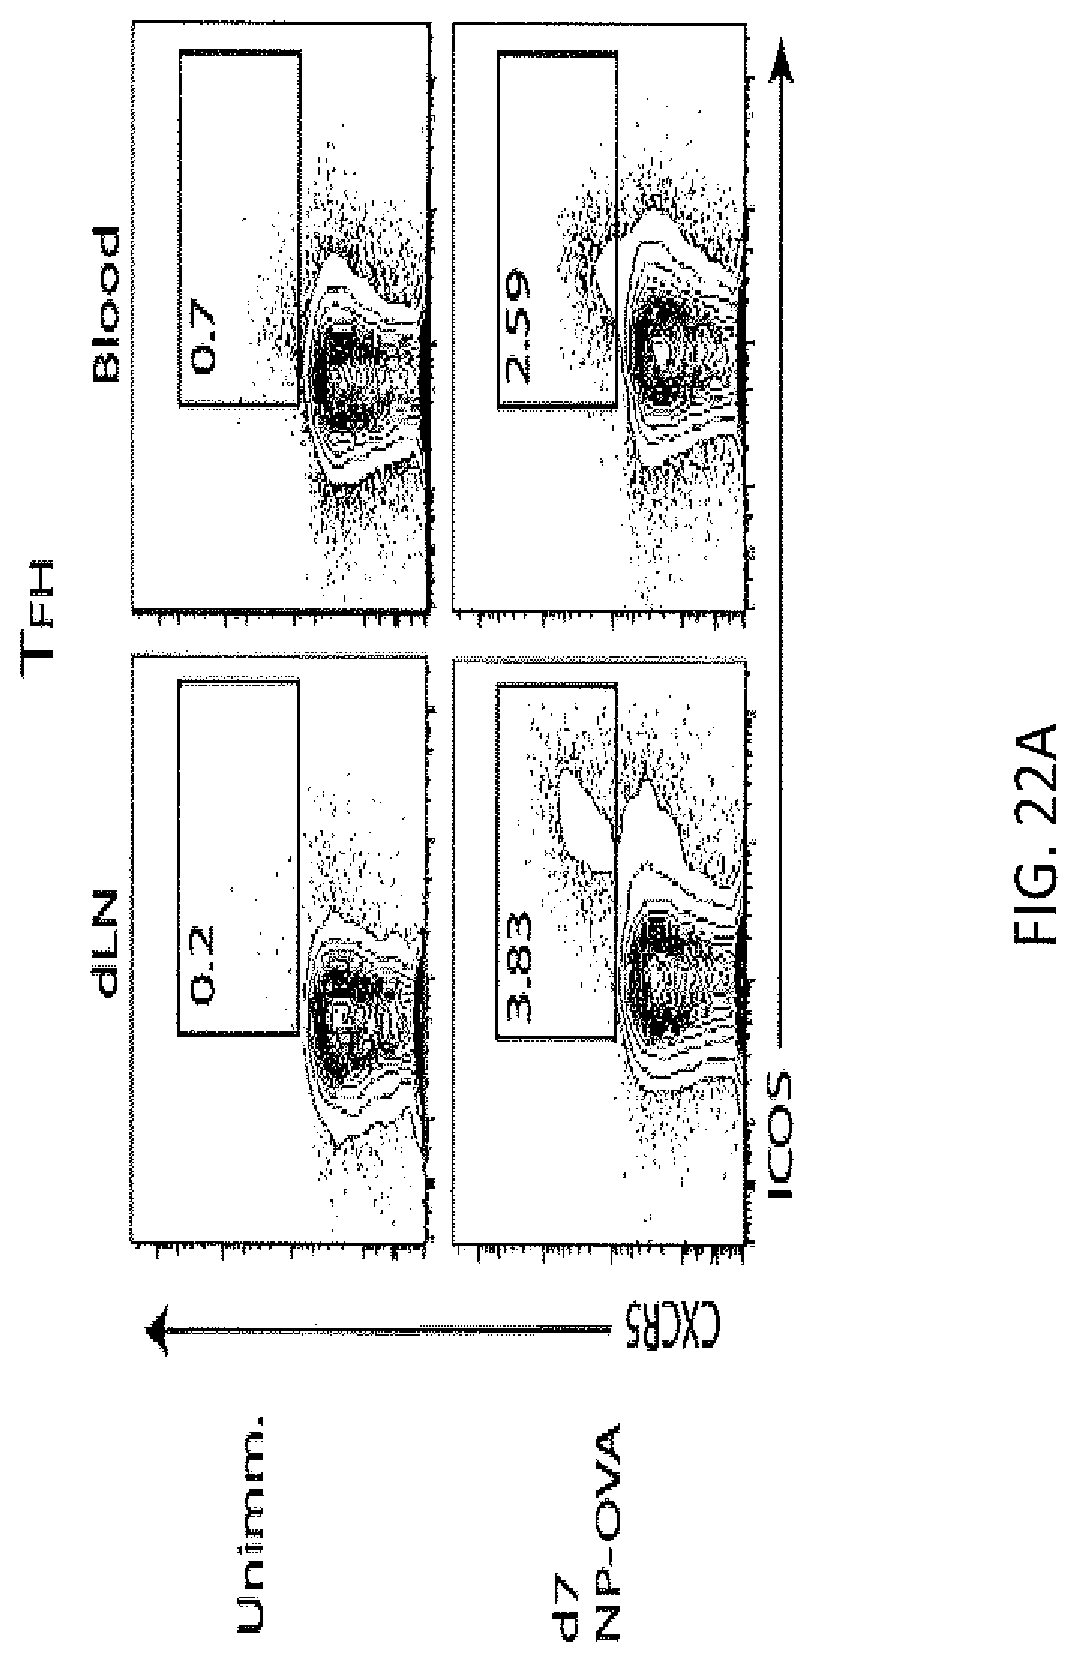
D00101

D00102

D00103

D00104
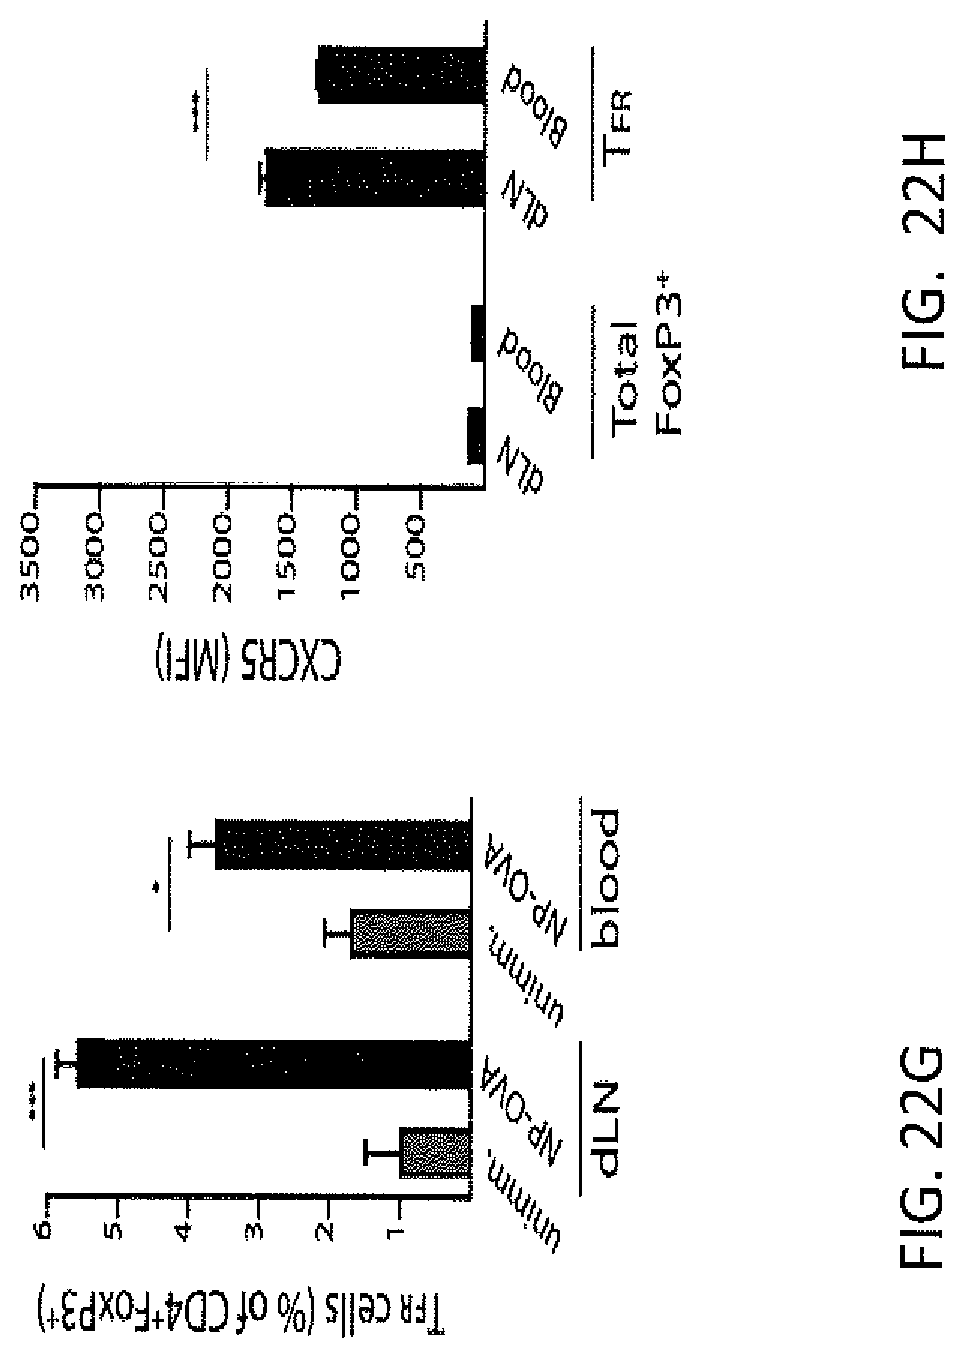
D00105

D00106

D00107

D00108

D00109

XML
uspto.report is an independent third-party trademark research tool that is not affiliated, endorsed, or sponsored by the United States Patent and Trademark Office (USPTO) or any other governmental organization. The information provided by uspto.report is based on publicly available data at the time of writing and is intended for informational purposes only.
While we strive to provide accurate and up-to-date information, we do not guarantee the accuracy, completeness, reliability, or suitability of the information displayed on this site. The use of this site is at your own risk. Any reliance you place on such information is therefore strictly at your own risk.
All official trademark data, including owner information, should be verified by visiting the official USPTO website at www.uspto.gov. This site is not intended to replace professional legal advice and should not be used as a substitute for consulting with a legal professional who is knowledgeable about trademark law.