Methods for assessing reliability of a utility company's power system
Castelli , et al. Fe
U.S. patent number 10,552,109 [Application Number 15/151,984] was granted by the patent office on 2020-02-04 for methods for assessing reliability of a utility company's power system. This patent grant is currently assigned to General Electric Technology GmbH. The grantee listed for this patent is General Electric Technology GmbH. Invention is credited to Heath Daniel Brand, Gennaro Castelli, Michael Hackett, Michael Quinn Howard, Lawrence Edmund Jones, HuiChu Su Shung.


View All Diagrams
| United States Patent | 10,552,109 |
| Castelli , et al. | February 4, 2020 |
Methods for assessing reliability of a utility company's power system
Abstract
Methods are provided for assessing reliability of a power system of a utility company. At least one main overview display is obtained. Violation markers are displayed on the one main overview display. A monitored elements tab is updated with a list of monitored elements.
| Inventors: | Castelli; Gennaro (Bothell, WA), Hackett; Michael (Kirkland, WA), Howard; Michael Quinn (Bothell, WA), Jones; Lawrence Edmund (Washington, DC), Shung; HuiChu Su (Bellevue, WA), Brand; Heath Daniel (Sammamish, WA) | ||||||||||
|---|---|---|---|---|---|---|---|---|---|---|---|
| Applicant: |
|
||||||||||
| Assignee: | General Electric Technology
GmbH (Baden, CH) |
||||||||||
| Family ID: | 40296088 | ||||||||||
| Appl. No.: | 15/151,984 | ||||||||||
| Filed: | May 11, 2016 |
Prior Publication Data
| Document Identifier | Publication Date | |
|---|---|---|
| US 20160328199 A1 | Nov 10, 2016 | |
Related U.S. Patent Documents
| Application Number | Filing Date | Patent Number | Issue Date | ||
|---|---|---|---|---|---|
| 13590321 | Jun 14, 2016 | 9367936 | |||
| 12139194 | Nov 27, 2012 | 8321804 | |||
| 60952021 | Jul 26, 2007 | ||||
| Current U.S. Class: | 1/1 |
| Current CPC Class: | G08B 23/00 (20130101); G01R 31/40 (20130101); G06F 3/0486 (20130101); G09G 5/377 (20130101); G06F 3/14 (20130101); G06F 3/0482 (20130101); G06F 3/04842 (20130101); H02J 3/008 (20130101); G06F 3/167 (20130101); G06T 3/40 (20130101); H04L 43/045 (20130101); G06Q 10/063 (20130101); G06Q 10/06315 (20130101); G06T 11/206 (20130101); H02J 3/00 (20130101); G06T 11/60 (20130101); Y02E 60/76 (20130101); Y02E 60/00 (20130101); H02J 3/001 (20200101); Y04S 40/20 (20130101); H02J 2203/20 (20200101); Y04S 50/10 (20130101); Y04S 40/22 (20130101) |
| Current International Class: | G06F 3/0481 (20130101); G06F 3/0486 (20130101); G06F 3/14 (20060101); G06Q 10/06 (20120101); H02J 3/00 (20060101); G06T 3/40 (20060101); G06T 11/20 (20060101); G06F 3/0482 (20130101); G08B 23/00 (20060101); H04L 12/26 (20060101); G06F 3/0484 (20130101); G06F 3/16 (20060101); G09G 5/377 (20060101); G01R 31/40 (20140101); G06T 11/60 (20060101) |
References Cited [Referenced By]
U.S. Patent Documents
| 1156131 | October 1915 | Braddock |
| 3932735 | January 1976 | Giras |
| 4075699 | February 1978 | Schneider et al. |
| 4078260 | March 1978 | Chen et al. |
| 4125782 | November 1978 | Pollnow, Jr. |
| 4181950 | January 1980 | Carter, II |
| 4204127 | May 1980 | Carter, II |
| 4264960 | April 1981 | Gurr |
| 4341345 | July 1982 | Hammer et al. |
| 4347575 | August 1982 | Gurr et al. |
| 4347576 | August 1982 | Kensinger et al. |
| 4398141 | August 1983 | Brennen |
| 4455614 | June 1984 | Martz et al. |
| 4551812 | November 1985 | Gurr et al. |
| 4560835 | December 1985 | Bourgonje |
| 4760531 | July 1988 | Yasui et al. |
| 4804938 | February 1989 | Rouse et al. |
| 4876854 | October 1989 | Owens |
| 5136497 | August 1992 | Coe et al. |
| 5185886 | February 1993 | Edem et al. |
| 5384697 | January 1995 | Pascucci |
| 5414640 | May 1995 | Seem |
| 5422561 | June 1995 | Williams |
| 5444618 | August 1995 | Seki et al. |
| 5467265 | November 1995 | Yamada et al. |
| 5568019 | October 1996 | Mason |
| 5594659 | January 1997 | Schlueter |
| 5598566 | January 1997 | Pascucci et al. |
| 5655136 | August 1997 | Morgan |
| 5729731 | March 1998 | Yajima et al. |
| 5796628 | August 1998 | Chiang et al. |
| 5798939 | August 1998 | Ochoa et al. |
| 5904727 | May 1999 | Prabhakaran |
| 5933355 | August 1999 | Deb |
| 5937414 | August 1999 | Souder et al. |
| 5963457 | October 1999 | Kanoi et al. |
| 5974403 | October 1999 | Takriti et al. |
| 6021402 | February 2000 | Takriti |
| 6084565 | July 2000 | Kiya |
| 6169981 | January 2001 | Werbos |
| 6178362 | January 2001 | Woolard et al. |
| 6259972 | July 2001 | Sumic |
| 6289267 | September 2001 | Alexander et al. |
| 6313752 | November 2001 | Corrigan |
| 6353847 | March 2002 | Maruyama et al. |
| 6388684 | May 2002 | Iwamura et al. |
| 6492801 | December 2002 | Sims |
| 6512966 | January 2003 | Lof et al. |
| 6528957 | March 2003 | Luchaco |
| 6549880 | April 2003 | Willoughby et al. |
| 6577962 | June 2003 | Afshari |
| 6591255 | July 2003 | Tatum et al. |
| 6620327 | September 2003 | Haddock |
| 6671585 | December 2003 | Lof et al. |
| 6681154 | January 2004 | Nierlich et al. |
| 6681156 | January 2004 | Weiss |
| 6741485 | May 2004 | Runkle et al. |
| 6804255 | October 2004 | Zheng et al. |
| 6813525 | November 2004 | Reid et al. |
| 6833844 | December 2004 | Shiota et al. |
| 6885915 | April 2005 | Rehtanz et al. |
| 6901347 | May 2005 | Murray et al. |
| 6924628 | August 2005 | Thompson |
| 6925385 | August 2005 | Ghosh et al. |
| 6927503 | August 2005 | Enis et al. |
| 6961641 | November 2005 | Forth et al. |
| 6963802 | November 2005 | Enis et al. |
| 6965454 | November 2005 | Silverbrook et al. |
| 7058522 | June 2006 | Chen |
| 7067937 | June 2006 | Enish et al. |
| 7085660 | August 2006 | Mansingh et al. |
| 7089089 | August 2006 | Cumming |
| 7127327 | October 2006 | O'Donnell et al. |
| 7177727 | February 2007 | Chu et al. |
| 7177728 | February 2007 | Gardner |
| 7194338 | March 2007 | Schlueter et al. |
| 7233843 | June 2007 | Budhraja et al. |
| 7274975 | September 2007 | Miller |
| 7283930 | October 2007 | Flynn |
| 7305282 | December 2007 | Chen |
| 7308361 | December 2007 | Enis et al. |
| 7313465 | December 2007 | O'Donnell |
| 7343226 | March 2008 | Ehlers et al. |
| 7343360 | March 2008 | Ristanovic et al. |
| 7349765 | March 2008 | Reaume et al. |
| 7430534 | September 2008 | Lof et al. |
| 7444189 | October 2008 | Marhoefer |
| 7454270 | November 2008 | Mansingh et al. |
| 7454717 | November 2008 | Hinckley et al. |
| 7509190 | March 2009 | Emery et al. |
| 7519438 | April 2009 | Barbour et al. |
| 7558703 | July 2009 | Stoupis et al. |
| 7610214 | October 2009 | Dwarakanath et al. |
| 7626497 | December 2009 | Mollenkopf |
| 7627453 | December 2009 | Keefe |
| 7689323 | March 2010 | Mansingh et al. |
| 7689394 | March 2010 | Furem et al. |
| 7693670 | April 2010 | Durling et al. |
| 7774307 | August 2010 | Ju et al. |
| 7783390 | August 2010 | Miller |
| 7831569 | November 2010 | Bestgen et al. |
| 7873442 | January 2011 | Tsui |
| 7953519 | May 2011 | Hamilton, II et al. |
| 7974742 | July 2011 | Enis et al. |
| 8019445 | September 2011 | Marhoefer |
| 8019697 | September 2011 | Ozog |
| 8041467 | October 2011 | Black et al. |
| 8090556 | January 2012 | Keefe |
| 8126685 | February 2012 | Nasle |
| 8131401 | March 2012 | Nasle |
| 8222765 | July 2012 | Collins et al. |
| 8280799 | October 2012 | Bing |
| 8396572 | March 2013 | Torzhkov et al. |
| 8401710 | March 2013 | Budhraja et al. |
| 8442698 | May 2013 | Fahimi et al. |
| 8463450 | June 2013 | Martin |
| 8494685 | July 2013 | Shaffer |
| 8494774 | July 2013 | Pasken et al. |
| 8540020 | September 2013 | Stone et al. |
| 8600571 | December 2013 | Dillon et al. |
| 8866334 | October 2014 | Donnelly et al. |
| 9207993 | December 2015 | Jain |
| 10122166 | November 2018 | Zhou et al. |
| 2001/0045949 | November 2001 | Chithambaram et al. |
| 2002/0019802 | February 2002 | Malme et al. |
| 2002/0029097 | March 2002 | Pionzio et al. |
| 2002/0032535 | March 2002 | Alexander et al. |
| 2002/0042789 | April 2002 | Michalewicz et al. |
| 2002/0046157 | April 2002 | Solomon |
| 2002/0085326 | July 2002 | Kim et al. |
| 2002/0103745 | August 2002 | Lof et al. |
| 2002/0198629 | December 2002 | Ellis |
| 2003/0036820 | February 2003 | Yellepeddy et al. |
| 2003/0050738 | March 2003 | Masticola et al. |
| 2003/0055776 | March 2003 | Samuelson |
| 2003/0056126 | March 2003 | O'connor et al. |
| 2003/0115306 | June 2003 | Hagarty et al. |
| 2003/0158631 | August 2003 | Masuda et al. |
| 2003/0171851 | September 2003 | Brickfiled et al. |
| 2004/0020206 | February 2004 | Sullivan et al. |
| 2004/0031059 | February 2004 | Bialk et al. |
| 2004/0044442 | March 2004 | Bayoumi et al. |
| 2004/0093124 | May 2004 | Havlena |
| 2004/0117330 | June 2004 | Ehlers et al. |
| 2004/0139038 | July 2004 | Ehlers et al. |
| 2004/0158360 | August 2004 | Garland et al. |
| 2004/0162675 | August 2004 | Moon |
| 2004/0220702 | November 2004 | Matsubara et al. |
| 2004/0220869 | November 2004 | Perera |
| 2004/0225648 | November 2004 | Ransom et al. |
| 2004/0225649 | November 2004 | Yeo et al. |
| 2004/0246643 | December 2004 | Chen |
| 2004/0249775 | December 2004 | Chen |
| 2004/0257858 | December 2004 | Mansingh et al. |
| 2004/0260430 | December 2004 | Mansingh et al. |
| 2004/0260489 | December 2004 | Mansingh et al. |
| 2004/0267466 | December 2004 | Enis et al. |
| 2005/0033481 | February 2005 | Budhraja et al. |
| 2005/0034023 | February 2005 | Maturana et al. |
| 2005/0039787 | February 2005 | Bing |
| 2005/0049757 | March 2005 | Funakura et al. |
| 2005/0055330 | March 2005 | Britton et al. |
| 2005/0071124 | March 2005 | Komatsu |
| 2005/0090995 | April 2005 | Sonderegger |
| 2005/0096964 | May 2005 | Tsai |
| 2005/0165511 | July 2005 | Fairlie |
| 2005/0169743 | August 2005 | Hicks |
| 2005/0197742 | September 2005 | Scott et al. |
| 2005/0234600 | October 2005 | Boucher et al. |
| 2005/0240381 | October 2005 | Seiler et al. |
| 2005/0240539 | October 2005 | Olavson |
| 2006/0005738 | January 2006 | Kumar |
| 2006/0072271 | April 2006 | Jones et al. |
| 2006/0072828 | April 2006 | Silverbrook et al. |
| 2006/0085363 | April 2006 | Cheng et al. |
| 2006/0089805 | April 2006 | Enis et al. |
| 2006/0092177 | May 2006 | Blasko |
| 2006/0120282 | June 2006 | Carlson et al. |
| 2006/0156248 | July 2006 | Chaudhri et al. |
| 2006/0167591 | July 2006 | McNally |
| 2006/0174209 | August 2006 | Barros |
| 2006/0174211 | August 2006 | Hoellerer |
| 2006/0200308 | September 2006 | Arutunian |
| 2006/0206240 | September 2006 | Tsui |
| 2006/0238364 | October 2006 | Keefe |
| 2006/0238379 | October 2006 | Kimchi et al. |
| 2006/0259199 | November 2006 | Gjerde et al. |
| 2006/0276938 | December 2006 | Miller |
| 2007/0005192 | January 2007 | Schoettle et al. |
| 2007/0083821 | April 2007 | Garbow et al. |
| 2007/0097143 | May 2007 | Ii et al. |
| 2007/0143046 | June 2007 | Budike |
| 2007/0156291 | July 2007 | Curt et al. |
| 2007/0165050 | July 2007 | Baar |
| 2007/0203860 | August 2007 | Golden et al. |
| 2007/0213956 | September 2007 | Nasle et al. |
| 2007/0236507 | October 2007 | Tigges |
| 2007/0244604 | October 2007 | McNally |
| 2007/0266332 | November 2007 | Jubinski |
| 2007/0276547 | November 2007 | Miller |
| 2007/0282495 | December 2007 | Kempton et al. |
| 2007/0285079 | December 2007 | Nasle |
| 2008/0077368 | March 2008 | Nasle |
| 2008/0133313 | June 2008 | Bateni et al. |
| 2008/0154693 | June 2008 | Bateni et al. |
| 2008/0167756 | July 2008 | Golden et al. |
| 2008/0172279 | July 2008 | Enis et al. |
| 2008/0174564 | July 2008 | Kim et al. |
| 2008/0189656 | August 2008 | Abanami et al. |
| 2008/0195255 | August 2008 | Lutze et al. |
| 2008/0215263 | September 2008 | Flohr |
| 2008/0249665 | October 2008 | Emery et al. |
| 2008/0263469 | October 2008 | Nasle et al. |
| 2008/0272934 | November 2008 | Wang et al. |
| 2008/0278311 | November 2008 | Grange |
| 2008/0300698 | December 2008 | Havekost et al. |
| 2008/0301565 | December 2008 | Abhyanker |
| 2009/0047564 | February 2009 | Touvard |
| 2009/0048716 | February 2009 | Marhoefer |
| 2009/0048718 | February 2009 | Richard et al. |
| 2009/0062969 | March 2009 | Chandra et al. |
| 2009/0073191 | March 2009 | Smith et al. |
| 2009/0075663 | March 2009 | Wilson |
| 2009/0093916 | April 2009 | Parsonnet et al. |
| 2009/0118873 | May 2009 | Cheng et al. |
| 2009/0121923 | May 2009 | Mainds et al. |
| 2009/0187284 | July 2009 | Kreiss et al. |
| 2009/0192655 | July 2009 | Ichikawa et al. |
| 2009/0216387 | August 2009 | Klein |
| 2009/0234511 | September 2009 | Ouchi et al. |
| 2009/0240431 | September 2009 | Chau et al. |
| 2009/0254396 | October 2009 | Metcalfe |
| 2009/0265568 | October 2009 | Jackson |
| 2009/0284542 | November 2009 | Baar et al. |
| 2009/0292402 | November 2009 | Cruickshank, III |
| 2009/0299537 | December 2009 | Rea et al. |
| 2009/0319090 | December 2009 | Dillon et al. |
| 2010/0076835 | March 2010 | Silverman |
| 2010/0100250 | April 2010 | Budhraja et al. |
| 2010/0179704 | July 2010 | Ozog |
| 2010/0191385 | July 2010 | Goodnow et al. |
| 2010/0191489 | July 2010 | Zolot |
| 2010/0198421 | August 2010 | Fahimi et al. |
| 2010/0217642 | August 2010 | Crubtree et al. |
| 2010/0217651 | August 2010 | Crubtree et al. |
| 2010/0222935 | September 2010 | Forbes et al. |
| 2010/0223577 | September 2010 | Bennett et al. |
| 2010/0247067 | September 2010 | Gratton |
| 2010/0253142 | October 2010 | Votoupal et al. |
| 2010/0274402 | October 2010 | Shaffer |
| 2010/0281405 | November 2010 | Whattam |
| 2010/0282460 | November 2010 | Stone et al. |
| 2010/0292856 | November 2010 | Fujita |
| 2010/0298998 | November 2010 | Hamilton, II et al. |
| 2011/0029141 | February 2011 | Sun et al. |
| 2011/0029142 | February 2011 | Sun et al. |
| 2011/0029147 | February 2011 | Sun et al. |
| 2011/0035071 | February 2011 | Sun et al. |
| 2011/0046801 | February 2011 | Imes et al. |
| 2011/0066258 | March 2011 | Torzhkov et al. |
| 2011/0071690 | March 2011 | Sun et al. |
| 2011/0071692 | March 2011 | D'Amato et al. |
| 2011/0093123 | April 2011 | Alexanian |
| 2011/0101779 | May 2011 | Patel et al. |
| 2011/0173109 | July 2011 | Synesiou et al. |
| 2011/0184604 | July 2011 | Franke et al. |
| 2011/0202467 | August 2011 | Hilber et al. |
| 2011/0231028 | September 2011 | Ozog |
| 2011/0282508 | November 2011 | Goutard et al. |
| 2011/0282982 | November 2011 | Jain |
| 2011/0296865 | December 2011 | Yuan et al. |
| 2011/0307109 | December 2011 | Sri-Jayantha |
| 2012/0136775 | May 2012 | Cotton |
| 2013/0024710 | January 2013 | Jackson |
| 2015/0255983 | September 2015 | Sum et al. |
| 2016/0041575 | February 2016 | Tadano |
| 2017/0359418 | December 2017 | Sustaeta et al. |
| 101478157 | Jul 2009 | CN | |||
Other References
|
European Office Action dated Jul. 26, 2017 for European Application No. 08782097.3, 3 pages. cited by applicant . European Office Action dated Aug. 28, 2017 for European Application No. 08782095.7, 3 pages. cited by applicant . Office Action dated Dec. 29, 2016 for U.S. Appl. No. 14/231,387, 38 pages. cited by applicant . Notice of Allowance dated Mar. 17, 2017 for U.S. Appl. No. 14/231,387, 26 pages. cited by applicant . Office Action dated Feb. 17, 2012 for U.S. Appl. No. 12/830,004, 32 pages. cited by applicant . Office Action dated Aug. 2, 2012 for U.S. Appl. No. 12/830,004, 32 pages. cited by applicant . Office Action dated Jun. 25, 2012 for U.S. Appl. No. 12/830,019, 42 pages. cited by applicant . Office Action dated Dec. 3, 2012 for U.S. Appl. No. 12/830,019, 35 pages. cited by applicant . Office Action dated Nov. 20, 2014 for U.S. Appl. No. 12/830,049, 14 pages. cited by applicant . Office Action dated Sep. 10, 2015 for U.S. Appl. No. 12/830,004, 33 pages. cited by applicant . Final Office Action dated Dec. 8, 2014 for U.S. Appl. No. 12/830,004, 43 pages. cited by applicant . Office Action dated Jun. 6, 2014 for U.S. Appl. No. 12/830,004, 58 pages. cited by applicant . Office Action dated Jul. 14, 2014 for U.S. Appl. No. 12/830,004, 38 pages. cited by applicant . Office Action dated Sep. 4, 2014 for U.S. Appl. No. 12/830,019, 6 pages. cited by applicant . Office Action dated Jan. 28, 2015 for U.S. Appl. No. 12/830,019,9 pages. cited by applicant . Final Office Action dated Dec. 17, 2015 for U.S. Appl. No. 12/830,004, 55 pages. cited by applicant . Office Action dated Mar. 7, 2016 for U.S. Appl. No. 12/830,011, 52 pages. cited by applicant . Office Action dated Sep. 13, 2016 for U.S. Appl. No. 12/830,004, 39 pages. cited by applicant . Office Action dated Jan. 9, 2017 for U.S. Appl. No. 14/601,838, 69 pages. cited by applicant . K. W. Cheung and R. Rios-Zalapa, "Smart dispatch for large grid operations with integrated renewable resources," ISGT 2011,Hilton Anaheim, CA, 2011, pp. 1-7. cited by applicant . K. Cheung, Xing Wang, But-Chung Chiu, Ying Xiao and R. Rios-Zalapa, "Generation dispatch in a smart grid environment," 2010 Innovative Smart Grid Technologies (ISGT), Gaithersburg, MD, 2010, pp. 1-6. cited by applicant . Non-Final Office Action received for U.S. Appl. No. 12/830,038 dated Oct. 29, 2012, 70 pages. cited by applicant . Final Office Action received for U.S. Appl. No. 12/830,038 dated Mar. 1, 2013, 28 pages. cited by applicant . Non-Final Office Action received for U.S. Appl. No. 12/830,038 dated Sep. 5, 2013, 362 pages. cited by applicant . Signet al., "Load Modelling for Real Time Monitoring of Power Systems", 1977, IEEE, pp. 1908-1914. cited by applicant . Tabari et al., "Maintenance Schedule Aided by a Comprehensive Mathematical Model in Competive Environments", 2004, IEEE,pp. 1774-1779. cited by applicant . Wiedman,T.E., "A Transmission Owner's Perspective on the Future Roles and Responsibilities of Transmission ExpansionPlanning", 2002, IEEE,pp. 1054-1056. cited by applicant . Yadav et al., "Autocorrelation Based Weighing Strategy for Short-Term Load Forecasting with the Self-Oranizing Map", 2010,IEEE, pp. 186-192. cited by applicant . Hobbs et al., "Analysis of the Value for Unit Commitment of Improved Load Forecasts", 1999, IEEE,pp. 1342-1348. cited by applicant . Liu et al., "Combining Multi Wavelet and Multi NN for Power Systems Load Forecasting" Institute of Electrification & Automation,Southwest Jiaotong University, Chengdu, 2008, pp. 666-673. cited by applicant . Lazarevic-A., "Autonomous Grid Scheduling Using Probabilistic Job Runtine Forecasting", PhD dissertation, 2008, 245 pages. cited by applicant . Final Office Action received for U.S. Appl. No. 12/830,038 dated Mar. 13, 2014, 75 pages. cited by applicant . Barton et al., "Energy Storage and Its Use With Intermittent Renewable Energy", IEEE, 2004, pp. 441-448. cited by applicant . Kobayashi et al., "Electrical Load Forecasting using Scatter Search Based Weighted Average Weather Conditions", IEEE, 2006,International Joint Conference on Neural Networks, Jul. 16-21, 2006, pp. 3754-3759. cited by applicant . Mu et al., "Short-term Load Forecasting Using Improved Similar Days Method", IEEE, Mar. 2010, pp. 28-31. cited by applicant . Non-Final Office Action received for U.S. Appl. No. 12/830,038 dated Jul. 18, 2014, 39 pages. cited by applicant . Non-Final Office Action received for U.S. Appl. No. 12/830,038 dated Nov. 10, 2014, 34 pages. cited by applicant . Non-Final Office Action received for U.S. Appl. No. 14/743,958 dated Aug. 7, 2017, 211 pages. cited by applicant . Final Office Action received for U.S. Appl. No. 14/743,958 dated Mar. 21, 2018, 13 pages. cited by applicant . Non-Final Office Action received for U.S. Appl. No. 15/011,844 dated Oct. 19, 2018, 67 pages. cited by applicant . Non-Final Office Action received for U.S. Appl. No. 15/659,770 dated Jul. 12, 2018, 95 pages. cited by applicant . Non-Final Office Action for U.S. Appl. No. 15/790,599 dated Jan. 14, 2019, 69 pages. cited by applicant . Final Office Action for U.S. Appl. No. 15/659,770 dated Nov. 23, 2018, 69 pages. cited by applicant . Non-Final Office Action for U.S. Appl. No. 15/822,291 dated Apr. 2, 2019, 68 pages. cited by applicant . Advisory Action for U.S. Appl. No. 15/659,770 dated Feb. 13, 2019, 60 pages. cited by applicant . Communication pursuant to Article 94(3) EPC received for European Application Serial No. 08796333.6 dated Oct. 22, 2012, 3 pages. cited by applicant . The extended European search report received for European Application Serial No. 08796333.6 dated Feb. 13, 2012, 5 pages. cited by applicant . The extended European search report received for European Application Serial No. 08796327.8 dated Apr. 23, 2012, 5 pages. cited by applicant . Communication pursuant to Article 94(3) EPC received for European Application Serial No. 08782095.7 dated Oct. 19, 2012, 4 pages. cited by applicant . Communication pursuant to Article 94(3) EPC received for European Application Serial No. 08796334.4 dated Oct. 22, 2012, 3 pages. cited by applicant . The extended European search report received for European Application Serial No. 08796334.4 dated Feb. 13, 2012, 5 pages. cited by applicant . Communication pursuant to Article 94(3) EPC received for European Application Serial No. 08782097.3 dated Oct. 19, 2012, 4 pages. cited by applicant . Communication pursuant to Article 94(3) EPC received for European Application Serial No. 08782097.3 dated May 22, 2018, 4 pages. cited by applicant . The extended European search report received for European Application Serial No. 08782097.3 dated Feb. 13, 2012, 6 pages. cited by applicant . Tomsovic, et al. Designing the Next Generation of Real-Time Control, Communication and Computations for Large Power Systems, Proceedings of the IEEE (Special Issue on Infrastructure Systems), 93(5), May 2005. cited by applicant . Overbye, et al., "Visualization of Power Systems and Components: Final Report." 2005. University of Illinois at Urbana-Champaign. Power Systems Engineering Research Center (PSERC) Publication 05-065. cited by applicant . Ray Klump, et al., "An advanced visualization platform for real-time power systems operations". Power Systems Computation Conference (PSCC), Sevilla, Spain, Jun. 2002, 8 pages. cited by applicant . Pathalawaththa, et al., "A power system CAD package for the workstation and personal computer environment." IEEE Transactions on Power Systems. vol. 6, No. 1, pp. 400-406, Feb. 1991. cited by applicant . CERTS Real-Time Voltage Monitoring and VAR Management System, California Energy Commission, Oct. 2003, P500-03-087F, 20 pages. cited by applicant . A.P. Sakis Meliopoulos, Power System Modeling, Analysis and Control, Georgia Institute of Technology, 2002. cited by applicant . Wu, et al., Power System Control Centers; Past, Present, and Future. Proceedings IEEE, 2005, vol. 93; NUMB 11, pp. 1890-1908. cited by applicant . Vilcahuaman, Volt/Var Control with Interactive Graphics Interface on Distribution Systems. Publication and date presently unknown. [Retreived Apr. 9, 2010]. Downloaded from the Internet: ,url.http://www.iansa.com.pe/volt_var_control.pdf. cited by applicant . Rasmussen, "Increasing data center efficiency by using improved high density power distribution", American Power Conversion, pp. 1-10, (2008). cited by applicant . Techsmith. "Snagit", published online at [http://www.techsmith.com/snagit-featue.html], retrieved on Oct. 28, 2011, 2 pages. cited by applicant . Wikipedia. "Snagit", published online at [http://en.wikipedia.org/wiki/snagit] retrieved on Oct. 28, 2011, 3 pages. cited by applicant . International Search Report dated Oct. 9, 2008 for International Patent Application No. PCT/US08/70526, 3 pages. cited by applicant . International Search Report dated Oct. 9, 2008 for International Patent Application No. PCT/US08/70537, 3 pages. cited by applicant . International Search Report dated Oct. 8, 2008 for International Patent Application No. PCT/US08/70544, 3 pages. cited by applicant . International Search Report dated Oct. 9, 2008 for International Patent Application No. PCT/US08/70547, 3 pages. cited by applicant . International Search Report dated Oct. 10, 2008 for International Patent Application No. PCT/US08/70551, 3 pages. cited by applicant . International Search Report dated Oct. 10, 2008 for International Patent Application No. PCT/US08/70552, 3 pages. cited by applicant . Examination Report dated May 2, 2013 for European Patent Application No. 08796334.4-1806, 3 pages. cited by applicant . Examination Report dated May 2, 2013 for European Patent Application No. 08782095.7-1806, 3 pages. cited by applicant . Examination Report dated Mar. 15, 2013 for European Patent Application No. 08796327.8-1806, 3 pages. cited by applicant . Examination Report dated May 2, 2013 for European Patent Application No. 08782097.3-1806, 3 pages. cited by applicant . Examination Report dated May 2, 2013 for European Patent Application No. 08796333.6-1806, 62 pages. cited by applicant . Extended European Search Report dated Oct. 2, 2013 for European Patent Application 08782090.8-1806, 6 pages. cited by applicant . Examination Report dated Sep. 26, 2013 for European Patent Application No. 08 782 095.7-1806, 3 pages. cited by applicant . Office Action dated Jul. 17, 2013 for U.S. Appl. No. 12/139,159, 28 pages. cited by applicant . European Office Action dated Jun. 11, 2014 for European Application Serial No. 08796334.4, 3 pages. cited by applicant . European Office Action dated Jun. 6, 2014 for European Application Serial No. 08782090.8, 4 pages. cited by applicant . European Office Action dated Jul. 8, 2014 for European Application Serial No. 08782097.3, 4 pages. cited by applicant . Non-Final Office Action dated Mar. 13, 2015 for U.S. Appl. No. 13/590,321, 51 pages. cited by applicant . Final Office Action dated Oct. 15, 2015 for U.S. Appl. No. 13/590,321, 31 pages. cited by applicant . Non-Final Office Action dated Aug. 13, 2015 for U.S. Appl. No. 13/658,489, 46 pages. cited by applicant . European Office Action dated Aug. 9, 2015 for European Application Serial No. 08782095.7, 4 pages. cited by applicant . European Office Action dated Aug. 24, 2015 for European Application Serial No. 08782097.3, 4 pages. cited by applicant . European Office Action dated Aug. 21, 2015 for European Application Serial No. 08796334.4, 3 pages. cited by applicant . European Office Action dated Aug. 21, 2015 for European Application Serial No. 08782090.8, 4 pages. cited by applicant . https://www.techsmith.com/snagit.html, 7 pages (Last accessed: Apr. 18, 2016). cited by applicant . https://en.wikipedia.org/wiki/Snagit, 3 pages (Last accessed: Apr. 18, 2016). cited by applicant . Non-Final Office Action dated Jun. 21, 2016 for U.S. Appl. No. 14/231,387, 66 pages. cited by applicant . European Office Action dated Aug. 4, 2016 for European Application Serial No. 08782095.7, 3 pages. cited by applicant . European Office Action dated Aug. 4, 2016 for European Application Serial No. 08782097.3, 3 pages. cited by applicant . Office Action for U.S. Appl. No. 15/091,552 dated Apr. 6, 2018, 57 pages. cited by applicant . Office Action for U.S. Appl. No. 15/091,552 dated Aug. 28, 2018, 17 pages. cited by applicant . Non-Final Office Action received for U.S. Appl. No. 12/139,111 dated Jul. 23, 2009, 19 pages. cited by applicant . Final Office Action received for U.S. Appl. No. 12/139,111 dated Mar. 24, 2010, 19 pages. cited by applicant . Non-Final Office Action received for U.S. Appl. No. 12/139,111 dated Oct. 29, 2010, 21 pages. cited by applicant . Final Office Action received for U.S. Appl. No. 12/139,111 dated Jul. 8, 2011, 22 pages. cited by applicant . Non-Final Office Action received for U.S. Appl. No. 12/139,159 dated Jun. 23, 2011, 41 pages. cited by applicant . Final Office Action received for U.S. Appl. No. 12/139,159 dated Nov. 30, 2011, 28 pages. cited by applicant . Non-Final Office Action received for U.S. Appl. No. 12/139,194 dated Jul. 20, 2011, 27 pages. cited by applicant . Final Office Action received for U.S. Appl. No. 12/139,194 dated Nov. 7, 2011, 25 pages. cited by applicant . Non-Final Office Action received for U.S. Appl. No. 12/139,167 dated Nov. 23, 2011, 27 pages. cited by applicant . Final Office Action received for U.S. Appl. No. 12/139,167 dated Jan. 25, 2012, 18 pages. cited by applicant . Non-Final Office Action received for U.S. Appl. No. 12/139,167 dated May 29, 2012, 15 pages. cited by applicant . Non-Final Office Action received for U.S. Appl. No. 15/091,552 dated Jan. 10, 2019, 20 pages. cited by applicant . Non-Final Office Action received for U.S. Appl. No. 12/139,189 dated Apr. 20, 2010, 39 pages. cited by applicant . Final Office Action received for U.S. Appl. No. 12/139,189 dated Jan. 4, 2011, 36 pages. cited by applicant . Non-Final Office Action received for U.S. Appl. No. 12/139,118 dated Mar. 7, 2011, 20 pages. cited by applicant . Final Office Action received for U.S. Appl. No. 12/139,118 dated Dec. 20, 2011, 25 pages. cited by applicant . Non-Final Office Action received for U.S. Appl. No. 12/830,028 dated Apr. 20, 2012, 23 pages. cited by applicant . Final Office Action received for U.S. Appl. No. 12/830,028 dated May 10, 2012, 19 pages. cited by applicant . Non-Final Office Action received for U.S. Appl. No. 12/830,028 dated Feb. 27, 2013, 25 pages. cited by applicant . Non-Final Office Action received for U.S. Appl. No. 14/012,853 dated May 19, 2014, 55 pages. cited by applicant . Final Office Action received for U.S. Appl. No. 14/012,853 dated Oct. 10, 2014, 43 pages. cited by applicant . Non-Final Office Action received for U.S. Appl. No. 14/012,853 dated Feb. 23, 2015, 18 pages. cited by applicant . Non-Final Office Action received for U.S. Appl. No. 14/012,853 dated Sep. 21, 2015, 46 pages. cited by applicant . Final Office Action received for U.S. Appl. No. 14/012,853 dated Aug. 31, 2016, 47 pages. cited by applicant . Non-Final Office Action received for U.S. Appl. No. 14/012,853 dated Jan. 9, 2017, 38 pages. cited by applicant . Notice of Allowance received for U.S. Appl. No. 14/012,853 dated Aug. 15, 2017, 95 pages. cited by applicant . Office Action dated Sep. 11, 2013 for U.S. Appl. No. 12/830,011, 42 pages. cited by applicant . Office Action dated Oct. 7, 2011 for U.S. Appl. No. 12/830,023, 22 pages. cited by applicant . Office Action dated Feb. 9, 2012 for U.S. Appl. No. 12/830,023, 19 pages. cited by applicant . Office Action dated Sep. 27, 2013 for U.S. Appl. No. 12/830,023, 38 pages. cited by applicant . Office Action dated Apr. 6, 2012 for U.S. Appl. No. 12/380,042, 26 pages. cited by applicant . Office Action dated May 11, 2012 for U.S. Appl. No. 12/380,042, 16 pages. cited by applicant . Office Action dated Dec. 14, 2012 for U.S. Appl. No. 12/380,042, 20 pages. cited by applicant . Office Action dated Apr. 8, 2013 for U.S. Appl. No. 12/380,042, 19 pages. cited by applicant . Office Action dated Feb. 16, 2012 for U.S. Appl. No. 12/830,011, 33 pages. cited by applicant . Office Action dated Mar. 6, 2014 for U.S. Appl. No. 12/830,023, 37 pages. cited by applicant . Office Action dated Mar. 7, 2014 for U.S. Appl. No. 12/830,042, 26 pages. cited by applicant . Office Action dated May 15, 2014 for U.S. Appl. No. 12/830,023, 41 pages. cited by applicant . Office Action dated Aug. 5, 2014 for U.S. Appl. No. 12/830,042, 29 pages. cited by applicant . Office Action dated Nov. 20, 2014 for U.S. Appl. No. 12/830,042, 12 pages. cited by applicant . Office Action dated Mar. 25, 2015 for U.S. Appl. No. 12/830,042, 14 pages. cited by applicant . Office Action dated Feb. 26, 2015 for U.S. Appl. No. 12/830,011, 45 pages. cited by applicant . Final Office Action dated Jul. 1, 2015 for U.S. Appl. No. 12/830,011, 48 pages. cited by applicant . Office Action dated Mar. 16, 2012 for U.S. Appl. No. 12/830,049,23 pages. cited by applicant . Office Action dated Dec. 20, 2012 for U.S. Appl. No. 12/830,049, 27 pages. cited by applicant . Office Action dated Nov. 18, 2013 for U.S. Appl. No. 12/830,049, 16 pages. cited by applicant . Office Action dated Mar. 21, 2014 for U.S. Appl. No. 12/830,049, 19 pages. cited by applicant . Office Action dated Aug. 5, 2014 for U.S. Appl. No. 12/830,049, 19 pages. cited by applicant. |
Primary Examiner: Savla; Arpan P.
Assistant Examiner: Stitt; Erik V
Attorney, Agent or Firm: Fitch Even Tabin & Flannery LLP
Parent Case Text
CROSS-REFERENCE TO RELATED APPLICATION
This application is a continuation of, and claims priority to each of, U.S. patent application Ser. No. 13/590,321 filed Aug. 21, 2012, and entitled "METHODS FOR ASSESSING RELIABILITY OF A UTILITY COMPANY'S POWER SYSTEM", which is a continuation of U.S. patent application Ser. No. 12/139,194 filed Jun. 13, 2008, and entitled "METHODS FOR ASSESSING RELIABILITY OF A UTILITY COMPANY'S POWER SYSTEM", now issued as U.S. Pat. No. 8,321,804, which claims the benefit of U.S. Provisional Patent Application No. Ser. No. 60/952,021 filed Jul. 26, 2007, and entitled "METHODS FOR ASSESSING RELIABILITY OF A UTILITY COMPANY'S POWER SYSTEM". The entireties of the foregoing applications are hereby incorporated by reference herein.
Claims
What is claimed is:
1. A method, comprising: rubber-banding selected geographic areas-of-interest from an electronic display, wherein low and high voltage conditions of the selected geographic areas-of-interest are desired to be managed using volt ampere reactive (VAR) reserves available; determining, by a system comprising a processor, locations and amounts of the VAR reserves available in a power generating system within the selected rubber-banded geographic area, the locations and amounts of VAR reserves available being for generation units, capacitor banks, reactor banks, and static VAR systems of the power generating system; and generating at least one user interface that includes the selected rubber-banded geographic areas-of-interest, the interface comprising elements indicating the locations and the amounts of the VAR reserves available in the power generating system; wherein the selected rubber-banded geographic areas-of-interest are presented at the user interface as a background layer representing the physical geography of the area-of-interest and wherein the amounts of VAR reserves are superimposed over the background layer.
2. The method of claim 1, wherein the determining the amounts of the VAR reserves comprises determining an amount of VAR reserves available in the power generating system for a generation unit, and wherein the determining the amount of the VAR reserves for the generation unit comprises determining an injection reactive reserve of the generation unit that is a mega VAR (MVAR) maximum of the generation unit minus a MVAR output of the generation unit, and determining an absorption reactive reserve of the generation unit that is the MVAR output of the generation unit minus a MVAR minimum of the generation unit.
3. The method of claim 1, wherein the determining the amounts of the VAR reserves comprises determining an amount of VAR reserves available in the power generating system for a capacitor bank, and wherein the determining the amount of the VAR reserves for the capacitor bank comprises determining an injection reactive reserve of the capacitor bank that is a first summation of nominal mega VAR (MVAR) of capacitors of the capacitor bank that are open or disconnected, and determining an absorption reactive reserve of the capacitor bank that is a second summation of nominal MVAR of capacitors of the capacitor bank that are closed.
4. The method of claim 1, wherein the determining the amounts of the VAR reserves comprises determining an amount of VAR reserves available in the power generating system for a reactor bank, and wherein the determining the amount of the VAR reserves for the reactor comprises determining an injection reactive reserve of the reactor bank that is a first summation of nominal mega VAR (MVAR) of capacitors of the reactor bank that are closed, and determining an absorption reactive reserve of the reactor bank that is a second summation of nominal MVAR of capacitors of the reactor bank that are open or disconnected.
5. The method of claim 1, wherein the determining the amounts of the VAR reserves comprises determining an amount of VAR reserves available in the power generating system for a static VAR system, and wherein the determining the amount of the VAR reserves the static VAR system comprises determining an injection reactive reserve of the static VAR system that is a mega VAR (MVAR) output of the static VAR system minus a MVAR minimum of the static VAR system, and determining an absorption reactive reserve of the static VAR system that is a MVAR maximum of the static VAR system minus a second MVAR output of the static VAR system.
6. The method of claim 1, wherein the locations and the amounts of the VAR reserves available in the power generating system are determined in real-time during operation of the power generating system for generating power.
7. The method of claim 1, further comprising applying highlighting to the at least one user interface on geographic areas having insufficient VAR reserves.
8. A system, comprising: a memory that stores executable components; and a processor, communicatively coupled to the memory, that executes or facilitates execution of the executable components to perform operations, comprising: receiving selected rubber-banded geographic areas-of-interest, wherein low and high voltage conditions of the selected geographic areas-of-interest are desired to be managed using volt ampere reactive (VAR) reserves available; determining locations and amounts of the VAR reserves available in a power generating system within the selected rubber-banded geographic areas-of-interest, the locations and amounts of VAR reserves available being for generation units, capacitor banks, reactor banks, and static VAR systems of the power generating system; and generating at least one user interface that includes the selected rubber-banded geographic areas-of-interest, the interface comprising elements indicating the locations and the amounts of the VAR reserves available in the power generating system; wherein the selected rubber-banded geographic areas-of-interest are presented at the user interface as a background layer representing the physical geography of the area-of-interest and wherein the amounts of VAR reserves are superimposed over the background layer.
9. The system of claim 8, wherein the determining the amounts of VAR reserves comprises determining an amount of VAR reserves available in the power generating system for a generation unit, and wherein the determining the amount of VAR reserves for the generation unit comprises determining an injection reactive reserve of the generation unit that is a mega VAR (MVAR) maximum of the generation unit minus a MVAR output of the generation unit, and determining an absorption reactive reserve of the generation unit that is the MVAR output of the generation unit minus a MVAR minimum of the generation unit.
10. The system of claim 8, wherein the determining the amounts of VAR reserves comprises determining an amount of VAR reserves available in the power generating system for a capacitor bank, and wherein the determining the amount of VAR reserves for the capacitor bank comprises determining an injection reactive reserve of the capacitor bank that is a first summation of nominal mega VAR (MVAR) of capacitors of the capacitor bank that are open or disconnected, and determining an absorption reactive reserve of the capacitor bank that is a second summation of nominal MVAR of capacitors of the capacitor bank that are closed.
11. The system of claim 8, wherein the determining the amounts of VAR reserves comprises determining an amount of VAR reserves available in the power generating system for a reactor bank, and wherein the determining the amount of VAR reserves for the reactor bank comprises determining an injection reactive reserve of the reactor bank that is a first summation of nominal mega VAR (MVAR) of capacitors of the reactor bank that are closed, and determining an absorption reactive reserve of the reactor bank that is a second summation of nominal MVAR of capacitors of the reactor bank that are open or disconnected.
12. The system of claim 8, wherein the determining the amounts of VAR reserves comprises determining an amount of VAR reserves available in the power generating system for a static VAR system, and wherein the determining the amount of VAR reserves for the static VAR system comprises determining an injection reactive reserve of the static VAR system that is a mega VAR (MVAR) output of the static VAR system minus a MVAR minimum of the static VAR system, and determining an absorption reactive reserve of the static VAR system that is a MVAR maximum of the static VAR system minus a second MVAR output of the static VAR system.
13. The system of claim 8, wherein the locations and the amounts of the VAR reserves available in the power generating system are determined dynamically during operation of the power generating system for generating power.
14. The system of claim 8, the operations further comprising highlighting the at least one user interface at geographic areas having insufficient VAR reserves.
15. A non-transitory computer-readable medium having instructions stored thereon that, in response to execution, cause a system including a processor to perform operations comprising: receiving selected rubber-banded geographic areas-of-interest, wherein low and high voltage conditions of the selected geographic areas-of-interest are desired to be managed using volt ampere reactive (VAR) reserves available; determining locations and amounts of the VAR reserves available in a power generating system within the selected rubber-banded geographic areas-of-interest, the locations and amounts of VAR reserves available being for generation units, capacitor banks, reactor banks, and static VAR systems of the power generating system; and generating at least one user interface that includes the selected rubber-banded geographic areas-of-interest, the interface comprising element indicating at least one location of the locations and at least one amount of the amounts of the VAR reserves available in the power generating system; wherein the selected rubber-banded geographic areas-of-interest are presented at the user interface as a background layer representing the physical geography of the area-of-interest and wherein the amounts of VAR reserves are superimposed over the background layer.
16. The non-transitory computer-readable medium of claim 15, wherein the determining the amounts of VAR reserves comprises determining an amount of VAR reserves available in the power generating system for a generation unit, and wherein the determining the amount of VAR reserves for the generation unit comprises determining an injection reactive reserve of the generation unit that is a mega VAR (MVAR) maximum of the generation unit minus a MVAR output of the generation unit, and determining an absorption reactive reserve of the generation unit that is the MVAR output of the generation unit minus a MVAR minimum of the generation unit.
17. The non-transitory computer-readable medium of claim 15, wherein the determining the amounts of VAR reserves comprises determining an amount of VAR reserves available in the power generating system for a capacitor bank, and wherein the determining the amount of VAR reserves for the capacitor bank comprises determining an injection reactive reserve of the capacitor bank that is a summation of nominal mega VAR (MVAR) of capacitors of the capacitor bank that are open or disconnected, and determining an absorption reactive reserve of the capacitor bank that is a summation of nominal MVAR of capacitors of the capacitor bank that are closed.
18. The non-transitory computer-readable medium of claim 15, wherein the determining the amounts of VAR reserves comprises determining an amount of VAR reserves available in the power generating system for a reactor bank, and wherein the determining the amount of VAR reserves for the reactor bank comprises determining an injection reactive reserve of the reactor bank that is a summation of nominal mega VAR (MVAR) of capacitors of the reactor bank that are closed, and determining an absorption reactive reserve of the reactor bank that is a summation of nominal MVAR of capacitors of the reactor bank that are open or disconnected.
19. The non-transitory computer-readable medium of claim 15, wherein the determining the amounts of VAR reserves comprises determining an amount of VAR reserves available in the power generating system for a static VAR system, and wherein the determining the amount of VAR reserves for a static VAR system comprises determining an injection reactive reserve of the static VAR system that is a mega VAR (MVAR) output of the static VAR system minus a MVAR minimum of the static VAR system, and determining an absorption reactive reserve of the static VAR system that is a MVAR maximum of the static VAR system minus a second MVAR output of the static VAR system.
20. The non-transitory computer-readable medium of claim 15, wherein the locations and the amounts of the VAR reserves available in the power generating system are determined on the fly during operation of the power generating system for generating power.
Description
BACKGROUND OF THE INVENTION
Field of the Invention
This invention relates generally systems and methods that improve energy management, and more particularly to systems and methods for the utility market.
Description of the Related Art
The modern electric power grid begins as the primary circuit leaves the generating sub-station, is transported via transmission line, distributed via distribution feeders, and ends as the secondary service enters the customers meter socket. This invention relates to the management of the transmission system, from a control center, which purpose is to maintain ail equipment within operating limits and to ensure the provision of electricity at a reliability rate greater than 99.999%.
To manage the grid, electric utilities rely on Energy Management Systems (EMS) which are mission critical information system that collect data from the field and can control protection devices from the control center via a Supervisory Control and Data Acquisition system (SCADA).
The EMS are more sophisticated today with advanced algorithms and increasing volume of data coming from smarter grids that are equipped with intelligent electronic devices (IED).
However, intelligent grids and sophisticate power system algorithms that process field data will not suffice to prevent human errors in control centers. Operators continuously train to adapt to new system conditions and react to emergency situations. This general aptitude to master complex information and make correct decisions is referred to as "situation awareness".
Catastrophic failures of a power system are relatively uncommon, but they are spectacular when they happen. Twenty-five million people in the northeastern United States lost electric power for 12 hours in 1965. Another blackout shut down New York City for several days in 1977. And in 2003, the largest power failure in North American history left 40 million people in an area in the United States stretching from Massachusetts, Connecticut, New York and New Jersey west to Ohio and Michigan, and 10 million people in eastern Canada, without power. The lack of adequate situational awareness at multiple levels was one of the root causes of the Aug. 14, 2003 massive power blackout in North America.
Designing tools for adequate Situation Awareness (SA) includes that: the following factors be kept in mind; so-called "enemies of situational awareness"; attention tunneling, requisite memory trap; data overload; misplaced salience; complexity creep, errant, mental models, out-of-the-loop syndrome; workload, anxiety, fatigue, and other stress factors.
There is a need for methods that assess reliability of power systems of a utility company. There is a further need for methods that assess reliability of power systems of a utility company with violation markers that are displayed on a main overview display.
SUMMARY OF THE INVENTION
Accordingly, an object of the present invention is to provide methods for assessing reliability of power systems of a utility company.
Another object of the present invention is to provide methods for assessing reliability of power systems of a utility company with viola Don markers that are displayed on a main overview display.
A further object of the present invention is to provide methods for assessing reliability of power systems of a utility company with violation markers
and showing only those violations associated for a selected violated element on a monitored elements tab.
Yet another object of the present invention is to provide methods for assessing reliability of power systems of a utility company with violation markers and showing vital data related to violations selected on an overview display.
These and other objects of the present invention are achieved in a method of assessing reliability or a power system of a utility company. At least one main overview display is obtained. Violation markers are displayed on the one main overview display. A monitored elements tab is updated with a list of monitored elements.
DESCRIPTION OF THE DRAWINGS
FIG. 1 is a block diagram illustrating one embodiment of an energy management system of the present invention that provides real time awareness of a potential energy management failure.
FIG. 2 is a block diagram illustrating one embodiment of an energy management system of the present invention which has situational dashboard panels.
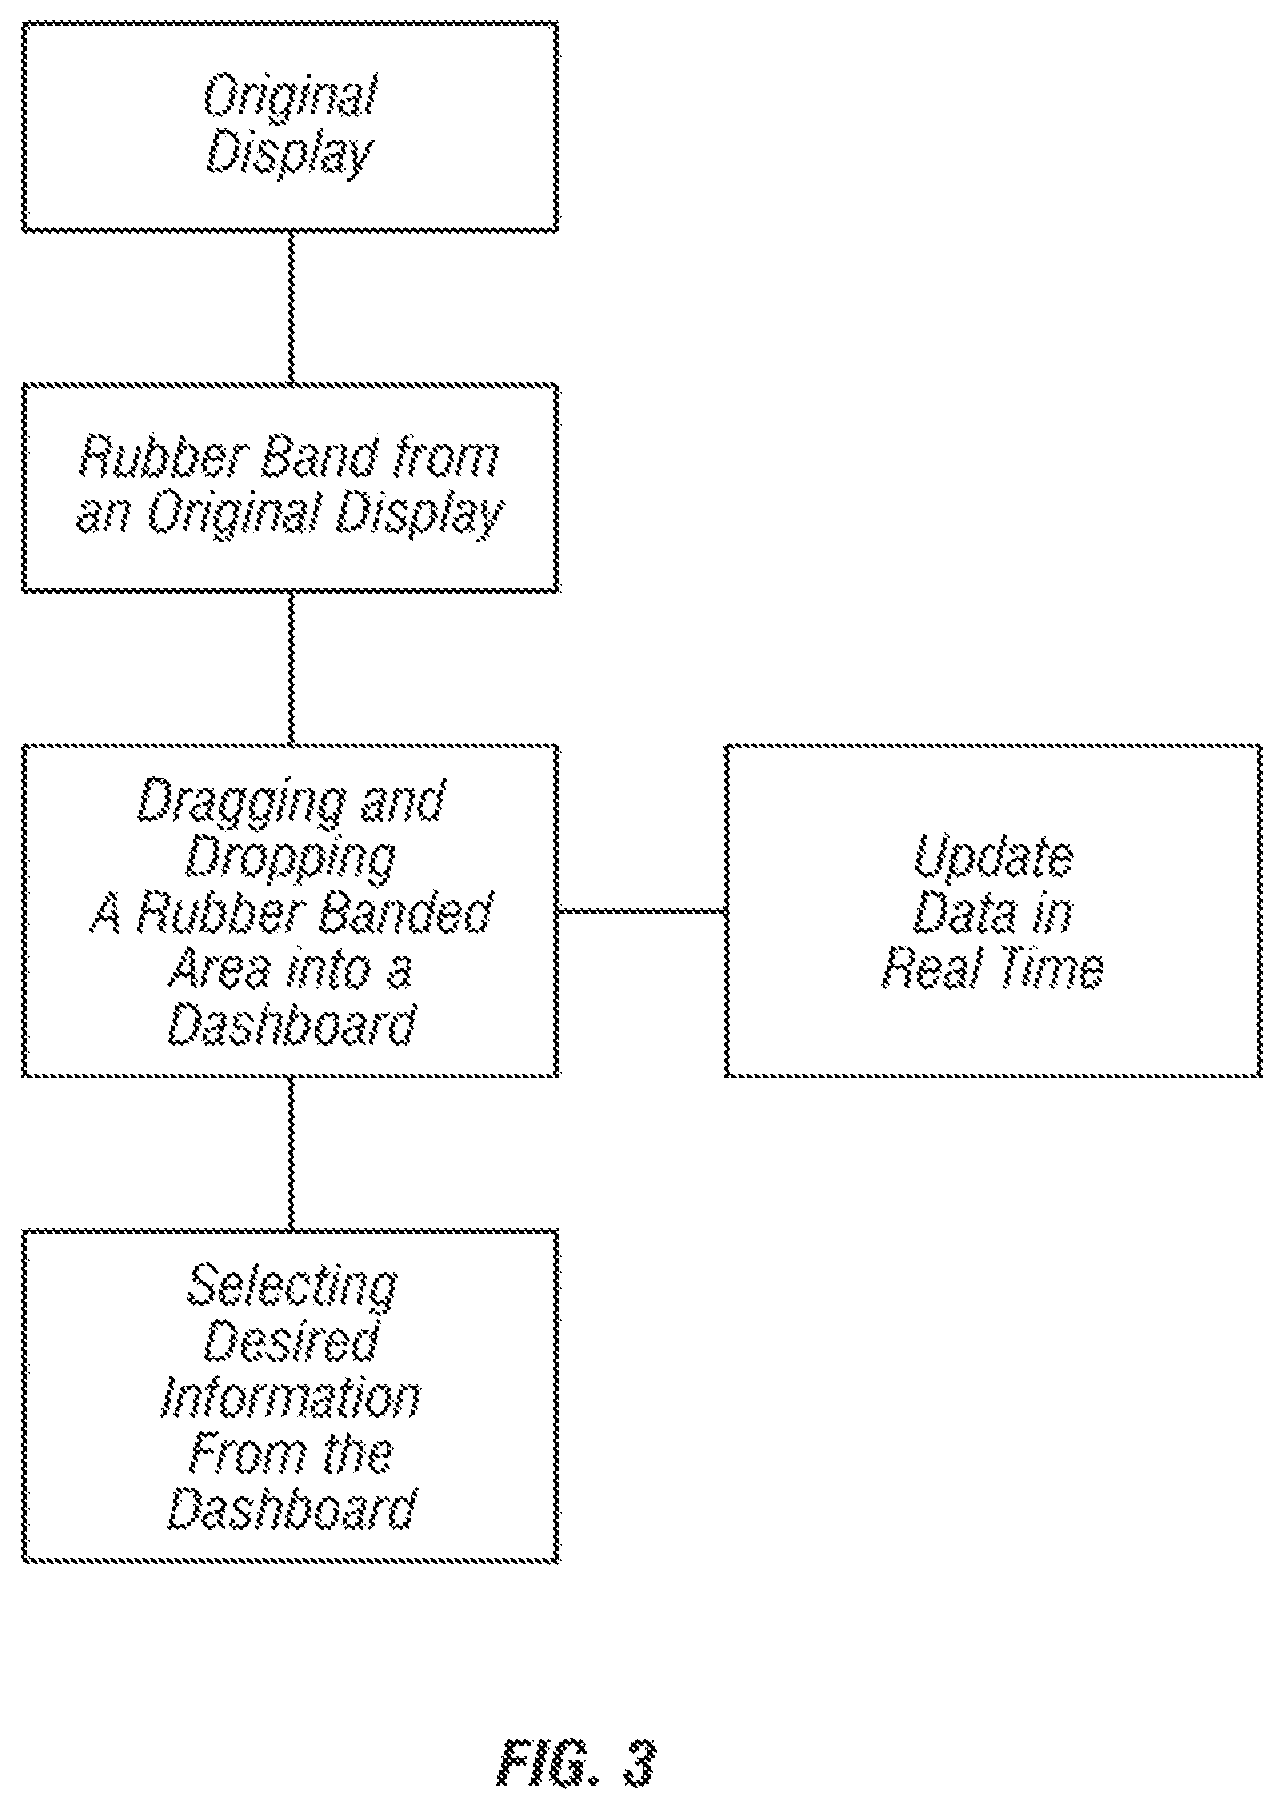
FIG. 3 is a flow chart illustrating one application of the FIG. 2 system.
FIG. 4 illustrates one embodiment of a custom dashboard of the present invention sourced from three different displays.
FIG. 5 is a flow chart illustrating one embodiment of a method of the present invention that assesses potentially compromising situations of a utility company.
FIG. 6 illustrates one embodiment of a fly-out and a pod of the present invention.
FIG. 7 illustrates one embodiment of a geographical overview with a background layer representing the aerial view of an area of the present invention.
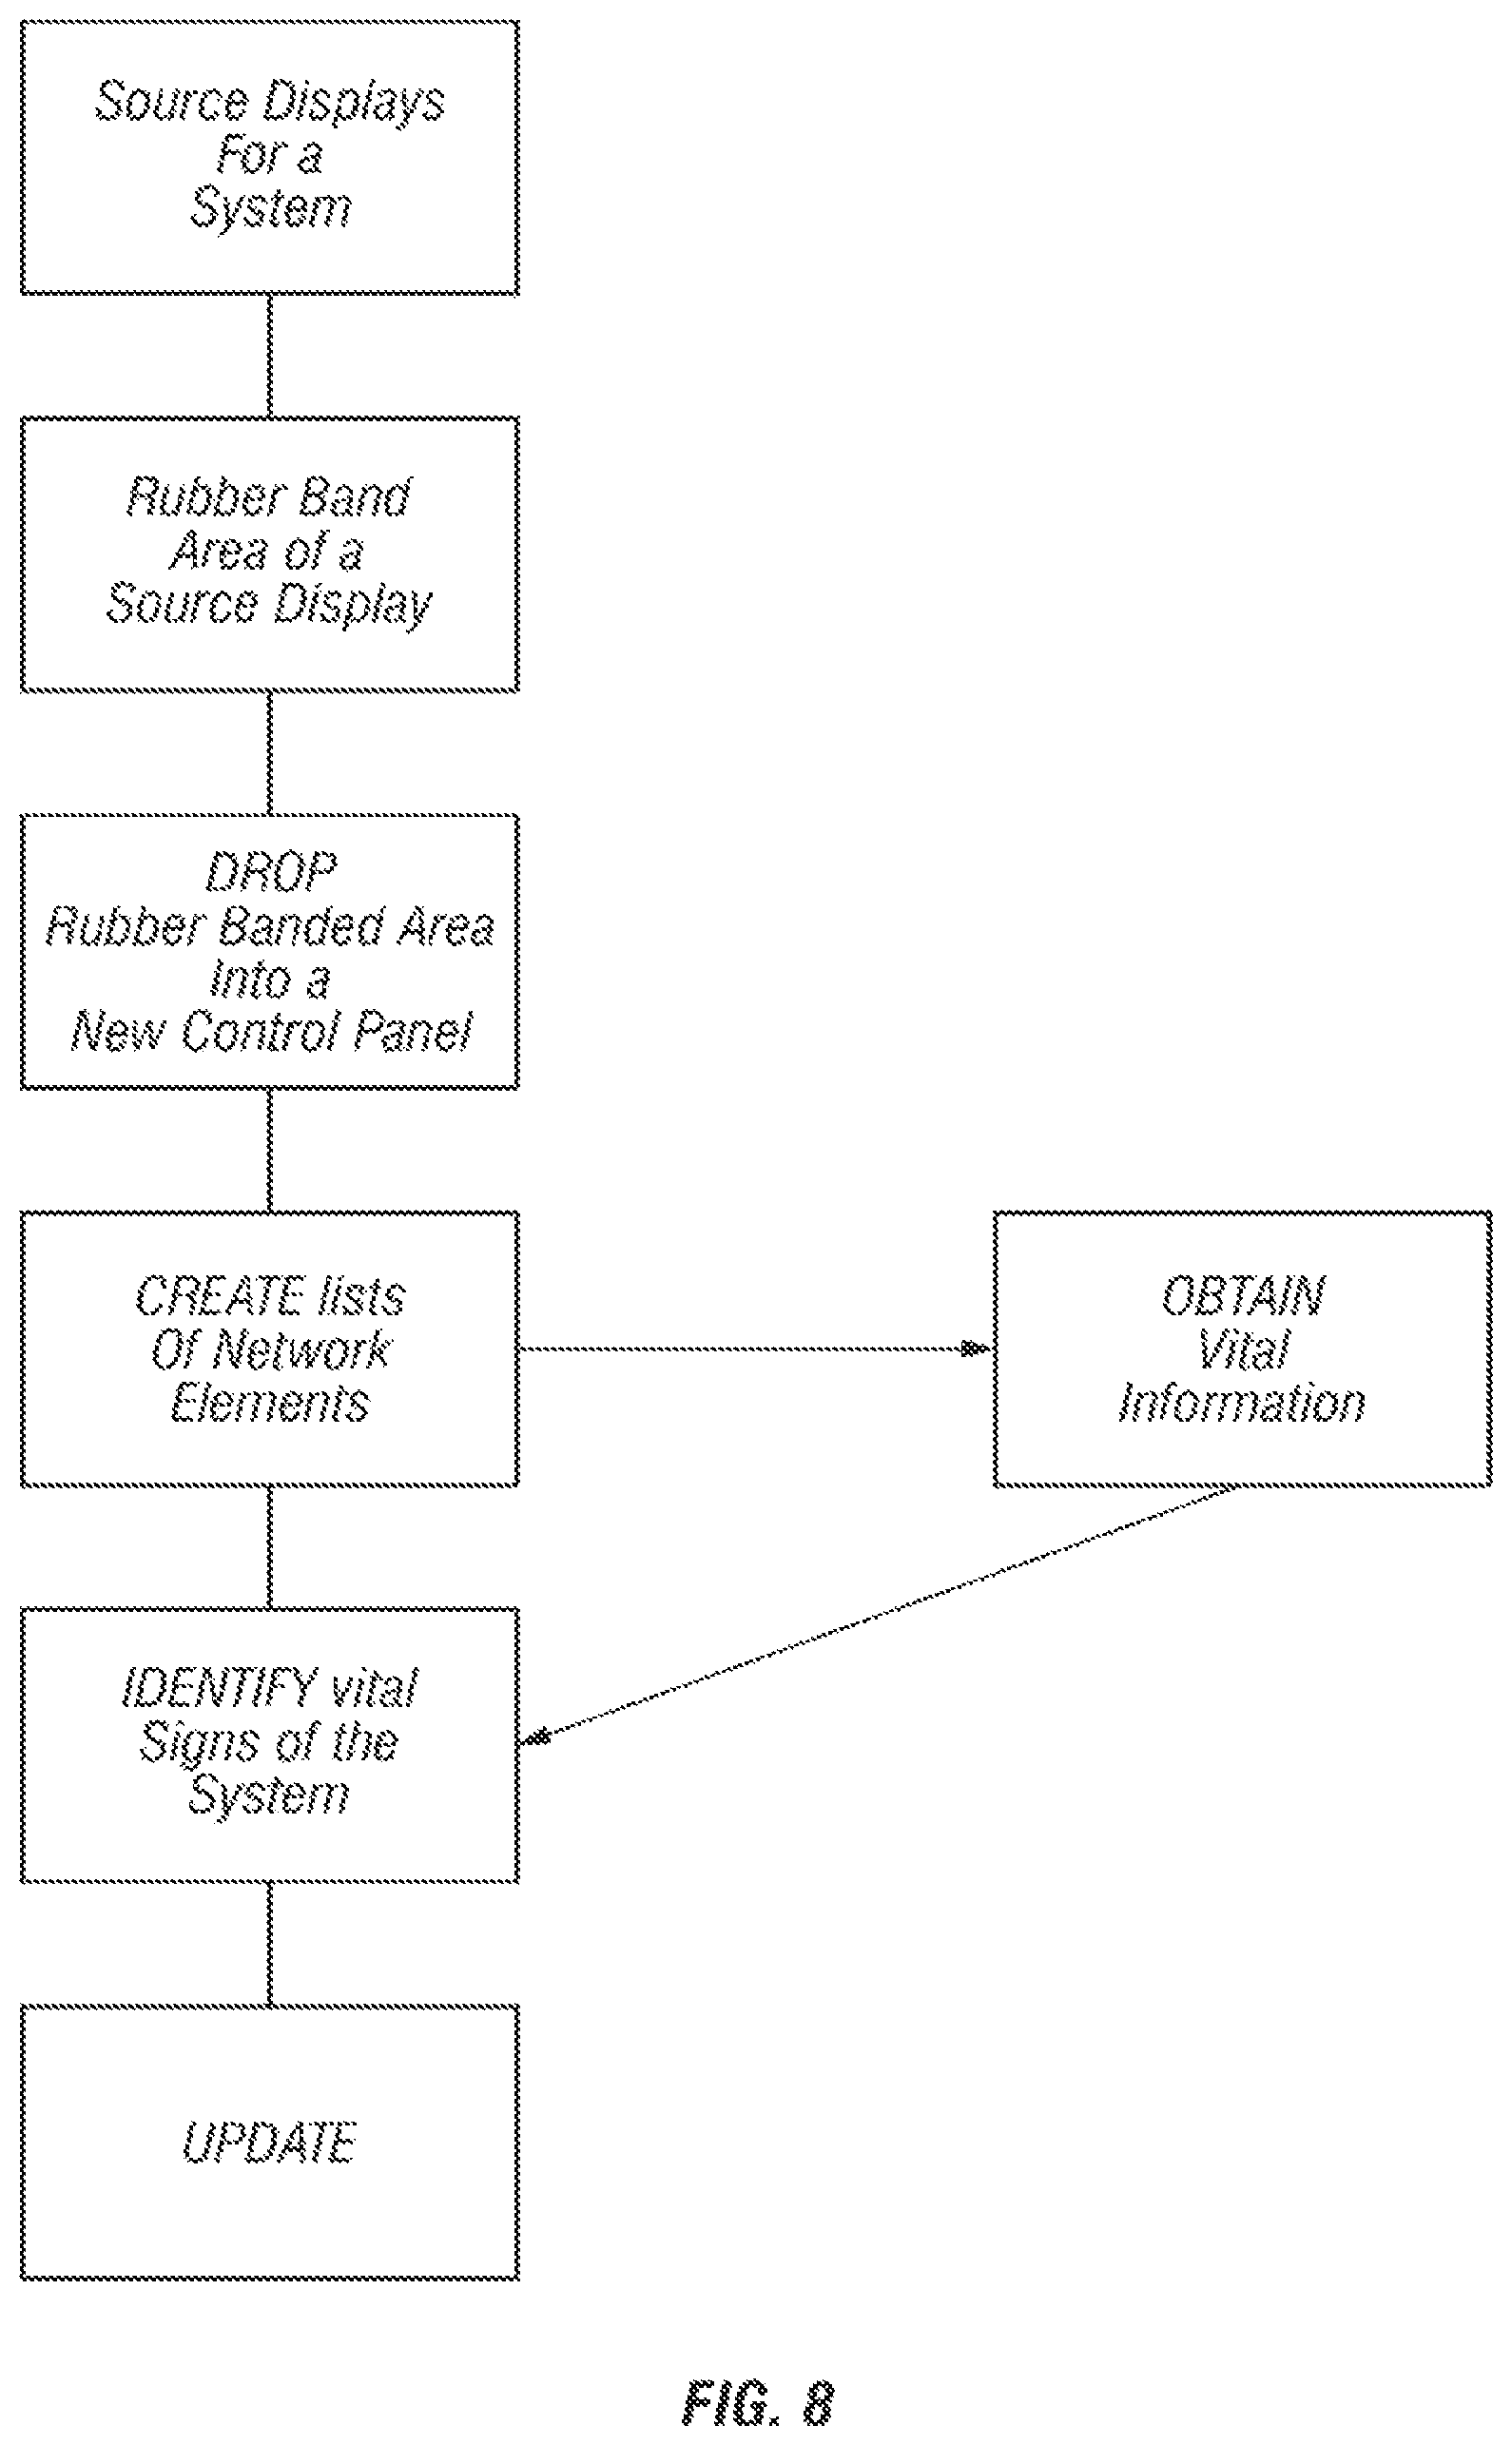
FIG. 8 is a flow chart illustrating one embodiment of a method of the present invention that creates dynamic lists from selected areas of a power system of a utility company using rubber-banding or lassoing.
FIG. 9 illustrates one embodiment of area selection that can be used with the flow chart of FIG. 8.
FIG. 10 illustrates one embodiment of vital signs for a selected element that can be utilized with the flow chart of FIG. 8.
FIG. 11 is a flow chart illustrating one embodiment of a method of the present invention for managing high and low voltage conditions from selected areas of a power system of a utility company.
FIG. 12 illustrates one embodiment of a MVAR Reserve dashboard that is automatically calculated based on the selected area and can be associated with the FIG. 11 flow chart.
FIG. 13 illustrates a 3D view of the available MVARs using the positive and negative reactive reserves toolbar buttons, and can be associated with the FIG. 11 flow chart.
FIG. 14 is a flow chart illustrating one embodiment of a method of the present invention for assessing reliability of a power system of a utility company.
FIG. 15 is associated with the FIG. 14 flow chart and illustrates that if a new violation appears following the execution of the State Estimator (SE), an alert is displayed of the viewport.
FIG. 16 is associated with the FIG. 14 flow chart and shows a selected branch.
FIG. 17 is associated with the FIG. 14 flow chart and shows how markers associated with the monitored elements in post contingency violations are displayed.
FIG. 18 is associated with the FIG. 14 flow chart and shows that to drill down into a particular violation, the operator can select a violation marker for an Alarm on branch.
FIG. 19 is associated with the FIG. 14 flow chart and illustrates that when a contingent element creates a violation, a square marker can be provided.
FIG. 20 is associated with the FIG. 14 flow chart and illustrates that selecting a contingent element marker can cause a display all violations that a particular contingent element creates.
FIG. 21 is associated with the FIG. 14 flow chart and shows a Contingency Tab in a control panel.
DETAILED DESCRIPTION OF THE PREFERRED EMBODIMENT
In various embodiments, the present invention provides a system and methods for enhance situational awareness for a control center of a utility company for improved energy management, to drill down on potential conditions that effect the distribution of power, and mitigates these potential conditions before catastrophic failures occur, provide a real time application of advanced graphics to display the current status of a power system of one or more utility companies, and the like. The present invention represents a new and improved way to design user interface, independently of the underlying application to display a 3D view of the available MVARs using the positive and negative reactive reserves toolbar buttons, as shown in FIG. 13.
The present invention represents a new and improved way to design user interface, independently or the underlying applications, algorithms, or databases. The main display is therefore targeted at a specific operator's task which may span several applications. Traditionally, a operator had to navigate among different user interfaces to achieve the same objective, albeit with much less productivity and slower reaction time.
The present invention is designed for mission critical systems that deal with large volume of data refreshed in real-time every seconds. These information systems cannot fail and must be available at a minimum 99.95% of the time.
The present invention is also designed to re-use most of the existing software applications already in place within the control center. Low cost of maintenance is achieved with automatic generation of displays and re-use of existing assets (software and hardware).
The systems and methods of the present invention can be used by utility companies that have a system including but not limited to power systems. The present invention can also be used by water management systems, petro-chemical systems, transportations systems, and the like. The power system is managed to bring energy to an end user and includes generation, transmission and distribution system. With the present invention, satellite maps can be utilized.
As illustrated in FIG. 1, one embodiment of the present invention has an energy management system that includes: a control center at a utility company; logic resources coupled to the power system that provide a real time notice of conditions which effect energy management of the utility company; and at least one user interface at the control center coupled to the logic resources. The user interfaces provide real time situation awareness of a potential energy management failure. The conditions can be one or more of energy, distribution, generation, transmission and energy market systems.
With the use of situation awareness of the present invention, a real time notice of conditions can be provided prior to an occurrence of, a catastrophic failure of power delivery, catastrophic power generation, catastrophic transmission and energy market systems and the like.
Situation awareness is perception and/or comprehension and is auditory and/or visual. Situational awareness, (i) improves energy management, facilitates drilling down on conditions that can effect energy management (ii) facilitates distribution of power, generation of power, transmission and energy market systems, (iii) mitigates the effects of conditions that can create failures in energy management and (iv) mitigates conditions that can create failures including best not limited to, delivery of power, generation of power, transmission and energy market systems.
The logic resources and the user interface are coupled to the power or distribution system of the utility company. The logic resources uses an overview of the majority of the utility system and drills down to more detailed views of the utility system.
The logic resources can be configured to re-use at least a portion of data and configurations from pre-existing software applications already in place in the control center. As a non-limiting example, the pre-existing software applications can include information of, system 1 lines, 1 line diagrams and/or asset information. The user interfaces provide a specific operator's task that can scan one or several utility company applications without navigating between different user interfaces of the control center.
The user interfaces include graphics that display one or more of, current status, mitigating factors and recommendations of the power system for one or more utility companies. The user interfaces can include advanced graphics that display a current: status of power generation, power generation, transmission and/or energy market systems. The user interfaces can be independent of an energy management application. In one embodiment, the user interfaces are automatically generated in response to data and configuration from pre-existing software or pre existing software applications and also uses its own. The user interfaces can be a model drivers overview, where the model driven overview combines coordinate system based on a geographical coordinate system including but not limited to GIS and the like.
One or more context panels can be provided with context data relative to a given situation facing the utility company. One or more information systems can also be provided that are refreshed in real-time. By way of non-limiting examples, the information system can be refreshed in a time period of from 1 second to 15 minutes, depending on the information and the situation.
In another embodiment of the present invention, illustrated in FIGS. 2 and 3, situational dynamic dashboards are created graphically and dynamically by operators. The situational dashboards can be built on-the-fly by combining subsets of, different displays, tabulars, one-lines, regional schematic and/or geographic overviews. The logic resources enable the operators to create their own dashboards from large geographical overviews, regional schematic displays and station one-line displays to assist operators in assessing a potentially compromising situation of the electric power system. Portions of the displays that are dropped onto a situational dashboard display can continue to be updated in real-time with live data.
As a non-limiting example, the potentially compromising situation can be, system violations of type branch, low voltage, high voltage and/or delta voltage, low or high voltage situation in a given area of the system, actual or potential system violations as a result of megawatts or megavars, and the like. The situational dashboards can be built on-the-fly by combining subsets of different displays, tabulars, one-lines, schematic, geographic overviews and the like, onto a dashboard area. The dashboards are saveable and reuseable, and are useful for identifying potentially compromising situations.
FIG. 4 shows an example of a custom dashboard of the present invention sourced from three different displays. The operator selects the displays of interest. Snippets from the original displays are selected by rubber-banding, the selected area is cut (initiated by the operator "drag" operation) and then pasted, initiated by the operator "drop" operation, into the dashboard. The portions of the displays that are dropped onto a dashboard display continue to be updated in real-time. The result is a new dashboard display. Once created, a dashboard can be saved and recalled later just as any other display in the system and is refreshed with live data. The benefits of a dynamically created dashboard, which is created to specifically address a situation, is that it allows the operator to select only the information that is relevant to the situation which the operator is facing. This reduces the workload on the operator since the operator needs to focus only on what is relevant not a collection of displays which have vast amount of information on it which may not be relevant. The concept is simple: provide the operator with only the information he needs to do the job, not all the data that the system has and letting the operator constantly review the data and extract what is needed. One the dynamic dashboards are created they can be saved and re-used should the situation present itself, thus eliminating setup time.
In one embodiment, a fly-out or data tensing is provided. A fly-out is an effective, way to dynamically select, an area of a large overview display of the power system, or any display for that matter to direct the operator attention to where or what in the power system needs attention without loosing perspective of the whole power system which is being monitored and controlled.
The operator selects an area of the overview which it wishes to focus on by rubber-banding or lasso the area. The selected area of interest is cut and pasted into a fly-out. The fly-out cars be moved and resized by dragging and resting the fly-out border to enhance the usability of the fly-out.
As illustrated in FIG. 5, projection lines are can be drawn from the source display to the fly-out to maintain reference to toe source such that the operator always knows about the reference source of the fly-out. The projection lines can be used with multiple fly-outs, and can track multiple situations at the same time. This is important because an operator may be tracking multiple situations at the same time and must be aware of the context of each of the situations from the multiple situations. The projection lines provide the operator with an awareness of a context of situations and information about a reference source of the fly-out.
A pod is a fly-out that has been un-pinned from the source display. Pods can be organized as additional windows to monitor specific information such as overload condition on a power line or a low voltage condition. FIG. 6 shows an example of a fly-out and a pod. Situation awareness principles can be utilized with the fly-out. The use of a fly-out allows an operator to generate informational displays without ever leaving the main overviews in order to accomplish a goal. This reinforces the goal of providing a use case based application. The operator is provided with only what it needs to the job and nothing else that can distract the operator from the task that the operator has been asked to do.
FIG. 7 shows an example of a geographical overview with a background layer representing the aerial view of an area. Other types of operator selected backgrounds, such as jpegs and bitmaps, can be used. In one embodiment, geographic satellites are used to obtain the geographical overview. The operator can then pan and zoom, with different tiles coming up on the display.
Depending on the portion of the overview which is visible and the zoom level, the corresponding tile for the matching background is obtained from the site. Once it is obtained it is locally cached for performance improvement and displayed as the background layer. As the operator pans and the zooms the display new tiles are retrieved and displayed. For efficiency only, the required tiles are loaded into memory and visible in the background.
For optimal visibility depending on the display and control room lighting, the operator can adjust the opacity of the background image using a dialog which is available for invocation from an icon on the toolbar.
FIG. 7 also shows a navigation window and a magnifier in use.
In another embodiment of the present invention, illustrated in FIG. 8, a method is provided for creating dynamic lists from selected areas of the power system of the utility company. The energy management system is used to access one or more source displays of a site. One or more of the source displays are then rubber-banded or lassoed to create the selected areas from at least a portion of the source displays. Lists, which can be in tabular form, are dynamically created that display operator defined information for each network element type in a list of network elements from the selected areas that have been rubber-handed or lassoed. By way of illustration, and without limitation, the network elements can include one or more of, substations, lines, generators, capacitors, loads, transformers. Static Var Compensators and inductors, and the like. These lists are dynamically created for an operator selected area of the power system to quickly obtain vital signs for the system within the selected area.
In this embodiment the operator selects an area by rubber-banding or lassoing an area on the display using a device such as a mouse. All the network elements in the selected area of interest are identified.
The selected area is dragged into a new control panel tab and dropped into the tab. The action of "drag and drop" constitutes the creation of a new list of elements the operator wants to obtain vital information for vital signs. The new list of elements is created by identifying network elements within a perimeter of the selected area. As a non-limiting example, the network elements can be each station and each line within the boundary of the selected area.
The information, which makes up the vital signs, is operator definable. As a non-limiting example, the vital information can be one or more of, the state of the line, energization status of the lines, MegaWatt flows, MegaVar flows of the line, station load, station generation in MegaWatt and MegaVars and the like. The present invention takes care of retrieving, from the energy management system, the most recent data associated with this selection, and automatically keeps it up to date. Once the new list is created it can be saved and recalled for future use.
An area selection is shown in FIG. 9. Vital signs for a selected element are shown in FIG. 10.
In one embodiment, the system of the present invention automatically populates the list and receives vital data for all of the elements in this list. The custom list can be given a name and saved for future use.
The control panel can have a special tab, called "Lists," which contains the names of all the custom-created areas. In one specific embodiment, the control panel has a MVAr Reserve tab that contains names of dynamically created MVar Reserve areas for a selected geographic representation of the power system.
Referring now to FIG. 11, the present invention also provides an operator with knowledge about where and how much VAR Reserves are available. This is particularly useful for operators facing high or low voltage situations. In a such a situation the operator needs to know if there are sufficient Vars in the area where the low or high voltage condition manifests itself so that they can be injected info or removed from the power system.
In another embodiment of the present invention, a method is provided for managing high or low voltage conditions from selected areas of a power system of a utility company using VAR reserves. Selected geographic are rubber banded or lassoed and potential low or high voltage situations are identified. The control panel can include a context menu. The context menu can be used to show VAR reserves. Once the area is selected, the operator selects the option "Show Reserves" from the context menu to display the MVAR Reserves available within the area. For the selected area, all network elements are identified and a query is generated to obtain the MVAR Reserves associated with the identified network elements. Geographic displays are overlayed with superimposed VAR reserves to create overlayed geographic displays that are used to identify potential low or high voltage instances in the selected geographic areas
In one embodiment, voltage contours are used to identify the potential low or high voltage instances. The overlayed geographic displays can be used to provide power flow information of the power system which can be in real time as well as to determine available VAR reserves. The geographic displays can be used to determine if there are sufficient VARS in portions or all of the selected geographic areas where low or high voltage conditions are manifest.
The location and amount of available VAR reserves is determined, and real time information relative to location and amount of available VAR reserves can be provided.
The available VAR reserves can be displayed as a summary for injection into the system and for absorption out of the system by device type, e.g., generation units, capacitor banks, reactor banks, and static Var systems). FIG. 12 shows the MVAR Reserve dashboard, which is automatically calculated based on the selected area A query can be generated to obtain MVAR reserves associated with the identified network elements.
The injection/absorption reactive reserve is calculated based on the following rules:
Generation Units: Considers only units that are not open or removed. The injection reactive reserve is (MVAR MAX-MVAR Out) and the absorption reactive reserve is (MVAR Out-MVAR Min).
Capacitor Banks: Considers only caps that are not removed from the system. The injection reactive reserve is the summation of nominal MVAR of caps that are open or disconnected. The absorption reactive reserve is the summation of nominal MVAR of caps that are closed.
Reactor Banks: Considers only reactors that are not removed from the system. The injection reactive reserve is the summation of nominal MVAR of caps that are closed. The absorption reactive reserve is the summation of nominal MVAR of caps that are open or disconnected.
Static VAR Systems: Considers only SVS that are not open or removed from the system. The injection reactive reserve is (MVAR MAX-MVAR Out) and the absorption reactive reserve is (MVAR Out-MVAR).
A stacked bar chart provides detailed information about the MVARs availability on a per-station basis and on a per-device-type, associated with the station basis. The height of the bar above the horizontal axis represents the amount or MVARs available to inject into the system from the station. The height of the bar below the horizontal axis represents the amount of MVARs available to absorb (remove) from the system at the station. For each station, the amount of MVARs that can be injected or absorbed is shown below the chart, injected/absorbed.
The chart is sorted from the station with the most available injection to the station with the least available injection. Clicking on the bar will cause the corresponding substation's one-line display to be called into the dashboard area. The operator can therefore rapidly identify which device needs to be operated on, using a familiar SCADA diagram. (Note: No control actions are allowed, the one-lines are read-only displays.)
With the present invention, it is also possible to display a 3D view of the available MVARs using the positive and negative reactive reserves toolbar buttons, as shown in FIG. 13.
The selected area can be saved in the reserves tab in the control panel and recalled for future use. Once recalled the display is automatically restored to the state when it was saved and the MVAR Reserves are updated throughout the system using the most recent real-time values.
In another embodiment of the present invention, illustrated in FIG. 14, an operator can detect and analyze a base case violation using a Reliability Assessment module. If a new violation appears following the execution of the State Estimator (SE), an alert is displayed of the viewport as shown in FIG. 15.
If the letters "SE" are visible, the State Estimator has detected one or more new violations. To begin analyzing base case Violations, the operator selects the Base Case Alert button on the Alert Panel. The main Overview display is updated to show violation markers. A voltage contour at the highest KV level for which there am voltage violations is displayed. The Monitored Elements tab is updated with the list of Monitored Elements in the Alarm, Violation, or Warning State. Round Markers are used to represent violations in an overview display. The branch violation marker is presented on the center of the branch. The voltage violation markers and transformer violation markets are presented on the related substation. By way of illustration, and without limitation, examples of markers are shown below:
Red marker, with label "183.2N", representing a branch alarm for a MW value that exceeds the normal limit by 183.2% (v-limit=limit.times.1.832)
Red marker, with label "0.9N" on white background, representing a voltage alarm for a voltage value that exceeds the normal limit by 0.9% (v-limit=0.09.times.limit)
Orange marker, with label (.DELTA.41.9E) on white background, representing a voltage drop violation for a voltage drop value that exceeds the emergency limit by 41.3% (v-limit=0.419.times.limit).
Red marker, with no label and white background, representing multiple violations with different violation types and at least one alarm.
The marker symbol is defined as follows:
Marker Color to represent the Violation severity threshold (warning=yellow, violation=orange, alarm=red).
Marker Fill: White background for voltage violation and/or multiple violations that have different violation types.
Label xxxS: The suffix S represents the limit being referenced ("N" for Normal, "E" for Emergency and "L" for Loadshed) and the number represents the violation percentage over this reference limit if there is a prefix with .DELTA., it is a voltage drop violation.
If a new violation is detected relative to the previous run, a halo is presented around the marker. The operator can now drill-down on a particular violation by selecting a violation marker. Only the selected one will appear on the display and all other violation markers will disappear. The same happens in the Monitored Element tab in the control panel, which will only show the violations associated with the current selected marker.
FIG. 16 shows a selected branch Alarm on the branch DOUGLAS-HANOVER. The control panel on the left is automatically open on the list of monitored elements and positioned on this branch. The control panel monitored element list shows the vital data related to all violations selected in the overview display. For each monitored element, the name and the highest percent over the limit value being violated is displayed on the top line.
By way of illustration, and without limitation, details for each violation can include;
The limit value, displayed as "Lxxx.xx"
The current value, displayed as "Vxxx.xx"
The percentage over the limit it violates.
In case of a branch, there might be two entries, one for each end of the branch.
There can be two icons for each Monitored element in violation: one for locating the element on the overview displays and one for calling the associated line display in a dashboard tab to obtain more information.
In one embodiment of the present invention, an operator can detect and analyze a contingency case violation using a Reliability Assessment module. If a new violation appears following the execution of the Contingency Analysis (CA), an alert is displayed on the top right corner as shown in FIG. 15. The operator selects the contingency alert button to begin analyzing Post Contingency Violations, Elements in Alarm, Violation, or Warning States as calculated by CA. The Contingent Tab in the Control Panel is updated with the list of conti
References
D00000
D00001
D00002
D00003
D00004
D00005
D00006
D00007
D00008
D00009
D00010
D00011
D00012

D00013

D00014

D00015

D00016

D00017

D00018

P00001

P00002

P00003

P00004

XML
uspto.report is an independent third-party trademark research tool that is not affiliated, endorsed, or sponsored by the United States Patent and Trademark Office (USPTO) or any other governmental organization. The information provided by uspto.report is based on publicly available data at the time of writing and is intended for informational purposes only.
While we strive to provide accurate and up-to-date information, we do not guarantee the accuracy, completeness, reliability, or suitability of the information displayed on this site. The use of this site is at your own risk. Any reliance you place on such information is therefore strictly at your own risk.
All official trademark data, including owner information, should be verified by visiting the official USPTO website at www.uspto.gov. This site is not intended to replace professional legal advice and should not be used as a substitute for consulting with a legal professional who is knowledgeable about trademark law.