Compositions comprising a mitofusin inhibitor for promoting cell reprogramming and a use thereof
Cho , et al. De
U.S. patent number 10,494,611 [Application Number 14/442,883] was granted by the patent office on 2019-12-03 for compositions comprising a mitofusin inhibitor for promoting cell reprogramming and a use thereof. This patent grant is currently assigned to KOREA RESEARCH INSTITUTE OF BIOSCIENCE AND BIOTECHNOLGY. The grantee listed for this patent is KOREA RESEARCH INSTITUTE OF BIOSCIENCE AND BIOTECHNOLOGY. Invention is credited to Yee Sook Cho, You Jeong Kwon, Myung Jin Son.


View All Diagrams
| United States Patent | 10,494,611 |
| Cho , et al. | December 3, 2019 |
Compositions comprising a mitofusin inhibitor for promoting cell reprogramming and a use thereof
Abstract
The present invention relates to a composition comprising a repressor of mitofusin gene expression, an inhibitor of mitofusin protein activity, or a mixture thereof as an active ingredient for promoting reprogramming a differentiated cell into a pluripotent stem cell, and a use thereof. The composition according to the present invention increases the efficiency of reprogramming as well as reduces the time required for reprogramming to produce pluripotent stem cells. Therefore, the present composition can be beneficially used to develop the production technology of high efficiency pluripotent stem cell and secure a large-scale culture system. Further, the present composition can be beneficially used to maintain pluripotent stem cells and screen the compounds capable of promoting the reprogramming into pluripotent stem cells.
| Inventors: | Cho; Yee Sook (Daejeon, KR), Son; Myung Jin (Daejeon, KR), Kwon; You Jeong (Daejeon, KR) | ||||||||||
|---|---|---|---|---|---|---|---|---|---|---|---|
| Applicant: |
|
||||||||||
| Assignee: | KOREA RESEARCH INSTITUTE OF
BIOSCIENCE AND BIOTECHNOLGY (Daejeon, KR) |
||||||||||
| Family ID: | 56014119 | ||||||||||
| Appl. No.: | 14/442,883 | ||||||||||
| Filed: | April 23, 2015 | ||||||||||
| PCT Filed: | April 23, 2015 | ||||||||||
| PCT No.: | PCT/KR2015/004067 | ||||||||||
| 371(c)(1),(2),(4) Date: | June 15, 2015 | ||||||||||
| PCT Pub. No.: | WO2016/080608 | ||||||||||
| PCT Pub. Date: | May 26, 2016 |
Prior Publication Data
| Document Identifier | Publication Date | |
|---|---|---|
| US 20170051254 A1 | Feb 23, 2017 | |
Foreign Application Priority Data
| Nov 20, 2014 [KR] | 10-2014-0162801 | |||
| Current U.S. Class: | 1/1 |
| Current CPC Class: | A61P 43/00 (20180101); C12N 15/1137 (20130101); C12N 5/0696 (20130101); C12Y 306/05 (20130101); C12N 2506/02 (20130101); C12N 2310/14 (20130101); C12N 2510/00 (20130101); C12N 2501/65 (20130101); C12N 2310/531 (20130101); C12N 2501/998 (20130101); C12N 2500/02 (20130101); C12N 2501/73 (20130101) |
| Current International Class: | C12N 5/074 (20100101); C12N 15/113 (20100101) |
References Cited [Referenced By]
U.S. Patent Documents
| 2007/0275924 | November 2007 | Khan |
| 2009/0253203 | October 2009 | Eilertsen et al. |
| 2012/0021519 | January 2012 | Ichida et al. |
| 10-2011-0006672 | Jan 2011 | KR | |||
Other References
|
Knowlton, et al. (2012). "Regulating a uniter: control of mitofusin 2 expression". Caridiovascular Research, v.94:6-7. cited by examiner . Son, M., et al. (2015) "Mitofusins deficiency elicits mitochondrial metabolic reprogramming to pluripotency." Cell Death and Differentiation, v.22:1957-69. cited by examiner . Fulop et al. (2011) "The Effect of OPA 1 on Mitochondrial Ca2+ Signaling," PLoS ONE. 6(9):e25199. pp. 1-11. cited by applicant . Prigione et al. (Jan. 13, 2014) "HI F1 [alpha]Modulates Cell Fate Reprogramming Through Early Glycolytic Shift and Upregulation of PDK1-3 and PKM2," Stem Cells. 32(2):364-376. cited by applicant . Son et al. (Aug. 9, 2013) "Interference with the mitochondrial bioenergetics fuels reprogramming to pluripotencyviafacilitation of the glycolytic transition," Int. J. Biochem. Cell Biol. 45(11):2512-2518. cited by applicant . Son et al. (Nov. 1, 2013) "Unveiling the critical role of REX1 in the regulation of human stem cell pluripotency," Stem Cells, 31(11):2374-2387. cited by applicant . Westermann (2010) "Mitochondrial fusion and fission in cell life and death," Nature Rev. Mol. Cell Biol. 11 (12):872-884. cited by applicant . Xu et al. (Sep. 1, 2013) "Mitochondrial Regulation in Pluripotent Stem Cells," Cell Metabol. 18(3):325-332. cited by applicant . Hong et al. (2009) "Suppression of induced pluripotent stem cell generation by the p53-p21 pathway," Nature. 460 (7259):1132-1135. cited by applicant . Buganim et al. (Sep. 14, 2012) "Single-Cell Expression Analyses During Cellular Reprogramming Reveal and Early Stochastic and a Late Hierarchic Phase," Cell. 150(6):1209-1222. cited by applicant . Takahashi et al. (2006) "Induction of Pluripotent Stem Cells from Mouse Embryonic and Adult Fibroblast Cultures by Defined Factors," Cell. 126(4):663-676. cited by applicant . Bukowiechi et al. (Nov. 19, 2013) "Mitochondrial function in pluripotent stem cells and cellular reprogramming," Gerontology. 60(2):174-182. cited by applicant . Cherry et al. (Jul. 2013) "Induced pluripotent stem cells with a mitochondrial DNA deletion," Stem Cells. 31(7):1287-1297. cited by applicant . Son et al. (Apr. 17, 2015) "Mitofusins deficiency elicits mitochondrial metabolic reprogramming to pluripotency," Cell Death & Differentiation. 22(12):1957-1969. cited by applicant . Takahashi et al. (2007) "Induction of pluripotent stem cells from adult human fibroblasts by defined factors," Cell. 131(5):861-872. cited by applicant . Vazquez-Martin et al. (Jun. 2012) "Mitochondrial fusion by pharmacological manipulation impedes somatic cell reprogramming to pluripotency: new insight into the rote of mitophagy in cell stemness," Aging. 4(6):393-401. cited by applicant . International Search Report with Written Opinion corresponding to International Patent Application No. PCT/KR2015/004067, dated Jul. 15, 2015. cited by applicant. |
Primary Examiner: McDonald; Jennifer Pitrak
Attorney, Agent or Firm: Lathrop Gage LLP Wilkins; Andrew T.
Claims
The invention claimed is:
1. A method for producing a pluripotent stem cell reprogrammed from a differentiated cell, comprising: (a) inducing reprogramming of the differentiated cell by delivering at least one reprogramming factor selected from the group consisting of Oct4, Sox2, Klf4, c-Myc, Nanog, Lin-28, and Rex1 to a differentiated cell; and (b) promoting reprogramming the differentiated cell of (a) by culturing the differentiated cell in a medium comprising a repressor of mitofusin gene expression as an active ingredient, wherein the repressor of mitofusin gene expression is at least one selected from the group consisting of an antisense oligonucleotide, siRNA, shRNA, and microRNA that targets a mitofusin gene.
2. The method of claim 1, wherein the mitofusin is derived from a human or a mouse.
3. The method of claim 1, wherein the mitofusin is mitofusin 1 or mitofusin 2.
4. The method of claim 3, wherein the mitofusin 1 consists of the amino acid sequence of SEQ ID NO: 1 or SEQ ID NO: 3, and the mitofusin 2 consists of the amino acid sequence of SEQ ID NO: 2 or SEQ ID NO: 4.
5. The method of claim 1, wherein the differentiated cell is a germ cell, a somatic cell, or a progenitor cell.
6. The method of claim 1, wherein the medium further comprises a culture medium additive.
7. The method of claim 1, wherein the pluripotent stem cell has an increased production of lactic acid, an activated Ras-Raf-HIF1 signaling, or a reduced oxygen consumption, compared with that of the differentiated cells, and wherein the reprogramming efficiency is improved by reducing the time required for reprogramming and increasing the number of reprogrammed cells.
8. A method for reprogramming an isolated differentiated cell into a pluripotent stem cell comprising: (a) inducing reprogramming of the differentiated cell by delivering at least one reprogramming factor selected from the group consisting of Oct4, Sox2, Klf4, c-Myc, Nanog, Lin-28, and Rex1 to a differentiated cell; and (b) promoting reprogramming the differentiated cell of (a) by repressing the expression of mitofusin gene of the isolated differentiated cell, wherein repressing the expression of mitofusin gene is performed by treating the isolated differentiated cell with a composition comprising a repressor of mitofusin gene expression as an active ingredient, wherein the repressor of mitofusin gene expression is at least one selected from the group consisting of an antisense oligonucleotide, siRNA, shRNA, and microRNA that targets a mitofusin gene.
Description
RELATED APPLICATIONS
This application is a 35 U.S.C. .sctn. 371 filing of International Application No. PCT/KR2015/004067, filed Apr. 23, 2015, which claims priority to Korean Patent Application No. 10-2014-0162801, filed Nov. 20, 2014, each of which is incorporated herein by reference in its entirety.
TECHNICAL FIELD
The present invention relates to a composition comprising a repressor of mitofusin gene expression, an inhibitor of mitofusin protein activity, or a mixture thereof as an active ingredient for promoting dedifferentiation/reprogramming a differentiated cell into a pluripotent stem cell; a method for producing pluripotent stem cell reprogrammed from differentiated cell using the composition; a pluripotent stem cell produced by the method; a method for reprogramming pluripotent stem cell comprising repressing the expression of mitofusin gene or inhibiting the activity of mitofusin protein; and a pluripotent stem cell produced by the reprogramming method.
BACKGROUND ART
Cell fate transition occurs under various developmental, physiological, and pathological conditions, including normal embryonic development, aging, and tissue regeneration as well as tumor initiation and progression. Defining the cellular and molecular mechanisms of cell fate transition and regulating these mechanisms may be an essential strategy for treating abnormal pathological conditions resulting from improper cell fate control. The recent development of induced pluripotent stem cell (iPSC) technology used to reprogram somatic cells into pluripotent stem cells using defined pluripotency factors allows us to more closely mimic and recapitualte the conditions of cell fate transition (see Takahashi K, et al., Cell, 2006, 126(4), 663-676).
Generally, complex molecular changes at genetic, epigenetic, and metabolic levels have occurred concurrently or sequentially during the stage of somatic cell reprogramming. Cell reprogramming faces the challenge of balancing stability and plasticity and must overcome critical barriers, such as cell cycle checkpoints, the mesenchymal-epithelial transition (MET), and metabolic reprogramming, to progress cell fate conversion from a stochastic early phase toward pluripotency (see Buganim Y, et al., Cell, 2012, 150(6), 1209-1222).
The p53 pathway limits cell fate transition by inducing classical signaling leading to cell cycle arrest, senescence, or apoptosis to protect genome stability against reprogramming-induced stress, and compromised p53 signaling accelerates the reprogramming process. Moreover, p53 governs the homeostasis of the cellular state, which constrains MET by repressing the Klf4-mediated expression of epithelial genes early in the reprogramming process, and which opposes glycolytic metabolic reprogramming.
Balancing mitochondrial dynamics is crucial for maintaining cellular homeostasis, and abnormal mitochondrial dynamics results in numerous diseases. Highly proliferative cells, such as iPSCs and tumor cells, prefer to undergo glycolysis and decrease the dependency on mitochondrial ATP production, which requires supporting the biosynthesis of macromolecules and alleviating mitochondrial oxidative stress in rapidly growing cells.
DISCLOSURE
Technical Problem
The present inventors have conducted extensive and intensive researches in order to improve the methodology for increasing the reprogramming efficiency in the process of reprogramming to pluripotent stem cells. As a result, the inventors have discovered that p53-deficient and p21-deficient cells with high reprogramming efficiency express mitofusin 1 and 2 at a low level, repressing or genetically ablating the mitofusin drastically increases the efficiency of reprogramming a differentiated cell into a pluripotent stem cell and are beneficial for maintaining a pluripotent state of pluripotent stem cells. Further, the inventors have discovered that compounds that repress the activity of mitofusin promoter increase the efficiency of reprogramming and are effective in maintaining the pluripotency. The present invention has been completed on the basis of such discovery.
Technical Solution
An object of the present invention is to provide a composition comprising a repressor of mitofusin gene expression, an inhibitor of mitofusin protein activity, or a mixture thereof as an active ingredient for promoting dedifferentiation/reprogramming a differentiated cell into a pluripotent stem cell.
Another object of the present invention is to provide a medium composition comprising a repressor of mitofusin gene expression, an inhibitor of mitofusin protein activity, or a mixture thereof as an active ingredient for maintaining and culturing pluripotent stem cells in an undifferentiated state.
Yet another object of the invention is to provide a method for a producing pluripotent stem cell reprogrammed from a differentiated cell, comprising (a) delivering at least one reprogramming factor to a differentiated cell, and (b) culturing the differentiated cell in a medium containing the composition for promoting the reprogramming.
A further object of the present invention is to provide a pluripotent stem cell prepared by the above-described method.
A further object of the present invention is to provide a method for reprogramming an isolated differentiated cell into a pluripotent stem cell comprising repressing the expression of mitofusin gene or inhibiting an activity of mitofusin protein of the isolated differentiated cell.
A further object of the present invention is to provide a pluripotent stem cell produced by the reprogramming method.
A further object of the present invention is to provide a use of a repressor of mitofusin gene expression, an inhibitor of mitofusin protein activity, or a mixture thereof for producing a composition for promoting the reprogramming into pluripotent stem cells.
Advantageous Effects
The composition according to the present invention increases the efficiency of reprogramming as well as shortens the time required for reprogramming to produce pluripotent stem cells. Therefore, the present composition can be beneficially used to develop a production technology of high efficiency pluripotent stem cell and a secured large-scale culture system. Further, the present composition can be beneficially used to maintain pluripotent stem cells and to screen for the compounds capable of promoting the reprogramming into pluripotent stem cells.
DESCRIPTION OF DRAWINGS
FIGS. 1a-1f show that mitochondrial function is downregulated during the early-stage reprogramming of p53-KO(p53-/-) and p21-KO(p21-/-) somatic cells. The data is presented as the mean.+-.SE (n=3). *p<0.05; **p<0.01 (Student's t-test).
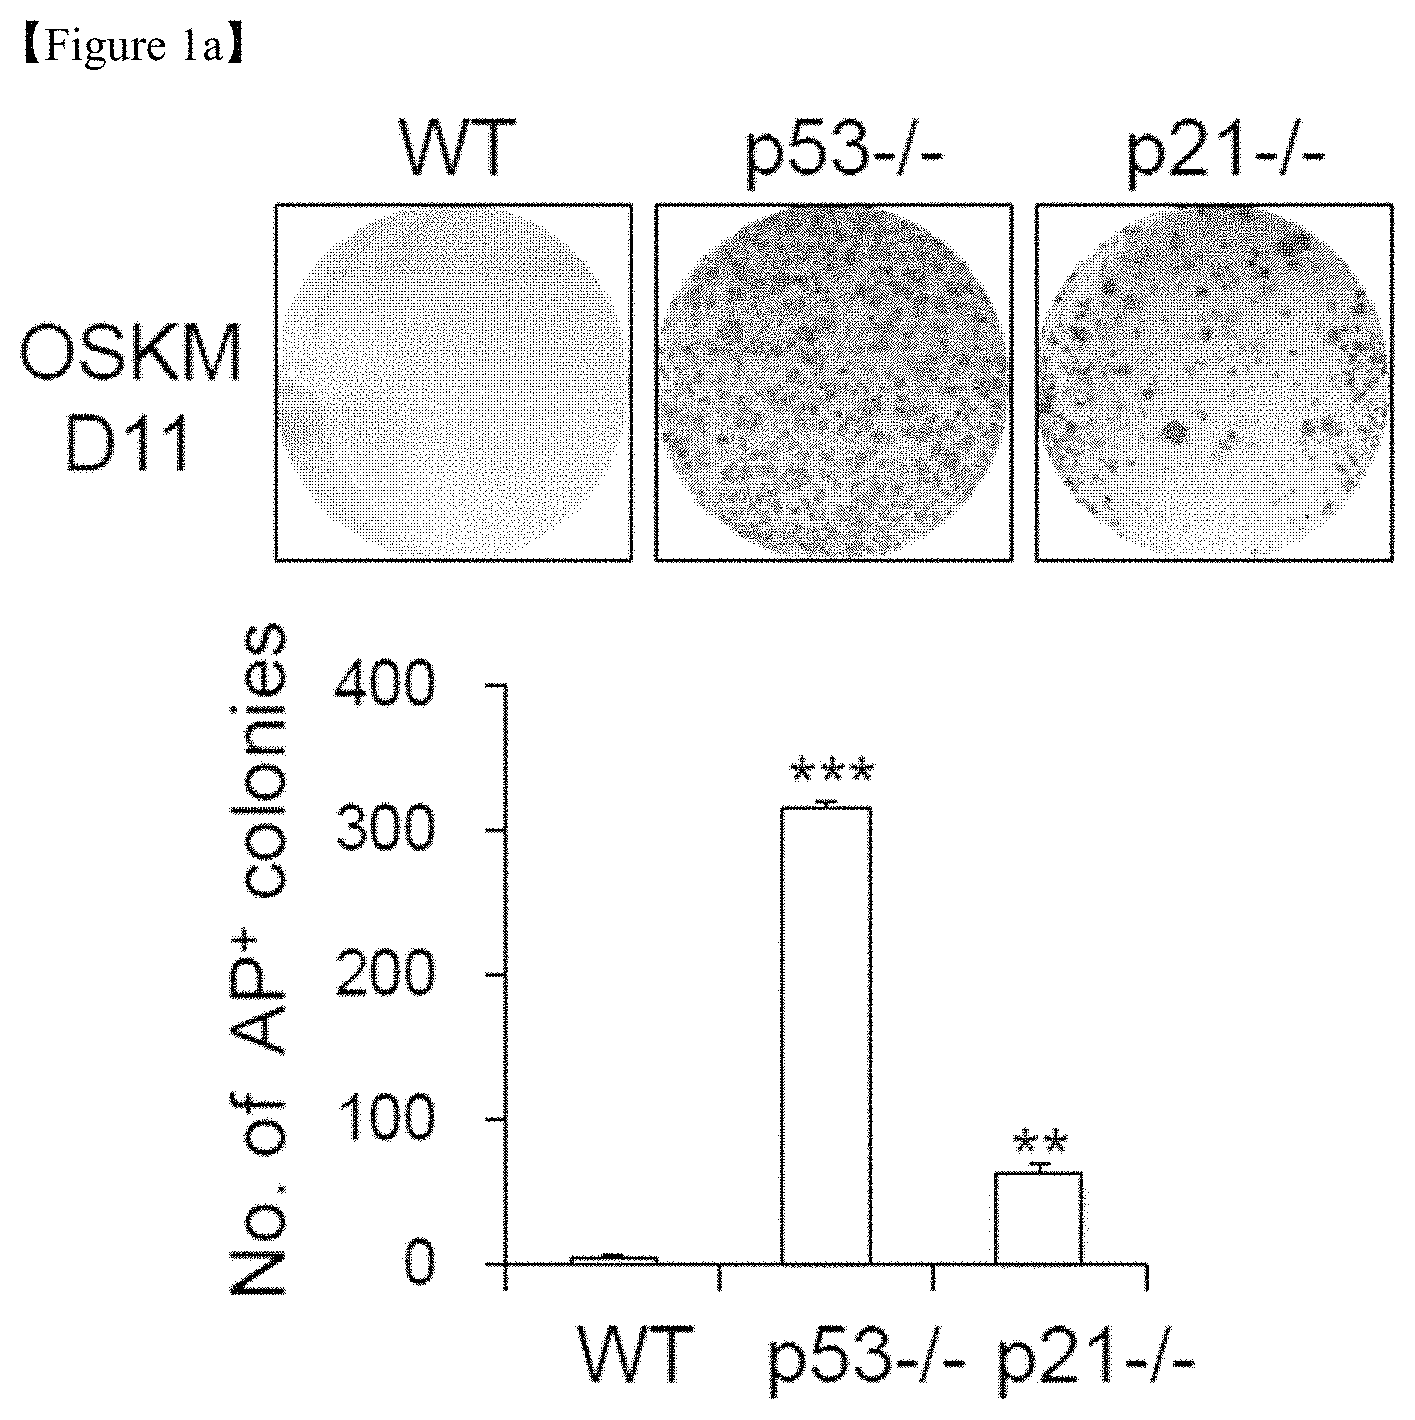
FIG. 1a shows representative images of AP+ colonies after WT MEFs, p53-/-MEFs, and p21-/- MEFs were reprogrammed via retroviral transduction of the OSKM reprogramming factors. The number of AP+ colonies (top) and the number of AP+ colonies (bottom) were determined on day 11 (D11) of reprogramming.
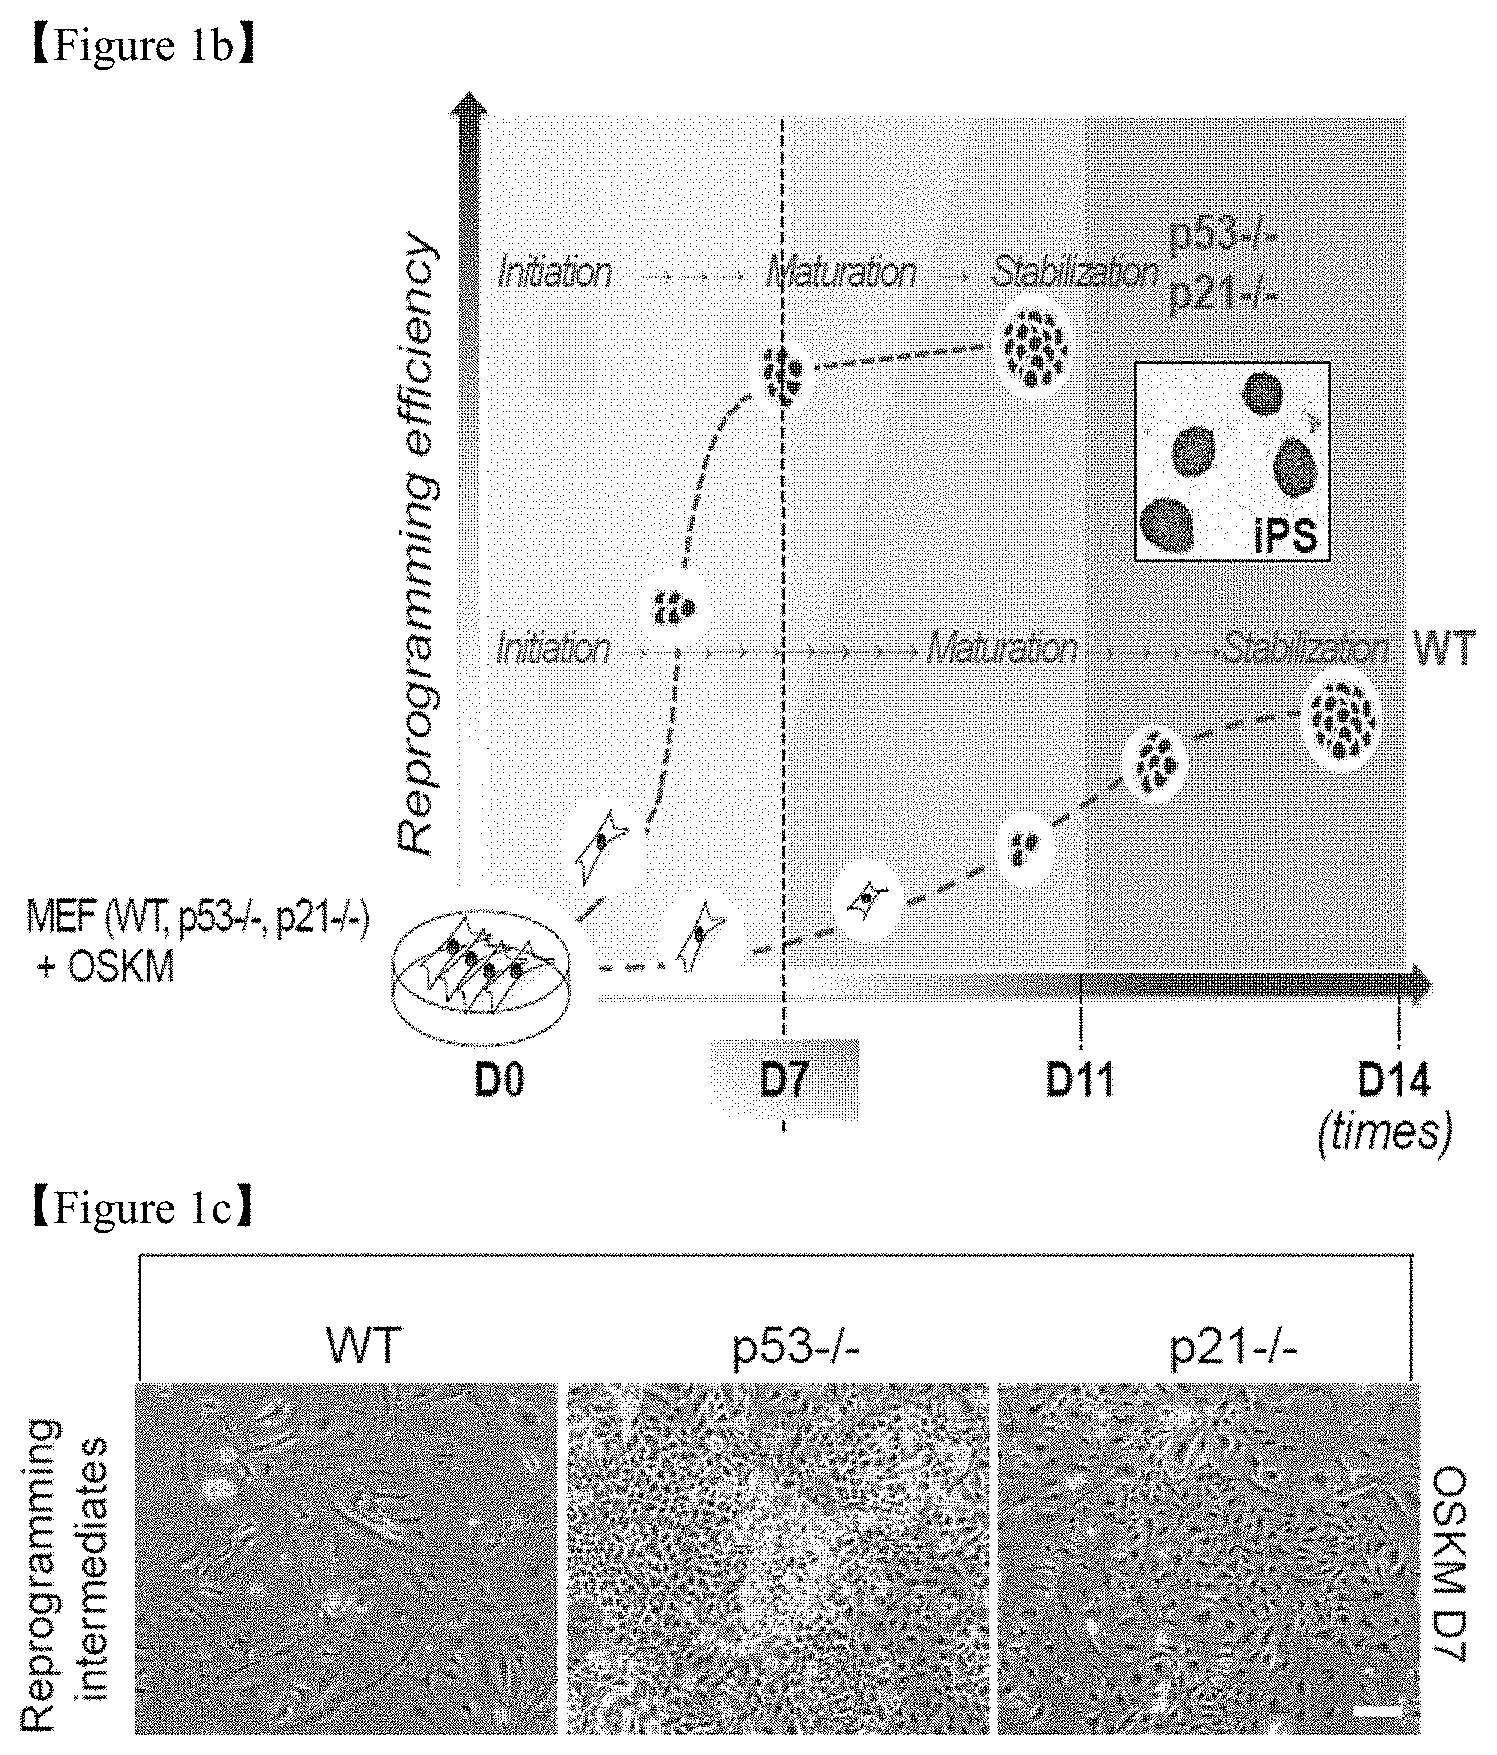
FIG. 1b shows the stages of sample preparation for transcriptome and metabolome analyses.
FIG. 1c shows a representative cell morphology on D7 of reprogramming (Scale bar=50 .mu.m).
FIG. 1d shows that the expression of genes encoding major enzymes (left) and the relative quantities of each metabolite (right) related to glycolysis were determined through a real-time polymerase chain reaction (PCR) analysis and capillary electrophoresis time-of-flight mass spectrometry (CE-TOFMS), respectively. The fold changes of metabolites in p53-/- and p21-/- reprogramming cultures compared with the WT control at D7 are represented by a color-coded index bar.
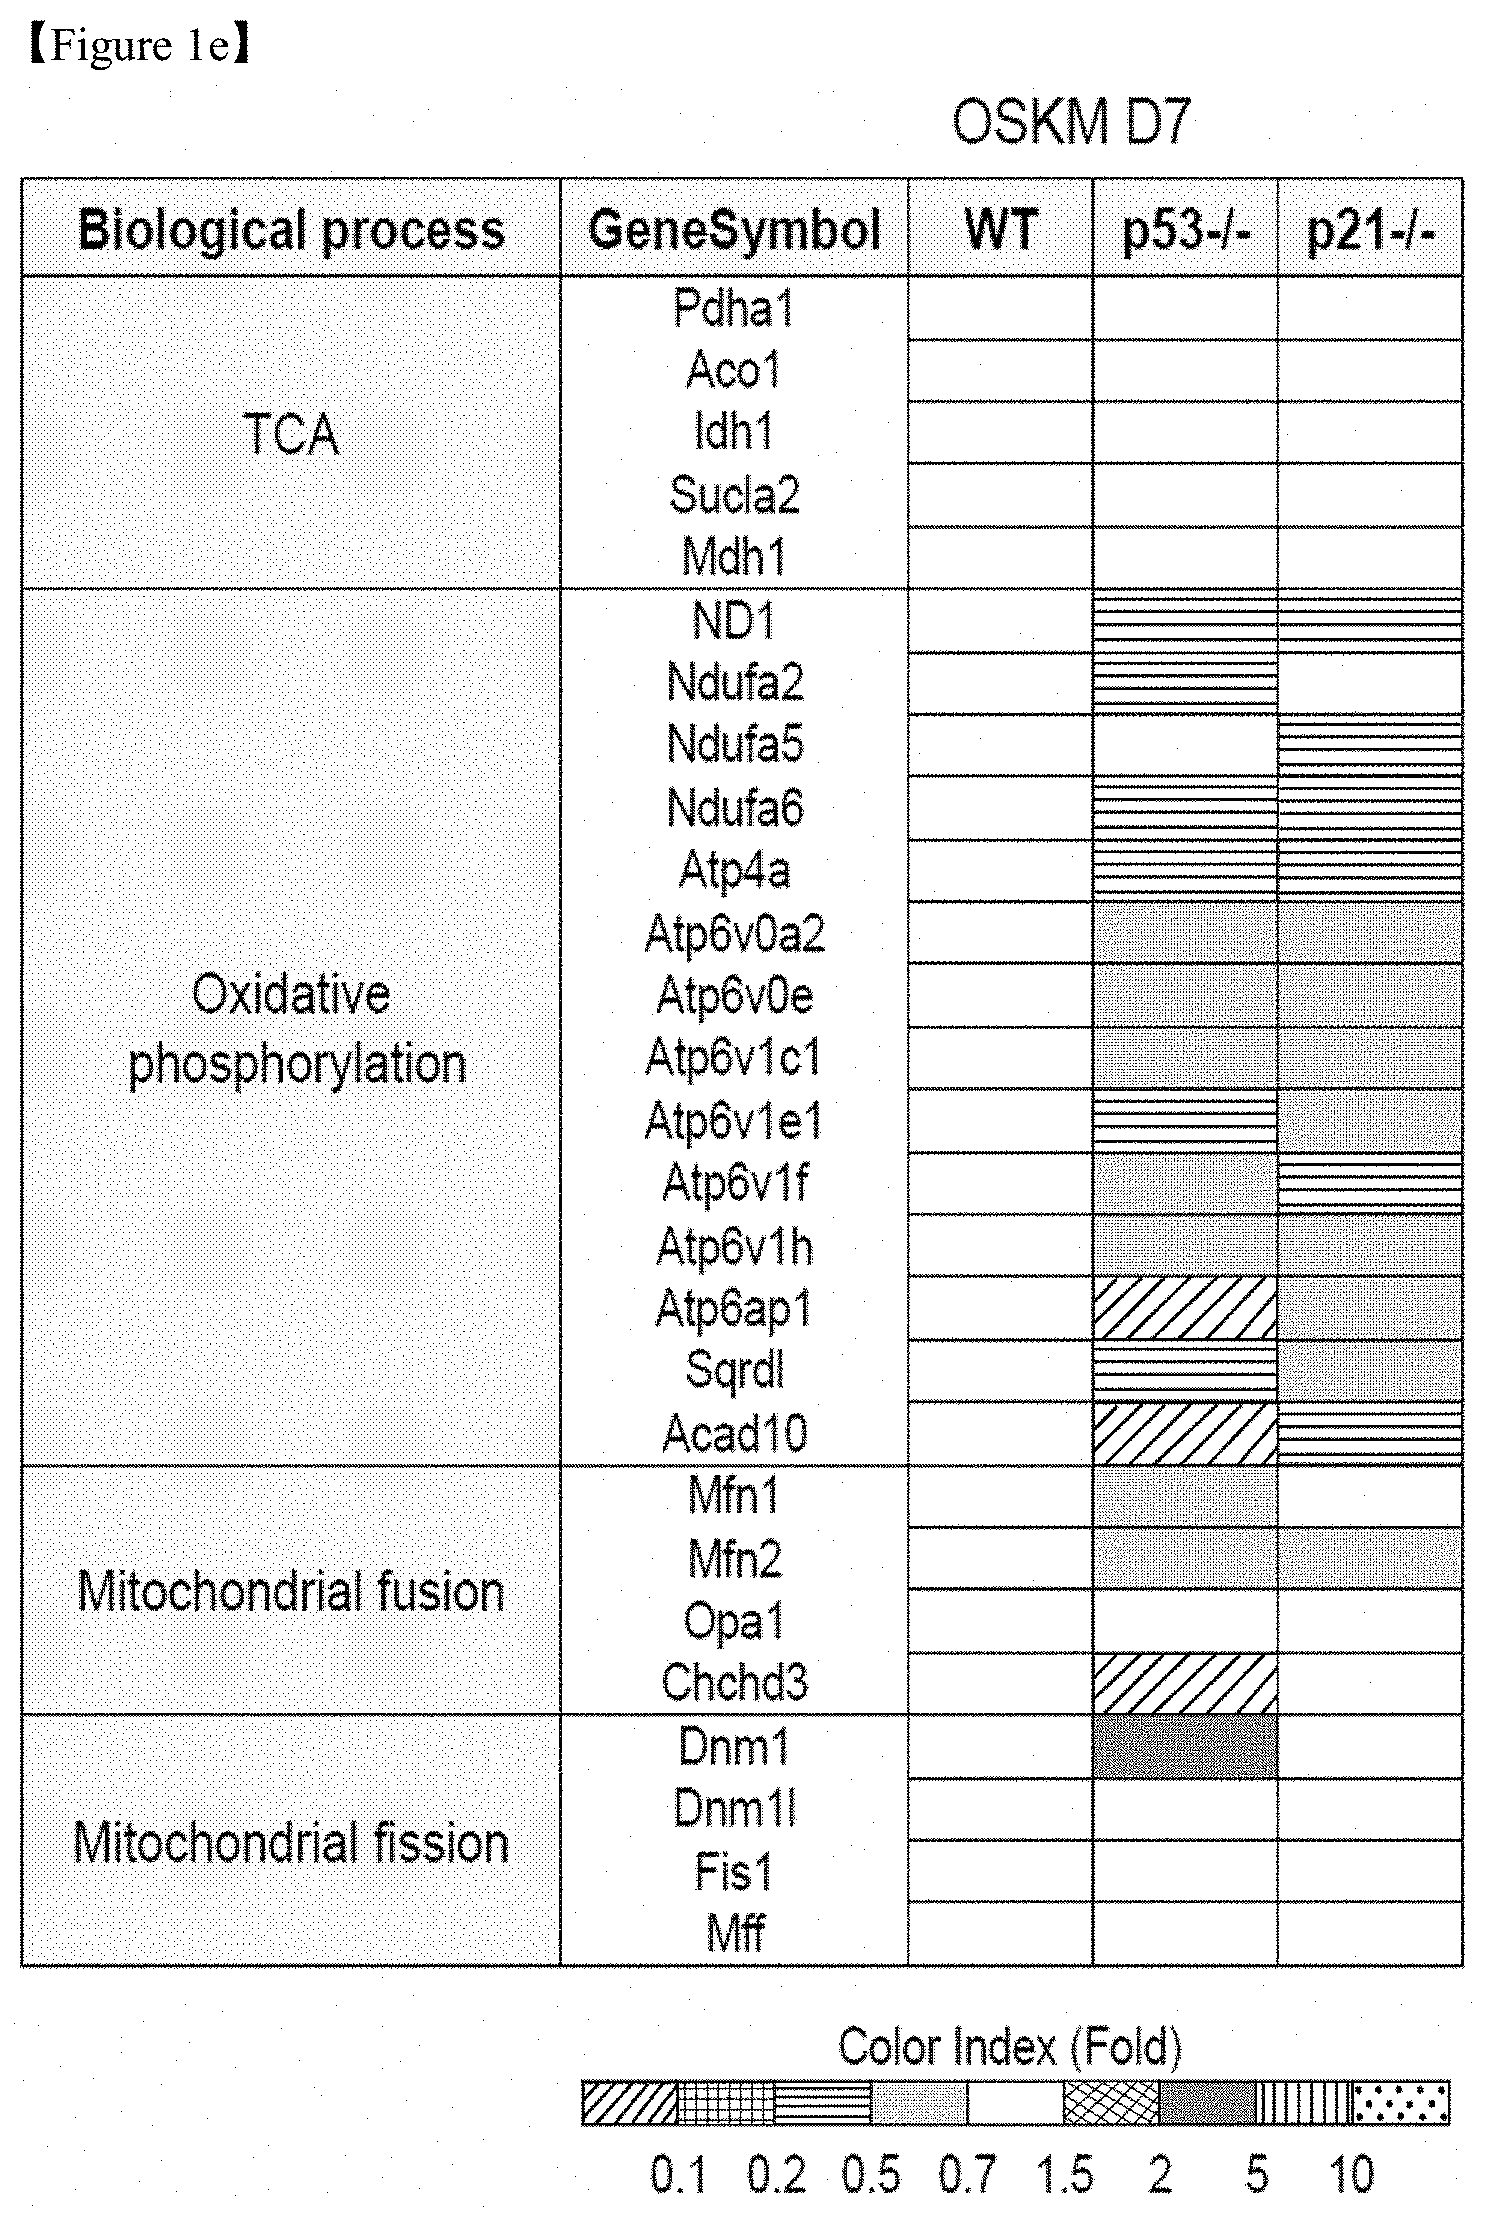
FIG. 1e shows the results of transcriptome analysis of mitochondrial function in OSKM-transduced WT, p53-/-, and p21-/- MEFs on D7 of reprogramming.
FIG. 1f shows the results of a real-time PCR of the mitochondria-encoded oxidative phosphorylation (OXPHOS) subunits ND1 and Atp6ap1 and the mitochondrial fusion genes Mitofusin1 (Mfn1) and Mitofusin2 (Mfn2) in WT, p53-/- and p21-/- D7 reprogramming cultures.
FIGS. 2a-c show the results of transcriptome analysis of WT MEFs, p53-/-, and p21-/- MEFs in early-stage reprogramming. The ratios are indicated by a color-coded index bar.
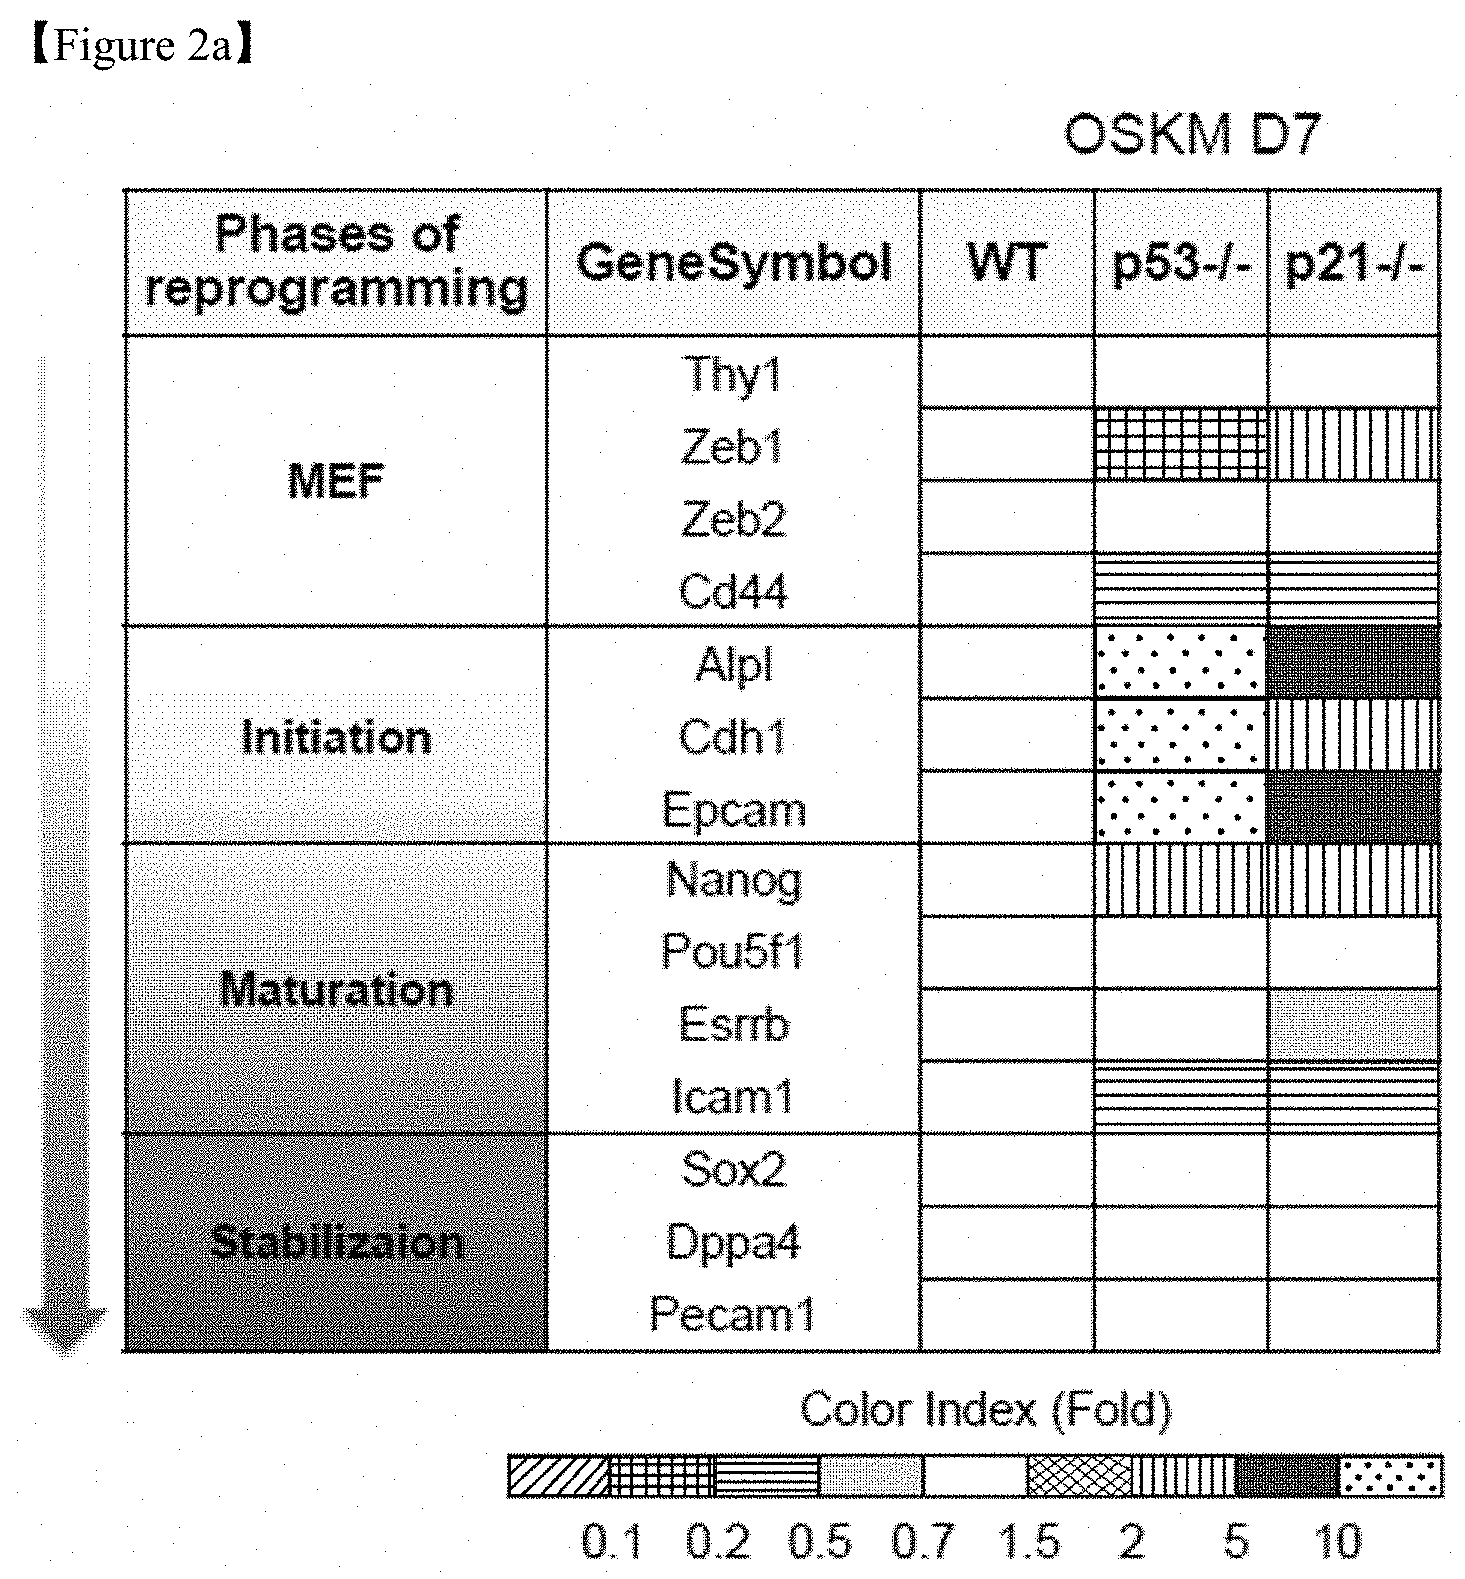
FIG. 2a shows a comparison of marker expression for discriminating reprogramming phases.
FIG. 2b shows a comparison of expression level-upregulated and downregulated gene sets in WT MEFs, p53-/-, and p21-/- MEFs on D7 of reprogramming.
FIG. 2c shows a gene expression analysis of glycolysis in WT MEFs, p53-/- MEFs and p21-/- MEFs at D7 of reprogramming.
FIGS. 3a-3b show that glycolytic conversion is accelerated in p53-/- and p21-/- MEFs in the late stage of reprogramming, which is essential for somatic cell reprogramming. The data are presented as the mean.+-.SE (n=3). *p<0.05; **p<0.01 (Student's t-test)
FIG. 3a shows that lactate production was determined in the cell lysates of each group at the indicated time point of reprogramming.
FIG. 3b shows the effect of the glycolysis inhibitor 2-DG (2-deoxy-D-glucose) on the reprogramming process. Representative images of AP+ colonies (top). The total number of AP+ colonies was counted on D11 (bottom).
FIGS. 4a-4c show that the expression of genes encoding OXPHOS components is downregulated in the early-stage reprogramming of p53-/- and p21-/- MEFs.
FIG. 4a shows gene expression profiling of OXPHOS complex components.
FIG. 4b shows real-time PCR analysis results of the nuclear-encoded OXPHOS subunits Sdhb, Uqcrc1, p53 and p21.
FIG. 4c shows that determination of the ADP/ATP energy turnover rate were performed in WT, p53-/-, and p21-/- reprogramming cultures at D7 and that the data are presented as the mean.+-.SE (n=3). *p<0.05; ***p<0.001 (Student's t-test).
FIGS. 5a-5g show that p53- and p21-KO cells and pluripotent reprogramming intermediates express low levels of mitochondrial fusion proteins.
FIG. 5a shows that OSKM-transduced WT, p53-/-, and p21-/- MEFs on D7 of reprogramming were stained with Tom20 (mitochondria, green) and DAPI (nuclei, blue) (top). High-magnification images (bottom).
FIG. 5b shows a mitochondrial morphology of WT, p53-/-, and p21-/- MEFs stained with Mitotracker (red) and enlarged images (inset in top right corner).
FIG. 5c is a graph showing the cell numbers of WT, p53-/-, and p21-/- MEFs.
FIG. 5d shows the results of Western blot analysis of Cyclin B1 and mitochondrial fission (Drp)-fusion (Mfn) components. .beta.-actin was used as an internal control.
FIG. 5e shows that reprogramming intermediates were sorted based on Thy1 and SSEA1 expression using magnetic-activated cell sorting (MACS) on D11 (scale bar=50 .mu.m). Representative images of each subgroup (top), the mitochondrial morphology stained with Mitotracker (red) (middle), and enlarged images (inset in middle right corner) on D14. The percentages of cells with fragmented/intermediate/fused mitochondria were determined in each subgroup (bottom).
FIG. 5f shows the results of Western blot analysis of mitochondrial fission (Drp)-fusion (Mfn) components in the mitochondrial fraction and of the pluripotency marker Nanog in the whole-cell lysates of MEFs and each subpopulation. HSP60 and .beta.-actin were used as internal controls.
FIG. 5g is schematic presentation of the p53- and p21-KO cells.
FIGS. 6a-6g show that Mfn1 and Mfn2 ablation promotes the acquisition and maintenance of pluripotency. The data are presented as the mean.+-.SE (n=3). *p<0.05; **p<0.01 (Student's t-test).
FIG. 6a shows that MEFs were transduced with control (shCon), Mfn1 (shMfn1) and Mfn2 (shMfn2) lentiviral shRNAs together with retroviral OSKM reprogramming factors and subjected to AP staining. Representative images of AP+ colonies (top) and the numbers of AP+ colonies (bottom) on D11 of reprogramming (bottom) were depicted.
FIG. 6b shows that human foreskin fibroblasts (HFFs) were transduced with control (shCon), Mfn1 (shMfn1) and Mfn2 (shMfn2) lentiviral shRNAs together with retroviral OSKM reprogramming factors and subjected to AP staining. Representative images of AP+ colonies (top) and the numbers of AP+ colonies (bottom) on D28 of reprogramming were depicted.
FIG. 6c shows that H9 hESCs were transfected with control (siCon), Mfn1 (siMfn1) and Mfn2 (siMfn2) siRNAs, cultured with unconditioned medium (UM) and subjected to AP staining. Representative images of AP+ colonies (top) and the relative fold difference in AP+ colonies under feeder-free conditions on D5 (bottom). Conditioned medium (CM)-cultured hESCs were used as an undifferentiated control.
FIG. 6d shows that Western blot analysis of Mfn1 and Mfn 2 and the pluripotency markers Oct3/4 and Nanog in siRNA-transfected hESCs on D5. .beta.-actin was used as an internal control.
FIG. 6e shows that WT, Mfn1-/-, and Mfn2-/- MEFs were reprogrammed via retroviral transduction of OSKM in the absence (top) and presence (middle) of 50 .mu.M Mdivi1, an inhibitor of mitochondrial division. Representative images of AP+ colonies (top and middle) and the numbers of AP+ colonies on D11 of reprogramming (bottom) were depicted.
FIG. 6f shows that the mitochondrial morphology of each reprogramming culture was observed using stably expressed Mito-EYFP (green) on D7. Enlarged images (inset in right corner). Scale bar=50 .mu.m.
FIG. 6g is a graph showing the time required for the reprogramming, when MEFs were transduced with control (shCon), Mfn1 (shMfn1) and Mfn2 (shMfn2) lentiviral shRNAs together with retroviral OSKM reprogramming factors and subjected to reprogramming.
FIG. 7. Knockdown of Mfn 1 and Mfn2 expression via siRNA transfection in hESCs. Real-time PCR analysis of Mfn1 and Mfn2 in Mfn 1 and 2 siRNA-transfected hESCs cultured using UM on D5. The data are presented as the mean.+-.SE (n=3). *p<0.05; **p<0.01; ***p<0.001 (Student's t-test).
FIGS. 8a-8c show that Mfn 1 and Mfn2 knockdown facilitates glycolytic conversion in early-stage reprogramming.
FIG. 8a shows transcriptome analysis result of gene sets related to glycolysis in MEFs transduced with OSKM and shRNAs on D7 of reprogramming. The ratios are indicated by a color-coded index bar.
FIG. 8b shows that the expression of genes encoding major enzymes (left) and the relative quantity of each metabolite (right) related to glycolysis were determined via real-time PCR analysis and CE-TOFMS, respectively. The fold changes of metabolites in Mfn 1 and Mfn2 shRNA-transduced reprogramming cultures compared with the control at D7 are represented by a color-coded index bar.
FIG. 8c shows that lactate production was determined in the cell lysates of each group. The data are presented as the mean.+-.SE (n=3). *p<0.05; **p<0.01 (Student's t-test).
FIGS. 9a-9c show gene expression profiling of OXPHOS complex components and cell cycle regulators following Mfn 1 and Mfn2 knockdown during early reprogramming.
FIG. 9a shows the results of transcriptome analysis of OXPHOS complex components in MEFs transduced with OSKM and the indicated shRNAs on D7 of reprogramming.
FIG. 9b shows transcriptome analysis results of Mfn 1 and Mfn2, p53 (Trp53), p21 (Cdkn1a), and p16 (Cdkn2a) in MEFs transduced with OSKM and the indicated shRNAs on D7 of reprogramming.
FIG. 9c shows transcriptome analysis results of real-time PCR analysis of p53 and p21 in MEFs transduced with OSKM and the indicated shRNAs on D7 of reprogramming. The data are presented as the mean.+-.SE (n=3). *p<0.05 (Student's t-test).
FIGS. 10a-10f show that reciprocal inhibition of p53/p21 and Mfn1/2 activates the Ras-Raf-HIF1.alpha. pathway. .beta.-actin was used as an internal control. The data are presented as the mean.+-.SE (n=3). *p<0.05; **p<0.01 (Student's t-test).
FIG. 10a shows Western blot analysis results of p53 and p21 on D11 of reprogramming, after WT, Mfn1-/-, and Mfn2-/- MEFs were reprogrammed via retroviral transduction of OSKM in the absence and presence of 25 .mu.M Nutlin3a, an MDM2 inhibitor that stabilizes p53.
FIG. 10b shows the results of Western blot analysis of Mfn1 on D11 of reprogramming, after WT, p53-/-, and p21-/- MEFs were reprogrammed via retroviral transduction of OSKM with or without retroviral Mfn1 overexpression.
FIG. 10c shows that images of AP+ colonies (top and middle) and the total numbers of AP+ colonies (bottom) were obtained in each indicated group.
FIG. 10d shows that images of AP+ colonies (top and middle) and the total numbers of AP+ colonies (bottom) were obtained in each indicated group.
FIG. 10e shows Western blot analysis results of Ras-Raf signaling in MEFs transduced with OSKM and Mfn1 and Mfn2 shRNAs on D7 of reprogramming.
FIG. 10f is model showing the activation of Ras-Raf-HIF1.alpha. signaling in Mfn1/2 depleted cells.
FIGS. 11a-11c show that increased glycolysis and reprogramming by Mfn1 and Mfn2 knockdown is HIF1.alpha.-dependent. The data are presented as the mean.+-.SE (n=3). *p<0.05; **p<0.01; ***p<0.001 (Student's t-test).
FIG. 11a shows that MEFs were transduced with OSKM and the indicated shRNAs. Western blot analysis was performed on D7 of reprogramming. .beta.-actin was used as an internal control.
FIG. 11b shows that lactate production was determined in the cell lysates of each group.
FIG. 11c shows that images of AP+ colonies (top and middle) and the total numbers of AP+ colonies (bottom) were obtained in each indicated group.
FIGS. 12a-12h show that hypoxia decreases Mfn1 and Mfn2 expression, and chemicals that inhibit Mfn1 expression promote the acquisition and maintenance of stem cell fate. .beta.-actin was used as an internal control. The data are presented as the mean.+-.SE (n=3). *p<0.05; **p<0.01; ***p<0.001 (Student's t-test).
FIG. 12a shows that MEFs were reprogrammed via the retroviral transduction of OSKM under normoxia (N) and hypoxia (H, 5% 02). Images of AP+ colonies (top) and the number of AP+ colonies (bottom) were counted on D11.
FIG. 12b shows Western blot analysis results of Mfn1 and Mfn2, HIF1.alpha. and LDHA on D7 of reprogramming in cultures under normoxia and hypoxia.
FIG. 12c shows Mfn1 promoter activity, determined in Mfn1-/- MEFs stably expressing an Mfn1 promoter reporter construct after 48 hours of normoxic or hypoxic culture.
FIG. 12d shows relative luciferase activity, determined in Mfn1-/- MEFs carrying the Mfn1 promoter reporter, at 48 hours after treatment with 84 redox library compounds. The top 3 downregulated (-1, -2, and -3) and the top 2 upregulated (+1 and +2) hits controlling Mfn1 promoter activity are presented.
FIG. 12e shows that MEFs were reprogrammed via retroviral transduction of OSKM together with treatment with 1 .mu.M of selected compounds, and Mfn1 protein expression was determined on D9 of reprogramming by Western blot analysis.
FIG. 12f shows that images of AP+ colonies were obtained (left) and the number of AP+ colonies was counted (right) on D11 of reprogramming under treatment with 1 .mu.M of selected compounds.
FIG. 12g shows that J1 mESCs were cultured with (+; self-renewing condition, bottom left) or without LIF (-; non self-renewing condition, top left). Images of AP+ colonies were obtained (left) and the number of AP+ colonies was counted (right) on D5 under treatment with 1 .mu.M of selected compounds.
FIG. 12h; 293T cells (human embryonic renal cells) including human Mfn1 promoter reporter were treated with 10 .mu.M of 84 focused redox library compounds. After 48 hours, the relative luciferase activity was measured and the results are shown in the graph.
FIGS. 13a-13b show that Mfn1 promoter activity-repressing compounds are beneficial for acquisition and maintenance of stem cell fate. The data are presented as the mean.+-.SE (n=3). *p<0.05 (Student's t-test).
FIG. 13a shows that HFFs were transduced with retroviral OSKM reprogramming factors and 10 .mu.M of Mfn1 promoter activity-regulating compounds were treated during reprogramming. Images of AP+ colonies (top) and the numbers of AP+ colonies (bottom) were determined on D28 of reprogramming.
FIG. 13b shows that H9 hESCs were cultured with UM to provide differentiation conditions, and treatment with 10 .mu.M of Mfn1 promoter activity-regulating compounds was performed in the presence of UM. Images of AP+ colonies (top) and the relative fold difference in AP+ colonies under feeder-free conditions on D5 (bottom). CM-cultured hESCs were used as an undifferentiated control.
FIG. 14 is a model for the control of cellular stability and plasticity via the reciprocal interaction of the p53/p21 and Mfn1/2 pathways. Depletion of Mfn1/2 promoted somatic cell reprogramming (top), which increases plasticity, allowing reprogramming barriers, such as mitochondrial fusion, cell cycle arrest, and/or failure of metabolic reprogramming, to be overcome (bottom).
BEST MODE
In one aspect, the present invention provides a composition comprising a mitofusin inhibitor as an active ingredient for promoting reprogramming differentiated cells into pluripotent stem cells. Specifically, the present invention provides a composition comprising a repressor of mitofusin gene expression, an inhibitor of mitofusin protein activity, or a mixture thereof as an active ingredient for promoting reprogramming differentiated cells into pluripotent stem cells.
In the present invention, the term "mitofusin" refers to a class of GTP-binding proteins embedded in the outer membrane of the mitochondria, which is a structural protein leading to a bond between mitochondria. Specifically, the mitofusin may be derived from a mouse or human, but is not limited thereto. Also, the mitofusin may specifically be mitofusin 1 (Mfn1) or mitofusin 2 (Mfn2). More specifically, the mitofusin may be Mfn1 having an amino acid sequence of SEQ ID NO: 1 (mouse-derived) or SEQ ID NO: 3 (human-derived) or Mfn2 having an amino acid sequence of SEQ ID NO: 2 (mouse-derived) or SEQ ID: 4 (human-derived). Even more specifically, the mitofusin may be Mfn1 encoded with a base sequence which can be amplified with a primer of SEQ ID NO: 21 or 22, or Mfn2 encoded with a base sequence which can be amplified with a primer of SEQ ID NO: 23 or 24, but is not limited thereto. The present inventors were the first to identify that, if mitofusin is repressed or genetically ablated from a differentiated cell, the efficiency of reprogramming to pluripotent stem cell is significantly increased and the pluripotency is maintained.
Based on such sequences of Mfn1 and Mfn2, a gene expression repressor of Mfn1 and 2 and an inhibitor of protein activity can be designed, and the sequence can be modified to some extent in this design. It will be apparent to those skilled in the art that the sequences capable of maintaining the homology of 80% or more, specifically 90% or more, more specifically 95% or more, and even more specifically 98% or more due to such artificial modification can be used.
In one specific embodiment of the present invention, the analysis was performed through alkaline phosphate (AP) staining to confirm that Mfn1/2 downregulation contributes to somatic cell reprogramming. The results demonstrate that Mfn1 and 2 knockdown using shRNA exhibited a significant increase in the number of reprogrammed cells as compared with the case of using control shRNA in both mouse (FIG. 6a) and human cell system (FIG. 6b). The results also demonstrate that Mfn1 and 2 knockdown using shRNA in mouse shortened the time required for the reprogramming as compared with using shRNA control (FIG. 6g).
In addition, in culture conditions using an unconditioned medium (UM) which is a condition for differentiation, human embryonic stem cells (hESC) led to differentiation, but hESCs with Mfn1 and Mfn2 knockdown using siRNA were maintained in the undifferentiated state (FIG. 6c). Under UM culture conditions, the expression of pluripotency-associated markers such as Oct3/4 and Nanog was maintained well in hESCs upon knockdown of Mfn1 and Mfn2 (FIGS. 6d and 7).
Furthermore, complete knockout via the genetic ablation of Mfn1 and Mfn2 yielded a significantly higher reprogramming efficiency (FIG. 6e) and a fragmented mitochondrial morphology (FIG. 6f) compared with WT mouse embryonic fibroblasts (MEFs). In particular, Mfn1-/-(Mfn1-KO) exhibited a significant increase of about 500 times or more in the numbers of AP+ colonies and Mfn2-/-(Mfn1-KO) exhibits a significant increase of about 200 times or more in the numbers of AP+ colonies as compared with WT (FIG. 6e). These results confirm that reprogramming efficiency of somatic cells via the ablation of Mfn1 and Mfn2 could be significantly increased. However, it has been found that these effects were blocked by treatment with Mdivi1, a pharmacological inhibitor of mitochondrial fission (FIGS. 6e and 6f).
These results demonstrate that, when mitochondrial structural protein Mfn is repressed or genetically ablated, the efficiency of reprogramming a differentiated cell into a pluripotent stem cell is significantly increased and the pluripotency is maintained.
In the present invention, the term "repressor of mitofusin gene expression" refers collectively to a substance capable of downregulating the mitofusin expression. More specifically, this repressor may comprise all the substances that downregulate the mitofusin expression at a transcription level or at a protein level. As the substances that repress the mitofusin expression, compounds capable of inhibiting the mitofusin expression or activity, targeting to mitofusin, nucleic acid, polypeptide, virus or vector including the nucleic acid can be used without restriction in their types. Specifically, the repressor of mitofusin gene expression may be at least one selected from the group consisting of an antisense oligonucleotide, siRNA, shRNA, and microRNA of mitofusin gene, but is not limited thereto. In the case of repressing the mitofusin gene expression, the efficiency of reprogramming a differentiated cell into a pluripotent stem cell is significantly increased and the pluripotency is maintained. Accordingly, the repressor of mitofusin gene expression can be used for the purpose of increasing the efficiency of reprogramming to pluripotent stem cells from differentiated cells.
In one specific embodiment of the present invention, the analysis was performed through an alkaline phosphate (AP) staining to confirm that Mfn1/2 downregulation contributes to somatic cell reprogramming. The results confirm that Mfn1 and 2 knockdown using shRNA exhibited a significant increase in the reprogramming efficiency as compared with the case of using control shRNA (FIGS. 6a and 6b) and that hESCs with Mfn1 and 2 knockdown using shRNA was maintained under UM in the undifferentiated state (FIG. 6c). Further, under UM culture conditions, the expression of pluripotency-associated markers such as Oct3/4 and Nanog was maintained well in hESCs upon knockdown of Mfn1 and 2 (FIGS. 6d and 7).
Further specifically, the repressor of mitofusin gene expression can be those which repress mitofusin promoter activity, and examples thereof include at least one selected from the group consisting of piceatannol, tetramethylpyrazine, 21-[4-(2,6-di-1-pyrolidinyl-4-pyrimidinyl)-1-piperazinyl]pregna-1,4,9[11]- -triene-3,20-dione maleate, retinyl palmitate and D-.alpha.-tocopherylquinone, but the substances which can repress the mitofusin gene expression and reprogram the differentiated cells can be included without limitation.
In the case of repressing the mitofusin promoter activity, the mitofusin gene expression is repressed and so, the efficiency of programming to pluripotent stem cells from differentiated cells is significantly increased and the pluripotency is maintained. Therefore, the repressor of mitofusin promoter activity can be used for the purpose of increasing the efficiency of programming to pluripotent stem cells from differentiated cells.
In one specific embodiment of the present invention, the present inventors have screened chemicals with the aim of altering the promoter activity of mouse or human Mfn1, using 84 focused redox library compounds. As a result, we have identified a new use of the top 3 downregulated compounds (piceatannol, tetramethylpyrazine and 21-[4-(2,6-di-1-pyrrolidinyl-4-pyrimidinyl)-1-piperazinyl]pregna-1,4,9[11- ]-triene-3,20-dione maleate, U74389G maleate), and the top 2 upregulated compounds (Tanshinone IIA, erbinafine.HCl) controlling mouse Mfn1 promoter activity (FIG. 12d). Also, we have identified that compounds that repress mouse Mfn1 promoter activity enhanced the reprogramming efficiency of both mouse and human somatic cells (FIGS. 12f and 13a) and that these compounds were beneficial for the maintenance of both mouse (FIG. 12g) and human ESCs (FIG. 13b) in an undifferentiated state.
In addition, we have identified a new use of the three compounds that best repress human Mfn1 promoter activity (U74389G maleate, retinyl palmitate and D-.alpha.-tocopheryl quinone)(FIG. 12h) and that U74389G maleate repressed Mfn1 promoter activity in both mice and human cells.
These results demonstrate that inhibitors of Mfn1 or 2 remarkably facilitate reprogramming a differentiated cell into a pluripotent stem cell and maintain the pluripotency and thus, lead a significant improvement in comparison with a conventional reprogramming condition (FIG. 14).
Further, if the composition for promoting reprogramming of the present invention can promote reprogramming to pluripoent stem cells from differentiated cells, the composition may comprise the repressors of mitofusin expression at various concentrations, but the repressors may comprise in the concentration of specifically 1 nM to 100 .mu.M, and more specifically, 10 nM to 10 .mu.M.
In one specific embodiment of the present invention, mouse and human Mfn1 promoter reporter (Genecopoeia) cells were prepared using Mfn1-/-MEFs and 293T cells, respectively, and a Screen-Well.TM. REDOX library containing the 84 compounds was treated at a concentration of 10 .mu.M by for 48 hours. As a result, we have confirmed that piceatanol, tetramethyl pyrazine and U74389G maleate down-regulated mouse Mfn1 promoter activity (FIG. 12d) and that U74389G maleate, retinyl palmitate and D-.alpha.-tocopheryl quinone down-regulated human Mfn1 promoter activity (FIG. 12h).
These results demonstrate that in the case of treating a repressor of mitofusin promoter activity in the said concentration range, the reprogramming efficiency is markedly increased, which leads to a remarkable improvement as compared with a conventional reprogramming condition.
In the present invention, the term "inhibitor of mitofusin protein activity" refers collectively to a substance which down-regulates the mitofusin protein activity and may specifically be an antibody or aptamer that binds specifically to the protein expressed from mitofusin gene, but is not limited thereto. The antibodies of the present invention include a polyclonal antibody, a monoclonal antibody or a fragment thereof as long as it has an antigen-binding property. Furthermore, the antibodies of the present invention also include special antibodies such as humanized antibodies and human antibodies, and the antibodies already known in the art other than novel antibodies may be included. The above-described antibody includes a complete form having a full length of two heavy chains and two light chains as well as a functional fragment of an antibody molecule, as long as it has the binding properties which specifically recognize the protein expressed by the mitofusin gene. The functional fragment of the antibody molecule refers to a fragment which holds at least antigen-binding function, and examples thereof include Fab, F(ab'), F(ab')2 and Fv and the like, but are not limited thereto.
In the present invention, the term "differentiation" refers to the process by which cells are divided and grown and the structure or function thereof is specialized during which the entire object is growing. In other words, the differentiation refers to a process in which biological cells, tissues or the like are changed into an appropriate form and function to perform respective given role. For example, the differentiation may include the process to which pluripotent stem cells such as embryonic stem cells are changed into ectoderm, mesoderm and endoderm cells, and also hematopoietic stem cells are changed into red blood cells, white blood cells, platelets and the like, that is, the process to which progenitor cells also express a certain differentiated character.
In the present invention, the "differentiated cell" refers to a cell in which the process of differentiation is proceeded to have a certain form and function. The differentiated cell of the present invention is not particularly limited, but comprises a germ cell, a somatic cell or a progenitor cell. One example thereof may be a human-derived cell, but the cells derived from various objects are included within the scope of the present invention.
Also, the differentiated cell of the present invention can comprise all the cells differentiated in vivo or in vitro, and it can be a differentiated cell of animal except for human or a differentiated cell separated in vivo.
The "somatic cell" refers to all cells in which differentiation has been completed constituting animal and plant except for the germ cell. The "progenitor cell" refers to a mother cell which does not express a differentiated character, but has a differentiation fate, if it has been found that a cell corresponding to its progeny expresses a certain differentiation character. For example, as for the nerve cells (neurons), nerve fibroblasts (neuronal stem cells) correspond to the precursor cell. As for the myotube, myoblasts correspond to the precursor cell.
In the present invention the term "pluripotent stem cell" refers to a stem cell in which has a pluriptency capable of differentiating into cells of all tissues of an object and a self-reproduction capability. Examples thereof include an embryonic stem cell and an induced pluripotent stem cell, but are not limited thereto.
The pluripotent stem cell of the present invention may comprise all of the pluripotent cells derived from humans, monkeys, pigs, horses, cattle, sheep, dogs, cats, mice, rabbits and the like, and the human-derived pluripotent stem cell is preferred.
The "induced pluripotent stem cell (iPSC)" refers to cells derived to have a pluripotency via an artificial reprogramming process from differentiated cells. The artificial reprogramming process is performed by introducing virus-mediated reprogramming factor using a retrovirus and lentivirus or non-viral-mediated reprogramming factor using a non-viral vector, protein and a cellular extract, or it may include the reprogramming process by stem cell extracts, compounds and the like. The induced pluripotent stem cells have almost the same properties as those of embryonic stem cells. Specifically, the cells show a similar shape, which show similar gene and protein expression patterns, they have pluripotency in vitro and in vivo, and they form a teratoma. When these cells are inserted into blastocysts, a chimeric mouse may be formed. In addition, a germline transmission of a gene is possible. The induced pluripotent stem cell of the present invention may comprise all of the induced pluripotent stem cells derived from humans, monkeys, pigs, horses, cattle, sheep, dogs, cats, mice, rabbits and the like, and the induced pluripotent stems derived from human are preferred.
In the present invention, the term "embryonic stem cell (ESC)" refers to cells extracted from the inner cell mass of a bastocyst, an early-stage preimplantation embryo and cultured in vitro, and having self-reproduction capability and pluripotency which can differentiate into cells of all tissues of the object. This may include embryoid bodies derived from embryonic stem cells. The embryonic stem cells of the present invention may include all embryonic stem cells derived from humans, monkeys, pigs, horses, cattle, sheep, dogs, cats, mice, rabbits and like, and the human embryonic stem cells derived from human is preferred.
In the present invention, the term "dedifferentiation" refers to a process in which a differentiated cell can revert to a state having a new type of differentiation potential. The dedifferentiation may be used interchangeably with the reprogramming of cells in the present invention. The reprogramming mechanisms of these cells mean that a nuclear epigenetic mark (DNA state associated with genetic changes in function without a change in the nucleotide sequence) is deleted and then a different set of epigenetic marks is established. During the differentiation and growth of multicelluar organisms, different cells and tissues is to obtain a different gene expression programs.
As used herein, the term "reprogramming promotion" means that the reprogramming during the reprogramming process occurs rapidly or the reprogramming efficiency is increased. This may mean that the efficiency of reprogramming may be increased in view of the speed or rate.
In one specific embodiment of the present invention, it was confirmed that Mfn1 and Mfn2 knockdown using shRNA significantly enhanced the reprogramming efficiency as compared with control shRNA (FIGS. 6a and 6b). Furthermore, complete knockout via the genetic ablation of Mfn1 and 2 yielded a significantly higher reprogramming efficiency (FIG. 6e) and a fragmented mitochondrial morphology (FIG. 6f) compared with WT mouse embryonic fibroblasts. In particular, Mfn1-/-(Mfn1-KO) exhibited a significant increase of about 500 times or more in the numbers of AP+ colonies and Mfn2-/-(Mfn1-KO) exhibited a significant increase of about 200 times or more in the numbers of AP+ colonies, as compared with that for the wild type (WT)(FIG. 6e). This shows that reprogramming efficiency of somatic cells via the ablation of Mfn1 and Mfn2 could be significantly increased.
These results demonstrate that, by using a composition comprising a repressor of mitofusin gene expression, an inhibitor of mitofusin protein activity, or a mixture thereof as an active ingredient, the reprogramming can be effectively rapidly performed, and the pluripotent (induced pluripotent) stem cells produced using the said composition can normally acquire the pluripotency.
Specifically, the composition for promoting reprogramming promotion according to the present invention may be in the form of a culture medium or culture medium additives. Accordingly, the composition of the present invention may further comprise a substance generally comprised in cell culture medium unless it is an obstacle in reprogramming to pluripotent stem cells from differentiated cells.
In addition, the composition for facilitating the reprogramming of differentiated cells into pluripotent stem cells in accordance with the present invention may comprise at least one reprogramming factor.
As used herein, the term "reprogramming factor" refers to a substance which induces so that finally differentiated cells are reprogrammed into pluripotent stem cells having a new type of differentiation potential. In the present invention, the term "reprogramming factor" may be used interchangeably with the term "reprogramming-inducible factor". The reprogramming factor may comprise any of the substances to induce the reprogramming of finally differentiated cells, without limitation, and it may be selected depending on the kinds of cells to be differentiated. Specifically, the reprogramming-inducible factor may further comprise, but is not limited to, proteins selected from the group consisting of Oct4, Sox2, Klf4, c-Myc, Nanog, Lin-28 and Rex1 or a nucleic acid molecule encoding these proteins.
In the present invention, the term "nucleic acid molecule encoding a protein" may be a form that is operatively linked to a promoter and the like so as to express the protein itself when delivered in the cells. Also, this broadly includes a nucleic acid molecule which can be inserted into an intracellular chromosome to express the protein. For example, at least one of the nucleic acid molecules encoding a protein selected from the group consisting of Oct4, Sox2, Klf4, c-Myc, Nanog, Lin-28, and Rex1 as the reprogramming-inducible factor, operatively linked to an expression vector, can be delivered into the cells, and it may be delivered into the cells in a form to be inserted into a chromosome of host cells.
In an exemplary embodiment of the present invention, the somatic cells were transfected with retrovirus 1 MOI (multiplicity of infection) encoding Oct4, Sox2, Klf4 and c-Myc, the reprogramming-inducible factor, thereby inducing reprogramming of mouse or human fibroblasts (Experiment 3).
The composition may comprise a repressor of mitofusin gene expression, an inhibitor of mitofusin protein activity, or a mixture thereof as an active ingredient for promoting reprogramming a differentiated cell into a pluripotent stem cell.
In another aspect, the invention provides a medium composition comprising a repressor of mitofusin gene expression, an inhibitor of mitofusin protein activity, or a mixture thereof as an active ingredient for maintaining and culturing pluripotent stem cells in an undifferentiated state. In the present invention, the repressor of mitofusin gene expression or the inhibitor of mitofusin protein activity may include a function to maintain pluripotent stem cells in an undifferentiated state and thus can be used in the above-described composition. In addition, the medium composition for maintaining and culturing pluripotent stem cells according to the present invention can further comprise a substance generally comprised in cell culture medium unless it is an obstacle to maintain and culture the cells in an undifferentiated state.
The above-described "repressor of mitofusin gene expression", "inhibitor of mitofusin protein activity", or "pluripotent stem cell" are as previously described.
In one specific embodiment of the present invention, in culture conditions using unconditioned medium (UM), human embryonic stem cells (hESC) led to differentiation, but hESCs with Mfn1 and 2 knockdown using siRNA were maintained in the undifferentiated state (FIG. 6c). Under UM culture conditions, the expression of pluripotency-associated markers such as Oct3/4 and Nanog was maintained well in hESCs upon knockdown of Mfn1 and 2 (FIGS. 6d and 7). These results demonstrate that in the case of repressing or genetically ablating the mitofusin, pluripotent stem cells were maintained in differentiated state.
Yet another aspect of the invention provides a method for producing a pluripotent stem cell reprogrammed from a differentiated cell, comprising (a) delivering at least one reprogramming factor to a differentiated cell, and (b) culturing the differentiated cell in a medium containing the composition for promoting the reprogramming. In the method for producing a pluripotent stem cell reprogrammed by inhibiting mitofusin in differentiated cells according to the present invention, the reprogrammed cell numbers are greatly increased and the time required for the reprogramming are greatly shortened, thus leading to a significant increase in the reprogramming efficiency, compared with a conventional method for producing the reprogrammed pluripoent stem cells.
The "differentiated cell", "reprogramming factor" and "pluripotent stem cell" are as previously described.
The method of delivering at least one reprogramming factor to a differentiated cell in step (a) may use, without limitation, a method of providing a nucleic acid molecule or protein, typically in the cell used in the art. Exemplary examples thereof may comprise a method of administering the reprogramming factor to a culture solution of differentiated cells, a method of injecting the reprogramming factor in the differentiated cells or a method of infecting the differentiated cells with a virus which is obtained from packaging cells transfected with a virus vector in which a gene of the reprogramming factor is inserted.
The virus vectors may include vectors derived from retrovirus, for example HIV (human immunodeficiency virus), MLV (murine leukemia virus), ASLV (avian sarcoma/leukosis), SNV (spleen necrosis virus), RSV (rous sarcoma virus), mMTV (mouse mammary tumor virus), etc., lentivirus, adenovirus, adeno-associated virus, herpes simplex virus, and the like, but are not limited thereto. Specifically, retrovirus vector may be used. More specifically, retrovirus vector PMXs may be used.
The method for inducing the reprogramming factor directly to the differentiated cells may select and use any method known in the art. It may appropriately select and use, but is not limited to, any of the methods including microinjection, electroporation, particle bombardment, direct muscle injection, insulator, and transposon.
Also, step (a) and step (b) may be performed simultaneously, sequentially or in reverse order, and the method may further comprise the step of separating the embryonic stem cell-like colonies from the culture from the step (b).
More specifically, in present invention, the pluripotent stem cell may have an increased production of lactic acid which is a by-product of glycolysis, or an activated Ras-Raf-HIF1.alpha. signaling, or a reduced oxygen consumption, compared with that of the differentiated cells, wherein the reprogramming efficiency may be improved by reducing the time required for reprogramming and increasing the number of reprogrammed cells.
In an exemplary embodiment of the present invention, the expression of genes encoding major enzymes involved in glycolysis and the relative quantity of metabolites in each step of glycolysis were dramatically increased in Mfn1 and 2 knockdown cells compared with the control (FIGS. 8a and 8b), and intracellular lactate production was indeed increased by Mfn1 and 2 knockdown (FIG. 8c).
During the early stage of reprogramming, reciprocal inhibition of the Mfn1/2 and p53/p21 pathways activates Ras-Raf signaling, leading to subsequent HIF1.alpha. stabilization (FIG. 10f), indicating that it is possible to mimic hypoxic conditions, which are favorable for efficient reprogramming. Further, under hypoxic conditions, a significant increase of iPSC generation was observed (FIG. 12a), and a related increase in the HIF1.alpha. and LDHA proteins was observed (FIG. 12b). Under the same conditions, the promoter activity of Mfn1 was significantly down-regulated (FIG. 12c), and the protein expression of Mfn1 and 2 was prominently down-regulated (FIG. 12b).
A further aspect of the present invention provides a pluripotent stem cell prepared by the method of producing a pluripotent stem cell reprogrammed from differentiated cell. Specifically, the pluripotent stem cell may be induced pluripotent stem cell.
The "pluripotent stem cell" and "induced pluripotent stem cell" are as previously described.
In the specific embodiment of the present invention, through the method for producing pluripotent stem cells having a very high reprogramming efficiency according to the present invention, the pluripotent stem cells reprogrammed from mouse and human fibroblasts was obtained (FIGS. 6a, 6b and 6e).
A further embodiment of the present invention provides a method for reprogramming an isolated differentiated cell into a pluripotent stem cell comprising repressing the expression of mitofusin gene or inhibiting an activity of mitofusin protein of the isolated differentiated cell. More specifically, repressing the expression of mitofusin gene or inhibiting an activity of mitofusin protein may be performed by treating the isolated differentiated cell with the composition for promoting the reprogramming.
The "differentiated cell", "repressing the expression of mitofusin gene", "inhibiting the activity of protein", "pluripotent stem cell", and "reprogramming" are as previously described.
Yet in another aspect, the invention provides pluripotent stem cell prepared by the reprogramming method. Specifically, the pluripotent stem cell may be induced pluripotent stem cell.
The "pluripotent stem cell" and "induced pluripotent stem cell" are as previously described.
Yet in another aspect, the invention provides a use of a repressor of mitofusin gene expression, an inhibitor of mitofusin protein activity, or a mixture thereof for producing a composition for promoting the reprogramming of differentiated cell into pluripotent stem cell. Specifically, the pluripotent stem cell may be induced pluripotent stem cell.
The "pluripotent stem cell", "induced pluripotent stem cell", "differentiated cell", "repressor of mitofusin gene expression", "inhibitor of mitofusin protein activity", and "reprogramming" are as previously described.
In the present invention, the term "repressor" may be used interchangeably with the term "inhibitor", and the term "repress" may be used interchangeably with the term "inhibit".
MODE FOR INVENTION
Hereinafter, the present invention will be described in detail to aid the understanding thereof with reference to the examples and the like. However, examples according to the present invention can be modified in many different forms and it should not be construed that the scope of the present invention is limited to the examples below. Examples of the invention are provided to illustrate more fully the present invention to those having ordinary skill in the art.
Experimental Example 1
Reagents
Mdivi1, 2-deoxy-D-glucose (2-DG), and lentiviral vectors that express each shRNA for gene knockdown were purchased from Sigma. siRNAs for mitofusin 1 or 2 (Mfn1/2) knockdown were purchased from Dharmacon. Nutlin3a was purchased from Cayman Chemical Co. A Screen-Well.TM. REDOX library was purchased from Enzo Life Sciences. The shRNA sequences for Mfn1/2 (shMfn1, shMfn2) and siRNA sequences for Mfn1/2 (siMfn1, siMfn2), used in the present invention, are presented in Table 1 below.
TABLE-US-00001 TABLE 1 mouse shMfn1 Target GCGTTTAAGCAGCAGTTTGTA SEQ ID NO: 5 Sequence: Hairpin 5'-CCCG-GCGTTTAAGCAGC Sequence: AGTTTGTA-CTCGAG-TACAA SEQ ID NO: 6 ACTGCTGCTTAAACCC-TTTT TG-3' shMfn2 Target TGGATGGACTATGCTAGTGAA SEQ ID NO: 7 Sequence: Hairpin 5'-CCGG-TGGATGGACTATG SEQ ID NO: 8 Sequence: CTAGTGAA-CTCGAG-TTCAC TAGCATAGTCCATCCA-TTTT TG-3' human shMfn1 Target ATCCGGAACTTGATCGAATAG SEQ ID NO: 9 Sequence: Hairpin 5'-CCGG-ATCCGGAACTTGA SEQ ID NO: 10 Sequence: TCGAATAG-CTCGAG-CTATT CGATCAAGTTCCGGAT-TTTT TTGAAT-3' shMfn2 Target GCTCAGTGCTTCATCCCATTT SEQ ID NO: 11 Sequence: Hairpin 5'-CCGG-GCTCAGTGCTTCA SEQ ID NO: 12 Sequence: TCCCATTT-CTCGAG-AAATG GGATGAAGCACTGAGC-TTTT TG-3' siMfn1 SMARTpool CGAUGAAGUAAACGCCUUA SEQ ID NO: 13 CAUGAUAGGAGGAAACGAA SEQ ID NO: 14 CAGAAUAUAUGGAAGACGU SEQ ID NO: 15 GGAAGUUCUUAGUGCUAGA SEQ ID NO: 16 siMfn2 SMARTpool GACUAUAAGCUGCGAAUUA SEQ ID NO: 17 CAUGAGGCCUUUCUCCUUA SEQ ID NO: 18 GCAACUCUAUCGUCACAGU SEQ ID NO: 19 GGUGGACGAUUACCAGAUC SEQ ID NO: 20
Experimental Example 2
Mice and Cell Culture
All animal experimental protocols were approved by the bioethics committee of KRIBB. MEFs were isolated from embryonic day 12.5 embryos obtained from WT, p53-KO(p53-/-) and p21-KO (p21-/-) mice (The Jackson Laboratory) and maintained in DMEM (Invitrogen) supplemented with 10% fetal bovine serum (FBS, Invitrogen), 1% non-essential amino acids (NEAA, Invitrogen), 0.1 mM .beta.-mercaptoethanol (Sigma), and 1% penicillin/streptomycin (Invitrogen). The mouse embryonic stem cell (ESC) line J1 (ATCC) and induced pluripotent stem cell (iPSC) lines were routinely maintained on .gamma.-irradiated MEFs or Matrigel.TM. (BD Biosciences)-coated plates in DMEM (Invitrogen) supplemented with 15% FBS, 1% NEAA, 1% L-glutamine (Invitrogen), 20 mM HEPES (Invitrogen), 0.1 mM .beta.-mercaptoethanol, 1% penicillin/streptomycin, and 1,000 U/ml LIF (Millipore). The culture medium was changed every other day. Human H9 ESC lines (WiCell Research Institute) were routinely maintained on .gamma.-irradiated MEFs in hESC culture medium (unconditioned medium; UM) or Matrigel.TM.-coated plates in MEF-CM (conditioned medium). The culture medium was changed daily, and cells were passaged every 5-7 days following collagenase IV (1 mg/ml; Invitrogen) or dispase (1 mg/ml; Invitrogen) treatment. Human foreskin fibroblasts (hFFs; ATCC) were maintained in DMEM containing 10% FBS, 1% NEAA, 1 mM L-glutamine, and 0.1 mM .beta.-mercaptoethanol.
Experimental Example 3
Virus Production and iPSC Generation
GP2-293 packaging cells were co-transfected with pMX vectors containing the human cDNAs for Oct4 (POU5F1), Sox2, Klf4, and c-Myc (OSKM, Addgene) and the VSV-G envelope vector using Lipofecamine 2000 transfection reagent (Invitrogen). Virus-containing supernatants were collected at 48 and 72 hours after transfection and concentrated via ultracentrifugation (Beckman Coulter) at 25,000 rpm for 90 minutes. To generate iPSCs, MEFs were seeded at 1.times.10.sup.5 cells per well in 6-well plates the day before transduction and subsequently transduced with concentrated virus at a multiplicity of infection (MOI) of 1 in the presence of Polybrene (8 .mu.g/ml). Four days after transduction, the MEFs were trypsinized and reseeded at a density of 3.times.10.sup.4 cells per well in Matrigel.TM.-coated 12-well plates. On the next day, the medium was replaced with mouse ESC medium, and the medium was changed every other day thereafter.
Experimental Example 4
Alkaline Phosphatase (AP) Staining
AP staining was performed with an alkaline phosphatase (AP) kit according to the manufacturer's protocol (Sigma). Cells were fixed with a citrate-acetone-formaldehyde solution for 30 sec and then stained with AP staining solution (Naphthol/Fast Red Violet) for 15 min in the dark. Images of AP+cells were obtained with a HP Scanjet G4010 (Hewlett-Packard).
Experimental Example 5
RNA Extraction, Real-Time Polymerase Chain Reaction (PCR), and Microarray Analysis
Total RNA was isolated from cells with the RNeasy Mini Kit (Qiagen) and reverse-transcribed with the SuperScript First-Strand Synthesis System Kit (Invitrogen) according to the manufacturers' protocols. Quantitative real-time PCR was performed with Fast SYBR.RTM. Green Master Mix (Life Technologies) on a 7500 Fast Real-Time PCR System (Applied Biosystems). The primer sequences used in the present invention are presented in Table 2 below. Transcriptome analysis was conducted with Agilent Mouse Genome 44 k Arrays.
TABLE-US-00002 TABLE 2 Gene Forward Primer Reverse Primer Mfn1 TGAAAGCTGGCTGTCTTGTG AGAGCCGCTCATTCACCTTA (SEQ ID NO: 21) (SEQ ID NO: 22) Mfn2 CCTCACAGAGGGCTCAGAAG GTCCAGCTCCGTGGTAACAT (SEQ ID NO: 23) (SEQ ID NO: 24) p53 AGAGACCGCCGTACAGAAGA CTGTAGCATGGGCATCCTTT (SEQ ID NO: 25) (SEQ ID NO: 26) p21 CGGTGGAACTTTGACTTCGT CAGGGCAGAGGAAGTACTGG (SEQ ID NO: 27) (SEQ ID NO: 28) Glycolysis Glut1 GATCCTGGGCCGCTTCAT ACATGGGCACGAAGCCTG (SEQ ID NO: 29) (SEQ ID NO: 30) Hif1.alpha. TCAAGTCAGCAACGTGGAAG TATCGAGGCTGTGTCGACTG (SEQ ID NO: 31) (SEQ ID NO: 32) hk2 GGGACGACGGTACACTCAAT GCCAGTGGTAAGGAGCTCTG (SEQ ID NO: 33) (SEQ ID NO: 34) Pfk ATGGCAAAGCTATCGGTGTC ACACAGTCCCATTTGGCTTC (SEQ ID NO: 35) (SEQ ID NO: 36) Pam1 GCCTGATCACCCCTTCTACA TCAAGACCCTTTTCCCCTCT (SEQ ID NO: 37) (SEQ ID NO: 38) Eno1 AGTACGGGAAGGACGCCACCA GCGGCCACATCCATGCCGAT (SEQ ID NO: 39) (SEQ ID NO: 40) Pkm CTGCAGGTGAAGGAGAAAGG AGATGCAAACACCATGTCCA (SEQ ID NO: 41) (SEQ ID NO: 42) Ldha TGGCAGCCTCTTCCTTAAAA CAGCTTGCAGTGTGGACTGT (SEQ ID NO: 43) (SEQ ID NO: 44) .beta.-actin AGCCATGTACGTAGCCATCC CTCTCAGCTGTGGTGGTGAA (SEQ ID NO: 45) (SEQ ID NO: 46) Oxidative phosphorylation ND132 CCCATTCGCGTTATCTT AAGTTGATCGTAACGGAAGC (SEQ ID NO: 47) (SEQ ID NO: 48) Atp6ap1 GCCATGGAACGACTTGAAAT CGGAGAGAAGAAACCAGCAC (SEQ ID NO: 49) (SEQ ID NO: 50) Sdhb ACTGGTGGAACGGAGACAAG TTAAGCCAATGCTCGCTTCT (SEQ ID NO: 54) (SEQ ID NO: 52) Uqcrc1 CCTACAGCACTCGAGAGCAC AGGTGTGCCCTGGAATGCTG (SEQ ID NO: 53) (SEQ ID NO: 54)
Experimental Example 6
Metabolome Analysis
Cells were washed with a 5% mannitol solution (Wako) and scraped in MeOH (Wako) including internal standards. The aqueous layer was separated via centrifugation at 3,200 rpm for 10 minutes. Metabolite extracts were prepared using 5 kDa-cutoff ultrafilter tips (Millipore) at 9,100.times.g for 2.5 hours, then evaporated in a centrifugal evaporator (SCANVAC), and capillary electrophoresis time-of-flight mass spectrometry (CE-TOFMS) was conducted according to the recommended protocols (Human Metabolome Technologies).
Experimental Example 7
Lactate and ATP Assays
The intracellular lactate contents were quantified from 10 .mu.g of protein using a Lactate Assay Kit (BioVision) according to the manufacturer's protocol. ATP was measured from 0.1 .mu.g of protein using an ADP/ATP Ratio Assay Kit (Abcam). The luminescence intensity was quantified using a SpectraMax microplate reader (Molecular Devices).
Experimental Example 8
Mitochondrial Staining
Cells were fixed in 4% paraformaldehyde for 10 minutes at room temperature (RT) and then in MeOH for 15 minutes at -20.degree. C., after which their permeability was increased with 0.3% Triton X-100 in PBS for 30 min and blocked with 4% BSA for 2 hours at RT. The samples were stained with the anti-Tom20 antibody diluted in a blocking buffer at 4.degree. C. overnight. After washing, the cells were stained with Alexa 488-conjugated secondary antibodies (Invitrogen) for 45 minutes at RT. The nuclei were counterstained with 10 .mu.g/ml DAPI. For live cell imaging, the cells were incubated with 200 nM MitoTracker.RTM. Red CMXRos (Invitrogen) for 30 minutes at 37.degree. C. Florescent images were analyzed under an IX51 microscope (Olympus) or an Axiovert 200M microscope (Carl Zeiss). The antibodies used in these assays are listed in Table 3 below.
TABLE-US-00003 TABLE 3 Antibody Catalog No. Company Dilution anti-Tom20 sc-17764 SantaCruz 1:70 anti-HSP60 4870 Cell Signaling 1:500 anti-Cyclin B1 sc-245 Santacruz 1:1000 anti-p-Drp1 3455 Cell signaling 1:1000 anti-Drp1 8570 Cell signaling 1:1000 anti-Mfn1 ABC41 Millpore 1:2000 anti-Mfn2 ab50843 abcam 1:1000 anti- .beta.-acin A1978 Sigma 1:500000 anti- mNanog A300-397A Bethyl Lab 1:5000 anti- Nanog AF1997 R&D 1:200 anti- Oct3/4 sc-8628 Santacruz 1:500 anti-Thy1.1 551401 BD 1:50 anti-p53 2524 Cell signaling 1:1000 anti-p21 sc-397 SantaCruz 1:4000 anti-Ras 3965 Cell signaling 1:1000 anti-p-Raf 9427 Cell signaling 1:1000 anti-Raf 9422 Cell signaling 1:1000 anti-p-ERK 9101 Cell signaling 1:1000 anti-ERK 9102 Cell signaling 1:2000 anti-p-PI3K 4228 Cell signaling 1:1000 anti-p-Akt 9271 Cell signaling 1:1000 anti-p-mTOR 2971 Cell signaling 1:1000
Experimental Example 9
Cell Sorting and Mitochondrial Morphology Analysis
A single-cell suspension of reprogramming cultures on day 11 was labeled with anti-Thy1-PE antibodies (BD Biosciences) for 20 minutes at RT, then incubated with anti-PE microbeads (Miltenyi Biotec) for 15 minutes at 4.degree. C. sorted using a MACS separation system (Miltenyi Biotec). Thy1-negative populations were then labeled with anti-SSEA1 microbeads (Miltenyi Biotec) for 20 minutes at RT and sorted using MACS. To ensure a high purity of the sorted populations, two separation columns were used consecutively. The sorted cells were reseeded at a density of 3.times.10.sup.4 cells per well in Matrigel.TM.-coated 12-well plates or used for mitochondrial fractionation. Three days after reseeding, mitochondria were visualized via MitoTracker staining under a fluorescent microscope, and cell numbers were counted according to the observed mitochondrial morphology as fragmented/intermediate/fused. Over 30 cells per sorted subpopulation were scored.
Experimental Example 10
Mitochondrial Fractionation and Western Blot Analysis
Mitochondria were fractionated from each MACS-sorted subpopulation using a mitochondria isolation kit (Thermo). For Western blot analysis, whole-cell lysates were obtained using RIPA buffer, and proteins were separated via SDS-PAGE and electrotransferred to PVDF membranes (Millipore). The antibodies used are listed in Table 2.
Experimental Example 11
Promoter Assay and Chemical Screening
Mfn1-KO MEFs were stably transfected with an Mfn1 promoter reporter construct (Genecopoeia) cells of mouse and human were produced using Mfn1-/- MEFs and 293T cells (human embryonic renal cells) and then treated with the Screen-Well.TM. REDOX library, containing 84 compounds, for 48 hours in a concentration of 10 nM to 10 .mu.M. Mfn1 promoter activity was measured in the culture supernatants with the Secrete-Pair.TM. Dual Luminescence and Gaussia Luciferase Assay Kits (Genecopoeia) using a SpectraMax microplate reader.
Experimental Example 12
Statistics
The data are presented as the mean.+-.SE (n=3). Student's t-test was applied to evaluate between-group comparisons. A value of p<0.05 was considered significant.
Example 1
Analysis of Mitochondrial Function During Early-Stage Reprogramming of p53-/- and p21-/- Somatic Cells
The reprogramming efficiency to generate iPSCs, determined by alkaline phosphatase (AP) staining, was increased in p53-/- and p21-/- mouse embryonic fibroblasts (MEFs; FIG. 1a). Beginning in the early stage of reprogramming, around day 7 (D7; FIG. 1b), dramatic morphological changes together with a substantial increase in cell numbers were observed in p53-/- and p21-/- cells compared with the wild-type control (FIG. 1c). To elucidate the underlying mechanisms of the early stage of reprogramming, microarray-based transcriptome and mass spectrometry-based metabolome analyses were performed using WT, p53-/-, and p21-/- MEFs at D7 of reprogramming.
Transcriptome analysis showed that p53-/- and p21-/- cells reprogrammed for 7 days were positioned at an intermediate stage between initiation (early) and maturation (late), as determined by comparing the levels of marker expression allowing discrimination of the stages of reprogramming (FIG. 2a).
Also, the expression of gene sets related to cell growth, adhesion, RNA splicing, and the cell cycle was markedly increased, and conversely, differentiation-related genes were downregulated in reprogramming intermediates from p53-/- and p21-/- cells compared with those of WT cells (FIG. 2b). However, within the central carbon pathway, glycolysis showed no significant changes regarding reprogramming intermediates from p53-/- and p21-/- cells (FIGS. 1d and 2c). The expression of genes encoding major enzymes involved in glycolysis remained unchanged, and the relative quantity of metabolites in each step of glycolysis decreased in reprogramming intermediates from p53-/- and p21-/- cells compared with WT cells (FIG. 1d). However, the intracellular production of lactate, the end-product of glycolysis, was sequentially increased upon reprogramming and promoted by p53-/- and p21-/- (FIG. 3a), whereas cellular reprogramming was substantially decreased by a glycolysis inhibitor, 2-DG (Supplementary FIG. 3b).
On the contrary, gene expression related to mitochondrial function was markedly suppressed in reprogramming intermediates from p53-/- and p21-/- cells compared with WT, but the expression levels of tricarboxylic acid (TCA) cycle-related genes remained unchanged (FIG. 1e). Notably, mitochondria-encoded oxidative phosphorylation (OXPHOS) subunits, including ND1 (complex I) and Atp6ap1 (ATP6 family in complex V), were markedly downregulated, whereas nuclear-encoded genes were not (Sdhb in complex II, Uqcrc1, and the ATP5 family in complex V) (FIGS. 4a and 4b). Importantly, mitochondrial fusion genes, such as Mfn1/2 and Chchd3, showed significantly decreased levels in reprogramming intermediates from p53-/- and p21-/- cells, whereas the levels of fission genes, such as Dnm1, Dnm11 (Drp1), Fis1, and Mff, were increased or remained unchanged (FIGS. 1e and f).
Furthermore, a reduced ADP/ATP ratio (an energy turnover index) was found in reprogramming intermediates from p53-/- cells compared with the WT control (FIG. 4c). These results suggest that a metabolic shift from mitochondrial dependence to independence occurs more rapidly and efficiently during the reprogramming of p53-/- and p21-/- cells compared with WT cells.
Example 2
Expression Analysis of Mitochondrial Fusion Proteins in p53-/- and p21-/- Cells; and Pluripotent Reprogramming Intermediates
On D7 after reprogramming, reprogramming intermediates from p53-/- and p21-/- cells displayed some fragmented and punctate mitochondria, which is characteristic of pluripotent stem cells, while reprogramming intermediates from WT cells did not (FIG. 5a). Prior to the reprogramming, fragmented mitochondria (FIG. 5b) and increased cell proliferation (FIG. 5c) were detected in p53-/- and p21-/- MEFs compared with WT cells. The expression of mitochondrial structural components between somatic WT MEFs, p53-/- and p21-/- MEFs, and pluripotent stem cells [PSCs (ESCs and iPSCs)] showed large differences at the protein level. Cyclin B1-dependent Drp1 phosphorylation and Drp1 protein expression was higher in p53-/- and p21-/- MEFs and PSCs than in WT MEFs. Conversely, Mfn 1 and 2 expression was significantly lower in PSCs and p53-/- and p21-/- MEFs compared with WT MEFs (FIG. 5d). To further examine the correlation between pluripotency induction and mitochondrial dynamics, reprogramming intermediates were sorted on D11 after reprogramming via magnetic-activated cell sorting (MACS) based on the expression of the somatic cell marker Thy1 and the early-stage pluripotency marker SSEA1 (FIG. 5e). The mitochondrial morphology of the Thy1+/SSEA1- (somatic), Thy1-/SSEA1- (early intermediate), and Thy1-/SSEA1+ (late intermediate) subpopulations was scored and quantified as fused(somatic)/intermediate/fragmented(pluripotent). Upon reprogramming, the fragmented phenotype was markedly increased in the Thy1-/SSEA1+ subpopulation, while the fused form gradually disappeared (FIG. 5e). Drp1 expression and phosphorylation levels were significantly increased in the mitochondrial fraction of the Thy1-/SSEA1+ subpopulation, while Mfn1 and 2 expression was decreased (FIG. 5f). Taking these findings together, it can be seen that the p53-/- and p21-/- cells are in a reprogramming-favorable state with a distinct mitochondrial background showing low expression of Mfns, which is similar to pluripotent reprogramming intermediates (FIG. 5g).
Example 3
Pluripotency Acquisition and Maintenance Via Mfn1 and Mfn2 Ablation
Whether Mfn1/2 downregulation contributes to somatic cell reprogramming was confirmed (FIG. 6). Mfn1 and Mfn2 knockdown using shRNA strongly enhanced the observed reprogramming efficiency in both mouse (FIG. 6a) and human cell systems (FIG. 6b), as assayed by AP staining, whereas control shRNA failed to show the same. In addition, in culture conditions using unconditioned medium (UM), hESC differentiation occurred, but Mfn1 and 2 knockdown with siRNA was maintained in the undifferentiated state (FIG. 6c). Under UM culture conditions, the expression of pluripotency-associated markers such as Oct3/4 and Nanog was maintained well in hESCs upon knockdown of Mfn1 and 2 (FIGS. 6d and 7).
Furthermore, complete knockout via the genetic ablation of Mfn1 and Mfn2 yielded a significantly higher reprogramming efficiency (FIG. 6e) and a fragmented mitochondrial morphology (FIG. 6f) compared with WT MEFs. In particular, Mfn1-/- exhibited about 500 times or more significant increase in the numbers of AP+ colonies and Mfn2-/- exhibited about 200 times or more increase in the numbers of AP+ colonies as compared with WT (FIG. 6e). These results confirm that reprogramming efficiency of somatic cells via the ablation of Mfn1 and 2 could be significantly increased. However, these effects were blocked by treatment with Mdivi1, a pharmacological inhibitor of mitochondrial fission (FIGS. 6e and 6f).
These results demonstrate that in the case of inhibiting or genetically ablating mitochondrial structural protein Mfn, the efficiency of reprogramming a differentiated cell into a pluripotent stem cell was greatly increased and the pluripotency was maintained.
Example 4
Mfn1 and 2 Knockdown Facilitates Glycolytic Conversion in Early-Stage Reprogramming
To clarify the mechanism promoting cell fate transition to pluripotency induced by Mfn1/2 knockdown, transcriptome and metabolome analyses were performed in D7 reprogramming cultures of Mfn1 and 2 shRNA-transduced cells (FIG. 8). As a result, gene expression profiling of the OXPHOS complex following Mfn1 and Mfn2 knockdown revealed overall downregulation of genes specifying mitochondrial energy metabolism (FIG. 9a). However, the expression of genes encoding major enzymes involved in glycolysis and the relative quantity of metabolites in each step of glycolysis were dramatically increased in Mfn1 and 2 knockdown cells compared with the control (FIGS. 8a and 8b), and intracellular lactate production was indeed increased by Mfn1 and 2 knockdown (FIG. 8c). These findings reveal that the suppression of mitochondrial fusion through Mfn1/2 ablation promotes glycolytic bioenergetic transition to meet the energy demands of highly proliferating pluripotent cells, such as pluripotent iPSCs.
Example 5
Reciprocal Inhibition of p53/p21 and Mfn1/2 Activates the Ras-Raf-HIF1.alpha. Signaling
Gene expression profiling showed that the expression of p53 (Trp53), p21 (Cdkn1a), and p16 (Cdkn2a) was significantly downregulated in Mfn1 and 2 knockdown cells compared with WT cells (FIGS. 9b and 9c). Also, the protein expression of p53 and p21 was downregulated in Mfn1-/- and Mfn2-/- cells compared with WT cells (FIG. 10a), and Mfn1 expression was suppressed during the reprogramming of p53-/- and p21-/- cells compared with WT cells (FIG. 10b).
The suppression of either of Mfn1/2 (FIGS. 6a, 6b, and 6e) or p53/p21 (FIGS. 1a to 1c) was sufficient for achieving efficient reprogramming of somatic cells into iPSCs, and conversely, either pharmacological reactivation of p53 or overexpression of Mfn1 effectively blocked the induced pluripotent stem cell reprogramming promoted by Mfn1 and 2 (FIG. 10c) or p53 and p21 ablation (FIG. 10d).
These findings suggest the presence of cross-talk between Mfn1/2 and p53/p21 signaling during the reprogramming process. It is already well established that Mfn2 is a direct p53-inducible target gene, and Mfn1 and Mfn2, which shares a high degree of homology with Mfn2, directly bind Ras and Raf, resulting in inhibition of cell proliferation via sequestration of Ras-Raf-ERK signaling. Under the experimental conditions of the present invention, we also observed a dramatic increase in the levels of phosphorylated Raf, ERK, PI3K, Akt, and mTOR proteins in the reprogramming intermediates of Mfn1 and 2 knockdown cells on D7 of reprogramming (FIG. 10e). Moreover, the expression of HIF1.alpha., a downstream effector of mTOR and an important metabolic target of a glycolytic shift, appeared during the early reprogramming process and a downstream target of HIF11.alpha., lactate dehydrogenase isoform A (LDHA)21, was also significantly increased at the protein level in the reprogramming intermediates of Mfn1 and Mfn2 knockdown cells at D7 of reprogramming (FIG. 10e). Further, an increase in the expression of HIF1.alpha. and its target Glut1 at the gene level was detected in the reprogramming intermediates of Mfn1 and 2 knockdown cells at D7 of reprogramming (FIG. 8b). On the contrary, HIF1.alpha. knockdown using shRNA strongly prevented increased expression of LDHA (FIG. 11a), production of lactate (FIG. 11b), and efficiency of reprogramming (FIG. 11c) in Mfn1 and Mfn2 knockdown cells. Taken together, these results demonstrate that during the early stage of reprogramming, reciprocal inhibition of the Mfn1/2 and p53/p21 pathways activates Ras-Raf signaling, leading to subsequent HIF1.alpha. stabilization (FIG. 10f), indicating that it is possible to mimic hypoxic conditions, which are favorable for efficient reprogramming.
Example 6
Hypoxia Decreases Mfn1 and 2 Expression
Under hypoxic conditions, a significant increase in PSC generation (FIG. 12a) and a related increase in the HIF1.alpha. and LDHA proteins (FIG. 12b) were observed. Under the same conditions, the promoter activity of Mfn1 was significantly downregulated (FIG. 12c), and the protein expression of Mfn1 and 2 was prominently decreased (FIG. 12b). These findings suggest that the effects of Mfn1/2 on reprogramming are related to the HIF1.alpha.-dependent induction of hypoxia-mimicking conditions, possibly via modulating the cross-talk between key components involved in the regulation of p53-dependent signaling and a metabolic switch to glycolysis. Thus, Mfn1/2 downregulation can be an efficient and easy way to switch the cell fate to pluripotency.
Example 7
Mfn1 Expression Inhibition Compound
Chemicals with the aim of altering the promoter activity of Mfn1 using 84 focused redox library compounds were screened.
First, a new use of the top 3 downregulated compounds (piceatannol, tetramethylpyrazine and 21-[4-(2,6-di-1-pyrrolidinyl-4-pyrimidinyl)-1-piperazinyl]pregna-1,4,9[11- ]-triene-3,20-dione maleate), and the top 2 upregulated compounds (Tanshinone IIA, erbinafine.HCl) controlling mouse Mfn1 promoter activity was identified (FIG. 12d).
When the selected compounds were treated during the reprogramming, Mfn1 protein expression was down-regulated or up-regulated (FIG. 12e). The compounds not influencing on Mfn1 promoter activity did not change the expression of Mfna protein.
Also, compounds that inhibit mouse Mfn1 promoter activity enhanced the reprogramming efficiency of both mouse and human somatic cells (FIGS. 12f and 13a), whereas these compounds that promote Mfn1 promoter activity suppressed the reprogramming (FIGS. 12f and 13a). Also, the inhibitor of Mfn1 promoter activity maintained mouse ESCs (FIG. 12g) and human ESCs (FIG. 13b) in an undifferentiated state.
In addition, a new use of the three compounds that best inhibit human Mfn1 promoter activity (U74389G maleate, retinyl palmitate and D-.alpha.-tocopheryl quinone)(FIG. 12h) and that U74389G maleate inhibited Mfn1 promoter activity in both mice and human cells were indentified.
These results demonstrate that inhibitors of Mfn1 or Mfn2 remarkably facilitate reprogramming a differentiated cell into a pluripotent stem cell and maintain the pluripotency and thus, lead a significant improvement in comparison with a conventional reprogramming condition (FIG. 14).
From the above description, a person skilled in the art will appreciate that the present invention may be practiced in other specific forms without changing the technical idea or essential characteristics thereof. In this regard, the embodiments described above should be understood to be illustrative rather than restrictive in every respect. The scope of the invention should be construed that all changes or variations derived from the meaning, scope and equivalent concepts of the appended claims rather than the detailed description fall within the scope of the present invention.
SEQUENCE LISTINGS
1
541741PRTMus sp. 1Met Ala Glu Thr Val Ser Pro Leu Lys His Phe Val Leu Ala Lys Lys1 5 10 15Ala Ile Thr Ala Ile Phe Gly Gln Leu Leu Glu Phe Val Thr Glu Gly 20 25 30Ser His Phe Val Glu Ala Thr Tyr Arg Asn Pro Glu Leu Asp Arg Ile 35 40 45Ala Ser Glu Asp Asp Leu Val Glu Ile Gln Gly Tyr Arg Asn Lys Leu 50 55 60Ala Val Ile Gly Glu Val Leu Ser Arg Arg His Met Lys Val Ala Phe65 70 75 80Phe Gly Arg Thr Ser Ser Gly Lys Ser Ser Val Ile Asn Ala Met Leu 85 90 95Trp Asp Lys Val Leu Pro Ser Gly Ile Gly His Thr Thr Asn Cys Phe 100 105 110Leu Ser Val Glu Gly Thr Asp Gly Asp Lys Ala Tyr Leu Met Thr Glu 115 120 125Gly Ser Asp Glu Lys Lys Ser Val Lys Thr Val Asn Gln Leu Ala His 130 135 140Ala Leu His Met Asp Lys Asp Leu Lys Ala Gly Cys Leu Val His Val145 150 155 160Phe Trp Pro Lys Ala Lys Cys Ala Leu Leu Arg Asp Asp Leu Val Leu 165 170 175Val Asp Ser Pro Gly Thr Asp Val Thr Thr Glu Leu Asp Ile Trp Ile 180 185 190Asp Lys Phe Cys Leu Asp Ala Asp Val Phe Val Leu Val Ala Asn Ser 195 200 205Glu Ser Thr Leu Met Asn Thr Glu Lys His Phe Phe His Lys Val Asn 210 215 220Glu Arg Leu Ser Lys Pro Asn Ile Phe Ile Leu Asn Asn Arg Trp Asp225 230 235 240Ala Ser Ala Ser Glu Pro Glu Tyr Met Glu Asp Val Arg Arg Gln His 245 250 255Met Glu Arg Cys Leu His Phe Leu Val Glu Glu Leu Lys Val Val Ser 260 265 270Pro Ser Glu Ala Arg Asn Arg Ile Phe Phe Val Ser Ala Lys Glu Val 275 280 285Leu Asn Ser Arg Lys His Lys Ala Gln Gly Met Pro Glu Gly Gly Gly 290 295 300Ala Leu Ala Glu Gly Phe Gln Ala Arg Leu Gln Glu Phe Gln Asn Phe305 310 315 320Glu Gln Thr Phe Glu Glu Cys Ile Ser Gln Ser Ala Val Lys Thr Lys 325 330 335Phe Glu Gln His Thr Ile Arg Ala Lys Gln Ile Leu Asp Thr Val Lys 340 345 350Asn Ile Leu Asp Ser Val Asn Val Ala Ala Ala Glu Lys Arg Val Tyr 355 360 365Ser Met Glu Glu Arg Glu Asp Gln Ile Asp Arg Leu Asp Phe Ile Arg 370 375 380Asn Gln Met Asn Leu Leu Thr Leu Asp Val Lys Lys Lys Ile Lys Glu385 390 395 400Val Thr Glu Glu Val Ala Asn Lys Val Ser Cys Ala Met Thr Asp Glu 405 410 415Ile Cys Arg Leu Ser Val Leu Val Asp Glu Phe Cys Ser Glu Phe His 420 425 430Pro Thr Pro Ser Val Leu Lys Val Tyr Lys Ser Glu Leu Asn Lys His 435 440 445Ile Glu Asp Gly Met Gly Arg Asn Leu Ala Asp Arg Cys Thr Asn Glu 450 455 460Val Asn Ala Ser Ile Leu Gln Ser Gln Gln Glu Ile Ile Glu Asn Leu465 470 475 480Lys Pro Leu Leu Pro Ala Gly Ile Gln Asn Lys Leu His Thr Leu Ile 485 490 495Pro Cys Lys Lys Phe Asp Leu Ser Tyr Asp Leu Asn Cys His Lys Leu 500 505 510Cys Ser Asp Phe Gln Glu Asp Ile Val Phe Arg Phe Ser Leu Gly Trp 515 520 525Ser Ser Leu Val His Arg Phe Leu Gly Ser Thr Asn Ala Gln Arg Val 530 535 540Leu Leu Gly Leu Ser Glu Pro Ile Phe Gln Val Pro Arg Ser Leu Ala545 550 555 560Ser Thr Pro Thr Ala Pro Ser Asn Pro Ala Ala Pro Asp Asn Ala Ala 565 570 575Gln Glu Glu Leu Met Ile Thr Leu Ile Thr Gly Leu Ala Ser Leu Thr 580 585 590Ser Arg Thr Ser Met Gly Ile Ile Val Val Gly Gly Val Ile Trp Lys 595 600 605Thr Val Gly Trp Lys Leu Ile Ser Val Thr Leu Ser Met Tyr Gly Ala 610 615 620Leu Tyr Leu Tyr Glu Arg Leu Thr Trp Thr Thr Arg Ala Lys Glu Arg625 630 635 640Ala Phe Lys Gln Gln Phe Val Asn Tyr Ala Thr Glu Lys Leu Gln Met 645 650 655Ile Val Ser Phe Thr Ser Ala Asn Cys Ser His Gln Val Gln Gln Glu 660 665 670Met Ala Thr Thr Phe Ala Arg Leu Cys Gln Gln Val Asp Val Thr Gln 675 680 685Lys His Leu Glu Glu Glu Ile Ala Arg Leu Ser Lys Glu Ile Asp Gln 690 695 700Leu Glu Lys Ile Gln Asn Asn Ser Lys Leu Leu Arg Asn Lys Ala Ile705 710 715 720Gln Leu Glu Ser Glu Leu Glu Asn Phe Ser Lys Gln Phe Leu His Pro 725 730 735Ser Ser Gly Glu Ser 7402757PRTMus sp. 2Met Ser Leu Leu Phe Ser Arg Cys Asn Ser Ile Val Thr Val Lys Lys1 5 10 15Asp Lys Arg His Met Ala Glu Val Asn Ala Ser Pro Leu Lys His Phe 20 25 30Val Thr Ala Lys Lys Lys Ile Asn Gly Ile Phe Glu Gln Leu Gly Ala 35 40 45Tyr Ile Gln Glu Ser Ala Ser Phe Leu Glu Asp Thr His Arg Asn Thr 50 55 60Glu Leu Asp Pro Val Thr Thr Glu Glu Gln Val Leu Asp Val Lys Gly65 70 75 80Tyr Leu Ser Lys Val Arg Gly Ile Ser Glu Val Leu Ala Arg Arg His 85 90 95Met Lys Val Ala Phe Phe Gly Arg Thr Ser Asn Gly Lys Ser Thr Val 100 105 110Ile Asn Ala Met Leu Trp Asp Lys Val Leu Leu Ser Gly Ile Gly His 115 120 125Thr Thr Asn Cys Phe Leu Arg Val Gly Gly Thr Asp Gly His Glu Ala 130 135 140Phe Leu Leu Thr Glu Gly Ser Glu Glu Lys Lys Ser Val Lys Thr Val145 150 155 160Asn Gln Leu Ala His Ala Leu His Gln Asp Glu Gln Leu His Ala Gly 165 170 175Ser Met Val Ser Val Met Trp Pro Asn Ser Lys Cys Pro Leu Leu Lys 180 185 190Asp Asp Leu Val Leu Met Asp Ser Pro Gly Ile Asp Val Thr Thr Glu 195 200 205Leu Asp Ser Trp Ile Asp Lys Phe Cys Leu Asp Ala Asp Val Phe Val 210 215 220Leu Val Ala Asn Ser Glu Ser Thr Leu Met Gln Thr Glu Lys Gln Phe225 230 235 240Phe His Lys Val Ser Glu Arg Leu Ser Arg Pro Asn Ile Phe Ile Leu 245 250 255Asn Asn Arg Trp Asp Ala Ser Ala Ser Glu Pro Glu Tyr Met Glu Glu 260 265 270Val Arg Arg Gln His Met Glu Arg Cys Thr Ser Phe Leu Val Asp Glu 275 280 285Leu Gly Val Val Asp Arg Ala Gln Ala Gly Asp Arg Ile Phe Phe Val 290 295 300Ser Ala Lys Glu Val Leu Ser Ala Arg Val Gln Lys Ala Gln Gly Met305 310 315 320Pro Glu Gly Gly Gly Ala Leu Ala Glu Gly Phe Gln Val Arg Met Phe 325 330 335Glu Phe Gln Asn Phe Glu Arg Gln Phe Glu Glu Cys Ile Ser Gln Ser 340 345 350Ala Val Lys Thr Lys Phe Glu Gln His Thr Val Arg Ala Lys Gln Ile 355 360 365Ala Glu Ala Val Arg Leu Ile Met Asp Ser Leu His Ile Ala Ala Gln 370 375 380Glu Gln Arg Val Tyr Cys Leu Glu Met Arg Glu Glu Arg Gln Asp Arg385 390 395 400Leu Arg Phe Ile Asp Lys Gln Leu Glu Leu Leu Ala Gln Asp Tyr Lys 405 410 415Leu Arg Ile Lys Gln Ile Thr Glu Glu Val Glu Arg Gln Val Ser Thr 420 425 430Ala Met Ala Glu Glu Ile Arg Arg Leu Ser Val Leu Val Asp Glu Tyr 435 440 445Gln Met Asp Phe His Pro Ser Pro Val Val Leu Lys Val Tyr Lys Asn 450 455 460Glu Leu His Arg His Ile Glu Glu Gly Leu Gly Arg Asn Leu Ser Asp465 470 475 480Arg Cys Ser Thr Ala Ile Ala Ser Ser Leu Gln Thr Met Gln Gln Asp 485 490 495Met Ile Asp Gly Leu Lys Pro Leu Leu Pro Val Ser Met Arg Asn Gln 500 505 510Ile Asp Met Leu Val Pro Arg Gln Cys Phe Ser Leu Ser Tyr Asp Leu 515 520 525Asn Cys Asp Lys Leu Cys Ala Asp Phe Gln Glu Asp Ile Glu Phe His 530 535 540Phe Ser Leu Gly Trp Thr Met Leu Val Asn Arg Phe Leu Gly Pro Lys545 550 555 560Asn Ser Arg Arg Ala Leu Leu Gly Tyr Ser Asp Gln Val Gln Arg Pro 565 570 575Leu Pro Leu Thr Pro Ala Asn Pro Ser Met Pro Pro Leu Pro Gln Ser 580 585 590Ser Leu Thr Gln Glu Glu Leu Met Val Ser Met Val Thr Gly Leu Ala 595 600 605Ser Leu Thr Ser Arg Thr Ser Met Gly Ile Leu Val Val Gly Gly Val 610 615 620Val Trp Lys Ala Val Gly Trp Arg Leu Ile Ala Leu Ser Phe Gly Leu625 630 635 640Tyr Gly Leu Leu Tyr Val Tyr Glu Arg Leu Thr Trp Thr Thr Lys Ala 645 650 655Lys Glu Arg Ala Phe Lys Arg Gln Phe Val Glu Tyr Ala Ser Glu Lys 660 665 670Leu Gln Leu Ile Ile Ser Tyr Thr Gly Ser Asn Cys Ser His Gln Val 675 680 685Gln Gln Glu Leu Ser Gly Thr Phe Ala His Leu Cys Gln Gln Val Asp 690 695 700Ile Thr Arg Asp Asn Leu Glu Gln Glu Ile Ala Ala Met Asn Lys Lys705 710 715 720Val Glu Ala Leu Asp Ser Leu Gln Ser Arg Ala Lys Leu Leu Arg Asn 725 730 735Lys Ala Gly Trp Leu Asp Ser Glu Leu Asn Met Phe Thr His Gln Tyr 740 745 750Leu Gln Pro Ser Arg 7553741PRTHomo sapiens 3Met Ala Glu Pro Val Ser Pro Leu Lys His Phe Val Leu Ala Lys Lys1 5 10 15Gly Ile Thr Ala Ile Phe Asp Gln Leu Leu Glu Phe Val Thr Glu Gly 20 25 30Ser His Phe Val Glu Ala Thr Tyr Lys Asn Pro Glu Leu Asp Arg Ile 35 40 45Ala Thr Glu Asp Asp Leu Val Glu Met Gln Gly Tyr Lys Asp Lys Leu 50 55 60Ser Ile Ile Gly Glu Val Leu Ser Arg Arg His Met Lys Val Ala Phe65 70 75 80Phe Gly Arg Thr Ser Ser Gly Lys Ser Ser Val Ile Asn Ala Met Leu 85 90 95Trp Asp Lys Val Leu Pro Ser Gly Ile Gly His Ile Thr Asn Cys Phe 100 105 110Leu Ser Val Glu Gly Thr Asp Gly Asp Lys Ala Tyr Leu Met Thr Glu 115 120 125Gly Ser Asp Glu Lys Lys Ser Val Lys Thr Val Asn Gln Leu Ala His 130 135 140Ala Leu His Met Asp Lys Asp Leu Lys Ala Gly Cys Leu Val Arg Val145 150 155 160Phe Trp Pro Lys Ala Lys Cys Ala Leu Leu Arg Asp Asp Leu Val Leu 165 170 175Val Asp Ser Pro Gly Thr Asp Val Thr Thr Glu Leu Asp Ser Trp Ile 180 185 190Asp Lys Phe Cys Leu Asp Ala Asp Val Phe Val Leu Val Ala Asn Ser 195 200 205Glu Ser Thr Leu Met Asn Thr Glu Lys His Phe Phe His Lys Val Asn 210 215 220Glu Trp Leu Ser Lys Pro Asn Ile Phe Ile Leu Asn Asn Arg Trp Asp225 230 235 240Ala Ser Ala Ser Glu Pro Glu Tyr Met Glu Asp Val Arg Arg Gln His 245 250 255Met Glu Arg Cys Leu His Phe Leu Val Glu Glu Leu Lys Val Ala Asn 260 265 270Ala Leu Glu Ala Gln Asn Arg Ile Phe Phe Val Ser Ala Lys Glu Val 275 280 285Leu Ser Ala Arg Lys Gln Lys Ala Gln Gly Met Pro Glu Ser Gly Val 290 295 300Ala Leu Ala Glu Gly Phe His Ala Arg Leu Gln Glu Phe Gln Asn Phe305 310 315 320Glu Gln Ile Phe Glu Glu Cys Ile Ser Gln Ser Ala Val Lys Thr Lys 325 330 335Phe Glu Gln His Thr Ile Arg Ala Lys Gln Ile Leu Ala Thr Val Lys 340 345 350Asn Ile Met Asp Ser Val Asn Leu Ala Ala Glu Asp Lys Arg His Tyr 355 360 365Ser Val Glu Glu Arg Glu Asp Gln Ile Asp Arg Leu Asp Phe Ile Arg 370 375 380Asn Gln Met Asn Leu Leu Thr Leu Asp Val Lys Lys Lys Ile Lys Glu385 390 395 400Val Thr Glu Glu Val Ala Asn Lys Val Ser Cys Ala Met Thr Asp Glu 405 410 415Ile Cys Arg Leu Ser Val Leu Val Asp Glu Phe Cys Ser Glu Phe His 420 425 430Pro Asn Pro Asp Val Leu Lys Ile Tyr Lys Ser Glu Leu Asn Lys His 435 440 445Ile Glu Asp Gly Met Gly Arg Asn Leu Ala Asp Arg Cys Thr Asp Glu 450 455 460Val Asn Ala Leu Val Leu Gln Thr Gln Gln Glu Ile Ile Glu Asn Leu465 470 475 480Lys Pro Leu Leu Pro Ala Gly Ile Gln Asp Lys Leu His Thr Leu Ile 485 490 495Pro Cys Lys Lys Phe Asp Leu Ser Tyr Asn Leu Asn Tyr His Lys Leu 500 505 510Cys Ser Asp Phe Gln Glu Asp Ile Val Phe Arg Phe Ser Leu Gly Trp 515 520 525Ser Ser Leu Val His Arg Phe Leu Gly Pro Arg Asn Ala Gln Arg Val 530 535 540Leu Leu Gly Leu Ser Glu Pro Ile Phe Gln Leu Pro Arg Ser Leu Ala545 550 555 560Ser Thr Pro Thr Ala Pro Thr Thr Pro Ala Thr Pro Asp Asn Ala Ser 565 570 575Gln Glu Glu Leu Met Ile Thr Leu Val Thr Gly Leu Ala Ser Val Thr 580 585 590Ser Arg Thr Ser Met Gly Ile Ile Ile Val Gly Gly Val Ile Trp Lys 595 600 605Thr Ile Gly Trp Lys Leu Leu Ser Val Ser Leu Thr Met Tyr Gly Ala 610 615 620Leu Tyr Leu Tyr Glu Arg Leu Ser Trp Thr Thr His Ala Lys Glu Arg625 630 635 640Ala Phe Lys Gln Gln Phe Val Asn Tyr Ala Thr Glu Lys Leu Arg Met 645 650 655Ile Val Ser Ser Thr Ser Ala Asn Cys Ser His Gln Val Lys Gln Gln 660 665 670Ile Ala Thr Thr Phe Ala Arg Leu Cys Gln Gln Val Asp Ile Thr Gln 675 680 685Lys Gln Leu Glu Glu Glu Ile Ala Arg Leu Pro Lys Glu Ile Asp Gln 690 695 700Leu Glu Lys Ile Gln Asn Asn Ser Lys Leu Leu Arg Asn Lys Ala Val705 710 715 720Gln Leu Glu Asn Glu Leu Glu Asn Phe Thr Lys Gln Phe Leu Pro Ser 725 730 735Ser Asn Glu Glu Ser 7404757PRTHomo sapiens 4Met Ser Leu Leu Phe Ser Arg Cys Asn Ser Ile Val Thr Val Lys Lys1 5 10 15Asn Lys Arg His Met Ala Glu Val Asn Ala Ser Pro Leu Lys His Phe 20 25 30Val Thr Ala Lys Lys Lys Ile Asn Gly Ile Phe Glu Gln Leu Gly Ala 35 40 45Tyr Ile Gln Glu Ser Ala Thr Phe Leu Glu Asp Thr Tyr Arg Asn Ala 50 55 60Glu Leu Asp Pro Val Thr Thr Glu Glu Gln Val Leu Asp Val Lys Gly65 70 75 80Tyr Leu Ser Lys Val Arg Gly Ile Ser Glu Val Leu Ala Arg Arg His 85 90 95Met Lys Val Ala Phe Phe Gly Arg Thr Ser Asn Gly Lys Ser Thr Val 100 105 110Ile Asn Ala Met Leu Trp Asp Lys Val Leu Pro Ser Gly Ile Gly His 115 120 125Thr Thr Asn Cys Phe Leu Arg Val Glu Gly Thr Asp Gly His Glu Ala 130 135 140Phe Leu Leu Thr Glu Gly Ser Glu Glu Lys Arg Ser Ala Lys Thr Val145 150 155 160Asn Gln Leu Ala His Ala Leu His Gln Asp Lys Gln Leu His Ala Gly 165 170 175Ser Leu Val Ser Val Met Trp Pro Asn Ser Lys Cys Pro Leu Leu Lys 180 185 190Asp Asp Leu Val Leu Met Asp Ser Pro Gly Ile Asp Val Thr Thr Glu 195 200 205Leu Asp Ser Trp Ile Asp Lys Phe Cys Leu Asp Ala Asp Val Phe Val 210 215 220Leu Val Ala Asn Ser Glu Ser Thr Leu Met Gln Thr
Glu Lys His Phe225 230 235 240Phe His Lys Val Ser Glu Arg Leu Ser Arg Pro Asn Ile Phe Ile Leu 245 250 255Asn Asn Arg Trp Asp Ala Ser Ala Ser Glu Pro Glu Tyr Met Glu Glu 260 265 270Val Arg Arg Gln His Met Glu Arg Cys Thr Ser Phe Leu Val Asp Glu 275 280 285Leu Gly Val Val Asp Arg Ser Gln Ala Gly Asp Arg Ile Phe Phe Val 290 295 300Ser Ala Lys Glu Val Leu Asn Ala Arg Ile Gln Lys Ala Gln Gly Met305 310 315 320Pro Glu Gly Gly Gly Ala Leu Ala Glu Gly Phe Gln Val Arg Met Phe 325 330 335Glu Phe Gln Asn Phe Glu Arg Arg Phe Glu Glu Cys Ile Ser Gln Ser 340 345 350Ala Val Lys Thr Lys Phe Glu Gln His Thr Val Arg Ala Lys Gln Ile 355 360 365Ala Glu Ala Val Arg Leu Ile Met Asp Ser Leu His Met Ala Ala Arg 370 375 380Glu Gln Gln Val Tyr Cys Glu Glu Met Arg Glu Glu Arg Gln Asp Arg385 390 395 400Leu Lys Phe Ile Asp Lys Gln Leu Glu Leu Leu Ala Gln Asp Tyr Lys 405 410 415Leu Arg Ile Lys Gln Ile Thr Glu Glu Val Glu Arg Gln Val Ser Thr 420 425 430Ala Met Ala Glu Glu Ile Arg Arg Leu Ser Val Leu Val Asp Asp Tyr 435 440 445Gln Met Asp Phe His Pro Ser Pro Val Val Leu Lys Val Tyr Lys Asn 450 455 460Glu Leu His Arg His Ile Glu Glu Gly Leu Gly Arg Asn Met Ser Asp465 470 475 480Arg Cys Ser Thr Ala Ile Thr Asn Ser Leu Gln Thr Met Gln Gln Asp 485 490 495Met Ile Asp Gly Leu Lys Pro Leu Leu Pro Val Ser Val Arg Ser Gln 500 505 510Ile Asp Met Leu Val Pro Arg Gln Cys Phe Ser Leu Asn Tyr Asp Leu 515 520 525Asn Cys Asp Lys Leu Cys Ala Asp Phe Gln Glu Asp Ile Glu Phe His 530 535 540Phe Ser Leu Gly Trp Thr Met Leu Val Asn Arg Phe Leu Gly Pro Lys545 550 555 560Asn Ser Arg Arg Ala Leu Met Gly Tyr Asn Asp Gln Val Gln Arg Pro 565 570 575Ile Pro Leu Thr Pro Ala Asn Pro Ser Met Pro Pro Leu Pro Gln Gly 580 585 590Ser Leu Thr Gln Glu Glu Phe Met Val Ser Met Val Thr Gly Leu Ala 595 600 605Ser Leu Thr Ser Arg Thr Ser Met Gly Ile Leu Val Val Gly Gly Val 610 615 620Val Trp Lys Ala Val Gly Trp Arg Leu Ile Ala Leu Ser Phe Gly Leu625 630 635 640Tyr Gly Leu Leu Tyr Val Tyr Glu Arg Leu Thr Trp Thr Thr Lys Ala 645 650 655Lys Glu Arg Ala Phe Lys Arg Gln Phe Val Glu His Ala Ser Glu Lys 660 665 670Leu Gln Leu Val Ile Ser Tyr Thr Gly Ser Asn Cys Ser His Gln Val 675 680 685Gln Gln Glu Leu Ser Gly Thr Phe Ala His Leu Cys Gln Gln Val Asp 690 695 700Val Thr Arg Glu Asn Leu Glu Gln Glu Ile Ala Ala Met Asn Lys Lys705 710 715 720Ile Glu Val Leu Asp Ser Leu Gln Ser Lys Ala Lys Leu Leu Arg Asn 725 730 735Lys Ala Gly Trp Leu Asp Ser Glu Leu Asn Met Phe Thr His Gln Tyr 740 745 750Leu Gln Pro Ser Arg 755521DNAMus sp.Mfn1 shRNA target sequence 5gcgtttaagc agcagtttgt a 21658DNAArtificial SequenceDescription of Artificial Sequence Synthetic mouse Mfn1 shRNA sequence 6ccgggcgttt aagcagcagt ttgtactcga gtacaaactg ctgcttaaac gctttttg 58721DNAMus sp.Mfn2 shRNA target sequence 7tggatggact atgctagtga a 21858DNAArtificial SequenceDescription of Artificial Sequence Synthetic mouse Mfn2 shRNA sequence 8ccggtggatg gactatgcta gtgaactcga gttcactagc atagtccatc catttttg 58921DNAHomo sapiensMfn1 shRNA target sequence 9atccggaact tgatcgaata g 211062DNAArtificial SequenceDescription of Artificial Sequence Synthetic human Mfn1 shRNA sequence 10ccggatccgg aacttgatcg aatagctcga gctattcgat caagttccgg atttttttga 60at 621121DNAHomo sapiensMfn21 shRNA target sequence 11gctcagtgct tcatcccatt t 211258DNAArtificial SequenceDescription of Artificial Sequence Synthetic human Mfn2 shRNA sequence 12ccgggctcag tgcttcatcc catttctcga gaaatgggat gaagcactga gctttttg 581319RNAArtificial SequenceDescription of Artificial Sequence Synthetic Mfn1 siRNA sequence 13cgaugaagua aacgccuua 191419RNAArtificial SequenceDescription of Artificial Sequence Synthetic human Mfn1 siRNA sequence 14caugauagga ggaaacgaa 191519RNAArtificial SequenceDescription of Artificial Sequence Synthetic human Mfn1 siRNA sequence 15cagaauauau ggaagacgu 191619RNAArtificial SequenceDescription of Artificial Sequence Synthetic human Mfn1 siRNA sequence 16ggaaguucuu agugcuaga 191719RNAArtificial SequenceDescription of Artificial Sequence Synthetic human Mfn1 siRNA sequence 17gacuauaagc ugcgaauua 191819RNAArtificial SequenceDescription of Artificial Sequence Synthetic human Mfn1 siRNA sequence 18caugaggccu uucuccuua 191919RNAArtificial SequenceDescription of Artificial Sequence Synthetic human Mfn1 siRNA sequence 19gcaacucuau cgucacagu 192019RNAArtificial SequenceDescription of Artificial Sequence Synthetic human Mfn1 siRNA sequence 20gguggacgau uaccagaug 192120DNAArtificial SequenceDescription of Artificial Sequence Synthetic Mfn1 forward primer 21tgaaagctgg ctgtcttgtg 202220DNAArtificial SequenceDescription of Artificial Sequence Synthetic Mfn1 reverse primer 22agagccgctc attcacctta 202320DNAArtificial SequenceDescription of Artificial Sequence Synthetic Mfn2 forward primer 23cctcacagag ggctcagaag 202420DNAArtificial SequenceDescription of Artificial Sequence Synthetic Mfn2 reverse primer 24gtccagctcc gtggtaacat 202520DNAArtificial SequenceDescription of Artificial Sequence Synthetic p53 forward primer 25agagaccgcc gtacagaaga 202620DNAArtificial SequenceDescription of Artificial Sequence Synthetic p53 reverse primer 26ctgtagcatg ggcatccttt 202720DNAArtificial SequenceDescription of Artificial Sequence Synthetic p21 forward primer 27cggtggaact ttgacttcgt 202820DNAArtificial SequenceDescription of Artificial Sequence Synthetic p21 reverse primer 28cagggcagag gaagtactgg 202918DNAArtificial SequenceDescription of Artificial Sequence Synthetic Glut1 forward primer 29gatcctgggc cgcttcat 183018DNAArtificial SequenceDescription of Artificial Sequence Synthetic Glut1 reverse primer 30acatgggcac gaagcctg 183120DNAArtificial SequenceDescription of Artificial Sequence Synthetic Hif1alpha forward primer 31tcaagtcagc aacgtggaag 203220DNAArtificial SequenceDescription of Artificial Sequence Synthetic Hif1alpha reverse primer 32tatcgaggct gtgtcgactg 203320DNAArtificial SequenceDescription of Artificial Sequence Synthetic Hk2 forward primer 33gggacgacgg tacactcaat 203420DNAArtificial SequenceDescription of Artificial Sequence Synthetic Hk2 reverse primer 34gccagtggta aggagctctg 203520DNAArtificial SequenceDescription of Artificial Sequence Synthetic Pfk forward primer 35atggcaaagc tatcggtgtc 203620DNAArtificial SequenceDescription of Artificial Sequence Synthetic Pfk reverse primer 36acacagtccc atttggcttc 203720DNAArtificial SequenceDescription of Artificial Sequence Synthetic Pam1 forward primer 37gcctgatcac cccttctaca 203820DNAArtificial SequenceDescription of Artificial Sequence Synthetic Pam1 reverse primer 38tcaagaccct tttcccctct 203921DNAArtificial SequenceDescription of Artificial Sequence Synthetic Eno1 forward primer 39agtacgggaa ggacgccacc a 214020DNAArtificial SequenceDescription of Artificial Sequence Synthetic Eno1 reverse primer 40gcggccacat ccatgccgat 204120DNAArtificial SequenceDescription of Artificial Sequence Synthetic Pkm forward primer 41ctgcaggtga aggagaaagg 204220DNAArtificial SequenceDescription of Artificial Sequence Synthetic Pkm reverse primer 42agatgcaaac accatgtcca 204320DNAArtificial SequenceDescription of Artificial Sequence Synthetic Ldha forward primer 43tggcagcctc ttccttaaaa 204420DNAArtificial SequenceDescription of Artificial Sequence Synthetic Ldha reverse primer 44cagcttgcag tgtggactgt 204520DNAArtificial SequenceDescription of Artificial Sequence Synthetic beta-actin forward primer 45agccatgtac gtagccatcc 204620DNAArtificial SequenceDescription of Artificial Sequence Synthetic beta-actin reverse primer 46ctctcagctg tggtggtgaa 204717DNAArtificial SequenceDescription of Artificial Sequence Synthetic ND132 forward primer 47cccattcgcg ttatctt 174820DNAArtificial SequenceDescription of Artificial Sequence Synthetic ND132 reverse primer 48aagttgatcg taacggaagc 204920DNAArtificial SequenceDescription of Artificial Sequence Synthetic Atp6ap1 forward primer 49gccatggaac gacttgaaat 205020DNAArtificial SequenceDescription of Artificial Sequence Synthetic Atp6ap1 reverse primer 50cggagagaag aaaccagcac 205120DNAArtificial SequenceDescription of Artificial Sequence Synthetic Sdhb forward primer 51actggtggaa cggagacaag 205220DNAArtificial SequenceDescription of Artificial Sequence Synthetic Sdhb reverse primer 52ttaagccaat gctcgcttct 205320DNAArtificial SequenceDescription of Artificial Sequence Synthetic Uqcrc1 forward primer 53cctacagcac tcgagagcac 205420DNAArtificial SequenceDescription of Artificial Sequence Synthetic Uqcrc1 reverse primer 54aggtgtgccc tggaatgctg 20
* * * * *
D00001
D00002
D00003
D00004
D00005
D00006
D00007
D00008
D00009
D00010
D00011
D00012
D00013
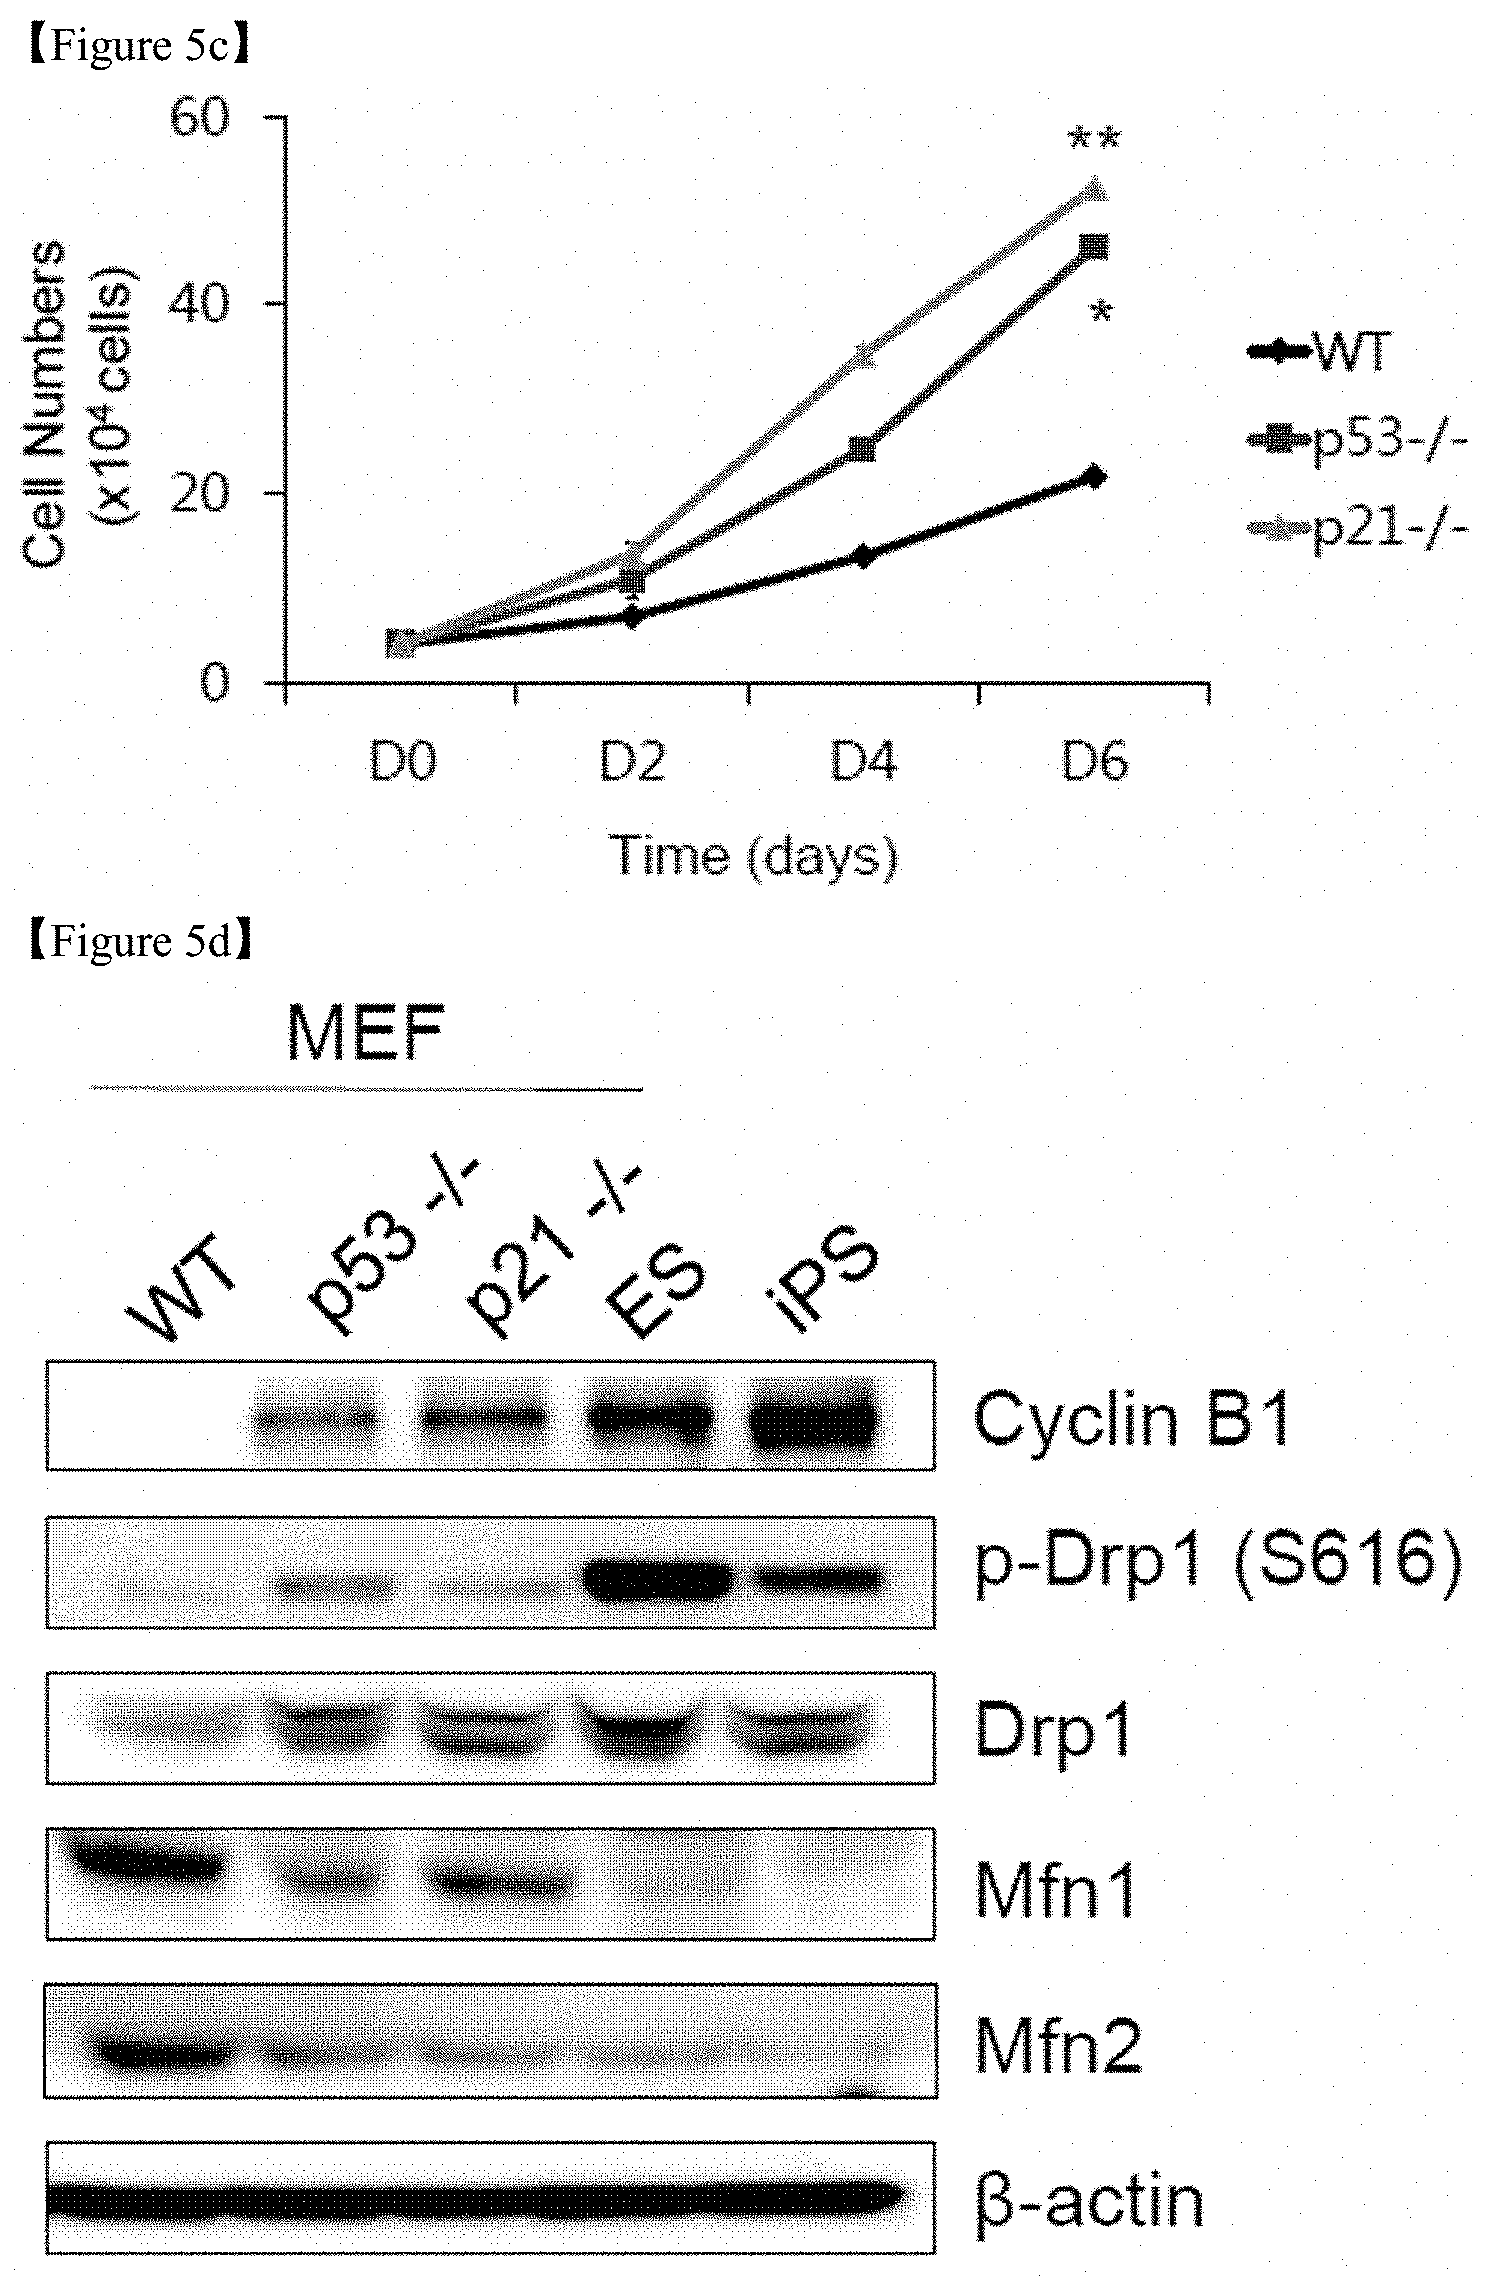
D00014
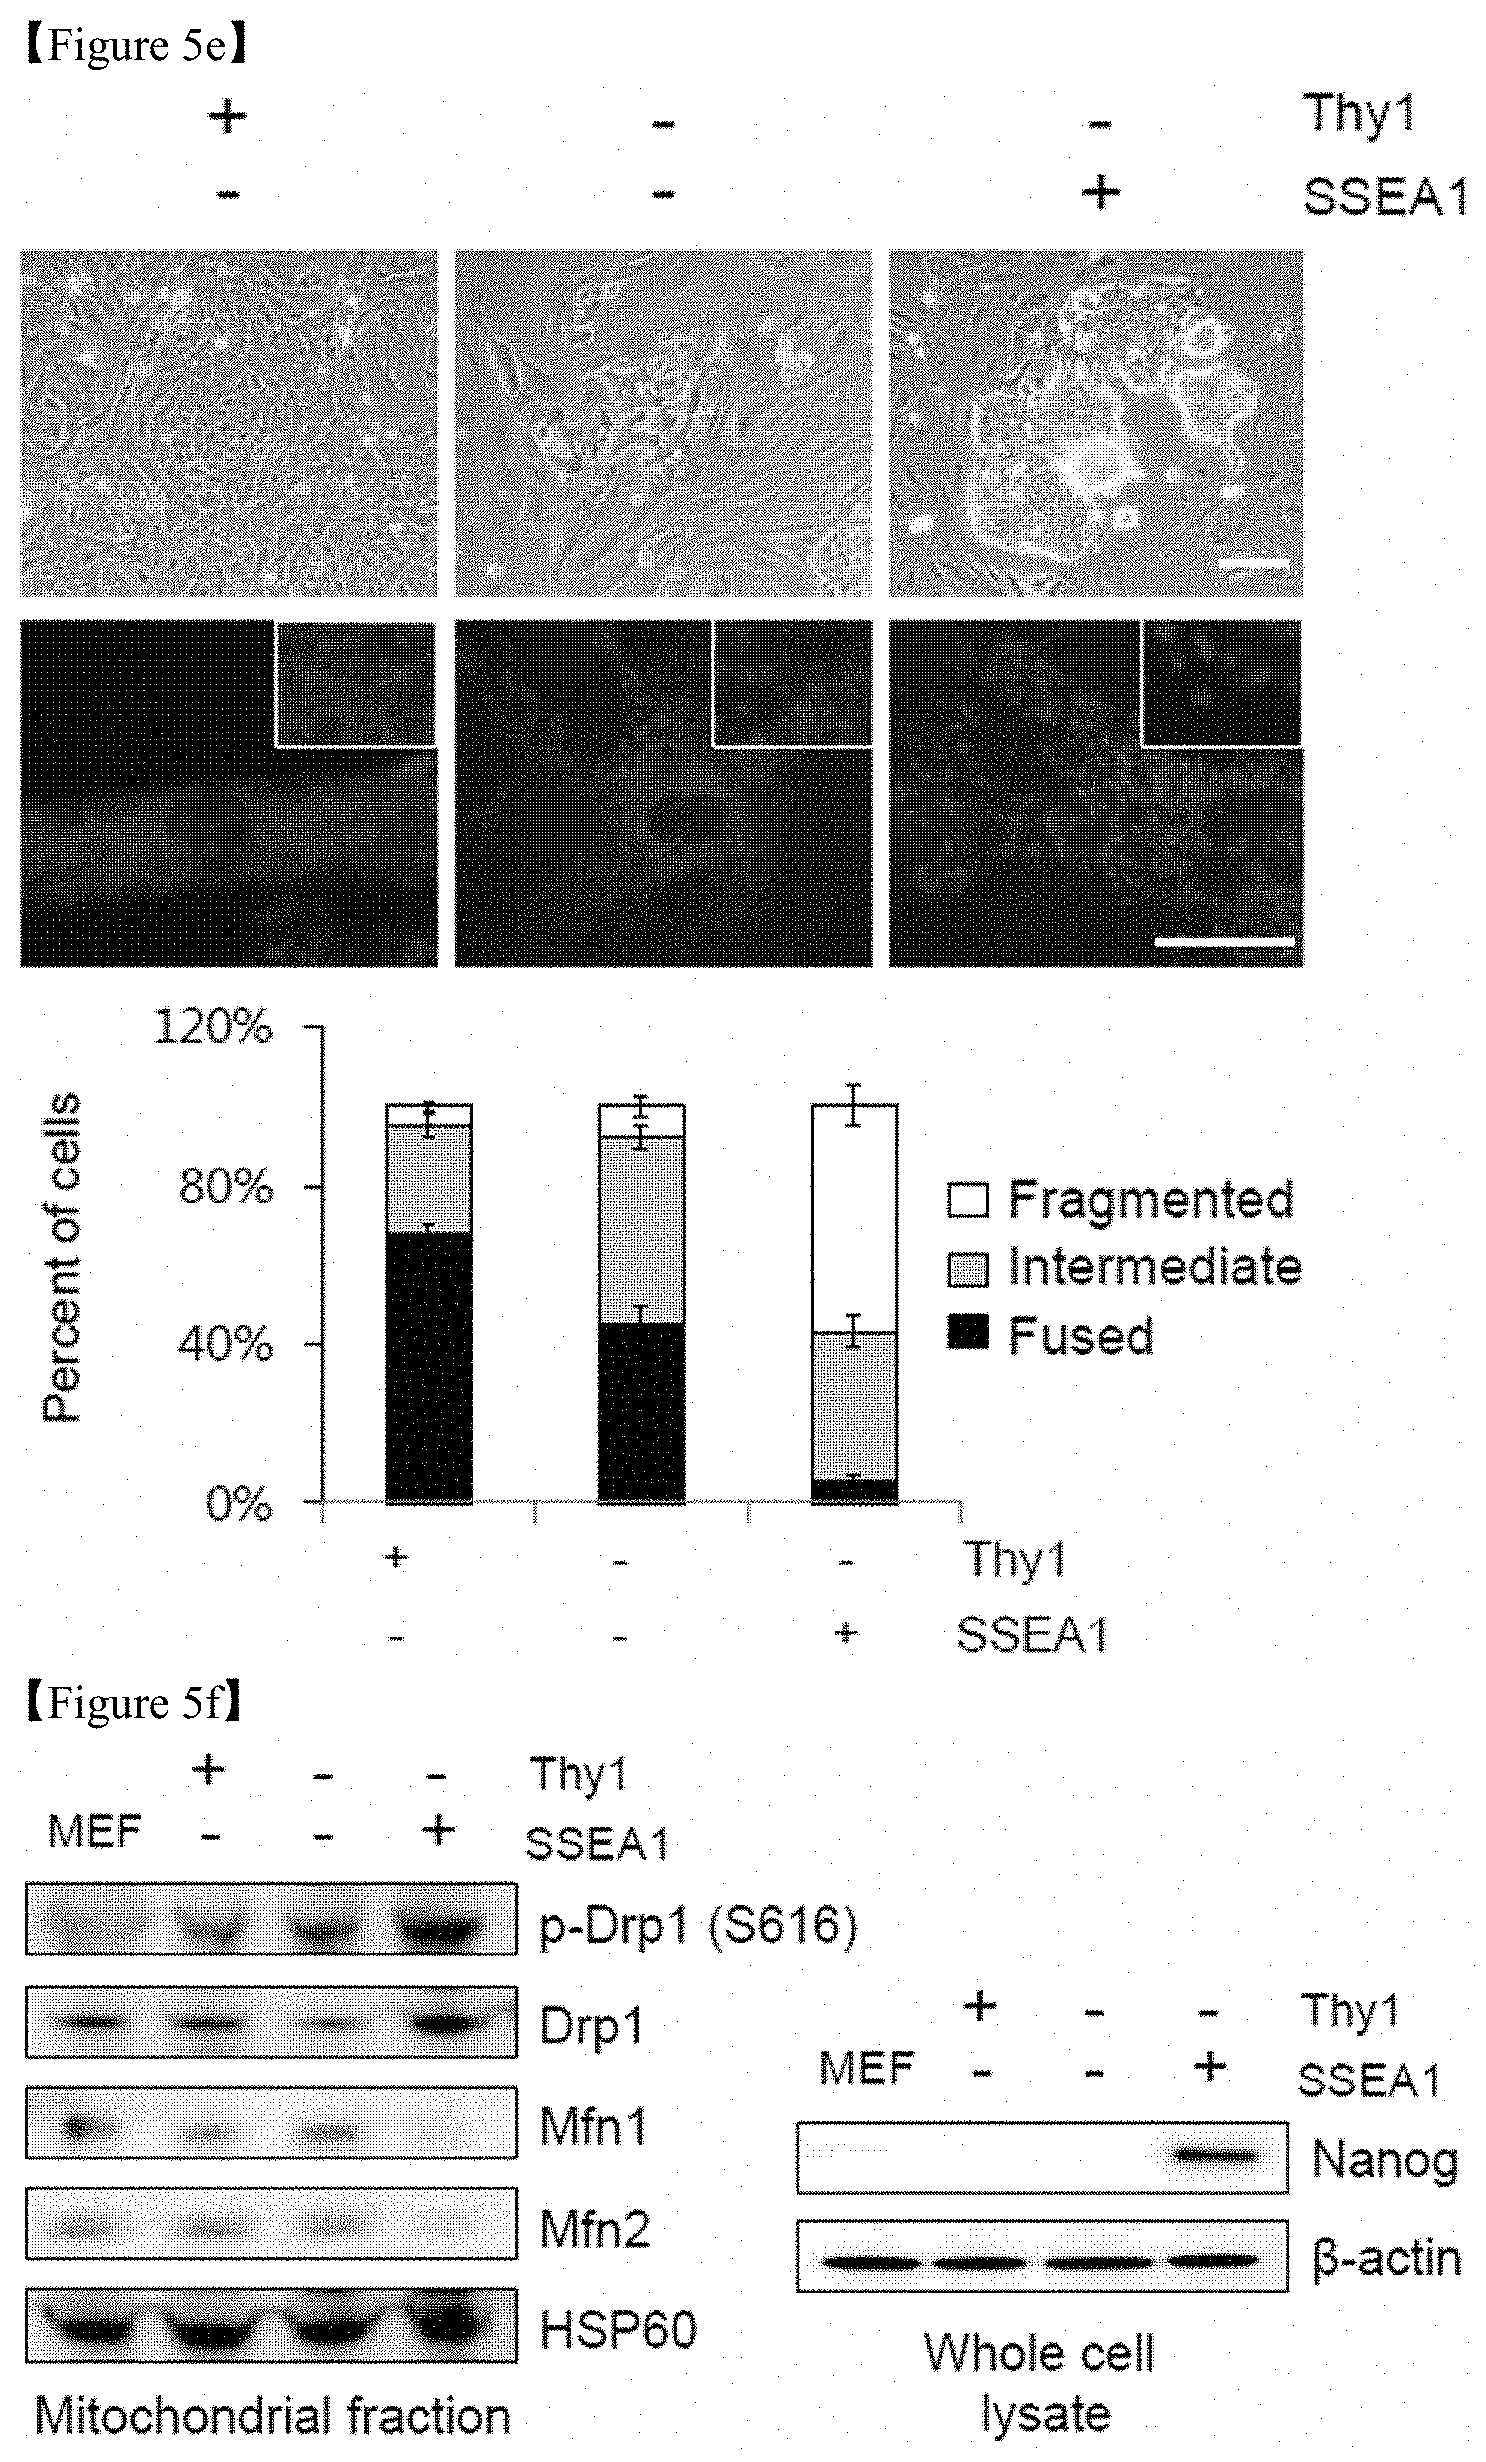
D00015
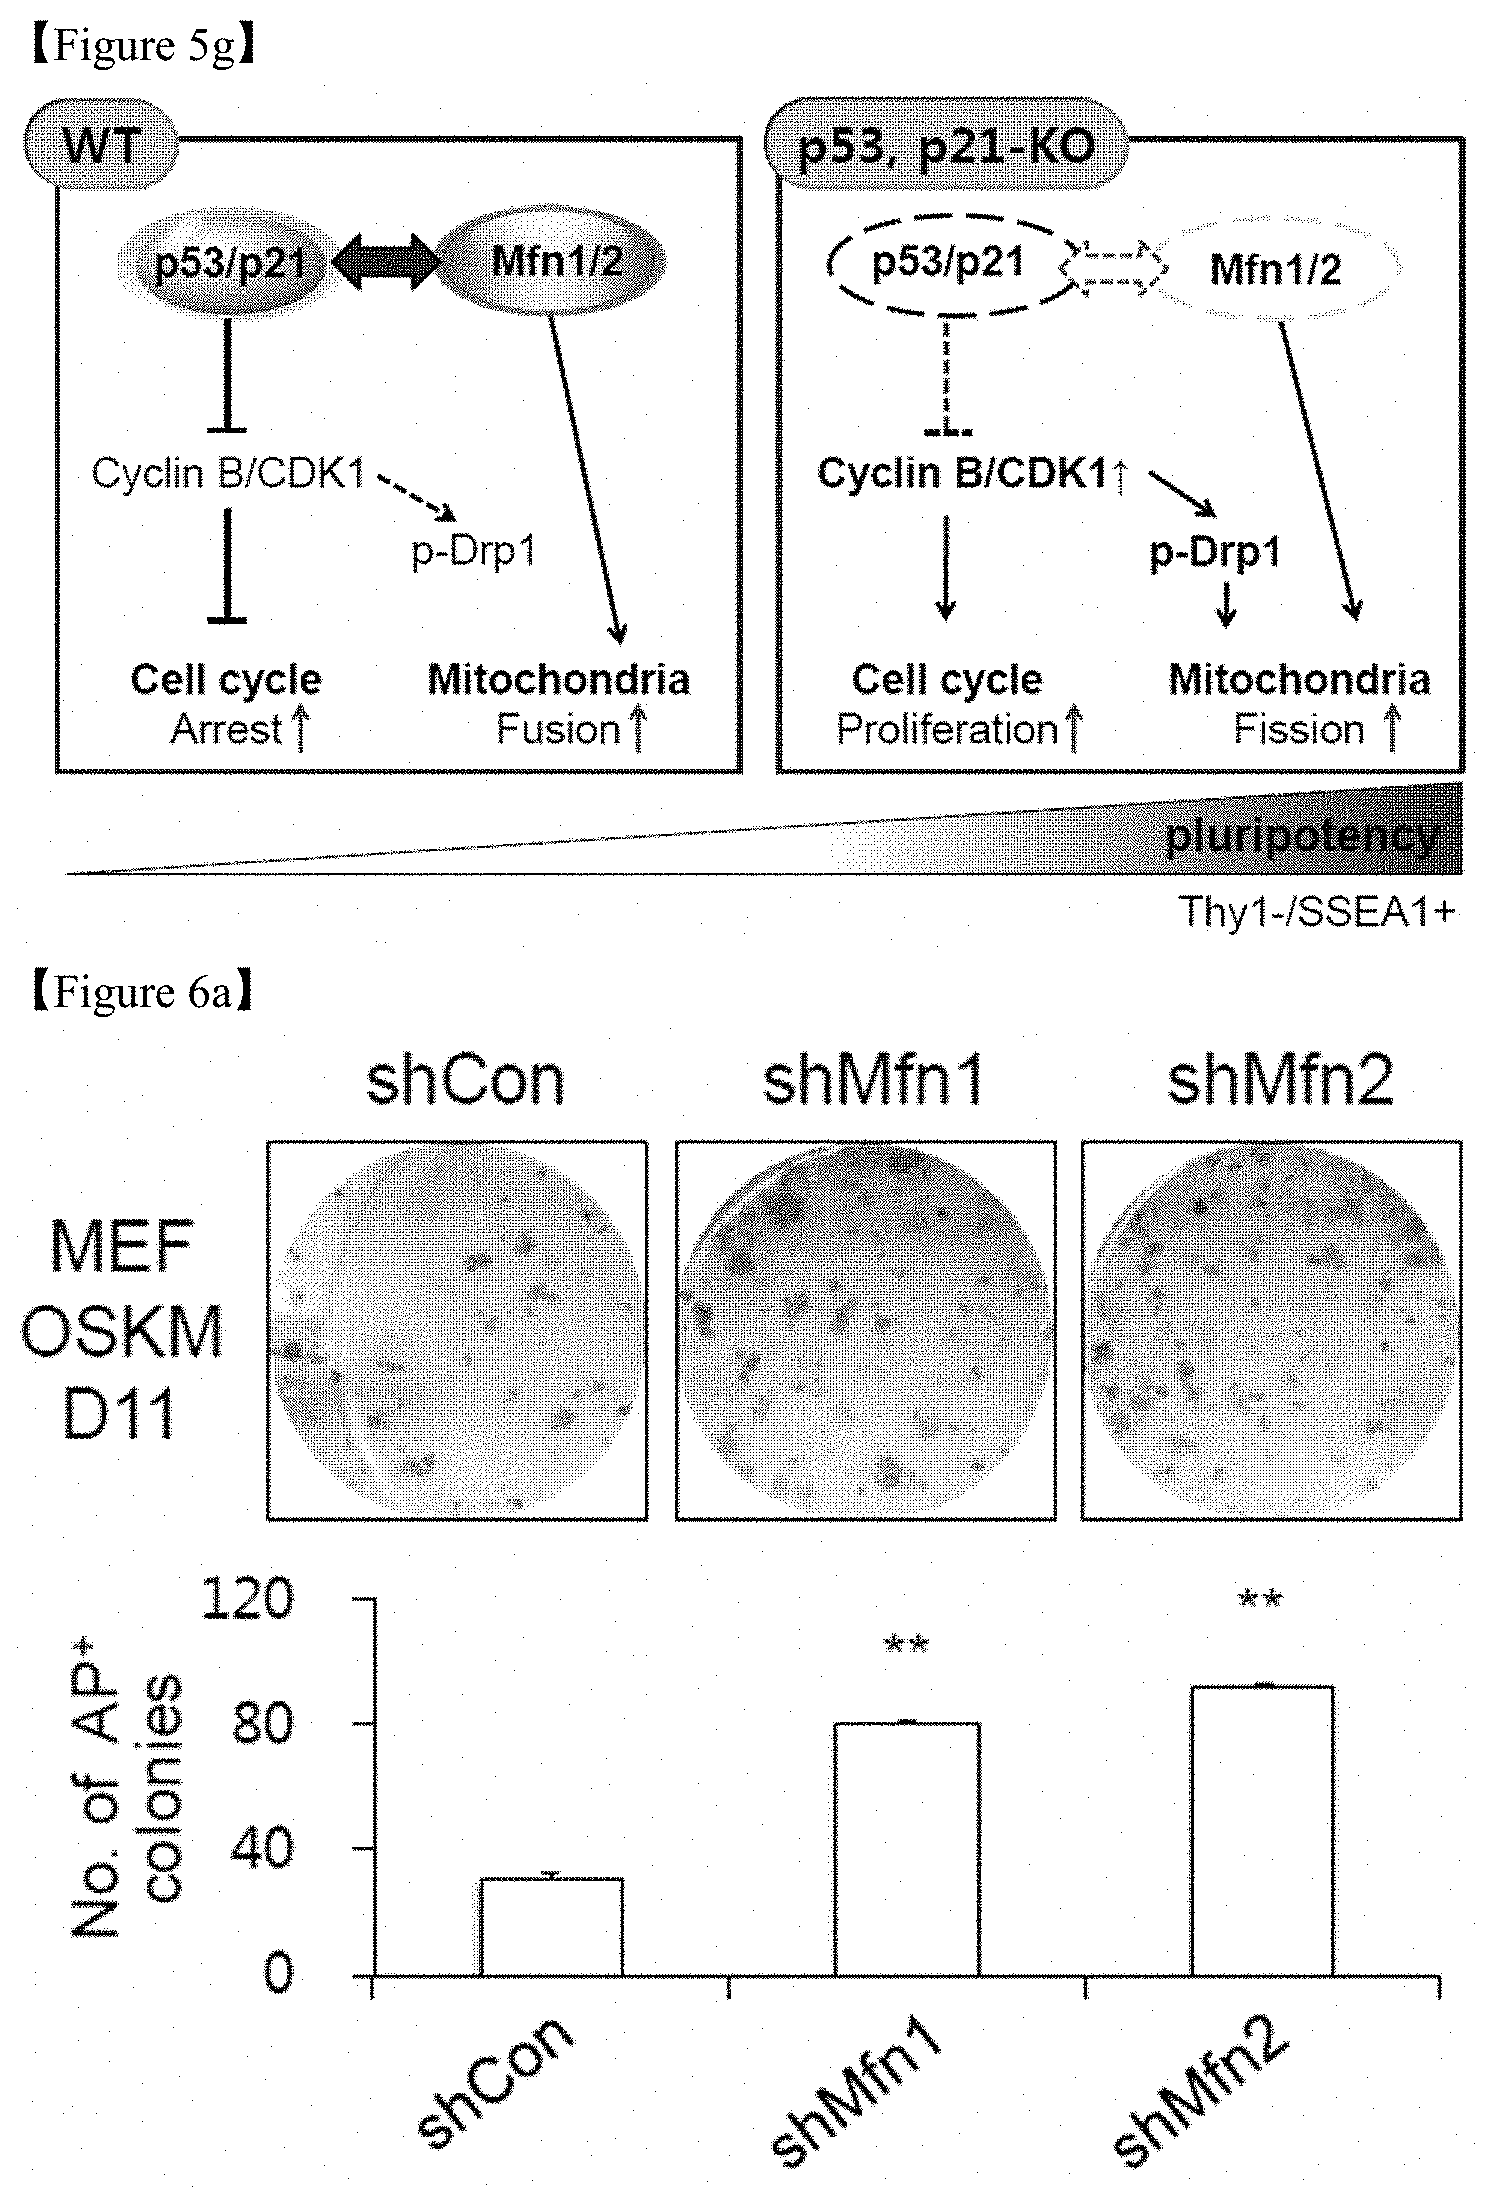
D00016
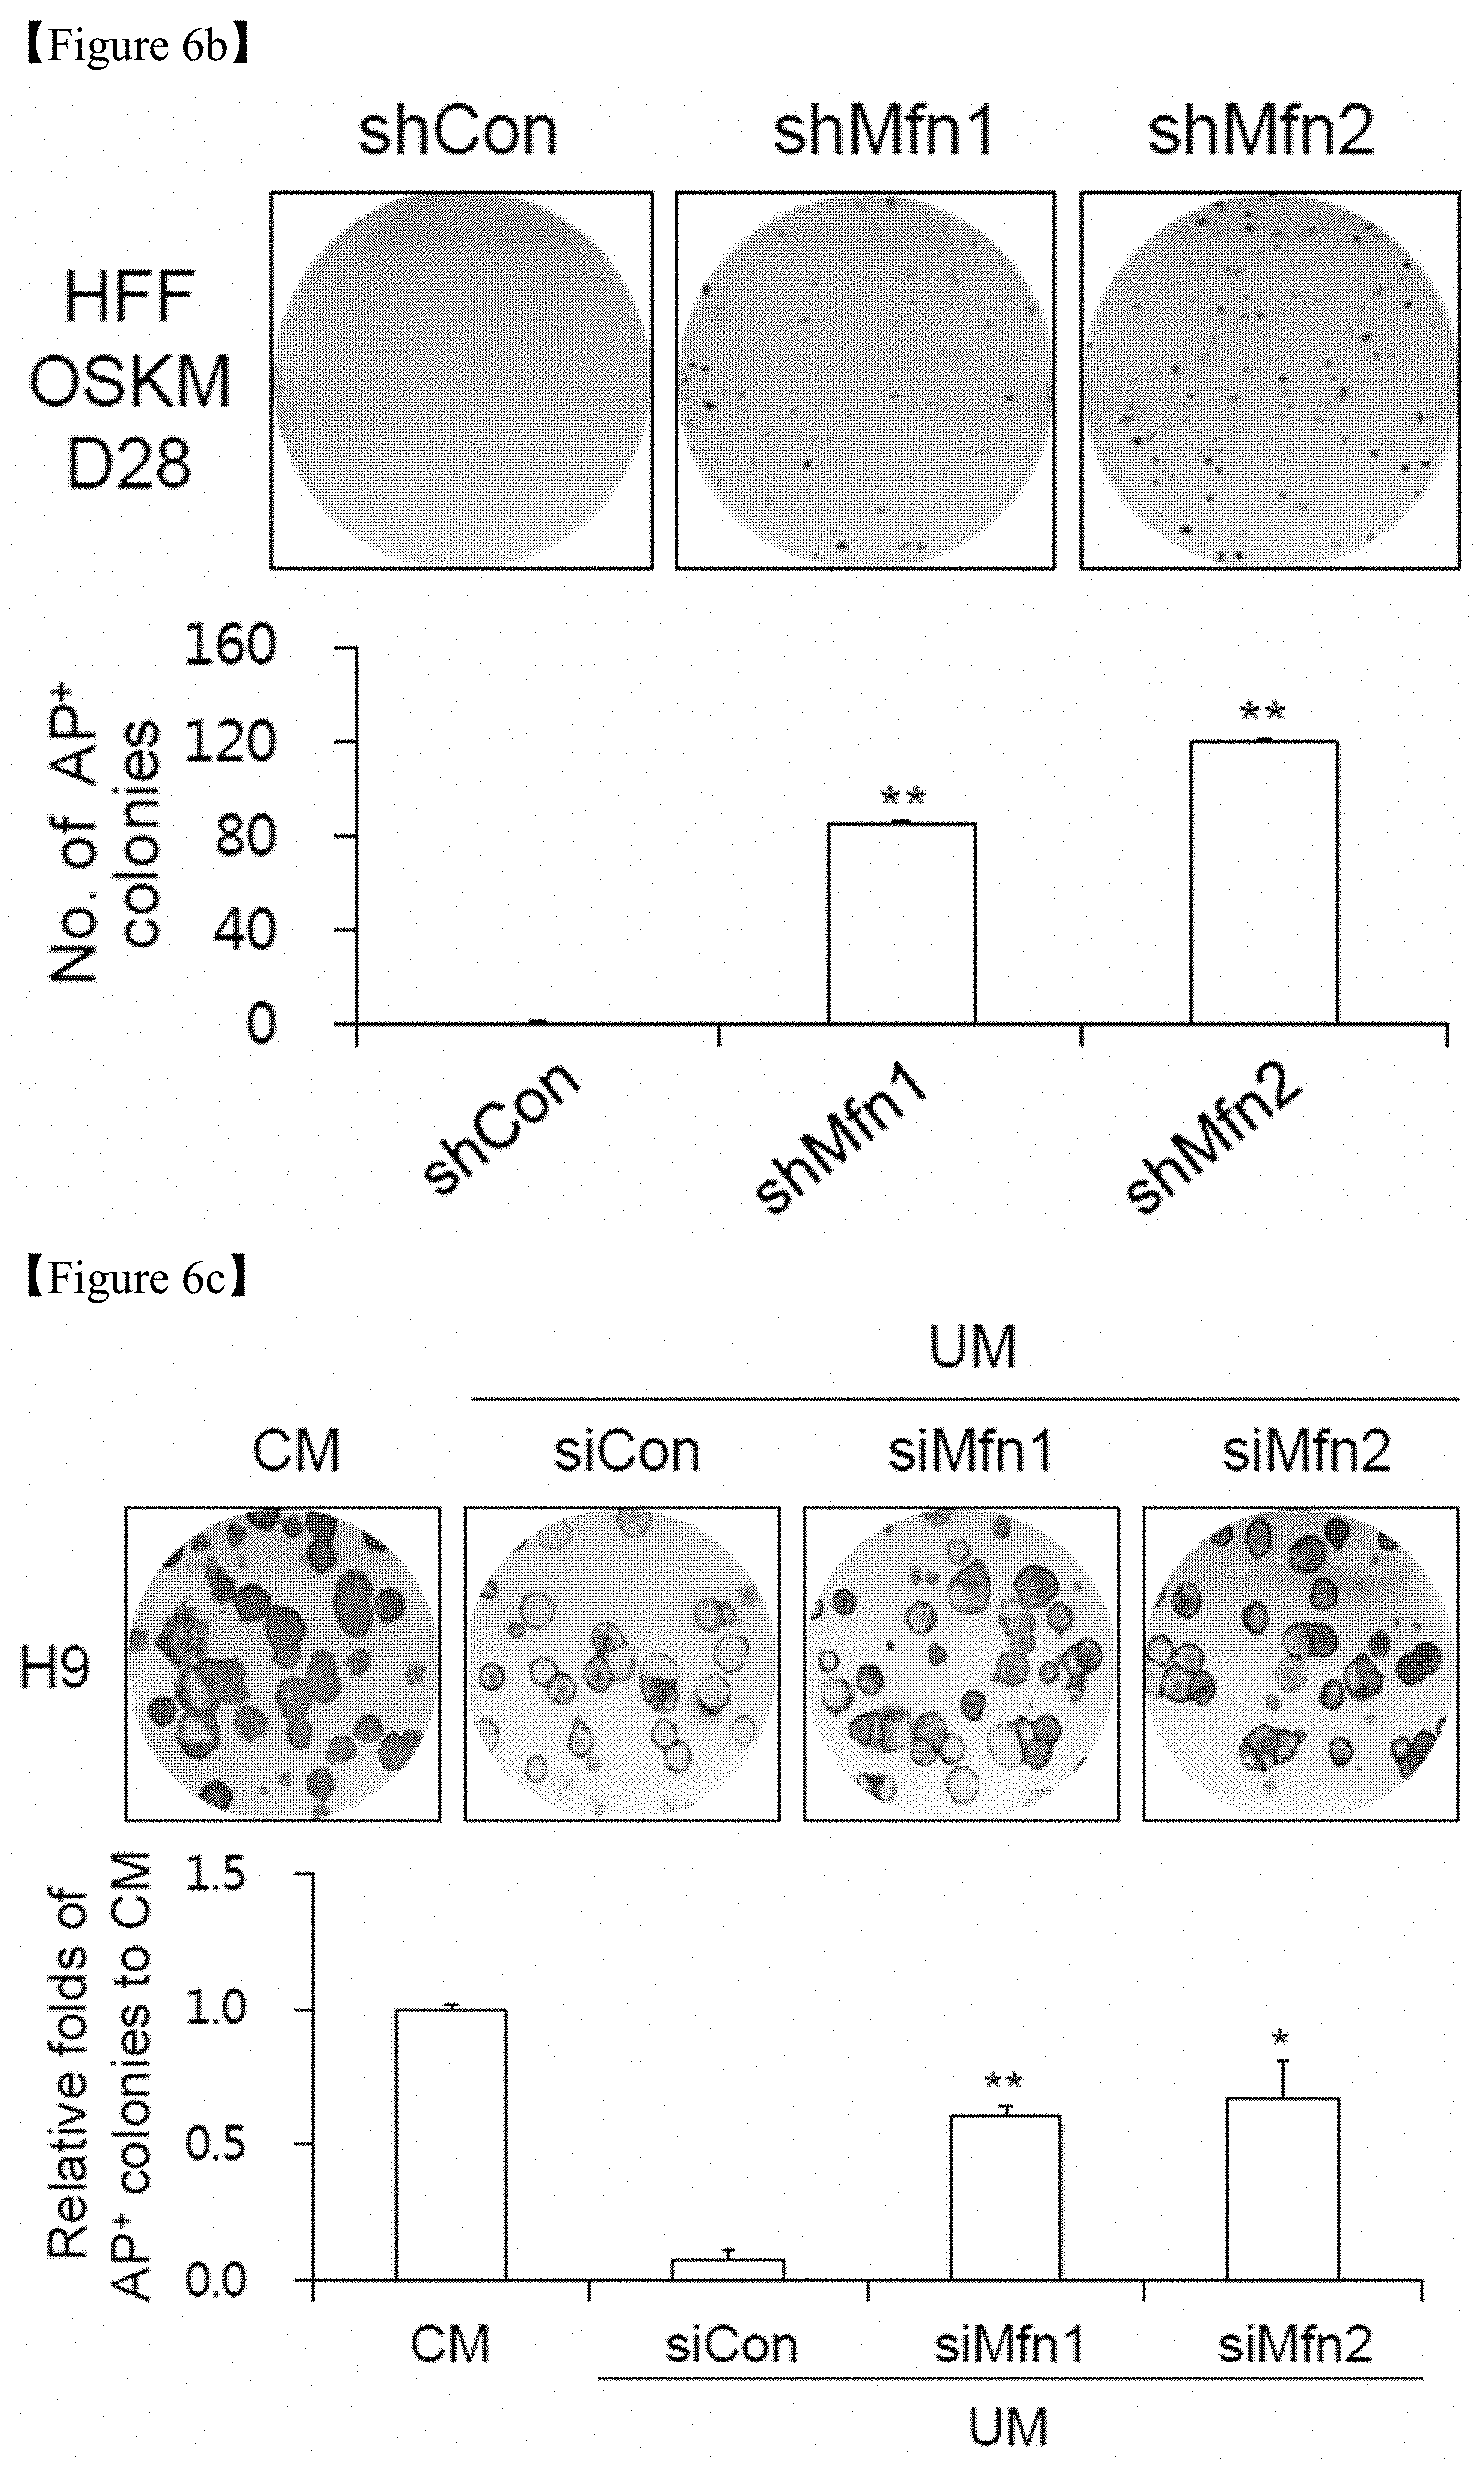
D00017
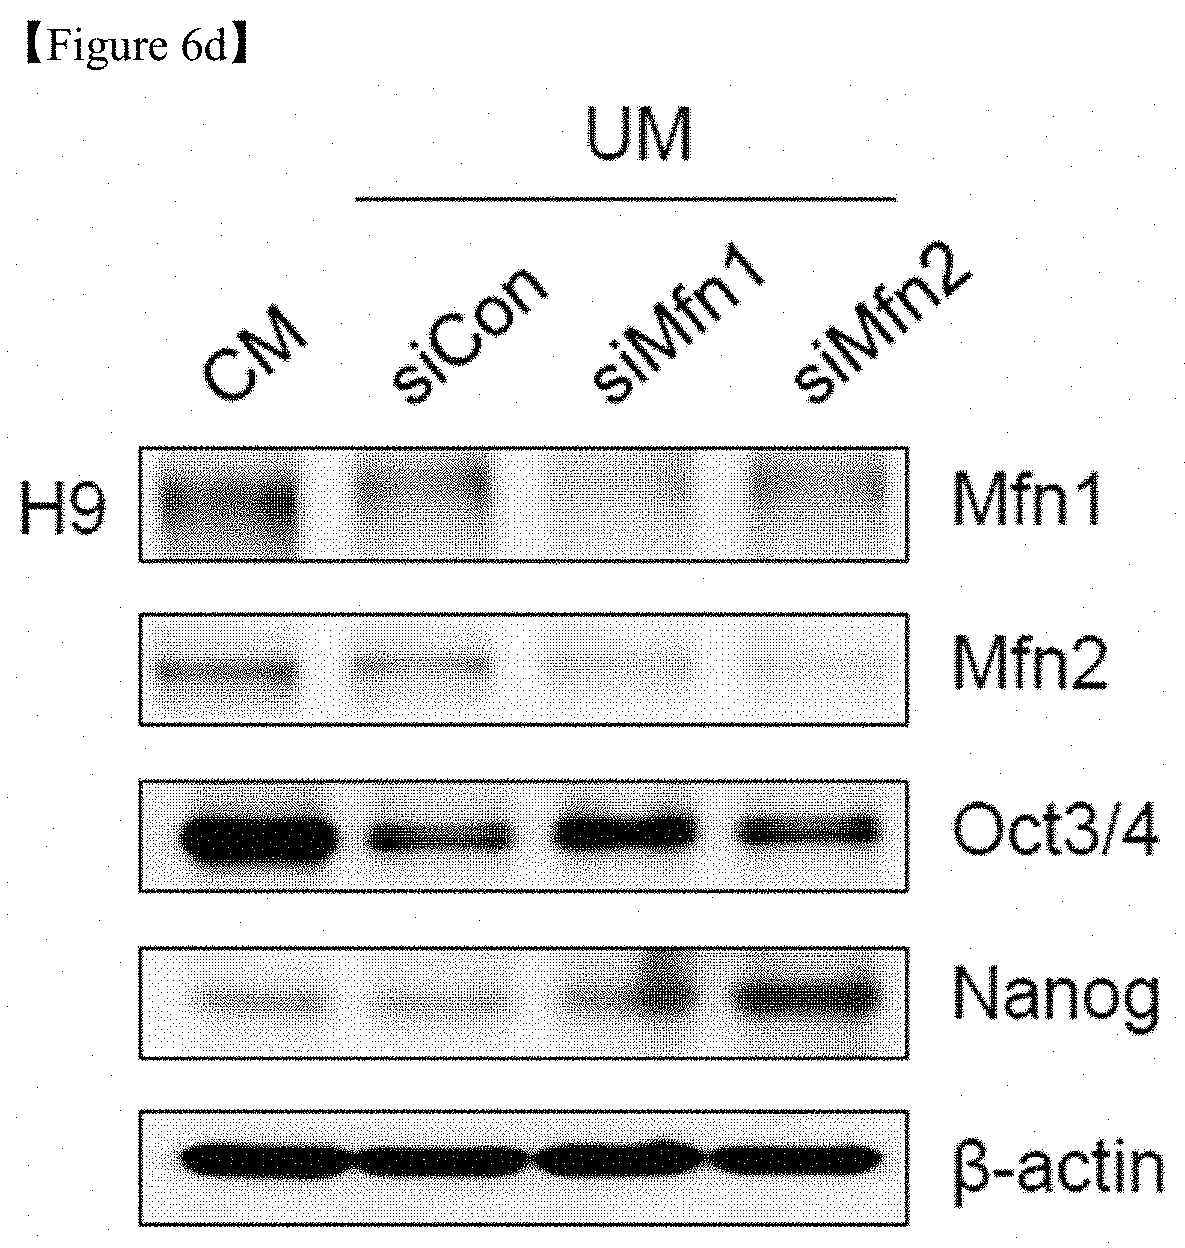
D00018
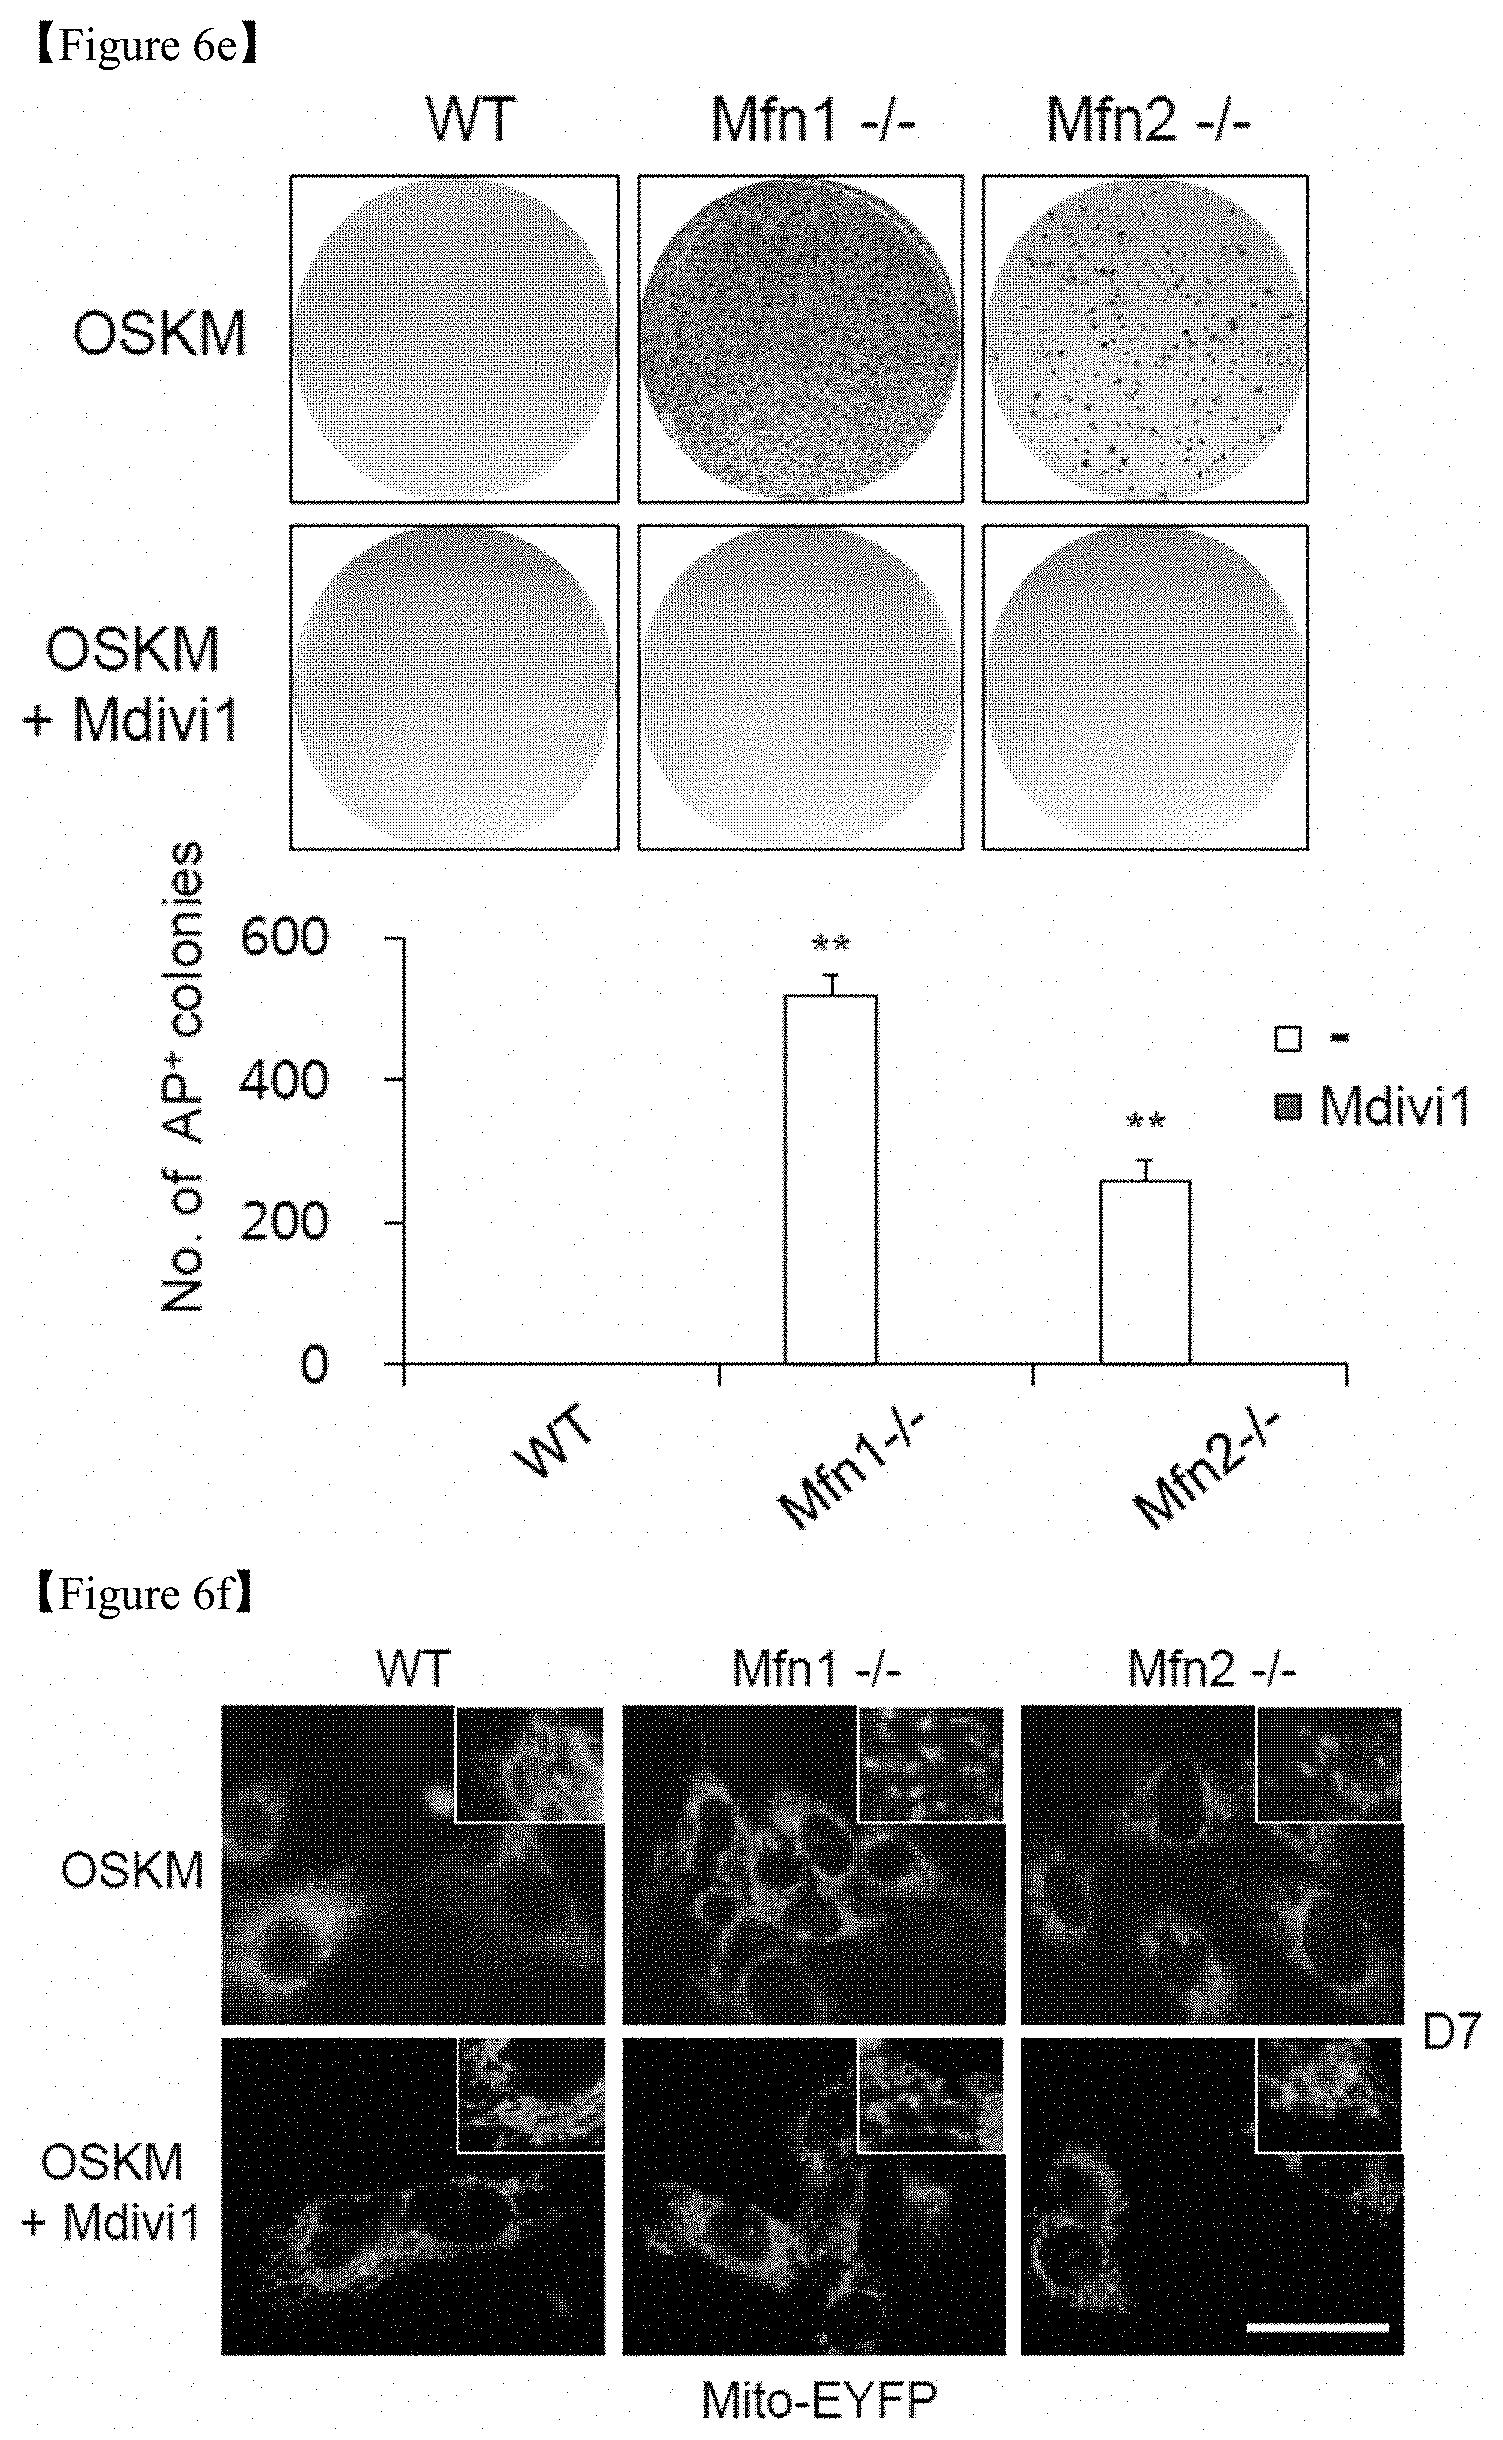
D00019

D00020
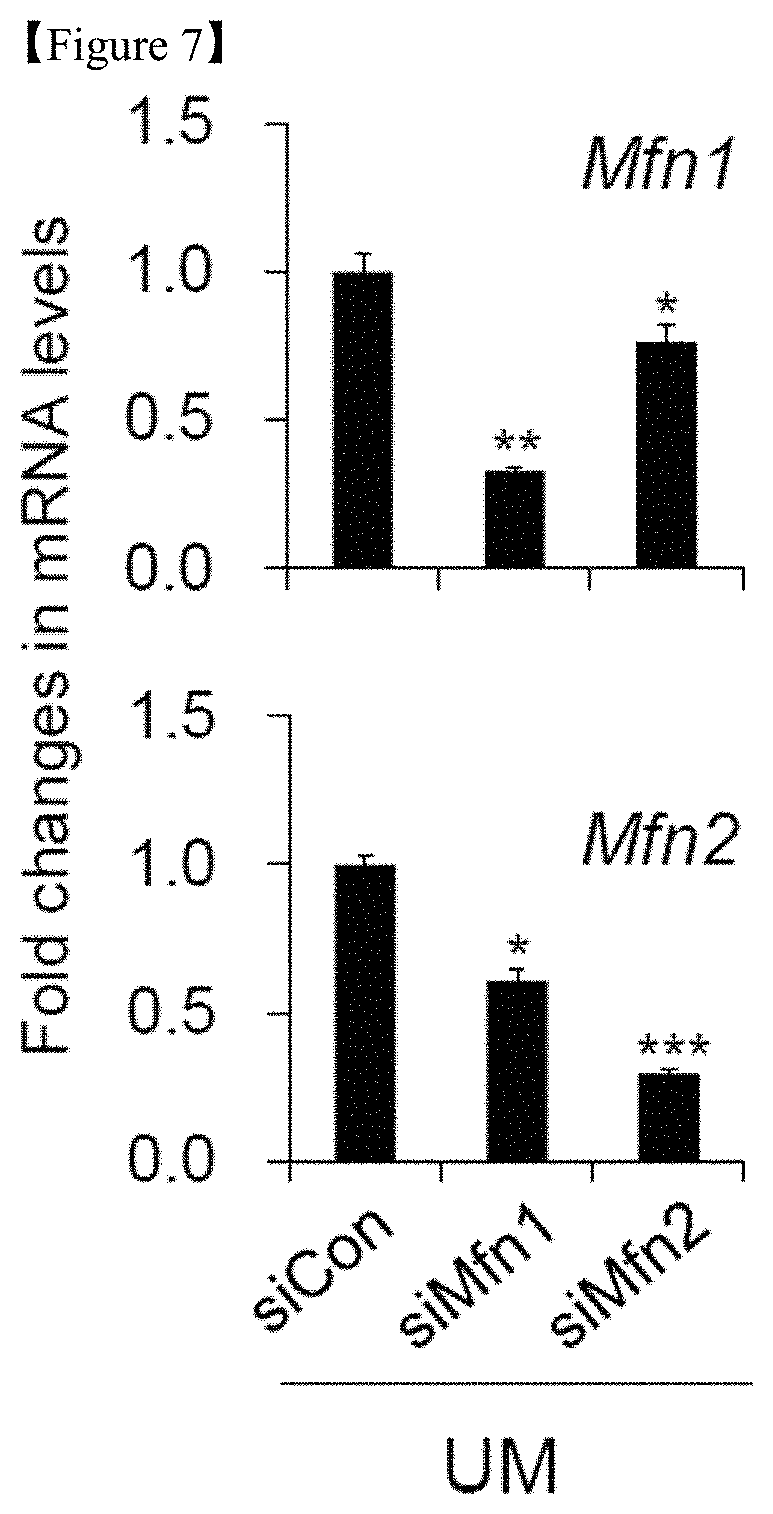
D00021
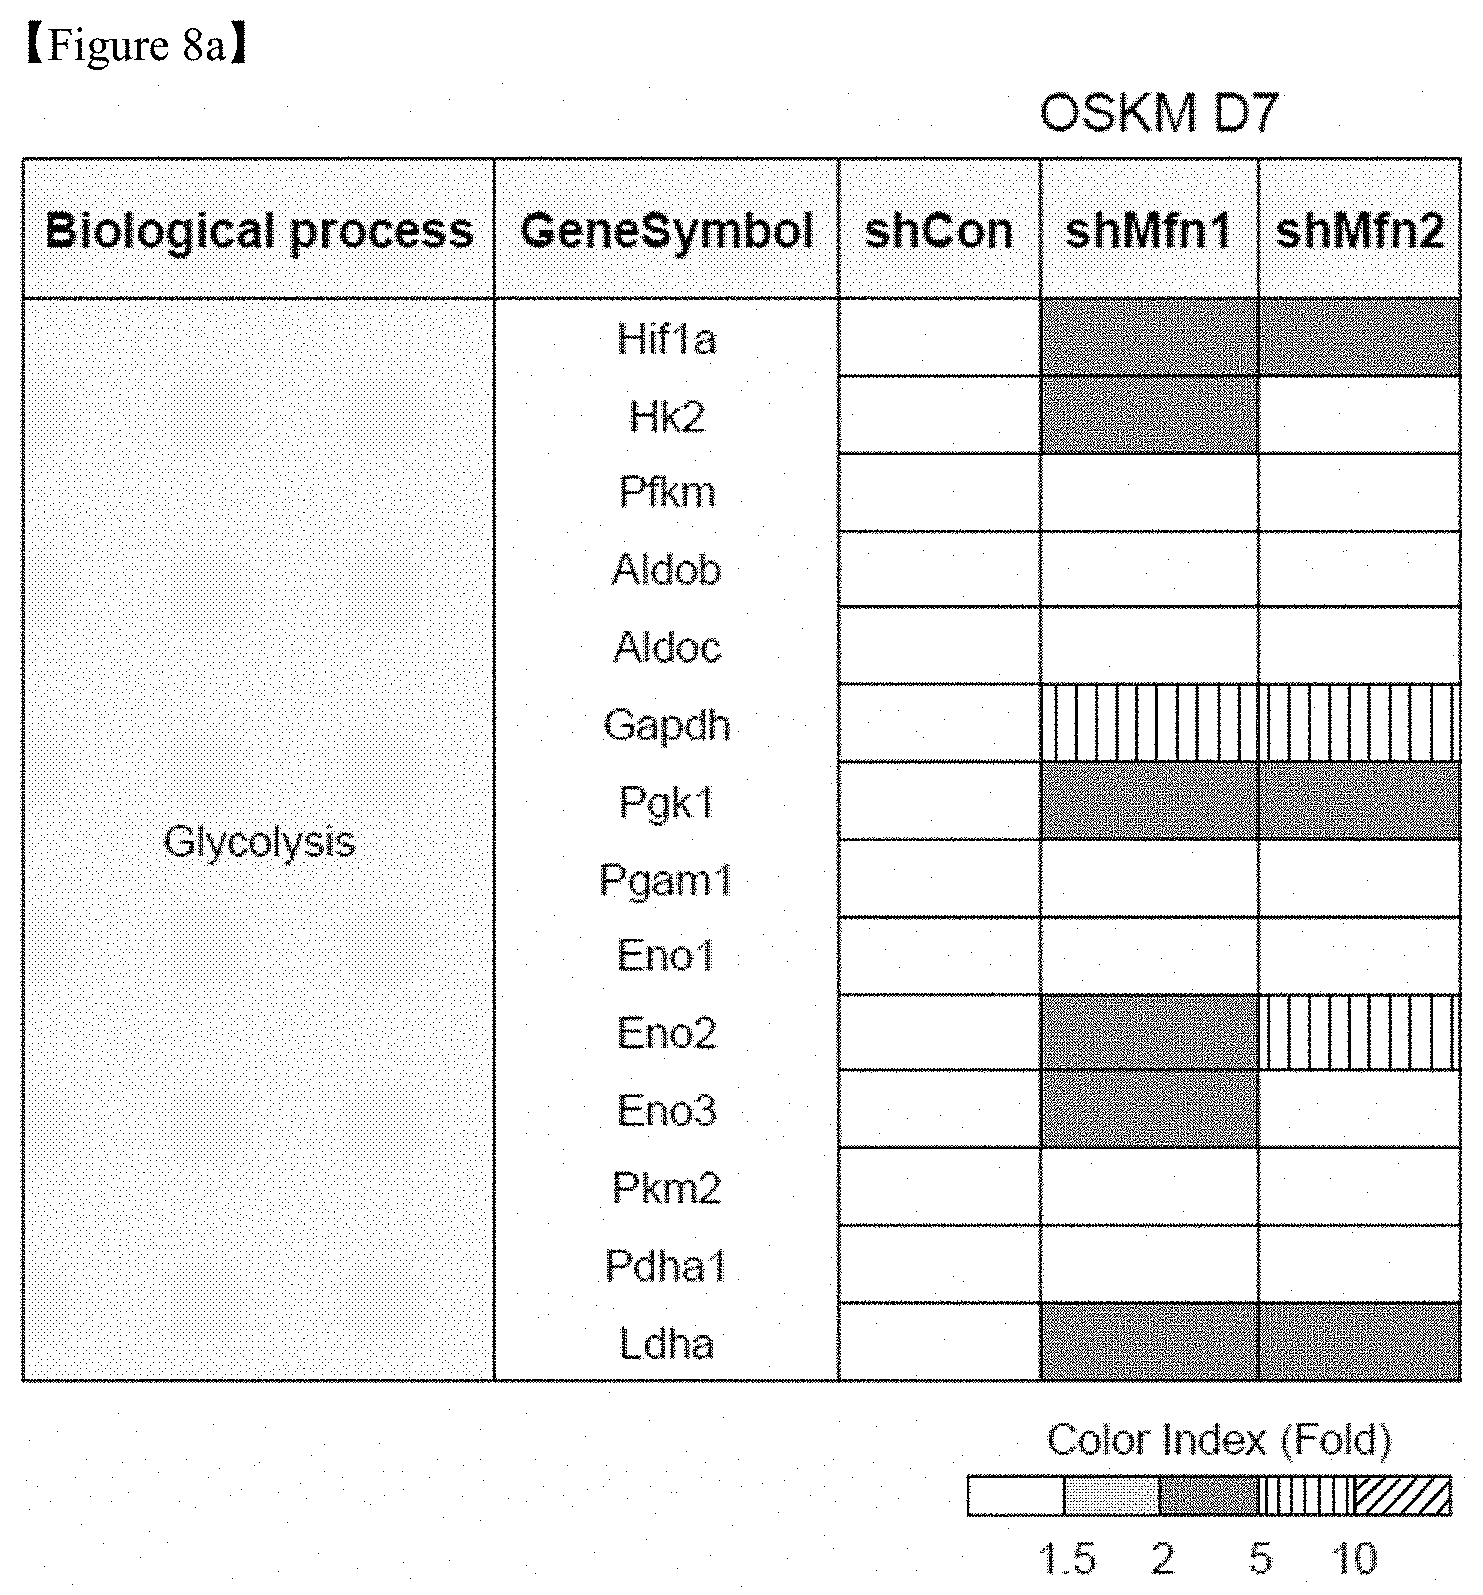
D00022

D00023
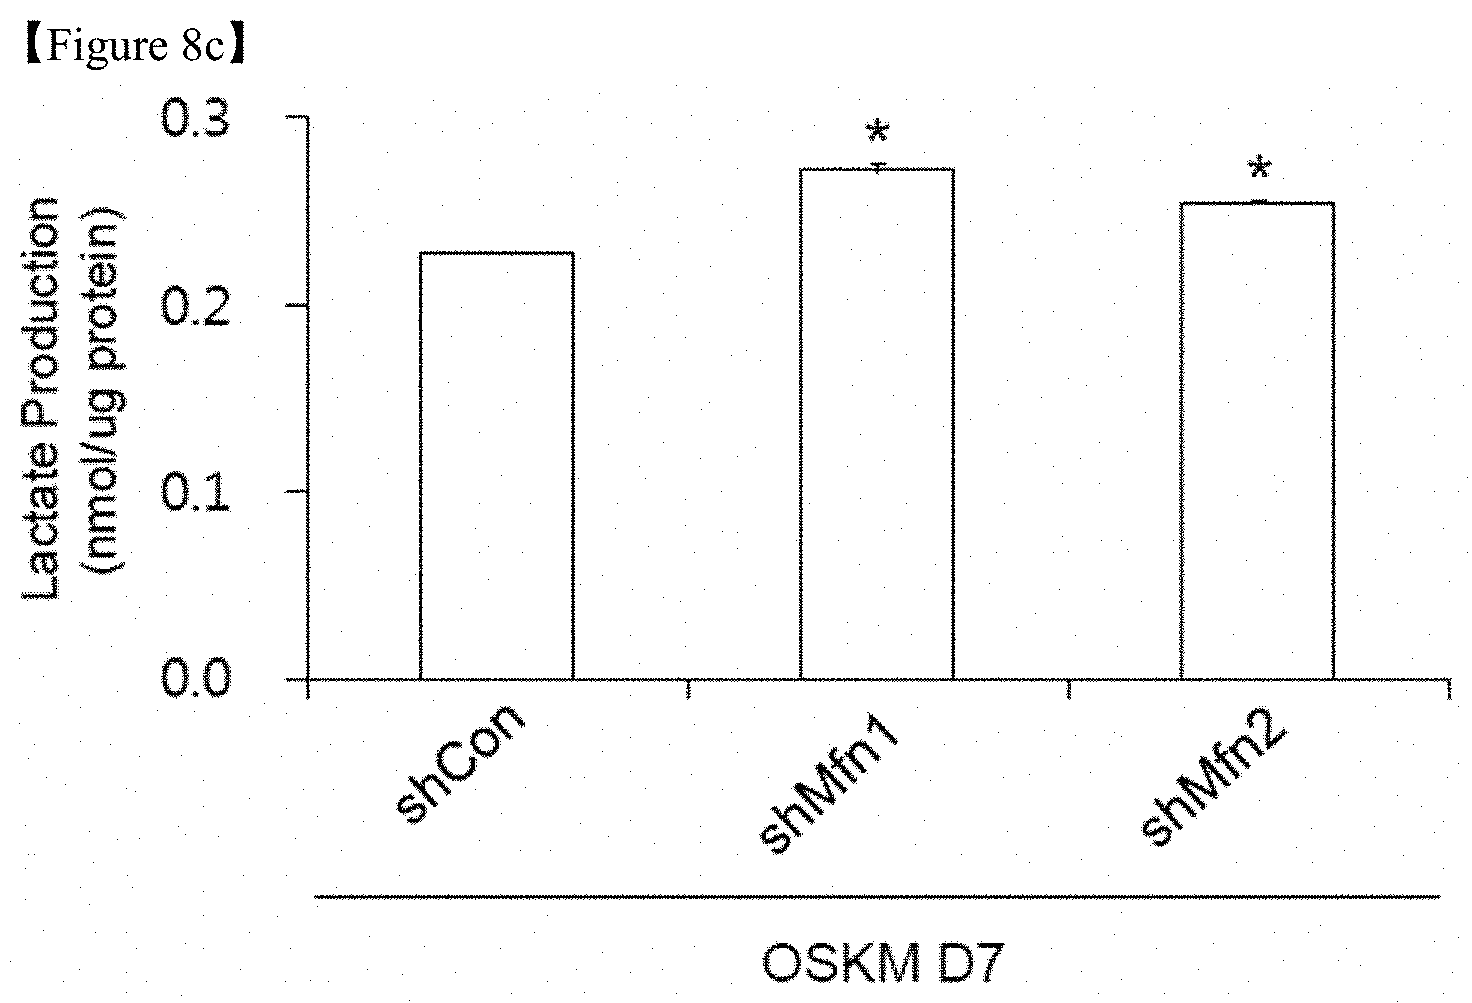
D00024

D00025

D00026

D00027
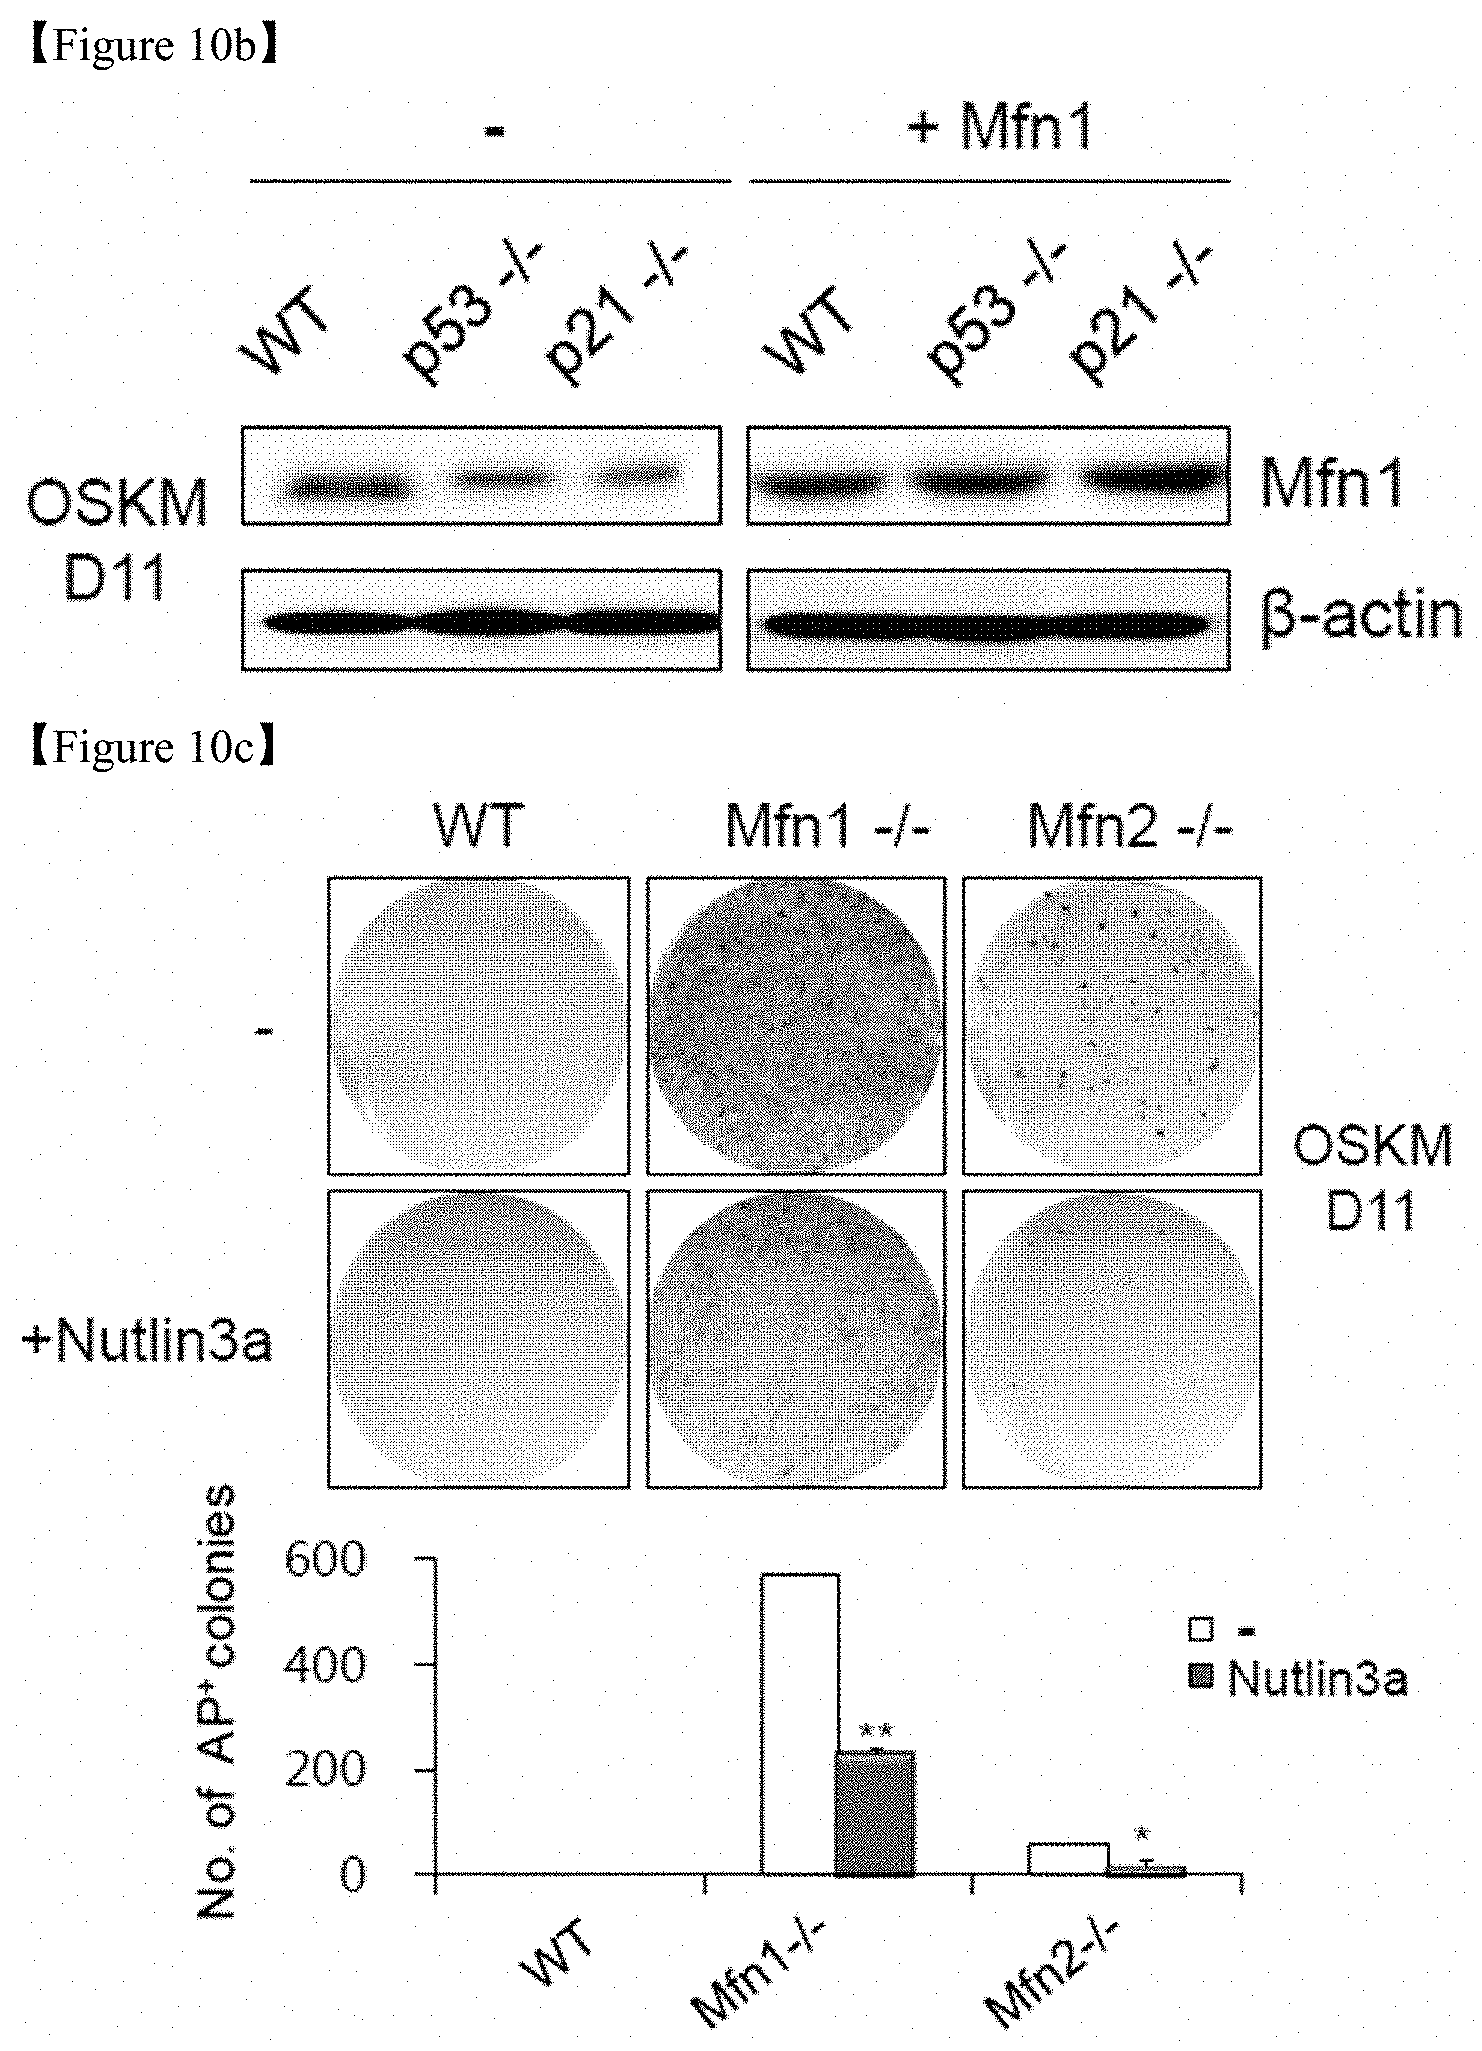
D00028
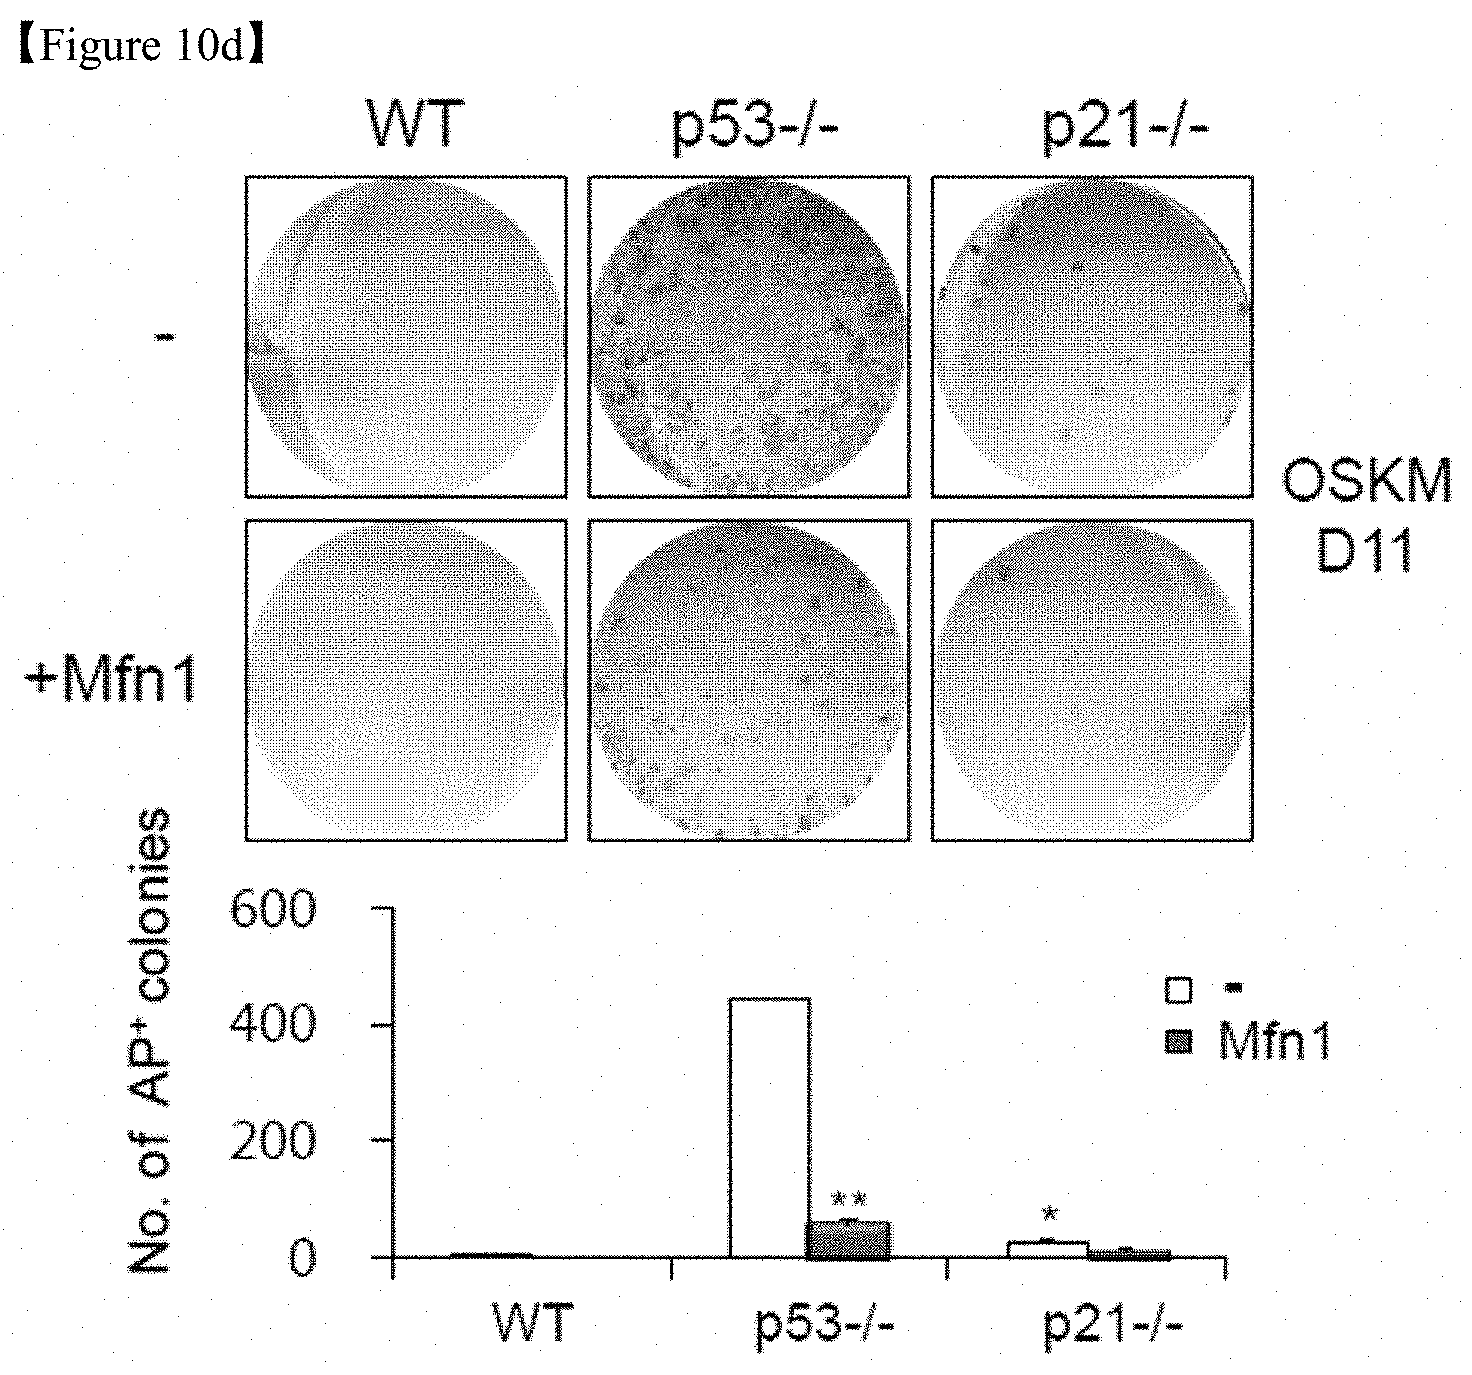
D00029

D00030

D00031
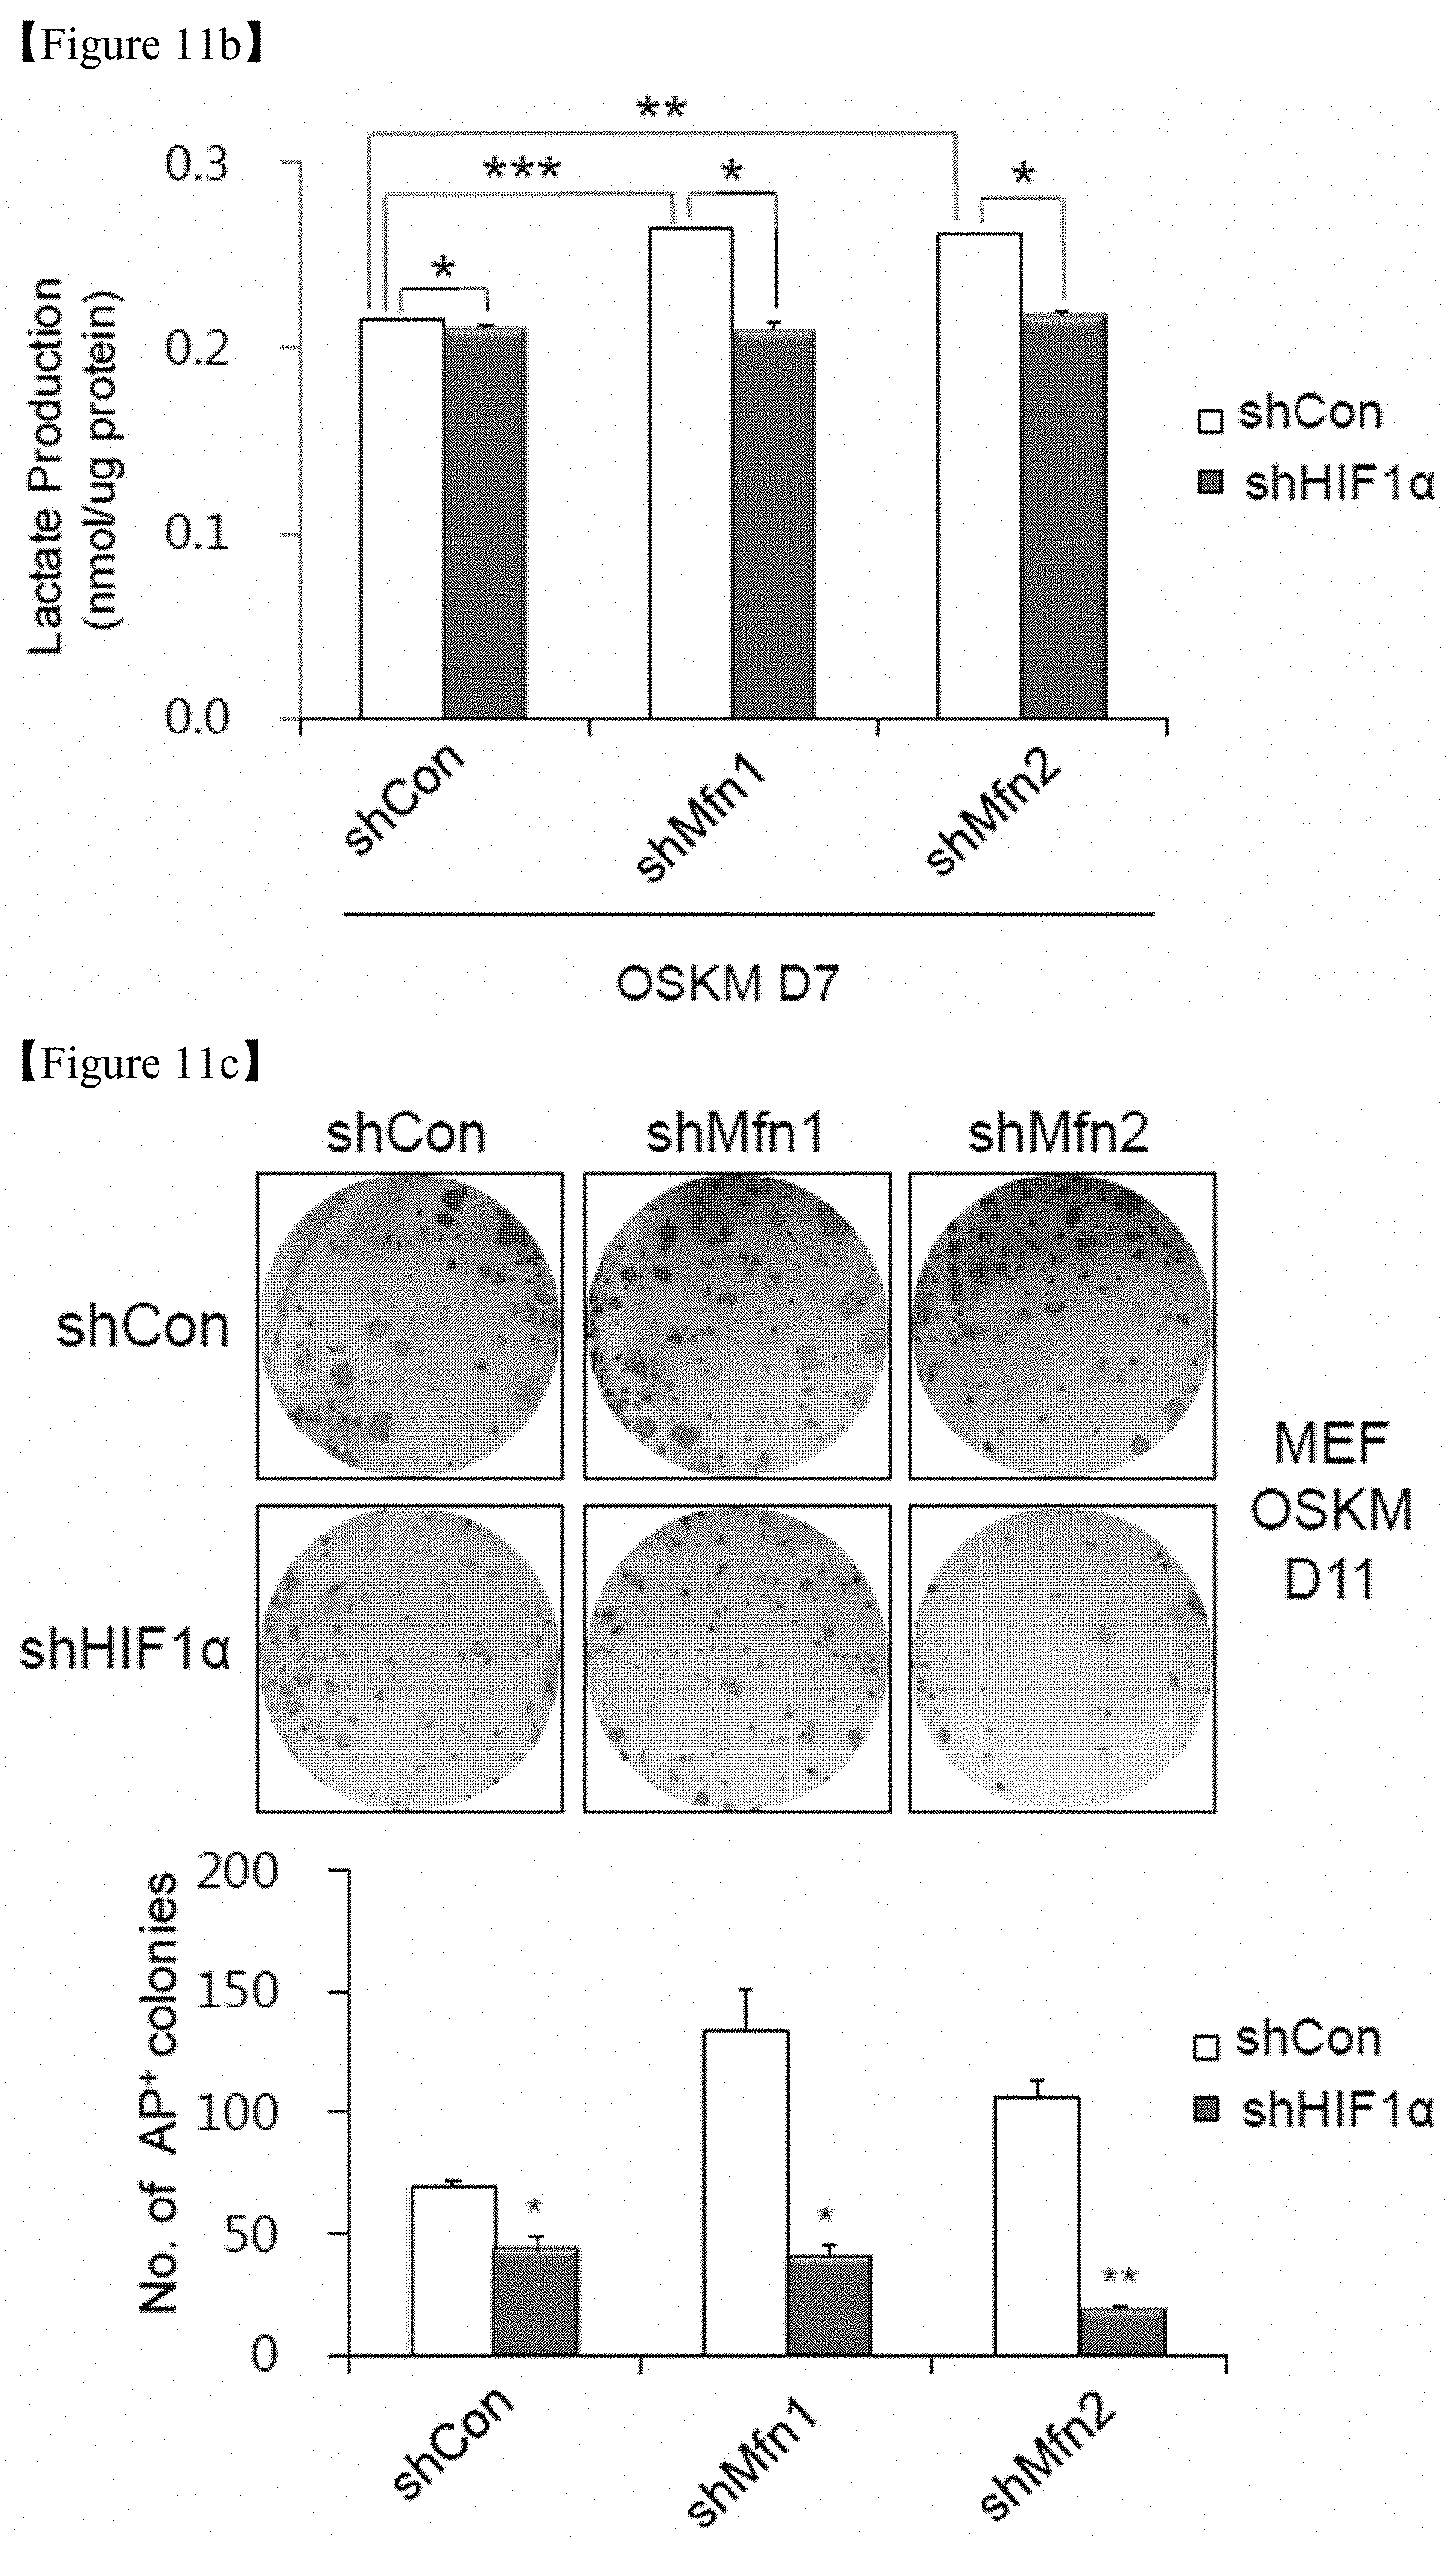
D00032

D00033

D00034

D00035
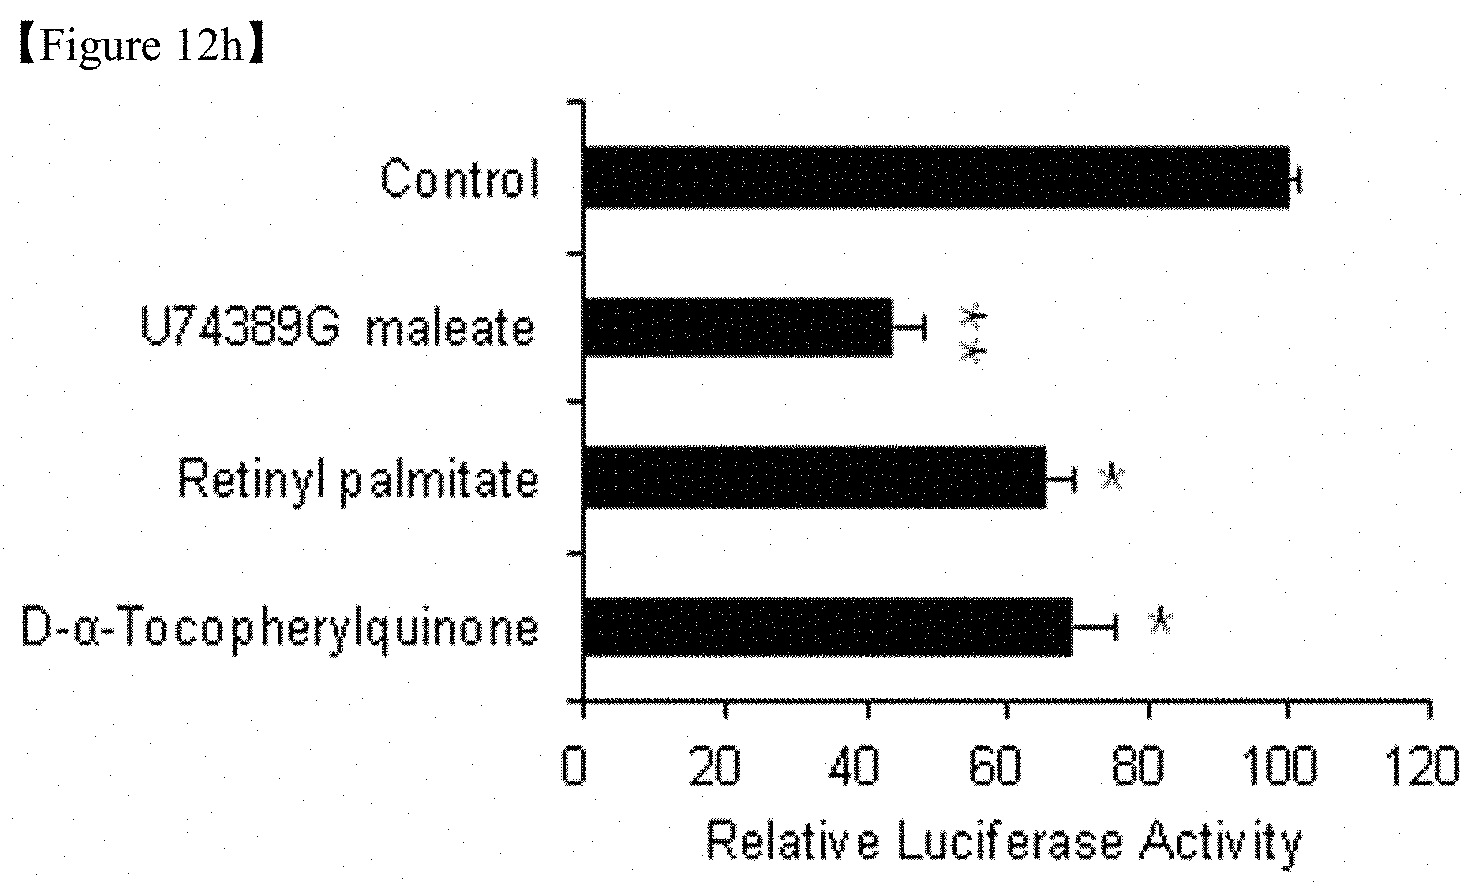
D00036

D00037
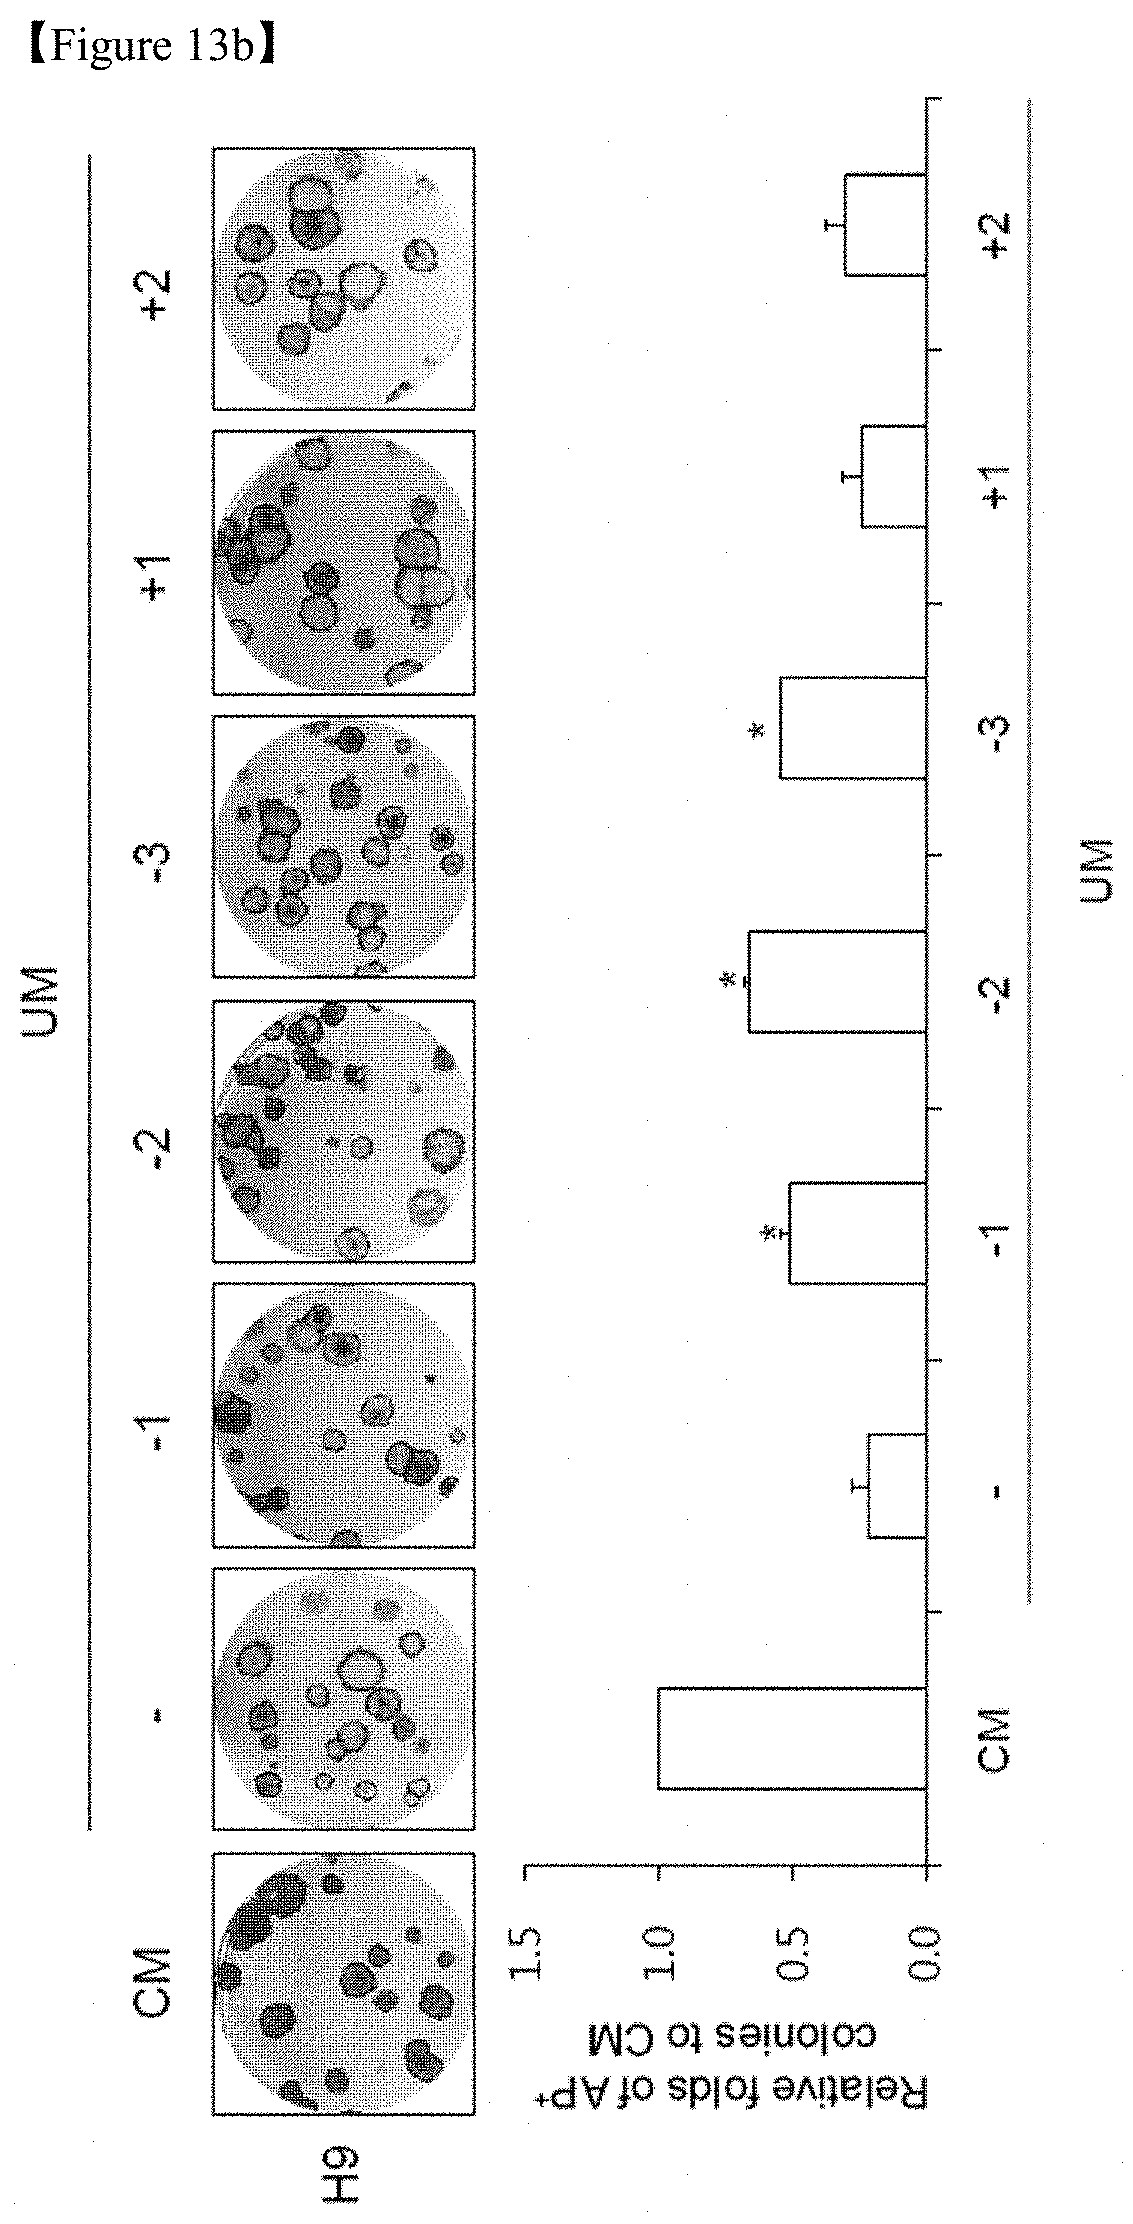
D00038
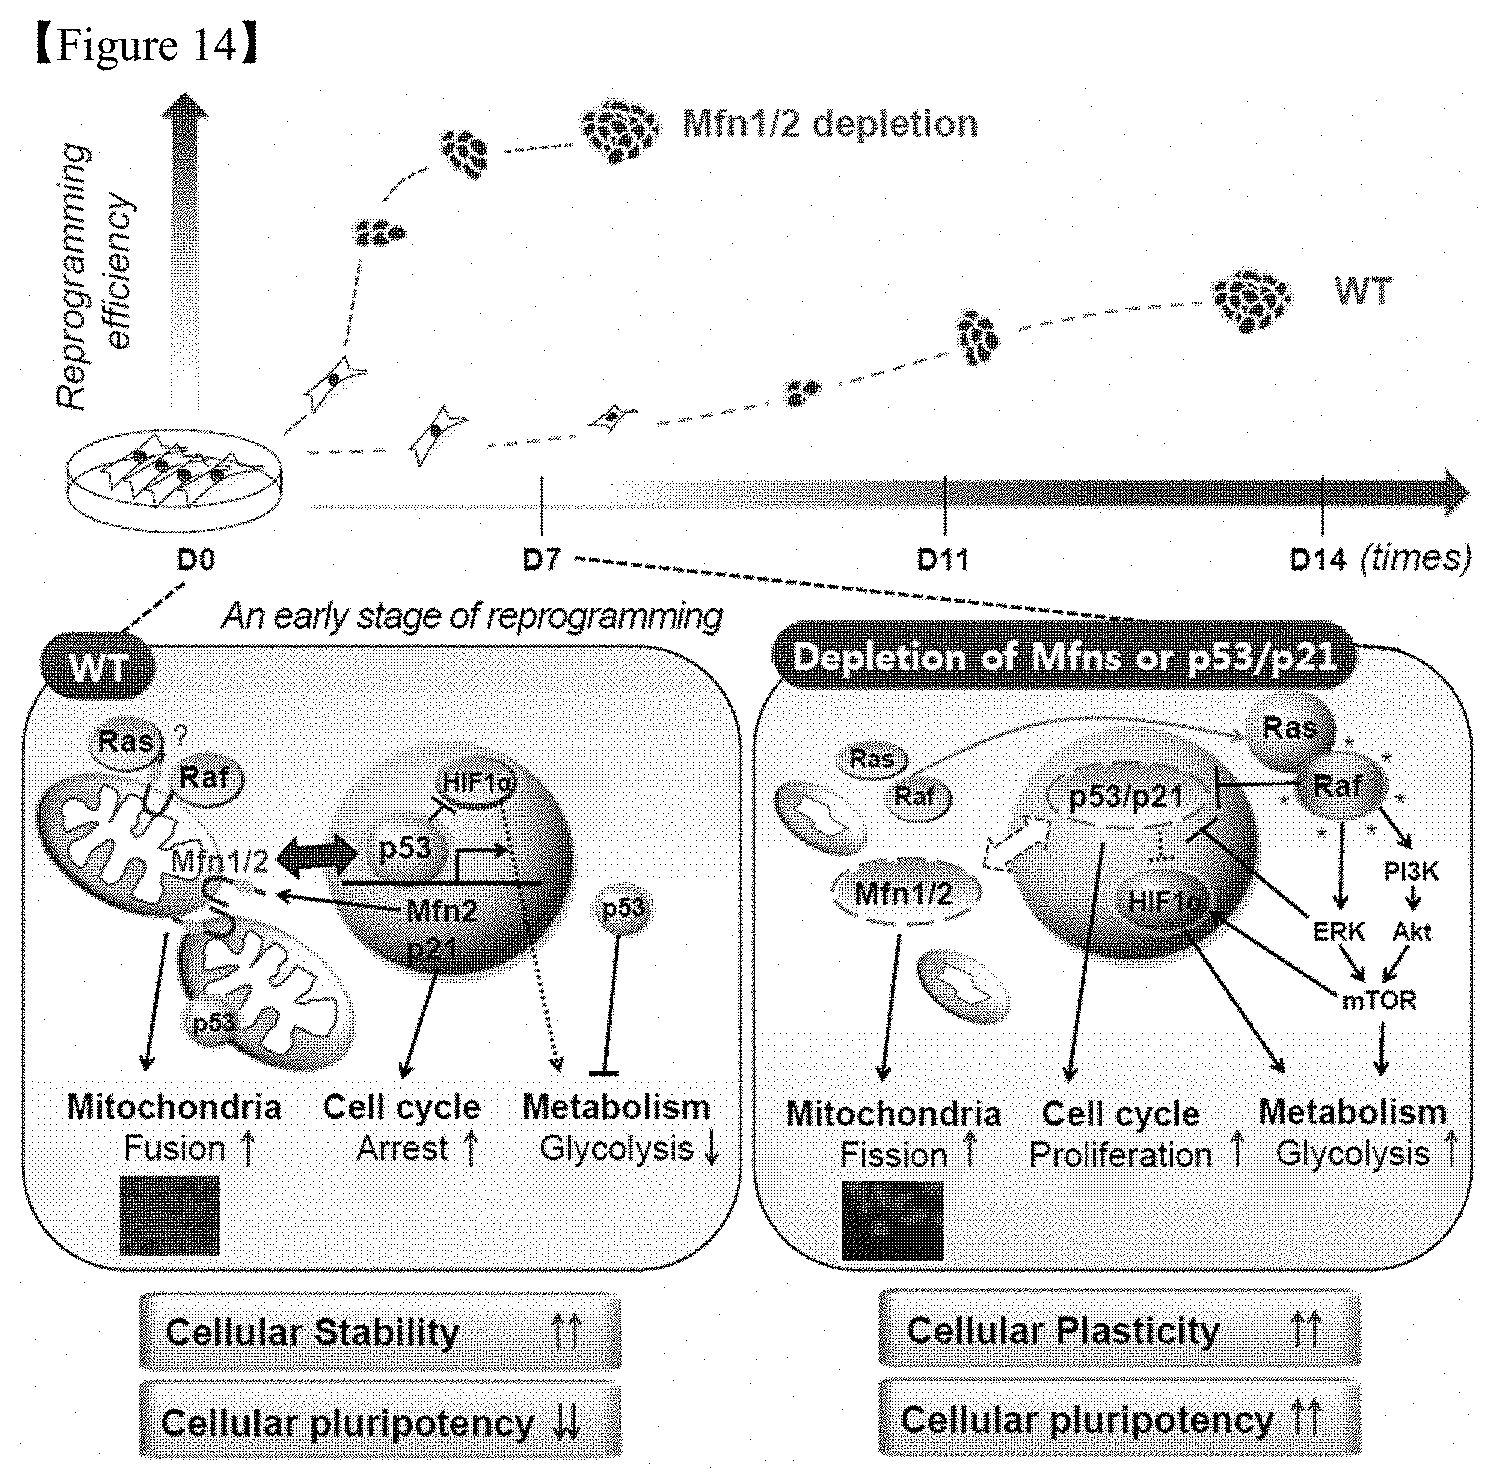
S00001
XML
uspto.report is an independent third-party trademark research tool that is not affiliated, endorsed, or sponsored by the United States Patent and Trademark Office (USPTO) or any other governmental organization. The information provided by uspto.report is based on publicly available data at the time of writing and is intended for informational purposes only.
While we strive to provide accurate and up-to-date information, we do not guarantee the accuracy, completeness, reliability, or suitability of the information displayed on this site. The use of this site is at your own risk. Any reliance you place on such information is therefore strictly at your own risk.
All official trademark data, including owner information, should be verified by visiting the official USPTO website at www.uspto.gov. This site is not intended to replace professional legal advice and should not be used as a substitute for consulting with a legal professional who is knowledgeable about trademark law.