Compositions and methods for detecting neoplasia
Manna , et al. Nov
U.S. patent number 10,487,363 [Application Number 14/762,426] was granted by the patent office on 2019-11-26 for compositions and methods for detecting neoplasia. This patent grant is currently assigned to The United States of America, as represented by the Secretary, Department of Health & Human Services. The grantee listed for this patent is The United States of America, as represented by the Secretary, Department of Health & Human Services, The United States of America, as represented by the Secretary, Department of Health & Human Services. Invention is credited to Frank J. Gonzalez, Kristopher W. Krausz, Soumen K. Manna.


View All Diagrams
| United States Patent | 10,487,363 |
| Manna , et al. | November 26, 2019 |
Compositions and methods for detecting neoplasia
Abstract
Compositions and methods for the diagnosis, treatment, and prevention of neoplasia (e.g., colorectal cancer).
| Inventors: | Manna; Soumen K. (Rockville, MD), Krausz; Kristopher W. (Columbia, MD), Gonzalez; Frank J. (Bethesda, MD) | ||||||||||
|---|---|---|---|---|---|---|---|---|---|---|---|
| Applicant: |
|
||||||||||
| Assignee: | The United States of America, as
represented by the Secretary, Department of Health & Human
Services (Rockville, MD) |
||||||||||
| Family ID: | 50097864 | ||||||||||
| Appl. No.: | 14/762,426 | ||||||||||
| Filed: | January 23, 2014 | ||||||||||
| PCT Filed: | January 23, 2014 | ||||||||||
| PCT No.: | PCT/US2014/012758 | ||||||||||
| 371(c)(1),(2),(4) Date: | July 21, 2015 | ||||||||||
| PCT Pub. No.: | WO2014/116833 | ||||||||||
| PCT Pub. Date: | July 31, 2014 |
Prior Publication Data
| Document Identifier | Publication Date | |
|---|---|---|
| US 20150344969 A1 | Dec 3, 2015 | |
Related U.S. Patent Documents
| Application Number | Filing Date | Patent Number | Issue Date | ||
|---|---|---|---|---|---|
| 61755891 | Jan 23, 2013 | ||||
| Current U.S. Class: | 1/1 |
| Current CPC Class: | C12Q 1/6886 (20130101); G01N 33/6806 (20130101); G01N 33/57419 (20130101); C12Q 2600/158 (20130101); G01N 2800/56 (20130101); G01N 2800/50 (20130101); G01N 2800/52 (20130101); C12Q 2600/154 (20130101) |
| Current International Class: | C12Q 1/6886 (20180101); G01N 33/574 (20060101); G01N 33/68 (20060101) |
References Cited [Referenced By]
U.S. Patent Documents
| 2011/0177063 | July 2011 | Pannequin |
| WO-2012/024612 | Feb 2012 | WO | |||
| WO201227984 | Sep 2012 | WO | |||
Other References
|
Bener et al. Biomedical Research 17(2): 149-154, 2006, 11 pages. cited by examiner . Malaguarnera et al. World J. Gastroenterol. 12(28):4541-454, Jul. 28, 2006. cited by examiner . Wang et al. World J. Gastroenterol. 10(9): 1297-1300, 2004. cited by examiner . Denkert Carsten et al: "Metabolite profiling of human colon carcinoma a deregulation of TCA cycle and amino acid turnover", Molecular Cancer, Biomed Central, London, GB, vol. 7, No. 1, Sep. 18, 2008 (Sep. 18, 2008), p. 72. cited by applicant . Yunping Qiu et al: "Urinary Metabonomic Study on Colorectal Cancer", Journal of Proteome Research, vol. 9, No. 3, Mar. 5, 2010(Mar. 5, 2010), pp. 1627-1634. cited by applicant . Yunping Qiu et al: "Serum Metabolite Profiling of Human Colorectal Cancer Using GC-TOFMS and UPLC-QTOFMS", Journal of Proteome Research, vol. 8, No. 10, Oct. 2, 2009 (Oct. 2, 2009), pp. 4844-4850. cited by applicant . Stephanos Pavlides et al: "The autophagic tumor stroma model of cancer: Role of oxidative stress and ketone production in fueling tumor cell metabolism", Cell Cycle, vol. 9, No. 17, Sep. 1, 2010 (Sep. 1, 2010), pp. 3485-3505. cited by applicant . Masanori Yoshimatsu et al: "Dysregulation of PRMT1 and PRMT6, Type I arginine methyltransferases, is involved in various types of human cancers", International Journal of Cancer, vol. 128, No. 3, Nov. 27, 2010 (Nov. 27, 2010), pp. 562-573. cited by applicant . Soumen K. Manna et al: "Biomarkers of Coordinate Metabolic Reprogramming in Colorectal Tumors in Mice and Humans", Gastroenterology, Jan. 1, 2014 (Jan. 1, 2014). cited by applicant. |
Primary Examiner: Dent; Alana Harris
Attorney, Agent or Firm: Locke Lord LLP DiCeglie, Jr.; Nicholas J. Smith; Andrew W.
Government Interests
STATEMENT OF RIGHTS TO INVENTIONS MADE UNDER FEDERALLY SPONSORED RESEARCH
This work was supported by the National Cancer Institute Intramural Research Program, National Institutes of Health. The Government has certain rights in this invention.
Parent Case Text
RELATED APPLICATIONS
This application is a national stage application filed under 35 U.S.C. .sctn. 371 of International Application PCT/US2014/012758 (published Jul. 31, 2014 as WO 2014/116833) having an International filing date of Jan. 23, 2014 and which claims priority to U.S. Provisional Application No. 61/755,891, filed Jan. 23, 2013, the entire contents each of which are incorporated by reference in its their entireties herein.
Claims
What is claimed is:
1. A method for identifying a subject as having colorectal cancer, the method comprising: identifying a change in the level of a combination of two or more biomarkers in a biological fluid or tissue sample derived from the subject relative to the level present in a reference, wherein a first biomarker is selected from a first group, and at least one additional biomarker is selected from a different group, wherein the groups are selected from among the following: (a) biomarkers related to methylation comprising at least one of asymmetric-dimethylarginine, symmetric-dimethylarginine, carnitine, methionine, dimethylglycine, or betaine; (b) biomarkers related to nucleic acid metabolism comprising at least one of xanthosine, inosine, deoxyuridine, thymidine, deoxycytidine, cytosine, hypoxanthine, xanthine, uracil, guanosine, or adenosine; (c) biomarkers related to urea cycle and polyamine metabolism comprising at least one of N1-acetyl spermidine, N8-acetyl spermidine, spermine, arginine ornithine, or citrulline; (d) biomarkers related to amino acid metabolism comprising at least one of proline, glutamine, glutamic acid, threonine, or N.alpha.-acetyllysine; and (e) M264 (.beta.-D-Ribofuranosylcreatine), wherein the subject is identified as having colorectal cancer when: (i) the levels of two or more biomarkers in the biological fluid are increased, or (ii) the change in the levels of the biomarkers in a tissue sample are: (A) increased for asymmetric-dimethylarginine, symmetric-dimethylarginine, carnitine, methionine, dimethylglycine, betaine, deoxyuridine, thymidine, deoxycytidine, cytosine, hypoxanthine, xanthosine, uracil, guanosine, adenosine, N1-acetyl spermidine, N8-acetyl spermidine, spermine, arginine ornithine, citrulline, proline, glutamine, glutamic acid, threonine, N.alpha.-acetyllysine, and M264; and (B) decreased for xanthine and inosine; normalizing the level of at least one of the biomarkers to the level of creatine in the sample, absolute concentration, 24-hr excretion, or with respect to specific gravity; and treating the colorectal cancer with surgery, radiation therapy, external beam radiation therapy, brachytherapy, chemotherapy, or a combination thereof.
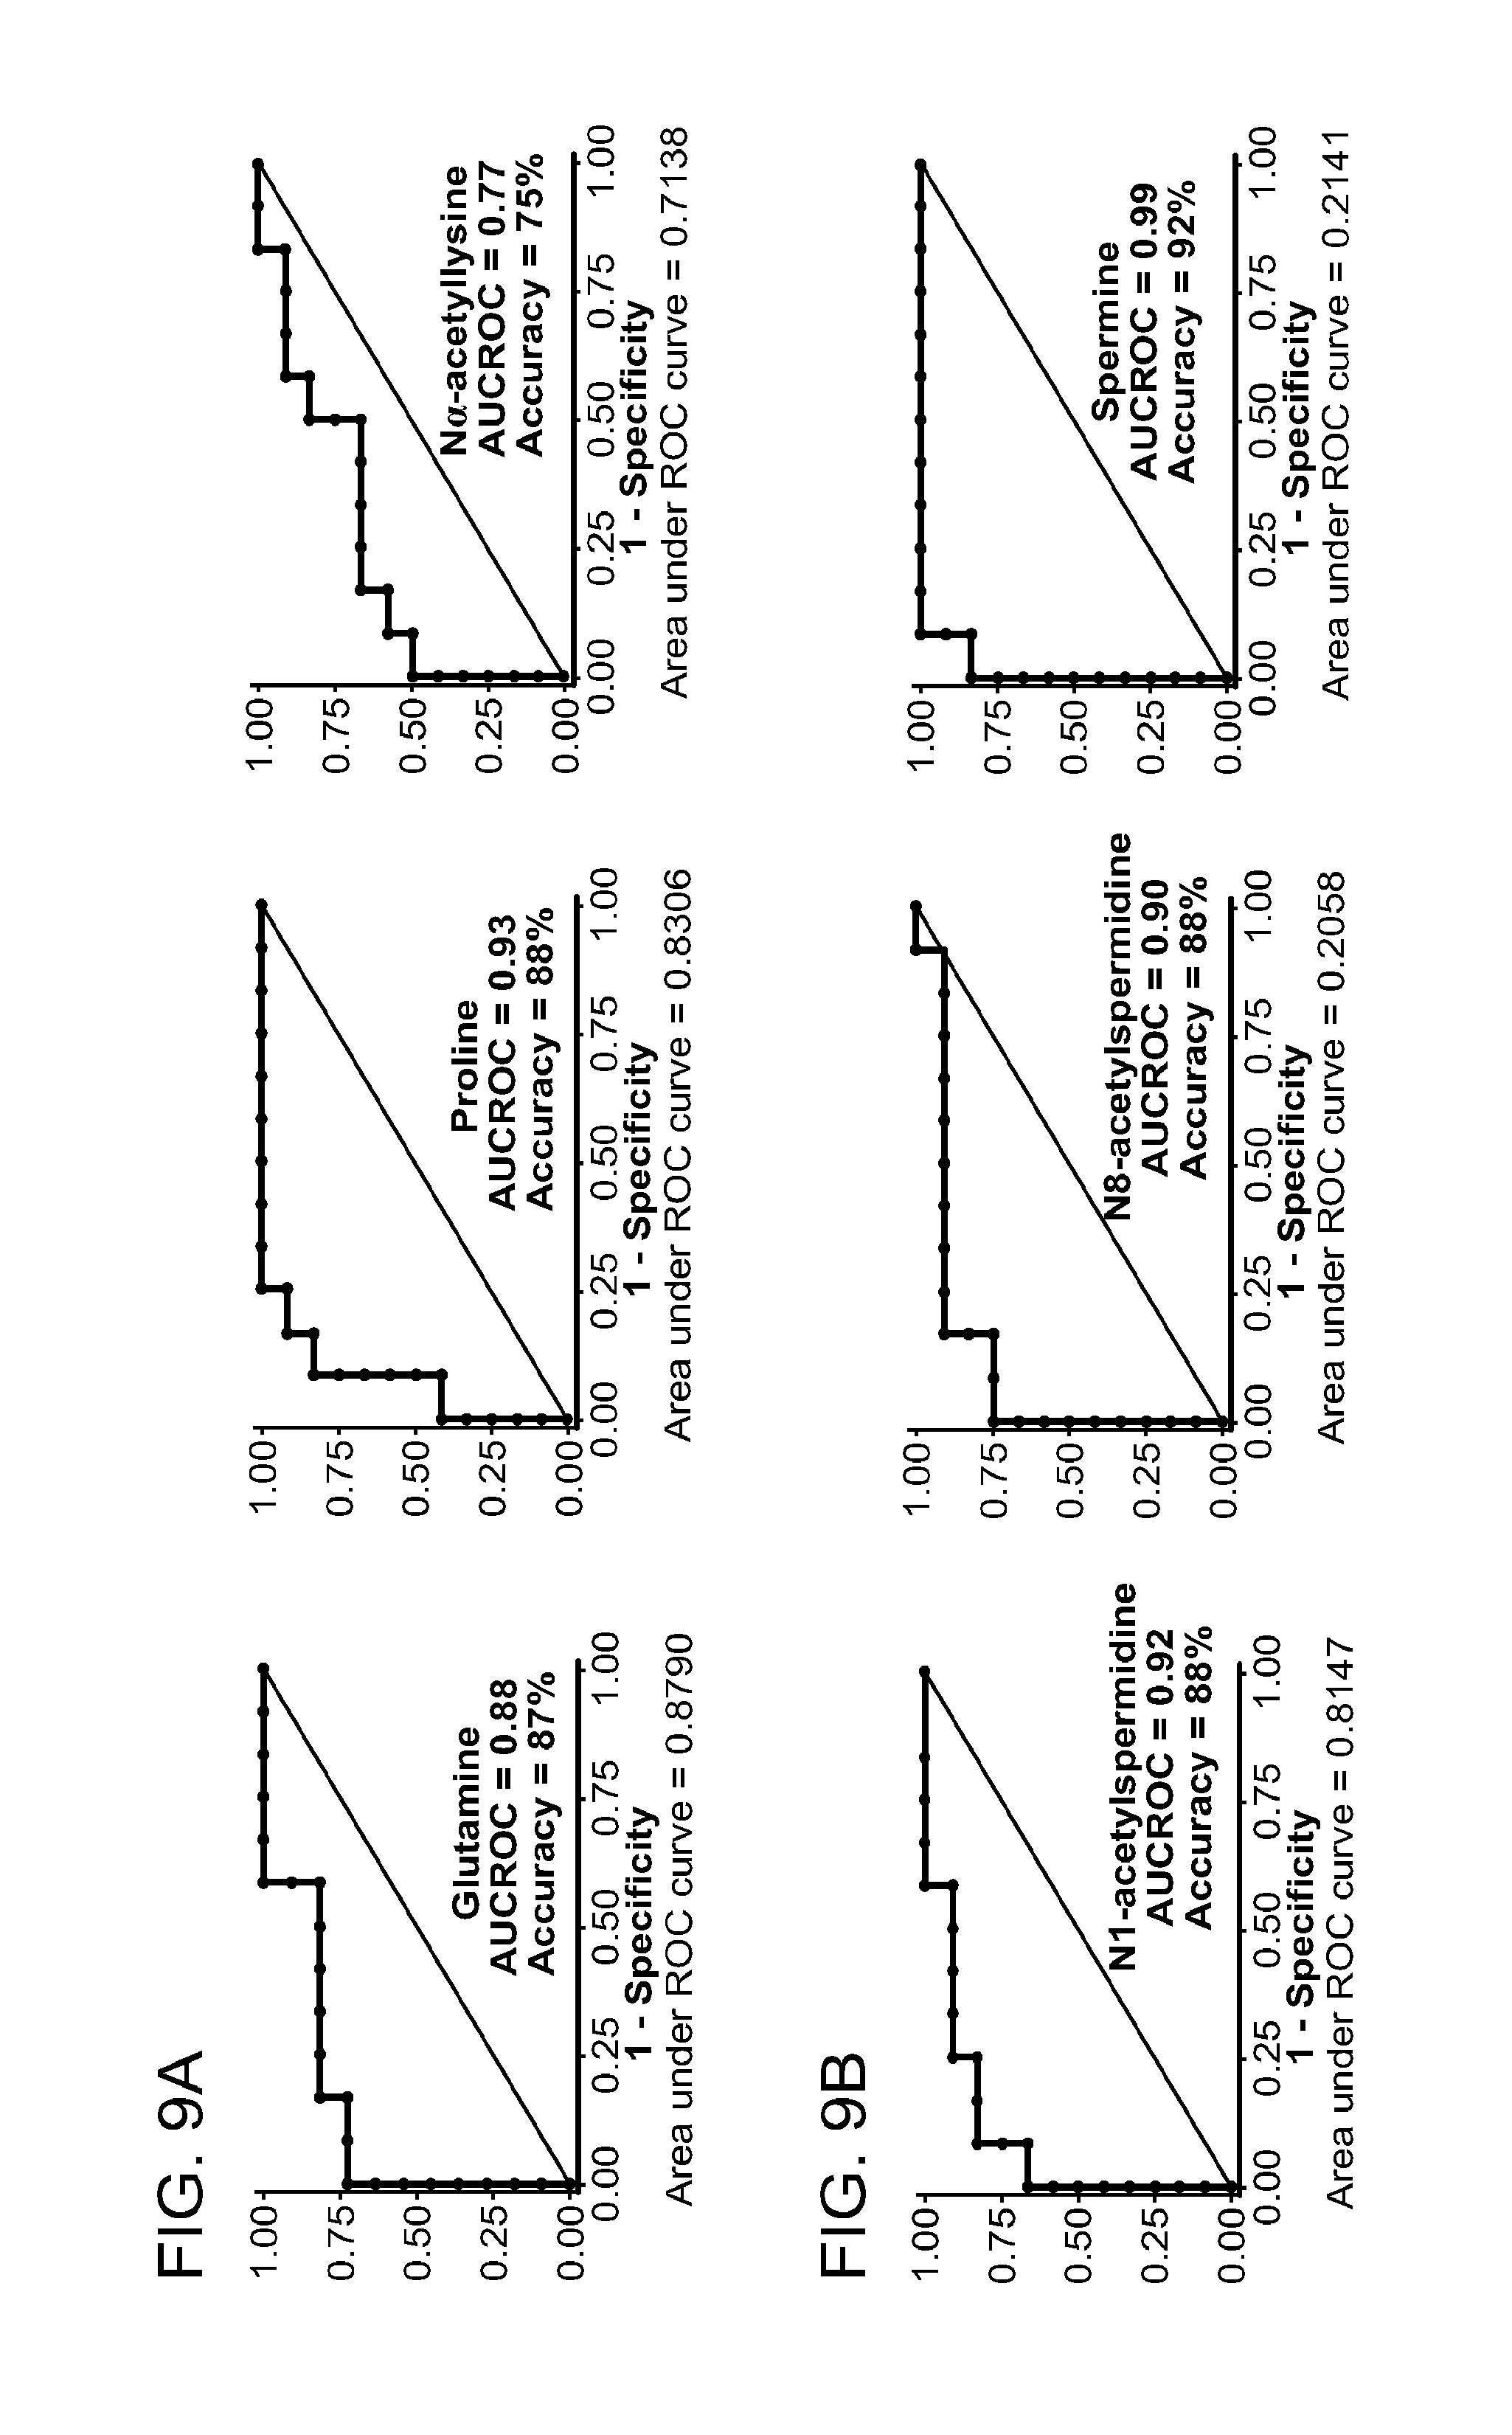
2. The method of claim 1, wherein the groups are selected from the following: biomarkers related to methylation comprising at least one of asymmetric-dimethylarginine or symmetric-dimethylarginine; biomarkers related to nucleic acid metabolism comprising at least one of xanthosine, inosine, deoxyuridine, or thymidine; biomarkers related to polyamine metabolism comprising at least one of N1-acetyl spermidine, N8-acetyl spermidine, or spermine; and biomarkers related to amino acid metabolism comprising at least one of proline, glutamine, or N.alpha.-acetyllysine.
3. The method of claim 1, wherein the tissue sample is a biopsy.
4. The method of claim 1, wherein the biological fluid is selected from the group consisting of urine, blood, blood serum, plasma, bile, fecal aspirate, intestinal aspirate, cerebrospinal fluid and saliva.
5. The method of claim 1, further comprising measuring the level of carnitine in the biological sample.
6. The method of claim 5, wherein a decrease in the level of carnitine in the biological fluid identifies a subject as having colorectal cancer.
7. The method of claim 5, wherein an increase in the level of carnitine in the biological fluid identifies a subject as having an increased chance of survival.
8. The method of claim 5, wherein an increase in the level of carnitine in the tissue sample identifies a subject as having colorectal cancer.
9. The method of claim 5, wherein a decrease in the level of carnitine in the tissue sample identifies a subject as having an increased chance of survival.
10. The method of claim 1, wherein the colorectal cancer comprises a mutation in APC or a Wnt signaling pathway protein.
11. The method of claim 1, further comprising detecting a mutation in APC or a Wnt signaling pathway protein.
12. The method of claim 1, wherein the level of the biomarker is increased 1.5, 2, 2.5, 3, 3.5, 4, 5, 6, 7, 8, 9, 10, 11, 12, 13, 14, 15-fold or more relative to the reference.
13. The method of claim 1, wherein the reference is a control or a corresponding biological sample derived from a healthy subject.
14. The method of claim 1, wherein the biomarker level is detected by chromatography, mass spectrometry, spectroscopy, or immunoassay.
15. The method of claim 1, wherein the first biomarker or the additional biomarker is M264 (.beta.-D-Ribofuranosylcreatine).
16. The method of claim 1, further comprising characterizing the colorectal cancer, wherein: an increased level of the biomarker related to methylation relative to the reference identifies a more aggressive colorectal cancer; or a decreases level of the biomarker related to methylation relative to the reference identifies a less aggressive colorectal cancer.
17. The method of claim 16, wherein the treatment corresponds to the more aggressive colorectal cancer.
18. The method of claim 16, wherein the treatment corresponds to the less aggressive colorectal cancer.
19. A method for identifying a subject as having colorectal cancer, the method comprising: identifying a change in the level of a combination of two or more biomarkers in a biological fluid or tissue sample derived from the subject relative to the level present in a reference, wherein a first biomarker is M264 (.beta.-D-Ribofuranosylcreatine), and at least one additional biomarker is selected from a different group, wherein the groups are selected from among the following: (a) biomarkers related to methylation comprising at least one of asymmetric-dimethylarginine, symmetric-dimethylarginine, carnitine, methionine, dimethylglycine, or betaine; (b) biomarkers related to nucleic acid metabolism comprising at least one of xanthosine, inosine, deoxyuridine, thymidine, deoxycytidine, cytosine, hypoxanthine, xanthine, uracil, guanosine, or adenosine; (c) biomarkers related to urea cycle and polyamine metabolism comprising at least one of N1-acetyl spermidine, N8-acetyl spermidine, spermine, arginine ornithine, or citrulline; and (d) biomarkers related to amino acid metabolism comprising at least one of proline, glutamine, glutamic acid, threonine, or N.alpha.-acetyllysine; wherein the subject is identified as having colorectal cancer when: (i) the levels of two or more biomarkers in the biological fluid are increased, or (ii) the change in the levels of the biomarkers in a tissue sample are: (A) increased for asymmetric-dimethylarginine, symmetric-dimethylarginine, carnitine, methionine, dimethylglycine, betaine, deoxyuridine, thymidine, deoxycytidine, cytosine, hypoxanthine, xanthosine, uracil, guanosine, adenosine, N1-acetyl spermidine, N8-acetyl spermidine, spermine, arginine ornithine, citrulline, proline, glutamine, glutamic acid, threonine, N.alpha.-acetyllysine, and M264; and (B) decreased for xanthine and inosine; and treating the colorectal cancer with surgery, radiation therapy, external beam radiation therapy, brachytherapy, chemotherapy, or a combination thereof.
Description
SEQUENCE LISTING
The instant application contains a Sequence Listing which has been submitted electronically in ascii format and is hereby incorporated by reference in its entirety. Said ascii copy is named 91921WO(47992)_sl.txt and is 843,776 bytes in size.
BACKGROUND OF THE INVENTION
Colorectal cancer is the second leading cause of cancer mortality in United States and fourth worldwide. Although colorectal cancer has good therapeutic response at early stages, advanced stages are frequently associated with metastasis and poor prognosis. Therefore, regular screening and early diagnosis of the disease is pivotal to therapeutic success. Currently used diagnostic procedures such as endoscopy and biopsy are invasive and time-consuming. The sensitivity and specificity of serum-based carcinoembryonic antigen test has also been found to be poor for early diagnosis. Lack of high-throughput noninvasive markers continues to contribute to avoidable healthcare burden and mortality.
Metabolomics has the potential to be a useful tool for identification of changes in biochemical signature associated with pathogenesis. However, tissue metabolomics, which requires biopsy samples, is also invasive. Moreover, there has been a general lack of studies investigating the mechanistic link between these biomarkers and changes in cancer tissue. Accordingly, high-throughput noninvasive methods for detecting neoplasia are urgently required.
SUMMARY OF THE INVENTION
As described below, the present invention features compositions and methods for the diagnosis, treatment, and prevention of neoplasia (e.g., colorectal cancer, small intestine cancer, duodenal cancer, gastric cancer, pancreatic cancer, liver cancer, esophageal cancer, ovarian cancer, prostate cancer, uterine cancer, breast cancer, thyroid cancer, and melanoma).
In one aspect, the invention generally features a method for identifying a subject as having or having a propensity to develop neoplasia, the method involving identifying an increased level of a combination of two or more biomarkers in a biological sample derived from the subject relative to the level present in a reference, where a first biomarker is selected from a first group and at least one additional marker is selected from a different group, where the groups are selected from among the following: biomarkers related to methylation; biomarkers related to nucleic acid metabolism; biomarkers related to urea cycle and polyamine metabolism; and biomarkers related to amino acid metabolism, where an increase in the levels of two or more biomarkers identifies a subject as having or having a propensity to develop neoplasia.
In another aspect, the invention generally features a method for identifying a subject as having or having a propensity to develop neoplasia, the method involving identifying an increased level of a combination of two or more biomarkers in a biological sample derived from the subject relative to the level present in a reference, where a first biomarker is selected from a first group and at least one additional marker is selected from a different group, where the groups are selected from among the following:
biomarkers related to methylation including asymmetric-dimethylarginine, symmetric-dimethylarginine, carnitine, methionine, dimethylglycine, and betaine;
biomarkers related to nucleic acid metabolism including xanthosine, inosine, deoxyuridine, thymidine, deoxycytidine, cytosine, hypoxanthine, xanthine, uracil, guanosine, and adenosine;
biomarkers related to urea cycle and polyamine metabolism including N1-acetylspermidine, acetylspermidine, spermine, arginine ornithine, and citrulline;
biomarkers related to amino acid metabolism including proline, glutamine, glutamic acid, threonine, and N.alpha.-acetyllysine; and
M264 (.beta.-D-Ribofuranosylcreatine), where an increase in the levels of two or more biomarkers identifies a subject as having or having a propensity to develop neoplasia.
In one embodiment, the groups are selected from the following:
biomarkers related to methylation comprising asymmetric-dimethylarginine and symmetric-dimethylarginine;
biomarkers related to nucleic acid metabolism comprising xanthosine, inosine, deoxyuridine, and thymidine;
biomarkers related to polyamine metabolism comprising N1-acetylspermidine, N8-acetylspermidine, and spermine; and
biomarkers related to amino acid metabolism comprising proline, glutamine, and N.alpha.-acetyllysine.
In another aspect, the invention features a method for determining the prognosis of neoplasia in a subject, the method involving identifying an increased level of a combination of two or more biomarkers in a biological sample derived from the subject relative to the level present in a reference, where a first biomarker is selected from a first group and at least one additional marker is selected from a different group, where the groups are selected from among the following: biomarkers related to methylation; biomarkers related to nucleic acid metabolism; biomarkers related to urea cycle and polyamine metabolism; and biomarkers related to amino acid metabolism, thereby determining the prognosis of neoplasia in the subject.
In another aspect, the invention features a method for determining the prognosis of neoplasia in a subject, the method involving identifying an increased level of a combination of two or more biomarkers in a biological sample derived from the subject relative to the level present in a reference, where a first biomarker is selected from a first group and at least one additional marker is selected from a different group, where the groups are selected from among the following:
biomarkers related to methylation including asymmetric-dimethylarginine, symmetric-dimethylarginine, carnitine, methionine, dimethylglycine, and betaine;
biomarkers related to nucleic acid metabolism including xanthosine, inosine, deoxyuridine, thymidine, deoxycytidine, cytosine, hypoxanthine, xanthine, uracil, guanosine, and adenosine;
biomarkers related to urea cycle and polyamine metabolism including N1-acetylspermidine, N8-acetylspermidine, spermine, arginine ornithine, and citrulline;
biomarkers related to amino acid metabolism including proline, glutamine, glutamic acid, threonine, and N.alpha.-acetyllysine; and
M264 (.beta.-D-Ribofuranosylcreatine), thereby determining the prognosis of neoplasia in the subject.
In one embodiment, the groups are selected from the following:
biomarkers related to methylation comprising asymmetric-dimethylarginine and symmetric-dimethylarginine;
biomarkers related to nucleic acid metabolism comprising xanthosine, inosine, deoxyuridine, and thymidine;
biomarkers related to polyamine metabolism comprising N1-acetylspermidine, N8-acetylspermidine, and spermine; and
biomarkers related to amino acid metabolism comprising proline, glutamine, and N.alpha.-acetyllysine.
In one embodiment, an increase in the level of asymmetric-dimethylarginine, symmetric-dimethylarginine, carnitine, methionine, dimethylglycine or betaine relative to the reference identifies the subject as having a reduced chance of survival. In a further embodiment, an increase in the level of asymmetric-dimethylarginine and symmetric-dimethylarginine relative to the reference identities the subject as having a reduced chance of survival.
In another embodiment, a decrease in the level of asymmetric-dimethylarginine, symmetric-dimethylarginine, carnitine, methionine, dimethylglycine or betaine relative to the reference identifies the subject as having an increased chance of survival. In a further embodiment, a decrease in the level of asymmetric-dimethylarginine and symmetric-dimethylarginine relative to the reference identifies the subject as having an increased chance of survival.
In another aspect, the invention features a method for monitoring response to neoplasia therapy in a subject, the method involving identifying an increased level of a combination of two or more biomarkers in a biological sample derived from the subject relative to the level present in a reference, where a first biomarker is selected from a first group and at least one additional marker is selected from a different group, where the groups are selected from among the following: biomarkers related to methylation; biomarkers related to nucleic acid metabolism; biomarkers related to urea cycle and polyamine metabolism; biomarkers related to amino acid metabolism; thereby monitoring neoplasia therapy in the subject.
In another aspect, the invention features a method for monitoring response to neoplasia therapy in a subject, the method involving identifying an increased level of a combination of two or more biomarkers in a biological sample derived from the subject relative to the level present in a reference, where a first biomarker is selected from a first group and at least one additional marker is selected from a different group, where the groups are selected from among the following:
biomarkers related to methylation including asymmetric-dimethylarginine, symmetric-dimethylarginine, carnitine, methionine, dimethylglycine, and betaine;
biomarkers related to nucleic acid metabolism including xanthosine, inosine, deoxyuridine, thymidine, deoxycytidine, cytosine, hypoxanthine, xanthine, uracil, guanosine, and adenosine;
biomarkers related to urea cycle and polyamine metabolism including N1-acetylspermidine, N8-acetylspermidine, spermine, arginine ornithine, and citrulline;
biomarkers related to amino acid metabolism including proline, glutamine, glutamic acid, threonine, and N.alpha.-acetyllysine; and
M264 (.beta.-D-Ribofuranosylcreatine), thereby monitoring neoplasia therapy in the subject.
In one embodiment, the groups are selected from the following:
biomarkers related to methylation comprising asymmetric-dimethylarginine and symmetric-dimethylarginine;
biomarkers related to nucleic acid metabolism comprising xanthosine, inosine, deoxyuridine, and thymidine;
biomarkers related to polyamine metabolism comprising N1-acetylspermidine, N8-acetylspermidine, and spermine; and
biomarkers related to amino acid metabolism comprising proline, glutamine, and N.alpha.-acetyllysine.
In one embodiment, a therapy that reduces the level of asymmetric-dimethylarginine, symmetric-dimethylarginine, carnitine, methionine, dimethylglycine, or betaine is identified as effective. In another particular embodiment, a therapy that reduces the level of asymmetric-dimethylarginine and symmetric-dimethylarginine is identified as effective.
In another embodiment, the reference is a sample obtained from the subject prior to therapy or at an earlier time point during therapy.
In one aspect, the invention features a method for characterizing the aggressiveness of a neoplasia in a subject, the method involving identifying an increased level of a combination of two or more biomarkers in a biological sample derived from the subject relative to the level present in a reference, where a first biomarker is selected from a first group and at least one additional marker is selected from a different group, where the groups are selected from among the following: biomarkers related to methylation; biomarkers related to nucleic acid metabolism; biomarkers related to urea cycle and polyamine metabolism; and biomarkers related to amino acid metabolism, where an increased level of a biomarker related to methylation identifies the neoplasia as aggressive, and a decreased level of a biomarker related to methylation identifies the neoplasia as less aggressive.
In another aspect, the invention features a method for characterizing the aggressiveness of a neoplasia in a subject, the method involving identifying an increased level of a combination of two or more biomarkers in a biological sample derived from the subject relative to the level present in a reference, where a first biomarker is selected from a first group and at least one additional marker is selected from a different group, where the groups are selected from among the following:
biomarkers related to methylation including asymmetric-dimethylarginine, symmetric-dimethylarginine, carnitine, methionine, dimethylglycine, and betaine;
biomarkers related to nucleic acid metabolism including xanthosine, inosine, deoxyuridine, thymidine, deoxycytidine, cytosine, hypoxanthine, xanthine, uracil, guanosine, and adenosine;
biomarkers related to urea cycle and polyamine metabolism including N1-acetylspermidine, N8-acetylspermidine, spermine, arginine omithine, and citrulline; d
biomarkers related to amino acid metabolism including proline, glutamine, glutamic acid, threonine, and N.alpha.-acetyllysine; and
M264 (.beta.-D-Ribofuranosylcreatine), where an increased level of asymmetric-dimethylarginine and symmetric-dimethylarginine identifies the neoplasia as aggressive, and a decreased level of asymmetric-dimethylarginine and symmetric-dimethylarginine identifies the neoplasia as less aggressive.
In one embodiment, the groups are selected from the following:
biomarkers related to methylation comprising asymmetric-dimethylarginine and symmetric-dimethylarginine;
biomarkers related to nucleic acid metabolism comprising xanthosine, inosine, deoxyuridine, and thymidine;
biomarkers related to polyamine metabolism comprising N1-acetylspermidine, N8-acetylspermidine, and spermine; and
biomarkers related to amino acid metabolism comprising proline, glutamine, and N.alpha.-acetyllysine.
In one aspect, the invention features a method for identifying a subject as having or having a propensity to develop colorectal cancer, the method involving identifying an increased level of a combination of two or more biomarkers in a biological sample derived from the subject relative to the level present in a reference, where at least one biomarker is selected from the group of biomarkers related to methylation; and at least one additional marker is selected from a group from among the following: biomarkers related to nucleic acid metabolism; biomarkers related to urea cycle and polyamine metabolism; and biomarkers related to amino acid metabolism, where an increase in the levels of two or more biomarkers identifies a subject as having or having a propensity to develop neoplasia.
In another aspect, the invention features a method for identifying a subject as having or having a propensity to develop colorectal cancer, the method involving identifying an increased level of a combination of two or more biomarkers in a biological sample derived from the subject relative to the level present in a reference, where at least one biomarker is selected from the group of biomarkers related to methylation including asymmetric-dimethylarginine, symmetric-dimethylarginine, carnitine, methionine, dimethylglycine and betaine; and at least one additional marker is selected from a group from among the following:
biomarkers related to nucleic acid metabolism including xanthosine, inosine, deoxyuridine, thymidine, deoxycytidine, cytosine, hypoxanthine, xanthine, uracil, guanosine, and adenosine;
biomarkers related to urea cycle and polyamine metabolism including N1-acetylspermidine, N8-acetylspermidine, spermine, arginine ornithine, and citrulline;
biomarkers related to amino acid metabolism including proline, glutamine, glutamic acid, threonine, and N.alpha.-acetyllysine, and
M264 (.beta.-D-Ribofuranosylcreatine), where an increase in the levels of two or more biomarkers identifies a subject as having or having a propensity to develop neoplasia.
In one embodiment, the groups are selected from the following:
biomarkers related to methylation comprising asymmetric-dimethylarginine and symmetric-dimethylarginine;
biomarkers related to nucleic acid metabolism comprising xanthosine, inosine, deoxyuridine, and thymidine;
biomarkers related to polyamine metabolism comprising N1-acetylspermidine, N8-acetylspermidine, and spermine; and
biomarkers related to amino acid metabolism comprising proline, glutamine, and N.alpha.-acetyllysine.
In one aspect, the invention features a method for identifying a subject as having or having a propensity to develop neoplasia, the method involving measuring the level of a combination of two or more biomarkers in a biological sample derived from the subject relative to the level present in a reference, where a first biomarker is selected from a first group and at least one additional marker is selected from a different group, where the groups are selected from among the following: biomarkers related to methylation; biomarkers related to nucleic acid metabolism; biomarkers related to urea cycle and polyamine metabolism; and biomarkers related to amino acid metabolism, and correlating the measurements of the level of the measured biomarkers with the subject having neoplasia or the subject having a propensity to develop neoplasia.
In one embodiment, the subject is identified as having or having a propensity to develop neoplasia when the level of a biomarker related to methylation is increased relative to a reference.
In yet another aspect, the invention features a method for identifying a subject as having or having a propensity to develop neoplasia, the method involving measuring the level of a combination of two or more biomarkers in a biological sample derived from the subject relative to the level present in a reference, where a first biomarker is selected from a first group and at least one additional marker is selected from a different group, where the groups are selected from among the following:
biomarkers related to methylation including asymmetric-dimethylarginine, symmetric-dimethylarginine, carnitine, methionine, dimethylglycine, and betaine;
biomarkers related to nucleic acid metabolism including xanthosine, inosine, deoxyuridine, thymidine, deoxycytidine, cytosine, hypoxanthine, xanthine, uracil, guanosine, and adenosine;
biomarkers related to urea cycle and polyamine metabolism including N1-acetylspermidine, N8-acetylspermidine, spermine, arginine ornithine, and citrulline;
biomarkers related to amino acid metabolism including proline, glutamine, glutamic acid, threonine, and N.alpha.-acetyllysine; and
M264 (.beta.-D-Ribofuranosylcreatine), and correlating the measurements of the level of the measured biomarkers with the subject having neoplasia or the subject having a propensity to develop neoplasia.
In one embodiment, the groups are selected from the following:
biomarkers related to methylation comprising asymmetric-dimethylarginine and symmetric-dimethylarginine;
biomarkers related to nucleic acid metabolism comprising xanthosine, inosine, deoxyuridine, and thymidine;
biomarkers related to polyamine metabolism comprising N1-acetylspermidine, N8-acetylspermidine, and spermine; and
biomarkers related to amino acid metabolism comprising proline, glutamine, and N.alpha.-acetyllysine.
In one embodiment, the subject is identified as having or having a propensity to develop neoplasia when the level of asymmetric-dimethylarginine, symmetric-dimethylarginine, carnitine, methionine, dimethylglycine, or betaine is increased relative to a reference.
In another embodiment, the subject is identified as having or having a propensity to develop neoplasia when the level of asymmetric-dimethylarginine and symmetric-dimethylarginine is increased relative to a reference.
In one aspect, the invention features a method for determining the prognosis of neoplasia in a subject, the method involving measuring the level of a combination of two or more biomarkers in a biological sample derived from the subject relative to the level present in a reference, where a first biomarker is selected from a first group and at least one additional marker is selected from a different group, where the groups are selected from among the following: biomarkers related to methylation; biomarkers related to nucleic acid metabolism; biomarkers related to urea cycle and polyamine metabolism; and biomarkers related to amino acid metabolism, and correlating the measurements of the level of the measured biomarkers with the prognosis of neoplasia in the subject.
In one embodiment, the subject is identified as having a reduced chance of survival when the level of a biomarker related to methylation is increased relative to a reference. In another embodiment, the subject is identified as having an increased chance of survival when the level of a biomarker related to methylation is decreased relative to a reference.
In another aspect, the invention features a method for determining the prognosis of neoplasia in a subject, the method involving measuring the level of a combination of two or more biomarkers in a biological sample derived from the subject relative to the level present in a reference, where a first biomarker is selected from a first group and at least one additional marker is selected from a different group, where the groups are selected from among the following:
biomarkers related to methylation including asymmetric-dimethylarginine, symmetric-dimethylarginine, carnitine, methionine, dimethylglycine, and betaine;
biomarkers related to nucleic acid metabolism including xanthosine, inosine, deoxyuridine, thymidine, deoxycytidine, cytosine, hypoxanthine, xanthine, uracil, guanosine, and adenosine;
biomarkers related to urea cycle and polyamine metabolism including N1-acetylspermidine, N8-acetylspermidine, spermine, arginine ornithine, and citrulline;
biomarkers related to amino acid metabolism including proline, glutamine, glutamic acid, threonine, and N.alpha.-acetyllysine, and
M264 (.beta.-D-Ribofuranosylcreatine), and correlating the measurements of the level of the measured biomarkers with the prognosis of neoplasia in the subject.
In one embodiment, the groups are selected from the following:
biomarkers related to methylation comprising asymmetric-dimethylarginine and symmetric-dimethylarginine;
biomarkers related to nucleic acid metabolism comprising xanthosine, inosine, deoxyuridine, and thymidine;
biomarkers related to polyamine metabolism comprising N1-acetylspermidine, N8-acetylspermidine, and spermine; and
biomarkers related to amino acid metabolism comprising proline, glutamine, and N.alpha.-acetyllysine.
In one embodiment, the subject is identified as having a reduced chance of survival when the level of asymmetric-dimethylarginine, symmetric-dimethylarginine, carnitine, methionine, dimethylglycine, or betaine is increased relative to a reference. In another embodiment, the subject is identified as having an increased chance of survival when the level of asymmetric-dimethylarginine, symmetric-dimethylarginine, carnitine, methionine, dimethylglycine, or betaine is decreased relative to a reference.
In one embodiment, the subject is identified as having a reduced chance of survival when the level of asymmetric-dimethylarginine and symmetric-dimethylarginine is increased relative to a reference. In another embodiment, the subject is identified as having an increased chance of survival when the level of asymmetric-dimethylarginine and symmetric-dimethylarginine is decreased relative to a reference.
In one aspect, the invention features a method for monitoring neoplasia therapy in a subject, the method involving measuring the level of a combination of two or more biomarkers in a biological sample derived from the subject relative to the level present in a reference, where a first biomarker is selected from a first group and at least one additional marker is selected from a different group, where the groups are selected from among the following: biomarkers related to methylation; biomarkers related to nucleic acid metabolism; biomarkers related to urea cycle and polyamine metabolism; and biomarkers related to amino acid metabolism, and correlating the measurements of the level of the measured biomarkers to thereby monitor neoplasia therapy in the subject.
In another aspect, the invention features a method for monitoring neoplasia therapy in a subject, the method involving measuring the level of a combination of two or more biomarkers in a biological sample derived from the subject relative to the level present in a reference, where a first biomarker is selected from a first group and at least one additional marker is selected from a different group, where the groups are selected from among the following:
biomarkers related to methylation including asymmetric-dimethylarginine, symmetric-dimethylarginine, carnitine, methionine, dimethylglycine, and betaine;
biomarkers related to nucleic acid metabolism including xanthosine, inosine, deoxyuridine, thymidine, deoxycytidine, cytosine, hypoxanthine, xanthine, uracil, guanosine, and adenosine;
biomarkers related to urea cycle and polyamine metabolism including N1-acetylspermidine, N8-acetylspermidine, spermine, arginine ornithine, and citrulline;
biomarkers related to amino acid metabolism including proline, glutamine, glutamic acid, threonine, and N.alpha.-acetyllysine; and
M264 (.beta.-D-Ribofuranosylcreatine), and correlating the measurements of the level of the measured biomarkers to thereby monitor neoplasia therapy in the subject.
In one embodiment, the groups are selected from the following:
biomarkers related to methylation comprising asymmetric-dimethylarginine and symmetric-dimethylarginine;
biomarkers related to nucleic acid metabolism comprising xanthosine, inosine, deoxyuridine, and thymidine;
biomarkers related to polyamine metabolism comprising N1-acetylspermidine, N8-acetylspermidine, and spermine; and
biomarkers related to amino acid metabolism comprising proline, glutamine, and N.alpha.-acetyllysine.
In one embodiment, a therapy that reduces the level of asymmetric-dimethylarginine, symmetric-dimethylarginine, carnitine, methionine, dimethylglycine, or betaine is identified as effective.
In another embodiment, a therapy that reduces the level of asymmetric-dimethylarginine and symmetric-dimethylarginine relative to a reference is identified as effective.
In one aspect, the invention features a method for characterizing the aggressiveness of a neoplasia in a subject, the method involving measuring the level of a combination of two or more biomarkers in a biological sample derived from the subject relative to the level present in a reference, where a first biomarker is selected from a first group and at least one additional marker is selected from a different group, where the groups are selected from among the following: biomarkers related to methylation; biomarkers related to nucleic acid metabolism; biomarkers related to urea cycle and polyamine metabolism; and biomarkers related to amino acid metabolism, and correlating the measurements of the level of the measured biomarkers to thereby characterize the aggressiveness of the neoplasia in the subject, where an increased level of a biomarker related to methylation relative to a reference, identifies the neoplasia as aggressive, and a decreased level of a biomarker related to methylation relative to a reference identifies the neoplasia as less aggressive.
In another aspect, the invention features a method for characterizing the aggressiveness of a neoplasia in a subject, the method involving measuring the level of a combination of two or more biomarkers in a biological sample derived from the subject relative to the level present in a reference, where a first biomarker is selected from a first group and at least one additional marker is selected from a different group, where the groups are selected from among the following:
biomarkers related to methylation including asymmetric-dimethylarginine, symmetric-dimethylarginine, carnitine, methionine, dimethylglycine, and betaine;
biomarkers related to nucleic acid metabolism including xanthosine, inosine, deoxyuridine, thymidine, deoxycytidine, cytosine, hypoxanthine, xanthine, uracil, guanosine, and adenosine;
biomarkers related to urea cycle and polyamine metabolism including N1-acetylspermidine, N8-acetylspermidine, spermine, arginine ornithine, and citrulline;
biomarkers related to amino acid metabolism including proline, glutamine, glutamic acid, threonine, and N.alpha.-acetyllysine; and
M264 (.beta.-D-Ribofuranosylcreatine), and correlating the measurements of the level of the measured biomarkers to thereby characterize the aggressiveness of the neoplasia in the subject, where an increased level of asymmetric-dimethylarginine and symmetric-dimethylarginine relative to a reference, identifies the neoplasia as aggressive, and a decreased level of asymmetric-dimethylarginine and symmetric-dimethylarginine relative to a reference identifies the neoplasia as less aggressive.
In one embodiment, an increased level of asymmetric-dimethylarginine, symmetric-dimethylarginine, carnitine, methionine, dimethylglycine, and betaine relative to a reference, identifies the neoplasia as aggressive, and a decreased level of asymmetric-dimethylarginine, symmetric-dimethylarginine, carnitine, methionine, dimethylglycine, and betaine relative to a reference identifies the neoplasia as less aggressive.
In one embodiment, the groups are selected from the following:
biomarkers related to methylation comprising asymmetric-dimethylarginine and symmetric-dimethylarginine;
biomarkers related to nucleic acid metabolism comprising xanthosine, inosine, deoxyuridine, and thymidine;
biomarkers related to polyamine metabolism comprising N1-acetylspermidine, N8-acetylspermidine, and spermine; and
biomarkers related to amino acid metabolism comprising proline, glutamine, and N.alpha.-acetyllysine.
In one aspect, the invention features a method for identifying a subject as having or having a propensity to develop colorectal cancer, the method involving measuring the level of a combination of two or more biomarkers in a biological sample derived from the subject relative to the level present in a reference, where at least one biomarker is selected from the group of biomarkers related to methylation and at least one additional marker is selected from a group from among the following: biomarkers related to nucleic acid metabolism; biomarkers related to urea cycle and polyamine metabolism; and biomarkers related to amino acid metabolism, and correlating the measurements of the level of the measured biomarkers with the subject having neoplasia or the subject having a propensity to develop neoplasia,
where the subject is identified as having or having a propensity to develop neoplasia when the level of a biomarker related to methylation is increased relative to a reference.
In another aspect, the invention features a method for identifying a subject as having or having a propensity to develop colorectal cancer, the method involving measuring the level of a combination of two or more biomarkers in a biological sample derived from the subject relative to the level present in a reference, where at least one biomarker is selected from the group of biomarkers related to methylation including asymmetric-dimethylarginine, symmetric-dimethylarginine, carnitine, methionine, dimethylglycine, and betaine and at least one additional marker is selected from a group from among the following:
biomarkers related to nucleic acid metabolism including xanthosine, inosine, deoxyuridine, thymidine, deoxycytidine, cytosine, hypoxanthine, xanthine, uracil, guanosine, and adenosine;
biomarkers related to urea cycle and polyamine metabolism including N1-acetylspermidine, N8-acetylspermidine, spermine, arginine ornithine, and citrulline;
biomarkers related to amino acid metabolism including proline, glutamine, glutamic acid, threonine, and N.alpha.-acetyllysine; and
M264 (.beta.-D-Ribofuranosylcreatine), and correlating the measurements of the level of the measured biomarkers with the subject having neoplasia or the subject having a propensity to develop neoplasia, where the subject is identified as having or having a propensity to develop neoplasia when the level of asymmetric-dimethylarginine and symmetric-dimethylarginine is increased relative to a reference.
In one embodiment, the groups are selected from the following:
biomarkers related to methylation comprising asymmetric-dimethylarginine and symmetric-dimethylarginine;
biomarkers related to nucleic acid metabolism comprising xanthosine, inosine, deoxyuridine, and thymidine;
biomarkers related to polyamine metabolism comprising N1-acetylspermidine, N8-acetylspermidine, and spermine; and
biomarkers related to amino acid metabolism comprising proline, glutamine, and N.alpha.-acetyllysine.
In one embodiment of any one of the above aspects, the methods feature measuring the level of M264 (.beta.-D-ribofuranosylcreatine). In another embodiment of any one of the above aspects, the methods feature measuring the level of M264 (f-D-ribofuranosylcreatine) in addition to any one or more of the claimed biomarkers.
In one aspect, the invention features a kit for aiding the diagnosis of neoplasia or colorectal cancer, the kit including at least one reagent capable of detecting, binding, or capturing a first biomarker selected from a first group and at least one reagent capable of detecting, binding, or capturing at least one additional marker selected from a different group, where the groups are selected from among the following: biomarkers related to methylation; biomarkers related to nucleic acid metabolism; biomarkers related to urea cycle and polyamine metabolism; and biomarkers related to amino acid metabolism.
In another aspect, the invention features a kit for aiding the diagnosis of neoplasia or colorectal cancer, the kit including at least one reagent capable of detecting, binding, or capturing a first biomarker selected from a first group and at least one reagent capable of detecting, binding, or capturing at least one additional marker selected from a different group or M264, where the groups are selected from among the following:
biomarkers related to methylation including asymmetric-dimethylarginine, symmetric-dimethylarginine, carnitine, methionine, dimethylglycine, and betaine;
biomarkers related to nucleic acid metabolism including xanthosine, inosine, deoxyuridine, thymidine, deoxycytidine, cytosine, hypoxanthine, xanthine, uracil, guanosine, and adenosine;
biomarkers related to urea cycle and polyamine metabolism including N1-acetylspermidine, N8-acetylspermidine, spermine, arginine ornithine, and citrulline;
biomarkers related to amino acid metabolism including proline, glutamine, glutamic acid, threonine, and N.alpha.-acetyllysine; and
M264 (.beta.-D-Ribofuranosylcreatine).
In one embodiment, the groups are selected from the following:
biomarkers related to methylation comprising asymmetric-dimethylarginine and symmetric-dimethylarginine;
biomarkers related to nucleic acid metabolism comprising xanthosine, inosine, deoxyuridine, and thymidine;
biomarkers related to polyamine metabolism comprising N1-acetylspermidine, N8-acetylspermidine, and spermine; and
biomarkers related to amino acid metabolism comprising proline, glutamine, and N.alpha.-acetyllysine.
In one aspect, the invention features a kit for aiding the diagnosis of neoplasia or colorectal cancer, the kit including at least one reagent capable of detecting, binding, or capturing at least one biomarker selected from the group of biomarkers related to methylation and at least one reagent capable of detecting, binding, or capturing at least one additional marker selected from a group from among the following: biomarkers related to nucleic acid metabolism; biomarkers related to urea cycle and polyamine metabolism; biomarkers related to amino acid metabolism.
In another aspect, the invention features a kit for aiding the diagnosis of neoplasia or colorectal cancer, the kit including at least one reagent capable of detecting, binding, or capturing at least one biomarker selected from the group of biomarkers related to methylation including asymmetric-dimethylarginine, symmetric-dimethylarginine, carnitine, methionine, dimethylglycine, and betaine and at least one reagent capable of detecting, binding, or capturing at least one additional marker selected from a group from among the following:
biomarkers related to nucleic acid metabolism including xanthosine, inosine, deoxyuridine, thymidine, deoxycytidine, cytosine, hypoxanthine, xanthine, uracil, guanosine, and adenosine;
biomarkers related to urea cycle and polyamine metabolism including N1-acetylspermidine, N8-acetylspermidine, spermine, arginine omithine, and citrulline;
biomarkers related to amino acid metabolism including proline, glutamine, glutamic acid, threonine, and N.alpha.-acetyllysine; and
M264 (.beta.-D-Ribofuranosylcreatine).
In one embodiment, the groups are selected from the following:
biomarkers related to methylation comprising asymmetric-dimethylarginine and symmetric-dimethylarginine;
biomarkers related to nucleic acid metabolism comprising xanthosine, inosine, deoxyuridine, and thymidine;
biomarkers related to polyamine metabolism comprising N1-acetylspermidine, N8-acetylspermidine, and spermine; and
biomarkers related to amino acid metabolism comprising proline, glutamine, and N.alpha.-acetyllysine.
In another aspect, the invention features a kit for aiding the diagnosis of neoplasia or colorectal cancer, the kit containing at least one reagent capable of detecting, binding, or capturing asymmetric-dimethylarginine and at least one reagent capable of detecting, binding, or capturing symmetric-dimethylarginine.
In another embodiment, the kit further contains at least one reagent capable of detecting, binding or capturing carnitine, methionine, dimethylglycine, and betaine.
In another embodiment, the kit further contains at least one reagent capable of detecting the M264 biomarker.
In one embodiment, the kit further contains at least one reagent capable of detecting, binding, or capturing proline, glutamine, glutamic acid, threonine, N.alpha.-acetyllysine, xanthosine, inosine, deoxyuridine, thymidine, deoxycytidine, cytosine, hypoxanthine, xanthine, uracil, guanosine, adenosine, N1-acetylspermidine, N8-acetylspermidine, spermine, arginine ornithine, citrulline, and M264 (.beta.-D-Ribofuranosylcreatine), or a combination of reagents thereof.
In another embodiment, the kit further contains directions for using the reagent to analyze the level of asymmetric-dimethylarginine, symmetric-dimethylarginine, carnitine, methionine, dimethylglycine, betaine, xanthosine, inosine, deoxyuridine, thymidine, deoxycytidine, cytosine, hypoxanthine, xanthine, uracil, guanosine, adenosine, N1-acetylspermidine, N8-acetylspermidine, spermine, arginine ornithine, citrulline, proline, glutamine, glutamic acid, threonine, and N.alpha.-acetyllysine, M264 (.beta.-D-Ribofuranosylcreatine), or a combination thereof.
In another embodiment, the kit further contains directions for contacting a test sample with the reagent and detecting asymmetric-dimethylarginine, symmetric-dimethylarginine, carnitine, methionine, dimethylglycine, betaine, xanthosine, inosine, deoxyuridine, thymidine, deoxycytidine, cytosine, hypoxanthine, xanthine, uracil, guanosine, adenosine, N1-acetylspermidine, N8-acetylspermidine, spermine, arginine ornithine, citrulline, proline, glutamine, glutamic acid, threonine, and N.alpha.-acetyllysine, M264 (.beta.-D-Ribofuranosylcreatine), or a combination thereof retained by the reagent.
In another aspect, the invention features a panel for aiding the diagnosis of neoplasia or colorectal cancer, the panel including at least one reagent capable of detecting, binding, or capturing at least one biomarker selected from the group of biomarkers related to methylation; biomarkers related to nucleic acid metabolism; biomarkers related to urea cycle and polyamine metabolism; and biomarkers related to amino acid metabolism.
In yet another aspect, the invention provides a panel for aiding the diagnosis of neoplasia or colorectal cancer, the panel containing at least one reagent capable of detecting, binding, or capturing a first biomarker selected from a first group and at least one reagent capable of detecting, binding, or capturing at least one additional marker selected from a different group, where the groups are selected from among the following:
biomarkers related to methylation including asymmetric-dimethylarginine, symmetric-dimethylarginine, carnitine, methionine, dimethylglycine, and betaine;
biomarkers related to nucleic acid metabolism including xanthosine, inosine, deoxyuridine, thymidine, deoxycytidine, cytosine, hypoxanthine, xanthine, uracil, guanosine, and adenosine;
biomarkers related to urea cycle and polyamine metabolism including N1-acetylspermidine, N8-acetylspermidine, spermine, arginine ornithine, and citrulline;
biomarkers related to amino acid metabolism including proline, glutamine, glutamic acid, threonine, and N.alpha.-acetyllysine; and
M264 (.beta.-D-Ribofuranosylcreatine).
In one embodiment, the groups are selected from the following:
biomarkers related to methylation comprising asymmetric-dimethylarginine and symmetric-dimethylarginine;
biomarkers related to nucleic acid metabolism comprising xanthosine, inosine, deoxyuridine, and thymidine;
biomarkers related to polyamine metabolism comprising N1-acetylspermidine, N8-acetylspermidine, and spermine; and
biomarkers related to amino acid metabolism comprising proline, glutamine, and N.alpha.-acetyllysine.
In another aspect, the invention features a panel for aiding the diagnosis of neoplasia or colorectal cancer, the panel including at least one reagent capable of detecting, binding, or capturing at least one biomarker selected from the group of biomarkers related to methylation including asymmetric-dimethylarginine, symmetric-dimethylarginine, carnitine, methionine, dimethylglycine, and betaine and at least one reagent capable of detecting, binding, or capturing at least one additional marker selected from a group from among the following:
biomarkers related to nucleic acid metabolism including xanthosine, inosine, deoxyuridine, thymidine, deoxycytidine, cytosine, hypoxanthine, xanthine, uracil, guanosine, and adenosine;
biomarkers related to urea cycle and polyamine metabolism including N1-acetylspermidine, N8-acetylspermidine, spermine, arginine ornithine, and citrulline;
biomarkers related to amino acid metabolism including proline, glutamine, glutamic acid, threonine, and N.alpha.-acetyllysine; and
M264 (.beta.-D-Ribofuranosylcreatine).
In one embodiment, the groups are selected from the following:
biomarkers related to methylation comprising asymmetric-dimethylarginine and symmetric-dimethylarginine;
biomarkers related to nucleic acid metabolism comprising xanthosine, inosine, deoxyuridine, and thymidine;
biomarkers related to polyamine metabolism comprising N1-acetylspermidine, N8-acetylspermidine, and spermine; and
biomarkers related to amino acid metabolism comprising proline, glutamine, and N.alpha.-acetyllysine.
In another aspect, the invention features a panel for aiding the diagnosis of neoplasia or colorectal cancer, the panel including at least one reagent capable of detecting, binding, or capturing asymmetric-dimethylarginine and at least one reagent capable of detecting or capturing symmetric-dimethylarginine. In one embodiment, the reagent is one or more of an organic molecule, peptide, peptide mimetic, polypeptide, nucleic acid ligand, aptamer, or antibody.
In another embodiment, the panel further contains at least one reagent capable of detecting, capturing, or binding carnitine, methionine, dimethylglycine, betaine, xanthosine, inosine, deoxyuridine, thymidine, deoxycytidine, cytosine, hypoxanthine, xanthine, uracil, guanosine, and adenosine, N1-acetylspermidine, N8-acetylspermidine, spermine, arginine ornithine, and citrulline, proline, glutamine, glutamic acid, threonine, N.alpha.-acetyllysine and M264 (.beta.-D-Ribofuranosylcreatine), or a combination of reagents thereof.
In various embodiments of any of the above aspects or any other aspect of the invention delineated herein, the invention further provides measuring the level of biomarkers in one or more groups including one or more of biomarkers related to methylation; biomarkers related to polyamine metabolism; and biomarkers related to amino acid metabolism. In various embodiments of the above aspects, an increase in the level of biomarkers in one or more of the groups identifies a subject as having or having a propensity to develop neoplasia; identifies a subject as having a reduced chance of survival; or identifies a neoplasia as aggressive. In other embodiments, a decrease in the level of biomarkers in one or more of the groups identifies a subject as having an increased chance of survival; identifies a therapy as effective; or identifies a neoplasia as less aggressive. In other embodiments, the biological sample is a biological fluid (e.g., urine, blood, blood serum, plasma, bile, fecal aspirate, intestinal aspirate, cerebrospinal fluid and saliva) or tissue sample. In various embodiments of the above aspects, the method further involves measuring the level of carnitine in the biological sample. In other embodiments a decrease in the level of carnitine in a biological sample that is a biological fluid identifies a subject as having or having a propensity to develop neoplasia; identifies a subject as having a reduced chance of survival; or identifies a neoplasia as aggressive. In still other embodiments, an increase in the level of carnitine in a biological sample that is a biological fluid identifies a subject as having an increased chance of survival; identifies a therapy as effective; or identifies a neoplasia as less aggressive.
In other embodiments, an increase in the level of carnitine in a biological sample that is a tissue sample identifies a subject as having or having a propensity to develop neoplasia; identifies a subject as having a reduced chance of survival; or identifies a neoplasia as aggressive. In still other embodiments, a decrease in the level of carnitine in a biological sample that is a tissue sample identifies a subject as having an increased chance of survival; identifies a therapy as effective; or identifies a neoplasia as less aggressive.
In various embodiments of the above aspects, the neoplasia is colorectal cancer, small intestine cancer, duodenal cancer, gastric cancer, pancreatic cancer, liver cancer, esophageal cancer, ovarian cancer, prostate cancer, uterine cancer, breast cancer, thyroid cancer or melanoma. In other embodiments, the neoplasia contains a mutation in APC or a Wnt signaling pathway protein. In still other embodiments of the above aspects, the method further involves detecting a mutation in APC or a Wnt signaling pathway protein. In other embodiments, the level of the biomarker is increased 1.5, 2, 2.5, 3, 3.5, 4, 5, 6, 7, 8, 9, 10, 11, 12, 13, 14, 15-fold or more relative to the reference. In still other embodiments, the reference is a control or a corresponding biological sample derived from a healthy subject. In still other embodiments, the level of the biomarker is normalized to the level of creatinine in the sample, absolute concentration, 24-hr excretion, or with respect to specific gravity. In still other embodiments, the subject is human. In still other embodiments, the level is detected by chromatography, mass spectrometry, spectroscopy, immunoassay, ultra performance liquid chromatography (UPLC). In other embodiments, the mass spectrometry is electrospray ionization quadruple time-of-flight mass spectrometry (ESI-QTF-MS). In other embodiments, spectroscopy is NMR spectroscopy. In other embodiments, the immunoassay is ELISA. In still other embodiments, the method further involves measuring the level of biomarkers in one or more groups from among biomarkers related to methylation; biomarkers related to polyamine metabolism; and biomarkers related to amino acid metabolism. In other embodiments, an increase in the level of biomarkers in one or more of the groups identifies a subject as having or having a propensity to develop neoplasia; identifies a subject as having a reduced chance of survival; or identifies a neoplasia as aggressive. In still other embodiments, an increase in the level of biomarkers in one or more of the groups identifies a subject as having an increased chance of survival; identifies a therapy as effective; or identifies a neoplasia as less aggressive.
The invention provides compositions and methods for diagnosing, treating or preventing neoplasia (e.g., colorectal cancer). Other features and advantages of the invention will be apparent from the detailed description, and from the claims.
Definitions
Unless defined otherwise, all technical and scientific terms used herein have the meaning commonly understood by a person skilled in the art to which this invention belongs. The following references provide one of skill with a general definition of many of the terms used in this invention: Singleton et al., Dictionary of Microbiology and Molecular Biology (2nd ed. 1994); The Cambridge Dictionary of Science and Technology (Walker ed., 1988); The Glossary of Genetics, 5th Ed., R. Rieger et al. (eds.), Springer Verlag (1991); and Hale & Marham, The Harper Collins Dictionary of Biology (1991). As used herein, the following terms have the meanings ascribed to them below, unless specified otherwise.
As used herein, the term "biomarker" generally refers to a molecule that is differentially present in a sample (e.g., biopsy, biological or physiological fluid) taken from a subject of one phenotypic status (e.g., having a disease) as compared with another phenotypic status (e.g., not having the disease). A biomarker is differentially present between different phenotypic statuses if the mean or median level of the biomarker in a first phenotypic status relative to a second phenotypic status is calculated to represent statistically significant differences. Common tests for statistical significance include, among others, t-test, ANOVA, Kruskal-Wallis, Wilcoxon, Mann-Whitney and odds ratio. Biomarkers, alone or in combination, provide measures of relative likelihood that a subject belongs to a phenotypic status of interest. As such, biomarkers can find use as markers for, for example, disease (diagnostics), therapeutic effectiveness of a drug (theranostics), and of drug toxicity.
As used herein, the term "biomarker related to methylation" refers to metabolic intermediates and products related to increased methylation (e.g., protein methylation, DNA methylation) in a subject or a tissue or a cell of the subject (e.g., a neoplastic tissue or cell). In various embodiments, the biomarker related to methylation is a small molecule compound. In various embodiments, the biomarker related to methylation is present in a sample derived from the subject (e.g., a biological or physiological fluid). In particular embodiments, an alteration in the levels of one or more biomarkers related to methylation, relative to a reference, indicates a tissue or cell is neoplastic. In specific embodiments, an alteration in the levels of one or more biomarkers related to methylation, relative to a reference, indicates a subject has or is at risk of having neoplasia. Exemplary biomarkers related to methylation include without limitation: asymmetric-dimethylarginine; symmetric-dimethylarginine; carnitine; N-monomethylarginine (CAS: 17035-90-4); N(6)-methyllysine (CAS: 1188-07-4); N6,N6 dimethyllysine (CAS: 2259-86-1, CID: 4478779, InChlKey: XXEWFEBMSGLYBY-UHFFFAOYSA-N); N6,N6,N6 trimethyllysine (CAS: 19253-88-4); Sarcosine (CAS: 107-97-1); Betaine (CAS: 107-43-7); Dimethylglycine (CAS: 1118-68-9); 1-methylhistidine (CAS: 332-80-9); 3-methylhistidine (CAS: 368-16-1); Trigonelline (CAS: 535-83-1); N-methylnicotinamide (CAS: 114-33-0); 1-methylnicotinamide (CAS: 3106-60-3); 6-methylnicotinamide (CAS: 6960-22-1); Methionine (CAS: 63-68-3); homocysteine (CAS: 454-29-5); S-adenosylhomocysteine (CAS: 979-92-0); S-adenosylmethionine (CAS: 29908-03-0); Trimethylammonioacetate (InChlKey: KWIUHFFTVRNATP-UHFFFAOYSA-O); Trimethylamine (CAS: 75-50-3); Trimethylamine N-oxide (CAS: 1184-78-7); Dimethylamine (CAS: 124-40-3); N-Formyl-L-methionine (CAS: 4289-98-9); Folic acid (CAS: 59-30-3); Tetrahydrofolic acid (CAS: 135-16-0); choline (CAS: 62-49-7); phosphorylcholine (CAS: 3616-04-4); glycerophosphocholine (CAS: 28319-77-9); acetylcarnitine (CAS: 3040-38-8); propionylcarnitine (CAS: 17298-37-2); butyrylcarnitine (CAS: 25576-40-3); and isobutyrylcarnitine (CAS: 25518-49-4); including pharmaceutically acceptable salts, solvates, hydrates, geometrical isomers, tautomers, optical isomers, isotopic derivatives, polymorphs, prodrugs, and N-oxides thereof. In certain exemplary embodiments, biomarkers related to methylation include asymmetric-dimethylarginine, symmetric-dimethylarginine, carnitine, methionine, dimethylglycine, and betaine.
As used herein, the term "biomarker related to nucleic acid metabolism" refers to metabolic intermediates and products related to increased nucleic acid metabolism in a subject or a tissue or a cell of the subject (e.g., a neoplastic tissue or cell). In various embodiments, the biomarker related to nucleic acid metabolism is a small molecule compound. In various embodiments, the biomarker related to nucleic acid metabolism is present in a sample derived from the subject (e.g., a biological or physiological fluid). In particular embodiments, an alteration in the levels of one or more biomarkers related to nucleic acid metabolism, relative to a reference, indicates a tissue or cell is neoplastic. In specific embodiments, an alteration in the levels of one or more biomarkers related to nucleic acid metabolism, relative to a reference, indicates a subject has or is at risk of having neoplasia. Exemplary biomarkers related to nucleic acid metabolism include without limitation: xanthosine (CAS: 146-80-5); inosine (CAS: 58-63-9); deoxyuridine (CAS: 951-78-0); thymidine (CAS: 50-89-5); Uric acid (CAS: 69-93-2); S-allantoin (CAS: 97-59-6); Xanthine (CAS: 69-89-6); Hypoxanthine (CAS: 68-94-0); Guanine (CAS: 73-40-5); Guanosine (CAS: 118-00-3); Deoxyguanosine (CAS: 961-07-9); Adenine (CAS: 73-24-5); Adenosine (CAS: 58-61-7); Deoxyadenosine (CAS: 958-09-8); FAPy-adenine (CAS: 5122-36-1); 1-Methyladenine (CAS: 5142-22-3); Deoxyonosine (CAS: 890-38-0); uracil (CAS: 66-22-8); uridine (CAS: 58-96-8); dihydrouracil (CAS: 504-07-4); dihydrouridine (CAS: 5627-05-4); Orotic acid (CAS: 65-86-1); Thymine (CAS: 65-71-4); dihydrothymine (CAS: 696-04-8); Ureidopropionic acid (CAS: 462-88-4); beta-Alanine (CAS: 107-95-9); Ureidoisobutyric acid (CAS: 2905-86-4); 4,5-Dihydroorotic acid (CAS: 155-54-4); 5-Methylcytidine (CAS: 2140-61-6); 5-Methyldeoxycytidine (CAS: 838-07-3); Carbamoylphosphate (CAS: 590-55-6); and 5-Hydroxymethyluracil (CAS: 4433-40-3); including pharmaceutically acceptable salts, solvates, hydrates, geometrical isomers, tautomers, optical isomers, isotopic derivatives, polymorphs, prodrugs, and N-oxides thereof. In certain exemplary embodiments, biomarkers related to nucleic acid metabolism include xanthosine, inosine, deoxyuridine, thymidine, deoxycytidine, cytosine, hypoxanthine, xanthine, uracil, guanosine, and adenosine.
As used herein, the term "biomarker related to urea cycle and polyamine metabolism" refers to metabolic intermediates and products related to increased polyamine metabolism in a subject or a tissue or a cell of the subject (e.g., a neoplastic tissue or cell). In various embodiments, the biomarker related to polyamine metabolism is a small molecule compound. In various embodiments, the biomarker related to polyamine metabolism is present in a sample derived from the subject (e.g., a biological or physiological fluid). In particular embodiments, an alteration in the levels of one or more biomarkers related to polyamine metabolism, relative to a reference, indicates a tissue or cell is neoplastic. In specific embodiments, an alteration in the levels of one or more biomarkers related to polyamine metabolism, relative to a reference, indicates a subject has or is at risk of having neoplasia. Exemplary biomarkers related to urea cycle and polyamine metabolism include without limitation: N1-acetylspermidine (CAS: 14278-49-0); N8-acetylspermidine (CAS: 34450-15-2); spermine (CAS: 71-44-3); Putrescine (CAS: 110-60-1); spermidine (CAS: 124-20-9); ornithine (CAS: 70-26-8); Citrulline (CAS: 372-75-8); L-arginine (CAS: 74-79-3); N-acetylputrescine (CAS: 124-20-9); N1-acetylspermine (CAS: 25593-72-0); and L-argininosuccinic acid (CAS: 2387-71-5) including pharmaceutically acceptable salts, solvates, hydrates, geometrical isomers, tautomers, optical isomers, isotopic derivatives, polymorphs, prodrugs, and N-oxides thereof. In certain exemplary embodiments, biomarkers related to polyamine metabolism include biomarkers related to urea cycle and polyamine metabolism including N1-acetylspermidine, N8-acetylspermidine, spermine, arginine ornithine, and citrulline.
As used herein, the term "biomarker related to amino acid metabolism" refers to metabolic intermediates and products related to increased amino acid metabolism in a subject or a tissue or a cell of the subject (e.g., a neoplastic tissue or cell). In various embodiments, the biomarker related to amino acid metabolism is a small molecule compound. In various embodiments, the biomarker related to amino acid metabolism is present in a sample derived from the subject (e.g., a biological or physiological fluid). In particular embodiments, an alteration in the levels of one or more biomarkers related to amino acid metabolism, relative to a reference, indicates a tissue or cell is neoplastic. In specific embodiments, an alteration in the levels of one or more biomarkers related to amino acid metabolism, relative to a reference, indicates a subject has or is at risk of having neoplasia. Exemplary biomarkers related to amino acid metabolism include without limitation: proline (CAS: 609-36-9 or 147-85-3); glutamine (CAS: 56-85-9); N.alpha.-acetyllysine (CAS: 1946-82-3); Serine (CAS: 56-45-1); Threonine (CAS: 72-19-5); glycine (CAS: 56-40-6); asparagine (CAS: 70-47-3); aspartic acid (CAS: 56-84-8); glutamic acid (CAS: 56-86-0); 4-hydroxyproline (CAS: 30724-02-8); 2-ketoglutaric acid (CAS: 18465-19-5); 2-hydroxyglutaric acid (CAS: 2889-31-8); Oxaloacetic acid (CAS: 328-42-7); Fumaric acid (CAS: 110-17-8); Lysine (CAS: 923-27-3); Creatine (CAS: 57-00-1); Creatinine (CAS: 60-27-5); Phoshocreatine (CAS: 67-07-2); Guanidinoacetic acid (CAS: 352-97-6); and N(6)-Methyllysine (CAS: 1188-07-4); including pharmaceutically acceptable salts, solvates, hydrates, geometrical isomers, tautomers, optical isomers, isotopic derivatives, polymorphs, prodrugs, and N-oxides thereof. In certain exemplary embodiments, biomarkers related to amino acid metabolism include proline, glutamine, glutamic acid, threonine, and N.alpha.-acetyllysine.
As used herein, the term "asymmetric-dimethylarginine (ADMA)" refers to a compound having the CAS number 102783-24-4, including a pharmaceutically acceptable salt, solvate, hydrate, geometrical isomer, tautomer, optical isomer, isotopic derivative, polymorph, prodrug, or N-oxide thereof. An increase in asymmetric-dimethylarginine in a biological sample is related to an increase in methylation (e.g. protein methylation, DNA methylation) in a subject or a tissue or a cell of the subject (e.g., a neoplastic tissue or cell).
As used herein, the term "symmetric-dimethylarginine (SDMA)" refers to a compound having the CAS number 30344-00-4, including a pharmaceutically acceptable salt, solvate, hydrate, geometrical isomer, tautomer, optical isomer, isotopic derivative, polymorph, prodrug, or N-oxide thereof. An increase in symmetric-dimethylarginine in a biological sample is related to an increase in methylation (e.g. protein methylation, DNA methylation) in a subject or a tissue or a cell of the subject (e.g., a neoplastic tissue or cell).
As used herein, the term "carnitine" refers to a compound having the CAS number 541-15-1, including a pharmaceutically acceptable salt, solvate, hydrate, geometrical isomer, tautomer, optical isomer, isotopic derivative, polymorph, prodrug, or N-oxide thereof. A decrease in carnitine in a biological fluid sample is related to an increase in methylation (e.g. protein methylation, DNA methylation) in a subject or a tissue or a cell of the subject (e.g., a neoplastic tissue or cell). A decrease in carnitine in a biological tissue sample is related to an increase in methylation in a subject or a tissue or a cell of the subject (e.g., a neoplastic tissue or cell).
As used herein, the term "methionine" refers to a compound having the CAS number 63-68-3, including a pharmaceutically acceptable salt, solvate, hydrate, geometrical isomer, tautomer, optical isomer, isotopic derivative, polymorph, prodrug, or N-oxide thereof. An increase in methionine in a biological sample is related to an increase in nucleic acid metabolism in a subject or a tissue or a cell of the subject (e.g., a neoplastic tissue or cell).
As used herein, the term "dimethylglycine" refers to a compound having the CAS number 1118-68-9, including a pharmaceutically acceptable salt, solvate, hydrate, geometrical isomer, tautomer, optical isomer, isotopic derivative, polymorph, prodrug, or N-oxide thereof. An increase in dimethylglycine in a biological sample is related to an increase in nucleic acid metabolism in a subject or a tissue or a cell of the subject (e.g., a neoplastic tissue or cell).
As used herein, the term "betaine` refers to a compound having the CAS number 107-43-7, including a pharmaceutically acceptable salt, solvate, hydrate, geometrical isomer, tautomer, optical isomer, isotopic derivative, polymorph, prodrug, or N-oxide thereof. An increase in betaine in a biological sample is related to an increase in nucleic acid metabolism in a subject or a tissue or a cell of the subject (e.g., a neoplastic tissue or cell).
As used herein, the term "xanthosine" refers to a compound having the CAS number 146-80-5, including a pharmaceutically acceptable salt, solvate, hydrate, geometrical isomer, tautomer, optical isomer, isotopic derivative, polymorph, prodrug, or N-oxide thereof. An increase in xanthosine in a biological sample is related to an increase in nucleic acid metabolism in a subject or a tissue or a cell of the subject (e.g., a neoplastic tissue or cell).
As used herein, the term "inosine" refers to a compound having the CAS number 58-63-9, including a pharmaceutically acceptable salt, solvate, hydrate, geometrical isomer, tautomer, optical isomer, isotopic derivative, polymorph, prodrug, or N-oxide thereof. An increase in inosine in a biological sample is related to an increase in nucleic acid metabolism in a subject or a tissue or a cell of the subject (e.g., a neoplastic tissue or cell).
As used herein, the term "deoxyuridine" refers to a compound having the CAS number 951-78-0, including a pharmaceutically acceptable salt, solvate, hydrate, geometrical isomer, tautomer, optical isomer, isotopic derivative, polymorph, prodrug, or N-oxide thereof. An increase in deoxyuridine in a biological sample is related to an increase in nucleic acid metabolism in a subject or a tissue or a cell of the subject (e.g., a neoplastic tissue or cell).
As used herein, the term "thymidine" refers to a compound having the CAS number 50-89-5, including a pharmaceutically acceptable salt, solvate, hydrate, geometrical isomer, tautomer, optical isomer, isotopic derivative, polymorph, prodrug, or N-oxide thereof. An increase in thymidine in a biological sample is related to an increase in nucleic acid metabolism in a subject or a tissue or a cell of the subject (e.g., a neoplastic tissue or cell).
As used herein, the term "deoxycytidine" refers to a compound having the CAS number 951-77-9, including a pharmaceutically acceptable salt, solvate, hydrate, geometrical isomer, tautomer, optical isomer, isotopic derivative, polymorph, prodrug, or N-oxide thereof. An increase in deoxycytidine in a biological sample is related to an increase in nucleic acid metabolism in a subject or a tissue or a cell of the subject (e.g., a neoplastic tissue or cell).
As used herein, the term "cytosine" refers to a compound having the CAS number 71-30-7, including a pharmaceutically acceptable salt, solvate, hydrate, geometrical isomer, tautomer, optical isomer, isotopic derivative, polymorph, prodrug, or N-oxide thereof. An increase in cytosine in a biological sample is related to an increase in nucleic acid metabolism in a subject or a tissue or a cell of the subject (e.g., a neoplastic tissue or cell).
As used herein, the term "hypoxanthine" refers to a compound having the CAS number CAS: 68-94-0, including a pharmaceutically acceptable salt, solvate, hydrate, geometrical isomer, tautomer, optical isomer, isotopic derivative, polymorph, prodrug, or N-oxide thereof. An increase in hypoxanthine in a biological sample is related to an increase in nucleic acid metabolism in a subject or a tissue or a cell of the subject (e.g., a neoplastic tissue or cell).
As used herein, the term "xanthine" refers to a compound having the CAS number CAS: 69-89-6, including a pharmaceutically acceptable salt, solvate, hydrate, geometrical isomer, tautomer, optical isomer, isotopic derivative, polymorph, prodrug, or N-oxide thereof. An increase in xanthine in a biological sample is related to an increase in nucleic acid metabolism in a subject or a tissue or a cell of the subject (e.g., a neoplastic tissue or cell).
As used herein, the term "uracil" refers to a compound having the CAS number CAS: 66-22-8, including a pharmaceutically acceptable salt, solvate, hydrate, geometrical isomer, tautomer, optical isomer, isotopic derivative, polymorph, prodrug, or N-oxide thereof. An increase in uracil in a biological sample is related to an increase in nucleic acid metabolism in a subject or a tissue or a cell of the subject (e.g., a neoplastic tissue or cell).
As used herein, the term "guanosine" refers to a compound having the CAS number CAS: 118-00-3, including a pharmaceutically acceptable salt, solvate, hydrate, geometrical isomer, tautomer, optical isomer, isotopic derivative, polymorph, prodrug, or N-oxide thereof. An increase in guanosine in a biological sample is related to an increase in nucleic acid metabolism in a subject or a tissue or a cell of the subject (e.g., a neoplastic tissue or cell).
As used herein, the term "adenosine" refers to a compound having the CAS number CAS: 58-61-7, including a pharmaceutically acceptable salt, solvate, hydrate, geometrical isomer, tautomer, optical isomer, isotopic derivative, polymorph, prodrug, or N-oxide thereof. An increase in adenosine in a biological sample is related to an increase in nucleic acid metabolism in a subject or a tissue or a cell of the subject (e.g., a neoplastic tissue or cell).
As used herein, the term "N1-acetylspermidine" refers to a compound having the CAS number 14278-49-0, including a pharmaceutically acceptable salt, solvate, hydrate, geometrical isomer, tautomer, optical isomer, isotopic derivative, polymorph, prodrug, or N-oxide thereof. An increase in N1-acetylspermidine in a biological sample is related to an increase in polyamine metabolism in a subject or a tissue or a cell of the subject (e.g., a neoplastic tissue or cell).
As used herein, the term "N8-acetylspermidine" refers to a compound having the CAS number 34450-15-2, including a pharmaceutically acceptable salt, solvate, hydrate, geometrical isomer, tautomer, optical isomer, isotopic derivative, polymorph, prodrug, or N-oxide thereof. An increase in N8-acetylspermidine in a biological sample is related to an increase in polyamine metabolism in a subject or a tissue or a cell of the subject (e.g., a neoplastic tissue or cell).
As used herein, the term "spermine" refers to a compound having the CAS number 71-44-3, including a pharmaceutically acceptable salt, solvate, hydrate, geometrical isomer, tautomer, optical isomer, isotopic derivative, polymorph, prodrug, or N-oxide thereof. An increase in spermine in a biological sample is related to an increase in polyamine metabolism in a subject or a tissue or a cell of the subject (e.g., a neoplastic tissue or cell).
As used herein, the term "arginine" refers to a compound having the CAS number CAS: 74-79-3, including a pharmaceutically acceptable salt, solvate, hydrate, geometrical isomer, tautomer, optical isomer, isotopic derivative, polymorph, prodrug, or N-oxide thereof. An increase in arginine in a biological sample is related to an increase in polyamine metabolism in a subject or a tissue or a cell of the subject (e.g., a neoplastic tissue or cell).
As used herein, the term "ornithine" refers to a compound having the CAS number CAS: 70-26-8, including a pharmaceutically acceptable salt, solvate, hydrate, geometrical isomer, tautomer, optical isomer, isotopic derivative, polymorph, prodrug, or N-oxide thereof. An increase in ornithine in a biological sample is related to an increase in polyamine metabolism in a subject or a tissue or a cell of the subject (e.g., a neoplastic tissue or cell).
As used herein, the term "citrulline" refers to a compound having the CAS number CAS: 372-75-8, including a pharmaceutically acceptable salt, solvate, hydrate, geometrical isomer, tautomer, optical isomer, isotopic derivative, polymorph, prodrug, or N-oxide thereof. An increase in citrulline in a biological sample is related to an increase in polyamine metabolism in a subject or a tissue or a cell of the subject (e.g., a neoplastic tissue or cell).
As used herein, the term "proline" refers to a compound having the CAS number 609-36-9 or 147-85-3 (L-proline), including pharmaceutically acceptable salts, solvates, hydrates, geometrical isomers, tautomers, optical isomers, isotopic derivatives, polymorphs, prodrugs, or N-oxides thereof. An increase in proline in a biological sample is related to an increase in amino acid metabolism in a subject or a tissue or a cell of the subject (e.g., a neoplastic tissue or cell).
As used herein, the term "glutamine" refers to a compound having the CAS number 56-85-9, including pharmaceutically acceptable salts, solvates, hydrates, geometrical isomers, tautomers, optical isomers, isotopic derivatives, polymorphs, prodrugs, or N-oxides thereof. An increase in glutamine in a biological sample is related to an increase in amino acid metabolism in a subject or a tissue or a cell of the subject (e.g., a neoplastic tissue or cell).
As used herein, the term "N.alpha.-acetyllysine" refers to a compound having the CAS number 1946-82-3, including pharmaceutically acceptable salts, solvates, hydrates, geometrical isomers, tautomers, optical isomers, isotopic derivatives, polymorphs, prodrugs, or N-oxides thereof. An increase in N.alpha.-acetyllysine in a biological sample is related to an increase in amino acid metabolism in a subject or a tissue or a cell of the subject (e.g., a neoplastic tissue or cell).
As used herein, the term "glutamic acid" refers to a compound having the CAS number CAS: 56-86-0, including pharmaceutically acceptable salts, solvates, hydrates, geometrical isomers, tautomers, optical isomers, isotopic derivatives, polymorphs, prodrugs, or N-oxides thereof. An increase in glutamic acid in a biological sample is related to an increase in amino acid metabolism in a subject or a tissue or a cell of the subject (e.g., a neoplastic tissue or cell).
As used herein, the term "threonine" refers to a compound having the CAS number CAS: 72-19-5, including pharmaceutically acceptable salts, solvates, hydrates, geometrical isomers, tautomers, optical isomers, isotopic derivatives, polymorphs, prodrugs, or N-oxides thereof. An increase in threonine in a biological sample is related to an increase in amino acid metabolism in a subject or a tissue or a cell of the subject (e.g., a neoplastic tissue or cell).
As used herein, the term "M264" refers to a novel metabolite that was identified as a biomarker for colorectal cancer in human urine samples. The metabolite has a molecular formulae C.sub.9H.sub.17N.sub.3O.sub.6 and gives rise to a protonated ion with m/z=264.12 in the ESI positive mode. The ion gives rise to fragments 132 and 90, characteristic fragments of creatine, in the ESI-MS/MS mode. The structure contains a creatine moiety with a ribofuranosyl ring attached to one of the guanidine nitrogens through C1 of the sugar. The IUPAC name of the compound is 2-{2-[(2R,3R,4S,5R)-3,4-dihydroxy-5-(hydroxymethyl)-oxolan-2-yl]-1-methyl- carbamimidamido}acetic acid and the common name .beta.-D-Ribofuranosylcreatine. The biosynthesis of the compound is expected to involve arginine metabolism, methylation and pentose phosphate pathway, which is also involved in nucleic acid biosynthesis.
By "agent" is meant any small molecule chemical compound, antibody, nucleic acid molecule, or polypeptide, or fragments thereof.
By "alteration" is meant an increase or decrease. An alteration may be by as little as 1%, 2%, 3%, 4%, 5%, 10%, 20%, 30%, or by 40%, 50%, 60%, or even by as much as 75%, 80%, 90%, or 100%.
As used herein, the term "antibody" means not only intact antibody molecules, but also fragments of antibody molecules that retain immunogen-binding ability. Such fragments are also well known in the art and are regularly employed both in vitro and in vivo. Accordingly, as used herein, the term "antibody" means not only intact immunoglobulin molecules but also the well-known active fragments F(ab')2, and Fab. F(ab')2, and Fab fragments that lack the Fc fragment of intact antibody, clear more rapidly from the circulation, and may have less non-specific tissue binding of an intact antibody (Wahl et al., J. Nucl. Med. 24:316-325 (1983). The antibodies of the invention comprise whole native antibodies, bispecific antibodies; chimeric antibodies; Fab, Fab', single chain V region fragments (scFv), fusion polypeptides, and unconventional antibodies.
By "biologic sample" is meant any tissue, cell, fluid, or other material derived from an organism.
By "clinical aggressiveness" is meant the severity of the neoplasia. Aggressive neoplasias are more likely to metastasize than less aggressive neoplasias. While conservative methods of treatment are appropriate for less aggressive neoplasias, more aggressive neoplasias require more aggressive therapeutic regimens.
As used herein, the terms "determining", "assessing", "assaying", "measuring" and "detecting" refer to both quantitative and qualitative determinations, and as such, the term "determining" is used interchangeably herein with "assaying," "measuring," and the like. Where a quantitative determination is intended, the phrase "determining an amount" of an analyte and the like is used. Where a qualitative and/or quantitative determination is intended, the phrase "determining a level" of an analyte or "detecting" an analyte is used.
The terms "isolated," "purified," or "biologically pure" refer to material that is free to varying degrees from components which normally accompany it as found in its native state. "Isolate" denotes a degree of separation from original source or surroundings. "Purify" denotes a degree of separation that is higher than isolation. A "purified" or "biologically pure" protein is sufficiently free of other materials such that any impurities do not materially affect the biological properties of the protein or cause other adverse consequences. That is, a nucleic acid or peptide of this invention is purified if it is substantially free of cellular material, viral material, or culture medium when produced by recombinant DNA techniques, or chemical precursors or other chemicals when chemically synthesized. Purity and homogeneity are typically determined using analytical chemistry techniques, for example, polyacrylamide gel electrophoresis or high performance liquid chromatography. The term "purified" can denote that a nucleic acid or protein gives rise to essentially one band in an electrophoretic gel. For a protein that can be subjected to modifications, for example, phosphorylation or glycosylation, different modifications may give rise to different isolated proteins, which can be separately purified.
The term "microarray" or "array" is meant to include a collection or panel of capture reagents arranged on a solid support (for example, a chip, plate, or bead).
By "neoplasia" is meant any disease that is caused by or results in inappropriately high levels of cell division, inappropriately low levels of apoptosis, or both. For example, cancer is an example of a neoplasia. Examples of cancers include, without limitation, prostate cancer, leukemias (e.g., acute leukemia, acute lymphocytic leukemia, acute myelocytic leukemia, acute myeloblastic leukemia, acute promyelocytic leukemia, acute myelomonocytic leukemia, acute monocytic leukemia, acute erythroleukemia, chronic leukemia, chronic myelocytic leukemia, chronic lymphocytic leukemia), polycythemia vera, lymphoma (Hodgkin's disease, non-Hodgkin's disease), Waldenstrom's macroglobulinemia, heavy chain disease, and solid tumors such as sarcomas and carcinomas (e.g., fibrosarcoma, myxosarcoma, liposarcoma, chondrosarcoma, osteogenic sarcoma, chordoma, angiosarcoma, endotheliosarcoma, lymphangiosarcoma, lymphangioendotheliosarcoma, synovioma, mesothelioma, Ewing's tumor, leiomyosarcoma, rhabdomyosarcoma, colon carcinoma, pancreatic cancer, breast cancer, ovarian cancer, squamous cell carcinoma, basal cell carcinoma, adenocarcinoma, sweat gland carcinoma, sebaceous gland carcinoma, papillary carcinoma, papillary adenocarcinomas, cystadenocarcinoma, medullary carcinoma, bronchogenic carcinoma, renal cell carcinoma, hepatoma, nile duct carcinoma, choriocarcinoma, seminoma, embryonal carcinoma, Wilm's tumor, cervical cancer, uterine cancer, testicular cancer, lung carcinoma, small cell lung carcinoma, bladder carcinoma, epithelial carcinoma, glioma, astrocytoma, medulloblastoma, craniopharyngioma, ependymoma, pinealoma, hemangioblastoma, acoustic neuroma, oligodenroglioma, schwannoma, meningioma, melanoma, neuroblastoma, and retinoblastoma). Lymphoproliferative disorders are also considered to be proliferative diseases.
By "reference" is meant a standard of comparison. For example, the level of one or more of asymmetric-dimethylarginine, symmetric-dimethylarginine, proline, glutamine, N.alpha.-acetyllysine, xanthosine, inosine, deoxyuridine, thymidine, N1-acetylspermidine, N8-acetylspermidine, spermine, or carnitine present in a patient sample may be compared to the level of the compound(s) in a corresponding healthy cell or tissue or in a diseased cell or tissue (e.g., a cell or tissue derived from a subject having neoplasia). In quantitating the level of a compound of interest in a sample, the levels of the compound may be normalized to those of another compound whose levels are not related to a disease and/or are not expected to change (e.g., creatinine).
By "periodic" is meant at regular intervals. Periodic patient monitoring includes, for example, a schedule of tests that are administered daily, bi-weekly, bi-monthly, monthly, bi-annually, or annually.
By "severity of neoplasia" is meant the degree of pathology. The severity of a neoplasia increases, for example, as the stage or grade of the neoplasia increases.
By "Marker profile" is meant a characterization of the level of two or more compounds, analytes, or metabolites. For example, Marker profiles of the following groups of biomarkers are useful in characterizing neoplasia in the methods of the invention: asymmetric-dimethylarginine and symmetric-dimethylarginine, and optionally carnitine (methylation); proline, glutamine, N.alpha.-acetyllysine (amino acid metabolism); xanthosine, inosine, deoxyuridine, thymidine (nucleic acid metabolism); and (polyamine metabolism); or a combination thereof.
The term "subject" or "patient" refers to an animal which is the object of treatment, observation, or experiment. By way of example only, a subject includes, but is not limited to, a mammal, including, but not limited to, a human or a non-human mammal, such as a non-human primate, murine, bovine, equine, canine, ovine, or feline.
By "specifically binds" is meant an affinity agent (e.g., an antibody) that recognizes and binds a compound or agent of interest (e.g., a biomarker), but which does not substantially recognize and bind other molecules in a sample, for example, a biological sample.
As used herein, the terms "prevent," "preventing," "prevention," "prophylactic treatment," and the like, refer to reducing the probability of developing a disease or condition in a subject, who does not have, but is at risk of or susceptible to developing a disease or condition, e.g., neoplasia.
As used herein, the terms "treat," treating," "treatment," and the like refer to reducing or ameliorating a disease or condition, e.g., neoplasia, and/or symptoms associated therewith. It will be appreciated that, although not precluded, treating a disease or condition does not require that the disease, condition, or symptoms associated therewith be completely eliminated.
As used herein, the terms "comprises," "comprising," "containing," "having" and the like can have the meaning ascribed to them in U.S. patent law and can mean "includes," "including," and the like. The term "including" is used herein to mean, and is used interchangeably with, the phrase "including but not limited to." The terms "consisting essentially of" or "consists essentially" likewise has the meaning ascribed in U.S. patent law and the term is open-ended, allowing for the presence of more than that which is recited so long as basic or novel characteristics of that which is recited is not changed by the presence of more than that which is recited, but excludes prior art embodiments.
As used herein, the singular forms "a", "an", and "the" include plural forms unless the context clearly dictates otherwise. Thus, for example, reference to "a biomarker" includes reference to more than one biomarker.
Unless specifically stated or obvious from context, as used herein, the term "about" is understood as within a range of normal tolerance in the art, for example within 2 standard deviations of the mean. About can be understood as within 10%, 9%, 8%, 7%, 6%, 5%, 4%, 3%, 2%, 1%, 0.5%, 0.1%, 0.05%, or 0.01% of the stated value. Unless otherwise clear from context, all numerical values provided herein are modified by the term about.
The recitation of a listing of chemical groups in any definition of a variable herein includes definitions of that variable as any single group or combination of listed groups. The recitation of an embodiment for a variable or aspect herein includes that embodiment as any single embodiment or in combination with any other embodiments or portions thereof. Unless specifically stated or obvious from context, as used herein, the term "or" is understood to be inclusive. Any compounds, compositions, or methods provided herein can be combined with one or more of any of the other compositions and methods provided herein.
DESCRIPTION OF THE DRAWINGS
FIGS. 1A-1C depict the characterization of APC.sup.Min/+ and wild-type mice. FIG. 1A shows a representative picture of longitudinally opened intestine of APC.sup.Min/+ and wild-type mice. Red arrows indicate tumor and polyps in the mutant. FIG. 1B is a graph of absolute body weight profile of wild-type (dotted line) and APC.sup.Min/+ (solid line) mice during the study. There was no significant difference in body weight of wild-type and APC.sup.Min/+ mice. All values presented as mean.+-.SEM. FIG. 1C is a graph of box plots for alanine aminotransferase (ALT) and aspartate aminotransferase (AST) levels in wild-type and APC.sup.Min/+ serum.
FIGS. 2A-2F depict the effect of tumorigenesis on global metabolomic signature and amino acid metabolism. FIG. 2A is a scores scatter plot for principal components analysis (PCA) of total ion count (TIC)-normalized data obtained from UPLC-HILIC-ESI-MS analysis urine samples at five months in negative ionization mode. FIG. 2B is a scores scatter plot for principal components analysis (PCA) of creatinine-normalized data obtained from UPLC-HILIC-ESI-MS analysis urine samples at five months in negative ionization mode. FIG. 2C is a graph showing the longitudinal variation in the creatinine-normalized urinary excretion of glutamine in wild-type and APC.sup.Min/+ mice is shown by dotted and solid lines, respectively. FIG. 2D is a graph showing the longitudinal variation in the creatinine-normalized urinary excretion of proline in wild-type and APC.sup.Min/+ mice is shown by dotted and solid lines, respectively. FIG. 2E is a graph showing the longitudinal variation in the creatinine-normalized urinary excretion of N.alpha.-acetyllysine in wild-type and APC.sup.Min/+ mice is shown by dotted and solid lines, respectively. FIG. 2F is a graph showing the longitudinal variation in the creatinine-normalized urinary excretion of carnitine in wild-type and APC.sup.Min/+ mice is shown by dotted and solid lines, respectively. The statistical significance of the difference in metabolite concentrations were calculated by two-tailed Mann-Whitney test with 95% confidence interval. P values <0.05, <0.01 and <0.005 are indicated by `*`, `**` and `***`, respectively. All values are presented as mean.+-.SEM.
FIGS. 3A-3D depict analysis of creatinine-normalized metabolomic signature using reverse-phase separation. FIG. 3A is a scores scatter plot for unsupervised principal components analysis (PCA) of creatinine-normalized UPLC-RP-ESIMS positive ionization mode data (0.1-1.3 mins) obtained from urine samples collected at six months. FIG. 3B is a scores scatter plot for orthogonal projections to latent structures (OPLS) analysis of creatinine-normalized data obtained from UPLC-HILIC-ESIMS analysis of urine samples collected at five months in negative ionization mode. FIG. 3C is a scores scatter plot for orthogonal projections to latent structures (OPLS) analysis of creatinine-normalized obtained from UPLC-RP-ESIMS analysis of urine samples collected at six months in positive ionization mode. FIG. 3D is a loadings S-plot of the ions from OPLS analysis of creatinine-normalized data obtained from UPLC-HILIC-ESIMS analysis of urine samples collected at five months in negative ionization mode. Distance from the origin along the Y-axis is commensurate with the contribution of the ion to separation of wild-type and mutant animals and that along the X-axis is commensurate with the abundance of the ion in the chromatogram. Ions in the upper right quadrant (shown in red box) represent ions elevated in APC.sup.Min/+ urine and those in the bottom left quadrant (shown in green box) represent ions reduced in APC.sup.Min/+ compared to their wild-type.
FIGS. 4A-4F depict the effect of tumorigenesis on urinary excretion of metabolites related to arginine and polyamine metabolism. FIG. 4A is a graph showing the longitudinal variation in the creatinine-normalized urinary excretion of symmetric-dimethylarginine in wild-type and APC.sup.Min/+ mice is shown by dotted and solid lines, respectively. FIG. 4B is a graph showing the longitudinal variation in the creatinine-normalized urinary excretion of asymmetric-dimethylarginine in wild-type and APC.sup.Min/+ mice is shown by dotted and solid lines, respectively. FIG. 4C is a graph showing the longitudinal variation in the creatinine-normalized urinary excretion of citrulline in wild-type and APC.sup.Min/+ mice is shown by dotted and solid lines, respectively. FIG. 4D is a graph showing the longitudinal variation in the creatinine-normalized urinary excretion of spermine in wild-type and APC.sup.Min/+ mice is shown by dotted and solid lines, respectively. FIG. 4E is a graph showing the longitudinal variation in the creatinine-normalized urinary excretion of N1-acetylspermidine in wild-type and APC.sup.Min/+ mice is shown by dotted and solid lines, respectively. FIG. 4F is a graph showing the longitudinal variation in the creatinine-normalized urinary excretion of N8-acetylspermidine in wild-type and APC.sup.Min/+ mice is shown by dotted and solid lines, respectively. The statistical significance of the difference in metabolite concentrations were calculated by two-tailed Mann-Whitney test with 95% confidence interval. P values <0.05, <0.01 and <0.005 are indicated by `*`, `**` and `***`, respectively. All values are presented as mean.+-.SEM.
FIGS. 5A and 5B depict the effect of tumorigenesis on urinary excretion of metabolites related to urea cycle and polyamine metabolism. FIG. 5A is a graph showing longitudinal variation in the creatinine-normalized excretion of ornithine in the wild-type and APC.sup.Min/+ mice in discovery set is shown by dotted and solid lines, respectively. All values shown as mean.+-.SEM and `**` indicate P value <0.01. FIG. 5B is a graph of box plots for urinary excretion of N-acetyllysine, citrulline, thymidine, deoxyuridine, cytidine and xanthine in validation cohort. All statistical significances were calculated by two-tailed Mann-Whitney test with 95% confidence interval.
FIGS. 6A-6F depict the effect of tumorigenesis on urinary excretion of metabolites related to nucleic acid metabolism. FIG. 6A is a is a graph showing longitudinal variation in the creatinine-normalized urinary excretion of xanthosine in wild-type and APC.sup.Min/+ mice is shown by dotted and solid lines, respectively. FIG. 6B is a is a graph showing longitudinal variation in the creatinine-normalized urinary excretion of inosine in wild-type and APC.sup.Min/+ mice is shown by dotted and solid lines, respectively. FIG. 6C is a is a graph showing longitudinal variation in the creatinine-normalized urinary excretion of xanthine in wild-type and APC.sup.Min/+ mice is shown by dotted and solid lines, respectively. FIG. 6D is a is a graph showing longitudinal variation in the creatinine-normalized urinary excretion of cytidine in wild-type and APC.sup.Min/+ mice is shown by dotted and solid lines, respectively. FIG. 6E is a is a graph showing longitudinal variation in the creatinine-normalized urinary excretion of deoxyuridine in wild-type and APC.sup.Min/+ mice is shown by dotted and solid lines, respectively. FIG. 6F is a is a graph showing longitudinal variation in the creatinine-normalized urinary excretion of thymidine in wild-type and APC.sup.Min/+ mice is shown by dotted and solid lines, respectively. The statistical significance of the difference in metabolite concentrations were calculated by two-tailed Mann-Whitney test with 95% confidence interval. P values <0.05, <0.01 and <0.005 are indicated by `*`, `**` and `***`, respectively. All values are presented as mean.+-.SEM.
FIGS. 7A-7E depict validation of metabolomic biomarkers and evaluation of diagnostic power. FIG. 7A is a graph of box plots for creatinine-normalized concentrations of carnitine, glutamine, N1-acetylspermidine, N8-acetylspermidine, proline, asymmetric-dimethylarginine, symmetric-dimethylarginine, spermine, xanthosine and inosine in age-matched (six month old) non-littermate healthy control (wild-type) and tumor-bearing (APC.sup.Min/+) animals. FIG. 7B is a graph of the receiver operating characteristic (ROC) curve for tumor diagnosis using biomarkers related to amino acid metabolism (proline, glutamine and N.alpha.-acetyllysine). FIG. 7C is a graph of the receiver operating characteristic (ROC) curve for tumor diagnosis using biomarkers related to polyamine metabolism (N1-acetylspermidine, N8-acetylspermidine and spermine). FIG. 7D is a graph of the receiver operating characteristic (ROC) curve for tumor diagnosis using biomarkers related to nucleic acid metabolism (xanthosine, inosine, deoxyuridine and thymidine). FIG. 7E is a graph of the receiver operating characteristic (ROC) curve for tumor diagnosis using biomarkers related to methylation (symmetric-dimethylarginine, asymmetric-dimethylarginine and carnitine). Area under the ROC curve (AUCROC) and accuracy is shown for each plot.
FIGS. 8A-8D are graphs of Box plots for comparison of ranges of creatinine-normalized urinary excretion of individual metabolites in discovery, validation and combined cohorts at six months. FIG. 8A depicts graphs of metabolites related to amino acid metabolism. FIG. 8B depicts graphs of metabolites related to polyamine metabolism. FIG. 8C depicts graphs of metabolites related to nucleic acid metabolism. FIG. 8D depicts graphs of metabolites related to methylation.
FIGS. 9A-9D depict analysis of individual metabolic urinary biomarkers. FIG. 9A depicts ROC curves for individual metabolites related to amino acid metabolism. FIG. 9B depicts ROC curves for individual metabolites related to polyamine metabolism. FIG. 9C depicts ROC curves for individual metabolites related to nucleic acid metabolism. FIG. 9D depicts ROC curves for individual metabolites related to methylation. The area under the curve (AUCROC) and accuracy for each metabolite is mentioned. See Table 1 for details on their diagnostic capability.
FIGS. 10A and 10B depict accuracy of tumor diagnosis using a panel of metabolic urinary biomarkers. FIG. 10A is a heat-map showing distinct metabolomic trait associated with APC.sup.Min/+ mice compared to wild-type. FIG. 10B shows that hierarchical clustering using the metabolite panel shows correct classification of all except one wild-type and one mutant mouse.
FIGS. 11A and 11B depict the ability of the biomarker panels to distinguish wild-type and mutant animals at 5 months. FIG. 11A depicts ROC curves for individual biomarker panels for detection of subjects prone to tumorigenesis (mutants) at five months in the longitudinal discovery cohort. FIG. 11B depicts ROC curves for a combination of biomarker panels for detection of subjects prone to tumorigenesis (mutants) at five months in the longitudinal discovery cohort. The area under the curve (AUCROC) and accuracy for each metabolic panel is mentioned. Carnitine had to be removed from the methylation panel as it perfectly identified mutants with a cut off value of 42.56 .mu.mol/mmol creatinine.
FIGS. 12A and 12B depict the ability of the biomarker panels to distinguish wild-type and mutant animals at 4 months. FIG. 12A depicts ROC curves for individual biomarker panels for detection of subjects prone to tumorigenesis (mutants) at four months in the longitudinal discovery cohort. FIG. 12B depicts ROC curves for a combination of biomarker panels for detection of subjects prone to tumorigenesis (mutants) at four months in the longitudinal discovery cohort. The area under the curve (AUCROC) and accuracy for each metabolic panel is mentioned.
FIGS. 13A and 13B depict the ability of the biomarker panels to distinguish wild-type and mutant animals at 3 months. FIG. 13A depicts ROC curves for individual biomarker panels for detection of subjects prone to tumorigenesis (mutants) at three months in the longitudinal discovery cohort. FIG. 13B depicts ROC curves for a combination of biomarker panels for detection of subjects prone to tumorigenesis (mutants) at three months in the longitudinal discovery cohort. The area under the curve (AUCROC) and accuracy for each metabolic panel is mentioned.
FIGS. 14A and 14B depict the ability of the biomarker panels to distinguish wild-type and mutant animals at 2 months. FIG. 14A depicts ROC curves for individual biomarker panels for detection of subjects prone to tumorigenesis (mutants) at two months in the longitudinal discovery cohort. FIG. 14B depicts ROC curves for a combination of biomarker panels for detection of subjects prone to tumorigenesis (mutants) at two months in the longitudinal discovery cohort. The area under the curve (AUCROC) and accuracy for each metabolic panel is mentioned.
FIGS. 15A-15D depict the effect of colorectal tumorigenesis on tissue metabolome. FIG. 15A depicts graphs of box plots showing relative abundance of metabolites related to amino acid metabolism in normal colon mucosa (wild type) and colon tumor (APC.sup.Min/+) tissue. FIG. 15B depicts graphs of box plots showing relative abundance of metabolites related to polyamine metabolism in normal colon mucosa (wild type) and colon tumor (APC.sup.Min/+) tissue. FIG. 15C depicts graphs of box plots showing relative abundance of metabolites related to nucleic acid metabolism in normal colon mucosa (wild type) and colon tumor (APC.sup.Min/+) tissue. FIG. 15D depicts graphs of box plots showing relative abundance of metabolites related to methylation in normal colon mucosa (wild type) and colon tumor (APC.sup.Min/+) tissue. The abundance of proline, glutamine, glutamic acid, threonine, arginine, citrulline, ornithine, N1-acetylspermidine, thymidine, ATP, dimethylarginine and carnitine were elevated while those of xanthine and inosine were reduced. All values presented as fold-change with respect to the abundance of the metabolite in the normal colon epithelium. Statistical significance was calculated by two-tailed Mann-Whitney test with 95% confidence interval.
FIGS. 16A-16E depict the effect of colorectal tumorigenesis on tissue transcriptome. FIG. 16A is a graph of the expression of genes involved in amino acid biosynthesis are shown as fold change with respect gene expression in normal colon mucosa. FIG. 16B is a graph of the expression of genes involved in purine metabolism are shown as fold change with respect gene expression in normal colon mucosa. FIG. 16C is a graph of the expression of genes involved in pyrimidine metabolism are shown as fold change with respect gene expression in normal colon mucosa. FIG. 16D is a graph of the expression of genes involved in polyamine metabolism are shown as fold change with respect gene expression in normal colon mucosa. FIG. 16E is a graph of the expression of genes involved in methylation are shown as fold change with respect gene expression in normal colon mucosa. Statistical significance was calculated by two-tailed Mann-Whitney test with 95% confidence interval with `#`, `$` and `*` indicating P values <0.05, <0.01 and <0.005, respectively.
FIG. 17 A-E are a series of graphs that show changes in urinary metabolic profile associated with AOM-induced colorectal carcinogenesis in mice. Dot-scatter plots (presented as mean with 95% confidence interval) showing creatinine-normalized urinary excretion of metabolites related to FIG. 17A shows amino acid metabolism (glutamine, glutamic acid, proline, threonine, and N.alpha.-acetyllysine), FIG. 17B shows urea cycle and polyamine metabolism (N8-acetylspermidine, N1-acetylspermidine, citrulline, arginine, and ornithine), FIG. 17C shows pyrimidine metabolism (deoxycytidine, cytosine, deoxyuridine, uracil, and thymidine), FIG. 17D purine metabolism (xanthine, xanthosine, and guanosine), and FIG. 17E methylation (symmetric-dimethylarginine, asymmetric-dimethylarginine, methionine, carnitine, and betaine) in saline-treated healthy (control, N=6) or tumor-bearing mice (AOM, N=6) five months after AOM-treatment. All statistical significances were calculated by two-tailed Mann-Whitney test with 95% confidence interval.
FIGS. 18A and 18B are a series of graphs that show the effect of colorectal tumorigenesis on the metabolome of human epithelial tissue. Arrow plots showing changes in metabolite abundance between paired colon tumor and adjacent non-tumor tissue. All cases (N=23) with tumors found in rectum and sigmoidal, descending or transverse colon are presented. P values were calculated by two-tailed paired t-test with 95% confidence intervals.
FIGS. 19A and 19B are a series of graphs that shows the effect of colorectal tumorigenesis on the metabolome of human epithelial tissue. Arrow plots showing changes in metabolite abundance between paired colon tumor and adjacent non-tumor tissue. All tumors (N=39) are presented irrespective of location and histology. Statistical significance was calculated by two-tailed paired t-test with 95% confidence intervals.
FIG. 20 shows identification of a novel metabolite (M264) as a urinary biomarker of human colorectal cancer. FIG. 20A shows the molecular formula, IUPAC name and structure of the compound that would be commonly referred to as .beta.-D-Ribofuranosylcreatine. FIG. 20B shows the creatinine-normalized relative abundance of the metabolite in control (N=10) and patient (N=10) urine samples. Statistical significance was calculated by two-tailed Mann-Whitney test with 95% confidence interval. FIG. 20C shows the ROC curve for detection of colorectal cancer using the metabolite.
FIGS. 21A and 21B depict the coordinate deregulation and reprogramming of metabolic network in APC mutation-mediated colorectal tumorigenesis. Coordinate reprogramming of metabolic machinery in colorectal tumorigenesis. FIG. 21A shows metabolic pathways captured by metabolomic and transcriptomic analysis in this study with metabolite names in red, black or blue indicating increase, no change or decrease, respectively, in abundance in APC.sup.Min/+ tumor tissue. `*` indicates that the metabolite was significantly elevated in human tumor tissues. Solid red, black or blue boxes indicate that creatinine-normalized excretion of the metabolite was elevated, unchanged or depleted, respectively, in urine of the Apc.sup.Min/+ mice. Dotted box indicates that the metabolite was either not detected or monitored in Apc.sup.Min/+ urine. FA, Ac-CoA, N.alpha.-Ac Lysine, OAA, .alpha.-KG, PRRP, SAH, SAM, MTA, SAMA, ADMA, SDMA, NMMA, N1-AcS and N8-AcS represent, fatty acid, acetyl coenzyme A, N.alpha. acetyllysine, oxaloacetic acid, .alpha.-ketoglutaric acid, 5-phosphoribosyl 1-pyrophosphate, S-adenosylhomocysteine, S-adenosylmethionine, S-methyl-5-thioadenosine, S-adenosylmethioninamine, asymmetric-dimethylarginine, symmetric-dimethylarginine, N-monomethylarginine, N1-acetylspermidine and N8-acetylspermidine, respectively. Arrows indicate pathways of conversion of metabolites with solid and dotted lines indicating the involvement of single and multiple reactions, respectively. Red, black or blue colors indicate upregulation, no change or downregulation of expression of genes encoding enzymes involved in these pathways in Apc.sup.Min/+ tumor tissue compared to normal colon mucosa, respectively. Dash-dotted arrows indicate pathways for biosynthesis of essential amino acids (such as threonine and lysine) that are unannotated in human and mouse. FIG. 21B shows the origin and utility of biomarkers of metabolic reprogramming in early noninvasive diagnosis.
DETAILED DESCRIPTION OF THE INVENTION
The invention features compositions and methods that are useful for the diagnosis, treatment and prevention of neoplasia, including colorectal cancer, as well as to determine subject prognosis and aid in treatment selection.
As detailed herein, metabolomic and transcriptomic analysis revealed changes in amino acid, nucleic acid, polyamine metabolism and methylation (e.g. protein methylation, DNA methylation) in tumor tissue. This invention is based, at least in part, on the discovery that the following groups or panels of biomarkers are useful and effective for identifying a subject as having or having a propensity to develop neoplasia (e.g., colorectal cancer, small intestine cancer, duodenal cancer, gastric cancer, pancreatic cancer, liver cancer, esophageal cancer, ovarian cancer, prostate cancer, uterine cancer, breast cancer, thyroid cancer and melanoma): biomarkers related to methylation; biomarkers related to nucleic acid metabolism; biomarkers related to urea cycle and polyamine metabolism; and biomarkers related to amino acid metabolism.
In particular, the biomarkers related to methylation include asymmetric-dimethylarginine, symmetric-dimethylarginine, carnitine, methionine, dimethylglycine, and betaine; the biomarkers related to nucleic acid metabolism include xanthosine, inosine, deoxyuridine, thymidine, deoxycytidine, cytosine, hypoxanthine, xanthine, uracil, guanosine, and adenosine; the biomarkers related to urea cycle and polyamine metabolism include N1-acetylspermidine, N8-acetylspermidine, spermine, arginine ornithine, and citrulline; and the biomarkers related to amino acid metabolism include proline, glutamine, glutamic acid, threonine, and N.alpha.-acetyllysine.
Also contemplated by the present invention is the biomarker M264 as useful and effective for identifying a subject as having or having a propensity to develop neoplasia.
Changes in the urinary metabolome were found to be in concert with these metabolomic and transcriptomic changes in tumor tissue and, consequently, helped to correctly distinguish healthy and tumor-bearing animals. The consistency of longitudinal trait of simultaneous deregulation of these pathways during tumorigenesis resulted in highly accurate and early prediction of subjects at risk of developing colorectal cancer in this mouse model.
The results described herein revealed a concerted deregulation of epigenetic, transcriptional, post-translational and metabolic events associated with tumorigenesis in APC.sup.Min/+ mice. Coordinate reprogramming of cellular metabolism during tumorigeneis is reflected in the urine metabolome. In particular, progressive elevation of symmetric- and asymmetric-dimethylarginine in urine of animals as a reflection of hyperactive methylation machinery is a novel observation in the context of colorectal cancer. The ability of urinary metabolites to prospectively identify animals that would eventually develop tumor, indicate a combined panel of urinary biomarkers representing synchronized deregulation of amino acid, nucleic acid, polyamine metabolism and methylation may provide a powerful high-throughput noninvasive method for screening as well as early diagnosis of colorectal cancer.
Accordingly, the invention provides for methods and kits that are useful in the diagnosis, treatment, and prevention of neoplasia, as well as for characterizing neoplasia to determine subject prognosis and aid in treatment selection. The invention further provides methods and kits for monitoring a patient identified as having neoplasia.
Diagnostics and Diagnostic Assays
The present invention features diagnostic assays for the detection of neoplasia, including colorectal cancer. In embodiments, the level of a biomarker(s) is measured in a subject sample and used to characterize neoplasia or the propensity to develop neoplasia. In particular embodiments, the levels of a group of methylation biomarkers are measured including at least asymmetric-dimethylarginine and symmetric-dimethylarginine, and optionally carnitine. In additional or alternative embodiments, the levels of biomarkers are measured from one or more of the following groups: biomarkers related to methylation; biomarkers related to nucleic acid metabolism; biomarkers related to urea cycle and polyamine metabolism; and biomarkers related to amino acid metabolism.
In particular, the biomarkers related to methylation include asymmetric-dimethylarginine, symmetric-dimethylarginine, carnitine, methionine, dimethylglycine, and betaine; the biomarkers related to nucleic acid metabolism include xanthosine, inosine, deoxyuridine, thymidine, deoxycytidine, cytosine, hypoxanthine, xanthine, uracil, guanosine, and adenosine; the biomarkers related to urea cycle and polyamine metabolism include N1-acetylspermidine, N8-acetylspermidine, spermine, arginine ornithine, and citrulline; and the biomarkers related to amino acid metabolism include proline, glutamine, glutamic acid, threonine, and N.alpha.-acetyllysine. M264 (.beta.-D-Ribofuranosylcreatine) biomarker is also contremplated in the diagnostic assays described herein.
Biological samples include tissue samples (e.g., cell samples, biopsy samples, and the like) and bodily fluids, including, but not limited to, urine, blood, blood serum, plasma, bile, fecal aspirate, intestinal aspirate, cerebrospinal fluid and saliva. Samples can optionally be treated to enrich for the biomarker(s) using enrichment and separation methods well known in the art.
Elevated levels of the biomarker(s) are considered a positive indicator of neoplasia. In general, an increase in the levels of one or more of biomarkers related to methylation; biomarkers related to nucleic acid metabolism; biomarkers related to urea cycle and polyamine metabolism; biomarkers related to amino acid metabolism and M264 is indicative of neoplasia or the propensity to develop neoplasia.
In particular, an increase in the levels of one or more biomarkers related to methylation including asymmetric-dimethylarginine, symmetric-dimethylarginine, carnitine, methionine, dimethylglycine, and betaine; the biomarkers related to nucleic acid metabolism including xanthosine, inosine, deoxyuridine, thymidine, deoxycytidine, cytosine, hypoxanthine, xanthine, uracil, guanosine, and adenosine; the biomarkers related to urea cycle and polyamine metabolism including N1-acetylspermidine, N8-acetylspermidine, spermine, arginine ornithine, and citrulline; and the biomarkers related to amino acid metabolism including proline, glutamine, glutamic acid, threonine, N.alpha.-acetyllysine and M264 is indicative of neoplasia or the propensity to develop neoplasia.
Elevated levels of the biomarker carnitine in tissue samples and reduced levels of the biomarker carnitine in biological fluid (e.g. urine) is indicative of neoplasia or the propensity to develop neoplasia. The increase or decrease in biomarker levels may be by at least about 10%, 25%, 50%, 75%, 90% or more. The increase or decrease in biomarker levels may be by at least about 1.5, 2, 2.5, 3, 3.5, 4, 4.5, 5, 5.5, 6, 6.5, 7, 7.5, 8, 8.5, 9, 9.5, 10, 10.5, 11, 11.5, 12, 12.5, 13, 13.5, 14, 14.5, 15, 16, 17, 18, 19, 20, 25, 30, 35, 40, 45, 50, 55, 60, 65, 70, 75, 80, 85, 90, 95-fold or more.
In embodiments, multiple biomarkers are measured (e.g., asymmetric-dimethylarginine, symmetric-dimethylarginine, carnitine, methionine, dimethylglycine, and betaine (methylation); proline, glutamine, glutamic acid, threonine, and N.alpha.-acetyllysine (amino acid metabolism); xanthosine, inosine, deoxyuridine, thymidine, deoxycytidine, cytosine, hypoxanthine, xanthine, uracil, guanosine, and adenosine (nucleic acid metabolism); N1-acetylspermidine, N8-acetylspermidine, spermine, arginine ornithine, and citrulline (urea cycle and polyamine metabolism). Additionally, one or more additional neoplasia biomarkers that are known in the art, (e.g., an APC variant associated with colon cancer).
In a particular embodiment, levels of the M264 biomarker are measured.
The use of multiple biomarkers increases the predictive value of the test and provides greater utility in diagnosis, toxicology, patient stratification and patient monitoring. The process called "Pattern recognition" detects the patterns formed by multiple biomarkers greatly improves the sensitivity and specificity of the diagnostic assay for predictive medicine. Subtle variations in data from clinical samples indicate that certain patterns of biomarkers can predict phenotypes such as the presence or absence of a certain disease, a particular stage of disease-progression, or a positive or adverse response to drug treatments.
Detection of an alteration relative to a reference sample (e.g., normal sample) can be used as a diagnostic indicator of neoplasia or colorectal cancer. In embodiments, the invention provides methods for identifying a subject as having or having a propensity to develop neoplasia or colorectal cancer. In related embodiments, the methods involve detecting the levels of one or more groups or panels of biomarkers as follows: asymmetric-dimethylarginine, symmetric-dimethylarginine, carnitine, methionine, dimethylglycine, and betaine (methylation); proline, glutamine, glutamic acid, threonine, and N.alpha.-acetyllysine (amino acid metabolism); xanthosine, inosine, deoxyuridine, thymidine, deoxycytidine, cytosine, hypoxanthine, xanthine, uracil, guanosine, and adenosine (nucleic acid metabolism); N1-acetylspermidine, N8-acetylspermidine, spermine, arginine ornithine, and citrulline (urea cycle and polyamine metabolism); or a combination thereof as specified herein, in a sample obtained from the subject. In embodiments, the methods involve comparing the level of the biomarker to a reference. In embodiments, the methods involve identifying the subject as having or having a propensity to develop neoplasia or colorectal cancer when the level of the biomarker is increased relative to the reference.
In embodiments, the invention provides methods for identifying neoplasia or colorectal cancer in a subject. In related embodiments, the methods involve detecting the levels of one or more groups or panels of biomarkers as follows: asymmetric-dimethylarginine, symmetric-dimethylarginine, carnitine, methionine, dimethylglycine, and betaine (methylation); proline, glutamine, glutamic acid, threonine, and N.alpha.-acetyllysine (amino acid metabolism); xanthosine, inosine, deoxyuridine, thymidine, deoxycytidine, cytosine, hypoxanthine, xanthine, uracil, guanosine, and adenosine (nucleic acid metabolism); N1-acetylspermidine, N8-acetylspermidine, spermine, arginine ornithine, and citrulline (urea cycle and polyamine metabolism); or a combination thereof as specified herein, in a sample obtained from the subject. In embodiments, the methods involve comparing the level of the biomarker to a reference. In embodiments, the methods involve identifying neoplasia or colorectal cancer in the subject when the level of the biomarker is increased relative to the reference.
In embodiments, the invention provides methods for characterizing the stage of neoplasia in a subject. In related embodiments, the methods involve detecting the levels of one or more groups or panels of biomarkers as follows: asymmetric-dimethylarginine, symmetric-dimethylarginine, carnitine, methionine, dimethylglycine, and betaine (methylation); proline, glutamine, glutamic acid, threonine, and N.alpha.-acetyllysine (amino acid metabolism); xanthosine, inosine, deoxyuridine, thymidine, deoxycytidine, cytosine, hypoxanthine, xanthine, uracil, guanosine, and adenosine (nucleic acid metabolism); N1-acetylspermidine, N8-acetylspermidine, spermine, arginine ornithine, and citrulline (urea cycle and polyamine metabolism); or a combination thereof as specified herein, in a sample obtained from the subject. In embodiments, the methods involve comparing the level of the biomarker to a reference. In embodiments, the methods involve identifying the subject as having a later stage of neoplasia when there is an increase in the level of the biomarker relative to the reference.
In embodiments, the invention provides methods for determining the prognosis of neoplasia in a subject. In related embodiments, the methods involve detecting the levels of one or more groups or panels of biomarkers as follows: a symmetric-dimethylarginine, symmetric-dimethylarginine, carnitine, methionine, dimethylglycine, and betaine (methylation); proline, glutamine, glutamic acid, threonine, and N.alpha.-acetyllysine (amino acid metabolism); xanthosine, inosine, deoxyuridine, thymidine, deoxycytidine, cytosine, hypoxanthine, xanthine, uracil, guanosine, and adenosine (nucleic acid metabolism); N1-acetylspermidine, N8-acetylspermidine, spermine, arginine ornithine, and citrulline (urea cycle and polyamine metabolism); or a combination thereof as specified herein in a sample obtained from the subject. In embodiments, the methods involve comparing the level of the biomarker to a reference. In embodiments, the methods involve identifying the subject as having a poor prognosis when there is an increase in the level of the biomarker relative to the reference.
In embodiments, the invention provides methods for characterizing the degree of lipid accumulation during the early stage of neoplasia in a subject. In related embodiments, the methods involve detecting the level s of one or more groups or panels of biomarkers as follows: asymmetric-dimethylarginine, symmetric-dimethylarginine, carnitine, methionine, dimethylglycine, and betaine (methylation); proline, glutamine, glutamic acid, threonine, and N.alpha.-acetyllysine (amino acid metabolism); xanthosine, inosine, deoxyuridine, thymidine, deoxycytidine, cytosine, hypoxanthine, xanthine, uracil, guanosine, and adenosine (nucleic acid metabolism); N1-acetylspermidine, N8-acetylspermidine, spermine, arginine ornithine, and citrulline (urea cycle and polyamine metabolism); or a combination thereof as specified herein in a sample obtained from the subject. In embodiments, the methods involve comparing the level of the biomarker to a reference. In embodiments, the methods involve identifying the subject as having a higher level of lipid accumulation during the early stage of neoplasia when there is an increase in the level of the biomarker relative to the reference.
In embodiments, the invention provides methods for monitoring neoplasia therapy in a subject. In related embodiments, the methods involve detecting the levels of one or more groups or panels of biomarkers as follows: asymmetric-dimethylarginine, symmetric-dimethylarginine, carnitine, methionine, dimethylglycine, and betaine (methylation); proline, glutamine, glutamic acid, threonine, and N.alpha.-acetyllysine (amino acid metabolism); xanthosine, inosine, deoxyuridine, thymidine, deoxycytidine, cytosine, hypoxanthine, xanthine, uracil, guanosine, and adenosine (nucleic acid metabolism); N1-acetylspermidine, N8-acetylspermidine, spermine, arginine ornithine, and citrulline (urea cycle and polyamine metabolism); or a combination thereof as specified herein in a sample obtained from the subject. In embodiments, the methods involve comparing the level of the biomarker to a reference. In embodiments, the methods involve identifying the therapy as effective when there is a decrease in the level of the biomarker relative to the reference.
In embodiments, the invention provides methods for detecting an agent's therapeutic efficacy in a subject having neoplasia. In related embodiments, the methods involve detecting an alteration in the levels of one or more groups or panels of biomarkers as follows: asymmetric-dimethylarginine, symmetric-dimethylarginine, carnitine, methionine, dimethylglycine, and betaine (methylation); proline, glutamine, glutamic acid, threonine, and N.alpha.-acetyllysine (amino acid metabolism); xanthosine, inosine, deoxyuridine, thymidine, deoxycytidine, cytosine, hypoxanthine, xanthine, uracil, guanosine, and adenosine (nucleic acid metabolism); N1-acetylspermidine, N8-acetylspermidine, spermine, arginine ornithine, and citrulline (urea cycle and polyamine metabolism); or a combination thereof as specified herein, in a sample obtained from the subject. In embodiments, the methods involve comparing the level of the biomarker to a reference (e.g., a patient sample taken at an earlier time point or prior to treatment). In embodiments, the methods involve identifying the agent as having therapeutic efficacy in the subject when there is a decrease in the level. In embodiments, the methods involve identifying the agent as lacking therapeutic efficacy in the subject when there maintenance or increase in the level.
In embodiments, the level of the biomarker(s) is measured on at least two different occasions and an alteration in the levels as compared to normal reference levels over time is used as an indicator of neoplasia, including colorectal cancer. The level of the biomarker(s) in a sample from a subject (e.g., bodily fluids such as blood, blood serum, plasma, bile, fecal aspirate, intestinal aspirate, cerebrospinal fluid, saliva, and urine) of a subject having neoplasia or the propensity to develop such a condition may be altered by as little as 10%, 20%, 30%, or 40%, or by as much as 50%, 60%, 70%, 80%, or 90% or more relative to the level of such biomarker(s) in a normal control. In embodiments, a subject sample is collected prior to the onset of symptoms of neoplasia. In embodiments, a subject sample is collected after the onset of symptoms of neoplasia. In embodiments, a subject sample is collected while the subject is undergoing treatment for neoplasia
The diagnostic methods described herein can be used individually or in combination with any other diagnostic method described herein or well known in the art for a more accurate diagnosis of the presence or severity of neoplasia. The diagnostic methods described herein can also be used to monitor and manage neoplasia, including colorectal cancer.
As indicated above, the invention provides methods for aiding an neoplasia diagnosis using one or more groups or panels of biomarkers as follows: asymmetric-dimethylarginine, symmetric-dimethylarginine, carnitine, methionine, dimethylglycine, and betaine (methylation); proline, glutamine, glutamic acid, threonine, and N.alpha.-acetyllysine (amino acid metabolism); xanthosine, inosine, deoxyuridine, thymidine, deoxycytidine, cytosine, hypoxanthine, xanthine, uracil, guanosine, and adenosine (nucleic acid metabolism); N1-acetylspermidine, N8-acetylspermidine, spermine, arginine ornithine, and citrulline (urea cycle and polyamine metabolism); or any combination of the recited biomarkers. These biomarker(s) can be used alone, in combination with other biomarkers in any set, or with entirely different markers in aiding neoplasia diagnosis. The markers are differentially present in samples of a neoplasia patient and a normal subject in whom neoplasia is undetectable. Therefore, detection of one or more of these biomarkers in a person would provide useful information regarding the probability that the person may have neoplasia or regarding the stage of neoplasia progression.
The detection of the biomarker(s) is then correlated with a probable diagnosis of neoplasia. In embodiments, the detection of the mere presence of a biomarker, without quantifying the amount thereof, is useful and can be correlated with a probable diagnosis of neoplasia. The measurement of biomarkers may also involve quantifying the markers to correlate the detection of markers with a probable diagnosis of neoplasia. Thus, if the amount of the biomarkers detected in a subject being tested is different compared to a control amount (e.g., higher than the control), then the subject being tested has a higher probability of having neoplasia.
The correlation may take into account the amount of the biomarker(s) in the sample compared to a control amount of biomarker(s) (e.g., in normal subjects or in non-neoplasia subjects such as where neoplasia is undetectable). A control can be, e.g., the average or median amount of the biomarker(s) present in comparable samples of normal subjects in normal subjects or in non-neoplasia subjects such as where neoplasia is undetectable. The control amount is measured under the same or substantially similar experimental conditions as in measuring the test amount. As a result, the control can be employed as a reference standard, where the normal (non-neoplasia) phenotype is known, and each result can be compared to that standard (e.g., a standardized curve for use), rather than re-running a control.
In some embodiments, the control is derived from the patient and provides a reference level of the patient prior to, during, or after treatment for neoplasia.
Accordingly, a biomarker profile may be obtained from a subject sample and compared to a reference biomarker profile obtained from a reference population, so that it is possible to classify the subject as belonging to or not belonging to the reference population. The correlation may take into account the presence or absence of the biomarkers in a test sample and the frequency of detection of the same biomarkers in a control. The correlation may take into account both of such factors to facilitate determination of neoplasia status.
In certain embodiments of the methods of qualifying neoplasia status, the methods further comprise managing subject treatment based on the status. The invention also provides for such methods where the biomarker(s) are measured again after subject management. In these cases, the methods are used to monitor the status of neoplasia, e.g., response to neoplasia treatment, including improvement, maintenance, or progression of the disease.
A biomarker, individually, can be useful in aiding in the determination of neoplasia status. First, the selected biomarker is detected in a subject sample using well known methods, including, but not limited to, the methods described herein. Then, the result is compared with a control that distinguishes neoplasia status from non-neoplasia status. As is well understood in the art, the techniques can be adjusted to increase sensitivity or specificity of the diagnostic assay depending on the preference of the diagnostician.
While an individual biomarker is a useful diagnostic marker, in some instances, a combination of biomarkers provides greater predictive value than single markers alone. The detection of a plurality of biomarkers (or absence thereof, as the case may be) in a sample can increase the percentage of true positive and true negative diagnoses and decrease the percentage of false positive or false negative diagnoses. Thus, in embodiments, methods of the present invention comprise the measurement of more than one biomarker.
Colorectal Cancer
Colorectal cancer is the second leading cause of cancer mortality in United States and fourth worldwide. Although colorectal cancer has good therapeutic response at early stages, advanced stages are frequently associated with metastasis and poor prognosis. Regular screening and early diagnosis of the disease is pivotal to therapeutic success.
More than 80% of colorectal cancers arise from adenomatous polyps making this cancer amenable to screening. Diagnosis of cases of colorectal cancer through screening tends to occur 2-3 years before diagnosis of cases with symptoms. Screening has the potential to reduce colorectal cancer deaths by 60%.
Colorectal Cancer Staging
The most commonly used staging system for colorectal cancer is that of the American Joint Committee on Cancer (AJCC), or the TNM system. Older staging systems for colorectal cancer, such as the Dukes and Astler-Coller systems, are mentioned for comparison. The TNM system describes 3 key pieces of information: "T" describes how far the main (primary) tumor has grown into the wall of the intestine and whether it has grown into nearby areas; "N" describes the extent of spread to nearby (regional) lymph nodes. Lymph nodes are small bean-shaped collections of immune system cells that are important in fighting infections. "M" indicates whether the cancer has spread (metastasized) to other organs of the body. (Colorectal cancer can spread almost anywhere in the body, but the most common sites of spread are the liver and lungs). Numbers appearing after T, N, and M (0-4) indicate increasing severity.
T categories of colorectal cancer describe the extent of spread through the layers that form the wall of the colon and rectum. Tx: No description of the tumor's extent is possible because of incomplete information. Tis: The cancer is in the earliest stage (in situ); involves only the mucosa; and/or has not grown beyond the muscularis mucosa (inner muscle layer). T1: The cancer has grown through the muscularis mucosa and extends into the submucosa. T2: The cancer has grown through the submucosa and extends into the muscularis propria (thick outer muscle layer). T3: The cancer has grown through the muscularis propria and into the outermost layers of the colon or rectum but not through them. It has not reached any nearby organs or tissues. T4a: The cancer has grown through the serosa (also known as the visceral peritoneum), the outermost lining of the intestines. T4b: The cancer has grown through the wall of the colon or rectum and is attached to or invades into nearby tissues or organs.
N categories indicate whether or not the cancer has spread to nearby lymph nodes and, if so, how many lymph nodes are involved. Nx: No description of lymph node involvement is possible because of incomplete information. N0: No cancer in nearby lymph nodes. N1: Cancer cells are found in or near 1 to 3 nearby lymph nodes; small deposits of cancer cells are found in areas of fat near lymph nodes, but not in the lymph nodes themselves. N2: Cancer cells are found in 4 or more nearby lymph nodes
M categories indicate whether or not the cancer has spread (metastasized) to distant organs, such as the liver, lungs, or distant lymph nodes. M0: No distant spread is seen. M1a: The cancer has spread to 1 distant organ or set of distant lymph nodes. M1b: The cancer has spread to more than 1 distant organ or set of distant lymph nodes, or it has spread to distant parts of the peritoneum (the lining of the abdominal cavity).
Information from T, N, and M categories is combined in a process called stage grouping. The stage is expressed in Roman numerals from stage I (the least advanced) to stage IV (the most advanced). Stage 0--Tis, N0, M0: The cancer is in the earliest stage; the cancer has not grown beyond the inner layer (mucosa) of the colon or rectum (carcinoma in situ or intramucosal carcinoma). Stage I--T1-T2, N0, M0: The cancer has grown through the muscularis mucosa into the submucosa (T1) or it may also have grown into the muscularis propria (T2); the cancer has not spread to nearby lymph nodes or distant sites. Stage IIA--T3, N0, M0: The cancer has grown into the outermost layers of the colon or rectum but has not gone through them (T3). The cancer has not reached nearby organs. The cancer has not yet spread to the nearby lymph nodes or distant sites. Stage IIB--T4a, N0, M0: The cancer has grown through the wall of the colon or rectum but has not grown into other nearby tissues or organs (T4a). The cancer has not yet spread to the nearby lymph nodes or distant sites. Stage IIC--T4b, N0, M0: The cancer has grown through the wall of the colon or rectum and is attached to or has grown into other nearby tissues or organs (T4b). The cancer has not yet spread to the nearby lymph nodes or distant sites. Stage IIIA--One of the following applies. T1-T2, N1, M0: The cancer has grown through the mucosa into the submucosa (T1) and it may also have grown into the muscularis propria (T2). The cancer has spread to 1 to 3 nearby lymph nodes (N1a/N1b) or into areas of fat near the lymph nodes but not the nodes themselves (N1c). It has not spread to distant sites. T1, N2a, M0: The cancer has grown through the mucosa into the submucosa (T1). It has spread to 4 to 6 nearby lymph nodes (N2a). The cancer has not spread to distant sites. Stage IIIB--One of the following applies. T3-T4a, N1, M0: The cancer has grown into the outermost layers of the colon or rectum (T3) or through the visceral peritoneum (T4a) but has not reached nearby organs. The cancer has spread to 1 to 3 nearby lymph nodes (N1a/N1b) or into areas of fat near the lymph nodes but not the nodes themselves (N1c). It has not spread to distant sites. T2-T3, N2a, M0: The cancer has grown into the muscularis propria (T2) or into the outermost layers of the colon or rectum (T3). The cancer has spread to 4 to 6 nearby lymph nodes (N2a). It has not spread to distant sites. T1-T2, N2b, M0: The cancer has grown through the mucosa into the submucosa (T1) or it may also have grown into the muscularis propria (T2). The cancer has spread to 7 or more nearby lymph nodes (N2b). The cancer has not spread to distant sites. Stage IIIC--One of the following applies. T4a, N2a, M0: The cancer has grown through the wall of the colon or rectum (including the visceral peritoneum) but has not reached nearby organs (T4a). The cancer has spread to 4 to 6 nearby lymph nodes (N2a). The cancer has not spread to distant sites. T3-T4a, N2b, M0: The cancer has grown into the outermost layers of the colon or rectum (T3) or through the visceral peritoneum (T4a) but has not reached nearby organs. The cancer has spread to 7 or more nearby lymph nodes (N2b). The cancer has not spread to distant sites. T4b, N1-N2, M0: The cancer has grown through the wall of the colon or rectum and is attached to or has grown into other nearby tissues or organs (T4b). The cancer has spread to at least one nearby lymph node or into areas of fat near the lymph nodes (N1 or N2). The cancer has not spread to distant sites. Stage IVA--Any T, Any N, M1a: The cancer may or may not have grown through the wall of the colon or rectum, and it may or may not have spread to nearby lymph nodes. The cancer has spread to 1 distant organ (such as the liver or lung) or set of lymph nodes (M1a). Stage IVB--Any T, Any N, M1b: The cancer may or may not have grown through the wall of the colon or rectum, and it may or may not have spread to nearby lymph nodes. The cancer has spread to more than 1 distant organ (such as the liver or lung) or set of lymph nodes, or it has spread to distant parts of the peritoneum (the lining of the abdominal cavity) (M1b).
Colorectal Cancer Grading
The grade of the cancer is another factor that can affect the outlook for survival. Grade is a description of how closely the cancer looks like normal colorectal tissue when seen under a microscope. The scale used for grading colorectal cancers goes from G1 (where the cancer looks much like normal colorectal tissue) to G4 (where the cancer looks very abnormal). The grades G2 and G3 fall somewhere in between. The grade is often simplified as either "low grade" (G1 or G2) or "high grade" (G3 or G4). Low-grade cancers tend to grow and spread more slowly than high-grade cancers. Most of the time, the outlook is better for low-grade cancers than it is for high-grade cancers of the same stage. Doctors sometimes use this distinction to help decide treatment selection (e.g., additional (adjuvant) treatment with chemotherapy after surgery).
Diagnosis of colorectal cancer is via tumor biopsy typically done during sigmoidoscopy or colonoscopy. The extent of the disease is then usually determined by a CT scan of the chest, abdomen and pelvis. There are other potential imaging test such as PET and MRI which may be used in certain cases. The three main screening tests are fecal occult blood testing, flexible sigmoidoscopy and colonoscopy. Of the three, only sigmoidoscopy can not screen the right side of the colon where 42% of malignancies are found. Virtual colonoscopy via a CT scan can detect cancers and large adenomas but is expensive, associated with radiation exposure, and can not remove any detected abnormal growths like standard colonoscopy can.
Fecal occult blood testing of the stool is typically recommended every two years and can be either guaiac based orimmunochemical. Medical societies recommend screening between the age of 50 and 75 years with sigmoidoscopy every 5 years and colonoscopy every 10 years. For those at high risk, screenings usually begin at around 40. For people with average risk who have had a high-quality colonoscopy with normal results, the American Gastroenterological Association does not recommend any type of screening in the 10 years following the colonoscopy. For people over 75 or those with a life expectancy of less than 10 years, screening is not recommended.
Metabolomics has the potential to be a useful tool for identification of changes in biochemical signature associated with pathogenesis. However, tissue metabolomics requires biopsy samples and is invasive. Urine metabolomics has been shown to be a powerful approach to identify noninvasive biomarkers for diagnosis. A number of metabolomic studies have actually shown that metabolite composition of the tissue as well as biofluids from colorectal cancer patients are different from that of healthy controls thus raising the hope for an alternative noninvasive method for screening, diagnosis and therapeutic monitoring. On the other hand, sensitivity of the metabolome to factors such as genetic composition, food and environment, warrants exploration of the mechanistic link between biofluid biomarkers and molecular signatures of tumor tissue to identify robust biomarkers of pathogenesis and high-fidelity target pathways. Moreover, there has been a general lack of studies investigating the mechanistic link between these biomarkers and changes in cancer tissue.
Longitudinal changes in population at risk (due to genetic or environmental predisposition) vis-a-vis healthy controls to find out consistent and progressive changes during tumorigenesis, which may also yield early biomarkers. Animal models have long provided a reasonably sound fundamental and translational bypass on human biology. In fact, a large volume of the molecular events associated with colorectal carcinogenesis has been derived from research on animal models such as APC.sup.Min/+ mice. These animals harbor a mutation in an allele of the Adenomalous Polyposis Coli (APC) gene that causes familial adenomatous polyposis-associated colorectal cancer in humans. Mutations in the APC gene, which is involved in the Wnt-signaling pathway, are also frequently associated with sporadic colorectal cancer. The results herein describe, for the first time, a longitudinal trace of evolution in urinary metabolomic signature during colorectal carcinogenesis and detail a potential mechanistic link with transcriptomic and metabolomic changes in tumor tissue to identify potential high-throughput noninvasive biomarkers using APC.sup.Min/+ mouse model.
Adenomatous Polyposis Coli (APC)
The most commonly mutated gene in all colorectal cancer is the APC gene, which produces the APC protein. The APC protein, which is a tumor suppressor gene, inhibits the accumulation of .beta.-catenin protein. Without APC, .beta.-catenin accumulates to high levels and translocates (moves) into the nucleus, binds to DNA, and activates the transcription of genes that are normally important for stem cell renewal and differentiation but when inappropriately expressed at high levels can cause cancer. While APC is mutated in most colon cancers, some cancers have mutations in other Wnt signaling pathway proteins. For example, such situations where Wnt signaling pathway proteins are mutated other than APC include mutations in .beta.-catenin (CTNNB1) that block its degradation, resulting in increased .beta.-catenin levels, or mutation(s) in other genes with function analogous to APC such as AXIN1, AXIN2, TCF7L2, or NKD1. Like colorectal cancer, APC and Wnt signaling pathway proteins may be mutated in other cancers including small intestine cancer, duodenal cancer, gastric cancer, pancreatic cancer, liver cancer, esophageal cancer, ovarian cancer, prostate cancer, uterine cancer, breast cancer, thyroid cancer or melanoma (Giles et al., Biochim. Biophys. Acta. 2003; 1653: 1-24).
The amino acid sequence of an exemplary human APC sequence (isoform B) is provided at GenBank Accession No. NP_000029, which is reproduced below:
TABLE-US-00001 1 maassydqll kqvealkmen snlrqeledn snhltklete asnmkevlkq lqgsiedeam 61 assgqidlle rlkelnldss nfpqvklrsk mslrsygsre gsvssrsgec spvpmgsfpr 121 rgfvngsres tgyleeleke rsllladldk eekekdwyya qlqnltkrid slpltenfsl 181 qtdmtrrqle yearqirvam esqlgtcqdm ekraqrriar iqqiekdilr irgllqsqat 241 eaerssqnkh etgshdaerq negqgvgein matsgngqgs ttrmdhetas vlssssthsa 301 prrltshlgt kvemvyslls mlgthdkddm srtllamsss qdscismrqs gclplliqll 361 hgndkdsvll gnsrgskear arasaalhni ihsqpddkrg rreirvlhll eqiraycetc 421 wewqeahepg mdqdknpmpa pvehqicpav cvlmklsfde ehrhamnelg glqaisellq 481 vdcemygltn dhysitlrry agmaltnltf gdvankatlc smkgcmralv aqlksesedl 541 qqviasvlrn lswradvnsk ktlrevgsvk almecalevk kestlksvls alwnlsahct 601 enkadicavd galaflvgtl tyrsqtntla iiesgggilr nvssliatne dhrqilrenn 661 clqtllqhlk shsltivsna cgtlwnlsar npkdqealwd mgavsmlknl ihskhkmiam 721 gsaaalrnim anrpakykda nimspgsslp slhvrkqkal eaeldaqhls etfdnidnls 781 pkashrskqr hkqslygdyv fdtnrhddnr sdnfhtgnmt vlspylnttv lpsssssrgs 841 ldssrsekdr slerergigl gnyhpatenp gtsskrglqi sttaaqiakv meevsaihts 901 qedrssgstt elhcvtdern alrrssaaht hsntynftks ensnrtcsmp yakleykrss 961 ndslnsvsss dgygkrgqmk psiesysedd eskfcsygqy padlahkihs anhmddndge 1021 ldtpinyslk ysdeqlnsgr gspsqnerwa rpkhiiedei kqseqrqsrn qsttypvyte 1081 stddkhlkfq phfgqqecvs pyrargangs etnrvgshhg inqnvsqslc qeddyeddkp 1141 tnyserysee eqheeeerpt nysikyneek rhvdqpidys lkyatdipss qkqsfsfsks 1201 ssgqaskteh mssssentst pssnakrqng lhpssaqsrs gqpqkaatck vssinqetiq 1261 tycvedtpic fsrcsslssl ssaedeigcn qttqeadsan tlqiaeikek igtrsaedpv 1321 sevpavsqhp rtkssrlqgs slssesarnk avefssgaks psksgaqtpk sppehyvqet 1381 plmfsrctsv ssldsfesrs iassvqsepc sgmvsgiisp sdlpdspgqt mppsrsktpp 1441 pppqtaqtkr evpknkapta ekresgpkqa avnaavqrvq vlpdadtllh fatestpdgf 1501 scssslsals ldepfiqkdv elrimppvqe ndngnetese qpkesnenqe keaektidse 1561 kdllddsddd dielleecii samptkssrk akkpaqtask lpppvarkps qlpvykllps 1621 qnrlqpqkhv sftpgddmpr vycvegtpin fstatslsdl tiesppnela agegvrggaq 1681 sgefekrdti ptegrstdea qggktssvti pelddnkaee gdilaecins ampkgkshkp 1741 frvkkimdqv gqasasssap nknqldgkkk kptspvkpip qnteyrtrvr knadsknnln 1801 aervfsdnkd skkqnlknns kvfndklpnn edrvrgsfaf dsphhytpie gtpycfsrnd 1861 slssldfddd dvdlsrekae lrkakenkes eakvtshtel tsnqqsankt qaiakqpinr 1921 gqpkpliqkq stfpqsskdi pdrgaatdek lqnfaientp vcfshnssls slsdidqenn 1981 nkenepiket eppdsqgeps kpqasgyapk sfhvedtpvc fsrnsslssl sidseddllq 2041 ecissampkk kkpsrlkgdn ekhsprnmgg ilgedltldl kdiqrpdseh glspdsenfd 2101 wkaiqegans ivsslhqaaa aaclsrqass dsdsilslks gislgspfhl tpdqeekpft 2161 snkgprilkp gekstletkk ieseskgikg gkkvykslit gkvrsnseis gqmkqplqan 2221 mpsisrgrtm ihipgvrnss sstspvskkg pplktpasks psegqtatts prgakpsvks 2281 elspvarqts qiggsskaps rsgsrdstps rpaqqplsrp iqspgrnsis pgrngisppn 2341 klsqlprtss pstastkssg sgkmsytspg rqmsqqnltk qtglsknass iprsesaskg 2401 lnqmnngnga nkkvelsrms stkssgsesd rserpvlvrq stfikeapsp tlrrkleesa 2461 sfeslspssr pasptrsqaq tpvlspslpd mslsthssvq aggwrklppn lsptieyndg 2521 rpakrhdiar shsespsrlp inrsgtwkre hskhssslpr vstwrrtgss ssilsasses 2581 sekaksedek hvnsisgtkq skenqvsakg twrkikenef sptnstsqtv ssgatngaes 2641 ktliyqmapa vsktedvwvr iedcpinnpr sgrsptgntp pvidsvseka npnikdskdn 2701 qakqnvgngs vpmrtvglen rlnsfiqvda pdqkgteikp gqnnpvpvse tnessivert 2761 pfsssssskh sspsgtvaar vtpfnynpsp rkssadstsa rpsqiptpvn nntkkrdskt 2821 dstessgtqs pkrhsgsylv tsv
APC is a 2843-amino acid polypeptide. The nucleotide sequence of human APC corresponds to nucleotides 86-8617 of the human APC mRNA transcript (variant 3) provided at GenBank Accession No. NM_000038.5, which is reproduced below:
TABLE-US-00002 1 gtattggtgc agcccgccag ggtgtcactg gagacagaat ggaggtgctg ccggactcgg 61 aaatggggtc caagggtagc caaggatggc tgcagcttca tatgatcagt tgttaaagca 121 agttgaggca ctgaagatgg agaactcaaa tcttcgacaa gagctagaag ataattccaa 181 tcatcttaca aaactggaaa ctgaggcatc taatatgaag gaagtactta aacaactaca 241 aggaagtatt gaagatgaag ctatggcttc ttctggacag attgatttat tagagcgtct 301 taaagagctt aacttagata gcagtaattt ccctggagta aaactgcggt caaaaatgtc 361 cctccgttct tatggaagcc gggaaggatc tgtatcaagc cgttctggag agtgcagtcc 421 tgttcctatg ggttcatttc caagaagagg gtttgtaaat ggaaacagag aaagtactgg 481 atatttagaa gaacttgaga aagagaggtc attgcttctt gctgatcttg acaaagaaga 541 aaaggaaaaa gactggtatt acgctcaact tcagaatctc actaaaagaa tagatagtct 601 tcctttaact gaaaattttt ccttacaaac agatatgacc agaaggcaat tggaatatga 661 agcaaggcaa atcagagttg cgatggaaga acaactaggt acctgccagg atatggaaaa 721 acgagcacag cgaagaatag ccagaattca gcaaatcgaa aaggacatac ttcgtatacg 781 acagctttta cagtcccaag caacagaagc agagaggtca tctcagaaca agcatgaaac 841 cggctcatat gatgctgagc ggcagaatga aggtcaagga gtgggagaaa tcaacatggc 901 aacttctggt aatggtcagg gttcaactac acgaatggac catgaaacag ccagtgtttt 961 gagttctagt agcacacact ctgcacctcg aaggctgaca agtcatctgg gaaccaaggt 1021 ggaaatggtg tattcattgt tgtcaatgct tggtactcat gataaggatg atatgtcgcg 1081 aactttgcta gctatgtcta gctcccaaga cagctgtata tccatgcgac agtctggatg 1141 tcttcctctc ctcatccagc ttttacatgg caatgacaaa gactctgtat tgttgggaaa 1201 ttcccggggc agtaaagagg ctcgggccag ggccagtgca gcactccaca acatcattca 1261 ctcacagcct gatgacaaga gaggcaggcg tgaaatccga gtccttcatc ttttggaaca 1321 gatacgcgct tactgtgaaa cctgttggga gtggcaggaa gctcatgaac caggcatgga 1381 ccaggacaaa aatccaatgc cagctcctgt tgaacatcag atctgtcctg ctgtgtgtgt 1441 tctaatgaaa ctttcatttg atgaagagca tagacatgca atgaatgaac tagggggact 1501 acaggccatt gcagaattat tgcaagtgga ctgtgaaatg tatgggctta ctaatgacca 1561 ctacagtatt acactaagac gatatgctgg aatggctttg acaaacttga cttttggaga 1621 tgtagccaac aaggctacgc tatgctctat gaaaggctgc atgagagcac ttgtggccca 1681 actaaaatct gaaagtgaag acttacagca ggttattgcg agtgttttga ggaatttgtc 1741 ttggcgagca gatgtaaata gtaaaaagac gttgcgagaa gttggaagtg tgaaagcatt 1801 gatggaatgt gctttagaag ttaaaaagga atcaaccctc aaaagcgtat tgagtgcctt 1861 atggaatttg tcagcacatt gcactgagaa taaagctgat atatgtgctg tagatggtgc 1921 acttgcattt ttggttggca ctcttactta ccggagccag acaaacactt tagccattat 1981 tgaaagtgga ggtgggatat tacggaatgt gtccagcttg atagctacaa atgaggacca 2041 caggcaaatc ctaagagaga acaactgtct acaaacttta ttacaacact taaaatctca 2101 tagtttgaca atagtcagta atgcatgtgg aactttgtgg aatctctcag caagaaatcc 2161 taaagaccag gaagcattat gggacatggg ggcagttagc atgctcaaga acctcattca 2221 ttcaaagcac aaaatgattg ctatgggaag tgctgcagct ttaaggaatc tcatggcaaa 2281 taggcctgcg aagtacaagg atgccaatat tatgtctcct ggctcaagct tgccatctct 2341 tcatgttagg aaacaaaaag ccctagaagc agaattagat gctcagcact tatcagaaac 2401 ttttgacaat atagacaatt taagtcccaa ggcatctcat cgtagtaagc agagacacaa 2461 gcaaagtctc tatggtgatt atgtttttga caccaatcga catgatgata ataggtcaga 2521 caattttaat actggcaaca tgactgtcct ttcaccatat ttgaatacta cagtgttacc 2581 cagctcctct tcatcaagag gaagcttaga tagttctcgt tctgaaaaag atagaagttt 2641 ggagagagaa cgcggaattg gtctaggcaa ctaccatcca gcaacagaaa atccaggaac 2701 ttcttcaaag cgaggtttgc agatctccac cactgcagcc cagattgcca aagtcatgga 2761 agaagtgtca gccattcata cctctcagga agacagaagt tctgggtcta ccactgaatt 2821 acattgtgtg acagatgaga gaaatgcact tagaagaagc tctgctgccc atacacattc 2881 aaacacttac aatttcacta agtcggaaaa ttcaaatagg acatgttcta tgccttatgc 2941 caaattagaa tacaagagat cttcaaatga tagtttaaat agtgtcagta gtagtgatgg 3001 ttatggtaaa agaggtcaaa tgaaaccctc gattgaatcc tattctgaag atgatgaaag 3061 taagttttgc agttatggtc aatacccagc cgacctagcc cataaaatac atagtgcaaa 3121 tcatatggat gataatgatg gagaactaga tacaccaata aattatagtc ttaaatattc 3181 agatgagcag ttgaactctg gaaggcaaag tccttcacag aatgaaagat gggcaagacc 3241 caaacacata atagaagatg aaataaaaca aagtgagcaa agacaatcaa ggaatcaaag 3301 tacaacttat cctgtttata ctgagagcac tgatgataaa cacctcaagt tccaaccaca 3361 ttttggacag caggaatgtg tttctccata caggtcacgg ggagccaatg gttcagaaac 3421 aaatcgagtg ggttctaatc atggaattaa tcaaaatgta agccagtctt tgtgtcaaga 3481 agatgactat gaagatgata agcctaccaa ttatagtgaa cgttactctg aagaagaaca 3541 gcatgaagaa gaagagagac caacaaatta tagcataaaa tataatgaag agaacgtca 3601 tgtggatcag cctattgatt atagtttaaa atatgccaca gatattcctt catcacagaa 3661 acagtcattt tcattctcaa agagttcatc tggacaaagc agtaaaaccg aacatatgtc 3721 ttcaagcagt gagaatacgt ccacaccttc atctaatgcc aagaggcaga atcagctcca 3781 tccaagttct gcacagagta gaagtggtca gcctcaaaag gctgccactt gcaaagtttc 3841 ttctattaac caagaaacaa tacagactta ttgtgtagaa gatactccaa tatgtttttc 3901 aagatgtagt tcattatcat ctttgtcatc agctgaagat gaaataggat gtaatcagac 3961 gacacaggaa gcagattctg ctaataccct gcaaatagca gaaataaaag aaaagattgg 4021 aactaggtca gctgaagatc ctgtgagcga agttccagca gtgtcacagc accctagaac 4081 caaatccagc agactgcagg gttctagttt atcttcagaa tcagccaggc acaaagctgt 4141 tgaattttct tcaggagcga aatctccctc caaaagtggt gctcagacac ccaaaagtcc 4201 acctgaacac tatgttcagg agaccccact catgtttagc agatgtactt ctgtcagttc 4261 acttgatagt tttgagagtc gttcgattgc cagctccgtt cagagtgaac catgcagtgg 4321 aatggtaagt ggcattataa gccccagtga tcttccagat agccctggac aaaccatgcc 4381 accaagcaga agtaaaacac ctccaccacc tcctcaaaca gctcaaacca agcgagaagt 4441 acctaaaaat aaagcaccta ctgctgaaaa gagagagagt ggacctaagc aagctgcagt 4501 aaatgctgca gttcagaggg tccaggttct tccagatgct gatactttat tacattttgc 4561 cacggaaagt actccagatg gattttcttg ttcatccagc ctgagtgctc tgagcctcga 4621 tgagccattt atacagaaag atgtggaatt aagaataatg cctccagttc aggaaaatga 4681 caatgggaat gaaacagaat cagagcagcc taaagaatca aatgaaaacc aagagaaaga 4741 ggcagaaaaa actattgatt ctgaaaagga cctattagat gattcagatg atgatgatat 4801 tgaaatacta gaagaatgta ttatttctgc catgccaaca aagtcatcac gtaaagcaaa 4861 aaagccagcc cagactgctt caaaattacc tccacctgtg gcaaggaaac caagtcagct 4921 gcctgtgtac aaacttctac catcacaaaa caggttgcaa ccccaaaagc atgttagttt 4981 tacaccgggg gatgatatgc cacgggtgta ttgtgttgaa gggacaccta taaacttttc 5041 cacagctaca tctctaagtg atctaacaat cgaatcccct ccaaatgagt tagctgctgg 5101 agaaggagtt agaggagggg cacagtcagg tgaatttgaa aaacgagata ccattcctac 5161 agaaggcaga agtacagatg aggctcaagg aggaaaaacc tcatctgtaa ccatacctga 5221 attggatgac aataaagcag aggaaggtga tattcttgca gaatgcatta attctgctat 5281 gcccaaaggg aaaagtcaca agcctttccg tgtgaaaaag ataatggacc aggtccagca 5341 agcatctgcg tcttcttctg cacccaacaa aaatcagtta gatggtaaga aaaagaaacc 5401 aacttcacca gtaaaaccta taccacaaaa tactgaatat aggacacgtg taagaaaaaa 5461 tgcagactca aaaaataatt taaatgctga gagagttttc tcagacaaca aagattcaaa 5521 gaaacagaat ttgaaaaata attccaaggt cttcaatgat aagctcccaa ataatgaaga 5581 tagagtcaga ggaagttttg cttttgattc acctcatcat tacacgccta ttgaaggaac 5641 tccttactgt ttttcacgaa atgattcttt gagttctcta gattttgatg atgatgatgt 5701 tgacctttcc agggaaaagg ctgaattaag aaaggcaaaa gaaaataagg aatcagaggc 5761 taaagttacc agccacacag aactaacctc caaccaacaa tcagctaata agacacaagc 5821 tattgcaaag cagccaataa atcgaggtca gcctaaaccc atacttcaga aacaatccac 5881 ttttccccag tcatccaaag acataccaga cagaggggca gcaactgatg aaaagttaca 5941 gaattttgct attgaaaata ctccggtttg cttttctcat aattcctctc tgagttctct 6001 cagtgacatt gaccaagaaa acaacaataa agaaaatgaa cctatcaaag agactgagcc 6061 ccctgactca cagggagaac caagtaaacc tcaagcatca ggctatgctc ctaaatcatt 6121 tcatgttgaa gataccccag tttgtttctc aagaaacagt tctctcagtt ctcttagtat 6181 tgactctgaa gatgacctgt tgcaggaatg tataagctcc gcaatgccaa aaaagaaaaa 6241 gccttcaaga ctcaagggtg ataatgaaaa acatagtccc agaaatatgg gtggcatatt 6301 aggtgaagat ctgacacttg atttgaaaga tatacagaga ccagattcag aacatggtct 6361 atcccctgat tcagaaaatt ttgattggaa agctattcag gaaggtgcaa attccatagt 6421 aagtagttta catcaagctg ctgctgctgc atgtttatct agacaagctt cgtctgattc 6481 agattccatc ctttccctga aatcaagaat ctctctggga tcaccatttc atcttacacc 6541 tgatcaagaa gaaaaaccct ttacaagtaa taaaggccca cgaattctaa aaccagggga 6601 gaaaagtaca ttggaaacta aaaagataga atctgaaagt aaaggaatca aaggaggaaa 6661 aaaagtttat aaaagtttga ttactggaaa agttcgatct aattcagaaa tttcaggcca 6721 aatgaaacag ccccttcaag caaacatgcc ttcaatctct cgaggcagga caatgattca 6781 tattccagga gttcgaaata gctcctcaag tacaagtcct gtttctaaaa aaggcccacc 6841 ccttaagact ccagcctcca aaagccctag tgaaggtcaa acagccacca cttctcctag 6901 aggagccaag ccatctgtga aatcagaatt aagccctgtt gccaggcaga catcccaaat 6961 aggtgggtca agtaaagcac cttctagatc aggatctaga gattcgaccc cttcaagacc 7021 tgcccagcaa ccattaagta gacctataca gtctcctggc cgaaactcaa tttcccctgg 7081 tagaaatgga ataagtcctc ctaacaaatt atctcaactt ccaaggacat catcccctag 7141 tactgcttca actaagtcct caggttctgg aaaaatgtca tatacatctc caggtagaca 7201 gatgagccaa cagaacctta ccaaacaaac aggtttatcc aagaatgcca gtagtattcc 7261 aagaagtgag tctgcctcca aaggactaaa tcagatgaat aatggtaatg gagccaataa 7321 aaaggtagaa ctttctagaa tgtcttcaac taaatcaagt ggaagtgaat ctgatagatc 7381 agaaagacct gtattagtac gccagtcaac tttcatcaaa gaagctccaa gcccaacctt 7441 aagaagaaaa ttggaggaat ctgcttcatt tgaatctctt tctccatcat ctagaccagc
7501 ttctcccact aggtcccagg cacaaactcc agttttaagt ccttcccttc ctgatatgtc 7561 tctatccaca cattcgtctg ttcaggctgg tggatggcga aaactcccac ctaatctcag 7621 tcccactata gagtataatg atggaagacc agcaaagcgc catgatattg cacggtctca 7681 ttctgaaagt ccttctagac ttccaatcaa taggtcagga acctggaaac gtgagcacag 7741 caaacattca tcatcccttc ctcgagtaag cacttggaga agaactggaa gttcatcttc 7801 aattctttct gcttcatcag aatccagtga aaaagcaaaa agtgaggatg aaaaacatgt 7861 gaactctatt tcaggaacca aacaaagtaa agaaaaccaa gtatccgcaa aaggaacatg 7921 gagaaaaata aaagaaaatg aattttctcc cacaaatagt acttctcaga ccgtttcctc 7981 aggtgctaca aatggtgctq aatcaaagac tctaatttat caaatggcac ctgctgtttc 8041 taaaacagag gatgtttggg tgagaattga ggactgtccc attaacaatc ctagatctgg 8101 aagatctccc acaggtaata ctcccccggt gattgacagt gtttcagaaa aggcaaatcc 8161 aaacattaaa gattcaaaag ataatcaggc aaaacaaaat gtgggtaatg gcagtgttcc 8221 catgcgtacc gtgggtttgg aaaatcgcct gaactccttt attcaggtgg atgcccctga 8281 ccaaaaagga actgagataa aaccaggaca aaataatcct gtccctgtat cagagactaa 8341 tgaaagttct atagtggaac gtaccccatt cagttctagc agctcaagca aacacagttc 8401 acctagtggg actgttgctg ccagagtgac tccttttaat tacaacccaa gccctaggaa 8461 aagcagcgca gatagcactt cagctcggcc atctcagatc ccaactccag tgaataacaa 8521 cacaaagaag cgagattcca aaactgacag cacagaatcc agtggaaccc aaagtcctaa 8581 gcgccattct gggtcttacc ttgtgacatc tgtttaaaag agaggaagaa tgaaactaag 8641 aaaattctat gttaattaca actgctatat agacattttg tttcaaatga aactttaaaa 8701 gactgaaaaa ttttgtaaat aggtttgatt cttgttagag ggtttttgtt ctggaagcca 8761 tatttgatag tatactttgt cttcactggt cttattttgg gaggcactct tgatggttag 8821 gaaaaaaata gtaaagccaa gtatgtttgt acagtatgtt ttacatgtat ttaaagtagc 8881 atcccatccc aacttccttt aattattgct tgtcttaaaa taatgaacac tacagataga 8941 aaatatgata tattgctgtt atcaatcatt tctagattat aaactgacta aacttacatc 9001 agggaaaaat tggtatttat gcaaaaaaaa atgtttttgt ccttgtgagt ccatctaaca 9061 tcataattaa tcatgtggct gtgaaattca cagtaatatg gttcccgatg aacaagttta 9121 cccagcctgc tttgctttac tgcatgaatg aaactgatgg ttcaatttca gaagtaatga 9181 ttaacagtta tgtggtcaca tgatgtgcat agagatagct acagtgtaat aatttacact 9241 attttgtgct ccaaacaaaa caaaaatctg tgtaactgta aaacattgaa tgaaactatt 9301 ttacctgaac tagattttat ctgaaagtag gtagaatttt tgctatgctg taatttgttg 9361 tatattctgg tatttgaggt gagatggctg ctcttttatt aatgagacat gaattgtgtc 9421 tcaacagaaa ctaaatgaac atttcagaat aaattattgc tgtatgtaaa ctgttactga 9481 aattggtatt tgtttgaagg gtcttgtttc acatttgtat taataattgt ttaaaatgcc 9541 tcttttaaaa gcttatataa atttttttct tcagcttcta tgcattaaga gtaaaattcc 9601 tcttactgta ataaaaacaa ttgaagaaga ctgttgccac ttaaccattc catgcgttgg 9661 cacttatcta ttcctgaaat ttcttttatg tgattagctc atcttgattt ttaatatttt 9721 tccacttaaa cttttttttc ttactccact ggagctcagt aaaagtaaat tcatgtaata 9781 gcaatgcaag cagcctagca cagactaagc attgagcata ataggcccac ataatttcct 9841 ctttcttaat attatagaat tctgtacttg aaattgattc ttagacattg cagtctcttc 9901 gaggctttac agtgtaaact gtcttgcccc ttcatcttct tgttgcaact gggtctgaca 9961 tgaacacttt ttatcaccct gtatgttagg gcaagatctc agcagtgaag tataatcagc 10021 actttgccat gctcagaaaa ttcaaatcac atggaacttt agaggtagat ttaatacgat 10081 taagatattc agaagtatat tttagaatcc ctgcctgtta aggaaacttt atttgtggta 10141 ggtacagttc tggggtacat gttaagtgtc cccttataca gtggagggaa gtcttccttc 10201 ctgaaggaaa ataaactgac acttattaac taagataatt tacttaatat atcttccctg 10261 atttgtttta aaagatcaga gggtgactga tgatacatgc atacatattt gttgaataaa 10321 tgaaaattta tttttagtga taagattcat acactctgta tttggggagg gaaaaccttt 10381 ttaagcatgg tggggcactc agataggagt gaatacacct acctggtgcc ttgaaaatca 10441 catcaagtag ttaattatct accccttacc tgtgtttata acttccaggt aatgagaatg 10501 atttttttta aagctaaaat gccagtaaat aaaagtgcta tgacttgagc taagatattt 10561 gactccaatg cctgtactgt gtctactgca ccactttgta aacacttcaa tttactatct 10621 ttgaaatgat tgacctttaa atttttgcca aatgttatct gaaattgtct atgaatacca 10681 tctacttctg ttgttttccc aggcttccat aaacaatgga gatacatgca aaaaaaaaaa
Familial adenomatous polyposis (FAP) is caused by mutations in the APC gene. More than 800 mutations in the APC gene have been identified in families with classic and attenuated types of familial adenomatous polyposis. Most of these mutations cause the production of an APC protein that is abnormally short and nonfunctional. This short protein cannot suppress the cellular overgrowth that leads to the formation of polyps, which can become cancerous. The most common mutation in familial adenomatous polyposis is a deletion of five bases in the APC gene. This mutation changes the sequence of amino acids in the resulting APC protein beginning at position 1309.
Another mutation is carried by approximately 6 percent of people of Ashkenazi (eastern and central European) Jewish heritage. This mutation results in the substitution of the amino acid lysine for isoleucine at position 1307 in the APC protein (also written as I1307K or Ile1307Lys). This change was initially thought to be harmless, but has recently been shown to be associated with a 10 to 20 percent increased risk of colon cancer.
Detection of Biomarkers
Any suitable method can be used to detect the biomarker(s). Successful practice of the invention can be achieved with one or a combination of methods that can detect and, in embodiments, quantify the biomarker(s). Detection of the biomarkers of the invention (e.g. symmetric-dimethylarginine, symmetric-dimethylarginine, carnitine, methionine, dimethylglycine, betaine, proline, glutamine, glutamic acid, threonine, and N.alpha.-acetyllysine, xanthosine, inosine, deoxyuridine, thymidine, deoxycytidine, cytosine, hypoxanthine, xanthine, uracil, guanosine, adenosine, N1-acetylspermidine, N8-acetylspermidine, spermine, arginine ornithine, citrulline and M264 can be detected using one or more methods well known in the art, including, without limitation, mass spectrometry, chromatography, spectroscopy (e.g., NMR), elemental analysis, conventional chemical methods, immunoassays, and the like.
Detection of the biomarkers can be conducted in the same or different samples, the same or separate assays, and may be conducted in the same or different reaction mixtures. Where the biomarkers are assayed in different samples, the samples are usually obtained from the subject during the same procedure (e.g., urine collection, blood draw, tissue extraction, and the like) or with only a relative short time intervening so as to avoid an incorrect result due to passage of time. Where the biomarkers are detected in separate assays, the samples assayed are can be derived from the same or different samples obtained from the subject to be tested.
In embodiments, the biomarker(s) are detected using mass spectrometry. Mass spectrometry-based methods exploit the differences in mass of biomarkers to facilitate detection. Mass spectrometry can be combined with other assays, e.g., resolving the analyte in a sample by one or two passes through liquid or gas chromatography followed by mass spectrometry analysis. Methods for preparing a biological sample for analysis by mass spectrometry are well known in the art. Suitable mass spectrometers for use include, without limit, electrospray ionization mass spectrometry (ESI-MS), ESIMS/MS, ESI-MS/(MS)n (n is an integer greater than zero), matrix-assisted laser desorption ionization time-of-flight mass spectrometry (MALDI-TOF-MS), electron impact ionization mass spectrometry (EI-MS), chemical ionization mass spectrometry (CI-MS), surface-enhanced laser desorption/ionization time-of-flight mass spectrometry (SELDI-TOF-MS), desorption/ionization on silicon (DIOS), secondary ion mass spectrometry (SIMS), quadrupole timeof-flight (Q-TOF), atmospheric pressure chemical ionization mass spectrometry (APCI-MS), APCI-MS/MS, APCI(MS)11, atmospheric pressure photoionization mass spectrometry (APPI-MS), APPI-MS/MS, APPI-(MS), quadrupole, fourier transform mass spectrometry (FTMS), ion trap, and hybrids of these methods, e.g., electrospray ionization quadrupole time-of-flight mass spectrometry (UPLC-ESI-QTOFMS) and two-dimensional gas chromatography electron impact ionization mass spectrometry (GC.times.GC-EI-MS).
The methods may be performed in an automated (Villanueva, et al., Nature Protocols (2006) 1(2):880-891) or semi-automated format. This can be accomplished, for example with MS operably linked to a liquid chromatography device (LC-MS/MS or LC-MS) or gas chromatography device (GC-MS or GC-MS/MS). Methods for performing MS are known in the field and have been disclosed, for example, in US Patent Application Publication Nos: 20050023454 and 20050035286; U.S. Pat. No. 5,800,979; and the references disclosed therein.
Samples are collected on a collection layer. They may then be analyzed by a spectroscopic method based on matrix-assisted laser desorption/ionization (MALDI), electrospray ionization (ESI), and the like.
Other techniques for improving the mass accuracy and sensitivity of the MALDI-TOF MS can be used to analyze the analytes obtained on the collection membrane. These include the use of delayed ion extraction, energy reflectors and ion-trap modules. In addition, post source decay and MS-MS analysis are useful to provide further structural analysis. With ESI, the sample is in the liquid phase and the analysis can be by ion-trap, TOF, single quadrupole or multi-quadrupole mass spectrometers. The use of such devices (other than a single quadrupole) allows MS-MS or MS.sup.n analysis to be performed. Tandem mass spectrometry allows multiple reactions to be monitored at the same time.
Capillary infusion may be employed to introduce the marker to a desired MS implementation, for instance, because it can efficiently introduce small quantities of a sample into a mass spectrometer without destroying the vacuum. Capillary columns are routinely used to interface the ionization source of a MS with other separation techniques including gas chromatography (GC) and liquid chromatography (LC). GC and LC can serve to separate a solution into its different components prior to mass analysis. Such techniques are readily combined with MS, for instance. One variation of the technique is that high performance liquid chromatography (HPLC) can now be directly coupled to mass spectrometer for integrated sample separation/and mass spectrometer analysis.
Quadrupole mass analyzers may also be employed as needed to practice the invention. Fourier-transform ion cyclotron resonance (FTMS) can also be used for some invention embodiments. It offers high resolution and the ability of tandem MS experiments. FTMS is based on the principle of a charged particle orbiting in the presence of a magnetic field. Coupled to ESI and MALDI, FTMS offers high accuracy with errors as low as 0.001%.
In embodiments, the diagnostic methods of the invention may further comprise identifying significant peaks from combined spectra. The methods may also further comprise searching for outlier spectra. In other embodiments, the methods of the invention further comprise determining distant dependent K-nearest neighbors.
In embodiments, an ion mobility spectrometer can be used to detect and characterize the biomarker(s). The principle of ion mobility spectrometry is based on different mobility of ions. Specifically, ions of a sample produced by ionization move at different rates, due to their difference in, e.g., mass, charge, or shape, through a tube under the influence of an electric field. The ions (typically in the form of a current) are registered at the detector which can then be used to identify a biomarker or other substances in a sample. One advantage of ion mobility spectrometry is that it can operate at atmospheric pressure.
In embodiments, the procedure is electrospray ionization quadrupole mass spectrometry with time of flight (TOF) analysis, known as UPLC-ESI-QTOFMS. UPLC-ESI-QTOFMS is well known in the art (see, e.g., Manna et al., J. Proteome Res. 9:4176-88 (2010)) and methods for using UPLC-ESI-QTOFMS are described in detail herein.
In embodiments, detection of the biomarker(s) involves chemical methods well known in the art. In embodiments, the chemical method is chemical extraction. In embodiments, the chemical method is chemical derivitization.
In embodiments, detection of the biomarker(s) involves use of chromatography methods that are well known in the art. Such chromatography methods include, without limit, column chromatography, ion exchange chromatography, hydrophobic (reverse phase) liquid chromatography, normal phase chromatography, hydrophilic interaction liquid chromatography, or other chromatography, such as thinlayer, gas, or liquid chromatography (e.g., high-performance or ultraperformance liquid chromatography), or any combination thereof.
In embodiments, detection of the biomarker(s) involves use of spectroscopy methods that are well known in the art. Such chromatography methods include, without limitation, NMR, IR, and the like.
In embodiments, detection of the biomarker(s) involves elemental analysis methods that are well known in the art. Such elemental analysis methods include, without limitation, combustion analysis, gravimetry, atomic spectroscopy, and the like.
In embodiments, detection of the biomarker(s) involves use of immunoassays. In embodiments, the immunoassays involve the use of antibodies. Suitable immunoassays include, without limitation, ELISA, flow chamber adhesion, colorimetric assays (e.g., antibody based colorimetric assays), biochip (e.g., antibody based biochip), and the like.
Analytes (e.g., biomarkers) can be detected by a variety of detection methods. Detection methods may include use of a biochip array. Biochip arrays useful in the invention include protein and polynucleotide arrays. One or more markers are captured on the biochip array and subjected to analysis to detect the level of the markers in a sample.
Markers may be captured with capture reagents immobilized to a solid support, such as a biochip, a multiwell microtiter plate, a resin, or a nitrocellulose membrane that is subsequently probed for the presence or level of a marker. Capture can be on a chromatographic surface or a biospecific surface. For example, a sample containing the markers, such as serum, may be used to contact the active surface of a biochip for a sufficient time to allow binding. Unbound molecules are washed from the surface using a suitable eluant, such as phosphate buffered saline. In general, the more stringent the eluant, the more tightly the proteins must be bound to be retained after the wash.
Upon capture on a biochip, analytes can be detected by a variety of detection methods selected from, for example, a gas phase ion spectrometry method, an optical method, an electrochemical method, atomic force microscopy and a radio frequency method. In one embodiment, mass spectrometry, and in particular, SELDI, is used. Optical methods include, for example, detection of fluorescence, luminescence, chemiluminescence, absorbance, reflectance, transmittance, birefringence or refractive index (e.g., surface plasmon resonance, ellipsometry, a resonant mirror method, a grating coupler waveguide method or interferometry). Optical methods include microscopy (both confocal and non-confocal), imaging methods and non-imaging methods. Immunoassays in various formats (e.g., ELISA) are popular methods for detection of analytes captured on a solid phase. Electrochemical methods include voltametry and amperometry methods. Radio frequency methods include multipolar resonance spectroscopy.
Other variations of the assays described herein to provide for different assay formats for detection of the biomarker(s) will be readily apparent to the one of ordinary skill in the art upon reading the present disclosure.
Types of Biological Samples
The level of symmetric-dimethylarginine, symmetric-dimethylarginine, carnitine, methionine, dimethylglycine, betaine, proline, glutamine, glutamic acid, threonine, and N.alpha.-acetyllysine, xanthosine, inosine, deoxyuridine, thymidine, deoxycytidine, cytosine, hypoxanthine, xanthine, uracil, guanosine, adenosine, N1-acetylspermidine, N8-acetylspermidine, spermine, arginine ornithine, citrulline and M264, or a combination thereof, is measured in different types of samples. In embodiment, the level of the biomarker(s) is measured in a biologic sample. Suitable biologic samples include, without limit, a tissue sample (e.g., from a biopsy) and biological or physiological fluids (e.g., urine, blood, blood serum, plasma, fecal aspirate, intestinal aspirate, bile, saliva, cerebrospinal fluid or any other biological fluid useful in the methods of the invention). In embodiments, the sample is a urine sample derived from the patient. In particular embodiments, the collection of a biological fluid is noninvasive (e.g., urine).
Subject Monitoring
The disease state or treatment of a subject having neoplasia (including colorectal cancer), or a propensity to develop such a condition can be monitored using the methods and biomarkers of the invention. In embodiments, methods and biomarkers of the invention are used by a clinician to identify subjects as having or not having neoplasia. For example, a general practitioner may use the methods delineated herein to screen patients for the presence of neoplasia. In embodiments, the level of biomarker(s) present in a patient sample, e.g., bodily fluid such as urine, blood, blood serum, plasma, fecal aspirate, bile, intestinal aspirate, or saliva, is monitored. Such monitoring may be useful, for example, in assessing disease progression or in assessing the efficacy of a particular drug in a subject. An increase in the level of a biomarker of the invention (e.g., symmetric-dimethylarginine, symmetric-dimethylarginine, carnitine, methionine, dimethylglycine, betaine, proline, glutamine, glutamic acid, threonine, and N.alpha.-acetyllysine, xanthosine, inosine, deoxyuridine, thymidine, deoxycytidine, cytosine, hypoxanthine, xanthine, uracil, guanosine, adenosine, N1-acetylspermidine, N8-acetylspermidine, spermine, arginine ornithine, citrulline and M264, or a combination thereof as specified herein) may indicate cancer onset or relapse. A decrease in the level of a biomarker of the invention (e.g., symmetric-dimethylarginine, symmetric-dimethylarginine, carnitine, methionine, dimethylglycine, betaine, proline, glutamine, glutamic acid, threonine, and N.alpha.-acetyllysine, xanthosine, inosine, deoxyuridine, thymidine, deoxycytidine, cytosine, hypoxanthine, xanthine, uracil, guanosine, adenosine, N1-acetylspermidine, N8-acetylspermidine, spermine, arginine ornithine, citrulline and M264, or a combination thereof as specified herein) may indicate cancer remission or the effectiveness of a therapy. Therapeutics that decrease the level of a biomarker of the invention (e.g., symmetric-dimethylarginine, symmetric-dimethylarginine, carnitine, methionine, dimethylglycine, betaine, proline, glutamine, glutamic acid, threonine, and N.alpha.-acetyllysine, xanthosine, inosine, deoxyuridine, thymidine, deoxycytidine, cytosine, hypoxanthine, xanthine, uracil, guanosine, adenosine, N1-acetylspermidine, N8-acetylspermidine, spermine, arginine ornithine, citrulline and M264, or a combination thereof as specified herein) are taken as particularly useful in the invention.
In embodiments, the biomarker(s) are monitored prior to administering therapy. These results provide a baseline that describes the level of the biomarker(s) prior to treatment. In embodiments, the biomarker(s) are monitored periodically. In embodiments, the biomarker(s) are monitored periodically throughout treatment. A therapy is identified as efficacious when a diagnostic assay of the invention detects a decrease in marker levels relative to the baseline level of marker prior to treatment.
Selection of a Treatment Method
After a subject is diagnosed as having colorectal cancer, a method of treatment is selected. In colorectal cancer, for example, a number of standard treatment regimens are available. The marker profile of the neoplasia is used in selecting a treatment method. Increased levels of symmetric-dimethylarginine, symmetric-dimethylarginine, carnitine, methionine, dimethylglycine, or betaine (methylation) correlate with a poor prognosis and an increased risk of death. Additionally, the levels of the methylation biomarkers may be used alone or in combination with the levels of biomarkers from one or more of the following groups: biomarkers related to nucleic acid metabolism including xanthosine, inosine, deoxyuridine, thymidine, deoxycytidine, cytosine, hypoxanthine, xanthine, uracil, guanosine, and adenosine; biomarkers related to urea cycle and polyamine metabolism including N1-acetylspermidine, N8-acetylspermidine, spermine, arginine omithine, and citrulline; and biomarkers related to amino acid metabolism including proline, glutamine, glutamic acid, threonine, and N.alpha.-acetyllysine, and M264 or a combination thereof. Increased levels of amino acid metabolism, nucleic acid metabolism, and/or polyamine metabolism biomarkers correlate with a poor prognosis and an increased risk of death. Such neoplasias are identified as aggressive neoplasias. Marker profiles that correlate with good clinical outcomes (e.g., decreased or basal levels of asymmetric-dimethylarginine and symmetric-dimethylarginine) are identified as less aggressive neoplasias.
Less aggressive neoplasias are likely to be susceptible to conservative treatment methods. Conservative treatment methods include, for example, cancer surveillance, which involves periodic patient monitoring using diagnostic assays of the invention. Cancer surveillance is selected when diagnostic assays indicate that the adverse effects of treatment (e.g., impotence, urinary, and bowel disorders) are likely to outweigh therapeutic benefits.
More aggressive neoplasias are less susceptible to conservative treatment methods. When methods of the invention indicate that a neoplasia is very aggressive, an aggressive method of treatment should be selected. Aggressive therapeutic regimens typically include one or more of the following therapies: radical surgery, radiation therapy (e.g., external beam and brachytherapy), and chemotherapy.
Therapy may be provided wherever cancer therapy is performed: at home, the doctor's office, a clinic, a hospital's outpatient department, or a hospital. Treatment generally begins at a hospital so that the doctor can observe the therapy's effects closely and make any adjustments that are needed. The duration of the therapy depends on the kind of cancer being treated, the age and condition of the patient, the stage and type of the patient's disease, and how the patient's body responds to the treatment. Drug administration may be performed at different intervals (e.g., daily, weekly, or monthly). Therapy may be given in on-and-off cycles that include rest periods so that the patient's body has a chance to build healthy new cells and regain its strength.
Depending on the type of cancer and its stage of development, the therapy can be used to slow the spreading of the cancer, to slow the cancer's growth, to kill or arrest cancer cells that may have spread to other parts of the body from the original tumor, to relieve symptoms caused by the cancer, or to prevent cancer in the first place. As used herein, the term "colorectal cancer" is meant a collection of colon, rectum, large intestine, or appendix cells multiplying in an abnormal manner. Cancer growth is uncontrolled and progressive, and occurs under conditions that would not elicit, or would cause cessation of, multiplication of normal cells.
Patient Monitoring
The diagnostic methods of the invention are also useful for monitoring the course of a colon cancer in a patient or for assessing the efficacy of a therapeutic regimen. In one embodiment, the diagnostic methods of the invention are used periodically to monitor the levels of biomarkers in one or more of the following groups: biomarkers related to methylation including asymmetric-dimethylarginine, symmetric-dimethylarginine, carnitine, methionine, dimethylglycine, and betaine; biomarkers related to nucleic acid metabolism including xanthosine, inosine, deoxyuridine, thymidine, deoxycytidine, cytosine, hypoxanthine, xanthine, uracil, guanosine, and adenosine; the biomarker related to urea cycle and polyamine metabolism including N1-acetylspermidine, N8-acetylspermidine, spermine, arginine ornithine, and citrulline; and biomarkers related to amino acid metabolism including proline, glutamine, glutamic acid, threonine, and N.alpha.-acetyllysine, and M264 or a combination thereof. In one example, the neoplasia is characterized using a diagnostic assay of the invention prior to administering therapy. This assay provides a baseline that describes the level of one or more markers of the neoplasia prior to treatment. Additional diagnostic assays are administered during the course of therapy to monitor the efficacy of a selected therapeutic regimen. A therapy is identified as efficacious when a diagnostic assay of the invention detects a decrease in marker levels relative to the baseline level of marker prior to treatment.
Microarrays
The invention provides diagnostic arrays or microarrays for measuring the levels of a metabolic biomarker in accordance with the invention. Capture reagents, including organic molecules, peptides, peptide mimetics, polypeptides, nucleic acid ligands, aptamers, and antibodies are useful array elements in the microarray. The array elements are organized in an ordered fashion such that each element is present at a specified location on the substrate. Useful substrate materials include membranes, composed of paper, nylon or other materials, filters, chips, glass slides, and other solid supports. The ordered arrangement of the array elements allows hybridization patterns and intensities to be interpreted as expression levels of particular genes or proteins. Methods for making nucleic acid microarrays are known to the skilled artisan and are described, for example, in U.S. Pat. No. 5,837,832, Lockhart, et al. (Nat. Biotech. 14:1675-1680, 1996), and Schena, et al. (Proc. Natl. Acad. Sci. 93:10614-10619, 1996), herein incorporated by reference. Methods for making polypeptide microarrays are described, for example, by Ge (Nucleic Acids Res. 28:e3.i-e3.vii, 2000), MacBeath et al., (Science 289:1760-1763, 2000), Zhu et al. (Nature Genet. 26:283-289), and in U.S. Pat. No. 6,436,665, hereby incorporated by reference.
To produce a nucleic acid microarray oligonucleotides may be synthesized or bound to the surface of a substrate using a chemical coupling procedure and an ink jet application apparatus, as described in PCT application WO95/251116 (Baldeschweiler et al.), incorporated herein by reference. Alternatively, a gridded array may be used to arrange and link cDNA fragments or oligonucleotides to the surface of a substrate using a vacuum system, thermal, UV, mechanical or chemical bonding procedure.
Metabolic biomarkers, such as those described herein, may also be analyzed using protein microarrays. Such arrays are useful in high-throughput low-cost screens to identify peptide or candidate compounds that bind a polypeptide of the invention, or fragment thereof. Typically, protein microarrays feature a protein, or fragment thereof, bound to a solid support. Suitable solid supports include membranes (e.g., membranes composed of nitrocellulose, paper, or other material), polymer-based films (e.g., polystyrene), beads, or glass slides. For some applications, proteins are spotted on a substrate using any convenient method known to the skilled artisan (e.g., by hand or by inkjet printer). Preferably, such methods retain the biological activity or function of the protein bound to the substrate (Ge et al., supra; Zhu et al., supra).
The microarray is hybridized with a detectable probe. Such probes can be small molecules, polypeptides, or nucleic acids. For some applications, small molecule probes are derived from a biological sample taken from a patient, such as a bodily fluid (e.g., urine, blood, blood serum, plasma, bile, fecal aspirate, intestinal aspirate, cerebrospinal fluid, and saliva); a homogenized tissue sample (e.g. a tissue sample obtained by biopsy); or cultured cells (e.g., colorectal cancer cells). Binding or capture conditions (e.g., temperature, pH, protein concentration, and ionic strength) are optimized to promote specific interactions. Such conditions are known to the skilled artisan and are described, for example, in Harlow, E. and Lane, D., Using Antibodies: A Laboratory Manual. 1998, New York: Cold Spring Harbor Laboratories. After removal of non-specific probes (e.g., by washing), specifically bound probes are detected, for example, by fluorescence, enzyme activity (e.g., an enzyme-linked calorimetric assay), direct immunoassay, radiometric assay, or any other suitable detectable method known to the skilled artisan. A detection system may be used to measure the absence, presence, and amount of binding or capture for all of the biomarkers simultaneously (e.g., Heller et al., Proc. Natl. Acad. Sci. 94:2150-2155, 1997). Preferably, a scanner is used to determine the levels and patterns of fluorescence.
Diagnostic Kits
The invention provides kits for diagnosing or monitoring neoplasia (e.g., colorectal cancer), or for selecting a treatment for neoplasia. In embodiments, the kits include one or more reagents capable of detecting and/or capturing one or more of the following groups of biomarkers: biomarkers related to methylation including asymmetric-dimethylarginine, symmetric-dimethylarginine, carnitine, methionine, dimethylglycine, and betaine; biomarkers related to nucleic acid metabolism including xanthosine, inosine, deoxyuridine, thymidine, deoxycytidine, cytosine, hypoxanthine, xanthine, uracil, guanosine, and adenosine; biomarkers related to urea cycle and polyamine metabolism including N1-acetylspermidine, N8-acetylspermidine, spermine, arginine ornithine, and citrulline; and biomarkers related to amino acid metabolism including proline, glutamine, glutamic acid, threonine, and N.alpha.-acetyllysine and M264 or a combination thereof. In certain embodiments, the reagent is an antibody or a mass spectrometry probe. The kit may include a collection of detection/capture reagents in the form of an array or panel which can be used for high throughput screening and/or profiling of samples.
In various embodiments, the kits include an affinity agent or adsorbent that retains one or more of the biomarkers, or a combination thereof. In related embodiments, the kit further contains directions for contacting a test sample with the affinity agent or adsorbent and detecting one or more of the biomarkers, or a combination thereof retained by the affinity agent or adsorbent. In various embodiments, the reagents and/or affinity agents are provided on a solid support (e.g., chip, microtiter plate, bead, resin, and the like). In embodiments, the kits include washing solution(s) or instructions for making a washing solution, in which the combination of the reagent/adsorbent and the washing solution allows capture of the biomarkers on the reagent/adsorbent.
In various embodiments, the kits include the biomarkers, which can be used as standard(s) for calibration as may be desired.
In various embodiments, the kit contains a container(s) that houses the components of the kit (e.g., reagent, adsorbant, solid support, and the like). Such containers can be boxes, ampoules, bottles, vials, tubes, bags, pouches, blister-packs, or other suitable container forms known in the art. Such containers can be made of plastic, glass, laminated paper, metal foil, and the like.
In various embodiments, the kits further contain directions for using the kit in any of the methods described herein (e.g., diagnosing neoplasia, monitoring neoplasia, characterizing neoplasia, selecting a treatment for neoplasia, and the like). In various embodiments, the instructions include at least one of the following: description of the reagents, supports, and/or affinity agents; warnings; indications; counter-indications; animal study data; clinical study data; and/or references. The instructions may be printed directly on the container (when present), or as a label applied to the container, or as a separate sheet, pamphlet, card, or folder supplied in or with the container.
The practice of the present invention employs, unless otherwise indicated, conventional techniques of molecular biology (including recombinant techniques), microbiology, cell biology, biochemistry and immunology, which are well within the purview of the skilled artisan. Such techniques are explained fully in the literature, such as, "Molecular Cloning: A Laboratory Manual", second edition (Sambrook, 1989); "Oligonucleotide Synthesis" (Gait, 1984); "Animal Cell Culture" (Freshney, 1987); "Methods in Enzymology" "Handbook of Experimental Immunology" (Weir, 1996); "Gene Transfer Vectors for Mammalian Cells" (Miller and Calos, 1987); "Current Protocols in Molecular Biology" (Ausubel, 1987); "PCR: The Polymerase Chain Reaction", (Mullis, 1994); "Current Protocols in Immunology" (Coligan, 1991). These techniques are applicable to the production of the polynucleotides and polypeptides of the invention, and, as such, may be considered in making and practicing the invention. Particularly useful techniques for particular embodiments will be discussed in the sections that follow.
The following examples are put forth so as to provide those of ordinary skill in the art with a complete disclosure and description of how to make and use the assay, screening, and therapeutic methods of the invention, and are not intended to limit the scope of what the inventors regard as their invention.
EXAMPLES
Example 1. Distinct Metabolic Traits Correlated with Colorectal Tumor Development in APC.sup.Min/+ Mice
All APC.sup.Min/+ mice studied developed colorectal tumors along with multiple intestinal polyps compared to wild-type mice, which were tumor-free at six months of age (FIG. 1A). The unsupervised principal components analysis of the total ion count-normalized urinary metabolomics data were acquired with hydrophilic interaction chromatography-based separation of the metabolites (FIG. 2A). Analysis of the urinary metabolomics data did not show segregation of APC.sup.Min/+ and wild-type metabolomes. However, creatinine-normalized data (FIG. 2B) showed clear separation of the wild-type and APC.sup.Min/+ animals along the first component in the principal components analysis (PCA), although none of the mice were visibly sick and there was no significant drop in body weight (FIG. 1B) or change in liver enzyme levels in serum (FIG. 1C) even at six months of age. Similarly, analysis of the creatinine-normalized metabolomic signature using reverse-phase separation also showed that while wild-type animals tended to cluster together, APC.sup.Min/+ animals separated from the cluster along first component in PCA (FIG. 3A). These observations indicated that tumorigenesis in APC.sup.Min/+ mice was associated with development of a distinct metabolic trait.
In order to identify the ions contributing to segregation of the metabolomic signature of naive and tumor bearing mice, supervised orthogonal projection to latent structure analysis was performed (see FIGS. 3B and 3C). A significant number of ions were modulated as a result of tumorigenesis (FIG. 3D). The identities of these ions were confirmed and concentrations measured with authentic standards. The creatinine-normalized excretion of glutamine, proline, citrulline, N.alpha.-acetyllysine, spermine, N1-acetylspermidine, N8-acetylspermidine, spermine, xanthosine, inosine, xanthine, deoxyuridine, cytidine, and thymidine were progressively elevated whereas those of ornithine and carnitine were reduced in tumor-bearing animals. A detailed description of quantitative ranges and statistical significances (P value and odds ratio) of these urinary biomarkers is provided at Table 1. The urinary excretion of glutamic acid, aspartic acid, lysine, arginine, hypoxanthine, creatine, N.omega.-monomethylarginine, and uridine were found to be unaffected during tumorigenesis.
Longitudinal Variation in Excretion of Amino Acid Metabolites.
The excretion of glutamine (FIG. 2C) was found to be progressively elevated in APC.sup.Min/+ mice and was 7.2-fold and 6.1-fold higher than that in wild-type mice at five and six months, respectively. The excretion of proline was also were found to increase by 3.0-fold in tumor-bearing mice at six months (FIG. 2D). However, N.alpha.-acetyllysine was elevated in urine of tumor bearing mice by 1.3-fold at both five and six months (FIG. 2E).
Longitudinal Variation in Excretion of Hypermethylated Metabolites.
Urinary excretion of carnitine, a permethylated metabolite of lysine, was reduced by 1.9- and 2.1-fold at five and six months, respectively (FIG. 2F). However, the urinary excretion of hypermethylated arginine metabolite symmetric-dimethylarginine was elevated by 1.7-fold and 1.6-fold at five and six months (FIG. 4A), while that of asymmetric-dimethylarginine (FIG. 4B) was also elevated by 1.7-fold and 2-fold at four and six months, respectively.
Longitudinal Variation in Urea Cycle and Polyamine Metabolites in Urine.
The creatinine-normalized urinary excretion of citrulline (FIG. 4C) was 2.7-fold and 1.4-fold higher at four and five months, respectively, while that of ornithine (FIG. 5A) was found to be lower by 1.4-fold at six months. Spermine excretion was progressively elevated in urine of tumor bearing animals and was found to be 1.8-fold higher at both five and six months (FIG. 4D). Acetylated polyamine metabolite N1-acetylspermidine (FIG. 4E) was elevated by 4.3-fold and 6.0-fold at four and six months, respectively, whereas N8-acetylspermidine (FIG. 4F) was elevated by 1.6-fold at four months.
Longitudinal Variation in Excretion of Purine and Pyrimidine Metabolites.
The urinary excretion of xanthosine (FIG. 6A) was elevated 2.0- and 2.8-fold at five and six months, respectively, whereas inosine (FIG. 6B) and xanthine (FIG. 6C) were elevated by 3.5- and 4.2-fold, respectively, at six months. The urinary excretion of cytidine (FIG. 6D) was elevated 28.7- and 6.8-fold at five and six months, respectively whereas that of deoxyuridine (FIG. 6E) and thymidine (FIG. 6F) were elevated by 5.0- and 7.4-fold, respectively, at five months.
Example 2. Validation and Predictive Power of Urinary Excreted Metabolic Cancer Biomarkers
The robustness of the biomarkers was tested in an independent cohort. Similar to that in the discovery cohort, the creatinine-normalized urinary excretions (FIG. 7A) of carnitine (3.6-fold) was reduced whereas those of glutamine (1.8-fold), NJ-acetylspermidine (4.8-fold), N8-acetylspermidine (2.1-fold), proline (2.9-fold), asymmetric-dimethylarginine (2-fold), symmetric-dimethylarginine (1.6-fold), spermine (1.9-fold), xanthosine (1.9-fold),
TABLE-US-00003 TABLE 1 Metabolic WT (av (95% CI) APC (av (95% CI) P (Mann- Fold pathway Identity umol/mmol creatinine umol/mmol creatinine Whitney) change OR (95% CI) Amino acid m5 Proline 22.4 (11.8-33.01) .sup. 7.6(5.36-9.75) 0.0004 2.96 1.82 (1.02-3.25) metabolism m9 Glutamine 23.14 (13.67-32.62) 8.52 (4.58-12.47) 0.0023 2.71 1.23 (1.04-1.47) m13 Na-acetyllysine 32.52 (27.17-37.87) 24.16 (21.2-27.13) 0.0226 1.34 1.21 (1.02-1.45) Polyamine m1 N1-acetylspermidine 200.5 (127.8-273.1) 39.06 913.26-64.85) 0.0006 5.13 1.03 (1.01-1.05) metabolism m2 N8-acetylspermidine 13.26 (10.3-16.23) 7.03 (5.62-8.44) 0.0011 1.89 1.71 (1.15-2.54) m6 Spermine 14.28 (12.32-16.24) 7.8 (6.7-8.91) <0.0001 1.83 110.681 (0.04-334763) Nucleic acid Xanthosine 8.62 (6.98-10.28) 3.91 (3.20-4.63) 0.0005 2.21 2.7 (1.26-5.78) metabolism Inosine 7.64 (4.16-11.11) 2.06 (1.80-2.32) 0.0002 3.71 49.3 (0.7-4371) Deoxyuridine 29.5 (16.19-42.8) 11.74 (7.76-15.72) 0.0304 2.51 1.1 (1.01-1.22) Thymidine 63.37 (-1.40-128.1) 5.55 (2.37-8.72) 0.0004 11.43 1.14 (.99-1.32) Methylation Asymmetric 73.86 (63.34-84.38) 37.69 (31.26-44.12) <0.0001 1.96 1.56 (.88-2.76) dimethylarginine Symmetric 22.49 (18.99-25.98) 13.82 (11.62-16.01) 0.0002 1.63 2.87 (.96-8.59) dimethylarginine Carnitine 19.22 (10.62-27.83) 51.39 (48.61-54.18) <0.0001 0.37 0.53 (0.2-1.41) Metabolic pathway Identity P (ROC) AUCROC Cut off Sensitivity Specificity Accuracy Amino acid m5 Proline 0.044 .93 (.82-1) .gtoreq.10.79 83 92 88 metabolism m9 Glutamine 0.019 0.88 (0.73-1.0) .gtoreq.18.19 73 100 87 m13 Na-acetyllysine 0.026 .77 (5.58-.97) .gtoreq.35.96 50 100 75 Polyamine m1 N1-acetylspermidine 0.017 0.92 .gtoreq.88.6 83 92 88 metabolism m2 N8-acetylspermidine 0.008 0.9 (.74-1.0) .gtoreq.9.34 92 83 88 m6 Spermine 0.25 .99 (.95-10.sup. .gtoreq.12.6 83 100 92 Nucleic acid Xanthosine 0.011 0.92 (.80-1.0) .gtoreq.7.95 83 100 92 metabolism Inosine 0.073 0.96 (.87-1).sup. .gtoreq.3.20 92 100 96 Deoxyuridine 0.038 .77 (.55-.97) .gtoreq.30.0 58 100 79 Thymidine 0.066 0.84 (.67-1.0) .gtoreq.21.02 67 100 83 Methylation Asymmetric 0.123 0.98 (.94-1).sup. .gtoreq.52.31 92 92 92 dimethylarginine Symmetric 0.06 .95 (.88-1) .gtoreq.18.14 83 92 88 dimethylarginine Carnitine 0.205 0.99 (.97-1.0) .gtoreq.34.71 92 100 96
inosine (3.2-fold), and N.alpha.-acetyllysine (1.4-fold; FIG. 5B) were elevated in the urine of tumor-bearing animals. Although not statistically significant, urinary excretion of thymidine (6.6-fold, P=0.054) and deoxyuridine (3.1-fold, P=0.065), showed a trend toward elevation as observed in the discovery cohort (FIG. 5B).
Thirteen biomarkers, related to amino acid metabolism (proline, glutamine and N.alpha.-acetyllysine), nucleic acid metabolism (Xanthosine, inosine, deoxyuridine and thymidine) and polyamine metabolism (N1-acetylspermidine, N8-acetylspermidine and spermine) as well as methylation (asymmetric-dimethylarginine, symmetric-dimethylarginine and carnitine), were selected on the basis of their consistent and significant derangement in both cohorts (see FIGS. 8A-8D for comparison) for evaluation of predictive power using ROC analysis. Individual biomarkers (FIGS. 9A-9D) showed moderate to high (75-99%) accuracy of prediction. However, combining the biomarkers according to metabolic pathway as mentioned above showed significant improvement in (see Table 1) sensitivity as well as specificity. Consequently, biomarker panels comprising amino acid metabolites (FIG. 7B, AUCROC=0.92, sensitivity=83%, specificity=91%), polyamine metabolites (FIG. 9C, AUCROC=0.99, sensitivity=92%, specificity=100%), nucleic acid metabolites (FIG. 4D, AUCROC=1.0, sensitivity=100%, specificity=100%) and methylation metabolites (FIG. 9B, AUCROC=1.0, sensitivity=100%, specificity=100%) showed 88%, 96%, 100% and 100% accuracy of tumor diagnosis, respectively, in combined cohort at six months. The hierarchical clustering analysis (FIG. 10B) of the modulation of metabolomic signature (heatmap shown in FIG. 10A) also correctly classified all except one naive and one tumor-bearing animal.
Subsequently, the ability of the biomarker panels to distinguish wild-type and mutant animals during earlier stages (5 months, FIGS. 11A and 11B; 4 months, FIGS. 12A and 12B; 3 months, FIGS. 13A and 13B; and 2 months, FIGS. 14A and 14B) of tumorigenesis were evaluated using ROC analysis. The results showed that although individual metabolites or pathways, especially, amino acid metabolism, performed poorly, any combination of biomarkers related to nucleic acid metabolism, polyamine metabolism and methylation, predicted mutant mice at risk of developing colorectal tumors with 100% sensitivity and specificity even at two months of age, when only few animals start developing tiny polyps.
Example 3. Analysis of Tissue Metabolome
In order to examine whether changes in the urinary biomarkers correlate with changes in the tissue metabolome, the abundance of these and related metabolites were examined in colon tumor and normal colon epithelial tissue. Targeted analysis showed that the abundance of amino acids (FIG. 15A) such as proline (5.2-fold), glutamine (3.0-fold), glutamic acid (2.4-fold), and threonine (4.2-fold) were elevated in colon tumors. Metabolites related to urea cycle and polyamine metabolism (FIG. 15B) such as arginine (2.4-fold), citrulline (2.5-fold), ornithine (3.5-fold) and N1-acetylspermidine (10.3-fold) were also elevated. While metabolites related to nucleic acid metabolism (FIG. 15C) such as thymidine (2.7-fold) was elevated, the abundance of both xanthine (10.0-fold) and inosine (3.4-fold) were reduced in tumors. ATP, which is related to nucleic acid and energy metabolism, was elevated (2.9-fold) in colon tumor. Hypermethylated metabolites, dimethylarginine (3.2-fold) and carnitine (4.2-fold) were also elevated in tumor tissue.
Example 4. Analysis of Gene Expression
The expression of key genes (see Table 2) related to these metabolic pathways were analyzed in order to elucidate the transcriptomic changes that contributed to changes in metabolic flux and precipitated observed segregation of metabolomic traits. Messenger RNA encoding enzymes involved in de novo amino acid biosynthesis (FIG. 16A), such as GLUD1 (1.5-fold), GOT2 (2.1-fold), ASS1 (3.1-fold), ASL (2-fold), PYCR1 (6.7-fold), PYCR2 (2.2-fold), ALDH4A1 (1.3-fold) and AHCYL1 (2.3-fold) were all elevated in colon tumor. Genes involved in de novo purine biosynthesis such as GART(2.9-fold), ATIC1 (3.3-fold), IMPDH1 (2.2-fold) and metabolism such as ADA (3.7-fold), PNP (2.9-fold), HPRT1 (1.9-fold) were also elevated in tumor tissue along with genes involved in de novo pyrimidine biosynthesis such as CAD (2.9-fold), UMPS (1.8-fold), UMPK (2.5-fold), TYMS (2.1-fold), TXNRD1 (2.7-fold), TXNRD2 (1.6-fold) and TXNRD3 (2.3-fold). Messenger RNA encoding enzymes involved in urea cycle and polyamine metabolism such as ARG1 (78.5-fold), ARG2 (2-fold), NOS2 (7.8-fold), NOS3 (4.6-fold), ODC (2.1-fold), SRM (5-fold), SMS (2.9-fold), SMOX (6.7-fold), and SAT1 (2.5-fold) were elevated whereas OTC (8.2-fold) was reduced. A whole host of mRNAs related to post-translational and epigenetic methylation machinery such as DNMT1 (3.3-fold), DNMT3A (2-fold), PRMT1 (2.7-fold), PRMT3 (2.5-fold), CARM1 (2.1-fold), PRMT5 (2.8-fold), PRMT6 (1.6-fold), PRMT7 (3.5-fold), PRMT8 (2.6-fold), AMD1 (2.4-fold), MAT2A (1.4-fold), MTAP1 (18.2-fold), DHFR (1.9-fold), MTHFR (1.5-fold), MTHFS (1.3-fold) and SHMT1 (1.6-fold) were also elevated.
TABLE-US-00004 TABLE 2 Gene Full name Reaction Forward primer Reverse primer CAD carbamoyl phosphate 2 ATP + L-glutamine + TGGGAGTTGCATGAAGAGTG TACGCAGTTCTCTCGACCA synthetase HCO3- + H2O = 2 ADP + phosphate + L-glutamate + carbamoyl phosphate CAD aspartate carbamoyl phosphate + L- carbamoyltransferase aspartate - phosphate + N- carbamoyl-L-aspartate CAD carbamoylaspartic (S)-dihydroorotate + H2O = dehydrase N-carbamoyl-L-aspartate UMPS orotate orotidine 5'-phosphate - CTCCTCCCCAGTCTACATCG AAACTGATCCCCGCATTTTT phosphoribosyl- UMP + CO2 transferase UMPS orotidine-5'-phosphate orotidine 5'-phosphate + decarboxylase diphosphate = orotate + 5- phospho-alpha-D-ribose 1- diphosphate UMPK UMP-CMP kinase ATP + UMP = ADP + UDP CTTCCTGATCGGCGTGAG CCTGCTTCTGGTGGTAATCC TXNRD1 thioredoxin reductase 1 thioredoxin + NADP + = GAGCTGGTGGTTTCACCTTC GGTCGAAGTCATAGGACCCA thioredoxin disulfide + NADPH + H+ TXNRD2 thioredoxin reductase 2 thioredoxin + NADP + = GCTTCTGGCAAGGAAGACAC CCAGCCTTCTCCAGATTCAA thioredoxin disulfide + NADPH + H+ TXNRD3 thioredoxin reductase 3 thioredoxin + NADP + = TTACTGTCCACACAGCACGC ACTTCCTGAACACTGGCCC thioredoxin disulfide + NADPH + H+ TYMS Thymidilate synthetase methylenetetrahydrofolate + GAGGCATTTTGGAGCAGAGT TCAGGGTTGGTTTTGATGGT dUMP =dihydrofolate + dTMP
Example 5. Changes in Amino Acid, Nucleic Acid, and Polyamine Metabolism and Methylation in Tumor Tissue Accompany Neoplasia
Metabolomic and transcriptomic analysis revealed changes in amino acid, nucleic acid, polyamine metabolism and methylation in tumor tissue. Changes in the urinary metabolome were found to be in concert with these changes and, consequently, helped to correctly distinguish healthy and tumor-bearing animals. The consistency of longitudinal trait of simultaneous deregulation of these pathways during tumorigenesis resulted in highly accurate and early prediction of subjects at risk of developing colorectal cancer in this mouse model.
Growth and proliferation are hallmarks of cancer cells. Loss-of-function APC mutation leads to activation of Wnt-signaling target genes such as c-Myc, which is a master regulator of genes involved in these processes. Growth demands building blocks for macromolecules and energy, which come from nutrients. It was shown that cancer cells develop an ability to increase nutrient (glucose, glutamine and fatty acid) uptake. In fact, the accumulation of essential amino acids such as threonine in colon tumors of APC.sup.Min/+ mice indicated development of a similar capability. In order to extract energy from nutrients cancer cells resort to a variety of metabolic reprogramming ranging from increased glycolysis (Warburg effect). Krebs cycle to fatty acid oxidation. The present results showed that urinary carnitine excretion was lower whereas tumor tissue carnitine concentrations were higher. Without being bound to a particular theory, this indicates an active retention of carnitine in tumors, presumably to shuttle fatty acids into mitochondrial for .beta.-oxidation to produce energy. It was shown that Wnt-signaling promotes mitochondrial biogenesis via c-Myc, which increases acetyl-CoA production. Therefore, elevated acetylated urinary biomarkers (N.alpha.-acetyllysine and acetylspermidines) may be a reflection of c-Myc activation in tumor tissue. Acetyl-CoA can either enter the Krebs cycle or de novo fatty acid synthesis, which is required for cell growth and has been shown to be upregulated in cancer. Mitochondrial Krebs cycle plays an important role in energy production and de novo synthesis of amino acids. Reducing equivalents produced via fatty acid oxidation or Krebs cycle can either be used in fatty acid biosynthesis or to produce ATP via mitochondrial oxidative phosphorylation. c-Myc activation was shown to increase oxidative phosphorylation. The concentration of ATP was indeed found to be higher in tumors.
The gene (GOT2) encoding the mitochondrial anaplerotic enzyme involved in transamination of aspartate and glutamate (1) was found to be overexpressed in tumors. Aspartate is involved in ATP-dependent biosynthesis and regeneration of arginine through urea cycle. The genes involved in this process such as ASS1 and ASL (6) were elevated in tumors. Consequently, arginine concentration in tumors was found to be higher than normal colon. The transamination of oxaloacetate to aspartate requires glutamate with concomitant production of .alpha.-ketoglutarate, which can contribute to the biosynthesis of non-essential amino acids via the Krebs cycle. Glutamate can be produced from glutamine, which was significantly elevated in tumor tissue, by glutaminase. c-Myc was shown to increase the production of glutamate without any change in glutaminase expression via suppression of miR-23. Glutamate can also be converted to .alpha.-ketoglutarate by GLUD1, which was found to be upregulated in tumors. Glutamate is a precursor to the biosynthesis of proline and the genes involved in this pathway such as ALDH4A1 and PYCR1, PYCR2 were overexpressed in tumors. Consequently, both tissue abundance and urinary excretion of proline was elevated tumor-bearing mice. The transcriptomic and metabolomic enrichment of these pathways, which might be the result of c-Myc activation, reflect hyperactive central carbon metabolism, energy metabolism and de novo amino acid biosynthesis to support growth of colon cancer cells in APC.sup.Min/+ mice.
Cell proliferation, on the other hand, requires the synthesis of genetic material. It was shown that glutamine plays a central role in c-Myc driven proliferation. Apart from glutamine and ATP, de novo nucleotide synthesis also requires 5-phosphoribosyl 1-pyrophosphate (PRRP), which is synthesized via pentose phosphate pathway (PPP) with concomitant production of NADPH. c-Myc was shown to increase flux through PPP. The present study showed that the expression of genes involved in funneling increased carbamoyl phosphate and PPP flux into purine biosynthesis, such as GART and ATIC, were elevated in colon tumors. In addition, the expression of genes involved in purine interconversion and metabolism such as IMPDH1, ADA, PNP, and HPRT1, were also elevated in tumors. IMPDH1 was shown to be a direct c-Myc target and inhibition of this gene was found to inhibit proliferation. These resulted in the elevation of inosine, xanthosine and xanthine in urine. However, inosine and xanthine were reduced in the tissue, presumably due to the interconversion and/or excretion through urine.
The expression of CAD, another direct target of c-Myc, that encodes a protein with triplet enzymatic activity required for biosynthesis of pyrimidines from glutamine, aspartate and ATP, was elevated in tumors. In addition, the expression of UMPS and UMPK, genes involved in converting PRRP and orotic acid into uridine triphosphate, were also elevated. Uridine triphosphate is the precursor of other pyrimidine nucleotides required for RNA and DNA synthesis. In line with the elevated de novo synthesis flux of pyrimidine nucleotides, excretion of cytidine was found to be elevated in urine. In addition, all three isoforms of thioredoxin reductase, the enzymes involved in synthesis of deoxyribonucleotides, were overexpressed along with TYMS, the gene involved in the synthesis of DNA-specific thymidine nucleotide. As a result, tissue distribution of thymidine as well as urinary excretion of thymidine and deoxyuridine was significantly elevated in tumor-bearing animals. These observations reflect a hyperactivation of RNA and DNA biosynthesis, an essence of proliferative capacity, via synchronized redistribution of central metabolic flux towards PPP and amino acid biosynthesis.
A significant amount of central metabolic flux was also directed towards urea cycle via aspartic acid mediated arginine biosynthesis. However, the arginases were also highly expressed in tumor tissue along with nitric oxide synthases NOS2 and NOS3 that produce citrulline and nitric oxide. Consequently citrulline was found to be elevated in both tumor tissue and urine. Arginase, which produces ornithine, was already shown to be increased in human colorectal cancer tissue. Ornithine can be converted to either citrulline by Ornithine transcarbamylase (OTC) to re-enter the urea cycle or putrescine byornithine decarboxlyase (ODC). The ODC expression was upregulated in tumor with concomitant downregulation of OTC expression that would result in funneling of ornithine into biosynthesis of putrescine. This indicates that the arginine pool is channelized in bifurcated fashion into both urea cycle (via NOS) and polyamine biosynthesis (via ODC). The next step in polyamine biosynthesis involves successive addition of propylamine groups from S-adenosylmethioninamine (SAMA) by SRM to produce spermidine and then, by SRM or SMS to produce spermine. The expression of both enzymes was elevated in tumors that also showed elevated expression of SMOX that reverts spermine to spermidine with concomitant production of H.sub.2O.sub.2. This should lead to a build-up of spermidine in tumors. Instead, a marked increase in N8-acetylspermidine in urine and N1-acetylspermidine in tumor and urine was observed in APC.sup.Min/+. This could be rationalized by the elevated production of acetyl-CoA and increase in expression of SAT1 in tumors. Both of these metabolites were earlier shown to be elevated in the urine of colorectal cancer patients. Polyamines are known to epigenetically modulate gene expression and promote proliferation. ODC, the key enzyme involved in determining the flux into polyamine biosynthesis, was shown to be a direct c-Myc target. Interestingly, polyamines were also shown to induce c-Myc overexpression by perturbing chromatin structure. Thus, these results suggest that activation of Wnt-signaling can direct central carbon flux is directed towards polyamine biosynthesis and epigenetically promote proliferation. It was interesting to note that the expression of MTAP that converts S-methyl-5'-thioadenosine (MTA), the product propylamine transfer from SAMA, into adenine was also increased in tumors. This might, in turn, contribute to the observed increase in purine metabolites in tissue and urine.
Epigenetic modulation of gene expression, particularly, downregulation of tumor suppressor genes, plays an important role in tumorigenesis. These mechanisms involve methylation of DNA as well as methylation and acetylation of arginine and lysine residues of histone. c-Myc has also been shown to influence DNA methylation. An increase in the expression of DNA methyltransferases (DNMT1, DNMT3A) was observed in colon tumors in APC.sup.Min/+ mice. These enzymes transfer methyl group from S-adenosylmethionine (SAM) to cytosine of CpG islands upstream of the target gene. SAM is converted to S-adenosylhomocysteine in the process, which eventually gets reconverted to SAM via homocysteine and methionine. Genes involved in the process, AHCYL1 and MAT2A were upregulated in tumors. This process requires ATP as well as 5-methyltetrahydrofolate that is derived from folic acid. Another folic acid metabolite, 5,10-methylenetetrahydrofolate, is also involved in thymidine synthesis by TYMS, which was significantly elevated. Purine biosynthetic enzyme GART, which was elevated in tumors, also requires 10-formyltetrahydrofolate. These results indicate funneling of carbon flux into folate-mediated one-carbon transfer machinery. Folic acid fortification has been shown promote colorectal cancer. c-Myc has earlier been shown to increase central carbon flux into one carbon pool and induce genes involved in folate metabolism. Genes involved in folate metabolism such as DHFR, MTHFR, MTHFS (ATP-dependent), and SHMT1 were, indeed, overexpressed in tumors. SHMT1 also participates in biosynthesis of serine. In addition, the gene AMD1 involved in conversion of SAM to SAMA, which drives polyamine biosynthesis, was also elevated in colon tumors. These observations indicate to hyperactive methylation machinery in colon tumors.
In addition to DNA methylation, post-translational modification of protein lysine and arginine residues also plays an important role in the epigenetic regulation of gene expression and modulation of protein activity. Carnitine is produced as a result of trimethylation of protein lysine residues. It was recently shown that trimethylation of lysine residues are involved in regulation of expression of Wnt-signaling target genes. The increase in abundance of carnitine indicates that increase in SAM-dependent lysine methylation might contribute to aberrant gene expression patterns in APC.sup.Min/+ colon tumors. In addition, the expression and activity of protein arginine methyltransferases (PRMTs) were also elevated. PRMTs transfers methyl groups from SAM to arginine side chains of histones and, thereby, modulate their nucleosome binding affinity to regulate gene expression. While type-I PRMTs typically activates gene expression, type-II PRMTs repress them and they act on different sites. PRMTs can regulate the transcriptional activity of a number of genes, including P53, NF-.kappa.B and E2F1 that play important role in tumorigenesis by regulation of downstream signaling for cell survival and proliferation. In addition, arginine methylation also post-translationally modulates the activity of a host of other proteins involved in processes like RNA processing, signal transduction and DNA repair. Arginine residues are methylated either symmetrically (by type-I PRMTs such as PRMT1, PRMT3, CARM1, PRMT6) or asymmetrically (by type-II PRMTs such as PRMT5, PRMT7) to produce symmetric or asymmetric dimethylarginine. The expression of all of these genes was upregulated along with Prmt8, which was recently shown to interact with hnRNPs and RNA-helicases, in the tumor tissue. Consequently, the abundance of dimethylarginines in tumor tissue as well as their excretion in the urine was significantly elevated. Wnt-signaling has been shown to cause arginine methylation of G3BP1 that acts as a molecular switch for fi-catenin activity. Thus, increased arginine methylation due to activation of Wnt-signaling may compound the activation of the proliferative signal and viciously accelerate tumorigenesis.
The results described herein revealed a concerted deregulation of epigenetic, transcriptional, post-translational and metabolic events associated with tumorigenesis in APC.sup.Min/+ mice. The existing literature suggests that c-Myc can directly contribute to many of these events. However, it remains unclear why all cells harboring APC mutation do not turn into cancer cells. It was proposed that colorectal carcinogenesis is a multi-step process where inflammation and mutagenesis plays the role of a promoter following mutation (genetic or somatic) in a tumor suppressor (such as APC) gene. Increase in production of reducing equivalents (via fatty acid oxidation, TCA cycle and PPP) and oxidative phosphorylation by c-Myc can significantly increase reactive oxygen species (ROS) production. In addition, the activities of ROS-generating metabolic processes, such as oxidation of spermine to spermidine or hypoxanthine to xanthine, were elevated in tumor tissue. Chronic elevation of ROS production can increase inflammation, DNA damage and mutation which keeps accumulating stochastically in cells in a time-dependent manner. ROS production can also induce antioxidant response in cancer cells and prevent apoptosis as well as accelerate ageing-autophagy in tumor microenvironment that helps to feed cancer cells. These may augment the activation of Wnt-signaling due to the APC mutation and promote tumorigenesis in a time-dependent, yet stochastic manner. Taken together, these observations suggest that c-Myc can simultaneously drive inflammation as well as genetic and epigenetic aberrations to precipitate redistribution of metabolic flux towards de novo biosynthesis of amino acids, nucleic acids, polyamines and energy production to promote growth and proliferation.
Without being bound to a particular theory, the results described herein indicate that a coordinate reprogramming of cellular metabolism during tumorigeneis is reflected in the urine metabolome. In particular, progressive elevation of symmetric- and asymmetric-dimethylarginine in urine of animals as a reflection of hyperactive methylation machinery is a novel observation in the context of colorectal cancer. The ability of urinary metabolites to prospectively identify subjects that would eventually develop tumor, indicate combined panel of urinary biomarkers representing synchronized deregulation of amino acid, nucleic acid, polyamine metabolism and methylation has the potential to provide a powerful high-throughput noninvasive method for screening as well as early diagnosis of colorectal cancer.
Example 6. Validation of Urinary Metabolic Signatures in Mouse Model of Sporadic Colorectal Cancer
The following examples further demonstrate the utility of metabolic biomarkers belonging to methylation, urea cycle and polyamine metabolism, nucleic acid metabolism and amino acid metabolism in early noninvasive screening and diagnosis of colorectal cancer.
In order to examine whether the noninvasive signatures associated with colorectal tumorigenesis identified in hereditary colorectal cancer mouse model (Apc.sup.Min/+) is, in general, etiology-independent biomarkers of colorectal cancer, these metabolites were measured in the urine of mouse model of AOM-induced sporadic colorectal carcinogenesis.
Similar to that observed in Apc.sup.Min/+ mice, AOM-treated mice also show (FIG. 17) elevated excretion of glutamine, proline, N.alpha.-acetyllysine, N8-acetylspermidine, citrulline, deoxyuridine, thymidine, symmetric-dimethylarginine, and asymmetric-dimethylarginine (FIG. 17). Although not statistically significant, xanthine (P=0.065), xanthosine (P=0.132) and N1-acetylspermidine (P=0.132) showed a trend of elevation (Supplementary FIG. 19). In addition, it also showed elevation of glutamic acid, threonine, deoxycytidine, cytosine, guanosine, betaine, methionine (FIG. 17). However, unlike Apc.sup.Min/+ mice it showed an increase in excretion of ornithine and carnitine. Nevertheless, the overall metabolic signature indicated a concerted dysregulation of the aforementioned metabolic pathways similar to Apc.sup.Min/+ mice. This indicated that such derangements may be a common feature of colorectal carcinogenesis irrespective of etiological heterogeneity as found in human subjects. The fact that even the genetic background of AOM-treated mice (129P3/J) and Apc.sup.Min/+ mice (C57/BL6J) were different strongly indicates to the robustness of association of these signatures with colorectal carcinogenesis.
Accordingly, based on the foregoing results, it can be concluded that derangement of urinary excretion of metabolites related to methylation, urea cycle and polyamine metabolism, nucleic acid metabolism and amino acid metabolism is a general phenomenon associated with hereditary as well as sporadic colorectal cancer.
Example 7. Validation of Metabolic Reprogramming Associated with Colorectal Tumorigenesis in Human Colorectal Tumor Samples
In order to examine whether the metabolic reprogramming observed in colon tumors from Apc.sup.Min/+ mice were also associated with human colorectal tumorigenesis, the metabolic profile of human colorectal tumors and adjacent non-tumor tissues from the same patient were analyzed. To compare with the observation made in Apc.sup.Min/+ mice where colon tumors are found only in lower two-third of the colon, human colon tumors found in rectum and sigmoidal, descending or transverse colon were analyzed together. Similar to that observed in Apc.sup.Min/+ mice, amino acid metabolites were elevated in human colorectal tumors (FIG. 18). Metabolites connecting amino acid metabolism to urea cycle and polyamine metabolism, such as arginine and N1-acetylspermidine were also elevated. Nucleic acid metabolites such as uracil, hypoxanthine and xanthine were elevated. Similar to Apc.sup.Min/+ mice, human tumors showed elevation of hypermethylated metabolites such as carnitine, symmetric-dimethylarginine, asymmetric-dimethylarginine, dimethylglycine and betaine along with S-adenosylmethionine and S-adenosylhomocysteine. Even in the overall cohort, which included tumors from ascending colon, aspartic acid, glutamic acid, proline, threonine, lysine, arginine, uracil, xanthine, hypoxanthine, S-adenosylhomocysteine, S-adenosylmethionine, carnitine, symmetric-dimethylarginine, asymmetric-dimethylarginine, betaine and dimethylglycine were significantly elevated (FIG. 19).
Accordingly, based on the foregoing results, it can be concluded that coordinate metabolic reprogramming of metabolic machinery involved in methylation, urea cycle and polyamine metabolism, nucleic acid metabolism and amino acid metabolism is also associated with human colorectal tumorigenesis. Similar to that observed in two independent mouse models, metabolites belonging to these pathways may act as noninvasive biomarkers of colorectal cancer in human subjects.
Example 8. Validation of Urinary Biomarkers of Colorectal Cancer in Human Samples
In order to examine whether derangement of urinary metabolic profiles are indeed associated with human colorectal carcinogenesis, a preliminary set urine samples from colorectal cancer patients (N=10) and healthy controls (N=10) were analyzed.
Metabolic profiling showed significant derangement in excretion of metabolites related to amino acid metabolism (glutamine, proline and N-acetyllysine), urea cycle and polyamine metabolism (N-acetylspermidine, arginine, and ornithine), nucleic acid metabolism (deoxycytidine, cytosine, inosine, adenosine, xanthosine and hypoxanthine) and methylation (symmetric-dimethylarginine, betaine, carnitine and methionine). This included ten metabolites that were found to be elevated in the human colorectal tumor samples. In general, metabolites related to methylation and nucleic acid metabolism showed the most consistent trend. A summary of concentration ranges and statistical analysis is presented in Table 3, below.
TABLE-US-00005 TABLE 3 Preliminary changes in urinary metabolic profiles of colorectal cancer patients Healthy controls (av Colorectal cancer Metabolite Pathway (95% CI)).sup.a patients (av (95% CI)) P value.sup.b AUCROC SDMA Methylation 28.09 (21.9-34.3) 54.85 (41.4-72.7) <.003 .88 ADMA Methylation 48.5 (41.4-55.6) 56.81 (41.4-72.7) .24 .66 Betaine Methylation 1.38 (0.12-2.63) 9.02 (3.48-14.6) <.003 .89 Methionine Methylation .045 (.015-.075) 1.02 (.52-1.5) <.0001 1 Carnitine Methylation 9.87 (4.53-15.2) 4.25 (1.36-7.14) .052 .76 Deoxycytidine Nucleic acid metabolism .006 (.004-.008) .0104 (.008-.013) <.01 .84 Cytosine Nucleic acid metabolism 1.28 (.94-1.61) 2.35 (1.83-2.31) .0005 .93 Inosine Nucleic acid metabolism .055 (.032-.078) .29 (.071-.51) <.0001 .96 Hypoxanthine Nucleic acid metabolism 14.5 (9.41-19.5) 36.4 (17.6-55.9) <.01 .84 Xanthosine Nucleic acid metabolism .91 (.48-1.33) 4.74 (.73-8.75) <.0001 .96 Adenosine Nucleic acid metabolism .00014 (.0001-.0004) .115 (.05-.18 <.001 1 N1-Acetylspermidine Urea cycle and polyamine 21.2 (18.14-24.2) 27.65 (20.54-34.8) .052 .76 N8-Acetylspermidine Urea cycle and polyamine .86 (.61-1.1) 1.79 (.92-2.66) <.02 .83 Arginine Urea cycle and polyamine 9.08 (5.79-12.4) 16.11 (9.95-22.3) .03 .8 Ornithine Urea cycle and polyamine 15.0 (10.6-19.4) 8.84 (6.58-11.1) <.004 .87 Glutamine Amino acid metabolism 2.01 (1.13-2.89) 70.46 (25.72-115.2) <.0001 1 Proline Amino acid metabolism 4.29 (2.97-5.6) 1.25 (.49-2.2) <.004 .87 N.alpha.-acetyllysine Amino acid metabolism 4.32 (2.89-5.75) 8.82 (6.03-11.6) <.02 .83 .sup.aAll values are in the units of .mu.mol/mmol creatinine; .sup.bP values were calculated by Mann-Whitney test.
In order to further validate and extend the utility of these biomarkers in colorectal cancer screening, and diagnosis, urine samples will be collected from subjects undergoing colonoscopy to compare the metabolic signature of colorectal cancer patients with those having benign polyps as well as other non-cancerous pathologies or normal colon. In this case, the patients serve as their own control. These subjects will be monitored longitudinally to evaluate the utility of noninvasive metabolomic biomarkers in screening, prognosis and prediction of therapeutic response. A repository of urine samples from other GI malignancies will also be examines in order to examine the utility of metabolic biomarkers to other GI malignancies and/to identify signatures specific to GI sites.
Accordingly, based on the foregoing results, biomarkers reflecting metabolic reprogramming of methylation, urea cycle and polyamine metabolism, nucleic acid metabolism and amino acid metabolism can be useful in noninvasive screening and early diagnosis of colorectal cancer.
Example 9. Identification of M264 Biomarker in Urine of Colorectal Cancer Patients
Another novel ion (M264) has been identified as a biomarker: 2-{2-[(2R,3R,4S,5R)-3,4-dihydroxy-5-(hydroxymethyl)-oxolan-2-yl]-1-methyl- carbamimidamido}acetic acid (aka, beta-D-Ribofuranosylcreatine). FIG. 20A shows the structure of the metabolite which has a molecular formula C.sub.9H.sub.17N.sub.3O.sub.6. M264 has been found to be significantly (p<0.0001) elevated only in the urine samples of CRC patients. FIG. 20B shows the creatinine-normalized relative abundance of this metabolite in control (N=10) and patient (N=10) urine samples. ROC analysis (FIG. 20C) showed that this metabolite can identify colorectal cancer patients with high accuracy (AUCROC=0.98).
Production of this metabolite may be a result of simultaneous upregulation of pentose phosphate pathway (which also contributes to nucleic acid biosynthesis) as well as dysregulation of urea cycle and methylation machinery both of which are involved in creatine biosynthesis.
The results reported herein were obtained using the following methods and materials.
Animal Studies
Wild-type and mutant (APC.sup.Min/+) mice were purchased from Jackson laboratories (Bar Harbor, Me.). Six age-matched wild-type and six APC.sup.Min/+ littermates were cohabited one week after weaning in two cages containing equal numbers of wild-type and six APC.sup.Min/+. Mice were fed with normal chow and water ad libitum and used as discovery cohorts for longitudinal metabolomic studies. Twenty four-hour urine samples were collected monthly starting from two months up to six months of age by placing mice in metabolic cages. Urine samples were also collected from an independent set of age-matched (six wild-type and six APC.sup.Min/+) non-littermates at six months of age, which were used as a validation cohort. Serum samples were collected by retro-orbital bleeding before euthanasia. Animals were killed through CO.sub.2 asphyxiation at the end of the study, intestine flushed with normal saline, longitudinally opened, tumor counted under light microscope, tissue samples harvested and all samples were stored at -80.degree. C.
Biochemistry
Serum ALT and AST levels were measured by using VetSpec kits (Catachem Inc., Bridgeport, Conn.) following the manufacturer's instructions.
Metabolomics
Deproteinated urine and tissue samples were analyzed in Xevo G2 ESIQToFMS coupled with Acquity UPLC BEH amide column (Waters Corp. Milford, Mass.) for HILIC analysis. Reverse-phase analysis of urine samples were performed using SYNAPT HDMS ESIQToFMS coupled with Acquity UPLC BEH C.sub.18 column. The data was deconvoluted and annotated using MassLynx software (Waters) and analyzed using SIMCA-P12+ (Umetrics, Umea, Sweden) software. The quantitation of the urinary metabolites were performed on a Xevo triple-quadruple ESIQToF platform coupled with an amide column through multiple reaction monitoring and all data were presented as normalized with respect to creatinine concentrations. Changes in relative abundance of the metabolites in tissue were calculated from internal standard-normalized area under extracted chromatograms. See Supplementary methods for detail.
Gene Expression
RNA was isolated using RNAeasy mini kit (Qiagen, Valencia, Calif.) and qPCR was performed using SYBR.RTM. GreenER.TM. Reagent System (Invitrogen, Carlsbad, Calif.) in a 7900 HT Fast Real-Time PCR system (Applied Biosystems, Carlsbad, Calif.). Relative change in gene expressions were calculated by the .DELTA..DELTA.C, method with normalization to 18S rRNA. See Table 2 for primers used in qPCR.
Chemicals
HPLC grade water, acetonitrile and methanol were purchased from Fisher Scientific (Hampton, N.H.). Difluoromethylornithine, .alpha.-aminopimelic acid, creatinine, glutamine, glutamic acid, creatine, aspartic acid, lysine, citrulline, ornithine, proline, threonine, uracil, uridine, deoxyuridine, thymidine, deoxycytidine, cytidine, adenosine, guanosine, xanthine, xanthosine, hypoxanthine, inosine, uridine monophosphate, deoxyuridine monophosphate, cytidine monophosphate, adenosinetriphosphate, acetyl CoA, N.alpha.-acetyllysine, N-acetylglutamic acid, spermine, N1-acetylspermidine, N8-acetylspermidine, arginine, N.omega.-monomethylarginine, sym-dimethylarginine, and asym-dimethylarginine, dimethylglycine, S-adenosylhomocysteine, S-adenosylmethionine, methionine, and betaine were purchased from Sigma-Aldrich (St. Louis, Mo.).
Global Urinary Metabolomic Analysis and Biomarker Identification.
Urine samples were deproteinated using 50% or 70% acetonitrile containing 5 .mu.M chloropropamide or .alpha.-aminopimelic acid as internal standards for reverse-phase (RP) or hydrophilic interaction liquid chromatography (HILIC), respectively. Supernatants were transferred into 96-well sample plates. All pipetting and dilution were performed using a MICROLAB STAR.sup.LET automated liquid handler (Hamilton Robotics, Reno, Nev.). For HILIC analysis, 5 .mu.L aliquot of samples were injected in a randomized fashion into a 2.1.times.50 mm Acquity UPLC BEH amide column (1.7 .mu.M) connected to a XEVO G2 ESIQTOF mass spectrometer (Waters Corporation, Milford, Mass.). Chromatographic separation was achieved by using a mixture of (A) 10 mM ammonium acetate in 90% acetonitrile (pH=8.9) and (B) 10 mM ammonium acetate in 10% acetonitrile (pH1=8.9) as mobile phase. The gradient elution was performed over 10 min using: 1-60% B in 4 min (0.4 ml/min), 60-80% B at 8 min (0.4 ml/min), holding at 80% B up to 8.5 min (0.3 ml/min), bringing back to 1% B at 8.8 min and holding at 1% until end (0.3 ml/min). Column temperature was maintained at 40.degree. C. Column was re-equilibrated with 99% A at the end of each run prior to injection of next sample. For reverse-phase analysis, 5 .mu.L aliquot of samples were injected into a 2.1.times.50 mm Acquity UPLC BEH Cis column (1.7 .mu.M) connected to a SYNAPT HDMS ESIQTOF mass spectrometer (Waters Corporation). Chromatographic separation was achieved by using a mixture of (A) water containing 1% formic acid and (B) acetonitrile containing 1% formic acid as mobile phase. The gradient elution was performed over 6 min at a flow rate of 0.3 mL using: 1-99% B in 4 min, holding at 99% B up to 5.0 min, bringing back to 1% at 5.5 min and holding at 1% until end. Column temperature was maintained at 40.degree. C. Column was re-equilibrated with 98% A at the end of each run prior to injection of next sample. Mass spectrometric analysis was performed in both positive and negative ionization modes. Sulfadimethoxine was used as the lock mass (m/z 311.0814.sup.+) for accurate mass calibration in real time. MassLynx software (Waters Corporation) was used to acquire mass chromatograms and mass spectral data in centroid format.
Chromatograms were manually inspected for chromatogram quality and retention time reproducibility across the run. MarkerLynx software (Waters Corporation) was used to deconvolute chromatograms, bin the data according to mass-retention time pairs and integrate the area under the peak. The intensity of each ion was normalized with respect to the either total ion count (TIC) or creatinine (m/z 114.067, RT=0.3 min or 0.8 min in RP or HILIC mode) count to generate a data matrix consisting of m/z value, retention time, and the normalized peak area. The multivariate data matrix was analyzed by SIMCA-P+12 software (Umetrics, Kinnelon, N.J.). Data quality inspection as well as distribution and unsupervised segregation of wild-type and mutants on global metabolomic space were checked by principal components analysis (PCA) of the Pareto-scaled data. The supervised orthogonal projection to latent structures (OPLS) model was used identify ions contributing to discrimination (indicated by their distance from origin along Y-axes) of metabolic traits. Consistency of longitudinal trend of ions in contributing to difference of wild-type and mutant metabolome was examined to select potential biomarker candidates. Candidate metabolites for these ions were identified on the basis of accurate mass measurement using metabolomic databases such as METLIN or HMDB and MS/MS fragmentation pattern. Finally, identities of biomarker were confirmed by comparison of retention time and fragmentation pattern with authentic standards.
Targeted Urinary Metabolite Quantitation.
Metabolites in the deproteinated urine samples were quantified in multiple reactions monitoring mode on a XEVO triple quadruple mass spectrometer (Water Corporation). .alpha.-Aminopimelic acid (5 .mu.M) was used as internal standard. The following metabolites were quantified by monitoring characteristic fragmentation reactions (in bracket); .alpha.-aminopimelic acid (176.fwdarw.112, ESI+), creatinine (114.fwdarw.86, ESI+), aspartic acid (132.fwdarw.88, ESI-), glutamine (147.fwdarw.84, ESI+), glutamic acid (148.fwdarw.84, ESI+), creatine (132.fwdarw.90, ESI+), lysine (147.fwdarw.130, ESI+), citrulline (176.fwdarw.159, ESI+), ornithine (133.fwdarw.70, ESI+), arginine (175.fwdarw.60, ESI+), N.omega.-monomethylarginine (189.fwdarw.84, ESI+), sym-dimethylarginine (203.fwdarw.172, ESI+), and asym-dimethylarginine (203.fwdarw.46, ESI+), proline (116.fwdarw.70, ESI+), threonine (120.fwdarw.74, ESI+), uridine (245.fwdarw.113, ESI+), deoxyuridine (229.fwdarw.117, ESI+), thymidine (241.fwdarw.151, ESI-), cytidine (244.fwdarw.112, ESI+), xanthine (151.fwdarw.108, ESI-), xanthosine, (285.fwdarw.153, ESI+), hypoxanthine (137.fwdarw.119, ESI+), inosine (269.fwdarw.153, ESI+), N.alpha.-acetyllysine (189.fwdarw.129, ESI+), N1-acetylspermidine (188.fwdarw.72, ESI+), N8-acetylspermidine (188.fwdarw.114, ESI+), betaine (118.fwdarw.59, ESI+), deoxycytidine (228.fwdarw.111, ESI+), adenosine (268.fwdarw.136, ESI+), methionine (150.fwdarw.56, ESI+), guanosine (2844.fwdarw.122, ESI+) and M264 (264.fwdarw.132, ESI+). Spermine was measured by single ion monitoring (203, ESI+) and relative abundance was measured by area under the peak. Chromatographic separation was achieved on a 2.1.times.50 mm Acquity UPLC BEH amide column using the mobile phase as mentioned above. The gradient elution was performed over 10 min at a flow rate of 0.5 ml/min using: 1-40% B in 6 min, 40-60% B at 8 min, 60-80% at 8.2 min, bringing back to 1% B at 9 min and holding at 1% until end. All data were processed using TargetLynx software (Waters Corporation). Internal standard-normalized area under the peak (response) from serially diluted authentic standard solution was used to build calibration curve for each metabolite. The concentration of metabolite was determined from the calibration curve and divided by creatinine concentration to determine creatinine-normalized excretion of the metabolite in 24-hour urine.
Mouse Tissue Metabolite Measurements.
Tumor (n=6) and normal colon mucosal tissue (n=5) samples were weighed and homogenized using a Precellys 24 homogenizer (Bertin technologies, France) and extracted using modified Bligh-Dyer method to separate the polar and non-polar metabolites. .alpha.-Aminopimelic acid (10 .mu.M) was added to each sample before extraction to normalize differences in metabolite extraction efficiency. Aqueous layer was vacuum-dried and reconstituted in acetonitrile/water/methanol (65:30:5) mixture containing 5 .mu.M difluoromethylornithine. Samples were analyzed on a XEVO G2 ESI-QTOF instrument connected to a 2.1.times.50 mm Acquity UPLC BEH amide column (1.7 .mu.M) with mobile phase as mentioned earlier. The gradient elution was performed over 10 min using: 1-40% B in 6 min (0.4 ml/min), 40-80% B at 8 min (0.4 ml/min), holding at 80% B up to 8.5 min (0.3 ml/min), bringing back to 1% B at 8.8 min and holding at 1% until the end of the run (0.3 ml/min). All samples were run in a randomized fashion along with authentic standards. Raw chromatograms were extracted with masses for target compounds and peaks at characteristic retention times (as that of the authentic standard) were integrated to get area under the peak using TargetLynx software. The area under the peak for each metabolite was normalized step-by-step for initial tissue weight, extraction efficiency (.alpha.-aminopimelic acid) and instrument response (difluoromethylornithine). The fold change in abundance of metabolites in tumor tissue samples were calculated by dividing the normalized response for the metabolite from tumor samples by the average normalized response from normal mucosal tissue samples. Colon scrapes from tamoxifen-treated Cre+ (n=3) and Cre- (n=3) mice were extracted as mentioned above. Metabolite composition was quantitated using MRM and normalized as mentioned above. In addition to aforementioned MRMs, the following MRMs were also monitored for respective metabolites; adenosine (268.fwdarw.136, ESI+), UMP (325.fwdarw.97, ESI-), dUMP (309.fwdarw.81, ESI+), CMP (324.fwdarw.112, ESI+), ATP (508.fwdarw.136, ESI+), N-acetylglutamic acid (190.fwdarw.84, ESI+), acetyl CoA (810.fwdarw.303, ESI+), uracil (111.fwdarw.42, ESI--), dimethylglycine (104.fwdarw.58, ESI+), S-adenosylhomocysteine (385.fwdarw.134, ESI+), and S-adenosylmethionine (3994.fwdarw.250, ESI+). The fold change in abundance of metabolites in Cre+ colon epithelium were calculated by dividing the normalized response for the metabolite from tumor samples by the average normalized response from Cre- colon epithelium.
Human Tissue Metabolite Measurements.
Matched tumor (N=39) and adjacent normal tissues were extracted following the same protocol as that described above for mouse tissues. Targeted measurement of metabolite abundances in the reconstituted aqueous extract were performed by MRM reaction monitoring coupled with hydrophilic interaction liquid chromatography as mentioned above for analysis of urine samples. The area under the peak for each metabolite was normalized step-by-step for initial tissue weight, extraction efficiency (.alpha.-aminopimelic acid) and instrument response (difluoromethylornithine) and presented as normalized response.
Statistics
Statistical significance of changes in metabolite abundance and gene expression were calculated by two-tailed Mann-Whitney test with 95% confidence interval using Graphpad Prism (San Diego, Calif.) unless mentioned otherwise. The creatinine-normalized urinary excretion of metabolites was used to test the predictive power of individual metabolites or metabolite panels by ROC analysis using STATA software (StataCorp, College Station, Tex.). The statistical significance of the change in metabolite abundances in matched human samples were calculated using two-tailed paired `t`-test with 95% confidence interval. P value <0.05 was considered statistically significant.
Other Embodiments
From the foregoing description, it will be apparent that variations and modifications may be made to the invention described herein to adopt it to various usages and conditions. Such embodiments are also within the scope of the following claims.
The recitation of a listing of elements in any definition of a variable herein includes definitions of that variable as any single element or combination (or subcombination) of listed elements. The recitation of an embodiment herein includes that embodiment as any single embodiment or in combination with any other embodiments or portions thereof.
All patents, publications, and CAS numbers mentioned in this specification are herein incorporated by reference to the same extent as if each independent patent and publication was specifically and individually indicated to be incorporated by reference.
SEQUENCE LISTINGS
1
1612843PRTHomo sapiens 1Met Ala Ala Ala Ser Tyr Asp Gln Leu Leu Lys Gln Val Glu Ala Leu1 5 10 15Lys Met Glu Asn Ser Asn Leu Arg Gln Glu Leu Glu Asp Asn Ser Asn 20 25 30His Leu Thr Lys Leu Glu Thr Glu Ala Ser Asn Met Lys Glu Val Leu 35 40 45Lys Gln Leu Gln Gly Ser Ile Glu Asp Glu Ala Met Ala Ser Ser Gly 50 55 60Gln Ile Asp Leu Leu Glu Arg Leu Lys Glu Leu Asn Leu Asp Ser Ser65 70 75 80Asn Phe Pro Gly Val Lys Leu Arg Ser Lys Met Ser Leu Arg Ser Tyr 85 90 95Gly Ser Arg Glu Gly Ser Val Ser Ser Arg Ser Gly Glu Cys Ser Pro 100 105 110Val Pro Met Gly Ser Phe Pro Arg Arg Gly Phe Val Asn Gly Ser Arg 115 120 125Glu Ser Thr Gly Tyr Leu Glu Glu Leu Glu Lys Glu Arg Ser Leu Leu 130 135 140Leu Ala Asp Leu Asp Lys Glu Glu Lys Glu Lys Asp Trp Tyr Tyr Ala145 150 155 160Gln Leu Gln Asn Leu Thr Lys Arg Ile Asp Ser Leu Pro Leu Thr Glu 165 170 175Asn Phe Ser Leu Gln Thr Asp Met Thr Arg Arg Gln Leu Glu Tyr Glu 180 185 190Ala Arg Gln Ile Arg Val Ala Met Glu Glu Gln Leu Gly Thr Cys Gln 195 200 205Asp Met Glu Lys Arg Ala Gln Arg Arg Ile Ala Arg Ile Gln Gln Ile 210 215 220Glu Lys Asp Ile Leu Arg Ile Arg Gln Leu Leu Gln Ser Gln Ala Thr225 230 235 240Glu Ala Glu Arg Ser Ser Gln Asn Lys His Glu Thr Gly Ser His Asp 245 250 255Ala Glu Arg Gln Asn Glu Gly Gln Gly Val Gly Glu Ile Asn Met Ala 260 265 270Thr Ser Gly Asn Gly Gln Gly Ser Thr Thr Arg Met Asp His Glu Thr 275 280 285Ala Ser Val Leu Ser Ser Ser Ser Thr His Ser Ala Pro Arg Arg Leu 290 295 300Thr Ser His Leu Gly Thr Lys Val Glu Met Val Tyr Ser Leu Leu Ser305 310 315 320Met Leu Gly Thr His Asp Lys Asp Asp Met Ser Arg Thr Leu Leu Ala 325 330 335Met Ser Ser Ser Gln Asp Ser Cys Ile Ser Met Arg Gln Ser Gly Cys 340 345 350Leu Pro Leu Leu Ile Gln Leu Leu His Gly Asn Asp Lys Asp Ser Val 355 360 365Leu Leu Gly Asn Ser Arg Gly Ser Lys Glu Ala Arg Ala Arg Ala Ser 370 375 380Ala Ala Leu His Asn Ile Ile His Ser Gln Pro Asp Asp Lys Arg Gly385 390 395 400Arg Arg Glu Ile Arg Val Leu His Leu Leu Glu Gln Ile Arg Ala Tyr 405 410 415Cys Glu Thr Cys Trp Glu Trp Gln Glu Ala His Glu Pro Gly Met Asp 420 425 430Gln Asp Lys Asn Pro Met Pro Ala Pro Val Glu His Gln Ile Cys Pro 435 440 445Ala Val Cys Val Leu Met Lys Leu Ser Phe Asp Glu Glu His Arg His 450 455 460Ala Met Asn Glu Leu Gly Gly Leu Gln Ala Ile Ala Glu Leu Leu Gln465 470 475 480Val Asp Cys Glu Met Tyr Gly Leu Thr Asn Asp His Tyr Ser Ile Thr 485 490 495Leu Arg Arg Tyr Ala Gly Met Ala Leu Thr Asn Leu Thr Phe Gly Asp 500 505 510Val Ala Asn Lys Ala Thr Leu Cys Ser Met Lys Gly Cys Met Arg Ala 515 520 525Leu Val Ala Gln Leu Lys Ser Glu Ser Glu Asp Leu Gln Gln Val Ile 530 535 540Ala Ser Val Leu Arg Asn Leu Ser Trp Arg Ala Asp Val Asn Ser Lys545 550 555 560Lys Thr Leu Arg Glu Val Gly Ser Val Lys Ala Leu Met Glu Cys Ala 565 570 575Leu Glu Val Lys Lys Glu Ser Thr Leu Lys Ser Val Leu Ser Ala Leu 580 585 590Trp Asn Leu Ser Ala His Cys Thr Glu Asn Lys Ala Asp Ile Cys Ala 595 600 605Val Asp Gly Ala Leu Ala Phe Leu Val Gly Thr Leu Thr Tyr Arg Ser 610 615 620Gln Thr Asn Thr Leu Ala Ile Ile Glu Ser Gly Gly Gly Ile Leu Arg625 630 635 640Asn Val Ser Ser Leu Ile Ala Thr Asn Glu Asp His Arg Gln Ile Leu 645 650 655Arg Glu Asn Asn Cys Leu Gln Thr Leu Leu Gln His Leu Lys Ser His 660 665 670Ser Leu Thr Ile Val Ser Asn Ala Cys Gly Thr Leu Trp Asn Leu Ser 675 680 685Ala Arg Asn Pro Lys Asp Gln Glu Ala Leu Trp Asp Met Gly Ala Val 690 695 700Ser Met Leu Lys Asn Leu Ile His Ser Lys His Lys Met Ile Ala Met705 710 715 720Gly Ser Ala Ala Ala Leu Arg Asn Leu Met Ala Asn Arg Pro Ala Lys 725 730 735Tyr Lys Asp Ala Asn Ile Met Ser Pro Gly Ser Ser Leu Pro Ser Leu 740 745 750His Val Arg Lys Gln Lys Ala Leu Glu Ala Glu Leu Asp Ala Gln His 755 760 765Leu Ser Glu Thr Phe Asp Asn Ile Asp Asn Leu Ser Pro Lys Ala Ser 770 775 780His Arg Ser Lys Gln Arg His Lys Gln Ser Leu Tyr Gly Asp Tyr Val785 790 795 800Phe Asp Thr Asn Arg His Asp Asp Asn Arg Ser Asp Asn Phe Asn Thr 805 810 815Gly Asn Met Thr Val Leu Ser Pro Tyr Leu Asn Thr Thr Val Leu Pro 820 825 830Ser Ser Ser Ser Ser Arg Gly Ser Leu Asp Ser Ser Arg Ser Glu Lys 835 840 845Asp Arg Ser Leu Glu Arg Glu Arg Gly Ile Gly Leu Gly Asn Tyr His 850 855 860Pro Ala Thr Glu Asn Pro Gly Thr Ser Ser Lys Arg Gly Leu Gln Ile865 870 875 880Ser Thr Thr Ala Ala Gln Ile Ala Lys Val Met Glu Glu Val Ser Ala 885 890 895Ile His Thr Ser Gln Glu Asp Arg Ser Ser Gly Ser Thr Thr Glu Leu 900 905 910His Cys Val Thr Asp Glu Arg Asn Ala Leu Arg Arg Ser Ser Ala Ala 915 920 925His Thr His Ser Asn Thr Tyr Asn Phe Thr Lys Ser Glu Asn Ser Asn 930 935 940Arg Thr Cys Ser Met Pro Tyr Ala Lys Leu Glu Tyr Lys Arg Ser Ser945 950 955 960Asn Asp Ser Leu Asn Ser Val Ser Ser Ser Asp Gly Tyr Gly Lys Arg 965 970 975Gly Gln Met Lys Pro Ser Ile Glu Ser Tyr Ser Glu Asp Asp Glu Ser 980 985 990Lys Phe Cys Ser Tyr Gly Gln Tyr Pro Ala Asp Leu Ala His Lys Ile 995 1000 1005His Ser Ala Asn His Met Asp Asp Asn Asp Gly Glu Leu Asp Thr 1010 1015 1020Pro Ile Asn Tyr Ser Leu Lys Tyr Ser Asp Glu Gln Leu Asn Ser 1025 1030 1035Gly Arg Gln Ser Pro Ser Gln Asn Glu Arg Trp Ala Arg Pro Lys 1040 1045 1050His Ile Ile Glu Asp Glu Ile Lys Gln Ser Glu Gln Arg Gln Ser 1055 1060 1065Arg Asn Gln Ser Thr Thr Tyr Pro Val Tyr Thr Glu Ser Thr Asp 1070 1075 1080Asp Lys His Leu Lys Phe Gln Pro His Phe Gly Gln Gln Glu Cys 1085 1090 1095Val Ser Pro Tyr Arg Ser Arg Gly Ala Asn Gly Ser Glu Thr Asn 1100 1105 1110Arg Val Gly Ser Asn His Gly Ile Asn Gln Asn Val Ser Gln Ser 1115 1120 1125Leu Cys Gln Glu Asp Asp Tyr Glu Asp Asp Lys Pro Thr Asn Tyr 1130 1135 1140Ser Glu Arg Tyr Ser Glu Glu Glu Gln His Glu Glu Glu Glu Arg 1145 1150 1155Pro Thr Asn Tyr Ser Ile Lys Tyr Asn Glu Glu Lys Arg His Val 1160 1165 1170Asp Gln Pro Ile Asp Tyr Ser Leu Lys Tyr Ala Thr Asp Ile Pro 1175 1180 1185Ser Ser Gln Lys Gln Ser Phe Ser Phe Ser Lys Ser Ser Ser Gly 1190 1195 1200Gln Ser Ser Lys Thr Glu His Met Ser Ser Ser Ser Glu Asn Thr 1205 1210 1215Ser Thr Pro Ser Ser Asn Ala Lys Arg Gln Asn Gln Leu His Pro 1220 1225 1230Ser Ser Ala Gln Ser Arg Ser Gly Gln Pro Gln Lys Ala Ala Thr 1235 1240 1245Cys Lys Val Ser Ser Ile Asn Gln Glu Thr Ile Gln Thr Tyr Cys 1250 1255 1260Val Glu Asp Thr Pro Ile Cys Phe Ser Arg Cys Ser Ser Leu Ser 1265 1270 1275Ser Leu Ser Ser Ala Glu Asp Glu Ile Gly Cys Asn Gln Thr Thr 1280 1285 1290Gln Glu Ala Asp Ser Ala Asn Thr Leu Gln Ile Ala Glu Ile Lys 1295 1300 1305Glu Lys Ile Gly Thr Arg Ser Ala Glu Asp Pro Val Ser Glu Val 1310 1315 1320Pro Ala Val Ser Gln His Pro Arg Thr Lys Ser Ser Arg Leu Gln 1325 1330 1335Gly Ser Ser Leu Ser Ser Glu Ser Ala Arg His Lys Ala Val Glu 1340 1345 1350Phe Ser Ser Gly Ala Lys Ser Pro Ser Lys Ser Gly Ala Gln Thr 1355 1360 1365Pro Lys Ser Pro Pro Glu His Tyr Val Gln Glu Thr Pro Leu Met 1370 1375 1380Phe Ser Arg Cys Thr Ser Val Ser Ser Leu Asp Ser Phe Glu Ser 1385 1390 1395Arg Ser Ile Ala Ser Ser Val Gln Ser Glu Pro Cys Ser Gly Met 1400 1405 1410Val Ser Gly Ile Ile Ser Pro Ser Asp Leu Pro Asp Ser Pro Gly 1415 1420 1425Gln Thr Met Pro Pro Ser Arg Ser Lys Thr Pro Pro Pro Pro Pro 1430 1435 1440Gln Thr Ala Gln Thr Lys Arg Glu Val Pro Lys Asn Lys Ala Pro 1445 1450 1455Thr Ala Glu Lys Arg Glu Ser Gly Pro Lys Gln Ala Ala Val Asn 1460 1465 1470Ala Ala Val Gln Arg Val Gln Val Leu Pro Asp Ala Asp Thr Leu 1475 1480 1485Leu His Phe Ala Thr Glu Ser Thr Pro Asp Gly Phe Ser Cys Ser 1490 1495 1500Ser Ser Leu Ser Ala Leu Ser Leu Asp Glu Pro Phe Ile Gln Lys 1505 1510 1515Asp Val Glu Leu Arg Ile Met Pro Pro Val Gln Glu Asn Asp Asn 1520 1525 1530Gly Asn Glu Thr Glu Ser Glu Gln Pro Lys Glu Ser Asn Glu Asn 1535 1540 1545Gln Glu Lys Glu Ala Glu Lys Thr Ile Asp Ser Glu Lys Asp Leu 1550 1555 1560Leu Asp Asp Ser Asp Asp Asp Asp Ile Glu Ile Leu Glu Glu Cys 1565 1570 1575Ile Ile Ser Ala Met Pro Thr Lys Ser Ser Arg Lys Ala Lys Lys 1580 1585 1590Pro Ala Gln Thr Ala Ser Lys Leu Pro Pro Pro Val Ala Arg Lys 1595 1600 1605Pro Ser Gln Leu Pro Val Tyr Lys Leu Leu Pro Ser Gln Asn Arg 1610 1615 1620Leu Gln Pro Gln Lys His Val Ser Phe Thr Pro Gly Asp Asp Met 1625 1630 1635Pro Arg Val Tyr Cys Val Glu Gly Thr Pro Ile Asn Phe Ser Thr 1640 1645 1650Ala Thr Ser Leu Ser Asp Leu Thr Ile Glu Ser Pro Pro Asn Glu 1655 1660 1665Leu Ala Ala Gly Glu Gly Val Arg Gly Gly Ala Gln Ser Gly Glu 1670 1675 1680Phe Glu Lys Arg Asp Thr Ile Pro Thr Glu Gly Arg Ser Thr Asp 1685 1690 1695Glu Ala Gln Gly Gly Lys Thr Ser Ser Val Thr Ile Pro Glu Leu 1700 1705 1710Asp Asp Asn Lys Ala Glu Glu Gly Asp Ile Leu Ala Glu Cys Ile 1715 1720 1725Asn Ser Ala Met Pro Lys Gly Lys Ser His Lys Pro Phe Arg Val 1730 1735 1740Lys Lys Ile Met Asp Gln Val Gln Gln Ala Ser Ala Ser Ser Ser 1745 1750 1755Ala Pro Asn Lys Asn Gln Leu Asp Gly Lys Lys Lys Lys Pro Thr 1760 1765 1770Ser Pro Val Lys Pro Ile Pro Gln Asn Thr Glu Tyr Arg Thr Arg 1775 1780 1785Val Arg Lys Asn Ala Asp Ser Lys Asn Asn Leu Asn Ala Glu Arg 1790 1795 1800Val Phe Ser Asp Asn Lys Asp Ser Lys Lys Gln Asn Leu Lys Asn 1805 1810 1815Asn Ser Lys Val Phe Asn Asp Lys Leu Pro Asn Asn Glu Asp Arg 1820 1825 1830Val Arg Gly Ser Phe Ala Phe Asp Ser Pro His His Tyr Thr Pro 1835 1840 1845Ile Glu Gly Thr Pro Tyr Cys Phe Ser Arg Asn Asp Ser Leu Ser 1850 1855 1860Ser Leu Asp Phe Asp Asp Asp Asp Val Asp Leu Ser Arg Glu Lys 1865 1870 1875Ala Glu Leu Arg Lys Ala Lys Glu Asn Lys Glu Ser Glu Ala Lys 1880 1885 1890Val Thr Ser His Thr Glu Leu Thr Ser Asn Gln Gln Ser Ala Asn 1895 1900 1905Lys Thr Gln Ala Ile Ala Lys Gln Pro Ile Asn Arg Gly Gln Pro 1910 1915 1920Lys Pro Ile Leu Gln Lys Gln Ser Thr Phe Pro Gln Ser Ser Lys 1925 1930 1935Asp Ile Pro Asp Arg Gly Ala Ala Thr Asp Glu Lys Leu Gln Asn 1940 1945 1950Phe Ala Ile Glu Asn Thr Pro Val Cys Phe Ser His Asn Ser Ser 1955 1960 1965Leu Ser Ser Leu Ser Asp Ile Asp Gln Glu Asn Asn Asn Lys Glu 1970 1975 1980Asn Glu Pro Ile Lys Glu Thr Glu Pro Pro Asp Ser Gln Gly Glu 1985 1990 1995Pro Ser Lys Pro Gln Ala Ser Gly Tyr Ala Pro Lys Ser Phe His 2000 2005 2010Val Glu Asp Thr Pro Val Cys Phe Ser Arg Asn Ser Ser Leu Ser 2015 2020 2025Ser Leu Ser Ile Asp Ser Glu Asp Asp Leu Leu Gln Glu Cys Ile 2030 2035 2040Ser Ser Ala Met Pro Lys Lys Lys Lys Pro Ser Arg Leu Lys Gly 2045 2050 2055Asp Asn Glu Lys His Ser Pro Arg Asn Met Gly Gly Ile Leu Gly 2060 2065 2070Glu Asp Leu Thr Leu Asp Leu Lys Asp Ile Gln Arg Pro Asp Ser 2075 2080 2085Glu His Gly Leu Ser Pro Asp Ser Glu Asn Phe Asp Trp Lys Ala 2090 2095 2100Ile Gln Glu Gly Ala Asn Ser Ile Val Ser Ser Leu His Gln Ala 2105 2110 2115Ala Ala Ala Ala Cys Leu Ser Arg Gln Ala Ser Ser Asp Ser Asp 2120 2125 2130Ser Ile Leu Ser Leu Lys Ser Gly Ile Ser Leu Gly Ser Pro Phe 2135 2140 2145His Leu Thr Pro Asp Gln Glu Glu Lys Pro Phe Thr Ser Asn Lys 2150 2155 2160Gly Pro Arg Ile Leu Lys Pro Gly Glu Lys Ser Thr Leu Glu Thr 2165 2170 2175Lys Lys Ile Glu Ser Glu Ser Lys Gly Ile Lys Gly Gly Lys Lys 2180 2185 2190Val Tyr Lys Ser Leu Ile Thr Gly Lys Val Arg Ser Asn Ser Glu 2195 2200 2205Ile Ser Gly Gln Met Lys Gln Pro Leu Gln Ala Asn Met Pro Ser 2210 2215 2220Ile Ser Arg Gly Arg Thr Met Ile His Ile Pro Gly Val Arg Asn 2225 2230 2235Ser Ser Ser Ser Thr Ser Pro Val Ser Lys Lys Gly Pro Pro Leu 2240 2245 2250Lys Thr Pro Ala Ser Lys Ser Pro Ser Glu Gly Gln Thr Ala Thr 2255 2260 2265Thr Ser Pro Arg Gly Ala Lys Pro Ser Val Lys Ser Glu Leu Ser 2270 2275 2280Pro Val Ala Arg Gln Thr Ser Gln Ile Gly Gly Ser Ser Lys Ala 2285 2290 2295Pro Ser Arg Ser Gly Ser Arg Asp Ser Thr Pro Ser Arg Pro Ala 2300 2305 2310Gln Gln Pro Leu Ser Arg Pro Ile Gln Ser Pro Gly Arg Asn Ser 2315 2320 2325Ile Ser Pro Gly Arg Asn Gly Ile Ser Pro Pro Asn Lys Leu Ser 2330 2335 2340Gln Leu Pro Arg Thr Ser Ser Pro Ser Thr Ala Ser Thr Lys Ser 2345 2350 2355Ser Gly Ser Gly Lys Met Ser Tyr Thr Ser Pro Gly Arg Gln Met 2360 2365 2370Ser Gln Gln Asn Leu Thr Lys Gln Thr Gly Leu Ser Lys Asn Ala 2375 2380 2385Ser Ser Ile Pro Arg Ser Glu Ser Ala Ser Lys Gly Leu Asn Gln 2390 2395 2400Met Asn Asn Gly Asn Gly Ala Asn Lys Lys Val Glu Leu Ser Arg 2405 2410 2415Met Ser Ser Thr Lys Ser Ser Gly Ser Glu Ser Asp Arg Ser Glu 2420 2425 2430Arg Pro Val Leu Val Arg Gln Ser Thr Phe Ile Lys Glu Ala Pro 2435 2440 2445Ser
Pro Thr Leu Arg Arg Lys Leu Glu Glu Ser Ala Ser Phe Glu 2450 2455 2460Ser Leu Ser Pro Ser Ser Arg Pro Ala Ser Pro Thr Arg Ser Gln 2465 2470 2475Ala Gln Thr Pro Val Leu Ser Pro Ser Leu Pro Asp Met Ser Leu 2480 2485 2490Ser Thr His Ser Ser Val Gln Ala Gly Gly Trp Arg Lys Leu Pro 2495 2500 2505Pro Asn Leu Ser Pro Thr Ile Glu Tyr Asn Asp Gly Arg Pro Ala 2510 2515 2520Lys Arg His Asp Ile Ala Arg Ser His Ser Glu Ser Pro Ser Arg 2525 2530 2535Leu Pro Ile Asn Arg Ser Gly Thr Trp Lys Arg Glu His Ser Lys 2540 2545 2550His Ser Ser Ser Leu Pro Arg Val Ser Thr Trp Arg Arg Thr Gly 2555 2560 2565Ser Ser Ser Ser Ile Leu Ser Ala Ser Ser Glu Ser Ser Glu Lys 2570 2575 2580Ala Lys Ser Glu Asp Glu Lys His Val Asn Ser Ile Ser Gly Thr 2585 2590 2595Lys Gln Ser Lys Glu Asn Gln Val Ser Ala Lys Gly Thr Trp Arg 2600 2605 2610Lys Ile Lys Glu Asn Glu Phe Ser Pro Thr Asn Ser Thr Ser Gln 2615 2620 2625Thr Val Ser Ser Gly Ala Thr Asn Gly Ala Glu Ser Lys Thr Leu 2630 2635 2640Ile Tyr Gln Met Ala Pro Ala Val Ser Lys Thr Glu Asp Val Trp 2645 2650 2655Val Arg Ile Glu Asp Cys Pro Ile Asn Asn Pro Arg Ser Gly Arg 2660 2665 2670Ser Pro Thr Gly Asn Thr Pro Pro Val Ile Asp Ser Val Ser Glu 2675 2680 2685Lys Ala Asn Pro Asn Ile Lys Asp Ser Lys Asp Asn Gln Ala Lys 2690 2695 2700Gln Asn Val Gly Asn Gly Ser Val Pro Met Arg Thr Val Gly Leu 2705 2710 2715Glu Asn Arg Leu Asn Ser Phe Ile Gln Val Asp Ala Pro Asp Gln 2720 2725 2730Lys Gly Thr Glu Ile Lys Pro Gly Gln Asn Asn Pro Val Pro Val 2735 2740 2745Ser Glu Thr Asn Glu Ser Ser Ile Val Glu Arg Thr Pro Phe Ser 2750 2755 2760Ser Ser Ser Ser Ser Lys His Ser Ser Pro Ser Gly Thr Val Ala 2765 2770 2775Ala Arg Val Thr Pro Phe Asn Tyr Asn Pro Ser Pro Arg Lys Ser 2780 2785 2790Ser Ala Asp Ser Thr Ser Ala Arg Pro Ser Gln Ile Pro Thr Pro 2795 2800 2805Val Asn Asn Asn Thr Lys Lys Arg Asp Ser Lys Thr Asp Ser Thr 2810 2815 2820Glu Ser Ser Gly Thr Gln Ser Pro Lys Arg His Ser Gly Ser Tyr 2825 2830 2835Leu Val Thr Ser Val 2840210740DNAHomo sapiens 2gtattggtgc agcccgccag ggtgtcactg gagacagaat ggaggtgctg ccggactcgg 60aaatggggtc caagggtagc caaggatggc tgcagcttca tatgatcagt tgttaaagca 120agttgaggca ctgaagatgg agaactcaaa tcttcgacaa gagctagaag ataattccaa 180tcatcttaca aaactggaaa ctgaggcatc taatatgaag gaagtactta aacaactaca 240aggaagtatt gaagatgaag ctatggcttc ttctggacag attgatttat tagagcgtct 300taaagagctt aacttagata gcagtaattt ccctggagta aaactgcggt caaaaatgtc 360cctccgttct tatggaagcc gggaaggatc tgtatcaagc cgttctggag agtgcagtcc 420tgttcctatg ggttcatttc caagaagagg gtttgtaaat ggaagcagag aaagtactgg 480atatttagaa gaacttgaga aagagaggtc attgcttctt gctgatcttg acaaagaaga 540aaaggaaaaa gactggtatt acgctcaact tcagaatctc actaaaagaa tagatagtct 600tcctttaact gaaaattttt ccttacaaac agatatgacc agaaggcaat tggaatatga 660agcaaggcaa atcagagttg cgatggaaga acaactaggt acctgccagg atatggaaaa 720acgagcacag cgaagaatag ccagaattca gcaaatcgaa aaggacatac ttcgtatacg 780acagctttta cagtcccaag caacagaagc agagaggtca tctcagaaca agcatgaaac 840cggctcacat gatgctgagc ggcagaatga aggtcaagga gtgggagaaa tcaacatggc 900aacttctggt aatggtcagg gttcaactac acgaatggac catgaaacag ccagtgtttt 960gagttctagt agcacacact ctgcacctcg aaggctgaca agtcatctgg gaaccaaggt 1020ggaaatggtg tattcattgt tgtcaatgct tggtactcat gataaggatg atatgtcgcg 1080aactttgcta gctatgtcta gctcccaaga cagctgtata tccatgcgac agtctggatg 1140tcttcctctc ctcatccagc ttttacatgg caatgacaaa gactctgtat tgttgggaaa 1200ttcccggggc agtaaagagg ctcgggccag ggccagtgca gcactccaca acatcattca 1260ctcacagcct gatgacaaga gaggcaggcg tgaaatccga gtccttcatc ttttggaaca 1320gatacgcgct tactgtgaaa cctgttggga gtggcaggaa gctcatgaac caggcatgga 1380ccaggacaaa aatccaatgc cagctcctgt tgaacatcag atctgtcctg ctgtgtgtgt 1440tctaatgaaa ctttcatttg atgaagagca tagacatgca atgaatgaac tagggggact 1500acaggccatt gcagaattat tgcaagtgga ctgtgaaatg tatgggctta ctaatgacca 1560ctacagtatt acactaagac gatatgctgg aatggctttg acaaacttga cttttggaga 1620tgtagccaac aaggctacgc tatgctctat gaaaggctgc atgagagcac ttgtggccca 1680actaaaatct gaaagtgaag acttacagca ggttattgcg agtgttttga ggaatttgtc 1740ttggcgagca gatgtaaata gtaaaaagac gttgcgagaa gttggaagtg tgaaagcatt 1800gatggaatgt gctttagaag ttaaaaagga atcaaccctc aaaagcgtat tgagtgcctt 1860atggaatttg tcagcacatt gcactgagaa taaagctgat atatgtgctg tagatggtgc 1920acttgcattt ttggttggca ctcttactta ccggagccag acaaacactt tagccattat 1980tgaaagtgga ggtgggatat tacggaatgt gtccagcttg atagctacaa atgaggacca 2040caggcaaatc ctaagagaga acaactgtct acaaacttta ttacaacact taaaatctca 2100tagtttgaca atagtcagta atgcatgtgg aactttgtgg aatctctcag caagaaatcc 2160taaagaccag gaagcattat gggacatggg ggcagttagc atgctcaaga acctcattca 2220ttcaaagcac aaaatgattg ctatgggaag tgctgcagct ttaaggaatc tcatggcaaa 2280taggcctgcg aagtacaagg atgccaatat tatgtctcct ggctcaagct tgccatctct 2340tcatgttagg aaacaaaaag ccctagaagc agaattagat gctcagcact tatcagaaac 2400ttttgacaat atagacaatt taagtcccaa ggcatctcat cgtagtaagc agagacacaa 2460gcaaagtctc tatggtgatt atgtttttga caccaatcga catgatgata ataggtcaga 2520caattttaat actggcaaca tgactgtcct ttcaccatat ttgaatacta cagtgttacc 2580cagctcctct tcatcaagag gaagcttaga tagttctcgt tctgaaaaag atagaagttt 2640ggagagagaa cgcggaattg gtctaggcaa ctaccatcca gcaacagaaa atccaggaac 2700ttcttcaaag cgaggtttgc agatctccac cactgcagcc cagattgcca aagtcatgga 2760agaagtgtca gccattcata cctctcagga agacagaagt tctgggtcta ccactgaatt 2820acattgtgtg acagatgaga gaaatgcact tagaagaagc tctgctgccc atacacattc 2880aaacacttac aatttcacta agtcggaaaa ttcaaatagg acatgttcta tgccttatgc 2940caaattagaa tacaagagat cttcaaatga tagtttaaat agtgtcagta gtagtgatgg 3000ttatggtaaa agaggtcaaa tgaaaccctc gattgaatcc tattctgaag atgatgaaag 3060taagttttgc agttatggtc aatacccagc cgacctagcc cataaaatac atagtgcaaa 3120tcatatggat gataatgatg gagaactaga tacaccaata aattatagtc ttaaatattc 3180agatgagcag ttgaactctg gaaggcaaag tccttcacag aatgaaagat gggcaagacc 3240caaacacata atagaagatg aaataaaaca aagtgagcaa agacaatcaa ggaatcaaag 3300tacaacttat cctgtttata ctgagagcac tgatgataaa cacctcaagt tccaaccaca 3360ttttggacag caggaatgtg tttctccata caggtcacgg ggagccaatg gttcagaaac 3420aaatcgagtg ggttctaatc atggaattaa tcaaaatgta agccagtctt tgtgtcaaga 3480agatgactat gaagatgata agcctaccaa ttatagtgaa cgttactctg aagaagaaca 3540gcatgaagaa gaagagagac caacaaatta tagcataaaa tataatgaag agaaacgtca 3600tgtggatcag cctattgatt atagtttaaa atatgccaca gatattcctt catcacagaa 3660acagtcattt tcattctcaa agagttcatc tggacaaagc agtaaaaccg aacatatgtc 3720ttcaagcagt gagaatacgt ccacaccttc atctaatgcc aagaggcaga atcagctcca 3780tccaagttct gcacagagta gaagtggtca gcctcaaaag gctgccactt gcaaagtttc 3840ttctattaac caagaaacaa tacagactta ttgtgtagaa gatactccaa tatgtttttc 3900aagatgtagt tcattatcat ctttgtcatc agctgaagat gaaataggat gtaatcagac 3960gacacaggaa gcagattctg ctaataccct gcaaatagca gaaataaaag aaaagattgg 4020aactaggtca gctgaagatc ctgtgagcga agttccagca gtgtcacagc accctagaac 4080caaatccagc agactgcagg gttctagttt atcttcagaa tcagccaggc acaaagctgt 4140tgaattttct tcaggagcga aatctccctc caaaagtggt gctcagacac ccaaaagtcc 4200acctgaacac tatgttcagg agaccccact catgtttagc agatgtactt ctgtcagttc 4260acttgatagt tttgagagtc gttcgattgc cagctccgtt cagagtgaac catgcagtgg 4320aatggtaagt ggcattataa gccccagtga tcttccagat agccctggac aaaccatgcc 4380accaagcaga agtaaaacac ctccaccacc tcctcaaaca gctcaaacca agcgagaagt 4440acctaaaaat aaagcaccta ctgctgaaaa gagagagagt ggacctaagc aagctgcagt 4500aaatgctgca gttcagaggg tccaggttct tccagatgct gatactttat tacattttgc 4560cacggaaagt actccagatg gattttcttg ttcatccagc ctgagtgctc tgagcctcga 4620tgagccattt atacagaaag atgtggaatt aagaataatg cctccagttc aggaaaatga 4680caatgggaat gaaacagaat cagagcagcc taaagaatca aatgaaaacc aagagaaaga 4740ggcagaaaaa actattgatt ctgaaaagga cctattagat gattcagatg atgatgatat 4800tgaaatacta gaagaatgta ttatttctgc catgccaaca aagtcatcac gtaaagcaaa 4860aaagccagcc cagactgctt caaaattacc tccacctgtg gcaaggaaac caagtcagct 4920gcctgtgtac aaacttctac catcacaaaa caggttgcaa ccccaaaagc atgttagttt 4980tacaccgggg gatgatatgc cacgggtgta ttgtgttgaa gggacaccta taaacttttc 5040cacagctaca tctctaagtg atctaacaat cgaatcccct ccaaatgagt tagctgctgg 5100agaaggagtt agaggagggg cacagtcagg tgaatttgaa aaacgagata ccattcctac 5160agaaggcaga agtacagatg aggctcaagg aggaaaaacc tcatctgtaa ccatacctga 5220attggatgac aataaagcag aggaaggtga tattcttgca gaatgcatta attctgctat 5280gcccaaaggg aaaagtcaca agcctttccg tgtgaaaaag ataatggacc aggtccagca 5340agcatctgcg tcttcttctg cacccaacaa aaatcagtta gatggtaaga aaaagaaacc 5400aacttcacca gtaaaaccta taccacaaaa tactgaatat aggacacgtg taagaaaaaa 5460tgcagactca aaaaataatt taaatgctga gagagttttc tcagacaaca aagattcaaa 5520gaaacagaat ttgaaaaata attccaaggt cttcaatgat aagctcccaa ataatgaaga 5580tagagtcaga ggaagttttg cttttgattc acctcatcat tacacgccta ttgaaggaac 5640tccttactgt ttttcacgaa atgattcttt gagttctcta gattttgatg atgatgatgt 5700tgacctttcc agggaaaagg ctgaattaag aaaggcaaaa gaaaataagg aatcagaggc 5760taaagttacc agccacacag aactaacctc caaccaacaa tcagctaata agacacaagc 5820tattgcaaag cagccaataa atcgaggtca gcctaaaccc atacttcaga aacaatccac 5880ttttccccag tcatccaaag acataccaga cagaggggca gcaactgatg aaaagttaca 5940gaattttgct attgaaaata ctccggtttg cttttctcat aattcctctc tgagttctct 6000cagtgacatt gaccaagaaa acaacaataa agaaaatgaa cctatcaaag agactgagcc 6060ccctgactca cagggagaac caagtaaacc tcaagcatca ggctatgctc ctaaatcatt 6120tcatgttgaa gataccccag tttgtttctc aagaaacagt tctctcagtt ctcttagtat 6180tgactctgaa gatgacctgt tgcaggaatg tataagctcc gcaatgccaa aaaagaaaaa 6240gccttcaaga ctcaagggtg ataatgaaaa acatagtccc agaaatatgg gtggcatatt 6300aggtgaagat ctgacacttg atttgaaaga tatacagaga ccagattcag aacatggtct 6360atcccctgat tcagaaaatt ttgattggaa agctattcag gaaggtgcaa attccatagt 6420aagtagttta catcaagctg ctgctgctgc atgtttatct agacaagctt cgtctgattc 6480agattccatc ctttccctga aatcaggaat ctctctggga tcaccatttc atcttacacc 6540tgatcaagaa gaaaaaccct ttacaagtaa taaaggccca cgaattctaa aaccagggga 6600gaaaagtaca ttggaaacta aaaagataga atctgaaagt aaaggaatca aaggaggaaa 6660aaaagtttat aaaagtttga ttactggaaa agttcgatct aattcagaaa tttcaggcca 6720aatgaaacag ccccttcaag caaacatgcc ttcaatctct cgaggcagga caatgattca 6780tattccagga gttcgaaata gctcctcaag tacaagtcct gtttctaaaa aaggcccacc 6840ccttaagact ccagcctcca aaagccctag tgaaggtcaa acagccacca cttctcctag 6900aggagccaag ccatctgtga aatcagaatt aagccctgtt gccaggcaga catcccaaat 6960aggtgggtca agtaaagcac cttctagatc aggatctaga gattcgaccc cttcaagacc 7020tgcccagcaa ccattaagta gacctataca gtctcctggc cgaaactcaa tttcccctgg 7080tagaaatgga ataagtcctc ctaacaaatt atctcaactt ccaaggacat catcccctag 7140tactgcttca actaagtcct caggttctgg aaaaatgtca tatacatctc caggtagaca 7200gatgagccaa cagaacctta ccaaacaaac aggtttatcc aagaatgcca gtagtattcc 7260aagaagtgag tctgcctcca aaggactaaa tcagatgaat aatggtaatg gagccaataa 7320aaaggtagaa ctttctagaa tgtcttcaac taaatcaagt ggaagtgaat ctgatagatc 7380agaaagacct gtattagtac gccagtcaac tttcatcaaa gaagctccaa gcccaacctt 7440aagaagaaaa ttggaggaat ctgcttcatt tgaatctctt tctccatcat ctagaccagc 7500ttctcccact aggtcccagg cacaaactcc agttttaagt ccttcccttc ctgatatgtc 7560tctatccaca cattcgtctg ttcaggctgg tggatggcga aaactcccac ctaatctcag 7620tcccactata gagtataatg atggaagacc agcaaagcgc catgatattg cacggtctca 7680ttctgaaagt ccttctagac ttccaatcaa taggtcagga acctggaaac gtgagcacag 7740caaacattca tcatcccttc ctcgagtaag cacttggaga agaactggaa gttcatcttc 7800aattctttct gcttcatcag aatccagtga aaaagcaaaa agtgaggatg aaaaacatgt 7860gaactctatt tcaggaacca aacaaagtaa agaaaaccaa gtatccgcaa aaggaacatg 7920gagaaaaata aaagaaaatg aattttctcc cacaaatagt acttctcaga ccgtttcctc 7980aggtgctaca aatggtgctg aatcaaagac tctaatttat caaatggcac ctgctgtttc 8040taaaacagag gatgtttggg tgagaattga ggactgtccc attaacaatc ctagatctgg 8100aagatctccc acaggtaata ctcccccggt gattgacagt gtttcagaaa aggcaaatcc 8160aaacattaaa gattcaaaag ataatcaggc aaaacaaaat gtgggtaatg gcagtgttcc 8220catgcgtacc gtgggtttgg aaaatcgcct gaactccttt attcaggtgg atgcccctga 8280ccaaaaagga actgagataa aaccaggaca aaataatcct gtccctgtat cagagactaa 8340tgaaagttct atagtggaac gtaccccatt cagttctagc agctcaagca aacacagttc 8400acctagtggg actgttgctg ccagagtgac tccttttaat tacaacccaa gccctaggaa 8460aagcagcgca gatagcactt cagctcggcc atctcagatc ccaactccag tgaataacaa 8520cacaaagaag cgagattcca aaactgacag cacagaatcc agtggaaccc aaagtcctaa 8580gcgccattct gggtcttacc ttgtgacatc tgtttaaaag agaggaagaa tgaaactaag 8640aaaattctat gttaattaca actgctatat agacattttg tttcaaatga aactttaaaa 8700gactgaaaaa ttttgtaaat aggtttgatt cttgttagag ggtttttgtt ctggaagcca 8760tatttgatag tatactttgt cttcactggt cttattttgg gaggcactct tgatggttag 8820gaaaaaaata gtaaagccaa gtatgtttgt acagtatgtt ttacatgtat ttaaagtagc 8880atcccatccc aacttccttt aattattgct tgtcttaaaa taatgaacac tacagataga 8940aaatatgata tattgctgtt atcaatcatt tctagattat aaactgacta aacttacatc 9000agggaaaaat tggtatttat gcaaaaaaaa atgtttttgt ccttgtgagt ccatctaaca 9060tcataattaa tcatgtggct gtgaaattca cagtaatatg gttcccgatg aacaagttta 9120cccagcctgc tttgctttac tgcatgaatg aaactgatgg ttcaatttca gaagtaatga 9180ttaacagtta tgtggtcaca tgatgtgcat agagatagct acagtgtaat aatttacact 9240attttgtgct ccaaacaaaa caaaaatctg tgtaactgta aaacattgaa tgaaactatt 9300ttacctgaac tagattttat ctgaaagtag gtagaatttt tgctatgctg taatttgttg 9360tatattctgg tatttgaggt gagatggctg ctcttttatt aatgagacat gaattgtgtc 9420tcaacagaaa ctaaatgaac atttcagaat aaattattgc tgtatgtaaa ctgttactga 9480aattggtatt tgtttgaagg gtcttgtttc acatttgtat taataattgt ttaaaatgcc 9540tcttttaaaa gcttatataa atttttttct tcagcttcta tgcattaaga gtaaaattcc 9600tcttactgta ataaaaacaa ttgaagaaga ctgttgccac ttaaccattc catgcgttgg 9660cacttatcta ttcctgaaat ttcttttatg tgattagctc atcttgattt ttaatatttt 9720tccacttaaa cttttttttc ttactccact ggagctcagt aaaagtaaat tcatgtaata 9780gcaatgcaag cagcctagca cagactaagc attgagcata ataggcccac ataatttcct 9840ctttcttaat attatagaat tctgtacttg aaattgattc ttagacattg cagtctcttc 9900gaggctttac agtgtaaact gtcttgcccc ttcatcttct tgttgcaact gggtctgaca 9960tgaacacttt ttatcaccct gtatgttagg gcaagatctc agcagtgaag tataatcagc 10020actttgccat gctcagaaaa ttcaaatcac atggaacttt agaggtagat ttaatacgat 10080taagatattc agaagtatat tttagaatcc ctgcctgtta aggaaacttt atttgtggta 10140ggtacagttc tggggtacat gttaagtgtc cccttataca gtggagggaa gtcttccttc 10200ctgaaggaaa ataaactgac acttattaac taagataatt tacttaatat atcttccctg 10260atttgtttta aaagatcaga gggtgactga tgatacatgc atacatattt gttgaataaa 10320tgaaaattta tttttagtga taagattcat acactctgta tttggggagg gaaaaccttt 10380ttaagcatgg tggggcactc agataggagt gaatacacct acctggtgcc ttgaaaatca 10440catcaagtag ttaattatct accccttacc tgtgtttata acttccaggt aatgagaatg 10500atttttttta aagctaaaat gccagtaaat aaaagtgcta tgacttgagc taagatattt 10560gactccaatg cctgtactgt gtctactgca ccactttgta aacacttcaa tttactatct 10620ttgaaatgat tgacctttaa atttttgcca aatgttatct gaaattgtct atgaatacca 10680tctacttctg ttgttttccc aggcttccat aaacaatgga gatacatgca aaaaaaaaaa 10740320DNAArtificial Sequencesource/note="Description of Artificial Sequence Synthetic primer" 3tgggagttgc atgaagagtg 20420DNAArtificial Sequencesource/note="Description of Artificial Sequence Synthetic primer" 4tacgcagttc tcatcgacca 20520DNAArtificial Sequencesource/note="Description of Artificial Sequence Synthetic primer" 5ctcctcccca gtctacatcg 20620DNAArtificial Sequencesource/note="Description of Artificial Sequence Synthetic primer" 6aaactgatcc ccgcattttt 20718DNAArtificial Sequencesource/note="Description of Artificial Sequence Synthetic primer" 7cttcctgatc ggcgtgag 18820DNAArtificial Sequencesource/note="Description of Artificial Sequence Synthetic primer" 8cctgcttctg gtggtaatcc 20920DNAArtificial Sequencesource/note="Description of Artificial Sequence Synthetic primer" 9gagctggtgg tttcaccttc 201020DNAArtificial Sequencesource/note="Description of Artificial Sequence Synthetic primer" 10ggtcgaagtc ataggaccca 201120DNAArtificial Sequencesource/note="Description of Artificial Sequence Synthetic primer" 11gcttctggca aggaagacac 201220DNAArtificial Sequencesource/note="Description of Artificial Sequence Synthetic primer" 12ccagccttct ccagattcaa 201320DNAArtificial Sequencesource/note="Description of Artificial Sequence Synthetic primer" 13ttactgtcca cacagcacgc 201419DNAArtificial Sequencesource/note="Description of Artificial Sequence Synthetic primer" 14acttcctgaa cactggccc 191520DNAArtificial Sequencesource/note="Description of Artificial
Sequence Synthetic primer" 15gaggcatttt ggagcagagt 201620DNAArtificial Sequencesource/note="Description of Artificial Sequence Synthetic primer" 16tcagggttgg ttttgatggt 20
* * * * *
D00001
D00002
D00003
D00004
D00005
D00006
D00007
D00008
D00009
D00010
D00011
D00012
D00013
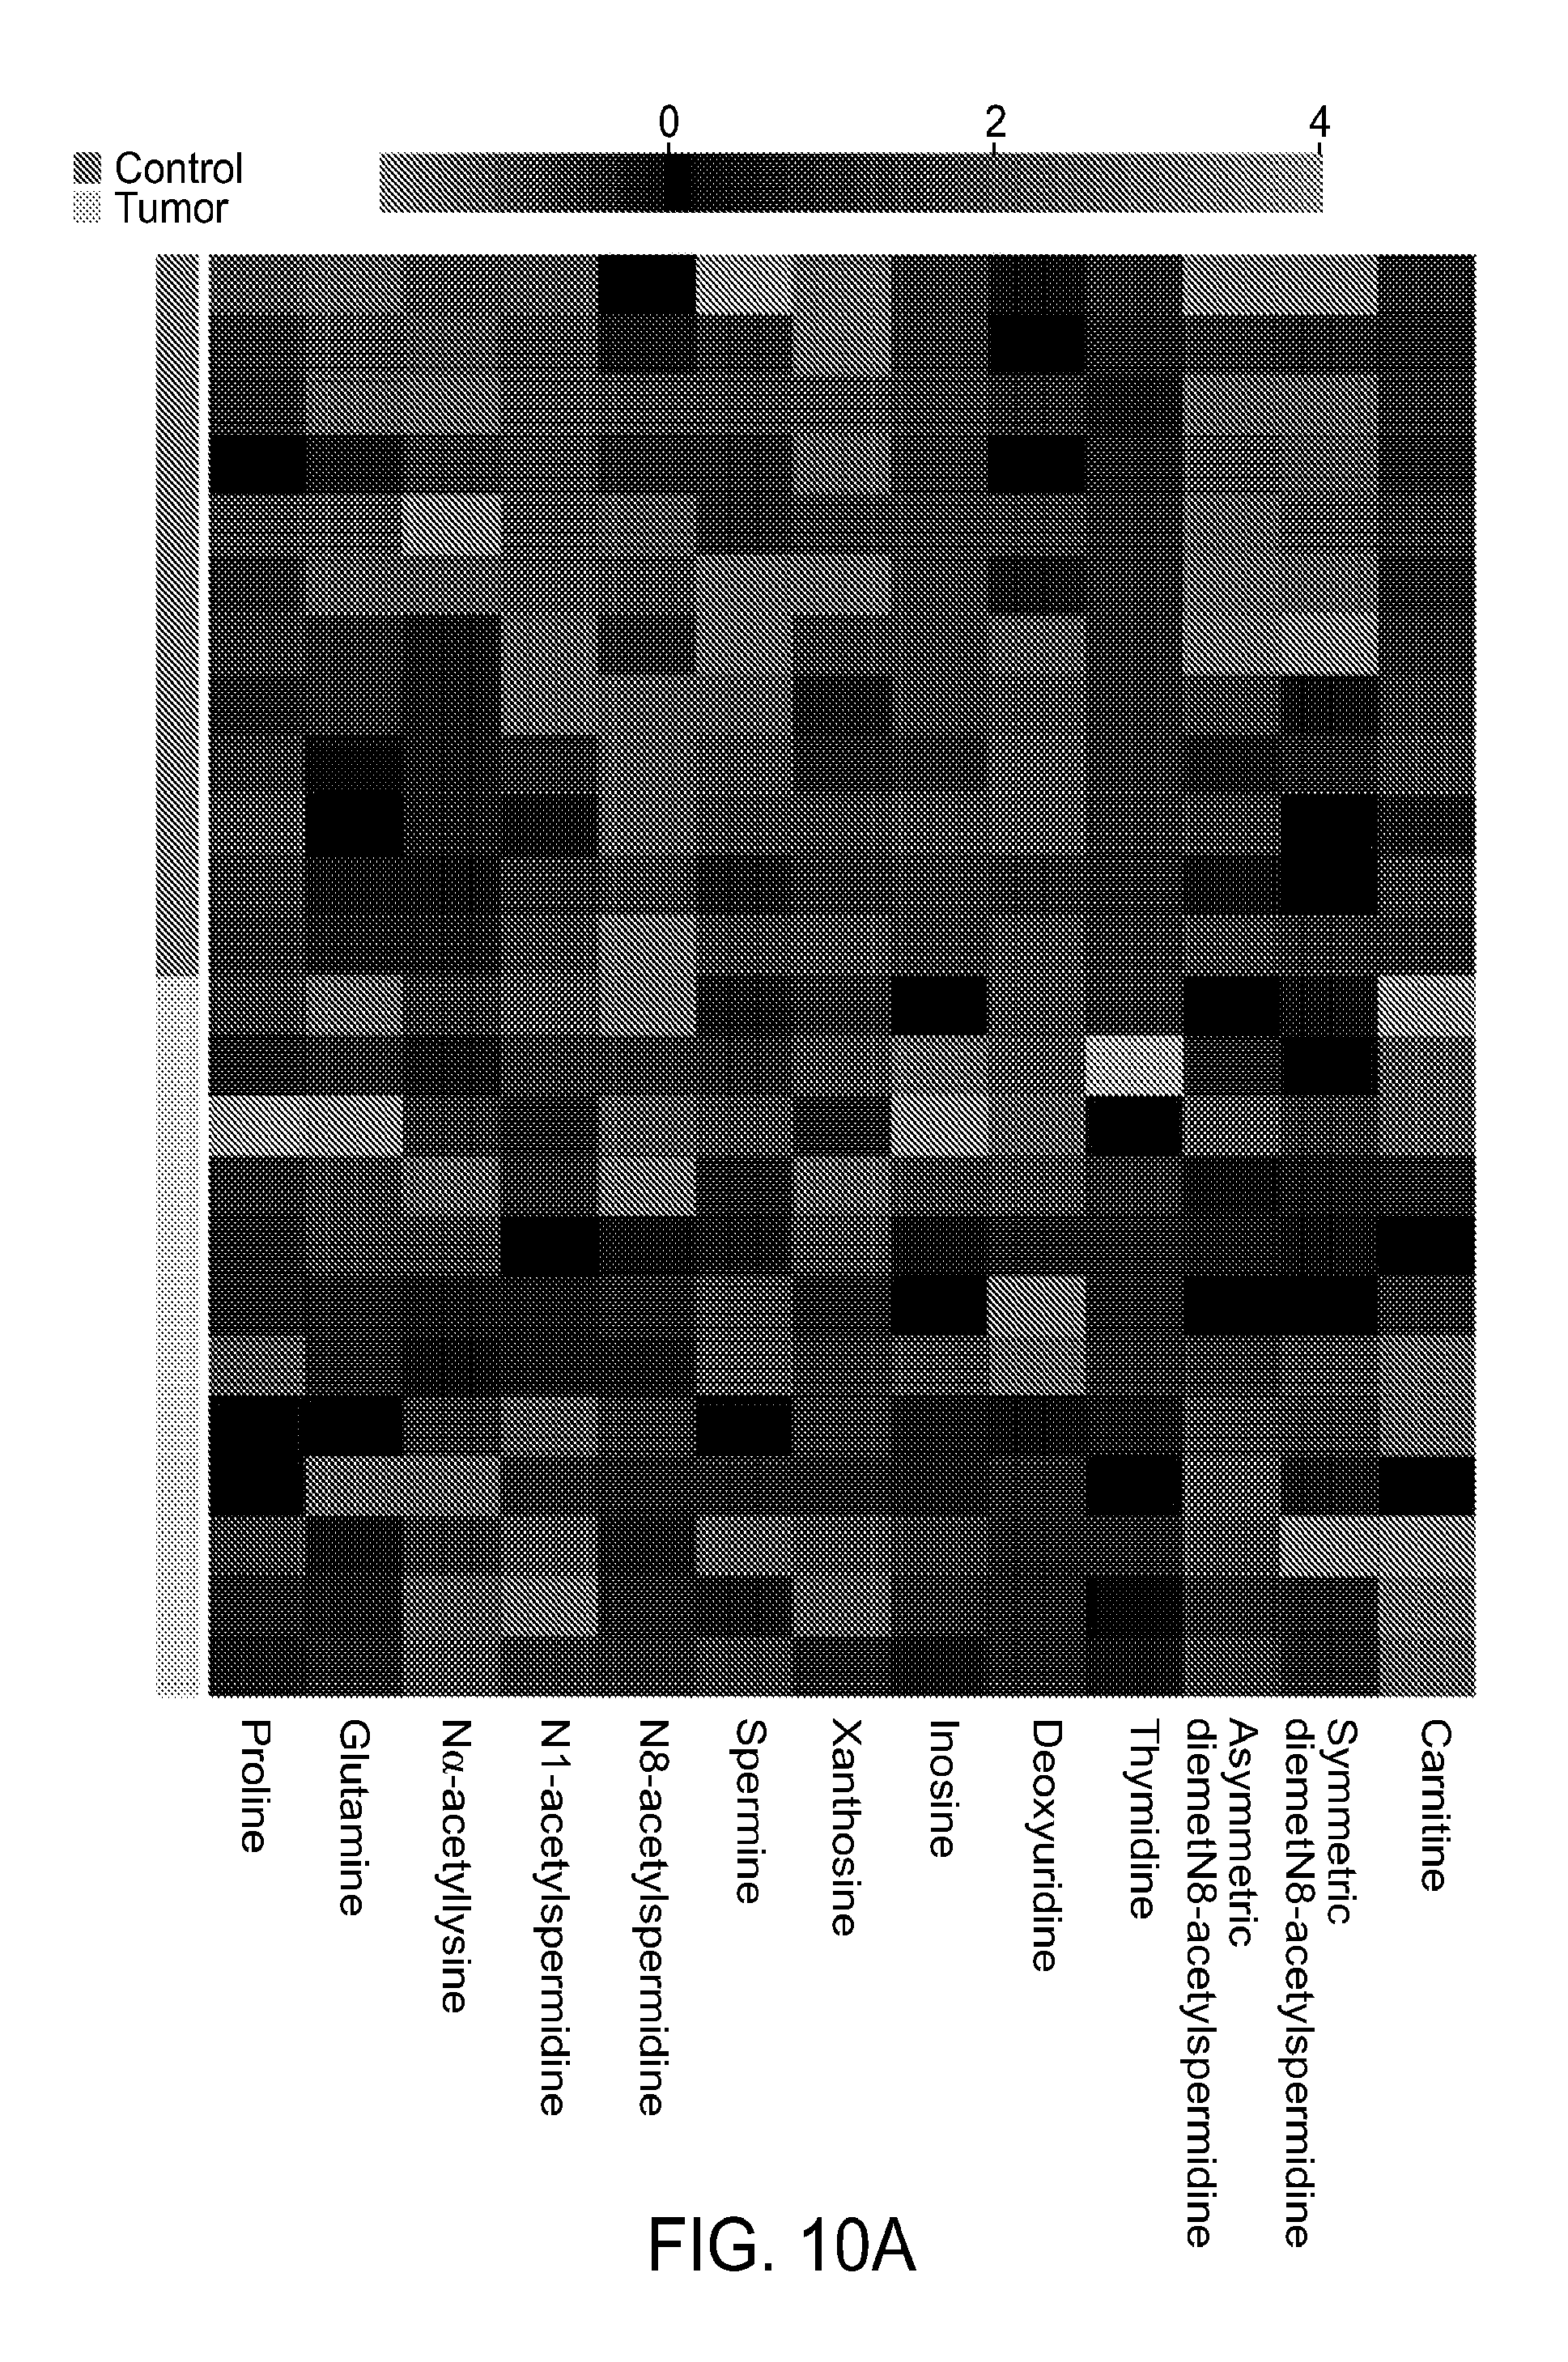
D00014
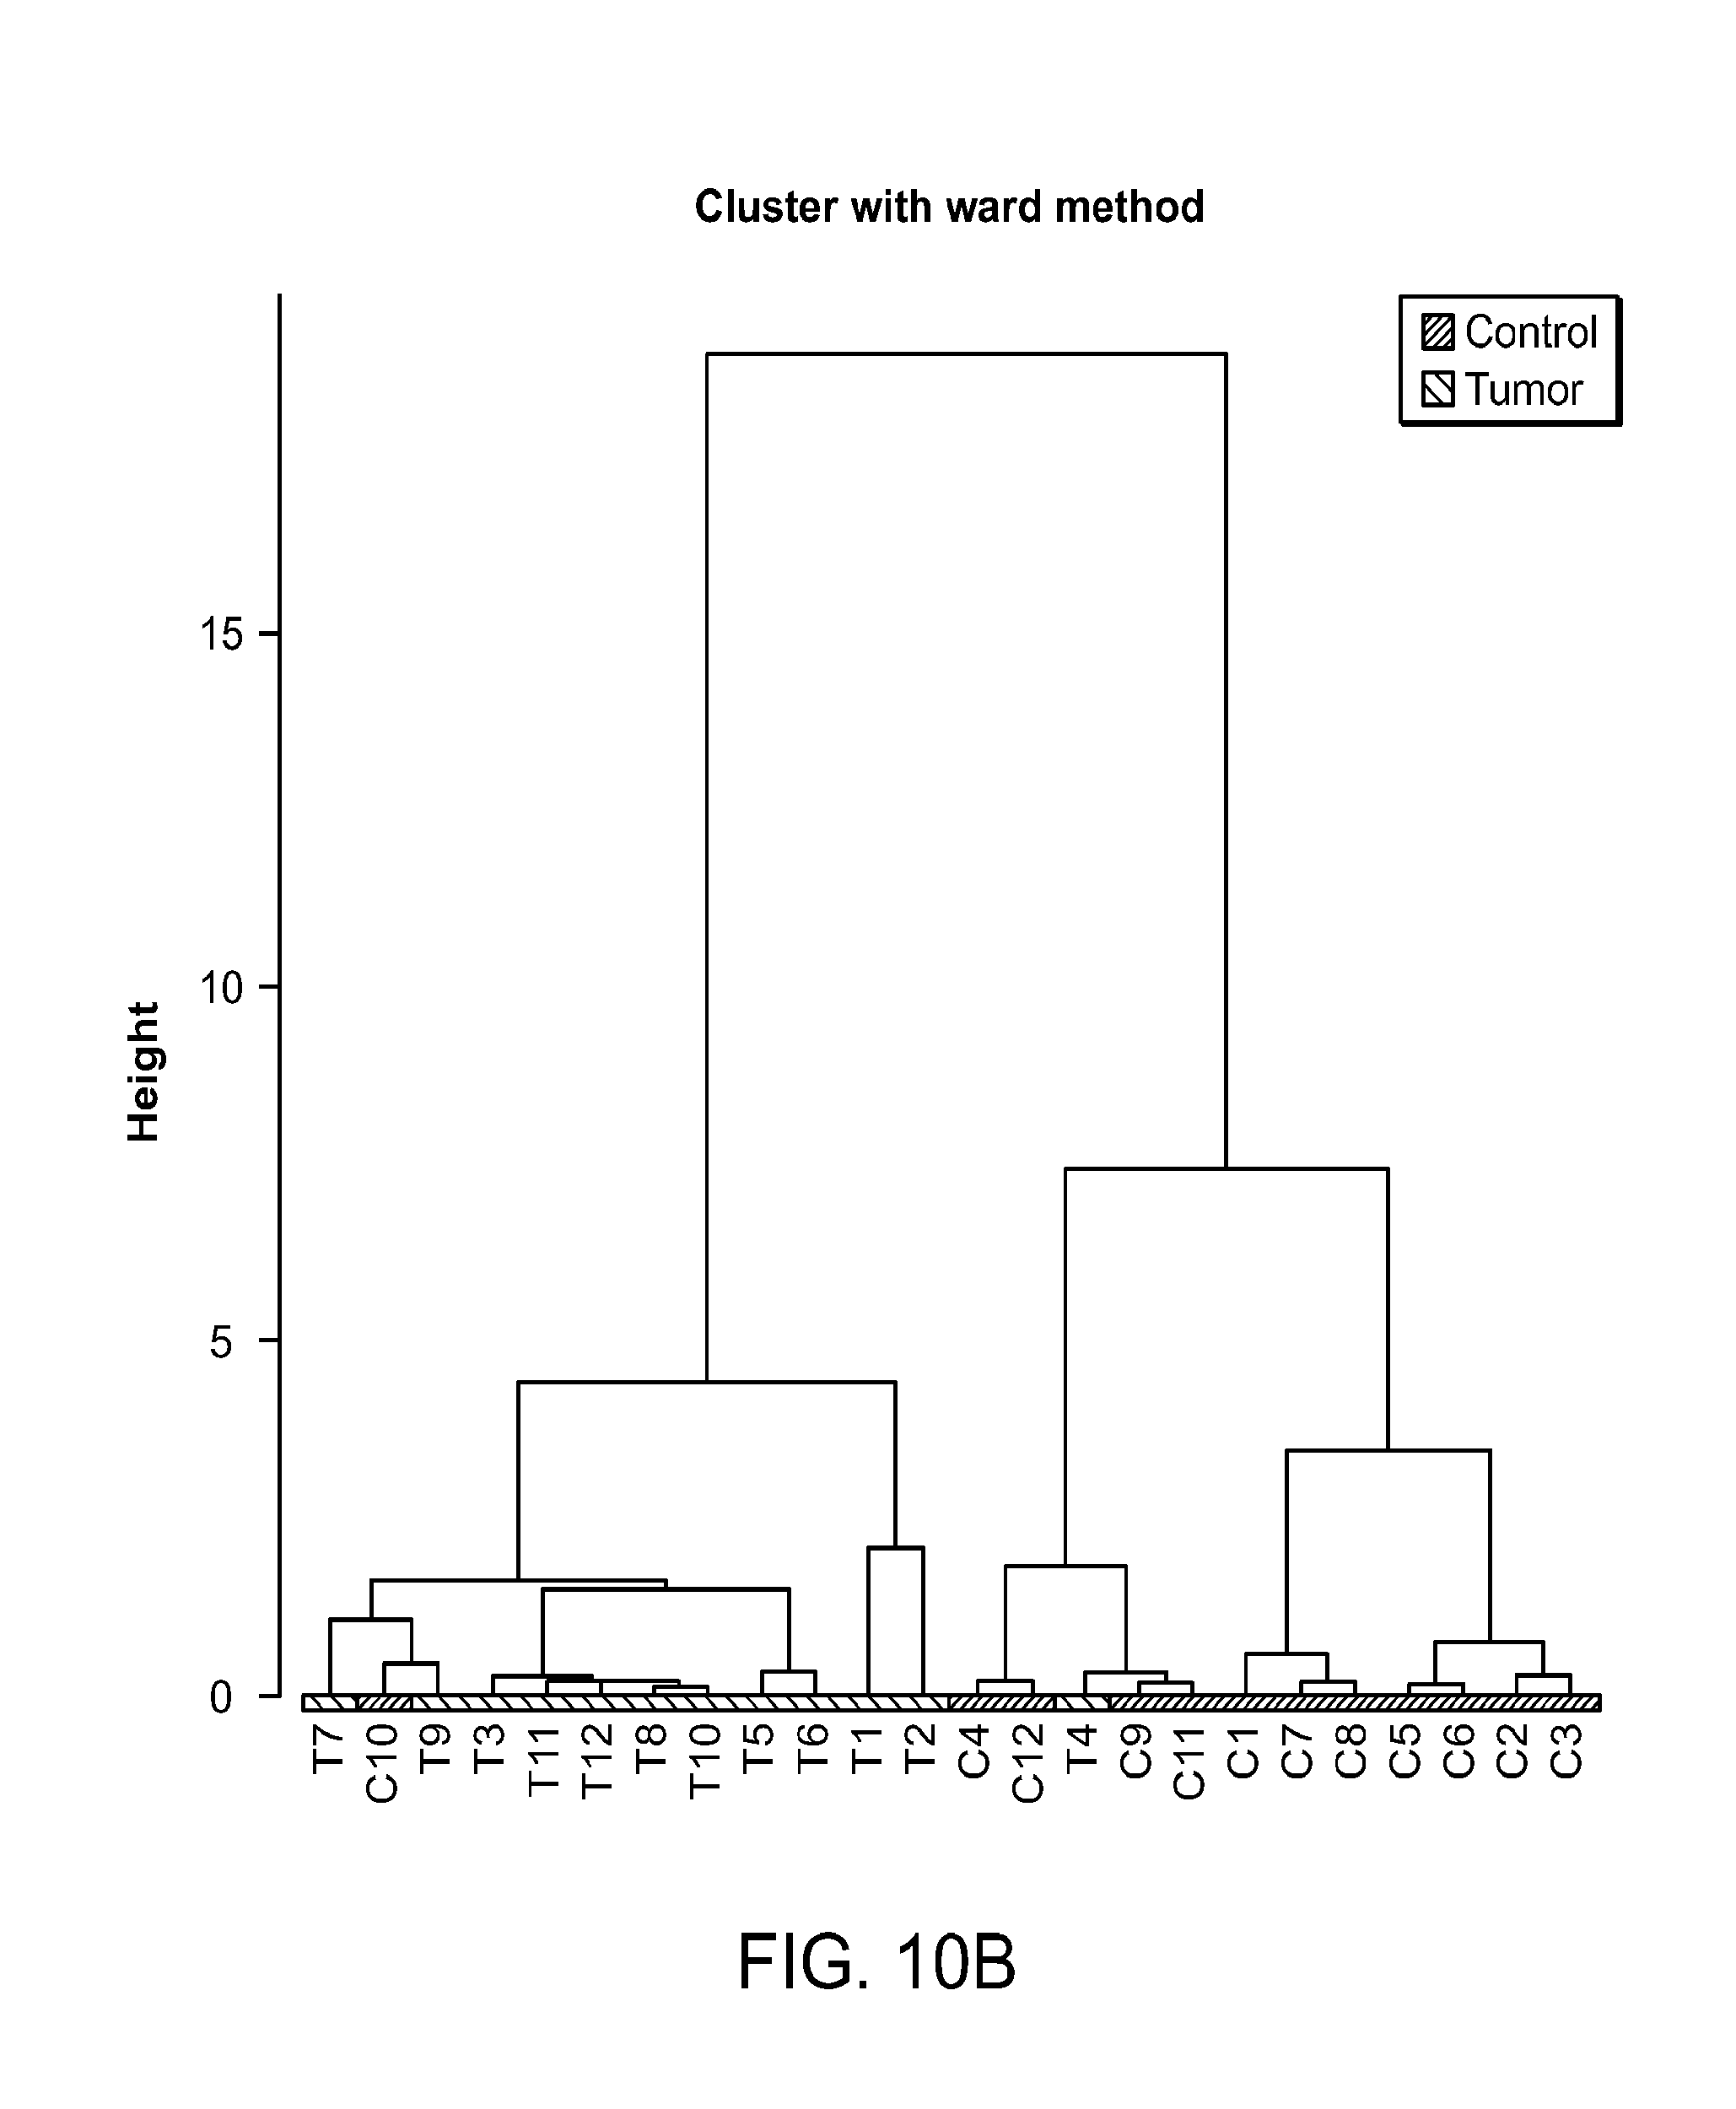
D00015
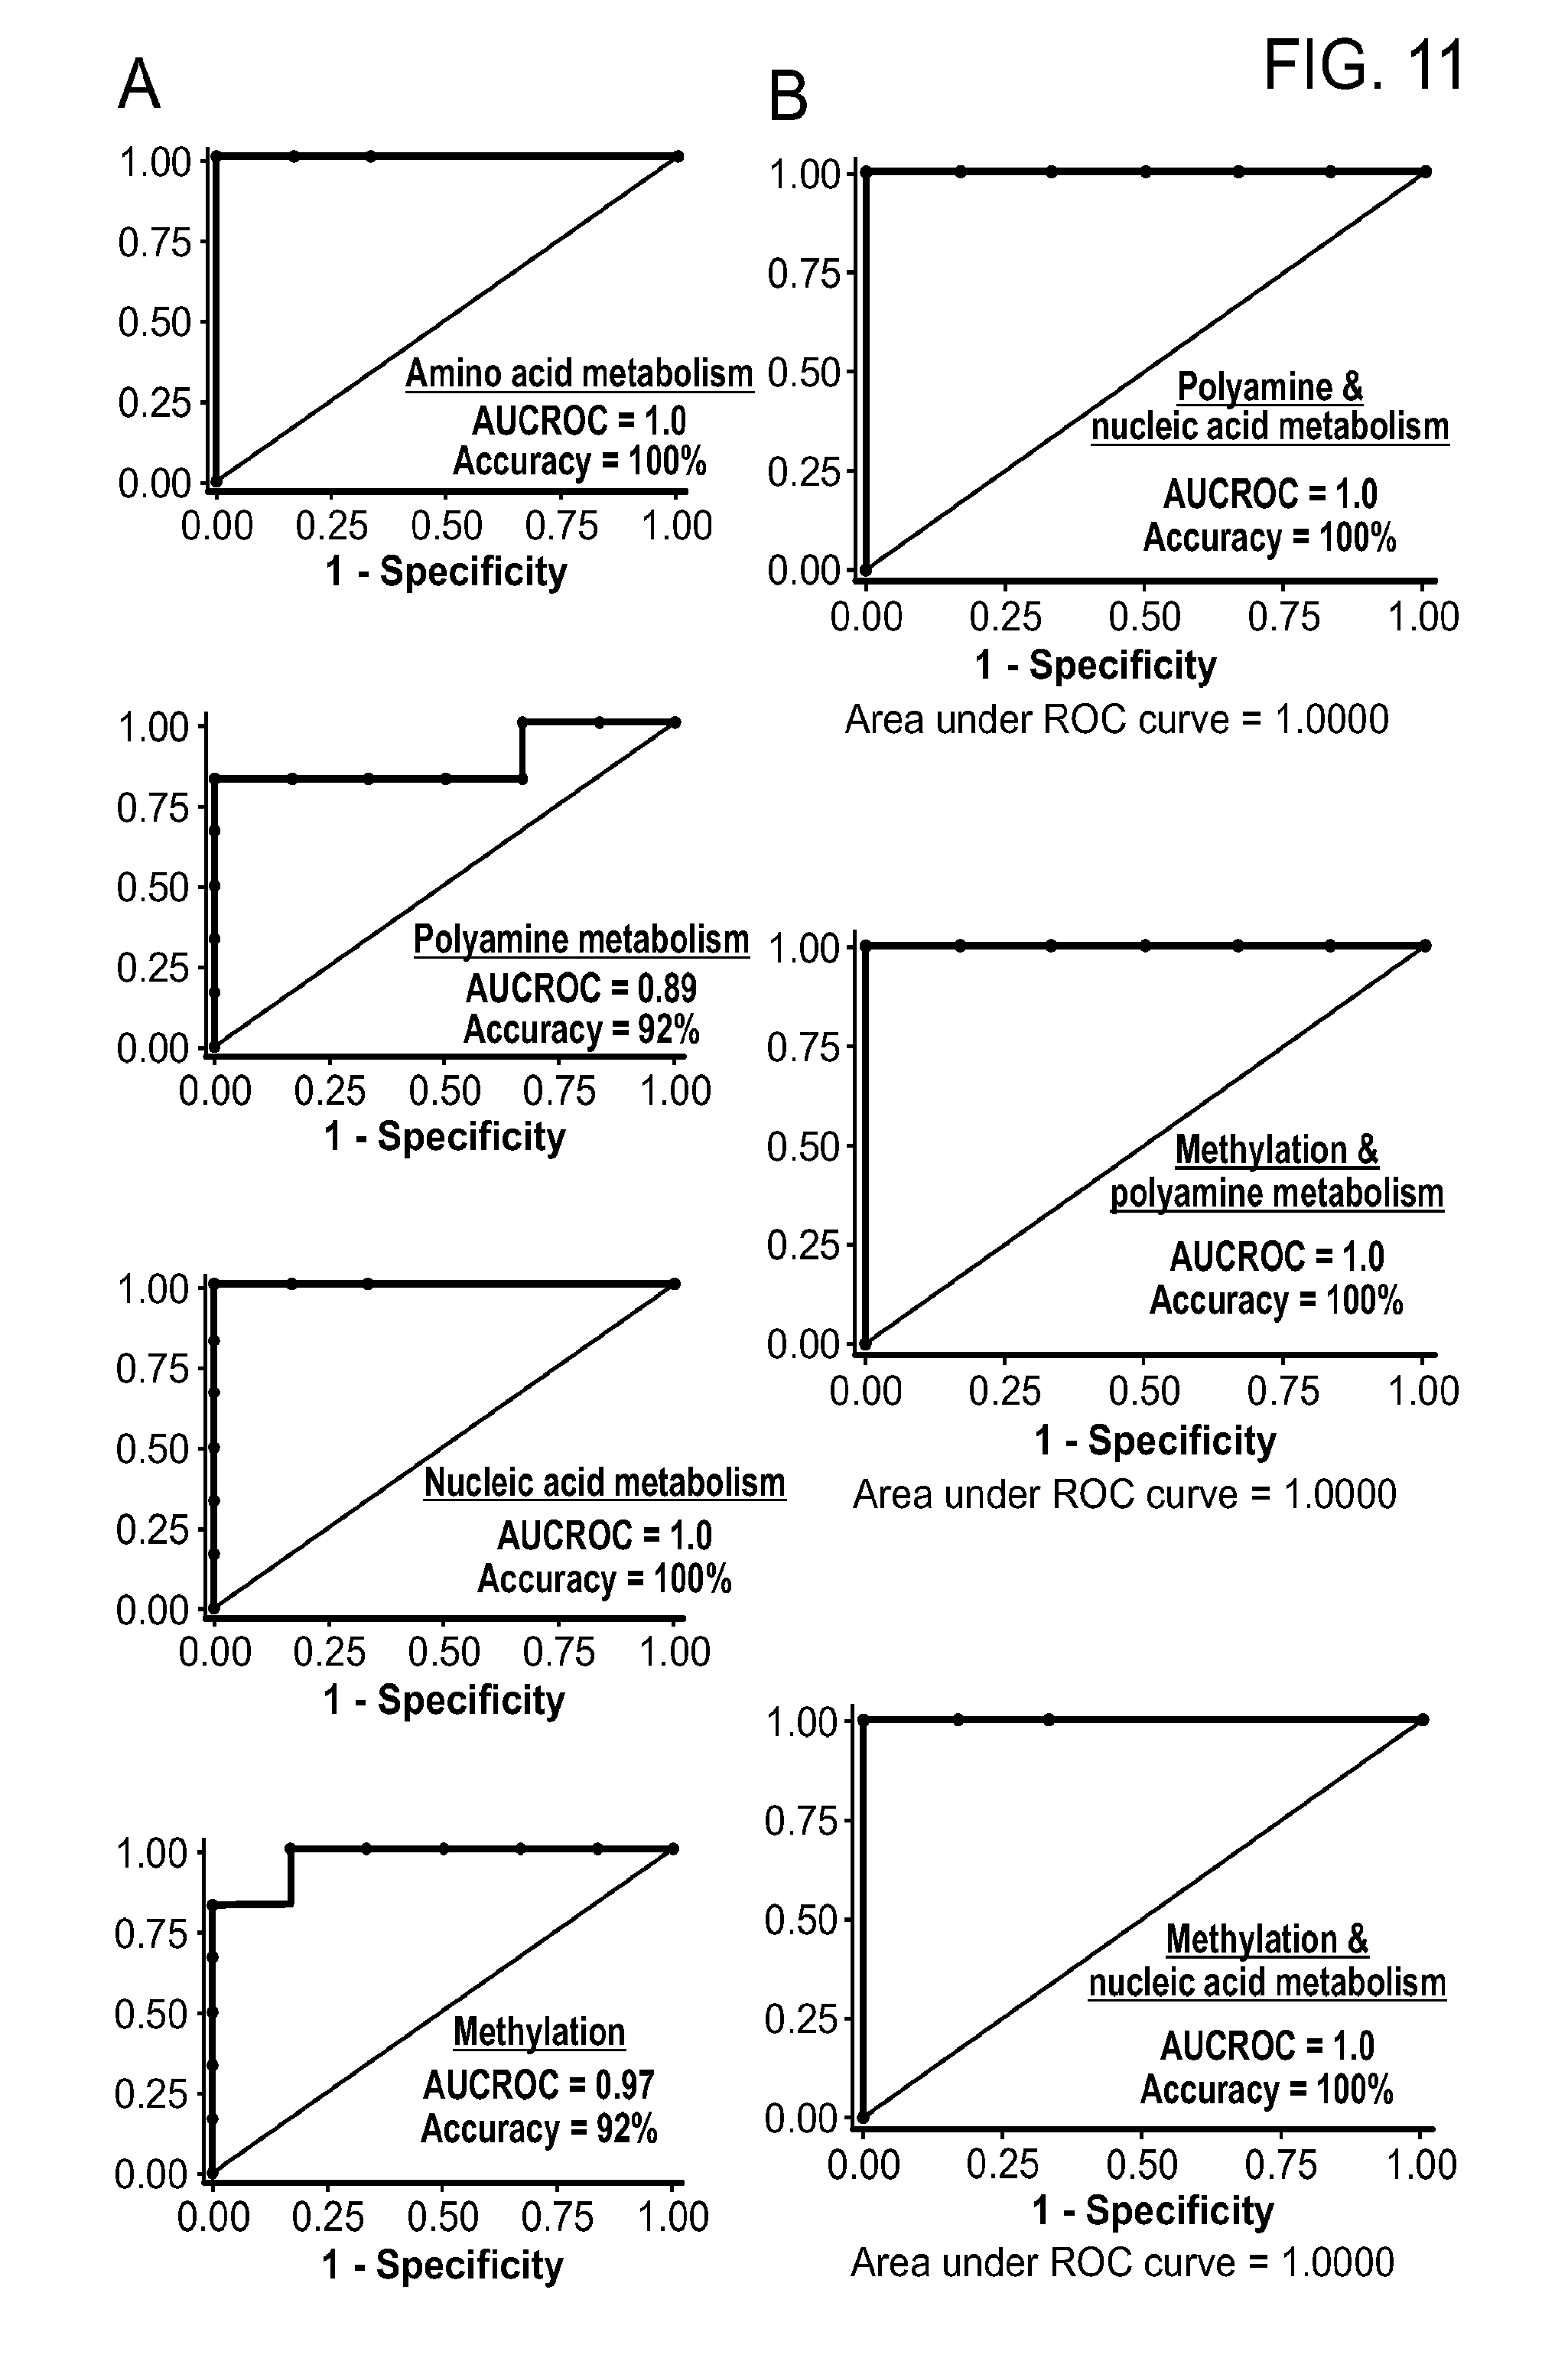
D00016
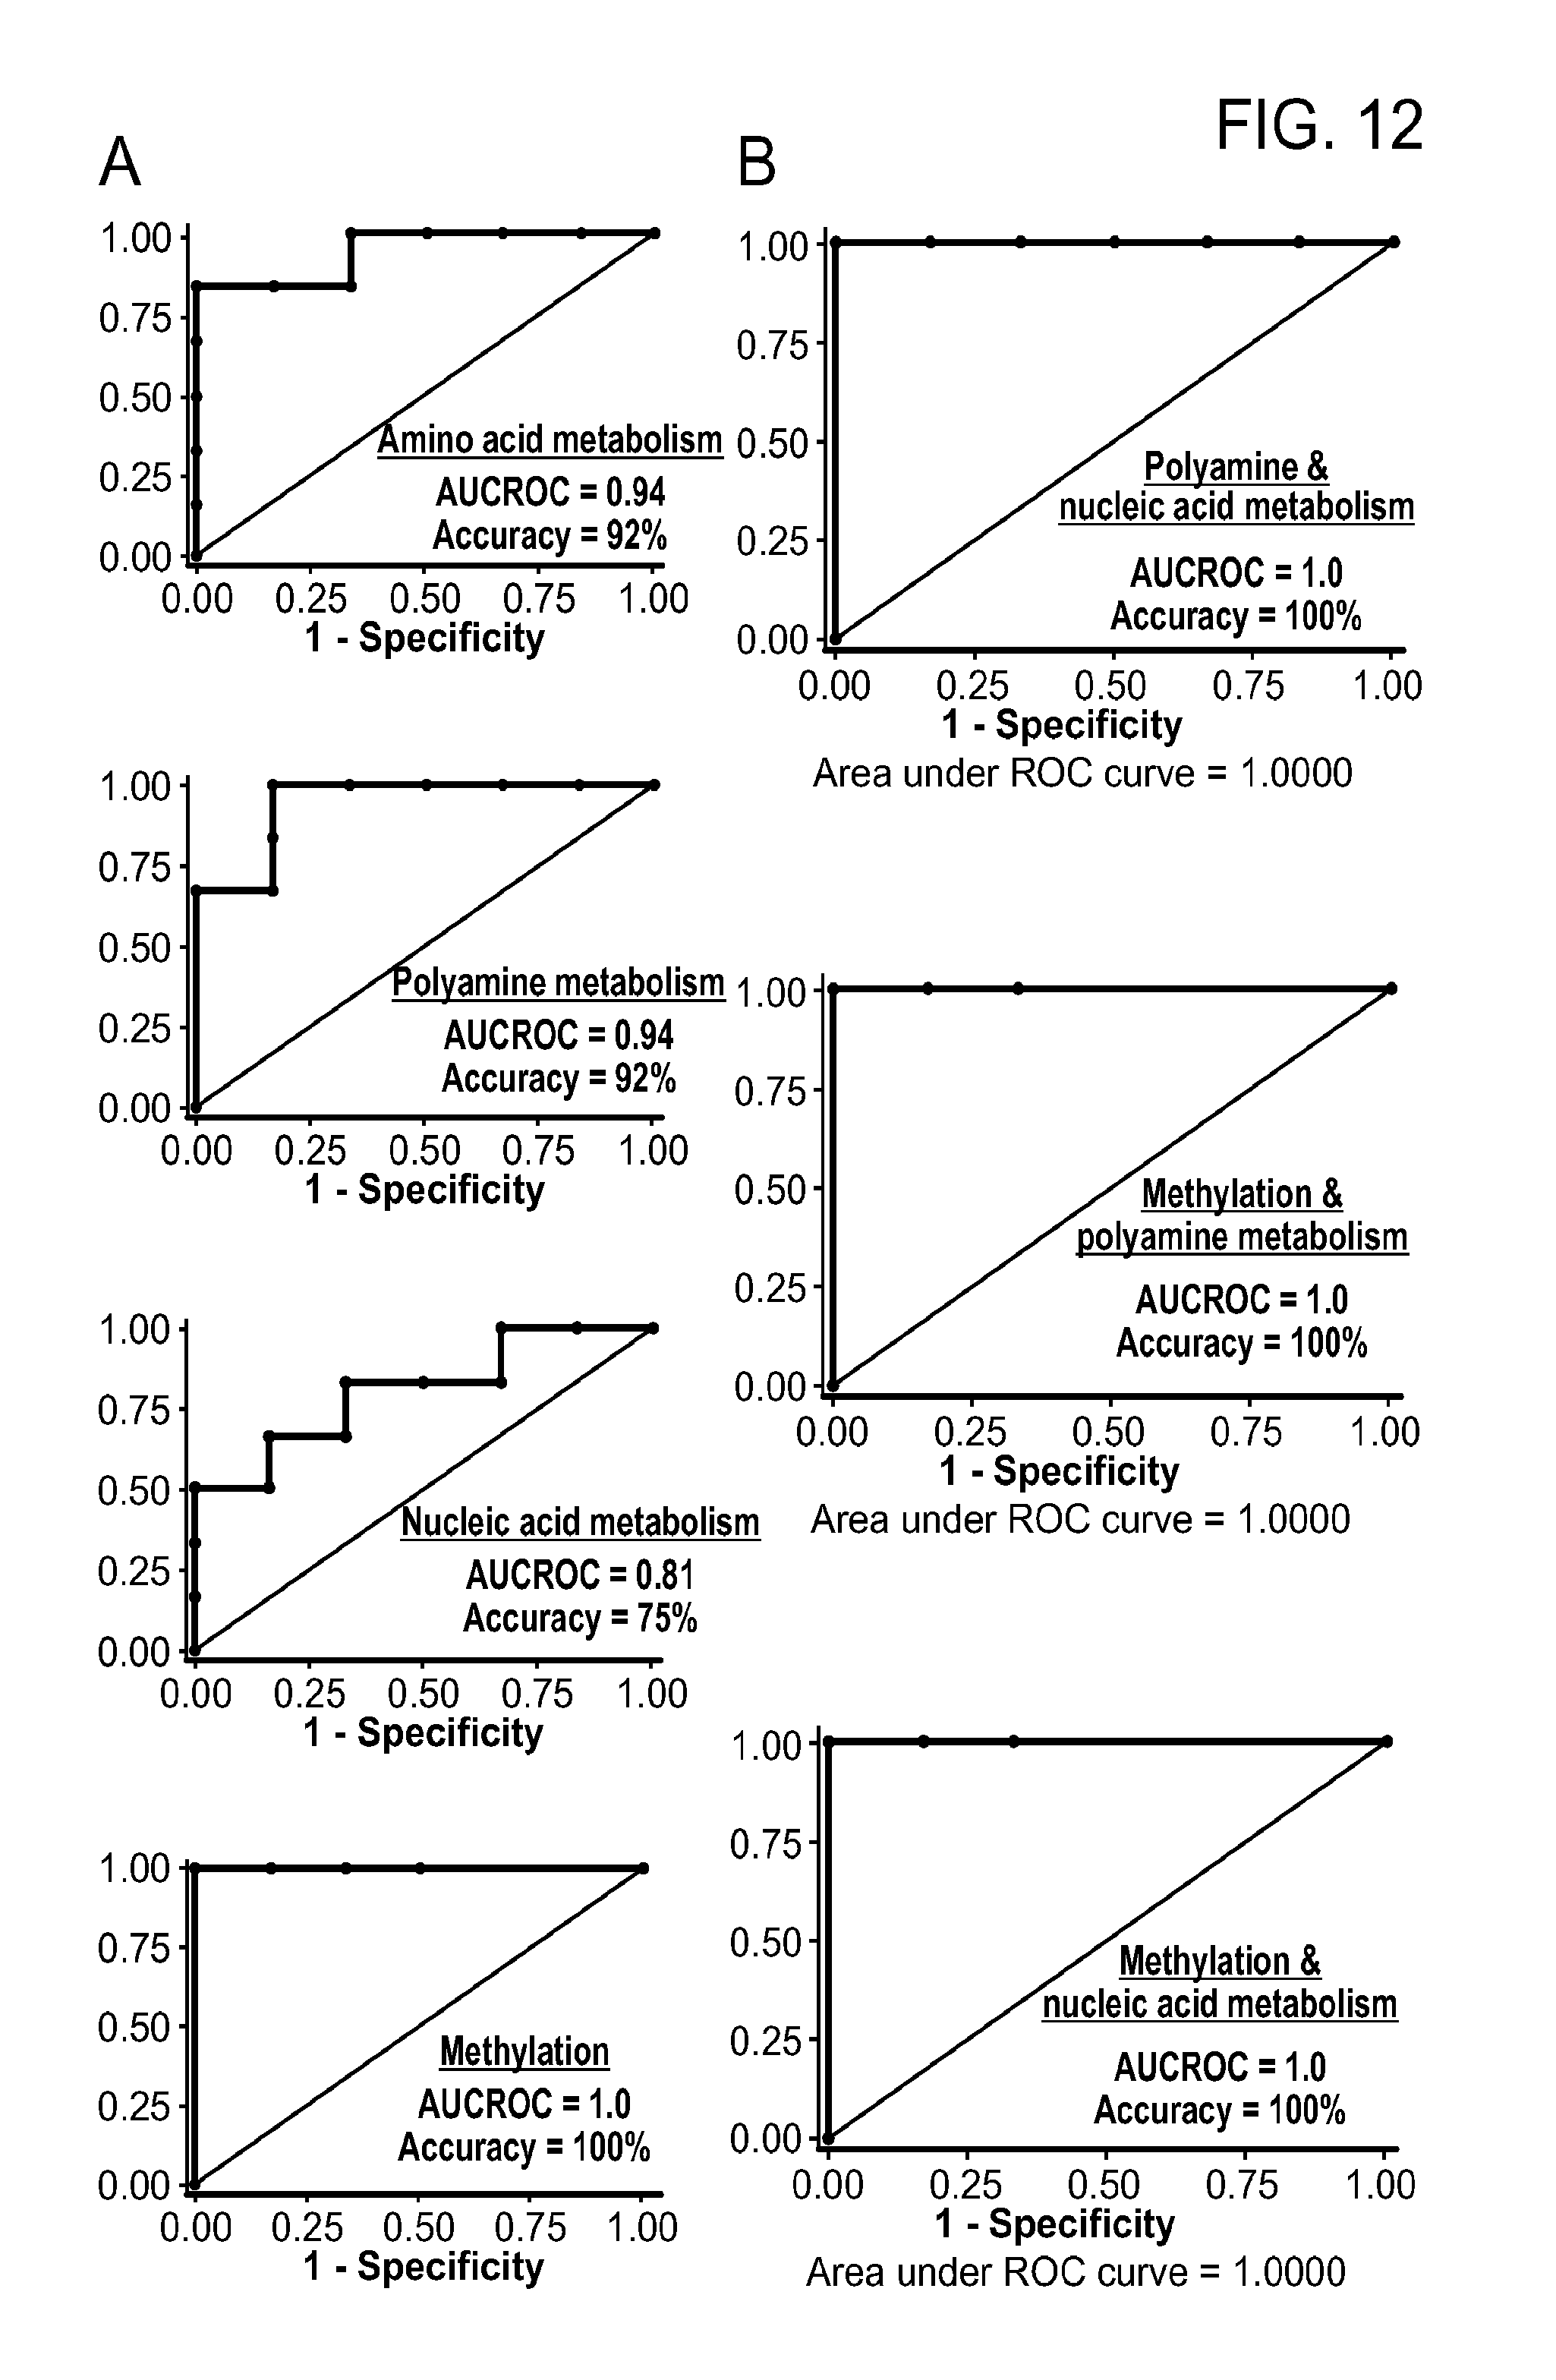
D00017
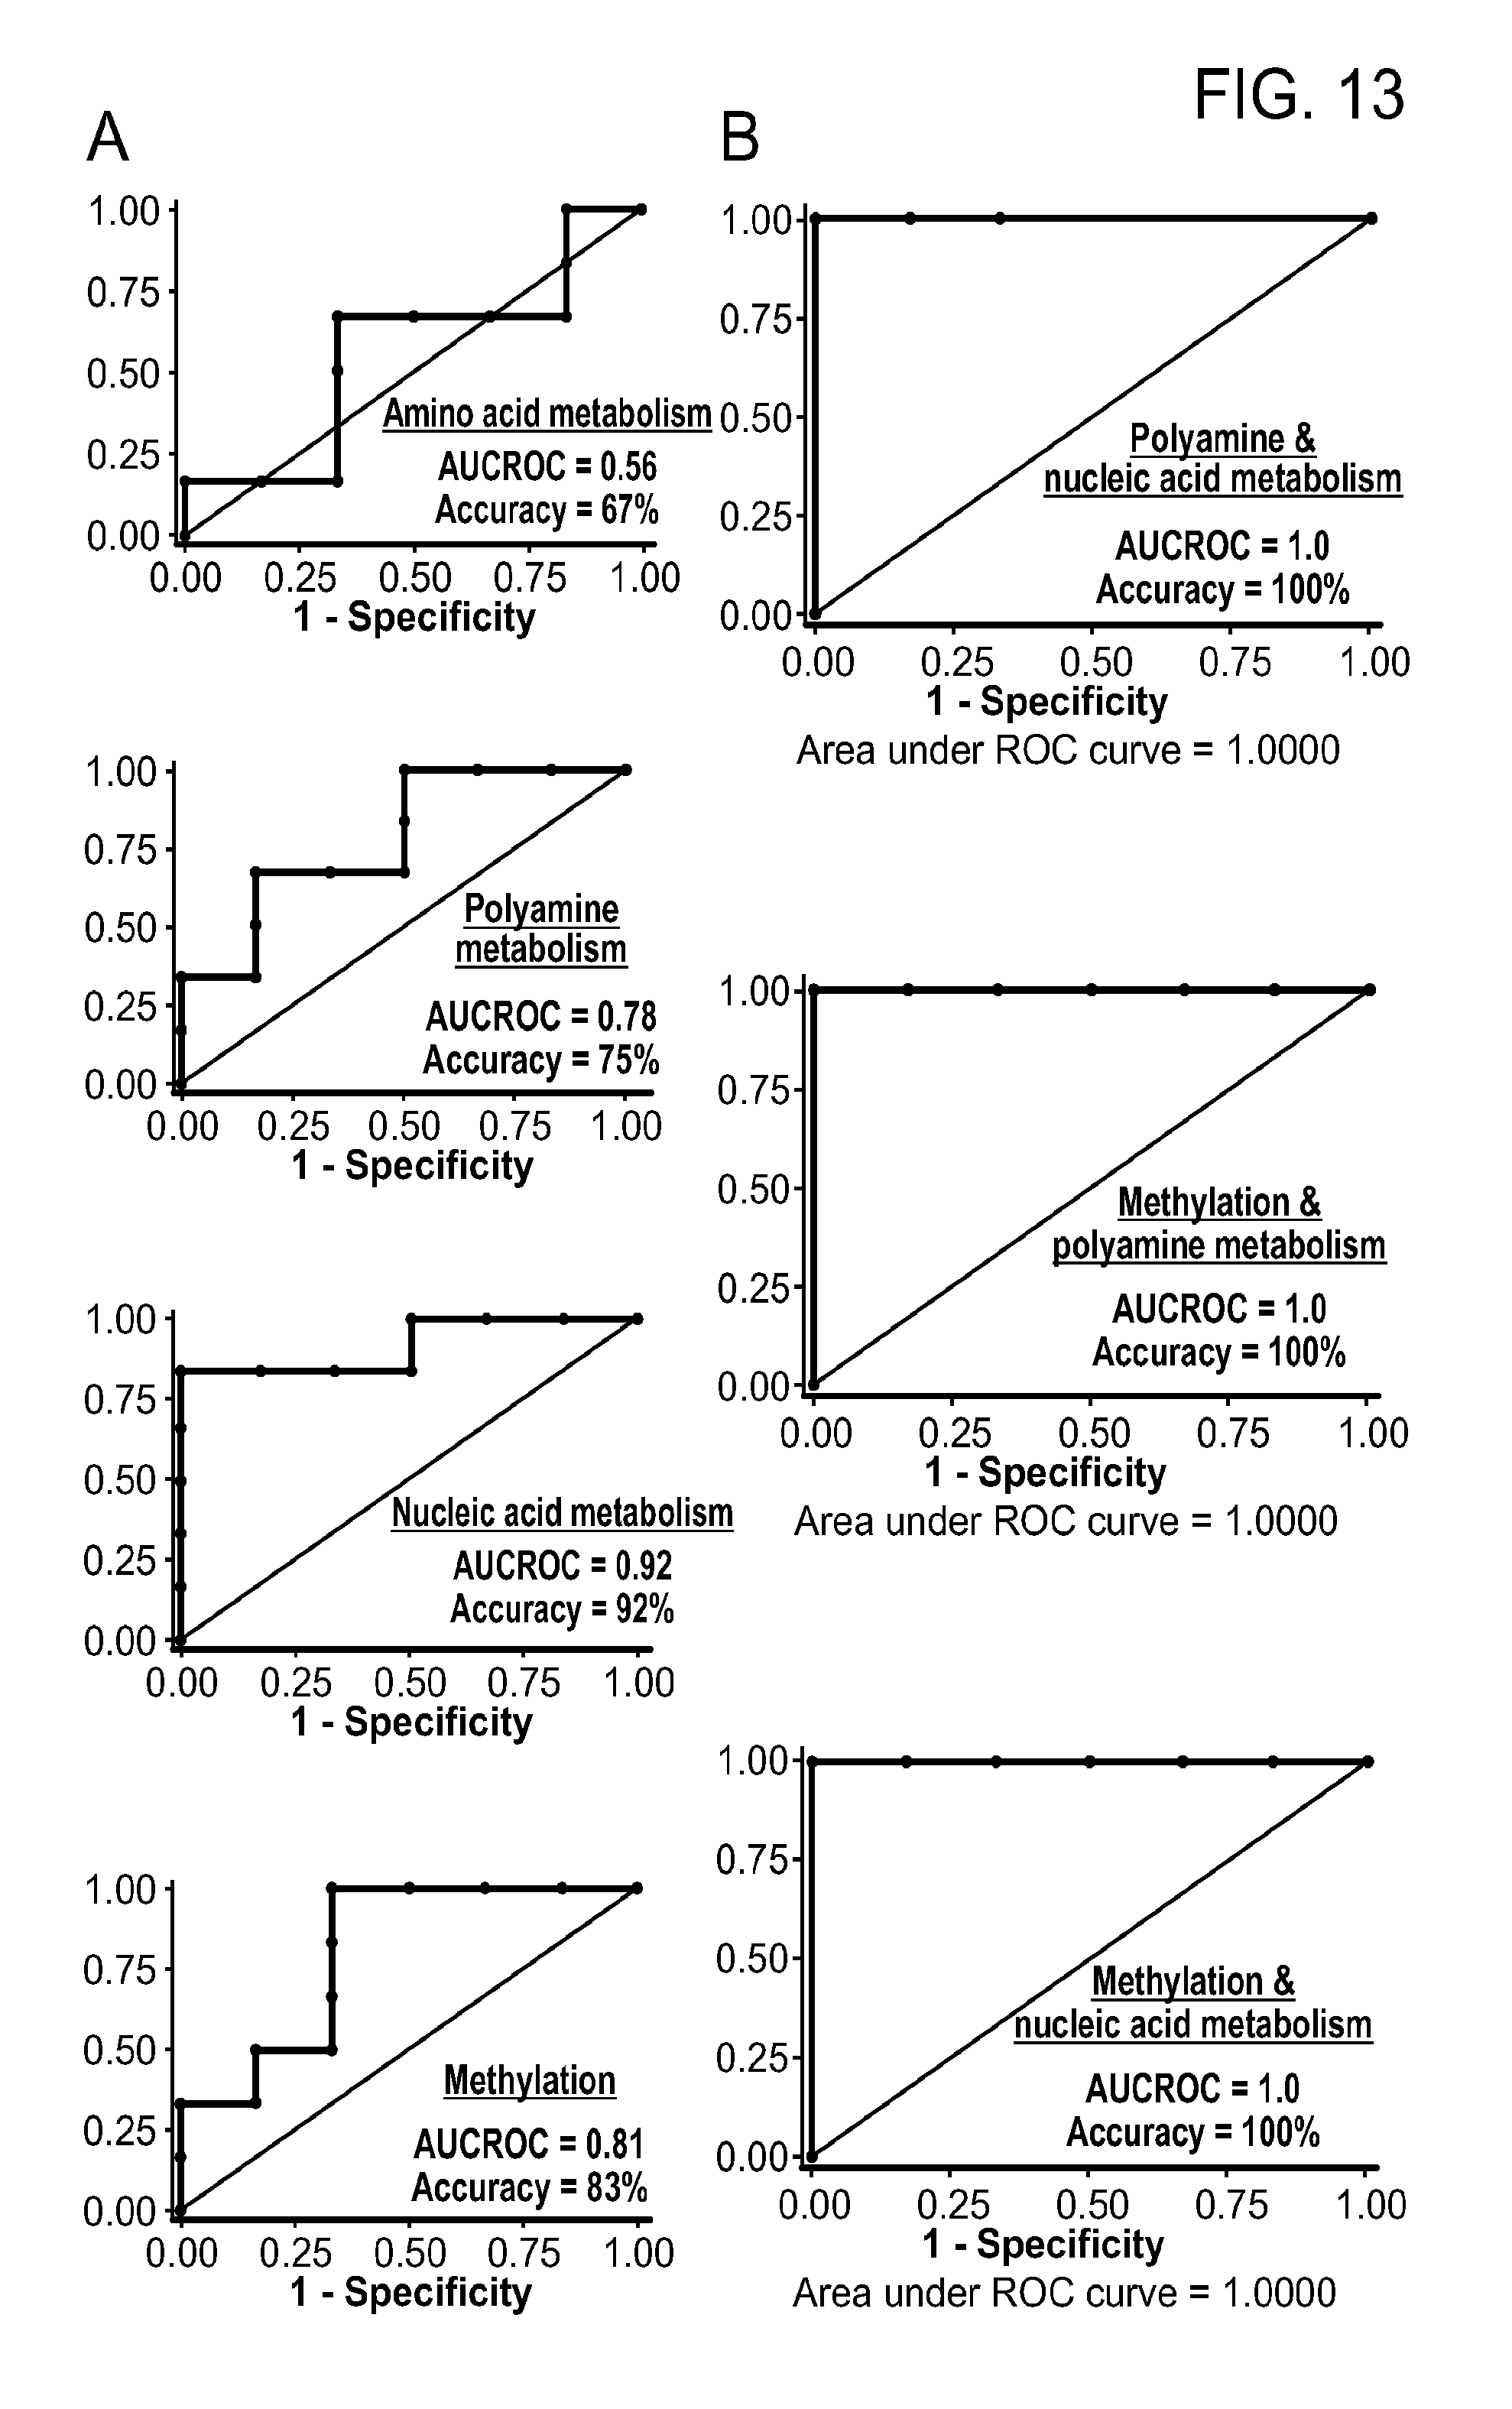
D00018

D00019

D00020
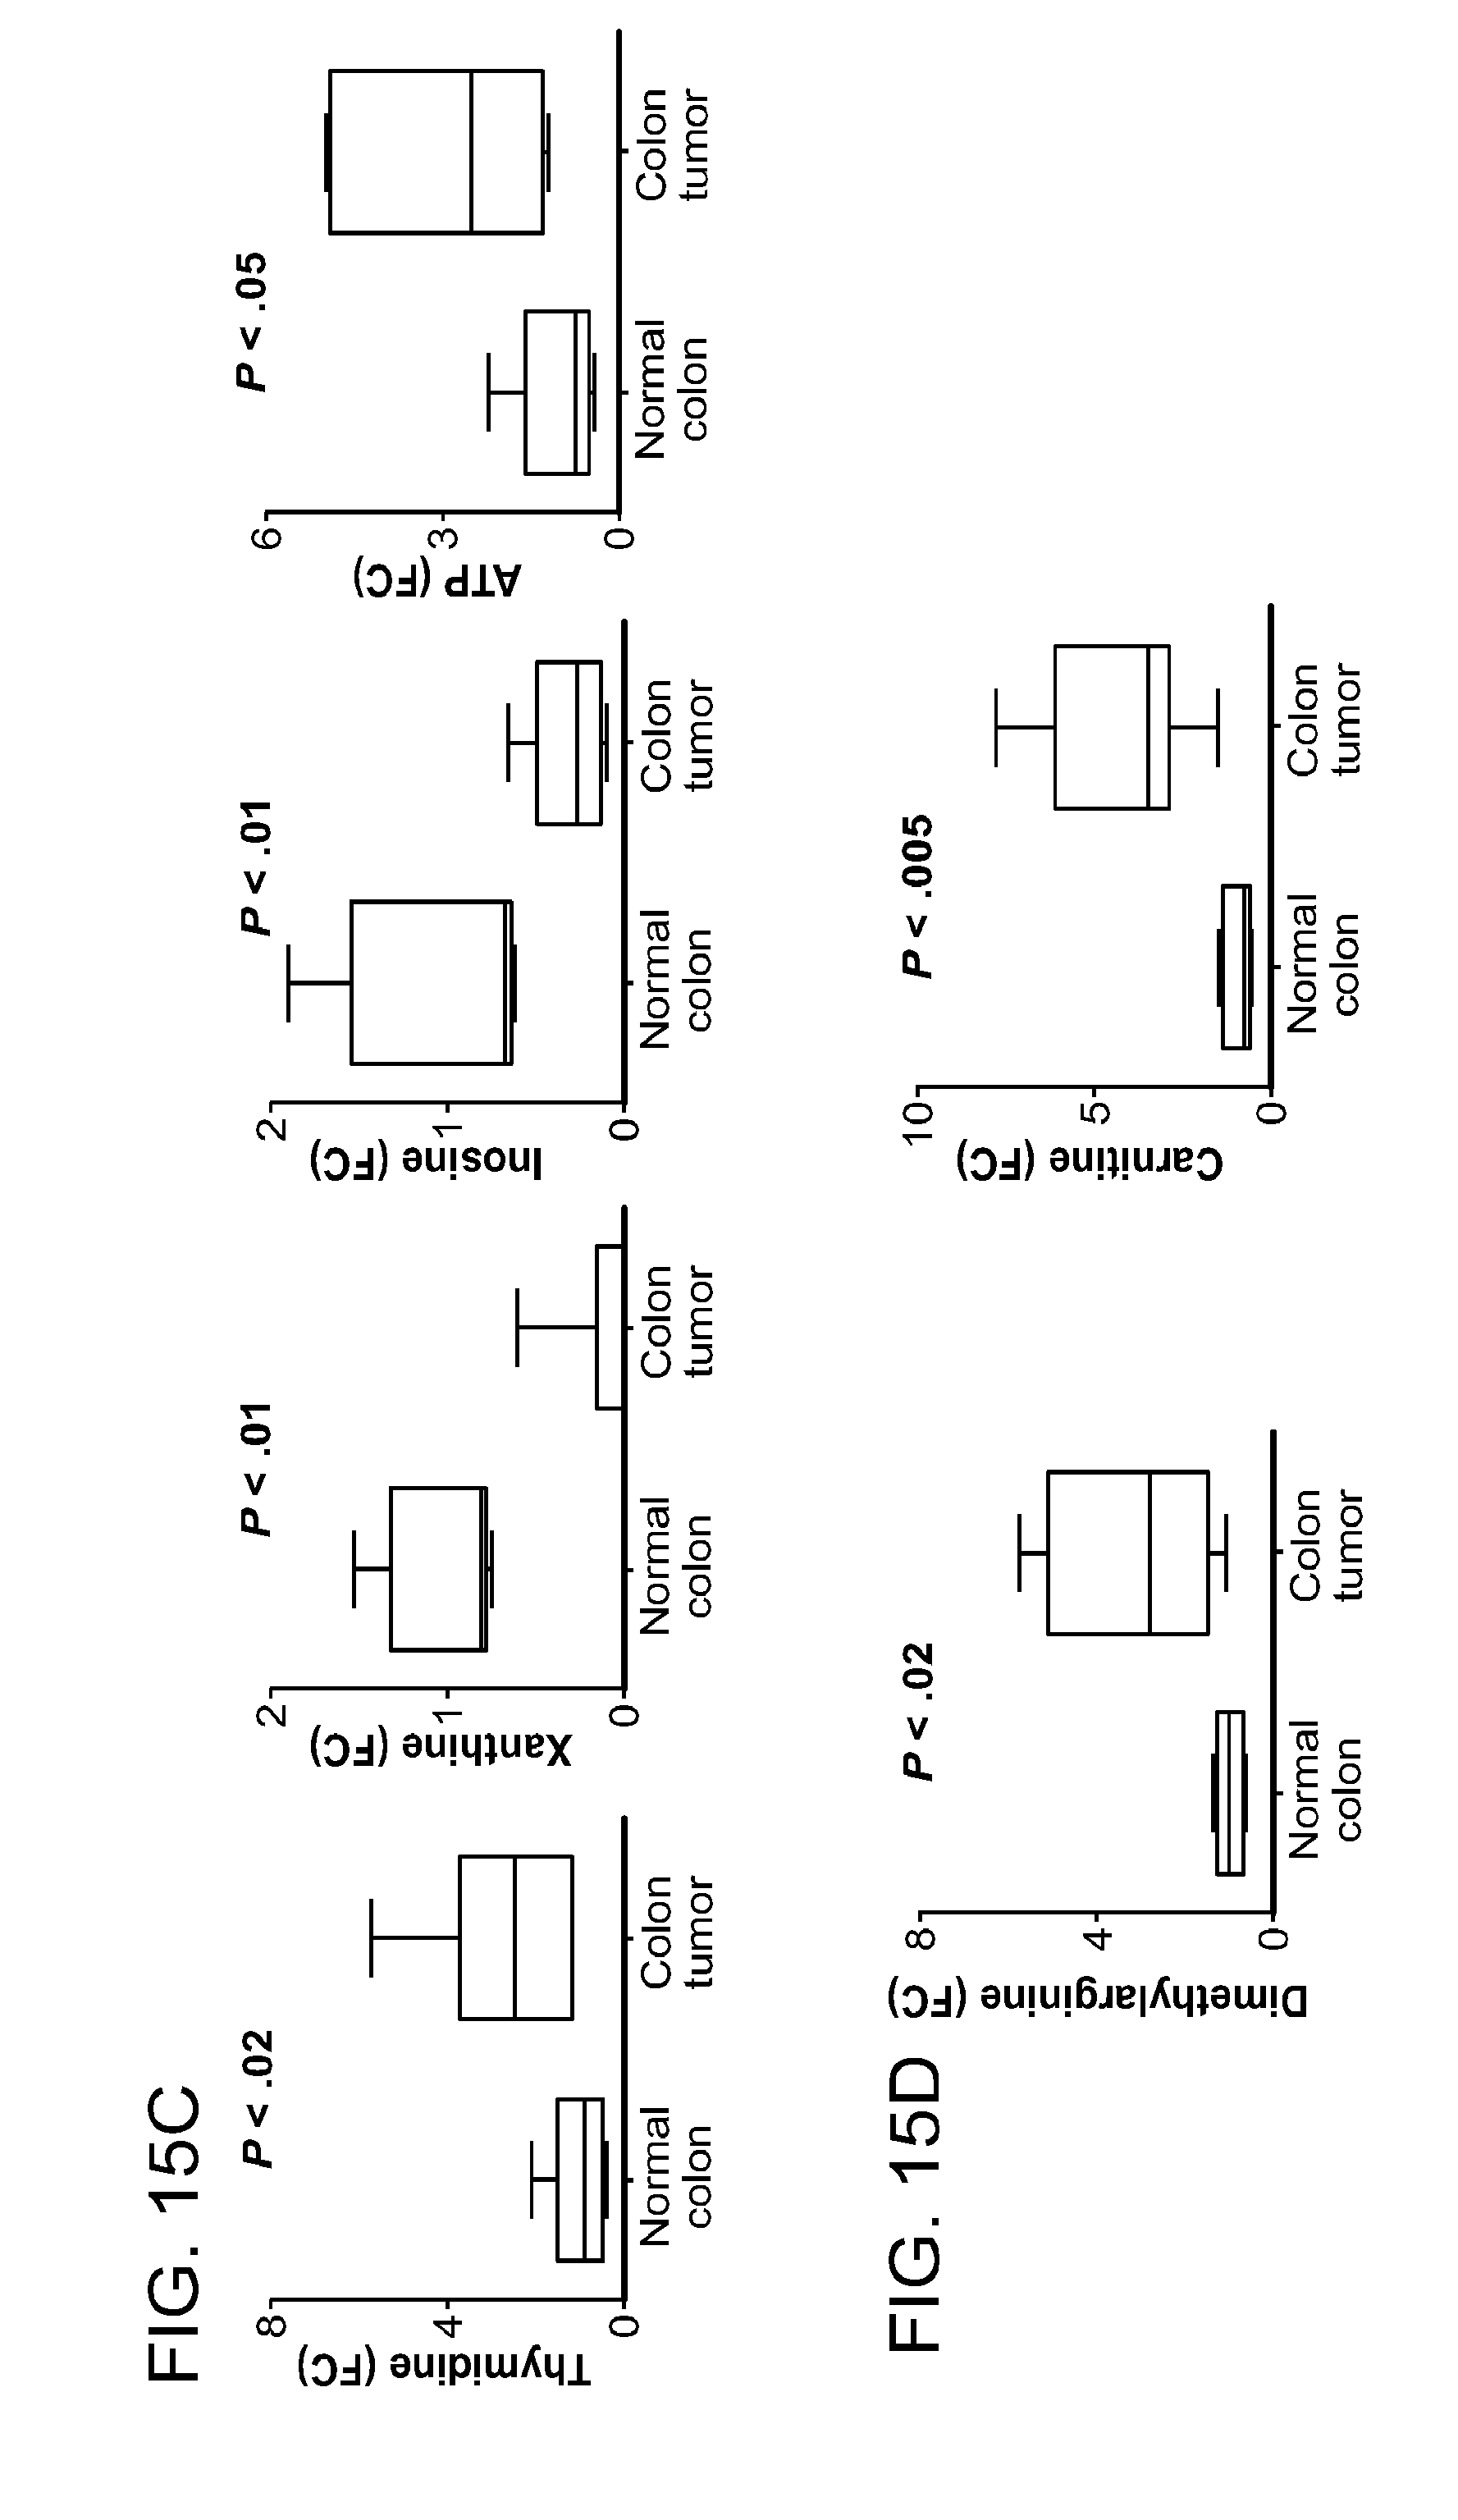
D00021

D00022

D00023

D00024

D00025
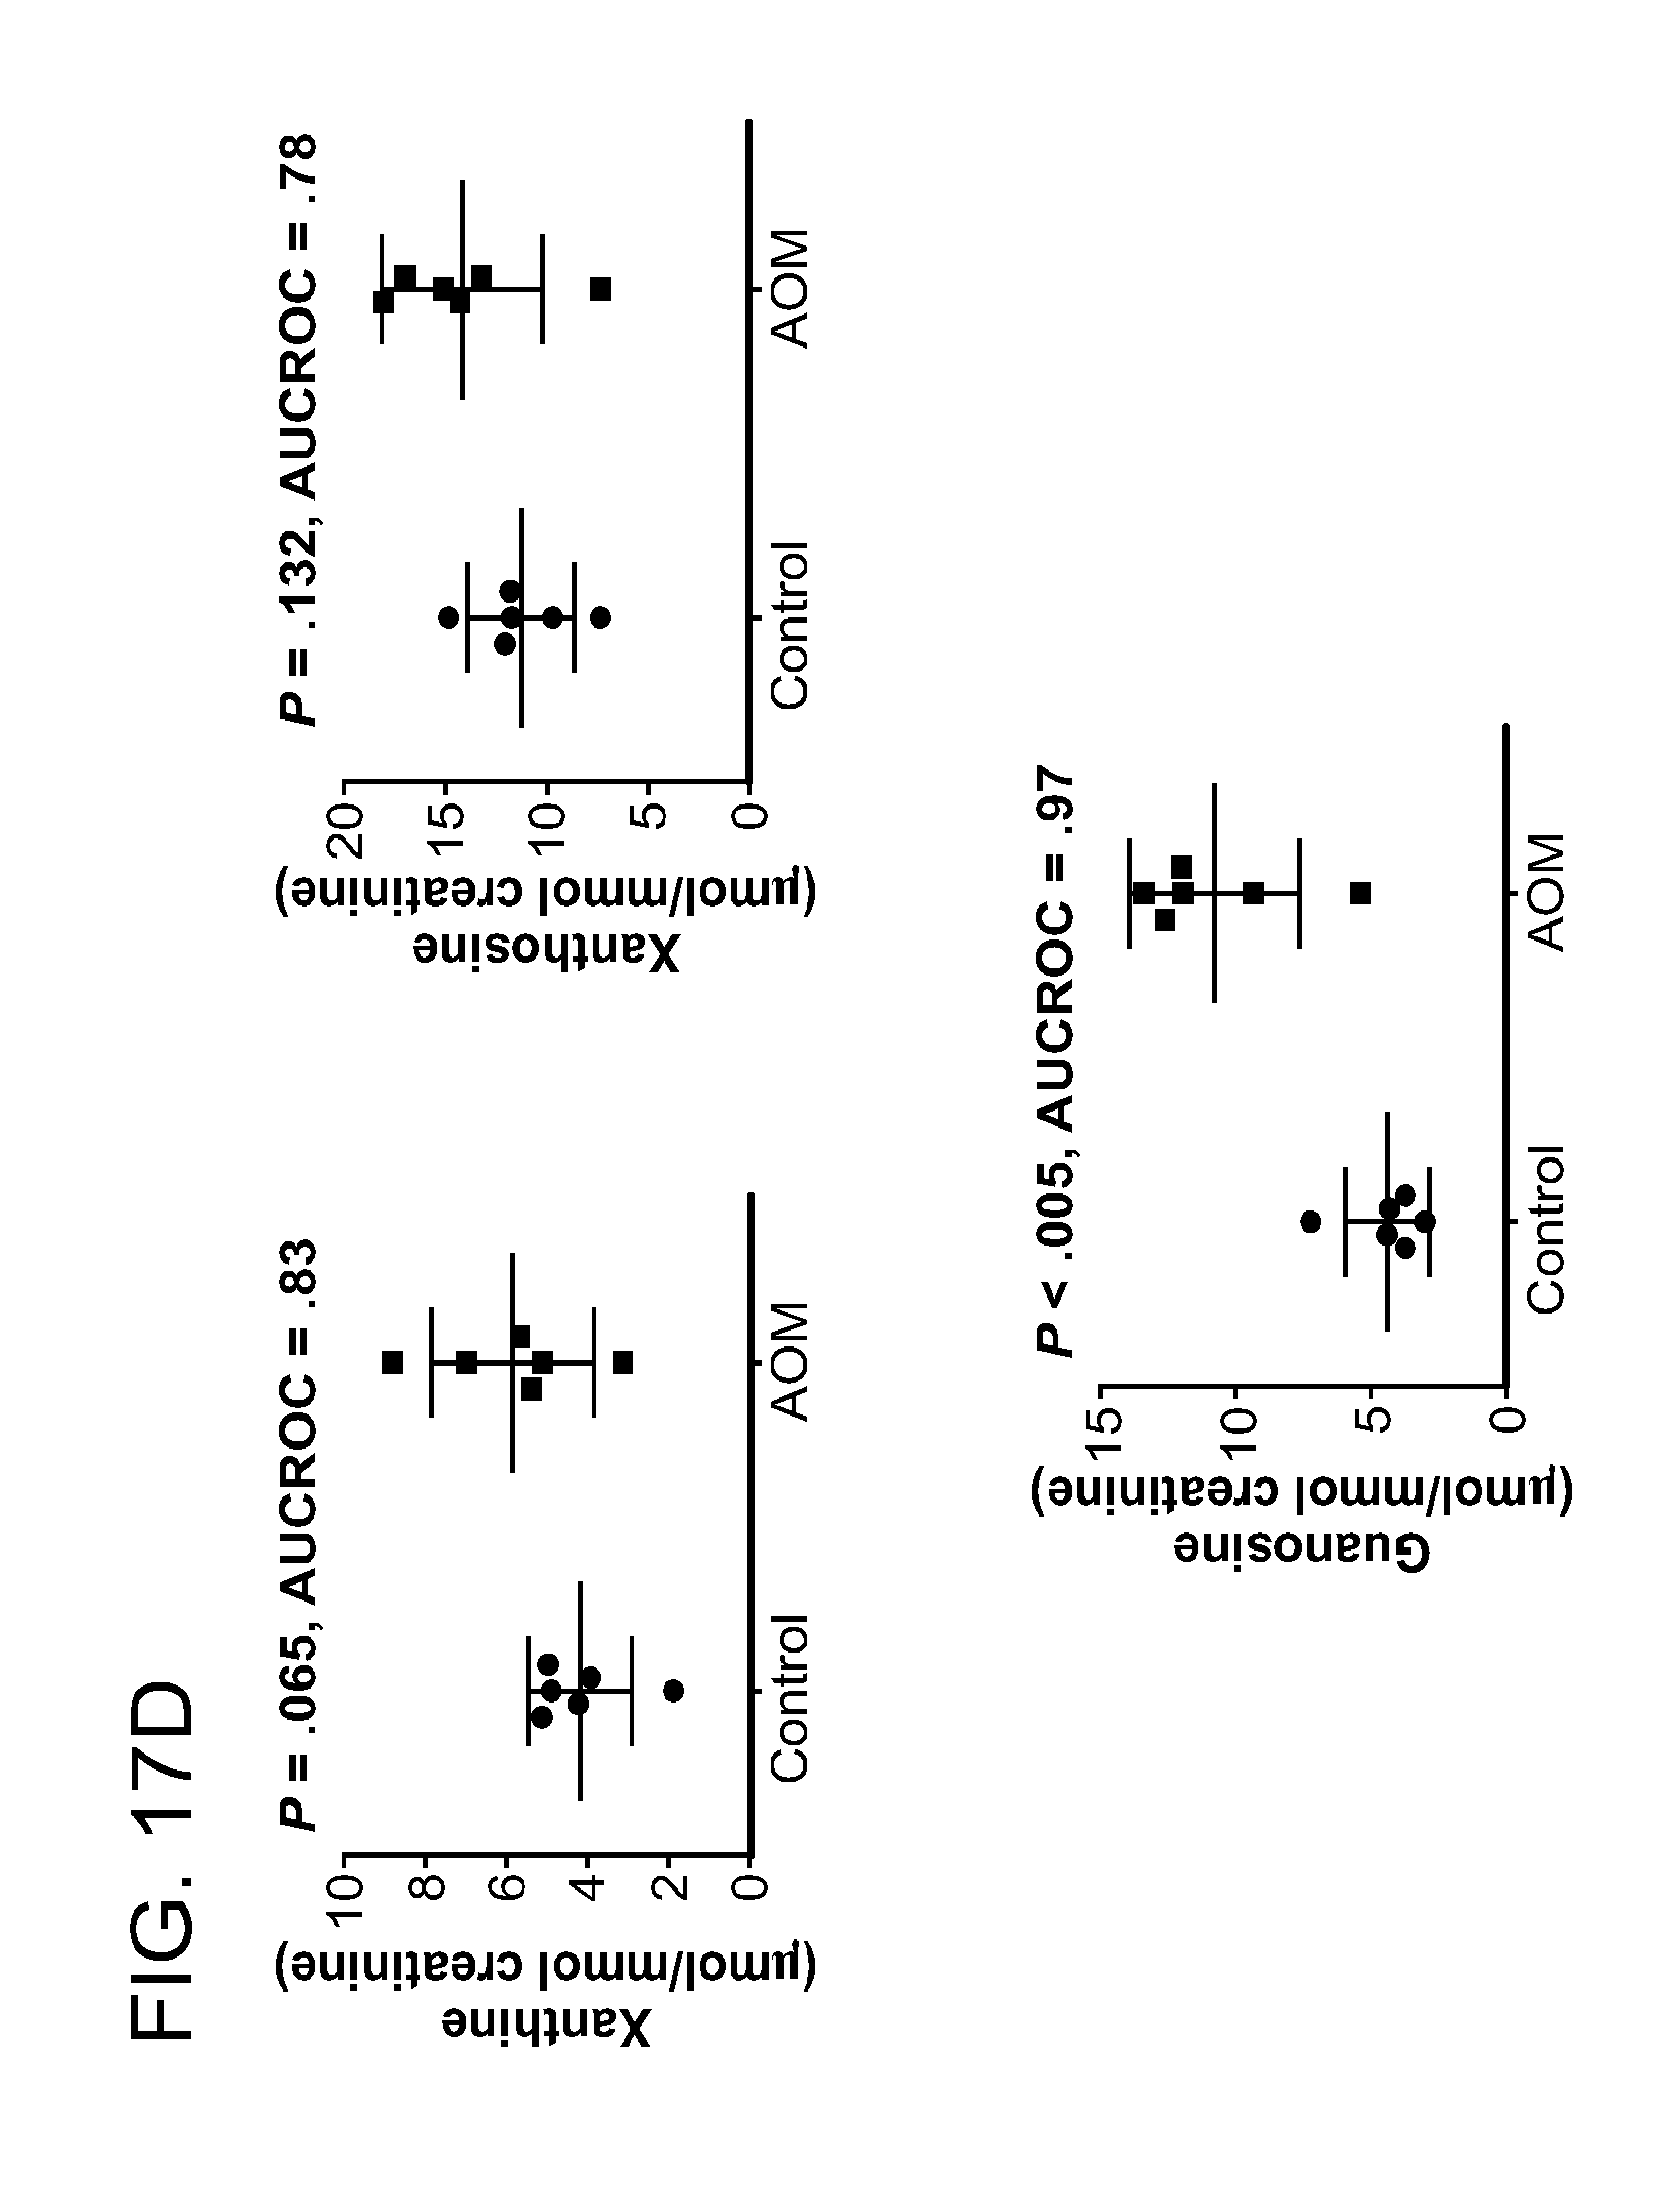
D00026

D00027

D00028
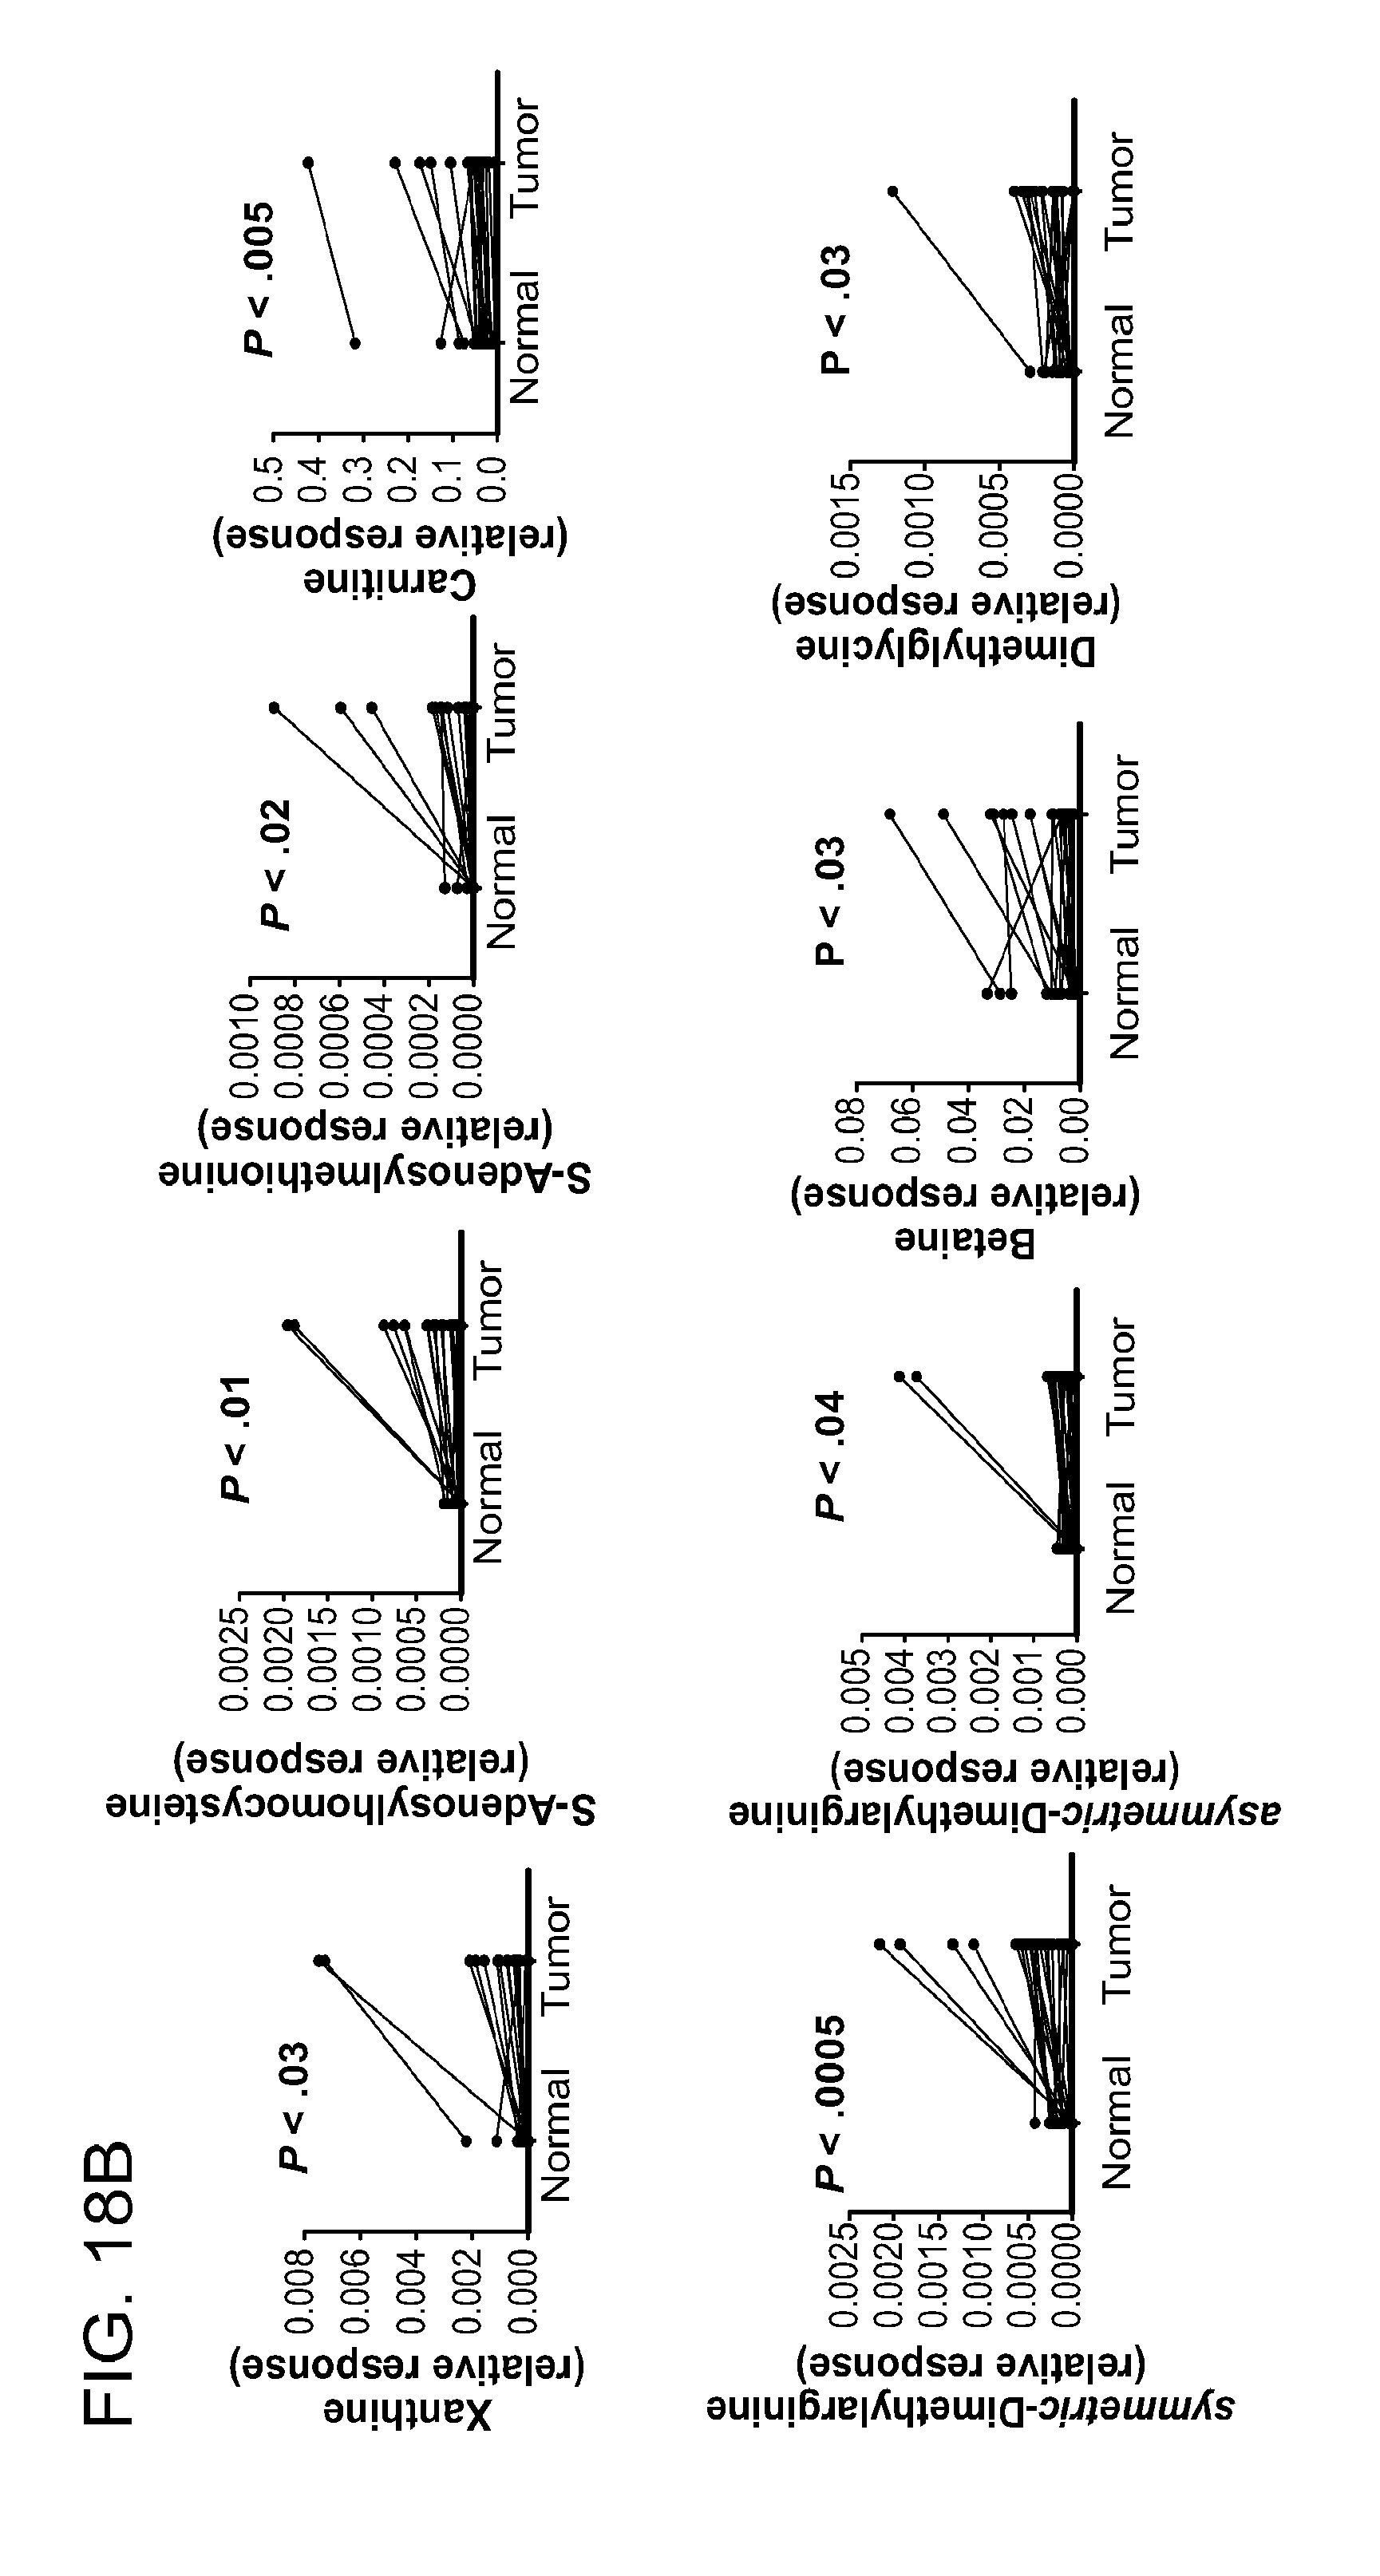
D00029
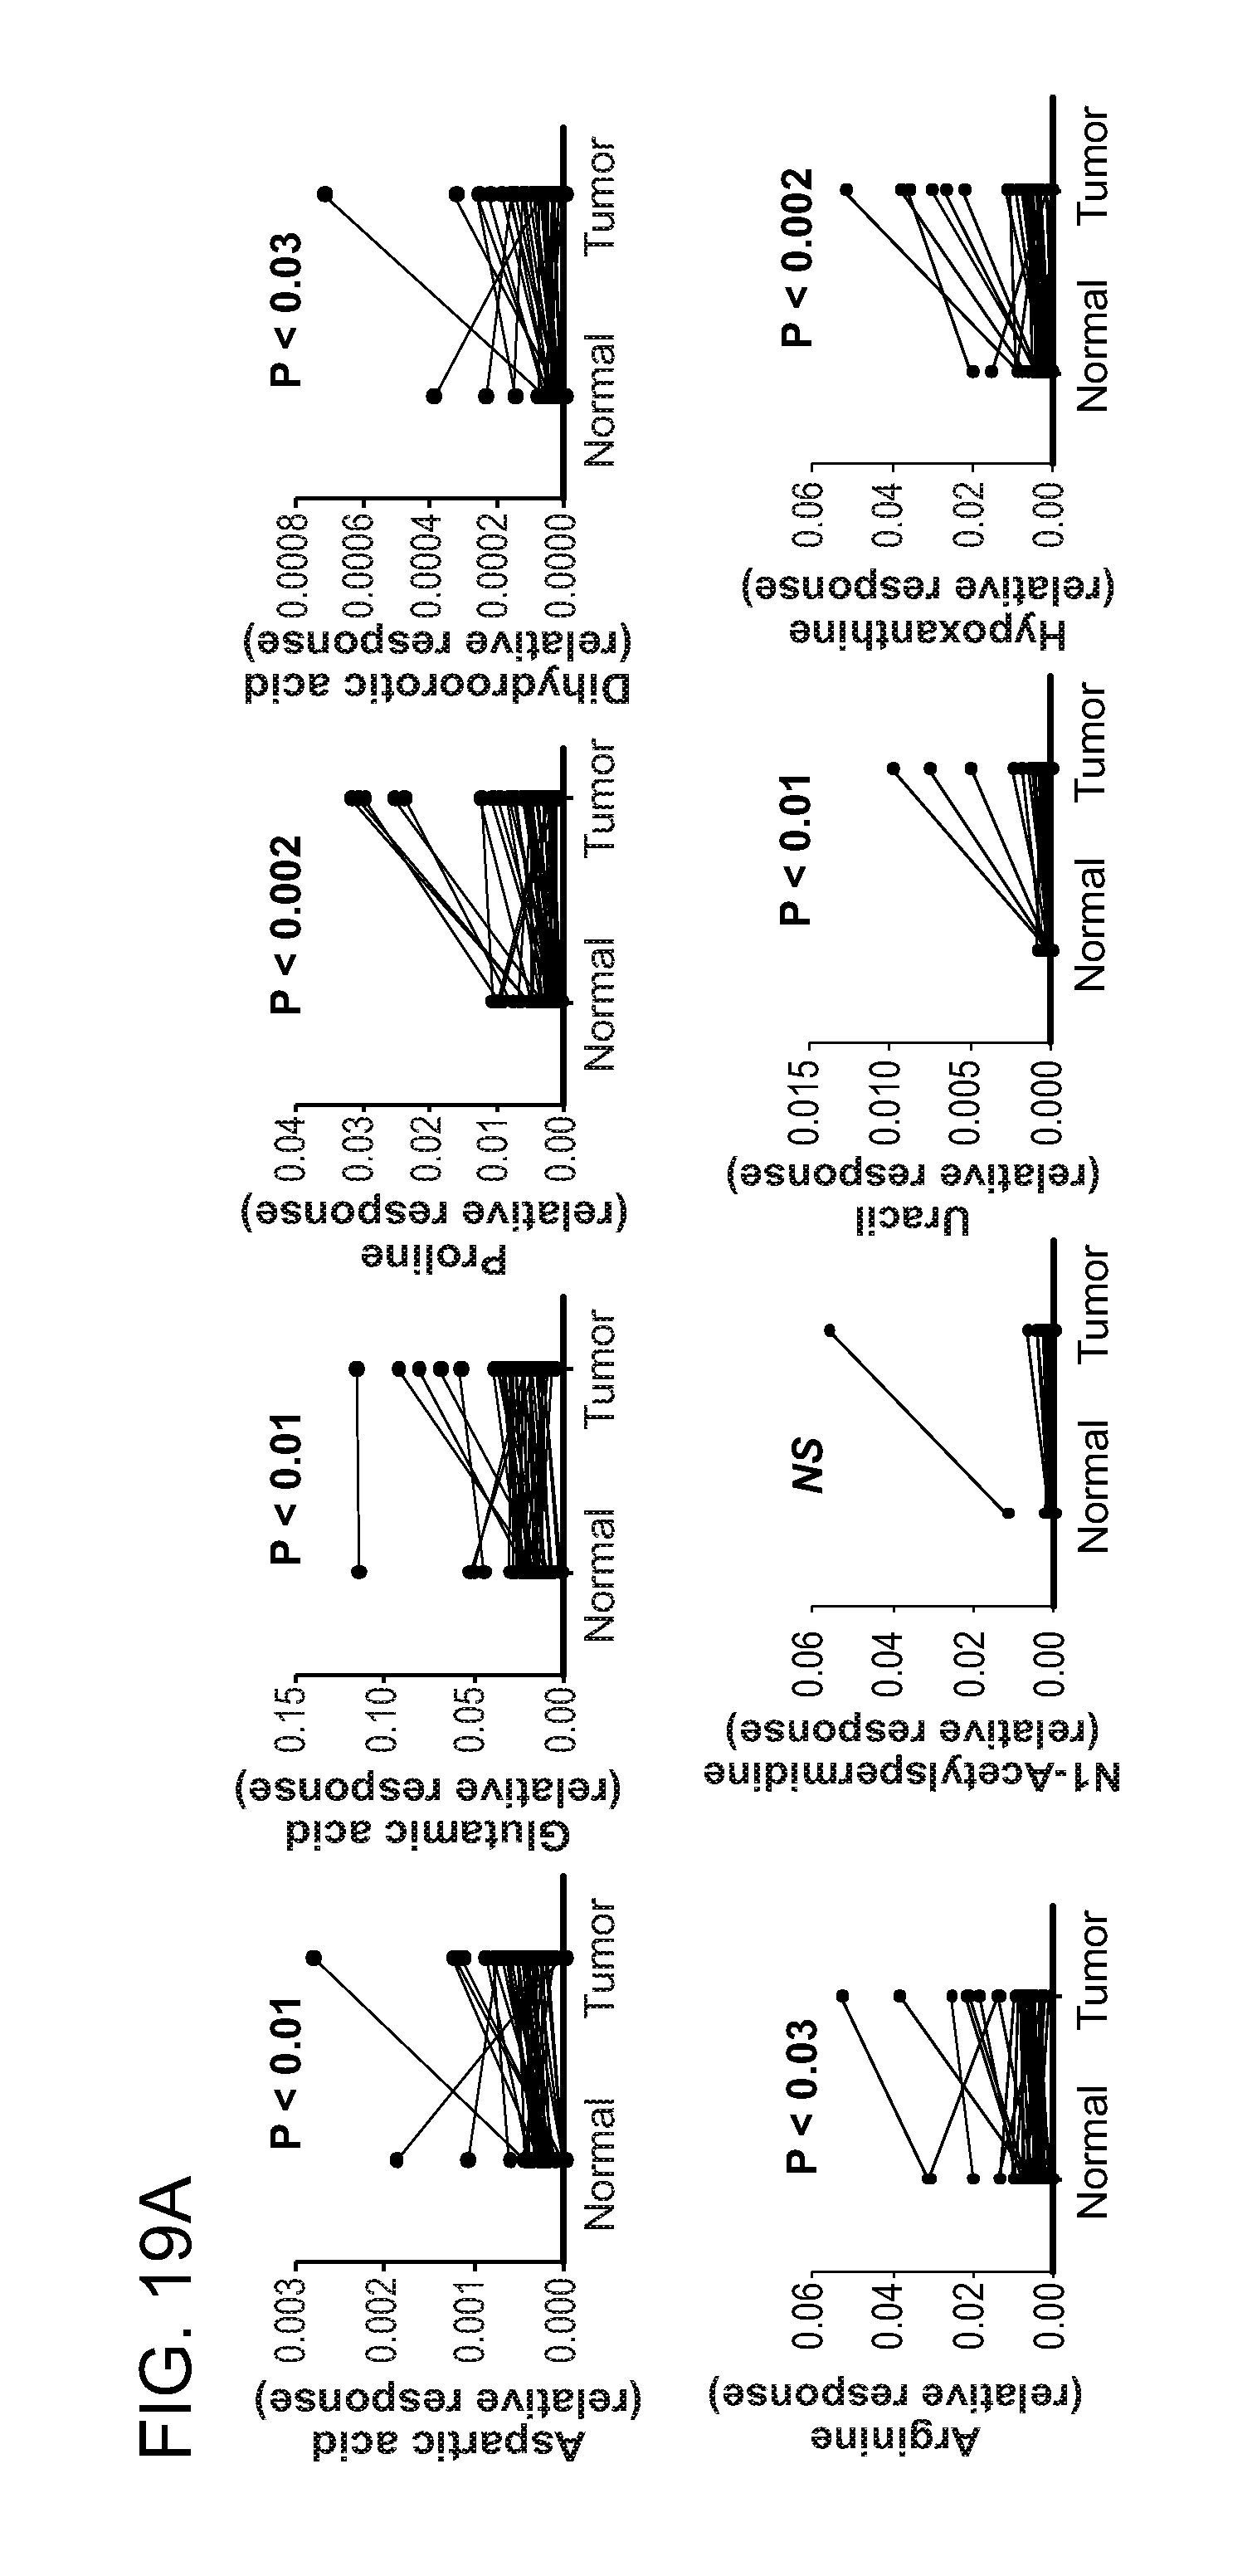
D00030
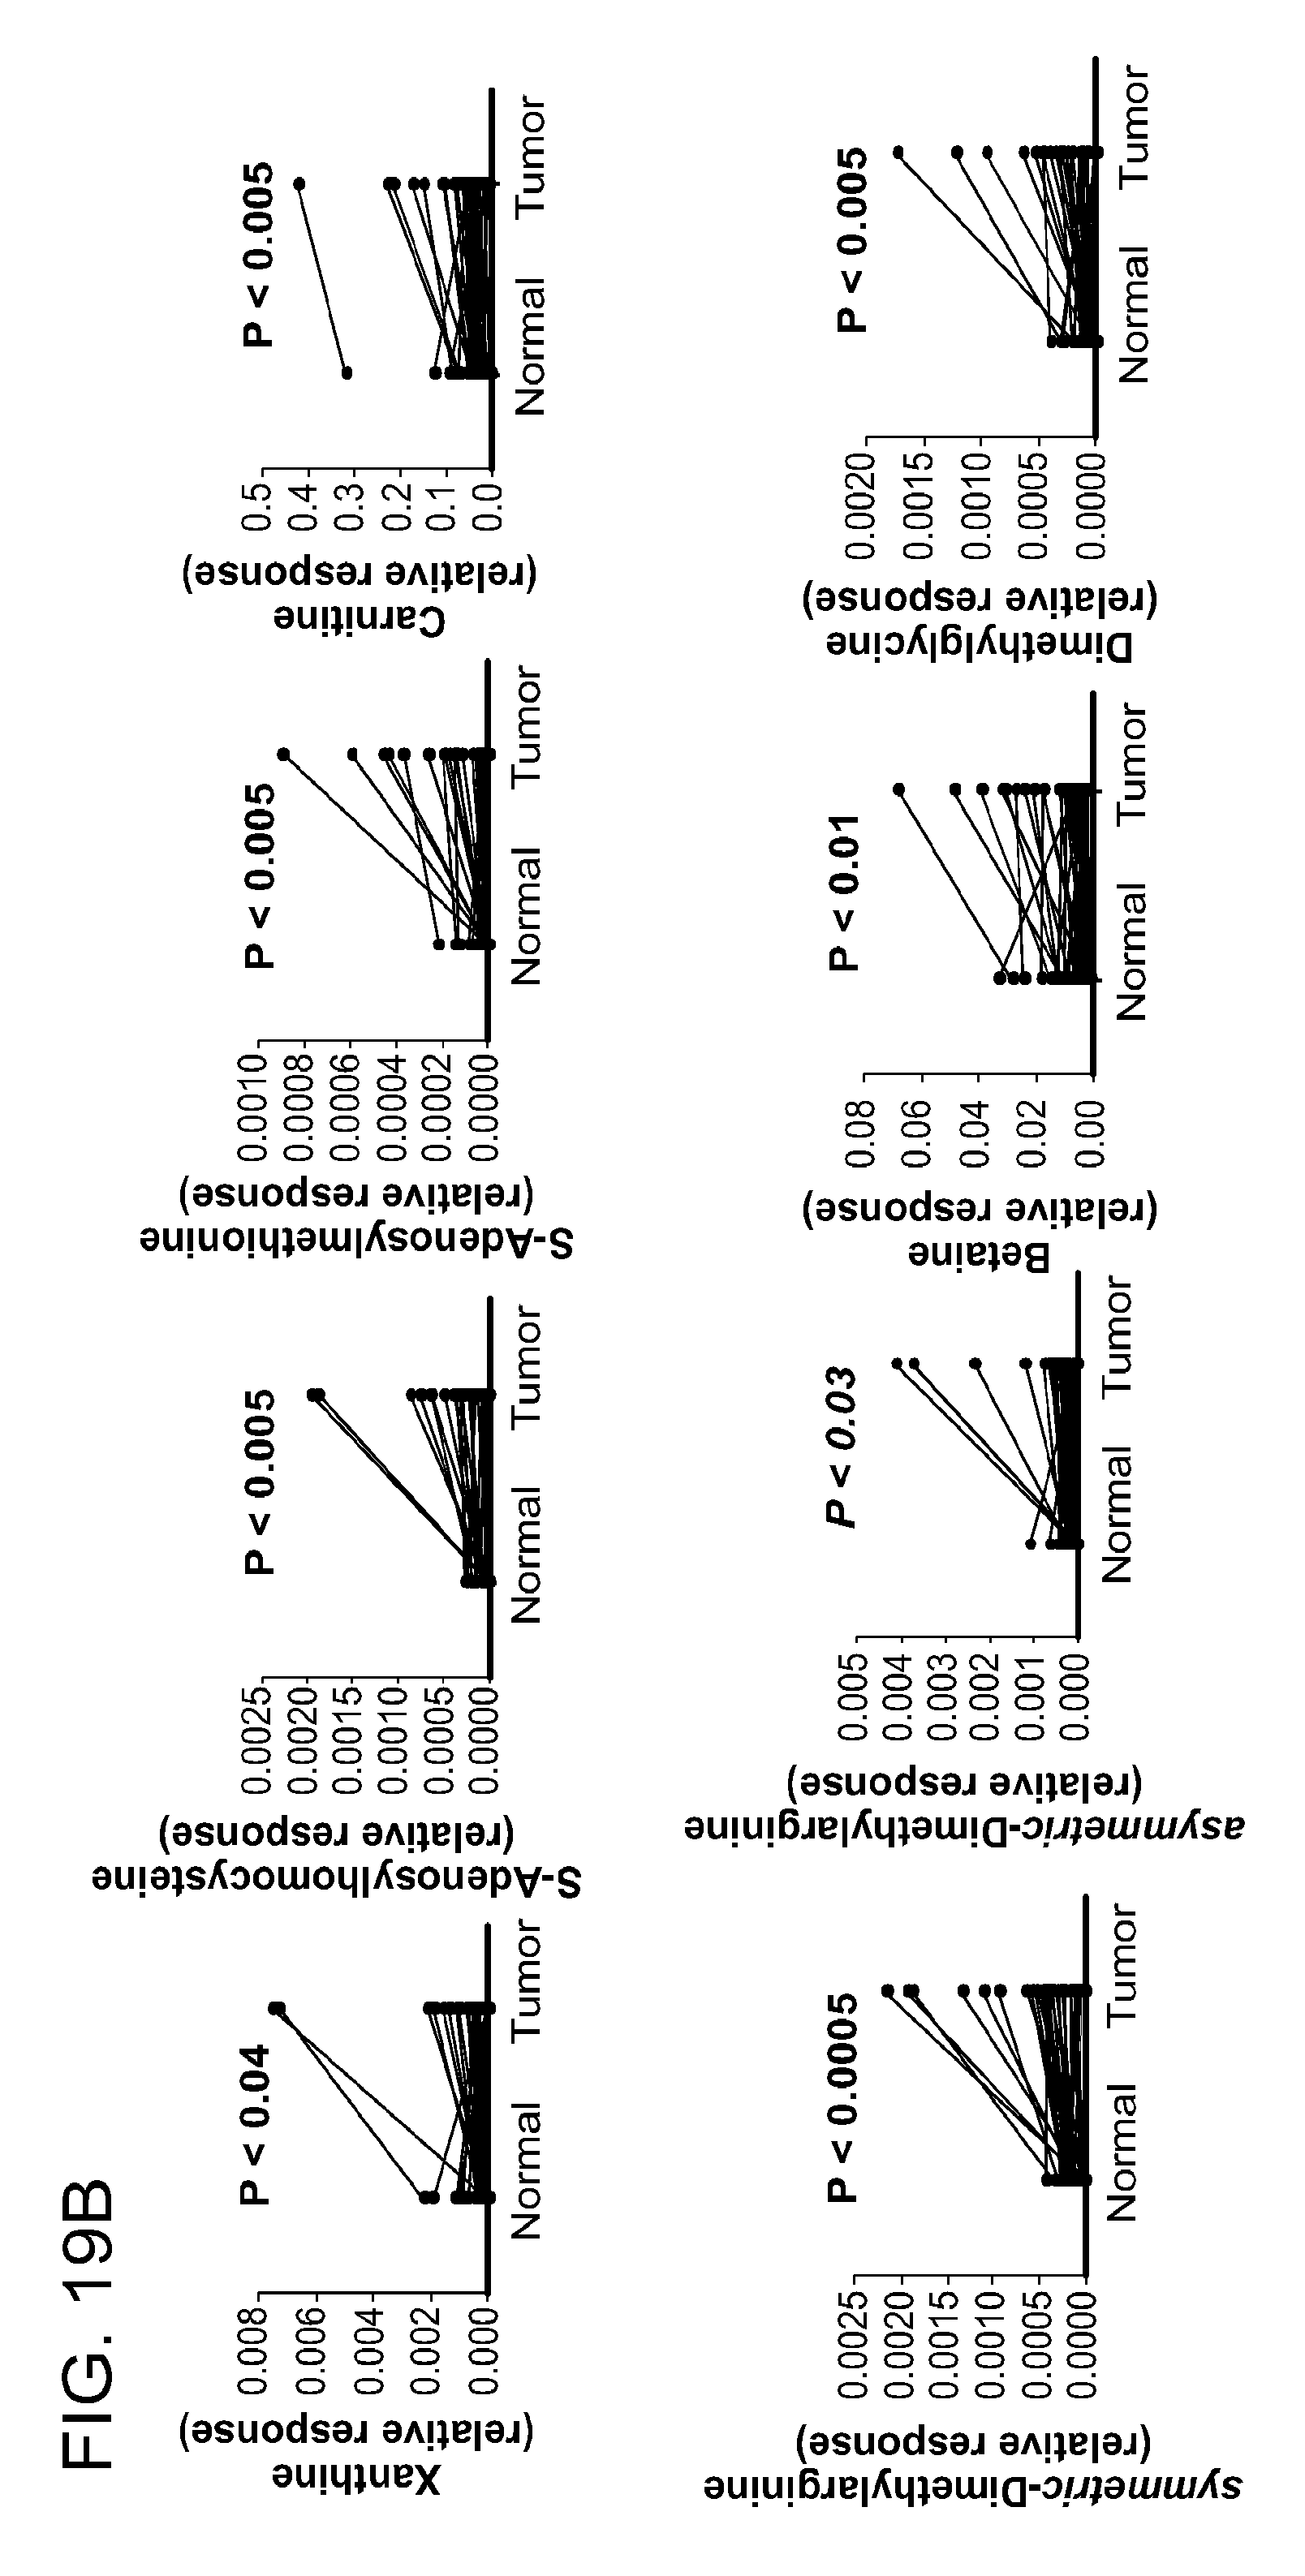
D00031
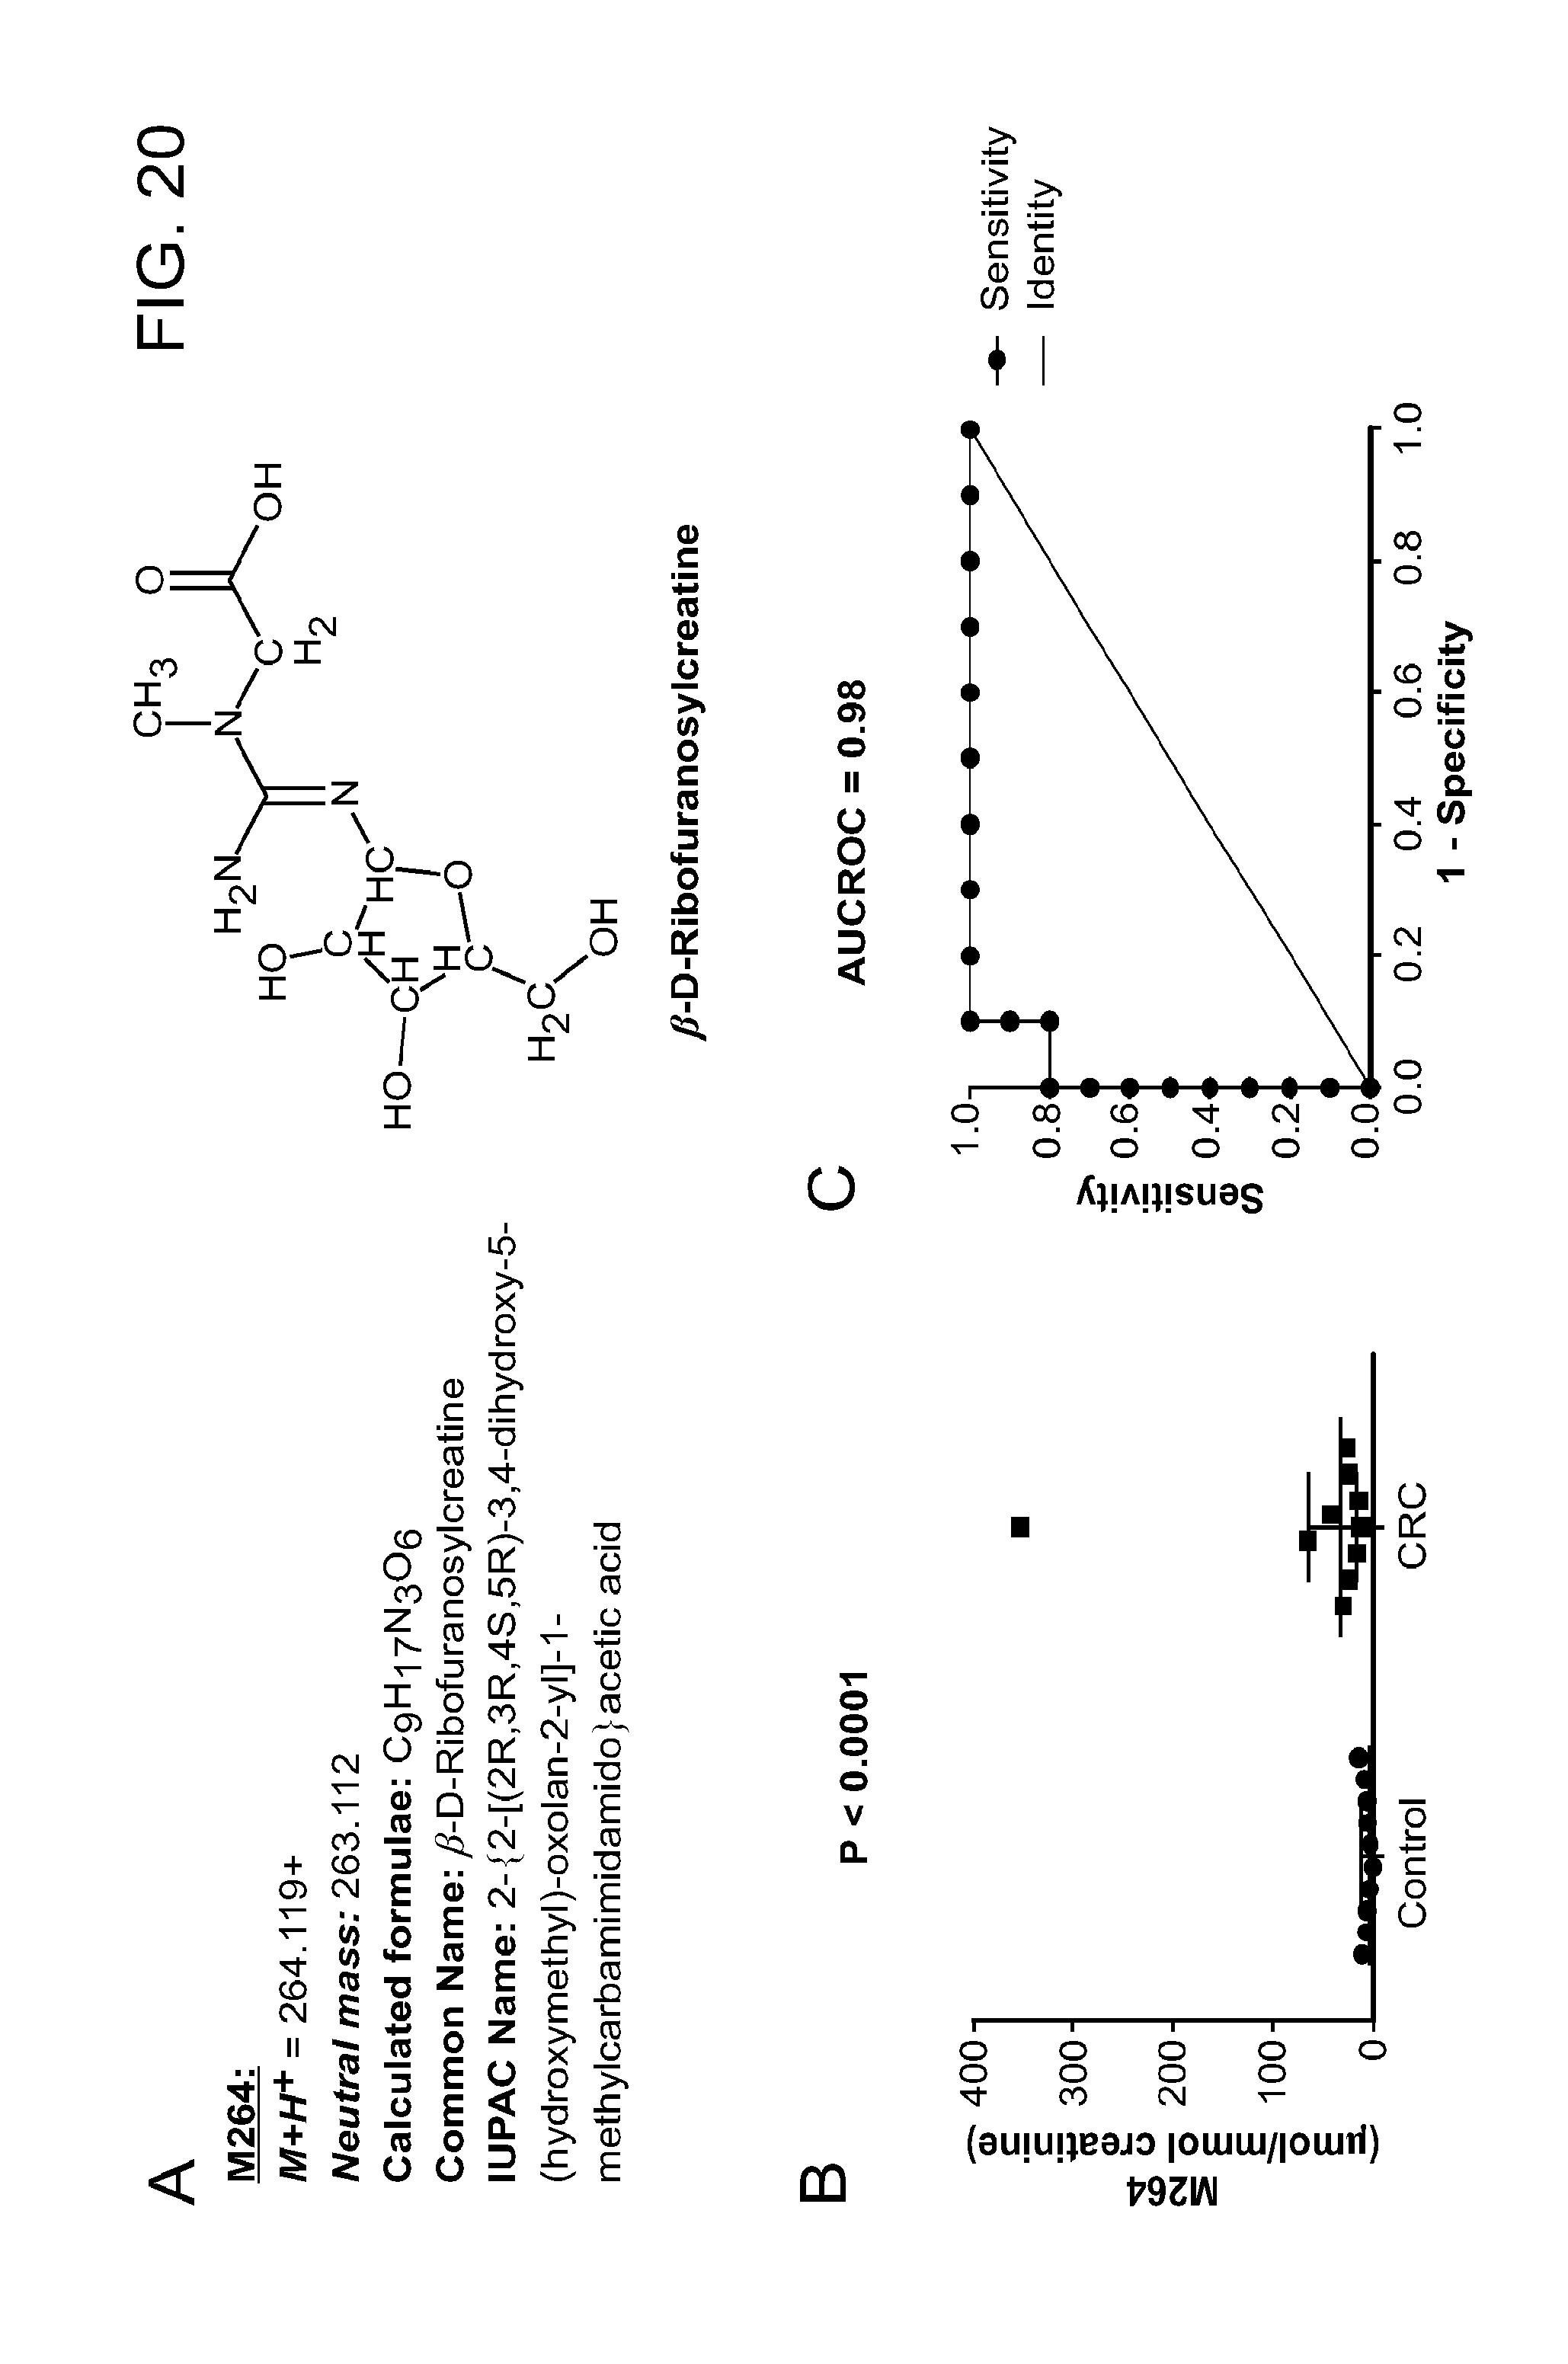
D00032
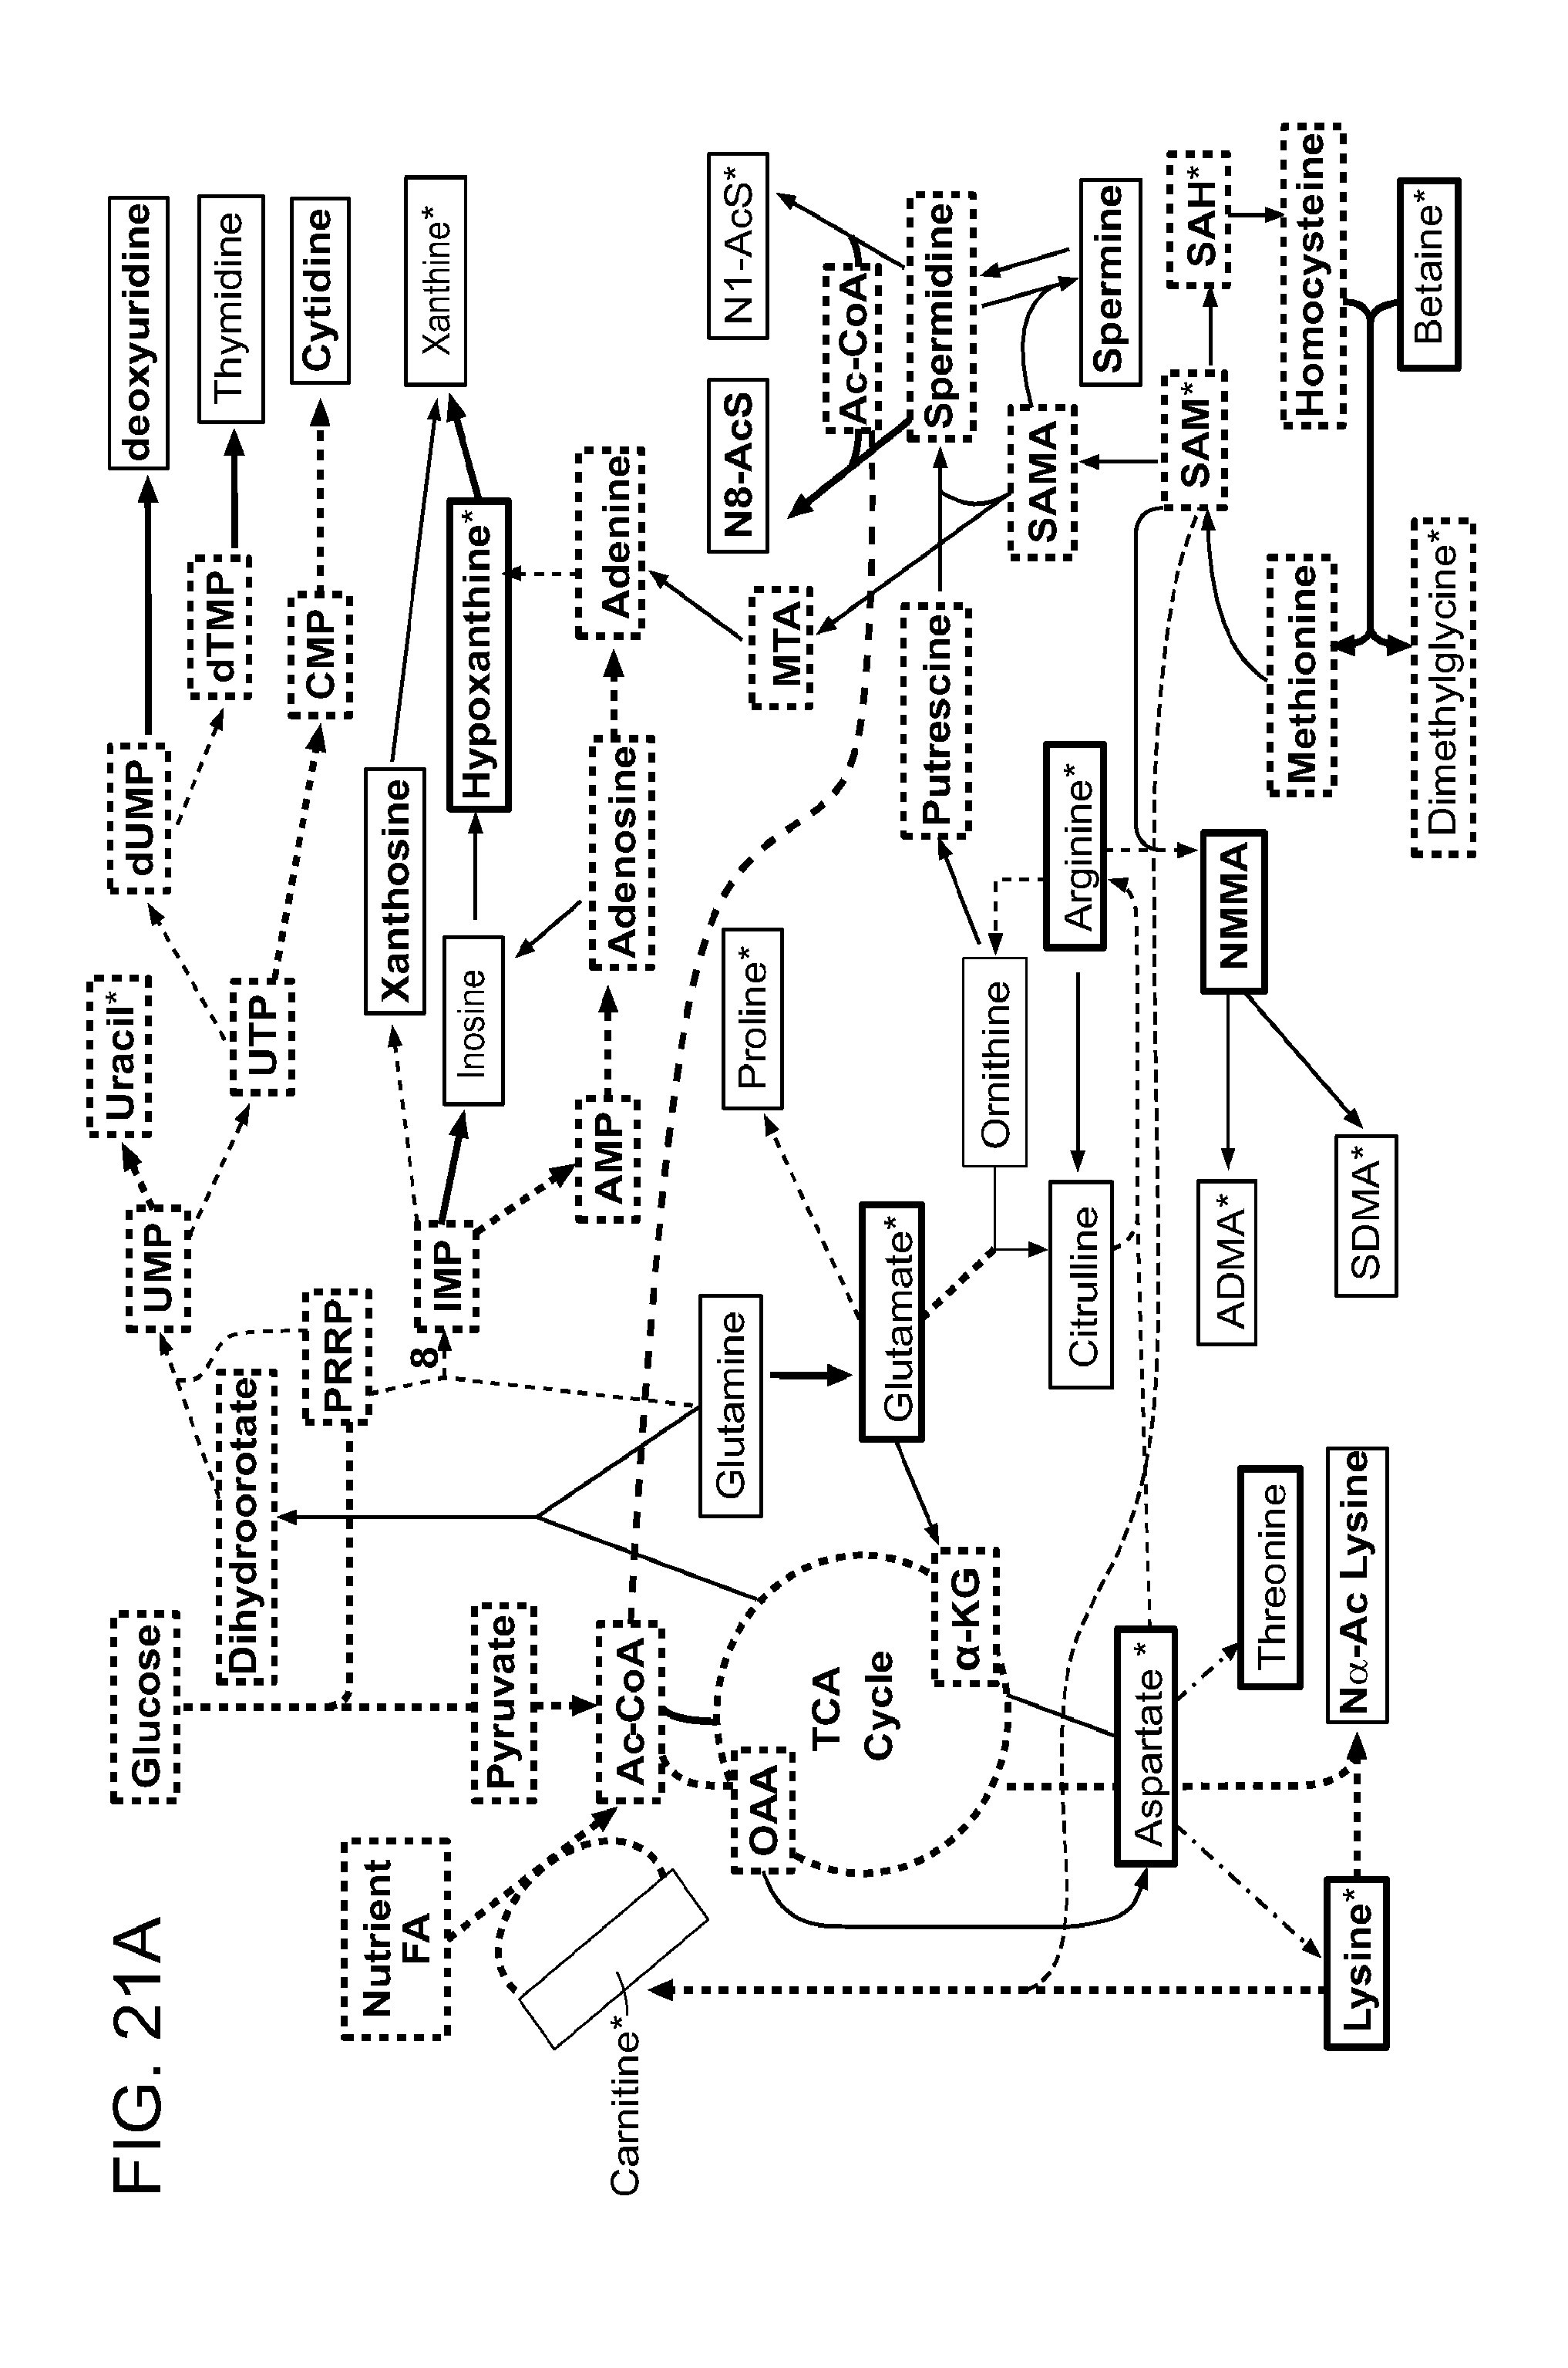
D00033
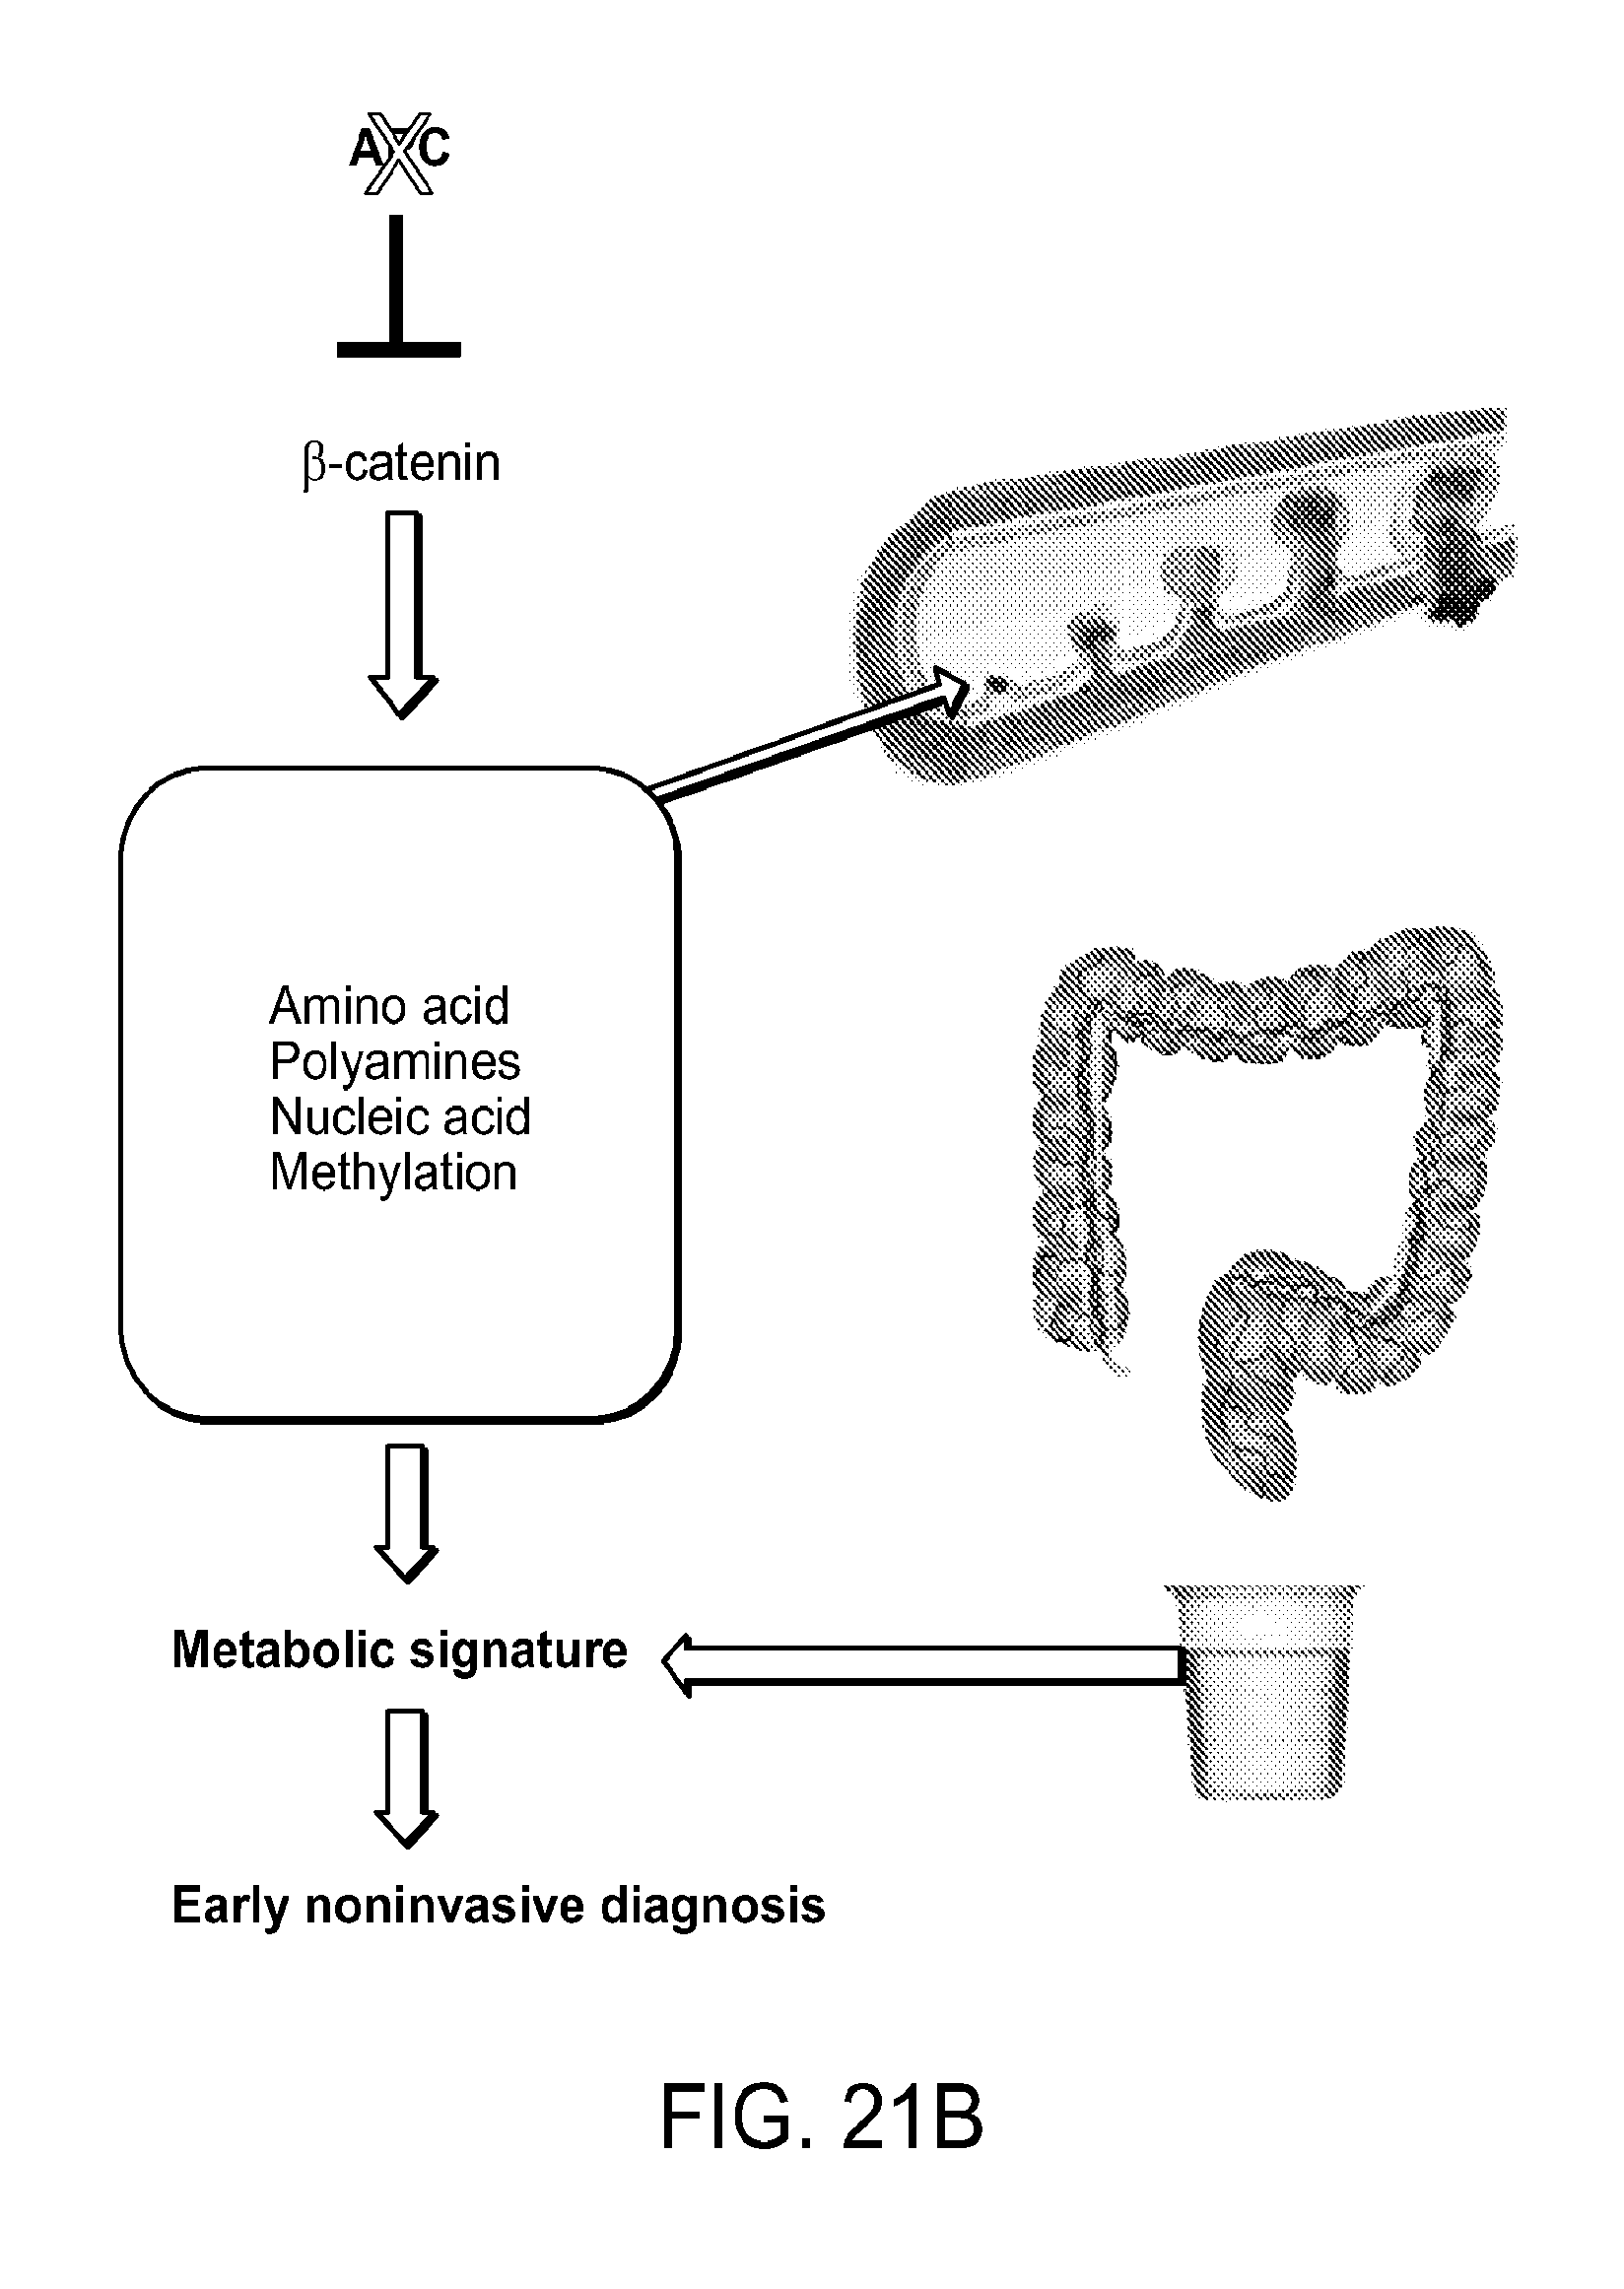
S00001
XML
uspto.report is an independent third-party trademark research tool that is not affiliated, endorsed, or sponsored by the United States Patent and Trademark Office (USPTO) or any other governmental organization. The information provided by uspto.report is based on publicly available data at the time of writing and is intended for informational purposes only.
While we strive to provide accurate and up-to-date information, we do not guarantee the accuracy, completeness, reliability, or suitability of the information displayed on this site. The use of this site is at your own risk. Any reliance you place on such information is therefore strictly at your own risk.
All official trademark data, including owner information, should be verified by visiting the official USPTO website at www.uspto.gov. This site is not intended to replace professional legal advice and should not be used as a substitute for consulting with a legal professional who is knowledgeable about trademark law.