Treating chronic myelogenous leukemia (CML)
Green , et al. October 1, 2
U.S. patent number 10,428,387 [Application Number 15/308,673] was granted by the patent office on 2019-10-01 for treating chronic myelogenous leukemia (cml). This patent grant is currently assigned to University of Massachusetts. The grantee listed for this patent is University of Massachusetts. Invention is credited to Michael R. Green, Leyuan Ma.
View All Diagrams
| United States Patent | 10,428,387 |
| Green , et al. | October 1, 2019 |
Treating chronic myelogenous leukemia (CML)
Abstract
Methods for treating chronic myeloid leukemia (CML), e.g., BCR-ABL inhibitor imatinib mesylate (IM)-resistant CML, using combination treatments, e.g., combined treatment with a BCR-ABL inhibitor, e.g., IM, and a MEK inhibitor, e.g., trametinib.
| Inventors: | Green; Michael R. (Boylston, MA), Ma; Leyuan (Holden, MA) | ||||||||||
|---|---|---|---|---|---|---|---|---|---|---|---|
| Applicant: |
|
||||||||||
| Assignee: | University of Massachusetts
(Boston, MA) |
||||||||||
| Family ID: | 54480930 | ||||||||||
| Appl. No.: | 15/308,673 | ||||||||||
| Filed: | May 14, 2015 | ||||||||||
| PCT Filed: | May 14, 2015 | ||||||||||
| PCT No.: | PCT/US2015/030908 | ||||||||||
| 371(c)(1),(2),(4) Date: | November 03, 2016 | ||||||||||
| PCT Pub. No.: | WO2015/175846 | ||||||||||
| PCT Pub. Date: | November 19, 2015 |
Prior Publication Data
| Document Identifier | Publication Date | |
|---|---|---|
| US 20170183741 A1 | Jun 29, 2017 | |
Related U.S. Patent Documents
| Application Number | Filing Date | Patent Number | Issue Date | ||
|---|---|---|---|---|---|
| 62032117 | Aug 1, 2014 | ||||
| 61994689 | May 16, 2014 | ||||
| Current U.S. Class: | 1/1 |
| Current CPC Class: | C12Q 1/6886 (20130101); A61K 31/519 (20130101); A61K 31/506 (20130101); G01N 33/57426 (20130101); C12Q 2600/106 (20130101); G01N 2800/52 (20130101); C12Q 2600/158 (20130101); G01N 2333/91205 (20130101); C12Q 2600/156 (20130101) |
| Current International Class: | A61K 31/506 (20060101); G01N 33/574 (20060101); C12Q 1/6886 (20180101); A61K 31/519 (20060101) |
References Cited [Referenced By]
U.S. Patent Documents
| 7307071 | December 2007 | Lyons |
| 2009/0215792 | August 2009 | Bhalla |
| 2011/0189192 | August 2011 | Cooper |
| 2013/0296318 | November 2013 | Huang |
Other References
|
Kim et al. 2011, Blood Cancer Journal, 1(8), pp. 1-10. cited by examiner . Jing et al. 2012 Mol. Cancer Ther., 11(3), pp. 720-729. cited by examiner . Aceves-Luquero et al., "ERK2, but Not ERK1, Mediates Acquired and "De novo" Resistance to Imatinib Mesylate: Implication for CML Therapy," PLoS One, Jul. 2009, 4: e6124. cited by applicant . Aderem, "The MARCKS brothers: a family of protein kinase C substrates," Cell, Nov. 1992,71: 713-716. cited by applicant . An et al., "BCR-ABL tyrosine kinase inhibitors in the treatment of Philadelphia chromosome positive chronic myeloid leukemia: a review," Leuk Res, 2010, 34: 1255-1268. cited by applicant . Andersson et al.,"K562--a human erythroleukemic cell line," International Journal of Cancer, Feb. 1979, 23: 143-147. cited by applicant . Baccarani et al., "Evolving concepts in the management of chronic myeloid leukemia: recommendations from an expert panel on behalf of the European Leukemia Net," Blood, Sep. 2006, 108(6):1809-20. cited by applicant . Bagger et al., "HemaExplorer: a database of mRNA expression profiles in normal and malignant haematopoiesis," Nucleic Acids Res, Jan. 2013, 41: D1034-1039. cited by applicant . Benjamini and Hochberg, "Controlling the false discovery rate: a practical and powerful approach to multiple testing," J. R. Statist. Soc. B, 1995, 57: 289-300. cited by applicant . Bhatia et al., "Persistence of malignant hematopoietic progenitors in chronic myelogenous leukemia patients in complete cytogenetic remission following imatinib mesylate treatment," Blood, Jun. 2003, 101: 4701-4707. cited by applicant . Bixby and Talpaz, "Mechanisms of resistance to tyrosine kinase inhibitors in chronic myeloid leukemia and recent therapeutic strategies to overcome resistance," Hematology, 2009, 461-476. cited by applicant . Bruennert et al., "Early in vivo changes of the transcriptome in Philadelphia chromosome-positive CD34+ cells from patients with chronic myelogenous leukaemia following imatinib therapy," Leukemia, 2009, 23: 983-985. cited by applicant . Cai et al., "Role of diacylglycerol-regulated protein kinase C isotypes in growth factor activation of the Raf-I protein kinase," Molecular and Cellular Biology, Feb. 1997, 17:732-741. cited by applicant . Carroll and May, "Protein kinase C-mediated serine phosphorylation directly activates Raf-1 in mmine hematopoietic cells," The Journal of Biological Chemistry, Jan. 1994, 269: 1249-1256. cited by applicant . Carvalho and Irizarry, "A framework for oligonucleotide microarray preprocessing," Bioinformatics, 2010, 26: 2363-2367. cited by applicant . Chakrabarti et al., "Elf5 inhibits the epithelial-mesenchymal transition in mammary gland development and breast cancer metastasis by transcriptionally repressing Snail2/Slug," Nature Cell Biology, Nov. 2012, 14: 1212-1222. cited by applicant . Chang et al., "High levels of the BCR/ABL oncoprotein are required for the MAPK-hnRNP-E2 dependent suppression of C/EBPalpha-driven myeloid differentiation," Blood, Aug. 2007, 110: 994-1003. cited by applicant . Chomel et al., "Leukemic stem cell persistence in chronic myeloid leukemia patients with sustained undetectable molecular residual disease," Blood, Sep. 2011, 118: 3657-3660. cited by applicant . Chu et al., "BCR/ABL kinase inhibition by imatinib mesylate enhances MAP kinase activity in chronic myelogenous leukemia CD34+ cells," Blood, Apr. 2004, 103: 3167-174. cited by applicant . Colicelli, "ABL tyrosine kinases: evolution of function, regulation, and specificity," Sci Signal, Sep. 2010, 3: re6. cited by applicant . Corbin et al., "Human chronic myeloid leukemia stem cells are insensitive to imatinib despite inhibition of BCR-ABL activity," J Clin Invest, Jan. 2011, 121: 396-409. cited by applicant . Cortes et al., "Staging of Chronic Myeloid Leukemia in the Imatinib Era," Cancer, Mar. 2006, 106 (6): 1306-1315. cited by applicant . Daley et al., "Induction of chronic myelogenous leukemia in mice by the P210bcr/abl gene of the Philadelphia chromosome," Science, Feb. 1990, 247: 824-830. cited by applicant . Dean et al., "Tumour stem cells and drug resistance," Nature Reviews, Apr. 2005, 5: 275-284. cited by applicant . Deininger et al., "The molecular biology of chronic myeloid leukemia," Blood, Nov. 2000, 96: 3343-3356. cited by applicant . Donato et al., "BCR-ABL independence and LYN kinase overexpression in chronic myelogenous leukemia cells selected for resistance to STI571," Blood, 2003, 101: 690-698. cited by applicant . Donato et al., "Imatinib mesylate resistance through BCR-ABL independence in chronic myelogenous leukemia," Cancer Research, Jan. 2004, 64: 672-677. cited by applicant . Escamilla-Hernandez et al., "Genome-wide search identifies Ccnd2 as a direct transcriptional target of Elf5 in mouse mammary gland," BMC Molecular Biology, 2010, 11: 68. cited by applicant . Faderl et al., "The biology of chronic myeloid leukemia," N Engl J Med, Jul. 1999, 341: 164-172. cited by applicant . Fang et al., "MEK/ERK Dependent Activation of STAT1 Mediates Dasatinib-Induced Differentiation of Acute Myeloid Leukemia," PLOS One, Jun. 2013, 8: e66915. cited by applicant . Gazin et al., "An elaborate pathway required for Ras-mediated epigenetic silencing" Nature, Oct. 2007, 449: 1073-1077. cited by applicant . Gerber et al., "Genome-wide comparison of the transcriptomes of highly enriched normal and chronic myeloid leukemia stem and progenitor cell populations," Oncotarget, 2013, 4: 715-728. cited by applicant . Goldman and Melo, "Chronic Myeloid Leukemia--Advances in Biology and New Approaches to Treatment," N Engl J Med, Oct. 2003, 349 (15): 1451-64. cited by applicant . Graham et al., "Primitive, quiescent, Philadelphia-positive stem cells from patients with chronic myeloid leukemia are insensitive to STI571 in vitro," Blood, Jan. 2002, 99: 319-325. cited by applicant . Hamilton et al., "Chronic myeloid leukemia stem cells are not dependent on Bcr-Abl kinase activity for their survival," Blood, Feb. 2012, 119: 1501-1510. cited by applicant . Hentschel et al., "BCR-ABL- and Ras-independent activation of Raf as a novel mechanism of Imatinib resistance in CML," Int J Oncol, Sep. 2011, 39: 585-591. cited by applicant . Ihaka and Gentleman, "R: A language for data analysis and graphics," J. Comput. Graph Stat., 1996, 5: 299-314. cited by applicant . Jabbour et al., "Frequency and clinical significance of BCR-ABL mutations in patients with chronic myeloid leukemia treated with imatinib mesylate," Leukemia, 2006 20: 1767-1773. cited by applicant . Jiang et al., "Chronic myeloid leukemia stem cells possess multiple unique features of resistance to BCR-ABL targeted therapies," Leukemia, 2007, 21: 926-935. cited by applicant . Kalyuga et al., "ELF5 suppresses estrogen sensitivity and underpins the acquisition of antiestrogen resistance in luminal breast cancer," PLoS Biology, Dec. 2012, 10: e1001461. cited by applicant . Kantarjian et al., "Dose escalation of imatinib mesylate can overcome resistance to standard-dose therapy in patients with chronic myelogenous leukemia," Blood, Jan. 2003,101(2):473-475. cited by applicant . Khorashad et al., "The presence of a BCR-ABL mutant allele in CML does not always explain clinical resistance to imatinib," Leukemia, 2006, 20: 658-663. cited by applicant . Klinac et al., "Advances in personalized targeted treatment of metastic melanoma and non-invasive tumor monitoring," Frontiers in Oncology, Mar. 2013, 3: 1-16. cited by applicant . Kolch et al., "Protein kinase C alpha activates RAF-I by direct phosphorylation," Nature, Jul. 1993, 364: 249-252. cited by applicant . Konuma et al., "Forced expression of the histone demethylase Fbx110 maintains self-renewing hematopoietic stem cells," Exp Hematol, Jun. 2011, 39: 697-709. cited by applicant . Li et al., "Activation of p53 by SIRT1 Inhibition Enhances Elimination of CML Leukemia Stem Cells in Combination with Imatinib," Cancer Cell, Feb. 2012, 21: 266-281. cited by applicant . Li et al., "The P190, P210, and P230 forms of the BCR/ABL oncogene induce a similar chronic myeloid leukemia-like syndrome in mice but have different lymphoid leukemogenic activity," The Journal of Experimental Medicine, May 1999, 189: 1399-1412. cited by applicant . Lobo et al., "The Biology of Cancer Stem Cells," Annu Rev Cell Dev Biol, Nov. 2007, 23: 675-699. cited by applicant . Mizuchi et al., "BCR/ABL activates Rap1 and B-Raf to stimulate the MEK/Erk signaling pathway in hematopoietic cells," Biochem Biophys Res Commun., Jan. 2005, 326: 645-651. cited by applicant . Mullenders and Bernards, "Loss-of-function genetic screens as a tool to improve the diagnosis and treatment of cancer," Oncogene, 2009, 28: 4409-4420. cited by applicant . Nambu et al., "Contribution of BCR--ABL-independent activation of ERK1/2 to acquired imatinib resistance in K562 chronic myeloid leukemia cells," Cancer Sci Jan. 2010, 101: 137-142. cited by applicant . National Cancer Institute: PDQ.RTM. Chronic Myelogenous Leukemia Treatment. Bethesda, MD: National Cancer Institute. Date last modified Mar. 28, 2014. Available at: http://www.cancer.gov/cancertopics/pdq/treatment/CML/HealthProfessional. Accessed Nov. 17, 2016. cited by applicant . Neering et al., "Leukemia stem cells in a genetically defined murine model of blast crisis CML," Blood, 2007, 110: 2578-2585. cited by applicant . Ohkubo et al., "A novel Ph1 chromosome positive cell line established from a patient with chronic myelogenous leukemia in blastic crisis," Leukemia Research, 1985, 9: 921-926. cited by applicant . Packer et al., "Nilotinib and MEK Inhibitors Induce Synthetic Lethality through Paradoxical Activation of RAF in Drug-Resistant Chronic Myeloid Leukemia," Cancer Cell, 2011, 20: 715-727. cited by applicant . Pellicano et al., "Concise Review: Cancer Cells Escape from Oncogene Addiction: Understanding the Mechanisms Behind Treatment Failure for More Effective Targeting," Stem Cells, Jun. 2014, 32: 1373-1379. cited by applicant . Pellicano et al., "The MEK inhibitor PD184352 enhances BMS-214662-induced apoptosis in CD34.PHI.CML stem/progenitor cells," Leukemia, 2011, 25: 1159-1167. cited by applicant . Quintas-Cardama et al., "Mechanisms of primary and secondary resistance to imatinib in chronic myeloid leukemia," Cancer Control, Apr. 2009, 16: 122-131. cited by applicant . Radich et al., "Gene expression changes associated with progression and response in chronic myeloid leukemia," PNAS, Feb. 2006, 103: 2794-2799. cited by applicant . Schonwasser et al., "Activation of the mitogen-activated protein kinase/extracellular signal-regulated kinase pathway by conventional, novel, and atypical protein kinase C isotypes," Molecular and Cellular Biology, Feb. 1998, 18: 790-798. cited by applicant . Shah et al., "Multiple BCR-ABL kinase domain mutations confer polyclonal resistance to the tyrosine kinase inhibitor imatinib (STI571) in chronic phase and blast crisis chronic myeloid leukemia," Cancer Cell, Aug. 2002, 2: 117-125. cited by applicant . Shah et al., "Overriding imatinib resistance with a novel ABL kinase inhibitor," Science, Jul. 2004, 305: 399-401. cited by applicant . Silva et al., "Second-generation shRNA libraries covering the mouse and human genomes," Nat Genet, Oct. 2005, 37: 1281-1288. cited by applicant . Slinker, "The Statistics of Synergism," J Mol Cell Cardiol, Apr. 1998, 30: 723-731. cited by applicant . Smith et al., "The Role of Kinase Inhibitors in the Treatment of Patients with Acute Myeloid Leukemia," ASCO Educational Book, 2013, 313-318. cited by applicant . Soverini et al., "BCR-ABL kinase domain mutation analysis in chronic myeloid leukemia patients treated with tyrosine kinase inhibitors: recommendations from an expert panel on behalf of European LeukemiaNet," Blood, Aug. 2011, 118: 1208-1215. cited by applicant . Soverini et al., "Contribution of ABL Kinase Domain Mutations to Imatinib Resistance in Different Subsets of Philadelphia-Positive Patients: By the GIMEMA Working Party on Chronic Myeloid Leukemia," Clin Cancer Res, Dec. 2006, 12: 7374-7379. cited by applicant . Sozeri et al., "Activation of the c-Raf protein kinase by protein kinase C phosphorylation," Oncogene, Nov. 1992, 7: 2259-2262. cited by applicant . Steelman et al., "JAK/STAT, Raf/MEK/ERK, PI3K/Akt and BCR-ABL in cell cycle progression and leukemogenesis," Leukemia, 2004, 18:189-218. cited by applicant . Suzuki et al., "PKC eta regulates occludin phosphorylation and epithelial tight junction integrity," PNAS, Jan. 2009,106: 61-66. cited by applicant . Takahashi et al., "VEGF activates protein kinase C-dependent, but Ras-independent Raf-MEK-MAP kinase pathway for DNA synthesis in primary endothelial cells," Oncogene, Apr. 1999, 18: 2221-2230. cited by applicant . ten Hoeve et al., "Tyrosine phosphorylation of CRKL in Philadelphia+ leukemia," Blood, Sep. 1994, 84: 1731-17363. cited by applicant . Third Party Observation in International Application No. PCT/US2015/030908, dated Feb. 16, 2016. cited by applicant . Ueda et al, "Protein kinase C activates the MEK-ERK pathway in a manner independent of Ras and dependent on Raf," The Journal of Biological Chemistry, 1996, 271: 23512-23519. cited by applicant . Uht et al., "The protein kinase C-eta isoform induces proliferation in glioblastoma cell lines through an ERK/Elk-1 pathway," Oncogene, 2007, 26: 2885-2893. cited by applicant . Valent, "Imatinib-resistant chronic myeloid leukemia (CML): Current concepts on pathogenesis and new emerging pharmacologic approaches," Biologics, Dec. 2007, 1: 433-448. cited by applicant . Von Bubnoff et al., "Resistance of Philadelphia-chromosome positive leukemia towards the kinase inhibitor imatinib (STI571, Glivec): a targeted oncoprotein strikes back," Leukemia, 2003, 17: 829-838. cited by applicant . Weisberg et al., "Second generation inhibitors of BCR-ABL for the treatment of imatinib-resistant chronic myeloid leukaemia," Nature Reviews, Cancer, May 2007, 7: 345-356. cited by applicant . Wellbrock et al., "The RAF proteins take centre stage," Nature Reviews, Molecular Cell Biology, Nov. 2004, 5: 875-885. cited by applicant . Zhang et al., "Effective Targeting of Quiescent Chronic Myelogenous Leukemia Stem Cells by Histone Deacetylase Inhibitors in Combination with Imatinib Mesylate," Cancer Cell, May 2010, 17: 427-442. cited by applicant . Zhang et al., "The Blk pathway functions as a tumor suppressor in chronic myeloid leukemia stem cells," Nat Genet, 2012, 44: 861-871. cited by applicant . Bhatia et al., "Abstract #: 1420: Suppression of CML Hematopoietic Progenitor Growth Following BCR/ABL-Kinase Inhibition by Imatinib Mesylate Does Not Result from MAPK Inhibition and Is Synergistically Enhanced Following Inhibition of MAPK Activity," Presented at 44th Annual Meeting of the American Society of Hematology, Philadelpha, PA, Dec. 6-10, 2002, BIOSIS, Nov. 2002, 100: 2 pages. cited by applicant . International Preliminary Report on Patentability on International Application No. PCT/US2015/030908, dated Dec. 1, 2016. cited by applicant . Ma et al., "A therapeutically targetable mechanism of BCR-ABL-independent imatinib resistance in chronic myeloid leukemia," Science Translational Medicine, Sep. 2014, 6: 252ra121 (13 pages). cited by applicant . Partial European Search Report in Application No. 15793586.7, dated Dec. 15, 2017, 17 pages. cited by applicant . Partial European Supplementary Search Report in Application No. 15793586.7, dated Nov. 10, 2017, 14 pages. cited by applicant . Ammoun et al. "Nilotinib alone or in combination with selumetinib is a drug candidate for neurofibromatosis type 2" Neuro-Oncology 13(7):759?766, 2011, abstract, p. 760, col. 1, para 2-3, p. 763, col. 1, para 2 to col. 2, para 1, Fig. 4. cited by applicant . Ma et al. "A therapeutically targetable mechanism of BCR-ABL?independent imatinib resistance in chronic myeloid leukemia" Science Translational Medicine Sep. 2014 vol. 6 Issue 252 252ra121, abstract, p. 4, col. 1, para 5 to p. 6, col. 1, para 2. cited by applicant . International Search Report and the Written Opinion of the International Searching Authority for PCT/US15/30908 dated Dec. 8, 2015, 15 pages. cited by applicant . Extended European Search Report in Application No. 15793586.7, dated Mar. 19, 2018, 11 pages. cited by applicant. |
Primary Examiner: McMillian; Kara R
Attorney, Agent or Firm: Fish & Richardson P.C.
Government Interests
FEDERALLY SPONSORED RESEARCH OR DEVELOPMENT
This invention was made with Government support under Grant No. R01 CA163926 awarded by the National Institutes of Health. The Government has certain rights in the invention.
Parent Case Text
CLAIM OF PRIORITY
This application is a U.S. National Phase Application under 35 U.S.C. .sctn. 371 of International Patent Application No. PCT/US2015/030908, filed May 14, 2015, which claims the benefit of U.S. Provisional Patent Application Ser. Nos. 61/994,689, filed on May 16, 2014, and 62/032,117, filed on Aug. 1, 2014. The entire contents of the foregoing are hereby incorporated by reference.
Claims
What is claimed is:
1. A method for treating BCR-ABL independent imatinib mesylate (IM)-resistant chronic myeloid leukemia (CML) in a mammalian subject, the method comprising: detecting a level of PRKCH mRNA in a sample comprising leukemic cells from the subject; comparing the level of PRKCH mRNA in the sample to a reference level; and administering a combination of a BCR-ABL inhibitor and a MEK inhibitor to a subject who has a level of PRKCH mRNA above the reference level.
2. The method of claim 1, wherein the BCR-ABL inhibitor is imatinib, Nilotinib; Dasatinib; Bosutinib; Ponatinib; Bafetinib; or thiazol or a thiazol derivative.
3. The method of claim 2, wherein the BCR-ABL inhibitor is imatinib.
4. The method of claim 1, wherein the MEK inhibitor is Trametinib, Selumetinib, MEK162, PD-325901, cobimetinib, CL-1040, or PD035901.
5. The method of claim 4, wherein the MEK inhibitor is trametinib.
6. The method of claim 1, wherein the subject is human.
7. The method of claim 1, wherein the level of PRKCH mRNA is determined using RNA in situ hybridization, Southern or Northern analyses, polymerase chain reaction analyses and probe arrays.
8. A method for treating BCR-ABL independent imatinib mesylate (IM)-resistant chronic myeloid leukemia (CIVIL) in a mammalian subject, the method comprising: detecting a level of PKCeta protein in a sample comprising leukemic cells from the subject; comparing the level of PKCeta protein in the sample to a reference level; and administering a combination of a BCR-ABL inhibitor and a MEK inhibitor to a subject who has a level of PKCeta protein above the reference level.
9. The method of claim 8, wherein the BCR-ABL inhibitor is imatinib, Nilotinib; Dasatinib; Bosutinib; Ponatinib; Bafetinib; or thiazol or a thiazol derivative.
10. The method of claim 9, wherein the BCR-ABL inhibitor is imatinib.
11. The method of claim 8, wherein the MEK inhibitor is Trametinib, Selumetinib, MEK162, PD-325901, cobimetinib, CL-1040, or PD035901.
12. The method of claim 11, wherein the MEK inhibitor is trametinib.
13. The method of claim 8, wherein the subject is human.
14. The method of claim 8, wherein the level of PKCeta protein is determined using an immunoassay.
Description
TECHNICAL FIELD
The present invention relates to methods for treating chronic myeloid leukemia (CML), e.g., BCR-ABL inhibitor imatinib mesylate (IM)-resistant CML, using combination treatments, e.g., combined treatment with a BCR-ABL inhibitor, e.g., IM, and a MEK inhibitor, e.g., trametinib.
BACKGROUND
Chronic myeloid leukemia (CML) is a hematopoietic malignancy characterized by an increase and unregulated growth of predominantly myeloid cells in the bone marrow, and their accumulation in the blood (1). A hallmark of CML is the Philadelphia chromosome resulting from a reciprocal translocation between the long arms of chromosomes 9 and 22 (2, 3). This chromosomal translocation leads to expression of BCR-ABL, an oncogenic fusion-protein with a constitutively activated ABL tyrosine kinase. BCR-ABL can transform myeloid progenitor cells and drives the development of 95% of CML cases. BCR-ABL promotes leukemogenesis by activating downstream signaling proteins that increase cell survival and proliferation (4). These pathways include, but are not limited to, the RAS/mitogen-activated protein kinase (RAF/MEK/ERK), phosphatidylinositol 3-kinase/AKT (PI3K/AKT), and JAK/STAT signaling cascades (5).
The first-line treatment for CML is imatinib mesylate (IM), which binds to the ABL kinase domain and inhibits phosphorylation of substrates (6). Although IM dramatically improves patient survival when used to treat early-stage disease, the drug is not curative. Resistance to IM can develop, especially in advanced-stage disease, leading to disease relapse and progression (7). Resistance to IM can result from multiple mechanisms that can be broadly classified as either BCR-ABL-dependent or BCR-ABL-independent (8). BCR-ABL-dependent resistance is most commonly due to the acquisition of point mutations in the ABL kinase domain that interfere with IM binding and subsequent kinase inhibition (9-11). However, in 50% or more of IM-resistant CML patients there is no mutation in BCR-ABL (12, 13) and the basis of such BCR-ABL-independent IM resistance is not understood.
SUMMARY
Previous studies have shown that a human BCR-ABL+ CML cell line, K562R, is resistant to IM due to over-expression of the Src family kinase LYN (Donato et al., Blood 101, 690-698 (2003)), however the clinical relevance of this finding is not well established. Our results reveal a previously-unknown survival pathway that promotes BCR-ABL-independent IM resistance and also contributes to the intrinsic IM resistance of CML stem cells. The mechanism described herein is therapeutically targetable and clinically relevant, which was confirmed by showing the efficacy of combined treatment with IM and trametinib both in cell culture and in IM-resistant CML mouse models.
Combined treatment with IM and trametinib represents a promising new therapeutic approach for treating CML patients with BCR-ABL-independent IM resistance. Furthermore, combined treatment with IM and trametinib synergistically kills CML stem cells with negligible effect on normal hematopoietic cells; currently, the intrinsic IM-resistance of CML stem cells is a major obstacle in long-term treatment of CML and essentially prevents a cure for the disease. Thus, the methods described herein have the potential to cure CML as opposed to the current treatment, which is effective only for the long-term management of CML.
Thus, in a first aspect, the invention provides methods for treating chronic myeloid leukemia (CML) in a mammalian subject that include administering a combination of a BCR-ABL inhibitor and a MEK inhibitor. Also provided herein is the use of a BCR-ABL inhibitor and a MEK inhibitor in the treatment of chronic myeloid leukemia (CML) in a mammalian subject.
In some embodiments, the CML is BCR-ABL inhibitor imatinib mesylate (IM)-resistant CML, e.g., BCR-ABL independent IM-resistant CML, wherein the BCR-ABL is wild-type or lacks a mutation that confers IM-resistance.
In some embodiments, the BCR-ABL inhibitor is imatinib, Nilotinib (AMN107); Dasatinib (BMS-345825); Bosutinib (SKI-606); Ponatinib (AP24534); Bafetinib (INNO-406); thiazol or a thiazol derivatives, e.g., 1,3,4 thiadiazole derivatives.
In some embodiments, the BCR-ABL inhibitor is imatinib.
In some embodiments, the MEK inhibitor is Trametinib (GSK1120212), Selumetinib, MEK162, PD-325901, cobimetinib (XL518; [3,4-Difluoro-2-(2-fluoro-4-iodoanilino)phenyl]{3-hydroxy-3-[(2S)-piperid- in-2-yl]azetidin-1-yl} methanone), CL-1040, or PD035901.
In some embodiments, the MEK inhibitor is trametinib.
In some embodiments, the subject is human.
In another aspect, the invention provides methods for selecting a subject with chronic myeloid leukemia (CML) for treatment with a BCR-ABL inhibitor and a MEK inhibitor. The methods include detecting a level of PRKCH mRNA or PKCeta protein in a sample comprising leukemic cells, e.g., leukemic stem cells, from the subject; comparing the level of PRKCH mRNA or PKCeta protein in the sample to a reference level; selecting a subject who has a level of PRKCH mRNA or PKCeta protein above the reference level for treatment with a BCR-ABL inhibitor and a MEK inhibitor; and optionally administering the treatment to the selected subject.
In some embodiments, the CML is BCR-ABL inhibitor imatinib mesylate (IM)-resistant CML, e.g., BCR-ABL independent IM-resistant CML, wherein the BCR-ABL is wild-type or lacks a mutation that confers IM-resistance. In some embodiments, the methods include determining that the subject has BCR-ABL independent IM-resistant CML, e.g., determining that the BCR-ABL is wild-type or lacks a mutation that confers IM-resistance.
In some embodiments, the CML is BCR-ABL inhibitor imatinib mesylate (IM)-resistant CML.
In some embodiments, the BCR-ABL inhibitor is imatinib, Nilotinib (AMN107); Dasatinib (BMS-345825); Bosutinib (SKI-606); Ponatinib (AP24534); Bafetinib (INNO-406); thiazol or a thiazol derivatives, e.g., 1,3,4 thiadiazole derivatives.
In some embodiments, the BCR-ABL inhibitor is imatinib.
In some embodiments, the MEK inhibitor is Trametinib (GSK1120212), Selumetinib, MEK162, PD-325901, cobimetinib (XL518; [3,4-Difluoro-2-(2-fluoro-4-iodoanilino)phenyl]{3-hydroxy-3-[(2S)-piperid- in-2-yl]azetidin-1-yl} methanone), CL-1040, or PD035901.
In some embodiments, the MEK inhibitor is trametinib.
In some embodiments, the level of PRKCH mRNA is determined using RNA in situ hybridization, Southern or Northern analyses, polymerase chain reaction analyses and probe arrays.
In some embodiments, the level of PKCeta protein is determined using an immunoassay.
In some embodiments, determining that the BCR-ABL is wild-type or lacks a mutation that confers IM-resistance comprises sequencing the BCR-ABL gene or a kinase domain thereof in leukemic cells of the subject, e.g., a mutation known in the art or described herein. Methods known in the art can be used to determine whether a new mutation confers IM-resistance.
Unless otherwise defined, all technical and scientific terms used herein have the same meaning as commonly understood by one of ordinary skill in the art to which this invention belongs. Methods and materials are described herein for use in the present invention; other, suitable methods and materials known in the art can also be used. The materials, methods, and examples are illustrative only and not intended to be limiting. All publications, patent applications, patents, sequences, database entries, and other references mentioned herein are incorporated by reference in their entirety. In case of conflict, the present specification, including definitions, will control.
Other features and advantages of the invention will be apparent from the following detailed description and Figures, and from the claims.
DESCRIPTION OF DRAWINGS
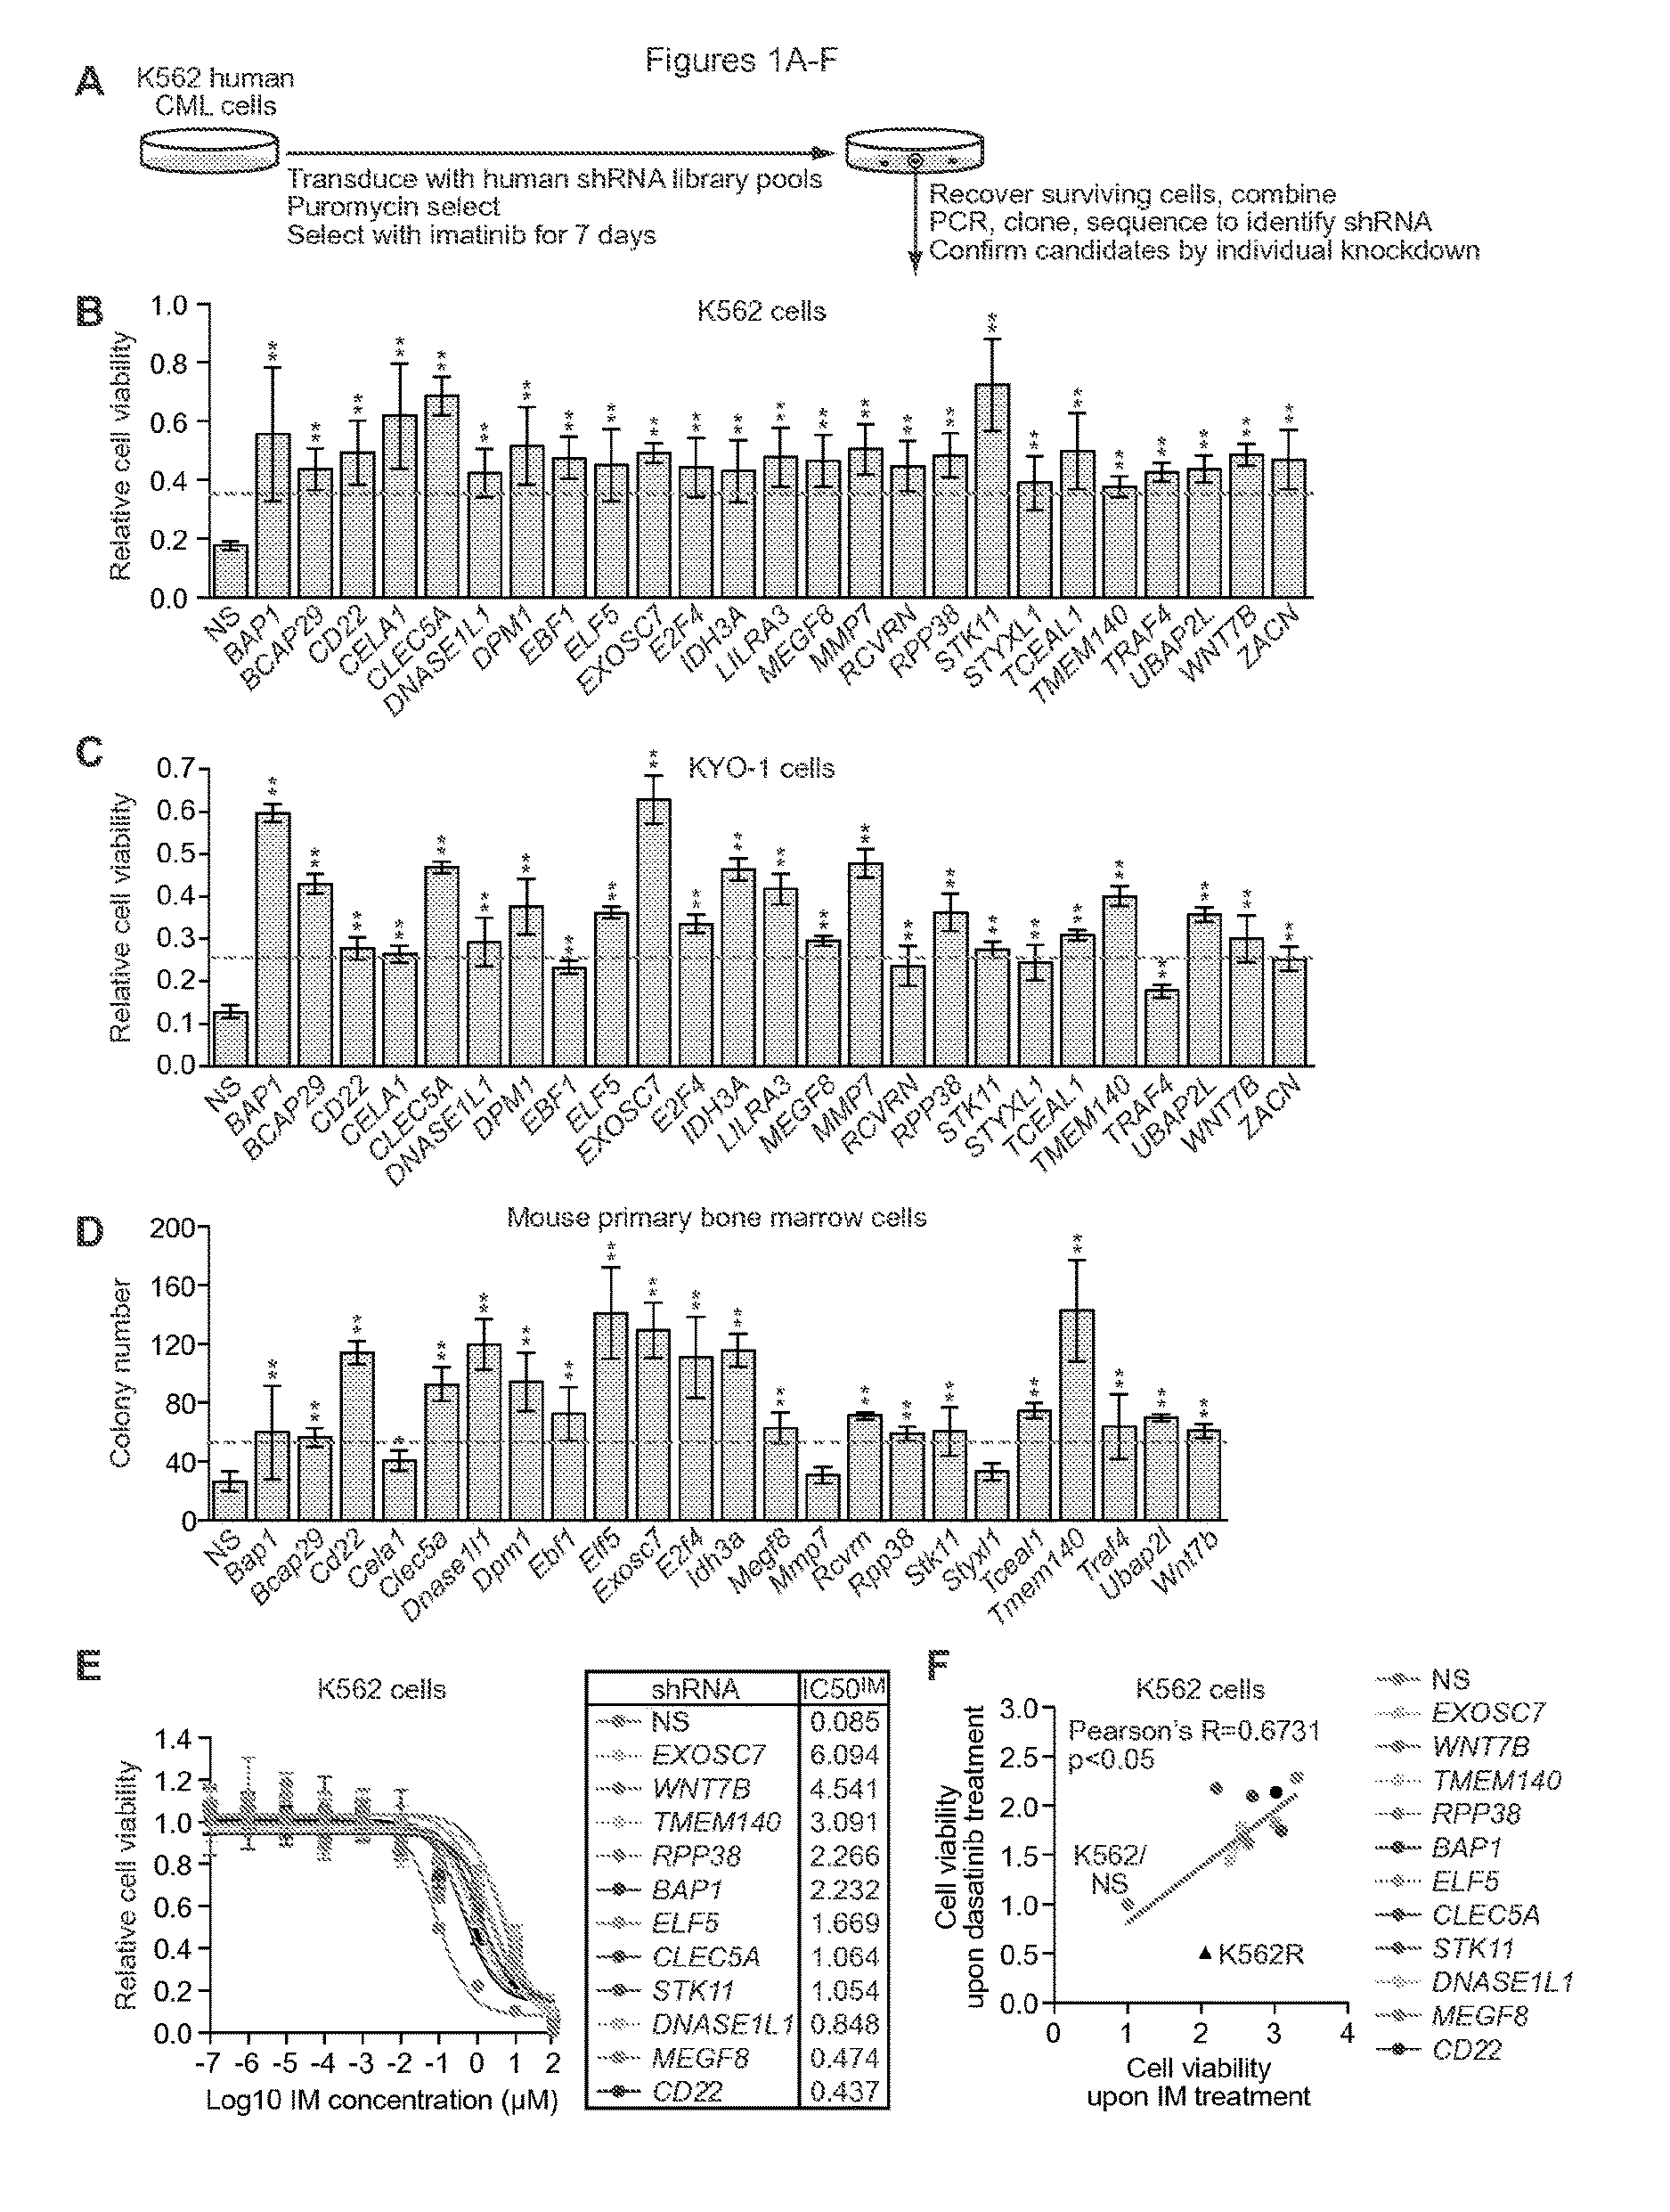
FIGS. 1A-F. A large-scale shRNA screen identifies IMSGs. (A) Schematic summary of the screen. (B) Relative viability of IMSG KD K562 cells in the presence of IM, as measured by MTT assay (n=4). The results were normalized to that obtained with DMSO-treated cells, which was set to 1. IMSG shRNAs that conferred >2-fold increase in cell survival (indicated by the red line) relative to the NS control shRNA were considered positive. (C) Relative viability of IMSG KD KYO-1 cells in the presence of IM, as measured by MTT assay (n=4). The results were normalized and positives determined as described in (B). (D) Colony formation assay monitoring survival of BCR-ABL+ mouse primary bone marrow cells expressing an IMSG shRNA in the presence of IM (n=3). IMSG shRNAs that conferred >2-fold increase in colony number (indicated by the red line) relative to the NS control shRNA were considered positive. (E) Relative IC50.sup.IM of IMSG KD K562 cells (n=4). (F) Cell viability, as measured by MTT assay, of IMSG KD K562 cells treated with 500 nM dasatinib or 10 .mu.M IM for 3 days (n=4). K562 cells expressing an NS shRNA (K562/NS) and IM-resistant K562 cells (K562R) were analyzed as controls. Data are represented as mean.+-.SD. *P.ltoreq.0.05, **P.ltoreq.0.01. Statistical tests and exact P values are provided in table 4.
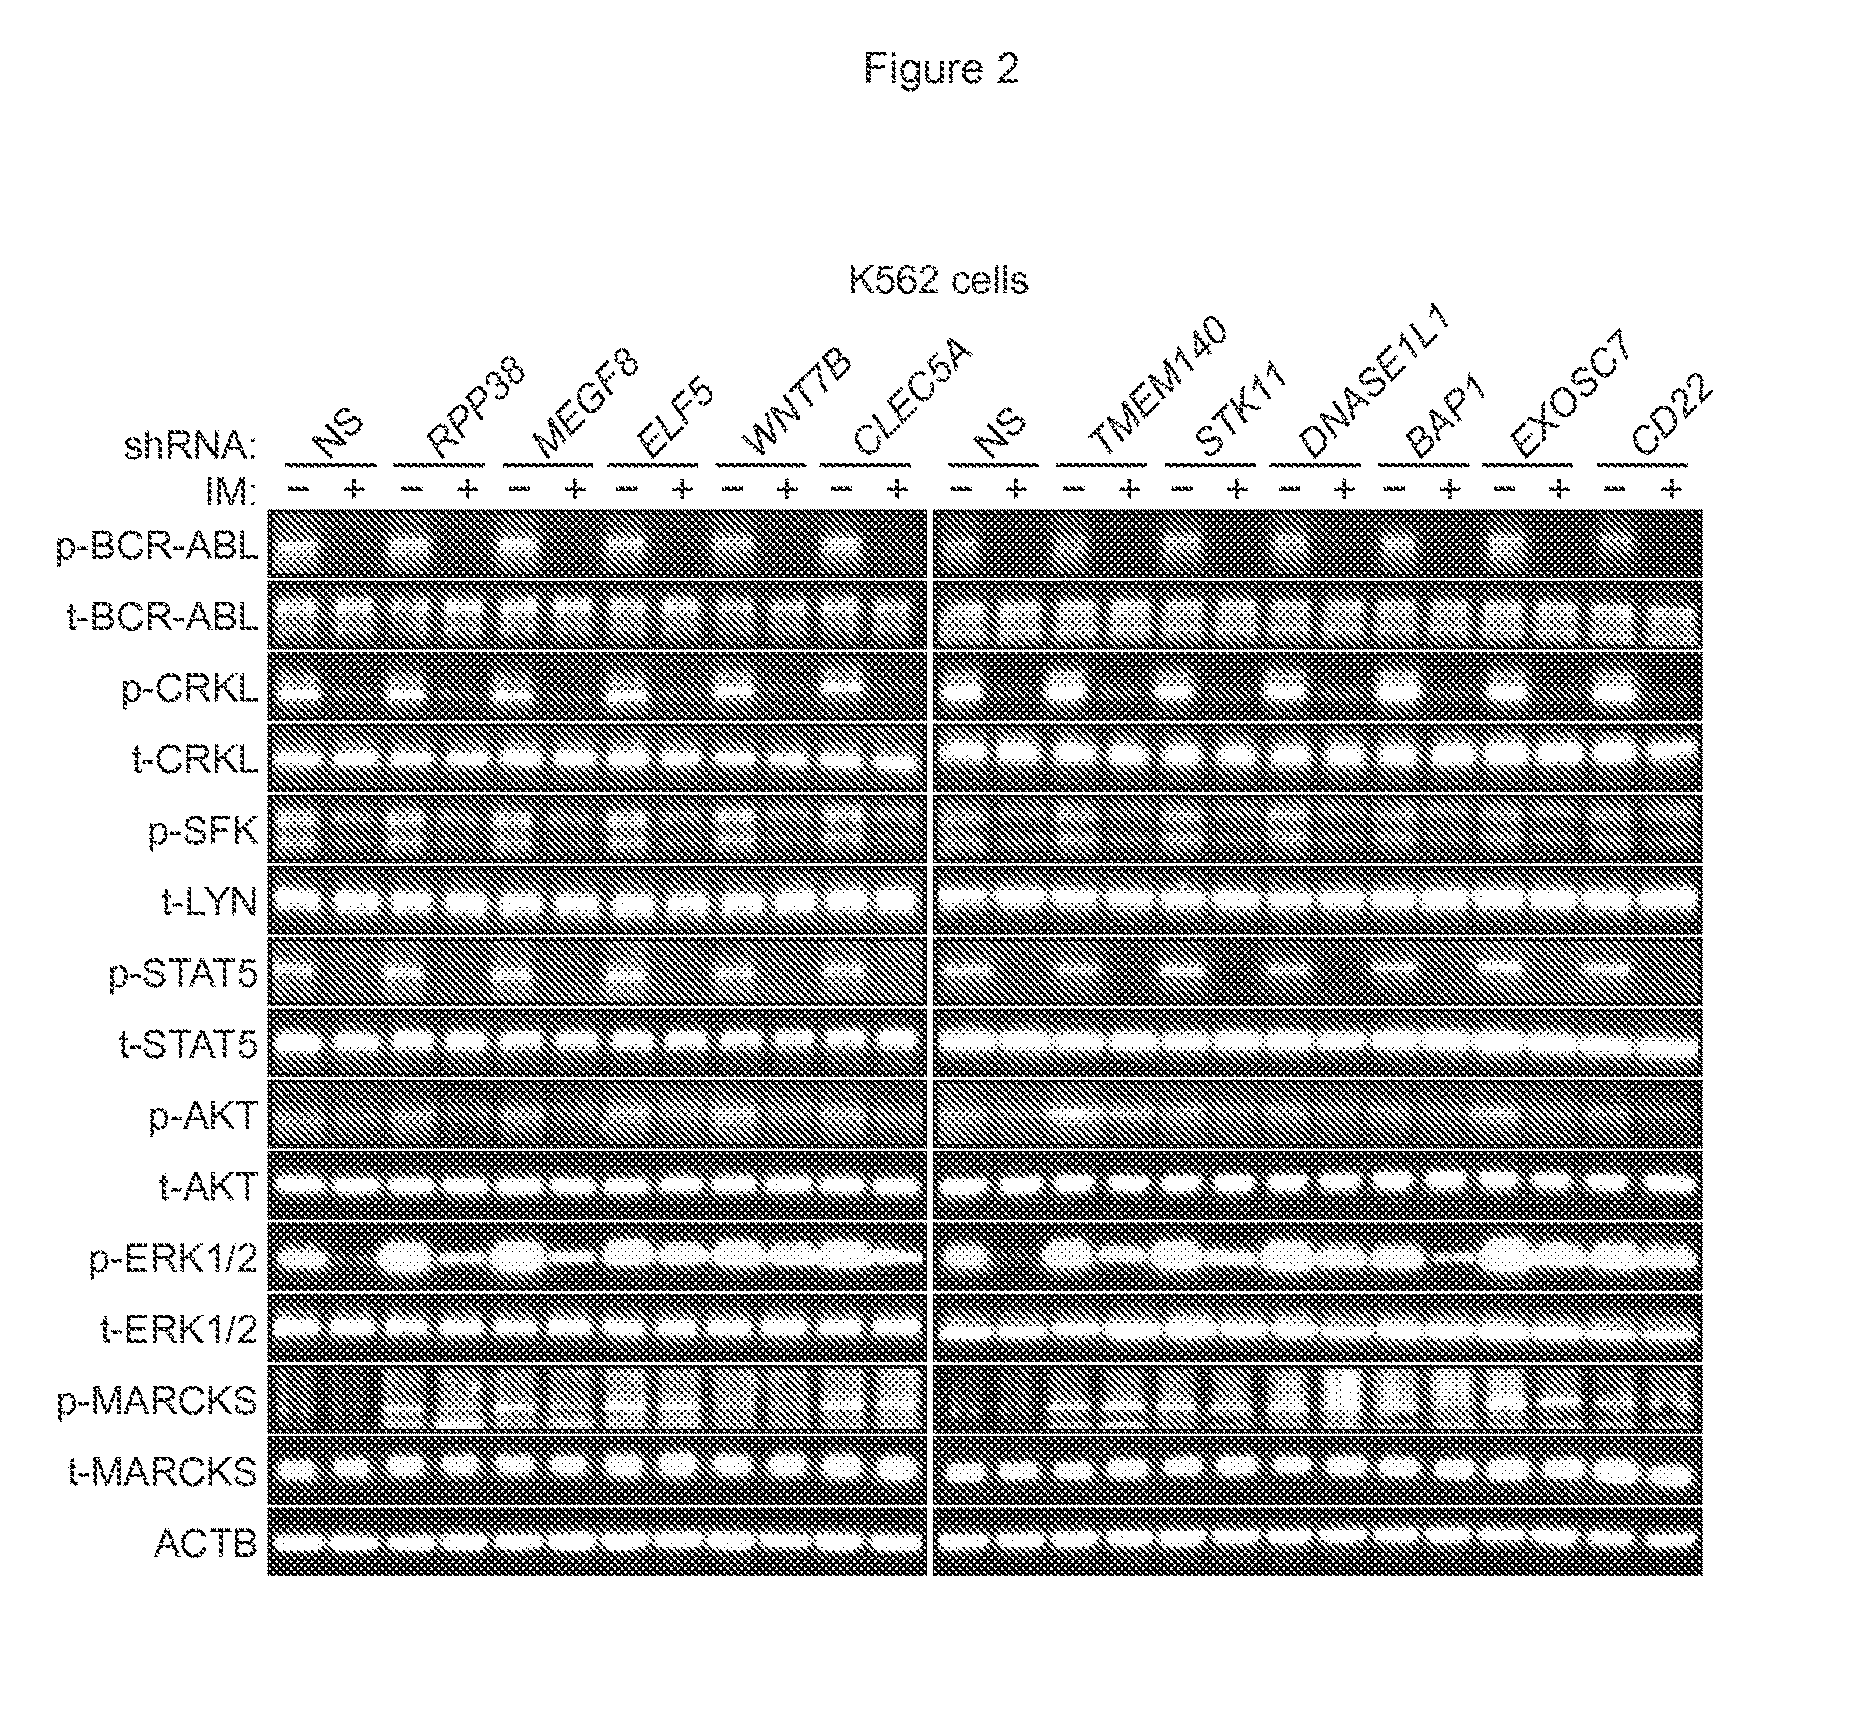
FIG. 2. Knockdown of IMSGs in BCR-ABL+ cells results in sustained RAF/MEK/ERK signaling after IM treatment. Immunoblot analysis monitoring the activity of BCR-ABL (as measured by phosphorylated (p) and total (t) BCR-ABL and CRKL), SFKs (p-SFK and t-LYN), JAK/STAT (p- and t-STAT5), PI3K/AKT (p- and t-AKT), MEK/ERK (p- and t-ERK1/2), and PKC (p- and t-MARCKS) pathways in IMSG KD K562 cells treated in the presence or absence of IM. .beta.-actin (ACTB) was monitored as a loading control.
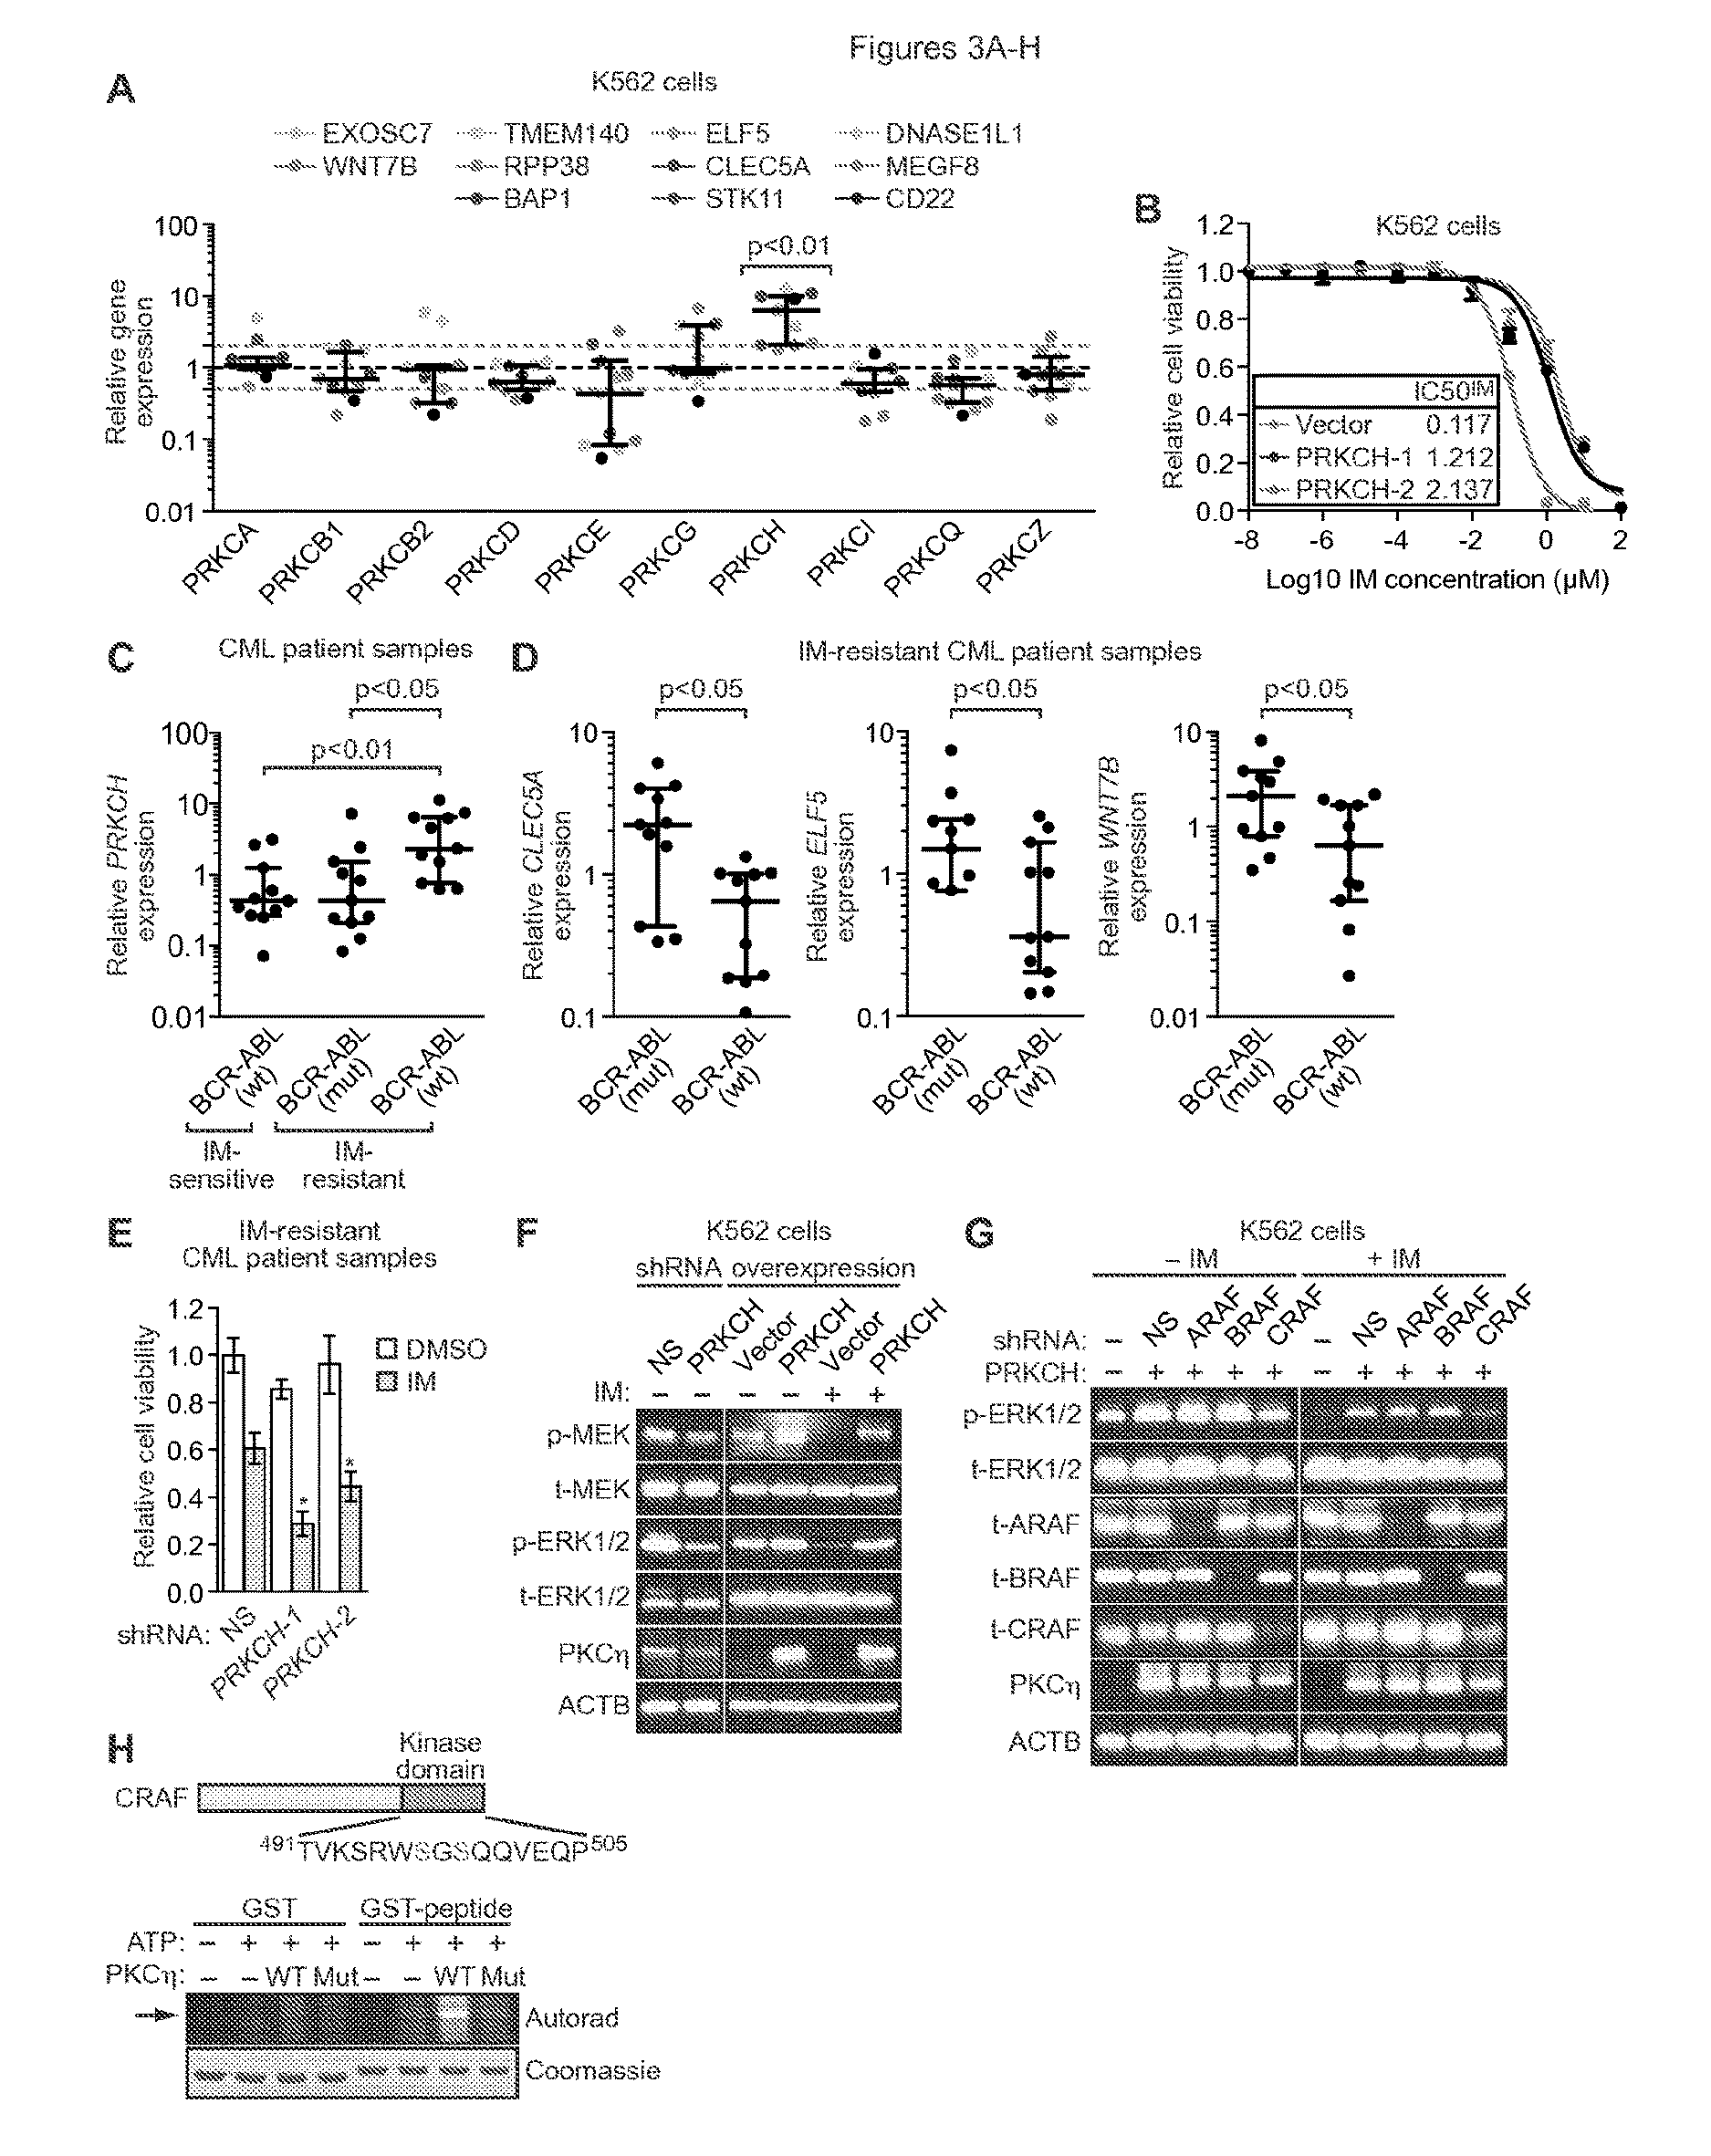
FIGS. 3A-H. IMSG knockdown increases RAF/MEK/ERK signaling through upregulation of PKC.eta., an activator of CRAF. (A) qRT-PCR analysis monitoring expression of different PKC isotypes in IMSG KD K562 cells. Each colored dot represents an individual IMSG KD K562 cell line. Error bars indicate median with interquartile range. The results were normalized to that obtained with the NS control shRNA, which was set to 1. The dashed lines indicate >2-fold change in gene expression relative to that obtained with the NS shRNA. (B) Relative IC50.sup.IM in K562 cells expressing empty vector and in two independently derived K562 clonal cell lines ectopically expressing PRKCH (n=4). Data are represented as mean.+-.SD. (C) qRT-PCR analysis monitoring expression of PRKCH in BCR-ABL wild-type IM-sensitive patient samples (n=11), and BCR-ABL mutant (n=11) or BCR-ABL wild-type (n=11) IM-resistant CML patient samples. Error bars indicate median with interquartile range. (D) qRT-PCR analysis monitoring expression of three IMSGs in BCR-ABL mutant (n=11) or BCR-ABL wild-type (n=11) IM-resistant CML patient samples. For ELF5, BCR-ABL mutant (n=9). Error bars indicate median with interquartile range. (E) Relative viability, as measured by trypan blue cell counting, of primary leukemic cells from BCR-ABL independent IM-resistant CML patient samples (n=5) expressing a NS or PRKCH shRNA and treated with DMSO or IM. The results were normalized to that obtained with DMSO-treated cells expressing a NS shRNA, which was set to 1. Data are represented as mean.+-.SEM. *P.ltoreq.0.05, **P.ltoreq.0.01. Statistical tests and exact P values are provided in table 4. (F) Immunoblot analysis monitoring RAF/MEK/ERK activity (as measured by p- and t-MEK and p- and t-ERK1/2) in PRKCH KD K562 cells (left) and in K562/PRKCH-1 cells in the absence or presence of IM (right). (G) Immunoblot analysis monitoring p- and t-ERK1/2 levels in K562/PRKCH-1 cells expressing an ARAF, BRAF or CRAF shRNA, treated with DMSO or IM for 1 h. (H) (Top) Schematic of CRAF showing the kinase domain bearing a potential PKC phosphorylation site at S497/S499. (Bottom) In vitro phosphorylation assay. Wild-type (WT) or kinase-dead mutant (Mut; K384R) PKC.eta. was used in an in vitro phosphorylation reaction containing either GST or a GST-CRAF(aa491-505) fusion-protein. The phosphorylated product was visualized by autoradiography. The Coomassie-stained gel shows the abundance of each protein.
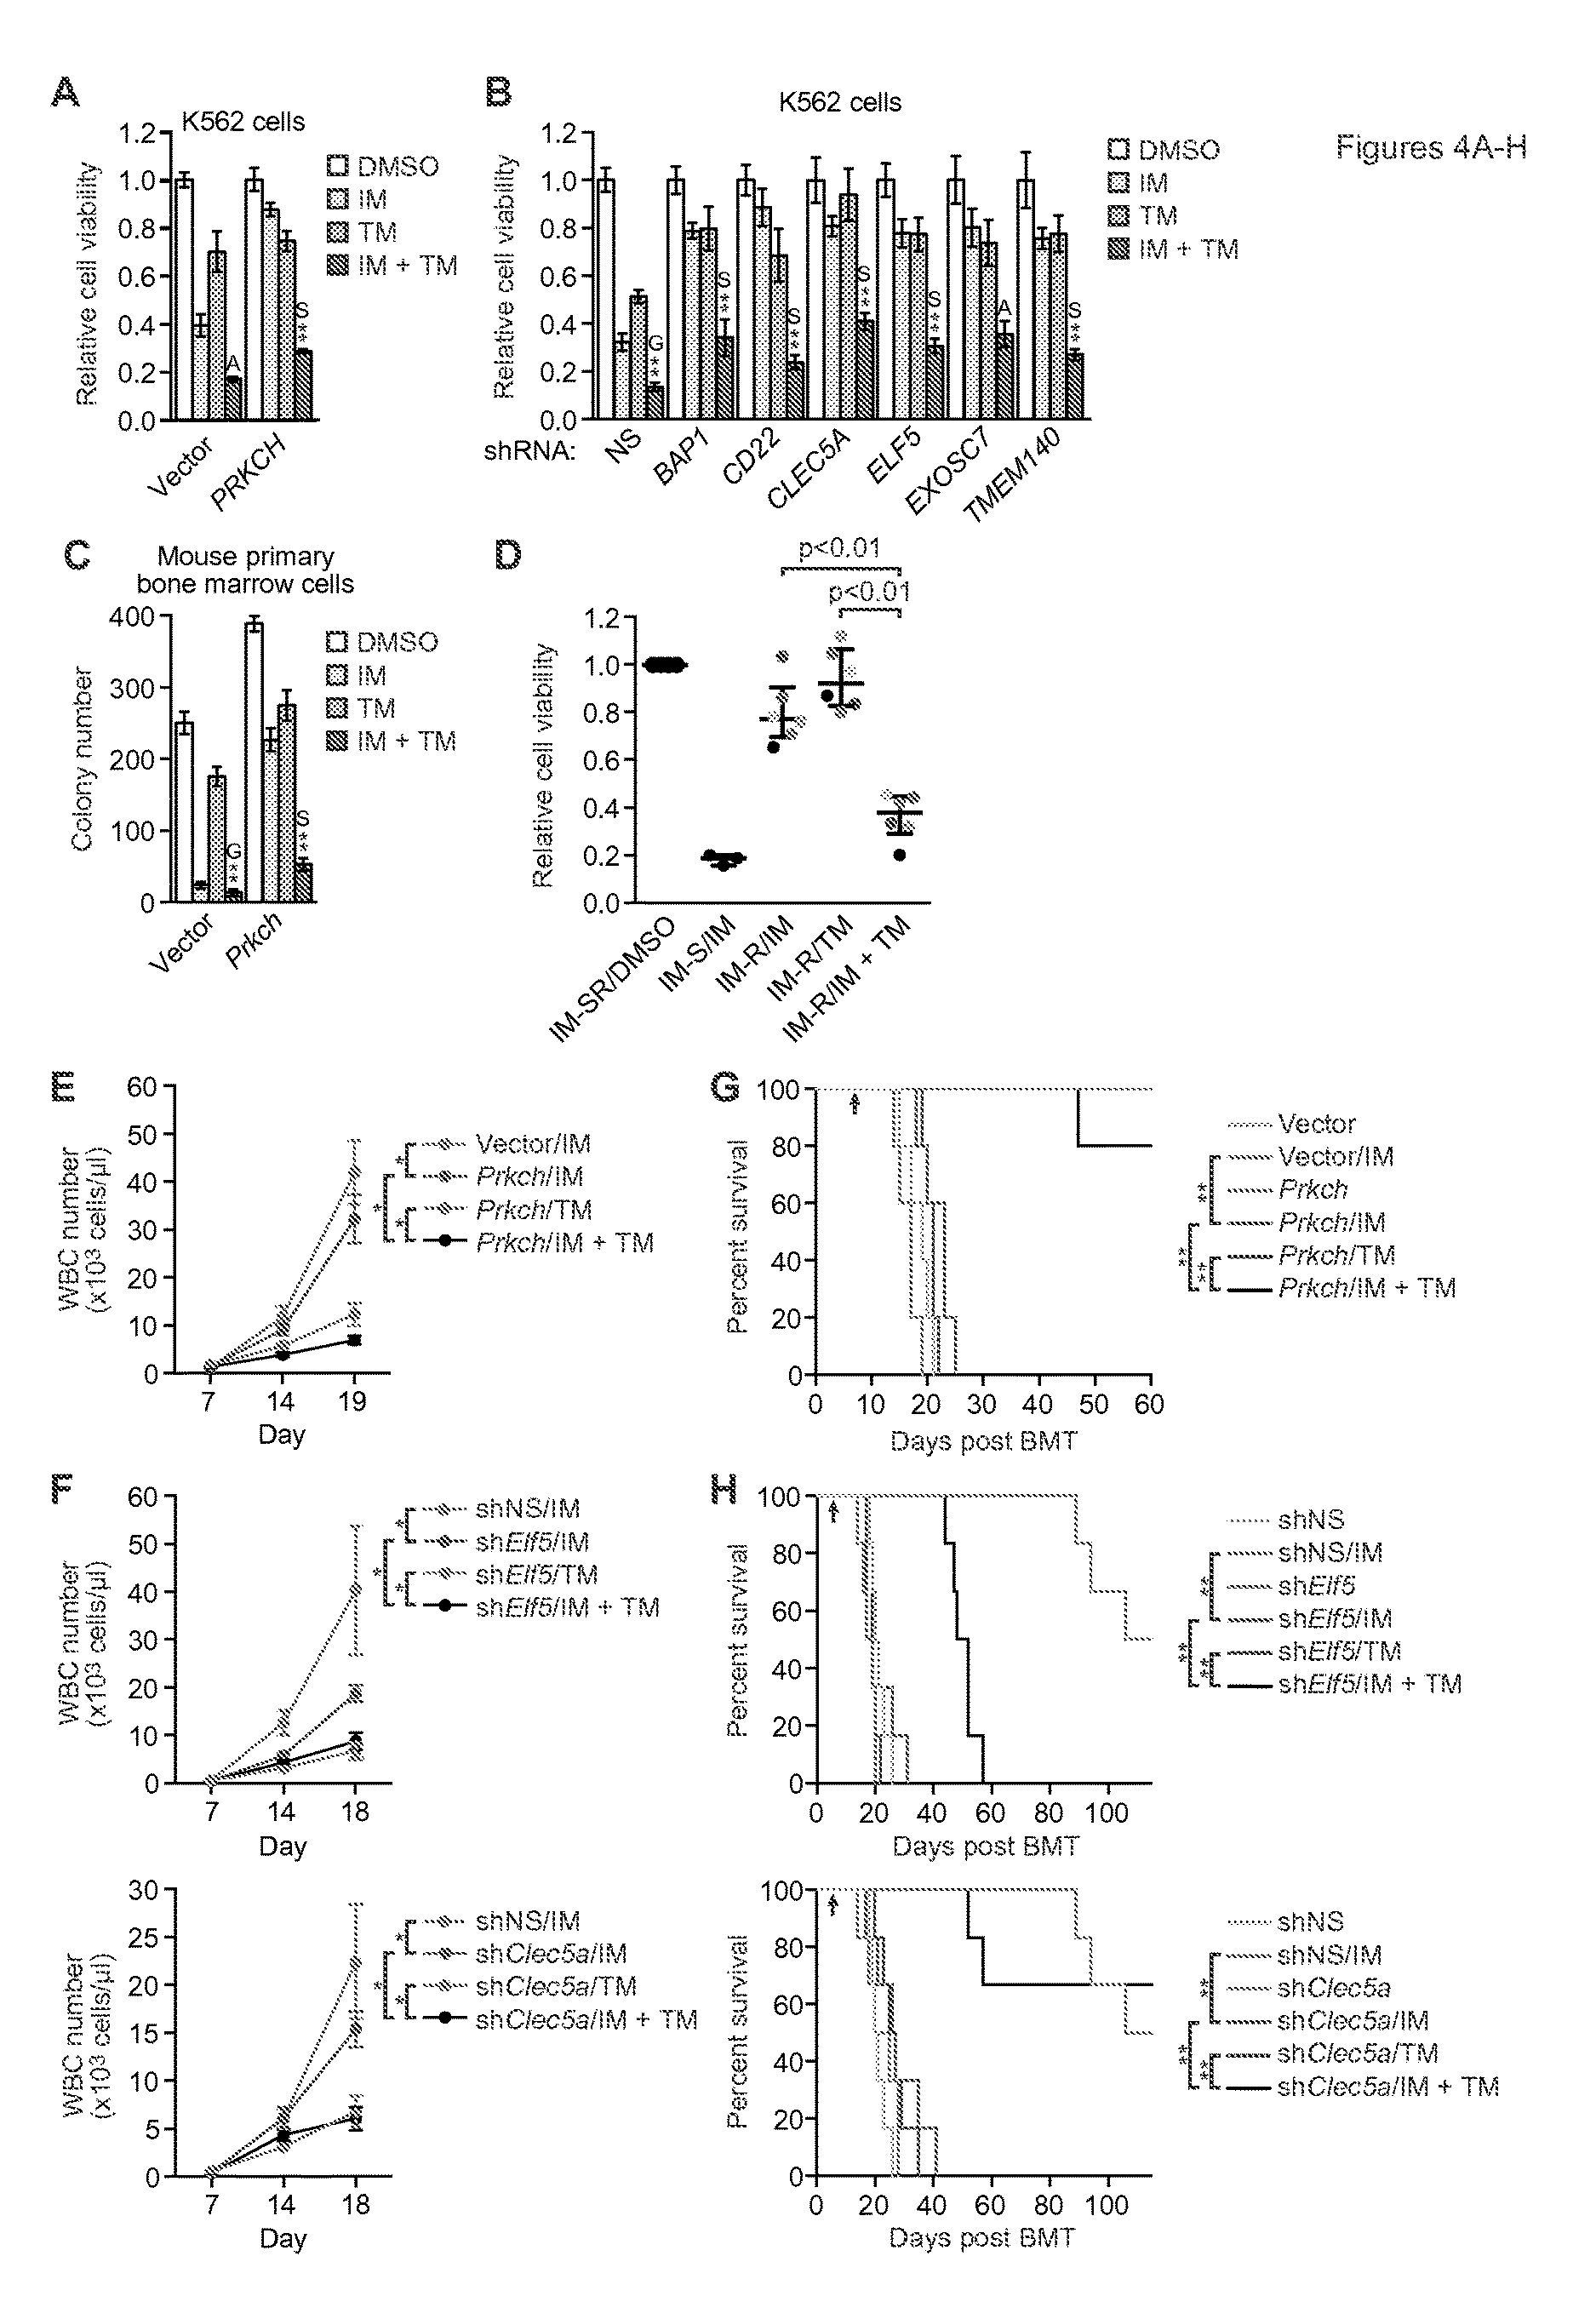
FIGS. 4A-H. Combined treatment with IM and a MEK inhibitor has beneficial effects. (A and B) Cell viability, as measured by MTT assay, of K562/PRKCH-1 (A; n=4) or IMSG KD K562 cells (B; n=3 or 4) treated with 0.1 .mu.M IM, 1.5 nM trametinib (TM) or a combination of the two drugs, as indicated. The results were normalized to that observed with DMSO, which was set to 1. Data are represented as mean.+-.SD. Asterisks indicate comparisons between the combined drug treatment and single drug treatments. Combined drug treatment was synergistic (S), additive (A) or antagonistic (G). (C) Colony formation assay monitoring survival of BCR-ABL+ mouse primary bone marrow cells ectopically expressing Prkch and treated with IM, TM or a combination, as described in (A) (n=3). Data are represented as mean.+-.SD. (D) Relative viability, as measured by trypan blue cell counting, of primary leukemic cells isolated from IM-sensitive (IM-S) CML patients and treated with 5 .mu.M IM (n=3), or isolated from BCR-ABL-independent IM-resistant (IM-R) CML patients and treated with 5 .mu.M IM, 5 .mu.M TM or a combination (n=6). The results were normalized to those obtained by DMSO treatment of the same samples (IM-S or IM-R [IM-SR]), which was set to 1. Error bars indicate median with interquartile range. Matched samples from the same patient are indicated by dots of the same color. (E and F) White blood cell (WBC) count of leukemic mice derived by transplantation of BCR-ABL+ mouse primary bone marrow cells ectopically expressing Prkch (E) or knocked down for an IMSG (F), and treated at day 7 with either IM, TM or a combination of the two drugs as indicated (n=4 or 5 mice per group). Data are represented as mean.+-.SEM. The same NS control is used in the two graphs shown in (F), which were derived from a single experiment. (G and H) Kaplan-Meier survival curves of leukemic mice derived as described in (E and F). The indicated cohorts of mice (n=5 for Prkch overexpression and n=6 for IMSG knockdown) were treated with either vehicle, IM (100 mg/kg twice a day), TM (2 mg/kg once a day), or both IM and TM by oral gavage starting at day 7 (indicated by the arrow). The same NS control is used in the curves shown in (H), which were derived from a single experiment. *P.ltoreq.0.05, **P.ltoreq.0.01. Statistical tests and exact P values are provided in table 4.
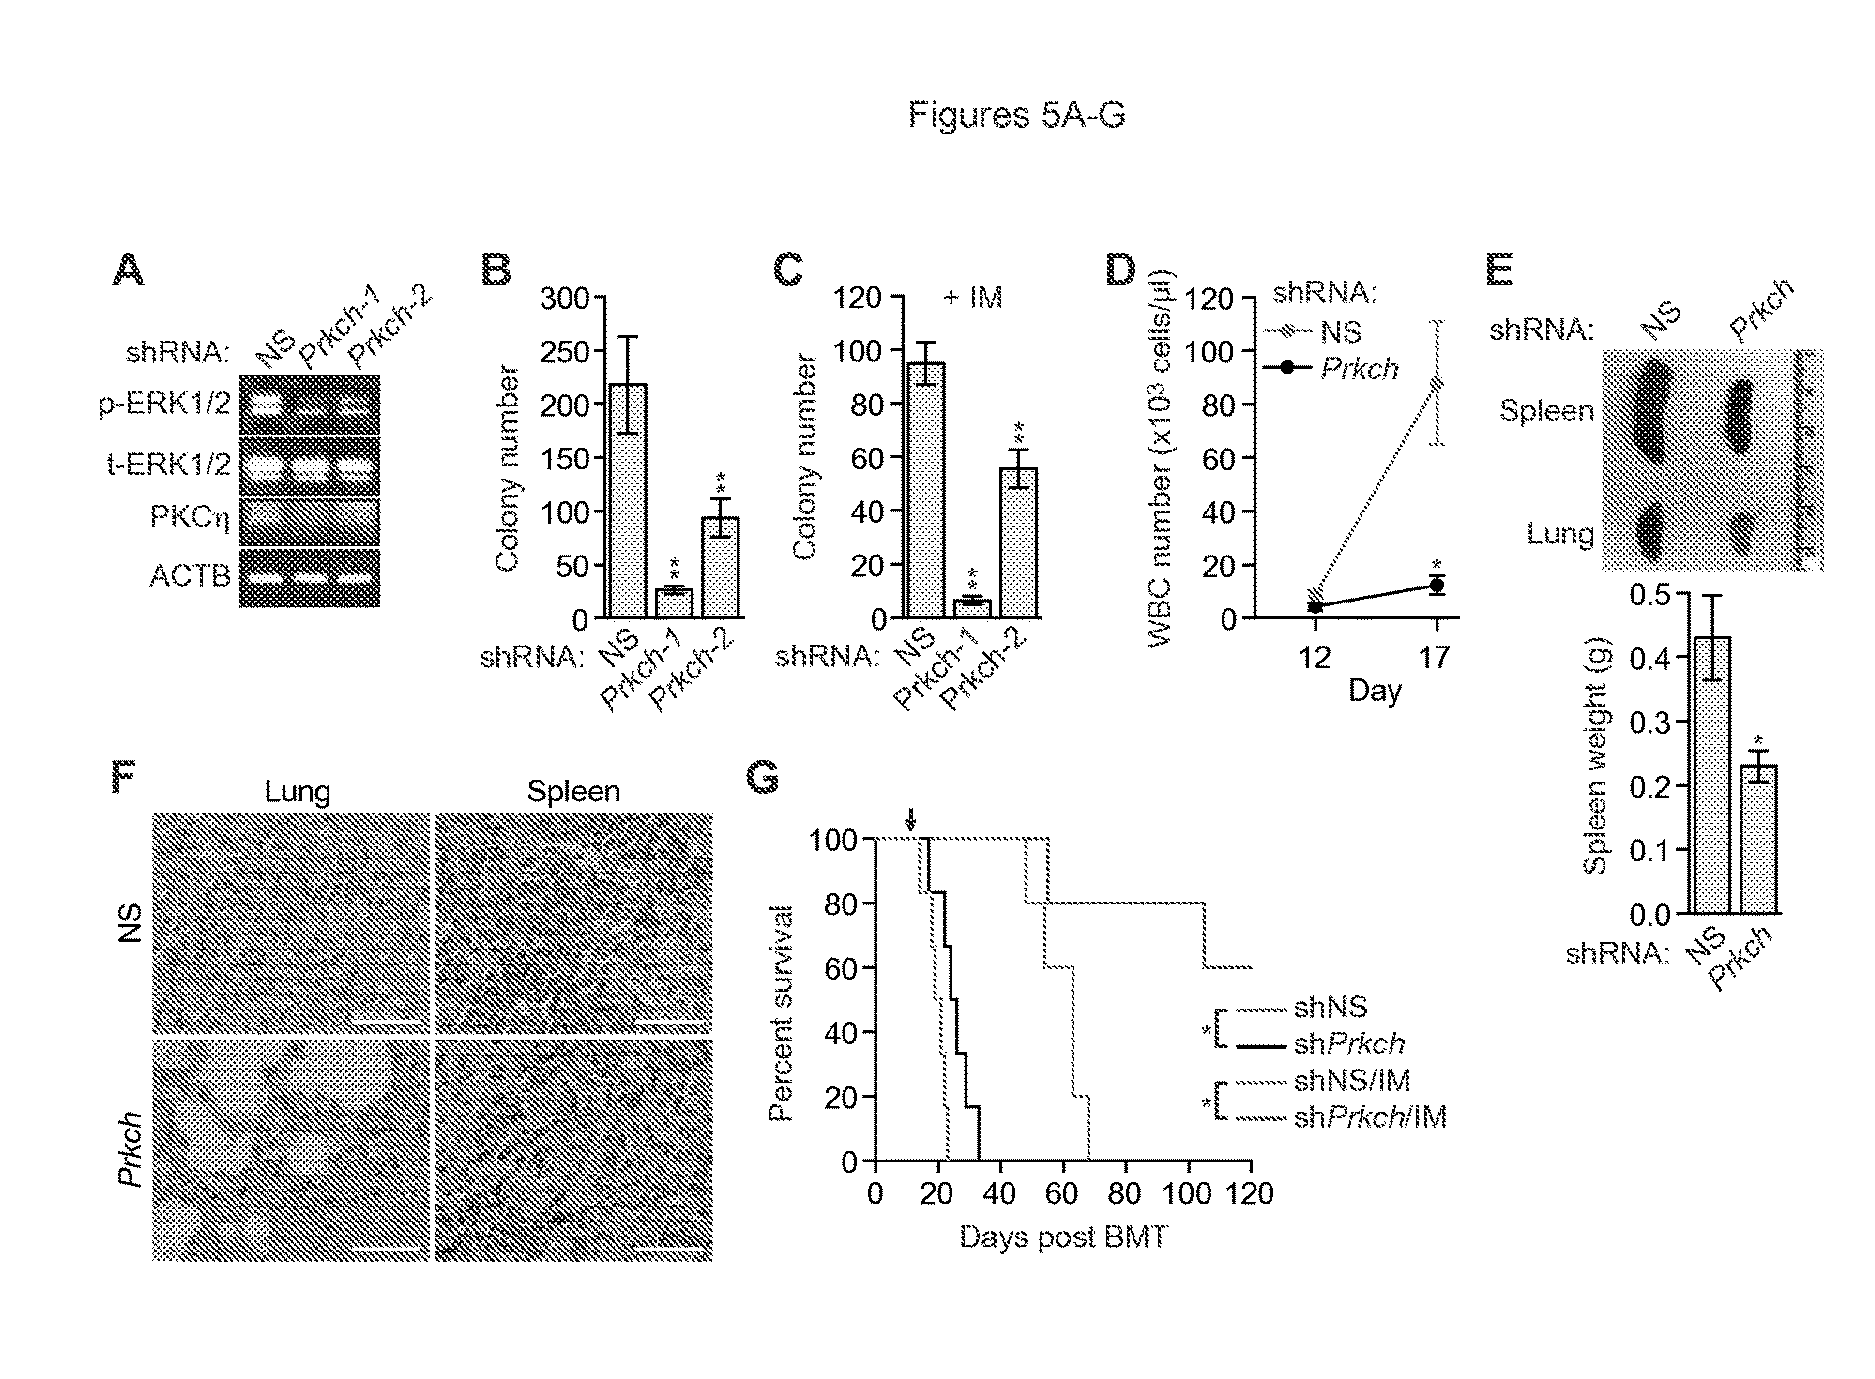
FIGS. 5A-G. PRKCH modulates proliferation of BCR-ABL+ cells, disease progression, and IM-sensitivity. (A) Immunoblot analysis monitoring p- and t-ERK1/2 levels in BCR-ABL+ mouse primary bone marrow cells expressing an NS shRNA or one of two Prkch shRNAs. (B) Colony formation assay after knockdown of Prkch in BCR-ABL+ mouse primary bone marrow cells (n=3). Data are represented as mean.+-.SD. (C) Colony formation assay monitoring survival of BCR-ABL+ mouse primary bone marrow cells expressing a NS or one of two Prkch shRNAs and treated with 0.1 .mu.M IM. Data are represented as mean.+-.SD. (D) WBC count of leukemic mice derived by transplantation of Prkch KD BCR-ABL+ mouse primary bone marrow cells (n=4 or 5). Data are represented as mean.+-.SEM. (E) (Top) Representative spleen and lung images of leukemic mice derived as described in (D). Mice were sacrificed at day 17. (Bottom) Spleen weight of mice (n=4). Data are represented as mean.+-.SEM. (F) Hematoxylin and eosin (H&E) staining of spleen and lung sections from leukemic mice derived as described in (D). Scale bars, 50 .mu.m. (G) Kaplan-Meier survival curve of untreated leukemic mice (n=6) or leukemic mice treated with IM at day 14 (indicated by the arrow) (n=5), derived as described in (D). *P.ltoreq.0.05, **P.ltoreq.0.01. Statistical tests and exact P values are provided in table 4.
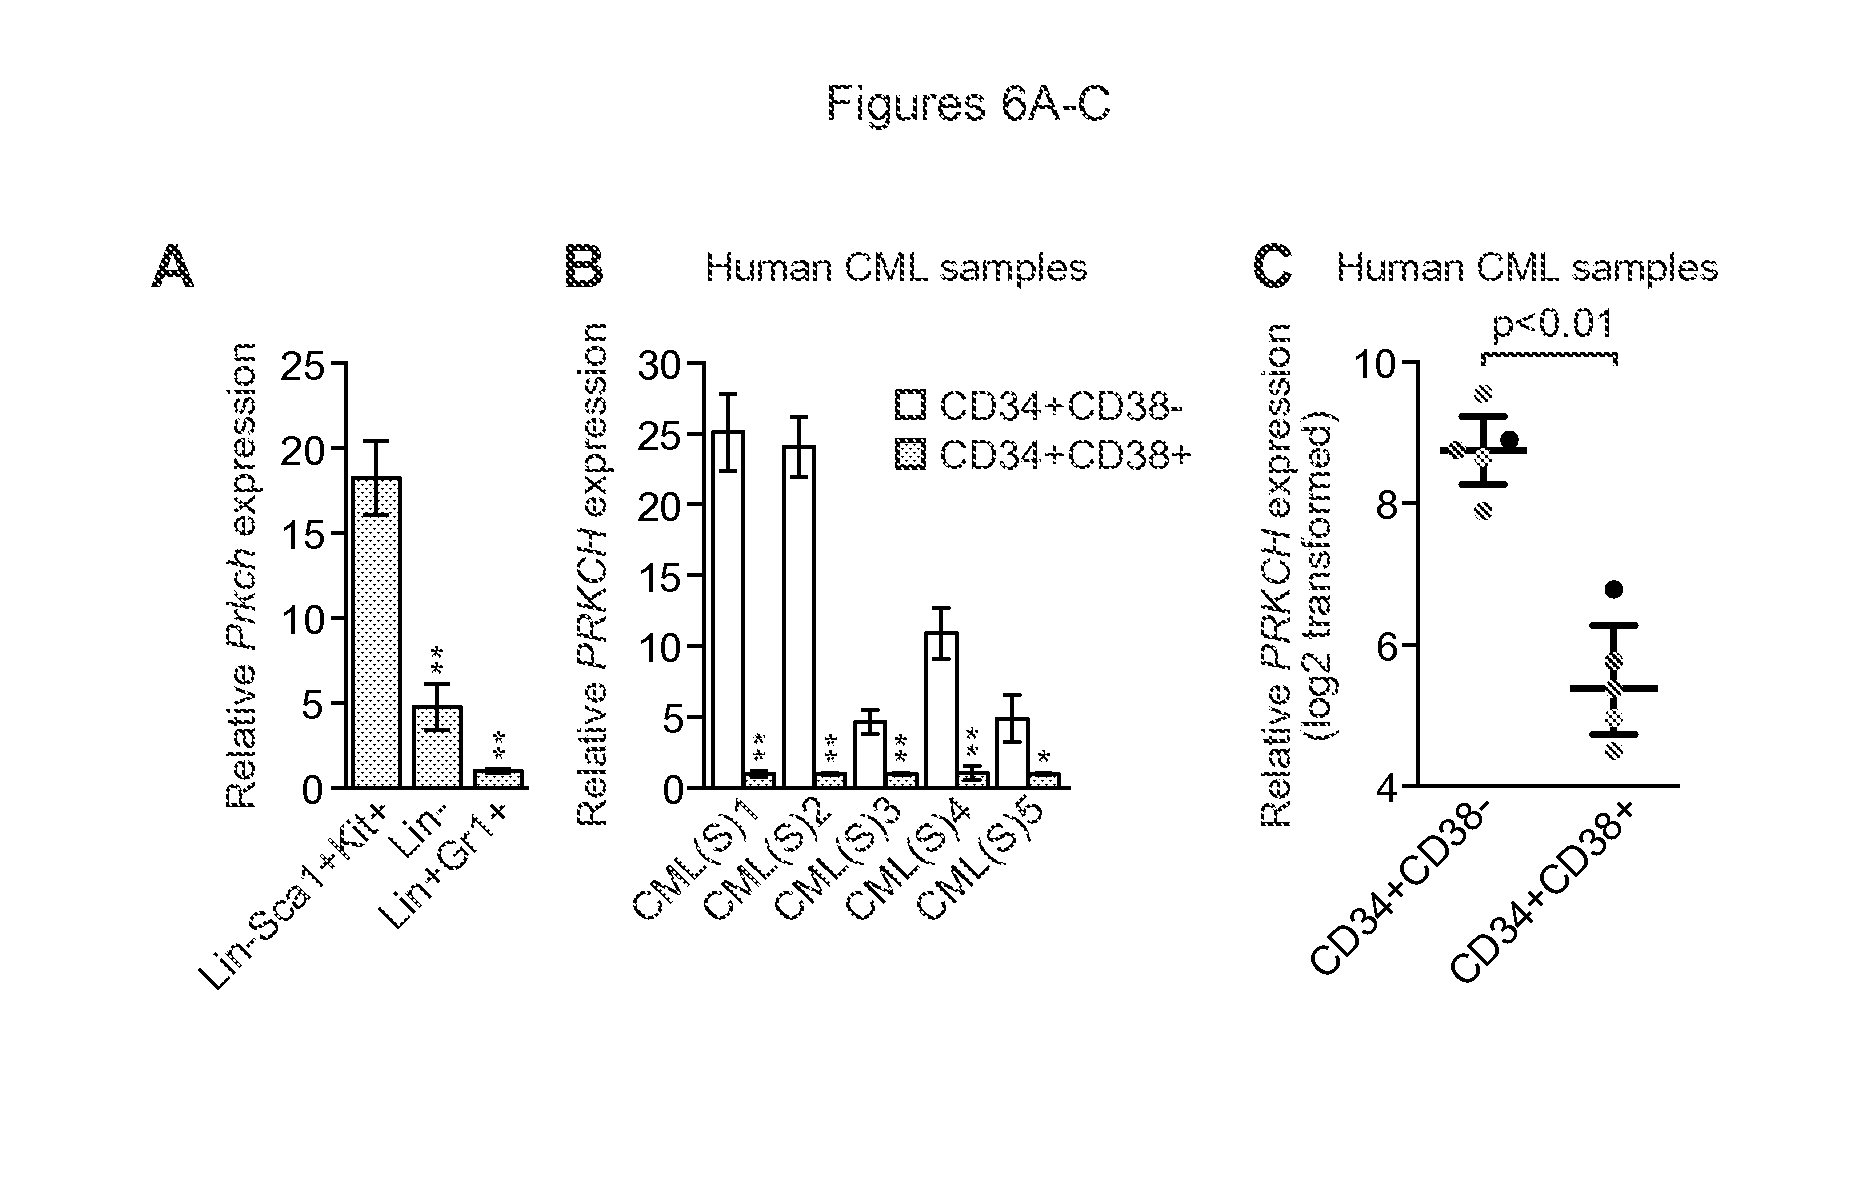
FIGS. 6A-C. IM-resistant murine and human CML stem cells contain high levels of PRKCH. (A) qRT-PCR analysis monitoring Prkch expression in BCR-ABL+ murine CML stem cells (Lin-Sca1+Kit+), progenitor cells (Lin-) and mature cells (Lin+Gr1+) (n=3). Data are represented as mean.+-.SD. (B) qRT-PCR analysis monitoring PRKCH expression in human CML stem cells (CD34+CD38-) and progenitor cells (CD34+CD38+) isolated from CML patient samples (n=5). Data are from three technical replicates and are means.+-.SD. (C) PRKCH expression in CD34+CD38- and CD34+CD38+ cells, mined from a previous expression profiling study (50). Matched samples from the same patient are indicated by dots of the same color. Error bars indicate median with interquartile range. *P.ltoreq.0.05, **P.ltoreq.0.01. Statistical tests and exact P values are provided in table 4.
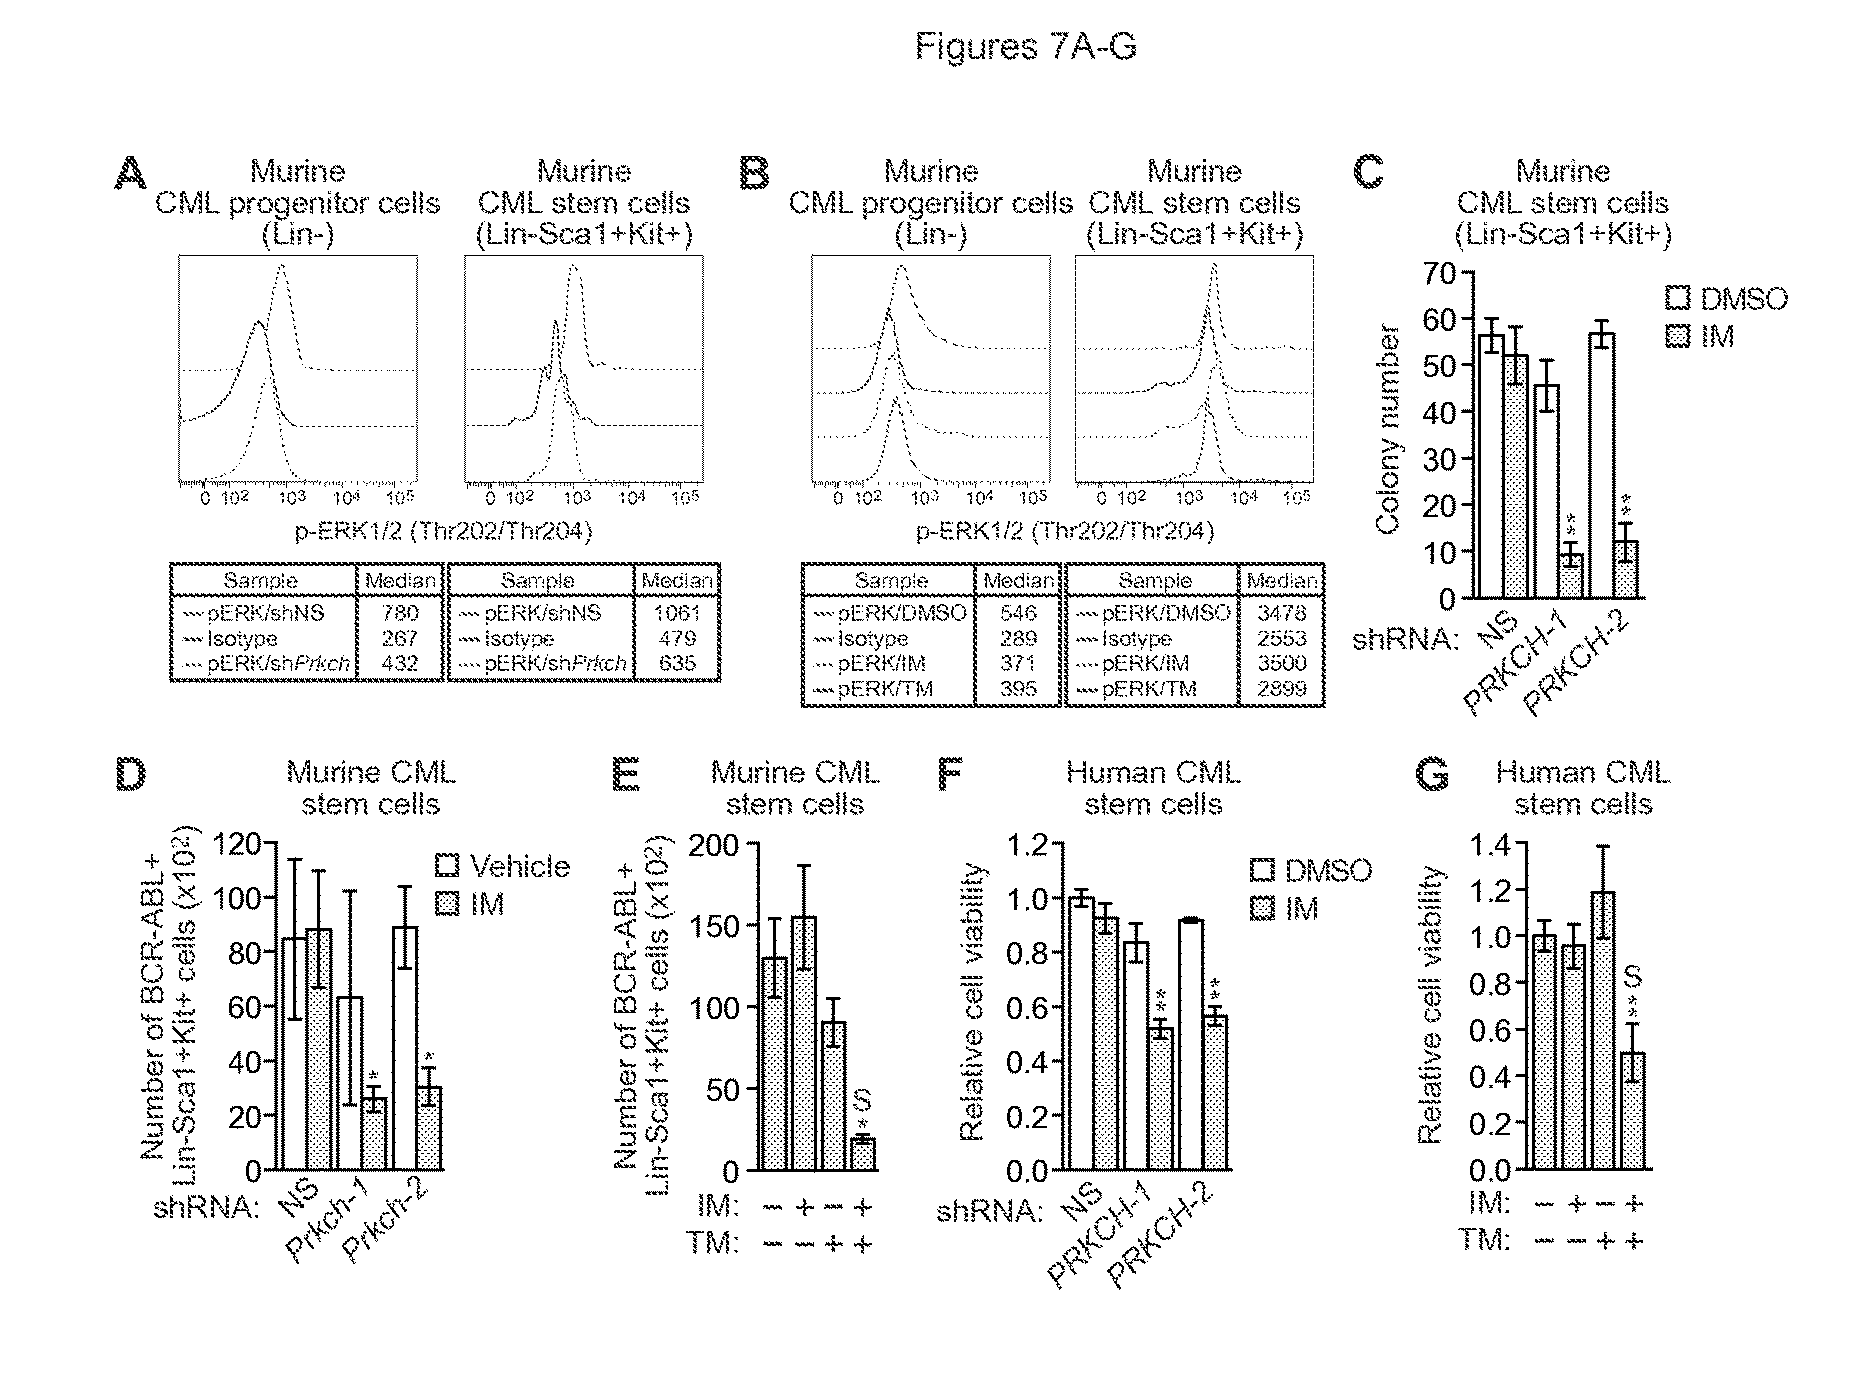
FIGS. 7A-G. High Prkch levels contribute to the IM resistance of CML stem cells. (A) Intracellular phosphorylated ERK1/2 levels in Lin- and Lin-Sca1+Kit+ BCR-ABL+ Prkch KD or control bone marrow cells. As a negative control, cells were incubated with a conjugated IgG isotype antibody. (B) Intracellular phosphorylated ERK1/2 levels in Lin- and Lin-Sca1+Kit+ BCR-ABL+ bone marrow cells treated with DMSO, IM or trametinib. (C) Colony formation assay monitoring survival of BCR-ABL+ murine stem cells expressing a NS or one of two Prkch shRNAs and treated with 0.1 .mu.M IM (n=3). Data are represented as mean.+-.SD. (D) FACS determination of the number of BCR-ABL+Lin-Sca1+Kit+ bone marrow cells expressing a NS or Prkch shRNA after IM treatment of mice (n=4 or 5). Data are represented as mean.+-.SEM. (E) FACS determination of the number of BCR-ABL+ Lin-Sca1+Kit+ bone marrow cells after treatment of mice with vehicle (n=10), IM (n=12), TM (n=10) or both IM and TM (n=12). Data are represented as mean.+-.SEM. Asterisks indicate comparisons between the combined drug treatment and single drug treatments. Combined drug treatment was synergistic (S). (F) Relative viability, as measured by trypan blue cell counting, of BCR-ABL+ human CML stem cells (CD34+CD38-) expressing a NS or Prkch shRNA and treated with DMSO or IM (n=3). Data are represented as mean.+-.SEM. (G) Relative viability of BCR-ABL+ human CML stem cells treated with DMSO, IM, TM or a combination of drugs (n=3). Data are represented as mean.+-.SEM. *P.ltoreq.0.05, **P.ltoreq.0.01. Statistical tests and exact P values are provided in table 4.
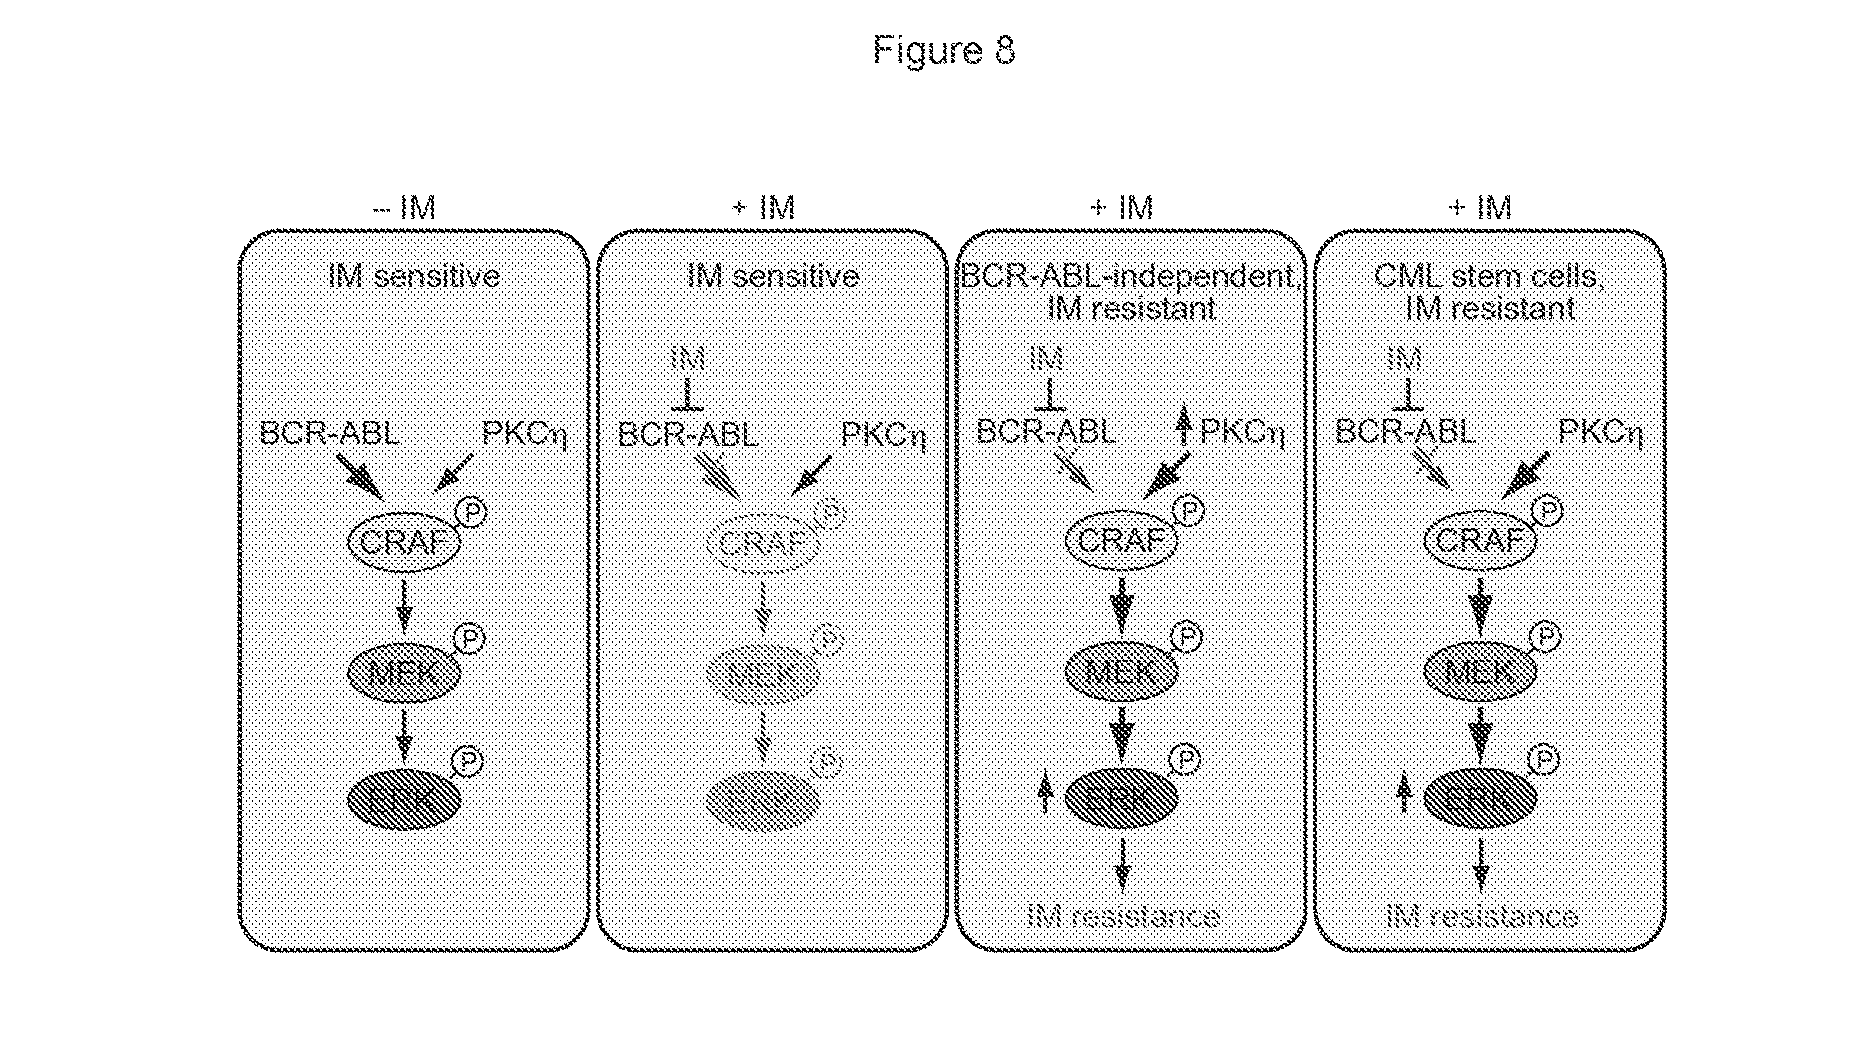
FIG. 8. Elevated PKC.eta. levels lead to IM resistance in CML and CML stem cells. Relative contributions of BCR-ABL and PKC.eta. to RAF/MEK/ERK signaling are indicated by arrow size and shading.
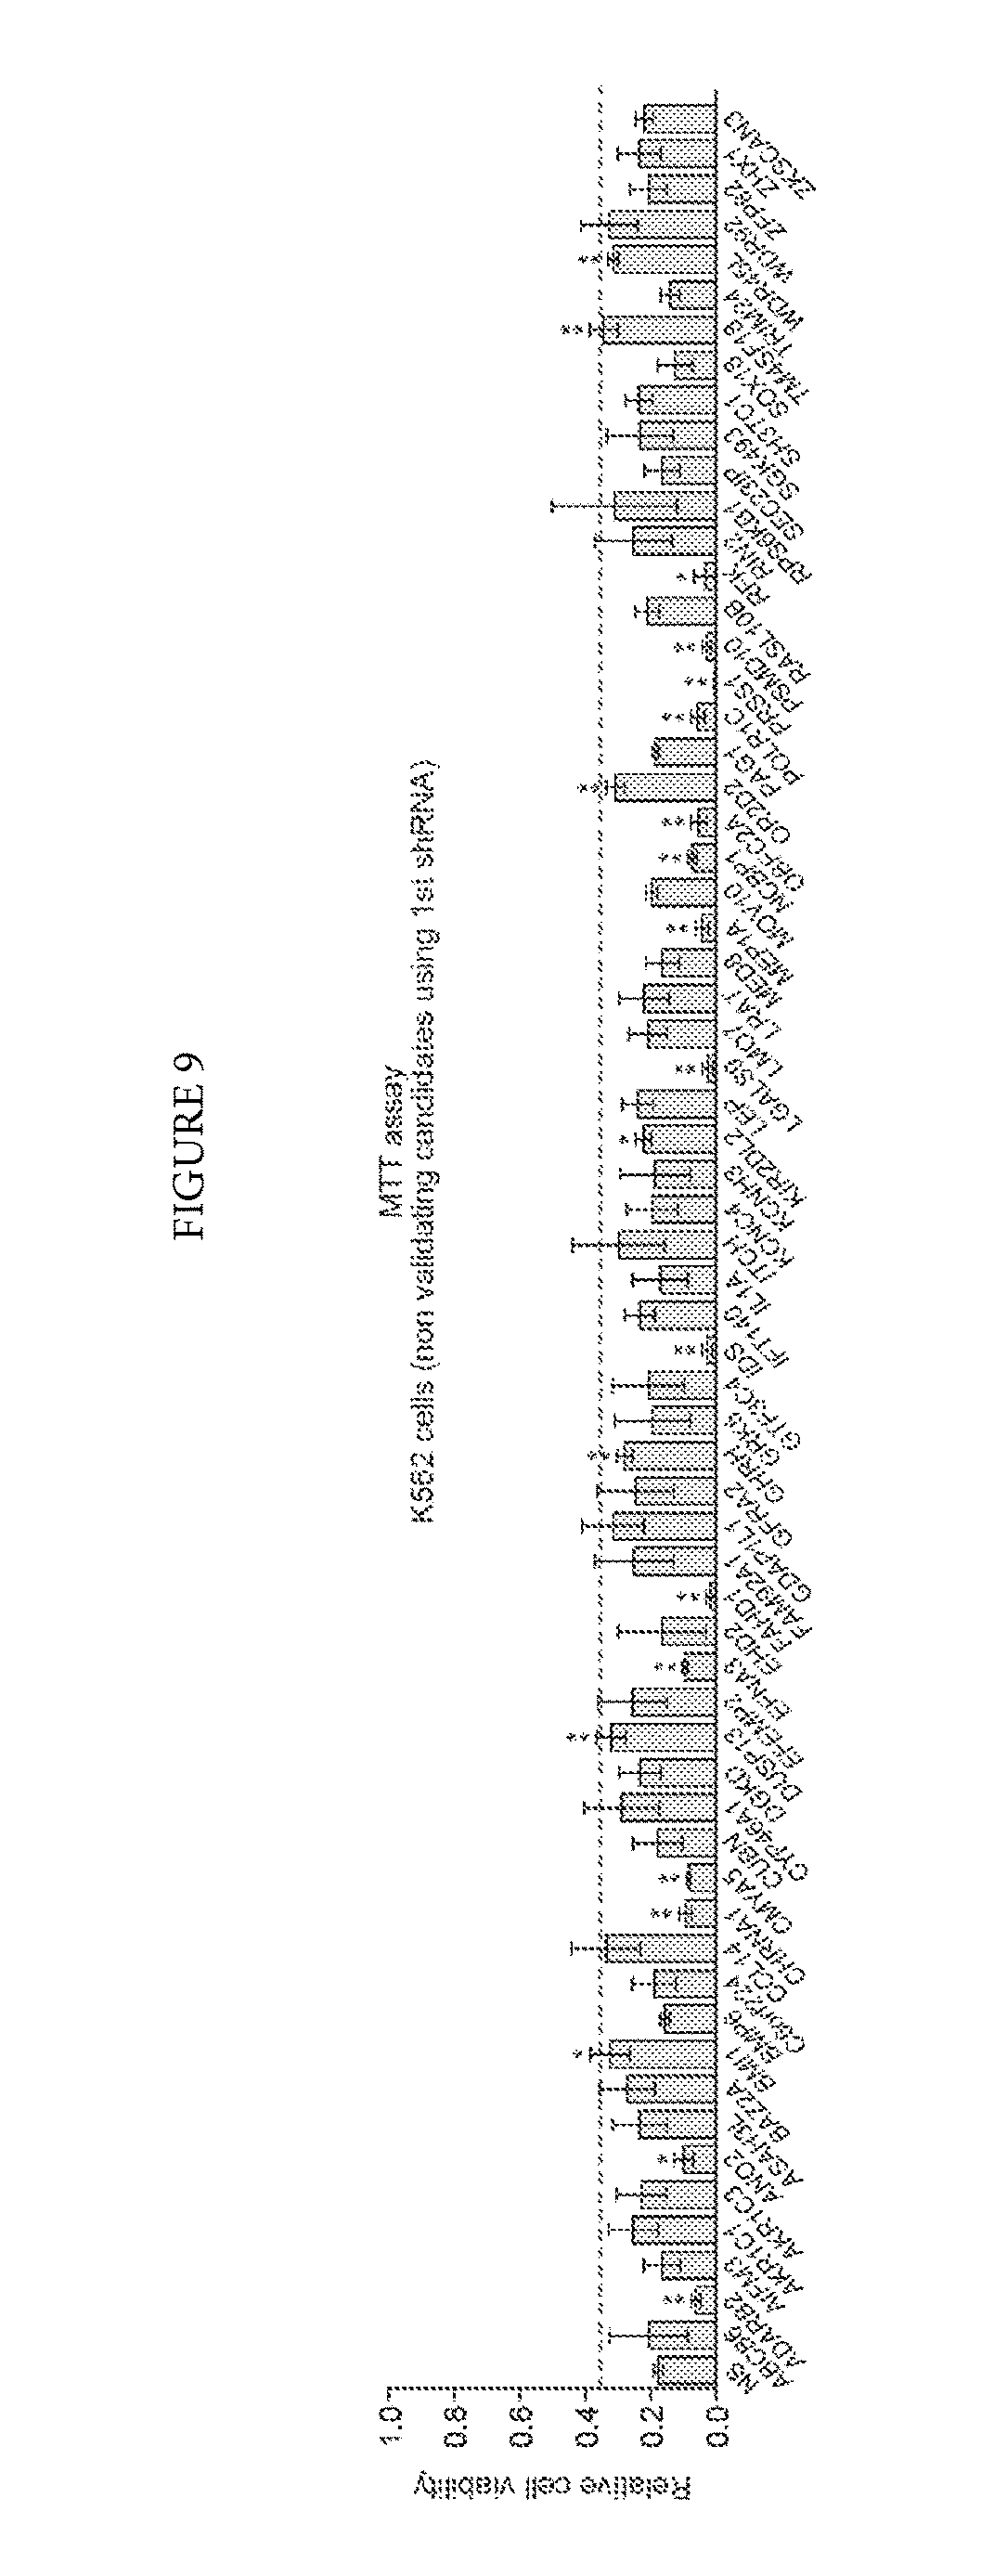
FIG. 9. IM sensitivity of non-validating candidates isolated from the primary shRNA screen. MTT assay showing relative viability of IMSG KD K562 cells in the presence of IM. The results were normalized to that obtained with DMSO-treated cells, which was set to 1. The red line indicates a 2-fold increase in cell survival relative to that of the non-silencing (NS) control shRNA; none of the shRNAs shown here were considered positive. The NS control is the same as that used in FIG. 1B. Data are represented as mean.+-.SD (n=4). *P.ltoreq.0.05, **P.ltoreq.0.01. Statistical tests and exact P values are provided in table 4.
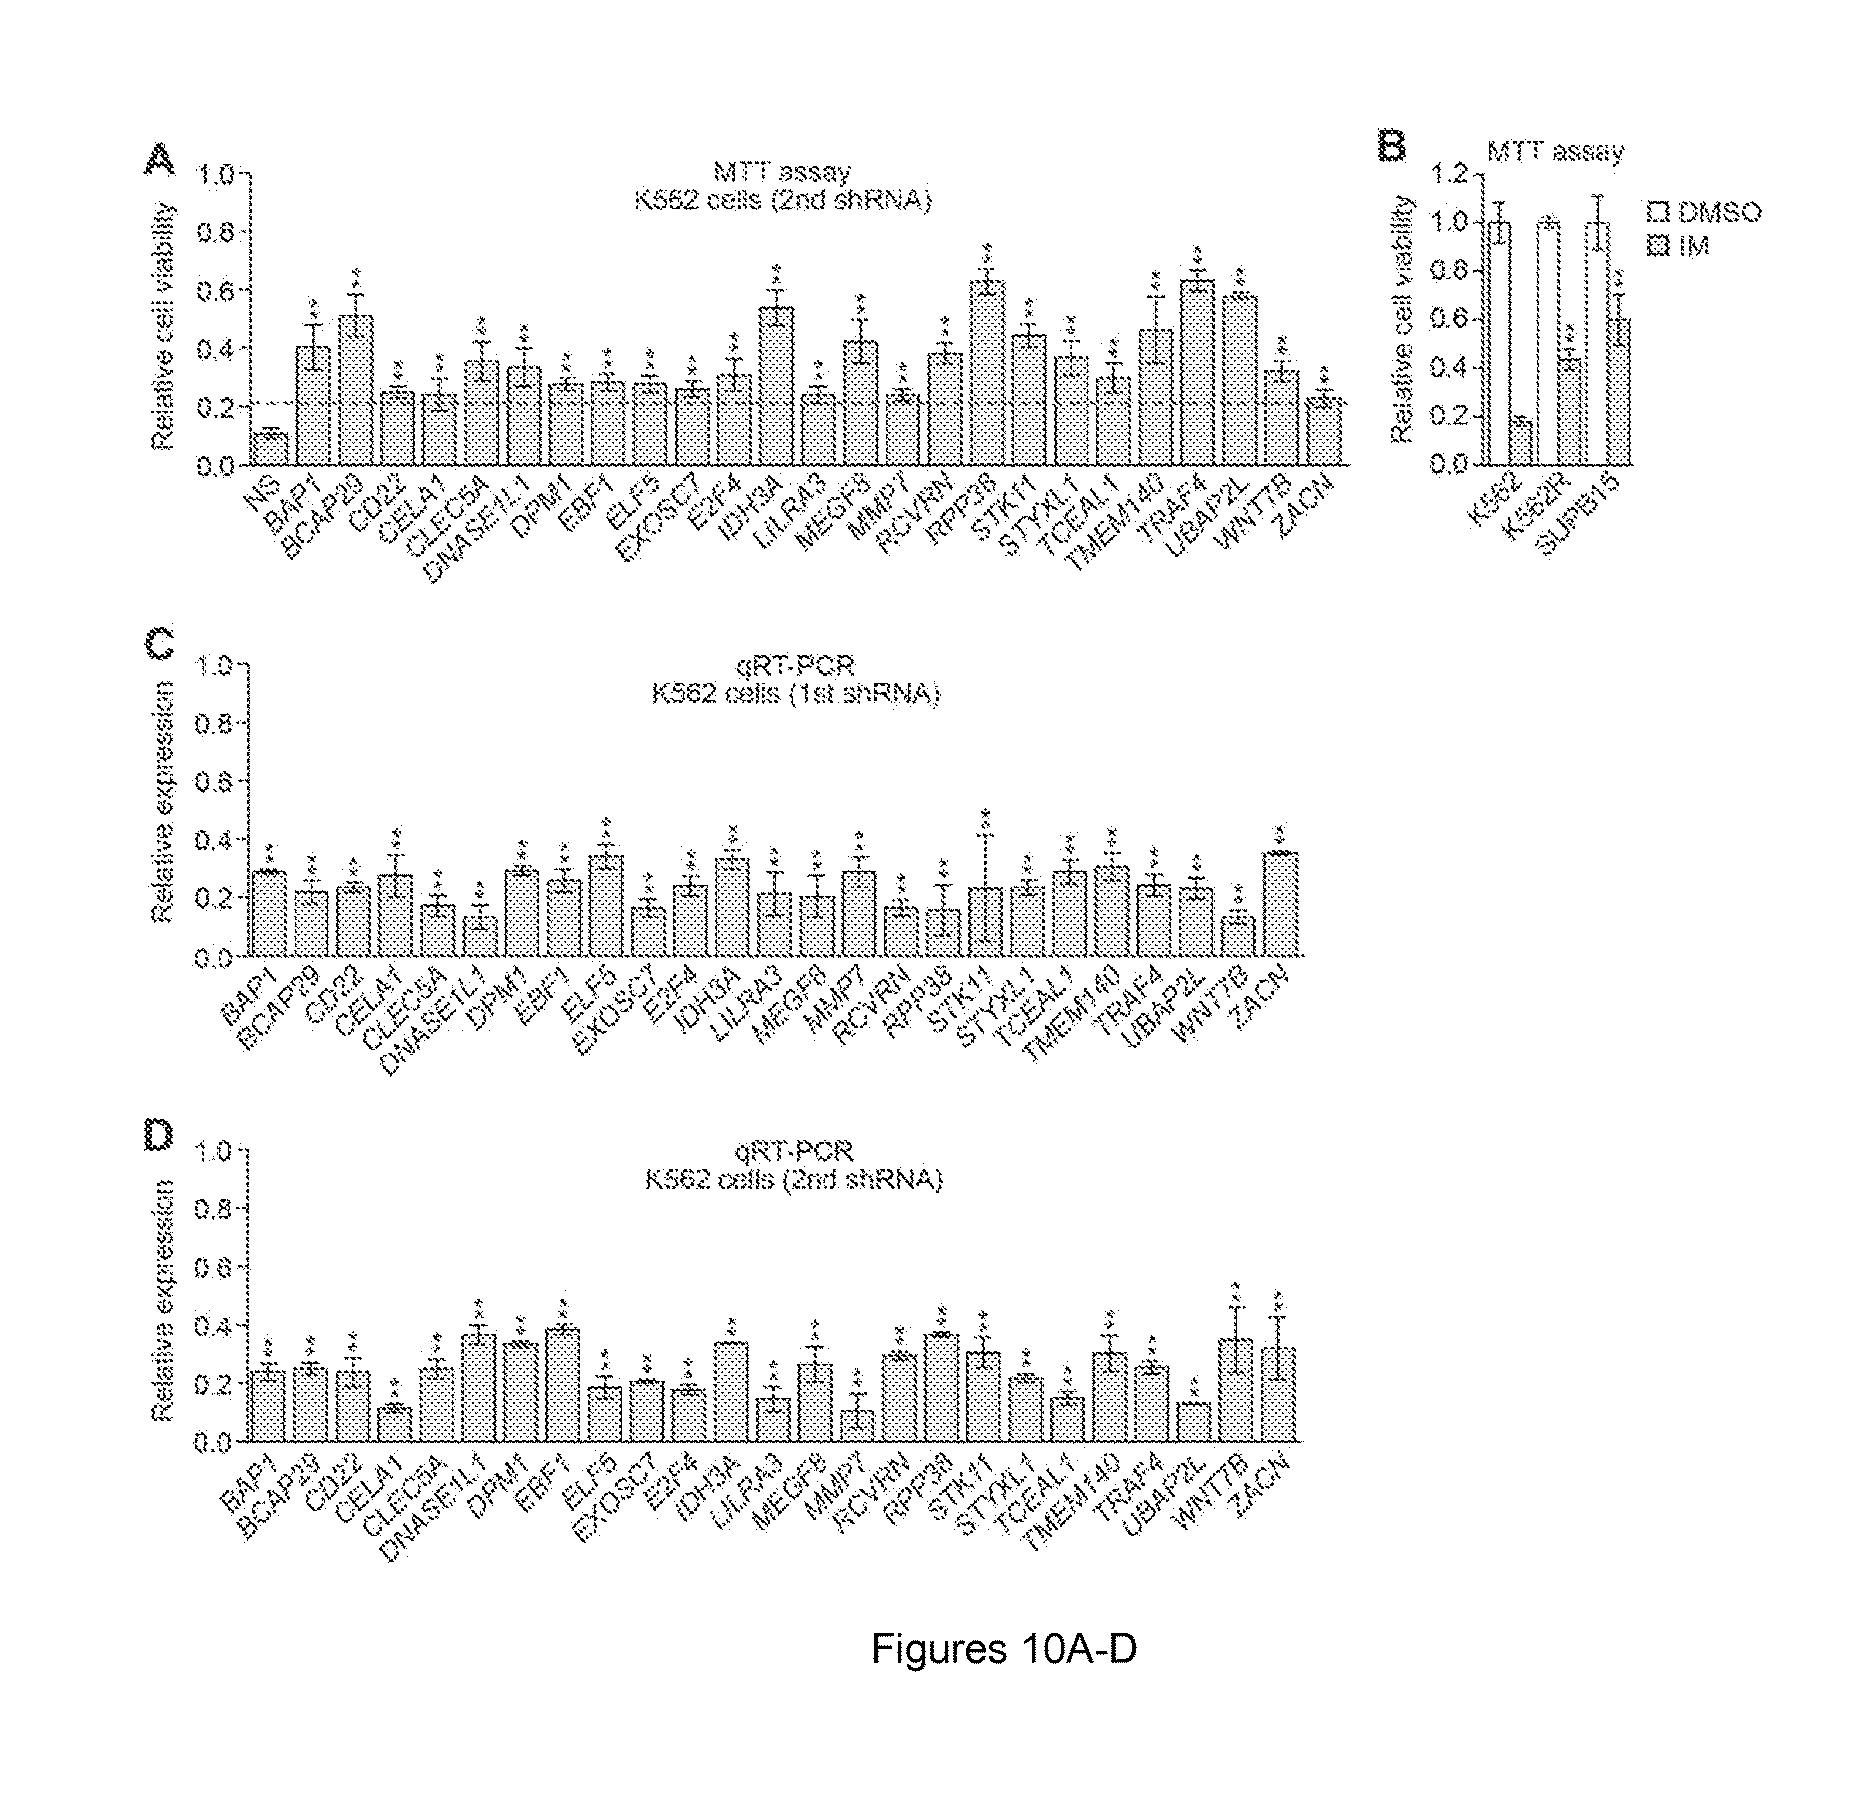
FIGS. 10A-D. Confirmation of validating candidates using a second shRNA. (A) MTT assay showing relative viability of IM-treated K562 cells expressing a second IMSG shRNA unrelated to that isolated in the primary screen and used in FIG. 1B (n=4). The results were normalized as described in FIG. 1B. IMSG shRNAs that conferred >2-fold increase in cell survival (indicated by the red line) relative to that of the NS control shRNA were considered positive. (B) MTT assay showing relative viability of IM-sensitive K562 cells, experimentally-derived IM-resistant K562R cells, and IM-resistant patient-derived SUPB15 cells treated with 10 .mu.M IM (n=4). The results were normalized to that obtained with DMSO-treated cells, which was set to 1. (C and D) qRT-PCR analysis monitoring knockdown efficiencies, in K562 cells, of IMSG shRNAs isolated from the primary screen (B; n=3) or a second, unrelated IMSG shRNA (C; n=3). Data are represented as mean.+-.SD. *P.ltoreq.0.05, **P.ltoreq.0.01. Statistical tests and exact P values are provided in table 4.
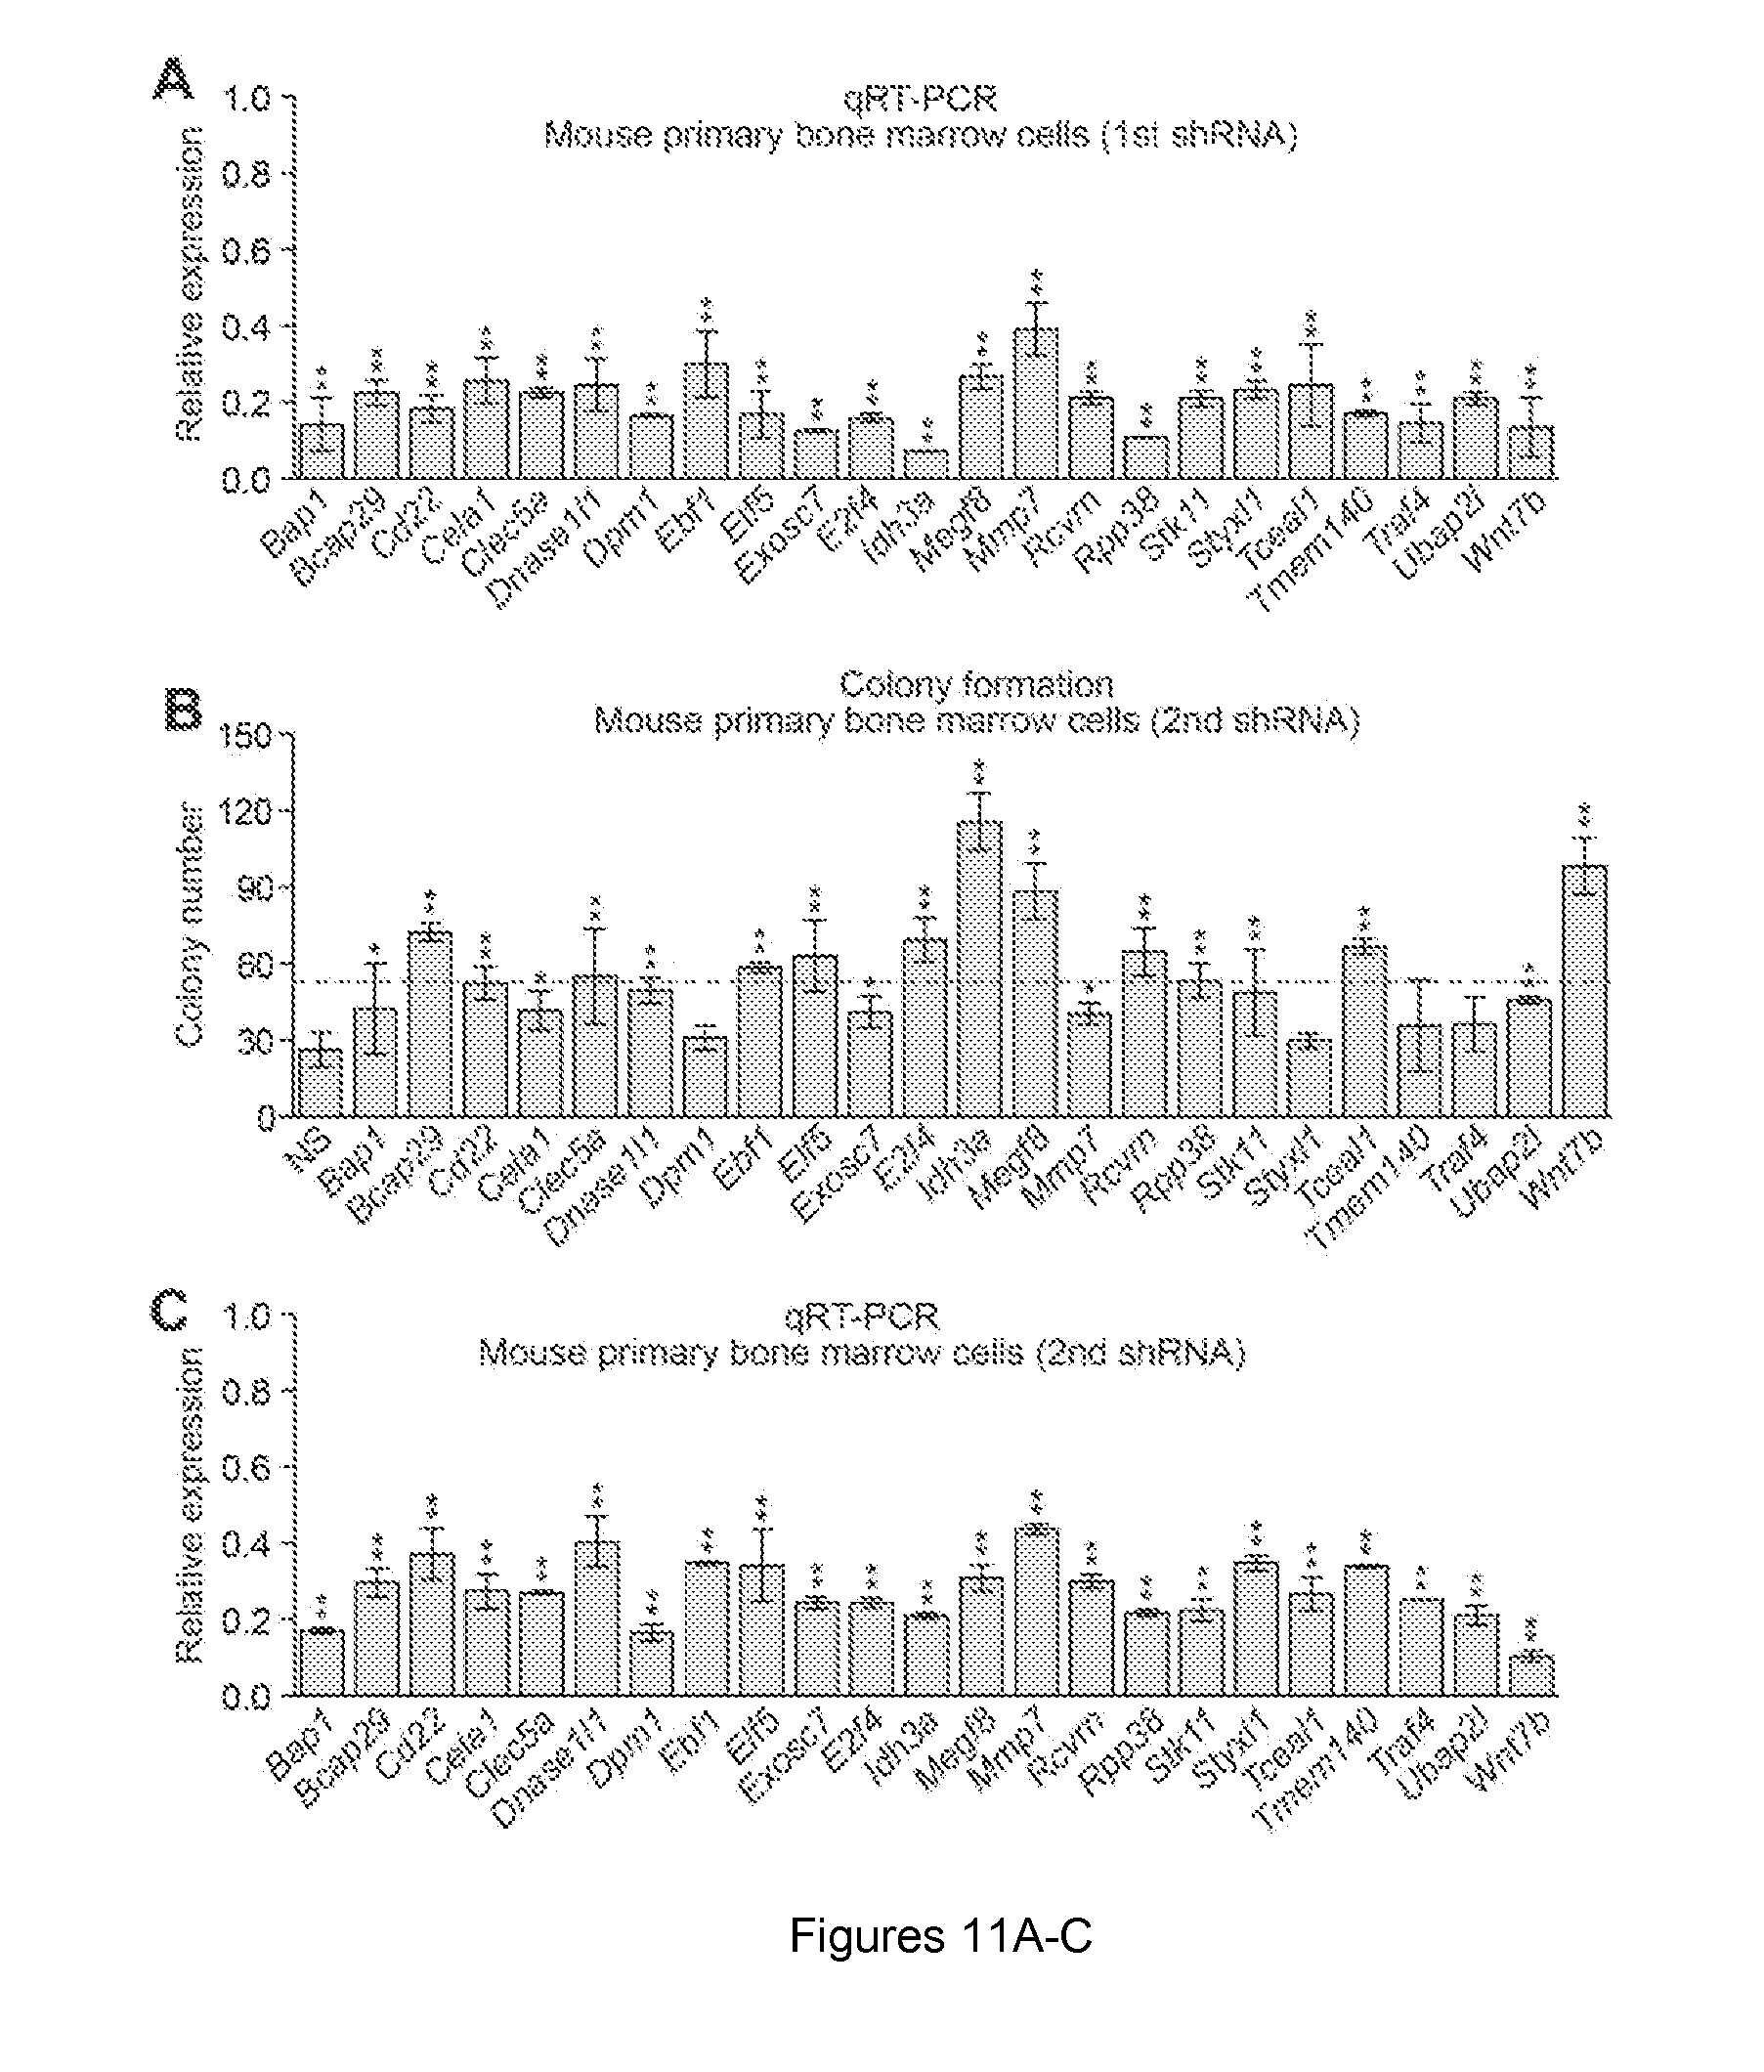
FIGS. 11A-C. IM sensitivity following candidate IMSG knockdown in mouse primary bone marrow cells. (A) qRT-PCR analysis monitoring knockdown efficiencies of mouse IMSG shRNAs in mouse primary bone marrow cells (n=3). (B) Colony formation assay monitoring survival of BCR-ABL+ mouse primary bone marrow cells expressing an IMSG shRNA in the presence of IM (n=3). IMSG shRNAs that conferred >2-fold increase in colony formation relative to that of the NS control shRNA (indicated by the red line) were considered positive. (C) qRT-PCR analysis monitoring knockdown efficiencies, in mouse primary bone marrow cells, of a second set of mouse IMSG shRNAs unrelated to those used in (A) but the same as those used in (B) (n=3). Data are represented as mean.+-.SD. *P.ltoreq.0.05, **P.ltoreq.0.01. Statistical tests and exact P values are provided in table 4.
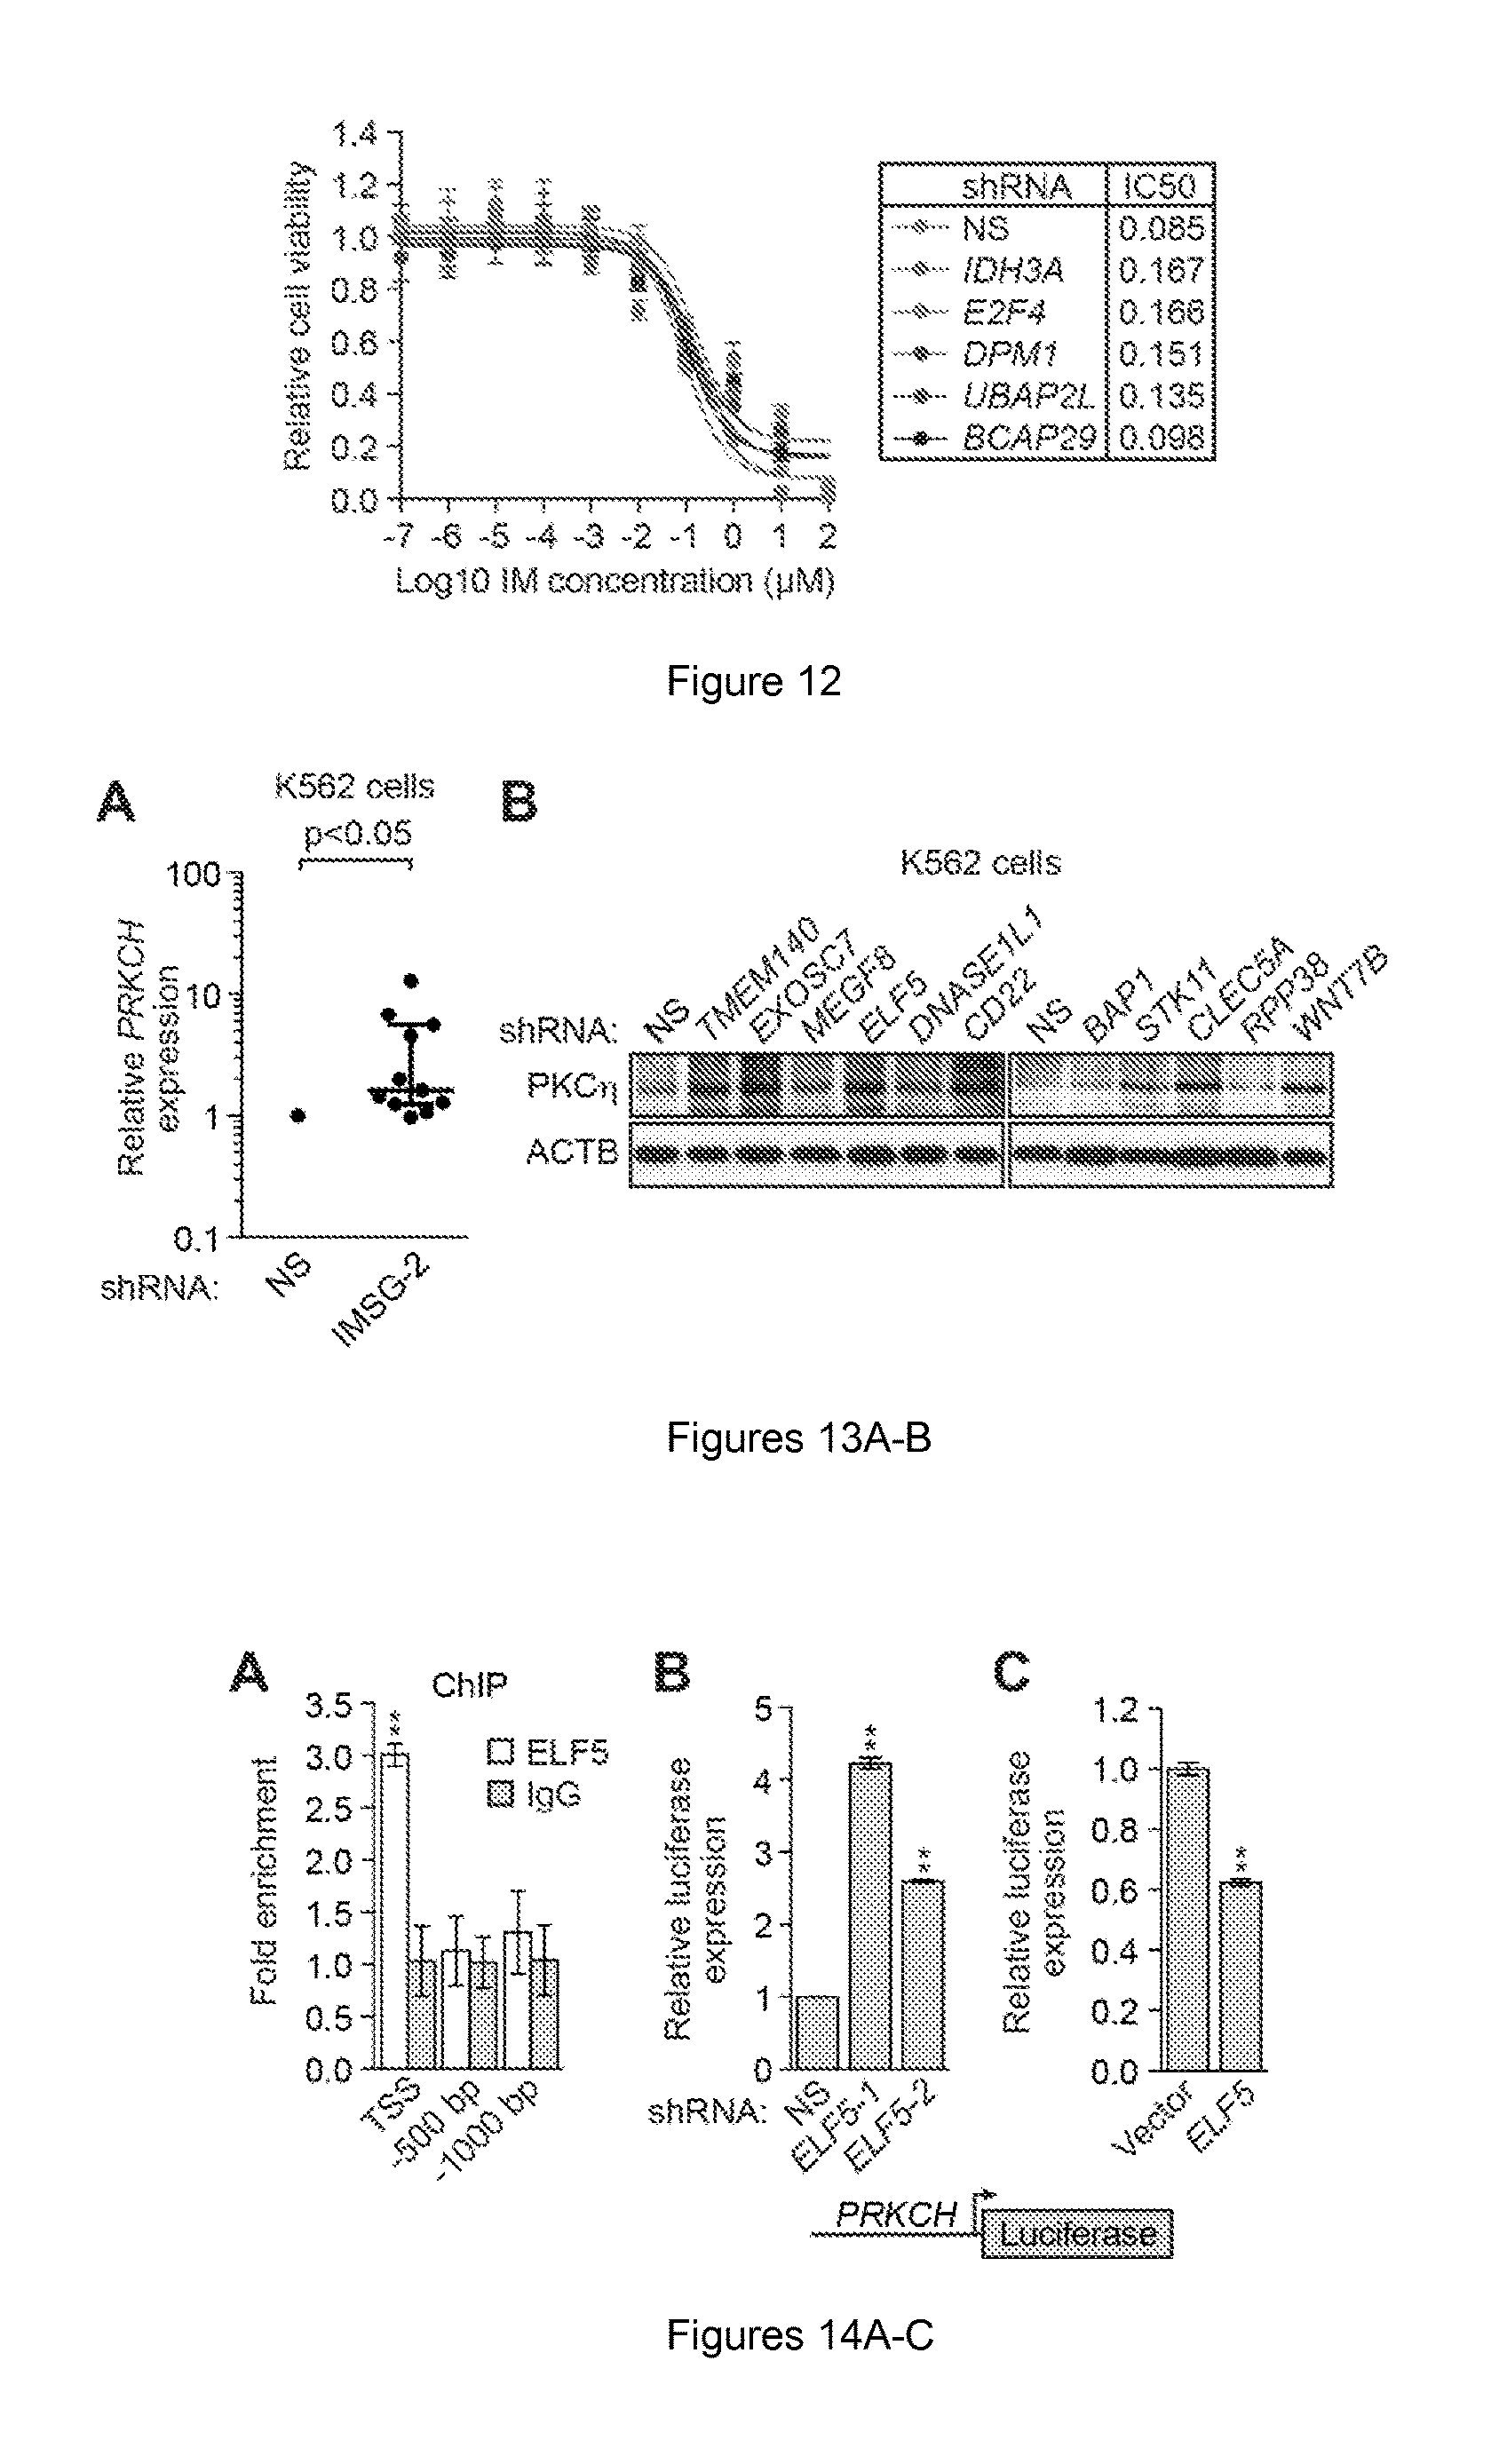
FIG. 12. Relative IC50IM of candidate IMSG KD K562 cells. The NS control used here is the same as that used in FIG. 1E, which was derived from the same experiment. Data are represented as mean.+-.SD (n=4).
FIGS. 13A-B. Confirmation that IMSG knockdown in K562 cells increases PRKCH and PKC.eta. levels. (A) qRT-PCR analysis monitoring expression of PRKCH in K562 cells expressing a second shRNA targeting each IMSG, unrelated to that used in FIG. 3A. The results were normalized to that obtained with the NS control shRNA, which was set to 1. The scatter dot plot shows the median line with interquartile range. Statistical tests and exact P values are provided in table 4. (B) Immunoblot analysis showing the level of PKC.eta. in IMSG KD K562 cells. beta-actin (ACTB) was monitored as a loading control.
FIGS. 14A-C. Demonstration that ELF5 is a direct transcriptional repressor of PRKCH. (A) Chromatin immunoprecipitation assay monitoring binding of ELF5 to the PRKCH promoter at the transcription start site (TSS) and at 500 and 1000 bp upstream of the TSS (n=3). The results were normalized to that obtained with an IgG control antibody, which was set to 1. (B and C) Expression of a luciferase reporter driven by the PRKCH promoter in K562 cells expressing a NS shRNA or one of two unrelated ELF5 shRNAs (B; n=3) or in K562 cells ectopically expressing ELF5 or, as a control, empty vector (C; n=3). Shown are firefly luciferase activities normalized to that of Renilla luciferase. Data are represented as mean.+-.SD. *P.ltoreq.0.05, **P.ltoreq.0.01. Statistical tests and exact P values are provided in table 4.
FIGS. 15A-B. Confirmation of elevated PKC.eta. levels in K562/PRKCH cells, and role of PRKCH in IM resistance. (A) Immunoblot analysis showing the levels of PKC.eta. and phosphorylated and total ERK1/2 (p-ERK1/2 and t-ERK1/2, respectively) in K562 cells expressing empty vector and in two independently derived K562 clonal cell lines ectopically expressing PRKCH. (B) MTT assay measuring relative viability of representative IMSG KD K562 cell lines expressing a NS or PRKCH shRNA, and treated in the presence or absence of IM. Data are represented as mean.+-.SD (n=4). Asterisks indicate comparisons between the two IM-treated samples. *P.ltoreq.0.05, **P.ltoreq.0.01. Statistical tests and exact P values are provided in table 4.
FIGS. 16A-B. Confirmation that PKC.eta. functions through CRAF to increase RAF/MEK/ERK signaling. (A) Immunoblot analysis showing RAF/MEK/ERK activity (as measured by p- and t-MEK and p- and t-ERK1/2) in K562 cells expressing a second PRKCH shRNA unrelated to that used in FIG. 3F. The level of PKC.eta. was monitored as a control. .beta.-actin (ACTB) was monitored as a loading control. (B) Immunoblot analysis showing p- and t-ERK1/2 levels in K562/PRKCH-1 cells, treated in the absence or presence of IM, expressing a second ARAF, BRAF or CRAF shRNA unrelated to that used in FIG. 3G. The levels of total (t-) ARAF, BRAF and CRAF, and PKC.eta. were monitored as controls. ACTB was monitored as a loading control.
FIGS. 17A-B. Comparison of combined treatment with IM and trametinib to IM and a JAK-STAT or PI3K inhibitor. (A) Cell viability, as measured by trypan blue cell counting, of primary leukemic cells from BCR-ABL-independent IM-resistant CML patients (n=6) treated with DMSO. 5 .mu.M IM, 5 .mu.M TM or a combination of the two drugs. The results were normalized to that observed with DMSO, which was set to 1. Data are represented as mean.+-.SD. The data are the same as those shown in FIG. 4D, but plotted to show the results for each individual patient sample. Asterisks indicate comparisons between the combined drug treatment and single drug treatments. Combined drug treatment was synergistic (S) or additive (A). (B) Relative viability, as measured by trypan blue cell counting, of primary leukemic cells isolated from IM-sensitive CML patients and treated with 5 .mu.M IM (n=3), or isolated from BCR-ABL-independent IM-resistant CML patients and treated with 5 .mu.M IM, 5 .mu.M TM or a combination (n=6), or treated with 0.5 .mu.M TG101348 (TG, a JAK-STAT inhibitor) or 10 nM rapamycin (Rapa, a PI3K inhibitor) alone or in combination with 5 .mu.M IM (n=4). The results were normalized to those obtained by DMSO treatment of the same samples, which was set to 1. Error bars indicate median with interquartile range. Matched samples from the same patient are indicated by dots of the same color. Samples IM-SR/DMSO, IM-S/IM, IM-R/IM and IM-R/IM+TM are the same as those in FIG. 4D and are shown to facilitate comparison. The results presented here and in FIG. 4D were derived from a single experiment. For statistical significance, only comparisons between double treatments and IM alone were made. Statistical tests and exact P values are provided in table 4.
FIGS. 18A-D. Effectiveness of retroviruses co-expressing BCR-ABL and either PRKCH or an Elf5 or Clec5a shRNA. (A) Immunoblot analysis monitoring levels of PKC.eta. and BCR-ABL in NIH 3T3 cells transduced with a retrovirus expressing BCR-ABL or one co-expressing BCR-ABL and murine Prkch. The percentage of GFP+ cells obtained was similar using both retroviruses, demonstrating equivalent virus titers. The same virus titers were used for transduction of primary mouse bone marrow cells. (B) qRT-PCR analysis monitoring knockdown efficiencies in 32D/BCR-ABL cells of one of two unrelated Elf5 (left) or Clec5a (right) shRNAs. Data are represented as mean.+-.SD (n=3). *P.ltoreq.0.05, **P.ltoreq.0.01. (C) Immunoblot analysis monitoring levels of PKC.eta. and phosphorylated and total ERK1/2 (p-ERK1/2 and t-ERK1/2, respectively) in 32D/BCR-ABL cells expressing an NS, Elf5 or Clec5a shRNA. (D) qRT-PCR analysis monitoring knockdown efficiencies of Elf5 (left) and Clec5a (right) in mouse primary bone marrow cells transduced with a retrovirus co-expressing BCR-ABL and either an Elf5 or Clec5a shRNA. The most effective Elf5 shRNA (Elf5-1) and Clec5a shRNA (Clec5a-1), as determined by the results in (B), were used here and in FIGS. 4 F and H. Data are represented as mean.+-.SD (n=3). *P.ltoreq.0.05, **P.ltoreq.0.01. Statistical tests and exact P values are provided in table 4.
FIGS. 19A-B. Knockdown of PRKCH in BCR-ABL+ cells decreases colony formation. (A) qRT-PCR analysis monitoring knockdown efficiency of Prkch in mouse primary bone marrow cells expressing one of two unrelated Prkch shRNAs. The results were normalized to that obtained with a NS control, which was set to 1. Data are represented as mean.+-.SD (n=3). *P.ltoreq.0.05, **P.ltoreq.0.01. Statistical tests and exact P values are provided in table 4. (B) Micrograph showing typical colonies of BCR-ABL+ mouse primary bone marrow cells expressing a NS shRNA or one of two unrelated Prkch shRNAs. Scale bar, 100 .mu.m.
FIG. 20. Confirmation of IM sensitivity of murine CML progenitor cells. Colony formation assay monitoring survival of BCR-ABL+ murine progenitor cells (Lin-Sca1+Kit+-depleted Lin- cells) expressing a NS shRNA and treated with DMSO or 0.1 .mu.M IM (n=3). Data are represented as mean.+-.SD. As a comparison, see FIG. 7C, which shows the results of a similar analysis of IM-resistant murine CML stem cells. *P.ltoreq.0.05, **P.ltoreq.0.01. Statistical tests and exact P values are provided in table 4.
FIGS. 21A-B. Analysis of phosphorylated-ERK1/2 levels in CML progenitor and stem cells. (A) Intracellular phosphorylated ERK1/2 levels in Lin- and Lin-Sca1+Kit+ BCR-ABL+ Prkch KD or control bone marrow cells (n=3). The results were background corrected and then normalized to that obtained with the NS control shRNA, which was set to 1. Data are represented as mean.+-.SEM. (B) Intracellular phosphorylated-ERK1/2 levels in Lin- and Lin-Sca1+Kit+ BCR-ABL+ bone marrow cells treated with DMSO, IM or trametinib. (n=4). The results were background corrected and then normalized to that obtained with DMSO, which was set to 1. Data are represented as mean.+-.SEM. *P.ltoreq.0.05, **P.ltoreq.0.01. Statistical tests and exact P values are provided in table 4. These results accompany the representative experiment shown in FIGS. 7, A and B.
FIGS. 22A-D. Synergistic induction of apoptosis in murine CML stem cells by IM and trametinib. (A) Apoptosis assay. CML mice (n=5) were orally gavaged with vehicle or IM. BCR-ABL+ bone marrow cells were stained with a Lin/Sca1/Kit antibody cocktail, then with Annexin V and 7-AAD followed by FACS. Data are represented as mean.+-.SEM. (B) FACS analysis showing representative Annexin V/7-AAD staining of murine CML stem cells expressing a NS shRNA or one of two unrelated Prkch shRNAs isolated from mice treated with vehicle or IM. These data provided the basis for the bar graph in (A). (C) Apoptosis assay. Mice were orally gavaged with vehicle (n=6), IM (n=6), TM (n=5) or both (n=5). BCR-ABL+ bone marrow cells were stained as described in (A). Data are represented as mean.+-.SEM. (D) FACS analysis showing representative Annexin V/7-AAD staining of murine CML stem cells isolated from mice treated with vehicle, IM, TM or a combination of IM and TM. These data provided the basis for the bar graph in (C). *P.ltoreq.0.05, **P.ltoreq.0.01. Statistical tests and exact P values are provided in table 4.
FIGS. 23A-B. Effect of IM and trametinib on normal hematopoietic stem cells. (A) FACS determination of the percentage of normal (BCR-ABL-) murine Lin-Sca1+Kit+ bone marrow cells after treatment with vehicle (n=21), IM (n=21), TM (n=9) or both IM and TM (n=9). Data are represented as mean.+-.SEM. (B) Relative viability, as measured by trypan blue cell counting, of normal human hematopoietic CD34+ cells and hematopoietic stem cells (CD34+CD38-) treated with DMSO, IM, TM or a combination of drugs (n=4). The results were normalized to that obtained in cells treated with DMSO, which was set to 1. Data are represented as mean.+-.SD. *P.ltoreq.0.05, **P.ltoreq.0.01. Statistical tests and exact P values are provided in table 4.
DETAILED DESCRIPTION
CML, like several other malignancies, is propagated by a small population of stem cells, elimination of which is likely required to achieve long-term remission and cure (14, 15). An important limitation of IM treatment is that although IM inhibits BCR-ABL activity in CML stem cells, these cells do not depend on BCR-ABL activity for survival and are thus not eliminated (16, 17). These findings imply that CML stem cells use survival signals other than BCR-ABL to maintain viability in the presence of IM. Understanding the mechanism by which CML stem cells are intrinsically resistant to IM is essential for devising strategies to eradicate residual leukemia. To gain insight into how IM resistance can occur in the absence of BCR-ABL mutations, an RNA interference (RNAi) screen was performed to identify genes that regulate IM responsiveness. Our results reveal a survival pathway that promotes BCR-ABL-independent IM resistance and also contributes to the IM resistance of CML stem cells.
Without wishing to be bound by theory, the present inventors have identified a molecular pathway whose increased activity promotes BCR-ABL-independent IM resistance and also contributes to the IM resistance of CML stem cells. See, e.g., the schematic model in FIG. 8 and below. In typical IM-sensitive CML cells, BCR-ABL is the major contributor to RAF/MEK/ERK signaling. Thus, treatment with IM substantially reduces RAF/MEK/ERK signaling, leading to inhibition of proliferation and induction of apoptosis. In BCR-ABL-independent, IM resistant CML cells, elevated levels of Protein Kinase C eta (PKC.eta.), due to decreased expression of one or more IM-sensitizing genes (IMSGs), results in phosphorylation and activation of CRAF, thereby augmenting RAF/MEK/ERK signaling. Following treatment with IM, RAF/MEK/ERK signaling is sustained, resulting in drug resistance.
A previous study analyzing IM resistance resulting from mutations in BCR-ABL found that IM treatment "paradoxically" increased RAF/MEF/ERK signaling through a RAS-directed pathway (Konuma et al. Exp Hematol 39, 697-709 e695 (2011)). Although the IM-resistance mechanism we describe, like that in Packer et al. (Cancer Cell 20, 715-727 (2011)), involves increased RAF/MEK/ERK signaling, there are several important differences. For example, in the experiments described herein the increased RAF/MEK/ERK signaling was not dependent upon RAS but rather initiated by PKC.eta., was constitutive and not induced by IM, and, as discussed below, was also relevant to the intrinsic IM resistance of CML stem cells. In addition, several reports have described experimentally derived BCR-ABL-independent IM-resistant CML cell lines in which RAF/MEK/ERK signaling is increased by a mechanism that was not determined (Aceves-Luquero et al., PLoS One 4, e6124 (2009); Hentschel et al., Int J Oncol 39, 585-591 (2011); Nambu et al., Cancer Sci 101, 137-142 (2010).) or have provided other evidence that RAF/MEK/ERK signaling can contribute to IM resistance (Chang et al., Blood 110, 994-1003 (2007); Chu et al., Blood 103, 3167-3174 (2004); Mizuchi et al., Biochem Biophys Res Commun 326, 645-651 (2005); Pellicano et al., Leukemia 25, 1159-1167 (2011)).
The mechanistic basis by which IMSGs regulate PRKCH expression is largely unknown. One of the IMSGs identified, ELF5, is directly bound at the transcription start-site of PRKCH, and can decrease PRKCH expression. Thus, ELF5 is a direct transcriptional repressor of PRKCH, explaining why decreased ELF5 levels result in increased PRKCH expression. Whether other IMSGs function directly or indirectly to regulate PRKCH expression remained to be determined.
It is possible that the RNAi screen described herein, like other large-scale RNAi screens (Mullenders and Bernards, Oncogene 28, 4409-4420 (2009)), was not saturating and thus there may be other IMSGs, and regulators of PRKCH expression, that remain to be identified. The present results suggest that a variety of diverse perturbations can increase PRKCH expression. A previous expression profiling study revealed that the level of PRKCH in CML cells increased following one week of IM treatment (Bruennert et al., Leukemia 23, 983-985 (2009)), perhaps due to selection of and enrichment for cells with high PRKCH expression. This finding may also be explained by induction of PRKCH expression by IM treatment, although we found in IMSG KD K562 cell lines and CML stem cells that PRKCH is highly expressed in the absence of IM. In addition to its role in IM resistance, elevated Prkch expression also accelerates disease progression in a mouse model of CML. Consistent with this idea, in a previous expression profiling study, PRKCH levels were found to increase during disease progression in CML patients. In the same study, the expression levels of seven of nine IMSGs analyzed decreased during disease progression (Radich et al., Proc Nat Acad Sci USA 103, 2794-2799 (2006)).
The IM-resistance mechanism described herein is therapeutically targetable, which was demonstrated by the showing that combined treatment with IM and the FDA-approved MEK inhibitor trametinib synergistically kills BCR-ABL+ IMSG KD cells and prolongs survival in several mouse models of BCR-ABL-independent IM-resistant CML. These results are also relevant to another current challenge of CML treatment: the intrinsic resistance of CML stem cells to IM. Both human and murine CML stem cells contain high levels of PRKCH and provide evidence that this is responsible, at least in part, for their IM resistance. The high PRKCH levels in CML stem cells promotes RAF/MEK/ERK signaling, which helps explain why CML stem cells are not dependent upon BCR-ABL for survival (16, 17). Collectively, these results provide a rationale for our finding that CML stem cells, but not normal hematopoietic stem cells, are efficiently killed by combined treatment with IM and trametinib, and suggest a therapeutic strategy for their eradication.
Chronic Myelogenous Leukemia (CML)
CML is a clonal stem cell disorder that is typically associated with the presence in more than 95% of patients of leukemic cells that have the Philadelphia chromosome (Ph1) (see, e.g., Kurzrock et al., Ann Intern Med 138 (10): 819-30, 2003; Goldman and Melo, N Engl J Med 349 (15): 1451-64, 2003), a reciprocal translocation between chromosomes 9 and 22. The Ph1 translocation results in the transfer of the Abelson (ABL) oncogene from chromosome 9 to the breakpoint cluster region (BCR) of chromosome 22, creating a fused BCR/ABL gene that codes for an abnormal, constitutively active tyrosine kinase that is essential to the growth and survival of leukemic cells. The Ph1 can be detected in bone marrow aspirate or peripheral blood samples using known methods, including cytogenetic studies, Southern blot analysis, Fluorescent in situ hybridization, or RT-PCR. See also the National Cancer Institute: PDQ.RTM. Chronic Myelogenous Leukemia Treatment. Bethesda, Md.: National Cancer Institute. Date last modified Mar. 28, 2014. Available at: http://www.cancer.gov/cancertopics/pdq/treatment/CML/HealthProfessional. Accessed May 6, 2014.
Bone marrow sampling is often done to assess cellularity, fibrosis, and cytogenetics. CML is typically staged into three phases: chronic, accelerated, and blastic phases based on myoblasts counts. Chronic-phase CML is characterized by less than 10% blasts and promyelocytes in the peripheral blood and bone marrow. Accelerated-phase CML is characterized by 10% to 19% blasts in either the peripheral blood or bone marrow. Blastic-phase CML is characterized by 20% or more blasts in the peripheral blood or bone marrow. When 20% or more blasts are present along with fever, malaise, and progressive splenomegaly, the patient has entered blast crisis (Cortes J E, et al., Cancer 106 (6): 1306-15, 2006).
IM-Resistant CML
Although imatinib is successful in treating many patients, development of resistance against imatinib is common (Valenti, Biologics. 1(4): 433-448, 2007). As noted above, resistance may be the result of one or several mechanisms, including molecular resistance caused by mutation of the BCR/ABL gene, or BCR/ABL independent resistance, e.g., associated with stem cell-specific survival factors, e.g., associated with increased RAF/MEK/ERK signaling that is not dependent upon RAS but rather initiated by PKC.eta.. Patients with CML are considered to be imatinib-resistant when response is lost or is not seen with a daily dose of >400 mg imatinib (Valenti, 2007; Kantarjian et al., Blood. 101(2):473, 2003; Baccarani et al., Blood. 108(6):1809-20, 2006).
Methods of Treating CML
Described herein are methods for treating CML, e.g., treating or reducing the risk of developing IM-resistant CML, that include the use of a combination of at least one BCR/ABL inhibitor and at least one MEK inhibitor.
Subject Selection
The methods described herein are useful in the treatment of subjects with CML, e.g., IM-resistant CML, e.g., in which the IM-resistant subject lacks a mutation in BCR-ABL that confers drug-resistance (i.e., BCR-ABL independent IM-resistance).
Any method known in the art can be used to diagnose CML in a subject, including detecting the presence of the Ph1 translocation in leukemic cells of the subject, e.g., as described above. Other methods can also be used.
As described herein, CML stem cells have elevated levels of PRKCH expression and PKC.eta. protein. Thus in some embodiments the methods can include detecting levels of PRKCH mRNA, or PKC.eta. protein or activity, in leukemic cells, e.g., stem cells of the subject. Routine methods can be used to detect expression levels. A nucleic acid sequence of human PRKCH cDNA is in GenBank at accession no. NM_006255.3; the sequence of human PKC.eta. protein is at accession no. NP_006246.2. For example, antibodies (including antibodies that bind specifically to the phosphorylated form) are commercially available from Abcam, Cell Sciences, Life Technologies, MBL International, Novus Biologicals, Bethyl Laboratories, and Santa Cruz Biotechnology, Inc. The presence and/or level of a protein can be evaluated using methods known in the art, e.g., using quantitative immunoassay methods. In some embodiments, high throughput methods, e.g., protein or gene chips as are known in the art (see, e.g., Ch. 12, Genomics, in Griffiths et al., Eds. Modern genetic Analysis, 1999, W. H. Freeman and Company; Ekins and Chu, Trends in Biotechnology, 1999, 17:217-218; MacBeath and Schreiber, Science 2000, 289(5485):1760-1763; Simpson, Proteins and Proteomics: A Laboratory Manual, Cold Spring Harbor Laboratory Press; 2002; Hardiman, Microarrays Methods and Applications: Nuts & Bolts, DNA Press, 2003), can be used to detect the presence and/or level of PKC.eta..
The presence and/or level of mRNA in a sample can also be evaluated using methods known in the art, e.g., both by in situ and/or by in vitro formats. For example, isolated mRNA can be used in hybridization or amplification assays that include, but are not limited to, RNA in situ hybridization (RNA ISH, e.g., a branched DNA assay), Southern or Northern analyses, polymerase chain reaction analyses and probe arrays. One method for the detection of mRNA levels involves contacting the isolated mRNA with a nucleic acid molecule (probe) that can hybridize to the mRNA encoded by the PRKCH gene being detected. The nucleic acid probe can be, for example, a full-length PRKCH nucleic acid, such as the cDNA deposited with ATCC as Accession Number NM_006255.3, or a portion thereof, such as an oligonucleotide of at least 7, 15, 30, 50, 100, 250 or 500 nucleotides in length and sufficient to specifically hybridize under stringent conditions to PRKCH mRNA or genomic DNA. Other suitable probes for use in the assays are described herein. Alternatively, levels or presence of PRKCH mRNA can be detected with nucleic acid amplification, e.g., by rtPCR (Mullis (1987) U.S. Pat. No. 4,683,202), ligase chain reaction (Barany (1991) Proc. Natl. Acad. Sci. USA 88:189-193), self-sustained sequence replication (Guatelli et al., (1990) Proc. Natl. Acad. Sci. USA 87:1874-1878), transcriptional amplification system (Kwoh et al., (1989), Proc. Natl. Acad. Sci. USA 86:1173-1177), Q-Beta Replicase (Lizardi et al., (1988) Bio/Technology 6:1197), rolling circle replication (Lizardi et al., U.S. Pat. No. 5,854,033) or any other nucleic acid amplification method, followed by the detection of the amplified molecules using techniques known in the art. The level of PRKCH mRNA, or PKCeta protein, can then be compared to a reference level, and a subject who has a level at or above the reference level, or above the reference level, can be selected for treatment using the methods described herein.
Suitable reference values can be determined using methods known in the art, e.g., using standard clinical trial methodology and statistical analysis. The reference values can have any relevant form. In some cases, the reference comprises a predetermined value for a meaningful level of PRKCH, e.g., a control reference level that represents a normal level of PRKCH, e.g., a level in an unaffected subject or a subject who is not at risk of developing CML, and/or a disease reference that represents a level of the proteins associated with CML.
In some embodiments, the subject has imatinib-resistant CML, and the methods are used to treat the IM-resistant CML in the subject. In some embodiments, the subject has CML but has not yet developed imatinib resistance, and the methods are used to treat CML in the subject or to prevent or reduce the risk of development of IM-resistant CML in the subject. In some embodiments, the subject has BCR-ABL independent IM-resistance, i.e., is IM-resistant but has no mutations in the BCR-ABL kinase domain that would confer drug-resistance (i.e., no mutations in the region of the sequence at GenBank Acc No. NM_005157.4 that encodes amino acids 235 to 497 of GenBank NP_005148.2, shown underlined below, that would confer resistance). More than 90 BCR-ABL point mutations have been identified, including mutations in the P-loop, the C-helix, SH2 domain, substrate binding site, activation loop and C-terminal lobe M237I; M244V; L248V; G250A; G250E; G250V; Q252H; Y253F; Y253H; E255D; E255K; E255R; E255V; E275K; D276G; E281K; E285N; E292K; F311V; T315I; F317C; F317L; F317V; G321E; D325N; S348L; M351T; Y353H; E355A; E355G; E355K; F359C; F359V; E373G; V379I; A380S; L387A; M388H; H396P; H396R; see Bixby and Talpaz, Hematology: 461-476 (2009); Soverini et al., Clin Cancer Res 12: 7374-7379 (2006); also FIG. 1 of Soverini et al., Blood, 118:1208-1215 (2011). Nine of these mutations account for more than 85% of all mutations: M244V, G250E, Y253F/H, E255K/V, T315I, M351T, and F359V. The T315I mutation (shown in bold and upper case below) is the most clinically relevant.
Reference sequence of human bcr/abl gene product; the kinase domain is underlined. From GenBank Acc No. NM_005157.4
TABLE-US-00001 (SEQ ID NO: 1) 1 mleiclklvg ckskkglsss sscyleealq rpvasdfepq glseaarwns kenllagpse 61 ndpnlfvaly dfvasgdntl sitkgeklry lgynhngewc eaqtkngqgw vpsnyitpvn 121 slekhswyhg pvsrnaaeyl lssgingsfl vresesspgq rsislryegr vyhyrintas 181 dgklyvsses rfntlaelvh hhstvadgli ttlhypapkr nkptvygvsp nydkwemert 241 ditmkhklgg gqygevyegv wkkysltvav ktlkedtmev eeflkeaavm keikhpnlvq 301 llgvctrepp fyiiTefmty gnlldylrec nrqevnavvl lymatqissa meylekknfi 361 hrdlaarncl vgenhlvkva dfglsrlmtg dtytahagak fpikwtapes laynkfsiks 421 dvwafgvllw eiatygmspy pgidlsqvye llekdyrmer pegcpekvye lmracwqwnp 481 sdrpsfaeih qafetmfqes sisdevekel gkqgvrgays tllqapelpt ktrtsrraae 541 hrdttdvpem phskgqgesd pldhepaysp llprkergpp egglnederl lpkdkktnlf 601 salikkkkkt aptppkrsss fremdgqper rgageeegrd isngalaftp ldtadpaksp 661 kpsngagvpn galresggsg frsphlwkks stltssrlat geeegggsss krflrscsas 721 cvphgakdte wrsvtlprdl qstgrqfdss tfgghksekp alprkragen rsdqvtrgtv 781 tppprlvkkn eeaadevfkd imesspgssp pnitpkplrr qvtvapasgl phkeeaekgs 841 algtpaaaep vtptskagsg apggtskgpa eesrvrrhkh ssespgrdkg klsrlkpapp 901 pppaasagka ggkpsqspsq eaageavlga ktkatslvda vnsdaakpsq pgeglkkpvl 961 patpkpqsak psgtpispap vpstlpsass alagdqpsst afiplistry slrktrqppe 1021 riasgaitkg vvldstealc laisrnseqm ashsavleag knlytfcvsy vdsiqqmrnk 1081 fafreainkl ennlrelqic patagsgpaa tqdfskllss vkeisdivqr
Methods for identifying mutations in subjects with CML are also known in the art, and include direct sequencing, optionally combined with nested PCR and/or denaturing-high performance liquid chromatography (D-HPLC) analysis; allele-specific PCR (e.g., fluorescent allele-specific PCR); pyrosequencing; high resolution melting; double gradient denaturing electrophoresis; MALDT-TOF mass spectrometry; nanofluidic array (Oehler et al., Leukemia 2008); fluorescence PCR and PNA clamping; fluorescence polarization template-directed dye-terminator incorporation (FP-TDI); and microarray analysis. Other methods of nucleic acid analysis can include direct manual sequencing (Church and Gilbert, Proc. Natl. Acad. Sci. USA 81:1991-1995 (1988); Sanger et al., Proc. Natl. Acad. Sci. USA 74:5463-5467 (1977); Beavis et al., U.S. Pat. No. 5,288,644); automated fluorescent sequencing; single-stranded conformation polymorphism assays (SSCP) (Schafer et al., Nat. Biotechnol. 15:33-39 (1995)); clamped denaturing gel electrophoresis (CDGE); two-dimensional gel electrophoresis (2DGE or TDGE); conformational sensitive gel electrophoresis (CSGE); denaturing gradient gel electrophoresis (DGGE) (Sheffield et al., Proc. Natl. Acad. Sci. USA 86:232-236 (1989)); denaturing high performance liquid chromatography (DHPLC, Underhill et al., Genome Res. 7:996-1005 (1997)); infrared matrix-assisted laser desorption/ionization (IR-MALDI) mass spectrometry (WO 99/57318); mobility shift analysis (Orita et al., Proc. Natl. Acad. Sci. USA 86:2766-2770 (1989)); restriction enzyme analysis (Flavell et al., Cell 15:25 (1978); Geever et al., Proc. Natl. Acad. Sci. USA 78:5081 (1981)); quantitative real-time PCR (Raca et al., Genet Test 8(4):387-94 (2004)); heteroduplex analysis; chemical mismatch cleavage (CMC) (Cotton et al., Proc. Natl. Acad. Sci. USA 85:4397-4401 (1985)); RNase protection assays (Myers et al., Science 230:1242 (1985)); use of polypeptides that recognize nucleotide mismatches, e.g., E. coli mutS protein; and combinations of such methods. See, e.g., Gerber et al., U.S. Patent Publication No. 2004/0014095 which is incorporated herein by reference in its entirety. Other methods can also be used.
Although the methods described herein refer to treatment of CML, the methods can also be used to treat other IM-resistant BCR-ABL+ leukemia, e.g., Ph+ Acute Lymphoblastic Leukemia (.about.20% in adult, 5% in children), Ph+ Acute Myelogenous Leukemia (.about.2%), and potentially KIT+ gastrointestinal stromal tumors (GIST, as Imatinib can also inhibit KIT kinase) as well.
BCR-ABL Inhibitors
A number of BCR/ABL inhibitors are known in the art. For example, imatinib (GLEEVEC) has been successfully used in the treatment of CML. Additional BCR/ABL inhibitors include Nilotinib (AMN107); Dasatinib (BMS-345825); Bosutinib (SKI-606); Ponatinib (AP24534); Bafetinib (INNO-406); and thiazol and thiazol derivatives, e.g., 1,3,4 thiadiazole derivatives.
MEK Inhibitors
A number of MEK inhibitors (which specifically inhibit mitogen-activated protein kinase kinase enzymes MEK1 and/or MEK2) are known in the art. For example, Trametinib (GSK1120212) has been used for the treatment of certain cancers. Other examples of MEK inhibitors include Selumetinib, MEK162, PD-325901, cobimetinib (XL518; [3,4-Difluoro-2-(2-fluoro-4-iodoanilino)phenyl]{3-hydroxy-3-[(2S)-piperid- in-2-yl]azetidin-1-yl} methanone), CL-1040, and PD035901.
Pharmaceutical Compositions
The methods described herein include the manufacture and use of pharmaceutical compositions, which include a BCR-ABL inhibitor, e.g., IM, and a MEK inhibitor, e.g., trametinib as active ingredients. Also included are the pharmaceutical compositions themselves.
Pharmaceutical compositions typically include a pharmaceutically acceptable carrier. As used herein the language "pharmaceutically acceptable carrier" includes saline, solvents, dispersion media, coatings, antibacterial and antifungal agents, isotonic and absorption delaying agents, and the like, compatible with pharmaceutical administration.
Pharmaceutical compositions are typically formulated to be compatible with its intended route of administration. Examples of routes of administration include parenteral, e.g., intravenous, intradermal, subcutaneous, oral (e.g., inhalation), transdermal (topical), transmucosal, and rectal administration.
Methods of formulating suitable pharmaceutical compositions are known in the art, see, e.g., Remington: The Science and Practice of Pharmacy, 21st ed., 2005; and the books in the series Drugs and the Pharmaceutical Sciences: a Series of Textbooks and Monographs (Dekker, N.Y.). For example, solutions or suspensions used for parenteral, intradermal, or subcutaneous application can include the following components: a sterile diluent such as water for injection, saline solution, fixed oils, polyethylene glycols, glycerine, propylene glycol or other synthetic solvents; antibacterial agents such as benzyl alcohol or methyl parabens; antioxidants such as ascorbic acid or sodium bisulfate; chelating agents such as ethylenediaminetetraacetic acid; buffers such as acetates, citrates or phosphates and agents for the adjustment of tonicity such as sodium chloride or dextrose. pH can be adjusted with acids or bases, such as hydrochloric acid or sodium hydroxide. The parenteral preparation can be enclosed in ampoules, disposable syringes or multiple dose vials made of glass or plastic.
Pharmaceutical compositions suitable for injectable use can include sterile aqueous solutions (where water soluble) or dispersions and sterile powders for the extemporaneous preparation of sterile injectable solutions or dispersion. For intravenous administration, suitable carriers include physiological saline, bacteriostatic water, Cremophor EL.TM. (BASF, Parsippany, N.J.) or phosphate buffered saline (PBS). In all cases, the composition must be sterile and should be fluid to the extent that easy syringability exists. It should be stable under the conditions of manufacture and storage and must be preserved against the contaminating action of microorganisms such as bacteria and fungi. The carrier can be a solvent or dispersion medium containing, for example, water, ethanol, polyol (for example, glycerol, propylene glycol, and liquid polyethylene glycol, and the like), and suitable mixtures thereof. The proper fluidity can be maintained, for example, by the use of a coating such as lecithin, by the maintenance of the required particle size in the case of dispersion and by the use of surfactants. Prevention of the action of microorganisms can be achieved by various antibacterial and antifungal agents, for example, parabens, chlorobutanol, phenol, ascorbic acid, thimerosal, and the like. In many cases, it will be preferable to include isotonic agents, for example, sugars, polyalcohols such as mannitol, sorbitol, sodium chloride in the composition. Prolonged absorption of the injectable compositions can be brought about by including in the composition an agent that delays absorption, for example, aluminum monostearate and gelatin.
Sterile injectable solutions can be prepared by incorporating the active compound in the required amount in an appropriate solvent with one or a combination of ingredients enumerated above, as required, followed by filtered sterilization. Generally, dispersions are prepared by incorporating the active compound into a sterile vehicle, which contains a basic dispersion medium and the required other ingredients from those enumerated above. In the case of sterile powders for the preparation of sterile injectable solutions, the preferred methods of preparation are vacuum drying and freeze-drying, which yield a powder of the active ingredient plus any additional desired ingredient from a previously sterile-filtered solution thereof.
Oral compositions generally include an inert diluent or an edible carrier. For the purpose of oral therapeutic administration, the active compound can be incorporated with excipients and used in the form of tablets, troches, or capsules, e.g., gelatin capsules. Oral compositions can also be prepared using a fluid carrier for use as a mouthwash. Pharmaceutically compatible binding agents, and/or adjuvant materials can be included as part of the composition. The tablets, pills, capsules, troches and the like can contain any of the following ingredients, or compounds of a similar nature: a binder such as microcrystalline cellulose, gum tragacanth or gelatin; an excipient such as starch or lactose, a disintegrating agent such as alginic acid, Primogel, or corn starch; a lubricant such as magnesium stearate or Sterotes; a glidant such as colloidal silicon dioxide; a sweetening agent such as sucrose or saccharin; or a flavoring agent such as peppermint, methyl salicylate, or orange flavoring.
For administration by inhalation, the compounds can be delivered in the form of an aerosol spray from a pressured container or dispenser that contains a suitable propellant, e.g., a gas such as carbon dioxide, or a nebulizer. Such methods include those described in U.S. Pat. No. 6,468,798.
Systemic administration of a therapeutic compound as described herein can also be by transmucosal or transdermal means. For transmucosal or transdermal administration, penetrants appropriate to the barrier to be permeated are used in the formulation. Such penetrants are generally known in the art, and include, for example, for transmucosal administration, detergents, bile salts, and fusidic acid derivatives. Transmucosal administration can be accomplished through the use of nasal sprays or suppositories. For transdermal administration, the active compounds are formulated into ointments, salves, gels, or creams as generally known in the art.
The pharmaceutical compositions can also be prepared in the form of suppositories (e.g., with conventional suppository bases such as cocoa butter and other glycerides) or retention enemas for rectal delivery.
In one embodiment, the therapeutic compounds are prepared with carriers that will protect the therapeutic compounds against rapid elimination from the body, such as a controlled release formulation, including implants and microencapsulated delivery systems. Biodegradable, biocompatible polymers can be used, such as ethylene vinyl acetate, polyanhydrides, polyglycolic acid, collagen, polyorthoesters, and polylactic acid. Such formulations can be prepared using standard techniques, or obtained commercially, e.g., from Alza Corporation and Nova Pharmaceuticals, Inc. Liposomal suspensions (including liposomes targeted to selected cells with monoclonal antibodies to cellular antigens) can also be used as pharmaceutically acceptable carriers. These can be prepared according to methods known to those skilled in the art, for example, as described in U.S. Pat. No. 4,522,811. The pharmaceutical compositions can be included in a container, pack, or dispenser together with instructions for administration.
Dosing
An "effective amount" is an amount sufficient to effect beneficial or desired results. For example, a therapeutic amount is one that achieves the desired therapeutic effect. This amount can be the same or different from a prophylactically effective amount, which is an amount necessary to prevent onset of disease or disease symptoms. An effective amount can be administered in one or more administrations, applications or dosages. A therapeutically effective amount of a therapeutic compound (i.e., an effective dosage) depends on the therapeutic compounds selected. The compositions can be administered one from one or more times per day to one or more times per week; including once every other day. The skilled artisan will appreciate that certain factors may influence the dosage and timing required to effectively treat a subject, including but not limited to the severity of the disease or disorder, previous treatments, the general health and/or age of the subject, and other diseases present. Moreover, treatment of a subject with a therapeutically effective amount of the therapeutic compounds described herein can include a single treatment or a series of treatments.
Dosage, toxicity and therapeutic efficacy of the therapeutic compounds can be determined by standard pharmaceutical procedures in cell cultures or experimental animals, e.g., for determining the LD50 (the dose lethal to 50% of the population) and the ED50 (the dose therapeutically effective in 50% of the population). The dose ratio between toxic and therapeutic effects is the therapeutic index and it can be expressed as the ratio LD50/ED50. Compounds which exhibit high therapeutic indices are preferred. While compounds that exhibit toxic side effects may be used, care should be taken to design a delivery system that targets such compounds to the site of affected tissue in order to minimize potential damage to uninfected cells and, thereby, reduce side effects.
The data obtained from cell culture assays and animal studies can be used in formulating a range of dosage for use in humans. The dosage of such compounds lies preferably within a range of circulating concentrations that include the ED50 with little or no toxicity. The dosage may vary within this range depending upon the dosage form employed and the route of administration utilized. For any compound used in the method of the invention, the therapeutically effective dose can be estimated initially from cell culture assays. A dose may be formulated in animal models to achieve a circulating plasma concentration range that includes the IC50 (i.e., the concentration of the test compound which achieves a half-maximal inhibition of symptoms) as determined in cell culture. Such information can be used to more accurately determine useful doses in humans. Levels in plasma may be measured, for example, by high performance liquid chromatography.
Alternatively, doses approved by the FDA can be used, e.g., for trametinib, 1-2 mg orally once a day, and up to a maximum of 800 mg/day of imatinib.
EXAMPLES
The invention is further described in the following examples, which do not limit the scope of the invention described in the claims.
Materials and Methods
The following materials and methods were used in the Examples set forth herein.
Study Design
The overall study objective was to identify mechanisms underlying BCR-ABL-independent IM-resistance in CML and CML stem cells. The study used cultured human CML cell lines, BCR-ABL+ mouse primary bone marrow cells, mouse models of BCR-ABL-independent IM-resistant CML, and bone marrow or blood samples from CML patients. The study consisted of a series of controlled laboratory experiments and measured multiple parameters including gene expression, cell viability, apoptosis, cell signaling pathway activity, and leukemic progression as described below. For animal experiments, mice were randomly allocated to each group for drug treatment after bone marrow transplantation, and were subsequently analyzed in a non-blinded fashion. Animal sample sizes were selected based on precedent established by previous publications and an understanding that at least n=5 is generally required to achieve statistical significance. Human CML samples were selected on the basis of sample availability and a requirement to achieve statistical significance. For mouse experiments involving shRNAs, the most efficacious shRNA of multiple shRNAs tested and validated in cell culture was used, a criterion that was established prospectively. All quantitative data were collected from experiments performed in at least triplicate.
Clone IDs for individual shRNAs used in this study are listed in table 5 and primer sequences used for qRT-PCR analysis are listed in table 6.
TABLE-US-00002 TABLE 5 List of clone IDs for shRNAs obtained from Open Biosystems/Thermo Scientific. Human Gene First shRNA Second shRNA ABCB6 TRCN0000060318 ADARB2 TRCN0000051893 AIFM3 TRCN0000064545 AKR1C1 TRCN0000036544 AKR1C3 TRCN0000026540 ANO2 TRCN0000138764 ARAF TRCN0000000571 TRCN0000000568 ASAH3L TRCN0000050685 BAP1 TRCN0000007373 TRCN0000007372 BAZ2A TRCN0000015571 BCAP29 TRCN0000060447 TRCN0000060444 BMI1 TRCN0000020158 BMP6 TRCN0000058615 BRAF TRCN0000006291 TRCN0000006292 C6orf224 TRCN0000140490 CCL14 TRCN0000057850 CD22 TRCN0000057623 TRCN0000057625 CELA1 TRCN0000003679 TRCN0000003681 CHRNA1 TRCN0000060992 CLEC5A TRCN0000054035 TRCN0000054034 CMYA5 TRCN0000129695 CRAF TRCN0000001067 TRCN0000001068 CUBN TRCN0000055649 CYP46A1 TRCN0000063810 DGKD TRCN0000000672 DNASE1L1 TRCN0000049688 TRCN0000049690 DPM1 TRCN0000036188 TRCN0000036186 DUSP13 TRCN0000003064 EBF1 TRCN0000013828 TRCN0000013830 EFEMP2 TRCN0000053336 EFNA3 TRCN0000058722 EHD2 TRCN0000053473 ELF5 TRCN0000013875 TRCN0000013877 EXOSC7 TRCN0000051072 TRCN0000051070 E2F4 TRCN0000013809 TRCN0000013810 FAHD1 TRCN0000050068 FAM92A1 TRCN0000136349 GDAP1L1 TRCN0000136540 GFRA2 TRCN0000060710 GHRH TRCN0000083152 GRK5 TRCN0000000842 GTF3C4 TRCN0000013402 IDH3A TRCN0000027270 TRCN0000027310 IDS TRCN0000051546 IFT140 TRCN0000147721 IL1A TRCN0000059211 ITCH TRCN0000002087 KCNC4 TRCN0000044942 KCNH3 TRCN0000044593 KIR2DL2 TRCN0000061458 LEP TRCN0000058353 LGALS9 TRCN0000057446 LILRA3 TRCN0000056945 TRCN0000056946 LMO7 TRCN0000006490 LRAT TRCN0000035998 MED8 TRCN0000052951 MEGF8 TRCN0000055555 TRCN0000055554 MEP1A TRCN0000050903 MMP7 TRCN0000051847 TRCN0000051844 MOV10 TRCN0000049978 NCBP1 TRCN0000059506 OBFC2A TRCN0000134695 OR2D2 TRCN0000060969 PAG1 TRCN0000123270 POLR1C TRCN0000052904 PRKCH TRCN0000006296 TRCN0000006295 PRSS1 TRCN0000052119 PSMD10 TRCN0000058074 RASL10B TRCN0000047610 RCVRN TRCN0000053264 TRCN0000053263 RFK TRCN0000037600 RIN2 TRCN0000062647 RPP38 TRCN0000049875 TRCN0000049876 RPS6KB1 TRCN0000003162 SEC23IP TRCN0000064955 SGK493 TRCN0000037531 SH3TC1 TRCN0000062611 SOX18 TRCN0000017449 STK11 TRCN0000000408 TRCN0000000409 STYXL1 TRCN0000003054 TRCN0000003052 TCEAL1 TRCN0000013415 TRCN0000013413 TM4SF18 TRCN0000122444 TMEM140 TRCN0000138719 TRCN0000138320 TRAF4 TRCN0000034239 TRCN0000034241 TRIM24 TRCN0000021262 UBAP2L TRCN0000007681 TRCN0000007679 WDR45L TRCN0000148944 WDR92 TRCN0000053730 WNT7B TRCN0000061877 TRCN0000061875 ZACN TRCN0000060205 TRCN0000060204 ZFP82 TRCN0000016086 ZHX1 TRCN0000020354 ZKSCAN3 TRCN0000017750 Mouse Gene Bap1 TRCN0000030719 TRCN0000030721 Bcap29 TRCN0000099810 TRCN0000099811 Cd22 TRCN0000067945 TRCN0000067946 Cela1 TRCN0000092406 TRCN0000092407 Clec5a TRCN0000067713 TRCN0000067715 Dnase1l1 TRCN0000108731 TRCN0000108730 Dpm1 TRCN0000111999 TRCN0000111996 Ebf1 TRCN0000086578 TRCN0000086580 Human Gene Elf5 TRCN0000081940 TRCN0000081938 Exosc7 TRCN0000051070 TRCN0000051068 E2f4 TRCN0000085633 TRCN0000085634 Idh3a TRCN0000041785 TRCN0000041786 Megf8 V3LMM_497156 V3LMM_457695 Mmp7 TRCN0000031250 TRCN0000031251 Prkch TRCN0000022812 TRCN0000022811 Rcvrn TRCN0000053267 V3LMM_504872 Rpp38 TRCN0000099598 TRCN0000099599 Stk11 TRCN0000024146 TRCN0000024147 Styxl1 TRCN0000071409 TRCN0000071412 Tceal1 TRCN0000108607 TRCN0000108608 Tmem140 TRCN0000177850 TRCN0000178239 Traf4 TRCN0000067747 TRCN0000067743 Ubap2l TRCN0000007677 TRCN0000007679 Wnt7b TRCN0000071779 TRCN0000071780
TABLE-US-00003 TABLE 6 List of primer sequences used for quantitative real-time RT-PCR. Forward primer Forward primer sequence (5' .fwdarw. 3') # sequence (5' .fwdarw. 3') # Human Gene BAP1 ATCTGGGTCCTGTCATCAGC 1. GCTGCCTTGGATTGGTCTG 2. BCAP29 AACTAGTAGAAGACCAGGAG 3. CGAAAGTCTCTCTGACTGC 4. CD22 CACCTCAATGACAGTGGTCAG 5. TGGATCGGATACCCATAGCAG 6. CELA1 TCCAGCTCCTCCTACTGG 7. CAGAATACTTGCCATTCACC 8. CLEC5A AGGTGGCGTTGGATCAACAA 9. TTAGGCCAATGGTCGCACAG 10. DNASE1L1 CTGCACACCACTCCTAAGGC 11. CAGGCGCTTTTTGGTCAGT 12. DPM1 ATGGATGCTGATCTCTCACACC 13. CCATTTCCTTTGTAGCGAGTTCC 14. EBF1 CCTGGTGTTGTGGAAGTCACA 15. GCTCAACGAACCCACCATC 16. ELF5 GCTGATTCCAACTGCTTGAAAAC 17. CAGTTTTCTTCAGGAGATAGAAGC 18. EXOSC7 CCAAATGAAGGCTACTTGGAGT 19. TAGAGGGTGTTAGCGATCTCG 20. E2F4 ATCGGGCTAATCGAGAAAAAGTC 21. TGCTGGTCTAGTTCTTGCTCC 22. IDH3A AGCCGGTCACCCATCTATGAA 23. TAGAGACACATGGTCGGACAT 24. LILRA3 GCTCACTCAGCTCCAACC 25. TCACCAGCCTTGGATTCG 26. LYN TTCTGGTCTCCGAGTCACTCA 27. GCCGTCCACTTAATAGGGAACT 28. MEGF8 CGCCTGTCTTCGTCACGTC 29. CTGCTGAAAGGTGAGCAAGT 30. MMP7 GTGGAGTGCCAGATGTTGC 31. ATCGATCCACTGAATATGCG 32. PRKCH GTGACTTGATGTTCCACATTCAG 33. ATTGTCCAGTTTCAGATCTCTATAG 34. RCVRN CACGCCGGAAAAGCGAGC 35. GGATCAGTCGCAGAATTTCC 36. RPP38 GACTTTGTGGACGAAGTAAGAGC 37. GCTTTCCAGAGGTTCAGTCTC 38. STK11 CTGCAAGCAGCAGTGAGG 39. AACCGGCAGGAAGACTGAG 40. STYXL1 GACCCCAAGATTCAGAAGG 41. TCCGGGGAATCTTCTATCC 42. TCEAL1 TCGTTCTCGCCCGCAATTTAG 43. GATAAGGACGGCTCCGTTTTG 44. TMEM140 TCGGCTTCTATAACTTCTGCCT 45. CTGTTGCACTGGGCTAGGAG 46. TRAF4 TGCCTATCCGCTGCATCC 47. TTCATGGGGCAGCGATTAGC 48. UBAP2L ATAGCAGCGGCAATACGTGG 49. GAAGACACATTAGAGGCAGTGAA 50. WNT7B GAAGCAGGGCTACTACAACCA 51. CGGCCTCATTGTTATGCAGGT 52. ZACN GAGAGGGGAACAGCGAGAG 53. CAGTCTCAGGCCAGCTTCTC 54. Mouse Gene Bap1 TAGTCCTCCCAGCAAATGTAAG 55. GTCTTCCTCCTCCTGCATAG 56. Bcap29 TTCTGTCTGCCCTTTATTCCTCC 57. TCTTACTTCTCTCACGGCATCT 58. Cd22 AAGCTGGATGTCCATTATGCTC 59. TCTGTAGGAGGTGACGTCTG 60. Cela1 TCTGGATGCCAGGGTGATTC 61. TATTCATCCAGGAAATGTAAGCAG 62. Mclec5a GAAACTGGGATTTTCACCAAGG 63. TCCTGAAGATACTTCAGTTTCTC 64. Dnase1l1 TATGTGTATATCTACAGGTCTGAC 65. ACCACACTTGGAAGAGTTTTGC 66. Dpm1 GTAATTTTGATATTGTCTCTGGAAC 67. CTTCTTTTCGGTATAATCTGAAGC 68. Ebf1 CTCACCCTATGCCATTGTGC 69. CGAAAGCACTCTTCTGTTTCAC 70. Elf5 TGCCTTTGAGCATCAGACAG 71. TACTGGTCGCAGCAGAATTG 72. Exosc7 GTGATGACCTTGGCACAGAG 73. CATTCCAGCAGCAGCACATC 74. E2f4 ACATCTGAGATTGCAGTGAGTG 75. TACTACTATCCAGCAGTGCAG 76. Idh3a TGGGTGTCCAAGGTCTCTC 77. CTCCCACTGAATAGGTGCTTTG 78. Megf8 CTGCCAGTGTTCTAGGAAACTAC 79. ATGTGAGTAACGGCCACTAGG 80. Mmp7 TGAGGACGCAGGAGTGAAC 81. CGTCCTTTGTAAGACTGAAGTC 82. Prkch TCCGGCACGATGAAGTTCAAT 83. TACGCTCACCGTCAGGTAGG 84. Rcvrn ACGACGTAGACGGCAATGG 85. CCGCTTTTCTGGGGTGTTTT 86. Rpp38 CTTCTGCTCAGGGTTTTCAAG 87. ATGTCTTCTCTCTCCAAGGTG 88. Stkl1 AGTATGACTGTAGTGCCCTAC 89. CAGGACCTGTCCAGGCAC 90. Styxl1 CTGCTTTTCTGCGAGCCAAC 91. TGTCGTTTTGATCGGACATCC 92. Tceal1 GTATCCGCCCTCAATTCATAG 93. CTCCGTTTTGCCTTCCAATGC 94. Tmem140 CAGCGTTGGTTTTTGTCTCCC 95. GAGGAGAGCGTAGAACATCAG 96. Traf4 CCCGGCTTCGACTACAAGTTC 97. TCAGGGCATTTGAAGACTCCT 98. Ubap2l TGCTACAACTTCAGGAAAAGCTC 99. GTCTGGAGCATCTGTAAATCATC 100. Wnt7b CCCGATGCCATCATTGTGATC 101. GTAGGGAGTCGAGAGGCTG 102. #, SEQ ID NO.
Cell Lines and Culture
BCR-ABL+ positive human CML cell lines K562 (ATCC), K562R (kindly provided by Nicholas J. Donato, University of Michigan) and KYO-1 (kindly provided by Brian Druker) were maintained in RPMI 1640 medium containing 10% fetal bovine serum (FBS), 4 mM L-glutamine, 100 units/ml penicillin, and 100 .mu.g/ml streptomycin. 32D/BCR-ABL cells (kindly provided by Tomasz Skorski, Temple University) were maintained in RPMI 1640 with 10% FBS.
RNAi Screen
The RNAi Consortium (TRC) lentiviral human shRNA library (Open Biosystems/Thermo Scientific) was obtained through the University of Massachusetts RNAi Core facility. Twenty-two lentivirus pools, each comprising 5000 shRNA clones, were generated with titers of .about.2.times.10.sup.7 cfu/ml, as previously described (47). 2.times.10.sup.6 K562 cells were transduced at a multiplicity of infection <1 with the lentiviral stocks in 6-well plates, and 2 days later puromycin selected (1 .mu.g ml.sup.-1) for 5 days. Cells were then treated with 20 .mu.M IM (LC Laboratories) for 7 days, and washed twice with fresh medium until >99% of control cells (i.e., those expressing a non-silencing shRNA) died off. Surviving cells from all shRNA pools were combined and allowed to recover in IM-free medium with 1 .mu.g/.mu.l puromycin for 4 days. Live cells were sorted out with a Dead Cell Removal kit (Miltenyi Biotec) and harvested, and genomic DNA was prepared for sequencing identification of the integrated shRNA as previously described (Gavin et al., Nature 449, 1073-1077 (2007)).
Cell Viability Assay
To validate candidates, K562 or KYO-1 cells were stably transduced with a lentivirus carrying an individual shRNA and puromycin selected for 5 days. 2.5.times.10.sup.3 IMSG KD K562 cells or 1.times.10.sup.4 IMSG KD KYO-1 cells were plated in 96-well plates, and IM (10 .mu.M for K562 cells or 0.1 .mu.M for KYO-1 cells) or vehicle (DMSO) was added for 3 days. MTT reagent (Promega) or Alamar Blue (Invitrogen) was added to each well in 1:10 volume and incubated, and absorbance at 570 nm was recorded using a VICTOR.sup.3 (PerkinElmer) or SpectraMAX M5 (Molecular Devices) plate reader.
For other cell viability assays, IMSG KD K562 cells or K562/PRKCH cells were treated for 3 days with a range of IM concentrations as indicated (FIGS. 1E and 3B), or 0.1 .mu.M IM, 1.5 nM trametinib or both (FIGS. 4, A and B), and analyzed as described above. For FIGS. 1E and 3B and FIG. 12, data were plotted in GraphPad Prism and a dose response curve was fit with nonlinear regression to calculate ICSO.sup.IM. For FIG. 1F, IMSG KD K562 cells were treated with 10 .mu.M IM or 500 nM dasatinib (ChemieTeK) and cell viability was analyzed as described above. The curve was fit with linear regression and correlation coefficient was calculated using GraphPad Prism.
Colony Formation Assay
For FIG. 1D, mouse primary bone marrow cells were harvested from CML mice as described below, and subjected to two rounds of infection with a mouse IMSG shRNA lentivirus (listed in table 5). Two days later, 5.times.10.sup.4 IMSG KD cells were mixed with cytokine-free methylcellulose-based medium (MethoCult M3234; STEMCELL Technologies) and 0.5 .mu.M IM and plated in 35 mm dishes. Colonies were counted under brightfield microscope at day 7. For FIG. 4C, primary bone marrow cells were transduced for two rounds with a retrovirus expressing Prkch, generated by PCR amplifying mouse Prkch cDNA (an MGC clone; Open Biosystems/Thermo Scientific) using forward (5'-ATAGGTTAACGCCACCATGTCGTCCGGCACGATGA-3'; SEQ ID NO:103) and reverse (5'-ATAGGAATTCCTACAGTTGCAATTCCGGTGA-3'; SEQ ID NO:104) primers, and digesting the PCR product with HpaI and EcoRI and cloning it into MSCV-IRES-GFP (Addgene plasmid 20672). Two days after transduction, 5.times.10.sup.4 cells were mixed with methylcellulose and 0.5 .mu.M IM, 2 nM trametinib (ChemieTek) or both. For FIGS. 5 B and C, primary bone marrow cells were collected from Prkch knockdown CML mice (generated using a retrovirus co-expressing BCR-ABL and a Prkch shRNA; see below), and 1.times.105 cells were plated in methylcellulose in the absence (FIG. 5B) or presence of 0.1 .mu.M IM (FIG. 5C). For FIG. 7C, primary bone marrow cells were collected from either NS or Prkch knockdown CML mice, BCR-ABL+ murine stem cells (Lin-Sca1+Kit+) were isolated from the mice by fluorescence activated cell sorting (FACS), and IM sensitivity determined as described above for FIGS. 5, B and C.
Immunoblot Analysis
After 5 days puromycin selection, .about.1.times.10.sup.6 IMSG KD K562 cells were plated into 6-well dishes and treated with 10 .mu.M IM for 36 hours. Cells were harvested and lysed with RIPA buffer (10.times., 200 mM HEPES pH 6.8, 1400 mM NaCl, 25 mM MgCl.sub.2, 25 mM CaCl.sub.2, 10% NP40, and 5% sodium deoxycholate) plus phosphatase (Sigma) and protease inhibitors (Roche). Blots were probed with the following primary antibodies, all obtained from Cell Signaling Technology: BCR-ABL PathScan (p-BCR-ABL, p-STAT5, p-CRKL) (#5300S), total BCR-ABL (#2862S), p-ERK1/2 (#4377S), total ERK1/2 (#4695S), t-STAT5 (#9358S), p-AKT (#4060S), t-AKT (#4685S), p-SFK (#2105S), t-LYN (#2796S), t-CRKL (#3182S), p-MARCKS (#8722S), t-MARCKS (#5607S), ARAF (#4432S), BRAF (#9433S), CRAF (#9422S). The PKC.eta. antibody (Santa Cruz Technology; C-15) was diluted in 5% skim milk at 1:150. The .beta.-actin antibody (Sigma; AC-74) diluted in 5% BSA at 1:5000. Blots were developed with Pico/Femato super signal (Sigma) and visualized using autoradiography or a Bio-Rad ChemiDoc MP Imaging System.
RNA Preparation and qRT-PCR
Total RNA was isolated from cells using TriPure Isolation Reagent (Roche) followed by treatment with turbo DNase (Ambion) to remove contaminating genomic DNA. Reverse transcription was performed using MMLV reverse transcriptase (NEB) followed by qPCR using Fast SYBR Green Master Mix (Applied Biosystems) using primers listed in table 6. The expression level of each gene was normalized to that of GAPDH. Knockdown efficiency was calculated relative to that obtained with a control non-silencing shRNA.
In Vitro Kinase Assay
A plasmid expressing Flag-tagged PKC.eta. was generated by PCR amplifying PRKCH from a cDNA clone (Open Biosystems/Thermo Scientific), and cloning the PCR product into expression vector p3xFlag-Myc-CMV-25 (Sigma). The kinase-dead K384R mutant was generated by PCR-based site-directed mutagenesis using PfuTurbo DNA polymerase (Agilent). Plasmids were transfected individually into 293T cells, and proteins were immunopurified from cell lysate using an anti-Flag antibody (Sigma). In vitro phosphorylation reactions were set up in a 20 .mu.l reaction volume as follows: 1 .mu.l .sup.32P-.gamma.-ATP (10 mCi), 1 .mu.l 10 .mu.M ATP, 0.2 mM microcystin, 4 .mu.l 5.times. kinase buffer [23 mM MOPS, 11.5 mM .beta.-glycerophosphate, 23 mM MgCl.sub.2, 4.6 mM EGTA, 1.8 mM EDTA, 0.25 mM DTT (pH 7.0)], 60 nM purified Flag-PKC.eta. diluted in 1.times. kinase buffer, and 10 .mu.M substrate (GST or GST fused to a peptide corresponding to amino acids 491-505 of CRAF, purified from E. coli) diluted in 1.times. kinase buffer. Reactions were incubated for 30 min at 30.degree. C. and stopped using 2.times. Laemmli Sample Buffer. Incorporation of the radiolabel into the peptide was monitored by autoradiography.
Flow Cytometry Analysis
Fifteen days after induction of CML-like disease (see below), bone marrow cells were flushed out of femur and tibia bones with RBC lysis buffer (155 mM NH.sub.4Cl, 12 mM NaHCO.sub.3, 0.1 mM EDTA), spun down at 1,000 rpm for 10 min, and washed once with PBS. 2-5.times.10.sup.6 cells from each sample were aliquoted for staining. A cocktail of primary antibodies [APC-conjugated Sca-1 antibody (eBioscience), PE-conjugated c-Kit antibody (eBioscience) and Biotin-conjugated Lineage antibody cocktail (Miltenyi Biotec)] was added to each sample in a total volume of 100 .mu.l, incubated on ice for 30 min, washed once by adding PBS (1 ml) and spin down at 1,000 rpm for 10 min. The secondary antibody (APC-eFluor780-conjugated Straptavidin; eBioscience) was added in a total volume of 100 .mu.l, incubated for 20 min on ice, and then washed once with PBS. FACS analysis was performed immediately using an LSR II flow cytometer (BD Biosciences). The Lin+ population was separated from the Lin- population by magnetic beads (Miltenyi Biotec). GFP+Lin-Sca1+Kit+ and GFP+Lin- cells were then FACS sorted from the Lin- population, and GFP+Lin+Gr1+ cells were FACS sorted from the Lin+ population.
For Lin-Sca1+Kit+ apoptosis staining, 5 .mu.l Annexin-V antibody [eFluor450-conjugated Annexin V (eBioscience)] was added to each sample after the last wash, and incubated for 20 min in the dark at room temperature. Samples were washed once, and 2 .mu.l 7AAD (eBioscience) was added within 4 h before FACS analysis.
For intracellular phosphorylated-ERK1/2 analysis, bone marrow cells isolated from leukemic mice were treated with 5 .mu.M IM or 10 nM trametinib for 3 hours, fixed in 4% paraformaldehyde (Electron Microscopy Sciences) for 10 min at 37.degree. C., washed twice with wash buffer (0.05% BSA in 1.times.PBS), spun down, and resuspended in 100 .mu.l wash buffer. Ice-cold methanol (900 .mu.l) was added to the cells while gently vortexing to reach a final 90% for permeabilization. Samples were incubated on ice for 30 min, washed twice, and resuspended in 100 .mu.l wash buffer. IgG control antibody (Cell signaling) was added (at 1:100 dilution) for 10 min at room temperature for blocking, followed by addition of 2 .mu.l conjugated IgG control (Pacific Blue-conjugated IgG.sup.XP Rabbit mAb, Cell Signaling) or phospho-ERK antibody (Pacific Blue-conjugated P-p44/42(T202/Y204).sup.XP Rabbit mAb, Cell Signaling). Samples were gently mixed and incubated at room temperature for 1 hour. Thirty minutes after the start of the incubation, a cocktail of primary antibodies for cell surface markers (described above) was added, incubated for a further 30 min, washed once with PBS, and incubated with the secondary antibody for 20 min on ice. Samples were then washed once with wash buffer prior to FACS analysis. Relative phosphorylated ERK1/2 staining was calculated by first subtracting the IgG background staining and then normalizing the absolute fluorescence intensity (median) of the treatment group (Prkch knockdown or IM or trametinib treatment) to that of the control group (NS shRNA or DMSO).
Construction of BCR-ABL/shRNA or BCR-ABL/Prkch Co-Expression Plasmids
shRNAs were subcloned from an effective TRC shRNA plasmid into the MluI site downstream of GFP in the retroviral vector MSCV-BCR-ABL-IRES-GFP (22) (using forward [5'-ATAGACGCGTTTCTTGGCTTTATATATCTTGTGG-3'; SEQ ID NO:105] and reverse [5'-ATAGACGCGTCAAAGTGGATCTCTGCTGTC-3'; SEQ ID NO:106] primers, where underlining indicates the MluI site) to ensure the shRNA would be expressed in the same transcript as BCR-ABL and GFP. Similarly, mouse Prkch cDNA was subcloned into MSCV-BCR-ABL-IRES-GFP as described above to generate an MSCV-BCR-ABL-IRES-mPRKCH-IRES-GFP triple gene expression construct. Virus titer was tested in NIH 3T3 cells. Briefly, 5.times.10.sup.4 cells were plated in each well of a 6-well plate, and virus was added at 1:1 dilution with fresh DMEM medium (10% FBS) plus Polybrene (Qiagen), and then cultured for 48 hours. FACS was performed to analyze GFP percentage. Only those viruses showing .gtoreq.90% infection were used for in vivo CML induction.
Mouse Models of CML
Mice with CML-like disease were generated as previously described (22). Briefly, wild-type male C57BL/6 mice 6-8 weeks of age (Jackson Laboratory) were tail-vein injected with 5-fluorouracil (200 mg/kg; Sigma) for 4 days to enrich for slow-cycling hematopoietic stem cells. At day 5, bone marrow cells were harvested and pre-incubated overnight in the presence of IL-3, IL-6 and SCF (all from PeproTech) to increase infection efficiency. At days 6 and 7, bone marrow cells were infected with a BCR-ABL retrovirus by co-sedimentation method at 3,000 rpm for 90 min at room temperature. Four hours after the second round of retroviral infection, 0.5.times.10.sup.6 bone marrow cells were injected into the tail vein of syngeneic recipient mice that had been lethally irradiated (twice at 550 R). Mice were randomly allocated to each group after bone marrow transplantation.
For drug treatment, mice were oral gavaged twice a day with IM (dissolved in filtered ddH.sub.2O) at 100 mg/kg and/or once a day with trametinib (dissolved in 0.5% hydroxypropylmethylcellulose and 0.2% Tween-80 in filtered ddH.sub.2O) at 2 mg/kg.
White Blood Count
Peripheral blood (.about.25 .mu.l) was collected from mouse tail veins into Microtainer tubes (BD Biosciences), and analyzed using a Hemavet 950 FS (Drew Scientific, Inc) cell counter within 3 hours after blood collection.
Acquisition and Storage of CML Patient Samples
After informed consent in accordance with Institutional Review Board (IRB)-approved protocols, bone marrow aspirate or peripheral blood samples were collected from CML patients. For samples provided by the Druker lab and Emory University, mononuclear cells were isolated by Ficoll gradient and, depending on the number of viable cells available, cells were stored as pellets or guanidinium thiocynate (GTC) lysates (resuspended in Qiagen RLT lysis buffer+beta-mercaptoethanol) at -80.degree. C., or resuspended in fetal bovine serum (FBS)+10% DMSO, frozen slowly overnight, and then transferred to liquid nitrogen for long-term storage. For samples provided by the University of Massachusetts Medical School, white blood cells were isolated by red cell lysis, and cells were resuspended in FBS+10% DMSO, frozen slowly overnight, and then transferred to liquid nitrogen for long-term storage. All samples were provided in a deidentified manner. Samples from normal donors were purchased from a commercial vendor (AllCells or Lonza).
Analysis of Human CML Patient Samples
To analyze gene expression in IM-sensitive and IM-resistant CML patient samples (FIGS. 3, C and D), RNA was obtained in the form of purified RNA or extracted independently from GTC lysate or Trizol stock, and qRT-PCR was performed as described above.
To culture primary cells derived from CML patients and normal individuals for functional experiments (FIGS. 3E, 4D and 7F-G and FIGS. 17A-B and 23B), frozen patient cells were first warmed for 10 min at 37.degree. C. 1 ml of pre-warmed thawing medium (Iscove's Modified Dulbecco's Media [IMDM] with 5% FBS, 0.1 mg/ml DNase, and 400 U/ml heparin) was added slowly, followed by 10 ml of wash medium (IMDM with 5% FBS, 0.1 mg/ml DNase). After passing through a 70 .mu.m filter, cells were spun at 300 g for 10 min. Cell pellets were then resuspended in an adequate amount of culture medium (IMDM with 20% BIT [STEMCELL Technologies], 20 ng/ml IL-3, 20 ng/ml IL-6, 20 ng/ml FLT3, 100 ng/ml granulocyte colonystimulating factor (G-CSF), and 100 ng/ml SCF [PeproTech]) and incubated overnight at 37.degree. C. Cells were then either directly used, or further enriched for the CD34+ population using CD34 MicroBead Kit UltraPure (Miltenyi Biotec).
For PRKCH knockdown, a volume of PRKCH shRNA-GFP lentivirus equal to the volume of cells was used to infect cells at 2,000 g for 90 min at room temperature. After culturing for an additional 16-24 hours, cells were pelleted at 300 g for 10 min and resuspended in culture medium with 1% of initial cytokines, a more physiologically relevant concentration. Cells were then treated with DMSO, 5 .mu.M IM, 5 nM trametinib, or both drugs for 4 days. The cell viability of the target population was then calculated by multiplying the percentage of target population, which was obtained by FACS analysis, and the total number of live cells, which was determined by trypan blue staining.
To analyze PRKCH expression in human CML stem cells (CD34+CD38-) and progenitor cells (CD34+CD38+) (FIG. 6B), freshly thawed CML cells or CD34+- enriched CML cells were directly stained for CD34 and CD38 cell surface markers. The target population was isolated by FACS and total RNA was extracted by Trizol for qRT-PCR analysis as described above. For bioinformatic analysis (FIG. 6C), CEL files were downloaded from Gene Expression Omnibus (GEO accession GSE43754), and PRKCH expression analysis was performed using the R program `RMA` in the BioConductor `oligo` package (66) with full probeset annotation.
Chromatin Immunoprecipitation (ChIP)
K562 cells (1.times.107) were crosslinked with 1% formaldehyde for 12 min at room temperature, followed by addition of 0.125 mM glycine for 10 min. Cells were washed twice and lysed in ChIP lysis buffer (50 mM HEPES pH 8.0, 150 mM NaCl, 1 mM EDTA, 0.1% Na-deoxycholate, 1% TritonX-100, 0.1% SDS, plus protease inhibitor) for 15 min on ice. The lysate was sonicated for 12 rounds (30 seconds on, 1 minute 30 seconds off, power output 6.0) using Sonicator 3000 (Qsonica), and clarified by centrifugation. 50 .mu.l 50% protein-G agarose bead slurry was used to pre-clear 5 mg of chromatin for over 4 hours at 4.degree. C. For ChIP experiments, 500 .mu.g pre-cleared chromatin were incubated overnight with either 5 .mu.g anti-ELF5 antibody ((N-20) X, Santa Cruz) or IgG, followed by addition of 50 .mu.l 50% protein-G agarose bead slurry and incubation for 4 hours at 4.degree. C. Beads were pelleted by centrifugation and washed twice with ChIP lysis buffer, once with high salt lysis buffer (ChIP lysis buffer adjusted to 1M NaCl), thrice with LiCl wash buffer (50 mM HEPES pH 8.0, 250 mM LiCl, 1 mM EDTA, 0.5% deoxycholate, 0.5% NP40, plus protease inhibitor), and once with Tris-EDTA buffer. After the last wash, the supernatant was removed and 400 .mu.l elution buffer (1% SDS, 0.1% NaHCO3) was added and incubated for 15 min at 65.degree. C. with occasional vortexing. Beads were pelleted, and the supernatant was transferred to a new tube and reverse-crosslinked overnight at 65.degree. C. RNase A (2 .mu.l of 10 mg/ml) was added to each ChIP sample and incubated for 1 hour at 37.degree. C., followed by addition of 5 .mu.l Protease K (20 mg/ml, Promega) and incubation for 2 hours at 55.degree. C. DNA was phenol:chloroform extracted and isopropanol precipitated, and subjected to qPCR with the following primers: TSS-for (5'-AGGAGGAGAAGCAAGAGGAG-'3'; SEQ ID NO:107) and TSS-rev (5'-CCGACCGTCCCTTCCAAG-3'; SEQ ID NO:108), 500-for (5'-GACCTTTCCTGCTCTATGTG-3'; SEQ ID NO:109) and 500-rev (5'-CTGCAGAGGCTAATTACACAG-3'; SEQ ID NO:110), and 1000-for (5'-CATAGCAGCGTAGGCTAAAA G-3'; SEQ ID NO:111) and 1000-rev (5'-CGGAAGAAATTGCCTCTTCTAG-3'; SEQ ID NO:112). Fold enrichment was calculated by setting the IgG control to a value of 1.
Luciferase Reporter Assays
A 2 kb genomic DNA region upstream of the PRKCH transcription start site was PCR amplified from a BAC clone (RP11-1069E8) using forward and reverse primers (5'-ATAGGCTAGCGTTCTGAACAGGGCCTTAGAG-3'; SEQ ID NO:113 and 5'-ATAGAAGCTTGATGCGGACCCTCAAATAGC-3'; SEQ ID NO:114, respectively), digested with NheI and HindIII, and ligated into the firefly luciferase reporter vector PGL4.14[luc2/Hygro] (Promega). 2 .mu.g of this reporter and 40 ng of pRL-TK Renilla luciferase control reporter vector (Promega) were co-transfected into ELF5 knockdown or overexpression K562 cells by electroporation. After 48 hours of culturing, cells were lysed and centrifuged. Supernatants were incubated with luciferase substrate (Promega) and the luciferase activity was recorded by VICTOR3 (PerkinElmer) plate reader.
Statistics
All quantitative data were collected from experiments performed in at least triplicate, and expressed as mean+/-standard deviation. Animal experiments were expressed as mean+/-standard error of the mean. Statistical analyses were performed using R, a system for statistical computation and graphics (Ihaka and Gentleman, J Comput Graph Stat 5, 299-314 (1996)). Relative cell viability data (FIGS. 1, B and C, 3E, 4D, 7F, 7G, 9, 10A, 17B and 23B) and cell death data (FIG. 22A) were first arcsine transformed to homogenize the variance. Colony number (FIG. 1D and FIGS. 11B and 20) and cell number (FIG. 7D) data were first log transformed. Levene's test was performed to test for homogeneity of variance. When the assumption of homogeneity of variances was met, ANOVA was performed followed by predetermined contrasts within the ANOVA framework. When the assumption was violated, a non-parametric counterpart of ANOVA (Kruskal-Wallis test for completely randomized design or Friedman rank sum test for randomized complete block design) was performed. In some instances, P values were adjusted to counteract the problem of multiple comparisons (Benjamini and Hochberg, J. Roy. Statist Soc Ser B 57, 289-300 (1995)). Significant differences were considered when P<0.05; *P.ltoreq.0.05 and **P.ltoreq.0.01. Statistical tests and exact P values are provided in table 4.
Statistical analysis for drug synergy was performed using R (Ihaka and Gentleman, J Comput Graph Stat 5, 299-314 (1996)) to assess whether the combined effects from IM and trametinib were additive (responses were equal to the sum of the single-drug effects), synergistic (greater than the sum of the single-drug effects) or antagonistic (less than the sum of the single-drug effects). Two-way analysis of variance (ANOVA) was used to test for the main effects of IM and trametinib and their interaction on cell viability and apoptosis. Benjamini and Hochberg (BH)-adjusted P value was calculated to counteract the problem of multiple comparisons (Benjamini and Hochberg, J. Roy. Statist Soc Ser B 57, 289-300 (1995)). The difference between observed effects and the expected additive effects for the cell lines exposed to both drugs were compared as previously described (Slinker, J Mol Cell Cardiol 30, 723-731 (1998)). The difference was estimated as the interaction coefficient in ANOVA. For cell viability, if there was a significant positive difference (interaction coefficient >0 and BH-adjusted P value <0.05), then the impact from the combined drugs was classified as antagonism; if there was a significant negative difference (interaction coefficient <0 and BH-adjusted P value <0.05), then the impact from the combined drugs was classified as synergistic; if there was no significant difference, then the impact from the combined drugs was classified as additive. For apoptosis, if there was a significant positive difference, then the impact from the combined drugs was classified as synergism; if there was a significant negative difference, then the impact from the combined drugs was classified as antagonism.
Example 1. A Large-Scale shRNA Screen Identifies IM-Sensitizing Genes
To identify IM-sensitizing genes (IMSGs), IM-sensitive human CML K562 cells (18) were stably transduced with pools of a genome-wide human short hairpin RNA (shRNA) library (19) followed by IM treatment (FIG. 1A). Surviving cells from all pools were combined and shRNAs, corresponding to 89 genes, were identified by sequence analysis. Validation experiments with individual shRNAs corresponding to those isolated from the primary screen, as well as second, unrelated shRNAs targeting the same genes, confirmed that knockdown of 25 genes conferred >2-fold increased K562 cell survival in the presence of IM relative to a control non-silencing (NS) shRNA (FIG. 1B and FIGS. 9 and 10A). The extent of IM resistance after IMSG knockdown was roughly similar to that of the well-studied experimentally-derived IM-resistant cell line K562R and an IM-resistant patient-derived cell line, SUPB15 (FIG. 10B). Quantitative real-time RT-PCR (qRT-PCR) confirmed in all cases that expression of the target gene was decreased in the corresponding K562 knockdown (KD) cell line (FIGS. 10C and D).
To confirm that these results were generalizable, the validated candidates were analyzed in KYO-1 cells, another IM-sensitive human CML cell line (20). FIG. 1C shows that 21 of the 25 shRNA candidates validated in KYO-1 cells. Finally, whether knockdown of the validated candidates would also confer IM resistance was tested in BCR-ABL+ mouse primary bone marrow cells. Toward this end, CML-like disease was induced in C57BL/6 mice using a BCR-ABL-expressing retrovirus (21, 22). Primary bone marrow cells were harvested, infected with a mouse candidate IMSG shRNA, and tested for their ability to form colonies in methylcellulose containing IM. Knockdown of 19 candidate IMSGs (FIG. 11A) rendered BCR-ABL+ primary bone marrow cells IM resistant (FIG. 1D). Equivalent results were obtained using a second, unrelated shRNA for each IMSG (FIGS. 11B and C).
To quantify IM resistance, we determined the IC50 for imatinib (IC50.sup.IM) of IMSG KD K562 cells. Knockdown of 11 IMSGs increased the IC50.sup.IM greater than five-fold (FIG. 1E and FIG. 12), and we therefore focused on these IMSGs in our subsequent experiments. The IC50IMs of these 11 IMSG KD K562 cell lines were similar to those of IM-resistant cell lines derived from CML patients (Quentmeier et al., J Hematol Oncol 4, 6 (2011)). These 11 IMSGs are involved in diverse biological processes including transcriptional regulation, signal transduction, protein metabolism and DNA/RNA metabolism (table 1).
Next, whether knockdown of IMSGs would cause resistance to the second-generation tyrosine kinase inhibitor, dasatinib (23) was tested. As a control, K562R cells were analyzed in parallel, which are resistant to IM but sensitive to dasatinib due to over-expression of the Src family kinase (SFK) LYN (24). All of the IMSG shRNAs that conferred IM resistance also caused resistance to dasatinib (FIG. 1F).
TABLE-US-00004 TABLE 1 List of 11 IMSGs obtained from the genome-wide RNAi screen. All candidates were validated with a second, unrelated shRNA. Knockdown conferred IM resistance in BCR-ABL- transformed primary bone marrow cells and increased IC50.sup.IM greater than 5-fold in K562 cells. Biological Gene process symbol Gene name Cell signaling CLEC5A C-type lectin domain family 5, member A STK11 Serine/threonine kinase 11 WNT7B Wingless-type MMTV integration site family, member 7B DNA/RNA DNASE1L1 Deoxyribonuclease I-like 1 metabolism EXOSC7 Exosome component 7 RPP38 Ribonuclease P/MRP 38 kDa subunit Protein BAP1 BRCA1 associated protein-1 (ubiquitin metabolism carboxy-terminal hydrolase) Transcriptional ELF5 E74-like factor 5 (ets domain regulation transcription factor) Immunity CD22 CD22 molecule Unknown MEGF8 Multiple EGF-like-domains 8 TMEM140 Transmembrane protein 140
Example 2. Knockdown of IMSGs in BCR-ABL+ Cells Results in Sustained RAF/MEK/ERK Signaling after IM Treatment
Next, a series of experiments was performed to identify the regulatory pathway(s) through which IMSGs promote IM sensitivity. IMSG KD K562 cell lines were cultured in the presence or absence of IM followed by immunoblotting for characteristic markers of relevant cell signaling pathways. The results, shown in FIG. 2, indicated that knockdown of IMSGs had no effect on total BCR-ABL levels. Moreover, in all IMSG KD K562 cell lines, IM inhibited BCR-ABL protein kinase activity, as evidenced by decreased BCR-ABL autophosphorylation and decreased phosphorylation of the BCR-ABL substrate CRKL (25). We also monitored the effect of IMSG knockdown on SFK activity, whose elevation, as mentioned above, is responsible for IM resistance in K562R cells. None of the IMSG KD K562 cell lines had elevated SFK activity or expression, consistent with their resistance to dasatinib.
The effect of IMSG knockdown was next analyzed on known downstream signaling pathways of BCR-ABL. All IMSG KD K562 cell lines had normal levels of phosphorylated STAT5 and AKT, indicating that JAK/STAT and PI3K/AKT signaling pathways were not affected by IMSG knockdown. In contrast, most of the IMSG KD K562 cell lines had increased RAF/MEK/ERK kinase pathway activity, as evidenced by increased phosphorylation of ERK1/2. As expected, after IM treatment of control K562 cells, there was a substantial decrease in phosphorylated-ERK1/2 levels. However, all of the IMSG KD K562 cell lines had, to varying extents, sustained levels of phosphorylation of ERK1/2 following IM treatment. Thus, in IMSG KD K562 cell lines there is an alternative pathway that activates RAF/MEK/ERK signaling after inhibition of BCR-ABL.
Previous studies have reported that the protein kinase C (PKC) pathway can stimulate RAF/MEK/ERK signaling (26-28). Therefore PKC pathway activity was analyzed in IMSG KD K562 cells by monitoring phosphorylation of a universal PKC substrate, MARCKS (29). Levels of MARCKS phosphorylation were elevated in all IMSG KD K562 cell lines, indicating elevated PKC activity.
Example 3. PRKCH is Upregulated in BCR-ABL-Independent IM-Resistant CML Cell Lines and Patient Samples
Next, the PKC family member(s) responsible for the increased PKC activity were identified. The qRT-PCR results, shown in FIG. 3A, showed that PRKCH, which encodes PKC.eta., was upregulated in nearly all IMSG KD K562 cell lines. Similar results were obtained with a second shRNA targeting each IMSG (FIG. 13A). Immunoblot analysis confirmed that PKC.eta. protein levels were also increased in the IMSG KD K562 cell lines (FIG. 13B).
As a first step toward understanding the basis by which IMSGs regulate PRKCH expression, one of the IMSGs, ELF5, a known transcriptional repressor (Chakrabarti et al., Nat Cell Biol 14, 1212-1222 (2012); Escamilla-Hernandez et al., BMC Mol Biol 11, 68 (2010)), was further analyzed. A chromatin immunoprecipitation assay was used; the results showed that ELF5 was directly bound at the transcription start site of PRKCH (FIG. 14A), consistent with the results of a study analyzing ELF5 occupancy genome-wide (Kalyuga et al., PLoS Biol 10, e1001461 (2012)). Moreover, we found that expression of a PRKCH promoter-luciferase reporter construct was increased by ELF5 knockdown and, conversely, decreased by ectopic expression of ELF5 (FIGS. 14B and C). Thus, ELF5 is a direct transcriptional repressor of PRKCH, explaining why decreased ELF5 levels result in increased PRKCH expression.
To verify that increased PKC.eta. expression is responsible for the IM resistance, we derived K562 cell lines that over-expressed PRKCH (K562/PRKCH cells) to varying degrees. In several K562/PRKCH cell lines, PKC.eta. levels were comparable to those found in IMSG KD K562 cells (FIG. 15A). The elevated PRKCH expression resulted in a 10-20-fold increase in IM resistance (FIG. 3B). Conversely, knockdown of PRKCH abrogated the IM resistance of representative IMSG KD K562 cell lines (FIG. 15B).
To determine the clinical relevance of these results, PRKCH mRNA levels were analyzed in IM-resistant CML patient samples harboring wild-type BCR-ABL. As a control, PRKCH mRNA levels were also analyzed in IM-resistant CML patient samples that contained a known IM-resistance mutation in BCR-ABL (table 2). The results shown in FIG. 3C show that PRKCH mRNA levels were significantly (P<0.01) higher in IM-resistant CML patient samples containing wild-type BCR-ABL compared to those with mutant BCR-ABL. In addition, the average expression levels of three IMSGs (CLEC5A, ELF5, and WNT7B) were significantly (P<0.01, <0.05, <0.05, respectively) lower in IM-resistant CML patient samples containing wild-type BCR-ABL compared to those with mutant BCR-ABL (FIG. 3D). Moreover, in all 11 IM-resistant CML patient samples containing wild-type BCR-ABL at least one IMSG was down-regulated >2-fold, and in 9/11 samples at least one IMSG was down-regulated >5-fold, relative to the average expression in IM-resistant mutant BCR-ABL samples (table 3). Finally, the results in FIG. 3E show that knockdown of PRKCH increased IM sensitivity of leukemic cells from BCR-ABL-independent IM-resistant CML patients. .sup.1WT, BCR-ABL wild-type; Mut, BCR-ABL kinase domain mutant .sup.2AP, accelerated phase; BC, blast crisis; CP, chronic phase; Ly BP, lymphoid blast crisis phase; My BP, myeloid blast crisis phase. OHSU=Druker lab, OHSU Knight Cancer Institute; WCI=Hematology Bank, Winship Cancer Institute; UMMS=Department of Pathology, UMMS BM=Bone marrow; PB=Peripheral blood
TABLE-US-00005 TABLE 2 List of CML patient samples used Sample BCR-ABL CML IM resistant/ ID.sup.1 Source mutation phase.sup.2 Origin sensitive Basis of IM resistance Relevant FIG. WT-1 OHSU -- CP BM Resistant Cytogenic relapse or suboptimal primary FIG. 3C and 3D response to IM WT-2 OHSU -- CP BM Resistant Cytogenic relapse or suboptimal primary FIG. 3C and 3D response to IM WT-3 OHSU -- CP BM Resistant Cytogenic relapse or suboptimal primary FIG. 3C and 3D response to IM WT-4 OHSU -- CP BM Resistant Cytogenic relapse or suboptimal primary FIG. 3C and 3D response to IM WT-5 WCI -- My BP BM Resistant Loss of hematological response FIG. 3C and 3D WT-6 WCI -- CP BM Resistant Loss of cytogenic response FIG. 3C and 3D WT-7 WCI -- My BP BM Resistant Lack of major cytgenic response FIG. 3C and 3D WT-8 WCI -- CP BM Resistant Lack of major molecular response FIG. 3C and 3D WT-9 WCI -- CP BM Resistant Lack of major cytgenic response FIG. 3C and 3D WT-10 WCI -- CP PB Resistant Loss of complete cytogenic response FIG. 3C and 3D WT-11 WCI -- CP PB Resistant Loss of hematological response FIG. 3C and 3D Mut-1 OHSU G250E CP BM Resistant Cytogenic relapse or suboptimal primary FIG. 3C and 3D response to IM Mut-2 OHSU M244V AP BM Resistant Cytogenic relapse or suboptimal primary FIG. 3C and 3D response to IM Mut-3 OHSU Y253F CP PB Resistant Cytogenic relapse or suboptimal primary FIG. 3C and 3D response to IM Mut-4 OHSU T315I BC Leuka- Resistant Cytogenic relapse or suboptimal primary FIG. 3C and 3D pheresis response to IM Mut-5 OHSU T315I AP PB Resistant Cytogenic relapse or suboptimal primary FIG. 3C and 3D response to IM Mut-6 WCI T315I, My BP BM Resistant Transformation to blest phase on IM FIG. 3C and 3D E255R Mut-7 WCI F317L Ly BP BM Resistant Transformation to blast phase on IM FIG. 3C and 3D Mut-8 WCI T315I CP BM Resistant Lack of hematological response FIG. 3C and 3D Mut-9 WCI T315I CP BM Resistant Loss of complete histological response FIG. 3C and 3D Mut-10 WCI T315I CP BM Resistant No complete histological response FIG. 3C and 3D Mut-11 WCI F317L CP PB Resistant Lack of major cytogenic response FIG. 3C and 3D CML(R)1 UMMS -- CP PB Resistant Failure to achieve major molecular FIG. 3E and 4D and response 17A-B CML(R)2 UMMS -- CP PB Resistant Loss of major molecular FIG. 3E and 4D and response/complete molecular response 17A-B and complete cytogenic response CML(R)3 OHSU -- CP BM Resistant Cytogenic relapse or suboptimal primary FIG. 3E and 4D and response to IM 17A-B CML(R)4 OHSU -- CP BM Resistant Cytogenic relapse or suboptimal primary FIG. 3E and 4D and response to IM 17A-B CML(R)5 OHSU -- CP BM Resistant Cytogenic relapse or suboptimal primary FIG. 3E and 4D and response to IM 17A-B CML(R)6 OHSU -- BC PB Resistant Cytogenic relapse or suboptimal primary FIG. 4D and 17A-B response to IM WT-1 WCI -- CP PB Sensitive N/A FIG. 3C WT-2 WCI -- CP PB Sensitive N/A FIG. 3C WT-3 WCI -- CP PB Sensitive N/A FIG. 3C WT-4 WCI -- CP BM Sensitive N/A FIG. 3C WT-5 UMMS -- CP BM Sensitive N/A FIG. 3C WT-6 UMMS -- CP BM Sensitive N/A FIG. 3C WT-7 UMMS -- CP BM Sensitive N/A FIG. 3C WT-8 UMMS -- CP PB Sensitive N/A FIG. 3C WT-9 UMMS -- CP PB Sensitrve N/A FIG. 3C WT-10 UMMS -- CP PB Sensitive N/A FIG. 3C WT-11 UMMS -- CP PB Sensitive N/A FIG. 3C CML(S)1 UMMS -- CP PB Sensitive N/A FIG. 4D, 6B, 7F, 7G and 17A-B CML(S)2 UMMS -- CP PB Sensitive N/A FIG. 4D, 6B, 7F, 7G and 17A-B CML(S)3 OHSU -- CP BM Sensitive N/A FIG. 4D, 6B, 7F, 7G and 17A-B CML(S)4 OHSU -- CP BM Sensitive N/A FIG. 6B CML(S)5 OHSU -- CP BM Sensitive N/A FIG. 6B
TABLE-US-00006 TABLE 3 Relative expression level of IMSGs in IM-resistant BCR-ABL-wt CML patient samples. Relative expression was calculated by determining the average expression of a given gene in all 11 mutant BCR-ABL patient samples, and dividing by the expression of the gene in the individual wild-type BCR-ABL sample. Thus, the value represents the fold down-regulation in wild-type BCR-ABL samples. Table 3. Relative expression of IMSGs in IM-resistant BCR-ABL-wt CML patient samples. Sample Relative expression ID RAP1 CD22 CLEC5A DNASE1L1 ELF5 EXOSC7 MEGF8 RPP38 STK11 TMEM140 WNT7B P- RKCH WT-1 0.498 3.723 13.781 1.231 9.882 1.299 3.806 0.541 0.607 3.559 15.608 0- .204 WT-2 1.294 5.749 2.379 1.198 8.263 3.765 9.764 1.872 2.876 7.013 10.095 0.- 688 WT-3 1.086 0.651 12.468 1.058 1.963 3.295 0.915 0.784 1.710 1.780 1.552 0.- 176 WT-4 0.723 1.042 1.828 1.401 1.208 5.210 1.713 7.357 .0842 0.478 1.191 0.8- 58 WT-5 0.437 0.976 2.717 1.268 0.953 .0332 1.431 0.437 3.192 0.503 4.125 0.1- 16 WT-6 1.222 0.655 2.400 0.918 0.790 1.807 0.696 2.904 2.692 0.404 1.341 0.2- 87 WT-7 7.906 16.193 22.845 2.368 13.862 0.195 5.888 5.464 1.770 3.420 96.887- 2.075 WT-8 5.844 3.436 3.760 2.744 13.486 2.027 3.055 1.708 5.362 3.521 10.836 1- .735 WT-10 0.574 0.569 7.508 0.852 1.954 2.260 1.537 0.102 0.795 0.438 2.595 2.- 107 WT-11 3.589 2.881 12.961 1.870 5.556 0.682 15.511 7.422 1.651 8.578 31.855- 0.565 WT-12 1.509 2.863 2.445 1.921 5.634 1.999 3.179 0.611 2.273 1.422 1.549 0.- 208
Example 4. PKC.eta. Increases RAF/MEK/ERK Signaling Through Phosphorylation and Activation of CRAF
The next experiments were performed to understand in greater detail how PKC.eta. increased RAF/MEK/ERK signaling. FIG. 3F shows that even a relatively modest knockdown of PRKCH in IM-sensitive K562 cells decreased both phosphorylated MEK and ERK1/2 (see also FIG. 10A) and increased IM sensitivity (FIG. 15B). Conversely, K562/PRKCH cells had increased levels of both phosphorylated MEK and ERK1/2 (FIG. 3F). Most importantly, K562/PRKCH cells maintained high levels of phosphorylated MEK and ERK1/2 after IM treatment (FIG. 3F).
The finding that PKC.eta. affected both phosphorylated-MEK and -ERK1/2 levels indicated that PKC.eta. functioned upstream of MEK by, for example, stimulating RAF activity. There are three known RAF kinases: ARAF, BRAF and CRAF (30). In K562/PRKCH cells, knockdown of CRAF, but not ARAF or BRAF, resulted in decreased phosphorylated-ERK1/2 levels (FIG. 3F and FIG. 15B). Most importantly, in IM-treated K562/PRKCH cells, knockdown of CRAF, but not ARAF or BRAF, resulted in loss of sustained phosphorylated-ERK1/2 levels.
To determine whether CRAF was a direct substrate of PKC.eta., a glutathione-S-transferase (GST) fusion-protein containing a CRAF peptide bearing a potential PKC phosphorylation site at S497/S499 (31, 32) was derived. The in vitro kinase assay showed (see FIG. 3H) that wild-type PKC.eta., but not a kinase-dead mutant (K384R) (33), could phosphorylate the CRAF S497/S499 site. These results are consistent with several previous findings including phosphorylation of CRAF by PKC isoforms (31, 32, 34-36), and reduced activity of a CRAF S497A/S499A mutant (32, 34).
Example 5. Combined Treatment with IM and a MEK Inhibitor Synergistically Kill BCR-ABL-Independent IM-Resistant CML Cells
The results presented above show that BCR-ABL-independent IM resistance can result from increased PRKCH expression, leading to sustained RAF/MEK/ERK signaling after IM treatment. An implication of this conclusion is that simultaneous inhibition of BCR-ABL and RAF/MEK/ERK signaling might efficiently kill BCR-ABL-independent IM-resistant CML cells. To investigate this possibility, the effect of combining IM treatment with the FDA-approved MEK inhibitor trametinib (also called GSK1120212) was analyzed. Treatment with both IM and trametinib had a substantially greater effect than either drug alone in killing K562/PRKCH cells (FIG. 4A), representative IMSG KD K562 cell lines (FIG. 4B), and BCR-ABL+ mouse primary bone marrow cells over-expressing Prkch (FIG. 4C). In most instances, the effect of combined drug treatment was synergistic (table 4). The modest effect of trametinib alone on K562 cell lines likely reflects stimulation of RAF/MEK/ERK signaling by BCR-ABL. Finally, treatment with both IM and trametinib had a significantly (P.ltoreq.0.01) greater effect than either drug alone in killing primary leukemic cells from BCR-ABL-independent IM-resistant CML patients (FIG. 4D and FIG. 17A), Moreover, these leukemic cells were killed more effectively by combined treatment with IM and trametinib than by IM and a JAK-STAT or PI3K inhibitor, and neither of these latter two drug combinations were significantly more effective than IM alone (FIG. 17B).
TABLE-US-00007 TABLE 4 Actual P values for all comparisons in this study. P value BH-adjusted P value Sample (shRNA vs NS) (shRNA vs NS) FIG. 1B Statistical test: One-way ANOVA (P value = 1.0406E-06) followed by predetermined contrasts within the ANOVA framework with Benjamini-Hochberg correction. BAP1 1.07513E-06 5.59068E-06 BCAP29 0.00040146 0.000497046 CD22 3.00752E-05 8.36825E-05 CELA1 2.68843E-08 2.32997E-07 CLEC5A 7.71503E-10 1.00295E-08 DNASE1L1 0.000726651 0.000787205 DPM1 9.38085E-06 4.06503E-05 EBF1 7.19634E-05 0.000133646 ELF5 0.000235868 0.000360739 EXOSC7 3.21856E-05 8.36825E-05 E2F4 0.000317805 0.000434891 IDH3A 0.000552982 0.000653525 LILRA3 6.15163E-05 0.000123033 MEGF8 0.00011352 0.000184469 MMP7 1.8066E-05 6.71023E-05 RCVRN 0.000260338 0.000376044 RPP38 4.7514E-05 0.000102947 STK11 2.38392E-11 6.19818E-10 STYXL1 0.002841565 0.002955228 TCEAL1 2.34123E-05 7.60901E-05 TMEM140 0.004475609 0.004475609 TRAF4 0.000616875 0.000697337 UBAP2L 0.000377057 0.000490174 WNT7B 4.09493E-05 9.67892E-05 ZACN 8.87069E-05 0.000153759 FIG. 1C Statistical test: One-way ANOVA (P value = 6.23277E-38) followed by predetermined contrasts within the ANOVA framework with Benjamini-Hochberg correction BAP1 8.98213E-33 1.12277E-31 BCAP29 2.17058E-22 9.04407E-22 CD22 1.29641E-10 1.80057E-10 CELA1 1.86785E-09 2.33481E-09 CLEC5A 4.92614E-25 3.07884E-24 DNASE1L1 1.07278E-11 1.57761E-11 DPM1 2.13891E-18 5.94141E-18 EBF1 8.31631E-07 8.66282E-07 ELF5 2.24623E-17 5.10507E-17 EXOSC7 1.48547E-34 3.71366E-33 E2F4 2.55704E-15 4.91739E-15 IDH3A 1.11839E-24 5.59197E-24 LILRA3 1.43058E-21 5.1092E-21 MEGF8 3.72116E-12 5.81431E-12 MMP7 1.42847E-25 1.19039E-24 RCVRN 4.84833E-07 5.26993E-07 RPP38 2.01321E-17 5.03303E-17 STK11 2.26331E-10 2.97804E-10 STYXL1 1.03672E-07 1.17809E-07 TCEAL1 3.00559E-13 5.36713E-13 TMEM140 2.36532E-20 7.39161E-20 TRAF4 0.008468345 0.008468345 UBAP2L 4.54415E-17 9.46698E-17 WNT7B 1.88709E-12 3.14516E-12 ZACN 1.86812E-08 2.22395E-08 FIG. 1D Statistical test: One-way ANOVA (P value = 8.581e-15) followed by predetermined contrasts within the ANOVA framework with Benjamini-Hochberg correction Bap1 0.000105724 0.000121582 Bcap29 5.20E-05 6.29E-05 Cd22 4.04E-11 1.55E-10 Cela1 0.014187481 0.01553867 Clec5a 2.69E-09 6.86E-09 Dnase1l1 1.74E-11 1.00E-10 Dpm1 2.26E-09 6.49E-09 Ebf1 5.32E-07 1.02E-06 Elf5 8.98E-13 1.03E-11 Exosc7 3.83E-12 2.94E-11 E2f4 9.80E-11 3.22E-10 Idh3a 3.12E-11 1.44E-10 Megf8 7.52E-06 1.24E-05 Mmp7 0.357567304 0.357567304 Rcvrn 5.24E-07 1.02E-06 Rpp38 2.06E-05 2.76E-05 Stk11 2.16E-05 2.76E-05 Styxl1 0.180762343 0.188978814 Tceal1 2.13E-07 4.91E-07 Tmem140 7.51E-13 1.03E-11 Traf4 1.10E-05 1.68E-05 Ubap2l 7.65E-07 1.35E-06 Wnt7b 1.20E-05 1.73E-05 FIG. 1F Statistical test: Correlation analysis (performed in GraphPad Prism 6). Pearson's correlation coefficient was calculated to reach a two-tailed P value with 95% confidence interval. P value.sup. 0.0117
Example 6. IM and a MEK Inhibitor Prolong Survival in Mouse Models of BCR-ABL-Independent IM-Resistant CML
Based upon the cell culture results, the ability of this drug combination to prolong survival was analyzed in mouse models of BCR-ABL-independent IM-resistant CML. Briefly, mouse primary bone marrow cells were transduced with a retrovirus co-expressing BCR-ABL and either Prkch (FIG. 18A) or an shRNA targeting one of two representative IMSGs, Clec5A or Elf5 (FIG. 18B), followed by transplantation into lethally irradiated syngeneic mice. Combined treatment with IM and trametinib was substantially more effective than either drug alone at suppressing leukemic progression, as evidenced by a reduced white blood cell count (FIGS. 4, E and F), and prolonging survival (FIGS. 4, F and G). In addition to prolonged survival, the general appearance and behavior of mice treated with IM and trametinib was normal, suggesting minimal drug toxicity.
Example 7. PRKCH Modulates Proliferation of BCR-ABL+ Cells, Disease Progression, and IM Sensitivity
The finding that knockdown of PRKCH in K562 cells reduced levels of phosphorylated-ERK1/2 (FIG. 3F) raised the possibility that PRKCH might modulate the proliferation and survival of BCR-ABL+ cells and thus affect disease progression. To investigate this possibility, mouse primary bone marrow cells were transduced with a retrovirus co-expressing BCR-ABL and a Prkch shRNA (FIG. 5A). Prkch knockdown led decreased levels of phosphorylated-ERK1/2, similar to the results in K562 cells. FIG. 5B shows that knockdown of Prkch (FIG. 19A) reduced the ability of untreated BCR-ABL+ mouse primary bone marrow cells to form colonies in methylcellulose (see also FIG. 19B). Moreover, the colony formation assay in FIG. 5C shows that knockdown of Prkch markedly increased the IM sensitivity of BCR-ABL+ mouse primary bone marrow cells.
Next, the Prkch KD bone marrow cells were transplanted into syngeneic mice to induce CML-like disease and analyzed the effect of Prkch knockdown on leukemic progression. In untreated mice, Prkch knockdown resulted in a lower white blood cell count (FIG. 5D), reduced spleen size (FIG. 5E), decreased infiltration of the lung and spleen by leukemic cells (FIG. 5F), and increased survival (FIG. 5G). Thus, in the absence of IM treatment, PRKCH promotes disease progression, although this effect may be relatively minor. More importantly, knockdown of Prkch markedly increased survival of IM-treated mice with CML-like disease (FIG. 5G).
Example 8. IM-Resistant Murine and Human CML Stem Cells Contain High Levels of PRKCH
To investigate the possibility that PRKCH might contribute to the intrinsic resistance of CML stem cells to IM, a CML-like disease was induced in mice, and BCR-ABL+ murine stem cells (Lin-Sca1+Kit+), progenitor cells (Lin-) and mature cells (Lin+Gr1+) were isolated by fluorescence activated cell sorting (FACS) (Hamilton et al., Blood 119, 1501-1510 (2012); Neering et al., Blood 110, 2578-2585 (2007)). The qRT-PCR results, shown in FIG. 6A, demonstrated that IM-resistant murine CML stem cells (Hamilton et al., Blood 119, 1501-1510 (2012); Zhang et al., Cancer Cell 17, 427-442 (2010); Zhang et al., Nat Genet 44, 861-871 (2012)) and see below) had substantially higher expression of Prkch compared to murine CML progenitor and mature cells, both of which are IM sensitive ((Hamilton et al., Blood 119, 1501-1510 (2012); Li et al., Cancer Cell 21, 266-281 (2012)) and FIG. 20).
The next experiments asked whether PRKCH expression levels were also high in human CML stem cells. CML stem cells (CD34+CD38-) and CML progenitor cells (CD34+CD38+) (Corbin et al., J Clin Invest 121, 396-409 (2011); Jiang et al., Leukemia 21, 926-935 (2007); Lobo et al., Annu Rev Cell Dev Biol 23, 675-699 (2007)) were isolated from newly diagnosed CML patients. The qRT-PCR results in FIG. 6B show that IM-resistant human CML stem cells (Graham et al., Blood 99, 319-325 (2002); Corbin et al., J Clin Invest 121, 396-409 (2011); Bhatia et al., Blood 101, 4701-4707 (2003); Chomel et al., Blood 118, 3657-3660 (2011); Pellicano et al., Stem Cells 32, 1373-1379 (2014)) and see below) had substantially higher expression of PRKCH compared to human CML progenitor cells, which are IM sensitive (Corbin et al., J Clin Invest 121, 396-409 (2011); Jiang et al., Leukemia 21, 926-935 (2007)). Analysis of a published expression profiling study comparing highly enriched human CML stem and progenitor cell populations (Gerber et al., Oncotarget 4, 715-728 (2013)) revealed similar differences in PRKCH expression levels (FIG. 6C). Microarray analysis indicates that PRKCH expression is much higher in hematopoietic stem cells than in mature myeloid cells (Konuma et al., Exp Hematol 39, 697-709 e695 (2011); Bagger et al., Nucleic Acids Res 41, D1034-1039 (2013)), suggesting that high PRKCH expression may be a marker of stemness.
Example 9. High Prkch Expression Contributes to the IM Resistance of CML Stem Cells
Several experiments were performed to determine whether the high Prkch levels in murine CML stem cells contributes to their IM resistance. First the contribution of Prkch, and as a comparison BCR-ABL, to RAF/MEK/ERK signaling was assessed in murine CML stem cells. Prkch KD bone marrow cells were isolated from leukemic mice, permeabilized and incubated with an antibody against phosphorylated-ERK1/2 or IgG isotype antibody as a negative control, and then analyzed by FACS to determine the phosphorylated-ERK1/2 levels in CML progenitor and stem cells. FIG. 7A shows that knockdown of Prkch reduced levels of phosphorylated ERK1/2 in both CML progenitor and stem cells (see also FIG. 21A).
To evaluate the role of BCR-ABL, bone marrow cells were isolated from leukemic mice and treated with either IM or trametinib, and phosphorylated ERK1/2 was monitored as described above. FIG. 7B shows, as expected, that trametinib reduced phosphorylated ERK1/2 in both CML progenitor and stem cells (see also FIG. 21B). In contrast, IM reduced levels of phosphorylated ERK1/2 in IM-sensitive CML progenitor cells but not in IM-resistant CML stem cells. Collectively, these results indicate that in CML stem cells PKC.eta. has a more prominent role than BCR-ABL in promoting RAF/MEK/ERK signaling.
Next, a series of experiments was performed to determine whether Prkch affects survival of CML stem cells after IM treatment. In the first experiment, mouse primary bone marrow cells were transduced with a retrovirus co-expressing BCR-ABL and either Prkch or a control non-silencing (NS) shRNA, followed by transplantation into lethally irradiated syngeneic mice. BCR-ABL+ murine stem cells (Lin-Sca1+Kit+) were isolated from the mice and IM sensitivity determined in a colony formation assay. The results in FIG. 7C show that Prkch knockdown markedly increased the IM sensitivity of CML stem cells. In the second experiment, mice with CML-like disease were treated with either vehicle or IM in parallel for two weeks, and then sacrificed at the same time followed by quantification of CML stem cells by FACS analysis. FIG. 7D shows, as expected, that IM treatment had little effect on the number of CML stem cells expressing a control NS shRNA, confirming that murine CML stem cells are IM-resistant. In contrast, IM treatment markedly reduced the number of Prkch KD CML stem cells. Annexin V staining revealed that IM treatment induced a higher level of apoptosis in Prkch KD compared to control CML stem cells (FIGS. 22A and B). Finally, combined treatment with IM and trametinib synergistically killed murine CML stem cells (FIG. 7E), which was due, at least in part, to the induction of apoptosis (FIGS. 22C and D). By contrast, treatment with IM and trametinib had negligible effect on normal murine hematopoietic stem cells (FIG. 23A).
Knockdown of PRKCH also increased the IM sensitivity of IM-resistant human CML stem cells (FIG. 7F). Moreover, treatment with both IM and trametinib had a substantially greater effect than either drug alone in killing human CML stem cells (FIG. 7G), and a negligible effect on normal human hematopoietic CD34+ cells and hematopoietic stem cells (CD34+CD38-) (FIG. 23B). Collectively, these results indicate that PRKCH is expressed at relatively high levels in both mouse and human CML stem cells and this contributes to their IM resistance.
REFERENCES AND NOTES
1. S. Faderl, M. Talpaz, Z. Estrov, S. O'Brien, R. Kurzrock, H. M. Kantarjian, The biology of chronic myeloid leukemia. N Engl J Med 341, 164-172 (1999). 2. M. W. Deininger, J. M. Goldman, J. V. Melo, The molecular biology of chronic myeloid leukemia. Blood 96, 3343-3356 (2000). 3. R. Kurzrock, H. M. Kantarjian, B. J. Druker, M. Talpaz, Philadelphia chromosome-positive leukemias: from basic mechanisms to molecular therapeutics. Ann Intern Med 138, 819-830 (2003). 4. J. Colicelli, ABL tyrosine kinases: evolution of function, regulation, and specificity. Sci Signal 3, re6 (2010). 5. L. S. Steelman, S. C. Pohnert, J. G. Shelton, R. A. Franklin, F. E. Bertrand, J. A. McCubrey, JAK/STAT, Raf/MEK/ERK, PI3K/Akt and BCR-ABL in cell cycle progression and leukemogenesis. Leukemia 18, 189-218 (2004). 6. X. An, A. K. Tiwari, Y. Sun, P. R. Ding, C. R. Ashby, Jr., Z. S. Chen, BCR-ABL tyrosine kinase inhibitors in the treatment of Philadelphia chromosome positive chronic myeloid leukemia: a review. Leuk Res 34, 1255-1268 (2010). 7. N. von Bubnoff, C. Peschel, J. Duyster, Resistance of Philadelphia-chromosome positive leukemia towards the kinase inhibitor imatinib (STI571, Glivec): a targeted oncoprotein strikes back. Leukemia 17, 829-838 (2003). 8. A. Quintas-Cardama, H. M. Kantarjian, J. E. Cortes, Mechanisms of primary and secondary resistance to imatinib in chronic myeloid leukemia. Cancer Control 16, 122-131 (2009). 9. E. Jabbour, H. Kantarjian, D. Jones, M. Talpaz, N. Bekele, S. O'Brien, X. Zhou, R. Luthra, G. Garcia-Manero, F. Giles, M. B. Rios, S. Verstovsek, J. Cortes, Frequency and clinical significance of BCR-ABL mutations in patients with chronic myeloid leukemia treated with imatinib mesylate. Leukemia 20, 1767-1773 (2006). 10. N. P. Shah, J. M. Nicoll, B. Nagar, M. E. Gorre, R. L. Paquette, J. Kuriyan, C. L. Sawyers, Multiple BCR-ABL kinase domain mutations confer polyclonal resistance to the tyrosine kinase inhibitor imatinib (STI571) in chronic phase and blast crisis chronic myeloid leukemia. Cancer cell 2, 117-125 (2002). 11. E. Weisberg, P. W. Manley, S. W. Cowan-Jacob, A. Hochhaus, J. D. Griffin, Second generation inhibitors of BCR-ABL for the treatment of imatinib-resistant chronic myeloid leukaemia. Nature reviews. Cancer 7, 345-356 (2007). 12. N. J. Donato, J. Y. Wu, J. Stapley, H. Lin, R. Arlinghaus, B. B. Aggarwal, S. Shishodia, M. Albitar, K. Hayes, H. Kantarjian, M. Talpaz, Imatinib mesylate resistance through BCR-ABL independence in chronic myelogenous leukemia. Cancer research 64, 672-677 (2004). 13. J. S. Khorashad, M. Anand, D. Marin, S. Saunders, T. Al-Jabary, A. Iqbal, S. Margerison, J. V. Melo, J. M. Goldman, J. F. Apperley, J. Kaeda, The presence of a BCR-ABL mutant allele in CML does not always explain clinical resistance to imatinib. Leukemia 20, 658-663 (2006). 14. M. Dean, T. Fojo, S. Bates, Tumour stem cells and drug resistance. Nature reviews. Cancer 5, 275-284 (2005). 15. S. M. Graham, H. G. Jorgensen, E. Allan, C. Pearson, M. J. Alcorn, L. Richmond, T. L. Holyoake, Primitive, quiescent, Philadelphia-positive stem cells from patients with chronic myeloid leukemia are insensitive to STI571 in vitro. Blood 99, 319-325 (2002). 16. A. S. Corbin, A. Agarwal, M. Loriaux, J. Cortes, M. W. Deininger, B. J. Druker, Human chronic myeloid leukemia stem cells are insensitive to imatinib despite inhibition of BCR-ABL activity. The Journal of clinical investigation 121, 396-409 (2011). 17. A. Hamilton, G. V. Helgason, M. Schemionek, B. Zhang, S. Myssina, E. K. Allan, F. E. Nicolini, C. Muller-Tidow, R. Bhatia, V. G. Brunton, S. Koschmieder, T. L. Holyoake, Chronic myeloid leukemia stem cells are not dependent on Bcr-Abl kinase activity for their survival. Blood 119, 1501-1510 (2012). 18. L. C. Andersson, K. Nilsson, C. G. Gahmberg, K562--a human erythroleukemic cell line. International journal of cancer. Journal international du cancer 23, 143-147 (1979). 19. J. M. Silva, M. Z. Li, K. Chang, W. Ge, M. C. Golding, R. J. Rickles, D. Siolas, G. Hu, P. J. Paddison, M. R. Schlabach, N. Sheth, J. Bradshaw, J. Burchard, A. Kulkarni, G. Cavet, R. Sachidanandam, W. R. McCombie, M. A. Cleary, S. J. Elledge, G. J. Hannon, Second-generation shRNA libraries covering the mouse and human genomes. Nat Genet 37, 1281-1288 (2005). 20. T. Ohkubo, T. Kamamoto, K. Kita, A. Hiraoka, Y. Yoshida, H. Uchino, A novel Ph1 chromosome positive cell line established from a patient with chronic myelogenous leukemia in blastic crisis. Leukemia research 9, 921-926 (1985). 21. G. Q. Daley, R. A. Van Etten, D. Baltimore, Induction of chronic myelogenous leukemia in mice by the P210bcr/abl gene of the Philadelphia chromosome. Science 247, 824-830 (1990). 22. S. Li, R. L. Ilaria, Jr., R. P. Million, G. Q. Daley, R. A. Van Etten, The P190, P210, and P230 forms of the BCR/ABL oncogene induce a similar chronic myeloid leukemia-like syndrome in mice but have different lymphoid leukemogenic activity. The Journal of experimental medicine 189, 1399-1412 (1999). 23. N. P. Shah, C. Tran, F. Y. Lee, P. Chen, D. Norris, C. L. Sawyers, Overriding imatinib resistance with a novel ABL kinase inhibitor. Science 305, 399-401 (2004). 24. N. J. Donato, J. Y. Wu, J. Stapley, G. Gallick, H. Lin, R. Arlinghaus, M. Talpaz, BCR-ABL independence and LYN kinase overexpression in chronic myelogenous leukemia cells selected for resistance to STI571. Blood 101, 690-698 (2003). 25. J. ten Hoeve, R. B. Arlinghaus, J. Q. Guo, N. Heisterkamp, J. Groffen, Tyrosine phosphorylation of CRKL in Philadelphia+leukemia. Blood 84, 1731-1736 (1994). 26. T. Takahashi, H. Ueno, M. Shibuya, VEGF activates protein kinase C-dependent, but Ras-independent Raf-MEK-MAP kinase pathway for DNA synthesis in primary endothelial cells. Oncogene 18, 2221-2230 (1999). 27. Y. Ueda, S. Hirai, S. Osada, A. Suzuki, K. Mizuno, S. Ohno, Protein kinase C activates the MEK-ERK pathway in a manner independent of Ras and dependent on Raf. The Journal of biological chemistry 271, 23512-23519 (1996). 28. R. M. Uht, S. Amos, P. M. Martin, A. E. Riggan, I. M. Hussaini, The protein kinase C-eta isoform induces proliferation in glioblastoma cell lines through an ERK/Elk-1 pathway. Oncogene 26, 2885-2893 (2007). 29. A. Aderem, The MARCKS brothers: a family of protein kinase C substrates. Cell 71, 713-716 (1992). 30. C. Wellbrock, M. Karasarides, R. Marais, The RAF proteins take centre stage. Nature reviews. Molecular cell biology 5, 875-885 (2004). 31. M. P. Carroll, W. S. May, Protein kinase C-mediated serine phosphorylation directly activates Raf-1 in murine hematopoietic cells. The Journal of biological chemistry 269, 1249-1256 (1994). 32. W. Kolch, G. Heidecker, G. Kochs, R. Hummel, H. Vahidi, H. Mischak, G. Finkenzeller, D. Marme, U. R. Rapp, Protein kinase C alpha activates RAF-1 by direct phosphorylation. Nature 364, 249-252 (1993). 33. T. Suzuki, B. C. Elias, A. Seth, L. Shen, J. R. Turner, F. Giorgianni, D. Desiderio, R. Guntaka, R. Rao, PKC eta regulates occludin phosphorylation and epithelial tight junction integrity. Proceedings of the National Academy of Sciences of the United States of America 106, 61-66 (2009). 34. H. Cai, U. Smola, V. Wixler, I. Eisenmann-Tappe, M. T. Diaz-Meco, J. Moscat, U. Rapp, G. M. Cooper, Role of diacylglycerol-regulated protein kinase C isotypes in growth factor activation of the Raf-1 protein kinase. Molecular and cellular biology 17, 732-741 (1997). 35. D. C. Schonwasser, R. M. Marais, C. J. Marshall, P. J. Parker, Activation of the mitogen-activated protein kinase/extracellular signal-regulated kinase pathway by conventional, novel, and atypical protein kinase C isotypes. Molecular and cellular biology 18, 790-798 (1998). 36. O. Sozeri, K. Vollmer, M. Liyanage, D. Frith, G. Kour, G. E. Mark, 3rd, S. Stabel, Activation of the c-Raf protein kinase by protein kinase C phosphorylation. Oncogene 7, 2259-2262 (1992). 37. J. M. Gerber, J. L. Gucwa, D. Esopi, M. Gurel, M. C. Haffner, M. Vala, W. G. Nelson, R. J. Jones, S. Yegnasubramanian, Genome-wide comparison of the transcriptomes of highly enriched normal and chronic myeloid leukemia stem and progenitor cell populations. Oncotarget 4, 715-728 (2013). 38. L. M. Packer, S. Rana, R. Hayward, T. O'Hare, C. A. Eide, A. Rebocho, S. Heidorn, M. S. Zabriskie, I. Niculescu-Duvaz, B. J. Druker, C. Springer, R. Marais, Nilotinib and MEK inhibitors induce synthetic lethality through paradoxical activation of RAF in drug-resistant chronic myeloid leukemia. Cancer cell 20, 715-727 (2011). 39. J. Hentschel, I. Rubio, M. Eberhart, C. Hipler, J. Schielher, K. Schubert, I. F. Loncarevic, U. Wittig, A. Baniahmad, F. von Eggeling, BCR-ABL- and Ras-independent activation of Raf as a novel mechanism of Imatinib resistance in CML. Int J Oncol 39, 585-591 (2011). 40. T. Nambu, N. Araki, A. Nakagawa, A. Kuniyasu, T. Kawaguchi, A. Hamada, H. Saito, Contribution of BCR-ABL-independent activation of ERK1/2 to acquired imatinib resistance in K562 chronic myeloid leukemia cells. Cancer Sci 101, 137-142 (2010). 41. R. Chakrabarti, J. Hwang, M. Andres Blanco, Y. Wei, M. Lukacisin, R. A. Romano, K. Smalley, S. Liu, Q. Yang, T. Ibrahim, L. Mercatali, D. Amadori, B. G. Haffty, S. Sinha, Y. Kang, Elf5 inhibits the epithelial-mesenchymal transition in mammary gland development and breast cancer metastasis by transcriptionally repressing Snail2. Nature cell biology 14, 1212-1222 (2012). 42. R. Escamilla-Hernandez, R. Chakrabarti, R. A. Romano, K. Smalley, Q. Zhu, W. Lai, M. S. Halfon, M. J. Buck, S. Sinha, Genome-wide search identifies Ccnd2 as a direct transcriptional target of Elf5 in mouse mammary gland. BMC molecular biology 11, 68 (2010). 43. M. Kalyuga, D. Gallego-Ortega, H. J. Lee, D. L. Roden, M. J. Cowley, C. E. Caldon, A. Stone, S. L. Allerdice, F. Valdes-Mora, R. Launchbury, A. L. Statham, N. Armstrong, M. C. Alles, A. Young, A. Egger, W. Au, C. L. Piggin, C. J. Evans, A. Ledger, T. Brummer, S. R. Oakes, W. Kaplan, J. M. Gee, R. I. Nicholson, R. L. Sutherland, A. Swarbrick, M. J. Naylor, S. J. Clark, J. S. Carroll, C. J. Ormandy, ELF5 suppresses estrogen sensitivity and underpins the acquisition of antiestrogen resistance in luminal breast cancer. PLoS biology 10, e1001461 (2012). 44. J. Mullenders, R. Bernards, Loss-of-function genetic screens as a tool to improve the diagnosis and treatment of cancer. Oncogene 28, 4409-4420 (2009). 45. D. Bruennert, A. Czibere, I. Bruns, R. Kronenwett, N. Gattermann, R. Haas, F. Neumann, Early in vivo changes of the transcriptome in Philadelphia chromosome-positive CD34+ cells from patients with chronic myelogenous leukaemia following imatinib therapy. Leukemia 23, 983-985 (2009). 46. J. P. Radich, H. Dai, M. Mao, V. Oehler, J. Schelter, B. Druker, C. Sawyers, N. Shah, W. Stock, C. L. Willman, S. Friend, P. S. Linsley, Gene expression changes associated with progression and response in chronic myeloid leukemia. Proceedings of the National Academy of Sciences of the United States of America 103, 2794-2799 (2006). 47. C. Gazin, N. Wajapeyee, S. Gobeil, C. M. Virbasius, M. R. Green, An elaborate pathway required for Ras-mediated epigenetic silencing. Nature 449, 1073-1077 (2007). 48. B. S. Carvalho, R. A. Irizarry, A framework for oligonucleotide microarray preprocessing. Bioinformatics 26, 2363-2367 (2010). 49. R. Ihaka, R. Gentleman, R: A language for data analysis and graphics. J. Comput. Graph Stat. 5, 299-314 (1996). 50. Y. Benjamini, Y. Hochberg, Controlling the false discovery rate: a practical and powerful approach to multiple testing. J. Roy. Statist. Soc. Ser. B 57, 289-300 (1995). 51. B. K. Slinker, The statistics of synergism. J Mol Cell Cardiol 30, 723-731 (1998).
OTHER EMBODIMENTS
It is to be understood that while the invention has been described in conjunction with the detailed description thereof, the foregoing description is intended to illustrate and not limit the scope of the invention, which is defined by the scope of the appended claims. Other aspects, advantages, and modifications are within the scope of the following claims.
SEQUENCE LISTINGS
1
115120DNAArtificial SequenceSynthetically generated primer 1atctgggtcc tgtcatcagc 20219DNAArtificial SequenceSynthetically generated primer 2gctgccttgg attggtctg 19320DNAArtificial SequenceSynthetically generated primer 3aactagtaga agaccaggag 20419DNAArtificial SequenceSynthetically generated Primer 4cgaaagtctc tctgactgc 19521DNAArtificial sequenceSynthetically generated primer 5cacctcaatg acagtggtca g 21621DNAArtificial sequenceSynthetically generated primer 6tggatcggat acccatagca g 21718DNAArtificial sequenceSynthetically generated primer 7tccagctcct cctactgg 18820DNAArtificial sequenceSynthetically generated primer 8cagaatactt gccattcacc 20920DNAArtificial sequenceSynthetically generated primer 9aggtggcgtt ggatcaacaa 201020DNAArtificial sequenceSynthetically generated primer 10ttaggccaat ggtcgcacag 201120DNAArtificial sequenceSynthetically generated primer 11ctgcacacca ctcctaaggc 201219DNAArtificial sequenceSynthetically generated primer 12caggcgcttt ttggtcagt 191322DNAArtificial sequenceSynthetically generated primer 13atggatgctg atctctcaca cc 221423DNAArtificial sequenceSynthetically generated primer 14ccatttcctt tgtagcgagt tcc 231521DNAArtificial sequenceSynthetically generated primer 15cctggtgttg tggaagtcac a 211619DNAArtificial sequenceSynthetically generated primer 16gctcaacgaa cccaccatc 191723DNAArtificial sequenceSynthetically generated primer 17gctgattcca actgcttgaa aac 231824DNAArtificial sequenceSynthetically generated primer 18cagttttctt caggagatag aagc 241922DNAArtificial sequenceSynthetically generated primer 19ccaaatgaag gctacttgga gt 222021DNAArtificial sequenceSynthetically generated primer 20tagagggtgt tagcgatctc g 212123DNAArtificial sequenceSynthetically generated primer 21atcgggctaa tcgagaaaaa gtc 232221DNAArtificial sequenceSynthetically generated primer 22tgctggtcta gttcttgctc c 212321DNAArtificial sequenceSynthetically generated primer 23agccggtcac ccatctatga a 212421DNAArtificial sequenceSynthetically generated primer 24tagagacaca tggtcggaca t 212518DNAArtificial sequenceSynthetically generated primer 25gctcactcag ctccaacc 182618DNAArtificial sequenceSynthetically generated primer 26tcaccagcct tggattcg 182721DNAArtificial sequenceSynthetically generated primer 27ttctggtctc cgagtcactc a 212822DNAArtificial sequenceSynthetically generated primer 28gccgtccact taatagggaa ct 222919DNAArtificial sequenceSynthetically generated primer 29cgcctgtctt cgtcacgtc 193020DNAArtificial sequenceSynthetically generated primer 30ctgctgaaag gtgagcaagt 203119DNAArtificial sequenceSynthetically generated primer 31gtggagtgcc agatgttgc 193220DNAArtificial sequenceSynthetically generated primer 32atcgatccac tgaatatgcg 203323DNAArtificial sequenceSynthetically generated primer 33gtgacttgat gttccacatt cag 233425DNAArtificial sequenceSynthetically generated primer 34attgtccagt ttcagatctc tatag 253518DNAArtificial sequenceSynthetically generated primer 35cacgccggaa aagcgagc 183620DNAArtificial sequenceSynthetically generated primer 36ggatcagtcg cagaatttcc 203723DNAArtificial sequenceSynthetically generated primer 37gactttgtgg acgaagtaag agc 233821DNAArtificial sequenceSynthetically generated primer 38gctttccaga ggttcagtct c 213918DNAArtificial sequenceSynthetically generated primer 39ctgcaagcag cagtgagg 184019DNAArtificial sequenceSynthetically generated primer 40aaccggcagg aagactgag 194119DNAArtificial sequenceSynthetically generated primer 41gaccccaaga ttcagaagg 194219DNAArtificial sequenceSynthetically generated primer 42tccggggaat cttctatcc 194321DNAArtificial sequenceSynthetically generated primer 43tcgttctcgc ccgcaattta g 214421DNAArtificial sequenceSynthetically generated primer 44gataaggacg gctccgtttt g 214522DNAArtificial sequenceSynthetically generated primer 45tcggcttcta taacttctgc ct 224620DNAArtificial sequenceSynthetically generated primer 46ctgttgcact gggctaggag 204718DNAArtificial sequenceSynthetically generated primer 47tgcctatccg ctgcatcc 184820DNAArtificial sequenceSynthetically generated primer 48ttcatggggc agcgattagc 204920DNAArtificial sequenceSynthetically generated primer 49atagcagcgg caatacgtgg 205023DNAArtificial sequenceSynthetically generated primer 50gaagacacat tagaggcagt gaa 235121DNAArtificial sequenceSynthetically generated primer 51gaagcagggc tactacaacc a 215221DNAArtificial sequenceSynthetically generated primer 52cggcctcatt gttatgcagg t 215319DNAArtificial sequenceSynthetically generated primer 53gagaggggaa cagcgagag 195420DNAArtificial sequenceSynthetically generated primer 54cagtctcagg ccagcttctc 205522DNAArtificial sequenceSynthetically generated primer 55tagtcctccc agcaaatgta ag 225620DNAArtificial sequenceSynthetically generated primer 56gtcttcctcc tcctgcatag 205723DNAArtificial sequenceSynthetically generated primer 57ttctgtctgc cctttattcc tcc 235822DNAArtificial sequenceSynthetically generated primer 58tcttacttct ctcacggcat ct 225922DNAArtificial sequenceSynthetically generated primer 59aagctggatg tccattatgc tc 226020DNAArtificial sequenceSynthetically generated primer 60tctgtaggag gtgacgtctg 206120DNAArtificial sequenceSynthetically generated primer 61tctggatgcc agggtgattc 206224DNAArtificial sequenceSynthetically generated primer 62tattcatcca ggaaatgtaa gcag 246322DNAArtificial sequenceSynthetically generated primer 63gaaactggga ttttcaccaa gg 226423DNAArtificial sequenceSynthetically generated primer 64tcctgaagat acttcagttt ctc 236524DNAArtificial sequenceSynthetically generated primer 65tatgtgtata tctacaggtc tgac 246622DNAArtificial sequenceSynthetically generated primer 66accacacttg gaagagtttt gc 226725DNAArtificial sequenceSynthetically generated primer 67gtaattttga tattgtctct ggaac 256824DNAArtificial sequenceSynthetically generated primer 68cttcttttcg gtataatctg aagc 246920DNAArtificial sequenceSynthetically generated primer 69ctcaccctat gccattgtgc 207022DNAArtificial sequenceSynthetically generated primer 70cgaaagcact cttctgtttc ac 227120DNAArtificial sequenceSynthetically generated primer 71tgcctttgag catcagacag 207220DNAArtificial sequenceSynthetically generated primer 72tactggtcgc agcagaattg 207320DNAArtificial sequenceSynthetically generated primer 73gtgatgacct tggcacagag 207420DNAArtificial sequenceSynthetically generated primer 74cattccagca gcagcacatc 207522DNAArtificial sequenceSynthetically generated primer 75acatctgaga ttgcagtgag tg 227621DNAArtificial sequenceSynthetically generated primer 76tactactatc cagcagtgca g 217719DNAArtificial sequenceSynthetically generated primer 77tgggtgtcca aggtctctc 197822DNAArtificial sequenceSynthetically generated primer 78ctcccactga ataggtgctt tg 227923DNAArtificial sequenceSynthetically generated primer 79ctgccagtgt tctaggaaac tac 238021DNAArtificial sequenceSynthetically generated primer 80atgtgagtaa cggccactag g 218119DNAArtificial sequenceSynthetically generated primer 81tgaggacgca ggagtgaac 198222DNAArtificial sequenceSynthetically generated primer 82cgtcctttgt aagactgaag tc 228321DNAArtificial sequenceSynthetically generated primer 83tccggcacga tgaagttcaa t 218420DNAArtificial sequenceSynthetically generated primer 84tacgctcacc gtcaggtagg 208519DNAArtificial sequenceSynthetically generated primer 85acgacgtaga cggcaatgg 198620DNAArtificial sequenceSynthetically generated primer 86ccgcttttct ggggtgtttt 208721DNAArtificial sequenceSynthetically generated primer 87cttctgctca gggttttcaa g 218821DNAArtificial sequenceSynthetically generated primer 88atgtcttctc tctccaaggt g 218921DNAArtificial sequenceSynthetically generated primer 89agtatgactg tagtgcccta c 219018DNAArtificial sequenceSynthetically generated primer 90caggacctgt ccaggcac 189120DNAArtificial sequenceSynthetically generated primer 91ctgcttttct gcgagccaac 209221DNAArtificial sequenceSynthetically generated primer 92tgtcgttttg atcggacatc c 219321DNAArtificial sequenceSynthetically generated primer 93gtatccgccc tcaattcata g 219421DNAArtificial sequenceSynthetically generated primer 94ctccgttttg ccttccaatg c 219521DNAArtificial sequenceSynthetically generated primer 95cagcgttggt ttttgtctcc c 219621DNAArtificial sequenceSynthetically generated primer 96gaggagagcg tagaacatca g 219721DNAArtificial sequenceSynthetically generated primer 97cccggcttcg actacaagtt c 219821DNAArtificial sequenceSynthetically generated primer 98tcagggcatt tgaagactcc t 219923DNAArtificial sequenceSynthetically generated primer 99tgctacaact tcaggaaaag ctc 2310023DNAArtificial sequenceSynthetically generated primer 100gtctggagca tctgtaaatc atc 2310121DNAArtificial sequenceSynthetically generated primer 101cccgatgcca tcattgtgat c 2110219DNAArtificial sequenceSynthetically generated primer 102gtagggagtc gagaggctg 1910335DNAArtificial sequenceSynthetically generated primer 103ataggttaac gccaccatgt cgtccggcac gatga 3510431DNAArtificial sequenceSynthetically generated primer 104ataggaattc ctacagttgc aattccggtg a 3110534DNAArtificial sequenceSynthetically generated primer 105atagacgcgt ttcttggctt tatatatctt gtgg 3410630DNAArtificial sequenceSynthetically generated primer 106atagacgcgt caaagtggat ctctgctgtc 3010720DNAArtificial sequenceSynthetically generated primer 107aggaggagaa gcaagaggag 2010818DNAArtificial sequenceSynthetically generated primer 108ccgaccgtcc cttccaag 1810920DNAArtificial sequenceSynthetically generated primer 109gacctttcct gctctatgtg 2011021DNAArtificial sequenceSynthetically generated primer 110ctgcagaggc taattacaca g 2111120DNAArtificial sequenceSynthetically generated primer 111catagcagcg taggctaaaa 2011222DNAArtificial sequenceSynthetically generated primer 112cggaagaaat tgcctcttct ag 2211331DNAArtificial sequenceSynthetically generated primer 113ataggctagc gttctgaaca gggccttaga g 3111430DNAArtificial sequenceSynthetically generated primer 114atagaagctt gatgcggacc ctcaaatagc 301151130PRTHomo sapiens 115Met Leu Glu Ile Cys Leu Lys Leu Val Gly Cys Lys Ser Lys Lys Gly1 5 10 15Leu Ser Ser Ser Ser Ser Cys Tyr Leu Glu Glu Ala Leu Gln Arg Pro 20 25 30Val Ala Ser Asp Phe Glu Pro Gln Gly Leu Ser Glu Ala Ala Arg Trp 35 40 45Asn Ser Lys Glu Asn Leu Leu Ala Gly Pro Ser Glu Asn Asp Pro Asn 50 55 60Leu Phe Val Ala Leu Tyr Asp Phe Val Ala Ser Gly Asp Asn Thr Leu65 70 75 80Ser Ile Thr Lys Gly Glu Lys Leu Arg Val Leu Gly Tyr Asn His Asn 85 90 95Gly Glu Trp Cys Glu Ala Gln Thr Lys Asn Gly Gln Gly Trp Val Pro 100 105 110Ser Asn Tyr Ile Thr Pro Val Asn Ser Leu Glu Lys His Ser Trp Tyr 115 120 125His Gly Pro Val Ser Arg Asn Ala Ala Glu Tyr Leu Leu Ser Ser Gly 130 135 140Ile Asn Gly Ser Phe Leu Val Arg Glu Ser Glu Ser Ser Pro Gly Gln145 150 155 160Arg Ser Ile Ser Leu Arg Tyr Glu Gly Arg Val Tyr His Tyr Arg Ile 165 170 175Asn Thr Ala Ser Asp Gly Lys Leu Tyr Val Ser Ser Glu Ser Arg Phe 180 185 190Asn Thr Leu Ala Glu Leu Val His His His Ser Thr Val Ala Asp Gly 195 200 205Leu Ile Thr Thr Leu His Tyr Pro Ala Pro Lys Arg Asn Lys Pro Thr 210 215 220Val Tyr Gly
Val Ser Pro Asn Tyr Asp Lys Trp Glu Met Glu Arg Thr225 230 235 240Asp Ile Thr Met Lys His Lys Leu Gly Gly Gly Gln Tyr Gly Glu Val 245 250 255Tyr Glu Gly Val Trp Lys Lys Tyr Ser Leu Thr Val Ala Val Lys Thr 260 265 270Leu Lys Glu Asp Thr Met Glu Val Glu Glu Phe Leu Lys Glu Ala Ala 275 280 285Val Met Lys Glu Ile Lys His Pro Asn Leu Val Gln Leu Leu Gly Val 290 295 300Cys Thr Arg Glu Pro Pro Phe Tyr Ile Ile Thr Glu Phe Met Thr Tyr305 310 315 320Gly Asn Leu Leu Asp Tyr Leu Arg Glu Cys Asn Arg Gln Glu Val Asn 325 330 335Ala Val Val Leu Leu Tyr Met Ala Thr Gln Ile Ser Ser Ala Met Glu 340 345 350Tyr Leu Glu Lys Lys Asn Phe Ile His Arg Asp Leu Ala Ala Arg Asn 355 360 365Cys Leu Val Gly Glu Asn His Leu Val Lys Val Ala Asp Phe Gly Leu 370 375 380Ser Arg Leu Met Thr Gly Asp Thr Tyr Thr Ala His Ala Gly Ala Lys385 390 395 400Phe Pro Ile Lys Trp Thr Ala Pro Glu Ser Leu Ala Tyr Asn Lys Phe 405 410 415Ser Ile Lys Ser Asp Val Trp Ala Phe Gly Val Leu Leu Trp Glu Ile 420 425 430Ala Thr Tyr Gly Met Ser Pro Tyr Pro Gly Ile Asp Leu Ser Gln Val 435 440 445Tyr Glu Leu Leu Glu Lys Asp Tyr Arg Met Glu Arg Pro Glu Gly Cys 450 455 460Pro Glu Lys Val Tyr Glu Leu Met Arg Ala Cys Trp Gln Trp Asn Pro465 470 475 480Ser Asp Arg Pro Ser Phe Ala Glu Ile His Gln Ala Phe Glu Thr Met 485 490 495Phe Gln Glu Ser Ser Ile Ser Asp Glu Val Glu Lys Glu Leu Gly Lys 500 505 510Gln Gly Val Arg Gly Ala Val Ser Thr Leu Leu Gln Ala Pro Glu Leu 515 520 525Pro Thr Lys Thr Arg Thr Ser Arg Arg Ala Ala Glu His Arg Asp Thr 530 535 540Thr Asp Val Pro Glu Met Pro His Ser Lys Gly Gln Gly Glu Ser Asp545 550 555 560Pro Leu Asp His Glu Pro Ala Val Ser Pro Leu Leu Pro Arg Lys Glu 565 570 575Arg Gly Pro Pro Glu Gly Gly Leu Asn Glu Asp Glu Arg Leu Leu Pro 580 585 590Lys Asp Lys Lys Thr Asn Leu Phe Ser Ala Leu Ile Lys Lys Lys Lys 595 600 605Lys Thr Ala Pro Thr Pro Pro Lys Arg Ser Ser Ser Phe Arg Glu Met 610 615 620Asp Gly Gln Pro Glu Arg Arg Gly Ala Gly Glu Glu Glu Gly Arg Asp625 630 635 640Ile Ser Asn Gly Ala Leu Ala Phe Thr Pro Leu Asp Thr Ala Asp Pro 645 650 655Ala Lys Ser Pro Lys Pro Ser Asn Gly Ala Gly Val Pro Asn Gly Ala 660 665 670Leu Arg Glu Ser Gly Gly Ser Gly Phe Arg Ser Pro His Leu Trp Lys 675 680 685Lys Ser Ser Thr Leu Thr Ser Ser Arg Leu Ala Thr Gly Glu Glu Glu 690 695 700Gly Gly Gly Ser Ser Ser Lys Arg Phe Leu Arg Ser Cys Ser Ala Ser705 710 715 720Cys Val Pro His Gly Ala Lys Asp Thr Glu Trp Arg Ser Val Thr Leu 725 730 735Pro Arg Asp Leu Gln Ser Thr Gly Arg Gln Phe Asp Ser Ser Thr Phe 740 745 750Gly Gly His Lys Ser Glu Lys Pro Ala Leu Pro Arg Lys Arg Ala Gly 755 760 765Glu Asn Arg Ser Asp Gln Val Thr Arg Gly Thr Val Thr Pro Pro Pro 770 775 780Arg Leu Val Lys Lys Asn Glu Glu Ala Ala Asp Glu Val Phe Lys Asp785 790 795 800Ile Met Glu Ser Ser Pro Gly Ser Ser Pro Pro Asn Leu Thr Pro Lys 805 810 815Pro Leu Arg Arg Gln Val Thr Val Ala Pro Ala Ser Gly Leu Pro His 820 825 830Lys Glu Glu Ala Glu Lys Gly Ser Ala Leu Gly Thr Pro Ala Ala Ala 835 840 845Glu Pro Val Thr Pro Thr Ser Lys Ala Gly Ser Gly Ala Pro Gly Gly 850 855 860Thr Ser Lys Gly Pro Ala Glu Glu Ser Arg Val Arg Arg His Lys His865 870 875 880Ser Ser Glu Ser Pro Gly Arg Asp Lys Gly Lys Leu Ser Arg Leu Lys 885 890 895Pro Ala Pro Pro Pro Pro Pro Ala Ala Ser Ala Gly Lys Ala Gly Gly 900 905 910Lys Pro Ser Gln Ser Pro Ser Gln Glu Ala Ala Gly Glu Ala Val Leu 915 920 925Gly Ala Lys Thr Lys Ala Thr Ser Leu Val Asp Ala Val Asn Ser Asp 930 935 940Ala Ala Lys Pro Ser Gln Pro Gly Glu Gly Leu Lys Lys Pro Val Leu945 950 955 960Pro Ala Thr Pro Lys Pro Gln Ser Ala Lys Pro Ser Gly Thr Pro Ile 965 970 975Ser Pro Ala Pro Val Pro Ser Thr Leu Pro Ser Ala Ser Ser Ala Leu 980 985 990Ala Gly Asp Gln Pro Ser Ser Thr Ala Phe Ile Pro Leu Ile Ser Thr 995 1000 1005Arg Val Ser Leu Arg Lys Thr Arg Gln Pro Pro Glu Arg Ile Ala 1010 1015 1020Ser Gly Ala Ile Thr Lys Gly Val Val Leu Asp Ser Thr Glu Ala 1025 1030 1035Leu Cys Leu Ala Ile Ser Arg Asn Ser Glu Gln Met Ala Ser His 1040 1045 1050Ser Ala Val Leu Glu Ala Gly Lys Asn Leu Tyr Thr Phe Cys Val 1055 1060 1065Ser Tyr Val Asp Ser Ile Gln Gln Met Arg Asn Lys Phe Ala Phe 1070 1075 1080Arg Glu Ala Ile Asn Lys Leu Glu Asn Asn Leu Arg Glu Leu Gln 1085 1090 1095Ile Cys Pro Ala Thr Ala Gly Ser Gly Pro Ala Ala Thr Gln Asp 1100 1105 1110Phe Ser Lys Leu Leu Ser Ser Val Lys Glu Ile Ser Asp Ile Val 1115 1120 1125Gln Arg 1130
* * * * *
References
D00001
D00002
D00003
D00004
D00005
D00006
D00007
D00008
D00009
D00010
D00011
D00012
D00013
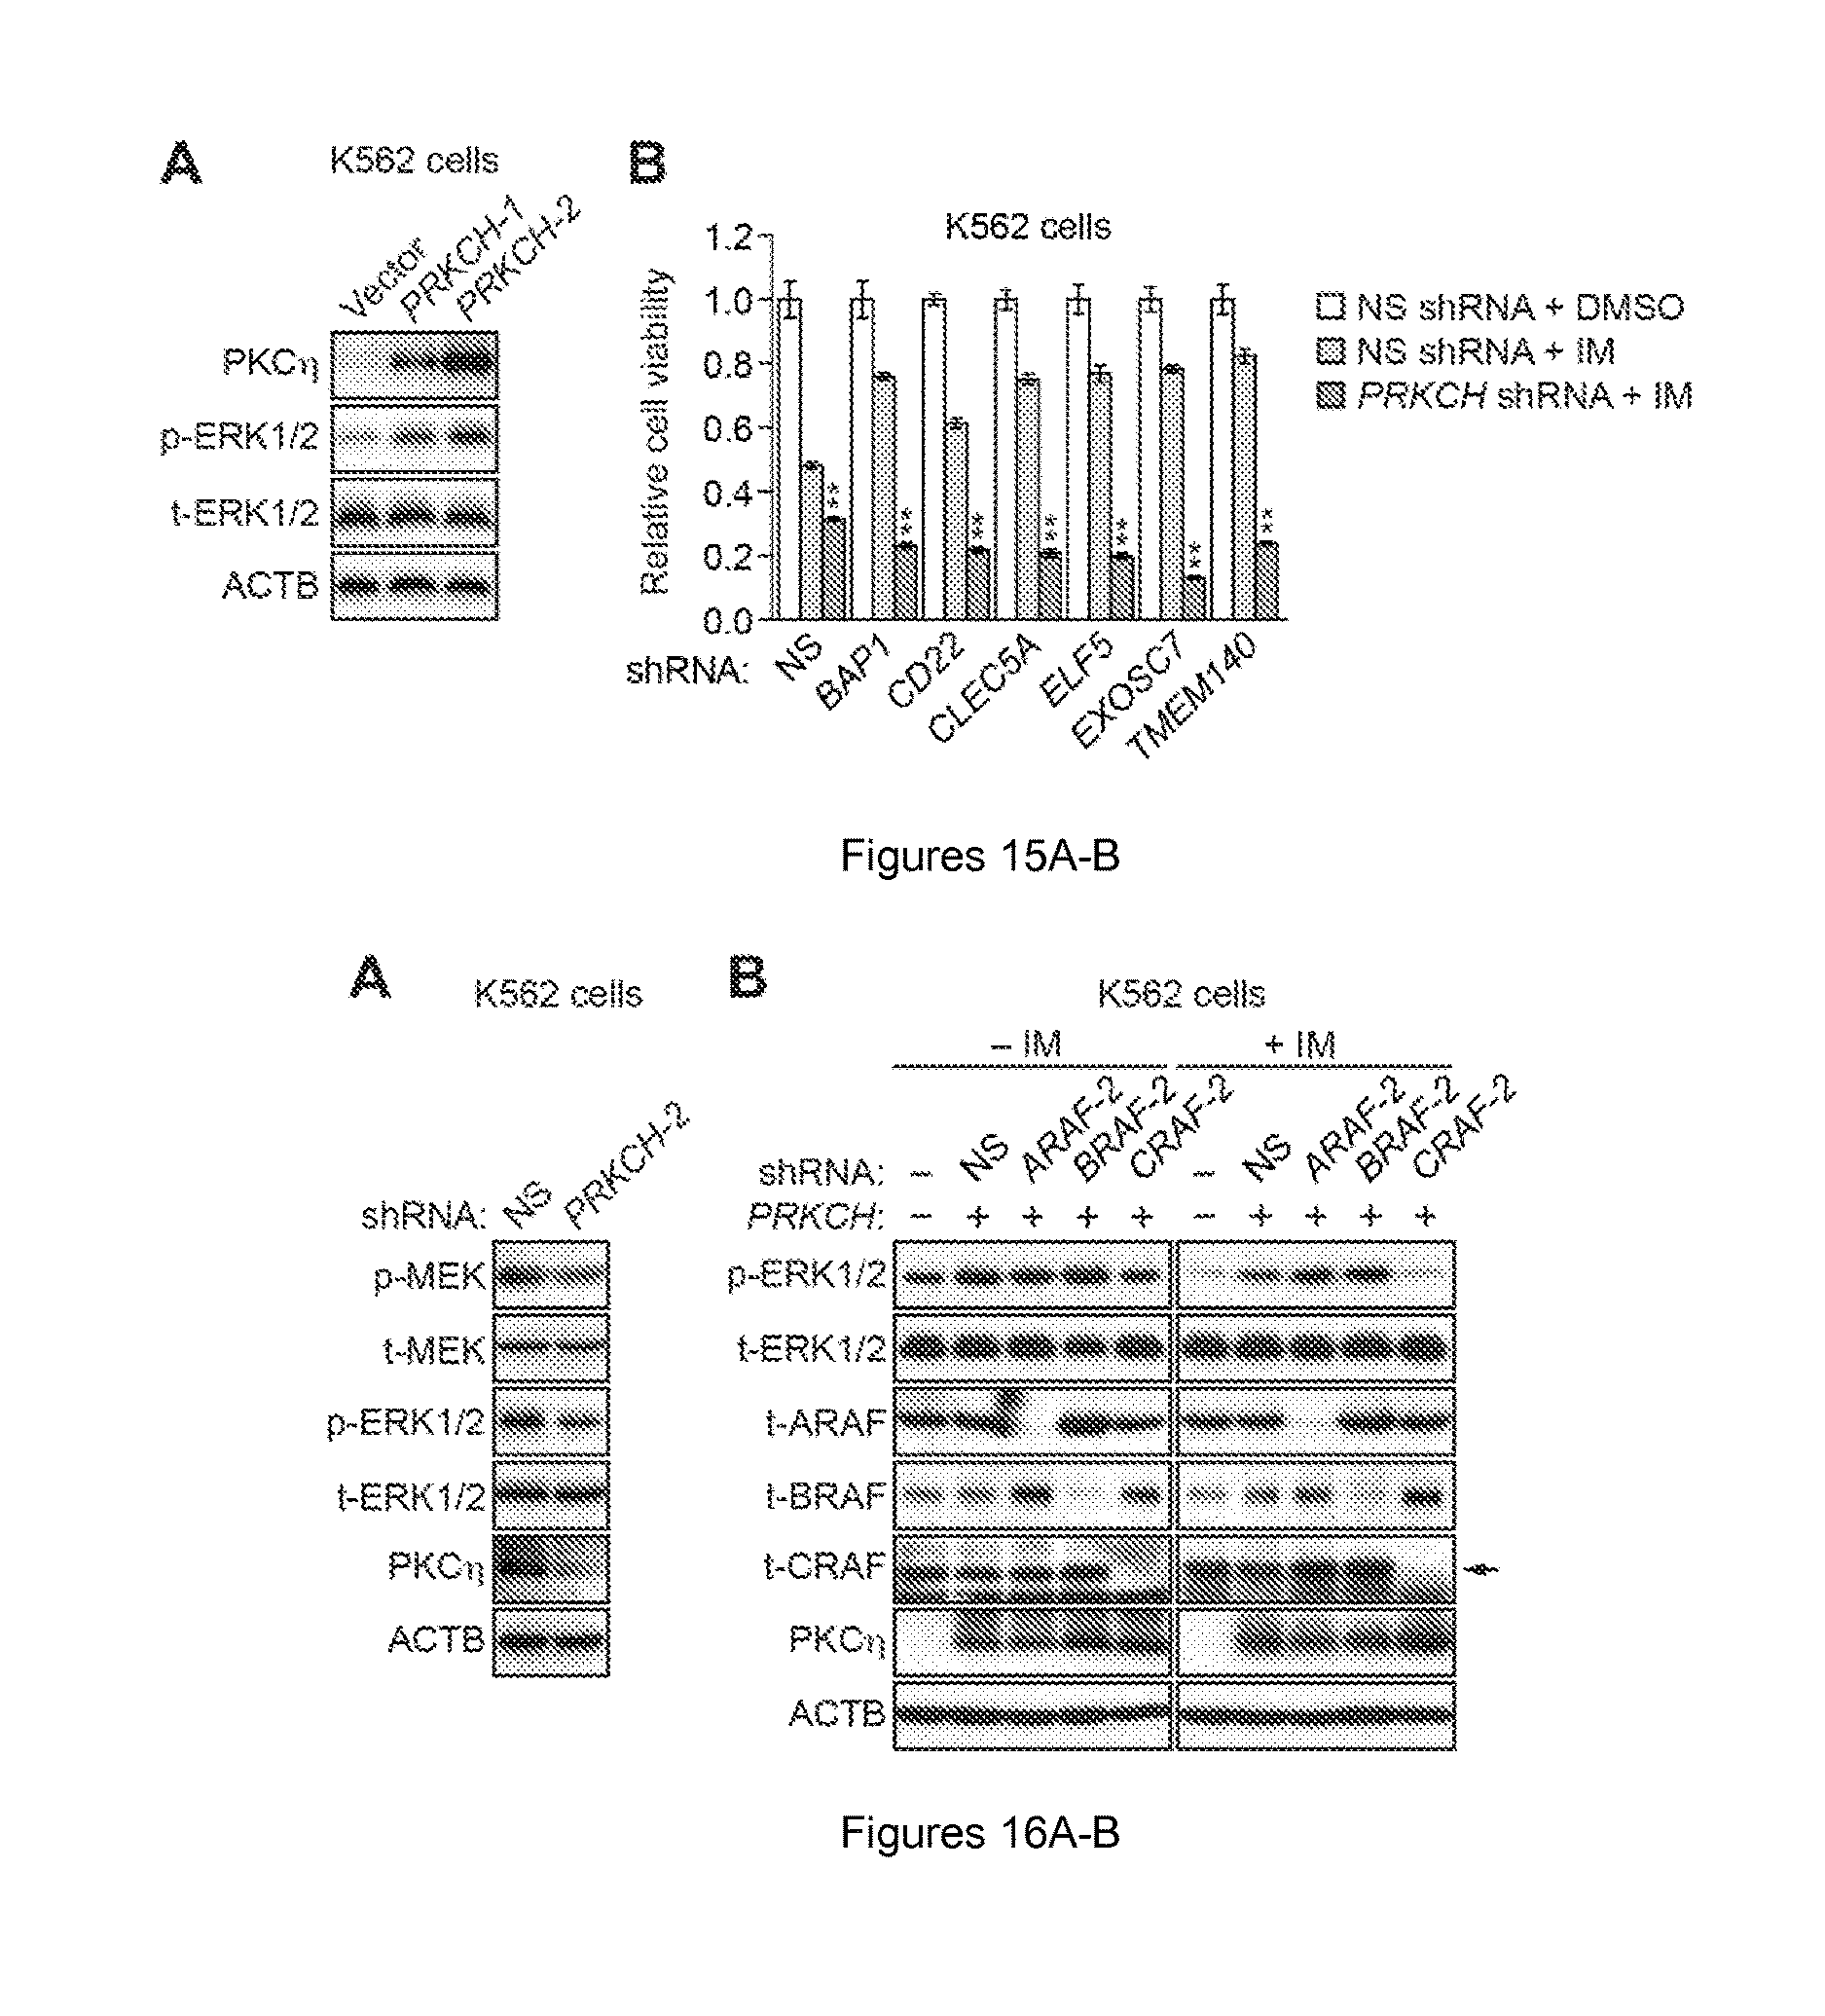
D00014
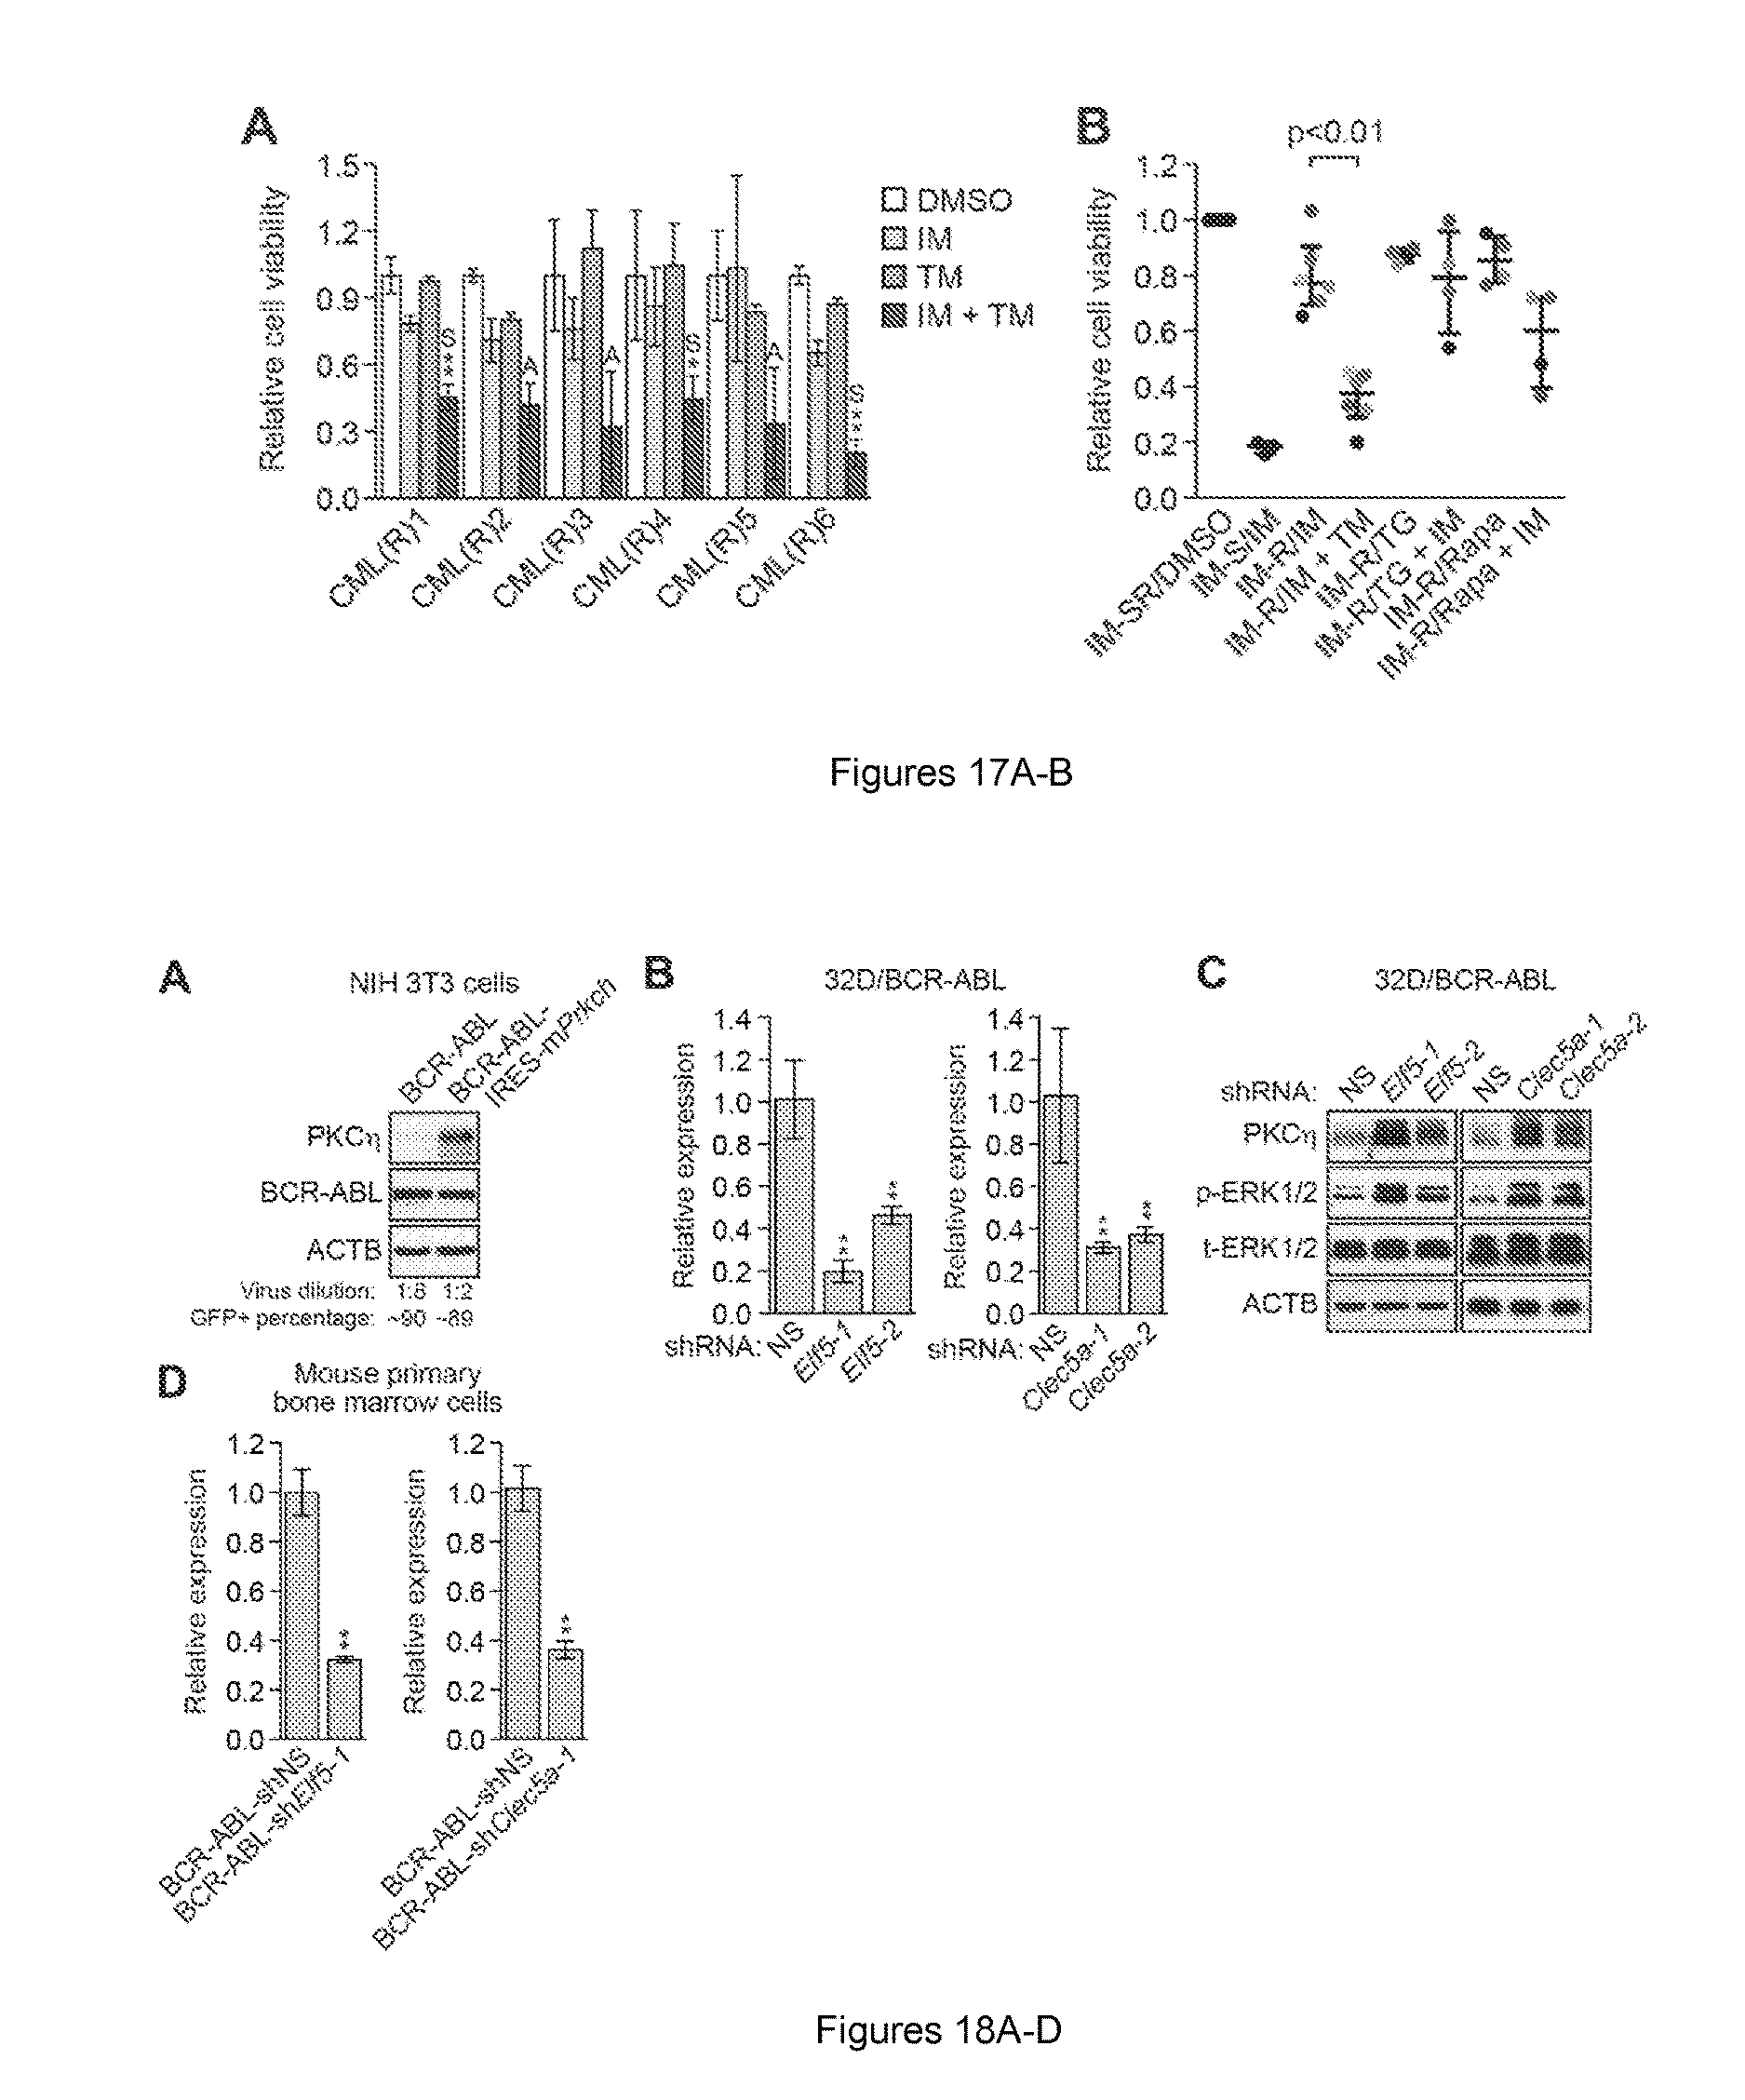
D00015
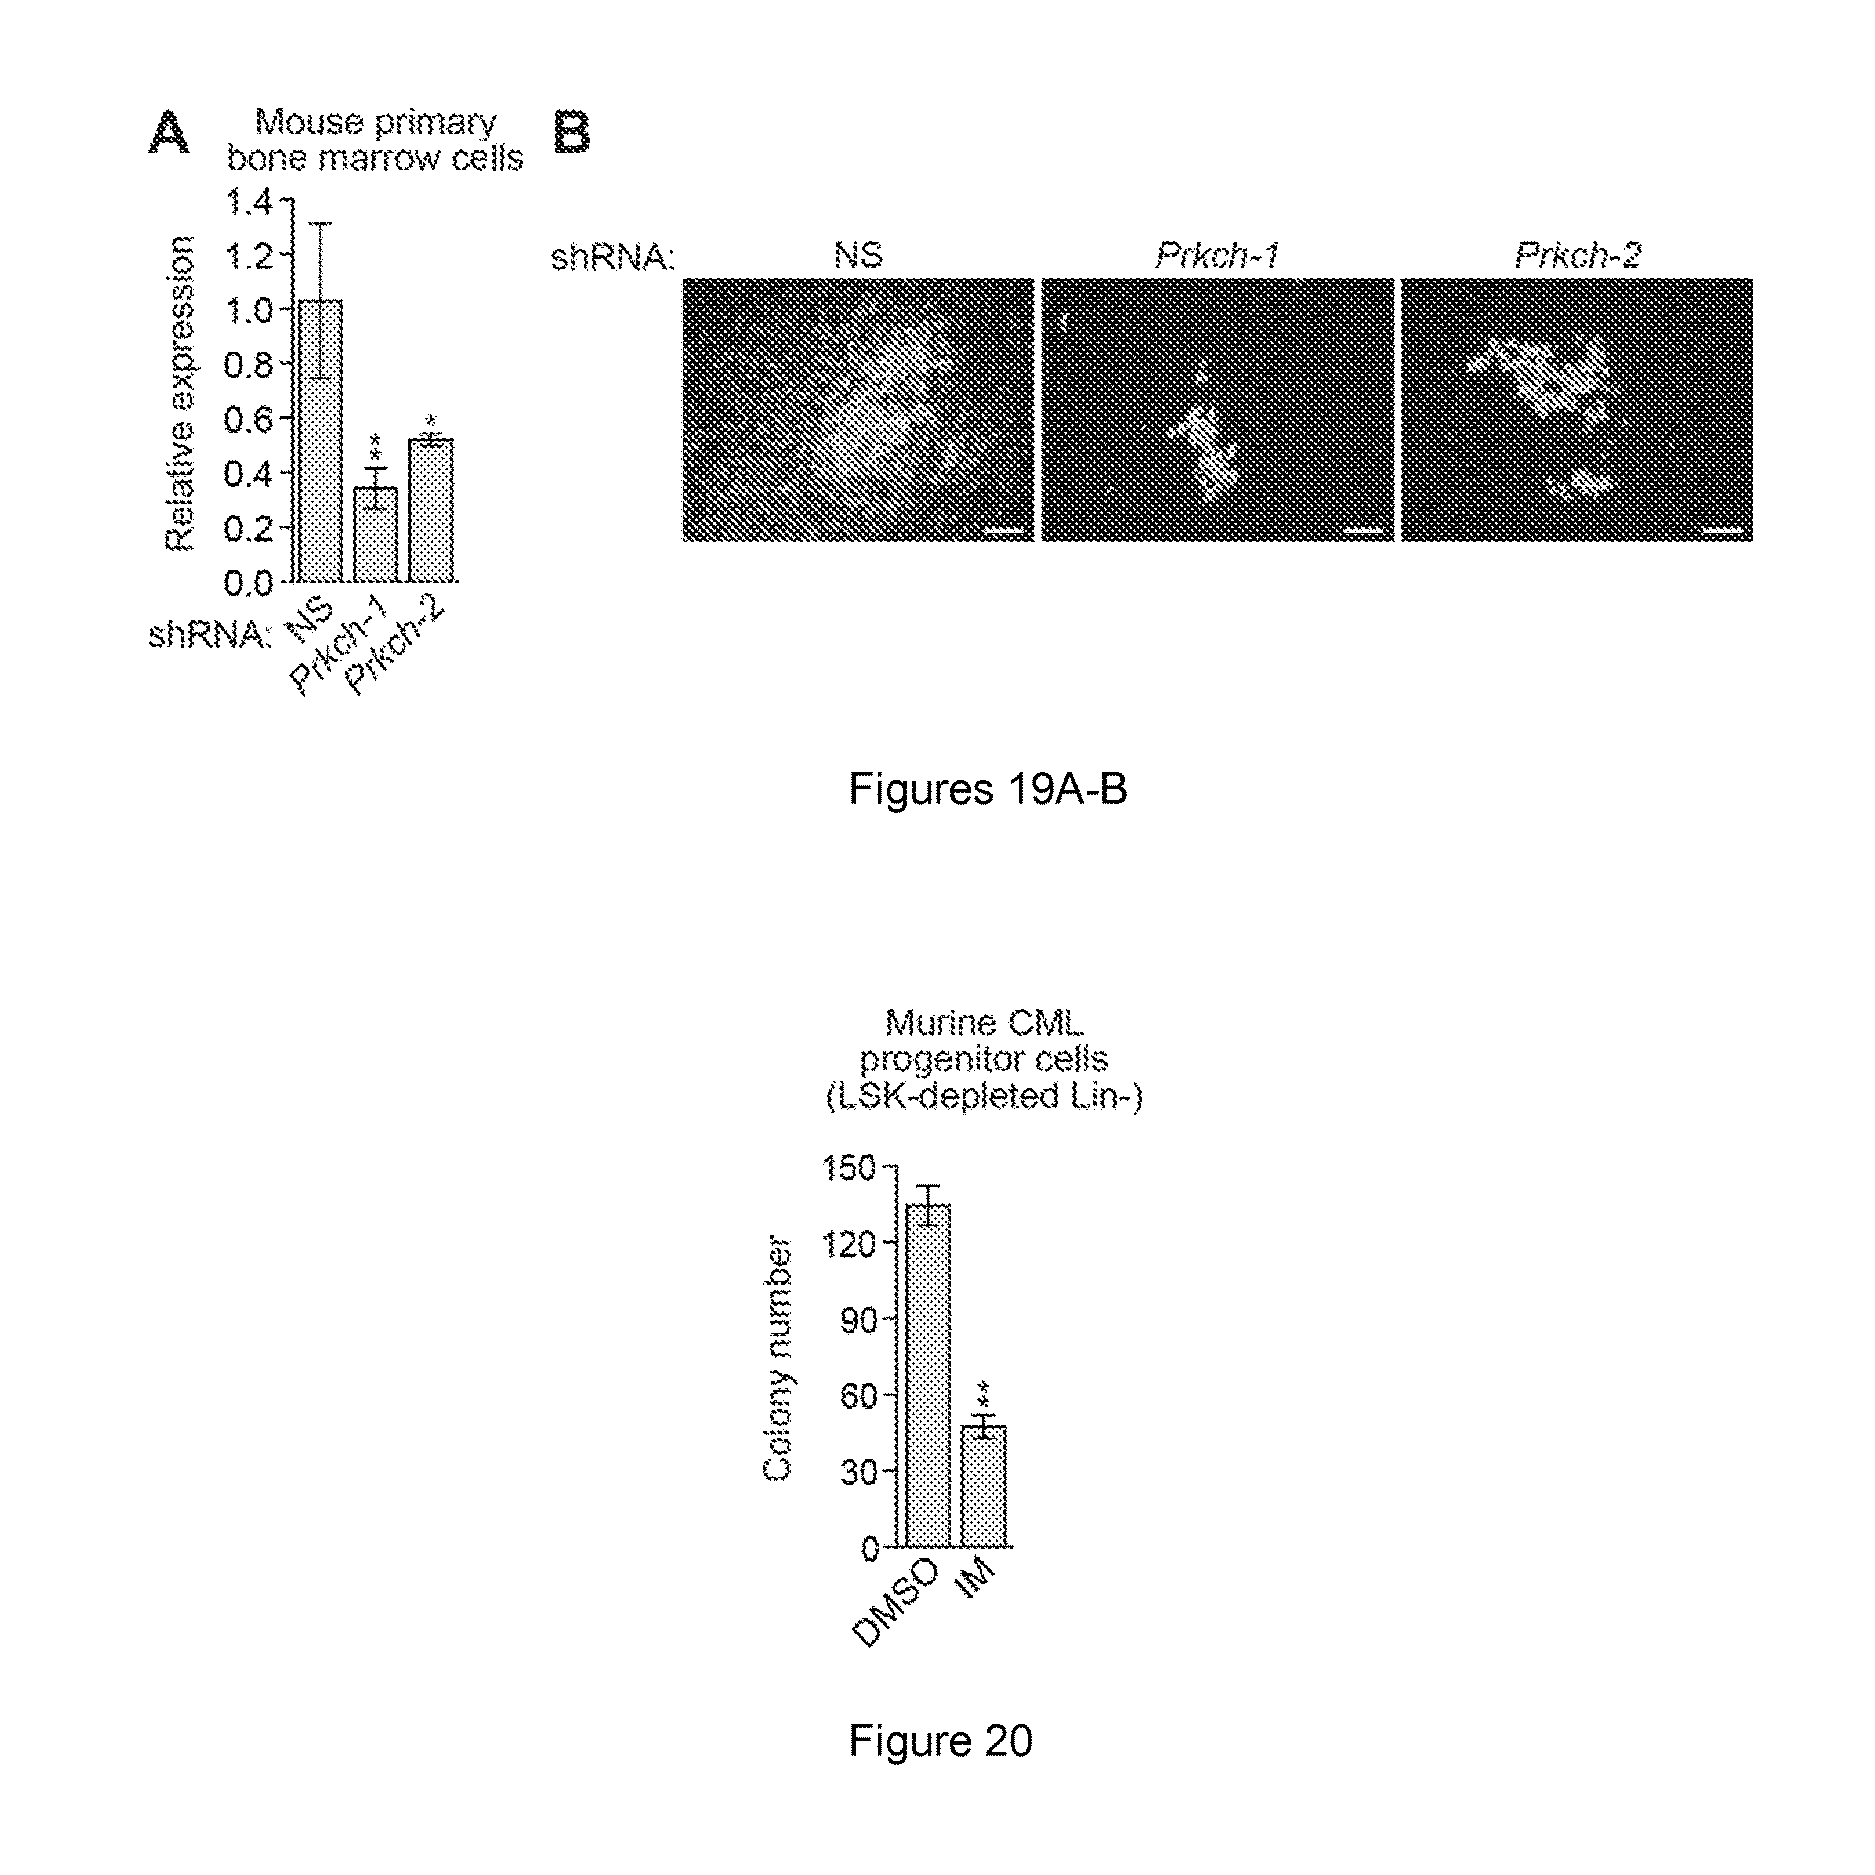
D00016
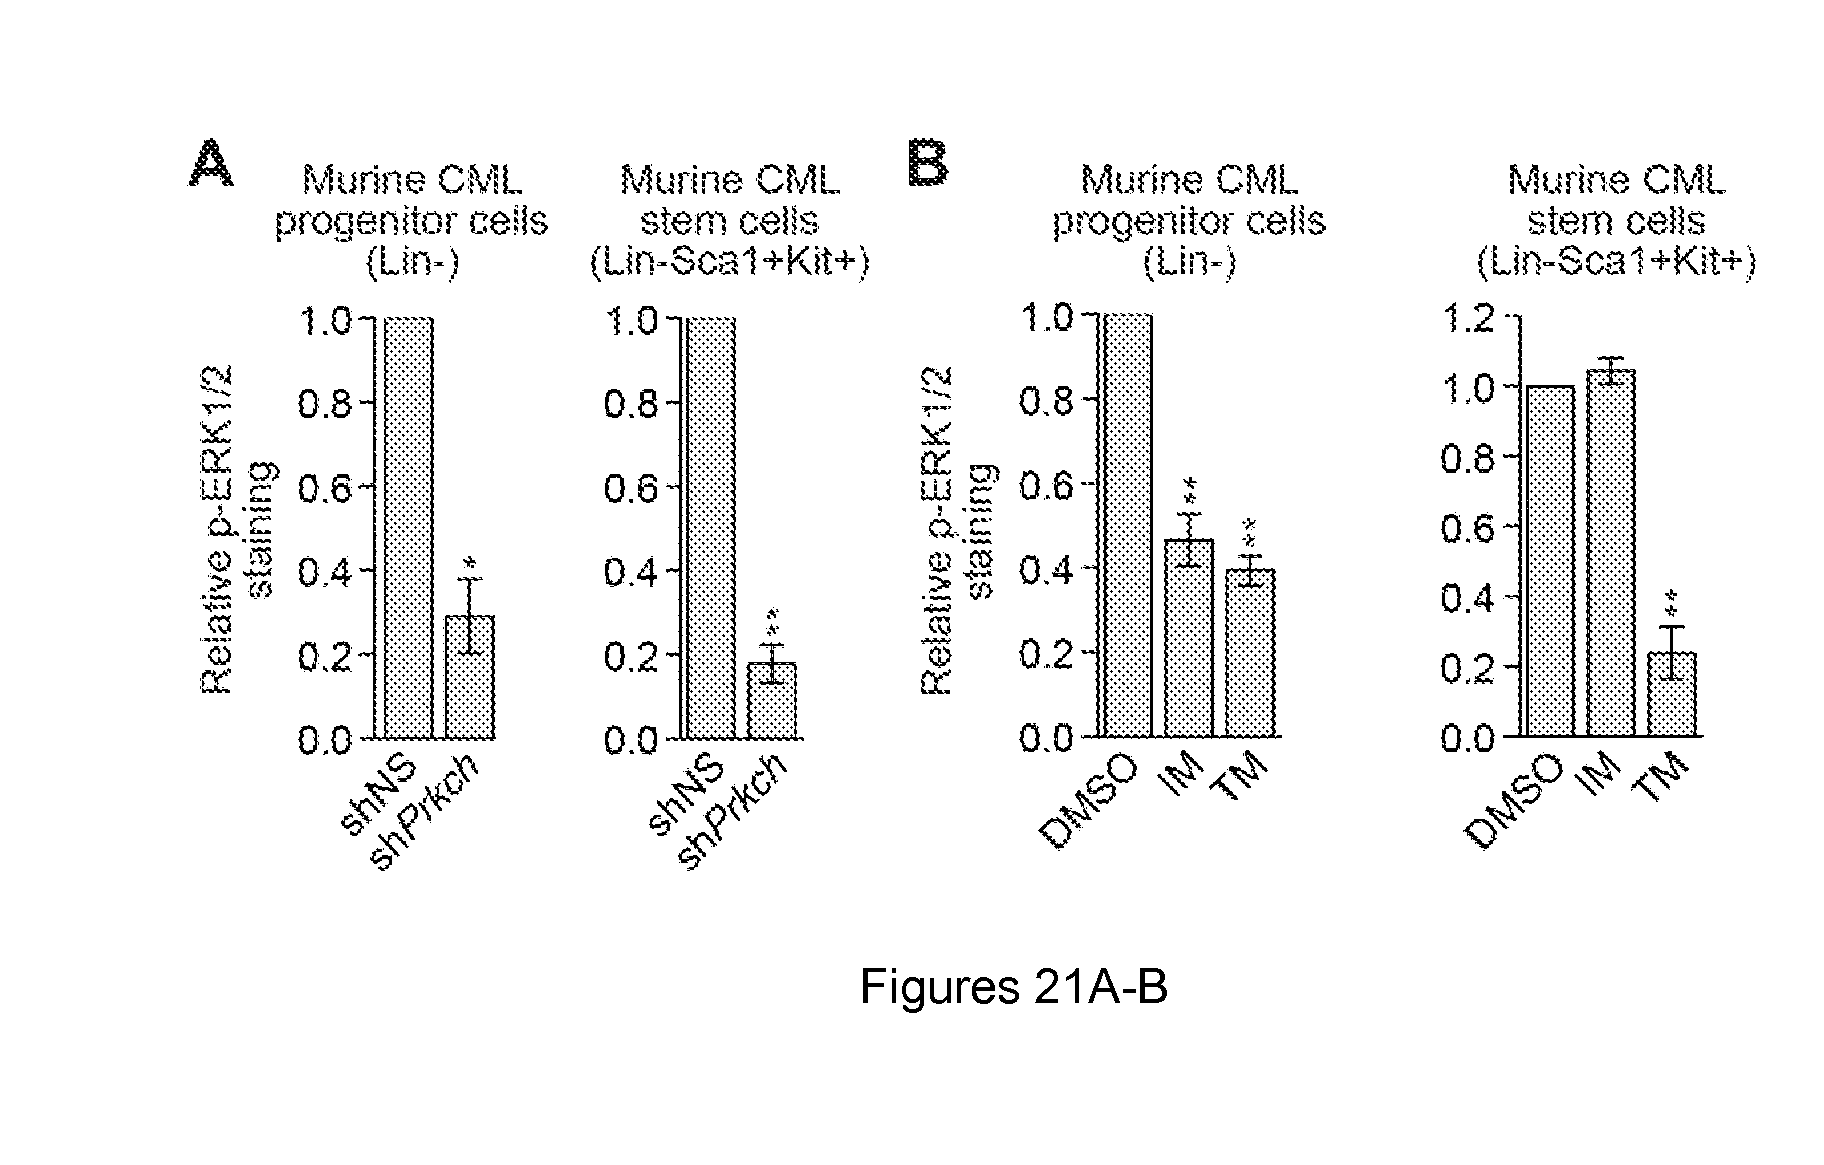
D00017
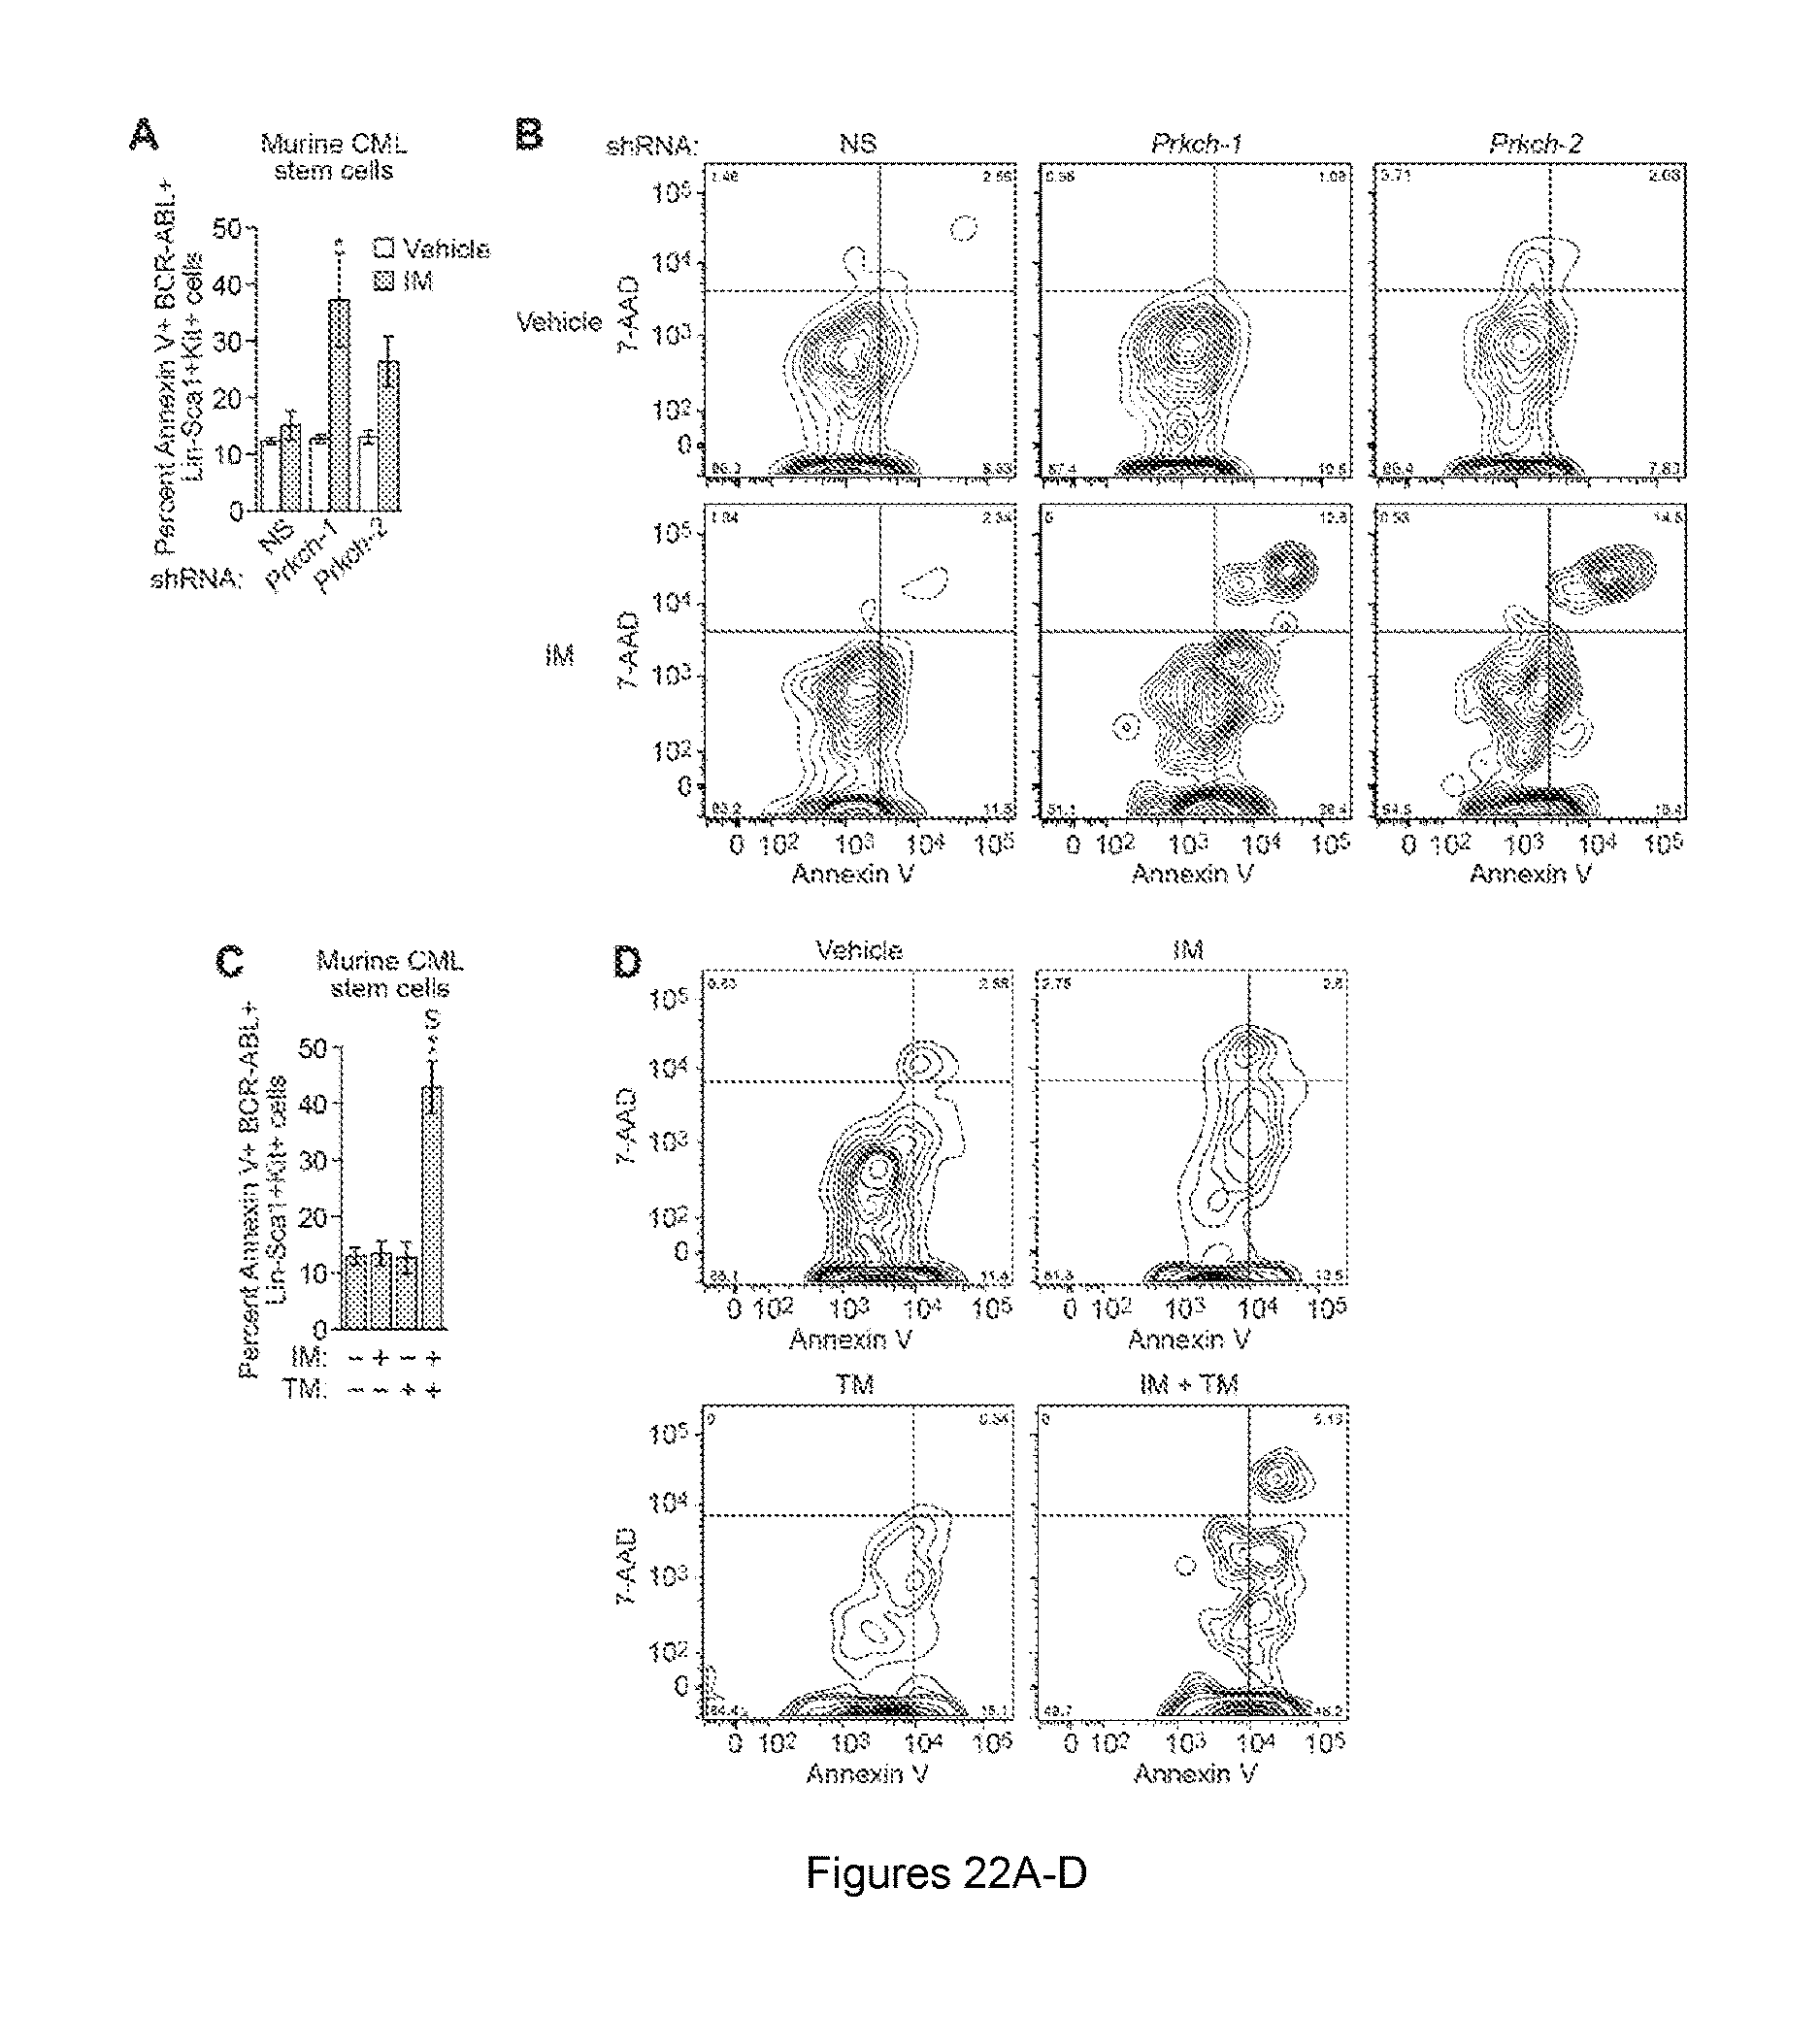
D00018
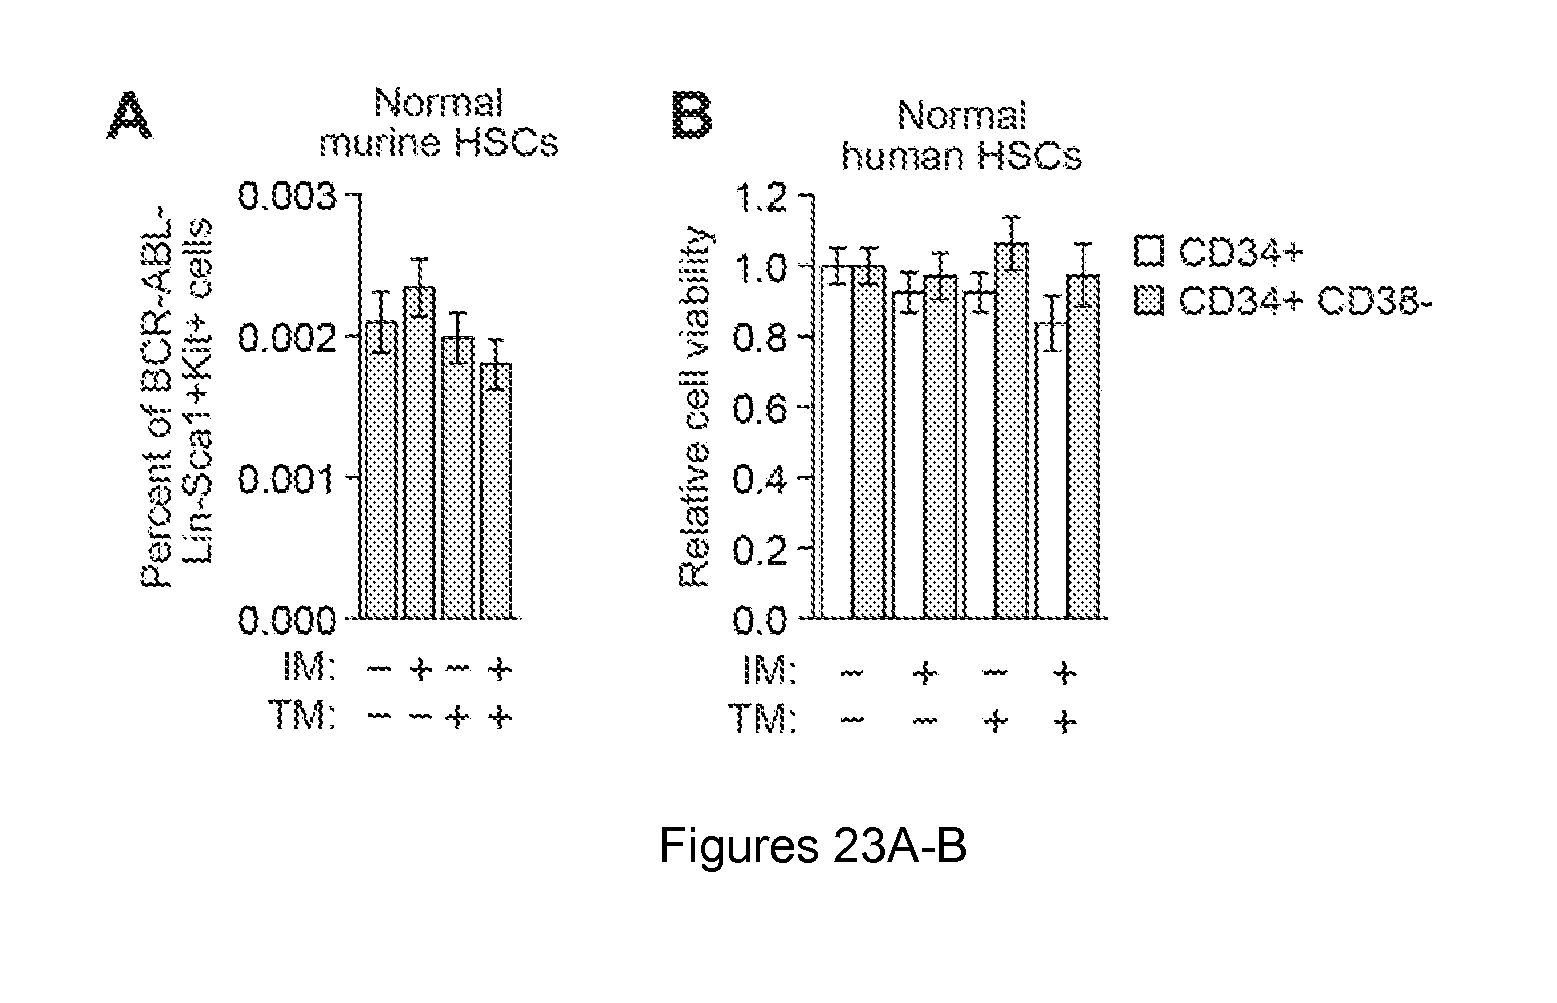
S00001
XML
uspto.report is an independent third-party trademark research tool that is not affiliated, endorsed, or sponsored by the United States Patent and Trademark Office (USPTO) or any other governmental organization. The information provided by uspto.report is based on publicly available data at the time of writing and is intended for informational purposes only.
While we strive to provide accurate and up-to-date information, we do not guarantee the accuracy, completeness, reliability, or suitability of the information displayed on this site. The use of this site is at your own risk. Any reliance you place on such information is therefore strictly at your own risk.
All official trademark data, including owner information, should be verified by visiting the official USPTO website at www.uspto.gov. This site is not intended to replace professional legal advice and should not be used as a substitute for consulting with a legal professional who is knowledgeable about trademark law.