Diagnostic and treatment for chronic and acute phase myeloid leukemia
Reya , et al. July 9, 2
U.S. patent number 10,344,276 [Application Number 14/789,976] was granted by the patent office on 2019-07-09 for diagnostic and treatment for chronic and acute phase myeloid leukemia. This patent grant is currently assigned to Duke University. The grantee listed for this patent is Duke University. Invention is credited to Takahiro Ito, Dong-Wook Kim, Hyog Y. Kwon, Vivian Oehler, Jerald Radich, Tannishtha Reya.


View All Diagrams
| United States Patent | 10,344,276 |
| Reya , et al. | July 9, 2019 |
Diagnostic and treatment for chronic and acute phase myeloid leukemia
Abstract
Disclosed are methods of predicting responsiveness of a cancer cell to a tyrosine kinase inhibitor, and methods of predicting the risk of progression of a cancer cell to a more aggressive form. Also provided are methods of reducing proliferation or promoting differentiation of a cancer cell having reduced level of Numb or increased level of Msi. Further disclosed are methods of treating a mammalian subject having cancer and methods of assessing an agent for chemotherapeutic potential.
| Inventors: | Reya; Tannishtha (San Diego, CA), Kwon; Hyog Y. (La Jolla, CA), Ito; Takahiro (San Diego, CA), Kim; Dong-Wook (Seoul, KR), Oehler; Vivian (Seattle, WA), Radich; Jerald (Sammamish, WA) | ||||||||||
|---|---|---|---|---|---|---|---|---|---|---|---|
| Applicant: |
|
||||||||||
| Assignee: | Duke University (Durham,
NC) |
||||||||||
| Family ID: | 43085618 | ||||||||||
| Appl. No.: | 14/789,976 | ||||||||||
| Filed: | July 1, 2015 |
Prior Publication Data
| Document Identifier | Publication Date | |
|---|---|---|
| US 20160002629 A1 | Jan 7, 2016 | |
Related U.S. Patent Documents
| Application Number | Filing Date | Patent Number | Issue Date | ||
|---|---|---|---|---|---|
| 13320324 | 9173963 | ||||
| PCT/US2010/035039 | May 14, 2010 | ||||
| 61178370 | May 14, 2009 | ||||
| 61332943 | May 10, 2010 | ||||
| Current U.S. Class: | 1/1 |
| Current CPC Class: | G01N 33/57496 (20130101); C12Q 1/6886 (20130101); A61K 48/005 (20130101); G01N 33/5011 (20130101); C12N 15/113 (20130101); C12N 15/86 (20130101); C12N 2320/30 (20130101); C12N 2740/10071 (20130101); G01N 2800/52 (20130101); C12N 2310/14 (20130101); C12N 2810/6081 (20130101); C12Q 2600/106 (20130101); C12N 2310/531 (20130101); G01N 2800/56 (20130101); C12Q 2600/136 (20130101); C12N 2740/10043 (20130101); C12N 2840/203 (20130101) |
| Current International Class: | C12N 15/113 (20100101); A61K 48/00 (20060101); C12N 15/86 (20060101); G01N 33/50 (20060101); G01N 33/574 (20060101); C12Q 1/6886 (20180101) |
References Cited [Referenced By]
U.S. Patent Documents
| 2006/0029944 | February 2006 | Huang et al. |
| 2007/0154931 | July 2007 | Radich |
| 2008/0188405 | August 2008 | Di Fiore et al. |
| 2012/0208188 | August 2012 | Reya et al. |
| WO 2006037462 | Apr 2006 | WO | |||
Other References
|
Sanchez-Diaz et al., BMC Cancer, 2008, vol. 8: 280, pp. 1-12. cited by examiner . Sureban et al., Gastroenterology, 2008, vol. 134, pp. 1448-1458 plus 6 pages--total of 19 pages. cited by examiner . Battelli, C., et al., "The RNA-binding protein Musashi-1 regulates neural development through the translational repression of p21WAF-1" Mol Cell Neurosci 31, 85-96 (2006). cited by applicant . Calabretta, B., et al., "The biology of CML blast crisis" Blood 103, 4010-4022 (2004). cited by applicant . Carlesso, N., Aster, J.C., Sklar, J. & Scadden, "Notch1-Induced Delay of Human Hematopoietic Progenitor Cell Differentiation Is Associated With Altered Cell Cycle Kinetics," D.T. Blood 1999, 93, 838-48. cited by applicant . Colaluca, I. N., et al., "NUMB controls p53 tumour suppressor activity" Nature 451, 76-80 (2008). cited by applicant . Daley, G. Q., et al., "Induction of chronic myelogenous leukemia in mice by the P210bcr/abl gene of the Philadelphia chromosome" Science 247, 824-830 (1990). cited by applicant . Dash, A. B., et al. "A murine model of CML blast crisis induced by cooperation between BCR/ABL and NUP98/HOXA9" Proc Natl Acad Sci USA 99, 7622-7627 (2002). cited by applicant . Duncan, A W. et al. "Integration of Notch and Wnt signaling in hematopoietic stem cell maintenance," Nat Immunol 2005,6,314-22. cited by applicant . Druker et al., The New England Journal of Medicine, 2001, vol. 344, pp. 1031-1037. cited by applicant . Estrach, S., Ambler, C.A, Lo Celso, C., Hozumi, K. & Watt, F.M. "Jagged 1 is a Beta-catenin target gene required for ectopic hair follicle formation in adult epidermis," Development 2006, 133, 4427-38. cited by applicant . Giniger et al., 1997, Grant No. DAMD17-94-J-4266; retrieved from http://www.dtic.mil/cgi-bin/GetTRDoc?AD=ADA341369 on Feb. 20, 2013. cited by applicant . Goldman, J. M., et al., "BCR-ABL in chronic myelogenous leukemia--how does it work?" Acta Haematol 119, 212-217 (2008). cited by applicant . Hellstrom, M. et al. "D114 signalling through Notch1 regulates formation of tip cells during angiogenesis," Nature 2007, 445, 776-80. cited by applicant . Huntly, B.J. et al. "MOZ-TIF2, but not BCR-ABL, confers properties of leukemic stem cells to committed murine hematopoietic prognitors," Cancer Cell 2004, 6, 587-96. cited by applicant . Imai, T., et al., "The neural RNA-binding protein Musashi l translationally regulates mammalian numb gene expression by interacting with its mRNA" Mol Cell Biol 21, 3888-3900 (2001). cited by applicant . Jegga, A. G., et al., "Detection and visualization of compositionally similar cis-regulatory element clusters in orthologous and coordinately controlled genes" Genome Res 12, 1408-1417 (2002). cited by applicant . Justice, N., et al., "Lethal giant larvae acts together with numb in notch inhibition and cell fate specification in the Drosophila adult sensory organ precursor lineage" Curr Biol 13, 778-783 (2003). cited by applicant . Knoblich, J. A. "Mechanisms of asymmetric cell division during animal development" Curr Opin Cell Biol 9, 833-841 (1997). cited by applicant . Lai, AY. & Kondo, "Identification of a bone marrow precursor of the earliest thymocytes in adult mouse," M. Proc Natl Acad Sci USA 2007, 104, 6311-6. cited by applicant . Liu, G., et al., "Analysis of gene expression and chemoresistance of CD133+ cancer stem cells in glioblastoma" Mol Cancer 5, 67 (2006). cited by applicant . Mayotte, N., et al., "Oncogenic interaction between BCR-ABL and NUP98-HOXA9 demonstrated by the use of an in vitro purging culture system" Blood 100, 4177-4184 (2002). cited by applicant . Melo, J. V., et al., "Chronic myeloid leukaemia as a model of disease evolution in human cancer" Nat Rev Cancer 7, 441-453 (2007). cited by applicant . Mombaerts, P. et al. "RAG-1-Deficient Mice Have No Mature B and T Lymphocytes" Cell 1992, 68, 869-77. cited by applicant . Nakahara, F., et al., "Hes 1 immortalizes committed progenitors and plays a role in blast crisis transition in chronic myelogenous leukemia" Blood 115, 2872-2881 (2010). cited by applicant . Nakamura, M., et al., "a neural RNA-binding protein required for Drosophila adult external sensory organ development" Neuron 13, 67-81 (1994). cited by applicant . NCBI Reference Sequence NM_001005743, 2004. cited by applicant . NCBI Reference Sequence NM_138962.2, 2004. cited by applicant . Neering, S. J., et al., "Leukemia stem cells in a genetically defined murine model of blast-crisis CML" Blood 110, 2578-2585 (2007). cited by applicant . Okabe, M., et al., "Translational repression determines a neuronal potential in Drosophila asymmetric cell division" Nature 411, 94-98 (2001). cited by applicant . Okano, H., et al., "Function of RNA-binding protein Musashi-1 in stem cells" Exp Cell Res 306, 349-356 (2005). cited by applicant . Pear, W. S., et al. "Efficient and rapid induction of a chronic myelogenous leukemia-like myeloproliferative disease in mice receiving P210 bcr/abl-transduced bone marrow" Blood 92, 3780-3792 (1998). cited by applicant . Pece, S., et al., "Loss of negative regulation by Numb over Notch is relevant to human breast carcinogenesis" J Cell Biol 167, 215-221 (2004). cited by applicant . Radich, J. P., et al. "Gene expression changes associated with progression and response in chronic myeloid leukemia" Proc Natl Acad Sci U S A 103, 2794-2799 (2006). cited by applicant . Ren, R. "Mechanisms of BCR-ABL in the pathogenesis of chronic myelogenous leukaemia" Nat Rev Cancer 5, 172-183 (2005). cited by applicant . Rizzo et al., "Cross-talk between Notch and the Estrogen Receptor in Breast Cancer Suggests Novel Therapeutic Approaches" Caner Res. Jul. 1, 2008, vol. 68, No. 13, p. 5226-35. cited by applicant . Sakakibara, S., et al., "RNA-binding protein Musashi family: roles for CNS stem cells and a subpopulation of ependymal cells revealed by targeted disruption and antisense ablation" Proc Natl Acad Sci U S A 99, 15194-15199 (2002). cited by applicant . Shen, Q., et al., "Asymmetric Numb distribution is critical for asymmetric cell division of mouse cerebral cortical stem cells and neuroblasts" Development 129, 4843-4853 (2002). cited by applicant . Spana, E. P., et al., "Numb antagonizes Notch signaling to specify sibling neuron cell fates" Neuron 17, 21-26 (1996). cited by applicant . Sureban et al., "Knockdown of RNA binding protein musashi-1 leads to tumor regression in vivo" Gastroenterology. May 2008, vol. 134, No. 5, p. 1448-58. cited by applicant . Taniwaki, T., et al., "Characterization of an exchangeable gene trap using pU-17 carrying a stop codon-beta geo cassette" Dev Growth Differ 47, 163-172 (2005). cited by applicant . Verdi et al., "Mammalian NUMB is an evolutionarily conserved signaling adapter protein that specifies cell fate" Curr Biol. Sep. 1, 1996, vol. 6, No. 9, p. 1134-1145. cited by applicant . Wakamatsu, Y., et al., "NUMB localizes in the basal cortex of mitotic avian neuroepithelial cells and modulates neuronal differentiation by binding to NOTCH-1" Neuron 23, 71-81 (1999). cited by applicant . Wang, H., et al., "Polo inhibits progenitor self-renewal and regulates Numb asymmetry by phosphorylating Pon" Nature 449, 96-100 (2007). cited by applicant . Witte, O. "The role of Bcr-Abl in chronic myeloid leukemia and stem cell biology" Semin Hematol 38, 3-8 (2001). cited by applicant . Wu, M., et al., "Imaging hematopoietic precursor division in real time" Cell Stem Cell 1, 541-554 (2007). cited by applicant . Zhao, C. et al. "Loss of Beta-Catenin Impairs the Renewal of Normal and CML Stem Cells In Vivo," Cancer Cell 2007, 12, 528-41. cited by applicant . Ramaswamy et al., PNAS, 2001, vol. 98, pp. 15149-15154. cited by applicant . Rennstam et al., Breast Cancer Res Treat, 2010, vol. 122, pp. 315-324. cited by applicant . Stylianou et al., Cancer Reasearch, 2006, vol. 66, pp. 1517-1525. cited by applicant . PCT/US2010/035039 International Preliminary Report on Patentability and Written Opinion dated Nov. 24, 2011 (9 pages). cited by applicant . PCT/US2010/035039 International Search Report dated Oct. 15, 2010 (3 pages). cited by applicant . United States Patent Office Action for U.S. Appl. No. 13/320,324 dated Feb. 27, 2012 (12 pages). cited by applicant . United States Patent Office Final Rejection for U.S. Appl. No. 13/320,324 dated Sep. 5, 2013 (8 pages). cited by applicant . United States Patent Office Action for U.S. Appl. No. 13/320,324 dated Jan. 3, 2014 (12 pages). cited by applicant . United States Patent Office Action for U.S. Appl. No. 13/320,324 dated Jul. 1, 2014 (8 pages). cited by applicant . United States Patent Office Action for U.S. Appl. No. 13/320,324 dated Oct. 6, 2014 (8 pages). cited by applicant . United States Patent Office Notice of Allowance for U.S. Appl. No. 13/320,324 dated Apr. 1, 2015 (11 pages). cited by applicant . Kwiatkowska et al. Molecular Cancer 2012, 11, 65. cited by applicant. |
Primary Examiner: Brown; Mindy G
Attorney, Agent or Firm: Michael Best & Friedrich LLP
Government Interests
STATEMENT REGARDING FEDERALLY SPONSORED RESEARCH
This invention was made with government support under grant nos. CA18029, CA140371, CA122206, DK63031, DK072234, AI067798, HL097767, and DP1OD006430 awarded by the United States Institutes of Health. The government has certain rights in the invention.
Parent Case Text
CROSS-REFERENCE TO RELATED APPLICATIONS
This application is a continuation of U.S. patent application Ser. No. 13/320,324, filed Apr. 24, 2012, which application is a national stage filing under 35 U.S.C. 371 of International Patent Application No. PCT/US2010/035039, filed May 14, 2010, which claims the benefit of U.S. Provisional Patent Application No. 61/178,370, filed May 14, 2009, and U.S. Provisional Patent Application No. 61/332,943, filed May 10, 2010, the contents of all aforementioned applications are incorporated herein by reference in their entireties.
Claims
What is claimed is:
1. A method of reducing proliferation or promoting differentiation of a leukemia cell, lymphoma cell, or breast cancer cell, the cell haying increased Msi expression, the method comprising: contacting the cell with an agent capable of decreasing Msi to reduce proliferation or increase differentiation, wherein the agent is a shRNA comprising a sequence of SEQ ID NO: 9.
2. The method of claim 1, wherein the leukemia cell is a lymphoid leukemia cell, or a myeloid leukemia cell.
3. The method of claim 1, wherein the leukemia cell is from a subject with acute phase leukemia or blast crisis leukemia.
4. The method of claim 1, wherein the agent decreases MSI1.
5. A method of reducing proliferation of a leukemia cell, lymphoma cell, or breast cancer cell, the method comprising: determining a level of Msi expression in the cell, wherein determining comprises a method selected from the group consisting of PCR, Western blot analysis, Northern blot analysis, ELISA, FACS analysis, and immunoflourescence; comparing the expression level to a control value; and administering to the cell an agent capable of decreasing Msi when the level of Msi expression is increased relative to the control, wherein the agent is a shRNA comprising a sequence of SEQ ID NO: 9.
6. The method of claim 5, wherein the leukemia cell is a lymphoid leukemia cell, or a myeloid leukemia cell.
7. The method of claim 5, wherein the leukemia cell is from a subject with acute phase leukemia or blast crisis leukemia.
8. The method of claim 5, wherein the agent decreases MSI1.
9. A method of treating a mammalian subject having cancer selected from leukemia, lymphoma, and breast cancer, a sample from the subject having increased Msi expression relative to a control, the method comprising: administering to the subject an amount of agent capable of decreasing Msi, wherein the agent is an shRNA comprising the sequence of SEQ ID NO: 9.
10. The method of claim 9, wherein the leukemia is a lymphoid leukemia, or a myeloid leukemia.
11. The method of claim 9, wherein the leukemia is acute phase leukemia or blast crisis leukemia.
12. The method of claim 9, wherein the agent decreases MSI1.
Description
BACKGROUND
The National Cancer Institute estimates that in the United States one in three people will be afflicted with cancer. Moreover, approximately 50% to 60% of people with cancer will eventually die from the disease. Early intervention and targeted therapeutic treatment are needed to increase cancer survival. The present invention relates to methods for cancer diagnosis and treatment.
In particular, myeloid leukemia may present as a slow-growing chronic phase with cells able to undergo differentiation (Chronic Myeloid Leukemia, CML) or as a more aggressive and fast-growing acute phase with cells that are unable to differentiate (Acute Myeloid Leukemia, AML). There is a need in the art for methods of distinguishing the various stages of myeloid leukemia and predicting responsiveness of leukemias to types of chemotherapeutics. In addition, there is a need for methods of screening cancer for chemotherapeutic sensitivity and for developing novel therapeutics.
SUMMARY
In one embodiment, methods of predicting responsiveness of a cancer cell to a tyrosine kinase inhibitor are provided. The methods include evaluating the level of Numb expression in the cancer cell and then using the level of expression to predict responsiveness to the inhibitor.
In another aspect, methods of predicting the risk of progression of a cancer cell to a more aggressive form are provided. These methods include evaluating the level of Numb expression in the cancer cell and using the level of expression to predict the risk of progression to a more aggressive form of the cancer.
In yet another aspect, methods of reducing proliferation or promoting differentiation of a cancer cell having reduced expression of Numb relative to a control are provided. These methods include contacting the cell with an agent capable of increasing the level of Numb in the cell. The increased level of Numb reduces proliferation and promotes differentiation of the cells.
In still another aspect, methods of treating a mammalian subject having a cancer that has a reduced level of Numb are provided. The methods include administering an agent capable of increasing the level of Numb to an amount effective to treat the cancer.
In a further aspect, methods of assessing an agent for chemotherapeutic potential are provided. The methods include contacting a cell with the agent and evaluating the level of Numb in the contacted cell. The level of Numb in the contacted cell is indicative of the chemotherapeutic potential of the agent.
In still a further aspect, methods of reducing proliferation or promoting differentiation of a cancer cell having increased expression of Msi are provided. The methods include contacting the cell with an agent capable of decreasing the level of Msi in the cell to reduce proliferation or increase differentiation.
In yet another aspect, methods of treating a mammalian subject having a cancer that has an increased level of Msi expression relative to a control are provided. The methods include administering an agent capable of decreasing the level of Msi to the subject in an amount effective to treat the cancer.
In a further aspect, methods of assessing an agent for chemotherapeutic potential are provided. The methods include contacting a cell with the agent and evaluating the level of Msi in the contacted cell. The level of Msi in the contacted cell is indicative of the chemotherapeutic potential of the agent.
In yet another aspect, methods of predicting the risk of progression of a cancer cell to a more aggressive form are provided. These methods include evaluating the level of Msi expression in the cancer cell and using the level of expression to predict the risk of progression to a more aggressive form of the cancer.
Other aspects of the invention will become apparent by consideration of the detailed description and accompanying drawings.
BRIEF DESCRIPTION OF THE DRAWINGS
FIG. 1A are images of AML and CML cells stained with anti-Numb antibody (red) and DAPI (green). FIG. 1B is a graph of fluorescence intensity of Numb staining for AML and CML cells. FIG. 1C is an image of a Western Blot showing detection of Numb expression in CML and AML cells. FIG. 1D is a graph of relative gene expression of Numb as analyzed by realtime PCR for AML and CML cells.
FIG. 2A is a schematic diagram of the strategy used to detect Notch signaling in AML and CML cells. FIG. 2B is a graph of GFP reporter expression (black line; GFP expression reflects Notch signalling) in CML cells, and FIG. 2C is a graph of GFP reporter expression in AML cells, with expression in wild type cells (gray line) used as a control.
FIG. 3A is a graph of the survival rate of wild type or Rag1-/- mice that were transplanted cells transduced with BCR-ABL/Vector, ICN/Vector, or BCR-ABL/ICN. FIG. 3B is a graph of the average percentage of blasts in leukemias transduced with BCR-ABL/ICN or BCR-ABL/Vector. FIG. 3C is an image of wright stained cells derived from wild type BCR-ABL/Vector driven leukemia. FIG. 3D is an image of wright stained cells derived from wild type BCR-ABL/ICN driven leukemia. FIG. 3E is an image of wright stained cells derived from Rag1-/- BCR-ABL/Vector driven leukemia. FIG. 3F is an image of wright stained cells derived from Rag1-/- BCR-ABL/ICN driven leukemia.
FIG. 4A is a graph of the survival rate of mice transplanted with bone marrow cells infected with BCR-ABL+NUP98-HOXA9 and either Vector or NUMB. FIG. 4B is a graph of a FACS analysis showing the percentage of differentiated leukemic cells from mice transplanted with BCR-ABL/NUP98-HOXA9/Vector or BCR-ABL/NUP98-HOXA9/Numb infected cells. FIG. 4C is a graph of FACS analysis showing the average percentage of lineage negative cells from control or Numb expressing leukemias. FIG. 4D is a graph of the survival rate of mice transplanted with cells from primary transplanted mice. FIG. 4E and FIG. 4H are images of spleen sections from leukemic Vector infected transplants, FIG. 4F and FIG. 4I are images of spleen sections from leukemic Numb infected transplants, and FIG. 4G and FIG. 4J are images of spleen sections from healthy Numb infected transplants.
FIG. 5A is a graph of primary colony number for AML cells infected with either control Vector-GFP or Numb-GFP. FIG. 5B is a graph of secondary colony number for AML cells infected with either control Vector-GFP or Numb-GFP. FIG. 5C is a graph of the survival of mice transplanted with AML cells infected with either vector or Numb. FIG. 5D is a graph of a representative example of lineage analysis for leukemic spleen cells from primary transplanted mice, wherein AML cells were analyzed for frequency of lineage negative population. FIG. 5E is a graph of the average percentage of lineage negative population from primary transplanted mice. FIG. 5F is the cancer stem cell frequency in primary leukemias. FIG. 5G is a graph of the average stem cell frequency in primary leukemias. FIG. 5H is a graph of the survival rate of mice transplanted with cells from primary transplanted mice that were sorted for donor derived cells. FIG. 5I is an image of leukemic spleen cells from secondary transplanted mice infected with control Vector-GFP, with representative myeloblasts indicated by arrows. FIG. 5J is an image of leukemic spleen cells from secondary transplanted mice infected with Numb-GFP, with representative differentiated myeloid cells indicated by arrows.
FIG. 6A is an image of hematoxylin and eosin stained spleen sections from mice transplanted with leukemic vector infected transplants, FIG. 6B is an image of hematoxylin and eosin stained spleen sections from mice transplanted with leukemic Numb infected transplants, and FIG. 6C is an image of hematoxylin and eosin stained spleen sections from mice transplanted with healthy Numb infected transplants.
FIG. 7A is a schematic of the strategy to detect Notch signaling in chronic and blast crisis CML. FIG. 7B shows GFP expression in donor derived cells from chronic CML as analyzed by FACS for TNR reporter activity. FIG. 7C shows GFP expression in donor derived cells from blast crisis CML as analyzed by FACS for TNR reporter activity. FIG. 7D and FIG. 7E show blast crisis CML cells from TNR mice that were cytospun and immunostained with anti-cleaved Notch1 antibody and DAPI.
FIG. 8A shows survival for blast crisis CML cells that were infected with either vector control or dominant negative Xenopus Suppressor of Hairless (dnXSu(H)), sorted, and transplanted into irradiated recipients. FIG. 8B shows survival for cells from primary transplanted mice that were sorted for donor-derived cells and serially transplanted into irradiated recipients. FIG. 8C shows survival for bone marrow progenitors from control (+/+) mice or conditional Rbpj knockout (Rbpj-/-) mice that were infected with NUP98-HOXA9 and BCR-ABL and transplanted into irradiated recipients. FIG. 8D shows survival for cells from primary transplanted mice that were sorted for donor-derived cells and serially transplanted into irradiated recipients.
FIG. 9A shows Lin- cells from Vector- or Numb-expressing NUP98-HOXA9/BCR-ABL-induced leukemia that were sorted, cytospun, and immunostained with anti-p53 and DAPI. FIG. 9B shows survival for bone marrow cells from p53 null mice (p53-/-) that were infected with BCR-ABL and NUP98-HOXA9 together with either Vector or Numb and transplanted into irradiated recipients. FIG. 9C shows survival for donor-derived cells from primary transplants that were re-transplanted and monitored for secondary disease. FIG. 9D shows the frequency of the Lin- population from primary and secondary leukemia. FIG. 9E shows the number of colonies from cells from primary transplants that were sorted and plated in methylcellulose media. FIG. 9F shows the number of colonies from cells from primary plating that were harvested and replated for secondary colonies.
FIG. 10 is a graph of relative gene expression of Numb from human CML-MMR, CML-no MMR, and bcCML patients.
FIG. 11A is a graph of the relative gene expression of Msi2 in AML and CML cells. FIG. 11B is a graph of the relative gene expression of Msi2 in AML sorted into Lin- or Lin+ fractions based on the expression of lineage markers.
FIG. 12A shows Musashi (Msi) expression in whole bone marrow (WBM), KLS cells, chronic and blast crisis CML, olfactory bulb (OB), -reverse transcriptase (-RT in OB), and water. FIG. 12B is a graph of Msi2 expression as determined by Realtime PCR in KLS cells and Lin.sup.+ cells. FIG. 12C is a graph of Msi2 expression as determined by Realtime PCR in blast crisis phase and chronic phase cells. FIG. 12D is a graph of Msi2 expression as determined by Realtime PCR in lin.sup.- chronic and blast crisis phase cells relative to normal KLS and lin.sup.+ cells. FIG. 12E is a graph of Msi2 expression as determined by Realtime PCR in lin.sup.- or lin.sup.+ blast crisis CML cells. FIG. 12F are control vector- or Msi2-expressing CML cells that were stained with anti-Numb antibody and DAPI. FIG. 12G is a graph of fluorescence intensity quantified for the cells in 12F. FIG. 12H is a graph of Msi2 expression in KLS cells transduced with either control vector or NUP98-HOXA9 retrovirus along with BCR-ABL. FIG. 12I is a schematic diagram of the murine Msi2 gene structure. FIG. 12J shows ChIP performed either with IgG control or anti-HoxA9 antibody for Flt3. FIG. 12K shows ChIP performed either with IgG control or anti-HoxA9 antibody for Msi2 -5.7 kb region. FIG. 12L shows ChIP performed either with IgG control or anti-HoxA9 antibody for Msi2+110 kb region. FIG. 12M shows .beta.-galactosidase reporter activity for KLS cells from Msi2 genetrap reporter mice that were transduced with BCR-ABL with either control vector or NUP98-HOXA9.
FIG. 13A is a schematic illustration of a Msi2 mutant allele generated by an insertion of a genetrap vector pU-21. FIG. 13B is a graph of Msi2 expression in whole bone marrow cells from control (+/+) and homozygotes for the genetrap allele (Gt/Gt) as analyzed by Realtime RT-PCR.
FIG. 14A is the frequency of KLS cells in mice of indicated genotypes (+/+, +/Gt, Gt/Gt). FIG. 14B shows is a survival curve of mice transplanted with BCR-ABL and NUP98-HOXA 9 infected +/+ or Gt/Gt KLS cells. FIG. 14C is a graph of colony numbers for blast crisis CML cells transduced with control shRNA (shLuc) or Msi2 shRNA (shMsi). FIG. 14D is a survival curve of mice transplanted with established blast crisis CML cells infected with control shLuc or shMsi. FIG. 14E are Wright's stain of leukemic cells from mice transplanted with control shLuc or shMsi infected blast crisis CML. FIG. 14F is a survival curve of mice transplanted with Lin.sup.- cells from primary shRNA expressing leukemias.
FIG. 15A is a graph of Msi2 expression in Lin- cells from NUP98-HOXA9/BCR-ABL-induced blast crisis leukemias that were infected with either shLuc or shMsi. FIG. 15B is a graph of Msi2 expression after Msi2 knockdown by an independent lentiviral shRNA construct, shMsi-2. FIG. 15C is a graph of the number of colonies formed with an independent shRNA construct, shMsi-2. FIG. 15D is a graph of Msi2 expression in samples expressing the indicated constructs. FIG. 15E is a graph of the colony-forming ability of the samples in 15D.
FIG. 16 is a graph of survival of mice transplanted with AML cells transduced with Msi2 shRNA or with a control shRNA.
FIG. 17 is a graph of MSI2 expression levels in human chronic phase leukemia and blast crisis leukemia.
FIG. 18A is a graph of MSI2 expression in chronic and blast crisis CML patient samples from the Korean Leukemia Bank. FIG. 18B is a graph of MSI2 expression in chronic and blast crisis CML patient samples from the Hammersmith MRD Lab Sample Archive. FIG. 18C is a microarray analysis of expression of MSI2 in bone marrow and peripheral blood samples. FIG. 18D is a microarray analysis of expression of NUMB in bone marrow and peripheral blood samples. FIG. 18E is a microarray analysis of expression of HOXA9 in bone marrow and peripheral blood samples. FIG. 18F is a microarray analysis of expression of HES1 in bone marrow and peripheral blood samples. FIG. 18G is a schematic diagram of a proposed model for the role of Musashi and Numb in CML progression.
FIG. 19A is a graph of HES1 expression during CML progression within a single patient. FIG. 19B is a graph of TRIB2 expression in chronic and blast crisis phase cells from CML patient samples in individual samples. FIG. 19C is a graph of average TRIB2 expression levels in chronic and blast crisis phase cells from CML patient samples.
DETAILED DESCRIPTION
As described in the Examples, it was discovered that CML cells in general expressed significantly higher levels of Numb as compared to AML cells. As used herein, the aggressive from of CML is referred to either as blast crisis CML (bcCML) or acute phase leukemia (AML). Interestingly, a subpopulation of CML cells expressing lower levels of Numb was identified. Surprisingly, the CML cells expressing lower levels of Numb correspond to CML cells unresponsive to treatment with imatinib, a tyrosine kinase inhibitor. Thus it was discovered that the level of Numb expression in a cancer cell can be used to predict responsiveness of CML cells to chemotherapeutics. Further, it is appreciated that therapeutics directed at increasing Numb expression within the cancer cells may decrease the aggressiveness of the cancer and increase responsiveness to other chemotherapeutics.
In addition, it was also discovered that Musashi, namely Msi2, expression downregulates Numb expression. Thus, Musashi expression may also be predictive of chemotherapeutic responsiveness. Additionally, it was discovered that reducing expression of Musashi in the cancer cells results in increased Numb expression, reduces the aggressiveness of the cancer and increases the responsiveness of the cancer to chemotherapeutics.
Methods of predicting responsiveness of a cancer cell to a tyrosine kinase inhibitor are provided herein. The method includes evaluating the level of Numb expression in the cancer cell and then using the level of Numb expression in the cancer cell to predict the responsiveness of the cancer cell to the tyrosine kinase inhibitor. As shown in Example 6, CML cells that do not respond to treatment with the tyrosine kinase inhibitor imatinib were found to have reduced expression of Numb. Accordingly, reduced Numb expression relative to a control is predictive of non-responsiveness to tyrosine kinase inhibitors, including imatinib.
The level of Numb expression in the cancer cell may be evaluated by a variety of techniques, as will be appreciated by those of skill in the art. For example, the level of Numb expression may be evaluated at either the protein or mRNA level using techniques including, but not limited to, Western blot, ELISA, Northern blot, real time PCR, immunofluorescence, or FACS analysis. In Example 2, the expression level of Numb was evaluated by immunofluorescence by visualizing cells stained with a fluorescently-labeled Numb-specific antibody, Western blot analysis of Numb protein expression, and RT-PCR of Numb transcripts.
As stated above, the expression level of Numb may be compared to a control. A control may include comparison to the level of Numb expression in a control cell, such as a noncancerous cell or a cancer cell with known responsiveness to a therapeutic. Alternatively a control may include an average range of the level of Numb expression from a population of chemotherapeutic responsive CML cells, non-cancer cells, chemotherapeutic non-responsive cells, or a combination thereof. Alternatively, a standard value developed by analyzing the results of a population of cells with known responsivities to tyrosine kinase inhibitors may be used. Those skilled in the art will appreciate that a variety of controls may be used.
Predicting may include using the information found in the Examples or generated by another entity to generate predictions. Predictions may be based on a comparison internal to a single assay or by comparison to a standard. For example the level of expression of Numb may be used to predict a cancer's responsiveness to a therapeutic. Predictions may be generated in relation to a standard or control as discussed above. This does not mean that the predicted event will occur with 100% certainty. Predicting and prediction also includes, but is not limited to, generating a statistically based indication of whether a particular event will occur, e.g. whether the cancer will be responsive to treatment with tyrosine kinase inhibitors.
The cancer cells for use in the methods include, but are not limited to, cancers cells characterized by a lack of differentiation of the cell. Examples of this type of cancer cell may include, but are not limited to, a leukemia cell, a breast cancer cell, a glioblastoma cell, or a lymphoma cell. The leukemia cell may be myeloproliferative disorder including but not limited to preleukemia. The leukemia cell may be a medullablastoma cell. The leukemia cell may be a myeloid or a lymphoid leukemia cell. Suitably, the cancer cell may be a myelogenous leukemia cell. Suitably, the cancer cell may be a CML or AML cell.
Tyrosine kinase inhibitors encompass agents that inhibit the activity of one or more tyrosine kinases. For example, a tyrosine kinase inhibitor may indirectly or directly bind and inhibit the activity of the tyrosine kinase, including binding activity or catalytic activity. A tyrosine kinase inhibitor may prevent expression of the tyrosine kinase, or inhibit the ability of the tyrosine kinase to mediate phosphorylation of its target. Examples of tyrosine kinase inhibitors include, but are not limited to, imatinib mesylate, axitinib, bosutinib, cediranib, dasatinib, erlotinib, gefitinib, lapatinib, lestaurtinib, nilotinib, semaxanib, sunitinib, vandetanib, and vatalanib.
The level of Numb protein correlates to the resistance or sensitivity of a cancer cell to treatment with a tyrosine kinase inhibitor. For example, reduced expression of Numb relative to a control cell that is responsive to a tyrosine kinase inhibitor is indicative of non-responsiveness. Increased expression of Numb relative to an AML cell is indicative of responsiveness of the cell to tyrosine kinase inhibitors. In FIG. 7, non-responsive CML cells expressed Numb at a level 20% of that of responsive CML cells. Cells expressing less than about 50%, about 40%, about 30%, about 20%, about 10%, about 5%, or about 1% as much Numb as control cells responsive to treatment are predicted to be non-responsive to treatment with tyrosine kinase inhibitors. Conversely, cells expressing more than about 50%, 60%, 70%, 80%, 90%, or 100% as much Numb as control cells responsive to treatment are predicted to be responsive to treatment with tyrosine kinase inhibitors. It is envisioned that cells having more than 2, 3, 4, 5, 6, 8, or 10 fold higher Numb expression than control cells non-responsive to treatment may be responsive to treatment with tyrosine kinase inhibitors, and cells expressing less than 125%, 100%, or 90% as much Numb as control cells non-responsive to treatment are predicted to be non-responsive to treatment with tyrosine kinase inhibitors.
In another embodiment, methods of predicting the risk of progression of a cancer cell to a more aggressive form are provided. The methods include evaluating the level of Numb expression in a cancer cell and using the level of expression to predict the risk of progression to a more aggressive form. Suitably, a reduced level of Numb expression relative to a control CML cell is indicative of an increased risk of progression to a more aggressive form. Similarly, increased expression of Numb correlates with less aggressive cancers. As shown in Examples 2-6, CML cells expressed significantly higher levels of Numb compared to AML cells, and Numb expression appears to be reduced with progression from chronic disease to acute disease. For example, reduced expression of Numb relative to a control CML cell is indicative of an increased risk of progression of the cancer cell to a more aggressive form. Increased expression of Numb relative to a control CML cell is indicative of a decreased risk of progression of the cancer cell to a more aggressive form. Thus the risk of progression of the cancer may be evaluated using methods similar to those described above for predicting responsiveness to a therapeutic.
In another embodiment, methods of reducing proliferation or promoting differentiation of a cancer cell having reduced expression of Numb protein relative to a control are provided. The cancer cells are contacted with an agent capable of increasing the level of Numb protein in a cell. In this embodiment, a control includes a control cell, such as a non-cancer cell of the same type as the cancer cell or a standard based on such a control cell.
Agents capable of increasing the level of Numb protein include any agent capable of increasing Numb protein or Numb mRNA levels. In one embodiment, the agent may comprise the Numb protein itself. For example, the agent may include exogenously expressed and isolated Numb protein capable of being delivered to the cells. The Numb protein may be delivered to cells by a variety of methods, including fusion to Tat or VP16 or via a delivery vehicle, such as a liposome, all of which allow delivery of protein based agents across the cellular membrane. Those of skill in the art will appreciate that other delivery mechanisms for proteins may be used. Alternatively, Numb mRNA expression may be enhanced relative to control cells by contact with the agent. For example, the agent capable of increasing the level of natively expressed Numb protein may include a gene expression activator or de-repressor. The agent capable of increasing the level of Numb protein may also include agents that bind to Numb directly or indirectly and increase the effective level of Numb, for example, by enhancing the binding or other activity of Numb.
In another embodiment, the agent capable of increasing the level of Numb protein may comprise a polynucleotide encoding the Numb protein or a polypeptide having at least 95% amino acid identity to Numb and having Numb activity. There are several isoforms of the Numb protein, including, for example, SEQ ID NOs: 12, 14, 16, 18, 20, 22, and 24, each of which may be encoded by more than one polynucleotide sequence, including, for example, SEQ ID NOs: 11, 13, 15, 17, 19, 21, and 23 (see polynucleotide and amino acid sequences appended to this application in a sequence listing, which is incorporated herein by reference in its entirety). Envisioned are polynucleotide sequences encoding Numb, a polypeptide sequence encoding Numb, or a polypeptide having at least 95% amino acid identity to Numb and having Numb activity. Those skilled in the art will appreciate that a Numb polynucleotide may be delivered to cells in a variety of ways, including, but not limited to, transfection, transduction, transformation, via a vector such as a viral vector or expression vector, or via a liposome. Suitably the polynucleotide encoding the Numb protein is operably connected to a promoter such that the Numb protein is expressed in the cancer cells. As shown in Example 4, expressing Numb from a vector in AML cells may increase the level of Numb and promote differentiation (FIG. 4B). It is further shown in the Examples that leukemias developed in the presence of Numb may be significantly more differentiated and less aggressive. Suitably, the agent has a direct effect on Numb protein or mRNA expression. In another embodiment, the agent capable of increasing the level of Numb protein may comprise an agent capable of decreasing Msi, as described further below.
In another embodiment, methods of treating a mammalian subject having a cancer with a reduced level of Numb protein as compared to a control are provided. The method may comprise administering to the subject an agent, such as those described above, capable of increasing the level of Numb protein in an amount effective to treat cancer. As will be appreciated by those of skill in the art, an agent may be administered by various methods including sublingually, orally, enterally, parenterally, topically, systemically or injected intravascularly or intraarterially, cutaneously, or peritoneally. Treating cancer includes, but is not limited to, reducing the number of cancer cells in the subject, reducing progression of a cancer cell from a chronic to a more aggressive form, reducing proliferation of cancer cells, killing of cancer cells, or reducing metastasis of cancer cells.
In another embodiment, methods of assessing the chemotherapeutic potential of an agent are provided. The methods may include contacting a cell with the agent and then evaluating the level of Numb in the contacted cell. As demonstrated in the Examples, the level of Numb in the contacted cell is indicative of the therapeutic potential of the agent. Specifically, increased expression of Numb in cells contacted with the agent is indicative of an agent with therapeutic potential. Conversely, a lack of any change or a reduction in Numb expression after contact with the agent as compared to the level of Numb expression prior to contact with the agent is indicative of a lack of therapeutic potential of the agent. In FIG. 10, CML cells responsive to imatinib were shown to express relatively high levels of Numb protein while those resistant to imatinib were shown to express relatively low levels of Numb.
Chemotherapeutic potential of an agent is the assessment of the agent's capability to act as a chemotherapeutic. Chemotherapeutic potential may include a prediction of the agent's capability to kill at least one cancer cell, to reduce the growth rate or proliferation rate of a cancer cell, to reduce the number of cancer cells in an individual, or to reduce progression of a cancer cells from a chronic to a more aggressive form.
Cells may be contacted with the agent directly or indirectly in vivo, in vitro, or ex vivo. Contacting encompasses administration to a cell, tissue, mammal, patient, or human. Further, contacting a cell includes adding an agent to a cell culture. Other suitable methods may include introducing or administering an agent to a cell, tissue, mammal, or patient using appropriate procedures and routes of administration as defined above.
In another embodiment, methods of reducing proliferation or promoting differentiation of a cancer cell having increased Msi expression are provided. The methods include contacting the cell with an agent capable of decreasing Msi to reduce proliferation or increase differentiation of cells. Decreasing Msi includes reducing the level of Msi expression at the mRNA or protein level or decreasing the activity of Msi. As used herein, Msi includes Msi1, Msi2, MSI1, MSI2, or combinations thereof. Also included are homologs and orthologs of Msi such as human MSI2. As shown in Example 8, the human ortholog MSI2 has the same pattern of expression in leukemic cells from chronic and blast-crisis CML as the expression pattern in a mouse model.
Levels of Msi correlate to aggressiveness of cancer. Thus, methods of predicting the risk of progression of a cancer cell to a more aggressive form are provided. These methods include evaluating the level of Msi expression in the cancer cell and using the level of expression to predict the risk of progression to a more aggressive form of the cancer.
As shown in Example 7, Msi2 contributes to the establishment and maintenance of AML from CML. Further shown in Example 7 is that AML cells require Msi2 during disease maintenance and propagation. FIG. 16 shows that decreasing the levels of Msi in a cell reduce cancer cell survival. Reducing the level of Msi in a cancer cell may reduce cancer cell survival by at least about 5%, at least about 10%, at least about 20%, at least about 30%, at least about 40%, at least about 50%, at least about 60%, or at least about 70%. A reduction in cancer cell survival may be achieved by reducing Msi expression or activity by at least about 50%, 40%, 30%, 20%, 10%, 5% or less as compared to the Msi expression or activity prior to treatment with the agent.
An agent capable of decreasing Msi includes a variety of agents and molecules capable of decreasing Msi mRNA transcripts or protein levels in the contacted cell. In one embodiment, the agent capable of decreasing Msi may comprise an inhibitory RNA. Suitably, the inhibitory RNA may comprise a shRNA such as SEQ ID NO: 9 as used in Example 7. An inhibitory RNA may comprise a sequence complementary to a portion of an RNA sequence encoding Msi. There are several isoforms of the Msi protein, including, for example, SEQ ID NOs: 26, 28, and 30, each of which may be encoded by more than one polynucleotide sequence, including, for example, SEQ ID NOs: 25, 27, and 29 (see polynucleotide and amino acid sequences appended to this application in a sequence listing, which is incorporated herein by reference in its entirety). Envisioned are polynucleotide sequences encoding Msi, a polypeptide sequence encoding Msi, or a polypeptide having at least 95% amino acid identity to Msi and having Msi activity. In some embodiments, the agent capable of decreasing Msi may include a gene expression repressor. In some embodiments, the agent capable of decreasing Msi may include a small molecule inhibitor. The agent capable of decreasing Msi may also include agents that bind to Msi directly or indirectly and decrease the effective level or activity of Msi, for example, by inhibiting the binding or other activity of Msi. The agent capable of decreasing Msi may also include agents that decrease Msi1, Msi2, or both. As shown in Examples 7 and 8, Msi2 expression was found to be greater in AML than in CML cells and Msi2 expression may be associated with immature leukemic cells (FIG. 11). Further, Msi2 knockdown with shRNA resulted in the longer latency of AML development in the mouse model of AML (FIG. 16).
In another embodiment, methods of treating a mammalian subject having a cancer with increased Msi expression relative to a control are provided. The methods include administering to the subject an effective amount of an agent capable of decreasing the level of Msi. Modes of administering an agent are discussed above. Agents suitable for the methods are similar to those described above that are capable of decreasing Msi expression or activity.
In another embodiment, methods of assessing an agent for chemotherapeutic potential are provided. The methods include contacting a cell with the agent and evaluating the level of Msi expression or activity in the contacted cell. The level of Msi expression or activity may be evaluated using methods similar to those described above. The level of Msi may be compared to a control, such as cells prior to contact with the agent, as described above. The level of Msi expression in the contacted cell may be indicative of the chemotherapeutic potential of the agent. As shown in Example 7, Msi2 may reduce the level of Numb protein and, at least in part, may activate a cascade that leads to inhibition of differentiation and a less aggressive form of cancer. Msi2 may downregulate Numb and contribute to the establishment and maintenance of acute myeloid leukemia. As detailed above, Numb expression may be used as part of a method to assess an agent for chemotherapeutic potential. Decreased Msi expression in a cancer cell may increase the level of Numb in the cancer cell and lead to reduced differentiation and a less aggressive form of cancer. As one example, reduced expression of Msi relative to an AML cancer cell control upon administration of an agent is indicative of an agent that is an effective chemotherapeutic agent.
EXAMPLES
Example 1
Materials and Methods
Mice
Mouse models of CML were generated by transducing bone marrow stem and progenitor cells with retroviruses carrying BCR-ABL (chronic phase), or BCR-ABL and NUP98-HOXA9 (blast crisis phase) and transplanted into irradiated recipient mice. The development of CML was confirmed by flow cytometry and histopathology. Transgenic Notch reporter (TNR), Rag1-/-, and C57BL6/J were used as transplant donors, and C57Bl6/J CD45.1 and CD1 mice were used as transplant recipients. All mice were 8-12 weeks of age. Mice were bred and maintained on acidified water after transplantation in the animal care facility at Duke University Medical Center. All live animal experiments were performed according to protocols approved by the Duke University Institutional Animal Care and Use Committee. For Msi2 knockdown experiments, lineage negative blast crisis CML cells were infected with Msi2 or control Luciferase shRNA retroviral constructs and leukemia incidence monitored.
Cell Isolation and FACS Analysis
HSCs (hematopoietic stem cells) were sorted from mouse bone marrow as described (Zhao, C. et al. Cancer Cell 2007, 12, 528-41, incorporated by reference herein in its entirety). -Kit+ cells were enriched by staining whole bone marrow with anti-c-Kit (CD117) microbeads (Miltenyi Biotec) and isolating positively labeled cells with autoMACS cell separation (Miltenyi Biotec). For lineage analysis peripheral blood cells were obtained by tail vein bleeds and diluted in 0.5 mL of 10 mM EDTA in PBS. 1 mL of 2% dextran was then added to each sample, and red blood cells depleted by sedimentation for 45 minutes at 37.degree. C. Red blood cells were lysed using 1.times.RBC Lysis Buffer (eBiosciences) before staining for lineage markers. The following antibodies were used to define the lineage positive cells in leukemic samples: 145-2C11 (anti-CD3e), GK1.5 (anti-CD4), 53-6.7 (anti-CD8), RB6-8C5 Ly-6G (anti-Gr-1), M1/70 (anti-CD11b, Mac-1), Ter119 (anti-erythrocyte specific antigen), and 6B2 (anti-B220). Other antibodies used for HSC sorts included 53-7.3 (anti-CD5) as part of the lineage cocktail, 2B8 (anti-CD117, c-Kit) and D7 (anti-Ly-6A/E, Sca-1). All antibodies were purchased from Pharmingen or eBiosciences. Analysis and cell sorting were carried out on a FACSVantage SE (Becton Dickinson), FACSTAR (Becton Dickinson), or FACsDiva (Becton Dickinson) at the Duke Cancer Center FACS facility.
Viral Production and Infection
The BCR-ABL polynucleotide was a gift from Warren Pear and Ann Marie Pendergast and was cloned into a MSCV-IRES-YFP or a MSCV-IRES-CFP retroviral vector. HOXA9-NUP98-IRES-YFP was a gift from Gary Gilliland and Craig Jordan and was also cloned into the MSCV-IRES-NGFR vector. Numb cDNA (p65 isoform, Accession number BC033459, NCBI) was cloned into the MSCV-IRES-GFP (and hCD2) vectors. ICN1 was cloned into the MSCV-IRES-CFP or YFP retroviral expression vectors. Virus was produced by triple transfection of 293T cells with MSCV constructs along with gag-pol and VSVG constructs. Viral supernatant was collected for three days and concentrated 100-fold by ultracentrifugation at 50,000.times.g. For viral infection, c-Kit+ enriched or KLS cells were cultured overnight in the presence of X-Vivo15 (BioWhittaker), 50 .mu.M 2-mercaptoethanol, 10% fetal bovine serum, SCF (100 ng/mL), and Tpo (20 ng/mL). After 12-18 h, concentrated retroviral supernatant was added to the cells. Cells were then incubated at 32.degree. C. for 12 h and 37.degree. C. for 36 h. Infected cells were then sorted based on their GFP, YFP, CFP, NGFR, or hCD2 expression as appropriate. All cytokines were purchased from R&D systems.
In Vitro Methylcellulose Assays
Lineage negative, NUP98-HOXA9-YFP positive cells from AML were sorted and infected retrovirally with either Vector-IRES-GFP or Numb-IRES-GFP. After 48 hours of infection, cells were sorted and serially plated on complete methylcellulose medium (Methocult GF M3434 from StemCell Technologies).
In Vivo Leukemia Models
Bone marrow c-Kit+ or KLS cells from C57BL6/J or TNR mice were enriched and cultured overnight in X-vivo15 with 10% FBS, 50 .mu.M 2-mercaptoethanol, 100 ng/mL SCF, and 20 ng/mL TPO in a 96 well U-bottom plate or 6 well plate. Subsequently, cells were infected with MSCV-BCR-ABL-IRES-YFP (or CFP) to generate CML, or MSCV-BCR-ABL-IRES-YFP (or CFP) and MSCV-NUP98-HOXA9-IRES-YFP (or NGFR) to generate AML. Cells were harvested 48 hours after infection and transplanted retro-orbitally into groups of 4-7 recipient mice. Recipients were lethally irradiated (10 Gy) for CML, and sublethally irradiated (7 Gy) for AML. For Numb overexpression, cells were infected with either MSCV-Numb-IRES-GFP (or hCD2) or MSCV-IRES-GFP (or hCD2) along with MSCV-BCR-ABL-IRES-YFP (or CFP) and MSCV-NUP98-HOXA9-IRES-NGFR (or YFP) and 20,000 to 100,000 sorted infected cells were transplanted per mouse. For secondary transplantation, cells from primary transplanted mice were sorted for either MSCV-Numb-IRES-GFP and MSCV-NUP98-HOXA9-YFP or MSCV-IRES-GFP and MSCV-NUP98-HOXA9-YFP, and 7,000 to 8,000 cells were transplanted per mouse. For ICN experiments, cells were infected with MSCV-ICN-IRES-CFP and MSCV-BCR-ABL-GFP, MSCV-ICN-IRES-CFP and MSCV-IRES-GFP, or MSCV-BCR-ABL-IRES-GFP and MSCV-IRES-CFP, and 10,000 to 20,000 KLS-derived or 200,000 to 500,000 c-kit+-derived sorted cells were transplanted per mouse. For the TNR mouse model, cells were infected with MSCV-BCR-ABL-IRES-YFP (or CFP) to generate CML or MSCV-BCR-ABL-IRES-YFP (or CFP) and MSCV-NUP98-HOXA9-IRES-NGFR to generate AML. 10,000 to 80,000 unsorted cells were transplanted per mouse. After transplantation, recipient mice were subsequently maintained on antibiotic water (sulfamethoxazole and trimethoprim) and evaluated daily for signs of morbidity, weight loss, failure to thrive, and splenomegaly. Premorbid animals were sacrificed by CO.sub.2 asphyxiation followed by cervical dislocation. Subsequently relevant tissues were harvested and analyzed by flow cytometry and histopathology.
Immunofluorescence Staining
For immunofluorescence relevant cell populations were sorted, cytospun, and fixed in 4% paraformaldehyde for 5 minutes. Samples were then blocked using 20% normal donkey serum in PBS with 0.1% Tween 20, and stained at 4.degree. C. overnight with an antibody to Numb (1:200) (ab4147, Abcam) followed by anti-goat Alexa 594 (Molecular probe) and DAPI. Slides were mounted using fluorescent mounting media (Fluoromount-G SouthernBiotech) and viewed by confocal microscopy.
Real Time PCR and RT PCR Analysis
RNA was isolated using RNAqueous-Micro (Ambion), levels were equalized, and RNA was converted to cDNA using Superscript II reverse transcriptase (Invitrogen). Quantitative real time PCRs were performed using an iCycler (BioRad) by mixing cDNAs, iQ SYBR Green Supermix (BioRad) and gene specific primers. Results were normalized to the level of beta-2-microglobulin (B2m). Primer sequences are as follows: Numb-F, ATGAGTTGCCTTCCACTATGCAG (SEQ ID NO: 1); Numb-R, TGCTGAAGGCACTGGTGATCTGG (SEQ ID NO: 2); Msi1-F, ATGGATGCCTTCATGCTGGGT (SEQ ID NO: 3); Msi1-R, CTCCGCTCTACACGGAATTCG (SEQ ID NO: 4); Msi2-F, TGCCATACACCATGGATGCGT (SEQ ID NO: 5); Msi2-R, GTAGCCTCTGCCATAGGTTGC (SEQ ID NO: 6); B2m-F, ACCGGCCTGTATGCTATCCAGAA (SEQ ID NO: 7); B2m-R, AATGTGAGGCGGGTGGAACTGT (SEQ ID NO: 8).
Statistical Analysis
Student's or Welch's t-test and logrank test were utilized to determine statistical significance.
Viral Constructs
Viral constructs used included MSCV-Numb-IRES-GFP, MSCV-Numb-IRES-hCD2, MSCV-NUP98-HOXA9-IRES-YFP, MSCV-NUP98-HOXA9-IRES-NGFR, MSCV-ICN1-IRES-CFP, MSCV-ICN1-IRES-YFP, MSCV-IRES-GFP, MSCV-BCR-ABL-IRES-YFP, MSCV-BCR-ABL-IRES-CFP, MSCV-BCR-ABL-IRES-GFP, MSCV-IRES-hCD2, MSCV-IRES-NGFR.
Chromatin Immunoprecipitation (ChIP) Assays
ChIP assays were performed using the myeloid leukemia cell line M1. DNA was crosslinked and immunoprecipitated with control or anti-HOXA9 antibodies and analyzed by PCR for regions of interest.
Human Samples
CML patient samples were obtained from the Korean Leukemia Bank (Korea), the Hammersmith MRD Lab Sample Archive (United Kingdom), the Fred Hutchinson Cancer Research Center (United States) and the Singapore General Hospital (Singapore). Gene expression in human chronic and blast crisis CML was analyzed by PCR or by DNA microarrays.
Example 2
Expression of Numb in CML and AML
The expression of Numb in mouse models of CML and AML was examined CML was generated by introducing retroviral BCR-ABL into hematopoietic stem cell enriched populations (c-Kit+Lin-Sca-1+ or KLS), and transplanting these cells into irradiated recipients (Daley, G. Q., Van Etten, R. A. & Baltimore, D. Science 1990, 247, 824-30; Pear, W. S. et al. Blood 1998, 92, 3780-92; both incorporated herein by reference in their entireties). AML was induced by infecting KLS cells with both BCR-ABL and NUP98-HOXA9, and transplanting them into irradiated recipients (Dash, A. B. et al. Proc Natl Acad Sci USA 2002, 99, 7622-7; Neering, S. J. et al. Blood 2007, 110, 2578-85; both incorporated herein by reference in their entireties).
Cells from AML and CML were sorted, cytospun, and immunostained with anti-Numb antibody. Analysis of cells from fully developed AML and CML revealed that CML cells expressed significantly higher levels of Numb compared to AML cells (FIG. 1A, FIG. 1B). Data in FIG. 1A is representative of three independent experiments, and data shown in FIG. 1B is the average intensity from a representative experiment (p<0.05). This pattern of expression was also confirmed by western blotting with Numb protein band shown at approximately 65-70 kDa (FIG. 1C, data is representative of four independent experiments). As shown in FIG. 1C, the expression of Numb protein is 2.6 fold higher in CML cells relative to AML cells.
This pattern of expression was also confirmed by real time PCR (FIG. 1D). Briefly, AML and CML cells were sorted and RNA was isolated. The level of Numb was analyzed by realtime PCR (n=7 for CML; n=9 for AML; p<0.05), and results were normalized to beta-2-microglobulin expression levels.
Example 3
Numb Versus Notch Signaling in CML and AML
It was tested whether the activation of Numb corresponded to a decrease in Notch signaling in CML and AML. The Transgenic Notch Reporter (TNR) for mice was used, in which GFP expression reflects the status of Notch signaling (Wu, M. et al. Cell Stem Cell 2007, 1, 541-54; Duncan, A. W. et al. Nat Immunol 2005, 6, 314-22; Estrach, S., Ambler, C. A., Lo Celso, C., Hozumi, K. & Watt, F. M. Development 2006, 133, 4427-38; Lai, A. Y. & Kondo, M. Proc Natl Acad Sci USA 2007, 104, 6311-6; Hellstrom, M. et al. Nature 2007, 445, 776-80; all incorporated herein by reference in their entireties). GFP+KLS cells from TNR mice were sorted and infected with either BCR-ABL (to generate CML) or BCR-ABL and NUP98-HOXA9 (to generate AML), and infected cells were transplanted into irradiated recipients (FIG. 2A). Following transplantation and leukemia development, leukemia cells were isolated from bone marrow and analyzed for GFP fluorescence reporter activity using FACS analysis. While about 5% of CML cells were positive for GFP, 30% of AML cells were positive for GFP (FIG. 2B, FIG. 2C). Leukemia cells from wild type mice were used as negative control for GFP expression (n=3 for CML; n=4 for AML). This suggested that the low levels of Numb detected in AML correspond with increased Notch signaling.
The pattern of Numb and Notch signaling in AML essentially corresponded to the rise in the frequency of undifferentiated cells and suggested that the Numb-Notch pathway may play a functional role in inhibiting differentiation during AML establishment. To test whether upregulation of Notch signaling could drive the conversion of chronic leukemia to a more undifferentiated state, the constitutively active intracellular domain of Notch1 (ICN) was used (Carlesso, N., Aster, J. C., Sklar, J. & Scadden, D. T. Blood 1999, 93, 838-48, incorporated herein by reference in its entirety). Not only wild type mice were used but also Rag1 deficient (Rag1-/-) mice in which lymphoid development is blocked (Mombaerts, P. et al. Cell 1992, 68, 869-77, incorporated herein by reference in its entirety). c-kit+ or KLS cells were infected with BCR-ABL (n=18), ICN/Vector (n=11), or BCR-ABL/ICN (n=16), and transplanted into irradiated recipient mice. Analysis of survival over a period of 90 days revealed that activation of Notch signaling decreased the latency of leukemia driven by BCR-ABL (FIG. 3A). Data shown in FIG. 3A is a combination of 4 independent experiments (BCR-ABL/ICN versus ICN/Vector, p<0.0001; BCR-ABL/ICN versus BCR-ABL/Vector, p=0.0194).
The average percentage of blasts in leukemias from BCR-ABL/ICN versus BCR-ABL/Vector was also compared. As shown in FIG. 3B, a significantly higher percentage of blasts were found in leukemias from BCR-ABL+ICN (p=0.044; error bars show s.e.m.). The analysis included data from all mice that could be analyzed before succumbing to disease (for BCR-ABL/ICN n=6 wild type, and n=6 Rag 1-/- out of a total of 16 transplanted; for BCR-ABL/vector n=3 wild type and n=4 Rag-1-/- out of a total of 18 transplanted). As shown in FIG. 3B, the cooperative effect of BCR-ABL and ICN led to more undifferentiated leukemias, with control leukemias containing on average 6% myeloid blasts and BCR-ABL/ICN leukemias containing on average 35% myeloid blasts. Cells derived from wild type BCR-ABL/Vector driven leukemias (FIG. 3C), BCR-ABL/ICN driven leukemias (FIG. 3D), Rag1-/- BCR-ABL/Vector driven leukemias (FIG. 3E), BCR-ABL/ICN driven leukemias (FIG. 3F) were also compared, based on morphological analysis after wright staining splenocytes. Differentiated myeloid cells are indicated by arrowheads, and myeloblasts are indicated by arrows in FIG. 3 (magnification 100.times.). Although a majority of BCR-ABL/ICN leukemias derived from wild type cells were of the myeloid lineage (66%, 4/6, FIG. 3C, FIG. 3D), two displayed elements of lymphocytic leukemia (33%, 2/6, data not shown). In contrast, all BCR-ABL/ICN leukemias derived from Rag1-/- mice were of the myeloid lineage (100%, 6/6, FIG. 3E, FIG. 3F), allowing a clearer assessment of ICN contribution to myeloid leukemia progression. Cumulatively the data from both wild type and Rag1-/- mice suggested that activation of Notch signaling can inhibit differentiation and thereby drive the conversion of chronic myelogenous leukemias to a more undifferentiated state and a more aggressive form of cancer.
Example 4
Numb Induces Differentiation of Undifferentiated Leukemias
It was tested whether Numb had the ability to convert undifferentiated leukemias to a more differentiated state, and thus slow disease progression. Bone marrow c-kit+ cells were infected with BCR-ABL and NUP98-HOXA9 together with either control vector or Numb. The cells were transplanted, and survival and leukemia progression was monitored. 83% of BCR-ABL/NUP98-HOXA9/Vector (control) mice and 63% of those transplanted with BCR-ABL/NUP98-HOXA9/Numb developed leukemia (FIG. 4A; data shown is from four independent experiments; n=18 for Vector and n=19 for Numb). Cells were also analyzed via FACS for frequency of lineage negative cells to determine and compare the level of differentiation in the BCR-ABL+NUP98-HOXA9/Numb and BCR-ABL+NUP98-HOXA9/Vector cells. Results indicated that the relative survival increase in cells expressing Numb was consistent with leukemias developed in the presence of Numb that displayed increased differentiation (FIG. 4B; cells were analyzed for frequency of lineage negative cells). Specifically, while the frequency of lineage negative immature cells was on average 47% in control leukemias, it was reduced to 12.3% in Numb expressing leukemias (FIG. 4C; p<0.001; error bars shown s.e.m.). This showed that re-expression of Numb depleted the most immature fraction of AML and converted it to a more differentiated disease.
Secondary transplants were carried out to test the ability of control and Numb expressing AML cells to propagate disease in secondary recipients. Cells from primary transplanted mice were sorted and transplanted, and the mice were monitored for secondary disease. As shown in FIG. 4D (data shown is from two independent experiments; n=14 for Vector; n=15 for Numb; **p<0.001), control AML cells were able to propagate disease in nearly all of the mice (8/9, 89%), but Numb expressing AML cells were significantly impaired in their ability to propagate the disease and lead to a significant decrease in AML incidence (2/10, 20%). Importantly, the few leukemias that did develop in the presence of Numb were less aggressive than control leukemias.
Hematoxylin and Eosin staining of Spleen sections from leukemic Vector infected transplants (FIG. 4E and FIG. 4H), leukemic Numb infected transplants (FIG. 4F and FIG. 4I; disease at 40 days), and healthy Numb infected transplants (FIG. 4G, FIG. 4J; sacrificed at 150 days) were prepared to analyze the morphology of the cells. In FIGS. 4E-4J, cells were stained with Hematoxylin and Eosin, and magnification is 10.times. (E-G) or 63.times. (H-J), with red arrows indicating areas of immature myeloid cells and black arrows indicating lymphoid follicles. Error bars in all bar graphs are s.e.m. Data shown is representative of three to four independent experiments. While spleen sections from control leukemias displayed extensive myeloid cell infiltration (FIG. 4E and FIG. 4H red arrows), and few remaining areas of normal lymphoid follicles, spleen sections from leukemias expressing Numb showed greater preservation of lymphoid follicles (FIG. 4F and FIG. 4I, black arrows). In addition, surviving mice transplanted with Numb AML cells that were sacrificed and analyzed at 150 days displayed normal splenic architecture and had no indication of leukemogenesis (FIG. 4G and FIG. 4J). These data indicate that when expressed during disease initiation, Numb can impair both the incidence and progression of acute myeloid leukemia by inducing differentiation.
The ability of Numb to influence AML progression after disease had been established was also tested. Fully developed AML cells were infected with either vector or Numb, and colony-formation was assessed in vitro using a serial replating assay (Zhao, C. et al. Cancer Cell 2007, 12, 528-41; Huntly, B. J. et al. Cancer Cell 2004, 6, 587-96; both incorporated herein by reference in their entireties). AML cells were infected with either control Vector-GFP (MSCV-IRES-GFP) or Numb-GFP (MSCV-Numb-IRES-GFP), plated on methylcellulose, and colony numbers were counted. For secondary plating, cells from primary plating were harvested, replated, and colonies counted (n=3, p<0.05). While Numb expression did not alter AML colony formation in the primary plating (FIG. 5A) it led to 3-fold fewer colonies compared to control by the secondary plating (FIG. 5B). Error bars in FIG. 5A and FIG. 5B indicate s.e.m.
To test the influence of Numb on the growth of established AML in vivo, AML cells were isolated, infected with either vector or Numb, and transplanted into irradiated mice. Survival was monitored over time and compared. The incidence and latency of the disease in both groups were similar in the primary transplant (FIG. 5C). However, when cells were analyzed via FACS for frequency of lineage negative cells to determine and compare the level of differentiation in the AML cells with and without Numb, the leukemias differed in their cellular composition, with Numb expressing leukemias showing a significant decrease in undifferentiated lineage negative cells compared to control (36% vs. 63% FIG. 5D, FIG. 5E; p=0.0496; error bars show s.e.m.). FIG. 5E shows the average percentage of Lin- cells from primary transplanted mice. FIG. 5F shows representative examples of cancer stem cells frequency (Lin-Sca1+Flk2+CD150-) in primary leukemias. FIG. 5G shows the average cancer stem cell frequency in primary leukemias (control vector, n=3 and Numb, n=4; one statistical outlier from the Numb cohort was excluded based on Grubb's test, p=0.045).
In addition, cells from primary transplanted mice were sorted for donor derived cells, transplanted into irradiated recipients, and the survival of these mice was monitored. As shown in FIG. 5H (data shown is from three independent experiments; n=13 for Vector; n=15 for Numb; p=0.0002), Numb had a significant impact on disease progression in secondary transplants. While 78% (7/9) of mice transplanted with control cells succumbed to leukemia, only 30% (3/10) of mice transplanted with Numb expressing AML cells developed disease. Leukemic spleen cells from secondary transplanted mice with AML/Vector (FIG. 5I) or AML/Numb (FIG. 5J) were cytospun and Wright stained, and it was observed from the morphology that the leukemias that did develop in the presence of Numb were significantly more differentiated (arrows indicate myeloblasts in FIG. 5I and differentiated myeloid cells in FIG. 5J; magnification is 100.times.). These data indicated that continual Numb repression may be important to AML establishment as well as maintenance even after the disease is fully established. Importantly, leukemias that developed in the presence of Numb were more differentiated (FIG. 4B, FIG. 4C), and unable to propagate disease efficiently (93% versus 20%, FIG. 1g) or infiltrate secondary organs (FIG. 4E, FIG. 4F, FIG. 6); no signs of leukemia were detected in mice that survived (FIG. 4G, FIG. 6). Numb also impaired propagation of fully established leukemias and dramatically reduced the frequency of cancer stem cells (FIG. 5). Shown in FIG. 6 are leukemic cells from mice transplanted with control- or Numb-expressing blast crisis CML that were sorted, transplanted, and spleen sections obtained and analyzed. Shown are hematoxylin and eosin staining of spleen sections from a, leukemic vector infected transplants (FIG. 6A), leukemic Numb infected transplants (disease at 40 days, FIG. 6B), and healthy Numb infected transplants (sacrificed at 150 days, FIG. 6C). Original magnification was at 63.times., red arrows indicate areas of immature myeloid cells, and black arrows indicate lymphoid follicles. These data show that continual repression of Numb is essential for maintenance of blast crisis CML, and that increasing the levels of Numb can inhibit disease.
Example 5
Relationship of Numb and Notch in CML
It was tested whether Numb and Notch had a reciprocal relationship in CML. Notch signaling was elevated in blast crisis CML (FIG. 7). Notch signaling was differentially active in chronic and blast crisis CML. FIG. 7A shows a schematic of the strategy to detect Notch signaling in chronic and blast crisis CML. KLS GFP+ cells from transgenic Notch reporter mice (TNR) were sorted and infected with either BCR-ABL to generate chronic phase disease or BCR-ABL and NUP98-HOXA9 to generate blast crisis CML. Infected cells were transplanted into irradiated recipients (chronic phase, n=3 and blast crisis, n=4). Following leukemia development, cells were isolated from the bone marrow and analyzed by FACS for TNR reporter activity as assessed by GFP expression. FIG. 7B and FIG. 7C show GFP expression (black line) in donor derived cells from (B) chronic and (C) blast crisis CML. Leukemia cells from wild type mice were used as negative control for GFP (gray line). FIG. 7D and FIG. 7E show blast crisis CML cells from TNR mice were sorted for GFP low and GFP high, cytospun and immunostained with anti-cleaved Notch1 antibody (red) and DAPI (blue). Presence of ICN was higher in GFP high cells confirming Notch reporter activity correlated with cleaved ICN.
Notch signaling inhibition via dnXSu(H) delivery or through conditional deletion of Rbpj paralleled the effects of Numb and led to reduced incidence and propagation of blast crisis CML (FIG. 8) Inhibition of Notch signaling lead to impaired development and propagation of blast crisis CML. FIG. 8A shows data for blast crisis CML cells that were infected with either vector control or dominant negative Xenopus Suppressor of Hairless (dnXSu(H)), sorted, transplanted into irradiated recipients, and survival monitored. Data shown is from two independent experiments (Vector, n=10 and dnXSu(H), n=9, p=0.66). FIG. 8B shows data for cells from primary transplanted mice that were sorted for donor-derived cells, serially transplanted into irradiated recipients, and survival monitored. Data shown is from two independent experiments (n=10, **p<0.0001). FIG. 8C shows data for bone marrow progenitors from control (+/+) mice or conditional Rbpj knockout (Rbpj-/-) mice that were infected with NUP98-HOXA9 and BCR-ABL, transplanted into irradiated recipients, and survival monitored. Data shown is from three independent experiments (wild type, n=11 and Rbpj-/-, n=14, p=0.809). FIG. 8D shows data for cells from primary transplanted mice that were sorted for donor-derived cells, serially transplanted into irradiated recipients, and survival monitored (Vector, n=5 and Rbpj-/-, n=4, *p=0.012).
In addition, levels of p53, another Numb target, were higher in Numb-expressing blast crisis CML (FIG. 9A). In the absence of p53, Numb was unable to impact leukemic cell growth in vivo or in vitro (FIGS. 9B-9F), indicating that Numb's effects are in part dependent on p53. Loss of p53 impaired Numb's ability to inhibit blast crisis CML propagation. FIG. 9A shows Lin- cells from Vector- or Numb-expressing NUP98-HOXA9/BCR-ABL-induced leukemia that were sorted, cytospun, and immunostained with anti-p53 (red) and DAPI (blue). FIG. 9B shows data for bone marrow cells from p53 null mice (p53-/-) that were infected with BCR-ABL and NUP98-HOXA9 together with either Vector or Numb, transplanted into irradiated recipients, and survival monitored. Data shown are from three independent experiments (Vector, n=10 and Numb, n=9, p=0.0149). FIG. 9C shows data for donor-derived cells from primary transplants that were re-transplanted and survival monitored for secondary disease. Data shown are from two independent experiments (Vector, n=9 and Numb, n=10, p=0.0918). FIG. 9D shows the frequency of the Lin- population from primary and secondary leukemia. Error bars show s.e.m. For primary: Vector, n=7 and Numb, n=5; secondary: Vector, n=7 and Numb, n=9. For FIG. 9E, cells from primary transplants were sorted, plated in methylcellulose media, and colony numbers counted. Error bars show s.e.m. (n=2). For FIG. 9F, cells from primary plating were harvested and replated for secondary colonies (*p=0.029). Data is representative of two independent experiments. Error bars show s.e.m.
Example 6
Numb Expression is Diagnostic for Imatinib Non-Responsiveness
It was next tested whether Numb is differentially expressed in human CML, imatinib resistant CML, and blast crisis CML (bcCML) cells in human disease. CML cells were subdivided into two groups: CML with major or complete molecular response (MMR or CMR), which can be easily cured with Imatinib Mesylate (IM), and CML with no MMR, which may relapse after Imatinib Mesylate (IM) treatment. The average BCR-ABL transcript of CML with MMR or CMR was 0.033% on the International Scale (IS), whereas that of CML with no MMR was 2.055% IS 12 months after IM treatment. To analyze Numb expression in these samples, CML cells from bone marrow cells were collected from human CML and bcCML patients before IM treatment. The bone marrow were purified, RNA was isolated, and the level of Numb expression was analyzed by realtime PCR with results normalized to actin expression levels (n=5 for CML with MMR or CMR; p=0.07 and n=4 for CML with no MMR; p=0.03 and n=0.03 for bcCML). Numb expression levels in CML with MMR or CMR was higher compared to CML with no MMR and bcCML (FIG. 10). These data suggest that Numb expression is downregulated as disease becomes more aggressive, and Numb could be used as a prognostic marker for imatinib non-responsiveness within CML patients.
Example 7
Musashi as a Therapeutic for Acute and Blast Crisis Myeloid Leukemia
The expression levels of the two paralogous mammalian Musashi genes, Msi1 and Msi2, were examined using real time PCR. KLS cells were sorted, and RNA was extracted and reverse transcribed. Following equalization of template cDNA, Msi1 and Msi2 transcript expression was analyzed by realtime PCR. It was found that Msi2 was dominant in normal and transformed hematopoietic cells, while Msi1 was barely detectable in these tissues.
Subsequent studies focused on Msi2. CML and AML cells were sorted from spleen, RNA was extracted and reverse transcribed, and Msi2 expression levels were determined by realtime PCR with results normalized to beta-2-microglobulin. Msi2 expression was 10-fold higher in AML than in CML (FIG. 11A; CML, n=6; AML, n=9; error bars represent s.e.m. p<0.001). AML cells were sorted into Lin.sup.- or Lin.sup.+ fractions based on the expression of lineage markers, and Msi2 levels were analyzed. As shown in FIG. 11B (n=5 for each group; p=0.039; error bars represent s.e.m.), the expression of Msi2 was further enriched in the lineage negative fraction within AML. These data indicated that Msi2 expression is associated with the most immature leukemic cells.
In the hematopoietic system it was found that Msi2 was expressed at much higher levels than Msi1 (FIG. 12A), and was particularly elevated in stem cells (FIG. 12B). FIG. 12A shows Musashi (Msi) expression in whole bone marrow (WBM), KLS cells, chronic, and blast crisis CML, olfactory bulb (OB), -reverse transcriptase (-RT in OB), and water (Tbp stands for TATA binding protein). FIG. 12B shows results for Realtime RT-PCR analysis of Msi2 expression in KLS cells (n=3) and Lin+ cells (n=2) (**p<0.001). Paralleling this, Msi2 expression was 10-fold higher in the more immature blast crisis CML (FIG. 12C). FIG. 12C shows results for Realtime RT-PCR analysis of Msi2 expression in blast crisis phase (n=9) and chronic phase (n=6) (**p<0.001). This pattern held true even in matched lineage negative fractions (FIG. 2D) suggesting that Msi2 upregulation in advanced phase is not simply a consequence of altered cellular composition. FIG. 12D shows results for Realtime RT-PCR analysis of Msi2 expression in lin- chronic and blast crisis phase cells relative to normal KLS and lin+ cells (lin+, n=2 and others, n=3). Finally, expression of Msi2 was most enriched in the lineage negative fraction of blast crisis CML (FIG. 12E). FIG. 12E shows results for Realtime RT-PCR analysis of lin- (n=5) or lin+ (n=5) blast crisis CML cells (*p=0.039). Error bars represent s.e.m. These data indicate that Msi2 expression associates predominantly with normal hematopoietic stem cells and the most immature fraction of leukemic cells.
Since Msi2 and Numb were expressed in a reciprocal pattern, it was examined whether Msi2 could downregulate Numb during leukemogenesis. Isolated CML cells were infected with Msi2-expressing or empty vector. Infected cells were sorted and stained with an anti-Numb antibody, and nuclei were visualized by DAPI staining (pseudo-colored in green in FIG. 12F), to analyze expression of Numb by immunofluorescence (**p<0.001). Fluorescence intensity of Numb staining was quantified by Metamorph software, more than thirty cells from each cohort were analyzed, background fluorescence intensity was subtracted from individual fluorescence intensity, and averaged values are shown in FIG. 12G and FIG. 12H (p<0.001). Msi2 significantly decreased the levels of Numb (FIG. 12F right panel and FIG. 12G) compared to empty vector control (FIG. 12F left panel and FIG. 12G).
To determine whether the NUP98-HOXA9 oncoprotein itself plays a role in how Msi2 expression is initially upregulated in AML, it was tested if NUP98-HOXA9 can induce Msi2 expression. KLS cells were isolated and transduced with BCR-ABL and vector, or BCR-ABL and NUP98-HOXA9. Analysis of Msi2 expression with realtime PCR revealed that the presence of NUP98-HOXA9 led to significantly higher levels of Msi2 (FIG. 12H); data shown are from three independent experiments, *p=0.017), showing that NUP98-HOXA9 could also activate this cascade by increasing expression of Msi2. These data cumulatively suggest that Msi2 is upregulated following NUP98-HOXA9 expression, and that Msi2, through its ability to downregulate Numb, contributed to the establishment and maintenance of acute myeloid leukemia and, at least in part, Msi2 has the ability to activate a cascade that leads to inhibition of differentiation.
Since NUP98-HOXA9 initiates transformation through HoxA9 mediated DNA binding and transcription, it was tested whether HoxA9 could bind the Msi2 promoter and activate its expression directly. As shown in FIGS. 12I-12L, HoxA9 bound to the Msi2 promoter. Shown in FIG. 12I is the murine Msi2 gene structure: exons (numbered boxes), transcription start site (TSS; +1) and the direction of transcription (flag), putative HOX binding element 5.7 kb upstream of TSS (oval), and +110 kb site with no HoxA9 binding sequence (open rectangle). Chromatin immunoprecipitation (ChIP) was performed either with IgG control or anti-HoxA9 antibody, wherein Flt3, a known HoxA9 target gene, was used as a positive control (FIG. 12J). Msi2-5.7 kb region (FIG. 12K) or Msi2+110 kb region (FIG. 12L) were also used as a positive control. The ChIP revealed that HoxA9 was in fact associated with the putative HoxA9 binding element that was identified at -5.7 kb.
As shown in FIG. 12M, KLS cells from Msi2 genetrap reporter mice were transduced with BCR-ABL with either control vector or NUP98-HOXA9 and .beta.-galactosidase reporter activity quantified (n=2 each, *p=0.011). This indicated that NUP98-HOXA9 expression was also able to induce Msi2 reporter activity in KLS cells. These data show that Msi2 can be upregulated by NUP98-HOXA9 and subsequently contribute to blast crisis CML by repressing Numb.
To test if Msi2 is required for the development of blast crisis CML, a mouse in which the Msi2 gene was disrupted by a genetrap (Gt) vector was utilized (Taniwaki, T. et al. Dev Growth Differ 2005, 47, 163-172, incorporated herein by reference in its entirety). FIG. 13A shows a schematic illustration of a Msi2 mutant allele generated by an insertion of a genetrap vector pU-21. Inverse PCR strategy allowed identification of the location of the genetrap event in intron 5 of Msi2 gene. As genetrap vector pU-21 harbors splice acceptor sequence (SA) and transcription termination/polyadenylation signal (pA) downstream of .sup.2-geo sequence, Msi2 gene transcription would be terminated at this site. Shown in FIG. 13B are results from Realtime RT-PCR analysis of Msi2 expression in whole bone marrow cells from control (+/+) and homozygotes for the genetrap allele (Gt/Gt) (n=6 each, **p<0.001). Results shown were normalized to beta-2-microglobulin levels. Error bars represent s.e.m.
Shown in FIG. 14B, is the frequency of KLS cells in mice of indicated genotypes (+/+, n=4, +/Gt, n=3 and Gt/Gt, n=4). Shown in FIG. 14B is the survival curve of mice transplanted with BCR-ABL and NUP98-HOXA9 infected +/+ or Gt/Gt KLS cells (+/+, n=15 and Gt/Gt, n=14, *p=0.0159). Msi2 mutant mice were viable, albeit smaller and less frequent than predicted (+/+:+/Gt:Gt/Gt=38:66:19, p=0.038), and showed a two-three fold reduction in the frequency (FIG. 14A) and absolute numbers (data not shown) of KLS cells. Additionally, the loss of Msi2 led to significantly impaired leukemia growth in vivo (FIG. 14B, 93% for control versus 57% for Gt/Gt).
To determine if inhibiting Msi2 could impact the growth of established CML, and to rule out the possibility that the reduced incidence of leukemia in Gt mutants was due to developmental defects and examine if Msi2 knockdown affects AML maintenance, Msi expression was targeted using an alternate shRNA approach. A lineage-negative population was sorted from full blown AML cells, which contains AML stem cells. Lin- cells from NUP98-HOXA9/BCR-ABL-induced blast crisis leukemias were infected with either an shRNA retrovirus targeting Msi2 (shMsi; SEQ ID NO: 9) or firefly luciferase (shLuc; SEQ ID NO: 10) as a negative control and resorted, and Msi2 expression was analyzed by realtime RT-PCR. Expression levels were normalized to the level of beta-2 microglobulin and displayed relative to the control arbitrarily set at 100. Error bars represent s.e.m. of triplicate PCRs (**p<0.01). Results are shown in FIG. 15A. Knockdown of Msi2 resulted in 75-90% reduction in Msi2 transcript levels compared with the shLuc control. A colony forming assay was done using methylcellulose media, and it was found that Msi2 knockdown led to 50-70% reduction in the number of colonies formed, suggesting that Msi2 reduction impaired colony forming ability of the AML cells.
Delivery of Msi2 shRNAs (shMsi) into established blast crisis CML cells reduced colony growth in vitro (FIG. 14C and FIGS. 15B-15E) As shown in FIG. 14C, colony-forming ability of blast crisis CML cells transduced with control shRNA (shLuc) or Msi2 shRNA (shMsi) (**p<0.001). FIG. 15B shows Msi2 knockdown by an independent lentiviral shRNA construct, shMsi-2. As a control, shRNA against LacZ was used. Error bars represent s.e.m. of triplicate PCRs (**p<0.01). FIG. 15C shows the reduction of colony formation by an independent shRNA construct, shMsi-2. Error bars represent s.e.m. of triplicate assay wells (**p<0.01). FIG. 15D shows Msi2 expression levels in samples expressing the indicated constructs (Msi2 mut: shMsi-resistant Msi2 mutant cDNA). Error bars represent s.e.m. of triplicate PCRs (**p<0.01). FIG. 15E shows rescue of shMsi2-mediated reduction of colony-forming ability with expression of shMsi-resistant Msi2 mutant cDNA, wherein Lin- cells from blast crisis phase leukemia were transduced retrovirally with either vector control or Msi2 mutant together with the indicated shRNA constructs, sorted and plated in methylcellulose media for colony formation (*p=0.019).
Delivery of Msi2 shRNAs (shMsi) into established blast crisis CML cells also reduced disease incidence in vivo, as shown in the survival curve of mice transplanted with established blast crisis CML cells infected with control shLuc or shMsi (FIG. 14D, n=13 each, *p=0.0267).
Further, the majority of leukemias that occurred in the presence of shMsi were more differentiated (FIG. 14E), and impaired in their ability to propagate disease (FIG. 14F, 87% control versus 25% shMsi). FIG. 14E shows Wright's stain of leukemic cells from mice transplanted with control shLuc or shMsi infected blast crisis CML, with immature myeloblasts (closed arrowheads) and differentiating myelocytes and mature band cells (open arrowheads) indicated (magnification: 100.times.). FIG. 14F shows the survival curve of mice transplanted with Lin.sup.- cells from primary shRNA expressing leukemias (control, n=15 and shMsi, n=16, **p<0.001). Data shown is representative of two to three independent experiments. These data show that Msi2 is important for establishment and continued propagation of blast crisis CML.
The impact of Msi2 loss in AML propagation in vivo was also tested. Lin-negative cells from full blown AML were transduced either with an Msi2 shRNA retrovirus or luciferase shRNA virus, and the cells were transplanted into sublethally-irradiated mice. 11 of 13 mice transplanted with control knockdown AML became sick by 1 month post transplant. In contrast, more than half of the mice transplanted with Msi2 knockdown AML survived beyond 1 month (FIG. 16). The surviving mice had no detectable levels of transplanted leukemic cells in their peripheral blood, indicating loss of the leukemic cells.
Serial transplants were also done to test the presence of leukemia-initiating ability of control and Msi2 knockdown AML cells from the mice who suffered from leukemia. While control knockdown AML cells were able to propagate disease in 2 out of 3 mice (transplanted with 3000 cells) or all of the mice (4 out of 4 at 10,000 cells transplanted), Msi2-knockdown AML cells were significantly impaired in their ability to initiate AML leading to a loss in AML incidence at either of the cell doses used. These data suggested that AML required Msi2 to be highly expressed during disease maintenance and propagation.
Example 8
Msi2 in Human Leukemia Progression
To determine if human myeloid leukemias have similar disease progression, the expression levels of Musashi (MSI2) were analyzed in human patient specimens from chronic phase and blast crisis CML patients. 9 specimens were obtained for each of chronic phase (CP) and blast crisis (BC) CML, and cDNA were prepared from the total RNA from these specimens. By using realtime RT-PCR analyses, it was found that the human ortholog MSI2 transcript levels were 6-fold higher in BC CML than in CP CML (FIG. 17) suggesting that a similar mechanism upregulating Musashi operates in both mice and humans to drive blast crisis CML.
Finally, it was examined if MSI2 was aberrantly upregulated during human leukemia progression. MSI2 was tracked in 30 patient samples from banks in Korea and the United Kingdom, and found to be expressed at significantly higher levels in blast crisis CML (FIG. 18A, FIG. 18B). FIG. 18A shows data from PCR analysis of MSI2 expression in chronic and blast crisis CML patient samples from the Korean Leukemia Bank (n=9 per cohort, Mann-Whitney U test **p<0.001) and FIG. 18B shows data from the Hammersmith MRD Lab Sample Archive in the United Kingdom (n=6 per cohort, Mann-Whitney U test, **p<0.001).
To determine if this reflected a general pattern in human CML progression, the expression of MSI2 and associated genes were examined in 90 patient samples from banks in the United States (Radich, J. P. et al. Proc Natl Acad Sci USA 2006, 103, 2794-2799, incorporated herein by reference in its entirety). FIG. 18 shows data from microarray analysis of expression of MSI2 (FIG. 18C, p<0.001), NUMB (FIG. 18D, p<0.001), HOXA9 (FIG. 18E, p<0.001), and HES1 (FIG. 18F, p=0.68) in bone marrow and peripheral blood samples from 42 chronic (red), 17 accelerated (green), and 31 blast crisis phase (blue) patients in the United States. Microarray analysis revealed a dramatic upregulation of MSI2 in every patient during CML progression (FIG. 18C). In addition, NUMB was downregulated in a majority of blast crisis patients (FIG. 18D). Notably, our mouse model was driven by NUP98-HOXA9 as a second hit, whereas human blast crisis CMLs harbor a variety of secondary mutations. Msi2 could be regulated by HoxA9 expression in the mouse model of CML, and it was examined if HOXA9 was upregulated in blast crisis CML samples. The observation that a majority of patient samples had elevated levels of HOXA9 (FIG. 18E) may explain how MSI2 becomes upregulated in advanced stage disease regardless of the nature of the second hit. Notch signaling targets HES1 and TRIB2 were also elevated in a number of blast crisis patient samples (FIG. 18F, FIG. 19). Notch signaling-associated genes HES1 and TRIB2 are elevated in blast crisis patient samples. FIG. 19A shows HES1 expression during CML progression within a single patient, determined via PCR analysis of HES1 in sorted CD34+ chronic phase and blast crisis phase cells from the same individual (Singapore General Hospital). Error bars represent s.e.m. of triplicate PCRs. FIG. 19B and FIG. 19C show results for chronic and blast crisis phase cells from CML patient samples (United Kingdom and Korean banks) that were isolated, RNA prepared, and TRIB2 expression analyzed by realtime RTPCR (FIG. 19B, expression levels in individual samples; FIG. 19C, average expression levels n=11 for each leukemia, Mann-Whitney U test, *p=0.0031).
Because the highest MSI2 expression was observed in blast crisis patients, where treatment outcomes are extremely poor, and because a range of expression was observed in both chronic and accelerated phase CML, it was tested whether MSI2 expression correlated with outcomes after allogeneic transplantation. Patients were divided into two groups based on median expression of MSI2. Among 37 chronic phase patients with available outcomes (9 relapses) increased MSI2 expression was associated with a higher risk of relapse (hazard ratio=4.35; 95% CI, 0.90-21.06, p=0.07). Additionally, among 13 accelerated phase patients with available outcomes (6 deaths and 3 relapses), increased MSI2 expression was not only associated with higher risk of relapse (all relapses occurred in the increased MSI2 group, p=0.06), but also with higher risk of death (hazard ratio=6.76; 95% CI, 0.78-58.57, p=0.08). The association of MSI2 with poorer outcomes suggests that Msi2 may be an early marker of advanced CML disease.
Our work identifies the Musashi-Numb axis as an important regulator of myeloid leukemia and indicates that maintenance of the immature state is dependent on reversal of classic differentiation cues. Specifically, it was found that Msi2 is upregulated and Numb downregulated as chronic phase CML progresses to blast crisis, and that modulation of this pathway can inhibit disease. Without being limited as to theory, a proposed model for the role of Musashi and Numb in CML progression is shown in FIG. 18G. The Musashi and Numb pathway is required for hematologic malignancy.
Numb, which drives commitment and differentiation, can impair blast crisis CML establishment and propagation. Just as Numb's influence may be mediated through p53 and/or Notch signaling, Musashi may act through Numb as well as other targets such as p21WAF1. Specific differentiation cues associated with the Musashi-Numb cascade may unlock the differentiation potential of blast crisis CML and impair its growth. Musashi may be an early marker of advanced CML. Musashi expression may serve as a prognostic tool, and targeting it may be used in therapy.
Various features and advantages of the invention are set forth in the following claims.
TABLE-US-00001 SEQUENCE LISTING Numb-F primer DNA, synthetic SEQ ID NO: 1 5'-ATGAGTTGCCTTCCACTATGCAG-3' Numb-R primer DNA, synthetic SEQ ID NO: 2 5'-TGCTGAAGGCACTGGTGATCTGG-3' Msi1-F primer DNA, synthetic SEQ ID NO: 3 5'-ATGGATGCCTTCATGCTGGGT-3' Msi1-R primer DNA, synthetic SEQ ID NO: 4 5'-CTCCGCTCTACACGGAATTCG-3' Msi2-F primer DNA, synthetic SEQ ID NO: 5 5'-TGCCATACACCATGGATGCGT-3' Msi2-R primer DNA, synthetic SEQ ID NO: 6 5'-GTAGCCTCTGCCATAGGTTGC-3' B2m-F primer DNA, synthetic SEQ ID NO: 7 5'-ACCGGCCTGTATGCTATCCAGAA-3' B2m-R primer DNA, synthetic SEQ ID NO: 8 5'-AATGTGAGGCGGGTGGAACTGT-3' shRNA used to decrease the level of Msi2 in mouse AML in Example 7 DNA, synthetic SEQ ID NO: 9 5'-CCCAGATAGCCTTAGAGACTAT-3' shRNA for firefly luciferase, used as a control in Example 7 DNA, synthetic SEQ ID NO: 10 5'-CTGTGCCAGAGTCCTTCGATAG-3' Polynucleotide sequence encoding the Numb protein, isoform 1, from homo sapiens, 1956 nt (CCDS ID CCDS32116.1, GeneID 8650). SEQ ID NO: 11 ##STR00001## ##STR00002## ##STR00003## ##STR00004## ##STR00005## ##STR00006## ##STR00007## ##STR00008## ##STR00009## ##STR00010## ##STR00011## ##STR00012## ##STR00013## ##STR00014## ##STR00015## ##STR00016## ##STR00017## ##STR00018## ##STR00019## ##STR00020## ##STR00021## ##STR00022## ##STR00023## ##STR00024## ##STR00025## ##STR00026## ##STR00027## Polypeptide sequence of Numb protein, isoform 1, from homo sapiens, 651 amino acids (translation of CCDS ID CCDS32116.1, GeneID 8650). SEQ ID NO: 12 MNKLRQSFRRKKDVYVPEASRPHQWQTDEEGVRTGKCSFPVKYLGHVEVDESRGMHICEDAVKRLKAERK FFKGFFGKTGFKAVKAVLWVSADGLRVVDEKTKDLIVDQTIEKVSFCAPDRNFDRAFSYICRDGTTRRWI CHCFMAVKDTGERLSHAVGCAFAACLERKQKREKECGVTATFDASRTTFTREGSFRVTTATEQAEREEIM KQMQDAKKAETDKIVVGSSVAPGNTAPSPSSPTSPTSDATTSLEMNNPHAIPRRHAPIEQLARQGSFRGF PALSQKMSPFKRQLSLRINELPSTMQRKTDFPIKNAVPEVEGEAESISSLCSQITNAFSTPEDPFSSAPM TKPVTVVAPQSPTFQANGTDSAFHVLAKPAHTALAPVAMPVRETNPWAHAPDAANKEIAATCSGTEWGQS SGAASPGLFQAGHRFTPSEADRWLEEVSKSVPAQQPQASAAPLQPVLQPPPPTAISQPASPFQGNAFLTS QPVPVGVVPALQPAFVPAWSYPVANGMPYPAPVNPVVGITPSQMVANVFGTAGHPQAAHPHQSPSLVRQQ TFPHYEASSATTSPFFKPPAQHLNGSAAFNGVDDGRLASADRHTEVPTGTCPVDPFEAQWAALENKSKQR TNPSPTNPFSSDLQKTFEIEL Polynucleotide sequence encoding the Numb protein, isoform 2, from homo sapiens, 1812 nt (CCDS ID CCDS32115.1, GeneID 8650). SEQ ID NO: 13 ATGAACAAATTACGGCAAAGTTTTAGGAGAAAGAAGGATGTTTATGTTCCAGAGGCCAGTCGTCCACATC AGTGGCAGACAGATGAAGAAGGCGTTCGCACCGGAAAATGTAGCTTCCCGGTTAAGTACCTTGGCCATGT AGAAGTTGATGAATCAAGAGGAATGCACATCTGTGAAGATGCTGTAAAAAGATTGAAAGCTGAAAGGAAG TTCTTCAAAGGCTTCTTTGGAAAAACTGGAAAGAAAGCAGTTAAAGCAGTTCTGTGGGTCTCAGCAGATC GACTCAGAGTTGTGGATGAAAAAACTAAGGACCTCATAGTTGACCAGACGATAGAGAAAGTTTCTTTCTG TGCCCCAGACAGGAACTTTGATAGAGCCTTTTCTTACATATGCCGTGATGGCACCACTCGTCGCTGGATC TGTCACTGCTTCATGGCTGTCAAGGACACAGGTGAAAGGTTGAGCCATGCAGTAGGCTGTGCTTTTGCAG CCTGTTTAGAGCGCAAGCAGAAGCGGGAGAAGGAATGTGGAGTGACTGCTACTTTTGATGCTAGTCGGAC CACTTTTACAAGAGAAGGATCATTCCGTGTCACAACAGCCACTGAACAAGCAGAAAGAGAGGAGATCATG AAACAAATGCAAGATGCCAAGAAAGCTGAAACAGATAAGATAGTCGTTGGTTCATCAGTTGCCCCTGGCA ACACTGCCCCATCCCCATCCTCTCCCACCTCTCCTACTTCTGATGCCACGACCTCTCTGGAGATGAACAA TCCTCATGCCATCCCACGCCGGCATGCTCCAATTGAACAGCTTGCTCGCCAAGGCTCTTTCCGAGGTTTT CCTGCTCTTAGCCAGAAGATGTCACCCTTTAAACGCCAACTATCCCTACGCATCAATGAGTTGCCTTCCA CTATGCAGAGGAAGACTGATTTCCCCATTAAAAATGCAGTGCCAGAAGTAGAAGGGGAGGCAGAGAGCAT CAGCTCCCTGTGCTCACAGATCACCAATGCCTTCAGCACACCTGAGGACCCCTTCTCATCTGCTCCGATG ACCAAACCAGTGACAGTGGTGGCACCACAATCTCCTACCTTCCAAGGGACCGAGTGGGGTCAATCTTCTG GTGCTGCCTCTCCAGGTCTCTTCCAGGCCGGTCATAGACGTACTCCCTCTGAGGCCGACCGATGGTTAGA AGAGGTGTCTAAGAGCGTCCGGGCTCAGCAGCCCCAGGCCTCAGCTGCTCCTCTGCAGCCAGTTCTCCAG CCTCCTCCACCCACTGCCATCTCCCAGCCAGCATCACCTTTCCAAGGGAATGCATTCCTCACCTCTCAGC CTGTGCCAGTGGGTGTGGTCCCAGCCCTGCAACCAGCCTTTGTCCCTGCCCAGTCCTATCCTGTGGCCAA TGGAATGCCCTATCCAGCCCCTAATGTGCCTGTGGTGGGCATCACTCCCTCCCAGATGGTGGCCAACGTA TTTGGCACTGCAGGCCACCCTCAGGCTGCCCATCCCCATCAGTCACCCAGCCTGGTCAGGCAGCAGACAT TCCCTCACTACGAGGCAAGCAGTGCTACCACCAGTCCCTTCTTTAAGCCTCCTGCTCAGCACCTCAACGG TTCTGCAGCTTTCAATGGTGTAGATGATGGCAGGTTGGCCTCAGCAGACAGGCATACAGAGGTTCCTACA GGCACCTGCCCAGTGGATCCTTTTGAAGCCCAGTGGGCTGCATTAGAAAATAAGTCCAAGCAGCGTACTA ##STR00028## Polypeptide sequence of Numb protein, isoform 2, from homo sapiens, 603 amino acids (translated CCDS ID CCDS 32115.1, GeneID 8650). SEQ ID NO: 14 MNKLRQSFRRKKDVYVPEASRPHQWQTDEEGVRTGKCSFPVKYLGHVEVDESRGMHICEDAVKRLKAERK FFKGFFGKTGKKAVKAVLWVSADGLRVVDEKTKDLIVDQTIEKVSFCAPDRNFDRAFSYICRDGTTRRWI CHCFMAVKDTGERLSHAVGCAFAACLERKQKREKECGVTATFDASRTTFTREGSFRVTTATEQAEREEIM ##STR00029## PALSQKMSPFKRQLSLRINELPSTMQRKTDFPIKNAVPEVEGEAESISSLCSQITNAFSTPEDPFSSAPM TKPVTVVAPQSPTFQGTEWGQSSGAASPGLFQAGHRRTPSEADRWLEEVSKSVRAQQPQASAAPLQPVLQ PPPPTAISQPASPFQGNAFLTSQPVPVGVVPALQPAFVPAQSYPVANGMPYPAPNVPVVGITPSQMVANV FGTAGHPQAAHPHQSPSLVRQQTFPHYEASSATTSPFFKPPAQHLNGSAAFNGVDDGRLASADRHTEVPT GTCPVDPFEAQWAALENKSKQRTNPSPTNPFSSDLQKTFEIEL Polynucleotide sequence encoding the Numb protein, isoform 3, from homo sapiens, 1923 nt (CCDS ID CCDS 9814.1, GeneID 8650). SEQ ID NO: 15 ATGAACAAATTACGGCAAAGTTTTAGGAGAAAGAAGGATGTTTATGTTCCAGAGGCCAGTCGTCCACATC AGTGGCAGACAGATGAAGAAGGCGTTCGCACCGGAAAATGTAGCTTCCCGGTTAAGTACCTTGGCCATGT AGAAGTTGATGAATCAAGAGGAATGCACATCTGTGAAGATGCTGTAAAAAGATTGAAAGCTACTGGAAAG AAAGCAGTTAAAGCAGTTCTGTGGGTCTCAGCAGATGGACTCAGAGTTGTGGATGAAAAAACTAAGGACC TCATAGTTGACCAGACGATAGAGAAAGTTTCTTTCTGTGCCCCAGACAGGAACTTTGATAGAGCCTTTTC TTACATATGCCGTGATGGCACCACTCGTCGCTGGATCTGTCACTGCTTCATGGCTGTCAAGGACACAGGT GAAAGGTTGAGCCATGCAGTAGGCTGTGCTTTTGCAGCCTGTTTAGAGCGCAAGCAGAAGCGGGAGAAGG AATGTGGAGTGACTGCTACTTTTGATGCTAGTCGGACCACTTTTACAAGAGAAGGATCATTCCGTGTCAC AACAGCCACTGAACAAGCAGAAAGAGAGGAGATCATGAAACAAATGCAAGATGCCAAGAAAGCTGAAACA GATAAGATAGTCGTTGGTTCATCAGTTGCCCCTGGCAACACTGCCCCATCCCCATCCTCTCCCACCTCTC CTACTTCTGATGCCACGACCTCTCTGGAGATGAACAATCCTCATGCCATCCCACGCCGGCATGCTCCAAT TGAACAGCTTGCTCGCCAAGGCTCTTTCCGAGGTTTTCCTGCTCTTAGCCAGAAGATGTCACCCTTTAAA CGCCAACTATCCCTACGCATCAATGAGTTGCCTTCCACTATGCAGAGGAAGACTGATTTCCCCATTAAAA ATGCAGTGCCAGAAGTAGAAGGGGAGGCAGAGAGCATCAGCTCCCTGTGCTCACAGATCACCAATGCCTT CAGCACACCTGAGGACCCCTTCTCATCTGCTCCGATGACCAAACCAGTGACAGTGGTGGCACCACAATCT CCTACCTTCCQAAGCTAATGGCACTGACTCAGCCTTCCATGTGCTTGCTAAGCCAGCCCATACTGCTCTAG CACCCGTAGCAATGCCTGTGCGTGAAACCAACCCTTGGGCCCATGCCCCTGATGCTGCTAACAAGGAAAT TGCAGCCACATGTTCGGGGACCGAGTGGGGTCAATCTTCTGGTGCTGCCTCTCCAGGTCTCTTCCAGGCC GGTCATAGACGTACTCCCTCTGAGGCCGACCGATGGTTAGAAGAGGTGTCTAAGAGCGTCCGGGCTCAGC
AGCCCCAGGCCTCAGCTGCTCCTCTGCAGCCAGTTCTCCAGCCTCCTCCACCCACTGCCATCTCCCAGCC AGCATCACCTTTCCAAGGGAATGCATTCCTCAQCCTCTCAGCCTGTGCCAGTGGGTGTGGTCCCAGCCCTG CAACCAGCCTTTGTCCCTGCCCAGTCCTATCCTGTGGCCAATGGAATGCCCTATCCAGCCCCTAATGTGC CTGTGGTGGGCATCACTCCCTCCCAGATGGTGGCCAACGTATTTGGCACTGCAGGCCACCCTCAGGCTGC CCATCCCCATCAGTCACCCAGCCTGGTCAGGCAGCAGACATTCCCTCACTACGAGGCAAGCAGTGCTACC ACCAGTCCCTTCTTTAAGCCTCCTGCTCAGCACCTCAACGGTTCTGCAGCTTTCAATGGTGTAGATGATG GCAGGTTGGCCTCAGCAGACAGGCATACAGAGGTTCCTACAGGCACCTGCCCAGTGGATCCTTTTGAAGC CCAGTGGGCTGCATTAGAAAATAAGTCCAAGCAGCGTACTAATCCCTCCCCTACCAACCCTTTCTCCAGT GACTTACAGAAGACGTTTGAAATTGAACTTTAA Polypeptide sequence of the Numb protein, isoform 3, from homo sapiens, 640 amino acids (CCDS ID CCDS 9814.1, GeneID 8650). SEQ ID NO: 16 MNKLRQSFRRKKDVYVPEASRPHQWQTDEEGVRTGKCSFPVKYLGHVEVDESRGMHICEDAVKRLKATGK KAVKAVLWVSADGLRVVDEKTKDLIVDQTIEKVSFCAPDRNFDRAFSYICRDGTTRPWICHCFMAVKDTG ERLSHAVGCAFAACLERKQKREKECGVTATFDASRTTFTREGSFRVTTATEQAEREEIMKQMQDAKKAET DKIVVGSSVAPGNTAPSPSSPTSPTSDATTSLEMNNPHAIPRRHAPIEQLARQGSFRGFPALSQKMSPFK RQLSLRINELPSTMQPKTDFPIKNAVPEVEGEAESISSLCSQITNAFSTPEDPFSSAPMTKPVTVVAPQS PTFQANGTDSAFHVLAKPAHTALAPVAMPVRETNPWAHAPDAANKEIAATCSGTEWGQSSGAASPGLFQA GHRRTPSEADRWLEEVSKSVRAQQPQASAAPLQPVLQPPPPTAISQPASPFQGNAFLTSQPVPVGVVPAL QPAFVPAQSYPVANGMPYPAPNVPVVGITPSQMVANVFGTAGHPAQAAHPHQSPSLVRQQTFPHYEASSAT TSPFFKPPAQHLNGSAAFNGVDDGRLASADRHTEVPTGTCPVDPFEAQWAALENKSKQRTNPSPTNPFSS DLQKTFEIEL Polynucleotide sequence encoding the Numb protein, isoform 4, from homo sapiens, 1779 nt(nucleotides 271 to 2049 of Accession No. AF171941, GeneID 8650). SEQ ID NO: 17 atgaacaaat tacggcaaag ttttaggaga aagaaggatg tttatgttcc agaggccagt cgtccacatc agtggcagac agatgaagaa ggcgttcgca ccggaaaatg tagcttcccg gttaagtacc ttggccatgt agaagttgat gaatcaagag gaatgcacat ctgtgaagat gctgtaaaaa gattgaaagc tactggaaag aaagcagtta aagcagttct gtgggtctca gcagatggac tcagagttgt ggatgaaaaa actaaggacc tcatagttga ccagacgata gagaaagttt ctttctgtgc cccagacagg aactttgata gagccttttc ttacatatgc cgtgatggca ccactcgtcg ctggatctgt cactgcttca tggctgtcaa ggacacaggt gaaaggttga gccatgcagt aggctgtgct tttgcagcct gtttagagcg caagcagaag cgggagaagg aatgtggagt gactgctact tttgatgcta gtcggaccac ttttacaaga gaaggatcat tccgtgtcac aacagccact gaacaagcag aaagagagga gatcatgaaa caaatgcaag atgccaagaa agctgaaaca gataagatag tcgttggttc atcagttgcc cctggcaaca ctgccccatc cccatcctct cccacctct ctacttctga tgccacgacc tctctggaga tgaacaatcc tcatgccatc ccacgccggc atgctccaat tgaacagctt gctcgccaag gctctttccg aggttttcct gctcttagcc agaagatgtc accctttaaa cgccaactat ccctacgcat caatgagttg ccttccacta tgcagaggaa gactgatttc cccattaaaa atgcagtgcc agaagtagaa ggggaggcag agagcatcag ctccctgtgc tcacagatca ccaatgcctt cagcacacct gaggacccct tctcatctgc tccgatgacc aaaccagtga cagtggtggc accacaatct cctaccttcc aagggaccga gtggggtcaa tcttctggtg ctgcctctcc aggtctcttc caggccggtc atagacgtac tccctctgag gccgaccgat ggttagaaga ggtgtctaag agcgtccggg ctcagcagcc ccaggcctca gctgctcctc tgcagccagt tctccagcct cctccaccca ctgccatctc ccagccagca tcacctttcc aagggaatgc attcctcacc tctcagcctg tgccagtggg tgtggtccca gccctgcaac cagcctttgt ccctgcccag tcctatcctg tggccaatgg aatgccctat ccagccccta atgtgcctgt ggtgggcatc actccctccc agatggtggc caacgtattt ggcactgcag gccaccctca ggctgcccat ccccatcagt cacccagcct ggtcaggcag cagacattcc ctcactacga ggcaagcagt gctaccacca gtcccttctt taagcctcct gctcagcacc tcaacggttc tgcagctttc aatggtgtag atgatggcag gttggcctca gcagacaggc atacagaggt tcctacaggc acctgcccag tggatccttt tgaagcccag tgggctgcat tagaaaataa gtccaagcag cgtactaatc cctcccctac caaccctttc tccagtgact tacagaagac gtttgaaatt gaactttaa Polypeptide sequence of Numb protein, isoform 4, from homo sapiens, 592 amino acids (translated from nucleotides 271 to 2049 of Accession No. AF171941, GeneID 8650). SEQ ID NO: 18 MNKLRQSFRRKKDVYVPEASRPHQWQTDEEGVRTGKCSFPVKYLGHVEVDESRGMHICEDAVKR LKATGKKAVKAVLWVSADGLRVVDEKTKDLIVDQTIEKVSFCAPDRNFDRAFSYICRDGTTRRW ICHCFMAVKDTGERLSHAVGCAFAACLERKQKREKECGVTATFDASRTTFTREGSFRVTTATEQ AEREEIMKQMQDAKKAETDKIVVGSSVAPGNTAPSPSSPTSPTSDATTSLEMNNPHAIPRRHAP IEQLARQGSFRGFPALSQKMSPFKRQLSLRINELPSTMQRKTDFPIKNAVPEVEGEAESISSLC SQITNAFSTPEDPFSSAPMTKPVTVVAPQSPTFQGTEWGQSSGAASPGLFQAGHRRTPSEADRW LEEVSKSVRAQQPQASAAPLQPVLQPPPPTAISQPASPFQGNAFLTSQPVPVGVVPALQPAFVP AQSYPVANGMPYPAPNVPVVGITPSQMVANVFGTAGHPQAAHPHQSPSLVRQQTFPHYEASSAT TSPFFKPPAQHLNGSAAFNGVDDGRLASADRHTEVPTGTCPVDPFEAQWAALENKSKQRTNPSP TNPFSSDLQKTFEIEL Polynucleotide sequence encoding the Numb protein, isoform 4, from homo sapiens, 1779 nt (nucleotides 321 to 2099 of Accession No. BC068476, GeneID 8650). SEQ ID NO: 19 atgaacaaat tacggcaaag ttttaggaga aagaaggatg tttatgttcc agaggccagt cgtccacatc agtggcagac agatgaagaa ggcgttcgca ccggaaaatg tagcttcccg gttaagtacc ttggccatgt agaagttgat gaatcaagag gaatgcacat ctgtgaagat gctgtaaaaa gattgaaagc tactggaaag aaagcagtta aagcagttct gtgggtctca gcagatggac tcagagttgt ggatgaaaaa actaaggacc tcatagttga ccagacgata gagaaagttt ctttctgtgc cccagacagg aactttgata gagccttttc ttacatatgc cgtgatggca ccactcgtcg ctggatctgt cactgcttca tggctgtcaa ggacacaggt gaaaggttga gccatgcagt aggctgtgct tttgcagcct gtttagagcg caagcagaag cgggagaagg aatgtggagt gactgctact tttgatgcta gtcggaccac ttttacaaga gaaggatcat tccgtgtcac aacagccact gaacaagcag aaagagagga gatcatgaaa caaatgcaag atgccaagaa agctgaaaca gataagatag tcgttggttc atcagttgcc cctggcaaca ctgccccatc cccatcctct cccacctctc ctacttctga tgccacgacc tctctggaga tgaacaatcc tcatgccatc ccacgccggc atgctccaat tgaacagctt gctcgccaag gctctttccg aggttttcct gctcttagcc agaagatgtc accctttaaa cgccaactat ccctacgcat caatgagttg ccttccacta tgcagaggaa gactgatttc cccattaaaa atgcagtgcc agaagtagaa ggggaggcag agagcatcag ctccctgtgc tcacagatca ccaatgcctt cagcacacct gaggacccct tctcatctgc tccgatgacc aaaccagtga cagtggtggc accacaatct cctaccttcc aagggaccga gtggggtcaa tcttctggtg ctgcctctcc aggtctcttc caggccggtc atagacgtac tccctctgag gccgaccgat ggttagaaga ggtgtctaag agcgtccggg ctcagcagcc ccaggcctca gctgctcctc tgcagccagt tctccagcct cctccaccca ctgccatctc ccagccagca tcacctttcc aagggaatgc attcctcacc tctcagcctg tgccagtggg tgtggtccca gccctgcaac cagcctttgt ccctgcccag tcctatcctg tggccaatgg aatgccctat ccagccccta atgtgcctgt ggtgggcatc actccctcca agatggtggc caacgtattt ggcactgcag gccaccctca ggctgcccat ccccatcagt cacccagcct ggtcaggcag cagacattcc ctcactacga ggcaagcagt gctaccacca gtcccttctt taagcctcct gctcagcacc tcaacggttc tgcagctttc aatggtgtag atgatggcag gttggcctca gcagacaggc atacagaggt tcctacaggc acctgcccag tggatccttt tgaagcccag tgggctgcat tagaaaataa gtccaagcag cgtactaatc cctcccctac caaccctttc tccagtgact tacagaagac gtttgaaatt gaactttaa Polypeptide sequence of Numb protein, isoform 4, from homo sapiens, 592 amino acids (translated from nucleotides 321 to 2099 of Accession No. BC068476, GeneID 8650). SEQ ID NO: 20 MNKLRQSFRRKKDVYVPEASRPHQWQTDEEGVRTGKCSFPVKYLGHVEVDESRGMHICEDAVKR LKATGKKAVKAVLWVSADGLRVVDEKTKDLIVDQTIEKVSFCAPDRNFDRAFSYICRDGTTRRW ICHCFMAVKDTGERLSHAVGCAFAACLERKQKREKECGVTATFDASRTTFTREGSFRVTTATEQ AEREEIMKQMQDAKKAETDKIVVGSSVAPGNTAPSPSSPTSPTSDATTSLEMNNPHAIPRRHAP IEQLARQGSFRGFPALSQKMSPFKRQLSLRINELPSTMQRKTDFPIKNAVPEVEGEAESISSLC SQITNAFSTPEDPFSSAPMTKPVTVVAPQSPTFQGTEWGQSSGAASPGLFQAGHRRTPSEADRW LEEVSKSVRAQQPQASAAPLQPVLQPPPPTAISQPASPFQGNAFLTSQPVPVGVVPALQPAFVP AQSYPVANGMPYPAPNVPVVGITPSKMVANVFGTAGHPQAAHPHQSPSLVRQQTFPHYEASSAT TSPFFKPPAQHLNGSAAFNGVDDGRLASADRHTEVPTGTCPVDPFEAQWAALENKSKQRTNPSP TNPFSSDLQKTFEIEL Polynucleotide sequence encoding the Numb protein, isoform 1, from Mus musculus, 1962 nt (nucleotides 1 to 1962 of Accession No. AF169192, GeneID 18222).
SEQ ID NO: 21 1 atgaacaaac tacggcaaag cttcaggaga aagaaagacg tttatgtccc agaggccagc 61 cgtccacatc agtggcagac agatgaagaa ggagtccgca ctggaaagtg tagcttccca 121 gttaagtacc tcggccacgt agaagttgat gagtcaagag gaatgcacat ctgtgaagat 181 gccgtaaaga gattgaaagc tgaaaggaag ttcttcaaag gcttctttgg aaaaacggga 241 aagaaagcag tgaaggccgt tctgtgggtg tcagcggatg ggctcagagt tgtggacgag 301 aaaactaagg acctcatagt tgaccagaca atagaaaaag tttccttctg tgccccagat 361 aggaactttg acagagcctt ttcttacata tgtcgtgatg gcaccactcg gcgatggatc 421 tgtcattgtt tcatggctgt caaagacacg ggggaaagac tgagccacgc cgtgggctgt 481 gcttttgcag cctgtttaga gcgtaaacag aagcgggaga aggagtgtgg cgtcactgct 541 acttttgatg ccagtagaac cactttcaca agagaaggat cattccgtgt cacaactgcc 601 actgagcaag ccgaaagaga ggagatcatg aaacagttgc aagatgccaa gaaagctgag 661 acagacaaga cagttgttgg tccatcagtg gctcctggca acactgctcc atccccatcc 721 tctcccacct ctcccactcc ggatggcact gcatcttcag agatgaacaa tccccatgct 781 atcccacgcc ggcatgcacc aattgaacag cttgctcgtc aaggctcttt ccggggattt 841 cctgctctta gccagaagat gtcacccttt aaacgccagc tgtccctacg catcaatgag 901 ttgccttcca ctatgcagag gaagaccgat ttcccaataa aaaacacagt gcccgaggtg 961 gaaggagagg ccgagagcat cagctccttg tgttcccaga tcaccagtgc cttcagcacg 1021 ccctctgagg accccttctc ctccgcccca atgaccaaac cagtgacatt ggtggcacca 1081 cagtctcctg tgttacaagc taatggcact gactcagcct cccatgtgct tactgctaag 1141 ccagccaata ctgctctagc acacgtagca atgcctgtcc gtgaaaccaa cccctgggcc 1201 catgtccctg atgctgctaa caaggaaatt gcagccatac atccggggac tgagtggggt 1261 cagtcttctg gtgctgcctc tccaggtctc ttccaggctg gtcacagacg cactccctct 1321 gaagctgacc gctggttaga agaagtgtca aagagtgtgc gggcccagca gcctcaggtc 1381 tcagctgccc ctctgcagcc agttctccag ccgcctccgc ccgccgccat tgcccctcca 1441 gcacctcctt tccaaggaca tgccttcctc acgtcccagc ctgtgcccgt gggtgtggtc 1501 ccacccctac aaccagcctt tgtccctacc cagtcctacc ctgtggccaa cgggatgccc 1561 tacccagcct ctaatgtgcc tgtagtgggc atcaccccat cccagatggt agccaatgtg 1621 tttggcactg caggccaccc tcagacaact catccacatc agtcgccaag cctggccaag 1681 cagcagacat tccctcaata tgagacaagt agtgctacca ccagtccctt ctttaagcct 1741 cctgctcagc acctcaatgg ttctgcagct ttcaatggtg tagacaatgg tgggctagcc 1801 tcaggaaaca ggcatgcaga agtccctcca ggcacctgcc cagtggatcc tttcgaagct 1861 cagtgggccg cactagaaag caagtccaag cagcgtacaa atccttctcc taccaaccct 1921 ttctccagtg acttacagaa aacatttgaa atagaacttt ag Polypeptide sequence of Numb protein, isoform 1, from Mus musculus, 653 amino acids (translated from 1 to 1962 of Accession No. AF169192, GeneID 18222). SEQ ID NO: 22 MNKLRQSFRRKKDVYVPEASRPHQWQTDEEGVRTGKCSFPVKYLGHVEVDESRGMHICED AVKRLKAERKFFKGFFGKTGKKAVKAVLWVSADGLRVVDEKTKDLIVDQTIEKVSFCAPD RNFDRAFSYICRDGTTRRWICHCFMAVKDTGERLSHAVGCAFAACLERKQKREKECGVTA TFDASRTTFTREGSFRVTTATEQAEREEIMKQLQDAKKAETDKTVVGPSVAPGNTAPSPS SPTSPTPDGTASSEMNNPHAIPRRHAPIEQLARQGSFRGFPALSQKMSPFKRQLSLRINE LPSTMQRKTDFPIKNTVPEVEGEAESISSLCSQITSAFSTPSEDPFSSAPMTKPVTLVAP QSPVLQANGTDSASHVLTAKPANTALAHVAMPVRETNPWAHVPDAANKEIAAIHPGTEWG QSSGAASPGLFQAGHRRTPSEADRWLEEVSKSVRAQQPQVSAAPLQPVLQPPPPAAIAPP APPFQGHAFLTSQPVPVGVVPPLQPAFVPTQSYPVANGMPYPASNVPVVGITPSQMVANV FGTAGHPQTTHPHQSPSLAKQQTFPQYETSSATTSPFFKPPAQHLNGSAAFNGVDNGGLA SGNRHAEVPPGTCPVDPFEAQWAALESKSKQRTNPSPTNPFSSDLQKTFEIEL Polynucleotide sequence encoding the Numb protein, isoform 2, from Mus musculus, 1815 nt (CCDS ID CCDS26032.1, GeneID 18222). SEQ ID NO: 23 ATGAACAAACTACGGCAAAGCTTCAGGAGAAAGAAAGACGTTTATGTCCCAGAGGCCAGCCGTCCACATC AGTGGCAGACAGATGAAGAAGGAGTCCGCACTGGAAAGTGTAGCTTCCCAGTTAAGTACCTCGGCCACGT AGAAGTTGATGAGTCAAGAGGAATGCACATCTGTGAAGATGCCGTAAAGAGATTGAAAGCTGAAAGGAAG TTCTTCAAAGGCTTCTTTGGAAAAACGGGAAAGAAAGCAGTGAAGGCCGTTCTGTGGGTGTCAGCGGATG GGCTCAGAGTTGTGGACGAGAAAACTAAGGACCTCATAGTTGACCAGACAATAGAAAAAGTTTCCTTCTG TGCCCCAGATAGGAACTTTGACAGAGCCTTTTCTTACATATGTCGTGATGGCACCACTCGGCGATGGATC TGTCATTGTTTCATGGCTGTCAAAGACACGGGGGAAAGACTGAGCCACGCCGTGGGCTGTGCTTTTGCAG CCTGTTTAGAGCGTAAACAGAAGCGGGAGAAGGAGTGTGGCGTCACTGCTACTTTTGATGCCAGTAGAAC CACTTTCACAAGAGAAGGATCATTCCGTGTCACAACTGCCACTGAGCAAGCCGAAAGAGAGGAGATCATG AAACAGTTGCAAGATGCCAAGAAAGCTGAGACAGACAAGACAGTTGTTGGTCCATCAGTGGCTCCTGGCA ACACTGCTCCATCCCCATCCTCTCCCACCTCTCCCACTCCGGATGGCACTGCATCTTCAGAGATGAACAA TCCCCATGCTATCCCACGCCGGCATGCACCAATTGAACAGCTTGCTCGTCAAGGCTCTTTCCGGGGATTT CCTGCTCTTAGCCAGAAGATGTCACCCTTTAAACGCCAGCTGTCCCTACGCATCAATGAGTTGCCTTCCA CTATGCAGAGGAAGACCGATTTCCCAATAAAAAACACAGTGCCCGAGGTGGAAGGAGAGGCCGAGAGCAT CAGCTCCTTGTGTTCCCAGATCACCAGTGCCTTCAGCACGCCCTCTGAGGACCCCTTCTCCTCCGCCCCA ATGACCAAACCAGTGACATTGGTGGCACCACAGTCTCCTGTGTTACAAGGGACTGAGTGGGGTCAGTCTT CTGGTGCTGCCTCTCCAGGTCTCTTCCAGGCTGGTCACAGACGCACTCCCTCTGAAGCTGACCGCTGGTT AGAAGAAGTGTCAAAGAGTGTGCGGGCCCAGCAGCCTCAGGTCTCAGCTGCCCCTCTGCAGCCAGTTCTC CAGCCGCCTCCGCCCGCCGCCATTGCCCCTCCAGCACCTCCTTTCCAAGGACATGCCTTCCTCACGTCCC AGCCTGTGCCCGTGGGTGTGGTCCCACCCCTACAACCAGCCTTTGTCCCTACCCAGTCCTACCCTGTGGC CAACGGGATGCCCTACCCAGCCTCTAATGTGCCTGTAGTGGGCATCACCCCATCCCAGATGGTAGCCAAT GTGTTTGGCACTGCAGGCCACCCTCAGACAACTCATCCACATCAGTCGCCAAGCCTGGCCAAGCAGCAGA CATTCCCTCAATATGAGACAAGTAGTGCTACCACCAGTCCCTTCTTTAAGCCTCCTGCTCAGCACCTCAA TGGTTCTGCAGCTTTCAATGGTGTAGACAATGGTGGGCTAGCCTCAGGAAACAGGCATGCAGAAGTCCCT CCAGGCACCTGCCCAGTGGATCCTTTCGAAGCTCAGTGGGCCGCACTAGAAAGCAAGTCCAAGCAGCGTA ##STR00030## Polypeptide sequence of Numb protein, isoform 2, from Mus musculus, 604 amino acids (translated from CCDS ID CCDS26032.1, GeneID 18222; ENSMUST00000021647). SEQ ID NO: 24 MNKLRQSFRRKKDVYVPEASRPHQWQTDEEGVRTGKCSFPVKYLGHVEVDESRGMHICEDAVKRLKAERK FFKGFFGKTGKKAVKAVLWVSADGLRVVDEKTKDLIVDQTIEKVSFCAPDRNFDRAFSYICRDGTTRRWI CHCFMAVKDTGERLSHAVGCAFAACLERKQKREKECGVTATFDASRTTFTREGSFRVTTATEQAEREEIM KQLQDAKKAETDKTVVGPSVAPGNTAPSPSSPTSPTPDGTASSEMNNPHAIPRRHAPIEQLARQGSFRGF PALSQKMSPFKRQLSLRINELPSTMQRKTDFPIKNTVPEVEGEAESISSLCSQITSAFSTPSEDPFSSAP MTKPVTLVAPQSPVLQGTEWGQSSGAASPGLFQAGHRRTPSEADRWLEEVSKSVRAQQPQVSAAPLQPVL QPPPPAAIAPPAPPFQGHAFLTSQPVPVGVVPPLQPAFVPTQSYPVANGMPYPASNVPVVGITPSQMVAN VFGTAGHPQTTHPHQSPSLAKQQTFPQYETSSATTSPFFKPPAQHLNGSAAFNGVDNGGLASGNRHAEVP PGTCPVDPFEAQWAALESKSKQRTNPSPTNPFSSDLQKTFEIEL Polynucleotide sequence encoding the MSI1 protein, from homo sapiens, 1089 nt (CCDS ID CCDS9196.1, GeneID 4440). SEQ ID NO: 25 ATGGAGACTGACGCGCCCCAGCCCGGCCTCGCCTCCCCGGACTCGCCGCACGACCCCTGCAAGATGGTTCA TCGGGGGACTCAGTTGGCAGACTACGCAGGAAGGGCTGCGCGAATACTTCGGCCAGTTCGGGGAGGTGAA GGAGTGTCTGGTGATGCGGGACCCCCTGACCAAGAGATCCAGGGGTTTCGGCTTCGTCACTTTCATGGAC CAGGCGGGGGTGGATAAAGTGCTGGCGCAATCGCGGCACGAGCTCGACTCCAAAACAATTGACCCTAAGG TGGCCTTCCCTCGGCGAGCACAGCCCAAGATGGTGACTCGAACGAAGAAGATCTTTGTGGGGGGGCTGTC GGTGAACACCACGGTGGAGGACGTGAAGCAATATTTTGAGCAGTTTGGGAAGGTGGACGACGCCATGCTG ATGTTTGACAAAACCACCAACCGGCACCGAGGGTTCGGGTTTGTCACGTTTGAGAGTGAGGACATCGTGG AGAAAGTGTGTGAAATTCATTTTCATGAAATCAACAACAAAATGGTGGAATGTAAGAAAGCTCAGCCAAA GGAGGTGATGTCGCCAACGGGCTCAGCCCGGGGGAGGTCTCGAGTCATGCCCTACGGAATGGACGCCTTC ATGCTGGGCATCGGCATGCTGGGTTACCCAGGTTTCCAAGCCACAACCTACGCCAGCCGGAGTTATACAG GCCTCGCCCCTGGCTACACCTACCAGTTCCCCGAATTCCGTGTAGAGCGGACCCCTCTCCCGAGCGCCCC AGTCCTCCCCGAGCTTACAGCCATTCCTCTCACTGCCTACGGACCAATGGCGGCGGCAGCGGCGGCAGCG GCTGTGGTTCGAGGGACAGGCTCTCACCCCTGGACGATGGCTCCCCCTCCAGGTTCGACTCCCAGCCGCA CAGGGGGCTTCCTGGGGACCACCAGCCCCGGCCCCATGGCCGAGCTCTACGGGGCGGCCAACCAGGACTC GGGGGTCAGCAGTTACATCAGCGCCGCCAGCCCTGCCCCCAGCACCGGCTTCGGCCACAGTCTTGGGGGC CCTTTGATTGCCACAGCCTTCACCAATGGGTACCACTGA Polypeptide sequence of MSI1 protein, from homo sapiens, 362 amino acids (translated from CCDS ID CCDS9196.1, GeneID 4440). SEQ ID NO: 26 METDAPQPGLASPDSPHDPCKMFIGGLSWQTTQEGLREYFGQFGEVKECLVMRDPLTKRSRGFGFVTFMD QAGVDKVLAQSRHELDSKTIDPKVAFPRRAQPKMVTPTKKIFVGGLSVNTTVEDVKQYFEQFGKVDDAML MFDKTTNRHRGFGFVTFESEDIVEKVCEIHFHEINNKMVECKKAQPKEVMSPTGSARGRSRVMPYGMDAF MLGIGMLGYPGFQATTYASRSYTGLAPGYTYQFPEFRVERTPLPSAPVLPELTAIPLTAYGPMAAAAAA AVVRGTGSHPWTMAPPPGSTPSRTGGFLGTTSPGPMAELYGAANQDSGVSSYISAASPAPSTGFGHSLGG PLIATAFTNGYH Polynucleotide sequence encoding the MSI2 protein, isoform a, from homo sapiens, 987 nt (CCDS ID CCDS11596.1, GeneID 124540). SEQ ID NO: 27 ATGGAGGCAAATGGGAGCCAAGGCACCTCGGGCAGCGCCAACGACTCCCAGCACGACCCCGGTAAAATGT TTATCGGTGGACTGAGCTGGCAGACCTCACCAGATAGCCTTAGAGACTATTTTAGCAAATTTGGAGAAAT TAGAGAATGTATGGTCATGAGAGATCCCACTACGAAACGCTCCAGAGGCTTCGGTTTCGTCACGTTCGCA GACCCAGCAAGTGTAGATAAAGTATTAGGTCAGCCCCACCATGAGTTAGATTCCAAGACGATTGACCCCA AAGTTGCATTTCCTCGTCGAGCGCAACCCAAGATGGTCACAAGAACAAAGAAAATATTTGTAGGCGGGTT ATCTGCGAACAGAGTAGTGGAAGATGTAAAGCAATATTTCGAGCAGTTTGGCAAGGTGGAAGATGCAATG CTGATGTTTGATAAAACTACCAACAGGCACAGAGGGTTTGGCTTTGTCACTTTTGAGAATGAAGATGTTC TGGAGAAAGTCTGTGAGATTCATTTCCATGAAATCAATAATAAAATGGTAGAATGTAAGAAAGCTCAGCC GAAAGAAGTCATGTTCCCACCTGGGACAAGAGGCCGGGCCCGGGGACTGCCTTACACCATGGACGCGTTC ATGCTTGGCATGGGGATGCTGGGATATCCCAACTTCGTGGCGACCTATGGCCGTGGCTACCCCGGATTTG CTCCAAGCTATGGCTATCAGTTCCCAGGCTTCCCAGCAGCGGCTTATGGACCAGTGGCAGCAGCGGCGGT GGCGGCAGCAAGAGGATCAGGCTCCAACCCGGCGCGGCCCGGAGGCTTCCCGGGGGCCAACAGCCCAGGA CCTGTCGCCGATCTCTACGGCCCTGCCAGCCAGGACTCCGGAGTGGGGAATTACATAAGTGCGGCCAGCC CACAGCCGGGCTCGGGCTTCGGCCACGGCATAGCTGGACCTTTGATTGCAACGGCCTTTACAAATGGATA
CCATTGA Polypeptide sequence of MSI2 protein, isoform a, from homo sapiens, 328 amino acids (translated from CCDS ID CCDS11596.1, GeneID 124540). SEQ ID NO: 28 MEANSQGTSGSANDSQHDPGKMFIGGLSWQTSPDSLRDYFSKFGEIRECMVMRDPTTKRSRGFGFVTFA DPASVDKVLGQPHELDSKTIDPKVAFPRRAQPKMVTRTKKIFVGGLSANTVVEDVKQYFEQFGKVEDAM LMFDKTTNRHRGFGFVTFENEDVVEKVCIHFHEINNKMVECKKAQPKEVMFPPGTRGRARGLPYTMDAF MLGMGMLGYPNFVATYGRGYPGFAPSYGYQFPGEFPAAAYGPVAAAAVAAARGSGSNPARPGGFPGANSPG PVADLYGPASQDSGVGNYISAASPQPGSGFGHGIAGPLIATAFTNGYH Polynucleotide sequence encoding the MSI2 protein, isoform b, from homo sapiens, 756 nt (CCDS ID CCDS11597.1, GeneID 124540). SEQ ID NO: 29 ATGGCCGATCTGACATCGGTGCTCACTTCTGTTATGTTTTCTCCCTCTAGTAAAATGTTTATCGGTGGAC TGAGCTGGCAGACCTCACCAGATAGCCTTAGAGACTATTTTAGCAAATTTGGAGAAATTAGAGAATGTAT GGTCATGAGAGATCCCACTACGAAACGCTCCAGAGGCTTCGGTTTCGTCACGTTCGCAGACCCAGCAAGT GTAGATAAAGTATTAGGTCAGCCCCACCATGAGTTAGATTCCAAGACGATTGACCCCAAAGTTGCATTTC CTCGTCGAGCGCAACCCAAGATGGTCACAAGAACAAAGAAAATATTTGTAGGCGGGTTATCTGCGAACAC AGTAGTGGAAGATGTAAAGCAATATTTCGAGCAGTTTGGCAAGGTGGAAGATGCAATGCTGATGTTTGAT AAAACTACCAACAGGCACAGAGGGTTTGGCTTTGTCACTTTTGAGAATGAAGATGTTGTGGAGAAAGTCT GTGAGATTCATTTCCATGAAATCAATAATAAAATGGTAGAATGTAAGAAAGCTCAGCCGAAAGAAGTCAT GTTCCCACCTGGGACAAGAGGCCGGGCCCGGGGACTGCCTTACACCATGGACGCGTTCATGCTTGGCATG GGGATGCTGGGATATCCCAACTTCGTGGCGACCTATGGCCGTGGCTACCCCGGATTTGCTCCAAGCTATG GCTATCAGTTCCCAGACTATTTGCCGGTTTCACAAGACATAATTTTTATCAACTAG Polypeptide sequence of MSI2 protein, isoform b, from homo sapiens, 251 amino acids (translated from CCDS ID CCDS11597.1, GeneID 124540). SEQ ID NO: 30 MADLTSVLTSVMFSPSSKMFIGGLSWQTSPDSLRDYFSKFGEIRECMVMRDPTTKRSRGFGFVTFADPAS VDKVLGQPHHELDSKTIDPKVAFPRRAQPKMVTRTKKIFVGGLSANTVVEDVKQYFEQFGKVEDAMLMFD KTTNRHRGFGFVTFENEDVVEKVCEIHFHEINNKMVECKKAQPKEVMFPPGTRGRARGLPYTMDAFMLGM GMLGYPNFVATYGRGYPGFAPSYGYQFPDYLPVSQDIIFIN
SEQUENCE LISTINGS
1
30123DNAArtificial SequenceSynthetic 1atgagttgcc ttccactatg cag 23223DNAArtificial SequenceSynthetic 2tgctgaaggc actggtgatc tgg 23321DNAArtificial SequenceSynthetic 3atggatgcct tcatgctggg t 21421DNAArtificial SequenceSynthetic 4ctccgctcta cacggaattc g 21521DNAArtificial SequenceSynthetic 5tgccatacac catggatgcg t 21621DNAArtificial SequenceSynthetic 6gtagcctctg ccataggttg c 21723DNAArtificial sequenceSynthetic 7accggcctgt atgctatcca gaa 23822DNAArtificial SequenceSynthetic 8aatgtgaggc gggtggaact gt 22922DNAArtificial SequenceSynthetic 9cccagatagc cttagagact at 221022DNAArtificial SequenceSynthetic 10ctgtgccaga gtccttcgat ag 22111956DNAHomo sapiens 11atgaacaaat tacggcaaag ttttaggaga aagaaggatg tttatgttcc agaggccagt 60cgtccacatc agtggcagac agatgaagaa ggcgttcgca ccggaaaatg tagcttcccg 120gttaagtacc ttggccatgt agaagttgat gaatcaagag gaatgcacat ctgtgaagat 180gctgtaaaaa gattgaaagc tgaaaggaag ttcttcaaag gcttctttgg aaaaactgga 240aagaaagcag ttaaagcagt tctgtgggtc tcagcagatg gactcagagt tgtggatgaa 300aaaactaagg acctcatagt tgaccagacg atagagaaag tttctttctg tgccccagac 360aggaactttg atagagcctt ttcttacata tgccgtgatg gcaccactcg tcgctggatc 420tgtcactgct tcatggctgt caaggacaca ggtgaaaggt tgagccatgc agtaggctgt 480gcttttgcag cctgtttaga gcgcaagcag aagcgggaga aggaatgtgg agtgactgct 540acttttgatg ctagtcggac cacttttaca agagaaggat cattccgtgt cacaacagcc 600actgaacaag cagaaagaga ggagatcatg aaacaaatgc aagatgccaa gaaagctgaa 660acagataaga tagtcgttgg ttcatcagtt gcccctggca acactgcccc atccccatcc 720tctcccacct ctcctacttc tgatgccacg acctctctgg agatgaacaa tcctcatgcc 780atcccacgcc ggcatgctcc aattgaacag cttgctcgcc aaggctcttt ccgaggtttt 840cctgctctta gccagaagat gtcacccttt aaacgccaac tatccctacg catcaatgag 900ttgccttcca ctatgcagag gaagactgat ttccccatta aaaatgcagt gccagaagta 960gaaggggagg cagagagcat cagctccctg tgctcacaga tcaccaatgc cttcagcaca 1020cctgaggacc ccttctcatc tgctccgatg accaaaccag tgacagtggt ggcaccacaa 1080tctcctacct tccaagctaa tggcactgac tcagccttcc atgtgcttgc taagccagcc 1140catactgctc tagcacccgt agcaatgcct gtgcgtgaaa ccaacccttg ggcccatgcc 1200cctgatgctg ctaacaagga aattgcagcc acatgttcgg ggaccgagtg gggtcaatct 1260tctggtgctg cctctccagg tctcttccag gccggtcata gacgtactcc ctctgaggcc 1320gaccgatggt tagaagaggt gtctaagagc gtccgggctc agcagcccca ggcctcagct 1380gctcctctgc agccagttct ccagcctcct ccacccactg ccatctccca gccagcatca 1440cctttccaag ggaatgcatt cctcacctct cagcctgtgc cagtgggtgt ggtcccagcc 1500ctgcaaccag cctttgtccc tgcccagtcc tatcctgtgg ccaatggaat gccctatcca 1560gcccctaatg tgcctgtggt gggcatcact ccctcccaga tggtggccaa cgtatttggc 1620actgcaggcc accctcaggc tgcccatccc catcagtcac ccagcctggt caggcagcag 1680acattccctc actacgaggc aagcagtgct accaccagtc ccttctttaa gcctcctgct 1740cagcacctca acggttctgc agctttcaat ggtgtagatg atggcaggtt ggcctcagca 1800gacaggcata cagaggttcc tacaggcacc tgcccagtgg atccttttga agcccagtgg 1860gctgcattag aaaataagtc caagcagcgt actaatccct cccctaccaa ccctttctcc 1920agtgacttac agaagacgtt tgaaattgaa ctttaa 195612651PRTHomo sapiens 12Met Asn Lys Leu Arg Gln Ser Phe Arg Arg Lys Lys Asp Val Tyr Val1 5 10 15Pro Glu Ala Ser Arg Pro His Gln Trp Gln Thr Asp Glu Glu Gly Val 20 25 30Arg Thr Gly Lys Cys Ser Phe Pro Val Lys Tyr Leu Gly His Val Glu 35 40 45Val Asp Glu Ser Arg Gly Met His Ile Cys Glu Asp Ala Val Lys Arg 50 55 60Leu Lys Ala Glu Arg Lys Phe Phe Lys Gly Phe Phe Gly Lys Thr Gly65 70 75 80Lys Lys Ala Val Lys Ala Val Leu Trp Val Ser Ala Asp Gly Leu Arg 85 90 95Val Val Asp Glu Lys Thr Lys Asp Leu Ile Val Asp Gln Thr Ile Glu 100 105 110Lys Val Ser Phe Cys Ala Pro Asp Arg Asn Phe Asp Arg Ala Phe Ser 115 120 125Tyr Ile Cys Arg Asp Gly Thr Thr Arg Arg Trp Ile Cys His Cys Phe 130 135 140Met Ala Val Lys Asp Thr Gly Glu Arg Leu Ser His Ala Val Gly Cys145 150 155 160Ala Phe Ala Ala Cys Leu Glu Arg Lys Gln Lys Arg Glu Lys Glu Cys 165 170 175Gly Val Thr Ala Thr Phe Asp Ala Ser Arg Thr Thr Phe Thr Arg Glu 180 185 190Gly Ser Phe Arg Val Thr Thr Ala Thr Glu Gln Ala Glu Arg Glu Glu 195 200 205Ile Met Lys Gln Met Gln Asp Ala Lys Lys Ala Glu Thr Asp Lys Ile 210 215 220Val Val Gly Ser Ser Val Ala Pro Gly Asn Thr Ala Pro Ser Pro Ser225 230 235 240Ser Pro Thr Ser Pro Thr Ser Asp Ala Thr Thr Ser Leu Glu Met Asn 245 250 255Asn Pro His Ala Ile Pro Arg Arg His Ala Pro Ile Glu Gln Leu Ala 260 265 270Arg Gln Gly Ser Phe Arg Gly Phe Pro Ala Leu Ser Gln Lys Met Ser 275 280 285Pro Phe Lys Arg Gln Leu Ser Leu Arg Ile Asn Glu Leu Pro Ser Thr 290 295 300Met Gln Arg Lys Thr Asp Phe Pro Ile Lys Asn Ala Val Pro Glu Val305 310 315 320Glu Gly Glu Ala Glu Ser Ile Ser Ser Leu Cys Ser Gln Ile Thr Asn 325 330 335Ala Phe Ser Thr Pro Glu Asp Pro Phe Ser Ser Ala Pro Met Thr Lys 340 345 350Pro Val Thr Val Val Ala Pro Gln Ser Pro Thr Phe Gln Ala Asn Gly 355 360 365Thr Asp Ser Ala Phe His Val Leu Ala Lys Pro Ala His Thr Ala Leu 370 375 380Ala Pro Val Ala Met Pro Val Arg Glu Thr Asn Pro Trp Ala His Ala385 390 395 400Pro Asp Ala Ala Asn Lys Glu Ile Ala Ala Thr Cys Ser Gly Thr Glu 405 410 415Trp Gly Gln Ser Ser Gly Ala Ala Ser Pro Gly Leu Phe Gln Ala Gly 420 425 430His Arg Arg Thr Pro Ser Glu Ala Asp Arg Trp Leu Glu Glu Val Ser 435 440 445Lys Ser Val Arg Ala Gln Gln Pro Gln Ala Ser Ala Ala Pro Leu Gln 450 455 460Pro Val Leu Gln Pro Pro Pro Pro Thr Ala Ile Ser Gln Pro Ala Ser465 470 475 480Pro Phe Gln Gly Asn Ala Phe Leu Thr Ser Gln Pro Val Pro Val Gly 485 490 495Val Val Pro Ala Leu Gln Pro Ala Phe Val Pro Ala Gln Ser Tyr Pro 500 505 510Val Ala Asn Gly Met Pro Tyr Pro Ala Pro Asn Val Pro Val Val Gly 515 520 525Ile Thr Pro Ser Gln Met Val Ala Asn Val Phe Gly Thr Ala Gly His 530 535 540Pro Gln Ala Ala His Pro His Gln Ser Pro Ser Leu Val Arg Gln Gln545 550 555 560Thr Phe Pro His Tyr Glu Ala Ser Ser Ala Thr Thr Ser Pro Phe Phe 565 570 575Lys Pro Pro Ala Gln His Leu Asn Gly Ser Ala Ala Phe Asn Gly Val 580 585 590Asp Asp Gly Arg Leu Ala Ser Ala Asp Arg His Thr Glu Val Pro Thr 595 600 605Gly Thr Cys Pro Val Asp Pro Phe Glu Ala Gln Trp Ala Ala Leu Glu 610 615 620Asn Lys Ser Lys Gln Arg Thr Asn Pro Ser Pro Thr Asn Pro Phe Ser625 630 635 640Ser Asp Leu Gln Lys Thr Phe Glu Ile Glu Leu 645 650131812DNAHomo sapiens 13atgaacaaat tacggcaaag ttttaggaga aagaaggatg tttatgttcc agaggccagt 60cgtccacatc agtggcagac agatgaagaa ggcgttcgca ccggaaaatg tagcttcccg 120gttaagtacc ttggccatgt agaagttgat gaatcaagag gaatgcacat ctgtgaagat 180gctgtaaaaa gattgaaagc tgaaaggaag ttcttcaaag gcttctttgg aaaaactgga 240aagaaagcag ttaaagcagt tctgtgggtc tcagcagatg gactcagagt tgtggatgaa 300aaaactaagg acctcatagt tgaccagacg atagagaaag tttctttctg tgccccagac 360aggaactttg atagagcctt ttcttacata tgccgtgatg gcaccactcg tcgctggatc 420tgtcactgct tcatggctgt caaggacaca ggtgaaaggt tgagccatgc agtaggctgt 480gcttttgcag cctgtttaga gcgcaagcag aagcgggaga aggaatgtgg agtgactgct 540acttttgatg ctagtcggac cacttttaca agagaaggat cattccgtgt cacaacagcc 600actgaacaag cagaaagaga ggagatcatg aaacaaatgc aagatgccaa gaaagctgaa 660acagataaga tagtcgttgg ttcatcagtt gcccctggca acactgcccc atccccatcc 720tctcccacct ctcctacttc tgatgccacg acctctctgg agatgaacaa tcctcatgcc 780atcccacgcc ggcatgctcc aattgaacag cttgctcgcc aaggctcttt ccgaggtttt 840cctgctctta gccagaagat gtcacccttt aaacgccaac tatccctacg catcaatgag 900ttgccttcca ctatgcagag gaagactgat ttccccatta aaaatgcagt gccagaagta 960gaaggggagg cagagagcat cagctccctg tgctcacaga tcaccaatgc cttcagcaca 1020cctgaggacc ccttctcatc tgctccgatg accaaaccag tgacagtggt ggcaccacaa 1080tctcctacct tccaagggac cgagtggggt caatcttctg gtgctgcctc tccaggtctc 1140ttccaggccg gtcatagacg tactccctct gaggccgacc gatggttaga agaggtgtct 1200aagagcgtcc gggctcagca gccccaggcc tcagctgctc ctctgcagcc agttctccag 1260cctcctccac ccactgccat ctcccagcca gcatcacctt tccaagggaa tgcattcctc 1320acctctcagc ctgtgccagt gggtgtggtc ccagccctgc aaccagcctt tgtccctgcc 1380cagtcctatc ctgtggccaa tggaatgccc tatccagccc ctaatgtgcc tgtggtgggc 1440atcactccct cccagatggt ggccaacgta tttggcactg caggccaccc tcaggctgcc 1500catccccatc agtcacccag cctggtcagg cagcagacat tccctcacta cgaggcaagc 1560agtgctacca ccagtccctt ctttaagcct cctgctcagc acctcaacgg ttctgcagct 1620ttcaatggtg tagatgatgg caggttggcc tcagcagaca ggcatacaga ggttcctaca 1680ggcacctgcc cagtggatcc ttttgaagcc cagtgggctg cattagaaaa taagtccaag 1740cagcgtacta atccctcccc taccaaccct ttctccagtg acttacagaa gacgtttgaa 1800attgaacttt aa 181214603PRTHomo sapiens 14Met Asn Lys Leu Arg Gln Ser Phe Arg Arg Lys Lys Asp Val Tyr Val1 5 10 15Pro Glu Ala Ser Arg Pro His Gln Trp Gln Thr Asp Glu Glu Gly Val 20 25 30Arg Thr Gly Lys Cys Ser Phe Pro Val Lys Tyr Leu Gly His Val Glu 35 40 45Val Asp Glu Ser Arg Gly Met His Ile Cys Glu Asp Ala Val Lys Arg 50 55 60Leu Lys Ala Glu Arg Lys Phe Phe Lys Gly Phe Phe Gly Lys Thr Gly65 70 75 80Lys Lys Ala Val Lys Ala Val Leu Trp Val Ser Ala Asp Gly Leu Arg 85 90 95Val Val Asp Glu Lys Thr Lys Asp Leu Ile Val Asp Gln Thr Ile Glu 100 105 110Lys Val Ser Phe Cys Ala Pro Asp Arg Asn Phe Asp Arg Ala Phe Ser 115 120 125Tyr Ile Cys Arg Asp Gly Thr Thr Arg Arg Trp Ile Cys His Cys Phe 130 135 140Met Ala Val Lys Asp Thr Gly Glu Arg Leu Ser His Ala Val Gly Cys145 150 155 160Ala Phe Ala Ala Cys Leu Glu Arg Lys Gln Lys Arg Glu Lys Glu Cys 165 170 175Gly Val Thr Ala Thr Phe Asp Ala Ser Arg Thr Thr Phe Thr Arg Glu 180 185 190Gly Ser Phe Arg Val Thr Thr Ala Thr Glu Gln Ala Glu Arg Glu Glu 195 200 205Ile Met Lys Gln Met Gln Asp Ala Lys Lys Ala Glu Thr Asp Lys Ile 210 215 220Val Val Gly Ser Ser Val Ala Pro Gly Asn Thr Ala Pro Ser Pro Ser225 230 235 240Ser Pro Thr Ser Pro Thr Ser Asp Ala Thr Thr Ser Leu Glu Met Asn 245 250 255Asn Pro His Ala Ile Pro Arg Arg His Ala Pro Ile Glu Gln Leu Ala 260 265 270Arg Gln Gly Ser Phe Arg Gly Phe Pro Ala Leu Ser Gln Lys Met Ser 275 280 285Pro Phe Lys Arg Gln Leu Ser Leu Arg Ile Asn Glu Leu Pro Ser Thr 290 295 300Met Gln Arg Lys Thr Asp Phe Pro Ile Lys Asn Ala Val Pro Glu Val305 310 315 320Glu Gly Glu Ala Glu Ser Ile Ser Ser Leu Cys Ser Gln Ile Thr Asn 325 330 335Ala Phe Ser Thr Pro Glu Asp Pro Phe Ser Ser Ala Pro Met Thr Lys 340 345 350Pro Val Thr Val Val Ala Pro Gln Ser Pro Thr Phe Gln Gly Thr Glu 355 360 365Trp Gly Gln Ser Ser Gly Ala Ala Ser Pro Gly Leu Phe Gln Ala Gly 370 375 380His Arg Arg Thr Pro Ser Glu Ala Asp Arg Trp Leu Glu Glu Val Ser385 390 395 400Lys Ser Val Arg Ala Gln Gln Pro Gln Ala Ser Ala Ala Pro Leu Gln 405 410 415Pro Val Leu Gln Pro Pro Pro Pro Thr Ala Ile Ser Gln Pro Ala Ser 420 425 430Pro Phe Gln Gly Asn Ala Phe Leu Thr Ser Gln Pro Val Pro Val Gly 435 440 445Val Val Pro Ala Leu Gln Pro Ala Phe Val Pro Ala Gln Ser Tyr Pro 450 455 460Val Ala Asn Gly Met Pro Tyr Pro Ala Pro Asn Val Pro Val Val Gly465 470 475 480Ile Thr Pro Ser Gln Met Val Ala Asn Val Phe Gly Thr Ala Gly His 485 490 495Pro Gln Ala Ala His Pro His Gln Ser Pro Ser Leu Val Arg Gln Gln 500 505 510Thr Phe Pro His Tyr Glu Ala Ser Ser Ala Thr Thr Ser Pro Phe Phe 515 520 525Lys Pro Pro Ala Gln His Leu Asn Gly Ser Ala Ala Phe Asn Gly Val 530 535 540Asp Asp Gly Arg Leu Ala Ser Ala Asp Arg His Thr Glu Val Pro Thr545 550 555 560Gly Thr Cys Pro Val Asp Pro Phe Glu Ala Gln Trp Ala Ala Leu Glu 565 570 575Asn Lys Ser Lys Gln Arg Thr Asn Pro Ser Pro Thr Asn Pro Phe Ser 580 585 590Ser Asp Leu Gln Lys Thr Phe Glu Ile Glu Leu 595 600151923DNAHomo sapiens 15atgaacaaat tacggcaaag ttttaggaga aagaaggatg tttatgttcc agaggccagt 60cgtccacatc agtggcagac agatgaagaa ggcgttcgca ccggaaaatg tagcttcccg 120gttaagtacc ttggccatgt agaagttgat gaatcaagag gaatgcacat ctgtgaagat 180gctgtaaaaa gattgaaagc tactggaaag aaagcagtta aagcagttct gtgggtctca 240gcagatggac tcagagttgt ggatgaaaaa actaaggacc tcatagttga ccagacgata 300gagaaagttt ctttctgtgc cccagacagg aactttgata gagccttttc ttacatatgc 360cgtgatggca ccactcgtcg ctggatctgt cactgcttca tggctgtcaa ggacacaggt 420gaaaggttga gccatgcagt aggctgtgct tttgcagcct gtttagagcg caagcagaag 480cgggagaagg aatgtggagt gactgctact tttgatgcta gtcggaccac ttttacaaga 540gaaggatcat tccgtgtcac aacagccact gaacaagcag aaagagagga gatcatgaaa 600caaatgcaag atgccaagaa agctgaaaca gataagatag tcgttggttc atcagttgcc 660cctggcaaca ctgccccatc cccatcctct cccacctctc ctacttctga tgccacgacc 720tctctggaga tgaacaatcc tcatgccatc ccacgccggc atgctccaat tgaacagctt 780gctcgccaag gctctttccg aggttttcct gctcttagcc agaagatgtc accctttaaa 840cgccaactat ccctacgcat caatgagttg ccttccacta tgcagaggaa gactgatttc 900cccattaaaa atgcagtgcc agaagtagaa ggggaggcag agagcatcag ctccctgtgc 960tcacagatca ccaatgcctt cagcacacct gaggacccct tctcatctgc tccgatgacc 1020aaaccagtga cagtggtggc accacaatct cctaccttcc aagctaatgg cactgactca 1080gccttccatg tgcttgctaa gccagcccat actgctctag cacccgtagc aatgcctgtg 1140cgtgaaacca acccttgggc ccatgcccct gatgctgcta acaaggaaat tgcagccaca 1200tgttcgggga ccgagtgggg tcaatcttct ggtgctgcct ctccaggtct cttccaggcc 1260ggtcatagac gtactccctc tgaggccgac cgatggttag aagaggtgtc taagagcgtc 1320cgggctcagc agccccaggc ctcagctgct cctctgcagc cagttctcca gcctcctcca 1380cccactgcca tctcccagcc agcatcacct ttccaaggga atgcattcct cacctctcag 1440cctgtgccag tgggtgtggt cccagccctg caaccagcct ttgtccctgc ccagtcctat 1500cctgtggcca atggaatgcc ctatccagcc cctaatgtgc ctgtggtggg catcactccc 1560tcccagatgg tggccaacgt atttggcact gcaggccacc ctcaggctgc ccatccccat 1620cagtcaccca gcctggtcag gcagcagaca ttccctcact acgaggcaag cagtgctacc 1680accagtccct tctttaagcc tcctgctcag cacctcaacg gttctgcagc tttcaatggt 1740gtagatgatg gcaggttggc ctcagcagac aggcatacag aggttcctac aggcacctgc 1800ccagtggatc cttttgaagc ccagtgggct gcattagaaa ataagtccaa gcagcgtact 1860aatccctccc ctaccaaccc tttctccagt gacttacaga agacgtttga aattgaactt 1920taa 192316640PRTHomo sapiens 16Met Asn Lys Leu Arg Gln Ser Phe Arg Arg Lys Lys Asp Val Tyr Val1 5 10 15Pro Glu Ala Ser Arg Pro His Gln Trp Gln Thr Asp Glu Glu Gly Val 20 25 30Arg Thr Gly Lys Cys Ser Phe Pro Val Lys Tyr Leu Gly His Val Glu 35 40 45Val Asp Glu Ser Arg Gly Met His Ile Cys Glu Asp Ala Val Lys Arg 50 55 60Leu Lys Ala Thr Gly Lys Lys Ala Val Lys Ala Val Leu Trp Val Ser65 70 75 80Ala Asp Gly Leu Arg Val Val Asp Glu Lys Thr Lys Asp Leu Ile Val 85 90 95Asp Gln
Thr Ile Glu Lys Val Ser Phe Cys Ala Pro Asp Arg Asn Phe 100 105 110Asp Arg Ala Phe Ser Tyr Ile Cys Arg Asp Gly Thr Thr Arg Arg Trp 115 120 125Ile Cys His Cys Phe Met Ala Val Lys Asp Thr Gly Glu Arg Leu Ser 130 135 140His Ala Val Gly Cys Ala Phe Ala Ala Cys Leu Glu Arg Lys Gln Lys145 150 155 160Arg Glu Lys Glu Cys Gly Val Thr Ala Thr Phe Asp Ala Ser Arg Thr 165 170 175Thr Phe Thr Arg Glu Gly Ser Phe Arg Val Thr Thr Ala Thr Glu Gln 180 185 190Ala Glu Arg Glu Glu Ile Met Lys Gln Met Gln Asp Ala Lys Lys Ala 195 200 205Glu Thr Asp Lys Ile Val Val Gly Ser Ser Val Ala Pro Gly Asn Thr 210 215 220Ala Pro Ser Pro Ser Ser Pro Thr Ser Pro Thr Ser Asp Ala Thr Thr225 230 235 240Ser Leu Glu Met Asn Asn Pro His Ala Ile Pro Arg Arg His Ala Pro 245 250 255Ile Glu Gln Leu Ala Arg Gln Gly Ser Phe Arg Gly Phe Pro Ala Leu 260 265 270Ser Gln Lys Met Ser Pro Phe Lys Arg Gln Leu Ser Leu Arg Ile Asn 275 280 285Glu Leu Pro Ser Thr Met Gln Arg Lys Thr Asp Phe Pro Ile Lys Asn 290 295 300Ala Val Pro Glu Val Glu Gly Glu Ala Glu Ser Ile Ser Ser Leu Cys305 310 315 320Ser Gln Ile Thr Asn Ala Phe Ser Thr Pro Glu Asp Pro Phe Ser Ser 325 330 335Ala Pro Met Thr Lys Pro Val Thr Val Val Ala Pro Gln Ser Pro Thr 340 345 350Phe Gln Ala Asn Gly Thr Asp Ser Ala Phe His Val Leu Ala Lys Pro 355 360 365Ala His Thr Ala Leu Ala Pro Val Ala Met Pro Val Arg Glu Thr Asn 370 375 380Pro Trp Ala His Ala Pro Asp Ala Ala Asn Lys Glu Ile Ala Ala Thr385 390 395 400Cys Ser Gly Thr Glu Trp Gly Gln Ser Ser Gly Ala Ala Ser Pro Gly 405 410 415Leu Phe Gln Ala Gly His Arg Arg Thr Pro Ser Glu Ala Asp Arg Trp 420 425 430Leu Glu Glu Val Ser Lys Ser Val Arg Ala Gln Gln Pro Gln Ala Ser 435 440 445Ala Ala Pro Leu Gln Pro Val Leu Gln Pro Pro Pro Pro Thr Ala Ile 450 455 460Ser Gln Pro Ala Ser Pro Phe Gln Gly Asn Ala Phe Leu Thr Ser Gln465 470 475 480Pro Val Pro Val Gly Val Val Pro Ala Leu Gln Pro Ala Phe Val Pro 485 490 495Ala Gln Ser Tyr Pro Val Ala Asn Gly Met Pro Tyr Pro Ala Pro Asn 500 505 510Val Pro Val Val Gly Ile Thr Pro Ser Gln Met Val Ala Asn Val Phe 515 520 525Gly Thr Ala Gly His Pro Gln Ala Ala His Pro His Gln Ser Pro Ser 530 535 540Leu Val Arg Gln Gln Thr Phe Pro His Tyr Glu Ala Ser Ser Ala Thr545 550 555 560Thr Ser Pro Phe Phe Lys Pro Pro Ala Gln His Leu Asn Gly Ser Ala 565 570 575Ala Phe Asn Gly Val Asp Asp Gly Arg Leu Ala Ser Ala Asp Arg His 580 585 590Thr Glu Val Pro Thr Gly Thr Cys Pro Val Asp Pro Phe Glu Ala Gln 595 600 605Trp Ala Ala Leu Glu Asn Lys Ser Lys Gln Arg Thr Asn Pro Ser Pro 610 615 620Thr Asn Pro Phe Ser Ser Asp Leu Gln Lys Thr Phe Glu Ile Glu Leu625 630 635 640171779DNAHomo sapiens 17atgaacaaat tacggcaaag ttttaggaga aagaaggatg tttatgttcc agaggccagt 60cgtccacatc agtggcagac agatgaagaa ggcgttcgca ccggaaaatg tagcttcccg 120gttaagtacc ttggccatgt agaagttgat gaatcaagag gaatgcacat ctgtgaagat 180gctgtaaaaa gattgaaagc tactggaaag aaagcagtta aagcagttct gtgggtctca 240gcagatggac tcagagttgt ggatgaaaaa actaaggacc tcatagttga ccagacgata 300gagaaagttt ctttctgtgc cccagacagg aactttgata gagccttttc ttacatatgc 360cgtgatggca ccactcgtcg ctggatctgt cactgcttca tggctgtcaa ggacacaggt 420gaaaggttga gccatgcagt aggctgtgct tttgcagcct gtttagagcg caagcagaag 480cgggagaagg aatgtggagt gactgctact tttgatgcta gtcggaccac ttttacaaga 540gaaggatcat tccgtgtcac aacagccact gaacaagcag aaagagagga gatcatgaaa 600caaatgcaag atgccaagaa agctgaaaca gataagatag tcgttggttc atcagttgcc 660cctggcaaca ctgccccatc cccatcctct cccacctctc ctacttctga tgccacgacc 720tctctggaga tgaacaatcc tcatgccatc ccacgccggc atgctccaat tgaacagctt 780gctcgccaag gctctttccg aggttttcct gctcttagcc agaagatgtc accctttaaa 840cgccaactat ccctacgcat caatgagttg ccttccacta tgcagaggaa gactgatttc 900cccattaaaa atgcagtgcc agaagtagaa ggggaggcag agagcatcag ctccctgtgc 960tcacagatca ccaatgcctt cagcacacct gaggacccct tctcatctgc tccgatgacc 1020aaaccagtga cagtggtggc accacaatct cctaccttcc aagggaccga gtggggtcaa 1080tcttctggtg ctgcctctcc aggtctcttc caggccggtc atagacgtac tccctctgag 1140gccgaccgat ggttagaaga ggtgtctaag agcgtccggg ctcagcagcc ccaggcctca 1200gctgctcctc tgcagccagt tctccagcct cctccaccca ctgccatctc ccagccagca 1260tcacctttcc aagggaatgc attcctcacc tctcagcctg tgccagtggg tgtggtccca 1320gccctgcaac cagcctttgt ccctgcccag tcctatcctg tggccaatgg aatgccctat 1380ccagccccta atgtgcctgt ggtgggcatc actccctccc agatggtggc caacgtattt 1440ggcactgcag gccaccctca ggctgcccat ccccatcagt cacccagcct ggtcaggcag 1500cagacattcc ctcactacga ggcaagcagt gctaccacca gtcccttctt taagcctcct 1560gctcagcacc tcaacggttc tgcagctttc aatggtgtag atgatggcag gttggcctca 1620gcagacaggc atacagaggt tcctacaggc acctgcccag tggatccttt tgaagcccag 1680tgggctgcat tagaaaataa gtccaagcag cgtactaatc cctcccctac caaccctttc 1740tccagtgact tacagaagac gtttgaaatt gaactttaa 177918592PRTHomo sapiens 18Met Asn Lys Leu Arg Gln Ser Phe Arg Arg Lys Lys Asp Val Tyr Val1 5 10 15Pro Glu Ala Ser Arg Pro His Gln Trp Gln Thr Asp Glu Glu Gly Val 20 25 30Arg Thr Gly Lys Cys Ser Phe Pro Val Lys Tyr Leu Gly His Val Glu 35 40 45Val Asp Glu Ser Arg Gly Met His Ile Cys Glu Asp Ala Val Lys Arg 50 55 60Leu Lys Ala Thr Gly Lys Lys Ala Val Lys Ala Val Leu Trp Val Ser65 70 75 80Ala Asp Gly Leu Arg Val Val Asp Glu Lys Thr Lys Asp Leu Ile Val 85 90 95Asp Gln Thr Ile Glu Lys Val Ser Phe Cys Ala Pro Asp Arg Asn Phe 100 105 110Asp Arg Ala Phe Ser Tyr Ile Cys Arg Asp Gly Thr Thr Arg Arg Trp 115 120 125Ile Cys His Cys Phe Met Ala Val Lys Asp Thr Gly Glu Arg Leu Ser 130 135 140His Ala Val Gly Cys Ala Phe Ala Ala Cys Leu Glu Arg Lys Gln Lys145 150 155 160Arg Glu Lys Glu Cys Gly Val Thr Ala Thr Phe Asp Ala Ser Arg Thr 165 170 175Thr Phe Thr Arg Glu Gly Ser Phe Arg Val Thr Thr Ala Thr Glu Gln 180 185 190Ala Glu Arg Glu Glu Ile Met Lys Gln Met Gln Asp Ala Lys Lys Ala 195 200 205Glu Thr Asp Lys Ile Val Val Gly Ser Ser Val Ala Pro Gly Asn Thr 210 215 220Ala Pro Ser Pro Ser Ser Pro Thr Ser Pro Thr Ser Asp Ala Thr Thr225 230 235 240Ser Leu Glu Met Asn Asn Pro His Ala Ile Pro Arg Arg His Ala Pro 245 250 255Ile Glu Gln Leu Ala Arg Gln Gly Ser Phe Arg Gly Phe Pro Ala Leu 260 265 270Ser Gln Lys Met Ser Pro Phe Lys Arg Gln Leu Ser Leu Arg Ile Asn 275 280 285Glu Leu Pro Ser Thr Met Gln Arg Lys Thr Asp Phe Pro Ile Lys Asn 290 295 300Ala Val Pro Glu Val Glu Gly Glu Ala Glu Ser Ile Ser Ser Leu Cys305 310 315 320Ser Gln Ile Thr Asn Ala Phe Ser Thr Pro Glu Asp Pro Phe Ser Ser 325 330 335Ala Pro Met Thr Lys Pro Val Thr Val Val Ala Pro Gln Ser Pro Thr 340 345 350Phe Gln Gly Thr Glu Trp Gly Gln Ser Ser Gly Ala Ala Ser Pro Gly 355 360 365Leu Phe Gln Ala Gly His Arg Arg Thr Pro Ser Glu Ala Asp Arg Trp 370 375 380Leu Glu Glu Val Ser Lys Ser Val Arg Ala Gln Gln Pro Gln Ala Ser385 390 395 400Ala Ala Pro Leu Gln Pro Val Leu Gln Pro Pro Pro Pro Thr Ala Ile 405 410 415Ser Gln Pro Ala Ser Pro Phe Gln Gly Asn Ala Phe Leu Thr Ser Gln 420 425 430Pro Val Pro Val Gly Val Val Pro Ala Leu Gln Pro Ala Phe Val Pro 435 440 445Ala Gln Ser Tyr Pro Val Ala Asn Gly Met Pro Tyr Pro Ala Pro Asn 450 455 460Val Pro Val Val Gly Ile Thr Pro Ser Gln Met Val Ala Asn Val Phe465 470 475 480Gly Thr Ala Gly His Pro Gln Ala Ala His Pro His Gln Ser Pro Ser 485 490 495Leu Val Arg Gln Gln Thr Phe Pro His Tyr Glu Ala Ser Ser Ala Thr 500 505 510Thr Ser Pro Phe Phe Lys Pro Pro Ala Gln His Leu Asn Gly Ser Ala 515 520 525Ala Phe Asn Gly Val Asp Asp Gly Arg Leu Ala Ser Ala Asp Arg His 530 535 540Thr Glu Val Pro Thr Gly Thr Cys Pro Val Asp Pro Phe Glu Ala Gln545 550 555 560Trp Ala Ala Leu Glu Asn Lys Ser Lys Gln Arg Thr Asn Pro Ser Pro 565 570 575Thr Asn Pro Phe Ser Ser Asp Leu Gln Lys Thr Phe Glu Ile Glu Leu 580 585 590191779DNAHomo sapiens 19atgaacaaat tacggcaaag ttttaggaga aagaaggatg tttatgttcc agaggccagt 60cgtccacatc agtggcagac agatgaagaa ggcgttcgca ccggaaaatg tagcttcccg 120gttaagtacc ttggccatgt agaagttgat gaatcaagag gaatgcacat ctgtgaagat 180gctgtaaaaa gattgaaagc tactggaaag aaagcagtta aagcagttct gtgggtctca 240gcagatggac tcagagttgt ggatgaaaaa actaaggacc tcatagttga ccagacgata 300gagaaagttt ctttctgtgc cccagacagg aactttgata gagccttttc ttacatatgc 360cgtgatggca ccactcgtcg ctggatctgt cactgcttca tggctgtcaa ggacacaggt 420gaaaggttga gccatgcagt aggctgtgct tttgcagcct gtttagagcg caagcagaag 480cgggagaagg aatgtggagt gactgctact tttgatgcta gtcggaccac ttttacaaga 540gaaggatcat tccgtgtcac aacagccact gaacaagcag aaagagagga gatcatgaaa 600caaatgcaag atgccaagaa agctgaaaca gataagatag tcgttggttc atcagttgcc 660cctggcaaca ctgccccatc cccatcctct cccacctctc ctacttctga tgccacgacc 720tctctggaga tgaacaatcc tcatgccatc ccacgccggc atgctccaat tgaacagctt 780gctcgccaag gctctttccg aggttttcct gctcttagcc agaagatgtc accctttaaa 840cgccaactat ccctacgcat caatgagttg ccttccacta tgcagaggaa gactgatttc 900cccattaaaa atgcagtgcc agaagtagaa ggggaggcag agagcatcag ctccctgtgc 960tcacagatca ccaatgcctt cagcacacct gaggacccct tctcatctgc tccgatgacc 1020aaaccagtga cagtggtggc accacaatct cctaccttcc aagggaccga gtggggtcaa 1080tcttctggtg ctgcctctcc aggtctcttc caggccggtc atagacgtac tccctctgag 1140gccgaccgat ggttagaaga ggtgtctaag agcgtccggg ctcagcagcc ccaggcctca 1200gctgctcctc tgcagccagt tctccagcct cctccaccca ctgccatctc ccagccagca 1260tcacctttcc aagggaatgc attcctcacc tctcagcctg tgccagtggg tgtggtccca 1320gccctgcaac cagcctttgt ccctgcccag tcctatcctg tggccaatgg aatgccctat 1380ccagccccta atgtgcctgt ggtgggcatc actccctcca agatggtggc caacgtattt 1440ggcactgcag gccaccctca ggctgcccat ccccatcagt cacccagcct ggtcaggcag 1500cagacattcc ctcactacga ggcaagcagt gctaccacca gtcccttctt taagcctcct 1560gctcagcacc tcaacggttc tgcagctttc aatggtgtag atgatggcag gttggcctca 1620gcagacaggc atacagaggt tcctacaggc acctgcccag tggatccttt tgaagcccag 1680tgggctgcat tagaaaataa gtccaagcag cgtactaatc cctcccctac caaccctttc 1740tccagtgact tacagaagac gtttgaaatt gaactttaa 177920592PRTHomo sapiens 20Met Asn Lys Leu Arg Gln Ser Phe Arg Arg Lys Lys Asp Val Tyr Val1 5 10 15Pro Glu Ala Ser Arg Pro His Gln Trp Gln Thr Asp Glu Glu Gly Val 20 25 30Arg Thr Gly Lys Cys Ser Phe Pro Val Lys Tyr Leu Gly His Val Glu 35 40 45Val Asp Glu Ser Arg Gly Met His Ile Cys Glu Asp Ala Val Lys Arg 50 55 60Leu Lys Ala Thr Gly Lys Lys Ala Val Lys Ala Val Leu Trp Val Ser65 70 75 80Ala Asp Gly Leu Arg Val Val Asp Glu Lys Thr Lys Asp Leu Ile Val 85 90 95Asp Gln Thr Ile Glu Lys Val Ser Phe Cys Ala Pro Asp Arg Asn Phe 100 105 110Asp Arg Ala Phe Ser Tyr Ile Cys Arg Asp Gly Thr Thr Arg Arg Trp 115 120 125Ile Cys His Cys Phe Met Ala Val Lys Asp Thr Gly Glu Arg Leu Ser 130 135 140His Ala Val Gly Cys Ala Phe Ala Ala Cys Leu Glu Arg Lys Gln Lys145 150 155 160Arg Glu Lys Glu Cys Gly Val Thr Ala Thr Phe Asp Ala Ser Arg Thr 165 170 175Thr Phe Thr Arg Glu Gly Ser Phe Arg Val Thr Thr Ala Thr Glu Gln 180 185 190Ala Glu Arg Glu Glu Ile Met Lys Gln Met Gln Asp Ala Lys Lys Ala 195 200 205Glu Thr Asp Lys Ile Val Val Gly Ser Ser Val Ala Pro Gly Asn Thr 210 215 220Ala Pro Ser Pro Ser Ser Pro Thr Ser Pro Thr Ser Asp Ala Thr Thr225 230 235 240Ser Leu Glu Met Asn Asn Pro His Ala Ile Pro Arg Arg His Ala Pro 245 250 255Ile Glu Gln Leu Ala Arg Gln Gly Ser Phe Arg Gly Phe Pro Ala Leu 260 265 270Ser Gln Lys Met Ser Pro Phe Lys Arg Gln Leu Ser Leu Arg Ile Asn 275 280 285Glu Leu Pro Ser Thr Met Gln Arg Lys Thr Asp Phe Pro Ile Lys Asn 290 295 300Ala Val Pro Glu Val Glu Gly Glu Ala Glu Ser Ile Ser Ser Leu Cys305 310 315 320Ser Gln Ile Thr Asn Ala Phe Ser Thr Pro Glu Asp Pro Phe Ser Ser 325 330 335Ala Pro Met Thr Lys Pro Val Thr Val Val Ala Pro Gln Ser Pro Thr 340 345 350Phe Gln Gly Thr Glu Trp Gly Gln Ser Ser Gly Ala Ala Ser Pro Gly 355 360 365Leu Phe Gln Ala Gly His Arg Arg Thr Pro Ser Glu Ala Asp Arg Trp 370 375 380Leu Glu Glu Val Ser Lys Ser Val Arg Ala Gln Gln Pro Gln Ala Ser385 390 395 400Ala Ala Pro Leu Gln Pro Val Leu Gln Pro Pro Pro Pro Thr Ala Ile 405 410 415Ser Gln Pro Ala Ser Pro Phe Gln Gly Asn Ala Phe Leu Thr Ser Gln 420 425 430Pro Val Pro Val Gly Val Val Pro Ala Leu Gln Pro Ala Phe Val Pro 435 440 445Ala Gln Ser Tyr Pro Val Ala Asn Gly Met Pro Tyr Pro Ala Pro Asn 450 455 460Val Pro Val Val Gly Ile Thr Pro Ser Lys Met Val Ala Asn Val Phe465 470 475 480Gly Thr Ala Gly His Pro Gln Ala Ala His Pro His Gln Ser Pro Ser 485 490 495Leu Val Arg Gln Gln Thr Phe Pro His Tyr Glu Ala Ser Ser Ala Thr 500 505 510Thr Ser Pro Phe Phe Lys Pro Pro Ala Gln His Leu Asn Gly Ser Ala 515 520 525Ala Phe Asn Gly Val Asp Asp Gly Arg Leu Ala Ser Ala Asp Arg His 530 535 540Thr Glu Val Pro Thr Gly Thr Cys Pro Val Asp Pro Phe Glu Ala Gln545 550 555 560Trp Ala Ala Leu Glu Asn Lys Ser Lys Gln Arg Thr Asn Pro Ser Pro 565 570 575Thr Asn Pro Phe Ser Ser Asp Leu Gln Lys Thr Phe Glu Ile Glu Leu 580 585 590211962DNAMus musculus 21atgaacaaac tacggcaaag cttcaggaga aagaaagacg tttatgtccc agaggccagc 60cgtccacatc agtggcagac agatgaagaa ggagtccgca ctggaaagtg tagcttccca 120gttaagtacc tcggccacgt agaagttgat gagtcaagag gaatgcacat ctgtgaagat 180gccgtaaaga gattgaaagc tgaaaggaag ttcttcaaag gcttctttgg aaaaacggga 240aagaaagcag tgaaggccgt tctgtgggtg tcagcggatg ggctcagagt tgtggacgag 300aaaactaagg acctcatagt tgaccagaca atagaaaaag tttccttctg tgccccagat 360aggaactttg acagagcctt ttcttacata tgtcgtgatg gcaccactcg gcgatggatc 420tgtcattgtt tcatggctgt caaagacacg ggggaaagac tgagccacgc cgtgggctgt 480gcttttgcag cctgtttaga gcgtaaacag aagcgggaga aggagtgtgg cgtcactgct 540acttttgatg ccagtagaac cactttcaca agagaaggat cattccgtgt cacaactgcc 600actgagcaag ccgaaagaga ggagatcatg aaacagttgc aagatgccaa gaaagctgag 660acagacaaga cagttgttgg tccatcagtg gctcctggca acactgctcc atccccatcc 720tctcccacct ctcccactcc ggatggcact gcatcttcag agatgaacaa tccccatgct 780atcccacgcc ggcatgcacc aattgaacag cttgctcgtc aaggctcttt ccggggattt 840cctgctctta gccagaagat
gtcacccttt aaacgccagc tgtccctacg catcaatgag 900ttgccttcca ctatgcagag gaagaccgat ttcccaataa aaaacacagt gcccgaggtg 960gaaggagagg ccgagagcat cagctccttg tgttcccaga tcaccagtgc cttcagcacg 1020ccctctgagg accccttctc ctccgcccca atgaccaaac cagtgacatt ggtggcacca 1080cagtctcctg tgttacaagc taatggcact gactcagcct cccatgtgct tactgctaag 1140ccagccaata ctgctctagc acacgtagca atgcctgtcc gtgaaaccaa cccctgggcc 1200catgtccctg atgctgctaa caaggaaatt gcagccatac atccggggac tgagtggggt 1260cagtcttctg gtgctgcctc tccaggtctc ttccaggctg gtcacagacg cactccctct 1320gaagctgacc gctggttaga agaagtgtca aagagtgtgc gggcccagca gcctcaggtc 1380tcagctgccc ctctgcagcc agttctccag ccgcctccgc ccgccgccat tgcccctcca 1440gcacctcctt tccaaggaca tgccttcctc acgtcccagc ctgtgcccgt gggtgtggtc 1500ccacccctac aaccagcctt tgtccctacc cagtcctacc ctgtggccaa cgggatgccc 1560tacccagcct ctaatgtgcc tgtagtgggc atcaccccat cccagatggt agccaatgtg 1620tttggcactg caggccaccc tcagacaact catccacatc agtcgccaag cctggccaag 1680cagcagacat tccctcaata tgagacaagt agtgctacca ccagtccctt ctttaagcct 1740cctgctcagc acctcaatgg ttctgcagct ttcaatggtg tagacaatgg tgggctagcc 1800tcaggaaaca ggcatgcaga agtccctcca ggcacctgcc cagtggatcc tttcgaagct 1860cagtgggccg cactagaaag caagtccaag cagcgtacaa atccttctcc taccaaccct 1920ttctccagtg acttacagaa aacatttgaa atagaacttt ag 196222653PRTMus musculus 22Met Asn Lys Leu Arg Gln Ser Phe Arg Arg Lys Lys Asp Val Tyr Val1 5 10 15Pro Glu Ala Ser Arg Pro His Gln Trp Gln Thr Asp Glu Glu Gly Val 20 25 30Arg Thr Gly Lys Cys Ser Phe Pro Val Lys Tyr Leu Gly His Val Glu 35 40 45Val Asp Glu Ser Arg Gly Met His Ile Cys Glu Asp Ala Val Lys Arg 50 55 60Leu Lys Ala Glu Arg Lys Phe Phe Lys Gly Phe Phe Gly Lys Thr Gly65 70 75 80Lys Lys Ala Val Lys Ala Val Leu Trp Val Ser Ala Asp Gly Leu Arg 85 90 95Val Val Asp Glu Lys Thr Lys Asp Leu Ile Val Asp Gln Thr Ile Glu 100 105 110Lys Val Ser Phe Cys Ala Pro Asp Arg Asn Phe Asp Arg Ala Phe Ser 115 120 125Tyr Ile Cys Arg Asp Gly Thr Thr Arg Arg Trp Ile Cys His Cys Phe 130 135 140Met Ala Val Lys Asp Thr Gly Glu Arg Leu Ser His Ala Val Gly Cys145 150 155 160Ala Phe Ala Ala Cys Leu Glu Arg Lys Gln Lys Arg Glu Lys Glu Cys 165 170 175Gly Val Thr Ala Thr Phe Asp Ala Ser Arg Thr Thr Phe Thr Arg Glu 180 185 190Gly Ser Phe Arg Val Thr Thr Ala Thr Glu Gln Ala Glu Arg Glu Glu 195 200 205Ile Met Lys Gln Leu Gln Asp Ala Lys Lys Ala Glu Thr Asp Lys Thr 210 215 220Val Val Gly Pro Ser Val Ala Pro Gly Asn Thr Ala Pro Ser Pro Ser225 230 235 240Ser Pro Thr Ser Pro Thr Pro Asp Gly Thr Ala Ser Ser Glu Met Asn 245 250 255Asn Pro His Ala Ile Pro Arg Arg His Ala Pro Ile Glu Gln Leu Ala 260 265 270Arg Gln Gly Ser Phe Arg Gly Phe Pro Ala Leu Ser Gln Lys Met Ser 275 280 285Pro Phe Lys Arg Gln Leu Ser Leu Arg Ile Asn Glu Leu Pro Ser Thr 290 295 300Met Gln Arg Lys Thr Asp Phe Pro Ile Lys Asn Thr Val Pro Glu Val305 310 315 320Glu Gly Glu Ala Glu Ser Ile Ser Ser Leu Cys Ser Gln Ile Thr Ser 325 330 335Ala Phe Ser Thr Pro Ser Glu Asp Pro Phe Ser Ser Ala Pro Met Thr 340 345 350Lys Pro Val Thr Leu Val Ala Pro Gln Ser Pro Val Leu Gln Ala Asn 355 360 365Gly Thr Asp Ser Ala Ser His Val Leu Thr Ala Lys Pro Ala Asn Thr 370 375 380Ala Leu Ala His Val Ala Met Pro Val Arg Glu Thr Asn Pro Trp Ala385 390 395 400His Val Pro Asp Ala Ala Asn Lys Glu Ile Ala Ala Ile His Pro Gly 405 410 415Thr Glu Trp Gly Gln Ser Ser Gly Ala Ala Ser Pro Gly Leu Phe Gln 420 425 430Ala Gly His Arg Arg Thr Pro Ser Glu Ala Asp Arg Trp Leu Glu Glu 435 440 445Val Ser Lys Ser Val Arg Ala Gln Gln Pro Gln Val Ser Ala Ala Pro 450 455 460Leu Gln Pro Val Leu Gln Pro Pro Pro Pro Ala Ala Ile Ala Pro Pro465 470 475 480Ala Pro Pro Phe Gln Gly His Ala Phe Leu Thr Ser Gln Pro Val Pro 485 490 495Val Gly Val Val Pro Pro Leu Gln Pro Ala Phe Val Pro Thr Gln Ser 500 505 510Tyr Pro Val Ala Asn Gly Met Pro Tyr Pro Ala Ser Asn Val Pro Val 515 520 525Val Gly Ile Thr Pro Ser Gln Met Val Ala Asn Val Phe Gly Thr Ala 530 535 540Gly His Pro Gln Thr Thr His Pro His Gln Ser Pro Ser Leu Ala Lys545 550 555 560Gln Gln Thr Phe Pro Gln Tyr Glu Thr Ser Ser Ala Thr Thr Ser Pro 565 570 575Phe Phe Lys Pro Pro Ala Gln His Leu Asn Gly Ser Ala Ala Phe Asn 580 585 590Gly Val Asp Asn Gly Gly Leu Ala Ser Gly Asn Arg His Ala Glu Val 595 600 605Pro Pro Gly Thr Cys Pro Val Asp Pro Phe Glu Ala Gln Trp Ala Ala 610 615 620Leu Glu Ser Lys Ser Lys Gln Arg Thr Asn Pro Ser Pro Thr Asn Pro625 630 635 640Phe Ser Ser Asp Leu Gln Lys Thr Phe Glu Ile Glu Leu 645 650231815DNAMus musculus 23atgaacaaac tacggcaaag cttcaggaga aagaaagacg tttatgtccc agaggccagc 60cgtccacatc agtggcagac agatgaagaa ggagtccgca ctggaaagtg tagcttccca 120gttaagtacc tcggccacgt agaagttgat gagtcaagag gaatgcacat ctgtgaagat 180gccgtaaaga gattgaaagc tgaaaggaag ttcttcaaag gcttctttgg aaaaacggga 240aagaaagcag tgaaggccgt tctgtgggtg tcagcggatg ggctcagagt tgtggacgag 300aaaactaagg acctcatagt tgaccagaca atagaaaaag tttccttctg tgccccagat 360aggaactttg acagagcctt ttcttacata tgtcgtgatg gcaccactcg gcgatggatc 420tgtcattgtt tcatggctgt caaagacacg ggggaaagac tgagccacgc cgtgggctgt 480gcttttgcag cctgtttaga gcgtaaacag aagcgggaga aggagtgtgg cgtcactgct 540acttttgatg ccagtagaac cactttcaca agagaaggat cattccgtgt cacaactgcc 600actgagcaag ccgaaagaga ggagatcatg aaacagttgc aagatgccaa gaaagctgag 660acagacaaga cagttgttgg tccatcagtg gctcctggca acactgctcc atccccatcc 720tctcccacct ctcccactcc ggatggcact gcatcttcag agatgaacaa tccccatgct 780atcccacgcc ggcatgcacc aattgaacag cttgctcgtc aaggctcttt ccggggattt 840cctgctctta gccagaagat gtcacccttt aaacgccagc tgtccctacg catcaatgag 900ttgccttcca ctatgcagag gaagaccgat ttcccaataa aaaacacagt gcccgaggtg 960gaaggagagg ccgagagcat cagctccttg tgttcccaga tcaccagtgc cttcagcacg 1020ccctctgagg accccttctc ctccgcccca atgaccaaac cagtgacatt ggtggcacca 1080cagtctcctg tgttacaagg gactgagtgg ggtcagtctt ctggtgctgc ctctccaggt 1140ctcttccagg ctggtcacag acgcactccc tctgaagctg accgctggtt agaagaagtg 1200tcaaagagtg tgcgggccca gcagcctcag gtctcagctg cccctctgca gccagttctc 1260cagccgcctc cgcccgccgc cattgcccct ccagcacctc ctttccaagg acatgccttc 1320ctcacgtccc agcctgtgcc cgtgggtgtg gtcccacccc tacaaccagc ctttgtccct 1380acccagtcct accctgtggc caacgggatg ccctacccag cctctaatgt gcctgtagtg 1440ggcatcaccc catcccagat ggtagccaat gtgtttggca ctgcaggcca ccctcagaca 1500actcatccac atcagtcgcc aagcctggcc aagcagcaga cattccctca atatgagaca 1560agtagtgcta ccaccagtcc cttctttaag cctcctgctc agcacctcaa tggttctgca 1620gctttcaatg gtgtagacaa tggtgggcta gcctcaggaa acaggcatgc agaagtccct 1680ccaggcacct gcccagtgga tcctttcgaa gctcagtggg ccgcactaga aagcaagtcc 1740aagcagcgta caaatccttc tcctaccaac cctttctcca gtgacttaca gaaaacattt 1800gaaatagaac tttag 181524604PRTMus musculus 24Met Asn Lys Leu Arg Gln Ser Phe Arg Arg Lys Lys Asp Val Tyr Val1 5 10 15Pro Glu Ala Ser Arg Pro His Gln Trp Gln Thr Asp Glu Glu Gly Val 20 25 30Arg Thr Gly Lys Cys Ser Phe Pro Val Lys Tyr Leu Gly His Val Glu 35 40 45Val Asp Glu Ser Arg Gly Met His Ile Cys Glu Asp Ala Val Lys Arg 50 55 60Leu Lys Ala Glu Arg Lys Phe Phe Lys Gly Phe Phe Gly Lys Thr Gly65 70 75 80Lys Lys Ala Val Lys Ala Val Leu Trp Val Ser Ala Asp Gly Leu Arg 85 90 95Val Val Asp Glu Lys Thr Lys Asp Leu Ile Val Asp Gln Thr Ile Glu 100 105 110Lys Val Ser Phe Cys Ala Pro Asp Arg Asn Phe Asp Arg Ala Phe Ser 115 120 125Tyr Ile Cys Arg Asp Gly Thr Thr Arg Arg Trp Ile Cys His Cys Phe 130 135 140Met Ala Val Lys Asp Thr Gly Glu Arg Leu Ser His Ala Val Gly Cys145 150 155 160Ala Phe Ala Ala Cys Leu Glu Arg Lys Gln Lys Arg Glu Lys Glu Cys 165 170 175Gly Val Thr Ala Thr Phe Asp Ala Ser Arg Thr Thr Phe Thr Arg Glu 180 185 190Gly Ser Phe Arg Val Thr Thr Ala Thr Glu Gln Ala Glu Arg Glu Glu 195 200 205Ile Met Lys Gln Leu Gln Asp Ala Lys Lys Ala Glu Thr Asp Lys Thr 210 215 220Val Val Gly Pro Ser Val Ala Pro Gly Asn Thr Ala Pro Ser Pro Ser225 230 235 240Ser Pro Thr Ser Pro Thr Pro Asp Gly Thr Ala Ser Ser Glu Met Asn 245 250 255Asn Pro His Ala Ile Pro Arg Arg His Ala Pro Ile Glu Gln Leu Ala 260 265 270Arg Gln Gly Ser Phe Arg Gly Phe Pro Ala Leu Ser Gln Lys Met Ser 275 280 285Pro Phe Lys Arg Gln Leu Ser Leu Arg Ile Asn Glu Leu Pro Ser Thr 290 295 300Met Gln Arg Lys Thr Asp Phe Pro Ile Lys Asn Thr Val Pro Glu Val305 310 315 320Glu Gly Glu Ala Glu Ser Ile Ser Ser Leu Cys Ser Gln Ile Thr Ser 325 330 335Ala Phe Ser Thr Pro Ser Glu Asp Pro Phe Ser Ser Ala Pro Met Thr 340 345 350Lys Pro Val Thr Leu Val Ala Pro Gln Ser Pro Val Leu Gln Gly Thr 355 360 365Glu Trp Gly Gln Ser Ser Gly Ala Ala Ser Pro Gly Leu Phe Gln Ala 370 375 380Gly His Arg Arg Thr Pro Ser Glu Ala Asp Arg Trp Leu Glu Glu Val385 390 395 400Ser Lys Ser Val Arg Ala Gln Gln Pro Gln Val Ser Ala Ala Pro Leu 405 410 415Gln Pro Val Leu Gln Pro Pro Pro Pro Ala Ala Ile Ala Pro Pro Ala 420 425 430Pro Pro Phe Gln Gly His Ala Phe Leu Thr Ser Gln Pro Val Pro Val 435 440 445Gly Val Val Pro Pro Leu Gln Pro Ala Phe Val Pro Thr Gln Ser Tyr 450 455 460Pro Val Ala Asn Gly Met Pro Tyr Pro Ala Ser Asn Val Pro Val Val465 470 475 480Gly Ile Thr Pro Ser Gln Met Val Ala Asn Val Phe Gly Thr Ala Gly 485 490 495His Pro Gln Thr Thr His Pro His Gln Ser Pro Ser Leu Ala Lys Gln 500 505 510Gln Thr Phe Pro Gln Tyr Glu Thr Ser Ser Ala Thr Thr Ser Pro Phe 515 520 525Phe Lys Pro Pro Ala Gln His Leu Asn Gly Ser Ala Ala Phe Asn Gly 530 535 540Val Asp Asn Gly Gly Leu Ala Ser Gly Asn Arg His Ala Glu Val Pro545 550 555 560Pro Gly Thr Cys Pro Val Asp Pro Phe Glu Ala Gln Trp Ala Ala Leu 565 570 575Glu Ser Lys Ser Lys Gln Arg Thr Asn Pro Ser Pro Thr Asn Pro Phe 580 585 590Ser Ser Asp Leu Gln Lys Thr Phe Glu Ile Glu Leu 595 600251089DNAHomo sapiens 25atggagactg acgcgcccca gcccggcctc gcctccccgg actcgccgca cgacccctgc 60aagatgttca tcgggggact cagttggcag actacgcagg aagggctgcg cgaatacttc 120ggccagttcg gggaggtgaa ggagtgtctg gtgatgcggg accccctgac caagagatcc 180aggggtttcg gcttcgtcac tttcatggac caggcggggg tggataaagt gctggcgcaa 240tcgcggcacg agctcgactc caaaacaatt gaccctaagg tggccttccc tcggcgagca 300cagcccaaga tggtgactcg aacgaagaag atctttgtgg gggggctgtc ggtgaacacc 360acggtggagg acgtgaagca atattttgag cagtttggga aggtggacga cgccatgctg 420atgtttgaca aaaccaccaa ccggcaccga gggttcgggt ttgtcacgtt tgagagtgag 480gacatcgtgg agaaagtgtg tgaaattcat tttcatgaaa tcaacaacaa aatggtggaa 540tgtaagaaag ctcagccaaa ggaggtgatg tcgccaacgg gctcagcccg ggggaggtct 600cgagtcatgc cctacggaat ggacgccttc atgctgggca tcggcatgct gggttaccca 660ggtttccaag ccacaaccta cgccagccgg agttatacag gcctcgcccc tggctacacc 720taccagttcc ccgaattccg tgtagagcgg acccctctcc cgagcgcccc agtcctcccc 780gagcttacag ccattcctct cactgcctac ggaccaatgg cggcggcagc ggcggcagcg 840gctgtggttc gagggacagg ctctcacccc tggacgatgg ctccccctcc aggttcgact 900cccagccgca cagggggctt cctggggacc accagccccg gccccatggc cgagctctac 960ggggcggcca accaggactc gggggtcagc agttacatca gcgccgccag ccctgccccc 1020agcaccggct tcggccacag tcttgggggc cctttgattg ccacagcctt caccaatggg 1080taccactga 108926362PRTHomo sapiens 26Met Glu Thr Asp Ala Pro Gln Pro Gly Leu Ala Ser Pro Asp Ser Pro1 5 10 15His Asp Pro Cys Lys Met Phe Ile Gly Gly Leu Ser Trp Gln Thr Thr 20 25 30Gln Glu Gly Leu Arg Glu Tyr Phe Gly Gln Phe Gly Glu Val Lys Glu 35 40 45Cys Leu Val Met Arg Asp Pro Leu Thr Lys Arg Ser Arg Gly Phe Gly 50 55 60Phe Val Thr Phe Met Asp Gln Ala Gly Val Asp Lys Val Leu Ala Gln65 70 75 80Ser Arg His Glu Leu Asp Ser Lys Thr Ile Asp Pro Lys Val Ala Phe 85 90 95Pro Arg Arg Ala Gln Pro Lys Met Val Thr Arg Thr Lys Lys Ile Phe 100 105 110Val Gly Gly Leu Ser Val Asn Thr Thr Val Glu Asp Val Lys Gln Tyr 115 120 125Phe Glu Gln Phe Gly Lys Val Asp Asp Ala Met Leu Met Phe Asp Lys 130 135 140Thr Thr Asn Arg His Arg Gly Phe Gly Phe Val Thr Phe Glu Ser Glu145 150 155 160Asp Ile Val Glu Lys Val Cys Glu Ile His Phe His Glu Ile Asn Asn 165 170 175Lys Met Val Glu Cys Lys Lys Ala Gln Pro Lys Glu Val Met Ser Pro 180 185 190Thr Gly Ser Ala Arg Gly Arg Ser Arg Val Met Pro Tyr Gly Met Asp 195 200 205Ala Phe Met Leu Gly Ile Gly Met Leu Gly Tyr Pro Gly Phe Gln Ala 210 215 220Thr Thr Tyr Ala Ser Arg Ser Tyr Thr Gly Leu Ala Pro Gly Tyr Thr225 230 235 240Tyr Gln Phe Pro Glu Phe Arg Val Glu Arg Thr Pro Leu Pro Ser Ala 245 250 255Pro Val Leu Pro Glu Leu Thr Ala Ile Pro Leu Thr Ala Tyr Gly Pro 260 265 270Met Ala Ala Ala Ala Ala Ala Ala Ala Val Val Arg Gly Thr Gly Ser 275 280 285His Pro Trp Thr Met Ala Pro Pro Pro Gly Ser Thr Pro Ser Arg Thr 290 295 300Gly Gly Phe Leu Gly Thr Thr Ser Pro Gly Pro Met Ala Glu Leu Tyr305 310 315 320Gly Ala Ala Asn Gln Asp Ser Gly Val Ser Ser Tyr Ile Ser Ala Ala 325 330 335Ser Pro Ala Pro Ser Thr Gly Phe Gly His Ser Leu Gly Gly Pro Leu 340 345 350Ile Ala Thr Ala Phe Thr Asn Gly Tyr His 355 36027987DNAHomo sapiens 27atggaggcaa atgggagcca aggcacctcg ggcagcgcca acgactccca gcacgacccc 60ggtaaaatgt ttatcggtgg actgagctgg cagacctcac cagatagcct tagagactat 120tttagcaaat ttggagaaat tagagaatgt atggtcatga gagatcccac tacgaaacgc 180tccagaggct tcggtttcgt cacgttcgca gacccagcaa gtgtagataa agtattaggt 240cagccccacc atgagttaga ttccaagacg attgacccca aagttgcatt tcctcgtcga 300gcgcaaccca agatggtcac aagaacaaag aaaatatttg taggcgggtt atctgcgaac 360acagtagtgg aagatgtaaa gcaatatttc gagcagtttg gcaaggtgga agatgcaatg 420ctgatgtttg ataaaactac caacaggcac agagggtttg gctttgtcac ttttgagaat 480gaagatgttg tggagaaagt ctgtgagatt catttccatg aaatcaataa taaaatggta 540gaatgtaaga aagctcagcc gaaagaagtc atgttcccac ctgggacaag aggccgggcc 600cggggactgc cttacaccat ggacgcgttc atgcttggca tggggatgct gggatatccc 660aacttcgtgg cgacctatgg ccgtggctac cccggatttg ctccaagcta tggctatcag 720ttcccaggct tcccagcagc ggcttatgga ccagtggcag cagcggcggt ggcggcagca 780agaggatcag gctccaaccc ggcgcggccc ggaggcttcc cgggggccaa cagcccagga 840cctgtcgccg atctctacgg ccctgccagc caggactccg gagtggggaa ttacataagt 900gcggccagcc cacagccggg ctcgggcttc ggccacggca tagctggacc tttgattgca 960acggccttta caaatggata ccattga
98728328PRTHomo sapiens 28Met Glu Ala Asn Gly Ser Gln Gly Thr Ser Gly Ser Ala Asn Asp Ser1 5 10 15Gln His Asp Pro Gly Lys Met Phe Ile Gly Gly Leu Ser Trp Gln Thr 20 25 30Ser Pro Asp Ser Leu Arg Asp Tyr Phe Ser Lys Phe Gly Glu Ile Arg 35 40 45Glu Cys Met Val Met Arg Asp Pro Thr Thr Lys Arg Ser Arg Gly Phe 50 55 60Gly Phe Val Thr Phe Ala Asp Pro Ala Ser Val Asp Lys Val Leu Gly65 70 75 80Gln Pro His His Glu Leu Asp Ser Lys Thr Ile Asp Pro Lys Val Ala 85 90 95Phe Pro Arg Arg Ala Gln Pro Lys Met Val Thr Arg Thr Lys Lys Ile 100 105 110Phe Val Gly Gly Leu Ser Ala Asn Thr Val Val Glu Asp Val Lys Gln 115 120 125Tyr Phe Glu Gln Phe Gly Lys Val Glu Asp Ala Met Leu Met Phe Asp 130 135 140Lys Thr Thr Asn Arg His Arg Gly Phe Gly Phe Val Thr Phe Glu Asn145 150 155 160Glu Asp Val Val Glu Lys Val Cys Glu Ile His Phe His Glu Ile Asn 165 170 175Asn Lys Met Val Glu Cys Lys Lys Ala Gln Pro Lys Glu Val Met Phe 180 185 190Pro Pro Gly Thr Arg Gly Arg Ala Arg Gly Leu Pro Tyr Thr Met Asp 195 200 205Ala Phe Met Leu Gly Met Gly Met Leu Gly Tyr Pro Asn Phe Val Ala 210 215 220Thr Tyr Gly Arg Gly Tyr Pro Gly Phe Ala Pro Ser Tyr Gly Tyr Gln225 230 235 240Phe Pro Gly Phe Pro Ala Ala Ala Tyr Gly Pro Val Ala Ala Ala Ala 245 250 255Val Ala Ala Ala Arg Gly Ser Gly Ser Asn Pro Ala Arg Pro Gly Gly 260 265 270Phe Pro Gly Ala Asn Ser Pro Gly Pro Val Ala Asp Leu Tyr Gly Pro 275 280 285Ala Ser Gln Asp Ser Gly Val Gly Asn Tyr Ile Ser Ala Ala Ser Pro 290 295 300Gln Pro Gly Ser Gly Phe Gly His Gly Ile Ala Gly Pro Leu Ile Ala305 310 315 320Thr Ala Phe Thr Asn Gly Tyr His 32529756DNAHomo sapiens 29atggccgatc tgacatcggt gctcacttct gttatgtttt ctccctctag taaaatgttt 60atcggtggac tgagctggca gacctcacca gatagcctta gagactattt tagcaaattt 120ggagaaatta gagaatgtat ggtcatgaga gatcccacta cgaaacgctc cagaggcttc 180ggtttcgtca cgttcgcaga cccagcaagt gtagataaag tattaggtca gccccaccat 240gagttagatt ccaagacgat tgaccccaaa gttgcatttc ctcgtcgagc gcaacccaag 300atggtcacaa gaacaaagaa aatatttgta ggcgggttat ctgcgaacac agtagtggaa 360gatgtaaagc aatatttcga gcagtttggc aaggtggaag atgcaatgct gatgtttgat 420aaaactacca acaggcacag agggtttggc tttgtcactt ttgagaatga agatgttgtg 480gagaaagtct gtgagattca tttccatgaa atcaataata aaatggtaga atgtaagaaa 540gctcagccga aagaagtcat gttcccacct gggacaagag gccgggcccg gggactgcct 600tacaccatgg acgcgttcat gcttggcatg gggatgctgg gatatcccaa cttcgtggcg 660acctatggcc gtggctaccc cggatttgct ccaagctatg gctatcagtt cccagactat 720ttgccggttt cacaagacat aatttttatc aactag 75630251PRTHomo sapiens 30Met Ala Asp Leu Thr Ser Val Leu Thr Ser Val Met Phe Ser Pro Ser1 5 10 15Ser Lys Met Phe Ile Gly Gly Leu Ser Trp Gln Thr Ser Pro Asp Ser 20 25 30Leu Arg Asp Tyr Phe Ser Lys Phe Gly Glu Ile Arg Glu Cys Met Val 35 40 45Met Arg Asp Pro Thr Thr Lys Arg Ser Arg Gly Phe Gly Phe Val Thr 50 55 60Phe Ala Asp Pro Ala Ser Val Asp Lys Val Leu Gly Gln Pro His His65 70 75 80Glu Leu Asp Ser Lys Thr Ile Asp Pro Lys Val Ala Phe Pro Arg Arg 85 90 95Ala Gln Pro Lys Met Val Thr Arg Thr Lys Lys Ile Phe Val Gly Gly 100 105 110Leu Ser Ala Asn Thr Val Val Glu Asp Val Lys Gln Tyr Phe Glu Gln 115 120 125Phe Gly Lys Val Glu Asp Ala Met Leu Met Phe Asp Lys Thr Thr Asn 130 135 140Arg His Arg Gly Phe Gly Phe Val Thr Phe Glu Asn Glu Asp Val Val145 150 155 160Glu Lys Val Cys Glu Ile His Phe His Glu Ile Asn Asn Lys Met Val 165 170 175Glu Cys Lys Lys Ala Gln Pro Lys Glu Val Met Phe Pro Pro Gly Thr 180 185 190Arg Gly Arg Ala Arg Gly Leu Pro Tyr Thr Met Asp Ala Phe Met Leu 195 200 205Gly Met Gly Met Leu Gly Tyr Pro Asn Phe Val Ala Thr Tyr Gly Arg 210 215 220Gly Tyr Pro Gly Phe Ala Pro Ser Tyr Gly Tyr Gln Phe Pro Asp Tyr225 230 235 240Leu Pro Val Ser Gln Asp Ile Ile Phe Ile Asn 245 250
* * * * *
References
C00001
C00002
C00003
C00004
C00005
C00006
C00007
C00008
C00009
C00010
C00011
C00012
C00013

C00014

C00015

C00016

C00017

C00018

C00019

C00020

C00021

C00022

C00023

C00024

C00025

C00026

C00027

C00028

C00029

C00030

D00001

D00002

D00003

D00004

D00005

D00006
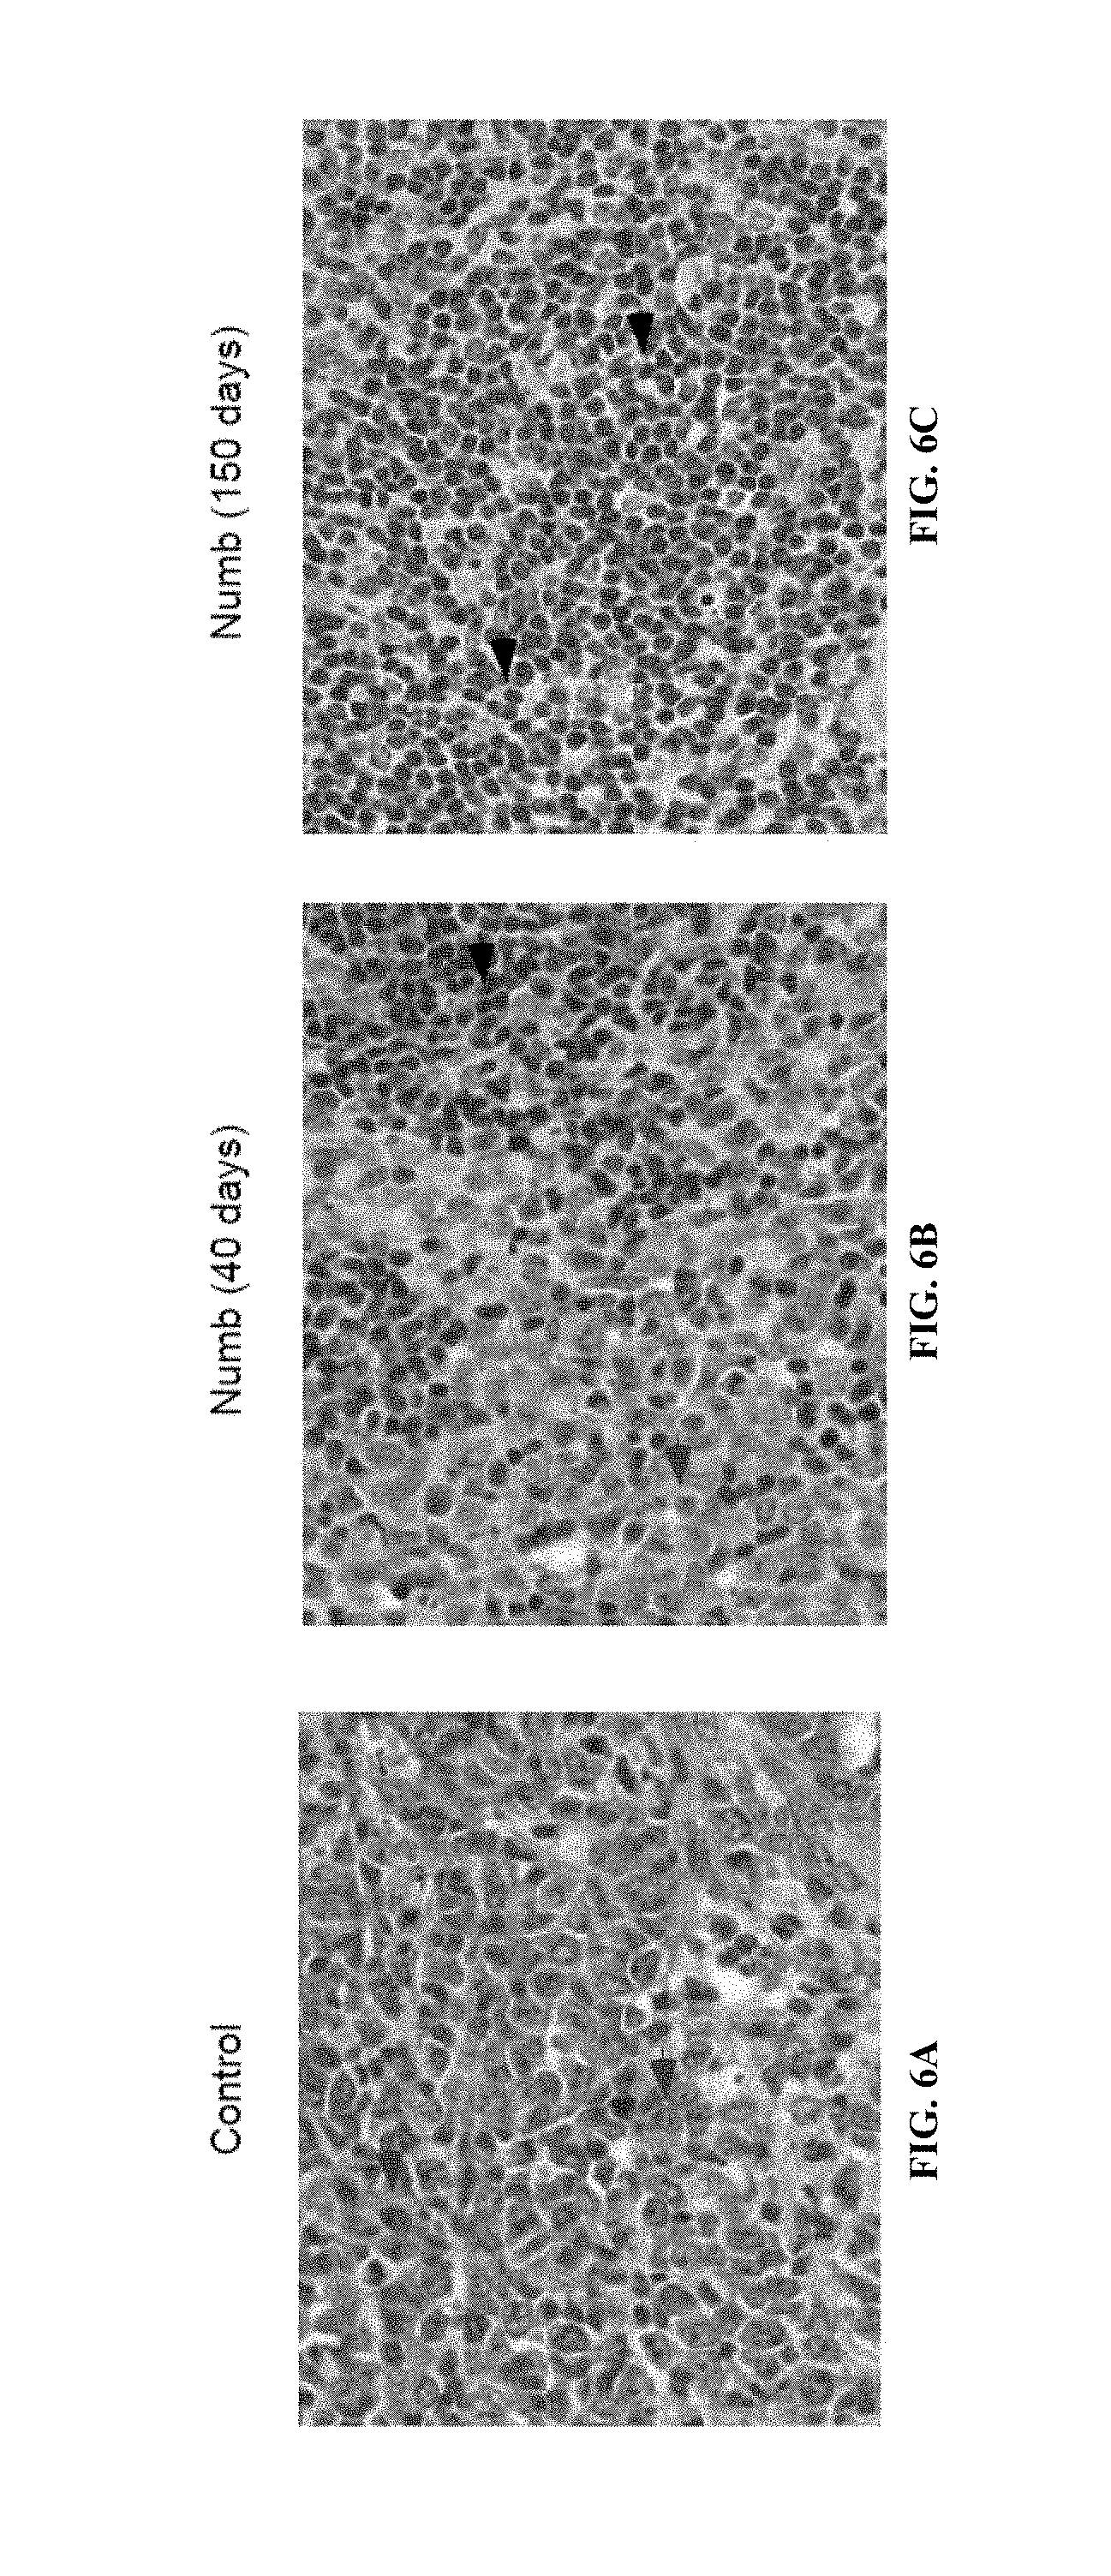
D00007

D00008

D00009

D00010

D00011

D00012

D00013

D00014
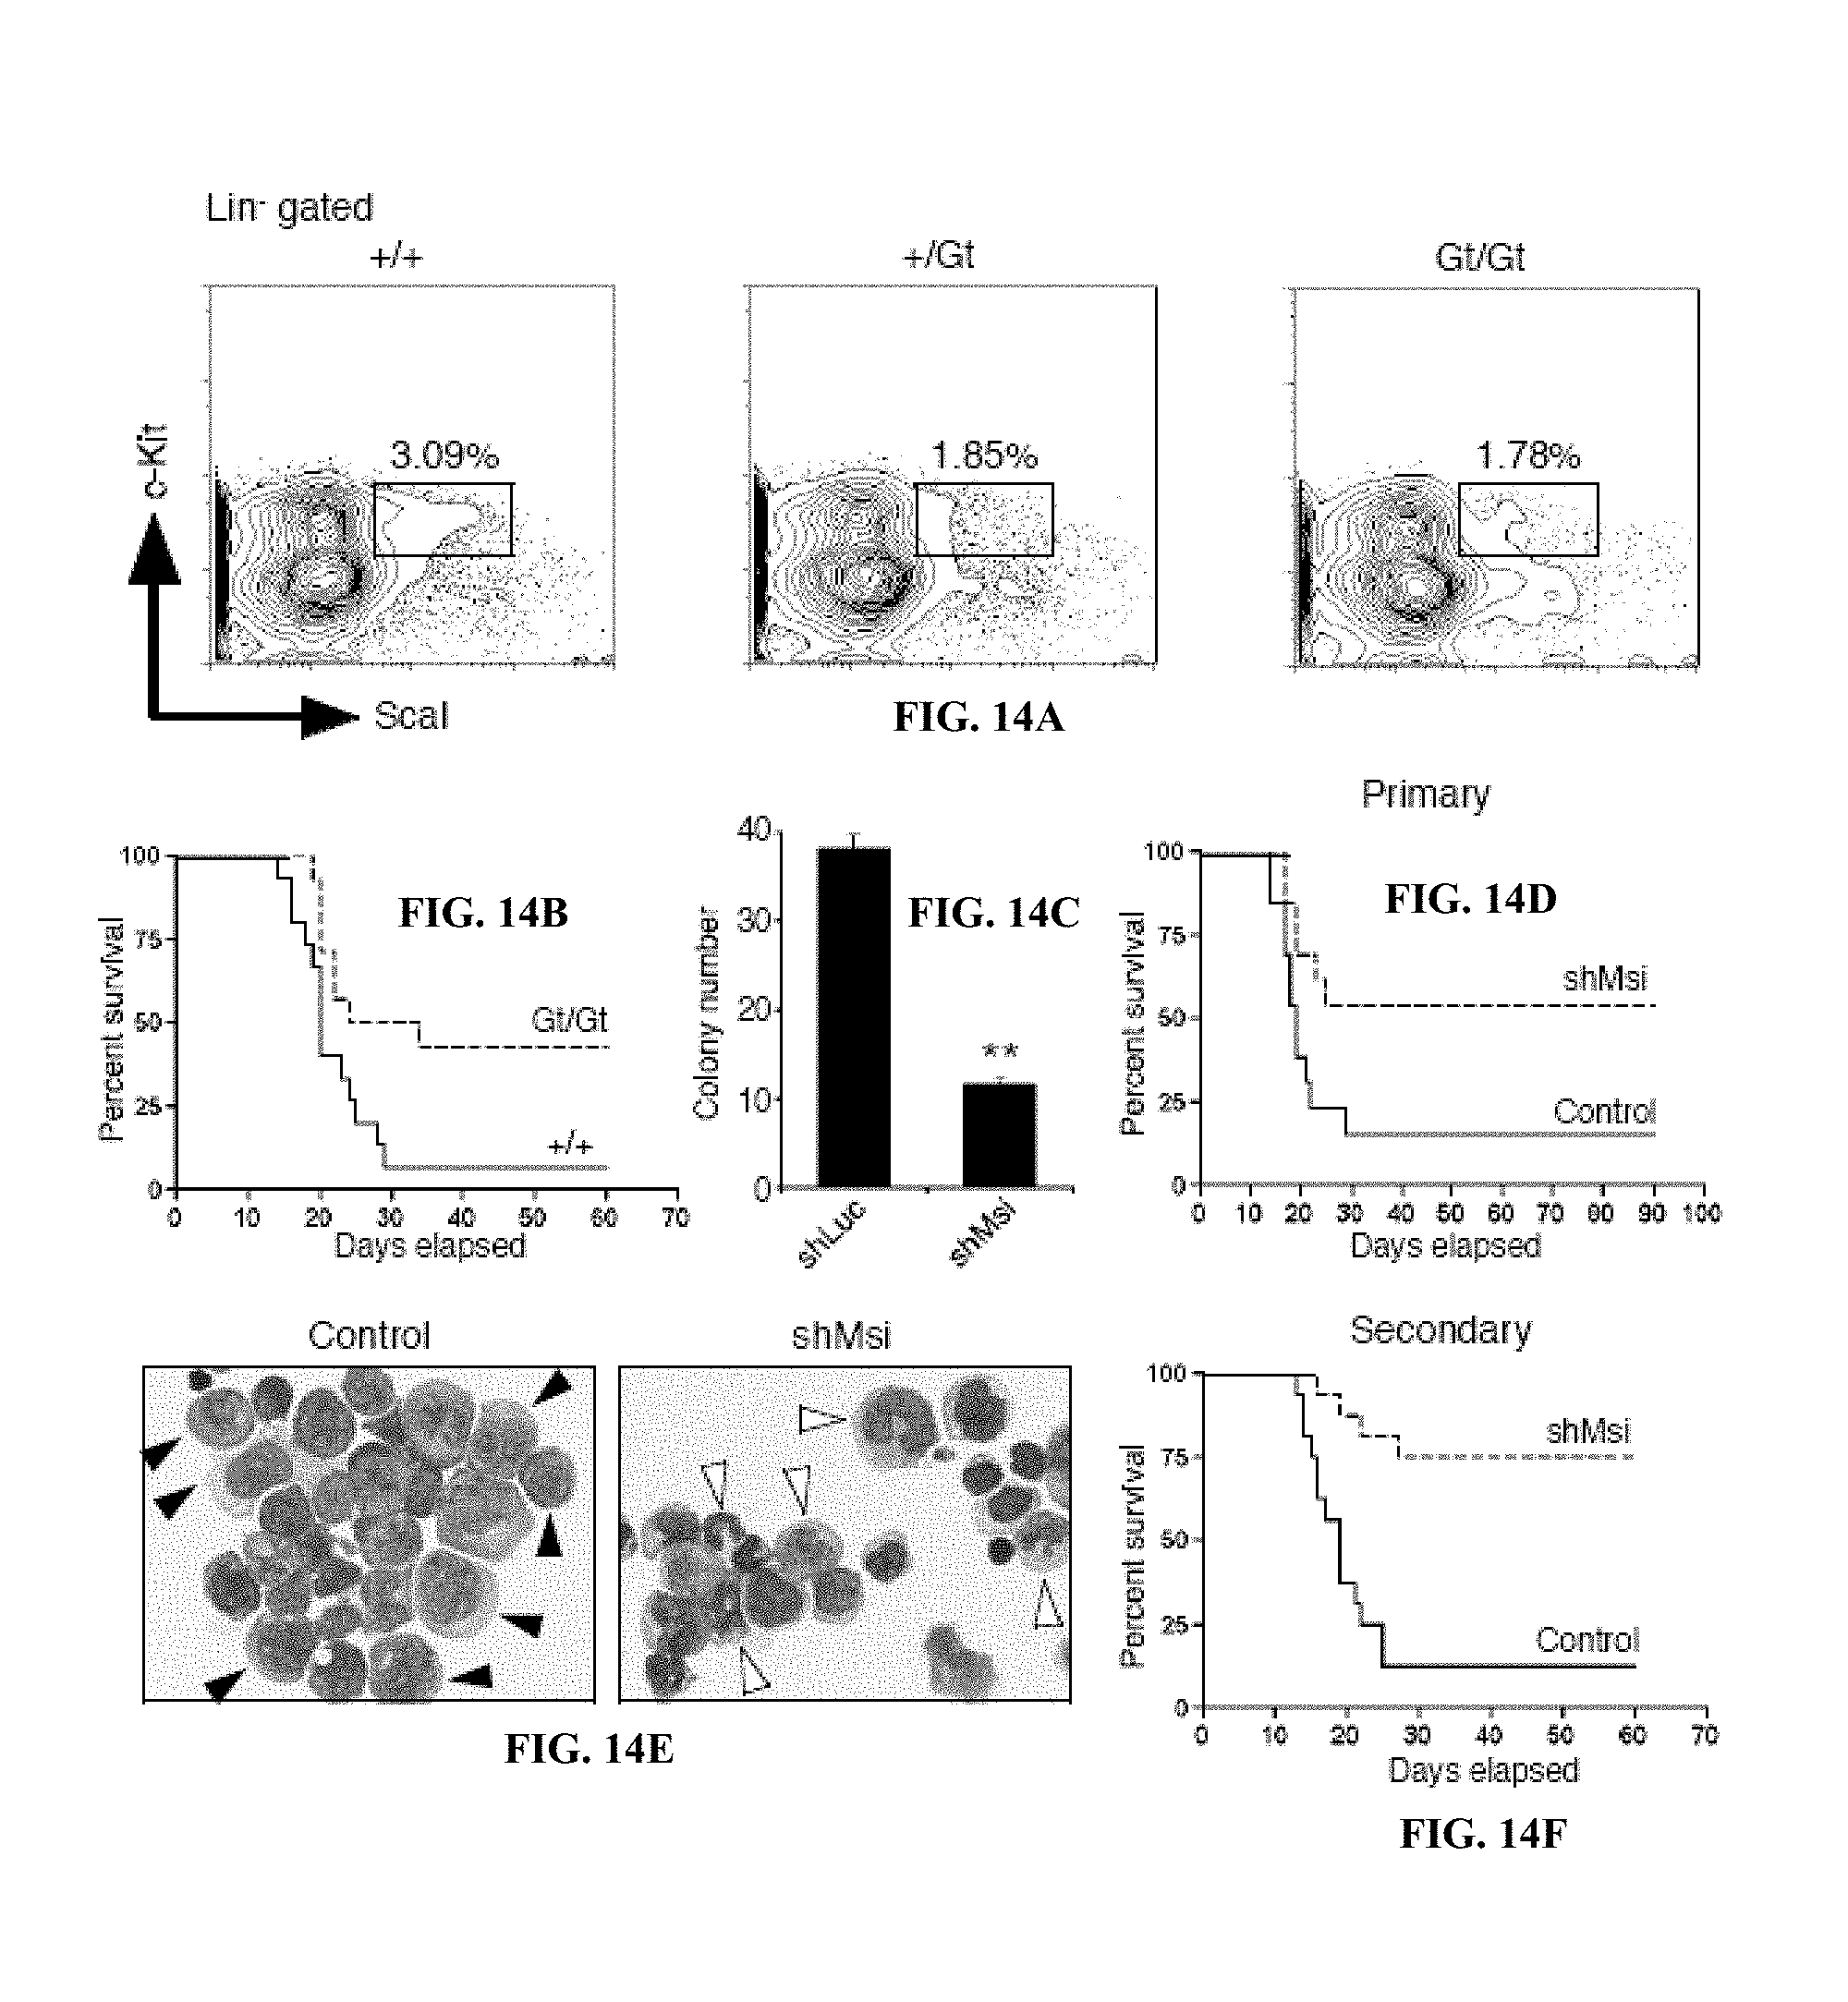
D00015

D00016

D00017

D00018

D00019

S00001
XML
uspto.report is an independent third-party trademark research tool that is not affiliated, endorsed, or sponsored by the United States Patent and Trademark Office (USPTO) or any other governmental organization. The information provided by uspto.report is based on publicly available data at the time of writing and is intended for informational purposes only.
While we strive to provide accurate and up-to-date information, we do not guarantee the accuracy, completeness, reliability, or suitability of the information displayed on this site. The use of this site is at your own risk. Any reliance you place on such information is therefore strictly at your own risk.
All official trademark data, including owner information, should be verified by visiting the official USPTO website at www.uspto.gov. This site is not intended to replace professional legal advice and should not be used as a substitute for consulting with a legal professional who is knowledgeable about trademark law.