Methods of treating a subject with a high gleason score prostate cancer
Skog , et al.
U.S. patent number 10,301,681 [Application Number 14/909,916] was granted by the patent office on 2019-05-28 for methods of treating a subject with a high gleason score prostate cancer. This patent grant is currently assigned to Exosome Diagnostics, Inc.. The grantee listed for this patent is Exosome Diagnostics, Inc.. Invention is credited to Mikkel Noerholm, Johan Karl Olov Skog.


View All Diagrams
| United States Patent | 10,301,681 |
| Skog , et al. | May 28, 2019 |
Methods of treating a subject with a high gleason score prostate cancer
Abstract
The present invention relates generally to the field of biomarker analysis, particularly determining gene expression signatures from urine samples. The disclosure provides compositions, kits and methods for diagnosing a prostate disorder such as prostate cancer in a male subject.
| Inventors: | Skog; Johan Karl Olov (Charlestown, MA), Noerholm; Mikkel (Gauting, DE) | ||||||||||
|---|---|---|---|---|---|---|---|---|---|---|---|
| Applicant: |
|
||||||||||
| Assignee: | Exosome Diagnostics, Inc.
(Waltham, MA) |
||||||||||
| Family ID: | 51358123 | ||||||||||
| Appl. No.: | 14/909,916 | ||||||||||
| Filed: | August 6, 2014 | ||||||||||
| PCT Filed: | August 06, 2014 | ||||||||||
| PCT No.: | PCT/US2014/049946 | ||||||||||
| 371(c)(1),(2),(4) Date: | February 03, 2016 | ||||||||||
| PCT Pub. No.: | WO2015/021158 | ||||||||||
| PCT Pub. Date: | February 12, 2015 |
Prior Publication Data
| Document Identifier | Publication Date | |
|---|---|---|
| US 20160177401 A1 | Jun 23, 2016 | |
Related U.S. Patent Documents
| Application Number | Filing Date | Patent Number | Issue Date | ||
|---|---|---|---|---|---|
| 61862630 | Aug 6, 2013 | ||||
| Current U.S. Class: | 1/1 |
| Current CPC Class: | C12Q 1/6886 (20130101); C12Q 2600/118 (20130101); C12Q 2600/158 (20130101); C12Q 2600/112 (20130101); C12Q 2600/16 (20130101) |
| Current International Class: | C12Q 1/6886 (20180101); G01N 33/48 (20060101) |
References Cited [Referenced By]
U.S. Patent Documents
| 5219727 | June 1993 | Wang et al. |
| 5538871 | July 1996 | Nuovo et al. |
| 5556773 | September 1996 | Yourno |
| 5582981 | December 1996 | Toole et al. |
| 5639606 | June 1997 | Willey |
| 5840867 | November 1998 | Toole et al. |
| 6004755 | December 1999 | Wang |
| 6525154 | February 2003 | Shea et al. |
| 6812023 | November 2004 | Lamparski et al. |
| 6893837 | May 2005 | Slamon et al. |
| 6899863 | May 2005 | Dhellin et al. |
| 6913879 | July 2005 | Schena |
| 6994960 | February 2006 | Foote et al. |
| 7074563 | July 2006 | Koster |
| 7186512 | March 2007 | Martienssen et al. |
| 7198893 | April 2007 | Koster et al. |
| 7198923 | April 2007 | Abrignani et al. |
| 7332553 | February 2008 | Sellergren et al. |
| 7364848 | April 2008 | Van Beuningen et al. |
| 7378245 | May 2008 | Liu |
| 7384589 | June 2008 | Hart et al. |
| 2010/0196426 | August 2010 | Skog et al. |
| 2010/0298151 | November 2010 | Taylor et al. |
| 2011/0003704 | January 2011 | Skog et al. |
| 2011/0053157 | March 2011 | Skog et al. |
| 2348042 | Feb 2009 | RU | |||
| WO 2003/023065 | Mar 2003 | WO | |||
| WO 2003/050290 | Jun 2003 | WO | |||
| WO 2006/066965 | Jun 2006 | WO | |||
| WO 2006/113590 | Oct 2006 | WO | |||
| WO 2009/100029 | Aug 2009 | WO | |||
| WO 2011/009104 | Jan 2011 | WO | |||
| WO 2011/031877 | Mar 2011 | WO | |||
| WO 2011/031892 | Mar 2011 | WO | |||
| WO 2013/028788 | Feb 2013 | WO | |||
| WO-2013028788 | Feb 2013 | WO | |||
| WO 2015/021158 | Feb 2015 | WO | |||
Other References
|
Sood et al. (PDEF in Prostate Cancer, 2012, vol. 72, No. 6. pp. 592-596: Pub. Date: Jul. 27, 2011). (Year: 2011). cited by examiner . Abravaya, et al., "Detection of point mutations with a modified ligase chain reaction (Gap-LCR)." Nucleic Acids Research (1995); 23(4): 675-682. cited by applicant . Al-Nedawi, et al., "Intercellular transfer of the oncogenic receptor EGFRvIII by microvesicles derived from tumour cells." Nat Cell Biol. (2008); 10(5): 619-624. cited by applicant . Balzar, et al., "The biology of the 17-1A antigen (Ep-CAM)." J Mol Med. (1999); 77(10): 699-712. cited by applicant . Bossi et al., "Molecularly imprinted polymers for the recognition of proteins: The state of the art." Biosensors and Bioelectronics (2007); 22(6): 1131-1137. cited by applicant . Bussemakers, et al., "DD3::A New Prostate-specific Gene, Highly Overexpressed in Prostate Cancer." Cancer Research (1999) 59(23): 5975-5979. cited by applicant . Cadieux, et al., "Genome-wide Hypomethylation in Human Glioblastomas Associated with Specific Copy Number Alteration, Methylenetetrahydrofolate Reductase Allele Status, and Increased Proliferation." Cancer Research (2006); 66(17): 8469-8476. cited by applicant . Chen, et al., "Microfluidic isolation and transcriptome analysis of serum microvesicles." Lab Chip (2010); 10(4): 505-511. cited by applicant . Cheruvanky, et al., "Rapid isolation of urinary exosomal biomarkers using a nanomembrane ultrafiltration concentrator." Am J Physiol Renal Physiol. (2007); 292: F1657-F1661. cited by applicant . Cortez and Calin, "MicroRNA identification in plasma and serum: a new tool to diagnose and monitor diseases." Expert Opinion on Biological Therapy (2009); 9(6): 703-711. cited by applicant . Cotton, et al., "Reactivity of cytosine and thymine in single-base-pair mismatches with hydroxylamine and osmium tetroxide and its application to the study of mutations." Proc Natl Acad Sci U S A (1988); 85 (12): 4397-4401. cited by applicant . Cowell and Lo, "Application of Oligonucleotides Arrays for Coincident Comparative Genomic Hybridization, Ploidy Status and Loss of Heterozygosity Studies in Human Cancers." Methods in Molecular Biology (2009); 556 (5): 47-65. cited by applicant . Decision to Grant in European Patent Application No. 14752743.6 dated Feb. 20, 2018, 95 pages. cited by applicant . Deras, et al., "PCA3: A Molecular Urine Assay for Predicting Prostate Biopsy Outcome." The Journal of Urology (2008); 179(4): 1587-1592. cited by applicant . Diehl, et al. "Circulating mutant DNA to assess tumor dynamics." Nature Medicine (2008); 14: 985-990. cited by applicant . Fischer and Lerman, "[11] Two-dimensional electrophoretic separation of restriction enzyme fragments of DNA." Methods in Enzymology (1979); 68: 183-191. cited by applicant . Fischer and Lerman, "Length-independent separation of DNA restriction fragments in two-dimensional gel electrophoresis." Cell (1979); 16(1): 191-200. cited by applicant . Furusato, et al., "Mapping of TMPRSS2-ERG fusions in the context of multi-focal prostate cancer." Modern Pathology(2008); 21: 67-75. cited by applicant . Ghadersohi, et al., "Prostate-derived Ets transcription factor (PDEF) is a potential prognostic marker in patients with prostate cancer." The Prostate (2011); 71(11): 1178-1188. cited by applicant . Guatelli, et al., "Isothermal, in vitro amplification of nucleic acids by a multienzyme reaction modeled after retroviral replication." Proc Natl Acad Sci U S A (1990); 87: 1874-1878. cited by applicant . Hahn, "Molecular biology of double-minute chromosomes." BioEssays (1993); 15(7): 477-484. cited by applicant . Hessels, et al., "Detection of TMPRSS2-ERG Fusion Transcripts and Prostate Cancer Antigen 3 in Urinary Sediments May Improve Diagnosis of Prostate Cancer." Clinical Cancer Research (2007); 13(17): 5103-5108. cited by applicant . International Preliminary Report on Patentability for International Application No. PCT/US2014/049946, dated Feb. 9, 2016, 7 pages. cited by applicant . International Search Report and Written Opinion for International Application No. PCT/US2014/049946, dated Dec. 5, 2014, 11 pages. cited by applicant . Itadani, et al., "Can Systems Biology Understand Pathway Activation? Gene Expression Signatures as Surrogate Markers for Understanding the Complexity of Pathway Activation." Current Genomics (2008); 9(5): 349-360. cited by applicant . Johnson, et al., "Surface-immobilized peptide aptamers as probe molecules for protein detection." Anal Chem. (2008); 80(4): 978-983. cited by applicant . Kan and Dozy, "Antenatal diagnosis of sickle-cell anaemia by DNA analysis of amniotic-fluid cells." The Lancet (1978); 312(8096): 910-912. cited by applicant . Kan and Dozy, "Polymorphism of DNA sequence adjacent to human .beta.-globin structural gene: relationship to sickle mutation." PNAS (1978); 75(11): 5631-5635,. cited by applicant . Kristensen and Hansen, "PCR-Based Methods for Detecting Single-Locus DNA Methylation Biomarkers in Cancer Diagnostics, Prognostics, and Response to Treatment." Clinical Chemistry (2009); 55(8): 1471-1483. cited by applicant . Kwoh, et al., "Transcription-based amplification system and detection of amplified human immunodeficiency virus type 1 with a bead-based sandwich hybridization format." Proc Natl Acad Sci U S A (1989); 86: 1173-1177. cited by applicant . Landegren, et al., "A ligase-mediated gene detection technique." Science (1988); 241(4869): 1077-1080. cited by applicant . Laxman, et al., "A First-Generation Multiplex Biomarker Analysis of Urine for the Early Detection of Prostate Cancer." Cancer Research (2008); 68(3): 645-649. cited by applicant . Laxman, et al., "Noninvasive Detection of TMPRSS2:ERG Fusion Transcripts in the Urine of Men with Prostate Cancer." Neoplasia (2006); 8(10): 885-888. cited by applicant . Li, et al., "Replacing PCR with COLD-PCR enriches variant DNA sequences and redefines the sensitivity of genetic testing." Nature Medicine (2008); 14(5): 579-584. cited by applicant . Li, et al., "BEAMing up for detection and quantification of rare sequence variants." Nat Methods. (2006); 3(2): 95-97. cited by applicant . Lipson, et al., "Quantification of the yeast transcriptome by single-molecule sequencing." Nature Biotechnology (2009); 27(7): 652-658. cited by applicant . Mattick, et al., "RNA regulation: a new genetics?" Nature Reviews Genetics (2004); 5: 316-323. cited by applicant . McKiernan, et al., "A novel urine exosome gene expression assay to predict high-grade prostate cancer at initial biopsy." JAMA Oncol. (2016); 2(7): 882-889. cited by applicant . Miele, et al., "Autocatalytic replication of a recombinant RNA." J Mol Biol. (1983); 171: 281-295. cited by applicant . Miranda, et al., "Nucleic acids within urinary exosomes/microvesicles are potential biomarkers for renal disease." Kidney International (2010); 78(2): 191-199. cited by applicant . Myers, et al., "Detection of single base substitutions by ribonuclease cleavage at mismatches in RNA:DNA duplexes." Science (1985); 230(4731): 1242-1246. cited by applicant . Nakazawa, et al., "UV and skin cancer: specific p53 gene mutation in normal skin as a biologically relevant exposure measurement." Proc Natl Acad Sci U S A. (1994); 91: 360-364. cited by applicant . Nguyen, et al., "A Panel of TMPRSS2:ERG Fusion Transcript Markers for Urine-Based Prostate Cancer Detection with High Specificity and Sensitivity." European Urology (2011); 59(3): 407-414. cited by applicant . Nilsson, et al., "Prostate cancer-derived urine exosomes: a novel approach to biomarkers for prostate cancer." British Journal of Cancer (2009); 100: 1603-1607. cited by applicant . Novakova, et al., "MicroRNA involvement in glioblastoma pathogenesis." Biochemical and Biophysical Research Communications (2009); 386(1): 1-5. cited by applicant . Orita, et al., "Detection of polymorphisms of human DNA by gel electrophoresis as single-strand conformation polymorphisms." PNAS (1989); 86(8): 2766-2770. cited by applicant . Orozco and Lewis, "Flow cytometric analysis of circulating microparticles in plasma." Cytometry A (2010); 77A(6): 502-514. cited by applicant . Palanisamy, et al., "Rearrangements of the RAF kinase pathway in prostate cancer, gastric cancer and melanoma." Nature Medicine (2010); 16(7): 793-798. cited by applicant . Parsons, et al., "An Integrated Genomic Analysis of Human Glioblastoma Multiforme." Science (2008); 321(5897): 1807-1812. cited by applicant . Petrovics, et al., "Frequent overexpression of ETS-related gene-1 (ERG1) in prostate cancer transcriptome." Oncogene (2005); 24: 3847-3852. cited by applicant . Raposo, et al., "B lymphocytes secrete antigen-presenting vesicles." Journal of Experimental Medicine (1996); 183: 1161-1172. cited by applicant . Rice, et al., "Evaluation of the ETS-Related Gene mRNA in Urine for the Detection of Prostate Cancer." Clinical Cancer Research (2010); 16(5): 1572-1576. cited by applicant . Rostad, et al., "TMPRSS2:ERG fusion transcripts in urine from prostate cancer patients correlate with a less favorable prognosis." APMIS (2009); 117(8): 575-582. cited by applicant . Salami, et al., "Combining urinary detection of TMPRSS2:ERG and PCA3 with serum PSA to predict diagnosis of prostate cancer." Urologic Oncology (2013); 31(5): 566-571. cited by applicant . Skog, et al., "Glioblastoma microvesicles transport RNA and proteins that promote tumour growth and provide diagnostic biomarkers." Nature Cell Biology (2008); 10(12): 1470-1476. cited by applicant . Sood, et al., "PDEF in Prostate Cancer." The Prostate (2012); 72(6): 592-596. cited by applicant . Steemers, et al., "Whole-genome genotyping with the single-base extension assay." Nature Methods (2006); 3: 31-33. cited by applicant . Taylor and Gercel-Taylor, "MicroRNA signatures of tumor-derived exosomes as diagnostic biomarkers of ovarian cancer." Gynecol Oncol. (2008); 110: 13-21. cited by applicant . Ting, et al., "Aberrant Overexpression of Satellite Repeats in Pancreatic and Other Epithelial Cancers." Science (2011); 331(6017): 593-596. cited by applicant . Tomlins, et al., "Recurrent Fusion of TMPRSS2 and ETS Transcription Factor Genes in Prostate Cancer." Science (2005); 310(5748): 644-648. cited by applicant . Tomlins, et al., "Urine TMPRSS2:ERG Fusion Transcript Stratifies Prostate Cancer Risk in Men with Elevated Serum PSA." Science Translational Medicine (2011); 3(94): 94ra72. cited by applicant . Velculescu, et al., "Serial Analysis of Gene Expression." Science (1995); 270(5235): 484-487. cited by applicant . Went, et al., "Frequent EpCam protein expression in human carcinomas." Hum Pathol. (2004); 35: 122-128. cited by applicant . Wong, et al., "Real-time PCR for mRNA quantitation." Biotechniques (2005); 39(1): 75-85. cited by applicant . Zhang, et al., "Survivin mediates resistance to antiandrogen therapy in prostate cancer." Oncogene (2005); 24: 2474-2482. cited by applicant. |
Primary Examiner: Whaley; Pablo S
Attorney, Agent or Firm: Cooley LLP Elrifi; Ivor R. Pavao; Matthew
Parent Case Text
RELATED APPLICATIONS
This application is a national stage application, filed under 35 U.S.C. .sctn. 371, of PCT Application No. PCT/US2014/049946, filed Aug. 6, 2014, which claims the benefit of U.S. Provisional Application No. 61/862,630, filed Aug. 6, 2013, the contents of which are incorporated herein by reference in their entirety.
Claims
What is claimed is:
1. A method of treating a subject with a high risk for a high Gleason score prostate cancer, wherein the high Gleason score prostate cancer has a Gleason score of greater than 6, the method comprising the steps of: a. extracting one or more mRNAs from a urine sample from the subject; b. detecting the level of mRNA expression of PCA3, ERG and SPDEF; c. normalizing the level of mRNA expression of PCA3 and ERG to SPDEF; d. computing an EXO106 score using the formula: .times..function..times..times..times..times..times..function..times..tim- es..times..times..times..times. ##EQU00003## wherein ERG copies is the level of mRNA expression of ERG, PCA3 copies is the level of mRNA expression of PCA3 and SPDEF copies is the level of SPDEF mRNA expression; e. comparing the EXO106 Score to a predetermined cutoff value; and f. treating the subject at a high risk for a high Gleason score prostate cancer when the EXO106 score is greater than the predetermined cutoff value.
2. The method of claim 1, wherein the urine sample is the first 40 mL voided from the bladder of the subject.
3. The method of claim 1, wherein the urine sample is the first 20 mL voided from the bladder of the subject.
4. The method of claim 1, wherein the predetermined cutoff value is 10.
5. The method of claim 1, wherein extracting one or more mRNAs in step (a) comprises: a. isolating a microvesicle fraction from the urine sample; and b. extracting one or more mRNAs from the microvesicle fraction.
6. The method of claim 5, wherein the step of isolating the microvesicle fraction comprises processing the sample to remove cells and cell debris and concentrating the microvesicle fraction by exposing the microvesicle fraction to ultrafiltration or a filtration concentrator, and washing the microvesicle fraction prior to extracting the one or more nucleic acids from the microvesicle fraction.
7. The method of claim 6, wherein the method further comprises adding an RNase inhibitor to the microvesicle fraction prior to extracting the one or more nucleic acids from the microvesicle fraction.
Description
INCORPORATION OF SEQUENCE LISTING
The contents of the text file named "EXOS016N01US_ST25.txt," which was created on Feb. 2, 2016 and is 56.0 KB in size, are hereby incorporated by reference in their entirety.
FIELD OF INVENTION
The present invention relates generally to the field of biomarker analysis, particularly determining gene expression signatures from urine samples.
BACKGROUND
Increasing knowledge of the genetic and epigenetic changes occurring in cancer cells provides an opportunity to detect, characterize, and monitor tumors by analyzing tumor-related nucleic acid sequences and profiles. These changes can be observed by detecting any of a variety of cancer-related biomarkers. Various molecular diagnostic assays are used to detect these biomarkers and produce valuable information for patients, doctors, clinicians and researchers. So far, these assays primarily have been performed on cancer cells derived from surgically removed tumor tissue or from tissue obtained by biopsy.
However, the ability to perform these tests using a bodily fluid sample is oftentimes more desirable than using a patient tissue sample. A less invasive approach using a bodily fluid sample has wide ranging implications in terms of patient welfare, the ability to conduct longitudinal disease monitoring, and the ability to obtain expression profiles even when tissue cells are not easily accessible, e.g., in the prostate gland. For these samples, the collection methods previously disclosed often required a digital rectal exam (DRE) or prostate massage to enable enough prostate-derived cellular fluid to enter the urine. Samples collected without DRE or prostate massage showed a lower detection rate of these biomarkers.
Accordingly, there exists a need for new, noninvasive methods of detecting biomarkers, for example, biomarkers in urinary microvesicles, to aid in diagnosis, prognosis, monitoring, or therapy selection for a disease or other medical condition of the prostate gland. In particular, there exists a need for noninvasive methods that do not require DRE or prostate massage prior to urine sample collection and do not require a sample preparation step involving isolation of a cellular pellet from urine samples.
SUMMARY OF THE INVENTION
The present invention provides methods of detecting one or more biomarkers in urine microvesicles to aid in diagnosis, prognosis, monitoring, or therapy selection for a disease such as, for example, cancer, particularly a disease or other medical condition of the prostate gland in a subject. The method includes obtaining a random urine sample from a subject; extracting mRNA from the sample, detecting the level of mRNA expression of PCA3 and ERG; and normalizing the level of mRNA expression of PCA3 and ERG to KLK3 or SPDEF. The method further comprises computing an output value for the normalized mRNA expression levels of PCA3 and ERG using a predetermined formula; and comparing the output value to a predetermined cutoff value that was determined using an ROC curve generated based on a combination of PCA3 and ERG to distinguish a subject at a high risk for cancer from a subject with a low risk for cancer. Furthermore, these methods allow for the identification of a subject at high risk of a high Gleason score (GS) prostate cancer (e.g., a Gleason score (GS)>6), as compared to a subject at low risk of a high GS prostate cancer. For example, subjects having an output value that is greater than, or in some embodiments, equal to, the predetermined cutoff value that was determined using an ROC curve generated based on a combination of PCA3 and ERG, are at high risk for a high GS prostate cancer, while subjects having an output value that is lower than the predetermined cutoff value are a low risk for a high GS prostate cancer. Thus, these methods are useful for distinguishing between subjects at high risk for a high GS prostate cancer from subjects at a low risk of a high GS prostate cancer.
The invention provides a method for diagnosis, prognosis, monitoring or therapy selection in a subject in need thereof, consisting of the steps of obtaining a random urine sample from the subject; extracting one or more mRNAs from the sample; detecting a level of expression of PCA3 and ERG mRNAs; normalizing the level of expression of PCA3 and ERG mRNAs to a reference gene; computing an output value by applying the normalized expression levels of PCA3 and ERG mRNAs to a predetermined formula; and comparing the output value to a predetermined cutoff value that was determined using an ROC curve generated based on a combination of PCA3 mRNA and ERG mRNA to distinguish a subject with a high risk of recurrence of cancer from a subject with a low risk of recurrence of cancer.
The methods of the disclosure use a urine sample from a male subject, e.g., a sample between 25-40 mL of first catch urine. The methods of the disclosure do not require a digital rectal exam (DRE), and preferably, the urine samples used in these methods are samples from patients who have not been subjected to DRE.
In some embodiments, the PSA level of the patient is detected. In some embodiments, the methods are used to analyze samples from patients in the PSA "gray zone" having a PSA level that is between 2-10 ng/mL. In some embodiments, the patient is a human male subject that is at least 50 years old.
In some embodiments, the patient sample is analyzed using the following algorithm:
.times..times..times..times..times..function..times..times..times..times.- .times..function..times..times..times..times..times..times. ##EQU00001##
In some embodiments, the EXO106 score is used to predict whether a patient is at a low risk of prostate cancer or a high risk of prostate cancer. For example, patients having an EXO106 score that is less than 10 as calculated using the algorithm above are identified as having a low risk of prostate cancer, and patients having an EXO106 score that is 10 or higher are identified as having a higher risk of prostate cancer.
In some embodiments, the EXO106 score is used to predict whether a patient is at a low risk of a high Gleason score (GS) prostate cancer or a high risk of a high GS prostate cancer. For example, patients having an EXO106 score that is less than 10 as calculated using the algorithm above are identified as having a low risk of a high GS prostate cancer, and patients having an EXO106 score that is 10 or higher are identified as having a higher risk of a high GS prostate cancer.
In some embodiments, the methods of the present invention further include isolating a microvesicle fraction from the random urine sample and extracting the nucleic acids from the microvesicle fraction.
In some embodiments, the method further comprises further includes detecting the level of expression of AMACR, BIRC5, HOXC6, and/or SPARCL1. In some embodiments, the method further comprises further includes detecting the level of expression of AMACR, BIRC5, HOXC6, and/or SPARCL1 and computing the output value based on the combination of PCA3, ERG, and AMACR, BIRC5, HOXC6, and/or SPARCL1.
In any of the foregoing methods, a known quantity of Q-beta particles is added to the urine sample prior to nucleic acid extraction. The expression level of the Q-beta target gene is detected and the detected expression level is compared to the known quantity of Q-beta particles.
The invention provides a method for diagnosis, prognosis, monitoring or therapy selection for a medical condition in a subject, comprising the steps of: (a) obtaining a microvesicle fraction from a urine sample from a subject; (b) extracting one or more nucleic acids from the microvesicle fraction; and (c) analyzing the extracted nucleic acids to detect the presence, absence or level of expression of PCA3 and ERG. These markers are detectable at a stable level in fresh urine samples, as well as urine samples that have been previously frozen and thawed. Preferably, the urine samples are 40 mL or 20 mL. More preferably, the urine samples are the first 40 mL voided from the bladder or the first 20 mL voided from the bladder. Detection of these markers is reproducible across samples from the same patient, as well as across samples from various patients.
The invention also provides a method further comprising the step of detecting a level of expression of a reference gene and determining a normalized, relative expression level of the biomarkers, wherein the relative expression level of the biomarkers is a ratio between the level of biomarker expression to the level of reference gene expression, and wherein the subject is identified as suffering from, or being at an increased risk for, a medical condition, such as cancer, when the relative expression level of the biomarker is greater than a cutoff level of biomarker expression. In some embodiments, the biomarker is at least ERG and PCA3. In some embodiments, the biomarker is at least ERG and PCA3 and at least one other biomarker selected from the group consisting of AMACR, BIRC5, HOXC6, SPARCL1, and combinations thereof. In some embodiments, the reference gene is a prostate-specific gene. In some embodiments, the reference gene is KLK3 or SPDEF, or a combination thereof. In some embodiments, the reference gene is KLK3. In some embodiments, the reference gene is a housekeeping gene, such as, for example GAPDH.
In some embodiments, the Area Under the Curve (AUC) derived from the Receiver Operator Characteristic (ROC) curve for each level of biomarker or a score created by a combination of biomarkers is computed using biomarker results from both controls and patients with disease. In some preferred embodiments, the AUC value derived from the ROC curve for each level of biomarker or a score created by a combination of biomarkers is greater than 0.5, 0.6, 0.7, or 0.8. Preferably, the AUC value is greater than 0.7. One skilled in the art would readily be able to maximize diagnostic accuracy of the biomarker level or combination of biomarkers by implementing a cut-off analysis that takes into account the sensitivity, specificity, negative predictive value (NPV), positive predictive value (PPV), positive likelihood ratio (PLR) and negative likelihood ratio (NLR) necessary for clinical utility. Biomarker results or a combination of biomarker results are analyzed in any of a variety of ways. In some embodiments, the results are analyzed using a univariate, or single-variable analysis (SV). In some embodiments, the results are analyzed using multivariate analysis (MV). Examples of both SV and MV analyses of biomarkers and/or biomarker cohorts are shown in the Tables below.
In some embodiments, the reference gene is a prostate-specific gene. In some embodiments, the reference gene is KLK3 or SPDEF, or a combination thereof. In some embodiments, the reference gene is a housekeeping gene, for example GAPDH.
The biomarkers and combinations of biomarkers (also referred to herein as biomarker cohorts) are useful in methods of diagnosis, prognosis, monitoring or therapy selection for a medical condition such as cancers, including aggressive cancers. In some embodiments, the biomarkers and combinations of biomarkers are useful in correlating biomarker and/or cohort expression with the likelihood that the subject is suffering from or is at risk for suffering from an aggressive cancer based on the level of expression and/or pattern of expression detected. In some embodiments, the biomarkers and combinations of biomarkers are useful in correlating biomarker and/or cohort expression with the likelihood that the subject is suffering from or is at risk for suffering from a recurrence of a cancer based on the level of expression and/or pattern of expression detected. In some embodiments, the biomarkers and combinations of biomarkers are useful in correlating biomarker and/or cohort expression with the likelihood that the subject is suffering from or is at risk for suffering from an aggressive prostate cancer based on the level of expression and/or pattern of expression detected. The biomarkers and combinations of biomarkers are useful in correlating biomarker and/or cohort expression with the Gleason score of a subject. For example, the expression level of a biomarker and/or cohort can be used to identify a subject's Gleason score based on the level of expression and/or pattern of expression detected. For example, the expression level of a PCA3 and ERG can be used to identify that a subject's Gleason score is greater than 6. The biomarkers and combinations of biomarkers are useful in correlating biomarker and/or cohort expression with the likelihood that the subject will need a radical prostatectomy based on the level of expression and/or pattern of expression detected.
In some embodiments, the medical condition is cancer. For example, the cancer is prostate cancer. In some embodiments, the cancer is a urogenital cancer, for example, a prostate cancer, a renal cancer, a bladder cancer, or a metastatic cancer that has spread to urogenital organs. In some embodiments, the cancer is an aggressive cancer. For example, in some embodiments, the medical condition is an aggressive prostate cancer, an aggressive renal cancer, or an aggressive bladder cancer.
The subject in need thereof is suffering from or at risk of suffering from cancer, for example, an aggressive cancer. In some embodiments, the subject is suffering from or is at risk of suffering from prostate cancer. In some embodiments, the subject is not at risk of suffering from prostate cancer. In some embodiments, the subject has prostate cancer and has been assigned a particular Gleason score. For example, in some embodiments, the subject has been assigned a Gleason score that is greater than or equal to 7. In some embodiments, the subject has been assigned a Gleason score that is greater than or equal to 1, 2, 3, 4, 5, 6, 7, 8 or 9. In some embodiments, the subject has been assigned a Gleason score that is in the range of 1 to 10, 1 to 9, 1 to 8, 1 to 7, 1 to 6, 1 to 5, 1 to 4, 1 to 3, 1 to 2, 2 to 10, 2 to 9, 2 to 8, 2 to 7, 2 to 6, 2 to 5, 2 to 4, 2 to 3, 3 to 10, 3 to 9, 3 to 8, 3 to 7, 3 to 6, 3 to 5, 3 to 4, 4 to 10, 4 to 9, 4 to 8, 4 to 7, 4 to 6, 4 to 5, 5 to 10, 5 to 9, 5 to 8, 5 to 7, 5 to 6, 6 to 10, 6 to 9, 6 to 8, 6 to 7, 7 to 10, 7 to 9, 7 to 8, 8 to 10, 8 to 9 or 9 to 10. In some embodiments, the subject has undergone a prostatectomy, for example, a radical prostatectomy or is at risk for having to undergo a prostatectomy, for example, a radical prostatectomy.
The subject is, for example, a male human subject with clinical suspicion for prostate cancer, e.g., based on a PSA test result and/or a suspicious DRE. In some embodiments, the subject has a clinical history of negative biopsy. In some embodiments, the subject does not have a clinical history of negative biopsy. In some embodiments, the subject has been recommended for a repeat biopsy. In some embodiments, the subject has been recommended for an initial, or first-time, biopsy.
In some embodiments, the subject has been recommended or scheduled for prostatectomy. In some embodiments, the subject has histologically confirmed acinar type (i.e., typical) prostate cancer. In some embodiments, the prostate cancer is localized. In some embodiments, the prostate cancer is locally advanced.
In some embodiments, the subject is not suffering from and/or is not suspected of suffering from a disease such as an infectious disease, e.g., hepatitis (all types) and/or HIV. In some embodiments, the subject has no history of concurrent renal and/or bladder tumor. In some embodiments, the subject has not received previously or is not concurrently receiving any form of neoadjuvant or focal therapy for prostate cancer. In some embodiments, the subject has not received previously or is not concurrently receiving any form of neoadjuvant or focal therapy, including androgen derivation therapy, within six months of providing the urine sample.
The markers and/or combinations of markers described herein are useful in a variety of kits, for example, a diagnostic kit which can be used to test urine samples from a variety of patients. In some embodiments, the urine sample is concentrated, e.g., using a filtration concentration step, before testing the sample with the kit. The results can be processed using any of a variety of methods, including apparatuses for fast qPCR readout.
BRIEF DESCRIPTION OF THE DRAWINGS
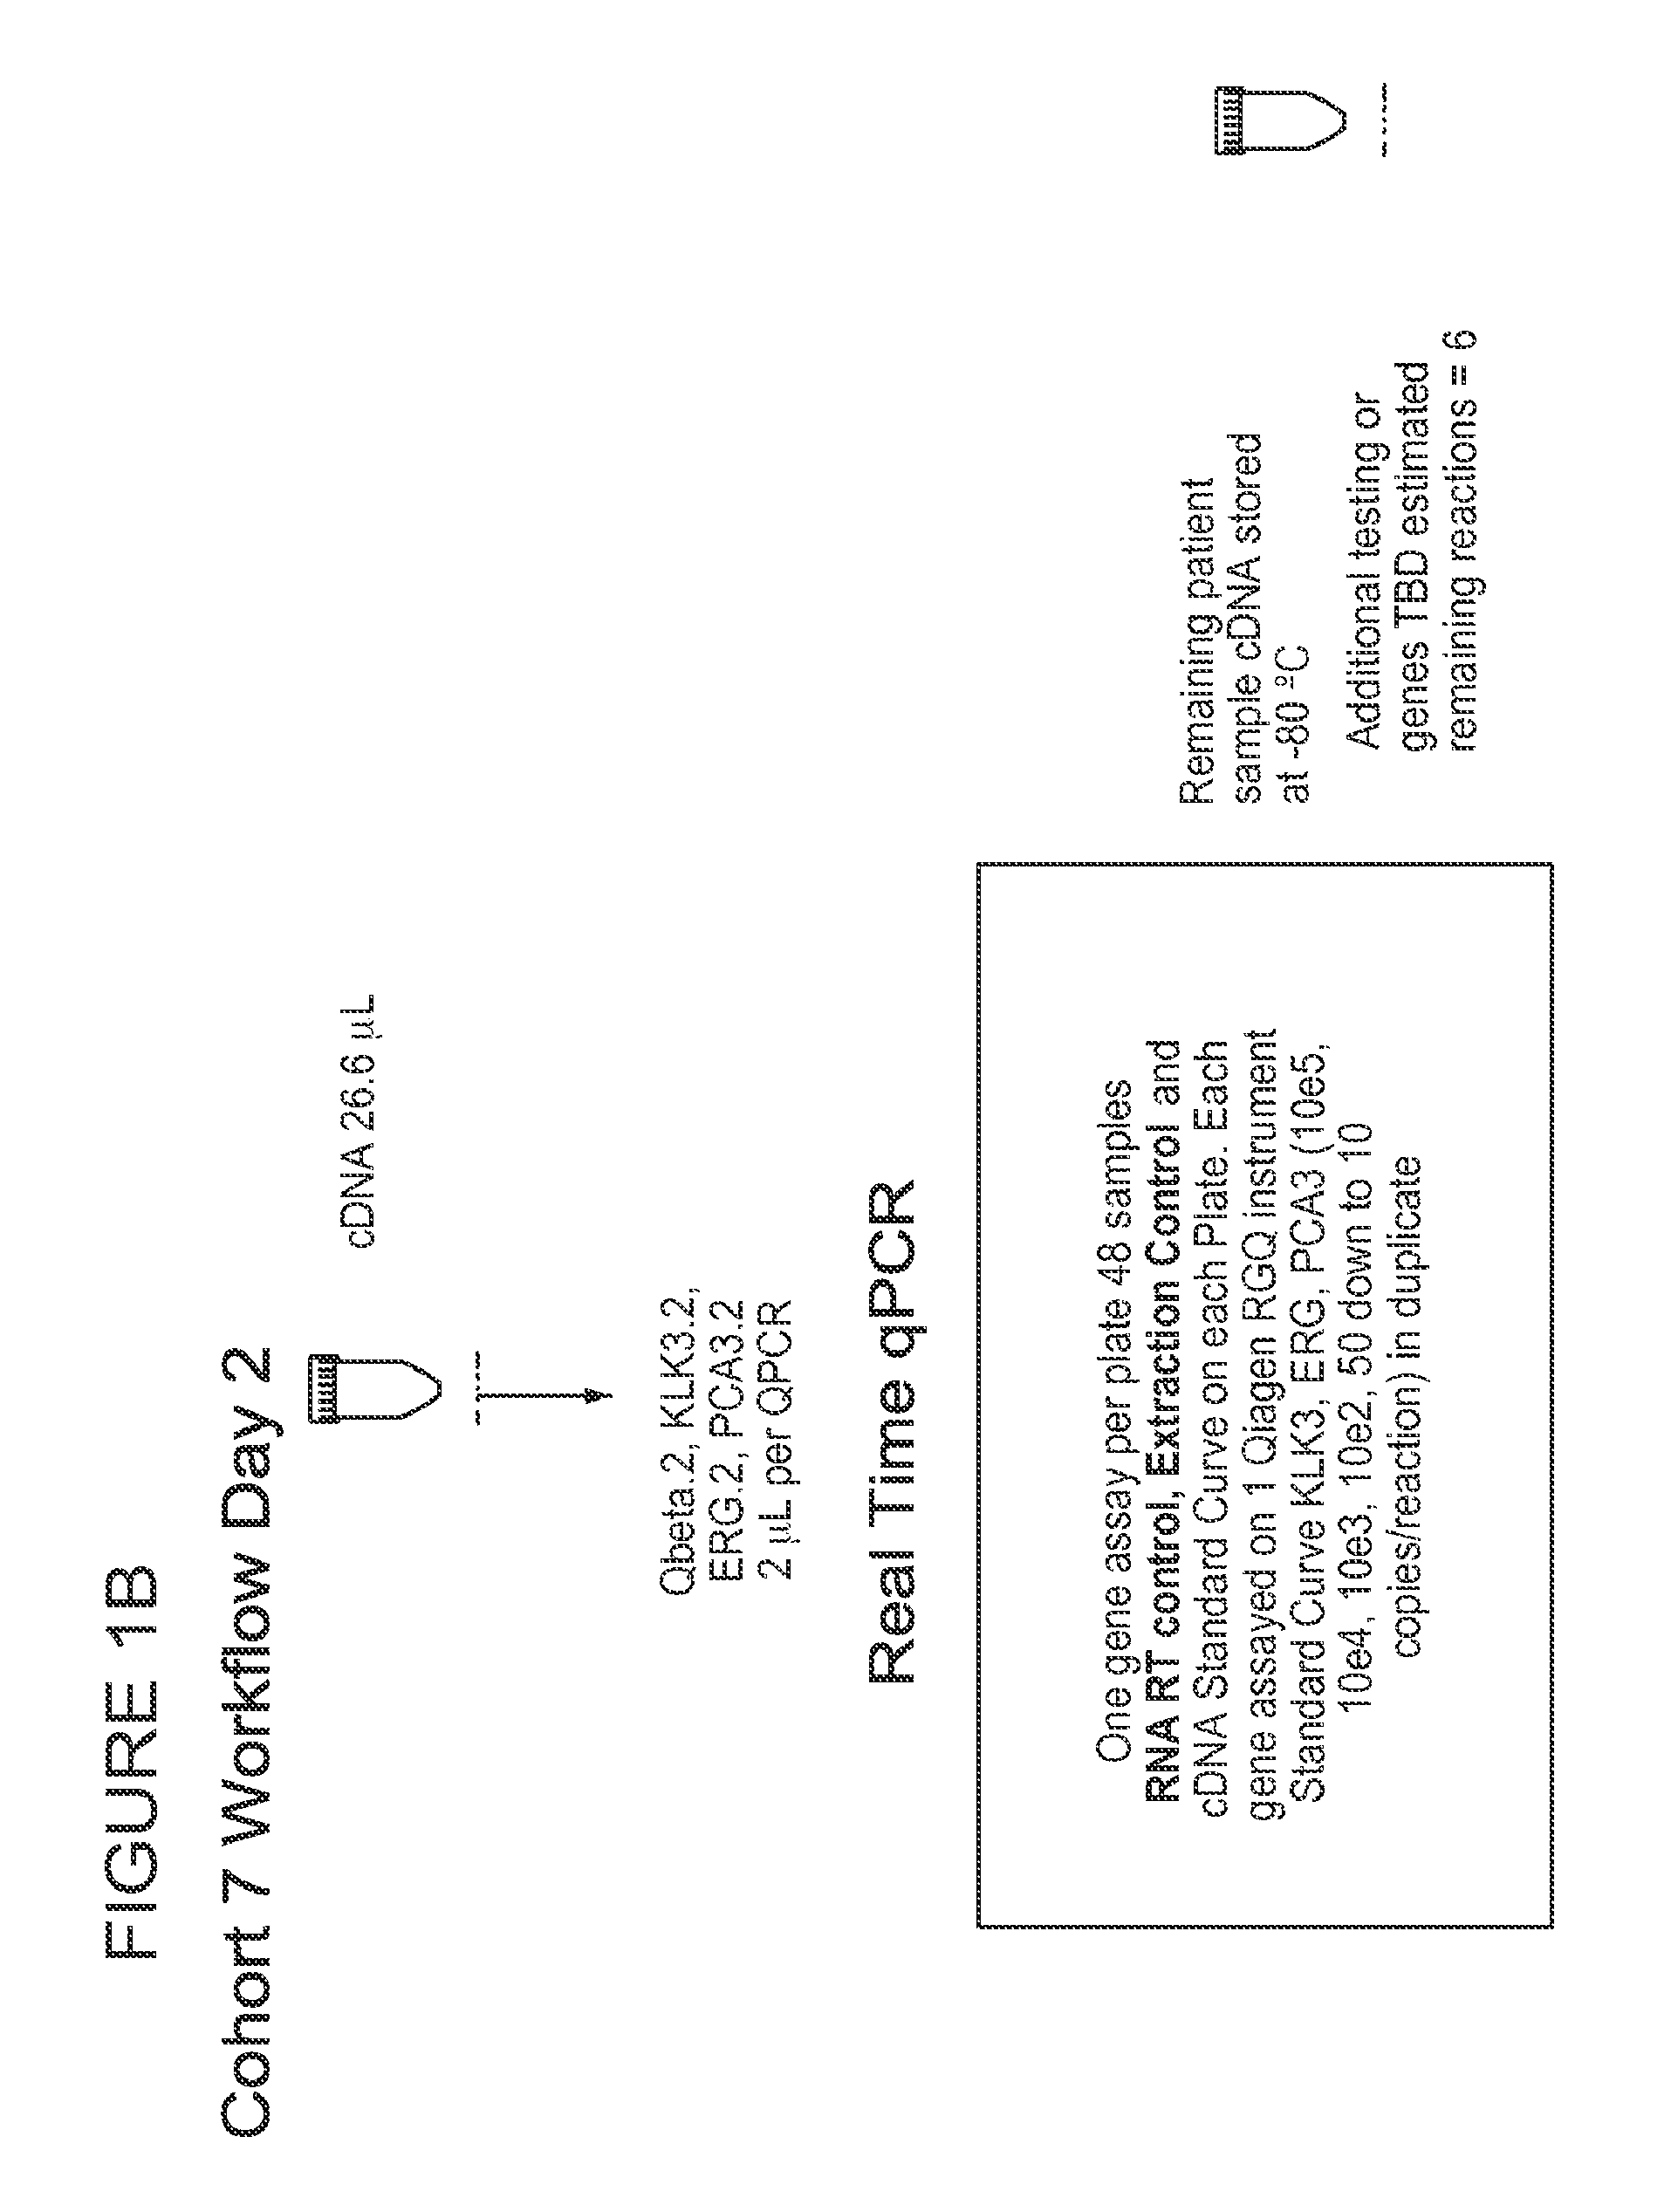
FIGS. 1A and 1B are a series of schematic illustrations depicting the lab workflow for analysis of the Patient Cohort 7 samples on Day 1 (FIG. 1A) and Day 2 (FIG. 1B).
FIG. 2A is a graph depicting the density distribution of Qbeta Ct values detected for 258 Cohort 7 samples. The Y axis represents the density and the X axis represents the Ct value.
FIG. 2B is a box plot depicting the density distribution of Qbeta Ct values detected for the 258 Cohort 7 samples. The X axis represents the Ct value.
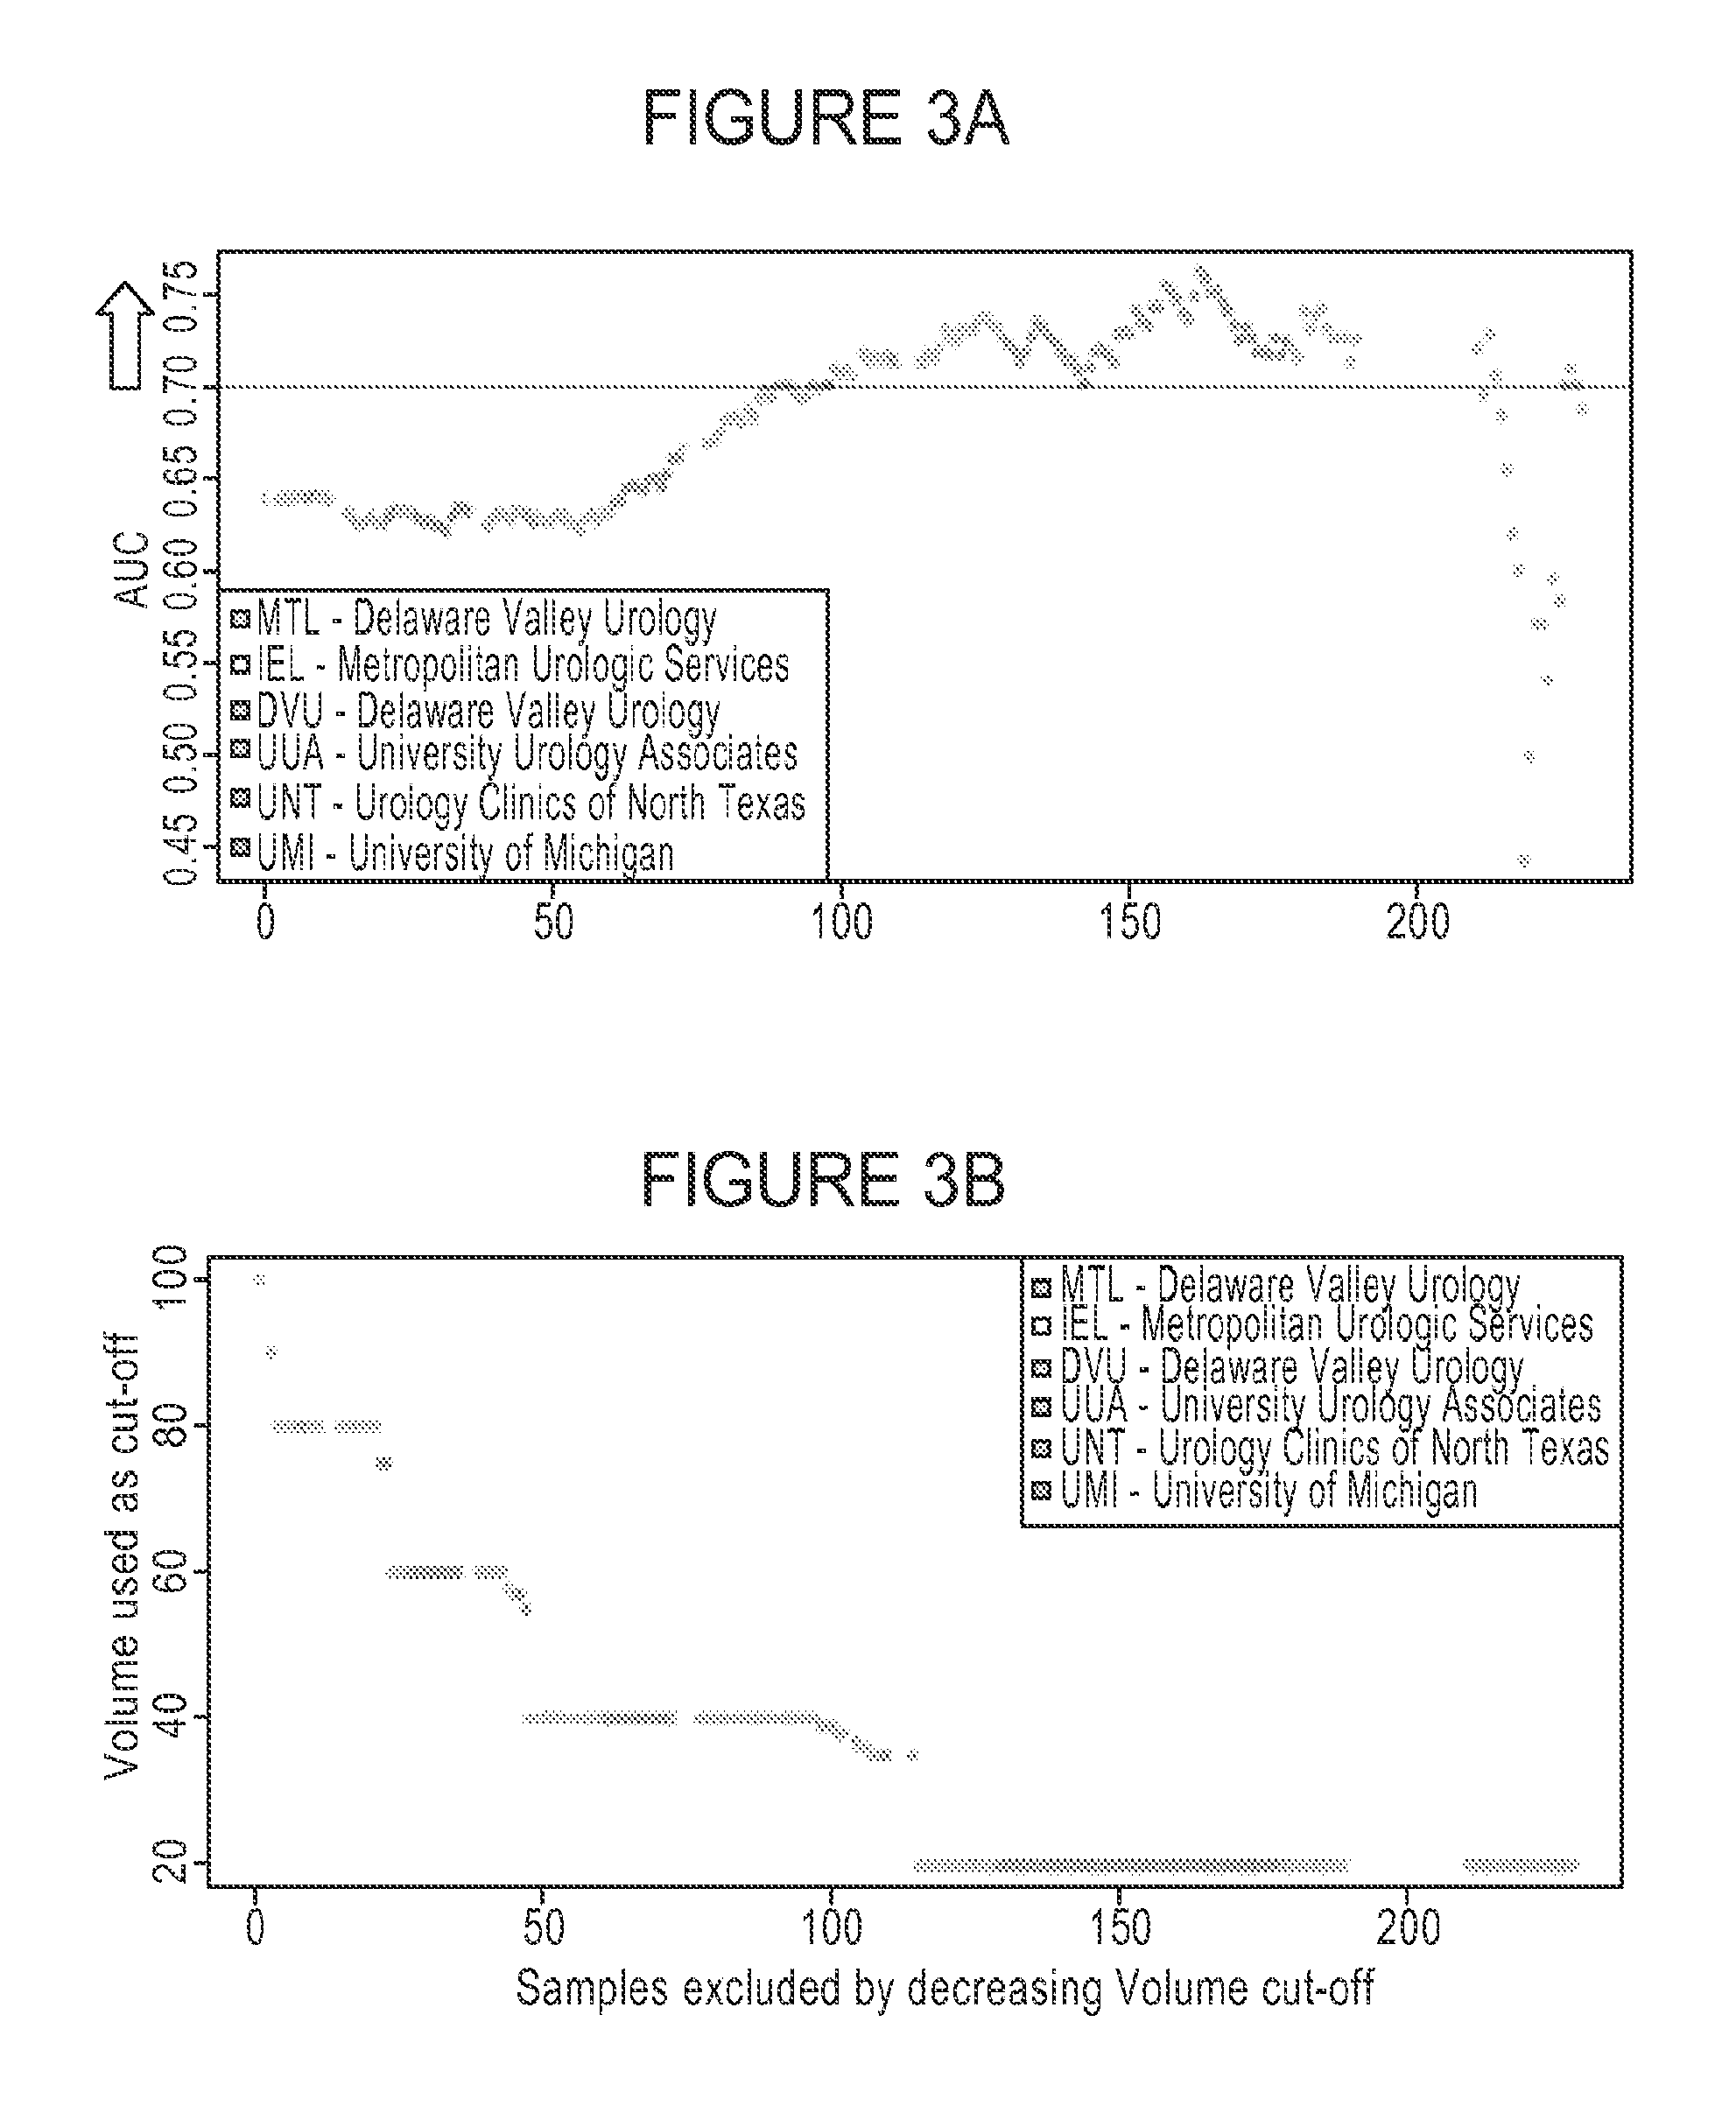
FIGS. 3A and 3B are two graphs depicting the correlation of PCA3 AUC values when normalized to KLK3 to the sample volume for each patient in Cohort 7. In FIG. 3A, the Y axis represents AUC values and the X axis represents each sample in Cohort 7. In FIG. 3B, the Y axis shows the sample volume and the X axis represents each sample in Cohort 7. The key designates the clinical sites where each sample is from. FIGS. 3A and 3B demonstrate that PCA3 AUC (normalized to KLK3) improves from <0.65 to >0.7 when donation volumes are restricted to only 20 mL. These figures demonstrate that the AUC was highly dependent on the sample volume.
FIGS. 4A and 4B are two graphs depicting ROC curves based on ERG expression analysis normalized to KLK3 (non-imputed, FIG. 4A) and PCA3 (FIG. 4B) expression analysis normalized to KLK3 with samples from Patient Cohort 7 in which the sample volume was less than or equal to 100 mL (N=236). In both figures, the X axis represents specificity; the Y axis represents sensitivity.
FIGS. 5A and 5B are two graphs depicting ROC curves based on ERG expression analysis normalized to KLK3 (non-imputed, FIG. 5A) and PCA3 (FIG. 5B) expression analysis normalized to KLK3 with samples from Patient Cohort 7 in which the sample volume was less than or equal to 40 mL (N=189). In both figures, the X axis represents specificity; the Y axis represents sensitivity.
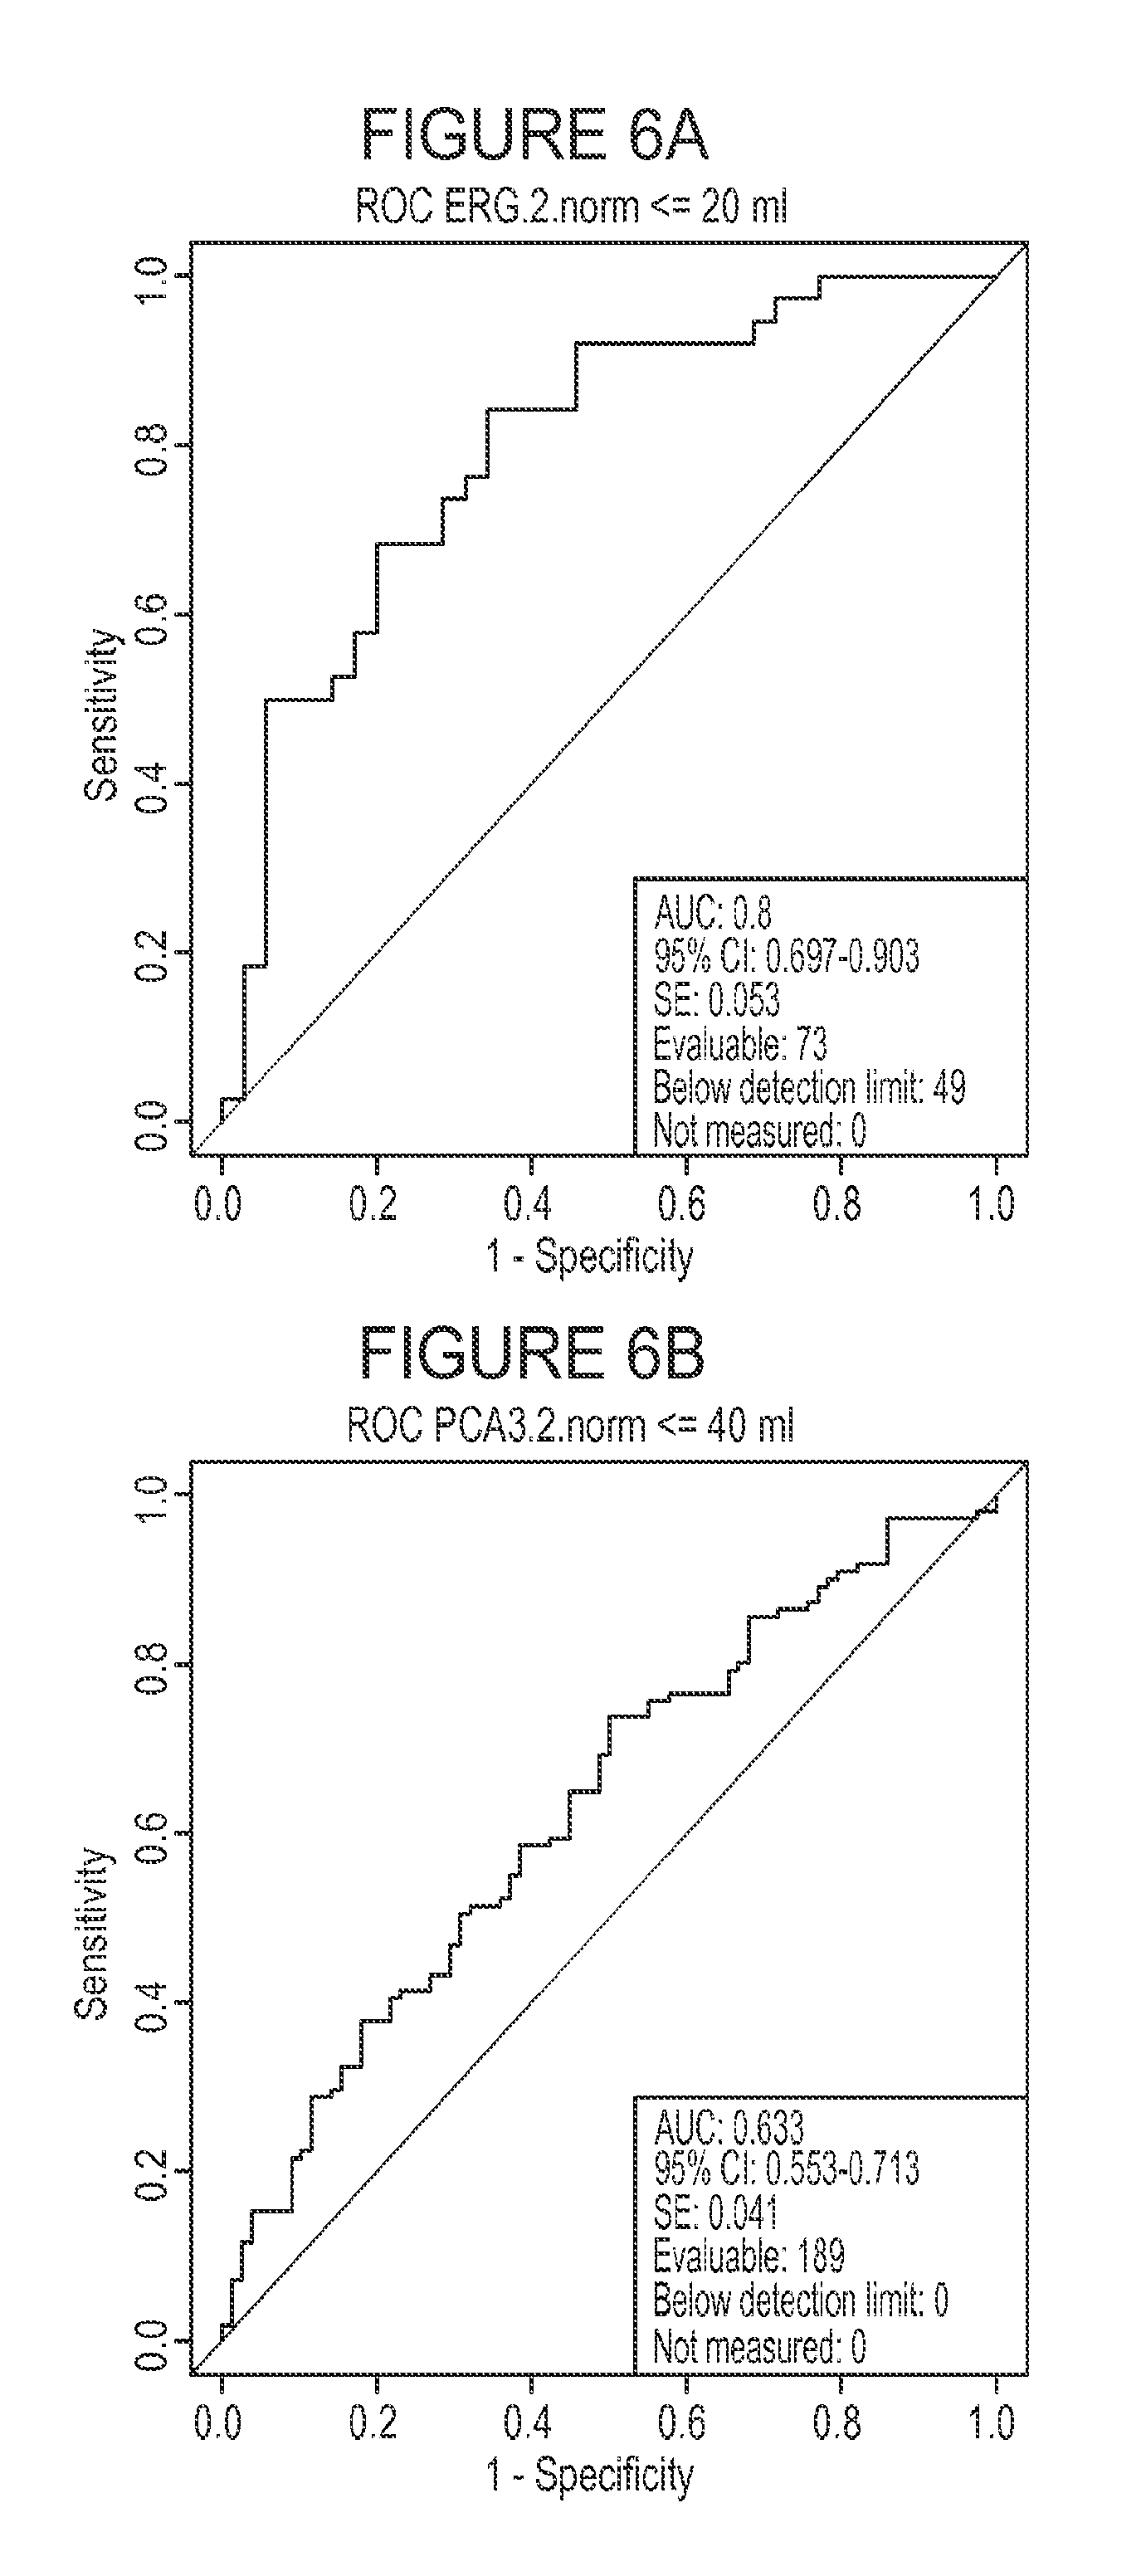
FIGS. 6A and 6B are two graphs depicting ROC curves based on ERG expression analysis normalized to KLK3 (non-imputed, FIG. 6A) and PCA3 (FIG. 6B) expression analysis normalized to KLK3 with samples from Patient Cohort 7 in which the sample volume was less than or equal to 20 mL (N=122). In both figures, the X axis represents specificity; the Y axis represents sensitivity.
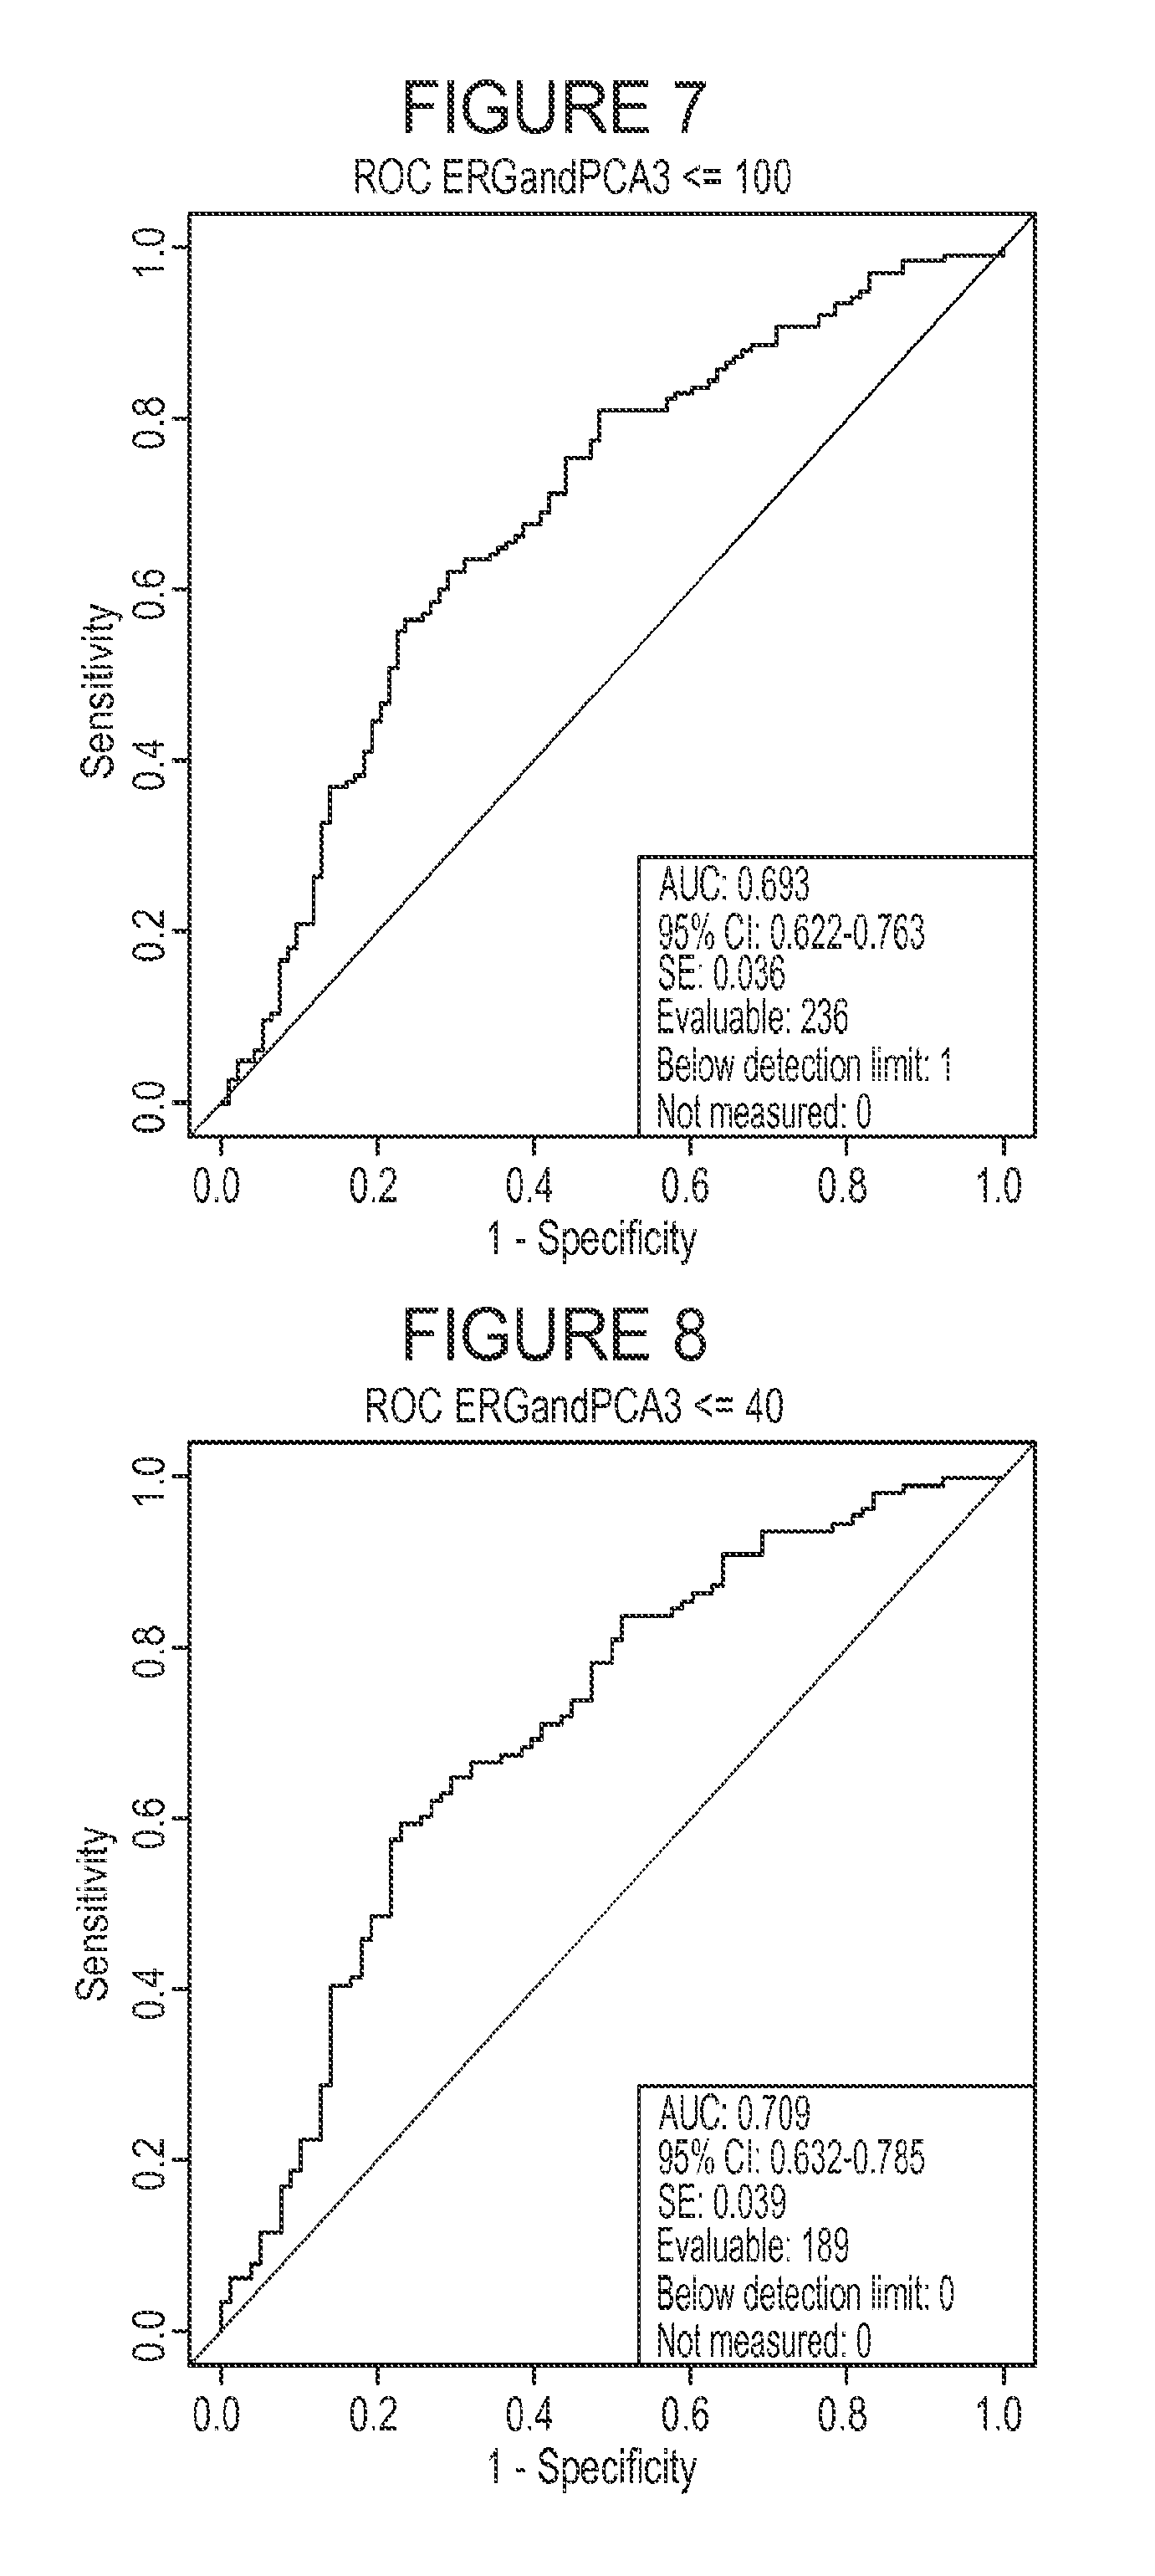
FIG. 7 is a graph depicting ROC curves based on ERG and PCA3 expression analysis normalized to KLK3 with samples from Patient Cohort 7 in which the sample volume was less than or equal to 100 mL (N=236). ERG expression analysis was imputed. The X axis represents specificity; the Y axis represents sensitivity.
FIG. 8 is a graph depicting ROC curves based on ERG and PCA3 expression analysis normalized to KLK3 with samples from Patient Cohort 7 in which the sample volume was less than or equal to 40 mL (N=189). ERG expression analysis was imputed. The X axis represents specificity; the Y axis represents sensitivity.
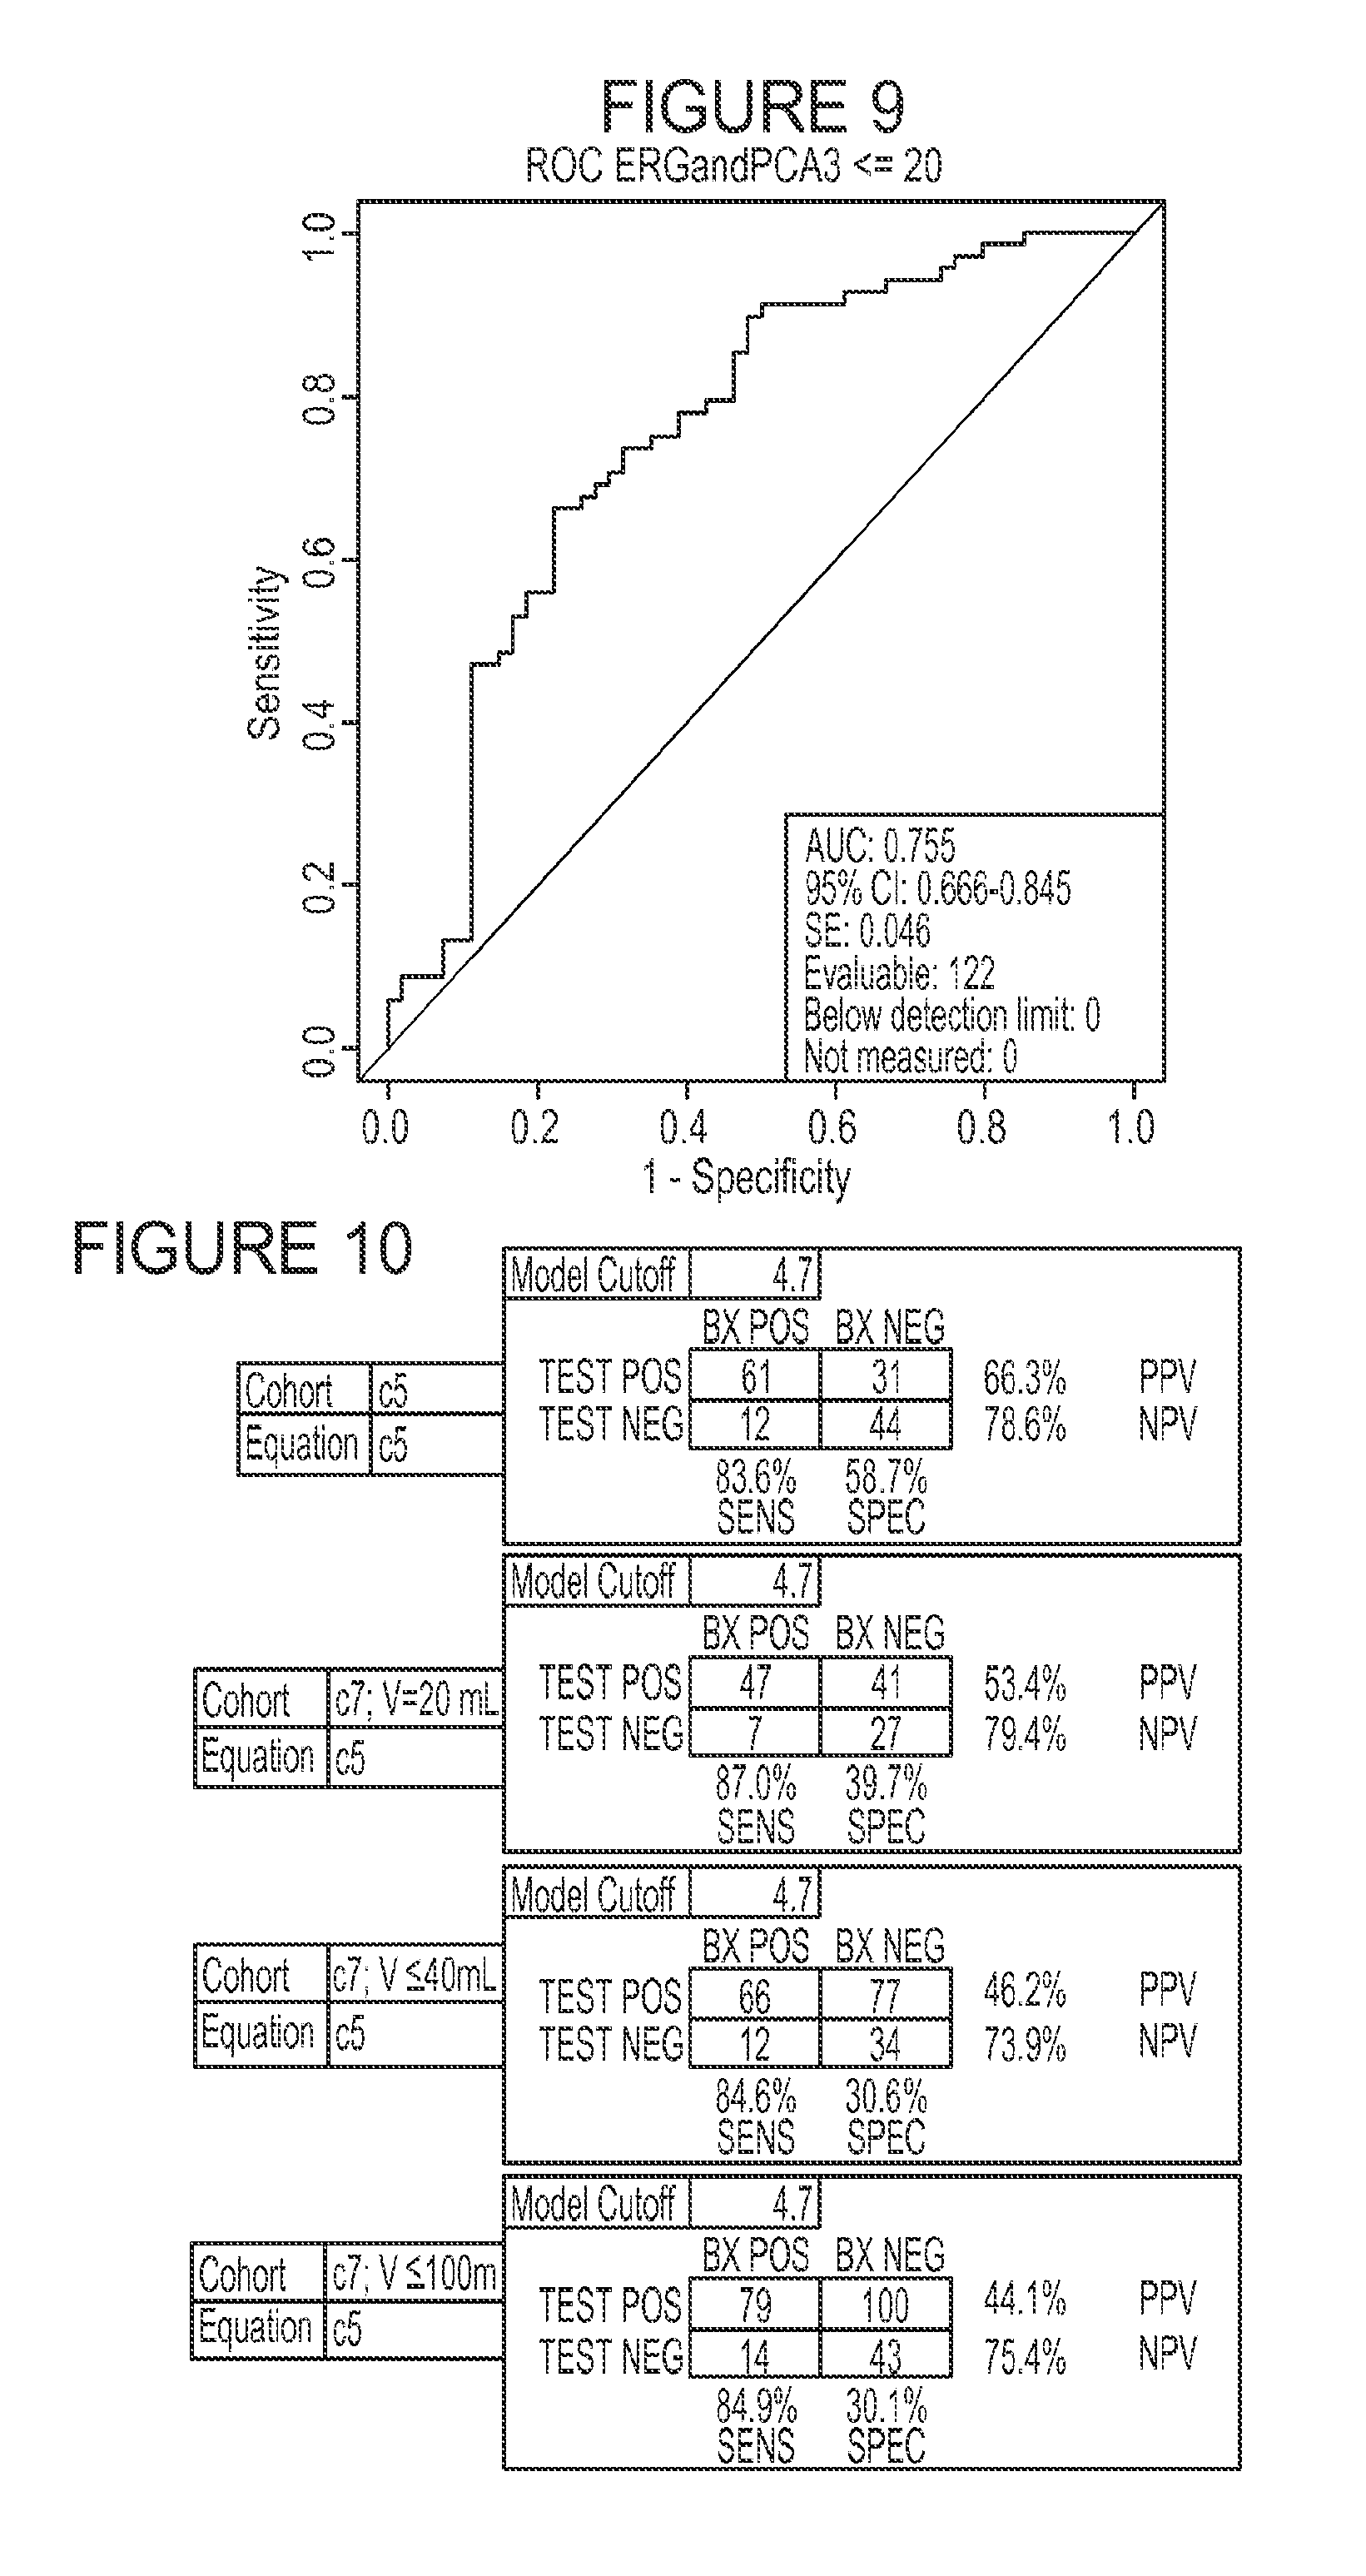
FIG. 9 is a graph depicting ROC curves based on ERG and PCA3 expression analysis normalized to KLK3 with samples from Patient Cohort 7 in which the sample volume was less than or equal to 20 mL (N=122). ERG expression analysis was imputed. The X axis represents specificity; the Y axis represents sensitivity.
FIG. 10 is a series of four tables showing the 2.times.2 analysis of the Cohort 7 data using the predetermined formula and model cutoff threshold values that were applied to previous Cohort 5 data. (Sens=sensitivity; Spec=specificity; NPV=negative predictive value; PPV=positive predictive value; C5=Cohort 5; C7=Cohort 7). Weights fitted to data in C5 performed well when applied to C7, despite several changes between C5 and C7 such as, for example, extraction protocol and probe chemistry. The C5 cohort volumes were generally lower than in C6, with more samples of the 40 mL volume.
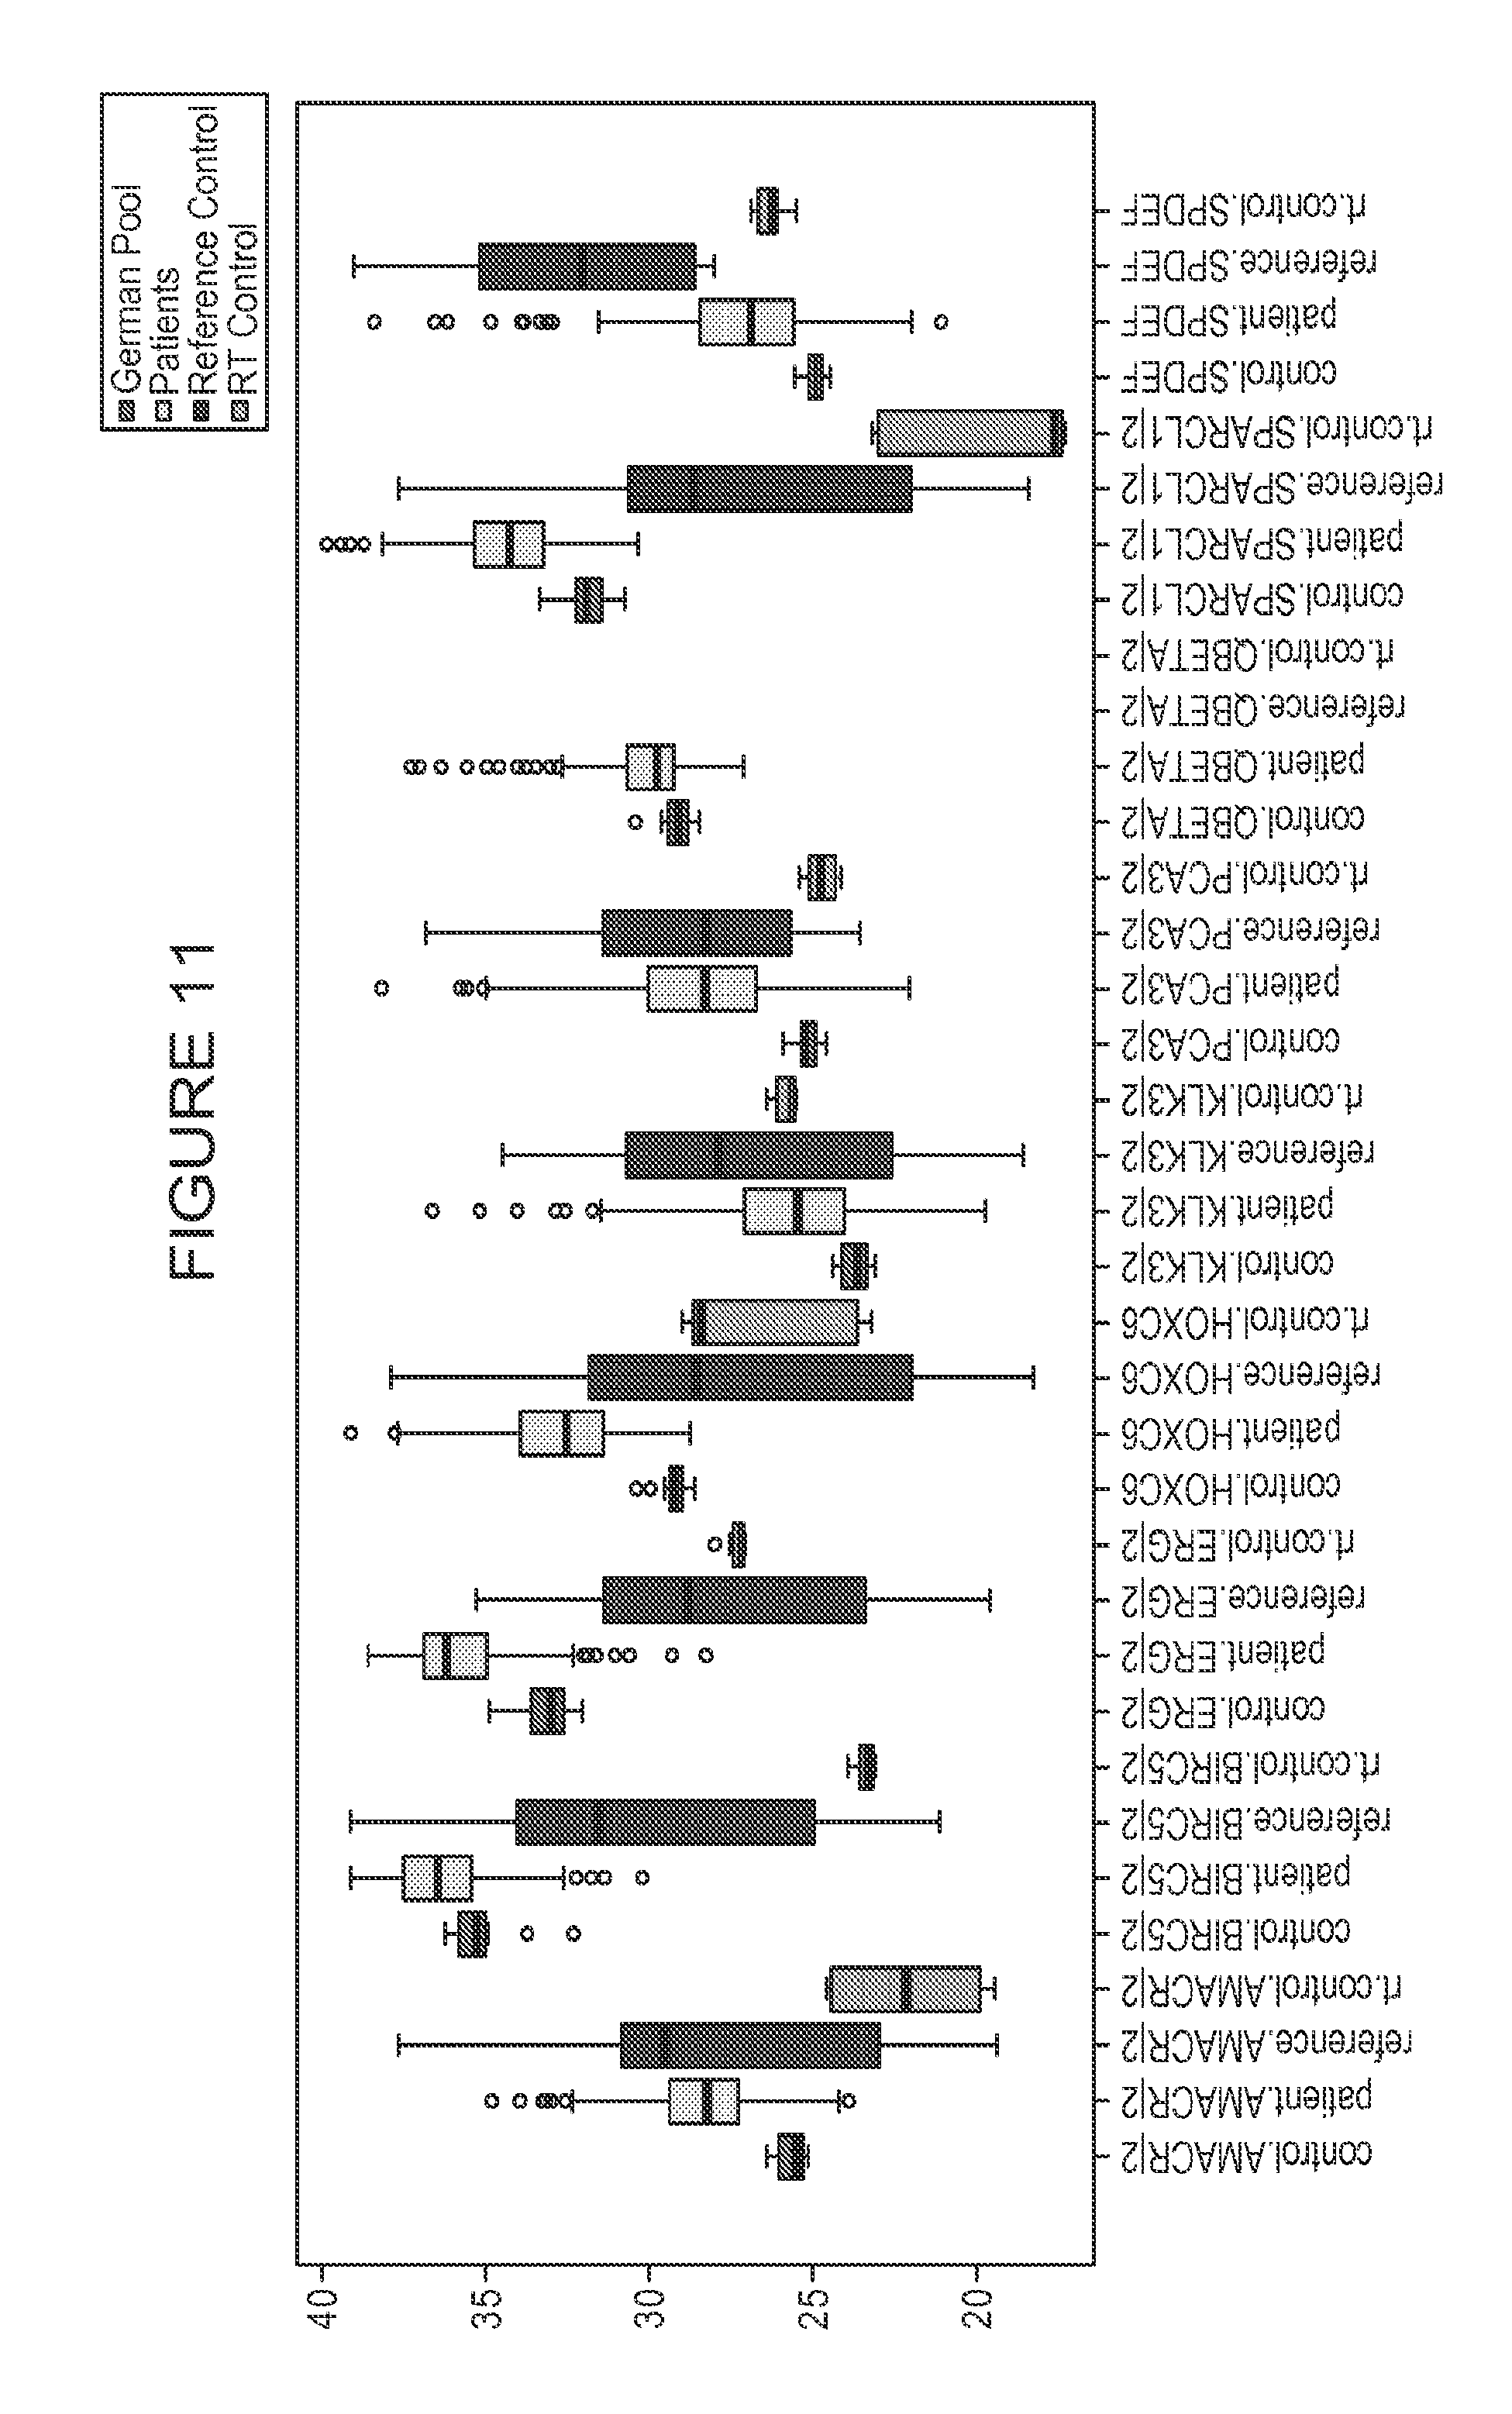
FIG. 11 is a box plot showing the distribution of Ct values for the detected genes (AMACR, BIRC5, ERG, HOXC6, KLK3, PCA4, QBETA, SPARCL1, and SPDEF) in each sample group (German pool=control pool samples. Patients=Cohort 7 patients, Reference=reference controls, and RT-controls=reverse transcriptase controls).
FIG. 12 is a graph comparing the AUC values generated by univariate analysis of each of the indicated genes (PCA3, ERG, AMACR, BIRC5, HOXC6, SPARCL1, and SPDEF) in samples of small volume (20 mL) with the AUC values of all samples. CI all and CI 20 mL indicates the 95% Confidence Interval for the AUCs for "All samples" and "20 mL samples", respectively. The Y axis represents the AUC values; the X axis represents each of the genes tested.
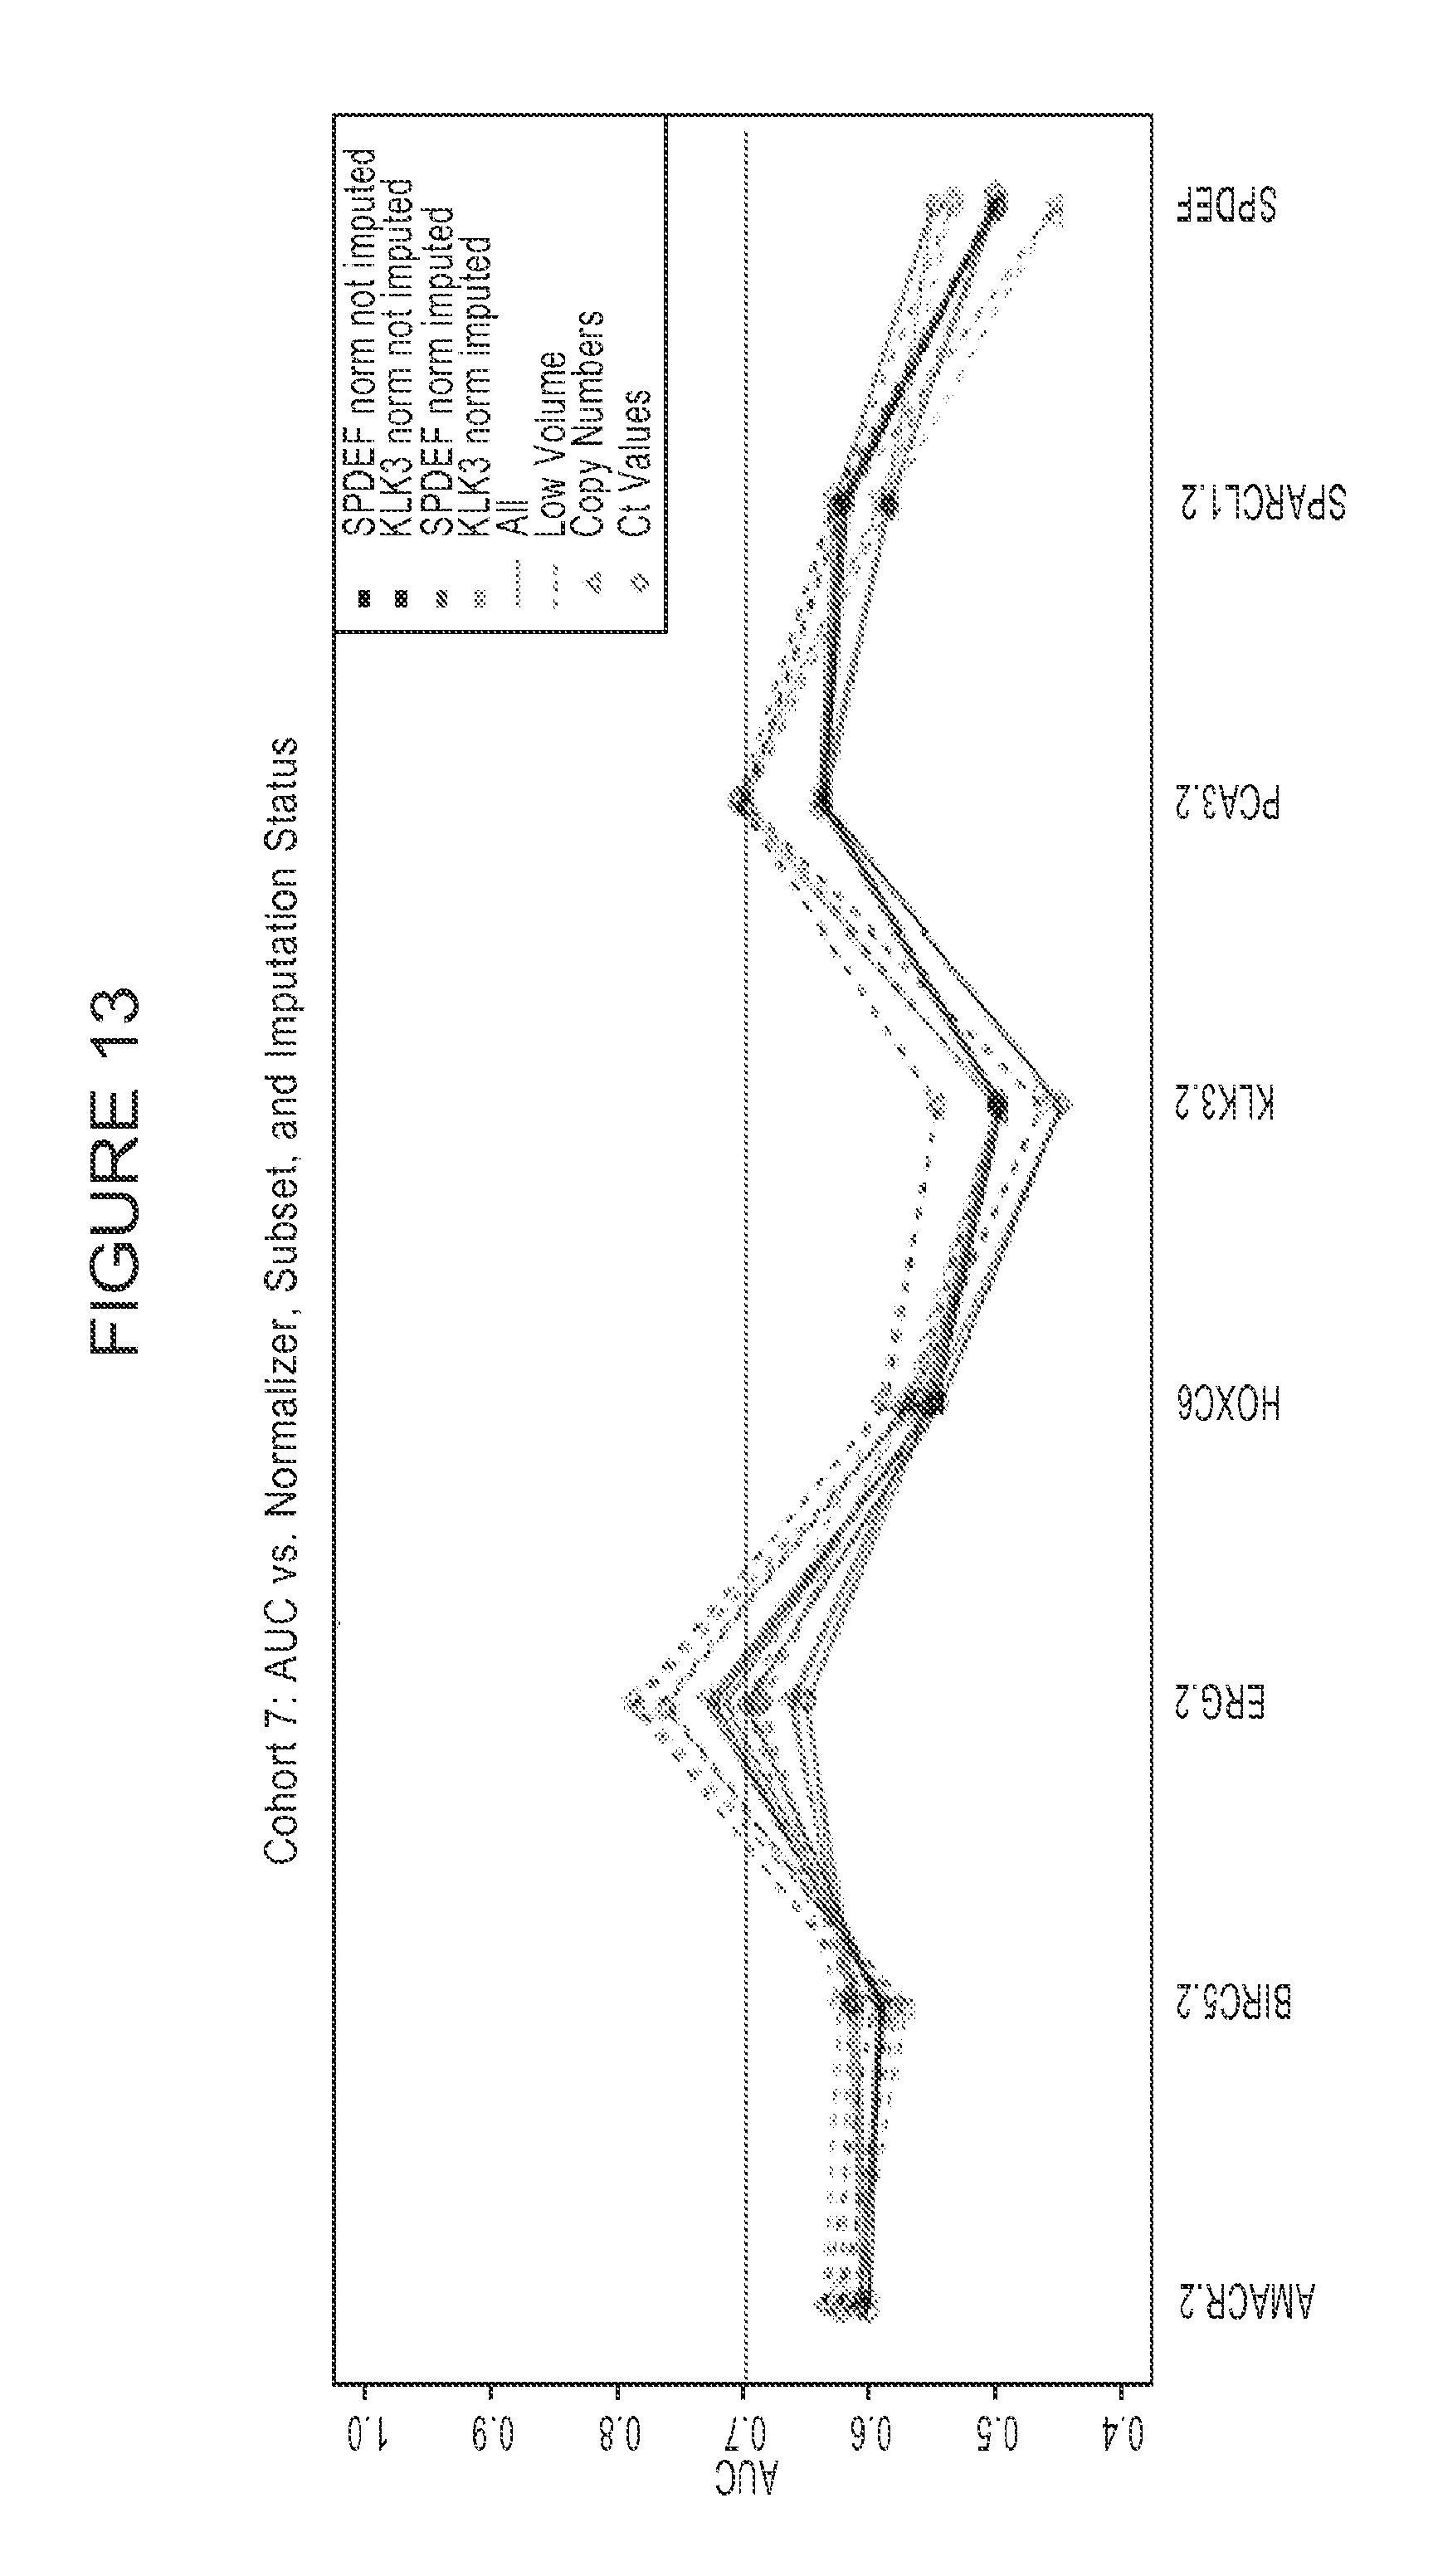
FIG. 13 is a graph showing the AUC values generated by univariate analysis of each of the indicated genes (AMACR, BIRC5, ERG, HOXC6, KLK3, PCA3, SPARCL1, and SPDEF) and comparing the AUC values between the following subsets: normalized to SPDEF or KLK3; imputed and normalized to SPDEF or KLK3; all sample volumes to low volume samples; and copy numbers to Ct values.
FIG. 14A and FIG. 14B are two graphs showing comparing the analysis of Cohort 5 (C5) and Cohort 7 (C7) by three gene analysis. FIG. 14A shows the comparison of C5 with C7 for all samples. FIG. 14B shows the comparison of C5 with C7 low volume samples. FTO=3 gene model that does not use PCA3. FTO refers to 3 gene models that do not use PCA3.
FIG. 15 is a graph showing the AUC values generated by 3-gene model analysis of the indicated combination of the following genes: AMACR, BIRC5, ERG, HOXC6, KLK3, PCA3, SPARCL1, and SPDEF; and comparing the AUC values between the following subsets: normalized to SPDEF or KLK3; imputed and normalized to SPDEF or KLK3; all sample volumes to low volume samples; and copy numbers to Ct values.
FIG. 16 is a graph depicting an exemplary EXO106 Score distribution in a patient cohort where n=453 samples, PSA median=5.3 ng/mL, and 80% of samples 2<PSA<10 ng/mL.
FIG. 17 is a graph depicting the AUC for EXO106 Performance on patients with any Gleason score as compared to the AUC for standard of care (SOC) treatment.
FIGS. 18A and 18B are a series of graphs depicting EXO106 performance by quartile, i.e., the percentage of samples identified as positive by biopsy by EXO106 score quartile.
FIG. 19 is a graph depicting the performance of the EXO106 Score for high grade prostate cancer, e.g., a Gleason score greater than 6.
FIG. 20 is a graph depicting a breakdown of the EXO106 Score performance based on Gleason score subgroups.
DETAILED DESCRIPTION
Cancer-related biomarkers include, e.g., specific mutations in gene sequences (Cortez and Calin, 2009; Diehl et al., 2008; Network, 2008; Parsons et al., 2008), up- and down-regulation of mRNA and miRNA expression (Cortez and Calin, 2009; Itadani et al., 2008; Novakova et al., 2009), mRNA splicing variations, changes in DNA methylation patterns (Cadieux et al., 2006; Kristensen and Hansen, 2009), amplification and deletion of genomic regions (Cowell and Lo, 2009), and aberrant expression of repeated DNA sequences (Ting et al., 2011). Various molecular diagnostic assays such as mutational analysis, methylation status of genomic DNA, and gene expression analysis may detect these biomarkers and produce valuable information for patients, doctors, clinicians and researchers. So far, these assays primarily have been performed on cancer cells derived from surgically removed tumor tissue or from tissue obtained by biopsy. For example, PCA3, TMPRSS2:ERG, and ERG, have previously been shown through biopsy analysis to be differentially expressed in prostate cancer compared to normal prostate tissues (Bussemakers et al., 1999; Petrovics et al., 2005; Tomlins et al., 2005).
However, the ability to perform these tests using a bodily fluid sample is oftentimes more desirable than using a patient tissue sample. A less invasive approach using a bodily fluid sample has wide ranging implications in terms of patient welfare, the ability to conduct longitudinal disease monitoring, and the ability to obtain expression profiles even when tissue cells are not easily accessible, e.g., in the prostate gland.
The detection of prostate cancer markers such as PSA (also called KLK3), PCA3, TMPRSS2:ERG, and ERG using urine samples has previously been investigated (Hessels et al., 2007; Laxman et al., 2008; Laxman et al., 2006; Nguyen et al., 2011; Rice et al., 2010; Rostad et al., 2009; Salami et al., 2011; Tomlins et al., 2005). However, the sample collection methods previously disclosed required a digital rectal exam (DRE), or prostate massage, to enable enough prostate-derived cellular fluid to enter the urine. Samples collected without DRE or prostate massage showed a lower detection rate of these biomarkers. For example, the detection rate for TMPRSS2:ERG was about 69% with DRE but only about 24% without DRE (Rostad et al., 2009).
Indeed, current sample collection methods for urine analysis of prostate cancer biomarkers require the use of a DRE with a systematic application of mild digital pressure over the entire palpated surface of the prostate, digital pressure to the prostate with 3 sweeps of each lateral lobe, firm pressure to the prostate from the base to apex and from the lateral to the median line of each lobe, or firm pressure to the prostate from the base to apex and from the lateral to the median line (where the depression of the prostate surface was between 0.5 to 1 cm) of each lobe three times (Deras et al., 2008; Hessels et al., 2007; Laxman et al., 2008; Laxman et al., 2006; Nguyen et al., 2011; Rice et al., 2010; Salami et al., 2011).
In addition, sample preparation methods previously disclosed require the isolation of cellular pellets from the post-DRE urine sample by centrifugation (Hessels et al., 2007; Laxman et al., 2008; Laxman et al., 2006; Nguyen et al., 2011; Rostad et al., 2009; Salami et al., 2011).
Many prior studies suggest that a DRE is a critical step in enabling enough RNA material to be collected for non-invasive prostate gene analysis (Deras et al., 2008; Hessels et al., 2007; Laxman et al., 2008; Laxman et al., 2006; Nguyen et al., 2011; Rice et al., 2010; Rostad et al., 2009; Salami et al., 2011; Tomlins et al., 2011). In some of these studies, urine samples are required to be processed within 4 hours of collection (Deras et al., 2008; Tomlins et al., 2011).
In contrast to these previous sample collection and urinary biomarker detection methods, the methods provided herein do not require a DRE or prostate massage prior to urine sample collection, nor do these methods require a sample preparation step involving isolation of a cellular pellet from urine samples. These new, noninvasive methods use urinary microvesicles to detect biomarkers in aid of diagnosis, prognosis, monitoring, or therapy selection for a disease or other medical condition of the prostate gland. Microvesicles released by tumor cells can be used to determine the genetic status of the tumor (Skog et al., 2008). See also WO 2009/100029, WO 2011/009104, WO 2011/031892, and WO 2011/031877.
Microvesicles are shed by eukaryotic cells, or budded off of the plasma membrane, to the exterior of the cell. These membrane vesicles are heterogeneous in size with diameters ranging from about 10 nm to about 5000 nm. All membrane vesicles shed by cells that are less than 0.8 .mu.m in diameter are referred to herein collectively as "microvesicles".
The present invention is based on the surprising finding that urine microvesicles contain biomarkers for a disease or other medical condition of the prostate gland in a subject. Thus, a patient urine sample can be assayed for detection of biomarkers for a disease or other medical condition of the prostate gland in a subject.
In the methods provided herein, random urine samples from subjects are collected without using a digital rectal exam (DRE) or prostatic massage prior to urine collection. The urine samples are 60 mL, 50 mL, 40 mL, 30 mL, 20 mL, 15 mL, or 10 mL. In some preferred embodiments, the urine samples are 40 mL or 20 mL. In some embodiments, the urine samples may be 1 to 40 mL, 1 to 35 mL, 1 to 30 mL, 1 to 25 mL, 1 to 20 mL, 1 to 15 mL, 1 to 10 mL, 1 to 5 mL, 5 to 40 mL, 5 to 35 mL, 5 to 30 mL, 5 to 25 mL, 5 to 20 mL, 5 to 15 mL, 5 to 10 mL, 10 to 40 mL, 10 to 35 mL, 10 to 30 mL, 10 to 25 mL, 10 to 20 mL, 10 to 15 mL, 15 to 40 mL, 15 to 35 mL, 15 to 30 mL, 15 to 25 mL, 15 to 20 mL, 20 to 40 mL, 20 to 35 mL, 20 to 30 mL, 20 to 25 mL, 25 to 40 mL, 25 to 35 mL, 25 to 30 mL, 30 to 40 mL, 30 to 35 mL, or 35 to 40 mL.
In a preferred embodiment, the urine sample is the urine that is first voided from the bladder, also known as "first catch" urine. The first voided urine contains the highest concentration of prostate-derived microvesicles, and therefore the analysis of the first voided urine provides higher signal from prostate biomarkers. As shown herein, the diagnostic accuracy of biomarkers useful in the diagnosis and prognosis of prostate cancer increases as the sample volume of the first voided urine sample decreases. The findings described herein demonstrate that 40 mL or 20 mL of the first voided urine exhibits greater diagnostic accuracy (i.e., AUC values). Accordingly, in a preferred embodiment, the urine samples are the first 40 mL or less, voided from the bladder. For example, the urine samples are the first 20 mL voided from the bladder.
Urine samples that are not suitable for use in the kits and/or methods of the disclosure include samples where the sample has not been properly stored and/or shipped. For example, specimens should not be kept at room temperature (e.g., 15-25.degree. C.) for extended periods of time. In some embodiments, specimens should not be kept at room temperature (e.g., 15-25.degree. C.) for more than 24 hours. In some embodiments, specimens should not be kept at room temperature (e.g., 15-25.degree. C.) for more than 36 hours. In some embodiments, specimens should not be kept at room temperature (e.g., 15-25.degree. C.) for more than 48 hours. Specimens should not be kept at a refrigerated temperature (e.g., 2-8.degree. C.) for extended periods of time. For example, specimens should not be kept at a refrigerated temperature (e.g., 2-8.degree. C.) for more than 21 days. In some embodiments, specimens should not be kept at a refrigerated temperature (e.g., 2-8.degree. C.) for more than 30 days. Typically, specimens can be frozen (e.g., .ltoreq.70.degree. C.) indefinitely. Specimens should be shipped on cold packs or on dry ice if the specimen is frozen.
Urine samples that are not suitable for use in the kits and/or methods of the disclosure include grossly bloody specimens.
The timing for collecting urine samples may also vary depending on different applications. A sample may be collected at any anytime as a spot urine sample. Spot urine may be sufficient for biomarker analyses when the amount of biomarker in microvesicles to be analyzed does not fluctuate too much during the day. In other cases, a 24-hour urine sample is collected when there is fluctuation of the amount of the biomarker in microvesicles to be analyzed and a 24-hour collection may mitigate the fluctuation effect. In still further cases, a series of urine samples are collected to study the fluctuation of the amount of biomarkers in microvesicles. The series of collections may be carried out in a certain time interval, e.g., every 6 hours, or in a scenario interval, e.g., before and after a therapeutic intervention.
In the methods provided herein, urine samples are first pre-processed by using a method comprising at least one filtration step. For example, a course filter (0.8 micron) is utilized to remove cells and cell debris. This filtration may be followed by an ultrafiltration step to remove solvent and small molecule analytes while retaining the microvesicles. The filters used in the initial filtration can be any size that is sufficient to remove cells and cell debris, for example, any size greater than 0.22 microns. To isolate the urine microvesicles, the pre-processed samples are then subjected to a filtration concentration step, wherein a filter that has a molecular weight cutoff is utilized to retain and concentrate the microvesicles that are greater than 10 nm in diameter. For example, the sample is then concentrated to a volume of less than 1 mL, preferably 100-200 .mu.L. For example, the molecular weight cutoff is at least 100 kDa.
In some embodiments, the method for pre-processing and processing a urine sample includes the following steps. First, a portion of the urine sample, e.g., at least 20 mL, is processed using a 0.8 .mu.m filter. For example, when the sample volume is .ltoreq.50 mL, at least 20 mL is drawn into a syringe that is attached to a 0.8 .mu.m filter and then expressed into a clean vessel, e.g., a clean 50 mL tube. When the sample urine volume is .gtoreq.50 mL, the sample is filtered using a 0.8 .mu.m bottle filter unit, and in some embodiments, suction is used to draw the sample through the bottle filter unit. Then, regardless of the initial sample volume, the filtered urine in the clean vessel is then subject to pulse vortex for a few seconds, e.g., 1-2 seconds. The filtered urine is then stored until filtrate concentration is ready to begin.
A portion of the filtered urine, e.g., 15 mL, is then processed using a filter concentrator (FC). Once the filtered urine is pipetted into the FC chamber (i.e., the top chamber of the FC vessel), an internal control, e.g., a Qbeta bacteriophage internal control (Attostar, Catalog #BAC200), can be added at the appropriate concentration. The FC vessel is then centrifuged. e.g., in a swing bucket rotor centrifuge, and spun for 5 minutes at 4,500.times.g at room temperature (e.g., 20-25.degree. C.). If the sample fails to filter completely (>500 .mu.L retentate remaining in the FC), then the FC should be re-centrifuged for 2-5 minutes. Samples that show minimal signs of filtering (>10 mL retentate remaining in the FC) should be discarded.
The sample is then removed from the centrifuge, and the filtrate (i.e., the fluid in the bottom of the FC vessel) is discarded. The retentate is then re-suspended with 5 mL of the remaining filtered urine and 10 mL 1.times.PBS. The sample is uniformly mixed, e.g., by inverting the FC vessel 3-4 times. The FC vessel is then centrifuged, e.g., in a swing bucket rotor centrifuge, and spun for 5 minutes at 4,500.times.g at room temperature (e.g., 20-25.degree. C.). The sample is then removed from the centrifuge, and the filtrate is discarded.
In the first wash step, the retentate is re-suspended in in 15 mL 1.times.PBS. The sample is uniformly mixed, e.g., by inverting the FC vessel 3-4 times. The FC vessel is then centrifuged, e.g., in a swing bucket rotor centrifuge, and spun for 5 minutes at 4,500.times.g at room temperature (e.g., 20-25.degree. C.).
In the second wash step, the retentate is re-suspended in in 15 mL 1.times.PBS. The sample is uniformly mixed, e.g., by inverting the FC vessel 3-4 times. The FC vessel is then centrifuged, e.g., in a swing bucket rotor centrifuge, and spun for 7 minutes at 4,500.times.g at room temperature (e.g., 20-25.degree. C.). The expected retention volume is 100-200 .mu.L. If the sample volume is greater than 250 .mu.L, then the FC vessel is centrifuged for an additional 5 minutes at 4,500.times.g at RT.
After isolation and concentration of the urine microvesicles, the samples are pre-treated with an RNase inhibitor, prior to nucleic acid extraction, to prevent digestion of extracted RNA and enhance the quality of the extraction. Optionally, the samples may be washed at least once using the appropriate buffer to further enrich or purify the microvesicle fraction. In some embodiments, the samples are washed twice using the appropriate buffer to further enrich or purify the microvesicle fraction. RNA is extracted from the microvesicles by a method comprising lysis of the microvesicles, processing the lysate through an RNA-binding column, and elution of the RNA from the RNA-binding column, under appropriate conditions designed to achieve high quality RNA preparations. Optionally, the concentrated microvesicles are lysed on the filter used in the pre-processing step. These high quality RNA preparations provide urine-based molecular diagnostics for prostate cancer and other disorders of the prostate.
In some embodiments, 4 .mu.L of an RNase Inhibitor is added to the upper chamber of the FC vessel. The vessel is then shaken laterally to ensure that the RNase inhibitor is well suspended. The sample is then incubated with the RNase Inhibitor for 2-3 minutes at room temperature (e.g., 15-25.degree. C.). An RNA lysis buffer, e.g., Promega RNA Lysis Buffer (Catalog #Z3051) containing 2% 1-thiglycerol is then added at a volume of 250 .mu.l to each sample. The sample is then briefly vortexed and incubated at room temperature for 1 minute.
A pipette is then placed at the bottom of the FC vessel (with care not to touch or scrape the sides of the vessel or the filter), and 150 .mu.l of solution (i.e., sample+RNase inhibitor) is transferred to a 2 mL RNase free tube. This step is repeated until all sample has been removed and transferred to the 2 mL RNase free tube. The isolated microvesicle fraction is then ready for nucleic acid extraction, e.g., RNA extraction.
Isopropanol is then added to the 2 mL tube at a volume of 150 .mu.l, and the solution is mixed by pipet. The lysate is transferred to the extraction column, and the extraction column is centrifuged for 30 seconds at 13,000.times.g. The extraction column is then transferred to a new collection tube, and the centrifuging for 30 seconds 13,000.times.g and transfer from extraction column to new collection tube is repeated until all lysate has been transferred. RNA Wash Solution (RWA Buffer) from Promega (Catalog #Z309B-C) is then added at a volume of 500 .mu.l to the collection tube, and the tube is centrifuged for 30 seconds at 13,000.times.g. The sample is then transferred to a new collection tube, 300 .mu.l of RWA Buffer is added to the collection tube, and the collection tube is then centrifuged for 2 minutes at 13,000.times.g. The sample is then transferred to a new collection tube, and the collection tube is then centrifuged for 2 minutes at 13,000.times.g. The contents of the collection tube are then transferred to a 1.5 mL Eppendorf.RTM. tube that is RNase DNase free. The contents of the tube are then eluted using 16 .mu.l of nuclease-free water, e.g., Promega Nuclease-Free Water (Catalog #P119E) and centrifuged for 1 minute at 13,000.times.g.
The extracted RNA from the microvesicle fraction can then be stored at .ltoreq.-70.degree. C. in an ultra-low freezer.
The methods described herein may include the use of a control particle to determine or evaluate the quality of the microvesicle isolation and/or microvesicle nucleic acid extraction. Control particles collectively refer to particles of the size range of microvesicles that are added at some point during the microvesicle isolation or nucleic acid extraction process, wherein the particles contain control nucleic acids, such as DNA or RNA. Specifically, the control nucleic acids comprise at least one target gene to be assayed or measured for determining the amount of recovery of the control particle during the isolation or extraction process.
Preferably, the control particle is a Q-beta bacteriophage, referred to herein as "Q-beta particle". The Q-beta particle used in the methods described herein may be a naturally-occurring virus particle or may be a recombinant or engineered virus, in which at least one component of the virus particle (e.g., a portion of the genome or coat protein) is synthesized by recombinant DNA or molecular biology techniques known in the art. Q-beta is a member of the leviviridae family, characterized by a linear, single-stranded RNA genome that consists of 3 genes encoding four viral proteins: a coat protein, a maturation protein, a lysis protein, and RNA replicase. Due to its similar size to average microvesicles, Q-beta can be easily purified from a biological sample using the same purification methods used to isolate microvesicles, as described herein. In addition, the low complexity of the Q-beta viral single-stranded gene structure is advantageous for its use as a control in amplification-based nucleic acid assays. The Q-beta particle contains a control target gene or control target sequence to be detected or measured for the quantification of the amount of Q-beta particle in a sample. For example, the control target gene is the Q-beta coat protein gene. After addition of the Q-beta particles to the urine sample or isolated urine-derived microvesicles, the nucleic acids from the Q-beta particle are extracted along with the nucleic acids from the microvesicles and/or urine sample using the extraction methods described herein. Detection of the Q-beta control target gene can be determined by RT-PCR analysis, for example, simultaneously with the biomarkers of interest (i.e., BIRC5, ERG and SPARCL1). A standard curve of at least 2, 3, or 4 known concentrations in 10-fold dilution of a control target gene can be used to determine copy number. The copy number detected and the quantity of Q-beta particle added can be compared to determine the quality of the isolation and/or extraction process.
In some embodiments, the kits and/or methods of the disclosure use a Q-beta particle that includes at least a portion, e.g., at least 10 nucleotides, at least 20 nucleotides, at least 30 nucleotides, at least 40 nucleotides, at least 50 nucleotides, at least 100 nucleotides, at least 150 nucleotides, at least 200 nucleotides, at least 250 nucleotides, at least 300 nucleotides, at least 350 nucleotides, at least 400 nucleotides, at least 450 nucleotides, and/or at least 500 nucleotides or more of the nucleic acid sequence of SEQ ID NO: 1:
TABLE-US-00001 (SEQ ID NO: 1) AAACGGTTCTTGTGACCCATCCGTTACTCGCCAGGCATATGCTGACGTGA CCTTTTCGTTCACGCAGTATAGTACCGATGAGGAACGAGCTTTTGTTCGT ACAGAGCTTGCTGCTCTGCTCGCTAGTCCTAGCGTCCTCAGTTAGATCCT TATCAGATTCTTGGACCAACAAGTAGCCGCCTTGCAAATCCAGGCAGTGG CCAGATCCAGCTTTGGCAGTTCCTCCTGGAGCTCCTGTCGGACAGCTCCC GGTCGGATGTGCTGCTGGAGCCCTTCCGCCGCGGTGTCATGGAGAAACTC CAGCTGGGCCCAGAGATTCTGCAGCGGGAAAACCTGTCCGTGACGTGGAT TGGTGCTGCACCCCTCATCCTGTCTCGGATTGTGGGAGGCTGGGAGTGCG AGAAGCATTCCCAACCCTGGCAGGTGCTTGTGGCCTCTCGTGGCAGGGCA GTCTGCGGCGGTGTTCTGGTGCACCCCCAGTGGGTCCTCACAGCTGCCCA CTGCATCAGGAACAAAAGCGTGATCTTGCTGGGTCGGCACAGC
In some embodiments, the Q-beta particles are added to the urine sample prior to nucleic extraction. For example, the Q-beta particles are added to the urine sample prior to ultrafiltration and/or after the pre-filtration step.
In some embodiments, 50, 100, 150, 200, 250, 300, 350, 400, 450, 500, 1,000 or 5,000 copies of Q-beta particles added to a urine sample. In some embodiments, 100 copies of Q-beta particles are added to a urine sample. The copy number of Q-beta particles can be calculated based on the ability of the Q-beta bacteriophage to infect target cells. Thus, the copy number of Q-beta particles is correlated to the colony forming units of the Q-beta bacteriophage.
The methods provided herein are useful in subjects suspected of having prostate cancer, for example, due to an elevated PSA, suspicious DRE or any other art-recognized technique for diagnosis of prostate cancer. In some embodiments, the methods provided herein are useful in subjects who have not had any prior diagnostic testing, such as PSA testing, DRE, or any other art-recognized technique for diagnosis of prostate cancer.
The methods provided herein demonstrate the association of biomarkers in urine microvesicles with the finding of prostate cancer as determined by a prostate biopsy. Prostate biopsy is the current standard for prostate cancer diagnosis, but the risks associated with prostate biopsy are significant, especially when considering that one million biopsies are performed in the United States, annually. Pain, bleeding, urinary retention and urinary tract infections are not uncommon, and serious life threatening infections may also occur.
The methods described herein provide methods of the non-invasive analysis of the RNA expression levels of cancer-associated transcripts in urine samples or urinary microvesicles. In particular, the methods are used to detect the mRNA expression of at least PCA3 and ERG in urine samples. ERG mRNAs may include one or more isoforms of ERG include ERG1, ERG2, ERG3, ERG4, ERG5, ERG6, ERG7, ERG8, ERG9, ERG Prostate Cancer-specific Isoform 1 (EPC1) and ERG Prostate Cancer-specific Isoform 2 (EPC2). As demonstrated herein, detecting expression levels of PCA3 and ERG in urinary microvesicles provides excellent sensitivity and specificity as biomarkers of prostate cancer and other prostate-related disorders in subjects who had previously undergone a prostate biopsy (referred to herein as the biopsy cohort or patient cohort). In some embodiments, 2, 3, 4, 5, 6, 7, 8, 9, or 10 or more biomarkers are detected in combination.
In some embodiments, the kits and/or methods of the disclosure are used to detect ERG mRNA having at least a portion, e.g., at least 10 nucleotides, at least 20 nucleotides, at least 30 nucleotides, at least 40 nucleotides, at least 50 nucleotides, at least 100 nucleotides, at least 150 nucleotides, at least 200 nucleotides, and/or at least 250 nucleotides or more of the following nucleic acid sequence:
TABLE-US-00002 (SEQ ID NO: 2) CAGTCGAAAGCTGCTCAACCATCTCCTTCCACAGTGCCCAAAACTGAAG ACCAGCGTCCTCAGTTAGATCCTTATCAGATTCTTGGACCAACAAGTAG CCGCCTTGCAAATCCAGGCAGTGGCCAGATCCAGCTTTGGCAGTTCCTC CTGGAGCTCCTGTCGGACAGCTCCAACTCCAGCTGCATCACCTGGGAAG GCACCAACGGGGAGTTCAAGATGACGGATCCCGACGAGGTGGCCCGGCG CTGGGGAGAGCGGAAGAGCAAACCCAACATGAACTACGATAAGCTCAGC CGCGCC
As shown herein, PCA3 and ERG were analyzed by univariate analysis and demonstrated that each gene alone (when normalized to a reference gene such as KLK3) had high diagnostic accuracy (AUC values greater than 0.6). The analysis disclosed herein shows that PCA3 and ERG had more diagnostic value when the normalized expression level of both was determined together than alone.
In some embodiments, the kits and/or methods of the disclosure are used to detect PCA3 mRNA having at least a portion, e.g., at least 10 nucleotides, at least 20 nucleotides, at least 30 nucleotides, at least 40 nucleotides, at least 50 nucleotides, at least 100 nucleotides, at least 150 nucleotides, at least 200 nucleotides, at least 250 nucleotides, at least 300 nucleotides, at least 350 nucleotides, at least 400 nucleotides, and/or at least 450 nucleotides or more of the nucleic acid sequence of
TABLE-US-00003 (SEQ ID NO: 3) GGGAGACGAAUUGGGCCCUCUAGAUGCAUGCUCGAGCGGCCGCCAGUGUG AUGGAUAUCUGCAGAAUUCGCCCUUAUUGUCUCCUCAGUGACACAGGGCU GGAUCACCAUCGACGGCACUUUCUGAGUACUCAGUGCAGCAAAGAAAGAC UACAGACAUCUCAAUGGCAGGGGUGAGAAAUAAGAAAGGCUGCUGACUUU ACCAUCUGAGGCCACACAUCUGCUGAAAUGGAGAUAAUUAACAUCACUAG AAACAGCAAGAUGACAAUAUAAUGUCUAAGUAGUGACAUGUUUUGCACAU UUCCAGCCCCUUUAAAUAUCCACACACACAGGAAGCACAAAAGGAAGCAC AGAGAUCCCUGGGAGAAAUGCCCGGCCACCUGCGGCCGCAAGCUUGGAUC CGAAUUCCUGUGUGAAAUUGUUAUCCGCUCACAAUUCCACACAACAUACG AGCCGGAAGCAUAAAGUGUAAAGCCUGGGGUGCCUAAUGA
In some embodiments, the kits and/or methods of the disclosure are used to detect ERG mRNA having at least a portion, e.g., at least 10 nucleotides, at least 20 nucleotides, at least 30 nucleotides, at least 40 nucleotides, at least 50 nucleotides, at least 100 nucleotides, at least 150 nucleotides, at least 200 nucleotides, and/or at least 250 nucleotides or more of the nucleic acid sequence of SEQ ID NO: 2 and PCA3 mRNA having at least a portion, e.g., at least 10 nucleotides, at least 20 nucleotides, at least 30 nucleotides, at least 40 nucleotides, at least 50 nucleotides, at least 100 nucleotides, at least 150 nucleotides, at least 200 nucleotides, at least 250 nucleotides, at least 300 nucleotides, at least 350 nucleotides, at least 400 nucleotides, and/or at least 450 nucleotides or more of the nucleic acid sequence of SEQ ID NO: 3.
In some embodiments, the kits and/or methods of the disclosure are used to detect ERG mRNA having the full-length nucleic acid sequence of SEQ ID NO: 2 and PCA3 mRNA having the full-length nucleic acid sequence of SEQ ID NO: 3.
Additional biomarker combinations can be used with PCA3 and ERG, wherein 1, 2, 3, 4, 5, 6, 7, 8, 9, or 10 or more additional genes may have high diagnostic value as biomarkers for cancer, such as aggressive cancers or prostate cancer. Examples of these additional genes include AMACR, BIRC5, HOXC6, and SPARCL1.
In some embodiments, the kits and/or methods of the disclosure are used to detect AMACR mRNA having at least a portion, e.g., at least 10 nucleotides, at least 20 nucleotides, at least 30 nucleotides, at least 40 nucleotides, at least 50 nucleotides, at least 100 nucleotides, at least 150 nucleotides, at least 200 nucleotides, at least 250 nucleotides, at least 300 nucleotides, at least 350 nucleotides, at least 400 nucleotides, at least 450 nucleotides, and/or at least 500 nucleotides or more of the nucleic acid sequence of SEQ ID NO: 4, SEQ ID NO: 37, or SEQ ID NO: 38:
TABLE-US-00004 Human AMACR, transcript variant 1, mRNA (SEQ ID NO: 4) (SEQ ID NO: 4) GGGGCCTGGCGCCGGGGATTGGGAGGGCTTCTTGCAGGCTGCTGGGCTGGGGCTAAGGGCT GCTCACTTTCCTTCAGCGGGGCACTGGGAAGCGCCATGGCACTGCAGGGCATCTCGGTCGT GGAGCTGTCCGGCCTGGCCCCGGGCCCGTTCTGTGCTATGGTCCTGGCTGACTTCGGGGCG CGTCTCGTACGCGTGGACCGGCCCGGCTCCCGCTACGACGTGAGCCGCTTGGGCCGGGGCA AGCGCTCGCTAGTGCTGGACCTGAAGCAGCCGCGGGGAGCCGCCGTGCTGCGGCGTCTGTC CAAGCGGTCGGATGTGCTGCTGGAGCCCTTCCGCCGCGGTGTCATGGAGAAACTCCAGCTG GGCCCAGAGATTCTGCAGCGGGAAAATCCAAGGCTTATTTATGCCAGGCTGAGTGGATTTG GCCAGTCAGGAAGCTTCTGCCGGTTAGCTGGCCACGATATCAACTATTTGGCTTTGTCAGG TGTTCTCTCAAAAATTGGCAGAAGTGGTGAGAATCCGTATGCCCCGCTGAATCTCCTGGCT GACTTTGCTGGTGGTGGCCTTATGTGTGCACTGGGCATTATAATGGCTCTTTTTGACCGCA CACGCACTGGCAAGGGTCAGGTCATTGATGCAAATATGGTGGAAGGAACAGCATATTTAAG TTCTTTTCTGTGGAAAACTCAGAAATTGAGTCTGTGGGAAGCACCTCCAGGACAGAACATG TTGGATGGTGGAGCACCTTTCTATACGACTTACAGGACAGCAGATGGGGAATTCATGGCTG TTGGAGCAATAGAACCCCAGTTCTACGAGCTGCTGATCAAAGGACTTGGACTAAAGTCTGA TGAACTTCCCAATCAGATGAGCATGGATGATTGGCCAGAAATGAAGAAGAAGTTTGCAGAT GTATTTGCAGAGAAGACGAAGGCAGAGTGGTGTCAAATCTTTGACGGCACAGATGCCTGTG TGACTCCGGTTCTGACTTTTGAGGAGGTTGTTCATCATGATCACAACAAGGAACGGGGCTC GTTTATCACCAGTGAGGAGCAGGACGTGAGCCCCCGCCCTGCACCTCTGCTGTTAAACACC CCAGCCATCCCTTCTTTCAAAAGGGATCCTTTCATAGGAGAACACACTGAGGAGATACTTG AAGAATTTGGATTCAGCCGCGAAGAGATTTATCAGCTTAACTCAGATAAAATCATTGAAAG TAATAAGGTAAAAGCTAGTCTCTAACTTCCAGGCCCACGGCTCAAGTGAATTTGAATACTG CATTTACAGTGTAGAGTAACACATAACATTGTATGCATGGAAACATGGAGGAACAGTATTA CAGTGTCCTACCACTCTAATCAAGAAAAGAATTACAGACTCTGATTCTACAGTGATGATTG AATTCTAAAAATGGTTATCATTAGGGCTTTTGATTTATAAAACTTTGGGTACTTATACTAA ATTATGGTAGTTATTCTGCCTTCCAGTTTGCTTGATATATTTGTTGATATTAAGATTCTTG ACTTATATTTTGAATGGGTTCTAGTGAAAAAGGAATGATATATTCTTGAAGACATCGATAT ACATTTATTTACACTCTTGATTCTACAATGTAGAAAATGAGGAAATGCCACAAATTGTATG GTGATAAAAGTCACGTGAAACAGAGTGATTGGTTGCATCCAGGCCTTTTGTCTTGGTGTTC ATGATCTCCCTCTAAGCACATTCCAAACTTTAGCAACAGTTATCACACTTTGTAATTTGCA AAGAAAAGTTTCACCTGTATTGAATCAGAATGCCTTCAACTGAAAAAAACATATCCAAAAT AATGAGGAAATGTGTTGGCTCACTACGTAGAGTCCAGAGGGACAGTCAGTTTTAGGGTTGC CTGTATCCAGTAACTCGGGGCCTGTTTCCCCGTGGGTCTCTGGGCTGTCAGCTTTCCTTTC TCCATGTGTTTGATTTCTCCTCAGGCTGGTAGCAAGTTCTGGATCTTATACCCAACACACA GCAACATCCAGAAATAAAGATCTCAGGACCCCCCAGCAAGTCGTTTTGTGTCTCCTTGGAC TGAGTTAAGTTACAAGCCTTTCTTATACCTGTCTTTGACAAAGAAGACGGGATTGTCTTTA CATAAAACCAGCCTGCTCCTGGAGCTTCCCTGGACTCAACTTCCTAAAGGCATGTGAGGAA GGGGTAGATTCCACAATCTAATCCGGGTGCCATCAGAGTAGAGGGAGTACAGAATGGATGT TGGGTAGGCCATCAATAAGGTCCATTCTGCGCAGTATCTCAACTGCCGTTCAACAATCGCA AGAGGAAGGTGGAGCAGGTTTCTTCATCTTACAGTTGAGAAAACAGAGACTCAGAAGGGCT TCTTAGTTCATGTTTCCCTTAGCGCCTCAGTGATTTTTTCATGGTGGCTTAGGCCAAAAGA AATATCTAACCATTCAATTTATAAATAATTAGGTCCCCAACGAATTAAATATTATGTCCTA CCAACTTATTAGCTGCTTGAAAAATATAATACACATAAATAAAAAAATATATTTTTCATTT CTATTTCATTGTTAATCACAACTACTTACTAAGGAGATGTATGCACCTATTGGACACTGTG CAACTTCTCACCTGGAATGAGATTGGACACTGCTGCCCTCATTTTCTGCTCCATGTTGGTG TCCATATAGTACTTGATTTTTTATCAGATGGCCTGGAAAACCCAGTCTCACAAAAATATGA AATTATCAGAAGGATTATAGTGCAATCTTATGTTGAAAGAATGAACTACCTCACTAGTAGT TCACGTGATGTCTGACAGATGTTGAGTTTCATTGTGTTTGTGTGTTCAAATTTTTAAATAT TCTGAGATACTCTTGTGAGGTCACTCTAATGCCCTGGGTGCCTTGGCACAGTTTTAGAAAT ACCAGTTGAAAATATTTGCTCAGGAATATGCAACTAGGAAGGGGCAGAATCAGAATTTAAG CTTTCATATTCTAGCCTTCAGTCTTGTTCTTCAACCATTTTTAGGAACTTTCCCATAAGGT TATGTTTTCCAGCCCAGGCATGGAGGATCACTTGAGGCCAAGAGTTCGAGACCAGCCTGGG GAACTTGGCTGGACCTCCGTTTCTACGAAATAAAAATAAAAAAATTATCCAGGTATGGTGG TGTGTGCCTGTAGTCCTATCTACTCAAGGGTGGGGCAGGAGGATCACTTGAGCCCAGGAAT TTGAGGCCACAGTGAATTAGGATTGCACCACTGCACTCTAGCCCAGGCAACAGAACAAGAA CCTGTCTCTAAATAAATAAATAAAAATAATAATAATAAAAAAGATGTTTTCCCTACAA Human AMACR, transcript variant 1, mRNA (SEQ ID NO: 37) (SEQ ID NO: 37) GGGGCCTGGCGCCGGGGATTGGGAGGGCTTCTTGCAGGCTGCTGGGCTGGGGCTAAGGGCT GCTCACTTTCCTTCAGCGGGGCACTGGGAAGCGCCATGGCACTGCAGGGCATCTCGGTCGT GGAGCTGTCCGGCCTGGCCCCGGGCCCGTTCTGTGCTATGGTCCTGGCTGACTTCGGGGCG CGTCTCGTACGCGTGGACCGGCCCGGCTCCCGCTACGACGTGAGCCGCTTGGGCCGGGGCA AGCGCTCGCTAGTGCTGGACCTGAAGCAGCCGCGGGGAGCCGCCGTGCTGCGGCGTCTGTC CAAGCGGTCGGATGTGCTGCTGGAGCCCTTCCGCCGCGGTGTCATGGAGAAACTCCAGCTG GGCCCAGAGATTCTGCAGCGGGAAAATCCAAGGCTTATTTATGCCAGGCTGAGTGGATTTG GCCAGTCAGGAAGCTTCTGCCGGTTAGCTGGCCACGATATCAACTATTTGGCTTTGTCAGG TGGAAGGAACAGCATATTTAAGTTCTTTTCTGTGGAAAACTCAGAAATTGAGTCTGTGGGA AGCACCTCGAGGACAGAACATGTTGGATGGTGGAGCACCTTTCTATACGACTTACAGGACA GCAGATGGGGAATTCATGGCTGTTGGAGCAATAGAACCCCAGTTCTACGAGCTGCTGATCA AAGGACTTGGACTAAAGTCTGATGAACTTCCCAATCAGATGAGCATGGATGATTGGCCAGA AATGAAGAAGAAGTTTGCAGATGTATTTGCAGAGAAGACGAAGGCAGAGTGGTGTCAAATC TTTGACGGCACAGATGCCTGTGTGACTCCGGTTCTGACTTTTGAGGAGGTTGTTCATCATG ATCACAACAAGGAACGGGGCTCGTTTATCACCAGTGAGGAGCAGGACGTGAGCCCCCGCCC TGCACCTCTGCTGTTAAACACCCCAGCCATCCCTTCTTTCAAAAGGGATCCTTTCATAGGA GAACACACTGAGGAGATACTTGAAGAATTTGGATTCAGCCGCGAAGAGATTTATCAGCTTA ACTCAGATAAAATCATTGAAAGTAATAAGGTAAAAGCTAGTCTCTAACTTCCAGGCCCACG GCTCAAGTGAATTTGAATACTGCATTTACAGTGTAGAGTAACACATAACATTGTATGCATG GAAACATGGAGGAACAGTATTACAGTGTCCTACCACTCTAATCAAGAAAAGAATTACAGAC TCTGATTCTACAGTGATGATTGAATTCTAAAAATGGTTATCATTAGGGCTTTTGATTTATA AAACTTTGGGTACTTATACTAAATTATGGTAGTTATTCTGCCTTCCAGTTTGCTTGATATA TTTGTTGATATTAAGATTCTTGACTTATATTTTGAATGGGTTCTAGTGAAAAAGGAATGAT ATATTCTTGAAGACATCGATATACATTTATTTACACTCTTGATTCTACAATGTAGAAAATG AGGAAATGCCACAAATTGTATGGTGATAAAAGTCACGTGAAACAGAGTGATTGGTTGCATC CAGGCCTTTTGTCTTGGTGTTCATGATCTCCCTCTAAGCACATTCCAAACTTTAGCAACAG TTATCACACTTTGTAATTTGCAAAGAAAAGTTTCACCTGTATTGAATCAGAATGCCTTCAA CTGAAAAAAACATATCCAAAATAATGAGGAAATGTGTTGGCTCACTACGTAGAGTCCAGAG GGACAGTCAGTTTTAGGGTTGCCTGTATCCAGTAACTCGGGGCCTGTTTCCCCGTGGGTCT CTGGGCTGTCAGCTTTCCTTTCTCCATGTGTTTGATTTCTCCTCAGGCTGGTAGCAAGTTC TGGATCTTATACCCAACACACAGCAACATCCAGAAATAAAGATTTCAGGACCCCCCAGCAA GTCGTTTTGTGTCTCCTTGGACTGAGTTAAGTTACAAGCCTTTCTTATACCTGTCTTTGAC AAAGAAGACGGGATTGTCTTTACATAAAACCAGCCTGCTCCTGGAGCTTCCCTGGACTCAA CTTCCTAAAGGCATGTGAGGAAGGGGTAGATTCCACAATCTAATCCGGGTGCCATCAGAGT AGAGGGAGTAGAGAATGGATGTTGGGTAGGCCATCAATAAGGTCCATTCTGCGCAGTATCT CAACTGCCGTTCAACAATCGCAAGAGGAAGGTGGAGCAGGTTTCTTCATCTTACAGTTGAG AAAACAGAGACTCAGAAGGGCTTCTTAGTTCATGTTTCCCTTAGCGCCTCAGTGATTTTTT CATGGTGGCTTAGGCCAAAAGAAATATCTAACCATTCAATTTATAAATAATTAGGTCCCCA ACGAATTAAATATTATGTCCTACCAACTTATTAGCTGCTTGAAAAATATAATACACATAAA TAAAAAAATATATTTTTCATTTCTATTTCATTGTTAATCACAACTACTTACTAAGGAGATG TATGGACCTATTGGACACTGTGCAACTTCTCACCTGGAATGAGATTGGACACTGCTGCCGT CATTTTCTGCTCCATGTTGGTGTGCATATAGTACTTGATTTTTTATCAGATGGCCTGGAAA ACCCAGTCTCACAAAAATATGAAATTATCAGAAGGATTATAGTGCAATCTTATGTTGAAAG AATGAACTACCTCACTAGTAGTTCACGTGATGTCTGACAGATGTTGACTTTCATTGTGTTT GTGTGTTCAAATTTTTAAATATTCTGAGATACTCTTGTGAGGTCACTCTAATGCCCTGGGT GCGTTGGCACAGTTTTAGAAATACCAGTTGAAAATATTTGGTCAGGAATATGCAACTAGGA AGGGGCAGAATCAGAATTTAAGCTTTCATATTCTAGCCTTCAGTCTTGTTCTTCAACCATT TTTAGGAACTTTCCCATAAGGTTATGTTTTCCAGCCCAGGCATGGAGGATCACTTGAGGCC AAGAGTTCGAGACCAGCCTGGGGAACTTGGCTGGACCTCCGTTTCTACGAAATAAAAATAA AAAAATTATCCAGGTATGGTGGTGTGTGCCTGTAGTCCTATCTACTCAAGGGTGGGSCAGG AGGATCACTTGAGCCCAGaAATTTGAGGCCACAGTGAATTAGGATTGCACCACTGCACTGT AGGCCAGGCAACAGAACAAGAACCTGTCTCTAAATAAATAAATAAAAATAATAATAATAAA AAAGATGTTTTCCCTACAA Human AMACR, transcript variant 1, mRNA (SEQ ID NO: 38) (SEQ ID NO: 38) GGGGCGTGGCGCCGGGGATTGGGAGGGCTTCTTGCAGGCTGCTGGGCTGGGGCTAAGGGGT GCTCAGTTTCCTTCAGCGGGGCACTGGGAAGCGCCATGGCACTGCAGGGCATCTCGGTCGT GGAGCTGTCCGGCCTGGCCCCGGGCGCGTTCTGTGCTATGGTGCTGGCTGACTTCGGGGGG CGTGTGGTACGCGTGGACCGGCCGGGCTCCCGCTACGACGTGAGCCGCTTGGGCCGGGGCA AGGGGTGGCTAGTGCTGGACCTGAAGCAGCCGCGGGGAGCCGGCGTGCTGCGGCGTCTGTG CAAGCGGTCGGATGTGCTGCTGGAGCCCTTCCGCCGCGGTGTCATGGAGAAACTCCAGCTG GGCCCACAGATTCTGCAGCGGGAAAATCCAAGGCTTATTTATGCCAGGCTGAGTGGATTTG GCCAGTCAGGAAGCTTCTGCCGGTTAGCTGGCCACGATATCAACTATTTGGCTTTGTCAGG TGTTCTCTCAAAAATTGGCAGAAGTGGTGAGAATCCGTATGCCCCGCTGAATCTCCTGGCT GACTTTGCTGGTGGTGGCCTTATGTGTGCACTGGGCATTATAATGGCTCTTTTTGACCGCA CACGCACTGGCAAGGGTCAGGTCATTGATGCAAATATGGTGGAAGGAACAGCATATTTAAG TTCTTTTCTGTGGAAAACTCAGAAATTGAGTCTGTGGGAAGCACCTCGAGGACAGAACATG TTGGATGGTGGAGCACCTTTCTATACGACTTACAGGACAGCAGATGGGGAATTCATGGCTG
TTGGAGCAATAGAACCCCAGTTCTACGAGCTGCTGATCAAAGGACTTGGACTAAAGTCTGA TGAACTTCCCAATCAGATGAGCATGGATGATTGGCCAGAAATGAAGAAGAAGTTTGCAGAT GTATTTGCAGAGAAGACGAAGGCAGAGTGGTGTCAAATCTTTGACGGCACAGATGCCTGTG TGACTCCGGTTCTGACTTTTGAGGAGGTTGTTCATCATGATCACAACAAGGAACGGGGCTC GTTTATCACCAGTGAGGAGCAGGACGTGAGCCCCCGCCCTGCACCTCTGCTGTTAAACACC CCAGCCATCCCTTCTTTCAAAAGGGATCCTTTCATAGGAGAACACACTGAGGAGATACTTG AAGAATTTGGATTCAGCCGCGAAGAGATTTATCAGCTTAACTCAGATAAAATCATTGAAAG TAATAAGGCTGGTAGCAAGTTCTGGATCTTATACCCAACACACAGCAACATCCAGAAATAA AGATCTCAGGACCCCCCAGCAAGTCGTTTTGTGTCTCCTTGGACTGAGTTAAGTTACAAGC CTTTCTTATACCTGTCTTTGACAAAGAAGACGGGATTGTCTTTACATAAAACCAGCCTGCT CCTGGAGCTTCCCTGGACTCAACTTCCTAAAGGCATGTGAGGAAGGGGTAGATTCCACAAT CTAATCCGGGTGCCATCAGAGTAGAGGGAGTAGAGAATGGATGTTGGGTAGGCCATCAATA AGGTCCATTCTGCGCAGTATCTCAACTGCCGTTCAACAATCGCAAGAGGAAGGTGGAGCAG GTTTCTTCATCTTACAGTTGAGAAAACAGAGACTCAGAAGGGCTTCTTAGTTCATGTTTCC CTTAGCGCCTCAGTGATTTTTTCATGGTGGCTTAGGCCAAAAGAAATATCTAACCATTCAA TTTATAAATAATTAGGTCCCCAACGAATTAAATATTATGTCCTACCAACTTATTAGCTGCT TGAAAAATATAATACACATAAATAAAAAAATATATTTTTCATTTCTATTTCATTGTTAATC ACAACTACTTACTAAGGAGATGTATGCACCTATTGGACACTGTGCAACTTCTCACCTGGAA TGAGATTGGACACTGCTGCCCTCATTTTCTGCTCCATGTTGGTGTCCATATAGTACTTGAT TTTTTATCAGATGGCCTGGAAAACCCAGTCTCACAAAAATATGAAATTATCAGAAGGATTA TAGTGCAATCTTATGTTGAAAGAATGAACTACCTCACTAGTAGTTCACGTGATGTCTGACA GATGTTGAGTTTCATTGTGTTTGTGTGTTCAAATTTTTAAATATTCTGAGATACTCTTGTG AGGTCACTCTAATGCCCTGGGTGCCTTGGCACAGTTTTAGAAATACCAGTTGAAAATATTT GCTCAGGAATATGCAACTAGGAAGGGGCAGAATCAGAATTTAAGCTTTCATATTCTAGCCT TCAGTCTTGTTCTTCAACCATTTTTAGGAACTTTCCCATAAGGTTATGTTTTCCAGCCCAG GCATGGAGGATCACTTGAGGCCAAGAGTTCGAGACCAGCCTGGGGAACTTGGCTGGACCTC CGTTTCTACGAAATAAAAATAAAAAAATTATCCAGGTATGGTGGTGTGTGCCTGTAGTCCT ATCTACTCAAGGGTGGGGCAGGAGGATCACTTGAGCCCAGGAATTTGAGGCCACAGTGAAT TAGGATTGCACCACTGCACTGTAGGCCAGGCAACAGAACAAGAACCTGTCTGTAAATAAAT AAATAAAAATAATAATAATAAAAAAGATGTTTTCCCTACAA
In some embodiments, the kits and/or methods of the disclosure are used to detect BIRC5 mRNA having at least a portion, e.g., at least 10 nucleotides, at least 20 nucleotides, at least 30 nucleotides, at least 40 nucleotides, at least 50 nucleotides, at least 100 nucleotides, at least 150 nucleotides, at least 200 nucleotides, at least 250 nucleotides, at least 300 nucleotides, at least 350 nucleotides, at least 400 nucleotides, at least 450 nucleotides, and/or at least 500 nucleotides or more of the nucleic acid sequence of SEQ ID NO: 5, SEQ ID NO: 39, or SEQ ID NO: 40:
TABLE-US-00005 Human BIRC5, Transcript Variant 1, mRNA (SEQ ID NO: 5) (SEQ ID NO: 5) CCCAGAAGGCCGCGGGGGGTGGACCGCCTAAGAGGGCGTGCGCTCCCGACATGCCCCGCGG CGCGCCATTAACCGCCAGATTTGAATCGCGGGACCCGTTGGCAGAGGTGGCGGCGGCGGCA TGGGTGCCCCGACGTTGCCCCCTGCCTGGCAGCCCTTTCTCAAGGACCACCGCATCTCTAC ATTCAAGAACTGGCCCTTCTTGGAGGGCTGCGCCTGCACCCCGGAGCGGATGGCCGAGGCT GGCTTCATCCACTGCCCCACTGAGAACGAGCCAGACTTGGCCCAGTGTTTCTTCTGCTTCA AGGAGCTGGAAGGCTGGGAGCCAGATGACGACCCCATAGAGGAACATAAAAAGCATTCGTC CGGTTGCGCTTTCCTTTCTGTCAAGAAGCAGTTTGAAGAATTAACCCTTGGTGAATTTTTG AAACTGGACAGAGAAAGAGCCAAGAACAAAATTGCAAAGGAAACCAACAATAAGAAGAAAG AATTTGAGGAAACTGCGGAGAAAGTGCGCCGTGCCATCGAGCAGCTGGCTGCCATGGATTG AGGCCTCTGGCCGGAGCTGCCTGGTCCCAGAGTGGCTGCACCACTTCCAGGGTTTATTCCC TGGTGCCACCAGCCTTCCTGTGGGCCCCTTAGCAATGTCTTAGGAAAGGAGATCAACATTT TCAAATTAGATGTTTCAACTGTGCTCTTGTTTTGTCTTGAAAGTGGCACCAGAGGTGCTTC TGCCTGTGCAGCGGGTGCTGCTGGTAACAGTGGCTGCTTCTCTCTCTCTCTCTCTTTTTTG GGGGCTCATTTTTGCTGTTTTGATTCCCGGGCTTACCAGGTGAGAAGTGAGGGAGGAAGAA GGCAGTGTCCCTTTTGCTAGAGCTGACAGCTTTGTTCGCGTGGGCAGAGCCTTCCACAGTG AATGTGTCTGGACCTCATGTTGTTGAGGCTGTCACAGTCCTGAGTGTGGACTTGGCAGGTG CCTGTTGAATCTGAGCTGCAGGTTCCTTATCTGTCACACCTGTGCCTCCTCAGAGGACAGT TTTTTTGTTGTTGTGTTTTTTTGTTTTTTTTTTTTTGGTAGATGCATGACTTGTGTGTGAT GAGAGAATGGAGACAGAGTCCCTGGCTCCTCTACTGTTTAACAACATGGCTTTCTTATTTT GTTTGAATTGTTAATTCACAGAATAGCACAAACTACAATTAAAACTAAGCACAAAGCCATT CTAAGTCATTGGGGAAACGGGGTGAACTTCAGGTGGATGAGGAGACAGAATAGAGTGATAG GAAGCGTCTGGCAGATACTCCTTTTGCCACTGCTGTGTGATTAGACAGGCCCAGTGAGCCG CGGGGCACATGCTGGCCGCTCCTCCCTCAGAAAAAGGCAGTGGCCTAAATCCTTTTTAAAT GACTTGGCTCGATGCTGTGGGGGACTGGCTGGGCTGCTGCAGGCCGTGTGTCTGTCAGCCC AACCTTCACATCTGTCACGTTCTCCACACGGGGGAGAGACGCAGTCCGCCCAGGTCCCCGC TTTCTTTGGAGGCAGCAGCTCCCGCAGGGCTGAAGTCTGGCGTAAGATGATGGATTTGATT CGCCCTCCTCCCTGTCATAGAGCTGCAGGGTGGATTGTTACAGCTTCGCTGGAAACCTCTG GAGGTCATCTCGGCTGTTCCTGAGAAATAAAAAGCCTGTCATTTCAAACACTGCTGTGGAC CCTACTGGGTTTTTAAAATATTGTCAGTTTTTCATCGTCGTCCCTAGCCTGCCAACAGCCA TCTGCCCAGACAGCCGCAGTGAGGATGAGCGTCCTGGCAGAGACGCAGTTGTCTCTGGGCG CTTGCCAGAGCCACGAACCCCAGACCTGTTTGTATCATCCGGGCTCCTTCCGGGCAGAAAC AACTGAAAATGCACTTCAGACCCAVTTATTTCTGCCACATCTGAGTCGGCCTGAGATAGAC TTTTCCCTCTAAACTGGGAGAATATCACAGTGGTTTTTGTTAGCAGAAAATGCACTCCAGC CTCTGTACTCATCTAAGCTGCTTATTTTTGATATTTGTGTCAGTCTGTAAATGGATACTTC ACTTTAATAACTGTTGCTTAGTAATTGGCTTTGTAGAGAAGCTGGAAAAAAATGGTTTTGT CTTCAACTCCTTTGCATGCCAGGCGGTGATGTGGATCTCGGCTTCTGTGAGCCTGTGCTGT GGGCAGGGCTGAGCTGGAGCCGCCCCTCTCAGCCCGCCTGCCACGGCCTTTCCTTAAAGGC CATCCTTAAAACCAGACCCTCATGGCTACCAGCACCTGAAAGCTTCCTCGACATCTGTTAA TAAAGCCGTAGGCCCTTGTCTAAGTGCAACCGCCTAGACTTTCTTTCAGATACATGTCCAC ATGTCCATTTTTCAGGTTCTCTAAGTTGGAGTGGAGTCTGGGAAGGGTTGTGAATGAGGCT TCTGGGCTATGGGTGAGGTTCCAATGGCAGGTTAGAGCCCCTCGGGCCAACTGCCATCCTG GAAAGTAGAGACAGCAGTGCCCGCTGCCCAGAAGAGACCAGCAAGCCAAACTGGAGCCCCC ATTGCAGGCTGTCGCCATGTGGAAAGAGTAACTCACAATTGCCAATAAAGTCTCATGTGGT TTTATCTAAAAAAAAAAAAAAAAAAAAAAAAA Human BIRC5, Transcript Variant 2, mRNA (SEQ ID NO: 39) (SEQ ID NO: 39) CCCAGAAGGCCGCGGGGGGTGGACCGCCTAAGAGGGCGTGCGCTCCCGACATGCCCCGCGG CGCGCCATTAACCGCCAGATTTGAATCGCGGGACCCGTTGGCAGAGGTGGCGGCGGCGGCA TGGGTGCCCCGACGTTGCCCCCTGCCTGGCAGCCCTTTCTCAAGGACCACCGCATCTCTAC ATTCAAGAACTGGCCCTTCTTGGAGGGCTGCGCCTGCACCCCGGAGCGGATGGCCGAGGCT GGCTTCATCCACTGCCCCACTGAGAACGAGCCAGACTTGGCCCAGTGTTTCTTCTGCTTCA AGGAGCTGGAAGGCTGGGAGCCAGATGACGACCCCATGCAAAGGAAACCAACAATAAGAAG AAAGAATTTGAGGAAACTGCGGAGAAAGTGCGCCGTGCCATCGAGCAGCTGGCTGCCATGG ATTGAGGCCTCTGGCCGGAGCTGCCTGGTCCCAGAGTGGCTGCACCACTTCCAGGGTTTAT TCCCTGGTGCCACCAGCCTTCCTGTGGGCCCCTTAGCAATGTCTTAGGAAAGGAGATCAAC ATTTTCAAATTAGATGTTTCAACTGTGCTCTTGTTTTGTCTTGAAAGTGGCACCAGAGGTG CTTCTGCCTGTGCAGCGGGTGCTGCTGGTAACAGTGGCTGCTTCTCTCTCTCTCTCTCTTT TTTGGGGGCTCATTTTTGCTGTTTTGATTCCCGGGCTTACCAGGTGAGAAGTGAGGGAGGA AGAAGGCAGTGTCCCTTTTGCTAGAGCTGACAGCTTTGTTCGCGTGGGCAGAGCCTTCCAC AGTGAATGTGTCTGGACCTCATGTTGTTGAGGCTGTCACAGTCCTGAGTGTGGACTTGGCA GGTGCCTGTTGAATCTGAGCTGCAGGTTCCTTATCTGTCACACCTGTGCCTCCTCAGAGGA CAGTTTTTTTGTTGTTGTGTTTTTTTGTTTTTTTTTTTTTGGTAGATGCATGACTTGTGTG TGATGAGAGAATGGAGACAGAGDOCCTGGCTCCTCTACTGTTTAACAACATGGCTTTCTTA TTTTGTTTGAATTGTTAATTCACAGAATAGCACAAACTACAATTAAAACTAAGCACAAAGC CATTCTAAGTCATTGGGGAAACGGGGTGAACTTCAGGTGGATGAGGAGACAGAATAGAGTG ATAGGAAGCGTCTGGCAGATACTCCTTTTGCCACTGCTGTGTGATTAGACAGGCCCAGTGA GCCGGGGGGCACATGCTGGCCGCTCGTCCCTCAGAAAAAGGCAGTGGCCTAAATCCTTTTT AAATGACTTGGCTCGATGCTGTGGGGGACTGGCTGGGCTGGTGCAGGCCGTGTGTCTGTCA GCCCAACCTTCACATCTGTCACGTTGTCCACACGGGGGAGAGACGCAGTCCGCCCAGGTCC CCGCTTTCTTTGGAGGCAGCAGCTCGCGCAGGGCTGAAGTGTGGCGTAAGATGATGGATTT GATTGGGCCTCCTCCCTGTCATAGAGCTGCAGGGTGGATTGTTACAGCTTCGCTGGAAACC TCTGGAGGTCATCTCGGCTGTTCGTGAGAAATAAAAAGCCTGTCATTTCAAACACTGCTGT GGACCCTACTGGGTTTTTAAAATATTGTCAGTTTTTCATCGTGGTCCCTAGCCTGCCAACA GCCATCTGCCCAGACAGCCGCAGTGAGGATGAGCGTCCTGGCAGAGACGCAGTTGTCTCTG GGCGGTTGCCAGAGCCACGAACCGCAGACCTGTTTGTATCATGCGGGCTCCTTCCGSGCAG AAACAACTGAAAATGCACTTCAGACCCACTTATTTCTGCCACATCTGAGTCGGCCTGAGAT AGACTTTTCCCTCTAAACTGGGAGAATATCACAGTGGTTTTTGTTAGCACAAAATGCACTC CAGCCTGTGTACTCATCTAAGGTGCTTATTTTTGATATTTGTGTCAGTCTGTAAATGGATA CTTCACTTTAATAACTGTTGCTTAGTAATTGGCTTTGTAGAGAAGCTGGAAAAAAATGGTT TTGTGTTCAACTCCTTTGCATGCCAGGCGGTGATGTGGATGTGGGCTTCTGTGAGCCTGTG CTGTGGGCAGGGCTGAGCTGGAGGCGCCCCTCTCAGCCCGGCTGCCACGGCCTTTCCTTAA AGGCCATCCTTAAAACCAGACCCTCATGGCTACCAGCACCTGAAAGCTTCCTCGACATCTG TTAATAAAGCCGTAGGCCCTTGTCTAAGTGCAACCGCCTAGACTTTCTTTCAGATACATGT CCACATGTCCATTTTTCAGGTTCTCTAAGTTGGAGTGGAGTCTGGGAAGGGTTGTGAATGA GGCTTCTGGGCTATGGGTGAGGTTCCAATGGCAGGTTAGAGCGCCTCGGGCCAACTGCCAT CCTGGAAAGTAGAGACAGCAGTGGCCGCTGCCCAGAAGAGACCAGCAAGCCAAACTGGAGC CCCCGCATTGCAGGCTGTCGCCAGTGGAAAGAGTAACTCACAATTGCCAATAAAGTCTCAG TGGTTTTATCTAAAAAAAAAAAAAAAAAAAAAAAAA Human BIRC5, Transcript Variant 3, mRNA (SEQ ID NO: 40) (SEQ ID NO: 40) CCCAGAAGGCCGCGGGGGGTGGACCGCCTAAGAGGGCGTGCGCTCCCGACATGCCCCGCGG CGCGCCATTAACCGCCAGATTTGAATCGCGGGACCCGTTGGCAGAGGTGGCGGCGGCGGCA TGGGTGCCCCGACGTTGCCCCCTGCCTGGCAGCCCTTTCTCAAGGACCACCGCATCTCTAC ATTCAAGAACTGGCCCTTCTTGGAGGGCTGCGCCTGCACCCCGGAGCGGATGGCCGAGGCT GGCTTCATCCACTGCCCCACTGAGAACGAGCCAGACTTGGCCCAGTGTTTCTTCTGCTTCA AGGAGCTGGAAGGCTGGGAGCCAGATGACGACCCCATTGGGCCGGGCACGGTGGCTTACGC CTGTAATACCAGCACTTTGGGAGGCCGAGGCGGGCGGATCACGAGAGAGGAACATAAAAAG CATTCGTCCGGTTGCGCTTTCCTTTCTGTCAAGAAGCAGTTTGAAGAATTAACCCTTGGTG AATTTTTGAAACTGGACAGAGAAAGAGCCAAGAACAAAATTGCAAAGGAAACCAACAATAA GAAGAAAGAATTTGAGGAAACTCCGGAGAAAGTGCGCCGTGCCATCGAGCAGCTGGCTGCC ATGGATTGAGGCCTCTGGCCGGAGCTGCCTGGTCCCAGAGTGGCTGCACCACTTCCAGGGT TTATTCCCTGGTGCCACCAGCCTTCCTGTGGGCCCCTTAGCAATGTCTTAGGAAAGGAGAT CAACATTTTCAAATTAGATGTTTCAACTGTGCTCTTGTTTTGTCTTGAAAGTGGCACCAGA GGTGCTTCTGCCTGTGCAGCGGGTGCTGCTGGTAACAGTGGCTGCTTCTCTCTCTCTCTCT CTTTTTTGGGGGCTCATTTTTGCTGTTTTGATTCCCGGGCTTACCAGGTGAGAAGTGAGGG AGGAAGAAGGCAGTGTCCCTTTTGCTAGAGCTGACAGCTTTGTTCGCGTGGGCAGAGCCTT CCACAGTGAATGTGTCTGGACCTCATGTTGTTGAGGCTGTCACAGTCCTGAGTGTGGACTT GGCAGGTGCCTGTTGAATCTGAGCTGCAGGTTCCTTATCTGTCACACCTGTGCCTCCTCAG AGGACAGTTTTTTTGTTGTTGTGTTTTTTTGTTTTTTTTTTTTTGGTAGATGCATGACTTG TGTGTGATGAGAGAATGGAGACAGAGTCCCTGGCTCCTCTACTGTTTAACAACATGGCTTT CTTATTTTGTTTGAATTGTTAQTTCACAGAATAGCACAAACTACAATTAAAACTAAGCACA AAGCCATTCTAAGTCATTGGGGAAACGGGGTGAACTTCAGGTGGATGAGGAGACAGAATAG AGTGATAGGAAGCGTCTGGCAGATACTCCTTTTGCCACTGCTGTGTGATTAGACAGGCCCA GTGAGCCGCGGGGCACATGCTGGCCGCTCCTCCCTCAGAAAAAGGCAGTGGCCTAAATCCT TTTTAAATGACTTGGCTCGATGCTGTGGGGGACTGGCTGGGCTGCTGCAGGCCGTGTGTCT GTCAGCCCAACCTTCACATCTGTCACGTTCTCCACACGGGGGAGAGACGCAGTCCGCCCAG GTCCCCGCTTTCTTTGGAGGCAGCAGCTCCCGCAGGGCTGAAGTCTGGCGTAAGATGATGG ATTTGATTCGCCCTCCTCCCTGTCATAGAGCTGCAGGGTGGATTGTTACAGCTTCGCTGGA AACCTCTGGAGGTCATCTCGGCTGTTCCTGAGAAATAAAAAGCCTGTCATTTCAAACACTG CTGTGGACCCTACTGGGTTTTTAAAATATTGTCAGTTTTTCATCGTCGTCCCTAGCCTGCC AACAGCCATCTGCCCAGACAGCCGCAGTGAGGATGAGCGTCCTGGCAGAGACGCAGTTGTC TCTGGGCGCTTGCCAGAGCCACGAACCCCAGACCTGTTTGTATCATCCGGGCTCCTTCCGG GCAGAAACAACTGAAAATGCACTTCAGACCCACTTATTTCTGCCACATCTGAGTCGGCCTG AGATAGACTTTTCCCTCTAAACTGGGAGAATATCACAGTGGTTTTTGTTAGCAGAAAATGC ACTCCAGCCTGTGTACTCATGTAAGCTGCTTATTTTTGATATTTGTGTCAGTGTGTAAATG
GATACTTCACTTTAATAACTGTTGCTTAGTAATTGGCTTTGTAGAGAAGCTGGAAAAAAAT GGTTTTGTGTTCAACTGCTTTGCATGCCAGGCGGTGATGTGGATCTCGGCTTCTGTGAGCC TGTGCTGTGGGCAGGGCTGAGCTGGAGCCGCCCCTCTCAGCCCGCCTGCCACGGCCTTTCC TTAAAGGCCATGGTTAAAACCAGACCCTCATGGCTACCAGCACCTGAAAGCTTCCTCGACA TGTGTTAATAAAGGCGTAGGCCCTTGTGTAAGTGGAACCGCCTAGACTTTGTTTCAGATAC ATGTCCACATGTGCATTTTTCAGGTTCTCTAAGTTGGAGTGGAGTCTGGGAAGGGTTGTGA ATGAGGCTTCTGGGCTATGGGTGAGGTTCCAATGGCAGGTTAGAGCCCCTCGGGCCAACTG CCATCCTGGAAAGTAGAGACAGCAGTGCCCGCTGCCCAGAAGAGACCAGCAAGCCAAACTG GAGCCCCCATTGCAGGCTGTCGCCATGTGGAAAGAGTAACTCACAATTGCCAATAAAGTCT CATGTGGTTTTATCTAAAAAAAAAAAAAAAAAAAAAAAAA
In some embodiments, the kits and/or methods of the disclosure are used to detect HOXC6 mRNA having at least a portion, e.g., at least 10 nucleotides, at least 20 nucleotides, at least 30 nucleotides, at least 40 nucleotides, at least 50 nucleotides, at least 100 nucleotides, at least 150 nucleotides, at least 200 nucleotides, at least 250 nucleotides, at least 300 nucleotides, at least 350 nucleotides, at least 400 nucleotides, at least 450 nucleotides, and/or at least 500 nucleotides or more of the nucleic acid sequence of SEQ ID NO: 6 or SEQ ID NO: 41:
TABLE-US-00006 Human HOXC6, Transcript Variant 1, mRNA (SEQ ID NO: 6) (SEQ ID NO: 6) lTTTTGTCTGTCCTGGATTGGAGCCGTCCCTATAACCATCTAGTTCCGAGTACAAACTGGA GACAGAAATAAATATTAAAGAAATCATAGACCGACCAGGTAAAGGCAAAGGGATGAATTCC TACTTCACTAACCCTTCCTTATCCTGCCACCTCGCCGGGGGCCAGGACGTCCTCCCCAACG TCGCCCTCAATTCCACCGCCTATGATCCAGTGAGGCATTTCTCGACCTATGGAGCGGCCGT TGCCCAGAACCGGATCTACTCGACTCCCTTTTATTCGCCACAGGAGAATGTCGTGTTCAGT TCCAGCCGGGGGCCGTATGACTATGGATCTAATTCCTTTTACCAGGAGAAAGACATGCTCT CAAACTGCAGACAAAACACCTTAGGACATAACACACAGACCTCAATCGCTCAGGATTTTAG TTCTGAGCAGGGCAGGACTGCGCCCCAGGACCAGAAAGCCAGTATCCAGATTTACCCCTGG ATGCAGCGAATGAATTCGCACAGTGGGGTCGGCTACGGAGCGGACCGGAGGCGCGGCCGCC AGATCTACTCGCGGTACCAGACCCTGGAACTGGAGAAGGAATTTCACTTCAATCGCTACCT AACGCGGCGCCGGCGCATCGAGATCGCCAACGCGCTTTGCCTGACCGAGCGACAGATCAAA ATCTGGTTCCAGAACCGCCGGATGAAGTGGAAAAAAGAATCTAATCTCACATCCACTCTCT CGGGGGGCGGCGGAGGGGCCACCGCCGACAGCCTGGGCGGAAAAGAGGAAAAGCGGGAAGA GACAGAAGAGGAGAAGCAGAAAGAGTGACCAGGACTGTCCCTGCCACCCCTCTCTCCCTTT CTCCCTCGCTCCCCACCAACTCTCCCCTAATCACACACTCTGTATTTATCACTGGCACAAT TGATGTGTTTTGATTCCCTAAAACAAAATTAGGGAGTCAAACGTGGACCTGAAAGTCAGCT CTGGACCCCCTCCCTCACCGCACAACTCTCTTTCACCACGCGCCTCCTCCTCCTCGCTCCC TTGCTAGCTCGTTCTCGGCTTGTCTACAGGCCCTTTTCCCCGTCCAGGCCTTGGGGGCTCG GACCCTGAACTCAGACTCTACAGATTGCCCTCCAAGTGAGGACTTGGCTCCCCCACTCCTT CGACGCCCCCACCCCCGCCCCCCGTGCAGAGAGCCGGCTCCTGGGCCTGCTGGGGCCTCTG CTCCAGGGCCTCAGGGCCCGGCCTGGCAGCCGGGGAGGGCCGGAGGCCCAAGGAGGGCGCG CCTTGGCCCCACACCAACCCCCAGGGCCTCCCCGCAGTCCCTGCCTAGCCCCTCTGCCCCA GCAAATGCCCAGCCCAGGCAAATTGTATTTAAAGAATCCTGGGGGTCATTATGGCATTTTA CAAACTGTGACCGTTTCTGTGTGAAGATTTTTAGCTGTATTTGTGGTCTCTGTATTTATAT TTATGTTTAGCACCGTCAGTGTTCCTATCCAATTTCAAAAAAGGAAAAAAAAGAGGGAAAA TTACAAAAAGAGAGAAAAAAAGTGAATGACGTTTGTTTAGCCAGTAGGAGAAAATAAATAA ATAAATAAATCCCTTCGTGTTACCCTCCTGTATAAATCCAACCTCTGGGTCCGTTCTCGAA TATTTAATAAAACTGATATTATTTTTAAAACTTTA Human HOXC6, Transcript Variant 2, mRNA (SEQ ID NO: 41) (SEQ ID NO: 41) AACTTTTTATTGTGGTTTGTCCGTTCCGAGCGCTCCGCAGAACAGTCCTCCCTGTAAGAGC CTAACCATTGCCAGGGAAACCTGCCCTGGGCGCTCCCTTCATTAGCAGTATTTTTTTTAAA TTAATCTGATTAATAATTATTTTTCCCCCATTTAATTTTTTTTCCTCCCAGGTGGAGTTGC CGAAGCTGGGGGCAGCTGGGGAGGGTGGGGATGGGAGGGGAGAGACAGAAGTTGAGGGCAT CTCTCTCTTCCTTCCCGACCCTCTGGCCCCCAAGGGGCAGGAGGAATGCAGGAGCAGGAGT TGAGCTTGGGAGCTGCAGATGCCTCCGCCCCTCCTCTCTCCCAGGCTCTTCCTCCTGCCCC CTTCTTGCAACTCTCCTTAATTTTGTTTGGCTTTTGGATGATTATAATTATTTTTATTTTT GAATTTATATAAAGTATATGTGTGTGTGTGTGGAGCTGAGACAGGCTCGGCAGCGGCACAG AATGAGGGAAGACGAGAAAGAGAGTGGGAGAGAGAGAGGCAGAGAGGGAGAGAGGGAGAGT GACAGCAGCGCTCGGACGTCCTCCCCAACGTCGCCCTCAATTCCACCGCCTATGATCCAGT GAGGCATTTCTCGACCTATGGAGCGGCCGTTGCCCAGAACCGGATCTACTCGACTCCCTTT TATTCGCCACAGGAGAATGTCGTGTTCAGTTCCAGCCGGGGGCCGTATGACTATGGATCTA ATTCCTTTTACCAGGAGAAAGACATGCTCTCAAACTGCAGACAAAACACCTTAGGACATAA CACACAGACCTCAATCGCTCAGGATTTTAGTTCTGAGCAGGGCAGGACTGCGCCCCAGGAC CAGAAAGCCAGTATCCAGATTTACCCCTGGATGCAGCGAATGAATTCGCACAGTGGGGTCG GCTACGGAGCGGACCGGAGGCGCGGCCGCCAGATCTACTCGCGGTACCAGACCCTGGAACT GGAGAAGGAATTTCACTTCAATCGCTACCTAACGCGGCGCCGGCGCATCGAGATCGCCAAC GCGCTTTGCCTGACCGAGCGACAGATCAAAATCTGGTTCCAGAACCGCCGGATGAAGTGGA AAAAAGAATCTAATCTCACATGCACTCTCTCGGGGGGCGGCGGAGGGGCCACCGCCGACAG CCTGGGCGGAAAAGAGGAAAAGCGGGAAGAGACAGAAGAGGAGAAGGAGAAAGAGTGACCA GGACTGTCCCTGCCACCCGTCTCTCCCTTTCTCCCTCGCTCCCCACCAACTCTCCCGTAAT CACACACTGTGTATTTATCACTGGCACAATTGATGTGTTTTGATTCGCTAAAACAAAATTA GGGAGTCAAACGTGGACCTGAAAGTCAGCTCTGGACCCCCTCCCTCACCGCACAACTCTCT TTCACCACGCGCCTCCTCGTCCTCGCTCCCTTGCTAGCTCGTTCTCGGCTTGTCTACAGGC CCTTTTCCCCGTCCAGGCGTTGGGGGCTCGGACCCTGAACTCAGACTCTACAGATTGCCCT CCAAGTGAGGACTTGGCTCCCCCACTCCTTCGACGCCCCCACCCCCGCCCCCCGTGCAGAG AGCCGGCTCCTGGGCCTGCTGGGGCCTCTGCTCCAGGGCCTCAGGGCCCGGCCTGGCAGCC GGGGAGGGCCGGAGGCCCAAGGAGGGCGCGCCTTGGCCCCACACCAACCCCCAGGGCCTGC CCGCAGTCCCTGCCTAGCCCCTCTGCCCCAGCAAATGCCCAGGCCAGGCAAATTGTATTTA AAGAATGCTGGGGGTCATTATGGCATTTTACAAACTGTGACCGTTTCTGTGTGAAGATTTT TAGCTGTATTTGTGGTCTCTGTATTTATATTTATGTTTAGGACCGTCAGTGTTCCTATCCA ATTTCAAAAAAGGAAAAAAAAGAGGGAAAATTACAAAAAGAGAGAAAAAAAGTGAATGACG TTTGTTTAGCCAGTAGGAaAAAATAAATAAATAAATAAATCCGTTCGTGTTACCCTCGTGT ATAAATGCAACCTCTGGGTGCGTTCTCGAATATTTAATAAAACTGATATTATTTTTAAAAC TTTAAAA
In some embodiments, the kits and/or methods of the disclosure are used to detect SPARCL1 mRNA having at least a portion, e.g., at least 10 nucleotides, at least 20 nucleotides, at least 30 nucleotides, at least 40 nucleotides, at least 50 nucleotides, at least 100 nucleotides, at least 150 nucleotides, at least 200 nucleotides, at least 250 nucleotides, at least 300 nucleotides, at least 350 nucleotides, at least 400 nucleotides, at least 450 nucleotides, and/or at least 500 nucleotides or more of the nucleic acid sequence of SEQ ID NO: 7, SEQ ID NO: 42, SEQ ID NO: 43, or SEQ ID NO: 44:
TABLE-US-00007 Human SPARCL1, Transcript Variant 1, mRNA (SEQ ID NO: 7) (SEQ ID NO: 7) AAAAATGCATAAAGAGGCAAGTGGTTATATTGTGGCCAAGTTATGAGGCTGTGAGAACAAG AGGTTGAGGGGAAGACTGTTAACCGCATGCACGGCACCAGAATTAGGTGTTTGCCTTTTGG TTTGCAAGGACTGCGTGTAAAGGCCTGGGATGAGAGGCCAGGCTGCTAGGGAAATGCAGGA ATGTGCAACAAAAACGATaACAGTGTGAAATACTCTGTGGTGCCAACCTGCAAATTGTGGT CTGTCACTTCAGACCCCCACTAGTTGACAGAGCAGCAGAATTTCAACTCCAGTAGACTTGA ATATGCCTCTGGGGAAAGAAGGAGAGGTAACGAGGAAAGGGATTTAAAGAGTTTTTGTTGG GTGTTTGTCAAACTTTTATTCCCTGTCTGTGTGCAGAGGGGATTCAACTTCAATTTTTCTG CAGTGGCTCTGGGTCCAGCCCCTTACTTAAAGGCCATAAGATGTTTTATTGAAAGAAACTT TCAATATCAAGTAATCCAACCAACCTTCTAAGATAAGCCTTTTCCTTCAACACAAAGAAGT GCATTTTGCCAAATCTGGAAAGCATGAAGACTGGGCTTTTTTTCCTATGTCTCTTGGGAAC TGCAGCTGCAATCCCGACAAATGCAAGATTATTATCTGATCATTCCAAACCAACTGCTGAA ACGGTAGCACCTGACAACACTGCAATCCCCAGTTTAAGGGCTGAAGCTGAAGAAAATGAAA AAGAAACAGCAGTATCCACAGAAGACGATTCCCACCATAAGGCTGAAAAATCATCAGTACT AAAGTCAAAAGAGGAAAGCCATGAACAGTCAGCAGAACAGGGCAAGAGTTCTAGCCAAGAG CTGGGATTGAAGGATCAAGAGGACAGTGATGGTCACTTAAGTGTGAATTTGGAGTATGCAC CAACTGAAGGTACATTGGACATAAAAGAAGATATGAGTGAGCCTCAGGAGAAAAAACTCTC AGAGAACACTGATTTTTTGGCTCCTGGTGTTAGTTCCTTCACAGATTCTAACCAACAAGAA AGTATCACAAAGAGAGAGGAAAACCAAGAACAACCTAGAAATTATTCACATCATCAGTTGA ACAGGAGCAGTAAACATAGCCAAGGCCTAAGGGATCAAGGAAACCAAGAGCAGGATCCAAA TATTTCCAATGGAGAAGAGGAAGAAGAAAAAGAGCCAGGTGAAGTTGGTACCCACAATGAT AACCAAGAAAGAAAGACAGAATTGCCCAGGGAGCATGCTAACAGCAAGCAGGAGGAAGACA ATACCCAATCTGATGATATTTTGGAAGAGTCTGATCAACCAACTCAAGTAAGCAAGATGCA GGAGGATGAATTTGATCAGGGTAACCAAGAACAAGAAGATAACTCCAATGCAGAAATGGAA GAGGAAAATGCATCGAACGTCAATAAGCACATTCAAGAAACTGAATGGCAGAGTCAAGAGG GTAAAACTGGCCTAGAAGCTATCAGCAACCACAAAGAGACAGAAGAAAAGACTGTTTCTGA GGCTCTGCTCATGGAACCTACTGATGATGGTAATACCACGCCCAGAAATCATGGAGTTGAT GATGATGGCGATGATGATGGCGATGATGGCGGCACTGATGGCCCCAGGCACAGTGCAAGTG ATGACTACTTCATCCCAAGCCAGGCCTTTCTGGAGGCCGAGAGAGCTCAATCCATTGCCTA TCACCTCAAAATTGAGGAGCAAAGAGAAAAAGTACATGAAAATGAAAATATAGGTACCACT GAGCCTGGAGAGCACCAAGAGGCCAAGAAAGCAGAGAACTCATCAAATGAGGAGGAAACGT CAAGTGAAGGCAACATGAGGGTGCATGCTGTGGATTCTTGCATGAGCTTCCAGTGTAAAAG AGGCCACATCTGTAAGGCAGACCAACAGGGAAAACCTCACTGTGTCTGCCAGGATCCAGTG ACTTGTCCTCCAACAAAACCCCTTGATCAAGTTTGTGGCACTGACAATCAGACCTATGCTA GTTCCTGTCATCTATTCGCTACTAAATGCAGACTGGAGGGGACCAAAAAGGGGCATCAACT CCAGCTGGATTATTTTGGAGCCTGCAAATCTATTCCTACTTGTACGGACTTTGAAGTGATT CAGTTTCCTCTACGGATGAGAGACTGGCTCAAGAATATCCTCATGCAGCTTTATGAAGCCA ACTCTGAACACGCTGGTTATCTAAATGAGAAGCAGAGAAATAAAGTCAAGAAAATTTACCT GGATGAAAAGAGGCTTTTGGCTGGGGACCATCCCATTGATCTTCTCTTAAGGGACTTTAAG AAAAACTACCACATGTATGTGTATCCTGTGCACTGGCAGTTTAGTGAACTTGACCAACACC CTATGGATAGAGTCTTGACACATTCTGAACTTGCTCCTCTGCGAGCATCTCTGGTGCCCAT GGAACACTGCATAACCCGTTTCTTTGAGGAGTGTGACCCCAACAAGGATAAGCACATCACC CTGAAGGAGTGGGGCCACTGCTTTGGAATTAAAGAAGAGGACATAGATGAAAATCTCTTGT TTTGAACGAAGATTTTAAAGAACTCAACTTTCCAGCATCCTCCTCTGTTCTAACCACTTCA GAAATATATGCAGCTGTGATACTTGTAGATTTATATTTAGCAAAATGTTAGCATGTATGAC AAGACAATGAGAGTAATTGCTTGACAACAACCTATGCACCAGGTATTTAACATTAACTTTG GAAACAAAAATGTACAATTAAGTAAAGTCAACATATGCAAAATACTGTACATTGTGAACAG AAGTTTAATTCATAGTAATTTCACTCTCTGCATTGACTTATGAGATAATTAATGATTAAAC TATTAATGATAAAAATAATGCATTTGTATTGTTCATAATATCATGTGCACTTCAAGAAAAT GGAATGCTACTCTTTTGTGGTTTACGTGTATTATTTTCAATATCTTAATACCCTAATAAAG AGTCCATAAAAATCCAAATGCTT Human SPARCL1, Transcript Variant 2, mRNA (SEQ ID NO: 42) (SEQ ID NO: 42) AAAAATGCATAAAGAGCCAAGTGCTTATATTCTGGCCAAGTTATGAGGCTCTGAGAACAAG AGCTTGAGGCGAAGACTGTTAACCCCATCCACGCCACCAGAATTAGCTCTTTCCCTTTTGG TTTGCAAGCACTGCCTGTAAAGCCCTCGCATGAGAGGCCAGCCTGCTAGGGAAATCCAGGA ATCTGCAACAAAAACGATGACAGTCTGAAATACTCTCTGGTGCCAACCTCCAAATTCTCGT CTGTCACTTCAGACCCCCACTAGTTGACAGAGCAGGAGAATTTCAACTCCAGTAGACTTGA ATATGCCTCTGGGCAAAGAAGGAGAGCTAACGAGGAAAGGGATTTAAAGAGTTTTTCTTGG GTGTTTGTCAAACTTTTATTCCCTGTCTGTGTGCAGAGGGGATTCAACTTCAATTTTTCTG CAGTGGCTCTGGGTCCAGCCCCTTACTTAAAGATCTGGAAAGCATGAAGACTGGGCTTTTT TTCCTATGTCTCTTGGGAACTGCAGCTGCAATCCCGACAAATGCAAGATTATTATCTGATC ATTCCAAACCAACTGCTGAAACGGTAGCACCTGACAACACTGCAATCCCCAGTTTAAGGGC TGAAGCTGAAGAAAATaAAAAAGAAACAGCAGTATCCACAGAAGACGATTCCCACCATAAG GCTGAAAAATCATCAGTACTAAAGTCAAAAGAGGAAAGCCATGAACAGTCAGGAGAACAGG GCAAGAGTTCTAGCCAAGAGCTGGGATTGAAGGATCAAGAGGACAGTGATGGTCACTTAAG TGTGAATTTGGAGTATGCACCAACTGAAGGTACATTGGACATAAAAGAAGATATGAGTGAG CCTCAGGAGAAAAAACTCTCAGAGAACACTGATTTTTTGGCTCCTGGTGTTAGTTCCTTCA CAGATTCTAACCAACAAGAAAGTATCACAAAGAGAGAGGAAAACCAAGAACAACCTAGAAA TTATTCACATCATCAGTTGAACAGGAGCAGTAAACATAGCCAAGGCCTAAGGGATCAAGGA AACCAAGAGCAGGATCCAAATATTTCCAATGGAGAAGAGGAAGAAGAAAAAGAGCCAGGTG AAGTTGGTACCCACAATGATAACCAAGAAAGAAAGACAGAATTGCCCAGGGAGCATGCTAA CAGCAAGCAGGAGGAAGACAATACCCAATCTGATGATATTTTGGAAGAGTCTGATCAACCA ACTCAAGTAAGCAAGATGCAGGAGGATGAATTTGATCAGGGTAACCAAGAACAAGAAGATA ACTCCAATGCAGAAATGGAAGAGGAAAATGCATCGAACGTCAATAAGCACATTCAAGAAAC TGAATGGCAGAGTCAAGAGGGTAAAACTGGCCTAGAAGCTATCAGCAACCACAAAGAGACA GAAGAAAAGACTGTTTCTGAGGCTCTGCTCATGGAACCTACTGATGATGGTAATACCACGC CCAGAAATCATGGAGTTGATGATGATGGCGATGATGATGGCGATGATGGCGGCACTGATGG CCCCAGGCACAGTGCAAGTGATGACTACTTCATCCCAAGCCAGGCCTTTCTGGAGGCCGAG AGAGCTCAATCCATTGCCTATCACCTCAAAATTGAGGAGCAAAGAGAAAAAGTACATGAAA ATGAAAATATAGGTACCACTGAGCCTGGAGAGCACCAAGAGGCCAAGAAAGCAGAGAACTC ATCAAATGAGGAGGAAACGTCAAGTGAAGGCAACATGAGGGTGCATGCTGTGGATTCTTGC ATGAGCTTCCAGTGTAAAAGAGGCCACATCTGTAAGGCAGACCAACAGGGAAAACCTCACT GTGTCTGCCAGGATCCAGTGACTTGTCCTCCAACAAAACCCCTTGATCAAGTTTGTGGCAC TGACAATCAGACCTATGCTAGTTCCTGTCATCTATTCGCTACTAAATGCAGACTGGAGGGG ACCAAAAAGGGGCATCAACTCCAGCTGGATTATTTTGGAGCCTGCAAATCTATTCCTACTT GTACGGACTTTGAAGTaATTCAGTTTCCTCTACGGATGAGAGACTGGCTCAAGAATATCCT CATGCAGCTTTATGAAGCCAACTCTGAACACGCTGGTTATCTAAATGAGAAGCAGAaAAAT AAAGTCAAGAAAATTTACCTGGATGAAAAGAGGCTTTTGGCTGGGGACCATCCCATTGATC TTCTCTTAAGGGACTTTAAGAAAAACTACCACATGTATGTGTATCCTGTGCACTGGCAGTT TAGTGAACTTGACCAACACCCTATGGATAGAGTCTTGACACATTCTGAACTTGCTCCTCTG CGAGCATCTCTGGTGCCCATGGAACACTGCATAACCCGTTTCTTTGAGGAGTGTGACCCCA ACAAGGATAAGCACATCACCCTGAAGGAGTGGGGCCACTGCTTTGGAATTAAAGAAGAGGA CATAGATGAAAATCTCTTGTTTTGAACGAAGATTTTAAAGAACTCAACTTTCCAGCATCCT CCTCTGTTCTAACCACTTCAGAAATATATGCAGCTGTGATACTTGTAGATTTATATTTAGC AAAATGTTAGCATGTATGACAAGACAATGAGAGTAATTGCTTGACAACAACCTATGCACCA GGTATTTAACATTAACTTTGGAAACAAAAATGTACAATTAAGTAAAGTCAACATATGCAAA ATACTGTACATTGTGAACAGAAGTTTAATTCATAGTAATTTCACTCTCTGCATTGACTTAT GAGATAATTAATGATTAAACTATTAATGATAAAAATAATGCATTTGTATTGTTCATAATAT CAGTGCACTTCAAGAAAATGGAATGCTACTCTTTTGTGGTTTACGTGTATTATTTTCAAT ATCTTAATACCCTAATAAAGM;TCCATAAAAATCCAAATGCTT Human SPARCL1, Transcript Variant 3, mRNA (SEQ ID NO: 43) (SEQ ID NO: 43) AAAAATGCATAAAGAGCCAAGTGCTTATATTCTGGCCAAGTTATGAGGCTCTGAGAACAAG AGCTTGAGGGGAAGACTGTTAACCCCATCCACGCCACCAGAATTAGCTCTTTCCCTTTTGG TTTGCAAGCACTGCCTGTAAM;CCCTCGCATGAGAGGCCAGCCTGCTAGGGAAATCCAGGA ATCTGCAACAAAAACGATGACAGTCTGAAATACTCTCTGGTGCCAACCTCCAAATTCTCGT CTGTCACTTCAGACCCCCACTAGTTGACAGAGCAGCAGAATTTCAACTCCAGTAGACTTGA ATATGCCTCTGGGCAAAGAAGCAGAGCTAACGAGGAAAGGGATTTAAAGAGTTTTTCTTGG GTGTTTGTCAAACTTTTATTCCCTGTCTGTGTGCAGAGGGGATTCAACTTCAATTTTTCTG CAGTGGCTCTGGGTCCAGCCCCTTACTTAAAGATCTGGAAAGCATGAAGACTGGGCTTTTT TTCCTATGTCTCTTGGGAACTGCAGCTGCAATCCCGGTGAAAAGGAGATAAGAAGCAAAGG AGCAAACCAAACCTAATATGAATCCTGTACTTTGGCCAGAAGCCGTGGCTCACATCTGTAA TCCCAGCACTTTGGGAGGCCAAGACAAATGCAAGATTATTATCTGATCATTCCAAACCAAC TGCTGAAACGGTAGCACCTGACAACACTGCAATCCCCAGTTTAAGGGCTGAAGCTGAAGAA AATGAAAAAGAAACAGCAGTATCCACAGAAGACGATTCCCACCATAAGGCTGAAAAATCAT CAGTACTAAAGTCAAAAGAGGAAAGCCATGAACAGTCAGCAGAACAGGGCAAGAGTTCTAG CCAAGAGCTGGGATTGAAGGATCAAGAGGACAGTGATGGTCACTTAAGTGTGAATTTGGAG TATGCACCAACTGAAGGTACATTGGACATAAAAGAAGATATGAGTGAGCCTCAGGAGAAAA AACTCTCAGAGAACACTGATTTTTTGGCTCCTGGTGTTAGTTCCTTCACAGATTCTAACCA ACAAGAAAGTATCACAAAGAGAGAGGAAAACCAAGAACAACCTAGAAATTATTCACATCAT CAGTTGAACAGGAGCAGTAAACATAGCCAAGGCCTAAGGGATCAAGGAAACCAAGAGCAGG ATCCAAATATTTCCAATGGAGAAGAGGAAGAAGAAAAAGAGCCAGGTGAAGTTGGTACCCA CAATGATAACCAAGAAAGAAAGACAGAATTGCCCAGGGAGCATGCTAACAGCAAGCAGGAG GAAGACAATACCCAATCTGATGATATTTTGGAAGAGTCTGATCAACCAACTCAAGTAAGCA AGATGCAGGAGGATGAATTTGATCAGGGTAACCAAGAACAAGAAGATAACTCCANTGCAGA
AATGGAAGAGGAAAATGCATCGAACGTCAATAAGCACATTCAAGAAACTGAATGGCAGAGT CAAGAGGGTAAAACTGGCCTAGAAGCTATCAGCAACCACAAAGAGACAGAAGAAAAGACTC TTTCTGAGGCTCTGCTCATGGAACCTACTGATGATGGTAATACCACGCCCAGAAATCATGG AGTTGATGATGATGGCGATGATGATGGCGATGATGGCGGCACTGATGGCCCCAGGCACAGT GCAAGTGATGACTACTTCATCCCAAGCCAGGCCTTTCTGGAGGCCCAGAGAGCTCAATCCA TTGCCTATCACCTCAAAATTGAGGAGCAAAGAGAAAAAGTACATGAAAATGAAAATATAGG TACCACTGAGCCTGGAGAGCACCAAGAGGCCAAGAAAGCAGAGAACTCATCAAATGAGGAG GAAACGTCAAGTGAAGGCAACATGAGGGTGCATGCTGTGGATTCTTGCATGAGCTTCCAGT GTAAAAGAGGCCACATCTGTAAGGCAGACCAACAGGGAAAACCTCACTGTGTCTGCCAGGA TCCAGTGACTTGTCCTCCAACAAAACCCCTTGATCAAGTTTGTGGCACTGACAATCAGACC TATGCTAGTTCCTGTCATCTATTCGCTACTAAATGCAGACTGGAGGGGACCAAAAAGGGGC ATCAACTCCAGCTGGATTATTTTGGAGCCTGCAAATCTATTCCTACTTGTACGGACTTTGA AGTGATTCAGTTTCCTCTACGGATGAGAGACTGGCTCAAGAATATCCTCATGCAGCTTTAT GAAGCCAACTCTGAACACGCTGGTTATCTAAATGAGAAGCAGAGAAATAAAGTCAAGAAAA TTTACCTGGATGAAAAGAGGCTTTTGGCTGGGGACCATCCCATTGATCTTCTCTTAAGGGA CTTTAAGAAAAACTACCACATGTATGTGTATCCTGTGCACTGGCAGTTTAGTGAACTTGAC CAACACCCTATGGATAGAGTCTTGACACATTCTGAACTTGCTCCTCTGCGAGCATCTCTGG TGCCCATGGAACACTGCATAACCCGTTTCTTTGAGGAGTGTGACCCCAACAAGGATAAGCA CATCACCCTGAAGGAGTGGGGCCACTGCTTTGGAATTAAAGAAGAGGACATAGATGAAAAT CTCTTGTTTTGAACGAAGATTTTAAAGAACTCAACTTTCCAGCATCCTCCTCTGTTCTAAC CACTTCAGAAATATATGCAGCTGTGATACTTGTAGATTTATATTTAGCAAAATGTTAGCAT GTATGACAAGACAATGAGAGTAATTGCTTGACAACAACCTATGCACCAGGTATTTAACATT AACTTTGGAAACAAAAATGTACAATTAAGTAAAGTCAACATATGCAAAATACTGTACATTG TGAACAGAAGTTTAATTCATAGTAATTTCACTCTCTGCATTGACTTATGAGATAATTAATG ATTAAACTATTAATGATAAAAATAATGCATTTGTATTGTTCATAATATCATGTGCACTTCA AGAAAATGGAATGCTACTCTTTTGTGGTTTACGTGTATTATTTTCAATATCTTAATACCCT AATAAAGAGTCCATAAAAATCCAAATGCTT Human SPARCL1, Transcript Variant 4, mRNA (SEQ ID NO: 44) (SEQ ID NO: 44) AAAAATGCATAAAGAGCCAAGTGCTTATATTCTGGCCAAGTTATGAGGCTCTGAGAACAAG AGCTTGAGGCGAAGACTGTTAACCCCATCCACGCCACCAGAATTAGCTCTTTCCCTTTTGG TTTGCAAGCACTGCCTGTAAAGCCCTCGCATGAGAGGCCAGCCTGCTAGGGAAATCCAGGA ATCTGCAACAAAAACGATGACAGTCTGAAATACTCTCTGGTGCCAACCTCCAAATTCTCGT CTGTCACTTCAGACCCCCACTAGTTGACAGAGCAGCAGAATTTCAACTCCAGTAGACTTGA ATATGCCTCTGGGCAAAGAAGGAGAGCTAACGAGGAAAGGGATTTAAAGAGTTTTTCTTGG GTGTTTGTCAAACTTTTATTCCCTGTCTGTGTGCAGAGGGGATTCAACTTCAATTTTTCTG CAGTGGCTCTGGGTCCAGCCCCTTACTTAAAGATCTGGAAAGCCATGAACAGTCAGCAGAA CAGGGCAAGAGTTCTAGCCAAGAGCTGGGATTGAAGGATCAAGAGGACAGTGATGGTCACT TAAGTGTGAATTTGGAGTATGCACCAACTGAAGGTACATTGGACATAAAAGAAGATATGAG TGAGCCTCAGGAGAAAAAACTCTCAGAGAACACTGATTTTTTGGCTCCTGGTGTTAGTTCC TTCACAGATTCTAACCAACAAGAAAGTATCACAAAGAGAGAGGAAAACCAAGAACAACCTA GAAATTATTCACATCATCAGTTGAACAGGAGCAGTAAACATAGCCAAGGCCTAAGGGATCA AGGAAACCAAGAGCAGGATCCAAATATTTCCAATGGAGAAGAGGAAGAAGAAAAAGAGCCA GGTGAAGTTGGTACCCACAATGATAACCAAGAAAGAAAGACAGAATTGCCCAGGGAGCATG CTAACAGCAAGCAGGAGGAAGACAATACCCAATCTGATGATATTTTGGAAGAGTCTGATCA ACCAACTCAAGTAAGCAAGATGCAGGAGGATGAATTTGATCAGGGTAACCAAGAACAAGAA GATAACTCCAATGCAGAAATGGAAGAGGAAAATGCATCGAACGTCAATAAGCACATTCAAG AAACTGAATGGCAGAGTCAAGAGGGTAAAACTGGCCTAGAAGCTATCAGCAACCACAAAGA GACAGAAGAAAAGACTGTTTCTGAGGCTCTGCTCATGGAACCTACTGATGATGGTAATACC ACGCCCAGAAATCATGGAGTTGATGATGATGGCGATGATGATGGCGATGATGGCGGCACTG ATGGCCCCAGGCACAGTGCAM;TGATGACTACTTCATCCCAAGCCAGGCCTTTCTGGAGGC CGAGAGAGCTCAATCCATTGCCTATCACCTCAAAATTGAGGAGCAAAGAGAAAAAGTACAT GAAAATGAAAATATAGGTACCACTGAGCCTGGAGAGCACCAAGAGGCCAAGAAAGCAGAGA ACTCATCAAATGAGGAGGAAACGTCAAGTGAAGGCAACATGAGGGTGCATGCTGTGGATTC TTGCATGAGCTTCCAGTGTAAAAGAGGCCACATCTGTAAGGCAGACCAACAGGGAAAACCT CACTGTGTCTGCCAGGATCCAGTGACTTGTCCTCCAACAAAACCCCTTGATCAAGTTTGTG GCACTGACAATCAGACCTATGCTAGTTCCTGTCATCTATTCGCTACTAAATGCAGACTGGA GGGGACCAAAAAGGGGCATCAACTCCAGCTGGATTATTTTGGAGCCTGCAAATCTATTCCT ACTTGTACGGACTTTGAAGTGATTCAGTTTCCTCTACGGATGAGAGACTGGCTCAAGAATA TCCTCATGCAGCTTTATGAAGCCAACTCTGAACACGCTGGTTATCTAAATGAGAAGCAGAG AAATAAAGTCAAGAAAATTTACCTGGATGAAAAGAGGCTTTTGGCTGGGGACCATCCCATT GATCTTCTCTTAAGGGACTTTAAGAAAAACTACCACATGTATGTGTATCCTGTGCACTGGC AGTTTAGTGAACTTGACCAACACCCTATGGATAGAGTCTTGACACATTCTGAACTTGCTCC TCTGCGAGCATCTCTGGTGCCCATGGAACACTGCATAACCCGTTTCTTTGAGGAGTGTGAC CCCAACAAGGATAAGCACATCACCCTGAAGGAGTGGGGCCACTGCTTTGGAATTAAAGAAG AGGACATAGATGAAAATCTCTTGTTTTGAACGAAGATTTTAAAGAACTCAACTTTCCAGCA TCCTCCTCTGTTCTAACCACTTCAGAAATATATGCAGCTGTGATACTTGTAGATTTATATT TAGCAAAATGTTAGCATGTATGACAAGACAATGAGAGTAATTGCTTGACAACAACCTATGC ACCAGGTATTTAACATTAACTTTGGAAACAAAAATGTACAATTAAGTAAAGTCAACATATG CAAAATACTGTACATTGTGAACAGAAGTTTAATTCATAGTAATTTCACTCTCTGCATTGAC TTATGAGATAATTAATGATTAAACTATTAATGATAAAAATAATGCATTTGTATTGTTCATA ATATCATGTGCACTTCAAGAAAATGGAATGCTACTCTTTTGTGGTTTACGTGTATTATTTT CAATATCTTAATACCCTAATAAAGAGTCCATAAAAATCCAAATGCTT
In some embodiments, the kits and/or methods of the disclosure are used to detect (i) ERG mRNA having at least a portion, e.g., at least 10 nucleotides, at least 20 nucleotides, at least 30 nucleotides, at least 40 nucleotides, at least 50 nucleotides, at least 100 nucleotides, at least 150 nucleotides, at least 200 nucleotides, and/or at least 250 nucleotides or more of the nucleic acid sequence of SEQ ID NO: 2, (ii) PCA3 mRNA having at least a portion, e.g., at least 10 nucleotides, at least 20 nucleotides, at least 30 nucleotides, at least 40 nucleotides, at least 50 nucleotides, at least 100 nucleotides, at least 150 nucleotides, at least 200 nucleotides, at least 250 nucleotides, at least 300 nucleotides, at least 350 nucleotides, at least 400 nucleotides, and/or at least 450 nucleotides or more of the nucleic acid sequence of SEQ ID NO: 3, and (iii) at least a portion of at least one other mRNA selected from the group consisting of (1) AMACR mRNA having at least a portion, e.g., at least 10 nucleotides, at least 20 nucleotides, at least 30 nucleotides, at least 40 nucleotides, at least 50 nucleotides, at least 100 nucleotides, at least 150 nucleotides, at least 200 nucleotides, at least 250 nucleotides, at least 300 nucleotides, at least 350 nucleotides, at least 400 nucleotides, at least 450 nucleotides, and/or at least 500 nucleotides or more of the nucleic acid sequence of SEQ ID NO: 4, SEQ ID NO: 37, or SEQ ID NO: 38; (2) BIRC5 mRNA having at least a portion, e.g., at least 10 nucleotides, at least 20 nucleotides, at least 30 nucleotides, at least 40 nucleotides, at least 50 nucleotides, at least 100 nucleotides, at least 150 nucleotides, at least 200 nucleotides, at least 250 nucleotides, at least 300 nucleotides, at least 350 nucleotides, at least 400 nucleotides, at least 450 nucleotides, and/or at least 500 nucleotides or more of the nucleic acid sequence of SEQ ID NO: 5, SEQ ID NO: 39, or SEQ ID NO: 40; (3) HOXC6 mRNA having at least a portion, e.g., at least 10 nucleotides, at least 20 nucleotides, at least 30 nucleotides, at least 40 nucleotides, at least 50 nucleotides, at least 100 nucleotides, at least 150 nucleotides, at least 200 nucleotides, at least 250 nucleotides, at least 300 nucleotides, at least 350 nucleotides, at least 400 nucleotides, at least 450 nucleotides, and/or at least 500 nucleotides or more of the nucleic acid sequence of SEQ ID NO: 6 or SEQ ID NO: 41; and (4) SPARCL1 mRNA having at least a portion, e.g., at least 10 nucleotides, at least 20 nucleotides, at least 30 nucleotides, at least 40 nucleotides, at least 50 nucleotides, at least 100 nucleotides, at least 150 nucleotides, at least 200 nucleotides, at least 250 nucleotides, at least 300 nucleotides, at least 350 nucleotides, at least 400 nucleotides, at least 450 nucleotides, and/or at least 500 nucleotides or more of the nucleic acid sequence of SEQ ID NO: 7, SEQ ID NO: 42, SEQ ID NO: 43, or SEQ ID NO: 44.
In some embodiments, the kits and/or methods of the disclosure are used to detect ERG mRNA having the full-length nucleic acid sequence of SEQ ID NO: 2, PCA3 mRNA having the full-length nucleic acid sequence of SEQ ID NO: 3, and at least one other mRNA selected from the group consisting of AMACR mRNA having the full-length nucleic acid sequence of SEQ ID NO: 4, SEQ ID NO: 37, or SEQ ID NO: 38, BIRC5 mRNA having the full-length nucleic acid sequence of SEQ ID NO: 5, SEQ ID NO: 39, or SEQ ID NO: 40, HOXC6 mRNA having the full-length nucleic acid sequence of SEQ ID NO: 6 or SEQ ID NO: 41, and SPARCL1 mRNA having the full-length nucleic acid sequence of SEQ ID NO: 7, SEQ ID NO: 42, SEQ ID NO: 43, or SEQ ID NO: 44.
The level of mRNA expression is detected using any of a variety of art-recognized techniques. For example, the Ct (cycle threshold) values for each biomarker in urine microvesicles are determined by RT-qPCR analysis. In a real time PCR assay a positive reaction is detected by accumulation of a fluorescent signal. The Ct value is defined as the number of cycles required for the fluorescent signal to cross the threshold (i.e., exceeds background level). Ct levels are inversely proportional to the amount of target nucleic acid in the sample (i.e., the lower the Ct level the greater the amount of target nucleic acid in the sample).
In some embodiments, the copy number of the detected genes (i.e., PCA3 and ERG) is calculated. Copy number can also be quantified using RT-qPCR analysis of one or more nucleic acids extracted from urine microvesicles. The skilled artisan can readily determine copy number using methods known in the art, such as by using a calibration curve.
To generate a calibration curve, a dilution series of known copy numbers of cDNA of a synthetic RNA sequence identical to the detected genes are analyzed on the same plate as the samples being analyzed for those same genes. By comparing the Ct values of samples to the Ct values of the calibration curve the exact copy number of sequences in the analyzed samples can be determined. By relating sample Ct values to calibration curves on the same plate the process "normalizes" for differences in performance of the assay due to variations in pipet inaccuracy, assay component performance (e.g., enzymes, probes, primers, dNTPs, etc.), qPCR thermocycler instrument performance (e.g., filters, temperature, etc.) and other plate-to-plate variation that might occur.
In the methods provided herein, those genes whose expression levels are used to calculate relative expression levels are referred to collectively as "reference genes." A reference gene used to determine the sufficiency of the urine sample for microvesicle-derived RNA are genes that are typically found in urine microvesicles, such as housekeeping genes or prostate-specific genes. The expression level of these reference genes are used to normalize for the amount of signal detected to control for variability in the quantity of microvesicles isolated between samples. For example, in the methods provided herein, the reference gene used for normalization of PCA3 and ERG expression can be KLK3, the gene encoding or prostate specific antigen (PSA), or SPDEF. The reference gene may be a prostate-specific gene. In some embodiments, the reference gene may be a non-tissue specific housekeeping gene, for example GAPDH. In the methods provided herein, the relative expression analysis, or normalization, is accomplished by subtracting the Ct value for the prostate-specific marker gene (e.g., KLK3) from the Ct values obtained for PCA3 and ERG with the result referred to as .DELTA.Ct. Copy numbers are calculated by fitting a curve of the following formula Ct=b+a*log 10(Calibration_Copies) to the known calibration points on the dilution series on the plate to achieve the "calibration curve". Copy numbers for samples are then calculated by the formula: Sample_Copies=10^((Ct_Sample-b)/a). This copy number calculation is done independently for each marker gene (e.g. PCA3 and/or ERG) as well as for the reference gene (e.g. KLK3 or SPDEF). "Normalization" of the resulting signal from a marker gene (e.g. PCA3 and/or ERG) is then achieved by dividing the gene marker copy number by the reference gene copy number (e.g. ERG/SPDEF, ERG/KLK3, PCA3/SPDEF, and ERG/SPDEF).
In some embodiments, the kits and/or methods of the disclosure use a reference gene comprising a KLK3 mRNA having at least a portion, e.g., at least 10 nucleotides, at least 20 nucleotides, at least 30 nucleotides, at least 40 nucleotides, at least 50 nucleotides, at least 100 nucleotides, at least 150 nucleotides, at least 200 nucleotides, and/or at least 250 nucleotides or more of the following nucleic acid sequence:
TABLE-US-00008 (SEQ ID NO: 8) TTGTCTTCCTCACCCTGTCCGTGACGTGGATTGGTGCTGCACCCCTCATC CTGTCTCGGATTGTGGGAGGCTGGGAGTGCGAGAAGCATTCCCAACCCTG GCAGGTGCTTGTGGCCTCTCGTGGCAGGGCAGTCTGCGGCGGTGTTCTGG TGCACCCCCAGTGGGTCCTCACAGCTGCCCACTGCATCAGGAACAAAAGC GTGATCTTGCTGGGTCGGCACAGCCTGTTTCATCCTGAAGACACAGGCCA GGTATTTCAGGTCAGCCACAGCTTCCCACACCCGCTCTACGATATGAGCC
In some embodiments, the kits and/or methods of the disclosure use a reference gene comprising a SPDEF mRNA having at least a portion, e.g., at least 10 nucleotides, at least 20 nucleotides, at least 30 nucleotides, at least 40 nucleotides, at least 50 nucleotides, at least 100 nucleotides, at least 150 nucleotides, at least 200 nucleotides, at least 250 nucleotides, at least 300 nucleotides, at least 350 nucleotides, at least 400 nucleotides, at least 450 nucleotides, and/or at least 500 nucleotides or more of the nucleic acid sequence of the following nucleic acid sequence:
TABLE-US-00009 (SEQ ID NO: 9) GGGAGACGAAUUGGGCCCUCUAGAUGCAUGCUCGAGCGGCCGCCAGUGUG AUGGAUAUCUGCAGAAUUCGCCCUUAUUUAAGUAGUGACAUGUUUUUGCA CAUUUCCAGCCCCUUUAAAUAUCCACACACACAGGAAGCACAAAAGGAAG CACAGAGAUCCCUGGGAGAAAUGCCCGGCCCUGGGUGGGGAUGUGCUGCA CGCCCACCUGGACAUCUGGAAGUCAGCGGCCUGGAUGAAAGAGCGGACUU CACCUGGGGCGAUUCACUACAAAUCUGGAAAGCAUGAAGACUGGGCUUUU UUUCCUAUGUCUCUUGGGAACUGGAGCUGCAAUCCCGACAAAUGCAAGAU UAUUAUCUGAUCAUUCCAAACCAACUGCUGAAACGGUAGCACCAGUUGCC CAGAUAACUGUGACGAUGGACUAUGCACCAAUGGUUGCAAGUACGAAGAU CUCUAUAGUAACUGUAAAAGUUUGAAGCUCACAUUAACCUGUAAACAUCA GUUGGUCAGGGACAGUUGCAAAAGGACCACCGCAUCUCUACAUUCAAGAA CUGGCCCUUCUUGGAGGGCUGCGCCUGCACCCCGGAGCGGAUGGCCGAGG CUGGCUUCAUCCACUGCCCCACUGAGAACGAGCCAGACUUGACCUGCGGC CGCAAGCUUGGAUCCGAAUUCCUGUGUGAAAUUGUUAUCCGCUCACAAUU CCACACAACAUACGAGCCGGAAGCAUAAAGUGUAAAGCCUGGGGUGCCUA AUGA
The relative, or normalized, expression levels of PCA3 and ERG and the reference gene can also be analyzed and compared using any of a variety of art-recognized techniques. For example, Receiver Operating Characteristics (ROC) analysis can be conducted for PCA3 and ERG, and optionally at least one other biomarker, wherein the expression levels of the biomarkers measured yield an Area Under the Curve (AUC) value for each biomarker measured. The ROC analyses of the biomarkers can be run individually, i.e., as individual biomarkers, or combined for linear regression analysis. Combinations of biomarkers with high diagnostic value as biomarkers as described herein with high diagnostic power have AUC values derived from ROC curves that are greater than 0.5, 0.6, 0.7, or 0.8. Preferably, the biomarker or combination of biomarkers have an AUC value greater than 0.7. For example, the combination of PCA3 and ERG yields an AUC value greater than 0.7.
The ROC curve is a widely used tool for evaluating discriminative and diagnostic power of a biomarker. When the biomarker value is missing for some observations, the ROC analysis based solely on complete cases loses efficiency because of the reduced sample size, and more importantly, it is subject to potential bias. Thus, imputation methods are implemented in the cases when a biomarker value is missing.
The Area Under the Curve (AUC) derived from the Receiver Operator Characteristic (ROC) curve for each level of biomarker or a score created by a combination of biomarkers is computed using biomarker results from both controls and patients with disease. One skilled in the art would readily be able to maximize diagnostic accuracy of the biomarker level or combination of biomarkers by a cut-off analysis that takes into account the sensitivity, specificity, negative predictive value (NPV), positive predictive value (PPV), positive likelihood ratio (PLR) and negative likelihood ratio (NLR) necessary for clinical utility.
The generation of ROC curves and analysis of a population of samples is used to establish the cutoff value used to distinguish between different subject sub-groups. For example, the cutoff value may distinguish between subjects with a high risk of recurrence of cancer from a low risk of recurrence of cancer. In some embodiments, the cutoff value may distinguish between subjects that have cancer from subjects that do not have cancer. In some embodiments, the cutoff value may distinguish between subjects with a non-aggressive cancer from an aggressive cancer. In some embodiments, the cutoff value may distinguish between subjects with a high Gleason score (e.g., GS>6) prostate cancer from a low Gleason score cancer.
As described herein, the normalized expression levels of PCA3 and ERG determined from a urine sample of a subject are computed into an output value for comparison with the cutoff value to distinguish between subject sub-groups. In some embodiments, the normalized expression levels of PCA3 and ERG are determined using KLK3 as the reference gene, as follows: .DELTA.Ct.sub.ERG=Ct.sub.ERG-Ct.sub.KLK3 .DELTA.Ct.sub.PCA3=Ct.sub.PCA3-Ct.sub.KLK3 The .DELTA.Ct values for ERG and PCA3 are then applied into a mathematical formula to generate an output value. An example formula to generate the output value is as follows: Output Value=(.DELTA.Ct.sub.ERG.times.0.233)+(.DELTA.Ct.sub.PCA3.times.0.446)
In the case of copy numbers, the Output Value of a test is calculated as follows: Output Value=Copy.sub.PCA3/Copy.sub.KLK3 or SPDEF.times.Coeff+Copy.sub.ERG/Copy.sub.KLK3 or SPDEF.times.Coeff, where the coefficients can all be equal, e.g. 1 (one). In the case where the coefficients are equal, all genes have the same relative contribution to the output value. In some embodiments, the coefficients are different for each marker gene, which indicates that each marker gene has different contributions to the output value and thereby to the likelihood of a positive biopsy. In one approach, the coefficients can be defined by fitting the equation Output Value=Copy.sub.PCA3/Copy.sub.KLK3 or SPDEF.times.Coeff+Copy.sub.ERG/Copy.sub.KLK3 or SPDEF.times.Coeff to an existing data set by linear regression.
As shown in the examples provided herein, the combination of PCA3 and ERG can specifically differentiate between biopsy negative and biopsy positive subjects with 77.8% sensitivity and 61.8% specificity. These values demonstrate the strength of the biomarker gene combinations disclosed herein as sensitive and specific diagnostic biomarkers for cancer, such as prostate cancer.
The term "subject" is intended to include all animals shown to or expected to have nucleic acid-containing microvesicles and/or circulating nucleic acids in urine. In particular embodiments, the subject is a mammal; for example, a human or nonhuman primate, a dog, a cat, a horse, a cow or another farm animal, or a rodent (e.g. a mouse, rat, guinea pig, etc.).
Procurement of a Microvesicle Fraction from a Urine Sample
Methods for procuring a microvesicle fraction from a urine sample are described in this application as well as in scientific publications and patent applications (Chen et al., 2010; Miranda et al., 2010; Skog et al., 2008). See also WO 2009/100029, WO 2011/009104, WO 2011/031892, and WO 2011/031877. These publications are incorporated herein by reference for their disclosures pertaining to microvesicle isolation or fraction procurement methods and techniques. These methods can include steps to evaluate the RNA integrity of an isolated microvesicle fraction, for example, by detecting the level of 18S and 28S RNA expression within the fraction.
For example, methods of microvesicle procurement by differential centrifugation are described in a paper by Raposo et al. (Raposo et al., 1996), a paper by Skog et al. (Skog et al., 2008) and a paper by Nilsson et al. (Nilsson et al., 2009). Methods of anion exchange and/or gel permeation chromatography are described in U.S. Pat. Nos. 6,899,863 and 6,812,023. Methods of sucrose density gradients or organelle electrophoresis are described in U.S. Pat. No. 7,198,923. A method of magnetic activated cell sorting (MACS) is described in a paper by Taylor and Gercel-Taylor (Taylor and Gercel-Taylor, 2008). A method of nanomembrane ultrafiltration concentration is described in a paper by Cheruvanky et al. (Cheruvanky et al., 2007). Further, microvesicles can be identified and isolated from a subject's bodily fluid by a microchip technology that uses a microfluidic platform to separate tumor-derived microvesicles (Chen et al., 2010). Each of the foregoing references is incorporated by reference herein for its teaching of these methods.
In one embodiment of the methods described herein, the microvesicles isolated from urine are enriched for those originating from prostate or tumor cells. Because the microvesicles often carry surface molecules such as antigens from their donor cells, surface molecules may be used to identify, isolate and/or enrich for microvesicles from a specific donor cell type (Al-Nedawi et al., 2008; Taylor and Gercel-Taylor, 2008). In this way, microvesicles originating from distinct cell populations can be analyzed for their nucleic acid content. For example, tumor (malignant and non-malignant) microvesicles carry tumor-associated surface antigens and may be detected, isolated and/or enriched via these specific tumor-associated surface antigens. In one example, the surface antigen is epithelial-cell-adhesion-molecule (EpCAM), which is specific to microvesicles from carcinomas of lung, colorectal, breast, prostate, head and neck, and hepatic origin, but not of hematological cell origin (Balzar et al., 1999; Went et al., 2004).
Additionally, tumor specific microvesicles may be characterized by the lack of surface markers, such as CD80 and CD86. In these cases, microvesicles with the markers, such as CD80 and CD86, may be excluded for further analysis of tumor specific markers. The exclusion may be achieved by various methods, for example, affinity exclusion.
The procurement of microvesicle fractions from prostate can be accomplished, for example, by using antibodies, aptamers, aptamer analogs or molecularly imprinted polymers specific for a desired surface antigen. In some embodiments, the surface antigen is specific for a cancer type. In some embodiments, the surface antigen is specific for a cell type which is not necessarily cancerous.
One example of a method of microvesicle separation based on cell surface antigen is provided in U.S. Pat. No. 7,198,923. As described in, e.g., U.S. Pat. Nos. 5,840,867 and 5,582,981, WO/2003/050290 and a publication by Johnson et al. (Johnson et al., 2008), aptamers and their analogs specifically bind surface molecules and can be used as a separation tool for retrieving cell type-specific microvesicles. Molecularly imprinted polymers also specifically recognize surface molecules as described in, e.g., U.S. Pat. Nos. 6,525,154, 7,332,553 and 7,384,589 and a publication by Bossi et al. (Bossi et al., 2007) and are a tool for retrieving and isolating cell type-specific microvesicles. Each of the foregoing references is incorporated herein for its teaching of these methods.
In the methods described herein, a urine sample may be pre-processed by one or more filtration or centrifugation steps to remove cell debris and other non-microvesicle matter. For example, the urine sample may be filtered through a 0.8 um filter. Optionally, the filtrate acquired from the 0.8 um filter may be further filtered through a 0.22 um filter. To isolate the urine microvesicles, the pre-processed samples are then concentrated using a filtration concentration step. This step comprises utilizing a filter that has a molecular cutoff to retain and concentrate the microvesicles that are greater than 10 nm in diameter. For example, the sample is then concentrated to a volume of less than 1 mL, preferably 100-200 .mu.L. For example, the molecular weight cutoff is at least 100 kDa. Preferably, the molecular weight cutoff is 100 kDa.
Nucleic Acid Extraction from Microvesicles
Methods for nucleic acid extraction are generally based on procedures well-known in the art. Persons of skill will select a particular extraction procedure as appropriate for the particular biological sample. Examples of extraction procedures are provided in patent publications WO 2009/100029, US 201/00196426, US 2011/0003704, US 2011/0053157, WO 2011/009104, and WO 2011/031892. These publications are incorporated herein by reference for their disclosure pertaining to microvesicle nucleic acid extraction methods and techniques.
In the methods described herein, an RNase inhibitor is added to the sample after microvesicle isolation and purification, but prior to microvesicle lysis and nucleic acid extraction for the purpose of preventing undesirable degradation of the nucleic acids after extraction. The microvesicles are lysed in the present of RNase inhibitor. The lysate is then added to an RNA-binding column, under such conditions known in the art so that the microvesicle RNA binds to the column. Optionally, the column is washed to increase the quality and yield of the RNA. Then the RNA is eluted under conditions known in the art such that high quality RNA is collected.
In some embodiments, the quality of the extracted nucleic acids can be assessed by detecting 18S and 28S ribosomal RNA and determining the ratio. The ratio of 18S:28S rRNA is preferably approximately 1:1 to approximately 1:2; more preferably approximately 1:2.
In some embodiments, nucleic acids may be extracted from the urine samples without isolation or purification of a microvesicle fraction.
Detection of Nucleic Acid Biomarkers
Biomarker detection can be carried out on the extracted nucleic acids in many different ways and constitute many aspects. In some embodiments, the detection of nucleic acid biomarkers from one or more urine samples is to obtain a profile of all or portions of the extracted nucleic acids.
A profile, as the term is used herein, refers to a representation of particular features of a collection of nucleic acids, which can be determined through quantitative or qualitative analysis of one or more nucleic acids contained in microvesicles or a microvesicle fraction isolated from a urine sample from a subject. A reference profile is here defined as a profile obtained from an independent subject or a group of subject, or from the same subject at a different time point.
The nucleic acids in microvesicles can be one or more types of nucleic acids, examples of which are provided herein.
The nucleic acids can be RNA. RNA can be coding RNA, e.g., messenger RNA which may encode proteins. RNA can also be non-coding RNA (ncRNA), e.g., ribosomal RNA, transfer RNA, microRNA, and other non-coding transcripts that may originate from genomic DNA. These non-coding RNA transcripts may include transcripts that are transcribed from satellite repeats; and transposons which may be DNA transposons or retrotransposons. Preferably, the nucleic acids are mRNAs.
The nucleic acids can be DNA. DNA can be single-stranded DNA that is reverse transcribed from RNA, e.g., cDNA. Reverse transcription is usually mediated by reverse transcriptase encoded by a reverse transcriptase gene in a cell. The DNA can also be single stranded DNA that is generated during DNA replication. Genomic DNA replicates in the nucleus while the cell is dividing. Some of the replicated DNA may come off its template, be exported out of the nucleus, and packaged in microvesicles. The DNA can further be fragments of double-stranded DNA.
In addition, the DNA can be non-coding DNA (ncDNA). The human genome only contains about 20,000 protein coding genes, representing less than 2% of the genome. The ratio of non-coding to protein-coding DNA sequences increases as a function of developmental complexity (Mattick, 2004). Prokaryotes have less than 25% ncDNA, simple eukaryotes have between 25-50%, more complex multicellular organisms like plants and animals have more than 50% ncDNA, with humans having about 98.5% ncDNA (Mattick, 2004)
Some of the ncDNA from the genome are transcribed into ncRNAs. NcRNAs have been implicated in many important processes in the cell, e.g., enzymes (ribozymes), binding specifically to proteins (aptamers), and regulating gene activity at both the transcriptional and post-transcriptional levels.
A profile of nucleic acids can be obtained through analyzing nucleic acids obtained from isolated microvesicles according to standard protocols in the art. For example, the analysis of the DNA may be performed by one or more various methods known in the art, including microarray analysis for determining the nucleic acid species in the extract, quantitative PCR for measuring the expression levels of genes, DNA sequencing for detecting mutations in genes, and bisulfite methylation assays for detecting methylation pattern of genes.
To obtain profiles, in some instances, data analysis may be performed. Such data analysis can be performed, for example, by Clustering Analysis, Principle Component Analysis, Linear Discriminant Analysis, Receiver Operating Characteristic Curve Analysis, Binary Analysis, Cox Proportional Hazards Analysis, Support Vector Machines and Recursive Feature Elimination (SVM-RFE), Classification to Nearest Centroid, Evidence-based Analysis, or a combination of any of the foregoing analytical techniques.
For another example, the analysis of RNA may be carried out using the Digital Gene Expression (DGE) analysis method (Lipson et al., 2009). For yet another example of RNA analysis, the RNA may be digested and converted into single stranded cDNA which may then be subject to sequencing analysis on a DNA sequencing machine, e.g., the HeliScope.TM. Single Molecule Sequencer from Helicos BioSciences as described in a publication by Ting et al. (Ting et al., 2011).
In other instances, the RNA may be reverse-transcribed into complementary DNA (cDNA) before further amplification. Such reverse transcription may be performed alone or in combination with an amplification step. One example of a method combining reverse transcription and amplification steps is reverse transcription polymerase chain reaction (RT-PCR), which may be further modified to be quantitative, e.g., quantitative RT-PCR as described in U.S. Pat. No. 5,639,606, which is incorporated herein by reference for this teaching. Another example of the method comprises two separate steps: a first step of reverse transcription to convert RNA into cDNA and a second step of quantifying the amount of cDNA using quantitative PCR.
Nucleic acid amplification methods include, without limitation, polymerase chain reaction (PCR) (U.S. Pat. No. 5,219,727) and its variants such as in situ polymerase chain reaction (U.S. Pat. No. 5,538,871), quantitative polymerase chain reaction (U.S. Pat. No. 5,219,727), nested polymerase chain reaction (U.S. Pat. No. 5,556,773), self-sustained sequence replication and its variants (Guatelli et al., 1990), transcriptional amplification system and its variants (Kwoh et al., 1989), Qb Replicase and its variants (Miele et al., 1983), cold-PCR (Li et al., 2008), BEAMing (Li et al., 2006) or any other nucleic acid amplification methods, followed by the detection of the amplified molecules using techniques well known to those of skill in the art. Especially useful are those detection schemes designed for the detection of nucleic acid molecules if such molecules are present in very low numbers. The foregoing references are incorporated herein for their teachings of these methods.
In some embodiments, the step of nucleic acid amplification is not performed. The unamplified nucleic acids can be analyzed by quantitative PCR (RT-PCR) or analyzed directly, e.g., through next-generation sequencing or nanostring technology.
The analysis of nucleic acids present in the isolated microvesicles can be quantitative and/or qualitative. For quantitative analysis, expression levels, either relative or absolute, of specific nucleic acids of interest within the isolated microvesicles are measured with methods known in the art and described herein. For qualitative analysis, the species of nucleic acids of interest within the isolated microvesicles, whether wild type or variants, are identified with methods known in the art.
In some embodiments, the detection of nucleic acid biomarkers involves detection of the presence or absence of one or a collection of genetic aberrations. The term "genetic aberration" is used herein to refer to the nucleic acid amounts as well as nucleic acid variants within the nucleic acid-containing microvesicles. Specifically, genetic aberrations include, without limitation, over-expression of a gene (e.g., an oncogene) or a panel of genes, under-expression of a gene (e.g., a tumor suppressor gene such as p53 or RB) or a panel of genes, alternative production of splice variants of a gene or a panel of genes, gene copy number variants (CNV) (e.g., DNA double minutes) (Hahn, 1993), nucleic acid modifications (e.g., methylation, acetylation and phosphorylations), single nucleotide polymorphisms (SNPs) (e.g., polymorphisms in Alu elements), chromosomal rearrangements (e.g., inversions, deletions and duplications), and mutations (insertions, deletions, duplications, missense, nonsense, synonymous or any other nucleotide changes) of a gene or a panel of genes, which mutations, in many cases, ultimately affect the activity and function of the gene products, lead to alternative transcriptional splice variants and/or changes of gene expression level, or combinations of any of the foregoing.
Genetic aberrations can be found in many types of nucleic acids. The determination of such genetic aberrations can be performed by a variety of techniques known to the skilled practitioner. For example, expression levels of nucleic acids, alternative splicing variants, chromosome rearrangement and gene copy numbers can be determined by microarray analysis (see, e.g., U.S. Pat. Nos. 6,913,879, 7,364,848, 7,378,245, 6,893,837 and 6,004,755) and quantitative PCR. Copy number changes may be detected, for example, with the Illumina Infinium II whole genome genotyping assay or Agilent Human Genome CGH Microarray (Steemers et al., 2006).
Nucleic acid modifications can be assayed by methods described in, e.g., U.S. Pat. No. 7,186,512 and patent publication WO/2003/023065. Methylation profiles may be determined, for example, by Illumina DNA Methylation OMA003 Cancer Panel.
SNPs and mutations can be detected by hybridization with allele-specific probes, enzymatic mutation detection, chemical cleavage of mismatched heteroduplex (Cotton et al., 1988), ribonuclease cleavage of mismatched bases (Myers et al., 1985), mass spectrometry (U.S. Pat. Nos. 6,994,960, 7,074,563, and 7,198,893), nucleic acid sequencing, single strand conformation polymorphism (SSCP) (Orita et al., 1989), denaturing gradient gel electrophoresis (DGGE) (Fischer and Lerman, 1979a; Fischer and Lerman, 1979b), temperature gradient gel electrophoresis (TGGE) (Fischer and Lerman, 1979a; Fischer and Lerman, 1979b), restriction fragment length polymorphisms (RFLP) (Kan and Dozy, 1978a; Kan and Dozy, 1978b), oligonucleotide ligation assay (OLA), allele-specific PCR (ASPCR) (U.S. Pat. No. 5,639,611), ligation chain reaction (LCR) and its variants (Abravaya et al., 1995; Landegren et al., 1988; Nakazawa et al., 1994), flow-cytometric heteroduplex analysis (WO/2006/113590) and combinations/modifications thereof.
In some embodiments, the detection of mutations is carried out by using a restriction enzyme which only digests one variant of the biomarker but does not digest other variants of the biomarker. As is known in the art, restriction enzymes faithfully recognize particular stretches of polynucleotides and the change of one or more nucleotides within the stretch of polynucleotides will mostly likely make the polynucleotide unrecognizable and indigestible by the enzyme. As such, the detection of one variant of a biomarker may be aided by digesting away some or all of the other variants that can be recognized by the enzyme. The variant to be detected can be a wild-type variant or a mutant variant.
Gene expression levels may be determined by the serial analysis of gene expression (SAGE) technique (Velculescu et al., 1995), quantitative PCR, quantitative reverse transcription PCR, microarray analysis, and next generation DNA sequencing, as known in the art.
In general, the methods for analyzing genetic aberrations are reported in numerous publications, not limited to those cited herein, and are available to skilled practitioners. The appropriate method of analysis will depend upon the specific goals of the analysis, the condition history of the patient, and the specific cancer(s), diseases or other medical conditions to be detected, monitored or treated.
Biomarkers Associated with Diseases or Other Medical Conditions
Many biomarkers may be associated with the presence or absence of a disease or other medical condition in a subject. Therefore, detection of the presence or absence of such biomarkers in a nucleic acid extraction from isolated microvesicles, according to the methods disclosed herein, may aid diagnosis, prognosis, or monitoring the progress or reoccurrence of the disease or other medical condition in the subject.
ERG, as used herein, refers to a gene also known as v-ets erythroblastosis virus E26 oncogene homolog and any identified isoforms. For example, ERG isoforms include ERG1, ERG2, ERG3, ERG4, ERG5, ERG6, ERG7, ERG8, and ERG9. ERG can also refer to ERG Prostate Cancer-specific isoform 1 (EPC1) and ERG Prostate Cancer-specific isoform 2 (EPC2). ERG, or any one of the isoforms of ERG, can be used as a biomarker for prostate cancer.
PCA3, as used herein, also refers to the gene also known as DD3 and any identified isoforms, and is useful as a biomarker for prostate cancer.
Many biomarkers have also been found to influence therapy selection for a particular patient. The detection of the presence or absence of such biomarkers in a nucleic acid extraction from isolated microvesicles, according to the methods disclosed herein, may aid in therapy selection in a given patient.
Patient Sub-Groups
The present invention provides methods of detecting one or more biomarkers in urine samples from a subject to aid in diagnosis, prognosis, monitoring, or therapy selection for a disease such as, for example, cancer, particularly an aggressive cancer.
Selection of an individual from whom the microvesicles are isolated is performed by the skilled practitioner based upon analysis of one or more of a variety of factors. Such factors for consideration are whether the subject has a family history of a specific disease (e.g., a cancer), has a genetic predisposition for such a disease, has an increased risk for such a disease, has physical symptoms which indicate a predisposition, or environmental reasons. Environmental reasons include lifestyle, exposure to agents which cause or contribute to the disease such as in the air, land, water or diet. Other reasons to select an individual for performing the methods disclosed herein include previous history with the disease, being currently diagnosed with the disease prior to therapy or after therapy, being currently treated for the disease (undergoing therapy), or being in remission or recovery from the disease.
The cancer diagnosed, monitored or otherwise evaluated with methods in this invention, can be any kind of cancer or pre-cancerous condition. This includes, without limitation, epithelial cell cancers such as lung, ovarian, cervical, endometrial, breast, brain, colon and prostate cancers. Also included are gastrointestinal cancer, head and neck cancer, non-small cell lung cancer, cancer of the nervous system, retina cancer, skin cancer, liver cancer, pancreatic cancer, renal cancer, genital cancer and bladder cancer, melanoma, and leukemia. In addition, the methods and compositions of the present invention are equally applicable to detection, diagnosis and prognosis of non-malignant tumors in an individual (e.g., neurofibromas, meningiomas and schwannomas). The cancer can be any aggressive cancer. In some embodiments, the cancer is a urogenital cancer, such as prostate cancer, bladder cancer, renal cancer, and metastatic cancer that has spread to the urogenital tract.
The present invention provides biomarkers that are of significant diagnostic and prognostic value in different patient subgroups. The patients have cancer, for example, prostate cancer. In some embodiments, the one or more biomarkers are detected in patients that have undergone radical prostatectomy. In some embodiments, the one or more biomarkers are detected in patients that have been assigned a particular Gleason score. In some embodiments, the one or more biomarkers are detected in patients that express ERG, or patients in whom the cancer is determined to be driven by ERG expression. These patients are referred to herein as "ERG Expressers." The presence of ERG or ERG expression over a certain predetermined threshold determines cancers driven by ERG expression. In some embodiments, the one or more biomarkers are detected in patients that do not express ERG, or patients in whom the cancer is determined to not be driven by ERG expression. These patients are referred to herein as "ERG Non-expressers."
The Gleason Grading System is commonly used in the art as a parameter of prognosis, often used in combination with other prognostic factors or tests, for prostate cancer. Prostate biopsy samples are examined, for example, by microscope, and a Gleason score is determined by a pathologist, based on the architectural pattern of the prostate tumor. The Gleason score is based upon the degree of loss of the normal glandular tissue architecture (i.e. shape, size and differentiation of the glands). The sample is assigned a grade to the most common tumor pattern, and a second grade to the next most common tumor pattern. There may be a primary or most common pattern and then a secondary or second most common pattern which can be identified; alternatively, there may be only a single grade. Gleason patterns are associated with the following features: Pattern 1--The cancerous prostate closely resembles normal prostate tissue. The glands are small, well-formed, and closely packed. Pattern 2--The tissue still has well-formed glands, but they are larger and have more tissue between them. Pattern 3--The tissue still has recognizable glands, but the cells are darker. At high magnification, some of these cells have left the glands and are beginning to invade the surrounding tissue. Pattern 4--The tissue has few recognizable glands. Many cells are invading the surrounding tissue. Pattern 5--The tissue does not have recognizable glands. There are often just sheets of cells throughout the surrounding tissue.
The two grades are added together to get a Gleason Score, also known as a Gleason sum. Scores from 2 to 4 are very low on the cancer aggression scale. Scores from 5 to 6 are mildly aggressive. A score of 7 indicates that the cancer is moderately aggressive. Scores from 8 to 10 indicate that the cancer is highly aggressive.
Other grading systems to stratify non-aggressive cancers from aggressive cancers for other cancers, such as bladder cancer or renal cancer are known in the art.
EXAMPLES
Example 1: Materials and Methods
Primer/Probe Sequences: The kits and methods for detecting urine biomarker cohorts use the following primer/probe sequences. The following abbreviations are used in Table 1 below: probes from Integrated DNA Technologies are designated as "IDT," 5'-FAM refers to a 5' reporter dye, "31ABkFQ" refers to a 3'-IowaBlack quencher and "ZEN" refers to an in-sequence-ZEN.TM. quencher from IDT.
TABLE-US-00010 TABLE 1 Primer/Probe Sequences Target Designation Sequence/Modifications SPDEF 0881_SPDEF_e3-4_fF_ CCACCTGGACATCTGGAAG (SEQ ID NO: 10) IDT SPDEF 0884_SPDEF_e3-4_r1_IDT AATCGCCCCAGGTGAAGT (SEQ ID NO: 11) SPDEF 0883_SPDEF_E3-4_P_ZEN /56-FAM/CGG CCT GGA/ZEN/TGA AAG AGC G/3IABkFQ/ (SEQ ID NO: 12) ERG 0498_ERG_ex11-12_IDT_f GCGTCCTCAGTTAGATCCTTATCAG (SEQ ID (ERG LDT F1) NO: 13) ERG 0499_ERG_ex12- CTGGCCACTGCCTGGATT (SEQ ID NO: 14) 13_IDT_R (ERG LDT R1) ERG 0500_ERG_ex12_IDT_FAM_ /56-FAM/CTT GGA CCA /ZEN/ACA AGT AGC ZEN_probe CGC CTT GC/3IABkFQ/ (SEQ ID NO: 15) PCA3 0539_PCA3_ex3- GCA CAT TTC CAG CCC CTT TA (SEQ ID 4_malig_IDT_f NO: 16) PCA3 0540_PCA3_ex3- GGC ATT TCT CCC AGG GAT CT (SEQ ID 4_malig_IDT_r NO: 17) PCA3 0514_PCA3_ex3- /56-FAM/CAC ACA GGA /ZEN/AGC ACA AAA 4_malig_IDT_FAM_ZEN_ GGA AGC /3IABkFQ/ (SEQ ID NO: 18) probe Qbeta 0545_Qbeta_P3_IDT_f AAC GGT TCT TGT GAC CCA TC (SEQ ID NO: 19) Qbeta 0546_Qbeta_P3_IDT_r CGA ACA AAA GCT CGT TCC TC (SEQ ID NO: 20) Qbeta 0547_Qbeta_P3_Tm69_IDT_ /56-FAM/CGC CAG GCA /ZEN/TAT GCT GAC FAM_ZEN_probe GTG /3IABkFQ/ (SEQ ID NO: 21) KLK3 0535_KLK3_LDT_ex1- CCTGTCCGTGACGTGGAT (SEQ ID NO: 22) 2_P3_f(KLK3 LDT F1) KLK3 0536_KLK3_LDT_ex1- CAGGGTTGGGAATGCTTCT (SEQ ID NO: 23) 2_P3_r(KLK3 LDT R) KLK3 0538_KLK3_ex1- /56-FAM/CGG ATT GTG /ZEN/GGA GGC TGG 2_P3_Tm70_FAM_ZEN_ GA/3IABkFQ/(SEQ ID NO: 24) probe TMPRSS: 0949_TMPRSS-ERG_CL_F GCC TGGAGC GCG GCA G (SEQ ID NO: 25) ERG TMPRSS: 0951_TMPRSS- GCA CAC TCA AAC AAC GAC TG (SEQ ID ERG ERG_SL_R2 NO: 26) TMPRSS: 0955_TMPRSS- /56-FAM/AGC CTT ATC /ZEN/AGT TGT GAG ERG ERG_SL_P1 TGA GGA C/3IABkFQ/(SEQ ID NO: 27) AMACR 0508_AMACR_ex1- GCCGCGGTGTCATGG (SEQ ID NO: 28) 2_LDT_f AMACR 0509_AMACR_ex2_LDT_ TTTCCCGCTGCAGAATCTC (SEQ ID NO: 29) f AMACR 0510_AMACR_353_IDT_ /56-FAM/AGA AAC TCC /ZEN/AGC TGG FAM_ZEN_probe GCC CA/3IABkFQ/ (SEQ ID NO: 30) BIRC5 0582_BIRC5_P3_e1-2_F GGA CCA CCG CAT CTC TAC AT (SEQ ID NO: 31) BIRC5 0583_BIRC5_P3_e12_R GTC TGG CTC GTT CTC AGT GG (SEQ ID NO: 32) BIRC5 0584_BIRC5_P3_e1-2_ /56-FAM/CTT CTT GGA /ZEN/GGG CTG CGC IDT_FAM_ZEN_probe CT/3IABkFQ/ (SEQ ID NO: 33) SPARCL1 0585_SPARCL1_P3-2_f TCT GGA AAG CAT GAA GAC TGG (SEQ ID NO: 34) SPARCL1 0586_SPARCL1_P3-2_R TGC TAC CGT TTC AGC AGT TG (SEQ ID NO: 35) SPARCL1 0587_SPARCL1_P3-2_ /56-FAM/CTG CAG CTG /ZEN/CAA TCC CGA IDT_FAM_ZEN_probe CA/3IABkFQ/ (SEQ ID NO: 36)
Example 2: Patient Cohort 7 Sample Preparation
A cohort of patient samples was used to identify biomarkers useful for detecting prostate cancer from nucleic acids extracted from the urine-derived microvesicles. A patient cohort of 258 subjects, referred to as "cohort 7" in this example, were enrolled in this study. Of the 258 subjects, 196 had their first biopsy, and 59 had repeat biopsies. Of the primary biopsy patients, 87 had positive biopsy results, and 109 had negative biopsy results. Of the repeat biopsy patients, 15 had positive biopsy results, and 44 had negative biopsy results.
Urine sample volumes ranged from 20-100 mL. The distribution of the initial volume of urine samples from the patients were as follows: sample volume (V) is equal to 20 mL (i.e., V=20 mL), 21% of the patients (n=55); sample volumes is greater than 20 mL but less than or equal to 40 mL (i.e., 20 mL<V.ltoreq.0.40 mL), 27% of the patients (n=70); or sample volumes is greater than 40 mL (i.e., V>40 mL), 52% of the patients (n=133).
Urine samples from cohort 7 were analyzed as depicted in FIGS. 1A and 1B. For example, urine samples were collected and filtered through a 0.8 .mu.m filter to separate cells and other cell debris from the microvesicles, and the microvesicle-enriched fractions were frozen at -80.degree. C. A first aliquot from each sample (S1) was further processed. Additional processing steps may include centrifugation, concentration through a filtration concentrator, 1-2 washing steps, and/or addition of RNase inhibitor. Optionally, control particles, such as Q-beta particles, can be added to the samples prior to microvesicle isolation or nucleic acid extraction to determine the quality of the isolation or nucleic acid extraction. For example, 18 subjects were removed from the study due to Q-beta control failures.
Specifically, the urine sample is first filtered, and the filtrate is discarded. Q-beta control is added at the appropriate concentration (e.g., 100 copies) to an aliquot of the filtered urine samples (e.g., 15 mL). The aliquot is then processed through a filter concentrator, and the filtrate is discarded. The retentate is re-suspended with a second aliquot of filtered urine samples (e.g., 5 mL of filtered urine) and processed through a filter concentrator. The retentate is then washed at least once (e.g. twice), and re-spun in the filter concentrator. RNase inhibitor is added to the retentate located in the upper chamber of the filter concentrator, and incubated at room temperature, for example, for 2-3 minutes. Lysis buffer is then added to the sample directly and incubated for 1 minute. The lysate is then transferred to another container to continue with nucleic acid extraction.
The samples are then subjected to nucleic acid extraction using methods well known in the art and conditions suitable to yield high quality RNA. 12 .mu.l of the extracted RNA is analyzed by BioAnalyzer Profile. The extracted RNA is reverse transcribed into cDNA (SUPERSCRIPT.RTM. VILO cDNA Synthesis Kit. Life Technologies). Quantitative real-time PCR was performed on the cDNA samples to determine the gene expression of PCA3, ERG, KLK3, and Qbeta (2 .mu.l per gene). A calibration standard curve was present on each qPCR plate.
Primer and probe sequences can be found in Table 1.
Example 3: PCA3 and ERG Gene Expression Analysis
Multiple analyses were performed using the gene expression results from of qPCR experiment. ROC curves were generated based on the delta Ct or copy number relative to the normalizer gene KLK3. Imputation may be used to obtain missing values. ROC analysis of PCA3, using KLK3 as the normalizer gene, generated an AUC value of 0.727 (FIG. 3). ROC curve analysis of PCA3 and ERG produced an increased AUC value of 0.756 (FIG. 4). In other experiments, the normalizer gene utilized was SPDEF (FIG. 13) and AUC values generated from analysis using SPDEF normalization showed that KLK3 and SPDEF performed equivalently.
Model, or output, values for PCA3 and ERG gene expression were also calculated for each sample using the following formula, which was determined from data analysis of a different patient cohort (Cohort 5): Model Value=(.DELTA.Ct.sub.ERG.times.0.233)+(.DELTA.Ct.sub.PCA3.times.0.4- 46) where .DELTA.Ct.sub.ERG=Ct.sub.ERG-Ct.sub.KLK3; .DELTA.Ct.sub.PCA3=Ct.sub.PCA3-Ct.sub.KLK3 A model cutoff value was chosen, for example, the cutoff value used in this example was 4.7, and the diagnostic accuracy of using the combination of PCA3 and ERG with a cutoff model value of 4.7 was determined by 2.times.2 analysis and Gleason analysis (FIG. 10).
Results of the 2.times.2 analysis using PCA3 and ERG gene expression for each sample volume sub-group of cohort 7 is summarized in Tables 2a, 3a and 4a. The combination of PCA3 and ERG greater than 84% sensitivity for identifying prostate cancer in samples that had been identified as positive by biopsy. In particular, the data demonstrated that urine sample volumes of 20 mL yielded better diagnostic accuracy, with sensitivity at 83.6% and specificity at 58.7%. This method also had a high negative predictive value of 79.4%, and a positive predictive value of 53.4%.
Further analysis included stratification of the samples by their Gleason scores, as shown in Tables 2b, 3b and 4b, and quartile analysis, as shown in Tables 2d, 2e, 3d, 3e, 4d, and 4c. Specifically, samples of patients with Gleason scores of 6 or higher were correctly identified 70% of the samples.
Example 4: Three-Gene Models Including PCA3
Multivariate analysis was performed using gene sets including PCA3. As shown in FIG. 15, PCA3-containing models (i.e., PCA3 and ERG with an additional gene, such as AMACR, BIRC5, HOXC6 and SPARCL1) consistently outperformed FTO three-gene models that did not contain PCA3. The reference genes used can be KLK3 or SPDEF, as shown by the consistent AUC values using either gene for normalization in FIG. 15.
The three-gene models were also shown to have improved AUC values when using low volume samples (i.e., 20 mL) compared to all samples (FIG. 15).
Example 5: Optimal Urine Sample Volume
Urine samples from Patient Cohort 7 ranged from 20-100 mL. The distribution of samples with volumes at 20 mL or less, 40 mL or less but greater than 20 mL, and more than 40 mL in cohort 7 is shown in FIG. 1.
Microvesicles were isolated, RNA was extracted, and biomarker gene expression was determined as described in Examples 1 and 2. Biostatistical analysis of biomarkers (i.e., PCA3, ERG) in cohort 7 was performed by generating AUC and ROC plots based on copy number and KLK3 normalized gene expression for all the samples in the cohort. FIG. 3 shows that the AUC generated from PCA3 expression analysis is highly dependent on sample volume. For example, samples that generated an AUC greater than 0.70 were from samples where the sample volume was less than 40 mL. Conversely, samples that generated AUCs in the range of 0.60-0.65 had a sample volume of 40 mL or greater. FIG. 12 shows the univariate analysis of each indicated gene (PCA3, ERG, AMACR, BIRC5, HOXC6, SPARCL1 and SPDEF) and the generated AUCs for samples that were 20 mL or less compared to the generated AUCs for all samples. These results show that samples 20 mL of less results in increased AUC values, indicating that the diagnostic power of the single gene is increased in urine samples of smaller volume. SPDEF is a reference gene utilized for normalization, and therefore, AUC values do not improve with smaller sample volume.
Analysis of biomarker expression for copy number rather than Ct values also show that samples with smaller volumes (20 mL) yielded improved AUC values when compared to all samples (FIG. 13).
Example 6: Scoring Patient Samples and Statistical Validation of Same
In the studies described herein, samples were used if they met the following criteria: (i) first biopsy only; (ii) patient age .gtoreq.50 years old; (iii) PSA "gray zone" level in the range of 2-10 ng/mL; and (iv) urine donation volume between 20-49 mL. Patient samples in the PSA gray zone are selected because patients with high PSA levels will almost always be biopsied, and patients with low PSA levels are typically only recommended for biopsy for other, non-PSA driven reasons.
The patient samples are scored according to a laboratory-developed test (LDT) score referred to herein as the EXO106 Score using the following algorithm:
.times..times..times..times..times..function..times..times..times..times.- .times..function..times..times..times..times..times..times. ##EQU00002## where copy numbers are calculated using the RGQ software (Qiagen) for each gene using the on-plate calibration curves, and where the cutoff is 10. An EXO106 score less than 10 is a score associated with a lower risk of prostate cancer. An EXO106 score that is greater than or equal to 10 is a score associated with a higher risk of prostate cancer.
It is noted that the score was scaled by multiplying by 1.83 and offset by adding 16.92 to transform the EXO106 score into a more appealing and legible range. This scaling and offset, however, have no effect on the performance of the test. The transformation of the EXO106 Score puts the majority of the data in the 0-30 range, but without a cap on the score in either end (i.e., individual samples can score outside of this range). The algorithm for the EXO106 Score was configured such that the negative predictive value (NPV) of the EXO106 Score at the cut-off value of 10 is greater than the NPV of the Prostate Cancer Preventional Trial Risk Calculator (PCPTRC), where the NPV.sub.PCPTRC cut-off is chosen such that it predicts at least 30% of the patients as negative. The algorithm for the EXO106 Score was also designed such that the fraction of patients predicted negative (i.e., EXO106 Score less than 10) is at least 30%.
An exemplary EXO106 Score distribution in a patient cohort referred to herein as Cohort 8 (i.e., C8, n=453 samples, PSA median=5.3 ng/mL, and 80% of samples 2<PSA<10 ng/mL) is shown in FIG. 16. The AUC for EXO106 Performance on patients with any Gleason score as compared to the AUC for standard of care (SOC) treatment is shown in FIG. 17, where the AUC for SOC=0.595; AUC for EXO106=0.738; and AUC for EXO106+SOC=0.764. The patient cohort used in FIG. 17 had the following characteristics: all samples were in the PSA gray zone, were from first biopsy only, and were from low volume urine samples. EXO106 performance by quartile, i.e., the percentage of samples identified as positive by biopsy by EXO106 score quartile, is shown in FIGS. 18A and 18B. Again, these samples were from patients with any Gleason score.
The performance of the EXO106 Score for high grade prostate cancer, e.g., a Gleason score greater than 6 is shown in FIG. 19, and a breakdown of the EXO106 Score performance based on Gleason score subgroups is shown in FIG. 20.
Thus, the EXO106 score is useful in determining the prediction of a high grade prostate disease, e.g., a disease having a Gleason score greater than 6. Typically, samples from first biopsy and from repeat biopsy populations are very different and should be analyzed separately.
While the present invention has been disclosed with reference to certain embodiments, numerous modifications, alterations, and changes to the described embodiments are possible without departing from the spirit and scope of the present invention, as described above and in the appended claims. Accordingly, it is intended that the present invention not be limited to the specifically described embodiments, but that it be given the full scope to which it is entitled under the law.
TABLE-US-00011 TABLE 2a Cohort 7 2 .times. 2 Analysis (V .ltoreq. 100 mL, N = 236) Model Cutoff 8.5 BX POS BX NEG TEST POS 72 69 51.1% PPV TEST NEG 21 74 77.9% NPV 77.4% 51.7% SENS SPEC
TABLE-US-00012 TABLE 2b Cohort 7 Gleason Score Analysis (V .ltoreq. 100 mL, N = 236) Gleason* # Missed % Missed Detected 6 11 29% 27 3 + 4 = 7 6 21% 22 4 + 3 = 7 2 13% 13 8 0 0% 3 9 1 13% 7 10 1 100% 0
TABLE-US-00013 TABLE 2c Cohort 7 Analysis (V .ltoreq. 100 mL, N = 236) % TEST POS 59.7% % TEST NEG 40.3%
TABLE-US-00014 TABLE 2d Cohort 7 Quartile Analysis (V .ltoreq. 100 mL, N = 236) % Biopsy Positive Quartile 1 Quartile 2 Quartile 3 Quartile 4 Gleason 0.40 to 6.70 6.70 to 8.20 8.20 to 9.40 9.40 to 13.60 Group Percent N Percent N Percent N Percent N 6 39.5% 15 26.3% 10 21.1% 8 13.2% 5 3 + 4 = 35.7% 10 39.3% 11 7.1% 2 17.9% 5 7 4 + 3 = 60.0% 9 26.7% 4 6.7% 1 6.7% 1 7 8 0.0% 0 66.7% 2 33.3% 1 0.0% 0 9 62.5% 5 0.0% 0 25.0% 2 12.5% 1 10 0.0% 0 0.0% 0 0.0% 0 100.0% 1
TABLE-US-00015 TABLE 2e Cohort 7 Quartile Analysis (V .ltoreq. 100 mL, N = 236) Quartile 1 Quartile 2 Quartile 3 Quartile 4 0.40 to 6.70 6.70 to 8.20 8.20 to 9.40 9.40 to 13.60 % Bx POS N % Bx POS N % Bx POS N % Bx POS N 60.9% 64 46.6% 58 26.9% 52 21.0% 62
TABLE-US-00016 TABLE 3a Cohort 7 2 .times. 2 Analysis (V .ltoreq. 40 mL, N = 189) Model Cutoff 8.5 BX POS BX NEG TEST POS 61 52 54.0% PPV TEST NEG 17 59 77.6% NPV 78.2% 53.2% SENS SPEC
TABLE-US-00017 TABLE 3b Cohort 7 Gleason Score Analysis (V .ltoreq. 40 mL, N = 189) Gleason # Missed % Missed Detected 6 8 26% 23 3 + 4 = 7 6 24% 19 4 + 3 = 7 2 17% 10 8 0 0% 2 9 0 0% 7 10 1 100% 0
TABLE-US-00018 TABLE 3c Cohort 7 Analysis (V .ltoreq. 40 mL, N = 189) % TEST POS 59.8% % TEST NEG 40.2%
TABLE-US-00019 TABLE 3d Cohort 7 Quartile Analysis (V .ltoreq. 40 mL, N = 189) % Biopsy Positive Quartile 1 Quartile 2 Quartile 3 Quartile 4 Gleason 0.70 to 6.70 6.70 to 8.20 8.20 to 9.70 9.70 to 13.60 Group Percent N Percent N Percent N Percent N 6 38.7% 12 29.0% 9 19.4% 6 12.9% 4 3 + 4 = 32.0% 8 40.0% 10 8.0% 2 20.0% 5 7 4 + 3 = 58.3% 7 25.0% 3 8.3% 1 8.3% 1 7 8 0.0% 0 50.0% 1 50.0% 1 0.0% 0 9 71.4% 5 0.0% 0 28.6% 2 0.0% 0 10 0.0% 0 0.0% 0 0.0% 0 100.0% 1
TABLE-US-00020 TABLE 3e Cohort 7 Quartile Analysis (V .ltoreq. 40 mL, N = 189) Quartile 1 Quartile 2 Quartile 3 Quartile 4 0.70 to 6.70 6.70 to 8.20 8.20 to 9.70 9.70 to 13.60 % Bx POS N % Bx POS N % Bx POS N % Bx POS N 65.3% 49 50.0% 46 24.0% 50 25.0% 44
TABLE-US-00021 TABLE 4a Cohort 7 2 .times. 2 Analysis (V .ltoreq. 20 mL, N = 122) Model Cutoff 8.5 BX POS BX NEG TEST POS 42 26 61.8% PPV TEST NEG 12 42 77.8% NPV 77.8% 61.8% SENS SPEC
TABLE-US-00022 TABLE 4b Cohort 7 Gleason Score Analysis (V .ltoreq. 20 mL, N = 122) Gleason # Missed % Missed Detected 6 7 28% 18 3 + 4 = 7 3 20% 12 4 + 3 = 7 2 25% 6 8 0 0% 1 9 0 0% 5 10 0 #DIV/0! 0
TABLE-US-00023 TABLE 4c Cohort 7 Analysis (V .ltoreq. 20 mL, N = 122) % TEST POS 55.7% % TEST NEG 44.3%
TABLE-US-00024 TABLE 4d Cohort 7 Quartile Analysis (V .ltoreq. 20 mL, N = 122) % Biopsy Positive Quartile 1 Quartile 2 Quartile 3 Quartile 4 Gleason 2.20 to 6.70 6.70 to 8.20 8.20 to 9.40 9.40 to 13.60 Group Percent N Percent N Percent N Percent N 6 40.0% 10 28.0% 7 20.0% 5 12.0% 3 3 + 4 = 26.7% 4 46.7% 7 13.3% 2 13.3% 2 7 4 + 3 = 62.5% 5 12.5% 1 12.5% 1 12.5% 1 7 8 0.0% 0 0.0% 0 100.0% 1 0.0% 0 9 80.0% 4 0.0% 0 20.0% 1 0.0% 0 10 #DIV/0! 0 #DIV/0! 0 #DIV/0! 0 #DIV/0! 0
TABLE-US-00025 TABLE 4e Cohort 7 Quartile Analysis (V .ltoreq. 20 mL, N = 122) Quartile 1 Quartile 2 Quartile 3 Quartile 4 2.20 to 6.70 6.70 to 8.20 8.20 to 9.40 9.40 to 13.60 % Bx POS N % Bx POS N % Bx POS N % Bx POS N 79.3% 29 50.0% 30 35.7% 28 17.1% 35
REFERENCES
Al-Nedawi, K., B. Meehan, J. Micallef, V. Lhotak, L. May, A. Guha, and J. Rak. 2008. Intercellular transfer of the oncogenic receptor EGFRvIII by microvesicles derived from tumour cells. Nat Cell Biol. 10:619-24. Balzar, M., M. J. Winter. C. J. de Boer, and S. V. Litvinov. 1999. The biology of the 17-1A antigen (Ep-CAM). J Mol Med. 77:699-712. Bossi, A., F. Bonini, A. P. Turner, and S. A. Piletsky. 2007. Molecularly imprinted polymers for the recognition of proteins: the state of the art. Biosens Bioelectron. 22:1131-7. Bussemakers, M. J., A. van Bokhoven, G. W. Verhaegh, F. P. Smit, H. F. Karthaus, J. A. Schalken, F. M. Debruyne, N. Ru, and W. B. Isaacs. 1999. DD3: a new prostate-specific gene, highly overexpressed in prostate cancer. Cancer Res. 59:5975-9. Chen, C., J. Skog, C. H. Hsu, R. T. Lessard, L. Balaj, T. Wurdinger, B. S. Carter, X. O. Breakefield, M. Toner, and D. Irimia. 2010. Microfluidic isolation and transcriptome analysis of serum microvesicles. Lab Chip. 10:505-11. Cheruvanky. A., H. Zhou, T. Pisitkun, J. B. Kopp, M. A. Knepper, P. S. Yuen, and R. A. Star. 2007. Rapid isolation of urinary exosomal biomarkers using a nanomembrane ultrafiltration concentrator. Am J Physiol Renal Physiol. 292:F1657-61. Cotton, R. G., N. R. Rodrigues, and R. D. Campbell. 1988. Reactivity of cytosine and thymine in single-base-pair mismatches with hydroxylamine and osmium tetroxide and its application to the study of mutations. Proc Natl Acad Sci USA. 85:4397-401. Cowell, J. K., and K. C. Lo. 2009. Application of oligonucleotides arrays for coincident comparative genomic hybridization, ploidy status and loss of heterozygosity studies in human cancers. Methods Mol Biol. 556:47-65. Deras, I. L., S. M. Aubin, A. Blase, J. R. Day, S. Koo, A. W. Partin, W. J. Ellis, L. S. Marks, Y. Fradet, H. Rittenhouse, and J. Groskopf. 2008. PCA3: a molecular urine assay for predicting prostate biopsy outcome. J Urol. 179:1587-92. Furusato, B., C. L. Gao, L. Ravindranath, Y. Chen. J. Cullen, D. G. McLeod, A. Dobi, S. Srivastava, G. Petrovics, and I. A. Sesterhenn. 2008. Mapping of TMPRSS2-ERG fusions in the context of multi-focal prostate cancer. Mod Pathol. 21:67-75. Guatelli, J. C., K. M. Whitfield, D. Y. Kwoh, K. J. Barringer, D. D. Richman, and T. R. Gingeras. 1990. Isothermal, in vitro amplification of nucleic acids by a multienzyme reaction modeled after retroviral replication. Proc Natl Acad Sci USA. 87:1874-8. Hahn, P. J. 1993. Molecular biology of double-minute chromosomes. Bioessays. 15:477-84. Hessels, D., F. P. Smit, G. W. Verhaegh, J. A. Witjes, E. B. Cornel, and J. A. Schalken. 2007. Detection of TMPRSS2-ERG fusion transcripts and prostate cancer antigen 3 in urinary sediments may improve diagnosis of prostate cancer. Clin Cancer Res. 13:5103-8. Johnson, S., D. Evans, S. Laurenson, D. Paul, A. G. Davies, P. K. Ferrigno, and C. Walti. 2008. Surface-immobilized peptide aptamers as probe molecules for protein detection. Anal Chem. 80:978-83. Kwoh, D. Y., G. R. Davis, K. M. Whitfield, H. L. Chappelle, L. J. DiMichele, and T. R. Gingeras. 1989. Transcription-based amplification system and detection of amplified human immunodeficiency virus type 1 with a bead-based sandwich hybridization format. Proc Natl Acad Sci USA. 86:1173-7. Laxman, B., D. S. Morris, J. Yu, J. Siddiqui, J. Cao, R. Mehra, R. J. Lonigro, A. Tsodikov, J. T. Wei, S. A. Tomlins, and A. M. Chinnaiyan. 2008. A first-generation multiplex biomarker analysis of urine for the early detection of prostate cancer. Cancer Res. 68:645-9. Laxman, B., S. A. Tomlins, R. Mehra, D. S. Morris, L. Wang, B. E. Helgeson, R. B. Shah, M. A. Rubin, J. T. Wei, and A. M. Chinnaiyan. 2006. Noninvasive detection of TMPRSS2:ERG fusion transcripts in the urine of men with prostate cancer. Neoplasia. 8:885-8. Li, J., L. Wang, H. Mamon, M. H. Kulke, R. Berbeco, and G. M. Makrigiorgos. 2008. Replacing PCR with COLD-PCR enriches variant DNA sequences and redefines the sensitivity of genetic testing. Nat Med. 14:579-84. Lipson, D., T. Raz, A. Kieu, D. R. Jones, E. Giladi, E. Thayer, J. F. Thompson, S. Letovsky, P. Milos, and M. Causey. 2009. Quantification of the yeast transcriptome by single-molecule sequencing. Nat Biotechnol. 27:652-8. Mattick, J. S. 2004. RNA regulation: a new genetics?Nat Rev Genet. 5:316-23. Miele. E. A., D. R. Mills, and F. R. Kramer. 1983. Autocatalytic replication of a recombinant RNA. J Mol Biol. 171:281-95. Myers, R. M., Z. Larin, and T. Maniatis. 1985. Detection of single base substitutions by ribonuclease cleavage at mismatches in RNA:DNA duplexes. Science. 230:1242-6. Nguyen, P. N., P. Violette, S. Chan, S. Tanguay, W. Kassouf, A. Aprikian, and J. Z. Chen. 2011. A panel of TMPRSS2:ERG fusion transcript markers for urine-based prostate cancer detection with high specificity and sensitivity. Eur Urol. 59:407-14. Nilsson, J., J. Skog, A. Nordstrand, V. Baranov, L. Mincheva-Nilsson, X. O. Breakefield, and A. Widmark. 2009. Prostate cancer-derived urine exosomes: a novel approach to biomarkers for prostate cancer. Br J Cancer. 100:1603-7. Orita, M., H. Iwahana, H. Kanazawa, K. Hayashi, and T. Sekiya. 1989. Detection of polymorphisms of human DNA by gel electrophoresis as single-strand conformation polymorphisms. Proc Natl Acad Sci USA. 86:2766-70. Orozco, A. F., and D. E. Lewis. 2010. Flow cytometric analysis of circulating microparticles in plasma. Cytometry A. 77:502-14. Palanisamy, N., B. Ateeq, S. Kalyana-Sundaram, D. Pflueger, K. Ramnarayanan, S. Shankar, B. Han, Q. Cao, X. Cao, K. Suleman, C. Kumar-Sinha, S. M. Dhanasekaran, Y. B. Chen, R. Esgueva, S. Banerjee, C. J. LaFargue, J. Siddiqui, F. Demichelis, P. Moeller, T. A. Bismar, R. Kuefer, D. R. Fullen, T. M. Johnson, J. K. Greenson, T. J. Giordano, P. Tan, S. A. Tomlins, S. Varambally, M. A. Rubin, C. A. Maher, and A. M. Chinnaiyan. 2010. Rearrangements of the RAF kinase pathway in prostate cancer, gastric cancer and melanoma. Nat Med. 16:793-8. Petrovics, G., A. Liu, S. Shaheduzzaman, B. Furusato, C. Sun, Y. Chen, M. Nau, L. Ravindranath, A. Dobi, V. Srikantan, I. A. Sesterhenn, D. G. McLeod, M. Vahey, J. W. Moul, and S. Srivastava. 2005. Frequent overexpression of ETS-related gene-1 (ERG1) in prostate cancer transcriptome. Oncogene. 24:3847-52. Raposo, G., H. W. Nijman, W. Stoorvogel, R. Liejendekker, C. V. Harding, C. J. Melief, and H. J. Geuze. 1996. B lymphocytes secrete antigen-presenting vesicles. J Exp Med. 183:1161-72. Rice, K. R., Y. Chen, A. Ali, E. J. Whitman, A. Blase, M. Ibrahim, S. Elsamanoudi, S. Brassell, B. Furusato, N. Stingle, I. A. Sesterhenn, G. Petrovics, S. Miick, H. Rittenhouse, J. Groskopf, D. G. McLeod, and S. Srivastava. 2010. Evaluation of the ETS-related gene mRNA in urine for the detection of prostate cancer. Clin Cancer Res. 16:1572-6. Rostad, K., O. J. Hellwinkel, S. A. Haukaas, O. J. Halvorsen, A. M. Oyan, A. Haese, L. Budaus, H. Albrecht, L. A. Akslen, T. Schlomm, and K. H. Kalland. 2009. TMPRSS2:ERG fusion transcripts in urine from prostate cancer patients correlate with a less favorable prognosis. APMIS. 117:575-82. Salami, S. S., F. Schmidt, B. Laxman, M. M. Regan, D. S. Rickman, D. Scherr, G. Bueti, J. Siddiqui, S. A. Tomlins, J. T. Wei, A. M. Chinnaiyan, M. A. Rubin, and M. G. Sanda. 2011. Combining urinary detection of TMPRSS2:ERG and PCA3 with serum PSA to predict diagnosis of prostate cancer. Urol Oncol. Skog, J., T. Wurdinger, S. van Rijn, D. H. Meijer, L. Gainche, M. Sena-Esteves, W. T. Curry. Jr., B. S. Carter. A. M. Krichevsky, and X. O. Breakefield. 2008. Glioblastoma microvesicles transport RNA and proteins that promote tumour growth and provide diagnostic biomarkers. Nat Cell Biol. 10:1470-6. Steemers, F. J., W. Chang, G. Lee, D. L. Barker, R. Shen, and K. L. Gunderson. 2006. Whole-genome genotyping with the single-base extension assay. Nat Methods. 3:31-3. Taylor. D. D., and C. Gercel-Taylor. 2008. MicroRNA signatures of tumor-derived exosomes as diagnostic biomarkers of ovarian cancer. Gynecol Oncol. 110:13-21. Ting, D. T., D. Lipson, S. Paul, B. W. Brannigan, S. Akhavanfard, E. J. Coffman, G. Contino, V. Deshpande, A. J. Iafrate, S. Letovsky, M. N. Rivera, N. Bardeesy, S. Maheswaran, and D. A. Haber. 2011. Aberrant overexpression of satellite repeats in pancreatic and other epithelial cancers. Science. 331:593-6. Tomlins, S. A., S. M. Aubin, J. Siddiqui, R. J. Lonigro, L. Sefton-Miller, S. Miick, S. Williamsen, P. Hodge, J. Meinke, A. Blase, Y. Penabella, J. R. Day, R. Varambally, B. Han, D. Wood, L. Wang, M. G. Sanda, M. A. Rubin, D. R. Rhodes, B. Hollenbeck, K. Sakamoto, J. L. Silberstein, Y. Fradet, J. B. Amberson, S. Meyers, N. Palanisamy, H. Rittenhouse, J. T. Wei, J. Groskopf, and A. M. Chinnaiyan. 2011. Urine TMPRSS2:ERG Fusion Transcript Stratifies Prostate Cancer Risk in Men with Elevated Serum PSA. Sci Transl Med. 3:94ra72. Tomlins, S. A., D. R. Rhodes, S. Perner, S. M. Dhanasekaran, R. Mehra, X. W. Sun, S. Varambally, X. Cao, J. Tchinda, R. Kuefer, C. Lee, J. E. Montie, R. B. Shah, K. J. Pienta, M. A. Rubin, and A. M. Chinnaiyan. 2005. Recurrent fusion of TMPRSS2 and ETS transcription factor genes in prostate cancer. Science. 310:644-8. Velculescu, V. E., L. Zhang, B. Vogelstein, and K. W. Kinzler. 1995. Serial analysis of gene expression. Science. 270:484-7. Went, P. T., A. Lugli, S. Meier, M. Bundi, M. Mirlacher, G. Sauter, and S. Dirnhofer. 2004. Frequent EpCam protein expression in human carcinomas. Hum Pathol. 35:122-8. Wong, M. L., and J. F. Medrano. 2005. Real-time PCR for mRNA quantitation. Biotechniques. 39:75-85. Zhang, M., D. E. Latham, M. A. Delaney, and A. Chakravarti. 2005. Survivin mediates resistance to antiandrogen therapy in prostate cancer. Oncogene. 24:2474-82.
SEQUENCE LISTINGS
1
441543DNAArtificial SequenceChemically synthesized Q beta particle 1aaacggttct tgtgacccat ccgttactcg ccaggcatat gctgacgtga ccttttcgtt 60cacgcagtat agtaccgatg aggaacgagc ttttgttcgt acagagcttg ctgctctgct 120cgctagtcct agcgtcctca gttagatcct tatcagattc ttggaccaac aagtagccgc 180cttgcaaatc caggcagtgg ccagatccag ctttggcagt tcctcctgga gctcctgtcg 240gacagctccc ggtcggatgt gctgctggag cccttccgcc gcggtgtcat ggagaaactc 300cagctgggcc cagagattct gcagcgggaa aacctgtccg tgacgtggat tggtgctgca 360cccctcatcc tgtctcggat tgtgggaggc tgggagtgcg agaagcattc ccaaccctgg 420caggtgcttg tggcctctcg tggcagggca gtctgcggcg gtgttctggt gcacccccag 480tgggtcctca cagctgccca ctgcatcagg aacaaaagcg tgatcttgct gggtcggcac 540agc 5432300DNAHomo sapiens 2cagtcgaaag ctgctcaacc atctccttcc acagtgccca aaactgaaga ccagcgtcct 60cagttagatc cttatcagat tcttggacca acaagtagcc gccttgcaaa tccaggcagt 120ggccagatcc agctttggca gttcctcctg gagctcctgt cggacagctc caactccagc 180tgcatcacct gggaaggcac caacggggag ttcaagatga cggatcccga cgaggtggcc 240cggcgctggg gagagcggaa gagcaaaccc aacatgaact acgataagct cagccgcgcc 3003386RNAHomo sapiens 3gggagacgaa gggccccaga gcagccgagc ggccgccagg gaggaacgca gaacgcccag 60ccccaggaca cagggcggac accacgacgg caccgagacc aggcagcaaa gaaagacaca 120gacaccaagg cagggggaga aaaagaaagg cgcgacacca cgaggccaca cacgcgaaag 180gagaaaaaca cacagaaaca gcaagagaca aaaagcaaga ggacaggcac accagcccca 240aaaccacaca cacaggaagc acaaaaggaa gcacagagac ccgggagaaa gcccggccac 300cgcggccgca agcggaccga accgggaaag accgccacaa ccacacaaca acgagccgga 360agcaaaagga aagccggggg ccaaga 38643352DNAHomo sapiens 4ggggcgtggc gccggggatt gggagggctt cttgcaggct gctgggctgg ggctaagggc 60tgctcagttt ccttcagcgg ggcactggga agcgccatgg cactgcaggg catctcggtc 120gtggagctgt ccggcctggc cccgggcccg ttctgtgcta tggtcctggc tgacttcggg 180gcgcgtgtgg tacgcgtgga ccggcccggc tcccgctacg acgtgagccg cttgggccgg 240ggcaagcgct cgctagtgct ggacctgaag cagccgcggg gagccgccgt gctgcggcgt 300ctgtgcaagc ggtcggatgt gctgctggag cccttccgcc gcggtgtcat ggagaaactc 360cagctgggcc cagagattct gcagcgggaa aatccaaggc ttatttatgc caggctgagt 420ggatttggcc agtcaggaag cttctgccgg ttagctggcc acgatatcaa ctatttggct 480ttgtcaggtg ttctctcaaa aattggcaga agtggtgaga atccgtatgc cccgctgaat 540ctcctggctg actttgctgg tggtggcctt atgtgtgcac tgggcattat aatggctctt 600tttgaccgca cacgcactgg caagggtcag gtcattgatg caaatatggt ggaaggaaca 660gcatatttaa gttcttttct gtggaaaact cagaaattga gtctgtggga agcacctcga 720ggacagaaca tgttggatgg tggagcacct ttctatacga cttacaggac agcagatggg 780gaattcatgg ctgttggagc aatagaaccc cagttctacg agctgctgat caaaggactt 840ggactaaagt ctgatgaact tcccaatcag atgagcatgg atgattggcc agaaatgaag 900aagaagtttg cagatgtatt tgcagagaag acgaaggcag agtggtgtca aatctttgac 960ggcacagatg cctgtgtgac tccggttctg acttttgagg aggttgttca tcatgatcac 1020aacaaggaac ggggctcgtt tatcaccagt gaggagcagg acgtgagccc ccgccctgca 1080cctctgctgt taaacacccc agccatccct tctttcaaaa gggatccttt cataggagaa 1140cacactgagg agatacttga agaatttgga ttcagccgcg aagagattta tcagcttaac 1200tcagataaaa tcattgaaag taataaggta aaagctagtc tctaacttcc aggcccacgg 1260ctcaagtgaa tttgaatact gcatttacag tgtagagtaa cacataacat tgtatgcatg 1320gaaacatgga ggaacagtat tacagtgtcc taccactcta atcaagaaaa gaattacaga 1380ctctgattct acagtgatga ttgaattcta aaaatggtta tcattagggc ttttgattta 1440taaaactttg ggtacttata ctaaattatg gtagttattc tgccttccag tttgcttgat 1500atatttgttg atattaagat tcttgactta tattttgaat gggttctagt gaaaaaggaa 1560tgatatattc ttgaagacat cgatatacat ttatttacac tcttgattct acaatgtaga 1620aaatgaggaa atgccacaaa ttgtatggtg ataaaagtca cgtgaaacag agtgattggt 1680tgcatccagg ccttttgtct tggtgttcat gatctccctc taagcacatt ccaaacttta 1740gcaacagtta tcacactttg taatttgcaa agaaaagttt cacctgtatt gaatcagaat 1800gccttcaact gaaaaaaaca tatccaaaat aatgaggaaa tgtgttggct cactacgtag 1860agtccagagg gacagtcagt tttagggttg cctgtatcca gtaactcggg gcctgtttcc 1920ccgtgggtct ctgggctgtc agctttcctt tctccatgtg tttgatttct cctcaggctg 1980gtagcaagtt ctggatctta tacccaacac acagcaacat ccagaaataa agatctcagg 2040accccccagc aagtcgtttt gtgtctcctt ggactgagtt aagttacaag cctttcttat 2100acctgtcttt gacaaagaag acgggattgt ctttacataa aaccagcctg ctcctggagc 2160ttccctggac tcaacttcct aaaggcatgt gaggaagggg tagattccac aatctaatcc 2220gggtgccatc agagtagagg gagtagagaa tggatgttgg gtaggccatc aataaggtcc 2280attctgcgca gtatctcaac tgccgttcaa caatcgcaag aggaaggtgg agcaggtttc 2340ttcatcttac agttgagaaa acagagactc agaagggctt cttagttcat gtttccctta 2400gcgcctcagt gattttttca tggtggctta ggccaaaaga aatatctaac cattcaattt 2460ataaataatt aggtccccaa cgaattaaat attatgtcct accaacttat tagctgcttg 2520aaaaatataa tacacataaa taaaaaaata tatttttcat ttctatttca ttgttaatca 2580caactactta ctaaggagat gtatgcacct attggacact gtgcaacttc tcacctggaa 2640tgagattgga cactgctgcc ctcattttct gctccatgtt ggtgtccata tagtacttga 2700ttttttatca gatggcctgg aaaacccagt ctcacaaaaa tatgaaatta tcagaaggat 2760tatagtgcaa tcttatgttg aaagaatgaa ctacctcact agtagttcac gtgatgtctg 2820acagatgttg agtttcattg tgtttgtgtg ttcaaatttt taaatattct gagatactct 2880tgtgaggtca ctctaatgcc ctgggtgcct tggcacagtt ttagaaatac cagttgaaaa 2940tatttgctca ggaatatgca actaggaagg ggcagaatca gaatttaagc tttcatattc 3000tagccttcag tcttgttctt caaccatttt taggaacttt cccataaggt tatgttttcc 3060agcccaggca tggaggatca cttgaggcca agagttcgag accagcctgg ggaacttggc 3120tggacctccg tttctacgaa ataaaaataa aaaaattatc caggtatggt ggtgtgtgcc 3180tgtagtccta tctactcaag ggtggggcag gaggatcact tgagcccagg aatttgaggc 3240cacagtgaat taggattgca ccactgcact ctagcccagg caacagaaca agaacctgtc 3300tctaaataaa taaataaaaa taataataat aaaaaagatg ttttccctac aa 335252655DNAHomo sapiens 5cccagaaggc cgcggggggt ggaccgccta agagggcgtg cgctcccgac atgccccgcg 60gcgcgccatt aaccgccaga tttgaatcgc gggacccgtt ggcagaggtg gcggcggcgg 120catgggtgcc ccgacgttgc cccctgcctg gcagcccttt ctcaaggacc accgcatctc 180tacattcaag aactggccct tcttggaggg ctgcgcctgc accccggagc ggatggccga 240ggctggcttc atccactgcc ccactgagaa cgagccagac ttggcccagt gtttcttctg 300cttcaaggag ctggaaggct gggagccaga tgacgacccc atagaggaac ataaaaagca 360ttcgtccggt tgcgctttcc tttctgtcaa gaagcagttt gaagaattaa cccttggtga 420atttttgaaa ctggacagag aaagagccaa gaacaaaatt gcaaaggaaa ccaacaataa 480gaagaaagaa tttgaggaaa ctgcggagaa agtgcgccgt gccatcgagc agctggctgc 540catggattga ggcctctggc cggagctgcc tggtcccaga gtggctgcac cacttccagg 600gtttattccc tggtgccacc agccttcctg tgggcccctt agcaatgtct taggaaagga 660gatcaacatt ttcaaattag atgtttcaac tgtgctcttg ttttgtcttg aaagtggcac 720cagaggtgct tctgcctgtg cagcgggtgc tgctggtaac agtggctgct tctctctctc 780tctctctttt ttgggggctc atttttgctg ttttgattcc cgggcttacc aggtgagaag 840tgagggagga agaaggcagt gtcccttttg ctagagctga cagctttgtt cgcgtgggca 900gagccttcca cagtgaatgt gtctggacct catgttgttg aggctgtcac agtcctgagt 960gtggacttgg caggtgcctg ttgaatctga gctgcaggtt ccttatctgt cacacctgtg 1020cctcctcaga ggacagtttt tttgttgttg tgtttttttg tttttttttt tttggtagat 1080gcatgacttg tgtgtgatga gagaatggag acagagtccc tggctcctct actgtttaac 1140aacatggctt tcttattttg tttgaattgt taattcacag aatagcacaa actacaatta 1200aaactaagca caaagccatt ctaagtcatt ggggaaacgg ggtgaacttc aggtggatga 1260ggagacagaa tagagtgata ggaagcgtct ggcagatact ccttttgcca ctgctgtgtg 1320attagacagg cccagtgagc cgcggggcac atgctggccg ctcctccctc agaaaaaggc 1380agtggcctaa atccttttta aatgacttgg ctcgatgctg tgggggactg gctgggctgc 1440tgcaggccgt gtgtctgtca gcccaacctt cacatctgtc acgttctcca cacgggggag 1500agacgcagtc cgcccaggtc cccgctttct ttggaggcag cagctcccgc agggctgaag 1560tctggcgtaa gatgatggat ttgattcgcc ctcctccctg tcatagagct gcagggtgga 1620ttgttacagc ttcgctggaa acctctggag gtcatctcgg ctgttcctga gaaataaaaa 1680gcctgtcatt tcaaacactg ctgtggaccc tactgggttt ttaaaatatt gtcagttttt 1740catcgtcgtc cctagcctgc caacagccat ctgcccagac agccgcagtg aggatgagcg 1800tcctggcaga gacgcagttg tctctgggcg cttgccagag ccacgaaccc cagacctgtt 1860tgtatcatcc gggctccttc cgggcagaaa caactgaaaa tgcacttcag acccacttat 1920ttctgccaca tctgagtcgg cctgagatag acttttccct ctaaactggg agaatatcac 1980agtggttttt gttagcagaa aatgcactcc agcctctgta ctcatctaag ctgcttattt 2040ttgatatttg tgtcagtctg taaatggata cttcacttta ataactgttg cttagtaatt 2100ggctttgtag agaagctgga aaaaaatggt tttgtcttca actcctttgc atgccaggcg 2160gtgatgtgga tctcggcttc tgtgagcctg tgctgtgggc agggctgagc tggagccgcc 2220cctctcagcc cgcctgccac ggcctttcct taaaggccat ccttaaaacc agaccctcat 2280ggctaccagc acctgaaagc ttcctcgaca tctgttaata aagccgtagg cccttgtcta 2340agtgcaaccg cctagacttt ctttcagata catgtccaca tgtccatttt tcaggttctc 2400taagttggag tggagtctgg gaagggttgt gaatgaggct tctgggctat gggtgaggtt 2460ccaatggcag gttagagccc ctcgggccaa ctgccatcct ggaaagtaga gacagcagtg 2520cccgctgccc agaagagacc agcaagccaa actggagccc ccattgcagg ctgtcgccat 2580gtggaaagag taactcacaa ttgccaataa agtctcatgt ggttttatct aaaaaaaaaa 2640aaaaaaaaaa aaaaa 265561681DNAHomo sapiens 6ttttgtctgt cctggattgg agccgtccct ataaccatct agttccgagt acaaactgga 60gacagaaata aatattaaag aaatcataga ccgaccaggt aaaggcaaag ggatgaattc 120ctacttcact aacccttcct tatcctgcca cctcgccggg ggccaggacg tcctccccaa 180cgtcgccctc aattccaccg cctatgatcc agtgaggcat ttctcgacct atggagcggc 240cgttgcccag aaccggatct actcgactcc cttttattcg ccacaggaga atgtcgtgtt 300cagttccagc cgggggccgt atgactatgg atctaattcc ttttaccagg agaaagacat 360gctctcaaac tgcagacaaa acaccttagg acataacaca cagacctcaa tcgctcagga 420ttttagttct gagcagggca ggactgcgcc ccaggaccag aaagccagta tccagattta 480cccctggatg cagcgaatga attcgcacag tggggtcggc tacggagcgg accggaggcg 540cggccgccag atctactcgc ggtaccagac cctggaactg gagaaggaat ttcacttcaa 600tcgctaccta acgcggcgcc ggcgcatcga gatcgccaac gcgctttgcc tgaccgagcg 660acagatcaaa atctggttcc agaaccgccg gatgaagtgg aaaaaagaat ctaatctcac 720atccactctc tcggggggcg gcggaggggc caccgccgac agcctgggcg gaaaagagga 780aaagcgggaa gagacagaag aggagaagca gaaagagtga ccaggactgt ccctgccacc 840cctctctccc tttctccctc gctccccacc aactctcccc taatcacaca ctctgtattt 900atcactggca caattgatgt gttttgattc cctaaaacaa aattagggag tcaaacgtgg 960acctgaaagt cagctctgga ccccctccct caccgcacaa ctctctttca ccacgcgcct 1020cctcctcctc gctcccttgc tagctcgttc tcggcttgtc tacaggccct tttccccgtc 1080caggccttgg gggctcggac cctgaactca gactctacag attgccctcc aagtgaggac 1140ttggctcccc cactccttcg acgcccccac ccccgccccc cgtgcagaga gccggctcct 1200gggcctgctg gggcctctgc tccagggcct cagggcccgg cctggcagcc ggggagggcc 1260ggaggcccaa ggagggcgcg ccttggcccc acaccaaccc ccagggcctc cccgcagtcc 1320ctgcctagcc cctctgcccc agcaaatgcc cagcccaggc aaattgtatt taaagaatcc 1380tgggggtcat tatggcattt tacaaactgt gaccgtttct gtgtgaagat ttttagctgt 1440atttgtggtc tctgtattta tatttatgtt tagcaccgtc agtgttccta tccaatttca 1500aaaaaggaaa aaaaagaggg aaaattacaa aaagagagaa aaaaagtgaa tgacgtttgt 1560ttagccagta ggagaaaata aataaataaa taaatccctt cgtgttaccc tcctgtataa 1620atccaacctc tgggtccgtt ctcgaatatt taataaaact gatattattt ttaaaacttt 1680a 168173012DNAHomo sapiens 7aaaaatgcat aaagagccaa gtgcttatat tctggccaag ttatgaggct ctgagaacaa 60gagcttgagg ggaagactgt taaccccatc cacgccacca gaattagctc tttccctttt 120ggtttgcaag cactgcctgt aaagccctcg catgagaggc cagcctgcta gggaaatcca 180ggaatctgca acaaaaacga tgacagtctg aaatactctc tggtgccaac ctccaaattc 240tcgtctgtca cttcagaccc ccactagttg acagagcagc agaatttcaa ctccagtaga 300cttgaatatg cctctgggca aagaagcaga gctaacgagg aaagggattt aaagagtttt 360tcttgggtgt ttgtcaaact tttattccct gtctgtgtgc agaggggatt caacttcaat 420ttttctgcag tggctctggg tccagcccct tacttaaagg ccataagatg ttttattgaa 480agaaactttc aatatcaagt aatccaacca accttctaag ataagccttt tccttcaaca 540caaagaagtg cattttgcca aatctggaaa gcatgaagac tgggcttttt ttcctatgtc 600tcttgggaac tgcagctgca atcccgacaa atgcaagatt attatctgat cattccaaac 660caactgctga aacggtagca cctgacaaca ctgcaatccc cagtttaagg gctgaagctg 720aagaaaatga aaaagaaaca gcagtatcca cagaagacga ttcccaccat aaggctgaaa 780aatcatcagt actaaagtca aaagaggaaa gccatgaaca gtcagcagaa cagggcaaga 840gttctagcca agagctggga ttgaaggatc aagaggacag tgatggtcac ttaagtgtga 900atttggagta tgcaccaact gaaggtacat tggacataaa agaagatatg agtgagcctc 960aggagaaaaa actctcagag aacactgatt ttttggctcc tggtgttagt tccttcacag 1020attctaacca acaagaaagt atcacaaaga gagaggaaaa ccaagaacaa cctagaaatt 1080attcacatca tcagttgaac aggagcagta aacatagcca aggcctaagg gatcaaggaa 1140accaagagca ggatccaaat atttccaatg gagaagagga agaagaaaaa gagccaggtg 1200aagttggtac ccacaatgat aaccaagaaa gaaagacaga attgcccagg gagcatgcta 1260acagcaagca ggaggaagac aatacccaat ctgatgatat tttggaagag tctgatcaac 1320caactcaagt aagcaagatg caggaggatg aatttgatca gggtaaccaa gaacaagaag 1380ataactccaa tgcagaaatg gaagaggaaa atgcatcgaa cgtcaataag cacattcaag 1440aaactgaatg gcagagtcaa gagggtaaaa ctggcctaga agctatcagc aaccacaaag 1500agacagaaga aaagactgtt tctgaggctc tgctcatgga acctactgat gatggtaata 1560ccacgcccag aaatcatgga gttgatgatg atggcgatga tgatggcgat gatggcggca 1620ctgatggccc caggcacagt gcaagtgatg actacttcat cccaagccag gcctttctgg 1680aggccgagag agctcaatcc attgcctatc acctcaaaat tgaggagcaa agagaaaaag 1740tacatgaaaa tgaaaatata ggtaccactg agcctggaga gcaccaagag gccaagaaag 1800cagagaactc atcaaatgag gaggaaacgt caagtgaagg caacatgagg gtgcatgctg 1860tggattcttg catgagcttc cagtgtaaaa gaggccacat ctgtaaggca gaccaacagg 1920gaaaacctca ctgtgtctgc caggatccag tgacttgtcc tccaacaaaa ccccttgatc 1980aagtttgtgg cactgacaat cagacctatg ctagttcctg tcatctattc gctactaaat 2040gcagactgga ggggaccaaa aaggggcatc aactccagct ggattatttt ggagcctgca 2100aatctattcc tacttgtacg gactttgaag tgattcagtt tcctctacgg atgagagact 2160ggctcaagaa tatcctcatg cagctttatg aagccaactc tgaacacgct ggttatctaa 2220atgagaagca gagaaataaa gtcaagaaaa tttacctgga tgaaaagagg cttttggctg 2280gggaccatcc cattgatctt ctcttaaggg actttaagaa aaactaccac atgtatgtgt 2340atcctgtgca ctggcagttt agtgaacttg accaacaccc tatggataga gtcttgacac 2400attctgaact tgctcctctg cgagcatctc tggtgcccat ggaacactgc ataacccgtt 2460tctttgagga gtgtgacccc aacaaggata agcacatcac cctgaaggag tggggccact 2520gctttggaat taaagaagag gacatagatg aaaatctctt gttttgaacg aagattttaa 2580agaactcaac tttccagcat cctcctctgt tctaaccact tcagaaatat atgcagctgt 2640gatacttgta gatttatatt tagcaaaatg ttagcatgta tgacaagaca atgagagtaa 2700ttgcttgaca acaacctatg caccaggtat ttaacattaa ctttggaaac aaaaatgtac 2760aattaagtaa agtcaacata tgcaaaatac tgtacattgt gaacagaagt ttaattcata 2820gtaatttcac tctctgcatt gacttatgag ataattaatg attaaactat taatgataaa 2880aataatgcat ttgtattgtt cataatatca tgtgcacttc aagaaaatgg aatgctactc 2940ttttgtggtt tacgtgtatt attttcaata tcttaatacc ctaataaaga gtccataaaa 3000atccaaatgc tt 30128300DNAHomo sapiens 8ttgtcttcct caccctgtcc gtgacgtgga ttggtgctgc acccctcatc ctgtctcgga 60ttgtgggagg ctgggagtgc gagaagcatt cccaaccctg gcaggtgctt gtggcctctc 120gtggcagggc agtctgcggc ggtgttctgg tgcaccccca gtgggtcctc acagctgccc 180actgcatcag gaacaaaagc gtgatcttgc tgggtcggca cagcctgttt catcctgaag 240acacaggcca ggtatttcag gtcagccaca gcttcccaca cccgctctac gatatgagcc 3009586RNAHomo sapiens 9gggagacgaa gggccccaga gcagccgagc ggccgccagg gaggaacgca gaacgcccaa 60agaggacagg cacaccagcc ccaaaaccac acacacagga agcacaaaag gaagcacaga 120gacccgggag aaagcccggc ccggggggga ggcgcacgcc caccggacac ggaagcagcg 180gccggagaaa gagcggacca ccggggcgac acacaaacgg aaagcagaag acgggcccag 240ccgggaacgc agcgcaaccc gacaaagcaa gaaacgacac caaaccaacg cgaaacggag 300caccaggccc agaaacggac gaggacagca ccaagggcaa gacgaagacc aagaacgaaa 360aggaagccac aaaccgaaac acagggcagg gacaggcaaa aggaccaccg caccacacaa 420gaacggcccc ggagggcgcg ccgcaccccg gagcggaggc cgaggcggcc accacgcccc 480acgagaacga gccagacgac cgcggccgca agcggaccga accgggaaag accgccacaa 540ccacacaaca acgagccgga agcaaaagga aagccggggg ccaaga 5861019DNAArtificial SequenceChemically synthesized primer sequence 10ccacctggac atctggaag 191118DNAArtificial SequenceChemically synthesized primer sequence 11aatcgcccca ggtgaagt 181219DNAArtificial SequenceChemically synthesized probe sequencemisc_feature(1)..(1)conjugated to 5' 6-FAMmisc_feature(9)..(10)internal ZEN quenchermisc_feature(19)..(19)conjugated to 3' Iowa Black(r) FQ 12cggcctggat gaaagagcg 191325DNAArtificial SequenceChemically synthesized primer sequence 13gcgtcctcag ttagatcctt atcag 251418DNAArtificial SequenceChemically synthesized primer sequence 14ctggccactg cctggatt 181526DNAArtificial SequenceChemically synthesized probe sequencemisc_feature(1)..(1)conjugated to 5' 6-FAMmisc_feature(9)..(10)internal ZEN quenchermisc_feature(26)..(26)conjugated to 3' Iowa Black(r) FQ 15cttggaccaa caagtagccg ccttgc 261620DNAArtificial SequenceChemically synthesized primer sequence 16gcacatttcc agccccttta 201720DNAArtificial SequenceChemically synthesized primer sequence 17ggcatttctc ccagggatct 201824DNAArtificial SequenceChemically synthesized probe sequencemisc_feature(1)..(1)conjugated to 5' 6-FAMmisc_feature(9)..(10)internal ZEN quenchermisc_feature(24)..(24)conjugated to 3' Iowa Black(r) FQ 18cacacaggaa gcacaaaagg aagc 241920DNAArtificial SequenceChemically synthesized primer sequence 19aacggttctt gtgacccatc
202020DNAArtificial SequenceChemically synthesized primer sequence 20cgaacaaaag ctcgttcctc 202121DNAArtificial SequenceChemically synthesized probe sequencemisc_feature(1)..(1)conjugated to 5' 6-FAMmisc_feature(9)..(10)internal ZEN quenchermisc_feature(21)..(21)conjugated to 3' Iowa Black(r) FQ 21cgccaggcat atgctgacgt g 212218DNAArtificial SequenceChemically synthesized primer sequence 22cctgtccgtg acgtggat 182319DNAArtificial SequenceChemically synthesized primer sequence 23cagggttggg aatgcttct 192420DNAArtificial SequenceChemically synthesized probe sequencemisc_feature(1)..(1)conjugated to 5' 6-FAMmisc_feature(9)..(10)internal ZEN quenchermisc_feature(20)..(20)conjugated to 3' Iowa Black(r) FQ 24cggattgtgg gaggctggga 202516DNAArtificial SequenceChemically synthesized primer sequence 25gcctggagcg cggcag 162620DNAArtificial SequenceChemically synthesized primer sequence 26gcacactcaa acaacgactg 202725DNAArtificial SequenceChemically synthesized probe sequencemisc_feature(1)..(1)conjugated to 5' 6-FAMmisc_feature(9)..(10)internal ZEN quenchermisc_feature(25)..(25)conjugated to 3' Iowa Black(r) FQ 27agccttatca gttgtgagtg aggac 252815DNAArtificial SequenceChemically synthesized primer sequence 28gccgcggtgt catgg 152919DNAArtificial SequenceChemically synthesized primer sequence 29tttcccgctg cagaatctc 193020DNAArtificial SequenceChemically synthesized probe sequencemisc_feature(1)..(1)conjugated to 5' 6-FAMmisc_feature(9)..(10)internal ZEN quenchermisc_feature(9)..(10)internal ZEN quencher 30agaaactcca gctgggccca 203120DNAArtificial SequenceChemically synthesized primer sequence 31ggaccaccgc atctctacat 203220DNAArtificial SequenceChemically synthesized primer sequence 32gtctggctcg ttctcagtgg 203320DNAArtificial SequenceChemically synthesized probe sequencemisc_feature(1)..(1)conjugated to 5' 6-FAMmisc_feature(9)..(10)internal ZEN quenchermisc_feature(20)..(20)conjugated to 3' Iowa Black(r) FQ 33cttcttggag ggctgcgcct 203421DNAArtificial SequenceChemically synthesized primer sequence 34tctggaaagc atgaagactg g 213520DNAArtificial SequenceChemically synthesized primer sequence 35tgctaccgtt tcagcagttg 203620DNAArtificial SequenceChemically synthesized probe sequencemisc_feature(1)..(1)conjugated to 5' 6-FAMmisc_feature(9)..(10)internal ZEN quenchermisc_feature(20)..(20)conjugated to 3' Iowa Black(r) FQ 36ctgcagctgc aatcccgaca 20373191DNAHomo sapiens 37ggggcgtggc gccggggatt gggagggctt cttgcaggct gctgggctgg ggctaagggc 60tgctcagttt ccttcagcgg ggcactggga agcgccatgg cactgcaggg catctcggtc 120gtggagctgt ccggcctggc cccgggcccg ttctgtgcta tggtcctggc tgacttcggg 180gcgcgtgtgg tacgcgtgga ccggcccggc tcccgctacg acgtgagccg cttgggccgg 240ggcaagcgct cgctagtgct ggacctgaag cagccgcggg gagccgccgt gctgcggcgt 300ctgtgcaagc ggtcggatgt gctgctggag cccttccgcc gcggtgtcat ggagaaactc 360cagctgggcc cagagattct gcagcgggaa aatccaaggc ttatttatgc caggctgagt 420ggatttggcc agtcaggaag cttctgccgg ttagctggcc acgatatcaa ctatttggct 480ttgtcaggtg gaaggaacag catatttaag ttcttttctg tggaaaactc agaaattgag 540tctgtgggaa gcacctcgag gacagaacat gttggatggt ggagcacctt tctatacgac 600ttacaggaca gcagatgggg aattcatggc tgttggagca atagaacccc agttctacga 660gctgctgatc aaaggacttg gactaaagtc tgatgaactt cccaatcaga tgagcatgga 720tgattggcca gaaatgaaga agaagtttgc agatgtattt gcagagaaga cgaaggcaga 780gtggtgtcaa atctttgacg gcacagatgc ctgtgtgact ccggttctga cttttgagga 840ggttgttcat catgatcaca acaaggaacg gggctcgttt atcaccagtg aggagcagga 900cgtgagcccc cgccctgcac ctctgctgtt aaacacccca gccatccctt ctttcaaaag 960ggatcctttc ataggagaac acactgagga gatacttgaa gaatttggat tcagccgcga 1020agagatttat cagcttaact cagataaaat cattgaaagt aataaggtaa aagctagtct 1080ctaacttcca ggcccacggc tcaagtgaat ttgaatactg catttacagt gtagagtaac 1140acataacatt gtatgcatgg aaacatggag gaacagtatt acagtgtcct accactctaa 1200tcaagaaaag aattacagac tctgattcta cagtgatgat tgaattctaa aaatggttat 1260cattagggct tttgatttat aaaactttgg gtacttatac taaattatgg tagttattct 1320gccttccagt ttgcttgata tatttgttga tattaagatt cttgacttat attttgaatg 1380ggttctagtg aaaaaggaat gatatattct tgaagacatc gatatacatt tatttacact 1440cttgattcta caatgtagaa aatgaggaaa tgccacaaat tgtatggtga taaaagtcac 1500gtgaaacaga gtgattggtt gcatccaggc cttttgtctt ggtgttcatg atctccctct 1560aagcacattc caaactttag caacagttat cacactttgt aatttgcaaa gaaaagtttc 1620acctgtattg aatcagaatg ccttcaactg aaaaaaacat atccaaaata atgaggaaat 1680gtgttggctc actacgtaga gtccagaggg acagtcagtt ttagggttgc ctgtatccag 1740taactcgggg cctgtttccc cgtgggtctc tgggctgtca gctttccttt ctccatgtgt 1800ttgatttctc ctcaggctgg tagcaagttc tggatcttat acccaacaca cagcaacatc 1860cagaaataaa gatctcagga ccccccagca agtcgttttg tgtctccttg gactgagtta 1920agttacaagc ctttcttata cctgtctttg acaaagaaga cgggattgtc tttacataaa 1980accagcctgc tcctggagct tccctggact caacttccta aaggcatgtg aggaaggggt 2040agattccaca atctaatccg ggtgccatca gagtagaggg agtagagaat ggatgttggg 2100taggccatca ataaggtcca ttctgcgcag tatctcaact gccgttcaac aatcgcaaga 2160ggaaggtgga gcaggtttct tcatcttaca gttgagaaaa cagagactca gaagggcttc 2220ttagttcatg tttcccttag cgcctcagtg attttttcat ggtggcttag gccaaaagaa 2280atatctaacc attcaattta taaataatta ggtccccaac gaattaaata ttatgtccta 2340ccaacttatt agctgcttga aaaatataat acacataaat aaaaaaatat atttttcatt 2400tctatttcat tgttaatcac aactacttac taaggagatg tatgcaccta ttggacactg 2460tgcaacttct cacctggaat gagattggac actgctgccc tcattttctg ctccatgttg 2520gtgtccatat agtacttgat tttttatcag atggcctgga aaacccagtc tcacaaaaat 2580atgaaattat cagaaggatt atagtgcaat cttatgttga aagaatgaac tacctcacta 2640gtagttcacg tgatgtctga cagatgttga gtttcattgt gtttgtgtgt tcaaattttt 2700aaatattctg agatactctt gtgaggtcac tctaatgccc tgggtgcctt ggcacagttt 2760tagaaatacc agttgaaaat atttgctcag gaatatgcaa ctaggaaggg gcagaatcag 2820aatttaagct ttcatattct agccttcagt cttgttcttc aaccattttt aggaactttc 2880ccataaggtt atgttttcca gcccaggcat ggaggatcac ttgaggccaa gagttcgaga 2940ccagcctggg gaacttggct ggacctccgt ttctacgaaa taaaaataaa aaaattatcc 3000aggtatggtg gtgtgtgcct gtagtcctat ctactcaagg gtggggcagg aggatcactt 3060gagcccagga atttgaggcc acagtgaatt aggattgcac cactgcactc tagcccaggc 3120aacagaacaa gaacctgtct ctaaataaat aaataaaaat aataataata aaaaagatgt 3180tttccctaca a 3191382603DNAHomo sapiens 38ggggcgtggc gccggggatt gggagggctt cttgcaggct gctgggctgg ggctaagggc 60tgctcagttt ccttcagcgg ggcactggga agcgccatgg cactgcaggg catctcggtc 120gtggagctgt ccggcctggc cccgggcccg ttctgtgcta tggtcctggc tgacttcggg 180gcgcgtgtgg tacgcgtgga ccggcccggc tcccgctacg acgtgagccg cttgggccgg 240ggcaagcgct cgctagtgct ggacctgaag cagccgcggg gagccgccgt gctgcggcgt 300ctgtgcaagc ggtcggatgt gctgctggag cccttccgcc gcggtgtcat ggagaaactc 360cagctgggcc cagagattct gcagcgggaa aatccaaggc ttatttatgc caggctgagt 420ggatttggcc agtcaggaag cttctgccgg ttagctggcc acgatatcaa ctatttggct 480ttgtcaggtg ttctctcaaa aattggcaga agtggtgaga atccgtatgc cccgctgaat 540ctcctggctg actttgctgg tggtggcctt atgtgtgcac tgggcattat aatggctctt 600tttgaccgca cacgcactgg caagggtcag gtcattgatg caaatatggt ggaaggaaca 660gcatatttaa gttcttttct gtggaaaact cagaaattga gtctgtggga agcacctcga 720ggacagaaca tgttggatgg tggagcacct ttctatacga cttacaggac agcagatggg 780gaattcatgg ctgttggagc aatagaaccc cagttctacg agctgctgat caaaggactt 840ggactaaagt ctgatgaact tcccaatcag atgagcatgg atgattggcc agaaatgaag 900aagaagtttg cagatgtatt tgcagagaag acgaaggcag agtggtgtca aatctttgac 960ggcacagatg cctgtgtgac tccggttctg acttttgagg aggttgttca tcatgatcac 1020aacaaggaac ggggctcgtt tatcaccagt gaggagcagg acgtgagccc ccgccctgca 1080cctctgctgt taaacacccc agccatccct tctttcaaaa gggatccttt cataggagaa 1140cacactgagg agatacttga agaatttgga ttcagccgcg aagagattta tcagcttaac 1200tcagataaaa tcattgaaag taataaggct ggtagcaagt tctggatctt atacccaaca 1260cacagcaaca tccagaaata aagatctcag gaccccccag caagtcgttt tgtgtctcct 1320tggactgagt taagttacaa gcctttctta tacctgtctt tgacaaagaa gacgggattg 1380tctttacata aaaccagcct gctcctggag cttccctgga ctcaacttcc taaaggcatg 1440tgaggaaggg gtagattcca caatctaatc cgggtgccat cagagtagag ggagtagaga 1500atggatgttg ggtaggccat caataaggtc cattctgcgc agtatctcaa ctgccgttca 1560acaatcgcaa gaggaaggtg gagcaggttt cttcatctta cagttgagaa aacagagact 1620cagaagggct tcttagttca tgtttccctt agcgcctcag tgattttttc atggtggctt 1680aggccaaaag aaatatctaa ccattcaatt tataaataat taggtcccca acgaattaaa 1740tattatgtcc taccaactta ttagctgctt gaaaaatata atacacataa ataaaaaaat 1800atatttttca tttctatttc attgttaatc acaactactt actaaggaga tgtatgcacc 1860tattggacac tgtgcaactt ctcacctgga atgagattgg acactgctgc cctcattttc 1920tgctccatgt tggtgtccat atagtacttg attttttatc agatggcctg gaaaacccag 1980tctcacaaaa atatgaaatt atcagaagga ttatagtgca atcttatgtt gaaagaatga 2040actacctcac tagtagttca cgtgatgtct gacagatgtt gagtttcatt gtgtttgtgt 2100gttcaaattt ttaaatattc tgagatactc ttgtgaggtc actctaatgc cctgggtgcc 2160ttggcacagt tttagaaata ccagttgaaa atatttgctc aggaatatgc aactaggaag 2220gggcagaatc agaatttaag ctttcatatt ctagccttca gtcttgttct tcaaccattt 2280ttaggaactt tcccataagg ttatgttttc cagcccaggc atggaggatc acttgaggcc 2340aagagttcga gaccagcctg gggaacttgg ctggacctcc gtttctacga aataaaaata 2400aaaaaattat ccaggtatgg tggtgtgtgc ctgtagtcct atctactcaa gggtggggca 2460ggaggatcac ttgagcccag gaatttgagg ccacagtgaa ttaggattgc accactgcac 2520tctagcccag gcaacagaac aagaacctgt ctctaaataa ataaataaaa ataataataa 2580taaaaaagat gttttcccta caa 2603392537DNAHomo sapiens 39cccagaaggc cgcggggggt ggaccgccta agagggcgtg cgctcccgac atgccccgcg 60gcgcgccatt aaccgccaga tttgaatcgc gggacccgtt ggcagaggtg gcggcggcgg 120catgggtgcc ccgacgttgc cccctgcctg gcagcccttt ctcaaggacc accgcatctc 180tacattcaag aactggccct tcttggaggg ctgcgcctgc accccggagc ggatggccga 240ggctggcttc atccactgcc ccactgagaa cgagccagac ttggcccagt gtttcttctg 300cttcaaggag ctggaaggct gggagccaga tgacgacccc atgcaaagga aaccaacaat 360aagaagaaag aatttgagga aactgcggag aaagtgcgcc gtgccatcga gcagctggct 420gccatggatt gaggcctctg gccggagctg cctggtccca gagtggctgc accacttcca 480gggtttattc cctggtgcca ccagccttcc tgtgggcccc ttagcaatgt cttaggaaag 540gagatcaaca ttttcaaatt agatgtttca actgtgctct tgttttgtct tgaaagtggc 600accagaggtg cttctgcctg tgcagcgggt gctgctggta acagtggctg cttctctctc 660tctctctctt ttttgggggc tcatttttgc tgttttgatt cccgggctta ccaggtgaga 720agtgagggag gaagaaggca gtgtcccttt tgctagagct gacagctttg ttcgcgtggg 780cagagccttc cacagtgaat gtgtctggac ctcatgttgt tgaggctgtc acagtcctga 840gtgtggactt ggcaggtgcc tgttgaatct gagctgcagg ttccttatct gtcacacctg 900tgcctcctca gaggacagtt tttttgttgt tgtgtttttt tgtttttttt tttttggtag 960atgcatgact tgtgtgtgat gagagaatgg agacagagtc cctggctcct ctactgttta 1020acaacatggc tttcttattt tgtttgaatt gttaattcac agaatagcac aaactacaat 1080taaaactaag cacaaagcca ttctaagtca ttggggaaac ggggtgaact tcaggtggat 1140gaggagacag aatagagtga taggaagcgt ctggcagata ctccttttgc cactgctgtg 1200tgattagaca ggcccagtga gccgcggggc acatgctggc cgctcctccc tcagaaaaag 1260gcagtggcct aaatcctttt taaatgactt ggctcgatgc tgtgggggac tggctgggct 1320gctgcaggcc gtgtgtctgt cagcccaacc ttcacatctg tcacgttctc cacacggggg 1380agagacgcag tccgcccagg tccccgcttt ctttggaggc agcagctccc gcagggctga 1440agtctggcgt aagatgatgg atttgattcg ccctcctccc tgtcatagag ctgcagggtg 1500gattgttaca gcttcgctgg aaacctctgg aggtcatctc ggctgttcct gagaaataaa 1560aagcctgtca tttcaaacac tgctgtggac cctactgggt ttttaaaata ttgtcagttt 1620ttcatcgtcg tccctagcct gccaacagcc atctgcccag acagccgcag tgaggatgag 1680cgtcctggca gagacgcagt tgtctctggg cgcttgccag agccacgaac cccagacctg 1740tttgtatcat ccgggctcct tccgggcaga aacaactgaa aatgcacttc agacccactt 1800atttctgcca catctgagtc ggcctgagat agacttttcc ctctaaactg ggagaatatc 1860acagtggttt ttgttagcag aaaatgcact ccagcctctg tactcatcta agctgcttat 1920ttttgatatt tgtgtcagtc tgtaaatgga tacttcactt taataactgt tgcttagtaa 1980ttggctttgt agagaagctg gaaaaaaatg gttttgtctt caactccttt gcatgccagg 2040cggtgatgtg gatctcggct tctgtgagcc tgtgctgtgg gcagggctga gctggagccg 2100cccctctcag cccgcctgcc acggcctttc cttaaaggcc atccttaaaa ccagaccctc 2160atggctacca gcacctgaaa gcttcctcga catctgttaa taaagccgta ggcccttgtc 2220taagtgcaac cgcctagact ttctttcaga tacatgtcca catgtccatt tttcaggttc 2280tctaagttgg agtggagtct gggaagggtt gtgaatgagg cttctgggct atgggtgagg 2340ttccaatggc aggttagagc ccctcgggcc aactgccatc ctggaaagta gagacagcag 2400tgcccgctgc ccagaagaga ccagcaagcc aaactggagc ccccattgca ggctgtcgcc 2460atgtggaaag agtaactcac aattgccaat aaagtctcat gtggttttat ctaaaaaaaa 2520aaaaaaaaaa aaaaaaa 2537402724DNAHomo sapiens 40cccagaaggc cgcggggggt ggaccgccta agagggcgtg cgctcccgac atgccccgcg 60gcgcgccatt aaccgccaga tttgaatcgc gggacccgtt ggcagaggtg gcggcggcgg 120catgggtgcc ccgacgttgc cccctgcctg gcagcccttt ctcaaggacc accgcatctc 180tacattcaag aactggccct tcttggaggg ctgcgcctgc accccggagc ggatggccga 240ggctggcttc atccactgcc ccactgagaa cgagccagac ttggcccagt gtttcttctg 300cttcaaggag ctggaaggct gggagccaga tgacgacccc attgggccgg gcacggtggc 360ttacgcctgt aataccagca ctttgggagg ccgaggcggg cggatcacga gagaggaaca 420taaaaagcat tcgtccggtt gcgctttcct ttctgtcaag aagcagtttg aagaattaac 480ccttggtgaa tttttgaaac tggacagaga aagagccaag aacaaaattg caaaggaaac 540caacaataag aagaaagaat ttgaggaaac tgcggagaaa gtgcgccgtg ccatcgagca 600gctggctgcc atggattgag gcctctggcc ggagctgcct ggtcccagag tggctgcacc 660acttccaggg tttattccct ggtgccacca gccttcctgt gggcccctta gcaatgtctt 720aggaaaggag atcaacattt tcaaattaga tgtttcaact gtgctcttgt tttgtcttga 780aagtggcacc agaggtgctt ctgcctgtgc agcgggtgct gctggtaaca gtggctgctt 840ctctctctct ctctcttttt tgggggctca tttttgctgt tttgattccc gggcttacca 900ggtgagaagt gagggaggaa gaaggcagtg tcccttttgc tagagctgac agctttgttc 960gcgtgggcag agccttccac agtgaatgtg tctggacctc atgttgttga ggctgtcaca 1020gtcctgagtg tggacttggc aggtgcctgt tgaatctgag ctgcaggttc cttatctgtc 1080acacctgtgc ctcctcagag gacagttttt ttgttgttgt gtttttttgt tttttttttt 1140ttggtagatg catgacttgt gtgtgatgag agaatggaga cagagtccct ggctcctcta 1200ctgtttaaca acatggcttt cttattttgt ttgaattgtt aattcacaga atagcacaaa 1260ctacaattaa aactaagcac aaagccattc taagtcattg gggaaacggg gtgaacttca 1320ggtggatgag gagacagaat agagtgatag gaagcgtctg gcagatactc cttttgccac 1380tgctgtgtga ttagacaggc ccagtgagcc gcggggcaca tgctggccgc tcctccctca 1440gaaaaaggca gtggcctaaa tcctttttaa atgacttggc tcgatgctgt gggggactgg 1500ctgggctgct gcaggccgtg tgtctgtcag cccaaccttc acatctgtca cgttctccac 1560acgggggaga gacgcagtcc gcccaggtcc ccgctttctt tggaggcagc agctcccgca 1620gggctgaagt ctggcgtaag atgatggatt tgattcgccc tcctccctgt catagagctg 1680cagggtggat tgttacagct tcgctggaaa cctctggagg tcatctcggc tgttcctgag 1740aaataaaaag cctgtcattt caaacactgc tgtggaccct actgggtttt taaaatattg 1800tcagtttttc atcgtcgtcc ctagcctgcc aacagccatc tgcccagaca gccgcagtga 1860ggatgagcgt cctggcagag acgcagttgt ctctgggcgc ttgccagagc cacgaacccc 1920agacctgttt gtatcatccg ggctccttcc gggcagaaac aactgaaaat gcacttcaga 1980cccacttatt tctgccacat ctgagtcggc ctgagataga cttttccctc taaactggga 2040gaatatcaca gtggtttttg ttagcagaaa atgcactcca gcctctgtac tcatctaagc 2100tgcttatttt tgatatttgt gtcagtctgt aaatggatac ttcactttaa taactgttgc 2160ttagtaattg gctttgtaga gaagctggaa aaaaatggtt ttgtcttcaa ctcctttgca 2220tgccaggcgg tgatgtggat ctcggcttct gtgagcctgt gctgtgggca gggctgagct 2280ggagccgccc ctctcagccc gcctgccacg gcctttcctt aaaggccatc cttaaaacca 2340gaccctcatg gctaccagca cctgaaagct tcctcgacat ctgttaataa agccgtaggc 2400ccttgtctaa gtgcaaccgc ctagactttc tttcagatac atgtccacat gtccattttt 2460caggttctct aagttggagt ggagtctggg aagggttgtg aatgaggctt ctgggctatg 2520ggtgaggttc caatggcagg ttagagcccc tcgggccaac tgccatcctg gaaagtagag 2580acagcagtgc ccgctgccca gaagagacca gcaagccaaa ctggagcccc cattgcaggc 2640tgtcgccatg tggaaagagt aactcacaat tgccaataaa gtctcatgtg gttttatcta 2700aaaaaaaaaa aaaaaaaaaa aaaa 2724412081DNAHomo sapiens 41aactttttat tgtggtttgt ccgttccgag cgctccgcag aacagtcctc cctgtaagag 60cctaaccatt gccagggaaa cctgccctgg gcgctccctt cattagcagt atttttttta 120aattaatctg attaataatt atttttcccc catttaattt tttttcctcc caggtggagt 180tgccgaagct gggggcagct ggggagggtg gggatgggag gggagagaca gaagttgagg 240gcatctctct cttccttccc gaccctctgg cccccaaggg gcaggaggaa tgcaggagca 300ggagttgagc ttgggagctg cagatgcctc cgcccctcct ctctcccagg ctcttcctcc 360tgcccccttc ttgcaactct ccttaatttt gtttggcttt tggatgatta taattatttt 420tatttttgaa tttatataaa gtatatgtgt gtgtgtgtgg agctgagaca ggctcggcag 480cggcacagaa tgagggaaga cgagaaagag agtgggagag agagaggcag agagggagag 540agggagagtg acagcagcgc tcggacgtcc tccccaacgt cgccctcaat tccaccgcct 600atgatccagt gaggcatttc
tcgacctatg gagcggccgt tgcccagaac cggatctact 660cgactccctt ttattcgcca caggagaatg tcgtgttcag ttccagccgg gggccgtatg 720actatggatc taattccttt taccaggaga aagacatgct ctcaaactgc agacaaaaca 780ccttaggaca taacacacag acctcaatcg ctcaggattt tagttctgag cagggcagga 840ctgcgcccca ggaccagaaa gccagtatcc agatttaccc ctggatgcag cgaatgaatt 900cgcacagtgg ggtcggctac ggagcggacc ggaggcgcgg ccgccagatc tactcgcggt 960accagaccct ggaactggag aaggaatttc acttcaatcg ctacctaacg cggcgccggc 1020gcatcgagat cgccaacgcg ctttgcctga ccgagcgaca gatcaaaatc tggttccaga 1080accgccggat gaagtggaaa aaagaatcta atctcacatc cactctctcg gggggcggcg 1140gaggggccac cgccgacagc ctgggcggaa aagaggaaaa gcgggaagag acagaagagg 1200agaagcagaa agagtgacca ggactgtccc tgccacccct ctctcccttt ctccctcgct 1260ccccaccaac tctcccctaa tcacacactc tgtatttatc actggcacaa ttgatgtgtt 1320ttgattccct aaaacaaaat tagggagtca aacgtggacc tgaaagtcag ctctggaccc 1380cctccctcac cgcacaactc tctttcacca cgcgcctcct cctcctcgct cccttgctag 1440ctcgttctcg gcttgtctac aggccctttt ccccgtccag gccttggggg ctcggaccct 1500gaactcagac tctacagatt gccctccaag tgaggacttg gctcccccac tccttcgacg 1560cccccacccc cgccccccgt gcagagagcc ggctcctggg cctgctgggg cctctgctcc 1620agggcctcag ggcccggcct ggcagccggg gagggccgga ggcccaagga gggcgcgcct 1680tggccccaca ccaaccccca gggcctcccc gcagtccctg cctagcccct ctgccccagc 1740aaatgcccag cccaggcaaa ttgtatttaa agaatcctgg gggtcattat ggcattttac 1800aaactgtgac cgtttctgtg tgaagatttt tagctgtatt tgtggtctct gtatttatat 1860ttatgtttag caccgtcagt gttcctatcc aatttcaaaa aaggaaaaaa aagagggaaa 1920attacaaaaa gagagaaaaa aagtgaatga cgtttgttta gccagtagga gaaaataaat 1980aaataaataa atcccttcgt gttaccctcc tgtataaatc caacctctgg gtccgttctc 2040gaatatttaa taaaactgat attattttta aaactttaaa a 2081422910DNAHomo sapiens 42aaaaatgcat aaagagccaa gtgcttatat tctggccaag ttatgaggct ctgagaacaa 60gagcttgagg ggaagactgt taaccccatc cacgccacca gaattagctc tttccctttt 120ggtttgcaag cactgcctgt aaagccctcg catgagaggc cagcctgcta gggaaatcca 180ggaatctgca acaaaaacga tgacagtctg aaatactctc tggtgccaac ctccaaattc 240tcgtctgtca cttcagaccc ccactagttg acagagcagc agaatttcaa ctccagtaga 300cttgaatatg cctctgggca aagaagcaga gctaacgagg aaagggattt aaagagtttt 360tcttgggtgt ttgtcaaact tttattccct gtctgtgtgc agaggggatt caacttcaat 420ttttctgcag tggctctggg tccagcccct tacttaaaga tctggaaagc atgaagactg 480ggcttttttt cctatgtctc ttgggaactg cagctgcaat cccgacaaat gcaagattat 540tatctgatca ttccaaacca actgctgaaa cggtagcacc tgacaacact gcaatcccca 600gtttaagggc tgaagctgaa gaaaatgaaa aagaaacagc agtatccaca gaagacgatt 660cccaccataa ggctgaaaaa tcatcagtac taaagtcaaa agaggaaagc catgaacagt 720cagcagaaca gggcaagagt tctagccaag agctgggatt gaaggatcaa gaggacagtg 780atggtcactt aagtgtgaat ttggagtatg caccaactga aggtacattg gacataaaag 840aagatatgag tgagcctcag gagaaaaaac tctcagagaa cactgatttt ttggctcctg 900gtgttagttc cttcacagat tctaaccaac aagaaagtat cacaaagaga gaggaaaacc 960aagaacaacc tagaaattat tcacatcatc agttgaacag gagcagtaaa catagccaag 1020gcctaaggga tcaaggaaac caagagcagg atccaaatat ttccaatgga gaagaggaag 1080aagaaaaaga gccaggtgaa gttggtaccc acaatgataa ccaagaaaga aagacagaat 1140tgcccaggga gcatgctaac agcaagcagg aggaagacaa tacccaatct gatgatattt 1200tggaagagtc tgatcaacca actcaagtaa gcaagatgca ggaggatgaa tttgatcagg 1260gtaaccaaga acaagaagat aactccaatg cagaaatgga agaggaaaat gcatcgaacg 1320tcaataagca cattcaagaa actgaatggc agagtcaaga gggtaaaact ggcctagaag 1380ctatcagcaa ccacaaagag acagaagaaa agactgtttc tgaggctctg ctcatggaac 1440ctactgatga tggtaatacc acgcccagaa atcatggagt tgatgatgat ggcgatgatg 1500atggcgatga tggcggcact gatggcccca ggcacagtgc aagtgatgac tacttcatcc 1560caagccaggc ctttctggag gccgagagag ctcaatccat tgcctatcac ctcaaaattg 1620aggagcaaag agaaaaagta catgaaaatg aaaatatagg taccactgag cctggagagc 1680accaagaggc caagaaagca gagaactcat caaatgagga ggaaacgtca agtgaaggca 1740acatgagggt gcatgctgtg gattcttgca tgagcttcca gtgtaaaaga ggccacatct 1800gtaaggcaga ccaacaggga aaacctcact gtgtctgcca ggatccagtg acttgtcctc 1860caacaaaacc ccttgatcaa gtttgtggca ctgacaatca gacctatgct agttcctgtc 1920atctattcgc tactaaatgc agactggagg ggaccaaaaa ggggcatcaa ctccagctgg 1980attattttgg agcctgcaaa tctattccta cttgtacgga ctttgaagtg attcagtttc 2040ctctacggat gagagactgg ctcaagaata tcctcatgca gctttatgaa gccaactctg 2100aacacgctgg ttatctaaat gagaagcaga gaaataaagt caagaaaatt tacctggatg 2160aaaagaggct tttggctggg gaccatccca ttgatcttct cttaagggac tttaagaaaa 2220actaccacat gtatgtgtat cctgtgcact ggcagtttag tgaacttgac caacacccta 2280tggatagagt cttgacacat tctgaacttg ctcctctgcg agcatctctg gtgcccatgg 2340aacactgcat aacccgtttc tttgaggagt gtgaccccaa caaggataag cacatcaccc 2400tgaaggagtg gggccactgc tttggaatta aagaagagga catagatgaa aatctcttgt 2460tttgaacgaa gattttaaag aactcaactt tccagcatcc tcctctgttc taaccacttc 2520agaaatatat gcagctgtga tacttgtaga tttatattta gcaaaatgtt agcatgtatg 2580acaagacaat gagagtaatt gcttgacaac aacctatgca ccaggtattt aacattaact 2640ttggaaacaa aaatgtacaa ttaagtaaag tcaacatatg caaaatactg tacattgtga 2700acagaagttt aattcatagt aatttcactc tctgcattga cttatgagat aattaatgat 2760taaactatta atgataaaaa taatgcattt gtattgttca taatatcatg tgcacttcaa 2820gaaaatggaa tgctactctt ttgtggttta cgtgtattat tttcaatatc ttaataccct 2880aataaagagt ccataaaaat ccaaatgctt 2910433019DNAHomo sapiens 43aaaaatgcat aaagagccaa gtgcttatat tctggccaag ttatgaggct ctgagaacaa 60gagcttgagg ggaagactgt taaccccatc cacgccacca gaattagctc tttccctttt 120ggtttgcaag cactgcctgt aaagccctcg catgagaggc cagcctgcta gggaaatcca 180ggaatctgca acaaaaacga tgacagtctg aaatactctc tggtgccaac ctccaaattc 240tcgtctgtca cttcagaccc ccactagttg acagagcagc agaatttcaa ctccagtaga 300cttgaatatg cctctgggca aagaagcaga gctaacgagg aaagggattt aaagagtttt 360tcttgggtgt ttgtcaaact tttattccct gtctgtgtgc agaggggatt caacttcaat 420ttttctgcag tggctctggg tccagcccct tacttaaaga tctggaaagc atgaagactg 480ggcttttttt cctatgtctc ttgggaactg cagctgcaat cccggtgaaa aggagataag 540aagcaaagga gcaaaccaaa cctaatatga atcctgtact ttggccagaa gccgtggctc 600acatctgtaa tcccagcact ttgggaggcc aagacaaatg caagattatt atctgatcat 660tccaaaccaa ctgctgaaac ggtagcacct gacaacactg caatccccag tttaagggct 720gaagctgaag aaaatgaaaa agaaacagca gtatccacag aagacgattc ccaccataag 780gctgaaaaat catcagtact aaagtcaaaa gaggaaagcc atgaacagtc agcagaacag 840ggcaagagtt ctagccaaga gctgggattg aaggatcaag aggacagtga tggtcactta 900agtgtgaatt tggagtatgc accaactgaa ggtacattgg acataaaaga agatatgagt 960gagcctcagg agaaaaaact ctcagagaac actgattttt tggctcctgg tgttagttcc 1020ttcacagatt ctaaccaaca agaaagtatc acaaagagag aggaaaacca agaacaacct 1080agaaattatt cacatcatca gttgaacagg agcagtaaac atagccaagg cctaagggat 1140caaggaaacc aagagcagga tccaaatatt tccaatggag aagaggaaga agaaaaagag 1200ccaggtgaag ttggtaccca caatgataac caagaaagaa agacagaatt gcccagggag 1260catgctaaca gcaagcagga ggaagacaat acccaatctg atgatatttt ggaagagtct 1320gatcaaccaa ctcaagtaag caagatgcag gaggatgaat ttgatcaggg taaccaagaa 1380caagaagata actccaatgc agaaatggaa gaggaaaatg catcgaacgt caataagcac 1440attcaagaaa ctgaatggca gagtcaagag ggtaaaactg gcctagaagc tatcagcaac 1500cacaaagaga cagaagaaaa gactgtttct gaggctctgc tcatggaacc tactgatgat 1560ggtaatacca cgcccagaaa tcatggagtt gatgatgatg gcgatgatga tggcgatgat 1620ggcggcactg atggccccag gcacagtgca agtgatgact acttcatccc aagccaggcc 1680tttctggagg ccgagagagc tcaatccatt gcctatcacc tcaaaattga ggagcaaaga 1740gaaaaagtac atgaaaatga aaatataggt accactgagc ctggagagca ccaagaggcc 1800aagaaagcag agaactcatc aaatgaggag gaaacgtcaa gtgaaggcaa catgagggtg 1860catgctgtgg attcttgcat gagcttccag tgtaaaagag gccacatctg taaggcagac 1920caacagggaa aacctcactg tgtctgccag gatccagtga cttgtcctcc aacaaaaccc 1980cttgatcaag tttgtggcac tgacaatcag acctatgcta gttcctgtca tctattcgct 2040actaaatgca gactggaggg gaccaaaaag gggcatcaac tccagctgga ttattttgga 2100gcctgcaaat ctattcctac ttgtacggac tttgaagtga ttcagtttcc tctacggatg 2160agagactggc tcaagaatat cctcatgcag ctttatgaag ccaactctga acacgctggt 2220tatctaaatg agaagcagag aaataaagtc aagaaaattt acctggatga aaagaggctt 2280ttggctgggg accatcccat tgatcttctc ttaagggact ttaagaaaaa ctaccacatg 2340tatgtgtatc ctgtgcactg gcagtttagt gaacttgacc aacaccctat ggatagagtc 2400ttgacacatt ctgaacttgc tcctctgcga gcatctctgg tgcccatgga acactgcata 2460acccgtttct ttgaggagtg tgaccccaac aaggataagc acatcaccct gaaggagtgg 2520ggccactgct ttggaattaa agaagaggac atagatgaaa atctcttgtt ttgaacgaag 2580attttaaaga actcaacttt ccagcatcct cctctgttct aaccacttca gaaatatatg 2640cagctgtgat acttgtagat ttatatttag caaaatgtta gcatgtatga caagacaatg 2700agagtaattg cttgacaaca acctatgcac caggtattta acattaactt tggaaacaaa 2760aatgtacaat taagtaaagt caacatatgc aaaatactgt acattgtgaa cagaagttta 2820attcatagta atttcactct ctgcattgac ttatgagata attaatgatt aaactattaa 2880tgataaaaat aatgcatttg tattgttcat aatatcatgt gcacttcaag aaaatggaat 2940gctactcttt tgtggtttac gtgtattatt ttcaatatct taatacccta ataaagagtc 3000cataaaaatc caaatgctt 3019442670DNAHomo sapiens 44aaaaatgcat aaagagccaa gtgcttatat tctggccaag ttatgaggct ctgagaacaa 60gagcttgagg ggaagactgt taaccccatc cacgccacca gaattagctc tttccctttt 120ggtttgcaag cactgcctgt aaagccctcg catgagaggc cagcctgcta gggaaatcca 180ggaatctgca acaaaaacga tgacagtctg aaatactctc tggtgccaac ctccaaattc 240tcgtctgtca cttcagaccc ccactagttg acagagcagc agaatttcaa ctccagtaga 300cttgaatatg cctctgggca aagaagcaga gctaacgagg aaagggattt aaagagtttt 360tcttgggtgt ttgtcaaact tttattccct gtctgtgtgc agaggggatt caacttcaat 420ttttctgcag tggctctggg tccagcccct tacttaaaga tctggaaagc catgaacagt 480cagcagaaca gggcaagagt tctagccaag agctgggatt gaaggatcaa gaggacagtg 540atggtcactt aagtgtgaat ttggagtatg caccaactga aggtacattg gacataaaag 600aagatatgag tgagcctcag gagaaaaaac tctcagagaa cactgatttt ttggctcctg 660gtgttagttc cttcacagat tctaaccaac aagaaagtat cacaaagaga gaggaaaacc 720aagaacaacc tagaaattat tcacatcatc agttgaacag gagcagtaaa catagccaag 780gcctaaggga tcaaggaaac caagagcagg atccaaatat ttccaatgga gaagaggaag 840aagaaaaaga gccaggtgaa gttggtaccc acaatgataa ccaagaaaga aagacagaat 900tgcccaggga gcatgctaac agcaagcagg aggaagacaa tacccaatct gatgatattt 960tggaagagtc tgatcaacca actcaagtaa gcaagatgca ggaggatgaa tttgatcagg 1020gtaaccaaga acaagaagat aactccaatg cagaaatgga agaggaaaat gcatcgaacg 1080tcaataagca cattcaagaa actgaatggc agagtcaaga gggtaaaact ggcctagaag 1140ctatcagcaa ccacaaagag acagaagaaa agactgtttc tgaggctctg ctcatggaac 1200ctactgatga tggtaatacc acgcccagaa atcatggagt tgatgatgat ggcgatgatg 1260atggcgatga tggcggcact gatggcccca ggcacagtgc aagtgatgac tacttcatcc 1320caagccaggc ctttctggag gccgagagag ctcaatccat tgcctatcac ctcaaaattg 1380aggagcaaag agaaaaagta catgaaaatg aaaatatagg taccactgag cctggagagc 1440accaagaggc caagaaagca gagaactcat caaatgagga ggaaacgtca agtgaaggca 1500acatgagggt gcatgctgtg gattcttgca tgagcttcca gtgtaaaaga ggccacatct 1560gtaaggcaga ccaacaggga aaacctcact gtgtctgcca ggatccagtg acttgtcctc 1620caacaaaacc ccttgatcaa gtttgtggca ctgacaatca gacctatgct agttcctgtc 1680atctattcgc tactaaatgc agactggagg ggaccaaaaa ggggcatcaa ctccagctgg 1740attattttgg agcctgcaaa tctattccta cttgtacgga ctttgaagtg attcagtttc 1800ctctacggat gagagactgg ctcaagaata tcctcatgca gctttatgaa gccaactctg 1860aacacgctgg ttatctaaat gagaagcaga gaaataaagt caagaaaatt tacctggatg 1920aaaagaggct tttggctggg gaccatccca ttgatcttct cttaagggac tttaagaaaa 1980actaccacat gtatgtgtat cctgtgcact ggcagtttag tgaacttgac caacacccta 2040tggatagagt cttgacacat tctgaacttg ctcctctgcg agcatctctg gtgcccatgg 2100aacactgcat aacccgtttc tttgaggagt gtgaccccaa caaggataag cacatcaccc 2160tgaaggagtg gggccactgc tttggaatta aagaagagga catagatgaa aatctcttgt 2220tttgaacgaa gattttaaag aactcaactt tccagcatcc tcctctgttc taaccacttc 2280agaaatatat gcagctgtga tacttgtaga tttatattta gcaaaatgtt agcatgtatg 2340acaagacaat gagagtaatt gcttgacaac aacctatgca ccaggtattt aacattaact 2400ttggaaacaa aaatgtacaa ttaagtaaag tcaacatatg caaaatactg tacattgtga 2460acagaagttt aattcatagt aatttcactc tctgcattga cttatgagat aattaatgat 2520taaactatta atgataaaaa taatgcattt gtattgttca taatatcatg tgcacttcaa 2580gaaaatggaa tgctactctt ttgtggttta cgtgtattat tttcaatatc ttaataccct 2640aataaagagt ccataaaaat ccaaatgctt 2670
* * * * *
D00001
D00002
D00003
D00004
D00005
D00006
D00007
D00008
D00009
D00010
D00011
D00012
D00013

D00014

D00015

D00016

D00017

D00018

D00019
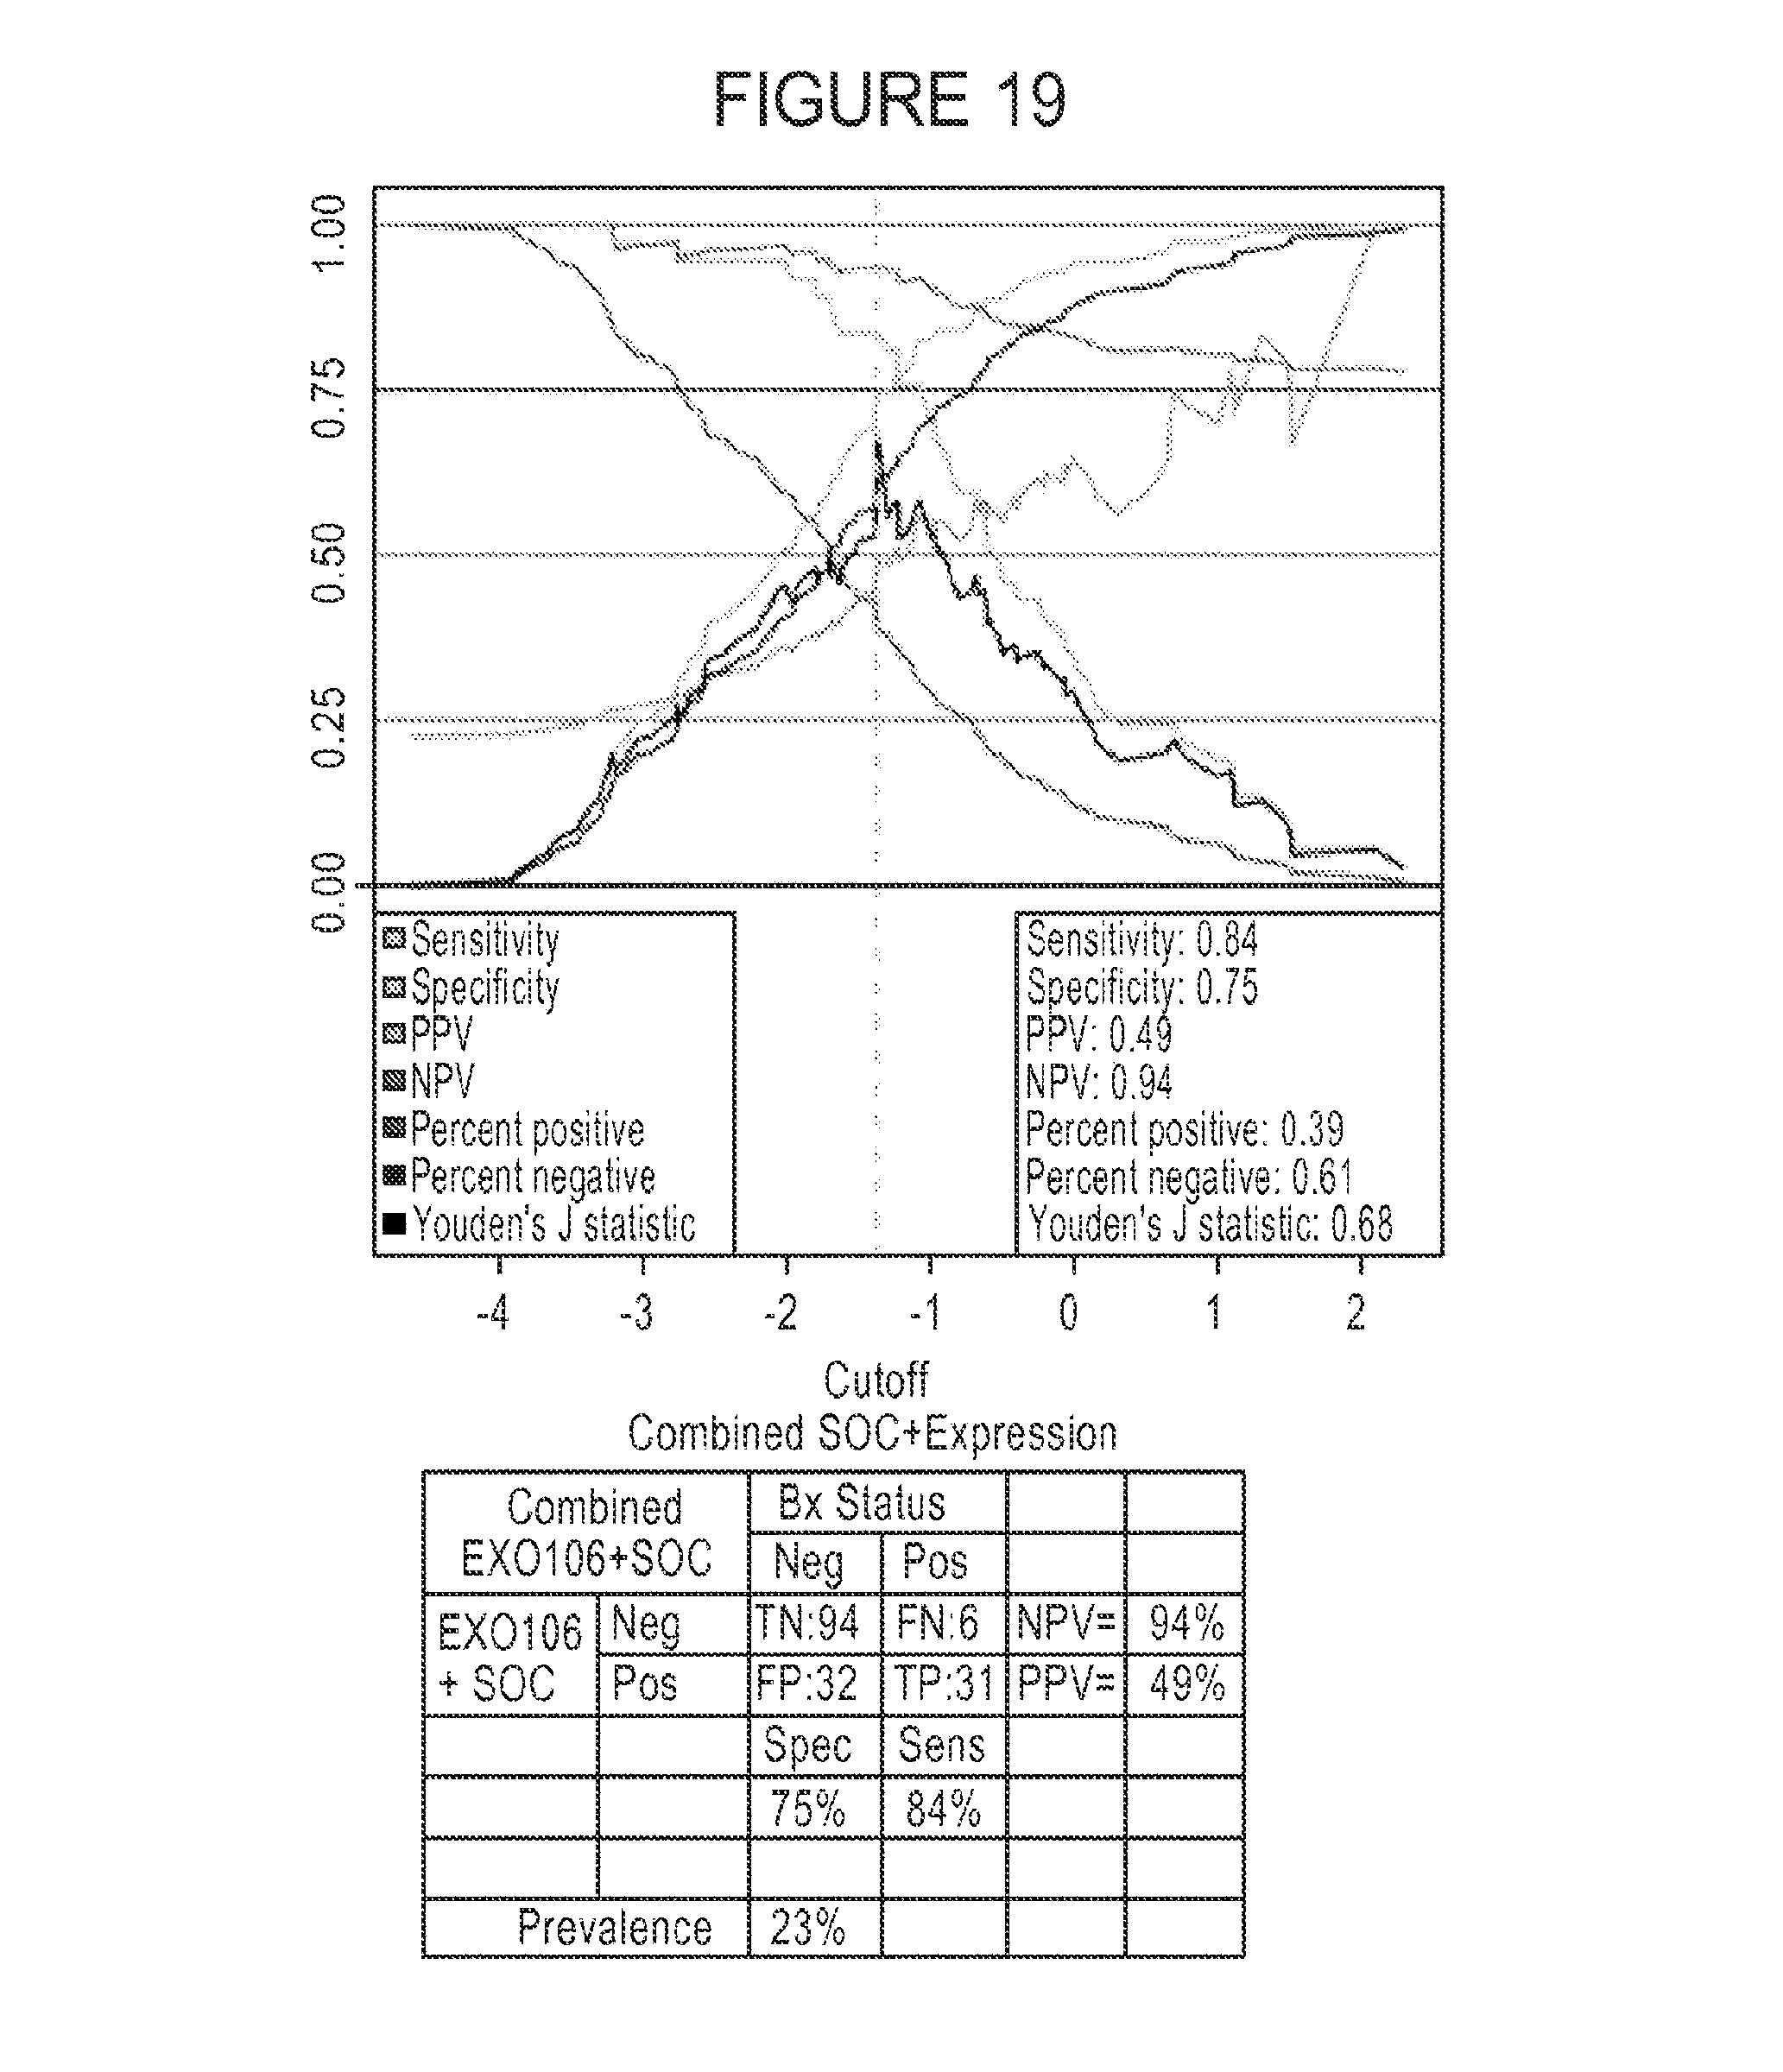
D00020
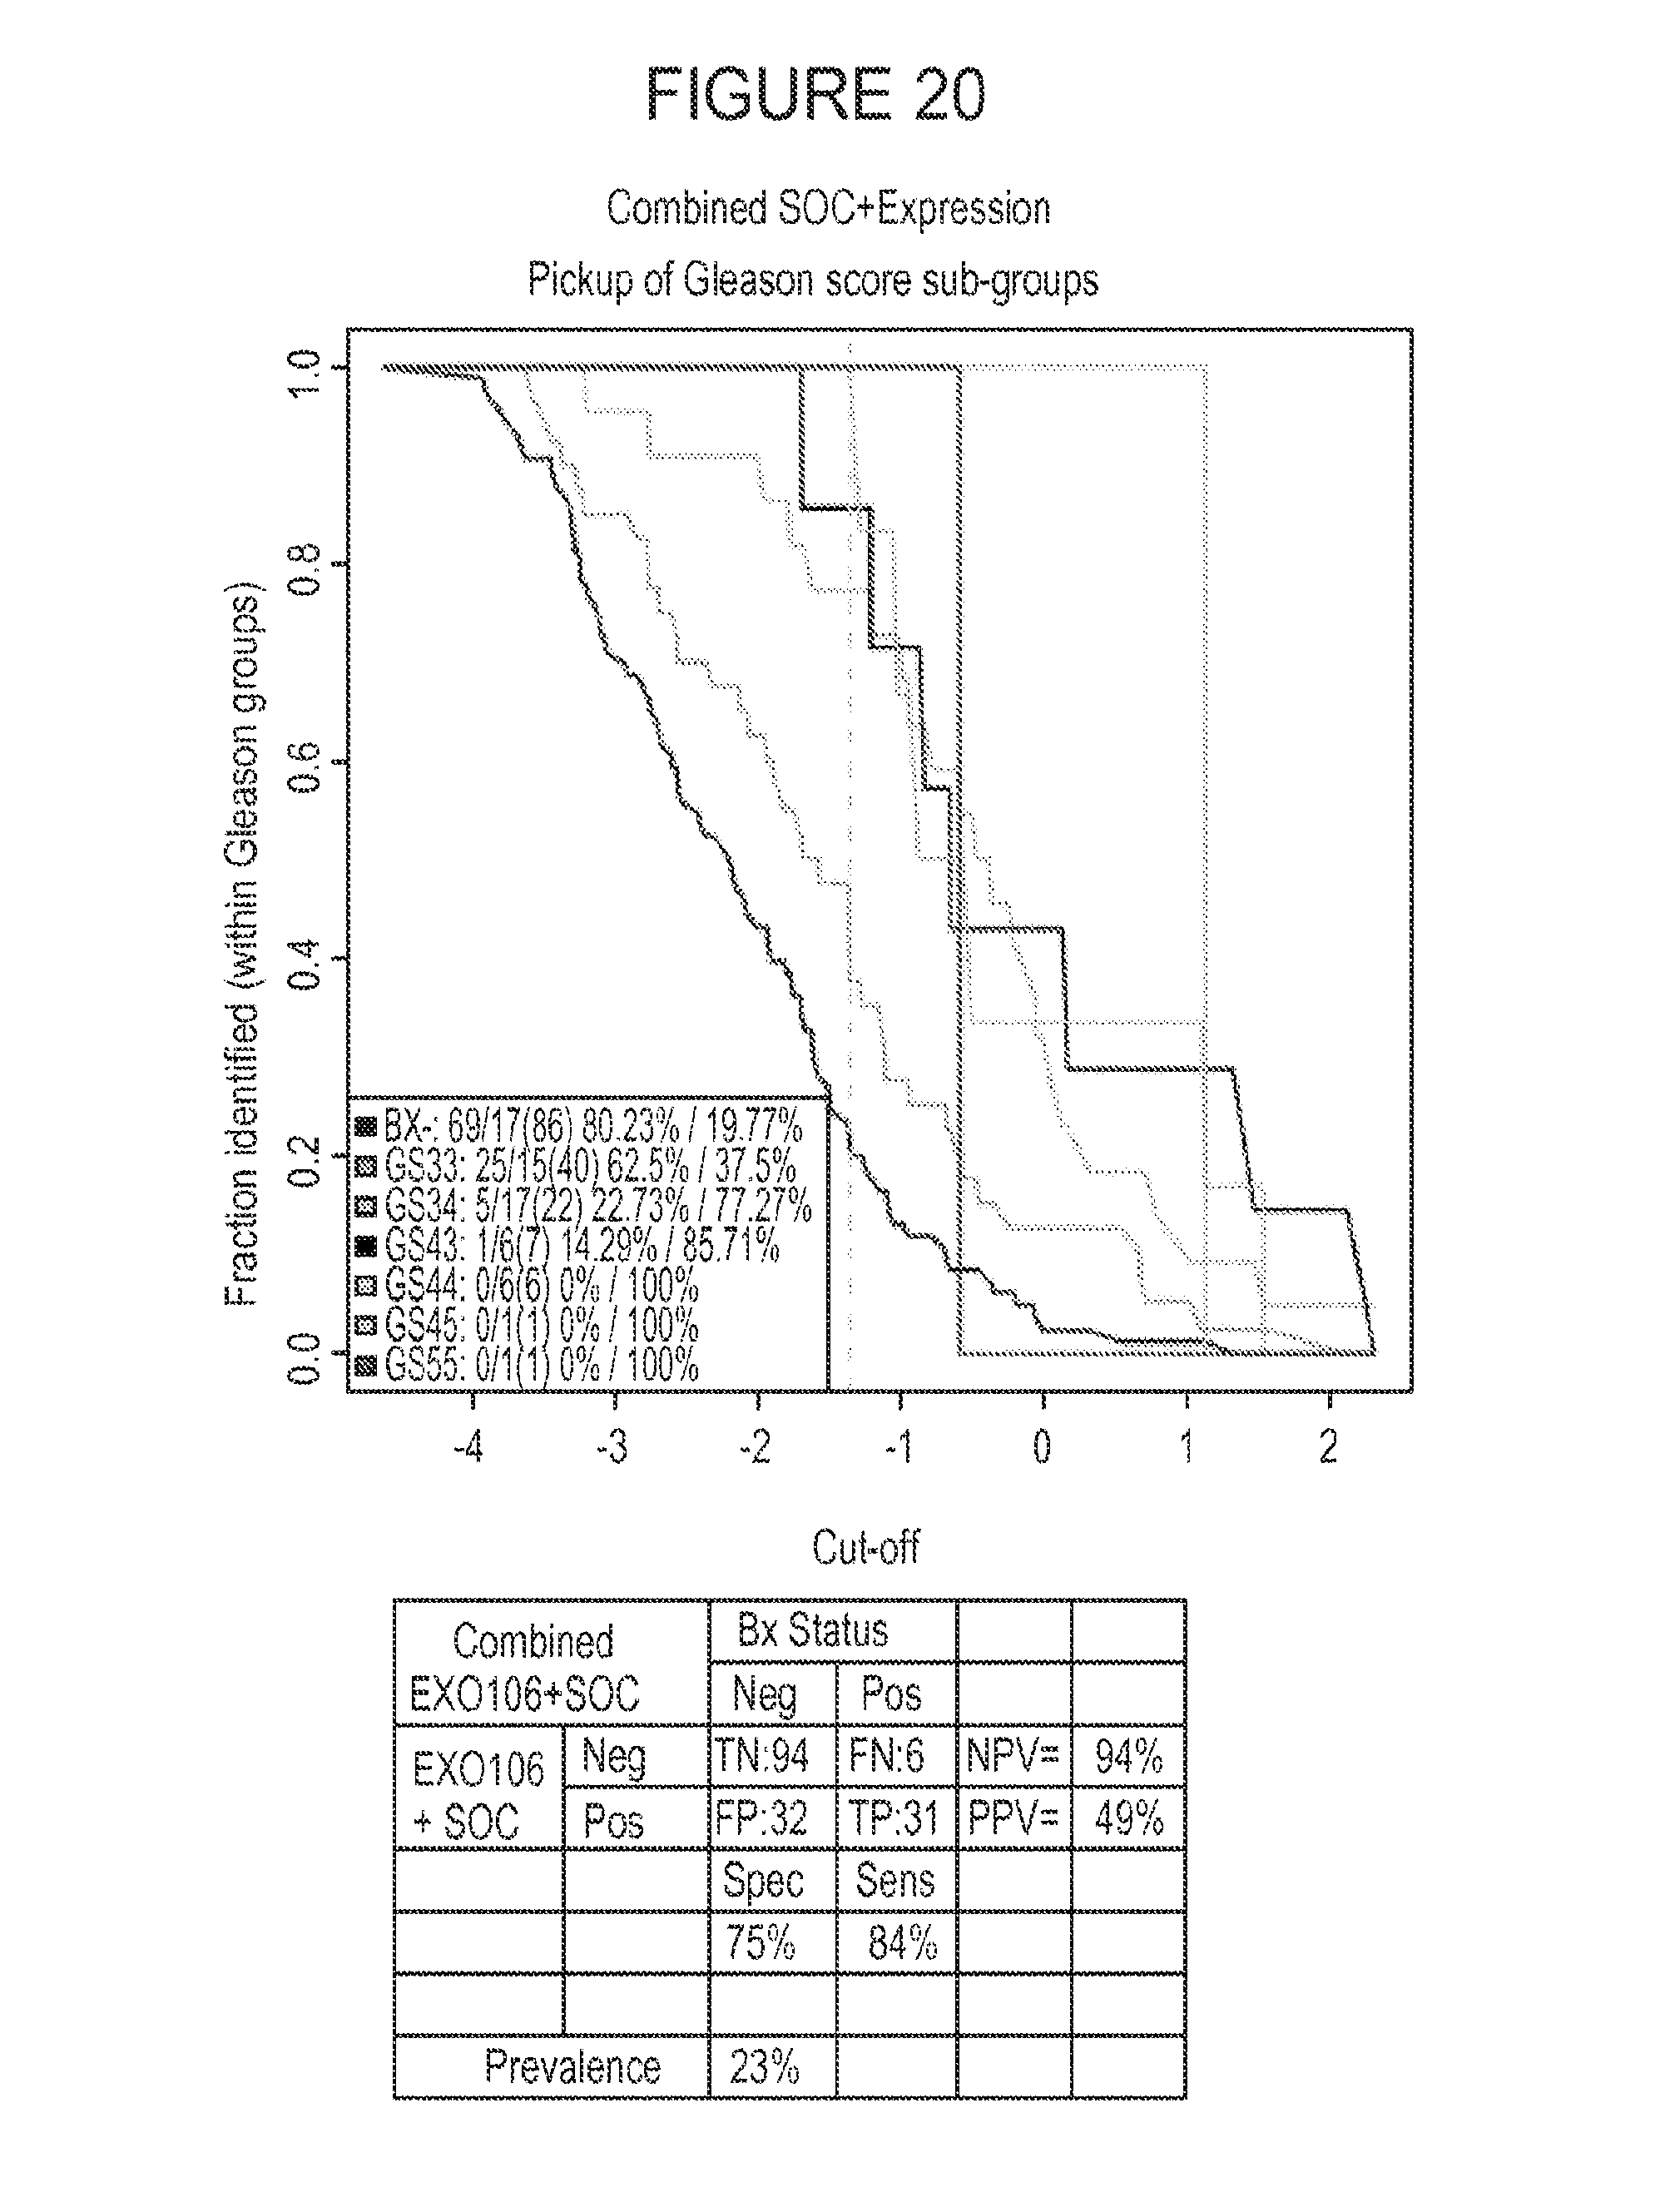
M00001

M00002

M00003

S00001
XML
uspto.report is an independent third-party trademark research tool that is not affiliated, endorsed, or sponsored by the United States Patent and Trademark Office (USPTO) or any other governmental organization. The information provided by uspto.report is based on publicly available data at the time of writing and is intended for informational purposes only.
While we strive to provide accurate and up-to-date information, we do not guarantee the accuracy, completeness, reliability, or suitability of the information displayed on this site. The use of this site is at your own risk. Any reliance you place on such information is therefore strictly at your own risk.
All official trademark data, including owner information, should be verified by visiting the official USPTO website at www.uspto.gov. This site is not intended to replace professional legal advice and should not be used as a substitute for consulting with a legal professional who is knowledgeable about trademark law.