Method and apparatus for analyzing biomolecules by using oligonucleotide
Kim
U.S. patent number 10,294,512 [Application Number 15/031,008] was granted by the patent office on 2019-05-21 for method and apparatus for analyzing biomolecules by using oligonucleotide. The grantee listed for this patent is Sung-Chun Kim. Invention is credited to Sung-Chun Kim.


| United States Patent | 10,294,512 |
| Kim | May 21, 2019 |
Method and apparatus for analyzing biomolecules by using oligonucleotide
Abstract
The present invention relates to a method for analyzing biomolecules by using an oligonucleotide, and specifically, provides a method and an apparatus for determining the meaning of biomolecules in a biosample by analyzing through one examination of the biomolecules contained in the biosample by preparing, with respect to a nucleic acid including a target nucleic acid such as nucleic acid and receptor-analysis ligand conjugates, an oligonucleotide, which complementarily binds completely to a specific region of the target nucleic acid, and analyzing the target nucleic acid.
| Inventors: | Kim; Sung-Chun (Seoul, KR) | ||||||||||
|---|---|---|---|---|---|---|---|---|---|---|---|
| Applicant: |
|
||||||||||
| Family ID: | 52993718 | ||||||||||
| Appl. No.: | 15/031,008 | ||||||||||
| Filed: | October 21, 2014 | ||||||||||
| PCT Filed: | October 21, 2014 | ||||||||||
| PCT No.: | PCT/KR2014/009870 | ||||||||||
| 371(c)(1),(2),(4) Date: | July 18, 2016 | ||||||||||
| PCT Pub. No.: | WO2015/060609 | ||||||||||
| PCT Pub. Date: | April 30, 2015 |
Prior Publication Data
| Document Identifier | Publication Date | |
|---|---|---|
| US 20160319330 A1 | Nov 3, 2016 | |
Foreign Application Priority Data
| Oct 21, 2013 [KR] | 10-2013-0125087 | |||
| Nov 25, 2013 [KR] | 10-2013-0143495 | |||
| Current U.S. Class: | 1/1 |
| Current CPC Class: | C12Q 1/6837 (20130101); C12Q 1/6806 (20130101); C12Q 1/6837 (20130101); C12Q 2563/185 (20130101); C12Q 2565/514 (20130101) |
| Current International Class: | C12Q 1/68 (20180101); C12Q 1/6806 (20180101); G01N 33/53 (20060101); C12Q 1/6837 (20180101) |
| Field of Search: | ;435/6.1,6.11,6.12,7.1,91.1,91.2,91.51 ;436/94,501 ;536/23.1,24.3,24.33,25.3 |
| 2006-500033 | Jan 2006 | JP | |||
| 2009-521946 | Jun 2009 | JP | |||
| 2009-528054 | Aug 2009 | JP | |||
| 2012-506712 | Mar 2012 | JP | |||
| WO 2001/036585 | May 2001 | WO | |||
| WO 2011162894 | Dec 2011 | WO | |||
| WO 2012/106525 | Aug 2012 | WO | |||
Other References
|
Extended European Search Report, dated Mar. 22, 2017, in European Patent Application No. EP 14855536.0. cited by applicant . Japanese Office Action, dated Aug. 1, 2017, in Japanese Patent Application No. JP 2016-526155. cited by applicant. |
Primary Examiner: Lu; Frank W
Attorney, Agent or Firm: Harness, Dickey & Pierce, P.L.C.
Claims
What is claimed is:
1. A method for simultaneously analyzing a target protein and a target nucleic acid in a biological sample, comprising: (a) (i) reacting the target protein of the biological sample with an analysis ligand and forming a target protein-analysis ligand complex, the analysis ligand consisting of a ligand binding specifically to the target protein, and an oligonucleotide linked to the ligand, and (ii) producing a hybridization complex by hybridizing the target nucleic acid of the biological sample with an upstream oligonucleotide and a downstream oligonucleotide which are perfectly complementary to an upstream site and a downstream site of the target nucleic acid respectively, and making a double-stranded nucleic acid by extending a region between the upstream oligonucleotide and the downstream oligonucleotide on the hybridization complex, wherein the double-stranded nucleic acid comprises an extended nucleic acid strand which is complementary to the target nucleic acid, the upstream oligonucleotide and the downstream oligonucleotide; (b) making a mixture of the target protein-analysis ligand complex and the double-stranded nucleic acid; and (c) simultaneously analyzing the target protein and the target nucleic acid in the biological sample by detecting the oligonucleotide of the target protein-analysis ligand complex and the double-stranded nucleic acid, simultaneously, in the mixture of step (b).
2. The method of claim 1, wherein the target nucleic acid is a nucleic acid selected from the group consisting of genomic DNA, genomic DNA treated with sodium bisulfite, and cDNA obtained from RNA by reverse transcription.
3. The method of claim 1, wherein the target nucleic acid is a wild-type target nucleic acid, a mutant target nucleic acid, or a methylated target nucleic acid.
4. The method of claim 1, wherein the ligand is an antibody or an aptamer.
5. The method of claim 1, wherein said detecting the oligonucleotide of the target protein-analysis ligand complex and the double-stranded nucleic acid in step (c) is carried out by: (c-1) producing an amplicon of the oligonucleotide of the target protein-analysis ligand complex and an amplicon of the double-stranded nucleic acid by amplifying the oligonucleotide of the target protein-analysis ligand complex and the double-stranded nucleic acid simultaneously in the mixture; and (c-2) simultaneously detecting the amplicon of the oligonucleotide of the target protein-analysis ligand complex and the amplicon of the double-stranded nucleic acid.
6. The method of claim 5, wherein step (c-1) is conducted with a pair of a forward primer and a backward primer, and the oligonucleotide of the target protein-analysis ligand complex and the double-stranded nucleic acid have common regions to which the forward primer and the backward primer respectively bind.
7. The method of claim 5, wherein, the oligonucleotide of the target protein-analysis ligand complex has a region that is used for discriminating the target protein, the double-stranded nucleic acid has a region that is used for discriminating the target nucleic acid, and step (c-2) is conducted by detecting the region of that is used for discriminating the target protein in the oligonucleotide of the target protein-analysis ligand complex and the region that is used for discriminating the target nucleic acid in the double-stranded nucleic acid simultaneously.
8. The method of claim 6, wherein at least one of the forward primer and the backward primer comprises a detectable marker capable of generating a detection signal, and step (c-2) is conducted by detecting the detection signal generated from the detectable marker detection signal.
9. The method of claim 8, wherein the primer which comprises the detectable marker is the forward primer.
10. The method of claim 1, wherein the oligonucleotide of the analysis ligand in the target protein-analysis ligand complex has a region to which a forward primer binds, a region to which a backward primer binds, and a region used for discriminating the target protein, located between the region to which the forward primer binds and the region to which the backward primer binds, the upstream oligonucleotide has a region to which the forward primer binds, and a downstream region that hybridizes specifically to the target nucleic acid, the downstream oligonucleotide has a region that recognizes and hybridizes with the target nucleic acid, and a downstream region to which a backward primer binds, wherein, in the double stranded nucleic acid, the downstream oligonucleotide hybridizes to a site of the target nucleic acid downstream from a site of the target nucleic acid to which the upstream oligonucleotide hybridizes, a region used for discriminating the target nucleic acid in the upstream oligonucleotide is located between a region of the upstream oligonucleotide to which the forward primer binds and a region of the upstream oligonucleotide which hybridizes to the target nucleic acid or a region used for discriminating the target nucleic acid in the downstream oligonucleotide, is located between a region of the downstream oligonucleotide which hybridizes to the target nucleic acid and a region of the downstream oligonucleotide to which the backward primer binds, the oligonucleotide of the target protein-analysis ligand complex, and the upstream oligonucleotide and the downstream oligonucleotide of the double-stranded nucleic acid have the same sequence region to which the forward primer binds and the same sequence region to which the backward primer binds, whereby, said detecting the oligonucleotide of the target protein-analysis ligand complex and the double-stranded nucleic acid in step (c) is carried out by (c-i) obtaining an amplicon of the oligonucleotide of the target protein-analysis ligand complex and an amplicon of the double-stranded nucleic acid by simultaneously amplifying the oligonucleotide of the target protein-analysis ligand complex and the double-stranded nucleic acid of the mixture in the presence of the forward primer and the backward primer; and (c-ii) simultaneously detecting the region used for discriminating the target protein in the amplicon of the oligonucleotide of the target protein-analysis ligand complex and the region used for discriminating the target nucleic acid in the amplicon of the double-stranded nucleic acid.
11. The method of claim 10, wherein the forward primer is a primer comprising a detectable marker capable of generating a detection signal whereby step (c-ii) is achieved by detecting the detection signal from the detectable marker in the amplicon of the oligonucleotide of the target protein-analysis ligand complex and detecting the detection signal from the detectable marker in the amplicon of the double-stranded nucleic acid, wherein the detectable marker of the forward primer used for amplifying the oligonucleotide of the target protein-analysis ligand complex and the detectable marker of the forward primer used for amplifying the double-stranded nucleic acid are different and produce different detection signals.
12. The method of claim 11, wherein the target nucleic acid is a nucleic acid selected from RNA, cDNA, and genomic DNA, the cDNA being reversely transcribed from RNA.
13. The method of claim 11, wherein step (c-ii) further comprises: applying the amplicon of the oligonucleotide of the target protein-analysis ligand complex and the amplicon of the double-stranded nucleic acid to a microarray onto which a capture probe having a sequence complementary to the region used for discriminating the target protein in the amplicon of the oligonucleotide of the target protein-analysis ligand complex and a capture probe having a sequence complementary to the region used for discriminating the target nucleic acid in the amplicon of the double-stranded nucleic acid are immobilized and inducing hybridization complexes; and removing the amplicon of the oligonucleotide of the target protein-analysis ligand complex and the amplicon of the double-stranded nucleic acid that are not hybridized to the microarray; wherein said detecting the detection signal from the detectable marker in the amplicon of the oligonucleotide of the target protein-analysis ligand complex and said detecting the detection signal from the detectable marker in the amplicon of the double-stranded nucleic acid comprises detecting the detection signal from the detectable marker in the amplicon of the oligonucleotide of the target protein-analysis ligand complex hybridized to the microarray and the detection signal from the detectable marker in the amplicon of the double-stranded nucleic acid hybridized to the microarray.
Description
CROSS-REFERENCE TO RELATED APPLICATIONS
This application is a national phase application of PCT Application No. PCT/KR2014/009870, filed on Oct. 21, 2014, which claims the benefit and priority of Korean Patent Application No. 10-2013-0143495, filed Nov. 25, 2013 and Korean Patent Application No. 10-2013-0125087, filed Oct. 21, 2013. The entire disclosures of the applications identified in this paragraph are incorporated herein by reference.
FIELD
The present disclosure relates to a method for the analysis of biomolecules. More particularly, the present disclosure relates to a method and an apparatus for analyzing biomolecules in a biological sample using an analysis ligand binding to various target molecules and an oligonucleotide perfectly complementary to a specific region of a target nucleic acid, whereby the biological significance of biomolecules can be analyzed in a single examination.
BACKGROUND
A biomolecule or biological molecule is any molecule that is present in living organisms, including proteins, carbohydrates, lipids, and nucleic acids. With advances in physics, biochemistry and bioinformatics, techniques for analyzing biomolecules and producing comprehensive information on quantitative states, that is, profiles, of biomolecules in biological samples have been developed. However, there is still a need for a novel, efficient method and apparatus due to problems with conventional methods and apparatuses, including difficulty of use, maintenance costs, feasibility, accuracy, sensitivity, testing time and process automation ability.
Techniques for producing a profile of a biomolecule in a biological sample, although not the ultimate object but a means to approach the object, find a wide range of application in various fields including medicine, veterinary science, environmental engineering, food engineering, the agriculture industry and the like.
Profiles of biomolecules including nucleic acid, proteins and other organic substances as constituents of tissues, cell mass, microorganisms, etc. are constructed by means of various methods using physical and chemical properties.
A clinical decision support system is a health information technology system that is designed to analyze the biological significance of biomolecules in biological samples using the profiles, with the aim of performing decision making tasks for physicians and other health professionals for diagnosis and treatment. Clinical decision support systems are largely classified as Case-Based Machine Learning Inference Systems and Expert Systems. In the Case-Based Machine Learning Inference Systems, the clinical information and biological information of known disease-carrying patients, that is, the profiles of biomolecules of patients, are collected, and a disease of interest is inferred or determined from the given clinical and biological information using machine learning on the basis of the collected data. The Expert System is a computer system that is designed to diagnose a disease using rules set forth by medical experts.
With regard to nucleic acids and proteins representative of biomolecules, genetic information is stored in a deoxyribonucleic acid (DNA), which is organized into long structures called chromosomes. About 3 billion nucleotides are included in the human genome. The nucleotide sequences in each chromosome play a critical role in forming the characteristics of individual subjects. Many diseases are based on modifications of the nucleotide sequences in the human genome. Gene codes in genomes belonging to individuals of the same species may differ from one biological individual to another, exhibiting variation in nucleotide sequence, called polymorphism. Causes of polymorphism include the deletion and/or insertion of at least one nucleotide, and the repetition of a certain base sequence. Single nucleotide polymorphism (SNP) is a variation in a single nucleotide that occurs at a specific position in the genome.
Genotypic chemistry analysis methods for many SNPs include PCR-restriction fragment length polymorphism analysis, single-strand conformation polymorphism detection, dideoxy minisequencing, oligonucleotide ligation assays, allele-specific polymerase chain reaction (hereinafter referred to as "AS PCR") analysis, ligase chain reaction analysis, primer-required nucleotide incorporation assays, and fluorescence energy transfer-based assays (Landegren, U., et al., 1998, Genome Res, 8:769-776; Gut, I. G., 2001, Hum Mutat, 17:475-492; Shi, M. M., 2001, Clin. Chem., 47:164-172). In addition, mass spectrometry (Ross P et al., 2000, BioTechniques, 29:620-629) and oligonucleotide microarray-based analysis (Wang, D. G. et al., 1998, Science, 280:1077-1082) have recently been suggested for direct determination of the mass of short single DNA fragments with accuracy.
Allele-specific hybridization was developed for Affymetrix whole genome SNP array (Komura D., et al., 2006, Genome Res. 2006; 16: 1575-84. 6), Idaho Hi-Res Melting curve analysis system (Graham R., et al., 2005, Clin. Chem. 51: 1295-8), dynamic allele-specific hybridization (DASH) (Prince J. A., et al., 2001, Genome Res. 11: 152-62), and Illumina Golden Gate SNP Genotyping Arrays (Gunderson K. L., et al., 2005, Nat Genet. 37: 549-54), and fluorescence resonance energy transfer (FRET) is used in TaqMan (Holloway J. W., et al., 1999, Hum Mutat. 14: 340-7). Molecular beacon assays were developed and described in Barreiro L. B., et al., 2009, Methods Mol Biol. 578: 255-76. Extension techniques used AS PCR are found in Illumina Infinium bead array (Oliphant A., et al., 2002, Biotechniques. Suppl: 56-8, 60-1), Beckman GenomeLab SNPstream system (Bell P. A., et al., 2002, Biotechniques. 2002; Suppl: 70-2, 74, 76-7), and Sequenom MassARRAY SNP system (Hayes B. J., et al. 2007, Bioinformatics. 2007; 23: 1692-3).
Since such techniques for identifying SNP exhibit relative advantages and disadvantages depending on the purpose, it cannot be said that one technique is better than another. However, a DNA-based microarray technique has attracted great attention because it can simply analyze the existence, quantity or expression pattern of specific genes or gene clusters (Schena et al., 1995, Science, 270:467-470; DeRisi et al., 1996, Nature Genetics 14:457-460).
In each cell, about 50,000-100,000 genes exist, but are selectively used. A significant number of the genes are required for the maintenance of basic cellular functions. These genes are called housekeeping genes (hereinafter referred to as "HKG"). In addition, an endogenous standard expression gene is used as a control in revealing the function of a certain gene, searching for a gene having a specific function, or examining the expression pattern of a gene under given conditions. According to various molecular biological purposes, the quantitative analysis of messenger RNA (hereinafter referred to as "mRNA") is used to compare expression levels of certain or multiple genes, as implemented by many techniques including reverse transcriptase polymerase chain reaction (hereinafter referred to as "RT-PCR"), quantitative real time PCR (hereinafter referred to as "qRT-PCR"), serial analysis of gene expression (hereinafter referred to as "SAGE") or microarray assay.
However, conventional DNA microarrays, which are designed to detect target sequences only through hybridization, are still plagued by the problem of false positives due to cross reaction, and thus require improvement in the reliability of the hybridization signal. In addition, conventional microarrays require very strict post-hybridization washing steps and indispensably require the denaturation of a target sequence into a single strand prior to hybridization. On-chip PCR has recently been developed as a heterogeneous assay system, like conventional microarrays, to detect target genes through hybridization or probe extension, but suffers from the disadvantages of impossibility of real-time detection and difficulty of accurate quantitation.
In addition, protein chips or aptamer chips have been developed on the basis of high-throughput screening techniques to track the interactions and activities of proteins, and to determine their functions (Smith et al., Mol Cell Proteomics, 11-18. 2003; and McCauley et al., Anal Biochem, 319(2), 244-250. 2003). The chip consists of a support surface, such as a glass slide, nitrocellulose membrane, bead or microtiter plate, to which an array of capture proteins is bound.
Further, biomolecules are identified by profiling, isolated, and analyzed for their constitution by MALDI-TOF (Matrix Assisted Laser Desorption/Ionization-Time Of Flight). In recent years, protein profiles have been under extensive study using SELDI-TOFMS (Surface-Enhanced Laser Desorption/Ionization Time Of Flight Mass Spectrometry) (Adam et al., Cancer Research, 62, 3609-3614. 2002; Li et al., Clinical Chemistry, 48, 1296-1304. 2002; and Petricoin et al., The Lancet, 359, 572-577. 2002). As a further approach, immuno-PCR (IPCR), in which signals are amplified using a DNA and polymerase (Sano et al., Science 258, 120-122. 1992), has been suggested.
As described above, there have been many developments in such assays in terms of detection sensitivity and multiple analytical potential, but they are in need of the reduction of cost and time, and the improvement of sensitivity and reproducibility.
The present inventor suggested a reverse-SELEX method for producing profiles of proteins (Korean Patent No. 10-0670799), an aptamer-based nucleic acid chip (Korean Patent No. 10-0464225), a method for analyzing biological significance using an aptamer-based nucleic acid chip (Korean Patent No. 10-0923048), and a method for analyzing genetic variation (Korean Patent Application No. 10-2013-0118222), but they are unable to analyze both proteins and nucleic acids simultaneously in biological samples, which can be achieved in the present disclosure.
The comprehensive analysis of biomolecules in biological samples allows for the production of profiles of biomolecules associated with diseases.
Comprehensive research into biomolecules of biological samples may be characterized by analyzing profiles of biomolecules associated with diseases, thereby identifying biomolecules that allows for the diagnosis of diseases or the analysis of therapeutic effects, biomolecules playing an important role in the onset and progression of diseases, biomolecules responsible for susceptibility to diseases, and target molecules for the development of novel drugs.
Leading to the present invention, intensive and thorough research into the analysis of biomolecules, conducted to overcome the problems encountered in the conventional techniques for analyzing biomolecules separately, resulted in the development of a method for analyzing all of the biomolecules responsible for a given biological event at once, in real time with improved efficiency and sensitivity.
Ultimately, the holistic analysis of biomolecules in a biosample with the production of biological profiles thereof can be applied to the diagnosis of diseases, the analysis of therapeutic effects, and the identification of biomolecular principles that play an important role in the onset and progression of disease or which are responsible for susceptibility to disease, and target molecules for the development of novel drugs.
DISCLOSURE
Technical Problem
In order to accomplish the above object, the present disclosure provides a method and an apparatus for analyzing two or more different biomolecules, using an oligonucleotide, the method and the apparatus comprising analyzing the two or more different biomolecules at the nucleic acid level, the two or more different biomolecules including at least one protein molecule and being isolated from a sample to be analyzed.
Also, the present disclosure provides a method and an apparatus for analyzing a biomolecule, using an oligonucleotide, comprising preparing a receptor and a nucleic acid from the biomolecule of a sample; reacting the receptor with an analysis ligand to form a receptor-analysis ligand complex; preparing a target DNA from a target nucleic acid to be analyzed and a target nucleic acid as an oligonucleotide of the receptor-analysis ligand complex; and analyzing the target DNA, whereby the biological significance of the receptor for an aptamer and of the nucleic acid is identified, whereby the biological significance of the biomolecule can be determined in the biological sample.
In addition, the present disclosure provides a nucleic acid chip capable of analyzing biomolecules in a biological sample in a single assay, whereby the biological significance of the biomolecule can be determined in the biological sample.
In some embodiments, the biological sample is at least one selected from the group consisting of cells, fungi, viruses, cell lines, and tissues.
The object of the present disclosure is to provide a method and an apparatus for analyzing a biomolecule, using an oligonucleotide, whereby various biological significances including diseases associated with the biomolecules can be analyzed from the information effectively produced as a result of binding patterns of oligonucleotides.
Technical Solution
As used herein, the term "biomolecule" means a special molecule that exhibits a biological function as a constituent of an organism, as exemplified by macromolecules such as proteins, nucleic acids, polysaccharides, and lipids, small molecules such as amino acids, nucleotides, monosaccharides, vitamins, metals such as iron, copper, and the like, inorganic substances, etc.
As used herein, the term "ligand" refers to a biomolecule that binds to a receptor. Representative among the scope of ligands are an antibody, a peptide, a nucleic acid, and an aptamer. The term "receptor" is intended to encompass almost all chemical or biological effectors as target molecules, irrespective of their size. Examples of the receptor include a protein, a peptide, a nucleic acid, a carbohydrate, a lipid, a polysaccharide, a glycoprotein, a hormone, a receptor, an antigen, an antibody, a virus, a pathogen, a toxic material, a substrate, a metabolite, a transition state analog, a cofactor, an inhibitor, a drug, a dye, a nutrient, a growth factor, a cell, and a tissue, but are not limited thereto.
In the present disclosure, a receptor refers to a molecule or molecular cluster that is specific for one or more ligands. When bound or associated with ligand(s), a receptor undergoes a conformational change to thus trigger a physiological response, such as in an agonist or antagonist.
An antibody is a protein that binds to an antigen to form an antigen-antibody complex that exhibits an immunological function in response to the invasion of the antigen. An aptamer is a small single-stranded nucleic acid (DNA or RNA) fragment (20-60 nucleotides long) that can bind to a variety of receptors ranging from low molecular weight compounds to proteins, with high affinity and specificity.
As used herein, the term "analysis ligand" refers to a structure in which a specific ligand is conjugated with an oligonucleotide. The oligonucleotide may be adapted for analyzing a biomolecule that serves as a receptor to which a ligand binds. The oligonucleotide of the analysis ligand has the structure represented by the following Formula I: 5'-P1.alpha.-T-P3.beta.-3' (I)
wherein,
P1 is a region complementary to a forward primer of a pair of signal primers,
T is a region, complementary to a capture probe, which is designed to serve as a probe in a hybridization reaction, discriminating a target protein or a nucleic acid representing single stranded nucleic acid,
P3 is a region complementary to a backward primer of the pair of primers carrying the detection signal, and
.alpha. and .beta. are each an integer of 8-30, representing the number of nucleotides in the corresponding regions.
The term "target nucleic acid", as used herein, means a nucleic acid isolated from a sample to be analyzed. It may be in the form of a polynucleotide that has nucleotide sequences complementary to at least part of an upstream oligonucleotide and at least part of a downstream oligonucleotide, respectively. In some embodiments, the target nucleic acid may have an extension region or a nick between the two regions respectively complementary to the upstream and the downstream oligonucleotide. The target nucleic acid may include single- or double-stranded DNA or RNA. In addition, a target DNA refers to a template DNA to which the upstream oligonucleotide and the downstream oligonucleotide bind directly.
To accomplish the above objects, the present disclosure provides a method and an apparatus for analyzing two or more different biomolecules, comprising analyzing the two or more different biomolecules at the nucleic acid level, the two or more different biomolecules including at least one protein molecule and being isolated from a sample to be analyzed.
In a biological sample, there are numerous biomolecules that can be associated with ligands. In this regard, biomolecules form biomolecule-ligand complexes, so that they can be detected by means of a ligand signal. Based on this detection, techniques of analyzing biomolecules have been developed.
The present disclosure provides a method and an apparatus for analyzing a biomolecule, using an oligonucleotide, the method and the apparatus comprising: preparing a receptor and a nucleic acid from the biomolecule of a sample; reacting the receptor with an analysis ligand to form a receptor-analysis ligand complex; preparing a target DNA from a target nucleic acid to be analyzed and a target nucleic acid as an oligonucleotide of the receptor-analysis ligand complex; and analyzing the target DNA, whereby the biological significance of the receptor for an aptamer and of the nucleic acid is identified.
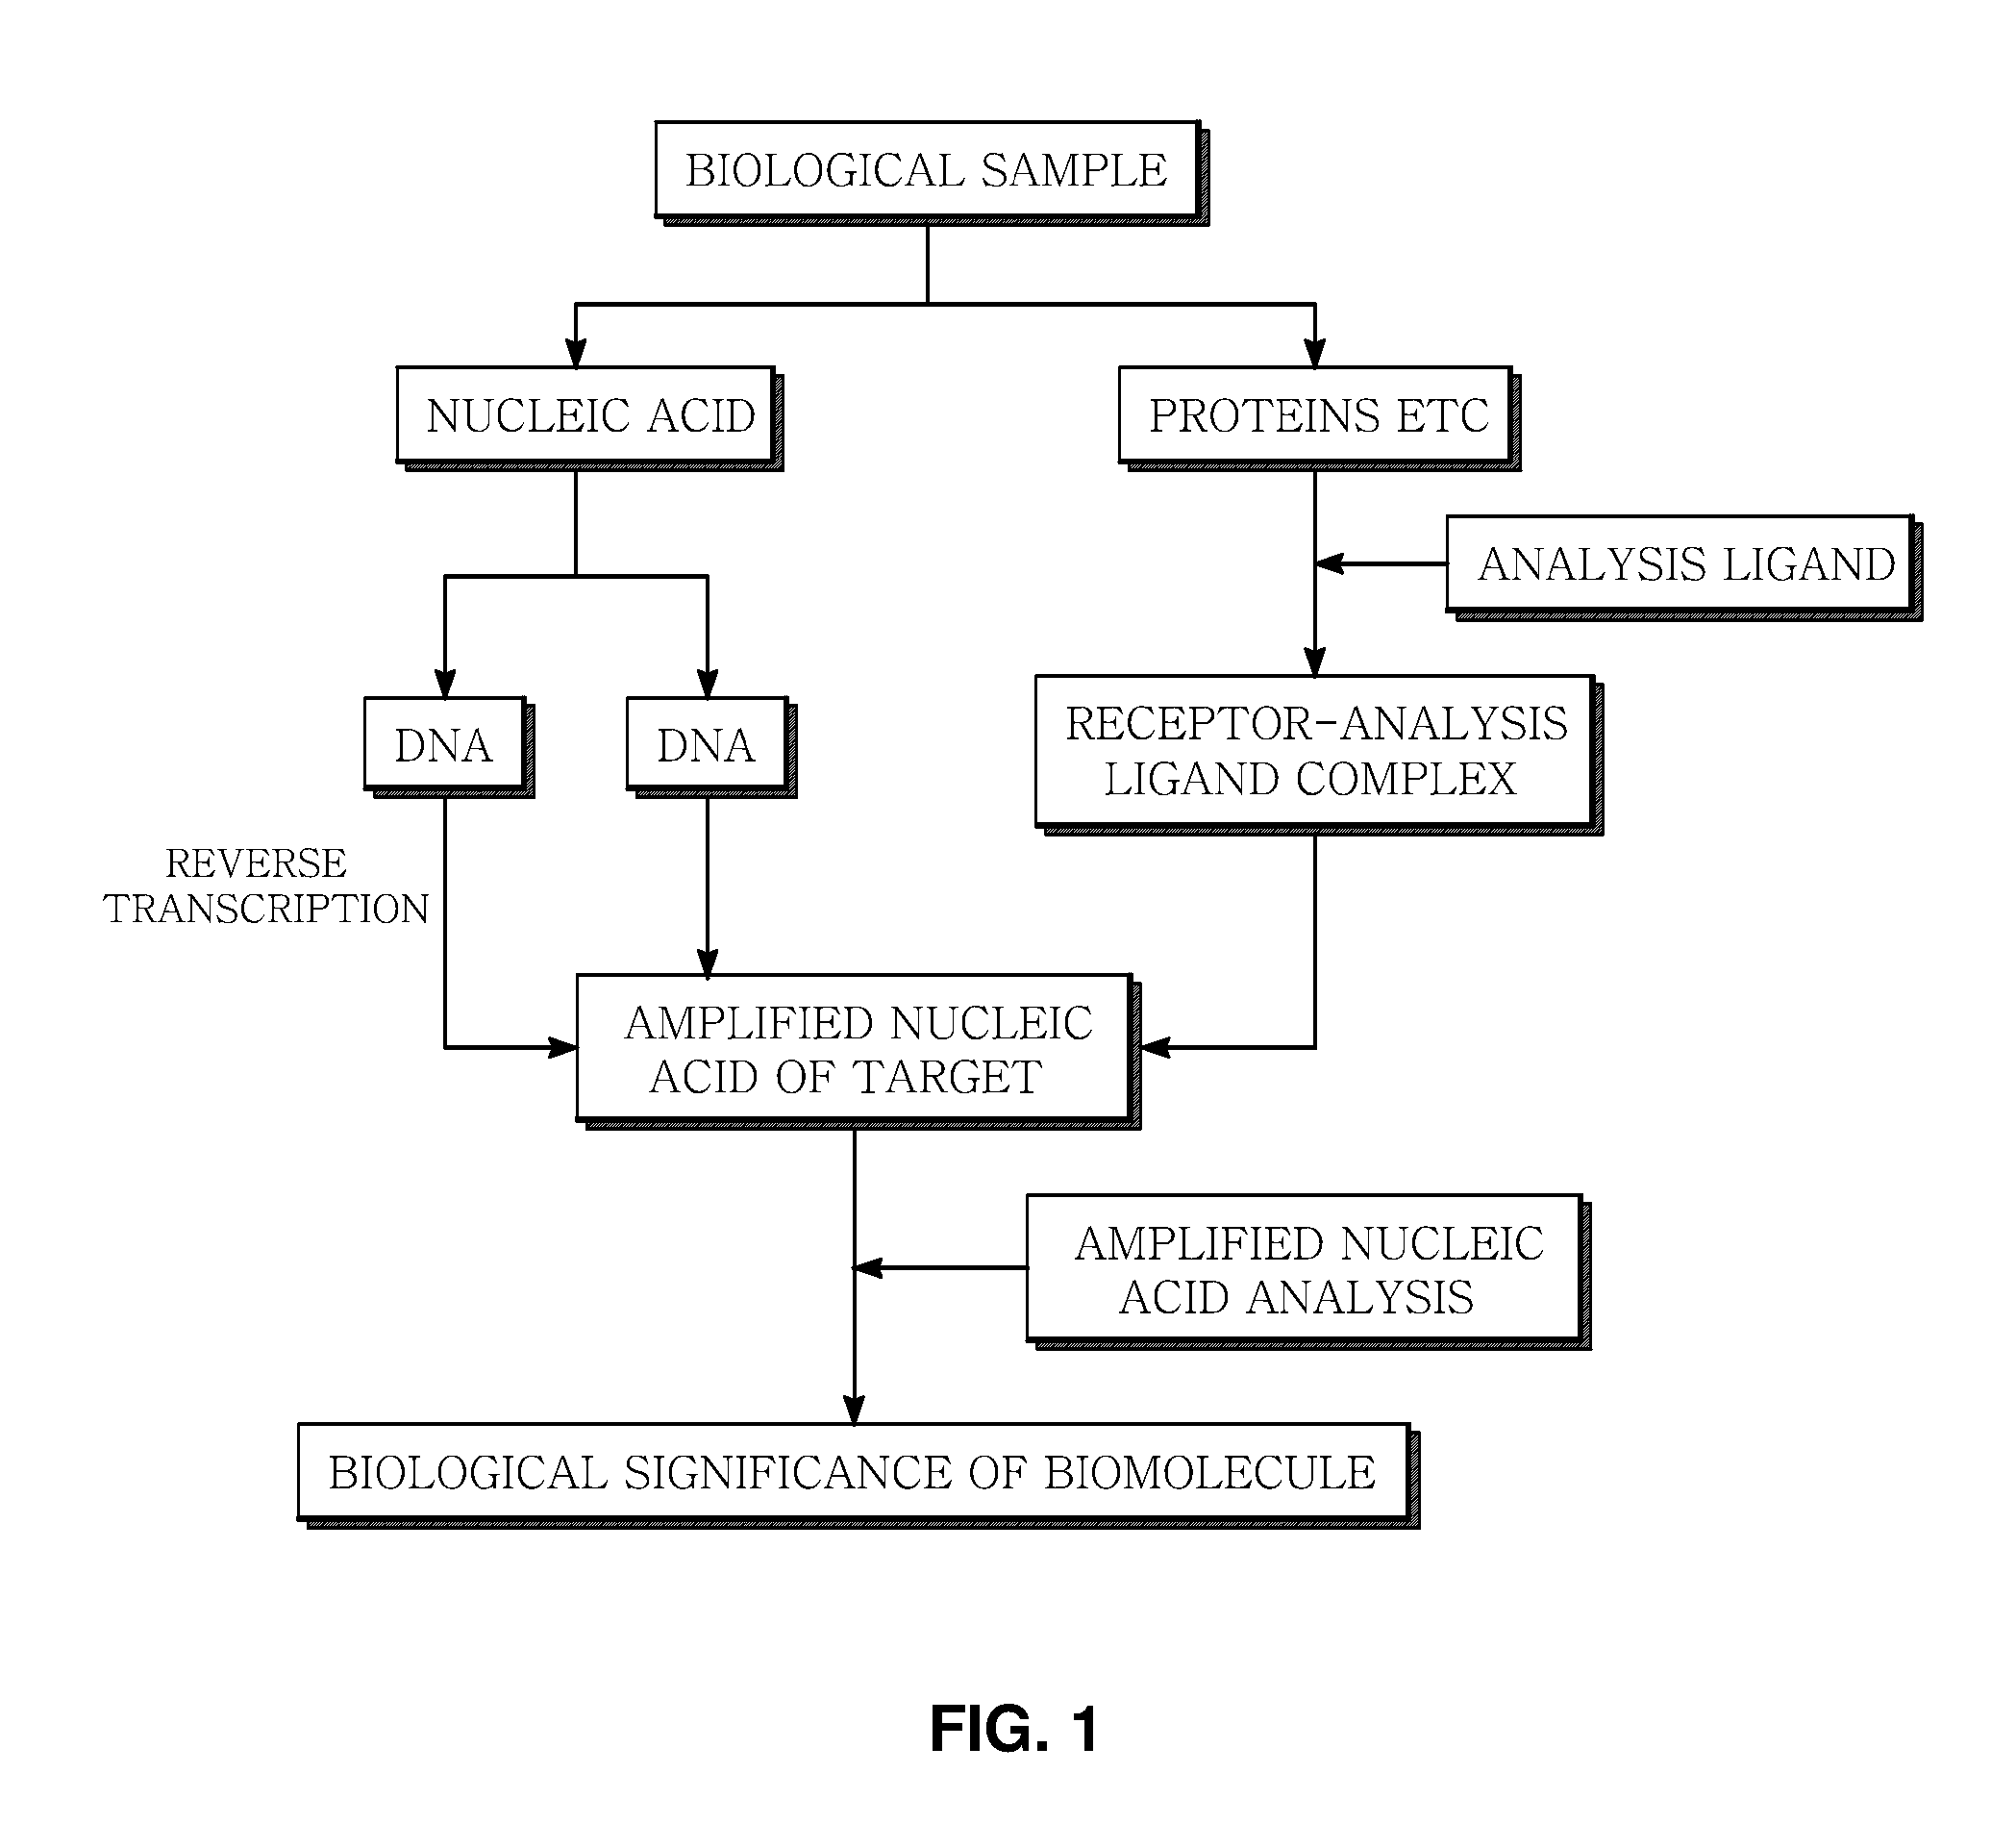
FIG. 1 is an overall flow diagram illustrating the determination of biological significance of a biomolecule in a biological sample by isolating nucleic acids and proteins separately, reacting the proteins with an analysis ligand to form a protein-analysis ligand complex, separating the nucleic acids into RNA and DNA, preparing a target DNA covering a target nucleic acid to be analyzed, and analyzing the target DNA with an oligonucleotide perfectly complementary to a specific region of the target nucleic acid.
FIG. 2 is a schematic view of a complex between a receptor isolated from a biological sample and an analysis ligand that comprises a ligand and an oligonucleotide composed of a nucleotide sequence representing the ligand, and universal PCR primers.
In a particular embodiment of the present disclosure, a biological sample, particularly cells, is lysed, and biomolecules serving as receptors are extracted from the lysate, and subsequently nucleic acids such as DNA and RNA are isolated from the remnant, using a method known in the art. The biomolecule thus obtained is reacted with an aptamer to form a biomolecule-analysis ligand complex which is then isolated using one of various known methods. Preferably, the isolation of the biomolecule-analysis ligand complex may be achieved by immobilizing the biomolecule onto a support, reacting an analysis ligand with the immobilized biomolecule to form a biomolecule-analysis ligand complex, and washing the support to remove) unbound analysis ligands. The RNA, DNA and biomolecule-analysis ligand complex isolates may be used as target nucleic acids to be analyzed and may be subjected to quantitative analysis and mutation analysis. From the analysis results thus obtained, the biological significance of the biomolecule in the biological sample can be determined.
In another embodiment of the present disclosure, the method and the apparatus for analyzing a biomolecule are characterized in that a specific nucleic acid is analyzed for quantity, mutation or methylation.
The specific nucleic acid mutation may be a genetic variant exemplified by single nucleotide polymorphism (SNP) and structural variation. Genetic variants are known to induce differences among individuals in phenotype, susceptibility to disease, and response to therapeutic drugs. Particularly, mutations involved in the onset and progression of disease are called Disease-associated Genetic Variants. SNP refers to genetic variation or mutation in a single nucleotide (A, T, G, C) that occurs at a specific position in the genome. Structural variation is the variation in structure of an organism's chromosome. It consists of many kinds of variation in the genome of one species, and usually includes microscopic and submicroscopic types, such as deletions, duplications, copy-number variants, insertions, inversions and translocations.
In addition, the analysis for nucleic acid methylation may be implemented by treating a nucleic acid with bisulfite. Upon treatment with bisulfite, unmethylated cytosine residues are converted into uracil residues while methylated cytosine residues remain unchanged. The change of nucleotides before and after treatment with bisulfite indicates the methylation of nucleic acids.
In another embodiment of the present disclosure, internal quality control for the quantitative analysis of the aptamer receptor employs a material that is not found in the biological sample to be analyzed.
As for qualitative and quantitative analysis, quality control is generally conducted with biomolecules included in a biological sample to be analyzed for comparison in various tests and examinations. For use in quality control, a material that is present at a relatively constant level in a biological sample to be analyzed is ideal. However, if that condition is impossible to satisfy, a heterogeneous substance that is not found in the sample may be employed. Particularly, a heterogeneous biomolecule that is not included in a biosample to be analyzed may be used as a substance for quality control. Quality control means internal quality control designed to manage the precision of measurements by analyzing a group of test data obtainable in each round, without employing an external reference such as a control sample.
When a biological sample of human origin is analyzed, a material for internal quality control may be preferably a plant-specific biomolecule that is not found in the biological sample of human origin. At present, the human genome project and the Arabidopsis thaliana genome project have been completed, and plant-specific proteins have been reported. In the present disclosure, a plant-specific protein may be used as a reference material for the analysis of a biological sample of human origin.
In a particular embodiment of the method and apparatus for analyzing a biomolecule, the target nucleic acid is quantitatively analyzed, or is subjected to base sequencing.
The analysis of the nucleic acid may be performed by PCR (polymerase chain reaction), LCR (ligase chain reaction), SDA (strand displacement amplification), TMA (transcription-mediated amplification), bDNA (branched DNA), an invader method, and/or RCA (rolling circle amplification). Particularly, a double-stranded nucleic acid obtained from the nucleic acid via LCR is used as a template for PCR amplification and the PCR product is analyzed.
In accordance with another embodiment of the method and apparatus for analyzing a biomolecule using an oligonucleotide, the step of preparing a target DNA from a target nucleic acid to be analyzed and a target nucleic acid as an oligonucleotide of the receptor-analysis ligand complex comprises preparing an upstream oligonucleotide and a downstream oligonucleotide, both perfectly complementary to the target nucleic acid in the same direction; reacting the upstream oligonucleotide and the downstream oligonucleotide with the target nucleic acid to form a complete double-stranded nucleic acid; producing a target probe by amplification in the presence of a set of signal primers, with the complete double-stranded nucleic acid serving as a template; and hybridizing the target probe with a capture probe and analyzing a signal produced from the hybrid.
The term "nucleotide sequence complementary to" the target nucleic acid, as used herein, refers to a nucleotide sequence sufficiently long to allow for the hybridization of oligonucleotides. Its length ranges from about 6 to about 1,000 nucleotides, preferably from about 8 to 30 nucleotides, and optimally from 10 to 25 nucleotides.
As used herein, the terms "upstream oligonucleotide" and "downstream oligonucleotide" refer to oligonucleotides that are perfectly complementary to the target nucleic acid at an upstream site and a downstream site, respectively.
In accordance with the present disclosure, the upstream oligonucleotide is a nucleotide sequence that is particularly 6 to 100 bases long, more particularly 8 to 30 bases long, and most particularly 20 bases long.
In accordance with the present disclosure, the downstream oligonucleotide is a nucleotide sequence particularly 8 to 80 bases long and most particularly 10 to 20 bases long, having a 3' region at least partially complementary to the target nucleic acid.
The term "capture probe", as used herein, refers to a distinct nucleotide sequence useful for identifying a polynucleotide and/or tracing the source of the polynucleotide. A capture probe sequence may be present at the 5'- or 3'-terminus of the signal primer. The capture probe nucleotide sequence may vary extensively in size and composition. With regard to instruction for the selection of a series of capture probe nucleotide sequences suitable for use in the present disclosure, reference may be made to the following documents (U.S. Pat. No. 5,635,400; Brenner et al, 2000, PNAS., 97: 1665-1670; Shoemaker et al, 1996, Nature Genetics, 14: 450-456; EU Patent No. 0799897A1; U.S. Pat. No. 5,981,179) and the like. In a particular embodiment, the capture probe may range in length from 4 to 36 nucleotides, more particularly from 6 to 30 nucleotides, or most particularly from 8 to 20 nucleotides.
In the present disclosure, the capture probe may have a specific nucleotide sequence of the target nucleic acid.
In accordance with another embodiment of the method and apparatus for analyzing a biomolecule using an oligonucleotide, the upstream oligonucleotide for the quantitative analysis of the target nucleic acid is composed of a region perfectly complementary to a forward signal primer and a region perfectly complementary to the nucleic acid, and the downstream oligonucleotide is composed of a region perfectly complementary to the target nucleic acid and a region perfectly complementary to a backward signal primer.
FIG. 3 is a view illustrating the formation of a double-stranded nucleic acid between a nucleic acid reversely transcribed from an RNA isolate from a biological sample and a set of the upstream oligonucleotide and the downstream oligonucleotide, followed by quantitative analysis.
In another embodiment, the upstream oligonucleotide for the quantitative analysis of the target nucleic acid is composed of (i) a region perfectly complementary to the forward signal primer of a pair of signal primers and (ii) a hybridization region substantially complementary to the target nucleic acid to be hydrolyzed.
In this regard, the upstream oligonucleotide is represented by the following formula II: 5'-P1.alpha.-H.beta.-3' (II)
wherein,
P1 is a region perfectly complementary to the forward primer of a pair of signal primers,
H is a hybridization region substantially complementary to a target nucleic acid to be hybridized, and
.alpha. and .beta. are each an integer of 8 to 30, representing numbers of nucleotides.
As the upstream oligonucleotide, a nucleotide sequence that is perfectly complementary to a certain nucleic acid is useful. However, a nucleotide sequence that is substantially complementary to a certain nucleic acid may be available as the upstream oligonucleotide unless its hybridization is interrupted. Preferably, the upstream oligonucleotide contains a sequence hybridizable to a sequence consisting of 10-30 consecutive nucleotide residues of the certain target nucleic acid.
The downstream oligonucleotide is composed of (i) a region perfectly complementary to the target nucleic acid in the same direction as the upstream oligonucleotide, (ii) a region perfectly complementary to the capture probe, and (iii) a region perfectly complementary to the backward primer of a pair of signal primers.
In this context, the downstream oligonucleotide is represented by the following formula III: 5'-H.alpha.-T.beta.-P3.gamma.-3' (III)
wherein,
H is a region complementary to the target nucleic acid at a site downstream of the 3' end of the upstream oligonucleotide,
T is a region, perfectly complementary to a capture probe, which is designed to serve as a probe in a hybridization reaction, discriminating a target nucleic acid or a single-stranded nucleic acid representing a target nucleic acid, and
P3 is a region complementary to a backward primer of the pair of signal primers, and
.alpha., .beta. and .gamma. are each an integer of 8-30, representing numbers of nucleotides in corresponding regions.
In accordance with another embodiment of the method and apparatus for analyzing a biomolecule using an oligonucleotide, an upstream oligonucleotide and a downstream oligonucleotide are constructed for use in analyzing the mutation of a target nucleic acid in the present disclosure. In this regard, the upstream oligonucleotide is composed of a region perfectly complementary to the forward signal primer, a nucleotide sequence perfectly complementary to the target nucleic acid, and a 3' terminal region capable of discriminating the mutated nucleotides of the target nucleic acid, and the downstream oligonucleotide is composed of a region perfectly complementary to the nucleic acid, a region perfectly complementary to the capture probe, and a region perfectly complementary to the backward signal primer.
FIG. 4 is a view illustrating the isolation of nucleic acids and receptors from a biological sample and the formation of a target nucleic acid from the nucleic acids and the receptor-analysis ligand complex prepared from the isolates, followed by analyzing the mutation of a target nucleic acid with oligonucleotides perfectly complementary to certain regions of the nucleic acid.
FIG. 5 is a view illustrating the preparation of a target DNA by treating a nucleic acid isolate from a biological sample with bisulfite, followed by analyzing the methylation of the target DNA with oligonucleotides perfectly complementary to certain regions of the target DNA.
Also, an upstream oligonucleotide and a downstream oligonucleotide are constructed for use in analyzing the mutation of a target nucleic acid. In this regard, the upstream oligonucleotide may be composed of (i) a region perfectly complementary to a forward primer of a pair of signal primers (P1), (ii) a variation-adjacent region perfectly hybridizable to a target nucleic acid, and (iii) a variation region covering a mutant nucleotide. The upstream oligonucleotide carrying information on nucleotide variation may consist of two or more different oligonucleotides.
In this context, the upstream oligonucleotide is represented by the following formula (IV): 5'-P1.alpha.-H.beta.-V.gamma.-3' (IV)
wherein,
P1 is a region perfectly complementary to a forward primer of a pair of signal primers,
H is a variation-adjacent region having a hybridization sequence perfectly complementary to a target nucleic acid,
V is a variation-specific region covering the variation of the target nucleic acid, and
.alpha., .beta., and .gamma. represent numbers of nucleotides in corresponding regions, .alpha. and .beta. each being an integer of 8-30 and .gamma. being an integer of 1-3.
As the upstream oligonucleotide, a nucleotide sequence that is perfectly complementary to an SNP-carrying nucleic acid is useful. However, a nucleotide sequence that is substantially complementary to the SNP-carrying nucleic acid may be available as the upstream oligonucleotide unless its hybridization is interrupted. Preferably, the upstream oligonucleotide contains a sequence hybridizable to a sequence consisting of 10-30 consecutive nucleotide residues of the SNP-carrying target nucleic acid. More preferably, the upstream oligonucleotide has a nucleotide complementary to the SNP nucleotide at its 3' end. As a rule, the stability of a duplex formed by hybridization tends to be dependent on the sequence matching of terminal sites. Hence, if the upstream oligonucleotide carrying a 3' terminal nucleotide complementary to an SNP nucleotide fails to hybridize at the terminal region, the duplex is apt to dissociation in stringent conditions.
The downstream oligonucleotide is composed of (i) a region perfectly complementary to the target nucleic acid in the same direction as the upstream oligonucleotide (H), (ii) a region perfectly complementary to the capture probe (T), and (iii) a region perfectly complementary to a backward primer of a pair of signal primers (P3).
In this regard, the downstream oligonucleotide is represented by the following formula V: 5'-H.alpha.-T.beta.-P3.gamma.-3' (V)
wherein,
H is a variation-adjacent region perfectly complementary to the target nucleic acid,
T is a region, perfectly complementary to a capture probe, which is designed to serve as a probe in a hybridization reaction, discriminating a mutation-carrying, single-stranded nucleic acid representing a target nucleic acid,
P3 is a region complementary to a backward primer of the pair of signal primers, and
.alpha., .beta. and .gamma. are each an integer of 8-30, representing numbers of nucleotides in corresponding regions.
The upstream oligonucleotide and the downstream oligonucleotide can be synthesized and prepared using a method known in the art (such as chemical synthesis). Alternatively, the upstream oligonucleotide and the downstream oligonucleotide can be conveniently obtained from a commercial supplier.
The upstream oligonucleotide and the downstream oligonucleotide useful in the present disclosure are hybridized or annealed with a template at predetermined regions to form a duplex. With regard to a nucleic acid hybridization condition suitable for the formation of such a duplex, reference may be made to Joseph Sambrook, etc., Molecular Cloning, A Laboratory Manual, Cold Spring Harbor Laboratory Press, Cold Spring Harbor, N.Y. (2001); and Haymes, B. D., etc., Nucleic Acid Hybridization, A Practical Approach, IRL Press, Washington, D.C. (1985).
In the present disclosure, the annealing is carried out in a stringent condition that allows the signal primers to bind specifically to a target nucleotide sequence. The stringent condition for annealing is sequence-dependent and may vary depending on environmental variables. The target nucleic acid thus amplified carries multiple target sites on one molecule so that it can be used in the simultaneous analysis of multiple target positions.
In the method and apparatus for analyzing a biomolecule using an oligonucleotide according to the present disclosure, when an extension region exists between the respective partial duplexes formed through the hybridization of the target nucleic acid to the upstream and the downstream oligonucleotide, extension is carried out, followed by ligation to produce a complete duplex.
As used herein, the term "extension region" refers to a nucleotide sequence long enough to allow for the extension of an oligonucleotide through nucleic acid polymerization. The "extension region" may be present in some embodiments of the target or template nucleic acids. If existing, the "extension region" is located between the upstream oligonucleotide and the downstream oligonucleotide, both of which are bound to the target or template nucleic acid. The "extension region" may range in length from about 1 to 1,000 nucleotides, preferably from about 1 to 100 nucleotides, more preferably from 3 to 50 nucleotides, and optimally from 3 to 10 nucleotides.
The term "extension", as used herein, is intended to mean the prolongation of a primer bound to the target nucleic acid so as to fill the extension region. The oligonucleotide completely bound to the nucleic acid is extended, with the nucleic acid serving as a template. In the present disclosure, the extension may be achieved using a DNA polymerase. It may be selected from the group consisting of Taq DNA polymerase and Pfu DNA polymerase. However, so long as it is thermostable, any DNA polymerase may be employed.
The term "ligation", as used herein, is intended to mean the enzymatic connection of the 3' end of the upstream oligonucleotide, whether extended or not, to the downstream oligonucleotide. The ligation may be carried out using a ligase. In the present disclosure, the ligase may be selected from among E. coli DNA ligase, Tag DNA ligase, T4 DNA ligase, and Ampligase ligase.
In the method and apparatus for analyzing a biomolecule using an oligonucleotide according to the present disclosure, when a nick exists between the respective partial duplexes formed through the hybridization of the target nucleic acid to the upstream and the downstream oligonucleotide, ligation is carried out to produce a complete duplex.
As described above, the ligation is the inter-nucleotide connection catalyzed by a ligase. When two different oligonucleotides with respective lengths are complementarily bound in series to adjacent sites of a target nucleic acid, a nick is formed between the two partial duplexes thus formed. The nick can be sealed using DNA ligase to thus connect the two separate oligonucleotides into a single strand. Hence, any ligase that is known to close nicks in the phosphodiester backbone of DNA can be employed in the present disclosure without limitations.
Examples of the ligase available for the present disclosure include E. coli DNA ligase, Taq DNA ligase, T4 DNA ligase, and Ampligase ligase, but are not limited thereto. Any enzyme with DNA ligation activity may be used.
In addition, even when two or more different oligonucleotides are used, ligation can be achieved in a single reaction. To this end, the individual oligonucleotides to be ligated are selected such that melting temperatures (Tm) of their sequences, hybridized to a target nucleic acid, may differ by 5.degree. C. or less.
In the method and apparatus for analyzing a biomolecule using an oligonucleotide according to the present disclosure, the production of the complete duplex by hybridizing the upstream oligonucleotide and the downstream oligonucleotide with the target nucleic acid and then ligating the partial duplexes to each other is carried out two or more times.
In the method and apparatus for analyzing a biomolecule using an oligonucleotide according to the present disclosure, the signal primers are composed of a universal forward PCR primer carrying a detection marker, and a universal backward PCR primer.
The signal primers are represented by the following formulas VI and VII, respectively: Forward primer: 5'-X-P-3' (VI) Backward primer: 5'-P-3' (VII)
wherein X is a detectable marker. For use in the quantitative analysis of a biomolecule, a marker used for a target probe from a control sample may be different from that used for a test sample. The marker may be Cy3 for the former and Cy5 for the latter.
Further, a marker may be utilized to analyze the mutation of a nucleic acid. For example, a fluorescent report molecule or a report molecule with a physical property may be linked to the 5' end of a primer for discriminating mutant nucleotides. Preferably, Cy3 may be used as a marker for a primer for wild-type nucleic acids while a primer for mutant nucleic acids may be labeled with Cy5.
In formulas VI and VII, P is a nucleotide sequence perfectly complementary to a region of the upstream oligonucleotide or the downstream oligonucleotide.
Of the signal primer pair, the forward primer (P1 or P2) has a nucleotide sequence perfectly complementary to a region of the upstream oligonucleotide, and may preferably be a universal PCR primer. It may be labeled at the 5' end with a marker (X), such as a fluorescent reporter molecule or a reporter molecule having a particular physical property, which may be selected depending on the nucleotide mutation of the target nucleic acid. After hybridization, the nucleotide mutation can be determined using the signal produced from the marker.
The backward primer (P3) has a nucleotide sequence perfectly complementary to a region of the downstream oligonucleotide, and may preferably be a universal PCR primer. A universal PCR primer refers to an oligonucleotide having a highly conserved nucleotide sequence useful for PCR, and may be available for many commercial cloning vectors.
In the method and apparatus for analyzing a biomolecule using an oligonucleotide according to the present disclosure, the capture probe has a nucleotide sequence perfectly complementary to a marker-labeled single-stranded nucleic acid of the target probe.
In the method and apparatus for analyzing a biomolecule using an oligonucleotide according to the present disclosure, the capture probe has a nucleotide sequence perfectly complementary to a specific nucleotide sequence of the downstream oligonucleotide on the target probe.
The capture probes are designed to bind to the amplicons, playing a role in discriminating the amplicons. The amplicons that are obtained by amplification in the presence of the signal primers with the target nucleic acid serving as a template may be used to construct, on the basis of the primer-binding region (T), a single-stranded nucleic acid complementary to the marker-labeled single-stranded nucleic acid, an oligonucleotide, and PNA (peptide nucleic acid).
In the method and apparatus for analyzing a biomolecule using an oligonucleotide according to the present disclosure, the target probe includes a control target probe prepared from a control sample and an analysis target prepared from a test sample.
In order to perform quantitative analysis with biomolecules isolated from a control sample and a test sample, a control target probe is constructed by performing PCR in the presence of signal primers on a target DNA prepared from the biomolecules of the control sample while an analysis target probe is constructed by performing PCR in the presence of signal primers on the target DNA prepared from the biomolecules of the test sample. A mixture of the control target probe and the analysis target probe is used. The signal primers used for the construction of the control target probe and the analysis target probe may be labeled with different markers. The primers may be labeled with Cy3 for the former and with Cy5 for the latter.
In the method and apparatus for analyzing a biomolecule using an oligonucleotide according to the present disclosure, the capture probe is immobilized onto a support.
In the present disclosure, the support is selected from among a glass slide, a detection surface of a biosensor, a bead, and a nanoparticle.
FIG. 6 is a view illustrating the hybridization of a marker-labeled target probe with the capture probes immobilized onto a glass slide, followed by washing and analyzing generated signals to determine the biomolecule.
Preferably, the capture probes may be fixed to a glass slide or to a detection surface of a biosensor. For this, it may be modified to allow for the fixation. The modification may be the addition of a C1-C20 alkyl group to the 5' end of the oligonucleotide. Alternatively, a thiol group may be added so as to facilitate the fixation. However, the modification may be suitably altered according to the purpose.
The support to which the capture probes are fixed is a kind of microarray, or may be a detection sensor of a biosensor. So long as it detects a change occurring upon the binding of a target material, any support may be employed to sense the target material in the present disclosure. Particularly, fluorescence can be detected from a fluorescent material bound to the capture probe. Herein, a glass slide is preferably employed.
The hybridization may be carried out at an annealing temperature of 40.degree. C. to 70.degree. C., preferably at an annealing temperature of 45.degree. C. to 68.degree. C., more preferably at an annealing temperature of 50.degree. C. to 65.degree. C., and most preferably at an annealing temperature of 60.degree. C. to 65.degree. C. With regard to hybridization conditions, reference may be made to Joseph Sambrook, et al., Molecular Cloning, A Laboratory Manual, Cold Spring Harbor Laboratory Press, Cold Spring Harbor, N.Y. (2001), and Haymes, B. D., et al., Nucleic Acid Hybridization, A Practical Approach, IRL Press, Washington, D.C. (1985). A stringent condition for the hybridization may be determined by many factors including temperature, ion strength (buffer concentration), organic solvents, etc. The stringent condition may vary depending on the sequence to be hybridized. For example, the stringent condition may be a high stringent condition. In this regard, hybridization at 65.degree. C. in a buffer containing 0.5 M NaHPO.sub.4, 7% SDS (Sodium Dodecyl Sulfate), and 1 mM EDTA, and washing at 68.degree. C. with 0.1.times.SSC (standard saline citrate)/0.1% SDS are performed. Alternatively, a high stringent condition may mean washing at 48.degree. C. in 6.times.SSC/0.05% sodium pyrophosphate. A low stringent condition may mean washing at 42.degree. C. in 0.2.times.SSC/0.1% SDS.
In the microarray, the capture probes are used as a hybridizable array element immobilized onto a substrate. A preferable substrate may be a suitable solid or semi-solid support, examples of which include a membrane, a filter, a chip, a slide, a wafer, a fiber, a magnetic or non-magnetic bead, a gel, tubing, a plate, a macromolecule, a microparticle, and a capillary tube. The capture probes are arranged and immobilized on the substrate. The immobilization may be achieved by forming covalent bonds, either chemically or under UV light. For example, the capture probes may be bound to an epoxy- or aldehyde-modified glass surface. On a polylysine-coated surface, covalent bonds may be formed under UV. In addition, the hybridizable array element may be bound to the substrate via a linker (e.g., ethylene glycol oligomer and diamine).
An instrument for measuring signals generated from the marker-labeled, single-stranded nucleic acids carrying mutant nucleotides in the amplicons bound to the capture probes is determined depending on the kind of signal. After hybridization, the generated signals are detected. The hybridization signals can be detected using various methods selected depending on the kind of marker that is bound to the capture probes.
Meanwhile, the sample DNA applied to the microarray of the present disclosure may be labeled and hybridized with the capture probes on the microarray. Various hybridization conditions may be used. The detection and analysis of hybridization may be conducted in various manners depending on the marker.
The marker bound to the capture probes provides a signal that allows for determining whether or not hybridization has occurred. The marker may be linked to the oligonucleotide. Examples of the marker useful in the present disclosure include fluorophores (e.g., fluorescein, phycoerythrin, rhodamine, Lissamine, Cy3 and Cy5 (Pharmacia)), chromophores, chemo luminophores, magnetic particles, radioisotopes, (P.sup.32 and S.sup.35), mass labels, electron-dense particles, enzymes (alkaline phosphatase, horseradish peroxidase), cofactors, enzyme substrates, heavy metals (e.g. gold), and haptens having specific binding partners, like antibodies, streptavidin, digoxigenin, and other chelating agents, but are not limited thereto. The labeling can be carried out using a typical method, such as a nick translation method, a random priming method (Multiprime DNA labelling systems booklet, "Amersham" (1989)), and a kination method (Maxam & Gilbert, 1989, Methods in Enzymology, 65:499). The marker may generate a signal that can be detected by means of fluorescence, radiation, color development, mass measurement, X-ray diffraction or absorption, magnetism, enzymatic activity, mass analysis, affinity, hybridization, high frequency, or nanocrystals.
The microarray can be fabricated using a suitable method known in the art. Devices useful for the construction of the microarray can be conveniently available from commercial suppliers. Various methods for fabricating nucleic acid chips on which the capture probes are regularly arranged are known in the art (M. Schena, 1999, DNA microarray; a practical approach, Oxford).
In the method and apparatus for analyzing a biomolecule using an oligonucleotide according to the present disclosure, the marker is a fluorescent dye selected from the group consisting of biotin, Cy2, GFP, YO-PRO-1, YOYO-1, Calcein, FITC, FlourX, ALEXA 488, Rhodamine 110, ABI 5-FAM, Oregon Green 500, Oregon green 488, RiboGreen, Rhodamine Green, Rhodamine 123, Magnesium Green, Calcium Green, TO-PRO-1, TOTO-1, ABI JOE, BODIPY 530/550, DiI, BODIPY TMR, BODIPY558/568, BODIPY564/570, Alexa 546, TRITC, Magnesium Orange, Phycoerythrin R & B, Rhodamine Phalloidin, Calcium Orange, Pyronin Y, Rhodamine B, ABI TAMRA, Rhodamine Red, Cy3.5, ABI ROX, Calcium Crimson, Alexa 594, Texas Red, Nile Red, YO-PRO-3, YOYO-3, R-phycocyanin, C-phycocyanin, TO-PRO-3, TOTO-3, DiD DiIC(5), thiadicarbocyanine, Cy5.5, Cy5, and Cy3.
In accordance with another embodiment thereof, the present disclosure provides a method and an apparatus for analyzing a biomolecule, using an oligonucleotide, the method and the apparatus comprising: fabricating a chip on which the capture probes are spotted; hybridizing the target probe with the capture probes immobilized onto the chip and then washing the chip, the target probe being a marker-labeled amplicon; scanning the chip with a laser having a fluorescent dye-specific wavelength; and measuring the fluorescence intensity resulting from the hybridization to analyze the quantity and mutation of the nucleic acid simultaneously.
In accordance with another embodiment thereof, the present disclosure provides a kit for analyzing a receptor and a nucleic acid of a biological sample, using an oligonucleotide, whereby the biological significance of the receptor and the nucleic acid can be determined.
In some embodiments, the apparatus for analyzing a biomolecule using an oligonucleotide is provided for implementing the analysis method. The apparatus comprises a sample treatment unit, in which a receptor and a nucleic acid are prepared from a biological sample, an amplification unit, composed of a module in which the target nucleic acid is prepared and amplified, and a module in which the amplicon is analyzed.
The sample treatment unit and amplification unit in the apparatus of the present disclosure may be composed of a mixing chamber, a lysis chamber, and a reaction chamber, and may be operated in an integrated manner so as to effectively conduct the analysis method.
A sample putatively containing a biomolecule of interest is prepared in a series of preparation steps in the sample treatment unit composed of the mixing chamber and the lysis chamber. The preparation steps may include filtration, cell lysis, the purification of RNA, DNA and receptors, the formation of receptor-analysis ligand complex, and treatment with reagents. In order to guarantee the result of biomolecule analysis, it is useful to avoid contamination during sample preparation. Thus, a method for assaying the validity of a sample prepared for use in nucleic acid amplification is provided.
The sample contains a target entity selected from the group consisting of cells, spores, microorganisms, and viruses. The target entity includes at least one target biomolecule. The method comprises introducing the sample into the unit containing the mixing chamber in which the sample is mixed with a control sample. The control sample is selected from the group consisting of cells, spores, microorganisms, and viruses. The control sample includes a quality control material. The apparatus also comprises a lysis chamber and a reaction chamber. The sample is mixed with a control sample in the mixing chamber.
In another embodiment, the method comprises lysing target entities from a target sample and a control sample to purify a biomolecule, forming a receptor-analysis ligand complex, exposing RNA and DNA, both being isolated in the lysis chamber, as well as the receptor-analysis ligand complex, to nucleic acid amplification conditions, and determining the presence of at least one quality control material. The positive detection of the quality control material indicates that the sample preparation process has been properly conducted. On the other hand, the absence of the quality control material indicates the improper implementation of sample preparation.
Also, the present disclosure provides an amplification apparatus for assaying the validity of a sample prepared for use in nucleic acid amplification. The sample contains a target entity selected from the group consisting of cells, spores, microorganisms, and viruses. The target entity includes at least one target biomolecule. The apparatus comprises a main body including a first chamber for accommodating a control sample to be mixed with the sample. The control sample is selected from the group consisting of cells, spores, microorganisms, and viruses. The control sample includes a quality control material.
The main body also includes a lysis chamber in which target entities from a target sample and a control sample are lysed in order to isolate biomolecules, and the isolates are separated into RNA, DNA, and a receptor. In addition, the main body includes an analysis ligand reacting chamber in which an isolated aptamer receptor is reacted with an aptamer to form a receptor-aptamer complex. Further, the main chamber includes a reaction chamber in which a nucleic acid is maintained for amplification and detection. The apparatus may further comprise at least one fluid controller for inducing a mixture of a sample and a control sample to flow from the first chamber to the lysis chamber, and for inducing the biomolecule, isolated in the lysis chamber, to flow into the reaction chamber.
According to some embodiments, the apparatus may further comprise an ultrasonic transducer, engaged with a wall of the lysis chamber, for proving ultrasonic waves to the wall. In some embodiments, the apparatus may further comprise beads for lysing the sample control and the target entity in the lysis chamber.
Also, contemplated in accordance with another embodiment of the present invention is a method for determining the correct performanceof lysis. This method may further comprise mixing a sample, putatively inferred to contain a target entity selected from the group consisting of cells, spores, microorganisms, and viruses, with a control sample. The target entity includes at least one quality control material. The control sample includes a quality control material. The control sample is mixed with the target entity of the sample and the mixture is lysed. The method may further comprise detecting the quality control material to determine whether or not a biomolecule is isolated from the control sample during the lysis. The positive detection of the quality control material indicates that the sample preparation process was properly conducted. On the other hand, the absence of the quality control material indicates the improper implementation of sample preparation.
In some embodiments, the method may further comprise flowing the sample mixed with the control sample into a chamber for accommodating a solid substance whereby the control sample and the target entity in the sample are captured by the solid substance, prior to lysis.
In some embodiments, the sample may be filtered before being mixed with the control sample. In some embodiments, the lysing step includes exposing the control sample and the target entity to ultrasonic energy. In some embodiments, the lysing step includes homogenizing the control sample and the target entity with beads. In some embodiments, the control sample includes spores. In some embodiments, the mixing step includes disintegrating dry beads containing the control sample.
In some embodiments, the lysing step comprises contacting with a chemical lysis agent. In some embodiments, a marker nucleotide sequence is detected by amplifying the marker nucleotide sequence (with, for example, PCB), and detecting the amplified marker nucleotide sequence. According to some embodiments, the marker nucleotide sequence may be detected by determining whether or not a signal from a probe bound to the marker nucleotide sequence exceeds a limit value.
A reaction mixture in the reaction chamber of the amplification apparatus is exposed to a nucleic acid amplification condition. The amplification of RNA or DNA is known in the art [U.S. Pat. Nos. 4,683,195; 4,683,202; PCR Protocols: A Guide to Methods and Applications (Innis et. al., 1990)]. DNA amplification is generally performed through multiple cycles of thermally denaturing DNA, annealing a pair of oligonucleotide primers to a target sequence, and extending the annealed primers with a DNA polymerase. The primers are attached to opposite strands while DNA synthesis is performed between the primers using a polymerase to produce the target DNA fragment at a two-fold faster speed. In addition, because the nascent, extended strands are also complementary to each other and can be annealed with the primers, the quantity of DNA produced in each of the consecutive cycles is twice as large as that in the previous cycle. Accordingly, the target DNA fragment may be produced at a 2-fold rate per cycle, thus being accumulated in a total relative amount of 2.sup.n (n being the number of cycles). PCR or ligase chain reaction (LCR) may be used to directly amplify a target sequence from mRNA, cDNA, genome libraries, or cDNA libraries. Isothermal amplification is also known, and may be used in the method of the present disclosure.
Nucleic acid amplification may be preferably carried out using a heat treatment device designed to heat and/or cool a reaction mixture to temperatures necessary for amplification. The heat treatment device may include at least one detector for detecting a marker nucleotide sequence and at least one target nucleotide sequence to be tested in the sample. Preferred is a heat treatment device embedded with an optical detector for amplifying and detecting nucleotide sequences in a reaction vessel (U.S. Pat. Nos. 6,369,893; 6,391,541). In addition, other known methods for controlling temperatures of the reaction mixture and for detecting a target sequence from the reaction mixture may be used in the present disclosure.
Further, the detection of a quality control material in a control sample and at least one quality control material in a sample to be tested is preferably conducted with a probe. In a preferred embodiment, a reaction vessel has at least one transparent or semi-transparent wall through which an optically detectable signal from the probe can pass. Preferably, the capture probe may be used in detecting and quantitating nucleic acid sequences. There are numerous assays utilizing nucleic acid-capturing probes. Some of the capture probes generate fluorescent signals that change with interaction with other molecules or moieties.
In another preferred method for detecting an amplified product, a fluorescent probe may consist of an oligonucleotide labeled with a fluorescent reporter dye. The dissociation of the capture probe increases the fluorescent intensity of the reporter dye.
In order to ensure the presence or absence of a target biomolecule in a sample, it is essential to control contamination during sample preparation. This is why the control sample should be subjected to the same treatment as a target entity of the test sample (e. g., target cells, spores, viruses or microorganisms containing a biomolecule of interest). The positive detection of the quality control material in the control sample indicates that the sample preparation process has been properly conducted. On the other hand, when the quality control material is not detected, the sample preparation is regarded as being improper and the test result of target nucleotide sequences are classified as "undetermined". Preferably, the detection of a quality control material may be achieved when the signal from the capture probes bound to a target probe meets or exceeds a limit value, for example, a predetermined limit value of fluorescence, that is, a minimal value regarded as being effective for a fluorescence assay.
The fluid controller may be controlled by a computer according to a desired protocol. The employment of a single value increases the possibility of improving the production yield because there is only one failure element. The integration of the fluid controller into other elemental members may yield a compact device (for example, a small cartridge) and makes it easy to automate fabrication and assembly processes. As stated above, such a system may be advantageously provided with a diluting and mixing function, an intermediate washing function, and a reliable pressurizing function. A fluid passage within the system is usually closed so as to prevent the contamination of the fluid in the system and to facilitate the reception and control of the fluid. The reaction vessel may be conveniently detached and changed with a fresh one. In some embodiments, it may be discarded.
The present disclosure provides a nucleic acid chip for analyzing receptors and nucleic acids of a biological sample, using aptamers, whereby the biological significance of the receptors and the nucleic acids can be determined.
The present disclosure provides a method and an apparatus for analyzing a biomolecule, comprising a structure designed to analyze the biological significance of the biomolecule using biomolecule information data, the structure comprising: a module in which the biomolecule information of a group of patients and the biomolecule information data of a control are received to construct a database; a module in which the input information data is used for pre-treatment in an analysis system; a module in which a patient module is created with the pre-treatment result; and a module in which the patient model is loaded into the system, and applied to a hospitalized patient or an outpatient to perform a diagnosis in a blind test manner; and evaluating the function of the system through a cross validation analysis.
The biological significance-predicting system using the biomolecule information data in accordance with the present disclosure is used for illustrative diagnosis, but is not limited thereto.
A huge amount of biomolecule information data with regard to various disease-related factors including cells, tissues, etc. can be produced in accordance with the present disclosure. The module in which the input data is used for pre-treatment in an analysis system is adapted for searching for factors having an influence on the health state of patients and for conducting feature selection using multivariate analysis. Feature selection is a process of selecting a subset of relevant features through dimensionality reduction or feature modification for accurate treatment and diagnosis.
For feature selection, unsupervised learning or supervised learning is employed according to whether or not class information is utilized for learning. In PCA (Principal Component Analysis) or ICA (Independent Component Analysis), typically utilized for unsupervised learning, features are selected in consideration of variables. Supervised learning is a method in which variables are selected using statistical significance between class information and variables or correlation between variables. In supervised learning, features are sequentially added or removed in forward or backward propagation, and important features can be selected after the function is examined upon the application of the resulting features to a classifier.
The module in which learning is conducted with the pre-treatment result to construct a patient model is designed to classify the selected features through suitable classifier.
Artificial neural networks, which find applications in a variety of fields including pattern recognition, function approximation, classification, etc., are employed in the present disclosure. An artificial neural network is structured to include multiple layers, nodes, and interconnection weights between neural networks. The neural network interlayer connection used in the present disclosure is of feed-forward type. Depending on input patterns, an interconnection weight for each node and an activation function are used to calculate an output value. When a calculated value is different from a measured value after an event is treated through the produced connective information, the error can be minimized by repetitive comparison between calculated values and measurements.
In the method and apparatus for analyzing a biomolecule according to the present disclosure, the construction of the patient model is performed using at least one selected from the group consisting of linear models, support vector machines, neural networks, classification and regression trees, ensemble learning methods, discriminant analysis, nearest neighbor method, Bayesian networks, and independent components analysis.
In consideration of the fact that accurate and comprehensive mechanisms are not defined for many diseases, case-based diagnosis is of great importance. However, conventional case-based machine learning inference systems conceived on the basis of specific machine learning techniques show poor accuracy, and there is therefore a need for improved systems. In addition, conventional systems are developed to utilize all of the learned clinical examination items only in diagnosing diseases, but do not provide importance and priority of individual clinical examination items according to diseases.
The present disclosure addresses a system for selecting clinical diagnosis and examination items, using case-based machine learning inference, the system comprising analyzing examination information of a new patient to make a preliminary diagnosis with the aid of a machine learning disease discriminator using a neural network trained with a case database of patients, and selecting a minimal number of important examination items for the final decision of an accurate disease. The construction of the patient model is performed using at least one selected from the group consisting of linear models, support vector machines, neural networks, classification and regression trees, ensemble learning methods, discriminant analysis, nearest neighbor method, Bayesian networks, and independent components analysis.
The practical application of the system may be achieved in two manners. For example, it may be structured as a stand-alone diagnosis system or as an integrated system in association with a conventional hospital information system, e.g., OCS, PACS, LIS, etc. For use in association with such a conventional hospital information system, the system should be structured according to HL7 and DICOM protocols. In conjunction with the early-stage model PMS (Patient Monitoring System), the system of the present disclosure exhibits highly accurate diagnosis. The system of the present disclosure may be developed into a diagnosis system of higher accuracy when designed to operate in association with various medical information systems such as OCS, EMR, and PACS in addition to PMS.
In the method and apparatus for analyzing a biomolecule, using an oligonucleotide in accordance with the present disclosure, the biological sample is at least one selected from the group consisting of cells, fungi, viruses, cell lines, and tissues.
Advantageous Effects
As described above, the use of oligonucleotides according to the present disclosure can analyze biomolecules in biological samples at high fluorescent sensitivity, with the consequent determination of the biological significance of the biomolecules. Further, the method and apparatus of the present disclosure allows for the analysis of various biomolecules in a single test, thereby effectively determining biological differences between individual persons, including phenotypic changes in the biological samples, susceptibility to diseases, and drug sensitivity.
DESCRIPTION OF DRAWINGS
FIG. 1 is an overall flow diagram illustrating the determination of biological significance of a biomolecule in a biological sample by isolating nucleic acids and proteins separately, reacting the proteins with an analysis ligand to form a protein-analysis ligand complex, separating the nucleic acids into RNA and DNA, preparing a target DNA covering a target nucleic acid to be analyzed, and analyzing the target DNA with an oligonucleotide perfectly complementary to a specific region of the target nucleic acid.
FIG. 2 is a schematic view of a complex between a receptor isolated from a biological sample and an analysis ligand.
FIG. 3 is a view illustrating the quantitative analysis of RNA using the cDNA reversely transcribed the RNA.
FIG. 4 is an overall flow view illustrating the analysis of the mutation of a target nucleic acid with oligonucleotides perfectly complementary to certain regions of a nucleic acid isolated from a biological sample.
FIG. 5 is an overall flow view illustrating the analysis of the methylation of a target DNA isolate with oligonucleotides perfectly complementary to certain regions of the target DNA isolate.
FIG. 6 is a view illustrating the analysis of biomolecules through signals generated upon hybridization between a marker-labeled target probe and a capture probe on an array.
FIG. 7 is an arrangement of the capture probes responsive to aptamers, mRNAs, mutant DNAs and methylated DNAs, all carrying either IL17 or IL17RA.
FIG. 8 is a fluorescent image of an array illustrating the analysis of IL17 and IL17RA in terms of proteins, mRNAs, and DNA mutation and methylation after partial double-stranded nucleic acids are formed using oligonucleotides and converted into complete double-stranded nucleic acids, followed by performing PCR on the double-stranded nucleic acids in the presence of signal primers and then hybridizing the labeled PCR products as target probes with capture probes immobilized on the array.
BEST MODE
Below, a detailed description will be given of standard materials, the preparation of nucleic acid chips, and a method for analyzing two or more different biomolecules in a biological sample, using the same, with reference to the accompanying drawings. The following Examples are set forth to illustrate, but are not to be construed as limiting the present invention.
As biomolecules, IL17 and IL17RA were used in the present disclosure. These biomolecules are analyzed at protein and nucleic acid levels in a single array assay for protein, mRNA, and DNA mutation.
IL-17, which is a cytokine produced the CD4+ T-cells, called Th17 cells, has an amino acid sequence represented as Accession code AAH67505 or NP002181. IL-17A or CTLA-8 is known as a member of the IL-17 family. An IL-17 receptor is a cell surface protein to which IL-17 binds. Within the scope of the IL-17 receptor family, IL-17RA, IL-17RB, IL-17RC, IL-17RD, and IL-17RE fall.
As used herein, the term "IL-17-mediated inflammatory disease" is intended to encompass all the diseases caused by IL-17 secreted from immune or inflammatory cells such as gamma/delta T cells, NK cells, macrophages, neutrophils, etc., in addition to Th17 cells, including respiratory diseases, gastrointestinal diseases, dermal diseases, vascular diseases, metabolic diseases, osteoarthritic diseases, and cerebral nerve diseases.
In detail, the respiratory diseases are exemplified by rhinitis, nasal polyp, sinusitis, asthma, bronchitis, chronic obstructive pulmonary disease, bronchiectasis, bronchiolitis, pneumonia, pulmonary fibrosis, lung cancer, etc. Examples of the gastrointestinal diseases include stomatitis, esophagitis, gastritis, gastric ulcer, inflammatory bowel disease, irritable bowel syndrome, cholangitis, pancreatitis, oral cancer, esophageal cancer, stomach cancer, colorectal cancer, cholangiocarcinoma, gallbladder cancer, and pancreatic cancer.
Representative among the vascular and metabolic diseases are arteriosclerosis, diabetes, and gout. The osteoarthritic diseases include rheumatoid arthritis, osteoarthritis, osteoporosis, etc. The cerebral nerve diseases include vascular dementia, Alzheimer's disease, neurodegenerative disease, etc.
In Examples of the present disclosure, IL17 and IL17RA were quantitatively analyzed at protein and RNA levels. Genetic information on IL17 and IL17RA is available from the GenBank Data System (http://www.ncbi.nlm.nih.gov) and their nucleotide sequences are identified (Accession number NM_002190 for IL17, and Accession number: NM_014339 for IL17RA)
For DNA mutation analysis, SNPs of IL17 and IL17RA were employed, and the genetic information thereof was found in http://www.ncbi.nlm.nih.gov/snp.
Nucleic acid methylation was analyzed at position IL17 promoter-144 (Thomas, R. M., et al., 2012, J Biol Chem. 287(30):25049-59.).
TABLE-US-00001 TABLE 1 Base Sequence of Specific Region(H) of Target Nucleic Acid SEQ SEQ Upstream Oligonucleotide ID Downstream Oligonucleotide ID (5'.fwdarw.3') NO. (5'.fwdarw.3') NO. # .beta.-actin gggcgacgaggcccagagcaagaga 1 ggcatcctcaccctgaagtacccca 61 1 mRNA cagatcatgtttgagaccttcaaca 2 ccccagccatgtacgttgctatcca 62 2 IL17 mRNA ccctcaggaaccctcatccttcaaa 3 gacagcctcatttcggactaaactc 63 3 taaccggaataccaataccaatccc 4 aaaaggtcctcagattactacaacc 64 4 IL17RA ggagcagaagcctcccagccactag 5 ccttttgggctcagtctctccaata 65 5 mRNA gagtacaggataccacaatgcactc 6 ttcctgcgtagagcacatgttccca 66 6 IL17 SNP rs10484879 AAACTCATCGTGAAGTCAAACATTCAA 7 ATTGGAAGAAAGAGCTATAGAA 67 7 AAACTCATCGTGAAGTCAAACATTCAC 8 AAT rs8193038 GGAATACTGTATATGTAGGATAGGAAA 9 TGAAAGCTTTGGTAGGTATTTA 68 8 GGAATACTGTATATGTAGGATAGGAAG 10 AGT rs8193037 TGTCACCCCTGAACCCACTGCGACAC 11 CCACGTAAGTGACCACAGAAG 69 9 A GAGA TGTCACCCCTGAACCCACTGCGACAC 12 G rs8193036 CCCCCCTGCCCCCCTTTTCTCCATCTC 13 CATCACCTTTGTCCAGTCTCTA 70 10 CCCCCCTGCCCCCCTTTTCTCCATCTT 14 TCC rs4711998 TGTATTCCTGAGAAGGAACTATTCTCA 15 AGGACCTGAGTCCAAGTTCATC 71 11 TGTATTCCTGAGAAGGAACTATTCTCG 16 TTA rs3819025 TCATTGGTGGTGAGTCCTGCACTAACA 17 TGCGATGCTCTTGCTGATTTGG 72 12 TCATTGGTGGTGAGTCCTGCACTAAC 18 ACC G rs3819024 AACACCTGGCCAAGGAATCTGTGAGG 19 AAAGAAAGATCAAATGGAAAAT 73 13 A CAA AACACCTGGCCAAGGAATCTGTGAGG 20 G rs3804513 CAAATGTATTTTGATCATTTGACTTCA 21 TACAAATAAGTCTCTGTTCTGT 74 14 CAAATGTATTTTGATCATTTGACTTCT 22 GGA rs3748067 TGGGCTGAACTTTTCTCATACTTAAAA 23 TTCGTTCTGCCCCATCAGCTCC 75 15 TGGGCTGAACTTTTCTCATACTTAAAG 24 TTT rs2275913 CTGCCCTTCCCATTTTCCTTCAGAAGA 25 AGAGATTCTTCTATGACCTCATT 76 16 CTGCCCTTCCCATTTTCCTTCAGAAGG 26 GG rs1974226 CTGAACTTTTCTCATACTTAAAGTTCA 27 TTCTGCCCCATCAGCTCCTTTC 77 17 CTGAACTTTTCTCATACTTAAAGTTCG 28 TGG IL17RA SNP rs151315255 GATGGCCTGCCTGCGGCTGACCTGAT 29 CCCCCACCGCTGAAGCCCAGG 78 18 C AAGG GATGGCCTGCCTGCGGCTGACCTGAT 30 T rs139412425 TGGATCATCTACTCAGCCGACCACCC 31 CTCTACGTGGACGTGGTCCTG 79 19 C AAAT TGGATCATCTACTCAGCCGACCACCC 32 K rs6518661 CTGTCACTAAGGAGTTAACCCCCGCA 33 AGCAGTTTTTTCATCACATCTCT 80 20 A GA CTGTCACTAAGGAGTTAACCCCCGCA 34 G rs6518660 CATAGTAGATAGCAATCTATTCAACCA 35 TTTCTAGTTTGATGGACATTTAG 81 21 CATAGTAGATAGCAATCTATTCAACCG 36 AT rs5748864 gcaagttaggattagagggctgggacA 37 tttagccccacccctttacccatca 82 22 gcaagttaggattagagggctgggacG 38 rs4819554 TGGGAAGTAACGACTCTCTTAGGTGC 39 GCTGGGACACAGTCTCACAGA A CCAG 83 23 TGGGAAGTAACGACTCTCTTAGGTGC 40 G rs2241049 GCATGGGAGGACCTATGGGAGGTTCC 41 ATAACATTCAGTAGCATCTCGG 84 24 A CCA GCATGGGAGGACCTATGGGAGGTTCC 42 G rs2241046 ATGCTATTTTCCCTTTTTCCTCTGTTC 43 TCATTGCAGAACCAATTCCGGG 85 25 ATGCTATTTTCCCTTTTTCCTCTGTTT 44 TAA rs2229151 CACCCCCTCTACGTGGACGTGGTCCT 45 AAATTCGCCCAGTTCCTGCTCA 86 26 A CCG CACCCCCTCTACGTGGACGTGGTCCT 46 G rs882643 ACGCTTTCCCCAACCACAATCCTTCAC 47 CTCAGGCATCTCCTCGGGGAT 87 27 ACGCTTTCCCCAACCACAATCCTTCAG 48 CCCC rs879577 TCAGCGGTGGGGGGATCAGGTCAGC 49 CAGGCAGGCCATCTAAGGAAA 88 28 CA CAAG] TCAGCGGTGGGGGGATCAGGTCAGC 50 CG rs879576 TGGTCGGCTGAGTAGATGATCCAGAC 51 TTCCTGGGCTTCAGCGGTGGG 89 29 C GGGA TGGTCGGCTGAGTAGATGATCCAGAC 52 T rs879576 TGGTCGGCTGAGTAGATGATCCAGAC 53 TTCCTGGGCTTCAGCGGTGGG 90 30 C GGGA TGGTCGGCTGAGTAGATGATCCAGAC 54 T rs721930 GTTCTGAGGGGTGATTAGGGAGGAGA 55 TTTAGTTTAACTTGGAGTCCTTC 91 31 C AG GTTCTGAGGGGTGATTAGGGAGGAGA 56 G IL17 ggucuagccggaggaguc 57 aguaaucgguagacc 92 32 Aptamer IL17RA ACGCGCTAGGATCAA 58 AGCTGCACTGAAGTG 93 33 Aptamer IL17 tcaaatcaattttaacatta 59 gtcatacttgtgggctgga gaccaaaagcc 94 34 methylation tctacaacaag (promoter tcaaatcaattttaacatta 60 at position tctacaacaaa 144)
TABLE-US-00002 TABLE 2 Capture Probes and Complementary Sequences thereof (zip-code base sequences directing ligands) SEQ SEQ ID ID # Capture Probe (5'.fwdarw.3')(53) NO. Complementary (5'.fwdarw.3') NO. 1 GATTTGTATTGATTGAGATTAAAG 95 CTTTAATCTCAATCAATACAAATC 129 2 TGATTGTAGTATGTATTGATAAAG 96 CTTTATCAATACATACTACAATCA 130 3 GATTGTAAGATTTGATAAAGTGTA 97 TACACTTTATCAAATCTTACAATC 131 4 GATTTGAAGATTATTGGTAATGTA 98 TACATTACCAATAATCTTCAAATC 132 5 GATTGATTATTGTGATTTGAATTG 99 CAATTCAAATCACAATAATCAATC 133 6 GATTTGATTGTAAAAGATTGTTGA 100 TCAACAATCTTTTACAATCAAATC 134 7 ATTGGTAAATTGGTAAATGAATTG 101 CAATTCATTTACCAATTTACCAAT 135 8 GTAAGTAATGAATGTAAAAGGATT 102 AATCCTTTTACATTCATTACTTAC 136 9 GTAAGATGTTGATATAGAAGATTA 103 TAATCTTCTATATCAACATCTTAC 137 10 TGTAGATTTGTATGTATGTATGAT 104 ATCATACATACATACAAATCTACA 138 11 GATTAAAGTGATTGATGATTTGTA 105 TACAAATCATCATCACTTTTAATC 139 12 AAAGAAAGAAAGAAAGAAAGTGTA 106 TACACTTTCTTTCTTTCTTTCTTT 140 13 TTAGTGAAGAAGTATAGTTTATTG 107 CAATAAACTATACTTCTTCACTAA 141 14 AAAGTAAGTTAAGATGTATAGTAG 108 CTACTATACATCTTACTATACTTT 142 15 TGAATTGATGAATGAATGAAGTAT 109 ATACTTCATTCATTCATCAATTCA 143 16 TGATGATTTGAATGAAGATTGATT 110 AATCAATCTTCATTCAAATCATCA 144 17 TGATAAAGTGATAAAGGATTAAAG 111 CTTTAATCCTTTATCACTTTATCA 145 18 TGATTTGAGTATTTGAGATTTTGA 112 TCAAAATCTCAAATACTCAAATCA 146 19 GTATTTGAGTAAGTAATTGATTGA 113 TCAATCAATTACTTACTCAAATAG 147 20 GATTGTATTGAAGTATTGTAAAAG 114 CTTTTACAATACTTCAATACAATC 148 21 TGATTTGAGATTAAAGAAAGGATT 115 AATCCTTTCTTTAATCTCAAATCA 149 22 TGATTGAATTGAGTAAAAAGGATT 116 AATCCTTTTTACTCAATTCAATCA 150 23 AAAGTTGAGATTTGAATGATTGAA 117 TTCAATCATTCAAATCTCAACTTT 151 24 GTATTGTATTGAAAAGGTAATTGA 118 TCAATTACCTTTTCAATACAATAC 152 25 TGAAGATTTGAAGTAATTGAAAAG 119 CTTTTCAATTACTTCAAATCTTCA 153 26 TGAAAAAGTGTAGATTTTGAGTAA 120 TTACTCAAAATCTACACTTTTTCA 154 27 AAAGTTGAGTATTGATTTGAAAAG 121 CTTTTCAAATCAATACTCAACTTT 155 28 TTGATAATGTTTGTTTGTTTGTAG 122 CTACAAACAAACAAACATTATCAA 156 29 AAAGAAAGGATTTGTAGTAAGATT 123 AATCTTACTACAAATCCTTTCTTT 157 30 GTAAAAAGAAAGGTATAAAGGTAA 124 TTACCTTTATACCTTTCTTTTTAC 158 31 GATTAAAGTTGATTGAAAAGTGAA 125 TTCACTTTTCAATCAACTTTAATC 159 32 GTAGATTAGTTTGAAGTGAATAAT 126 ATTATTCACTTCAAACTAATCTAC 160 33 AAAGGATTAAAGTGAAGTAATTGA 127 TCAATTACTTCACTTTAATCCTTT 161 34 TGAAATGAATGAATGATGAAATTG 128 CAATTTCATCATTCATTCATTTCA 162
TABLE-US-00003 TABLE 3 Universal PCR primers SEQ SEQ ID ID Forward (5'.fwdarw.3') NO. Backward (5'.fwdarw.3') NO. P1: 5'-ACTTCGTCAGTAACGGAC-3' 163 P3: 5'-GTCTGCCTATAGTGAGTC-3' 165 P2: 5'-GAGTCGAGGTCATATCGT-3' 164
Example 1: Preparation of Biomolecule
Biomolecules were extracted from cells or a tissue sample containing cells, with the aid of an AllPrep DNA/RNA/Protein Mini kit (Qiagen. USA). In this Example, cartilage tissue (Promocell, Germany) was used as the source of the biomolecules. The cartilage tissue was lysed and homogenized in a buffer provided by the manufacturer, and was then passed through a column that was designed to allow selective binding of genomic DNA. The column was washed, and DNA was eluted from the column by spinning. After the addition of ethanol thereto, the flow-through from the AllPrep DNA spin column was applied to an RNA spin column, in which total RNA was bound to the membrane. The RNA bound to the membrane was eluted by washing. A buffer for protein precipitation was added to the through-flow from the RNA spin column, and the precipitated proteins were pelleted by centrifugation.
Example 2: Preparation of Ligand for Analysis
2-1. Antigen and Aptamer Analysis Ligands
For preparation of a protein-antibody analysis ligand complex to be used in the quantitative analysis of a specific protein in the cartilage tissue, biotinylated antibodies against human IL17 (Catalog No. BAF317) and IL17RA (Catalog No. BAF177) were purchased from R&D Systems, USA.
In addition, for preparation of a protein-aptamer complex to be used in the quantitative analysis of a specific protein in the cartilage tissue was prepared, respective aptamers binding specifically to IL17 (Korean Patent No. 10-1276519-0000) and IL17RA (Chen, L., et al., 2011, Osteoarthritis and Cartilage 19; 711.about.718) were single-stranded nucleic acids with the nucleotide sequences given in Table 4, below. Biotinylated IL17 and IL17RA aptamers were chemically synthesized (Bioneer. Korea).
TABLE-US-00004 TABLE 4 Nucleotide Sequences of IL17 and IL17RA Aptamers Aptamer SEQ ID Name Base Sequence (5'.fwdarw.3') NO. IL17 GGUCUAGCCGGAGGAGUCAGUAAUCGGUAGACC 166 IL17RA ACGCGCTAGGATCAAAGCTGCACTGAAGTG 167
A biotinylated oligonucleotide used as a member of the antibody or aptamer analysis ligand for the quantitative analysis of a protein of interest is represented by the following general formula I: 5'-Biotin-P1-T-P3-3' (I)
wherein,
P1 is a region complementary to a forward primer of a pair of primers carrying a detection signal,
T is a region, complementary to a capture probe, which is designed to serve as a probe in a hybridization reaction, discriminating a target protein, or a single strand nucleic acid representing a target protein, and
P3 is a region complementary to a backward primer of the pair of primers carrying the detection signal.
The biotinylated antibody and the biotinylated aptamer were connected with the biotinylated oligonucleotide through avidin to afford two conjugates, which are termed an antibody analysis ligand and an aptamer analysis ligand, respectively.
2-2. Upstream and Downstream Oligonucleotides
2-2-1. Quantitative Analysis of Nucleic Acid
For use in the quantitative analysis of nucleic acids, an upstream oligonucleotide was designed to have the structure of the following Formula II: 5'-P1-H-3' (II)
wherein,
P1 is a sequence region complementary to a forward primer of a pair of primers carrying a detection signal; and
H is a sequence region complementarily hybridizable with a target nucleic acid.
A downstream oligonucleotide was designed to have the structure of the following Formula III: 5'-H-T-P3-3' (III)
wherein,
H is a sequence region complementary to the target nucleic acid at a site downstream of the 3' end of the upstream oligonucleotide,
T is a region, perfectly complementary to a capture probe, which is designed to serve as a probe in a hybridization reaction, discriminating a target nucleic acid, or a single strand nucleic acid representing a target nucleic acid, and
P3 is a region complementary to a backward primer of the pair of primers carrying the detection signal.
In Formulas II and III, H may be a nucleotide sequence specific for an mRNA for .beta.-actin, IL17, IL17R, etc., and the sequences are listed in Table 1. The sequences available for T are given in Table 2, and for P1 and P3 in Table 3. With reference to these sequences, upstream and downstream oligonucleotides for nucleic acid mutation analysis were chemically synthesized (Bioneer, Korea).
2-2-2. Nucleic Acid Mutation Analysis
For use in the mutation analysis of a target nucleic acid, an upstream oligonucleotide sequence was designed to have the following formula IV: 5'-P2-H-V-3' (IV)
wherein,
P2 is a region to which a forward primer carrying a detection signal complementarily binds,
H is a region complementarily hybridizable with a target nucleic acid, and
V is a region complementarily hybridizable with the mutant sequence of the target nucleic acid. In this context, the upstream oligonucleotide may be composed of two or more different oligonucleotides.
For use in the mutation analysis of a target nucleic acid, a downstream oligonucleotide sequence was designed to have the following formula V: 5'-H-T-P3-3' (V)
wherein,
H is a sequence region complementary to the target nucleic acid at a site downstream of the mutant region of the target nucleic acid,
T is a region, complementary to a capture probe, which is designed to serve as a probe in a hybridization reaction, discriminating a target mutant nucleic acid, or a single strand nucleic acid representing a target mutant nucleic acid, and
P3 is a region complementary to a backward primer.
In Formulas IV and V, H may be a nucleotide sequence specific for SNP of IL17, SNP of IL17RA, methylated IL17, etc., and the sequences are listed in Table 1. Sequences available for T are given in Table 2, and for P1 and P3 in Table 3. With reference to these sequences, upstream and downstream oligonucleotides for nucleic acid mutation analysis were chemically synthesized (Bioneer, Korea).
Example 3: Preparation of Quality Control Single-Stranded Nucleic Acid
Reference materials include five different plant-specific proteins A, B, C, D, and E, obtained from the website http://genomics.msu.edu/plant_specific/ (see Table 5).
TABLE-US-00005 TABLE 5 Plant-Specific Protein Locus Description Accession number A At1g65390.1 defense/immunity protein GO:0003793 B At5g39310.1 cell elongation GO:0009826 C At4g15910.1 Drought-Induced Protein (Di21) GO:0009414 D At1g12860.1 Bhlh Protein GO:0003677 E At4g02530.1 Chloroplast Thylakoid Lumen GO:0009543 Protein
The five selected plant-specific proteins were expressed in E. coli expression systems, and used in the standard SELEX method (Ellington, A. D. and J. W. Szostak. 1990. In vitro selection of RNA molecules that bind specific ligands. Nature 346: 818-822; Gold, L., P. Allen, J. Binkley, D. Brown, D. Schneider, S. R. Eddy, C. Tuerk, L. Green, S. Macdougal, and D. Tasset 1993. RNA: the shape of things to come, pp. 497-510. In: R. F. Gestelend and J. F. Atkins (eds.). The RNA World, Cold Spring Harbor Press, Cold Spring Harbor, N.Y.) to acquire single-stranded nucleic acids capable of specifically binding to the reference materials.
The single-stranded nucleic acids were designated as quality control single-stranded nucleic acids. After being biotinylated, the quality control single-stranded nucleic acid was conjugated with a biotinylated oligonucleotide represented by Formula I via avidin to afford a structure for the analysis of the reference materials. For the purpose of convenience, the structure was termed a "quality control ligand".
Example 4: Preparation of Nucleic Acid Sample
4-1. Protein
4-1-1. Antibody Analysis Ligand
Each well of microtiter plates to which the protein solution prepared from the cartilage tissue was added in an amount of 100 .mu.l was coated at 4.degree. C. overnight or at 37.degree. C. for 2 hrs with a 0.05M carbonate buffer (pH 9.6).
After incubation for 30 min at room temperature with avidin (7.2 .mu.g/ml), 100 .mu.l of a biotinylated antibody (10 .mu.g/ml) was mixed with the biotinylated oligonucleotide to produce an antibody-avidin-oligonucleotide, termed an antibody analysis ligand.
The wells were blocked with phosphate buffered saline (180 .mu.l/well) containing 3% skimmed milk, 0.1 mM ethylene diamine tetraacetate, and 0.02% sodium azide, and washed twice with phosphate buffered saline-Tween 20, followed by incubation at 37.degree. C. for 2 hrs with 100 .mu.l of the antibody analysis ligand (10 .mu.g/ml). The wells were washed five times for 5 min with Tween-PBS, and then four times for 5 min with distilled water to remove non-specifically bound, biotinylated oligonucleotides. The content in each well was transferred to a 500 .mu.l Eppendorf tube and used as a nucleic acid sample.
4-1-2. Aptamer Analysis Ligand
The biotinylated IL17 aptamer (10 .mu.g/ml) 100 .mu.l and the biotinylated IL17RA aptamer (10 .mu.g/ml) 100 .mu.l, prepared as described above, were each incubated at room temperature for 30 min with avidin (7.2 .mu.g/ml) and then with the biotinylated oligonucleotide (10 .mu.g/ml) to give an aptamer-avidin-oligonucleotide, termed an aptamer analysis ligand. The proteins separated from the cartilage tissue were immobilized onto a nitrocellulose disk, which was then treated for 30 min with the IL17 and IL17RA aptamer analysis ligands in a SELEX buffer to form a protein-aptamer analysis ligand complex. It was purified by washing to remove non-specifically bound aptamers. The pure protein-aptamer analysis ligand complex was used as a nucleic acid sample.
4-2. RNA
For quantitative analysis and mutation analysis of a particular RNA, total RNA 10 ng, dT.sub.20 primer (100 .mu.moles/20 .mu.l reaction buffer, Bioneer, Korea), MMLV reverse transcriptase (200 U/20 .mu.l reaction buffer, Bioneer, Korea), 10.times. Reaction buffer 2 .mu.l, RNasin (15 U/20 .mu.l reaction buffer, Promega) and betaine (500 mM/20 .mu.l reaction buffer, Sigma) were mixed to give a reverse transcription solution. Using this solution, reverse transcription was started under a single temperature condition of 42.degree. C. or 52.degree. C. for 10, 20, 40, or 60 min, followed by 2, 4, 8, or 12 cycles of 37.degree. C. for 2 min and 50.degree. C. for 3 min, or 2, 4, 8, or 12 cycles of 37.degree. C. for 1 min, 47.degree. C. for 3 min, and 55.degree. C. for 1 min. The cDNA thus obtained was used as a nucleic acid sample.
4-3. DNA Mutation
A particular DNA was analyzed for mutation. To this end, genomic DNA was extracted from the cartilage tissue using a kit, and used as a nucleic acid sample for the analysis of DNA mutation after determining its concentration using NanoDrop.
4-4. Methylation
A certain DNA was analyzed for methylation. To this end, genomic DNA was extracted from the cartilage tissue using a kit, and measured for concentration using NanoDrop. Then, about 1.about.2 .mu.g of the extracted DNA was mixed with 0.5 N NaOH to a concentration of 16 mM, followed by denaturing the DNA into a single strand form at 37.degree. for 15 min. Subsequently, the denatured DNA was incubated at 56.degree. C. for 16 hrs in the presence of 3.5M sodium bisulfite and 0.01 M hydroquinone. The bisulfite-modified DNA was precipitated with ethanol and eluted at 50.degree. C. in deionized water. NaOH was added to a concentration of 0.1 M and incubated at room temperature for 15 min to desulfonate DNA at cytosine residues. After precipitation in ethanol, the DNA pellet thus obtained was dissolved at 30.degree. C. in deionized water before storage at -20.degree. C. The DNA was used as a nucleic acid sample for the analysis of methylation.
Example 5: Preparation of Nucleic Acid Sample for Amplification
From the target nucleic acid-containing samples of cartilage tissue origin, including the RNA sample, the genomic DNA sample, and the protein-analysis ligand complex, nucleic acids for use in amplification reactions were prepared as follows.
The protein-analysis ligand complex having the oligonucleotide prepared for quantitative analysis of the protein in Example 4 was itself used as a nucleic acid sample for amplification.
From the nucleic acid samples of Example 4, including the cDNA reversely transcribed from the RNA extract, the genomic DNA for DNA mutation analysis, and the bisulfate-modified DNA that reflected the information of methylation on genomic DNA, nucleic acid samples for amplification were prepared as follows.
A mixture of the nucleic acid samples was hybridized with the upstream and the downstream oligonucleotide to make a partially double-stranded nucleic acid which was then converted into a fully double-stranded nucleic acid by extension from the upstream oligonucleotide to the downstream oligonucleotide. The double-stranded DNA was used as a sample for amplification.
The following 10-ml reaction solution was subjected to PCR, which started by denaturing at 95.degree. C. for 5 min, and was then performed with 10 cycles of 95.degree. C. for 1 min, 70.degree. C. for 1 min, 68.degree. C. for 1 min, 66.degree. C. for 1 min, and 64.degree. C. for 3 min.
The 10-ml reaction solution contained 20 mM TrisHCl (pH 7.6), 25 mM sodium acetate, 10 mM magnesium acetate, 1 mM dithiothreitol, 1 mM NAD+, 0.1% Triton X-100, the upstream and the downstream oligonucleotide prepared in Example 2 (500 pM each), 1 unit Taq DNA ligase (New England Biolabs, MA, USA), and 100 .mu.g of the mixture of the nucleic acid samples.
Example 6: Amplification
In a PCR apparatus, amplification started by denaturing at 95.degree. C. for 3 min and then proceeded with 42 cycles of 95.degree. C. for 10 sec, 56.degree. C. for 10 sec, and 72.degree. C. for 20 sec. The 25-ml reaction solution used in the amplification contained 10 mM TrisHCl (pH 8.6), 50 mM KCl, 2.5 mM MgCl2, 5% (V/V) glycerin, 1 U Taq DNA polymerase, 1 .mu.mol forward signal primers (P1 alone for wild-type target DNA, P1 and P2 for mutant DNA), 20 .mu.mol reverse signal primer (P3), and 2 ml of the reaction solution of Example 5.
Primers for analyzing a wild-type target nucleic acid were composed of a forward primer, which is complementary to the P1 region of the analysis ligand or upstream oligonucleotide and which is labeled with Cy3, generating a detection signal, and a backward primer complementary to the P3 region.
For analyzing a mutant target nucleic acid, at least two forward primers, composed of a Cy3-labeled primer complementary to the P1 region and a Cy5-labeled primer complementary to the P2 region, were used while the backward primer was a universal primer complementary to the P3 region. The nucleotide sequences of these PCR primers are given in Table 2.
Example 7: Array Construction
For the capture probes for discriminating target nucleic acids, oligomers having nucleotide sequences corresponding to target nucleic acids were suggested in Table 2. After being chemically synthesized (Bioneer, Korea), the capture probes were patterned on an array.
The upstream and downstream oligonucleotides of Table 1 were designed to be perfectly complementary to a specific region of the target nucleic acid which the capture probe of Table 2 represents.
Briefly, the No. 1 capture probe of Table 2 represents .beta.-actin mRNA, which is perfectly complementary to the No. 1 upstream and downstream oligonucleotides of Table 1, while the No. 3 capture probe of Table 2 represents IL17 mRNA that is perfectly complementary to the No. 3 upstream and downstream oligonucleotides of Table 1.
On an UltraGAPS.TM. Coated Slide (Corning), which is a slide coated with GAPS (Gamma Amino Propyl Silane), capture single-stranded nucleic acids were immobilized in a predetermined pattern to construct a nucleic acid chip. For the nucleic acid chip construction, a Microarrayer system (GenPak) was employed, in which pins were used to place spots at a center-to-center spacing of 150 .mu.m. Each capture single-stranded nucleic acid was dissolved at a desired concentration in a standard solution. During spotting, a humidity of 70% was maintained within the array. The spotted slides were left for 24-48 hrs in a humidified chamber, and then baked in a UV crosslinker. After the capture single-stranded nucleic acids were immobilized onto the glass slides in a well-known manner, the slides were dried by spinning, and stored in darkness. As described, a slide glass was used as a support in array construction. Here, the support may be coated with amine or aldehyde. For example, the capture probes were arrayed and fixed in regular patterns on an UltraGAPS.TM. Coated Slide (Corning), which is a slide coated with GAPS (Gamma Amino Propyl Silane), to construct an array.
The array construction may be achieved using, for example, a Microarrayer system. Each capture probe was dissolved at a predetermined concentration in a buffer and spotted while the array was maintained a humidity of 70 to 80%.
After being maintained in a humidified chamber, the spotted slides were baked in a UV crosslinker.
As described, the array according to the present disclosure is constructed by immobilizing the captured single-stranded nucleic acids onto glass slides in a well-known manner, and drying the slides through centrifugation. The array may be stored in a dark condition before use.
Example 8: Array Hybridization and Analysis
Target probes, each carrying the base sequence of a specific region of a target nucleic acid, and a base sequence perfectly complementary to a capture probe, were applied to the array, hybridized at 60.degree. C. for 4.about.12 hrs with the capture probes, and washed at 42.degree. C. with 0.1.times.SSC buffer.
The hybridization buffer contained 1 M sodium chloride, 0.3 M sodium citrate, 0.5% SDS or 100 .mu.g/ml salmon sperm DNA, and 0.2% bovine serum albumin or single-stranded nucleic acid. Following hybridization, the array was stepwise washed with wash buffers.
The wash buffers contained compositions of 1.times.SSC+0.2% SDS, 1.times.SSC+0.2% SDS, 0.5.times.SSC+0.2% SDS, and 0.01.times.SSC+0.2% SDS, and were used in that order at 42.degree. C. for 30 min for sequential wash steps.
Example 9: Scanning and Analysis of Spot on DNA Chip
Following washing in Example 6, the glass slides were dried by centrifugation, and scanned using a laser scanner (GenePix4000, Axon) that performs excitation at the 635 nm (Cy5) wavelength. The images thus generated were stored as TIFF (multi-image Tagged Image File Format) files, and analyzed using suitable image analysis software (GenePix Pro 3.0, Axon).
The signal intensity (unit: quanta) at each spot was used, exclusive of a background signal. Here, the background signal means a local background acquired from four spots around a spot of interest. Generally, when at least 90% of pixels in a spot show a higher signal intensity than a background signal+2 standard deviations (S.D.), the spot is included in data analysis; otherwise, it is classified as a bad spot and not included in data analysis.
Signal intensity was normalized against variations according to labeling efficiency using internal standard (IS) intensity (e.g., Normalized Intensity=Probe Intensity/IS intensity). In the case of monolabeling, the signal intensity of Cy5 channels was recorded. When spotting is conducted two or more times, mean values are used. For the signal intensity (S) of target single-stranded nucleic acids, a median value of individual spot pixel intensities (median value of pixel-by-pixel) was used. The signal intensity (S) was normalized against variation in labeling efficiency using internal standard (IS) signals. S'(normalized value)=S (Cy5-reference).times.(Cy5-IS).
As mentioned above, the analysis results for the pixel density can be plotted against the amounts of the sample to determine the correlation therebetween.
As can be seen in FIG. 6, in which an experimental result is shown in accordance with an embodiment of the present disclosure, spot fluorescence intensities on the array allow for the qualitative and quantitative analysis of proteins, mRNAs, DNA mutation and DNA methylation.
FIG. 7 is an array image of capture probes hybridized with target probes that were prepared by forming partial double-stranded nucleic acids with oligonucleotides for analyzing proteins, mRNA and wild-type or mutant DNA carrying IL17 or IL17RA, extending them to give complete double-stranded nucleic acids, and amplifying target genes in the presence of signal primers through PCR, with the double-stranded nucleic acids serving as templates.
In FIG. 8, the fluorescent intensities of spots vary depending on the properties of the double strands formed between the capture probes and the labeled target probes, and are determined by the signals of the labeled target probes in the spots consisting of single capture probes.
Together with the base sequences of the target probes, prepared from PCR amplicons of target nucleic acids of biomolecules, the base sequences of the capture probes affixed on the array determine the stability of the double strands between the target single-stranded nucleic acids and the capture single-stranded nucleic acids. In addition, the amount of the labeled target probes in each spot on the array has an influence on the fluorescent intensity.
Hence, the fluorescent intensities in FIG. 8 represent the amounts of the target probes while the amounts of the labeled target probes account for the levels of the biomolecules corresponding to the target nucleic acids in the biological sample.
When target probes were prepared from target nucleic acids isolated from control and test samples using signal primers labeled with different markers, particularly with Cy3 for the control and Cy5 for the test sample, the color spectra of blue-yellow-red given to the spots appear, reflecting various ratios between the Cy-3-labeled target probes and the Cy-5-labeled target probes, both being hybridized with the capture probes on the chip. The color intensity detected at a specific spot accounts for the profiles of specific biomolecules present in the control and the test sample.
For nucleic acid mutation analysis, the color spectrum of a spot can convey information about the mutation of a specific gene corresponding to the target nucleic acid applied to the spot. An amplicon is produced only when the upstream oligonucleotide is perfectly complementary to the mutant sequence of a predetermined mutant region of the target nucleic acid, and the target probe is generated using it as a template. Therefore, the analysis of color spectra acquired for spots can show the binding intensity at the spots, identifying the mutation of a specific gene in the biological sample. In FIG. 8, for example, spots appear red due to the Cy5 label, indicating the existence of SNPs corresponding to capture probes prepared with the signal primer P2 in the biological sample.
Also, the color spectra can be used to examine whether or not DNA is methylated. In full consideration of the fact that the signal primer P1 for the methylation-specific upstream oligonucleotide and the signal primer P2 for non-methylation-specific upstream oligonucleotide are labeled with Cy3 and Cy5, respectively, the cytosine at position 144 of the IL17 promoter of the sample was observed to be methylated, as the spot for methylated IL17 appears blue.
Example 10: Analysis of Biomolecule Including Extracellular Molecules of E. coli
11-1. Preparation of Oligonucleotide for Analysis of AmpR Gene
Upstream and downstream oligonucleotides for use in analyzing the AmpR gene of pUC19 were synthesized according to Formulas IV and V, respectively (Bioneer, Korea).
TABLE-US-00006 TABLE 6 Oligonucleotides for Analysis of Amp.sup.R Gene SEQ Oligo- ID nucleotide Base Sequence (5'.fwdarw.3') NO. Upstream 5-GCAGCACTGCATAATTCTCTTACTGTCATG-3 168 Oligo- nucleotide (wild-type) Upstream 5-GCAGCACTGCATAATTCTCTTACTGTCATA-3 169 Oligo- nucleotide (mutant) Downstream 5-CCATCCGTAAGATGCTTTTCTGTGACTGGT-3 170 Oligo- nucleotide
10-2. Construction of Analysis Ligand for Cell Surface Molecule
The single-stranded nucleic acids binding to E. coli (Korean Patent No. 10-0730359), proposed by the present inventors, have the base sequences listed in Table 7. Based on these sequences, biotinylated, single-stranded nucleic acid ligands and biotinylated oligonucleotides were designed according to Formula I, with reference to sequences of Tables 1 and 2 (Bioneer, Korea).
TABLE-US-00007 TABLE 7 Base Sequences of Aptamers Binding to Cell Surface Molecules of E. coli. SEQ ID # Base Sequence (5'.fwdarw.3') NO. 1 cgcaguuugc gcgcguucca aguucucuca ucacggaaua 171 2 acacugcgug cuuacgacuu cuggucccau cauucggcua 172 3 aguucgauga gggugacacc gccaggagug uuugcuagac 173 4 acccgucgau aaugacugaa cuuccucuau cuuaaagggg 174 5 ggguaagggg auguuucugg gauucaagcg ccugauucug 175 6 ucuguauuug uacgcaccga agauaagaga gggaguggau 176 7 caugggcggg ccgcggucua uucgggauua uugcggaucc 177 8 ucagggugug aaguucuucc gcgcuagugg cuuguauguu 178 8 gucgggguug caaggcgucg uagcguguau uugugauggu 179 10 gcguaugggc gggucauuag gacaauuuaa ccacucgcga 180 11 auugucugug ugacuagucg gucuagugug ggggagaaga 181 12 uuaccacuga guuaauuugu acggucugcg guguacuuua 182 13 gcuaucaaua uuauagaggc ggucggggua gugucaucgu 183 14 uaggagagcg ggagcugaga acuuagaggc gccgauacac 184 15 gacguauuac aguuaaguug gcgccauucg auuucugauc 185 16 auaccagcuu auucaauuau accagcuuau ucaauuuugu 186 17 ccguaagucc ggucuuccuu gcugagucgc ccuuucaggu 187 18 uuggugggga gggccaguua ggucuaauuu ccgacgcgca 188
To 100 .mu.l of each of the biotinylated E. coli aptamers (10 .mu.g/.mu.l), avidin (7.2 .mu.g/.mu.l) was added. After incubation at room temperature for 30 min, the biotinylated oligonucleotides (10 .mu.g/.mu.l) were reacted with the aptamers and avidin to form aptamer-avidin-oligonucleotide structures, termed aptamer analysis ligands.
10-3. Isolation of Biomolecule from E. coli-Analysis Ligand Complex
E. coli was reacted with the aptamer analysis ligand pool, after which the E. coli-aptamer analysis ligand complexes thus formed were washed and isolated. From the E. coli-analysis ligand complex, total nucleic acids including plasmid pUC19 and single-stranded nucleic acids bound to the surface of E. coli were extracted. The total nucleic acids were used in the same manner as in Example 5 to prepare target DNA. The target DNA was labeled and amplified in the same manner as in Example 6, followed by conducting analysis on an array constructed in Example 7. Profiles of E. coli surface molecules were obtained, and the AmpR gene was identified.
INDUSTRIAL APPLICABILITY
As described above, biomolecules from biological samples can be assayed to determine their biological significance and can be detected at high fluorescent sensitivity through a single assay using the oligonucleotides of the present disclosure. Thus, the method according to the present disclosure allows for the analysis of various biomolecules in a single assay, with the consequent determination of difference in phenotype change, sensitivity to disease, responsiveness to drugs, etc. between persons, whereby a great contribution can be made to overcoming human disease. In addition, the method can find economically advantageous applications in the medical industry.
SEQUENCE LISTINGS
1
188125DNAArtificial SequenceUpstream Oligonucleotide 1gggcgacgag gcccagagca agaga 25225DNAArtificial SequenceUpstream Oligonucleotide 2cagatcatgt ttgagacctt caaca 25325DNAArtificial SequenceUpstream Oligonucleotide 3ccctcaggaa ccctcatcct tcaaa 25425DNAArtificial SequenceUpstream Oligonucleotide 4taaccggaat accaatacca atccc 25527DNAArtificial SequenceUpstream Oligonucleotide 5gatggcctgc ctgcggctga cctgatt 27625DNAArtificial SequenceUpstream Oligonucleotide 6gagtacagga taccacaatg cactc 25727DNAArtificial SequenceUpstream Oligonucleotide 7aaactcatcg tgaagtcaaa cattcaa 27827DNAArtificial SequenceUpstream Oligonucleotide 8aaactcatcg tgaagtcaaa cattcac 27927DNAArtificial SequenceUpstream Oligonucleotide 9ggaatactgt atatgtagga taggaaa 271027DNAArtificial SequenceUpstream Oligonucleotide 10ggaatactgt atatgtagga taggaag 271127DNAArtificial SequenceUpstream Oligonucleotide 11tgtcacccct gaacccactg cgacaca 271227DNAArtificial SequenceUpstream Oligonucleotide 12tgtcacccct gaacccactg cgacacg 271327DNAArtificial SequenceUpstream Oligonucleotide 13cccccctgcc ccccttttct ccatctc 271427DNAArtificial SequenceUpstream Oligonucleotide 14cccccctgcc ccccttttct ccatctt 271527DNAArtificial SequenceUpstream Oligonucleotide 15tgtattcctg agaaggaact attctca 271627DNAArtificial SequenceUpstream Oligonucleotide 16tgtattcctg agaaggaact attctcg 271727DNAArtificial SequenceUpstream Oligonucleotide 17tcattggtgg tgagtcctgc actaaca 271827DNAArtificial SequenceUpstream Oligonucleotide 18tcattggtgg tgagtcctgc actaacg 271927DNAArtificial SequenceUpstream Oligonucleotide 19aacacctggc caaggaatct gtgagga 272027DNAArtificial SequenceUpstream Oligonucleotide 20aacacctggc caaggaatct gtgaggg 272127DNAArtificial SequenceUpstream Oligonucleotide 21caaatgtatt ttgatcattt gacttca 272227DNAArtificial SequenceUpstream Oligonucleotide 22caaatgtatt ttgatcattt gacttct 272327DNAArtificial SequenceUpstream Oligonucleotide 23tgggctgaac ttttctcata cttaaaa 272427DNAArtificial SequenceUpstream Oligonucleotide 24tgggctgaac ttttctcata cttaaag 272527DNAArtificial SequenceUpstream Oligonucleotide 25ctgcccttcc cattttcctt cagaaga 272627DNAArtificial SequenceUpstream Oligonucleotide 26ctgcccttcc cattttcctt cagaagg 272727DNAArtificial SequenceUpstream Oligonucleotide 27ctgaactttt ctcatactta aagttca 272827DNAArtificial SequenceUpstream Oligonucleotide 28ctgaactttt ctcatactta aagttcg 272927DNAArtificial SequenceUpstream Oligonucleotide 29gatggcctgc ctgcggctga cctgatc 273027DNAArtificial SequenceUpstream Oligonucleotide 30gatggcctgc ctgcggctga cctgatt 273127DNAArtificial SequenceUpstream Oligonucleotide 31tggatcatct actcagccga ccacccc 273227DNAArtificial SequenceUpstream Oligonucleotide 32tggatcatct actcagccga ccaccck 273327DNAArtificial SequenceUpstream Oligonucleotide 33ctgtcactaa ggagttaacc cccgcaa 273427DNAArtificial SequenceUpstream Oligonucleotide 34ctgtcactaa ggagttaacc cccgcag 273527DNAArtificial SequenceUpstream Oligonucleotide 35catagtagat agcaatctat tcaacca 273627DNAArtificial SequenceUpstream Oligonucleotide 36catagtagat agcaatctat tcaaccg 273727DNAArtificial SequenceUpstream Oligonucleotide 37gcaagttagg attagagggc tgggaca 273827DNAArtificial SequenceUpstream Oligonucleotide 38gcaagttagg attagagggc tgggacg 273927DNAArtificial SequenceUpstream Oligonucleotide 39tgggaagtaa cgactctctt aggtgca 274027DNAArtificial SequenceUpstream Oligonucleotide 40tgggaagtaa cgactctctt aggtgcg 274127DNAArtificial SequenceUpstream Oligonucleotide 41gcatgggagg acctatggga ggttcca 274227DNAArtificial SequenceUpstream Oligonucleotide 42gcatgggagg acctatggga ggttccg 274327DNAArtificial SequenceUpstream Oligonucleotide 43atgctatttt ccctttttcc tctgttc 274427DNAArtificial SequenceUpstream Oligonucleotide 44atgctatttt ccctttttcc tctgttt 274527DNAArtificial SequenceUpstream Oligonucleotide 45caccccctct acgtggacgt ggtccta 274627DNAArtificial SequenceUpstream Oligonucleotide 46caccccctct acgtggacgt ggtcctg 274727DNAArtificial SequenceUpstream Oligonucleotide 47acgctttccc caaccacaat ccttcac 274827DNAArtificial SequenceUpstream Oligonucleotide 48acgctttccc caaccacaat ccttcag 274927DNAArtificial SequenceUpstream Oligonucleotide 49tcagcggtgg ggggatcagg tcagcca 275027DNAArtificial SequenceUpstream Oligonucleotide 50tcagcggtgg ggggatcagg tcagccg 275127DNAArtificial SequenceUpstream Oligonucleotide 51tggtcggctg agtagatgat ccagacc 275227DNAArtificial SequenceUpstream Oligonucleotide 52tggtcggctg agtagatgat ccagact 275327DNAArtificial SequenceUpstream Oligonucleotide 53tggtcggctg agtagatgat ccagacc 275427DNAArtificial SequenceUpstream Oligonucleotide 54tggtcggctg agtagatgat ccagact 275527DNAArtificial SequenceUpstream Oligonucleotide 55gttctgaggg gtgattaggg aggagac 275627DNAArtificial SequenceUpstream Oligonucleotide 56gttctgaggg gtgattaggg aggagag 275718RNAArtificial SequenceAptamer 57ggucuagccg gaggaguc 185815DNAArtificial SequenceUpstream Oligonucleotide 58acgcgctagg atcaa 155931DNAArtificial SequenceUpstream Oligonucleotide 59tcaaatcaat tttaacatta tctacaacaa g 316031DNAArtificial SequenceUpstream Oligonucleotide 60tcaaatcaat tttaacatta tctacaacaa a 316125DNAArtificial SequenceDownstream Oligonucleotide 61ggcatcctca ccctgaagta cccca 256225DNAArtificial SequenceDownstream Oligonucleotide 62ccccagccat gtacgttgct atcca 256325DNAArtificial SequenceDownstream Oligonucleotide 63gacagcctca tttcggacta aactc 256425DNAArtificial SequenceDownstream Oligonucleotide 64aaaaggtcct cagattacta caacc 256525DNAArtificial SequenceDownstream Oligonucleotide 65ccttttgggc tcagtctctc caata 256625DNAArtificial SequenceDownstream Oligonucleotide 66ttcctgcgta gagcacatgt tccca 256725DNAArtificial SequenceDownstream Oligonucleotide 67attggaagaa agagctatag aaaat 256825DNAArtificial SequenceDownstream Oligonucleotide 68tgaaagcttt ggtaggtatt taagt 256925DNAArtificial SequenceDownstream Oligonucleotide 69ccacgtaagt gaccacagaa ggaga 257025DNAArtificial SequenceDownstream Oligonucleotide 70catcaccttt gtccagtctc tatcc 257125DNAArtificial SequenceDownstream Oligonucleotide 71aggacctgag tccaagttca tctta 257225DNAArtificial SequenceDownstream Oligonucleotide 72tgcgatgctc ttgctgattt ggacc 257325DNAArtificial SequenceDownstream Oligonucleotide 73aaagaaagat caaatggaaa atcaa 257425DNAArtificial SequenceDownstream Oligonucleotide 74tacaaataag tctctgttct gtgga 257525DNAArtificial SequenceDownstream Oligonucleotide 75ttcgttctgc cccatcagct ccttt 257625DNAArtificial SequenceDownstream Oligonucleotide 76agagattctt ctatgacctc attgg 257725DNAArtificial SequenceDownstream Oligonucleotide 77ttctgcccca tcagctcctt tctgg 257825DNAArtificial SequenceDownstream Oligonucleotide 78cccccaccgc tgaagcccag gaagg 257925DNAArtificial SequenceDownstream Oligonucleotide 79ctctacgtgg acgtggtcct gaaat 258025DNAArtificial SequenceDownstream Oligonucleotide 80agcagttttt tcatcacatc tctga 258125DNAArtificial SequenceDownstream Oligonucleotide 81tttctagttt gatggacatt tagat 258225DNAArtificial SequenceDownstream Oligonucleotide 82tttagcccca cccctttacc catca 258325DNAArtificial SequenceDownstream Oligonucleotide 83gctgggacac agtctcacag accag 258425DNAArtificial SequenceDownstream Oligonucleotide 84ataacattca gtagcatctc ggcca 258525DNAArtificial SequenceDownstream Oligonucleotide 85tcattgcaga accaattccg ggtaa 258625DNAArtificial SequenceDownstream Oligonucleotide 86aaattcgccc agttcctgct caccg 258725DNAArtificial SequenceDownstream Oligonucleotide 87ctcaggcatc tcctcgggga tcccc 258825DNAArtificial SequenceDownstream Oligonucleotide 88caggcaggcc atctaaggaa acaag 258925DNAArtificial SequenceDownstream Oligonucleotide 89ttcctgggct tcagcggtgg gggga 259025DNAArtificial SequenceDownstream Oligonucleotide 90ttcctgggct tcagcggtgg gggga 259125DNAArtificial SequenceDownstream Oligonucleotide 91tttagtttaa cttggagtcc ttcag 259215RNAArtificial SequenceAptamer 92aguaaucggu agacc 159315DNAArtificial SequenceDownstream Oligonucleotide 93agctgcactg aagtg 159430DNAArtificial SequenceDownstream Oligonucleotide 94gtcatacttg tgggctggag accaaaagcc 309524DNAArtificial SequenceCapture probe 95gatttgtatt gattgagatt aaag 249624DNAArtificial SequenceCapture probe 96tgattgtagt atgtattgat aaag 249724DNAArtificial SequenceCapture probe 97gattgtaaga tttgataaag tgta 249824DNAArtificial SequenceCapture probe 98gatttgaaga ttattggtaa tgta 249924DNAArtificial SequenceCapture probe 99gattgattat tgtgatttga attg 2410024DNAArtificial SequenceCapture probe 100gatttgattg taaaagattg ttga 2410124DNAArtificial SequenceCapture probe 101attggtaaat tggtaaatga attg 2410224DNAArtificial SequenceCapture probe 102gtaagtaatg aatgtaaaag gatt 2410324DNAArtificial SequenceCapture probe 103gtaagatgtt gatatagaag atta 2410424DNAArtificial SequenceCapture probe 104tgtagatttg tatgtatgta tgat 2410524DNAArtificial SequenceCapture probe 105gattaaagtg attgatgatt tgta 2410624DNAArtificial SequenceCapture probe 106aaagaaagaa agaaagaaag tgta 2410724DNAArtificial SequenceCapture probe 107ttagtgaaga agtatagttt attg 2410824DNAArtificial SequenceCapture probe 108aaagtaagtt aagatgtata gtag 2410924DNAArtificial SequenceCapture probe 109tgaattgatg aatgaatgaa gtat 2411024DNAArtificial SequenceCapture probe 110tgatgatttg aatgaagatt gatt 2411124DNAArtificial SequenceCapture probe 111tgataaagtg ataaaggatt aaag 2411224DNAArtificial SequenceCapture probe 112tgatttgagt atttgagatt ttga 2411324DNAArtificial SequenceCapture probe 113gtatttgagt aagtaattga ttga 2411424DNAArtificial SequenceCapture probe 114gattgtattg aagtattgta aaag 2411524DNAArtificial SequenceCapture probe 115tgatttgaga ttaaagaaag gatt 2411624DNAArtificial SequenceCapture probe 116tgattgaatt gagtaaaaag gatt 2411724DNAArtificial SequenceCapture probe 117aaagttgaga tttgaatgat tgaa 2411824DNAArtificial SequenceCapture probe 118gtattgtatt gaaaaggtaa ttga 2411924DNAArtificial SequenceCapture probe 119tgaagatttg aagtaattga aaag 2412024DNAArtificial SequenceCapture probe 120tgaaaaagtg tagattttga gtaa 2412124DNAArtificial SequenceCapture probe 121aaagttgagt attgatttga aaag 2412224DNAArtificial SequenceCapture probe 122ttgataatgt ttgtttgttt gtag 2412324DNAArtificial SequenceCapture probe 123aaagaaagga tttgtagtaa gatt 2412424DNAArtificial SequenceCapture probe 124gtaaaaagaa aggtataaag gtaa 2412524DNAArtificial SequenceCapture probe 125gattaaagtt gattgaaaag tgaa 2412624DNAArtificial SequenceCapture probe 126gtagattagt ttgaagtgaa taat 2412724DNAArtificial SequenceCapture probe 127aaaggattaa agtgaagtaa ttga 2412824DNAArtificial SequenceCapture probe 128tgaaatgaat gaatgatgaa attg 2412924DNAArtificial SequenceComplementary sequence of Capture probe 129ctttaatctc aatcaataca aatc 2413024DNAArtificial SequenceComplementary sequence of Capture probe 130ctttatcaat acatactaca atca 2413124DNAArtificial SequenceComplementary sequence of Capture probe 131tacactttat caaatcttac aatc 2413224DNAArtificial SequenceComplementary sequence of Capture probe 132tacattacca ataatcttca aatc 2413324DNAArtificial
SequenceComplementary sequence of Capture probe 133caattcaaat cacaataatc aatc 2413424DNAArtificial SequenceComplementary sequence of Capture probe 134tcaacaatct tttacaatca aatc 2413524DNAArtificial SequenceComplementary sequence of Capture probe 135caattcattt accaatttac caat 2413624DNAArtificial SequenceComplementary sequence of Capture probe 136aatcctttta cattcattac ttac 2413724DNAArtificial SequenceComplementary sequence of Capture probe 137taatcttcta tatcaacatc ttac 2413824DNAArtificial SequenceComplementary sequence of Capture probe 138atcatacata catacaaatc taca 2413924DNAArtificial SequenceComplementary sequence of Capture probe 139tacaaatcat catcactttt aatc 2414024DNAArtificial SequenceComplementary sequence of Capture probe 140tacactttct ttctttcttt cttt 2414124DNAArtificial SequenceComplementary sequence of Capture probe 141caataaacta tacttcttca ctaa 2414224DNAArtificial SequenceComplementary sequence of Capture probe 142ctactataca tcttactata cttt 2414324DNAArtificial SequenceComplementary sequence of Capture probe 143atacttcatt cattcatcaa ttca 2414424DNAArtificial SequenceComplementary sequence of Capture probe 144aatcaatctt cattcaaatc atca 2414524DNAArtificial SequenceComplementary sequence of Capture probe 145ctttaatcct ttatcacttt atca 2414624DNAArtificial SequenceComplementary sequence of Capture probe 146tcaaaatctc aaatactcaa atca 2414724DNAArtificial SequenceComplementary sequence of Capture probe 147tcaatcaatt acttactcaa atag 2414824DNAArtificial SequenceComplementary sequence of Capture probe 148cttttacaat acttcaatac aatc 2414924DNAArtificial SequenceComplementary sequence of Capture probe 149aatcctttct ttaatctcaa atca 2415024DNAArtificial SequenceComplementary sequence of Capture probe 150aatccttttt actcaattca atca 2415124DNAArtificial SequenceComplementary sequence of Capture probe 151ttcaatcatt caaatctcaa cttt 2415224DNAArtificial SequenceComplementary sequence of Capture probe 152tcaattacct tttcaataca atac 2415324DNAArtificial SequenceComplementary sequence of Capture probe 153cttttcaatt acttcaaatc ttca 2415424DNAArtificial SequenceComplementary sequence of Capture probe 154ttactcaaaa tctacacttt ttca 2415524DNAArtificial SequenceComplementary sequence of Capture probe 155cttttcaaat caatactcaa cttt 2415624DNAArtificial SequenceComplementary sequence of Capture probe 156ctacaaacaa acaaacatta tcaa 2415724DNAArtificial SequenceComplementary sequence of Capture probe 157aatcttacta caaatccttt cttt 2415824DNAArtificial SequenceComplementary sequence of Capture probe 158ttacctttat acctttcttt ttac 2415924DNAArtificial SequenceComplementary sequence of Capture probe 159ttcacttttc aatcaacttt aatc 2416024DNAArtificial SequenceComplementary sequence of Capture probe 160attattcact tcaaactaat ctac 2416124DNAArtificial SequenceComplementary sequence of Capture probe 161tcaattactt cactttaatc cttt 2416224DNAArtificial SequenceComplementary sequence of Capture probe 162caatttcatc attcattcat ttca 2416318DNAArtificial SequencePrimer 163acttcgtcag taacggac 1816418DNAArtificial SequencePrimer 164gagtcgaggt catatcgt 1816518DNAArtificial SequencePrimer 165gtctgcctat agtgagtc 1816633RNAArtificial SequenceAptamer 166ggucuagccg gaggagucag uaaucgguag acc 3316730DNAArtificial SequenceAptamer 167acgcgctagg atcaaagctg cactgaagtg 3016830DNAArtificial SequenceUpstream Oligonucleotide 168gcagcactgc ataattctct tactgtcatg 3016930DNAArtificial SequenceUpstream Oligonucleotide 169gcagcactgc ataattctct tactgtcata 3017030DNAArtificial SequenceDownstream Oligonucleotide 170ccatccgtaa gatgcttttc tgtgactggt 3017140RNAArtificial SequenceAptamer 171cgcaguuugc gcgcguucca aguucucuca ucacggaaua 4017240RNAArtificial SequenceAptamer 172acacugcgug cuuacgacuu cuggucccau cauucggcua 4017340RNAArtificial SequenceAptamer 173aguucgauga gggugacacc gccaggagug uuugcuagac 4017440RNAArtificial SequenceAptamer 174acccgucgau aaugacugaa cuuccucuau cuuaaagggg 4017540RNAArtificial SequenceAptamer 175ggguaagggg auguuucugg gauucaagcg ccugauucug 4017640RNAArtificial SequenceAptamer 176ucuguauuug uacgcaccga agauaagaga gggaguggau 4017740RNAArtificial SequenceAptamer 177caugggcggg ccgcggucua uucgggauua uugcggaucc 4017840RNAArtificial SequenceAptamer 178ucagggugug aaguucuucc gcgcuagugg cuuguauguu 4017940RNAArtificial SequenceAptamer 179gucgggguug caaggcgucg uagcguguau uugugauggu 4018040RNAArtificial SequenceAptamer 180gcguaugggc gggucauuag gacaauuuaa ccacucgcga 4018140RNAArtificial SequenceAptamer 181auugucugug ugacuagucg gucuagugug ggggagaaga 4018240RNAArtificial SequenceAptamer 182uuaccacuga guuaauuugu acggucugcg guguacuuua 4018340RNAArtificial SequenceAptamer 183gcuaucaaua uuauagaggc ggucggggua gugucaucgu 4018440RNAArtificial SequenceAptamer 184uaggagagcg ggagcugaga acuuagaggc gccgauacac 4018540RNAArtificial SequenceAptamer 185gacguauuac aguuaaguug gcgccauucg auuucugauc 4018640RNAArtificial SequenceAptamer 186auaccagcuu auucaauuau accagcuuau ucaauuuugu 4018740RNAArtificial SequenceAptamer 187ccguaagucc ggucuuccuu gcugagucgc ccuuucaggu 4018840RNAArtificial SequenceAptamer 188uuggugggga gggccaguua ggucuaauuu ccgacgcgca 40
* * * * *
References
D00001
D00002
D00003
D00004
D00005
D00006
D00007
D00008
P00001
S00001
XML
uspto.report is an independent third-party trademark research tool that is not affiliated, endorsed, or sponsored by the United States Patent and Trademark Office (USPTO) or any other governmental organization. The information provided by uspto.report is based on publicly available data at the time of writing and is intended for informational purposes only.
While we strive to provide accurate and up-to-date information, we do not guarantee the accuracy, completeness, reliability, or suitability of the information displayed on this site. The use of this site is at your own risk. Any reliance you place on such information is therefore strictly at your own risk.
All official trademark data, including owner information, should be verified by visiting the official USPTO website at www.uspto.gov. This site is not intended to replace professional legal advice and should not be used as a substitute for consulting with a legal professional who is knowledgeable about trademark law.