Systems and methods of accuracy mapping in a location tracking system
Gonia , et al.
U.S. patent number 10,267,893 [Application Number 15/439,437] was granted by the patent office on 2019-04-23 for systems and methods of accuracy mapping in a location tracking system. This patent grant is currently assigned to Honeywell International Inc.. The grantee listed for this patent is Honeywell International Inc.. Invention is credited to Patrick Gonia, Soumitri Kolavennu.


View All Diagrams
| United States Patent | 10,267,893 |
| Gonia , et al. | April 23, 2019 |
Systems and methods of accuracy mapping in a location tracking system
Abstract
Systems and method of accuracy mapping in a location tracking system are provided. Methods include identifying a position of at least one location anchor on a site rendering, determining, for a plurality of positions on the site rendering, an estimated error value of location accuracy as a function of position on the site rendering, generating an overlay rendering of the estimated error values of location accuracy for the plurality of position on the site rendering, and the site rendering with the overlay rendering therewith.
| Inventors: | Gonia; Patrick (Maplewood, MN), Kolavennu; Soumitri (Blaine, MN) | ||||||||||
|---|---|---|---|---|---|---|---|---|---|---|---|
| Applicant: |
|
||||||||||
| Assignee: | Honeywell International Inc.
(Morris Plains, NJ) |
||||||||||
| Family ID: | 48609689 | ||||||||||
| Appl. No.: | 15/439,437 | ||||||||||
| Filed: | February 22, 2017 |
Prior Publication Data
| Document Identifier | Publication Date | |
|---|---|---|
| US 20170160377 A1 | Jun 8, 2017 | |
Related U.S. Patent Documents
| Application Number | Filing Date | Patent Number | Issue Date | ||
|---|---|---|---|---|---|
| 13331564 | Dec 20, 2011 | ||||
| Current U.S. Class: | 1/1 |
| Current CPC Class: | G01S 5/0263 (20130101); G01S 5/145 (20130101); H04W 64/00 (20130101); G01S 5/0252 (20130101); G01S 5/14 (20130101); G01S 5/021 (20130101) |
| Current International Class: | G01S 5/02 (20100101); H04W 64/00 (20090101); G01S 5/14 (20060101) |
References Cited [Referenced By]
U.S. Patent Documents
| 4330866 | May 1982 | Malchow |
| 4696027 | September 1987 | Bonta |
| 4831328 | May 1989 | Brust |
| 5390339 | February 1995 | Bruckert |
| 5640677 | June 1997 | Karlsson |
| 5724660 | March 1998 | Kauser et al. |
| 5732328 | March 1998 | Mitra |
| 5877035 | March 1999 | Fujino |
| 5966661 | October 1999 | Bernardin |
| 5983106 | November 1999 | Bernardin |
| 5995836 | November 1999 | Wijk |
| 6006095 | December 1999 | Bernardin |
| 6097953 | August 2000 | Bonta |
| 6173186 | January 2001 | Dalley |
| 6188894 | February 2001 | Clancy |
| 6285883 | September 2001 | Bringby |
| 6445916 | September 2002 | Rahman |
| 6526283 | February 2003 | Jang |
| 6642884 | November 2003 | Bryant et al. |
| 6674403 | January 2004 | Gray et al. |
| 6708036 | March 2004 | Proctor |
| 6762712 | July 2004 | Kim |
| 6799047 | September 2004 | Bahl |
| 6839560 | January 2005 | Bahl |
| 6990428 | January 2006 | Kaiser et al. |
| 7031405 | April 2006 | Touzni et al. |
| 7209743 | April 2007 | Babovic |
| 7286835 | October 2007 | Dietrich |
| 7359718 | April 2008 | Tao et al. |
| 7389111 | June 2008 | Petrus |
| 7444149 | October 2008 | Prehofer |
| 7498986 | March 2009 | Thomas |
| 7570593 | August 2009 | ElBatt et al. |
| 7586891 | September 2009 | Masciulli |
| 7643936 | January 2010 | Boxberger |
| 7746343 | June 2010 | Charaniya et al. |
| 7830250 | November 2010 | Huseth |
| 7835749 | November 2010 | Hart |
| 7848762 | December 2010 | Gordon et al. |
| 7899467 | March 2011 | Feuerstein et al. |
| 7966021 | June 2011 | Dietrich et al. |
| 8032153 | October 2011 | Dupray et al. |
| 8200242 | June 2012 | Dietrich et al. |
| 8229442 | July 2012 | Ji |
| 8295846 | October 2012 | Hwang |
| 8325704 | December 2012 | Lemkin et al. |
| 8509809 | August 2013 | Hirsch |
| 8532676 | September 2013 | El-Sallabi |
| 8750267 | June 2014 | Aggarwal et al. |
| 8768344 | July 2014 | Naguib et al. |
| 8879607 | November 2014 | Skarp |
| 8948742 | February 2015 | Horton |
| 9080889 | July 2015 | Shrum, Jr. |
| 9451404 | September 2016 | Al-Najjar |
| 9467965 | October 2016 | Liu |
| 9632668 | April 2017 | Xie |
| 9654904 | May 2017 | Tredoux |
| RE46501 | August 2017 | Bahl |
| 9921314 | March 2018 | Jakel |
| 10021737 | July 2018 | Edge |
| 10025993 | July 2018 | Seeber |
| 2002/0082012 | June 2002 | Wang |
| 2002/0107037 | August 2002 | Wille |
| 2003/0083819 | May 2003 | Rooney |
| 2003/0128674 | July 2003 | Kong et al. |
| 2003/0222820 | December 2003 | Karr et al. |
| 2004/0022214 | February 2004 | Goren |
| 2004/0059547 | March 2004 | Aftelak |
| 2004/0166877 | August 2004 | Spain, Jr. |
| 2004/0190718 | September 2004 | Dacosta |
| 2004/0195500 | October 2004 | Sachs et al. |
| 2004/0198373 | October 2004 | Ford et al. |
| 2004/0198392 | October 2004 | Harvey et al. |
| 2004/0203904 | October 2004 | Gwon |
| 2004/0236547 | November 2004 | Rappaport et al. |
| 2004/0248589 | December 2004 | Gwon |
| 2005/0075199 | April 2005 | Sheha et al. |
| 2005/0124354 | June 2005 | Durgin |
| 2005/0128139 | June 2005 | Misikangas |
| 2005/0131635 | June 2005 | Myllymaki et al. |
| 2005/0136845 | June 2005 | Masuoka et al. |
| 2005/0136944 | June 2005 | Misikangas et al. |
| 2005/0185615 | August 2005 | Zegelin |
| 2005/0208952 | September 2005 | Dietrich |
| 2005/0246334 | November 2005 | Tao |
| 2005/0266855 | December 2005 | Zeng |
| 2005/0282540 | December 2005 | Motamedi et al. |
| 2005/0285792 | December 2005 | Sugar et al. |
| 2005/0285793 | December 2005 | Sugar et al. |
| 2006/0071853 | April 2006 | Sayers |
| 2006/0205417 | September 2006 | Ju |
| 2006/0211376 | September 2006 | Bhattacharya |
| 2007/0011503 | January 2007 | Kitani |
| 2007/0077941 | April 2007 | Gonia |
| 2007/0099678 | May 2007 | Kim |
| 2007/0132577 | June 2007 | Kolavennu |
| 2007/0155334 | July 2007 | Chang et al. |
| 2007/0230407 | October 2007 | Petrie et al. |
| 2007/0232319 | October 2007 | Bells |
| 2007/0241965 | October 2007 | Kolavennu |
| 2007/0262985 | November 2007 | Watanbe et al. |
| 2008/0051036 | February 2008 | Vaswani et al. |
| 2008/0112699 | May 2008 | Huseth |
| 2008/0166973 | July 2008 | Hart et al. |
| 2008/0180246 | July 2008 | Malik |
| 2008/0192724 | August 2008 | Kondo |
| 2008/0209521 | August 2008 | Malaney |
| 2008/0225799 | September 2008 | Lee et al. |
| 2008/0307025 | December 2008 | Licul |
| 2009/0005063 | January 2009 | Malik et al. |
| 2009/0034793 | February 2009 | Dong |
| 2009/0043495 | February 2009 | Hattori et al. |
| 2009/0081956 | March 2009 | Liechty et al. |
| 2009/0138151 | May 2009 | Smid |
| 2009/0209268 | August 2009 | Ha |
| 2009/0221297 | September 2009 | Wengerter |
| 2009/0232121 | September 2009 | Mark et al. |
| 2010/0017791 | January 2010 | Finkler |
| 2010/0045388 | February 2010 | Xu |
| 2010/0067388 | March 2010 | Kim et al. |
| 2010/0135178 | June 2010 | Aggarwal |
| 2010/0238862 | September 2010 | Davidson |
| 2010/0249549 | September 2010 | Baker, Jr. et al. |
| 2010/0267397 | October 2010 | Shen |
| 2010/0285815 | November 2010 | Treu |
| 2011/0021156 | January 2011 | Kobayashi |
| 2011/0037571 | February 2011 | Johnson, Jr. et al. |
| 2011/0077862 | March 2011 | Huang et al. |
| 2011/0090121 | April 2011 | Thomson |
| 2011/0110242 | May 2011 | Nixon |
| 2011/0156957 | June 2011 | Waite et al. |
| 2011/0161044 | June 2011 | Gonia et al. |
| 2011/0161885 | June 2011 | Gonia et al. |
| 2011/0170576 | July 2011 | Nagano et al. |
| 2011/0176523 | July 2011 | Huang |
| 2011/0221634 | September 2011 | Libby |
| 2011/0294448 | December 2011 | Vauhkonen |
| 2011/0316695 | December 2011 | Li |
| 2012/0093108 | April 2012 | Wengerter |
| 2012/0106362 | May 2012 | Reumerman et al. |
| 2012/0116677 | May 2012 | Higgison et al. |
| 2012/0134280 | May 2012 | Rotvold |
| 2012/0244875 | September 2012 | Cardona |
| 2012/0257558 | October 2012 | Shin |
| 2012/0262327 | October 2012 | Hester et al. |
| 2012/0293372 | November 2012 | Amendolare et al. |
| 2012/0299702 | November 2012 | Edara et al. |
| 2012/0310736 | December 2012 | Vengroff et al. |
| 2012/0319844 | December 2012 | van Doorn |
| 2013/0003572 | January 2013 | Kim |
| 2013/0091472 | April 2013 | Terai |
| 2013/0109413 | May 2013 | Das |
| 2013/0113819 | May 2013 | Gurusamy |
| 2013/0121205 | May 2013 | Backes et al. |
| 2013/0122803 | May 2013 | Forster |
| 2013/0155102 | June 2013 | Gonia |
| 2013/0260780 | October 2013 | Liu et al. |
| 2013/0260798 | October 2013 | Moshfeghi |
| 2013/0329581 | December 2013 | Chen et al. |
| 2013/0331121 | December 2013 | Bandyopadhyay |
| 2013/0342565 | December 2013 | Sridhara |
| 2014/0011518 | January 2014 | Valaee |
| 2014/0066088 | March 2014 | Bhattacharya |
| 2014/0073349 | March 2014 | Schunk |
| 2014/0086369 | March 2014 | Zhang |
| 2014/0087751 | March 2014 | Do |
| 2014/0087755 | March 2014 | Schunk |
| 2014/0120931 | May 2014 | Shin |
| 2014/0125521 | May 2014 | Monnerat |
| 2014/0179340 | June 2014 | Do |
| 2014/0185520 | July 2014 | Gao |
| 2014/0194113 | July 2014 | Ahlstrom |
| 2014/0274119 | September 2014 | Venkatraman |
| 2014/0320348 | October 2014 | Ly Nguyen |
| 2014/0357196 | December 2014 | Mayor |
| 2015/0080019 | March 2015 | Edge |
| 2015/0087239 | March 2015 | Yang |
| 2015/0119068 | April 2015 | Kudekar |
| 2015/0133167 | May 2015 | Edge |
| 2015/0243158 | August 2015 | Bassan-Eskenazi |
| 2015/0309183 | October 2015 | Black |
| 2016/0025498 | January 2016 | Le Grand |
| 2016/0077190 | March 2016 | Julian |
| 2016/0077191 | March 2016 | Julian |
| 2016/0080905 | March 2016 | Julian |
| 2016/0080908 | March 2016 | Julian |
| 2016/0088440 | March 2016 | Palanki |
| 2016/0127069 | May 2016 | Nuss |
| 2016/0150361 | May 2016 | Zhu |
| 2016/0187144 | June 2016 | Modica |
| 2016/0188996 | June 2016 | Modica |
| 2016/0316193 | October 2016 | Gruenwald |
| 2017/0059687 | March 2017 | Dinesh |
| 2017/0074965 | March 2017 | Lee |
| 2017/0090007 | March 2017 | Park |
| 2017/0134899 | May 2017 | Chan |
| 2017/0146636 | May 2017 | Alicot |
| 2017/0160377 | June 2017 | Gonia |
| 2017/0201865 | July 2017 | Cho |
| 2017/0285178 | October 2017 | Platzer |
| 2017/0359697 | December 2017 | Bhatti |
| 2017/0371142 | December 2017 | Anthony |
| 2018/0007654 | January 2018 | Wirola |
| 2018/0063673 | March 2018 | Jang |
| 2018/0139717 | May 2018 | Vered |
| 2018/0227711 | August 2018 | Moshfeghi |
| 2018/0266826 | September 2018 | Wang |
Other References
|
Shi, Hongchi, et al. "Cramer-Rao Bound Analysis of Quantized RSSI Based Localization in Wireless Sensor Networks." Proceedings of the 2005 11th International Conference on Parallel and Distributed Sytems (ICPADS'05), 2005, 5 pages. cited by applicant . Papamanthou, Charalampos et al., "Algorithms for Location Estimation Based on RSSI Sampling", Algosensors 2008, LNCS 5389, 2008, pp. 72-86. cited by applicant . Luo, Xiaowei et al. "Comparative evaluation of Received Signal-Strength Index (RSSI) based indoor localization techniques for construction jobsites." Advanced Engineering Informatics, 2010, 9 pages. cited by applicant . Ni, Lionel M. et al. "LANDMARC: Indoor Location Sensing Using Active RFID." Wireless Networks 10, 2004, pp. 701-710. cited by applicant . Koyuncu, Hakan, et al. "A 2D positioning system using WSNs in indoor environment." International Journal of Electrical & Computer Sciences IJECS-IJENS vol. 11. No. 03, Jun. 2011, 8 pages. cited by applicant . Gansemer, S., et al. "3D WLAN Indoor Positioning in Multi-Storey Buildings." IEE International Workshop on Intelligent Data Acquisition and Advanced Computing Systems: Technology and Applications, Sep. 2009, 4 pages. cited by applicant . Lien, Yao-Nan, "Phantom Positioning Technology for Indoor WLAN." WPMC 2006, San Diego, CA, Sep. 2006, 5 pages. cited by applicant . U.S. Appl. No. 13/331,564, Office Action, dated Sep. 13, 2013, 38 pages. cited by applicant . U.S. Appl. No. 13/331,564, Final Office Action, dated Jan. 17, 2014, 49 pages. cited by applicant . U.S. Appl. No. 13/331,564, Office Action, dated May 21, 2014, 57 pages. cited by applicant . U.S. Appl. No. 13/331,564, Final Office Action, dated Aug. 1, 2014, 62 pages. cited by applicant . U.S. Appl. No. 13/331,564, Office Action, dated Jan. 15, 2015, 69 pages. cited by applicant . U.S. Appl. No. 13/331,564, Examiner's Answer, dated Jun. 3, 2015, 65 pages. cited by applicant . U.S. Appl. No. 13/331,564, Decision on Appeal, dated Dec. 22, 2016, 10 pages. cited by applicant. |
Primary Examiner: Faulk; Devona E
Assistant Examiner: Beard; Charles L
Attorney, Agent or Firm: Wick Phillips Gould & Martin, LLP
Parent Case Text
CROSS REFERENCE TO RELATED APPLICATION
This application is a continuation of U.S. patent application Ser. No. 13/331,564 (entitled SYSTEM AND METHODS OF ACCURACY MAPPING IN A LOCATION TRACKING SYSTEM filed Dec. 20, 2011) which is incorporated herein by reference in its entirety.
Claims
What is claimed is:
1. A method comprising: identifying a position of each of a plurality of location anchors or a site rendering; determining by measuring a wireless signal, for a plurality of positions on the site rendering, an upper bound and a lower bound of an estimated error value of location accuracy as a function of position on the site rendering where the upper and lower bounds of the estimated error value are respective Euclidean distances from each of at least two of the plurality of location anchors; forming a bounding box with dimensions X and Y around each of the plurality of positions based upon intersections of the respective upper and lower bounds of the at least two location anchors, wherein forming the bounding box comprises: creating an array of pseudo-test points, wherein the pseudo-test points are a set of points that are equidistant from two of the plurality of location anchors and are positioned to cover the site rendering entirely, thereby enabling a preparation of values of location errors for positions across a site; calculating a received signal strength indication (RSSI) as a function of Euclidean distance from the plurality of location anchors, for each of the pseudo-test points; calculating an expected standard deviation of RSSI; and calculating X and Y such that the respective upper and lower bounds are based upon the standard deviation of RSSI for the pseudo-test points; generating an overlay rendering of the estimated error values of location accuracy for the plurality of positions on the site rendering Where each estimated error value of the estimated error values is a relatively larger value of the X and Y dimensions of the bounding box of the associated position or a square root of an area of the bounding box; and displaying the site rendering with the overlay rendering therewith.
2. The method of claim 1, wherein the overlay rendering includes a set of contours of common error values.
3. The method of claim 1, wherein identifying the position of each of the plurality of location anchors on the site rendering includes at least one of receiving coordinates of the position or receiving user input identifying the position as a position with respect to the site rendering.
4. The method of claim 3, further comprising: receiving user input specifying a limit to the estimated error value for at least one specified area or volume in the site rendering; and generating a set of recommended coordinates for at least one location anchor of the plurality of location anchors, wherein the estimated error value is less than the limit for all positions within the at least one specified area or volume.
5. The method of claim 4, wherein a first specified area is associated with a first limit, wherein a second specified area is associated with a second limit, wherein the first limit is different from the second limit, and wherein the set of recommended coordinates for the at least one location anchor is adjusted to ensure the estimated error value is less than the respective limit for each specified area.
6. The method of claim 5, further comprising: providing a pre-existing set of location anchors; and generating the set of recommended coordinates using coordinates of the pre-existing set of location anchors and adding coordinates for an additional set of location anchors to ensure the estimated error value is less than the respective limit for each specified area.
7. The method of claim 6, further comprising providing a bill of materials for the additional set of location anchors.
8. The method of claim 1, wherein identifying the position of the at least one of the plurality of location anchors on the site map includes receiving the position of the at least one location anchor as GPS coordinates.
9. The method of claim 1, wherein determining, for the plurality of positions on the site rendering, the estimated error value of location accuracy includes: determining an upper bound limit as a function of Euclidean distance to at least one of the plurality of location anchors for each of the plurality of positions on the site rendering; and for each of the plurality of positions on the site rendering, combining each of the upper bound limits to derive the estimated error value.
10. The method of claim 9, wherein the function of Euclidean distance is based on RSSI and wherein determining the upper bound limit and the estimated error value for each of the plurality of positions on the site map is based on determining a mean value RSSI, an expected standard deviation of RSSI, and an upper bound on the RSSI as a function of the Euclidian distance.
11. The method of claim 10, wherein determining the upper bound limit includes using the Euclidean distance to determine an expected average RSSI and using the expected average RSSI to determine the upper bound limit, wherein the upper bound limit depends on a user input specifying a desired level of confidence in location accuracy.
12. The method of claim 9, wherein the function of Euclidean distance is based on time of flight and wherein determining the upper bound limit and the estimated error value for each of the plurality of positions on the site rendering is based on determining a mean value of time of flight, an expected standard deviation of time of flight, and an upper bound of time of flight as a function of the Euclidean distance.
13. The method of claim 10, wherein the mean value of RSSI and the expected standard deviation of RSSI are based on measurements obtained in an RF site survey at a plurality of positions at the site.
14. The method of claim 10, wherein the mean value of RSSI and the expected standard deviation of RSSI are based on an RF propagation model that takes into account a presence of equipment and buildings at the site.
15. The method of claim 10, further comprising receiving user input specifying a desired level of confidence in location accuracy, and using the user input to determine the upper bound on the RSSI.
16. The method of claim 15, wherein a value of a number of RSSI standard deviations is used to determine the upper bound on the RSSI.
17. The method of claim 1, further comprising: determining a second position of at least one location anchor of the plurality of location anchors on the site rendering based on user input; determining, for the plurality of positions on the site rendering, a second estimated error value of location accuracy as a function of position on the site rendering; generating a second contour map of the second estimated error value of location accuracy for the plurality of positions on the site rendering; and displaying the second contour map.
18. The method of claim 17, further comprising: identifying a position of a second location anchor on the site rendering; determining, for the plurality of positions on the site rendering, a second estimated error value of location accuracy as a function of position on the site rendering; generating a second contour map of the second estimated error value of location accuracy for the plurality of positions on the site rendering; displaying the second contour map; generating an inventory of contour maps; and determining a cost before moving the at least one location anchor, a cost after moving the at least one location anchor, a cost before adding the second location anchor, and a cost after adding the second location anchor.
19. The method of claim 1, further comprising generating a bill of materials the at least one location anchor at the site.
20. The method of claim 1, wherein each of the estimated error values includes one of a worst case error value or an average error value.
21. A system comprising: executable control software stored on a non-transitory computer readable medium; and at least one programmable processor for: identifying a position of a plurality of location anchors on a site rendering; determining via a wireless signal measurement, for each of a plurality of positions on the site rendering, a respective upper bound and a lower bound of an estimated error value of location accuracy as a function of Euclidean distance from each of the plurality of location anchors; forming a bounding box of dimensions X and Y around each of the plurality of positions based upon intersections of the respective upper and lower bounds of at least two of the plurality of location anchors, wherein forming the bounding box comprises creating an array of pseudo-test points, wherein the pseudo-test points are a set of points that are equidistant from two of the plurality of location anchors and are positioned to cover the site rendering entirely, thereby enabling a preparation of values of location errors for positions across a site; calculating a received signal strength indication (RSSI) as a function of Euclidean distance from the plurality of location anchors, for each of the pseudo-test points; calculating an expected standard deviation of RSSI; and calculating X and Y such that the respective upper and lower bounds are based upon the standard deviation of RSSI for the pseudo-test points; and generating an overlay rendering of the estimated error values of location accuracy for the plurality of positions on the site rendering where each estimated error value of the estimated error values is a relatively larger value of the X and Y dimensions of the bounding box of the associated position or a square root of an area of the bounding box.
22. The system of claim 21, further comprising a graphical user interface for displaying the overlay rendering.
23. The system of claim 21, further comprising user inputs for adding, moving, or deleting at least one of the plurality of location anchors.
24. A method comprising: measuring a wireless signal; determining an upper bound and a lower bound of accuracy of a location estimate based upon the wireless signal measurement with respect to at least two different location anchors as a function of Euclidean distance for each of a plurality of locations on a site rendering; forming a bounding box with dimensions X and Y around each of the plurality of locations by identifying intersections between the respective upper and lower bounds of the at least two different location anchors, wherein forming the bounding box comprises: creating an array of pseudo-test points, wherein the pseudo-test points are a set of points that are equidistant from two of the plurality of location anchors and are positioned to cover the site rendering entirely, thereby enabling a preparation of values of location errors for positions across a site; calculating a received signal strength indication (RSSI) as a function of Euclidean distance from the at least two different location anchors, for each of the pseudo-test points; calculating an expected standard deviation of RSSI; and calculating X and Y such that the respective upper and lower bounds are based upon the standard deviation of RSSI for the pseudo-test points; generating an overlay rendering visually displaying the determined accuracy of the location estimate for each of the plurality of locations on the site rendering wherein the determined accuracy for each of the plurality of locations is equal to a relatively larger value of the X and Y dimensions of the bounding box of the associated location or a square root of an area of the bounding box; and communicating the overlay rendering to a user.
25. The method of claim 24, wherein determining the accuracy of the location estimate for each of the plurality of locations on the site rendering includes determining an RSSI for each of the plurality of locations on the site rendering as a function of distance front a plurality of location anchors.
Description
FIELD
The present invention relates generally to location tracking systems. More particularly, the present invention relates to systems and methods of accuracy mapping in a location tracking system.
BACKGROUND
Location tracking systems are known in the art. However, many location tracking systems, both wired and wireless, exhibit location estimation errors. Often times, these location estimation errors are specific to a user's location or specific to hardware and infrastructure of the location tracking system. For example, the accuracy of a location estimate can depend on the location and structure of access points or location anchors.
It is desirable for a user to understand the accuracy of any location estimate. Specifically, it is desirable for a user to know what to expect in terms of accuracy of a location tracking system based on the user's location and the hardware and infrastructure in the environment. When a user understands accuracy and knows what level of error to expect, he can adjust the infrastructure to enhance accuracy according to his requirements.
There is thus a continuing, ongoing need for systems and methods of accuracy mapping in a location tracking system. Preferably, such systems and methods predict and communicate to a user the expected accuracy of a location estimate on a site map.
BRIEF DESCRIPTION OF THE DRAWINGS
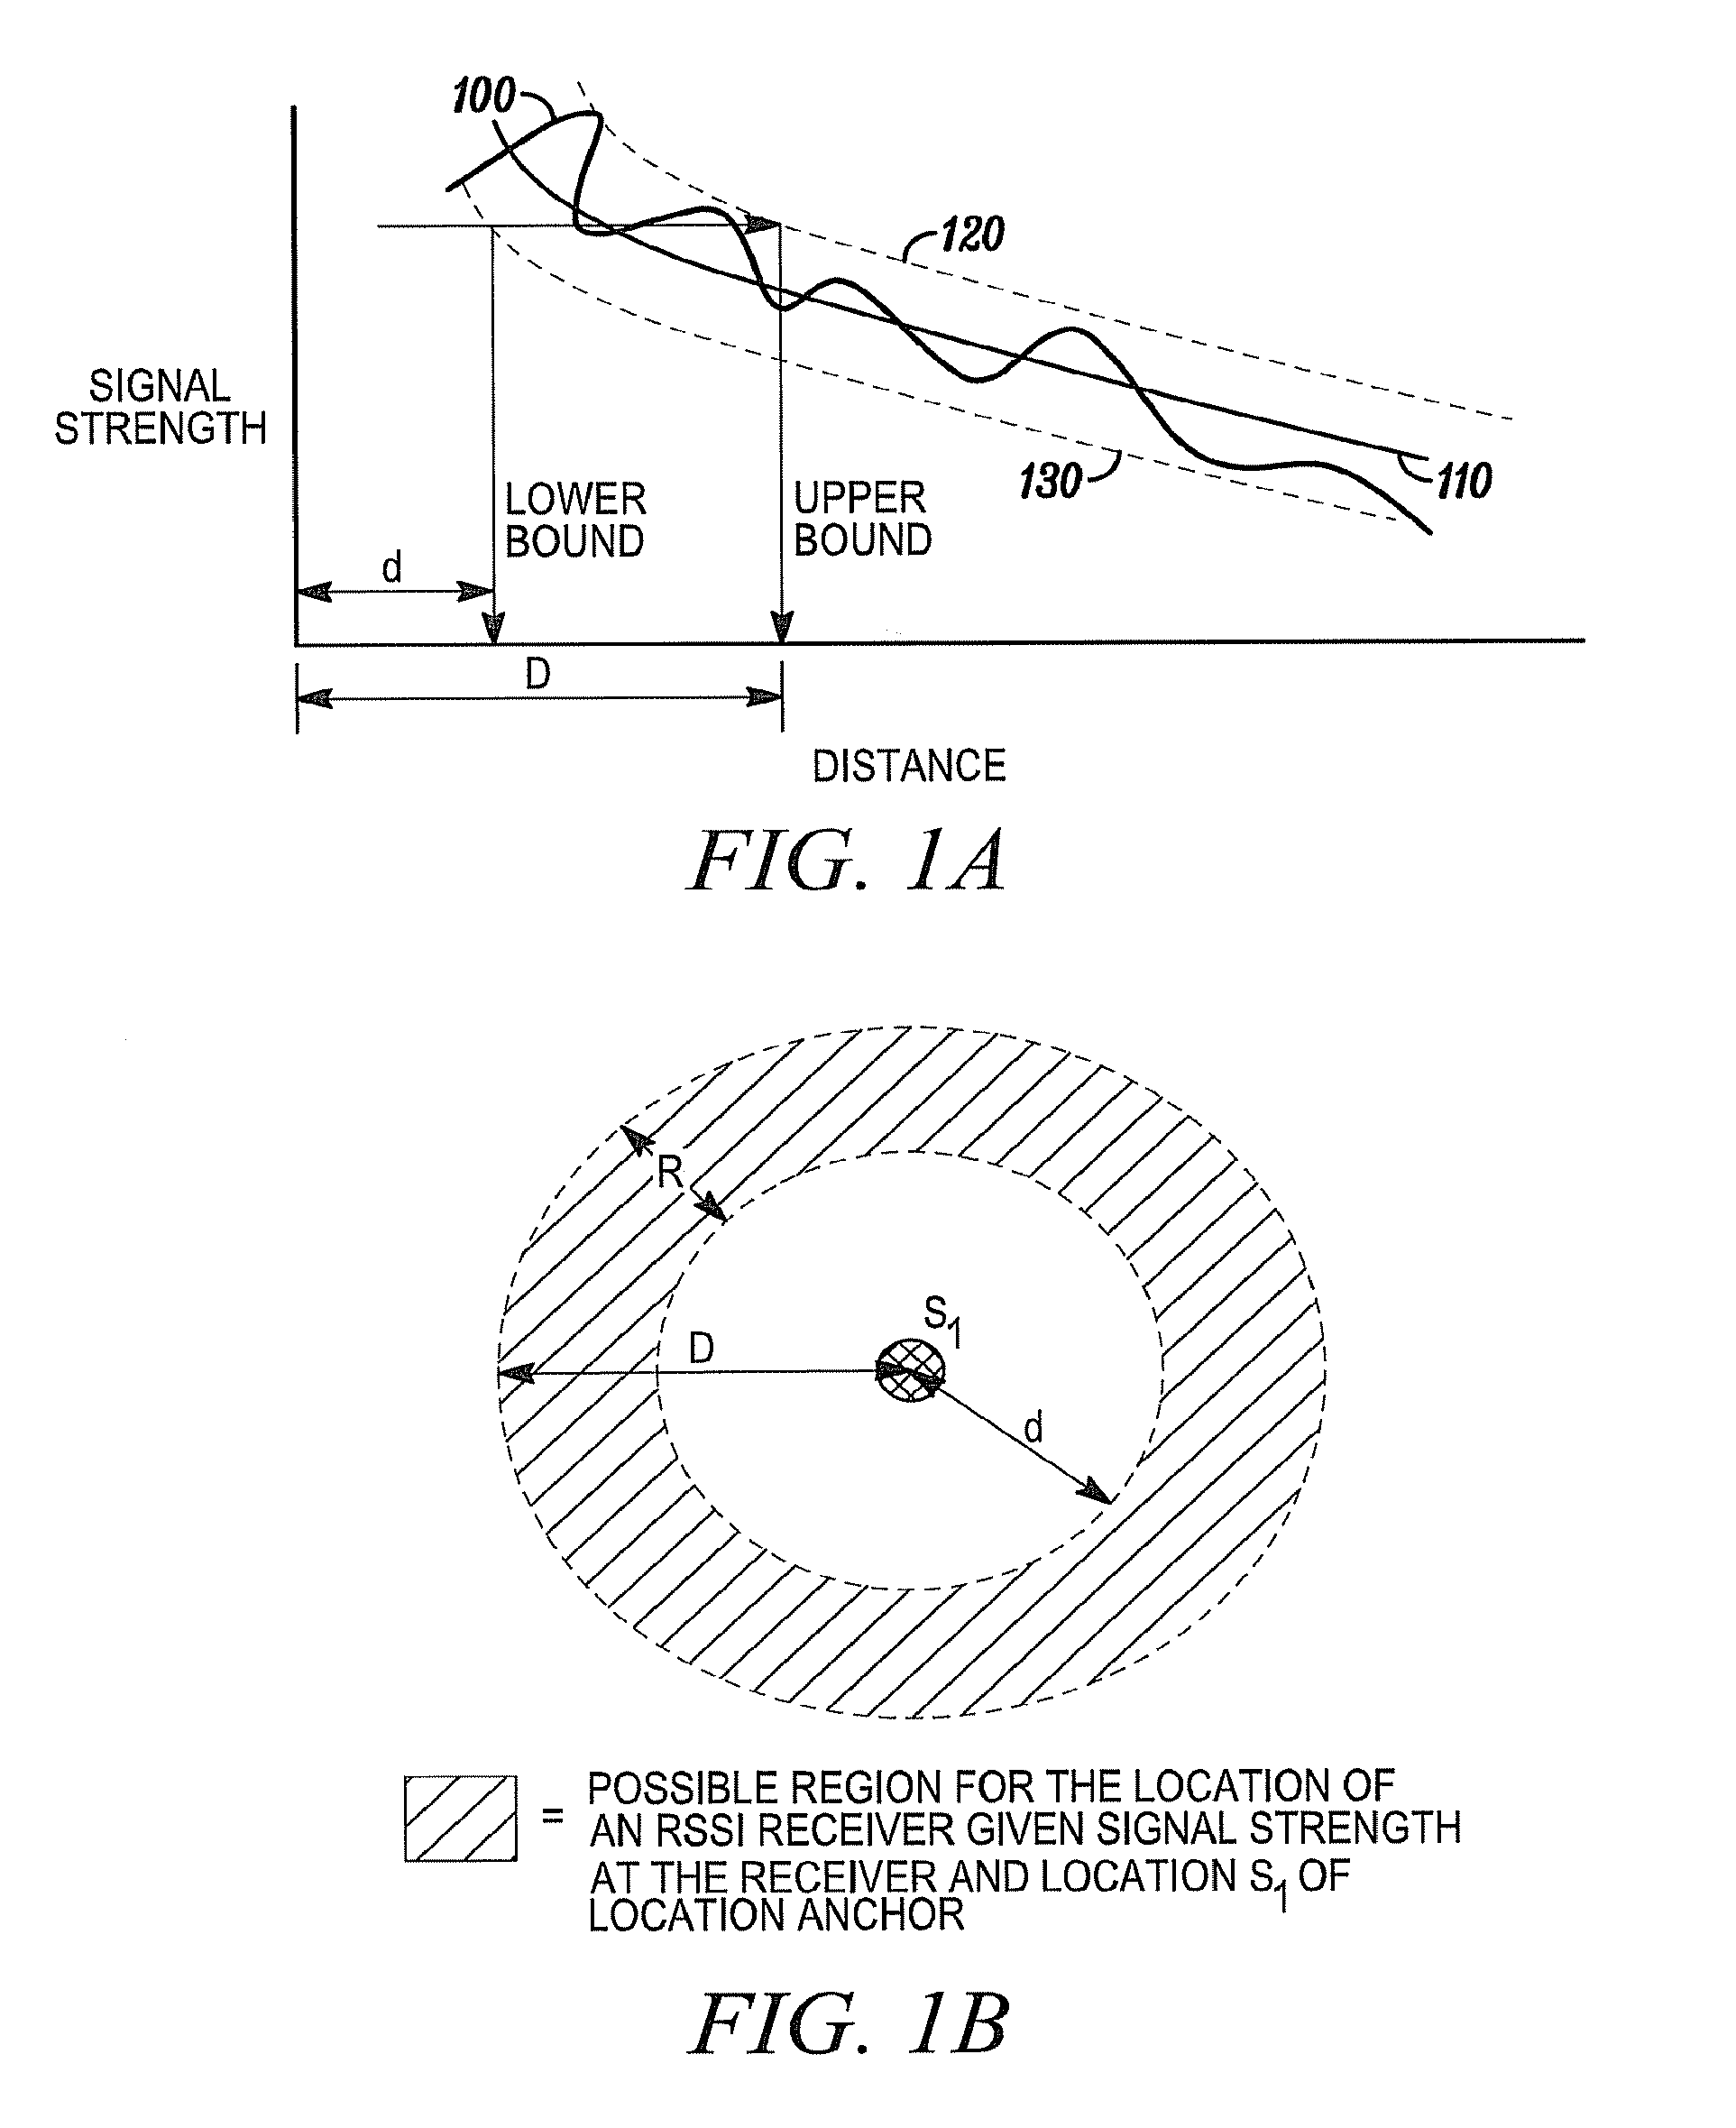
FIG. 1A is a graph of signal strength versus distance in accordance with the present invention;
FIG. 1B is graph plotting a possible region for the location of an RSSI receiver in accordance with the present invention;
FIG. 1C is a graph depicting the statistical variation of RSSI versus distance measurements in accordance with the present invention;
FIG. 2 is a graph plotting the most probable region for the location of an RSSI receiver when RSSI from multiple location anchors are available in accordance with the present invention;
FIG. 3 is a method of predicting and communicating the accuracy of a location estimate in a location tracking system in accordance with the present invention;
FIG. 4 is a block diagram of a system for carrying out the method of FIG. 3 and others in accordance with the present invention;
FIG. 5 is an exemplary contour map that can be generated and displayed in accordance with the present invention;
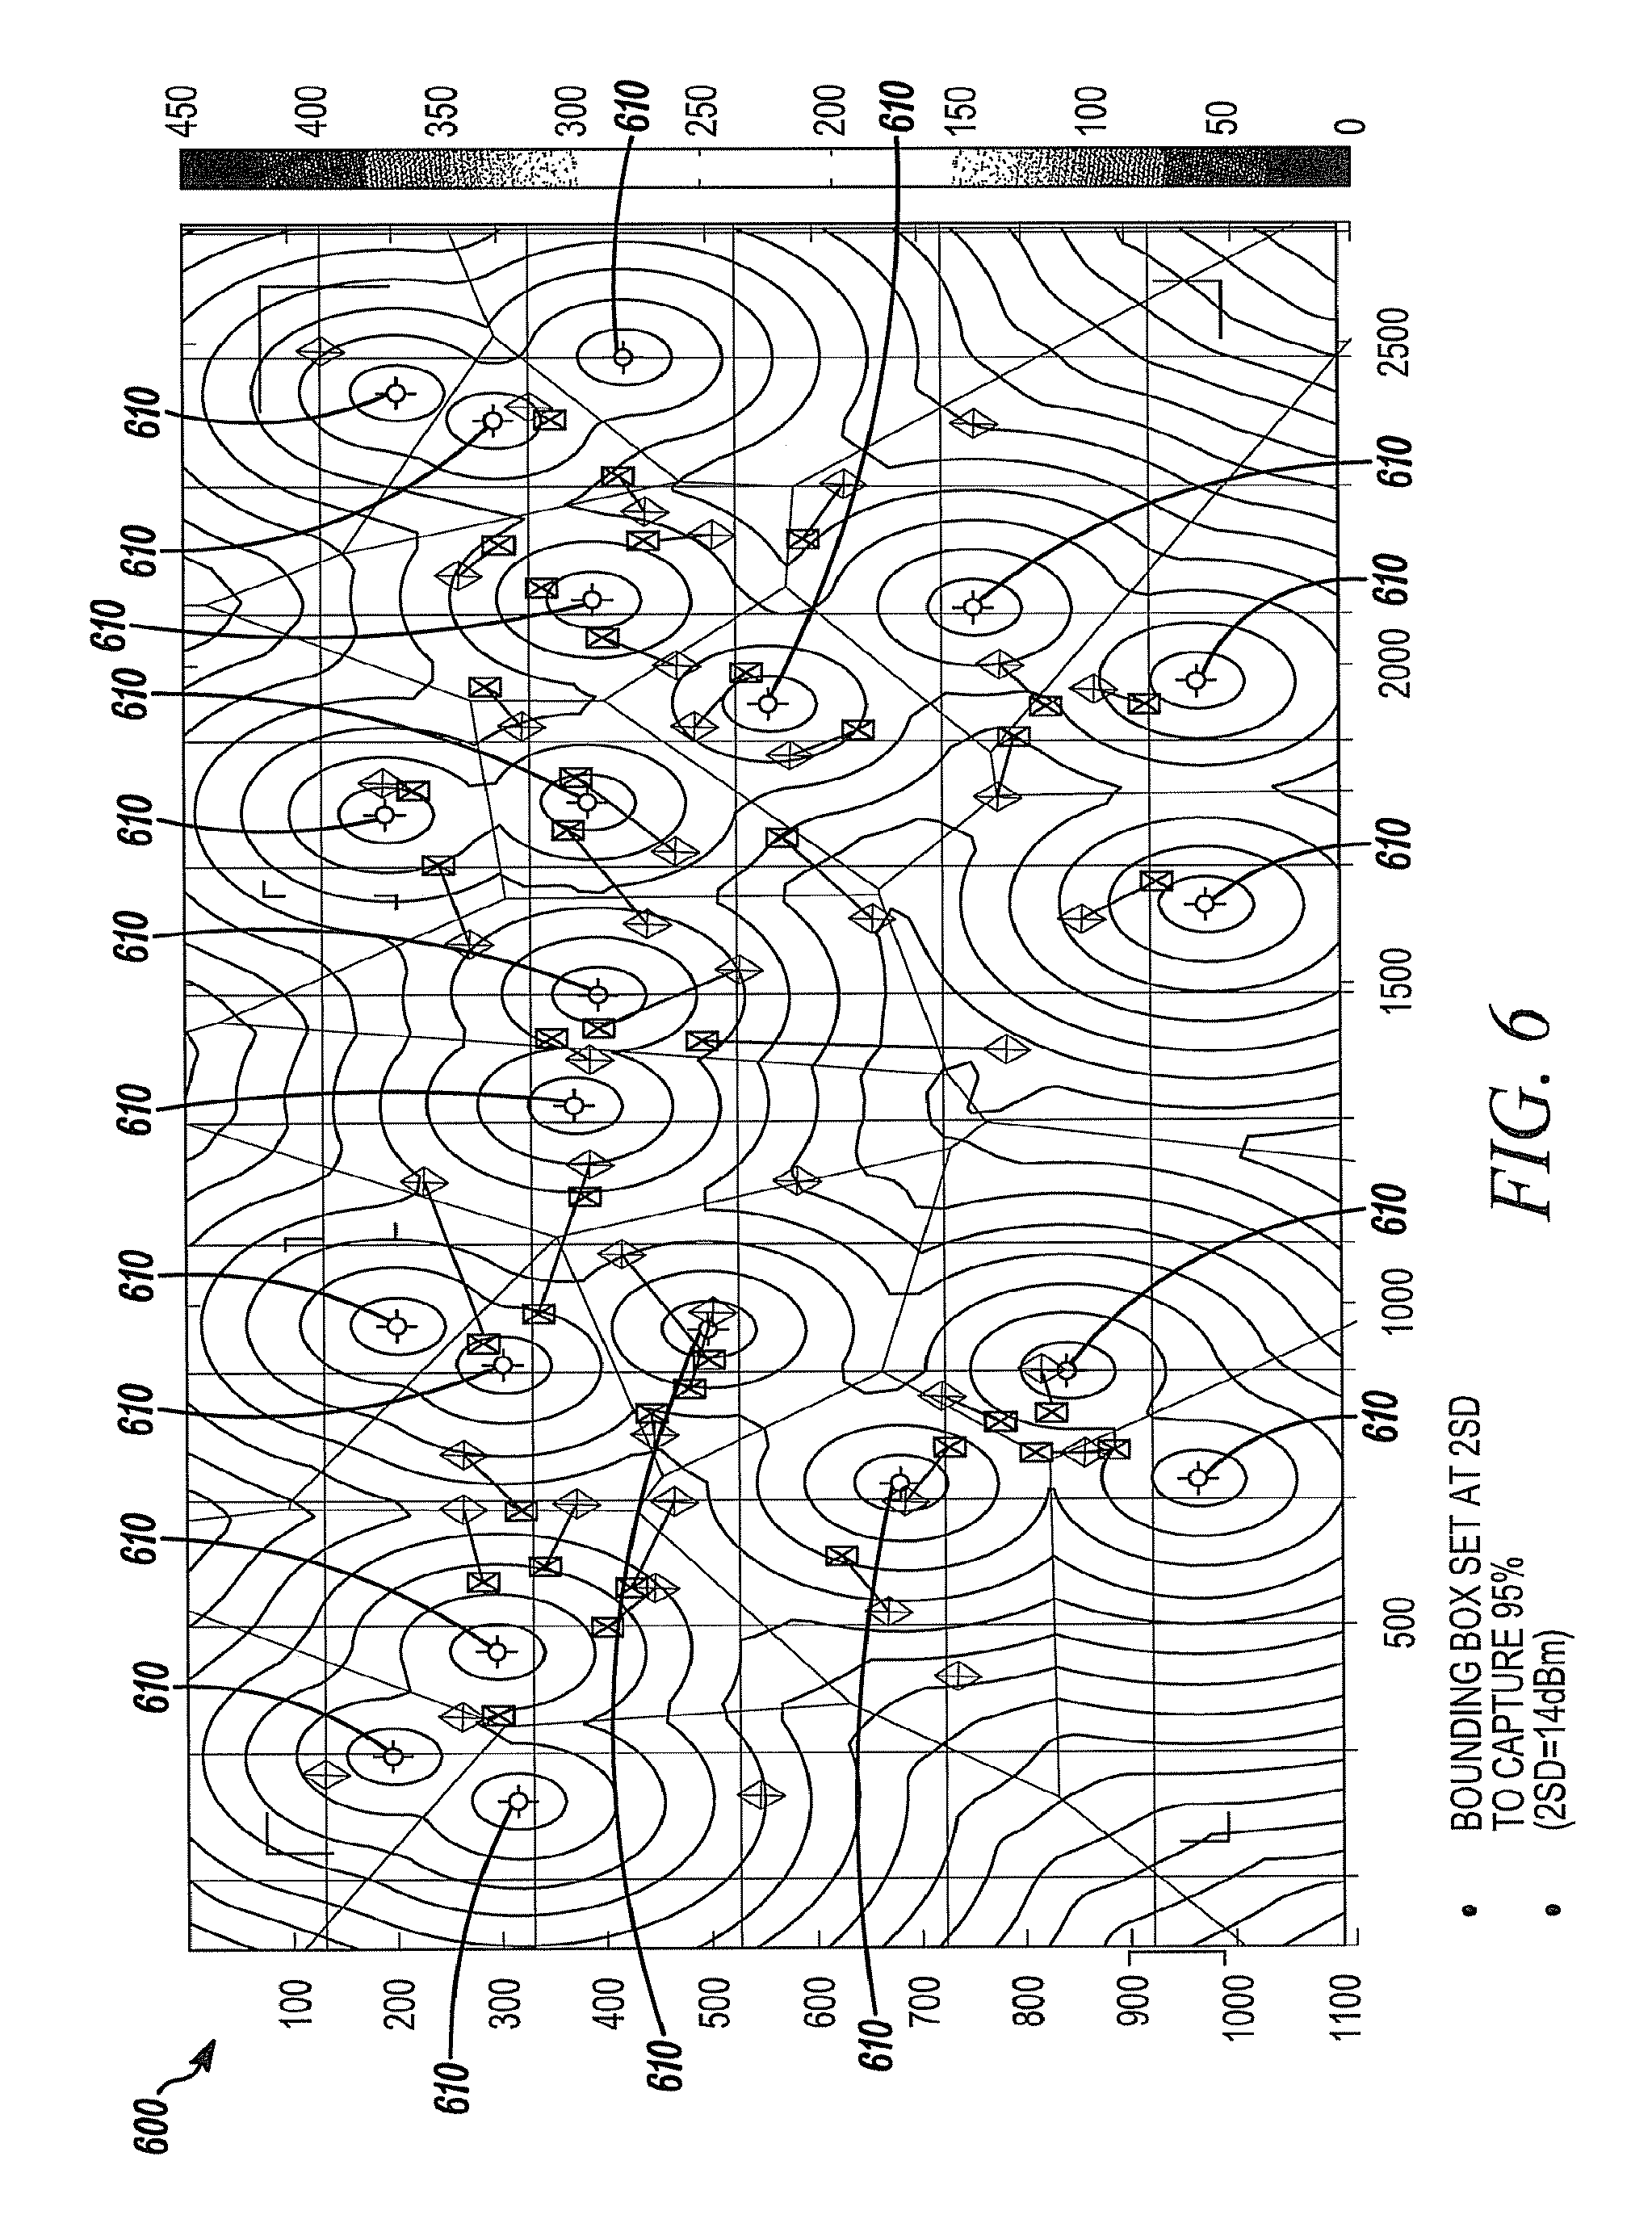
FIG. 6 is an exemplary contour map that can be generated and displayed in accordance with the present invention;
FIG. 7 is an exemplary contour map that can be generated and displayed in accordance with the present invention;
FIG. 8 is an exemplary contour map that can be generated and displayed in accordance with the present invention;
FIG. 9 is an exemplary contour map that can be generated and displayed in accordance with the present invention; and
FIG. 10 is an exemplary contour map that can be generated and displayed in accordance with the present invention.
DETAILED DESCRIPTION
While this invention is susceptible of an embodiment in many different forms, the drawings and detailed description show and describe specific embodiments of the present invention. However, it is to be understood that the present disclosure is to be considered as an exemplification of the principles of the invention. It is not intended to limit the invention to the specific illustrated embodiments.
Embodiments of the present invention include systems and methods of accuracy mapping in a location tracking system. Preferably, such systems and methods predict and communicate to a user the expected accuracy of a location estimate on a site map.
In accordance with the present invention, predicting and communicating the accuracy of a location estimate on a site map can enable a user to visualize location accuracy when needed. The wireless infrastructure at a site can affect the location accuracy. Therefore, when users know the accuracy of any location estimate, users can optimize infrastructure deployment where needed. Accordingly, accuracy requirements can be achieved at a minimized infrastructure cost.
In embodiments of the present invention, systems and methods can create a graphical topology map, and a graphical user interface (GUI) can present the map to a user based on an imported customer site image. In some embodiments, the graphical topology map can include an overlaid contour map, for example, a color contour map similar to a thermal image heat map. In a heat map, color indicates temperature. However, in the color contour map shown and described herein, color can indicate the predicted location accuracy.
The color contour map overlay on the site image can communicate to a user the expected worst case error versus position in the site. According to some embodiments, the expected worst case error can be predicted based on the positions of location anchors.
It is to be understood that the rendering of the site can be two-dimensional or three-dimensional. In three-dimensional embodiments, a user can view the overlaid contours of the expected worst case error as would exist in the three-dimensional space of the site.
A contour map or a three-dimensional rendering in accordance with the present invention can take into account the placement of location anchors to be used in the estimation of location accuracy. According to some embodiments, the estimation of location accuracy at any given point in the site depends on the Euclidean distance to nearby location anchors. Therefore, it is important to specify the location of all location anchors in the site.
The estimation of location accuracy can also depend on the methods used for estimating location in the location system. For example, one method for location estimation is based on the received signal strength indication (RSSI) for signals received from location anchors. In these methods, the RSSI is used as an indicator for distance. It is to be understood that the method for estimating location accuracy is not limited to location systems based on RSSI measurements. Rather, other methods for estimating location come within the spirit and scope of the present invention, for example, time of flight measurements.
In embodiments of the present invention, a location anchor can include a wireless receiver, transmitter, or transceiver that has a known location. For example, a location anchor could include a Wi-Fi access point (AP). In some embodiments, a location anchor can include a mechanism for responding to a probe request received from a Wi-Fi client device.
In some embodiments, the position of a location anchor can be specified by receiving Global Positioning System (GPS) coordinates of the location anchor. If multiple GPS coordinates of the site rendering are known, then the position of a location anchor within the site can be known with respect to the site rendering.
In other embodiments, a contour map can be displayed on a GUI, and a user can click on or otherwise select a point at which a location anchor is located. Then, that point on the map can display the location anchor.
After all of the location anchor positions are determined, systems and methods in accordance with the present invention can predict a worst case location accuracy as a function of position on the site rendering. The prediction will depend on the location of the location anchors in the site and on the method used to determine location. It is to be understood that the average accuracy can be better than the worst case accuracy in many situations.
One method to determine location can use a function of a default received signal strength indication (RSSI) versus Euclidean distance. For example, U.S. application Ser. No. 12/959,250, which is assigned to the assignee hereof and is hereby incorporated by reference, describes a location engine that can estimate the distance from all location anchors in a region using signal strength. The method can use the signal strength and estimated distance from location anchors to estimate the location of a receiver. However, the estimated location of the receiver can exhibit an error that is due to the inaccuracy of the function of RSSI versus distance.
Radio frequency signal strength can vary, even if a location anchor and receiver stay in constant positions. Systems and methods of the present invention can account for this variance by determining the variation of RSSI versus distance to determine reliable bounds. For example, as seen in FIG. 1A, a graph of signal strength versus distance is shown. Line 100 depicts the typical wide variations in RSSI versus distance while line 110 depicts the average RSSI versus distance. The dotted lines 120, 130 depict the upper and lower bound curves, respectively, around the average, where the limits include a majority of the typical measurements.
FIG. 1C is a graph depicting the statistical variation of RSSI versus distance measurements. The upper bound curve 120 and the lower bound curve 130 in FIG. 1A can be determined based on the statistical variation shown in FIG. 1C. That is, the confidence level for the upper and lower bound curve 120, 130 can be dependent on the standard deviation of the statistics at any given distance in FIG. 1C.
In a normal distribution, one standard deviation from the mean can account for approximately 68.27% of a set. Two standard deviations from the mean can account for approximately 95.45% of the set, and three standard deviations from the mean can account for approximately 99.73% of the set. Therefore, if a user desires a 95% confidence, then the upper and lower bound lines 120, 130 can be set at two standard deviations away from the mean for each distance position.
FIG. 1B shows a plot predicting a possible region for the location of an RSSI receiver given the signal strength measured when the signal is transmitted from the location anchor at position S.sub.1. As seen in FIG. 1B, D can be an upper distance bound, and d can be a lower distance bound. When a signal strength is known, a region R in which the receiver can be located can be determined. That is, d<R<D.
According to some embodiments, the values of d and D can be used to estimate the location error for a given position in the site. For example, the values for d and D can be determined by determining the Euclidean distance from a position to a location anchor. Then, the average RSSI value for that Euclidean distance can be determined using the RSSI versus distance curve 110 shown in FIG. 1A. Using the determined RSSI value, the values of d and D can be determined using the upper and lower bound lines 120, 130, shown in FIG. 1A. Thus, as shown in FIG. 1B, a user can be 95% confident that the receiver is within the region R of FIG. 1B surrounding the position of the location anchor S.sub.1.
When multiple location anchor signals are received by the RSSI receiver, the location of the RSSI receiver can be predicted even more accurately. For example, as seen in FIG. 2, regions in which a receiver can be located can be determined for each of a plurality of location anchors, S.sub.1-S.sub.6. Then, systems and methods can determine a location in which each of the regions overlap. This overlap area can be the most probable location region 210 for the receiver 200.
In some embodiments, the size of the most probable location region 210 can be used to report the estimated error in the location estimate for the particular position in the site. A similar calculation can be done to determine the error for all other positions in the site.
The confidence that a given location estimate will be within the most probable location region 210 can depend on the upper and lower bound RSSI curves. For example, if the curves are positioned to be two standard deviations above and below the average curve, then 95% of the RSSI measurements can occur between the upper and lower bound curves. Thus, in FIG. 2, a user can be 95% confident that the receiver 200 is within the most probable location region 210.
In some embodiments, the shape of the most probable location region 210 can be based on a set of circular arcs, each circular arc having a radius D. Then, the estimated location error can be reported as the square root of this area. In other embodiments, the shape of the most probable location region 210 can be estimated using squares having a width equal to 2 D. Then, the shape of the most probable location region 210 can be a bounding box rectangle with dimensions X and Y, where the rectangle is the intersection of all of the squares for each location anchor. The largest of the X and Y dimensions can be used as the estimated error for that position. The confidence in an error estimate can be depend on the number of standard deviations used for the upper and lower bound curves.
According to embodiments disclosed herein, a contour map of the entire site can be generated using the calculations described above for each possible receiver location. Once each location has a calculated error value, contour lines can be drawn overlaying the map such that each contour line can correspond to a specific common error value.
In three-dimensional embodiments, the Euclidean distance can be measured in three dimensions. Thus, circles of radius D can become spheres, and the most probable location can become a three-dimensional volume. In these embodiments, the cube root of the volume can be used as the error value.
Users can adjust the function of default RSSI versus distance according to their environment. Furthermore, a user can provide input specifying a desired worst case level of confidence in location accuracy. Given the desired confidence, the number of RSSI standard deviations to be used for the upper and lower bounds can be determined. An RSSI standard deviation value can be changed as appropriate for the environment.
In some embodiments, the RSSI standard deviation value can be approximately 5-7 dB. However, the desired confidence can be 95% where the upper and lower bound curves can be positioned at approximately two standard deviations above and below the RSSI curve. This is because higher standard deviations can capture more measurements. For any set of location anchor positions, RSSI statistics, and user confidence specification, an error contour overlay can be calculated and displayed.
In accordance with the present invention, a user can add or move location anchors to increase the accuracy of location estimates in desired areas. When a location anchor is added or moved, systems and methods of the present invention can generate an inventory of the move or addition. Systems and methods can then use the inventory to perform a tradeoff analysis of cost installation versus accuracy.
FIG. 3 is a flow chart of an exemplary method 300 of predicting and communicating the accuracy of a location estimate in a location tracking system in accordance with the present invention. As seen in FIG. 3, an image of a site or region can be imported as in 305. Alternatively, a three-dimensional rendering of the site can be used, for example, a three-dimensional AutoCAD model.
In some embodiments, location anchors can be shown on the imported image, and in other embodiments, location anchors do not appear on the imported image. Accordingly, location anchors can be optionally identified on the image as in 310. For example, a user can click on or otherwise select locations on the image where anchors are currently located and/or where anchors are anticipated to be located. Upon completion of step 310, positions of location anchors can be known with respect to the site image or three-dimensional model.
Then, the method 300 can identify and create an array of pseudo-test points as in 315. For example, the pseudo-test points can be a set of points that are equidistant and that cover the entire site image or three-dimensional model. Pseudo-test points can enable the method 300 to prepare values of location error for positions across the site.
The method can select a pseudo-test point from the array of pseudo-test points as in 320. Then, for the selected pseudo-test point, the method 300 can calculate the RSSI as a function of distance from all location anchors on the site as in 325. For example, in some embodiments, the calculation of RSSI versus distance can be based on a default RSSI versus distance function. In some embodiments, the mean value and expected standard deviation of RSSI can be determined as a function of distance, for example, through measurements obtained in an RF site survey at each pseudo-test point and/or through an RF propagation model that takes into account the presence of equipment and buildings on the site map.
The method 300 can also calculate a bounding box with X and Y dimensions as in 330. The bounding box can be based on using an upper bound RSSI curve to determine the size of the squares for each location anchor. In embodiments of the present invention, the bounding box can be based on the farthest distance that the estimate can range given the variance in the RSSI function. Then, the X and Y dimensions of the bounding box can be used to determine the error value for that pseudo-test point as in 335, for example, (XY) or the maximum of X and Y.
Portions of the method 300 can be repeated to generate error values for each pseudo-test point. For example, after an error value for the selected pseudo-test point is determined as in 335, the method 300 can determine if all pseudo-test points in the array of pseudo-test points have been analyzed as in 340. If not, then the method 300 can select another pseudo-test point as in 320.
However, if the method determines that all pseudo-test points have been analyzed as in 340, then the method 300 can generate a contour map as in 350. For example, to generate the contour map as in 350, the error values that were determined in 335 can be sorted into groups and assigned a color as in 351. For example, a good error value can be assigned to a green group, and a bad error value can be assigned to a red group. Then, the map can be color coded at each pseudo-test point as in 352, and contour lines can be drawn accordingly as in 353. In embodiments of the present invention, a colored map with contour lines can show color coding of the magnitude of location estimation error versus the position on the image.
In some embodiments, after a user visually views location accuracy via the contour map, a user can adjust accuracy by adding, moving, or deleting location anchors on the map as in 360. When any location anchors are added, moved, or deleted, location error mapping functions can be re-run to re-calculate accuracy.
When the method of FIG. 3 generates a contour map with a desired location accuracy, systems and methods of the present invention can generate a bill of materials. For example, the bill of materials can indicate materials needed to install a system with the location accuracy displayed by the contour map. If an initial set of location anchors is already installed, the bill of materials can indicate the additional materials needed to improve the location accuracy by adding additional location anchors.
The method shown in FIG. 3 and others in accordance with the present invention can be implemented with the system 400 shown in FIG. 4. As seen in FIG. 4, the system 400 can include control circuitry 410, one or more programmable processors 420, executable control software 430 as would be understood by those of skill in the art, and a database 425. The executable control software 430 can be stored on a transitory or non-transitory computer readable medium.
An associated user interface 440 can be in communication with the control circuitry 410, and a viewing screen 450 of the user interface 440, as would be known by those of skill in the art, can display interactive and viewing windows. In some embodiments of the present invention, the user interface 440 can be a multi-dimensional graphical user interface. The user interface 440 can also include user input mechanisms 455 for receiving user input.
As seen in FIG. 4, an image 460 of a site or region can be imported to the control circuitry 410. The control circuitry 410 can perform methods in accordance with the present invention to generate a contour map, and the viewing screen 450 of the user interface 440 can display the contour map as an overlay on top of the site image to visually display to a user the accuracy of location estimates.
In some embodiments, the viewing screen can display a three-dimensional rendering of the site with various perspectives. Then, the contour and color coded error information can be displayed on the site rendering to convey the location error information.
It is to be understood that alternate embodiments to enable the viewing of a three-dimensional model come within the spirit and scope of the present invention. For example, layers of a three-dimensional model can be viewed, where a given layer represents a specific horizontal slice through three-dimensional space. In these embodiments, the error map can be overlaid on each layer. In other embodiments, the overlay can be presented to a user with a controlled level of transparency such that the underlying site image can be more or less visible with respect to the error color coding and contours.
FIG. 5 is an exemplary contour map 500 that can be generated and displayed in accordance with the present invention. As seen in FIG. 5, the contour map 500 can include a plurality of location anchors 510. To generate the contour map 500, the upper bound RSSI curve has been set to 7 dB above the mean RSSI curve.
FIG. 6 is an exemplary contour map 600 that can be generated and displayed in accordance with the present invention. As seen in FIG. 6, the contour map 600 can include a plurality of location anchors 610. To generate the contour map 600, the upper bound RSSI curve has been set to 14 dB above the mean RSSI curve.
When the contour map 500 in FIG. 5 and the contour map 600 in FIG. 6 are compared, it can be seen that greater accuracy in location estimates is achieved when the upper bound RSSI curve is 7 dB, as opposed to 14 dB. FIG. 6 also demonstrates additional contours. The number of contours, or alternatively, the incremental amount of error between contours, can be a user input to the mapping system.
FIG. 7 is an exemplary contour map 700 including location anchors 710 that can be generated and displayed in accordance with the present invention. To generate the contour map 700, the upper bound RSSI curve has been set to 7 dB above the mean RSSI curve.
As seen in FIG. 7, a location anchor 750 has been added to the map 700 so the map 700 in FIG. 7 has more location anchors than the map 500 in FIG. 5. Accordingly, greater accuracy in location estimates is achieved as compared to the map 500 in FIG. 5, especially around the area of location anchor 750.
FIG. 8 is an exemplary contour map 800 including location anchors 810 that can be generated and displayed in accordance with the present invention. To generate the contour map 800, the upper bound RSSI curve has been set to 14 dB above the mean RSSI curve.
As seen in FIG. 8, a location anchor 850 has been added to the map 800 so the map 800 in FIG. 8 has more location anchors than the map 600 in FIG. 6. Accordingly, greater accuracy in location estimates is achieved as compared to the map 600 in FIG. 6, especially around the area of location anchor 850.
FIG. 9 is an exemplary contour map 900 including location anchors 910 that can be generated and displayed in accordance with the present invention. To generate the contour map 900, the upper bound RSSI curve has been set to 7 dB above the mean RSSI curve.
As seen in FIG. 9, and as compared to FIG. 7, a location anchor 955 has been moved. That is, the anchor 955 has been moved from the location at the base of the arrow to the location at the tip of the arrow. In the map 900, greater accuracy in location estimates is achieved near and around the moved location anchor 955 as compared to that same area in the map 700, when the location anchor 955 was not there.
In embodiments of the present invention, when a user views the map 700 as in FIG. 7, he may determine that more accuracy in location estimates in desired in a certain area. Therefore, he can move the location anchor 955 to the area where more accuracy is desired.
Finally, FIG. 10 is an exemplary contour map 1000 including location anchors 1010 and added location anchor 1050 that can be generated and displayed in accordance with the present invention. To generate the contour map 1000, the upper bound RSSI curve has been set to 14 dB above the mean RSSI curve.
As seen in FIG. 10, and as compared to FIG. 8, a location anchor 1055 has been moved. That is, the anchor 1055 has been moved from the location at the base of the arrow to the location at the tip of the arrow. In the map 1000, greater accuracy in location estimates is achieved near and around the moved location anchor 1055 as compared to that same area in the map 800, when the location anchor 1055 was not there.
In embodiments of the present invention, when a user views the map 800 as in FIG. 8, he may determine that more accuracy in location estimates is desired in a certain area. Therefore, he can move the location anchor 1055 to the area where more accuracy is desired.
Although a few embodiments have been described in detail above, other modifications are possible. For example, the logic flows depicted in the figures do not require the particular order shown, or sequential order, to achieve desirable results. Other steps may be provided, or steps may be eliminated, from the described flows, and other components may be added to, or removed from, the described systems. Other embodiments may be within the scope of the following claims.
From the foregoing, it will be observed that numerous variations and modifications may be effected without departing from the spirit and scope of the invention. It is to be understood that no limitation with respect to the specific system or method illustrated herein is intended or should be inferred. It is, of course, intended to cover by the appended claims all such modifications as fall within the spirit and scope of the claims.
* * * * *
D00000
D00001
D00002
D00003
D00004
D00005
D00006
D00007
D00008
D00009
D00010
D00011
XML
uspto.report is an independent third-party trademark research tool that is not affiliated, endorsed, or sponsored by the United States Patent and Trademark Office (USPTO) or any other governmental organization. The information provided by uspto.report is based on publicly available data at the time of writing and is intended for informational purposes only.
While we strive to provide accurate and up-to-date information, we do not guarantee the accuracy, completeness, reliability, or suitability of the information displayed on this site. The use of this site is at your own risk. Any reliance you place on such information is therefore strictly at your own risk.
All official trademark data, including owner information, should be verified by visiting the official USPTO website at www.uspto.gov. This site is not intended to replace professional legal advice and should not be used as a substitute for consulting with a legal professional who is knowledgeable about trademark law.