Detection of oral microbial virulence factors
Haught , et al.
U.S. patent number 10,267,797 [Application Number 15/939,382] was granted by the patent office on 2019-04-23 for detection of oral microbial virulence factors. This patent grant is currently assigned to The Procter & Gamble Company. The grantee listed for this patent is The Procter & Gamble Company. Invention is credited to Benjamin Thomas Circello, John Christian Haught, Thomas Glenn Huggins, Deepa Ashok Khambe, Malgorzata Klukowska, Cheryl Sue Tansky, Donald James White, Sancai Xie.


View All Diagrams
| United States Patent | 10,267,797 |
| Haught , et al. | April 23, 2019 |
Detection of oral microbial virulence factors
Abstract
Methods for detecting and quantifying toxins present in the oral cavity. The methods may include providing a biological sample, providing reporter cells expressing one or more Toll like receptors, exposing the cells to the biological sample, measuring the EC50 value of the lipopolysaccharide on activation of a Toll like receptor, quantification of the lipopolysaccharide in the biological sample.
| Inventors: | Haught; John Christian (West Chester, OH), Xie; Sancai (Liberty Township, OH), Circello; Benjamin Thomas (Maineville, OH), Tansky; Cheryl Sue (Forest Park, OH), Klukowska; Malgorzata (Mason, OH), Huggins; Thomas Glenn (Mason, OH), Khambe; Deepa Ashok (Cincinnati, OH), White; Donald James (Fairfield, OH) | ||||||||||
|---|---|---|---|---|---|---|---|---|---|---|---|
| Applicant: |
|
||||||||||
| Assignee: | The Procter & Gamble
Company (Cincinnati, OH) |
||||||||||
| Family ID: | 56024418 | ||||||||||
| Appl. No.: | 15/939,382 | ||||||||||
| Filed: | March 29, 2018 |
Prior Publication Data
| Document Identifier | Publication Date | |
|---|---|---|
| US 20180231546 A1 | Aug 16, 2018 | |
Related U.S. Patent Documents
| Application Number | Filing Date | Patent Number | Issue Date | ||
|---|---|---|---|---|---|
| 15148663 | May 6, 2016 | 9970934 | |||
| 62309110 | Mar 16, 2016 | ||||
| 62157659 | May 6, 2015 | ||||
| Current U.S. Class: | 1/1 |
| Current CPC Class: | A61K 8/42 (20130101); A61K 8/4926 (20130101); A61K 8/21 (20130101); G01N 33/5044 (20130101); A61K 8/361 (20130101); C12Q 1/6897 (20130101); G01N 33/5091 (20130101); A61K 8/0204 (20130101); A61K 8/39 (20130101); G01N 33/5041 (20130101); G01N 33/566 (20130101); G01N 33/579 (20130101); A61Q 11/00 (20130101); G01N 2333/705 (20130101); G01N 2333/70596 (20130101); G01N 2400/50 (20130101); C12Q 2600/136 (20130101); A61K 2800/74 (20130101); G01N 2333/195 (20130101) |
| Current International Class: | C12Q 1/00 (20060101); G01N 33/566 (20060101); A61Q 11/00 (20060101); A61K 8/49 (20060101); A61K 8/42 (20060101); G01N 33/50 (20060101); C12Q 1/6897 (20180101); G01N 33/579 (20060101); A61K 8/02 (20060101); A61K 8/21 (20060101); A61K 8/36 (20060101); A61K 8/39 (20060101) |
References Cited [Referenced By]
U.S. Patent Documents
| 5175089 | December 1992 | Fine et al. |
| 5738985 | April 1998 | Miles et al. |
| 2007/0160544 | July 2007 | Sreenivasan |
| 2009/0047240 | February 2009 | Johnson et al. |
| 2012/0019735 | January 2012 | Zuidema et al. |
| 2017/0119643 | May 2017 | Haught et al. |
| 2323630 | Aug 1990 | CA | |||
| 1971865 | Apr 2013 | EP | |||
| 2481267 | Apr 2016 | GB | |||
| WO1995013094 | May 1995 | WO | |||
| WO2008042279 | Apr 2008 | WO | |||
| WO2011091366 | Jul 2011 | WO | |||
| WO2014098868 | Jun 2014 | WO | |||
Other References
|
13837M International Search and Written Opinion for PCT/US2016/031349 dated Jul. 18, 2016. cited by applicant . 13838M Search Report and Written Opinion for PCT/US2016/031350 dated Jul. 18, 2016. cited by applicant . Chuang, TH1 et al., "Cloning and characterization of a sub-family of human toll-like receptors: hTLR7, hTLR8 5 and hTLR9", Eur. Cytokine Netw.. Sep. 2000, 11(3):372-8). cited by applicant . Darveau, R.P. et al., "Porphyromonas gingivalis Lipopolysaccharide Contains Multiple Lipid A species That Functionally Interact with Both Toll-Like Receptors 2 and 4", Infection and Immunity, vol. 72, No. 9, Sep. 1, 2004, pp. 5041-5051. cited by applicant . Dongari-Bagtzoglou et al., "Production of inflammatory mediators and cytokines by human gingival fibroblasts following bacterial challenge", J. Periodont. Res. 1996; 31:90-98. cited by applicant . Henkel et al. "Toxins from Bacteria", EXS (2010) 100:1-30. cited by applicant . Hong, Sun Woong et al., "Lipoteichoic acid of Streptococcus mutans interacts with Toll-like receptor 2 through the lipid moiety for induction of inflammatory mediators in murine macrophages", Molecular Immunology, vol. 57, pp. 284-291, 2014. cited by applicant . Huang, Li-Yun et al., "Use of Toll-Like Receptor Assays to Detect and Identify Microbial Contaminants in Biological Products", Journal of Clinical Microbiology, Nov. 2009, p. 3427-3434. cited by applicant . Liebers, Verena et al. "Occupational Endotoxin-Exposure and Possible health Effects on Human", American Journal of Industrial Medicine 49(6):474-491 (2006). cited by applicant . Madianos, PN et al., "Generation of inflammatory stimuli: how bacteria set up inflammatory responses in the gingiva", J. Clin. Periodontol. 2005; 32(supplement 6): 57-71. cited by applicant . Mullarkey, M. et al. "Inhibition of endotoxin response by E5564, a novel toll like receptor 4 directed endotoxin antagonist", Journal of Pharmacology and Experimental Therapeutics, American Society for Pharmacologoy and Experimental Therapeutics, vol. 304, No. 3, Jan. 1, 2003, pp. 1093-1102. cited by applicant . Offenbacher, S et al., "Gingival transcriptome patterns during induction and resolution of experimental gingivitis in humans", J. Periodontol. Dec. 2009; 80(12): 1963-82. cited by applicant . Raetz et al. "Lipopolysaccharide endotoxin", Annu. Rev. Biochem (2002) 71:635-700. cited by applicant . Rock, FL et al., "A family of human receptors structurally related to Drosophila Toll", Proc. National Academy Science, Jan. 20, 1998, 95:588-93. cited by applicant . Shapira, L. et al., "Effect of Amine- and Stannous Fluoride on Human Neutrophil Functions in vitro", J. Dent. Res. 73 (7): 1381-1386, Jul. 1997. cited by applicant . Sulamain, Ali et al. "Corresponding Author: Bacterial Endotoxin Released by Different Types of Mouthwash", World Applied Sciences Journal, Jan. 1, 2012, pp. 305-309. cited by applicant . Takeuchi, et al., "A novel member of an expanding toll-like receptor family", Gene, Apr. 29, 1999, 231(1-2): pp. 59-65. cited by applicant . Wood, Stewart J. et al., "Anti-Endotoxin Agents. 1. Development of a Fluorescent Probe Displacement Method Optimized for High-Throughput Identification of Lipopolysaccharide-Binding Agents", May 1, 2004, retrieved from Internet on Jun. 23, 2016: URL:http://www.ncbi.nlm.nih.gov/pmc/articles/PMC1540690/pdf/nihms2661.ppd- f. cited by applicant . Yokoyama, Yuji et al., "Systemic Immune Response to Streptococcal and Staphylococcal Lipoteichoic Acids in Children with Recurrent Tonsillitis", Acta Otolaryngol (Stockh) 1996; Suppl 523: 108-111. cited by applicant . Zhang, Hongwei et al., "Lipoprotein Release by Bacteria: Potential Factor in Bacterial Pathogenesis", Infection and Immunity, Nov. 1998, vol. 66, No. 11, pp. 5196-5201. cited by applicant . All Office Actions from U.S. Appl. No. 15/148,663, filed May 6, 2016--See Private Pair. cited by applicant . All Office Actions from U.S. Appl. No. 15/149,044, filed May 6, 2016--See Private Pair. cited by applicant. |
Primary Examiner: Navarro; Albert M
Attorney, Agent or Firm: McCrary; Parker D.
Claims
What is claimed is:
1. A method of determining bacterial virulence in an oral cavity comprising: a. providing a reporter cell expressing at least one toll-like receptor; b. providing a sample of oral matter; c. combining the sample of oral matter and the reporter cell; d. measuring the toll-like receptor activation; e. providing another sample of oral matter from an individual who used an oral care composition prior to providing another sample of oral matter; f. combining the another sample of oral matter and the reporter cell; g. measuring the toll-like receptor response; h. comparing the toll-like receptor response from the sample of oral matter and another sample of oral matter.
2. The method of claim 1, wherein the toll-like receptor is at least one of TLR1 to TLR9.
3. The method of claim 1, wherein the reporter cell expresses at least of one TLR2 or TLR4.
4. The method of claim 1, wherein the toll-like receptor activates a reporter gene.
5. The method of claim 4, wherein the reporter gene is a secreted embryonic alkaline phosphatase (SEAP) reporter gene.
6. The method of claim 1, wherein the sample of oral matter is at least one of gum-line plaque, subgingival plaque, supragingival plaque, interstitial plaque, gingival crevicular fluid (GCF), gingival biopsy, saliva, or tongue swab.
7. The method of claim 1, wherein the sample of oral matter comprises virulence factor that is at least one of Gram positive cell wall components, Gram negative cell wall components, bacterial DNA, flagellin, peptidoglycan, bacterial metabolites, fimbriae; outer membrane vesicles bacterial proteins, or bacterial enzymes.
8. The method of claim 7, wherein the sample of oral matter comprises virulence factor that is at least one of lipopolysaccharide or lipoteichoic acid.
9. The method of claim 1, where the sample of oral matter and the another sample of oral matter are from the same individual.
Description
FIELD OF THE INVENTION
The invention relates to a method for detecting and quantifying bacterial virulence factors in oral samples, and for identifying agents for detoxifying oral virulence factors and a method for determining the effectiveness of detoxifying agents.
BACKGROUND OF THE INVENTION
The toxins of bacterial cell walls (Henkel et al, EXS. (2010) 100: 1-29) have been associated with health related issues, such as septic shock, fever and malaise (V. Liebers et al., Am J Ind Med. (2006) 49(6): 474-91). Examples of Gram-negative cell wall toxins associated with health concerns are endotoxins, such as lipopolysaccharide (LPS), peptidogylcans, and fimbriae; and Gram-positive cell wall toxins associated with health concerns are lipoteichoic acid (LTA) and peptidoglycans. There are many other bacterial toxins, such as enterotoxins and exotoxins, as reported in Henkel et al, EXS. 2010; 100: 1-29. For the oral environment, the LPS and LTA seem to be the dominant drivers of a bacterial induced immune response, or at least the best characterized. The immune response mounted by the body in response to these toxins depends on the origin of the toxin and the exposure history of the individual to said toxin. The LPS is a component of Gram-negative bacteria that is different from strain to strain, as has been illustrated with the differences in virulence of E. coli (Raetz and Whitfield Annu. Rev. Biochem (2002) 71:635-700). LPS is composed of a lipid A fraction, core region, and may have an O-antigen. The Lipid A fraction's fatty acid composition has been shown to determine its virulence in response to its interaction with the Toll-like 4 (TLR4) receptor. The LTA has been linked to various inflammatory responses (Y. Yokoyama, et al., Acta Otolaryngol Suppl. (1996) 523:108-111) and associated with Toll-like receptor 2 (TLR2) activation. It is widely believed that only the lysed bacteria liberate LPS that can initiate an inflammatory response (CA2323630). However, Zhang et al. showed that growing bacteria secrete LPS at a level in proportion to their growth phase (H. Zhang et al. (1998) Infection & Immunity, 66(11), 5196-5201). Therefore, even a small fraction of the plaque left on the teeth after brushing could seed the inflammatory cascade due to the release of LPS from the Gram negative bacteria present in the plaque.
Methods of detecting specific microbial species have been demonstrated in the art. In US Pub. No. 2012/019735A1, methods were proposed to distinguish disease-causing bacteria via spectrophotometric methods. Though they were able to show the presence of specific microbes, their invention would not allow the user to determine the virulence level of a specific site. Further, their method requires the microbes to be cultured in the lab in order to obtain a sufficient quantity of LTA or LPS for detection. Thus, their invention lacks the ability to detect the non-culturable species present, nor would it allow for measures of toxicity of biological samples.
In U.S. Pat. No. 5,175,089, the use of the Limulus amebocyte lysate (LAL) endotoxin (LPS) assay was applied to the determination of the amount of endotoxin in the periodontal pocket. Though they were able to show overall amounts of endotoxin present, they lacked the ability to differentiate diseased versus healthy endotoxin and they were unable to quantify the level of virulence of the endotoxin. Further, their invention limited them to the Gram-negative endotoxin, as the LTA is not detectable via the LAL kit.
In US Pub. No. 2009/0047240, the chaperonin 10 (Cpn10) was used to modulate the clustering of Cpn10 in a cell line (murine RAW264) with labeled antibodies. Though they showed TLR-4, 7, and 9 reporter genes in an HEK cell line, their system would not allow for a more sensitive or low level detection needed for microbial populations with weaker activating LPS, since those genes were under the control of the NFkB binding sites only (a minimal promoter). Their system lacks the sensitivity needed to differentiate biological systems with multiple microbial species and no dominant organism present. Further, their system needs strong NFkB activators to overcome the weak promoter used in their system, thus unable to pick up weaker TLR LPS agonists, such as LPS from Porphyromonas gingivalis. Additionally, their system lacked the ability to detect TLR3 agonists, which would be deleterious to the characterization of an inflammatory disease, such as gingivitis.
US Pub. No. 2007/0160544 describes a method for determining orally deleterious bacteria. Their method calls for contacting a gingival cell with bacteria or a bacterial component and measuring an inflammatory marker. According to US Pub. No. 2007/0160544, the presence of a marker indicates inflammation and the labeling of a bacterium as deleterious. Conversely, they say that the absence of a marker indicates the bacterium is not a problem. Though they cited Toll-like receptors, which were known in the art as part of the pathway to generate cytokines, their method would have only allowed for determining the presence of a cytokine.
Since oral cells contain one or more of the receptors to which a bacterial virulence factor would activate, screening on the individual receptors requires the use of engineered cells, such as reporter cells containing the receptor gene of interest. What further complicates the use of native oral cells, such as gingival cells, is that the expression and activation of a receptor, such as a Toll-like receptor, is specific to the function of the cell. Gingival cells are less likely to respond to bacterial virulence factors, due to their constant contact with microbes in the dental plaque. Thus the need exists to have engineered cells where a direct response can be measured via a reporter system.
In addition to quantifying the virulence of microbial components and byproducts, there also exists a need for an in vitro screen of the inflammatory potential of organic and inorganic molecules, which would allow for pharmokinetic parameters to be determined.
SUMMARY OF THE INVENTION
A method of determining bacterial virulence in an oral cavity is provided that includes providing a reporter cell expressing at least one toll-like receptor; providing a sample of oral matter; combining the sample of oral matter and the reporter cell; and measuring the toll-like receptor activation. The method may also include the additional steps of providing another sample of oral matter from an individual who used an oral care composition prior to providing another sample of oral matter; combining the another sample of oral matter and the reporter cell; measuring the toll-like receptor response; and comparing the toll-like receptor response from the sample of oral matter and another sample of oral matter.
A method for determining the virulence of lipopolysaccharide comprising providing a lipopolysaccharide; providing a reporter cell expressing at least one Toll-like receptor; combining the reporter cell with the lipopolysaccharide; measuring the toll-like receptor activation; and quantifying the lipopolysaccharide.
A method for determining the virulence of lipoteichoic acid comprising providing a lipoteichoic acid; providing a reporter cell expressing at least one Toll-like receptor; combining the reporter cell with the lipoteichoic acid; measuring the toll-like receptor activation; and quantifying the lipoteichoic acid.
The present invention includes methods of improving and/or resolving the state of gingival inflammation utilizing molecules, peptides, or proteins/enzymes that bind to, alter, or chemically modify bacterial virulence factors and/or host response mechanisms. The methods provide a means of quantifying the level of lipopolysaccharide of oral tissues; and utilizes TLR-4 and TLR-2 reporter cells line combined with the detection LPS via a fluorescence assay, such as BODIPY TR cadaverine, or endotoxin detection assay, assay to assign potency and quantification of LPS. The invention also includes assays and protocols which enable communication and demonstrations to consumers and dental professionals utilizing the TLR reporter cells.
The present invention includes methods for determining the potency of lipopolysaccharide comprising: a) providing a lipopolysaccharide sample; b) providing reporter cells expressing one or more Toll-like receptors; c) exposing the cells to the lipopolysaccharide sample; d) measuring the EC50 value of the lipopolysaccharide on activation of a Toll-like receptor; e) quantification of the lipopolysaccharide.
The present invention also includes isolating lipopolysaccharide from a growth culture of Gram negative bacteria. A lipopolysaccharide may be isolated from a biological sample. The biological sample includes, but is not limited to, an oral plaque, saliva, gingival brush samples. Toll-like receptor reporter gene assays, such as TLR4-SEAP and/or TLR2-SEAP, may be used to detect and quantify bacterial toxins, including but not limited to endotoxins, in a biological sample.
A BODIPY TR cadaverine assay may be used to detect and quantify lipopolysaccharide in a biological sample. In addition, LAL (the Limulus amebocyte lysate assay) assay or endotoxin detection assay may be used to detect and quantify the lipopolysaccharide in a biological sample.
The present invention may be directed toward a method for determining the potency of an oral biofilm comprising: a) providing a biofilm sample; b) providing reporter cells expressing one or more Toll like receptors; c) exposing the cells to the biofilm sample; d) measuring the EC50 value of the biofilm activation of a Toll like receptor; e) quantification of the lipopolysaccharide. The biofilm may be an oral plaque, including but not limited to subgingival plaque, marginal or gumline plaque, supragingival plaque.
The present invention may also be directed toward a method for determining the potency of virulence in an oral sample comprising: a) providing an oral sample; b) providing reporter cells expressing one or more Toll-like receptors; c) exposing the cells to the oral sample; d) measuring the EC50 value of the biofilm activation of a Toll like receptor; e) quantification of the lipopolysaccharide. The oral sample may include saliva, oral lavage or gingival crevicular fluid.
BRIEF DESCRIPTION OF THE DRAWINGS
FIG. 1A is a graph showing secretion of LPS during bacterial growth in culture.
FIG. 1B is a graph showing time course of bacterial growth in culture medium.
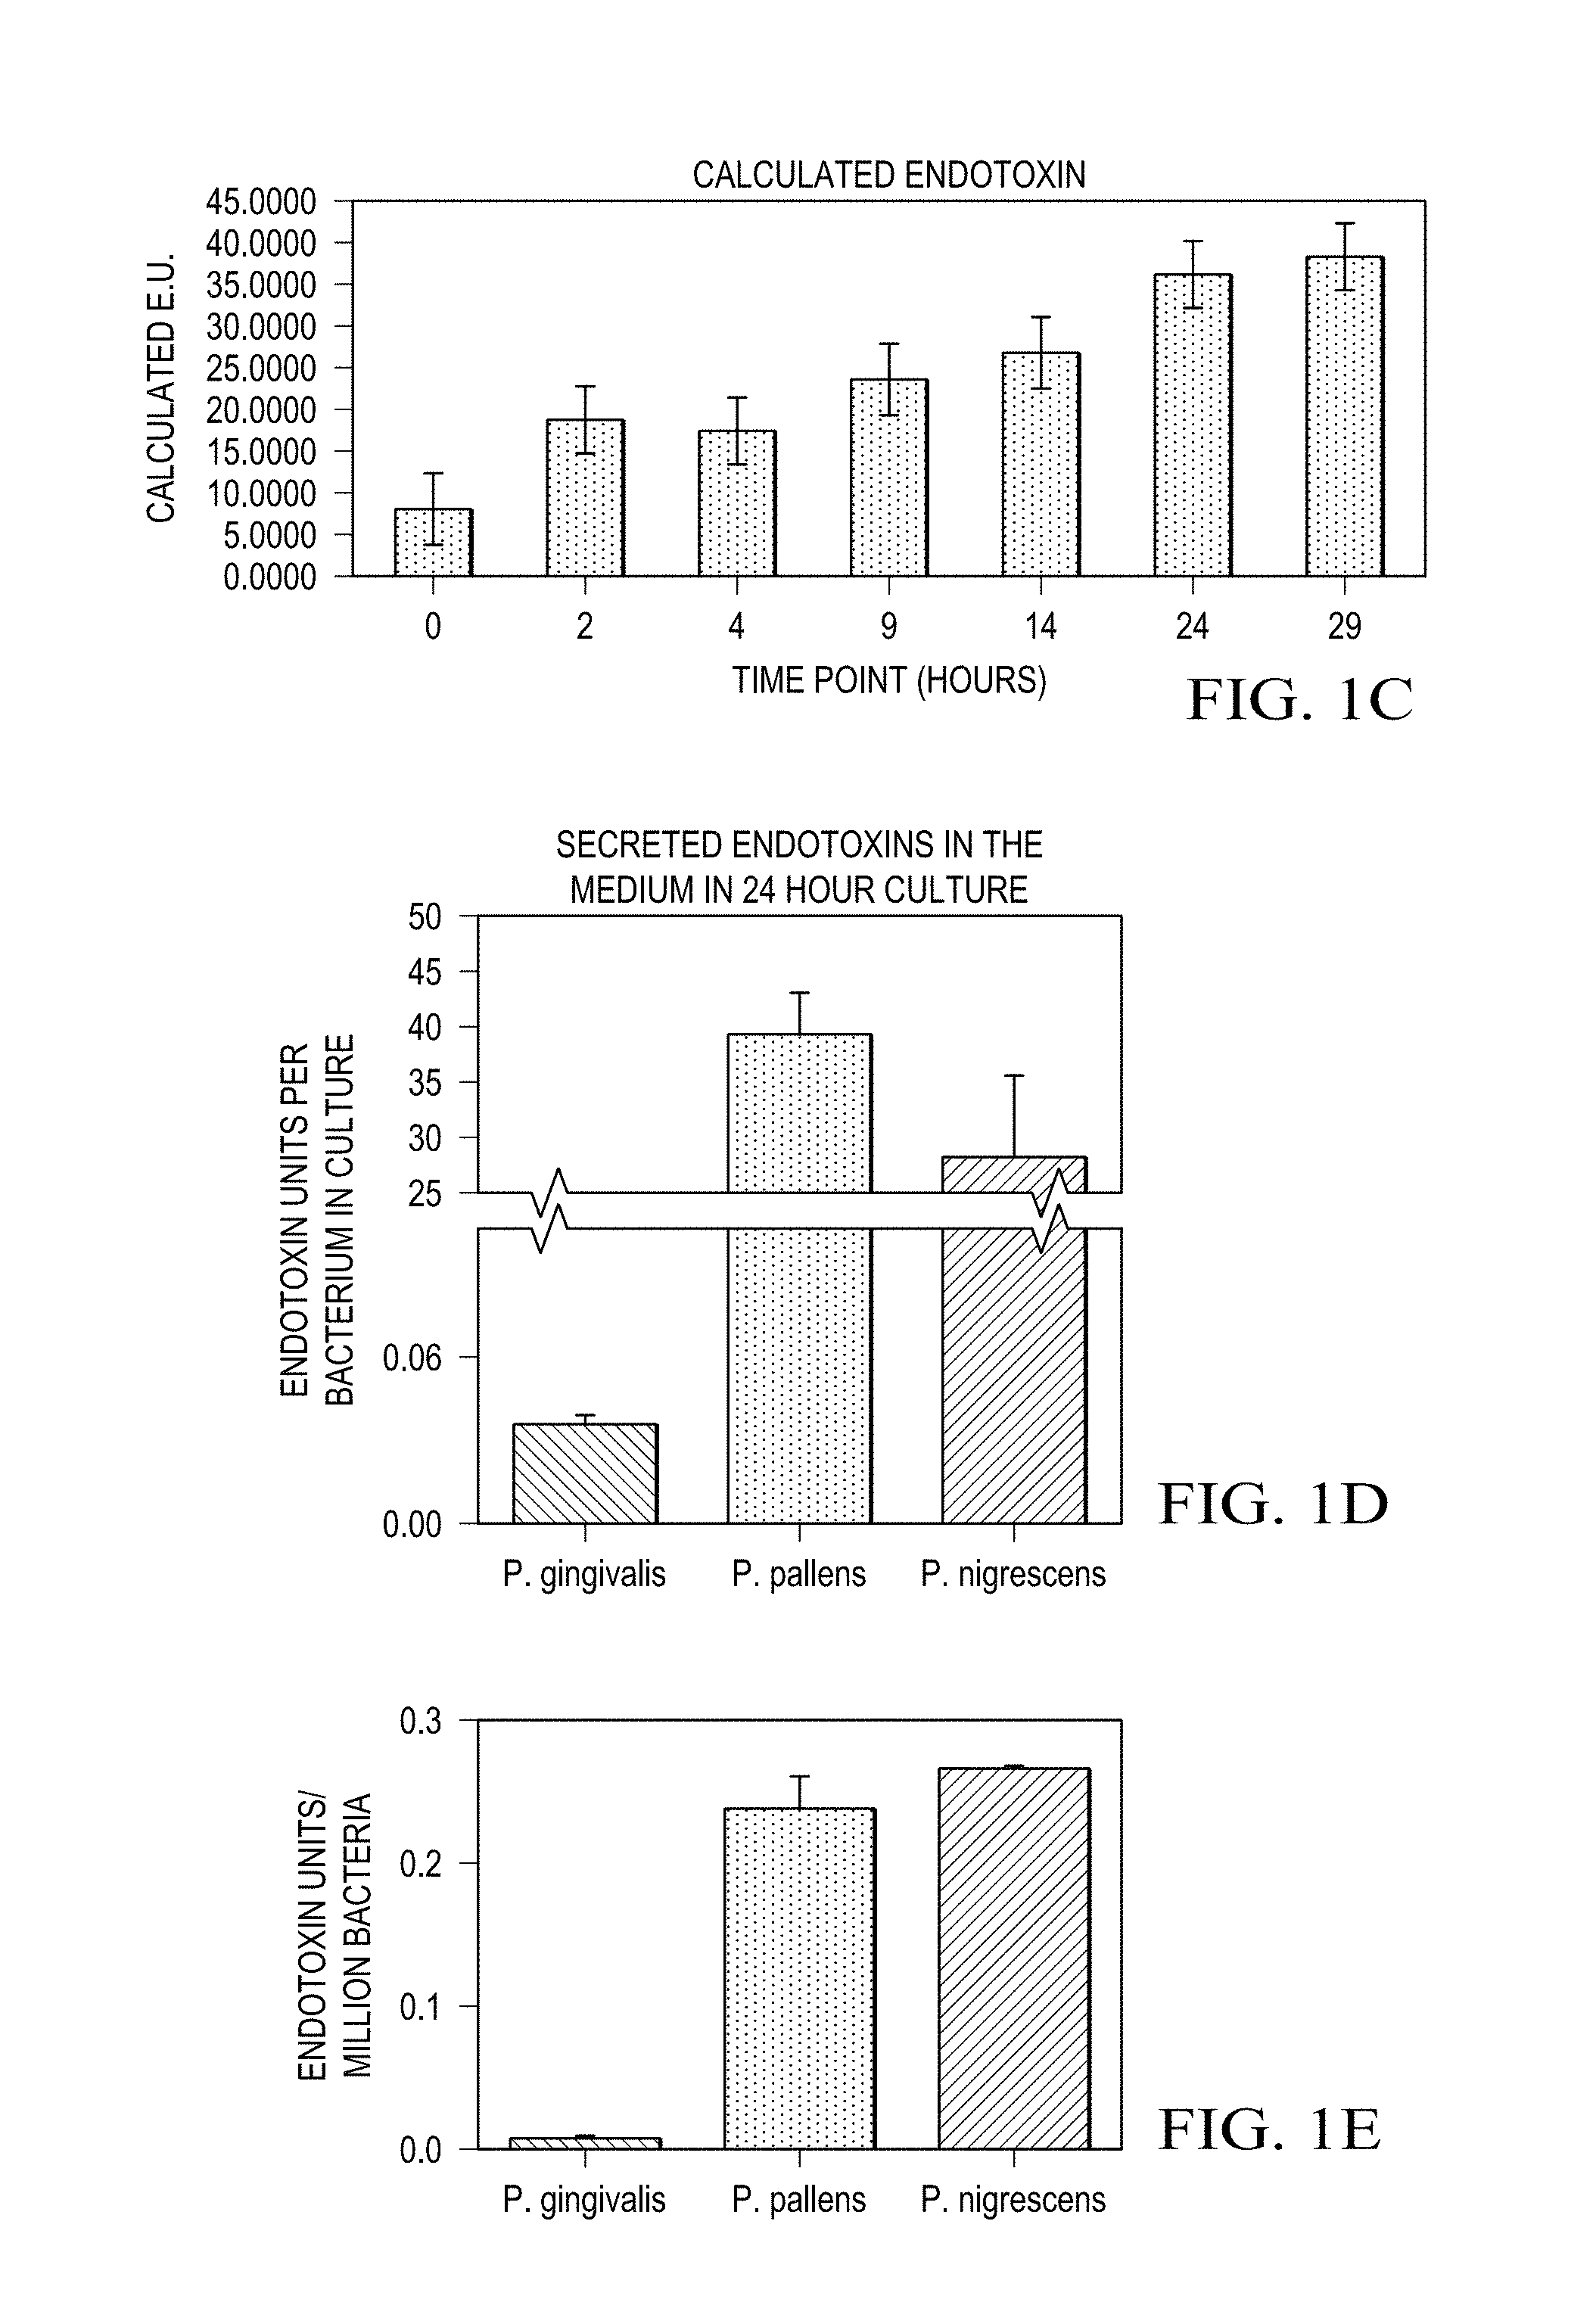
FIG. 1C is a graph showing secretion of LPS during bacterial growth in culture.
FIG. 1D is a graph showing secretion of LPS during bacterial growth in culture at 24 hours. P. pallens and P. nigrescens released more LPS into the medium than P gingivalis.
FIG. 1E is a graph showing the amount of LPS per bacterium during bacterial growth in culture at 24 hours. P. pallens and P. nigrescens contain more LPS than P gingivalis.
FIG. 1F is a picture showing the taking of gingival plaque samples using Periopaper.
FIG. 2A is a graph showing cell culture and virulence determination of lipopolysaccharide from different bacteria.
FIG. 2B is a graph showing activation of TLR4 reporter gene in culture.
FIG. 2C is a graph showing activation of TLR4 reporter gene in culture.
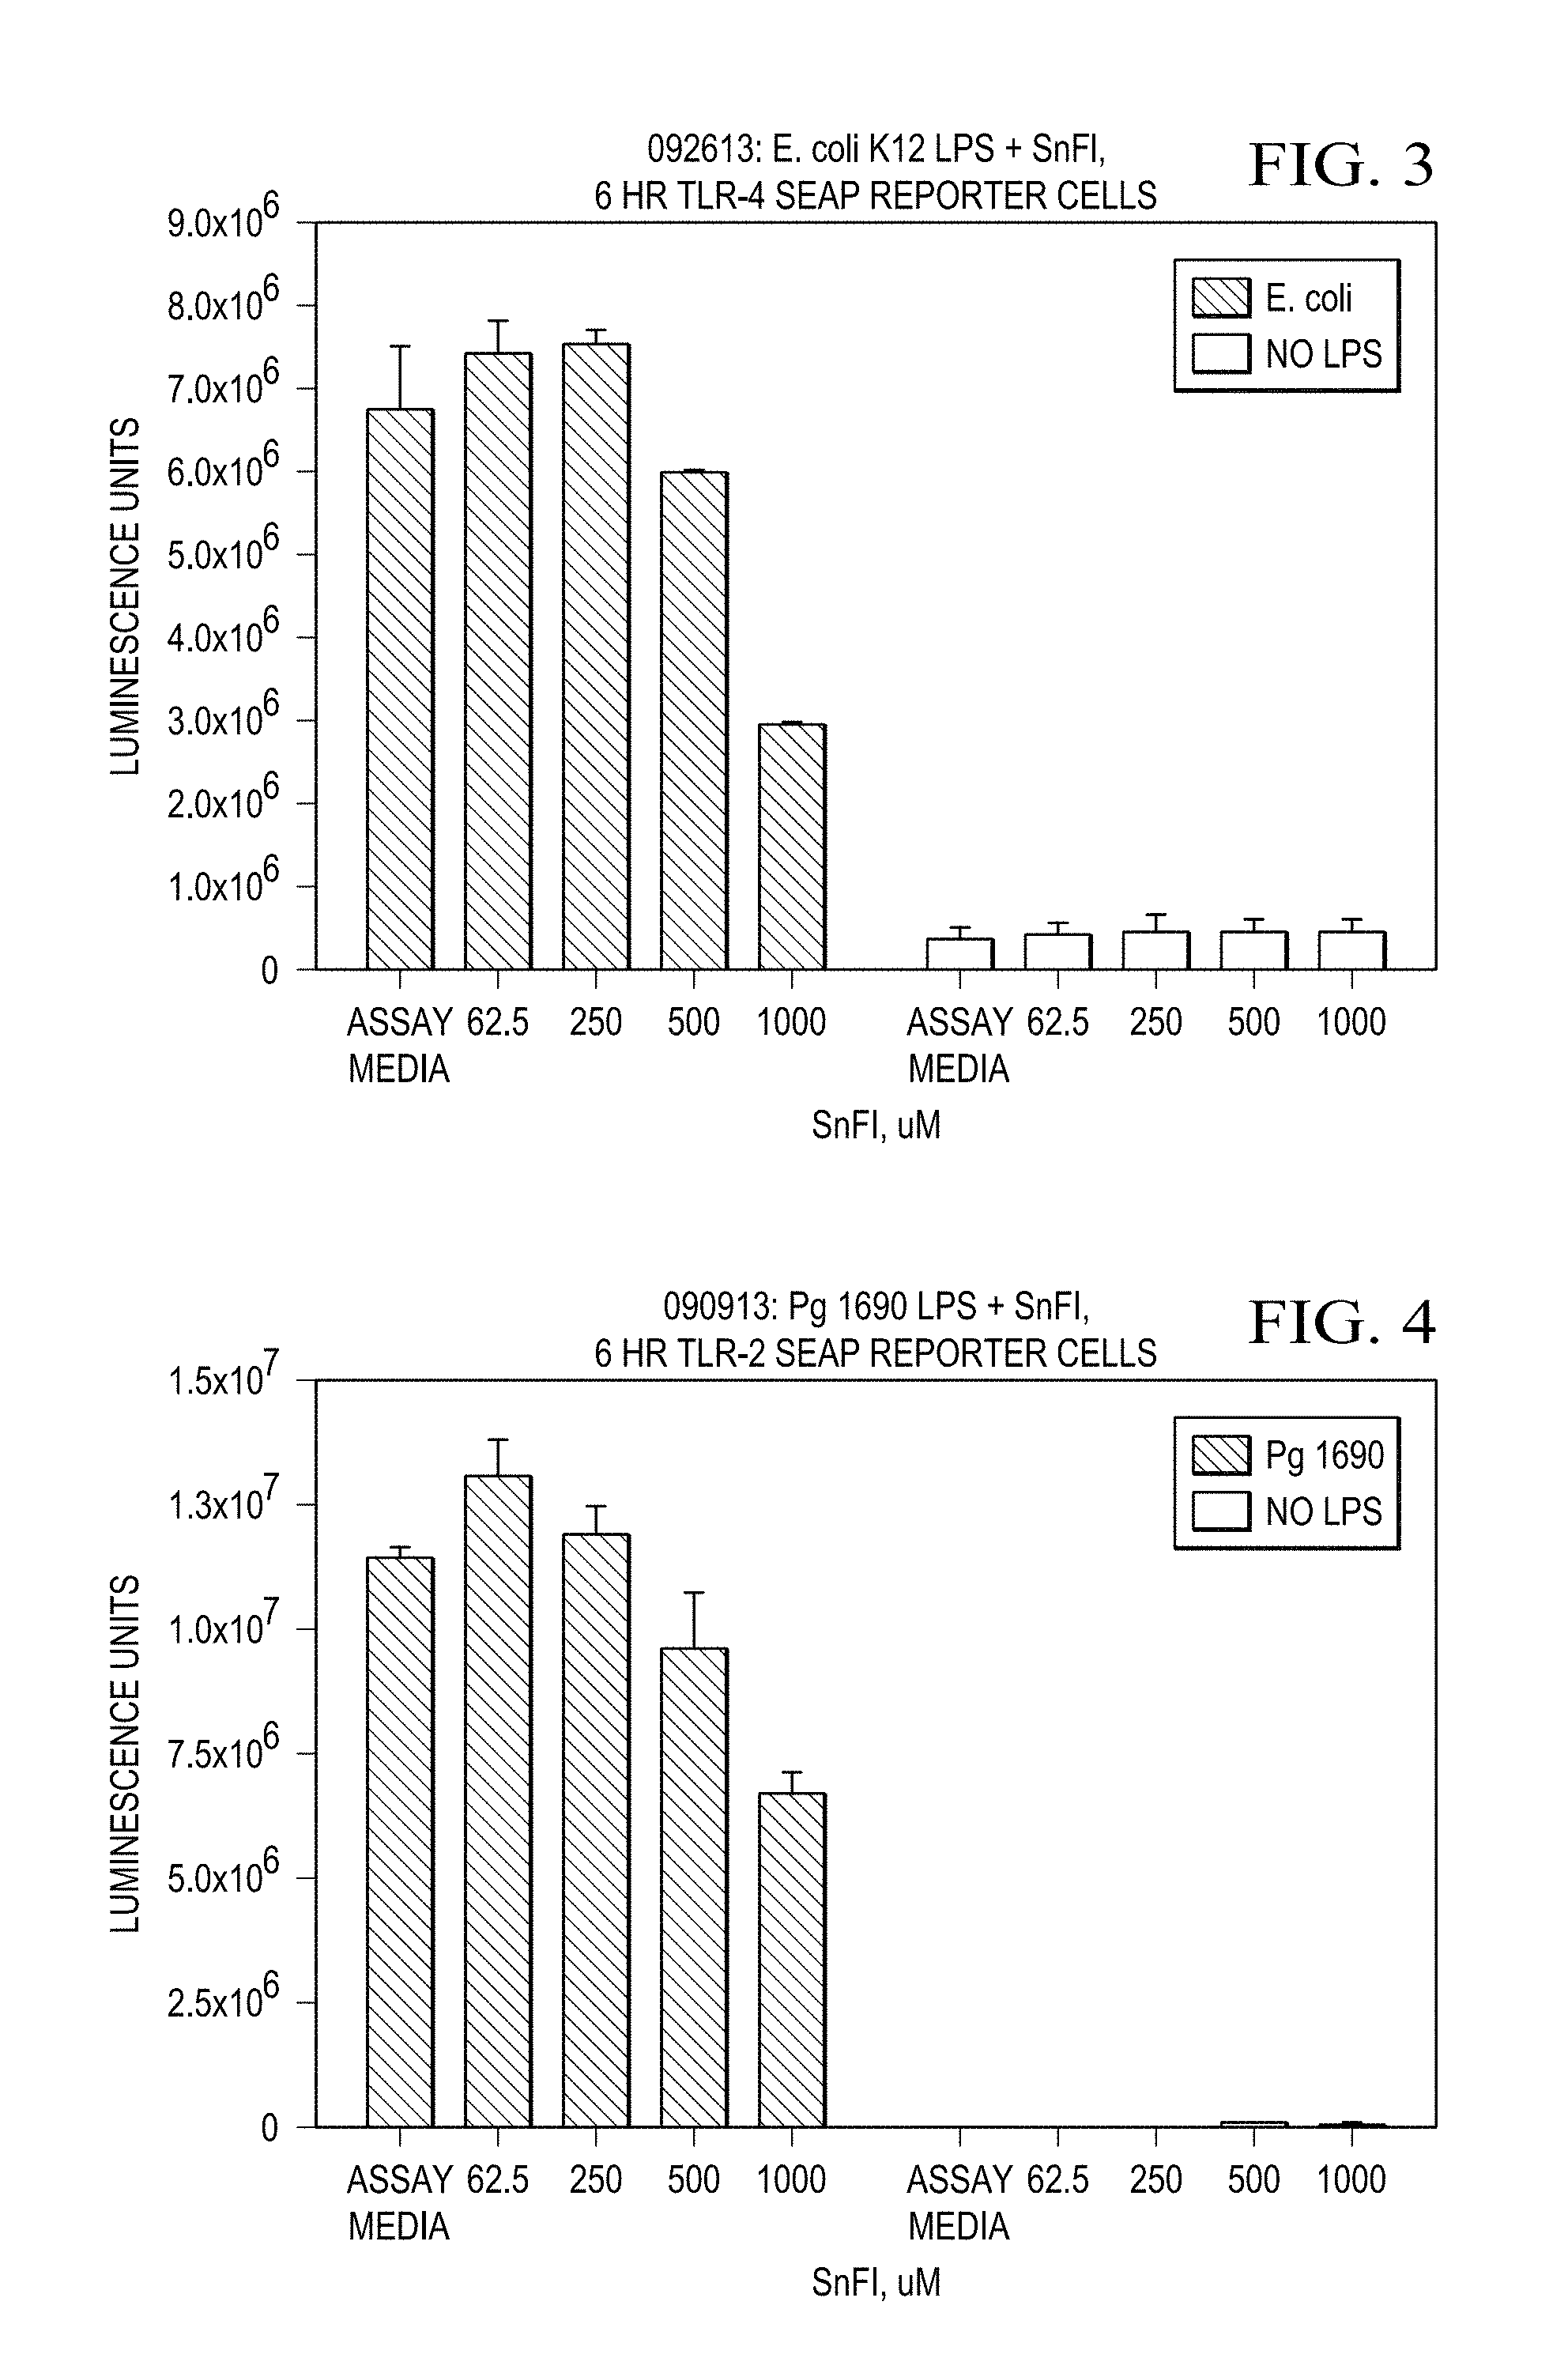
FIG. 3 is a graph showing stannous fluoride inhibition of TLR4 reporter gene expression.
FIG. 4 is a graph showing stannous fluoride prevention of P. gingivalis LPS from activating TLR2 reporter gene expression.
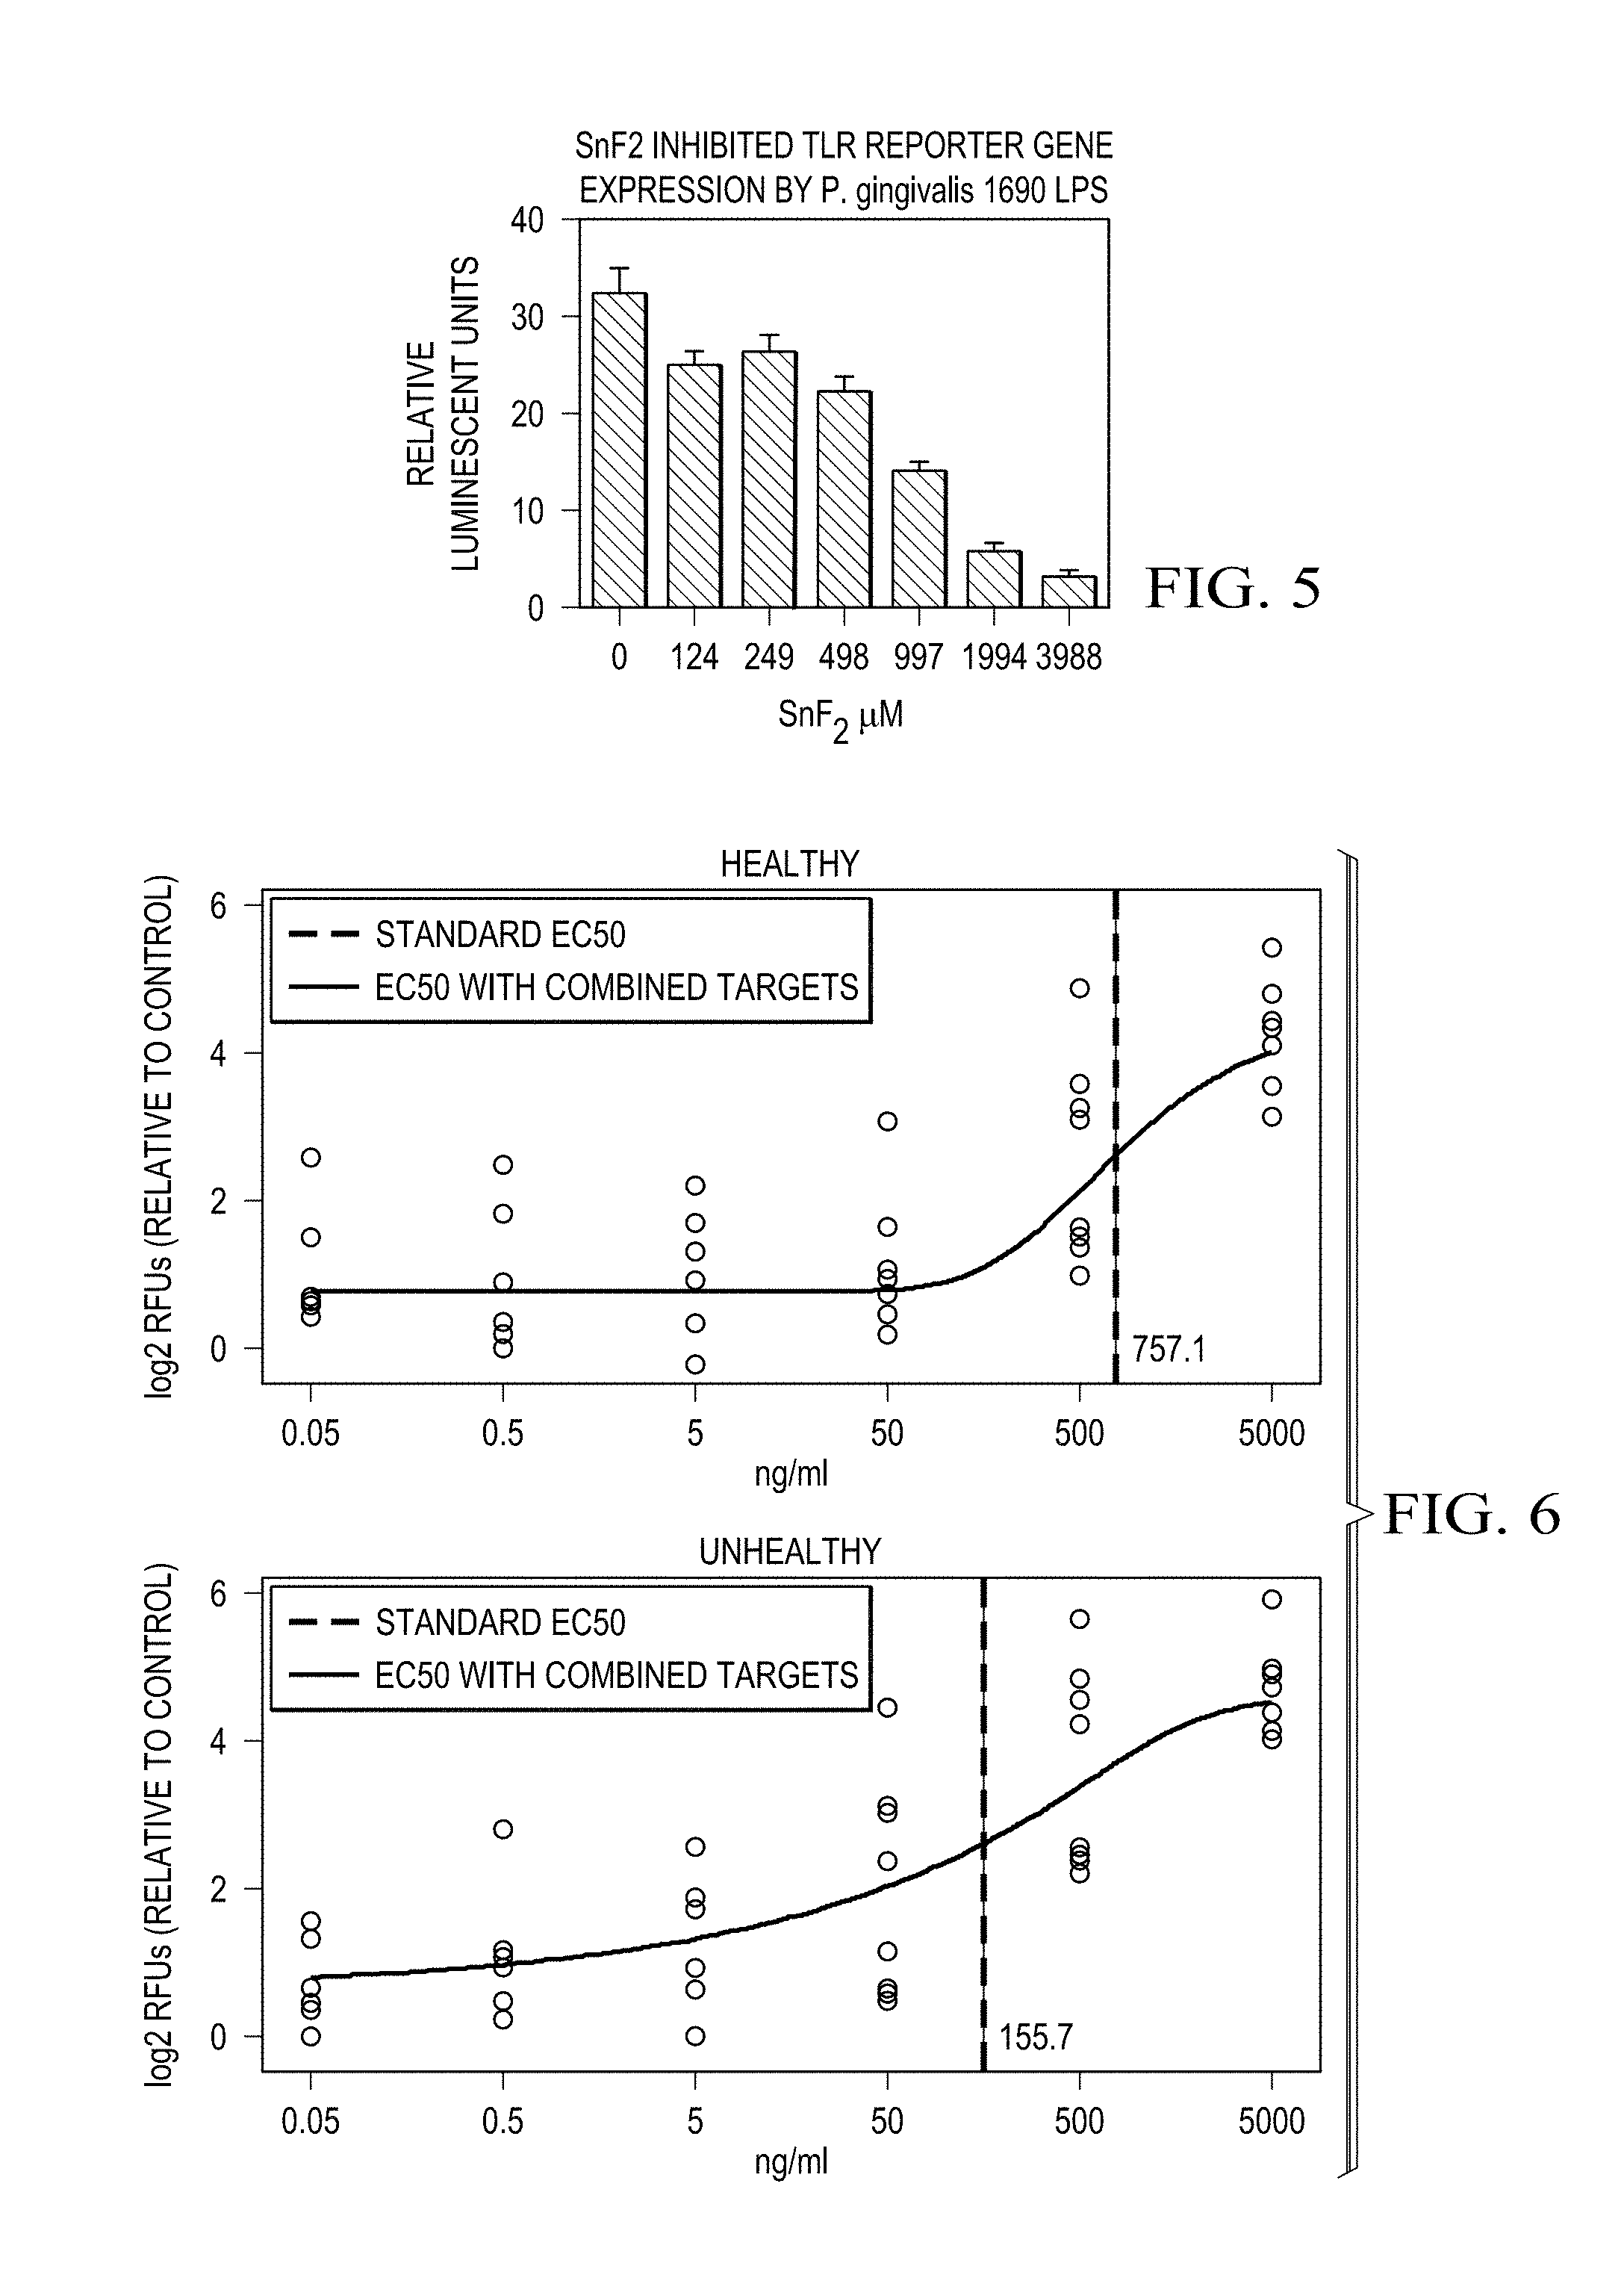
FIG. 5 is a graph showing percentage reduction of P. gingivalis LPS on activation of TLR-4 by stannous fluoride.
FIG. 6 is a graph showing EC50 determination of subgingival plaques that activate TLR4-SEAP signal transduction. Dental plaques from unhealthy sites had a smaller EC50 than those from healthy sites, suggesting the dental plaques from unhealthy sites contain more virulence factors.
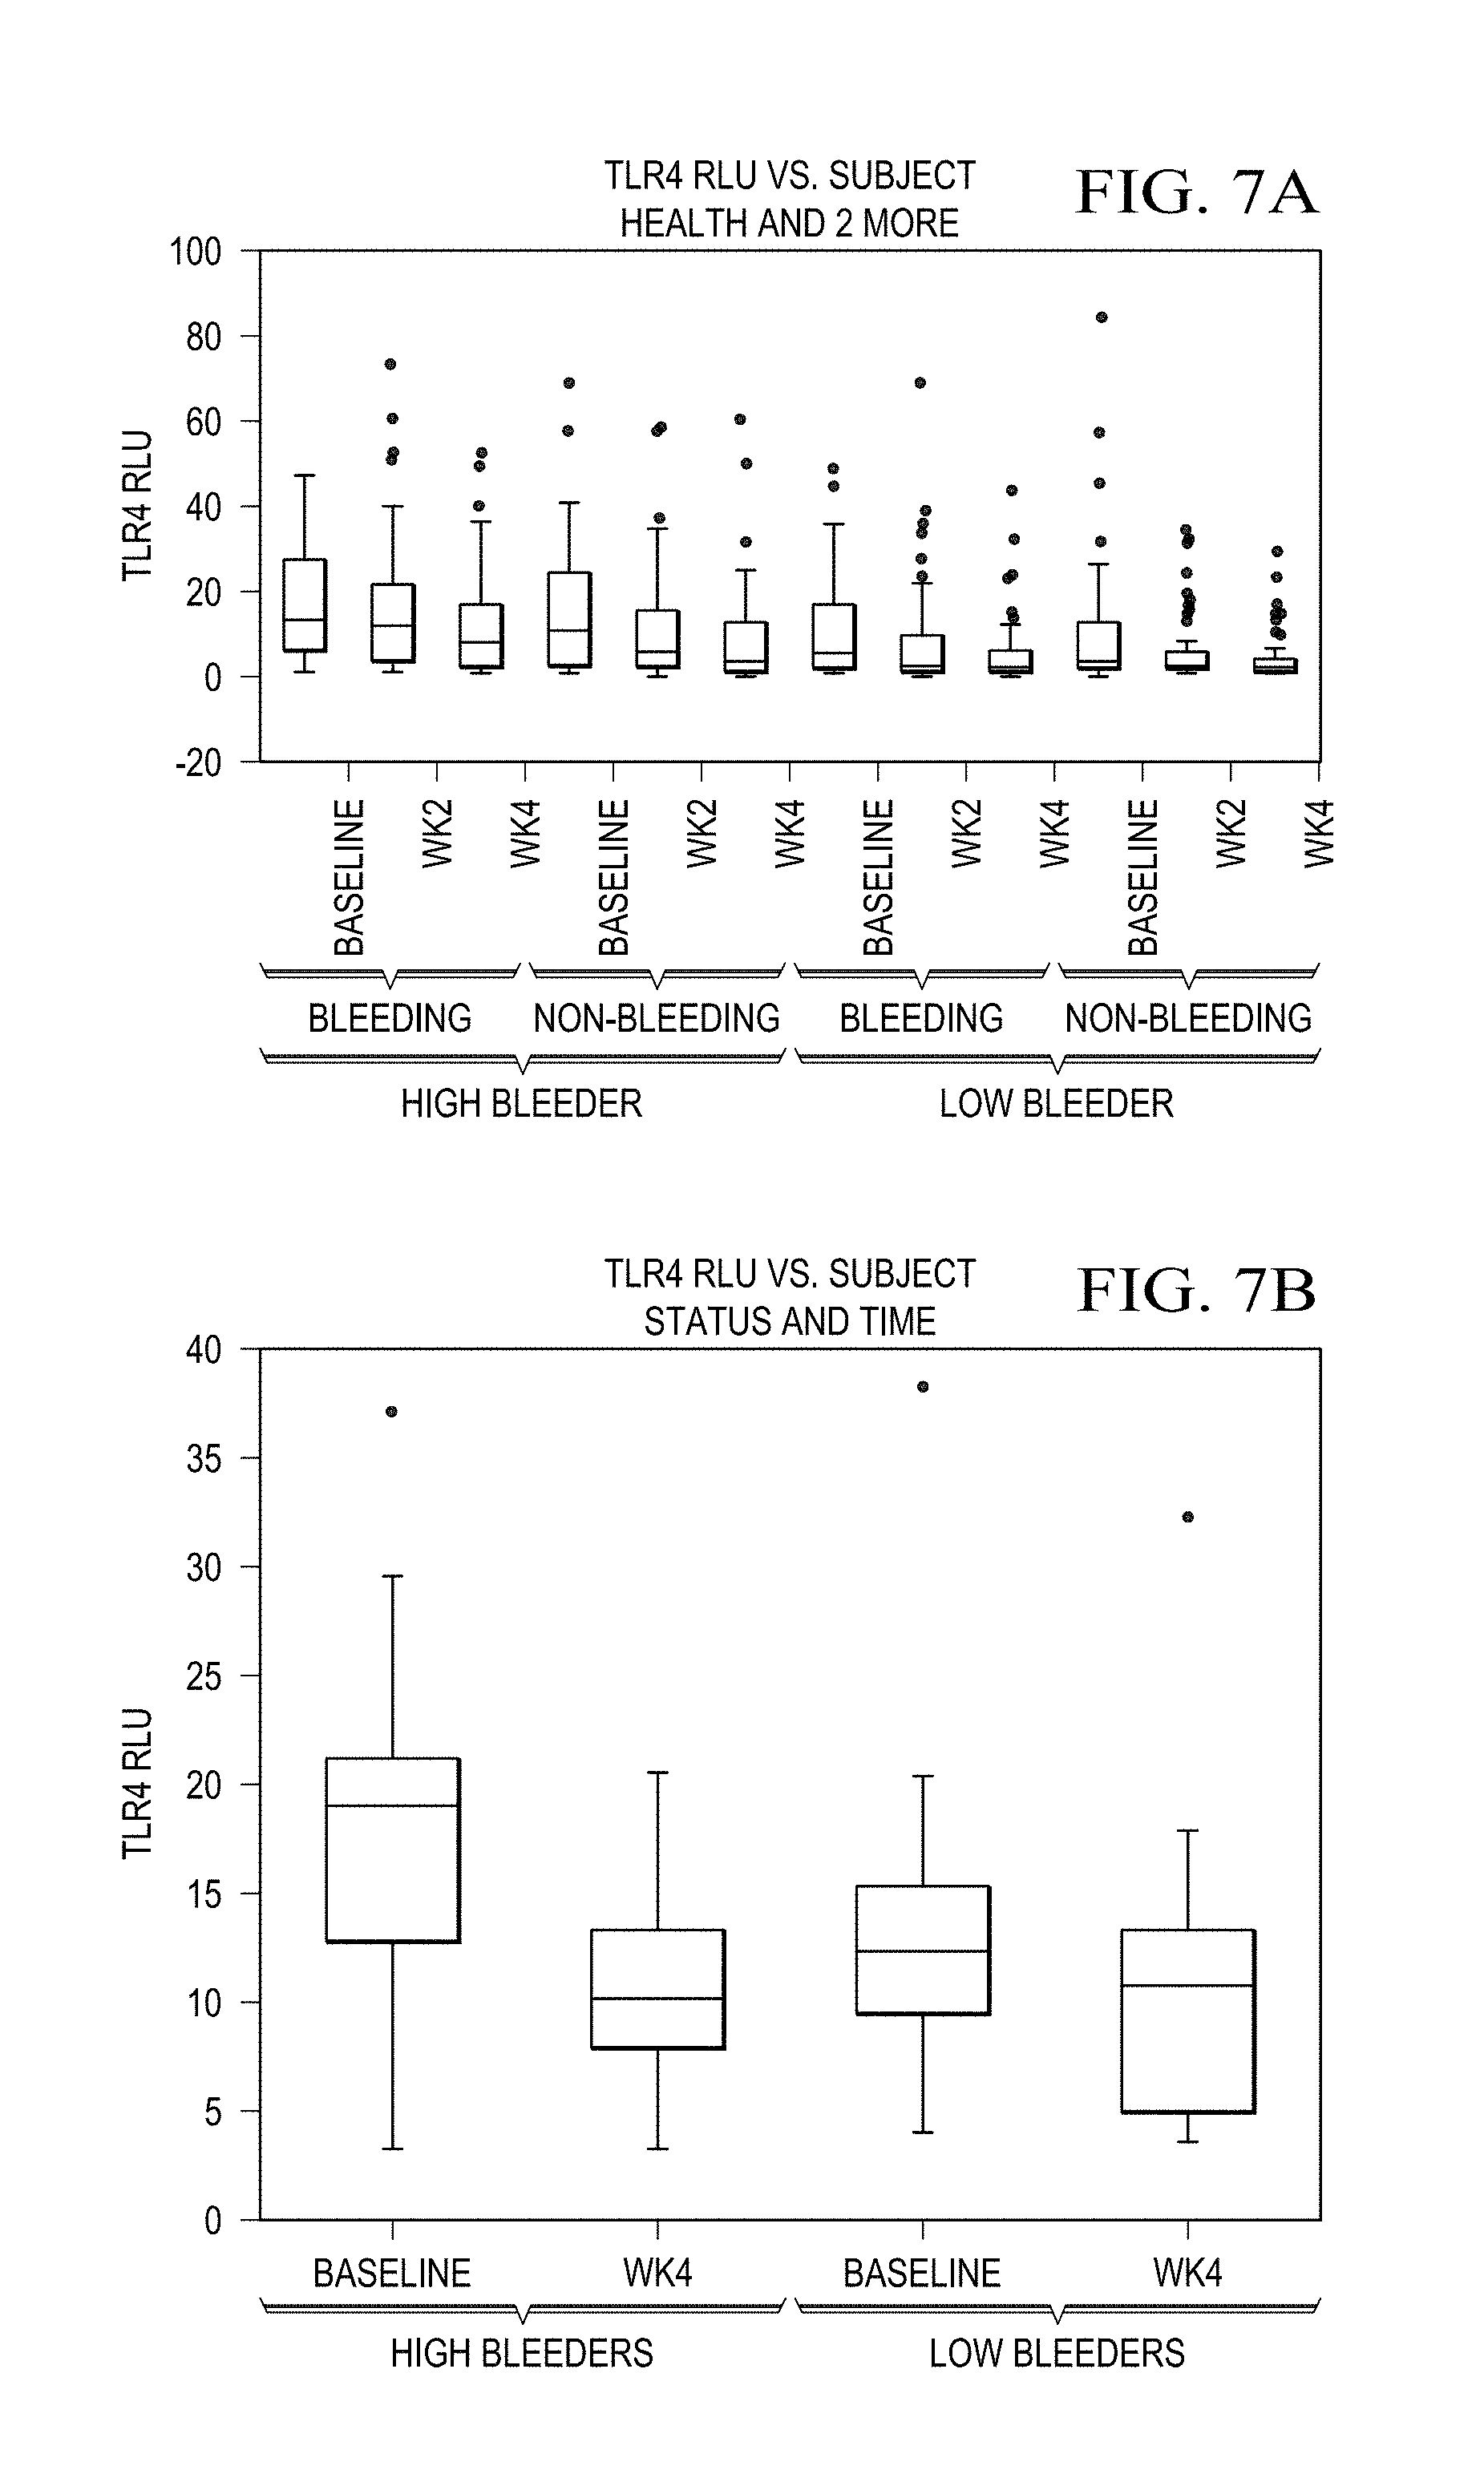
FIG. 7A is a graph showing TLR4 Evaluation of Human Subgingival Plaque (Healthy vs. Gingivitis).
FIG. 7B is a graph showing TLR4 Evaluation of Human oral lavage (Healthy vs. Gingivitis). and
FIG. 8A is a graph showing cell culture and virulence determination of LTA from different bacteria.
FIG. 8B is a graph showing cell culture and virulence determination of LPS from different bacteria.
FIG. 8C is a graph showing cell culture and virulence determination of LPS from different bacteria.
FIG. 8D is a graph showing cell culture and virulence determination of LPS from different bacteria.
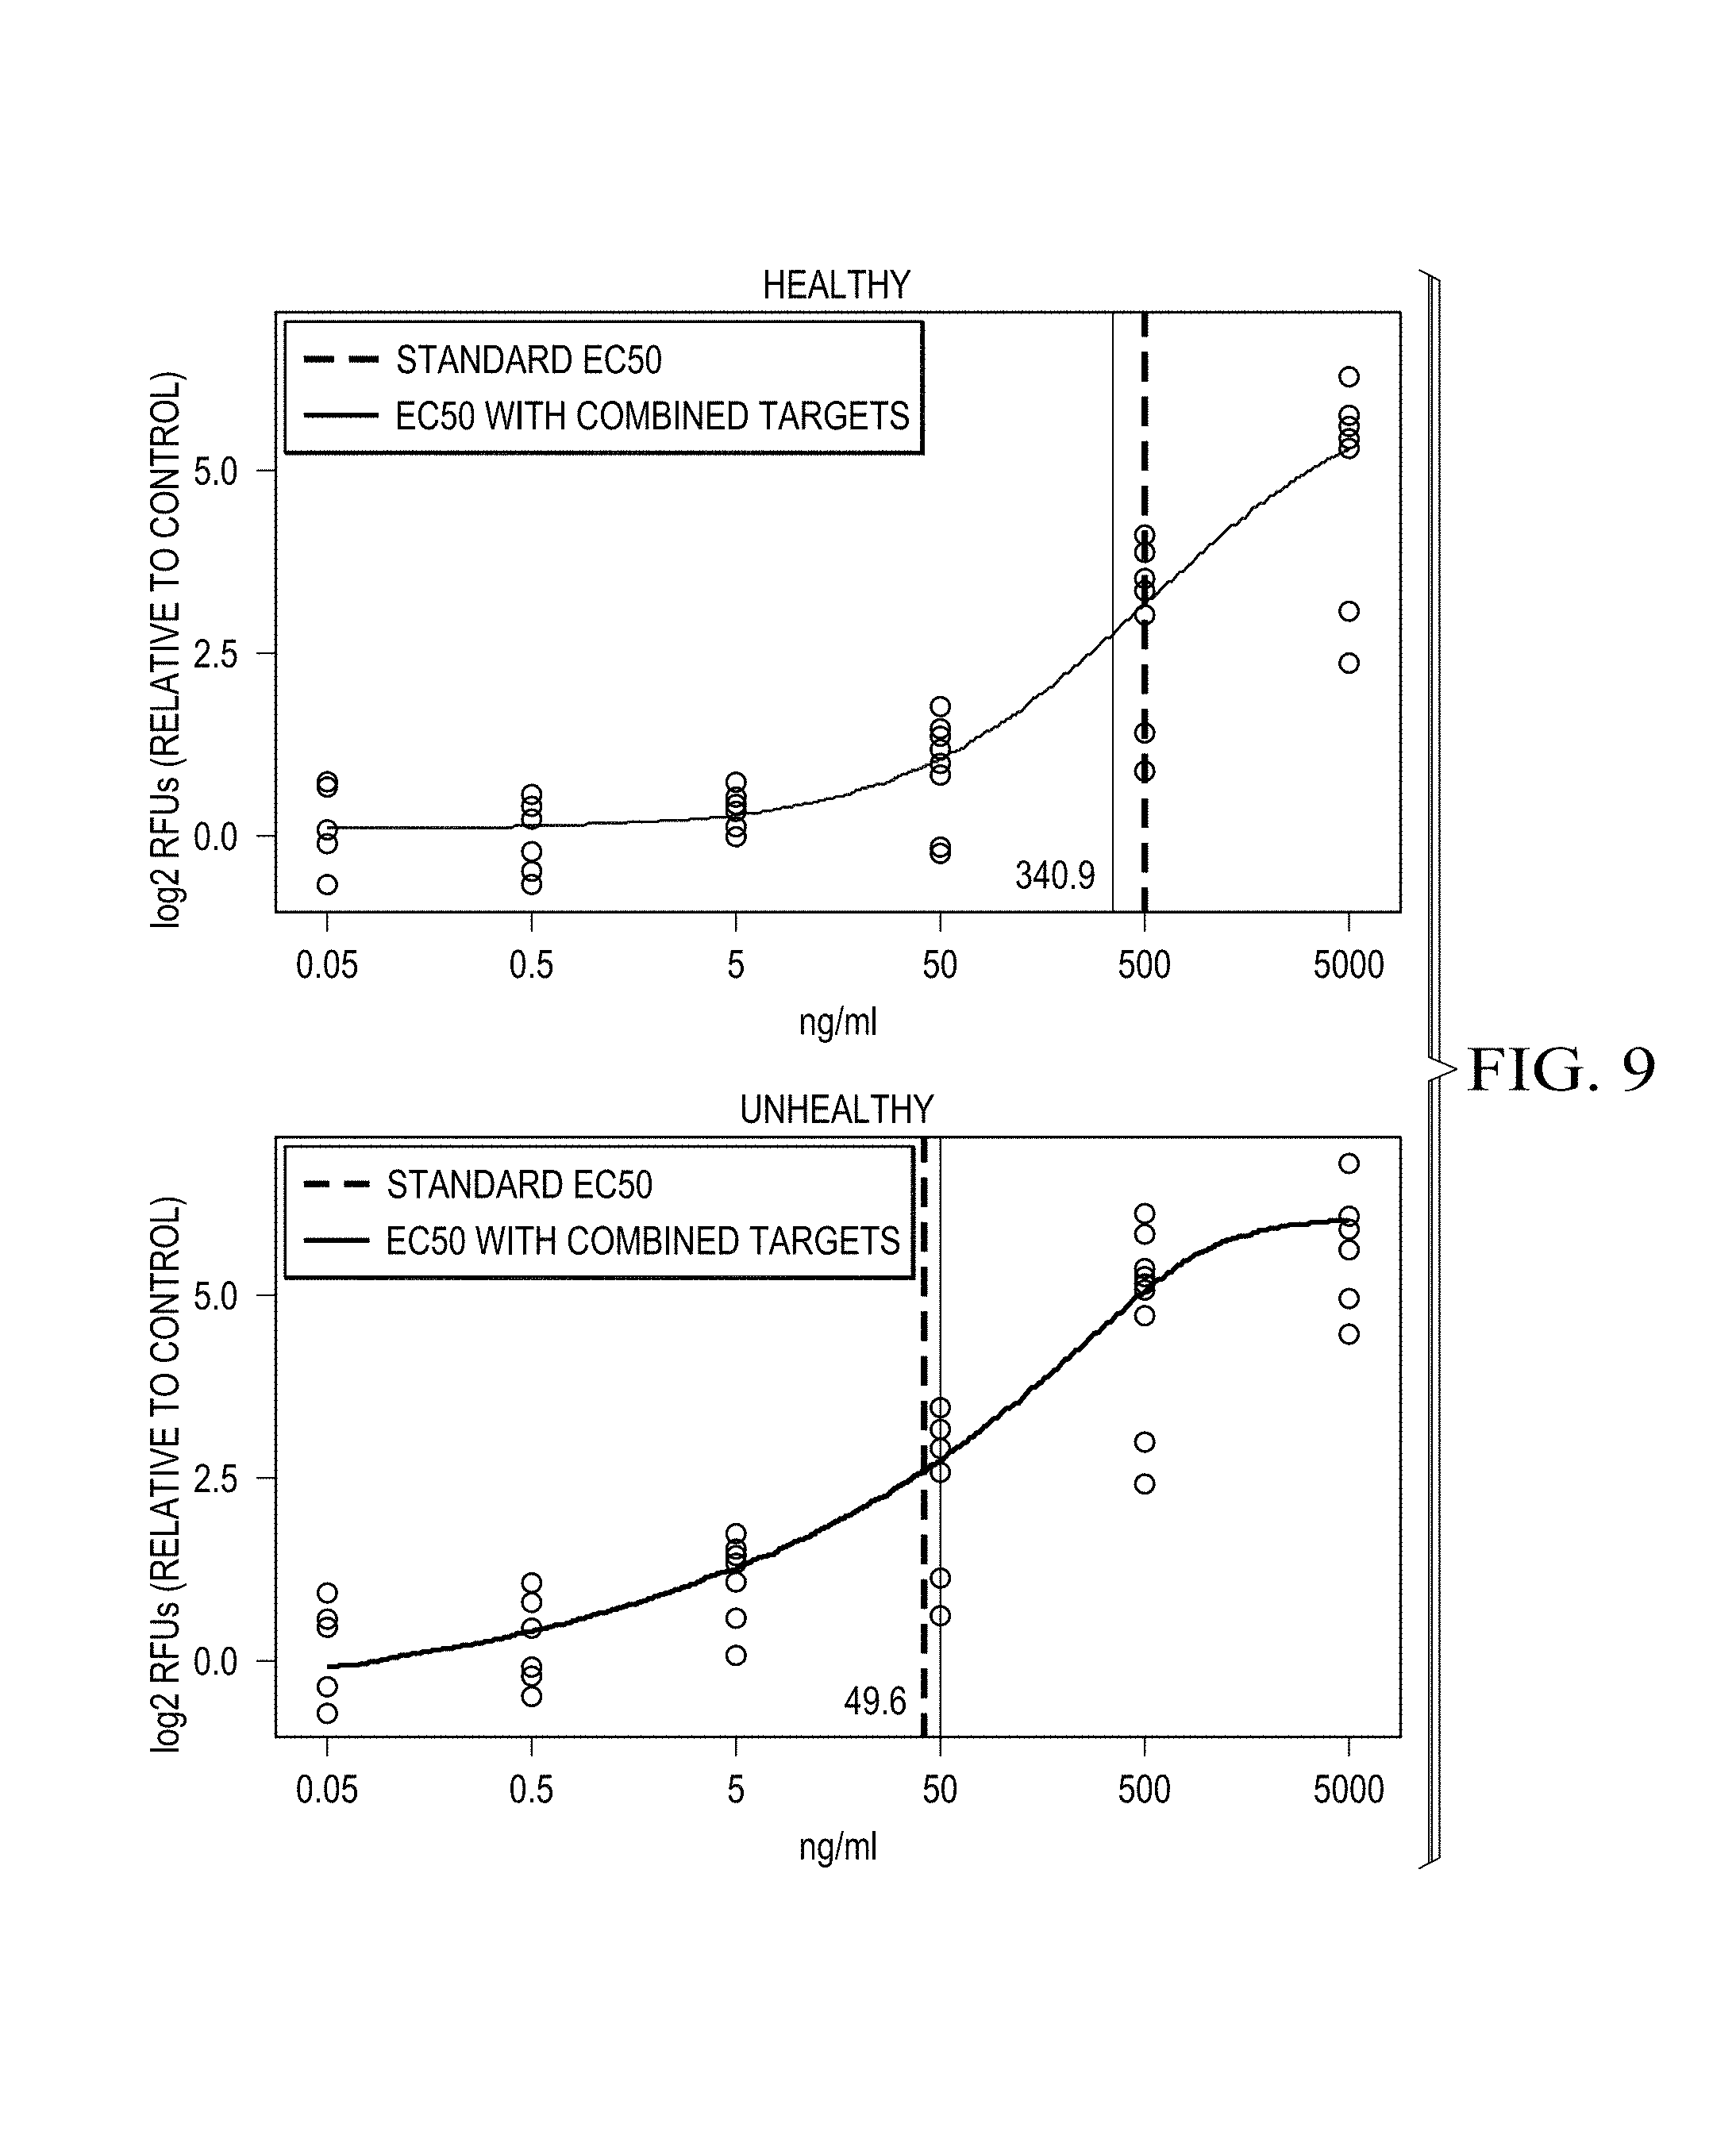
FIG. 9 is an EC50 graph showing determination of subgingival plaques that activate TLR2-SEAP signal transduction.
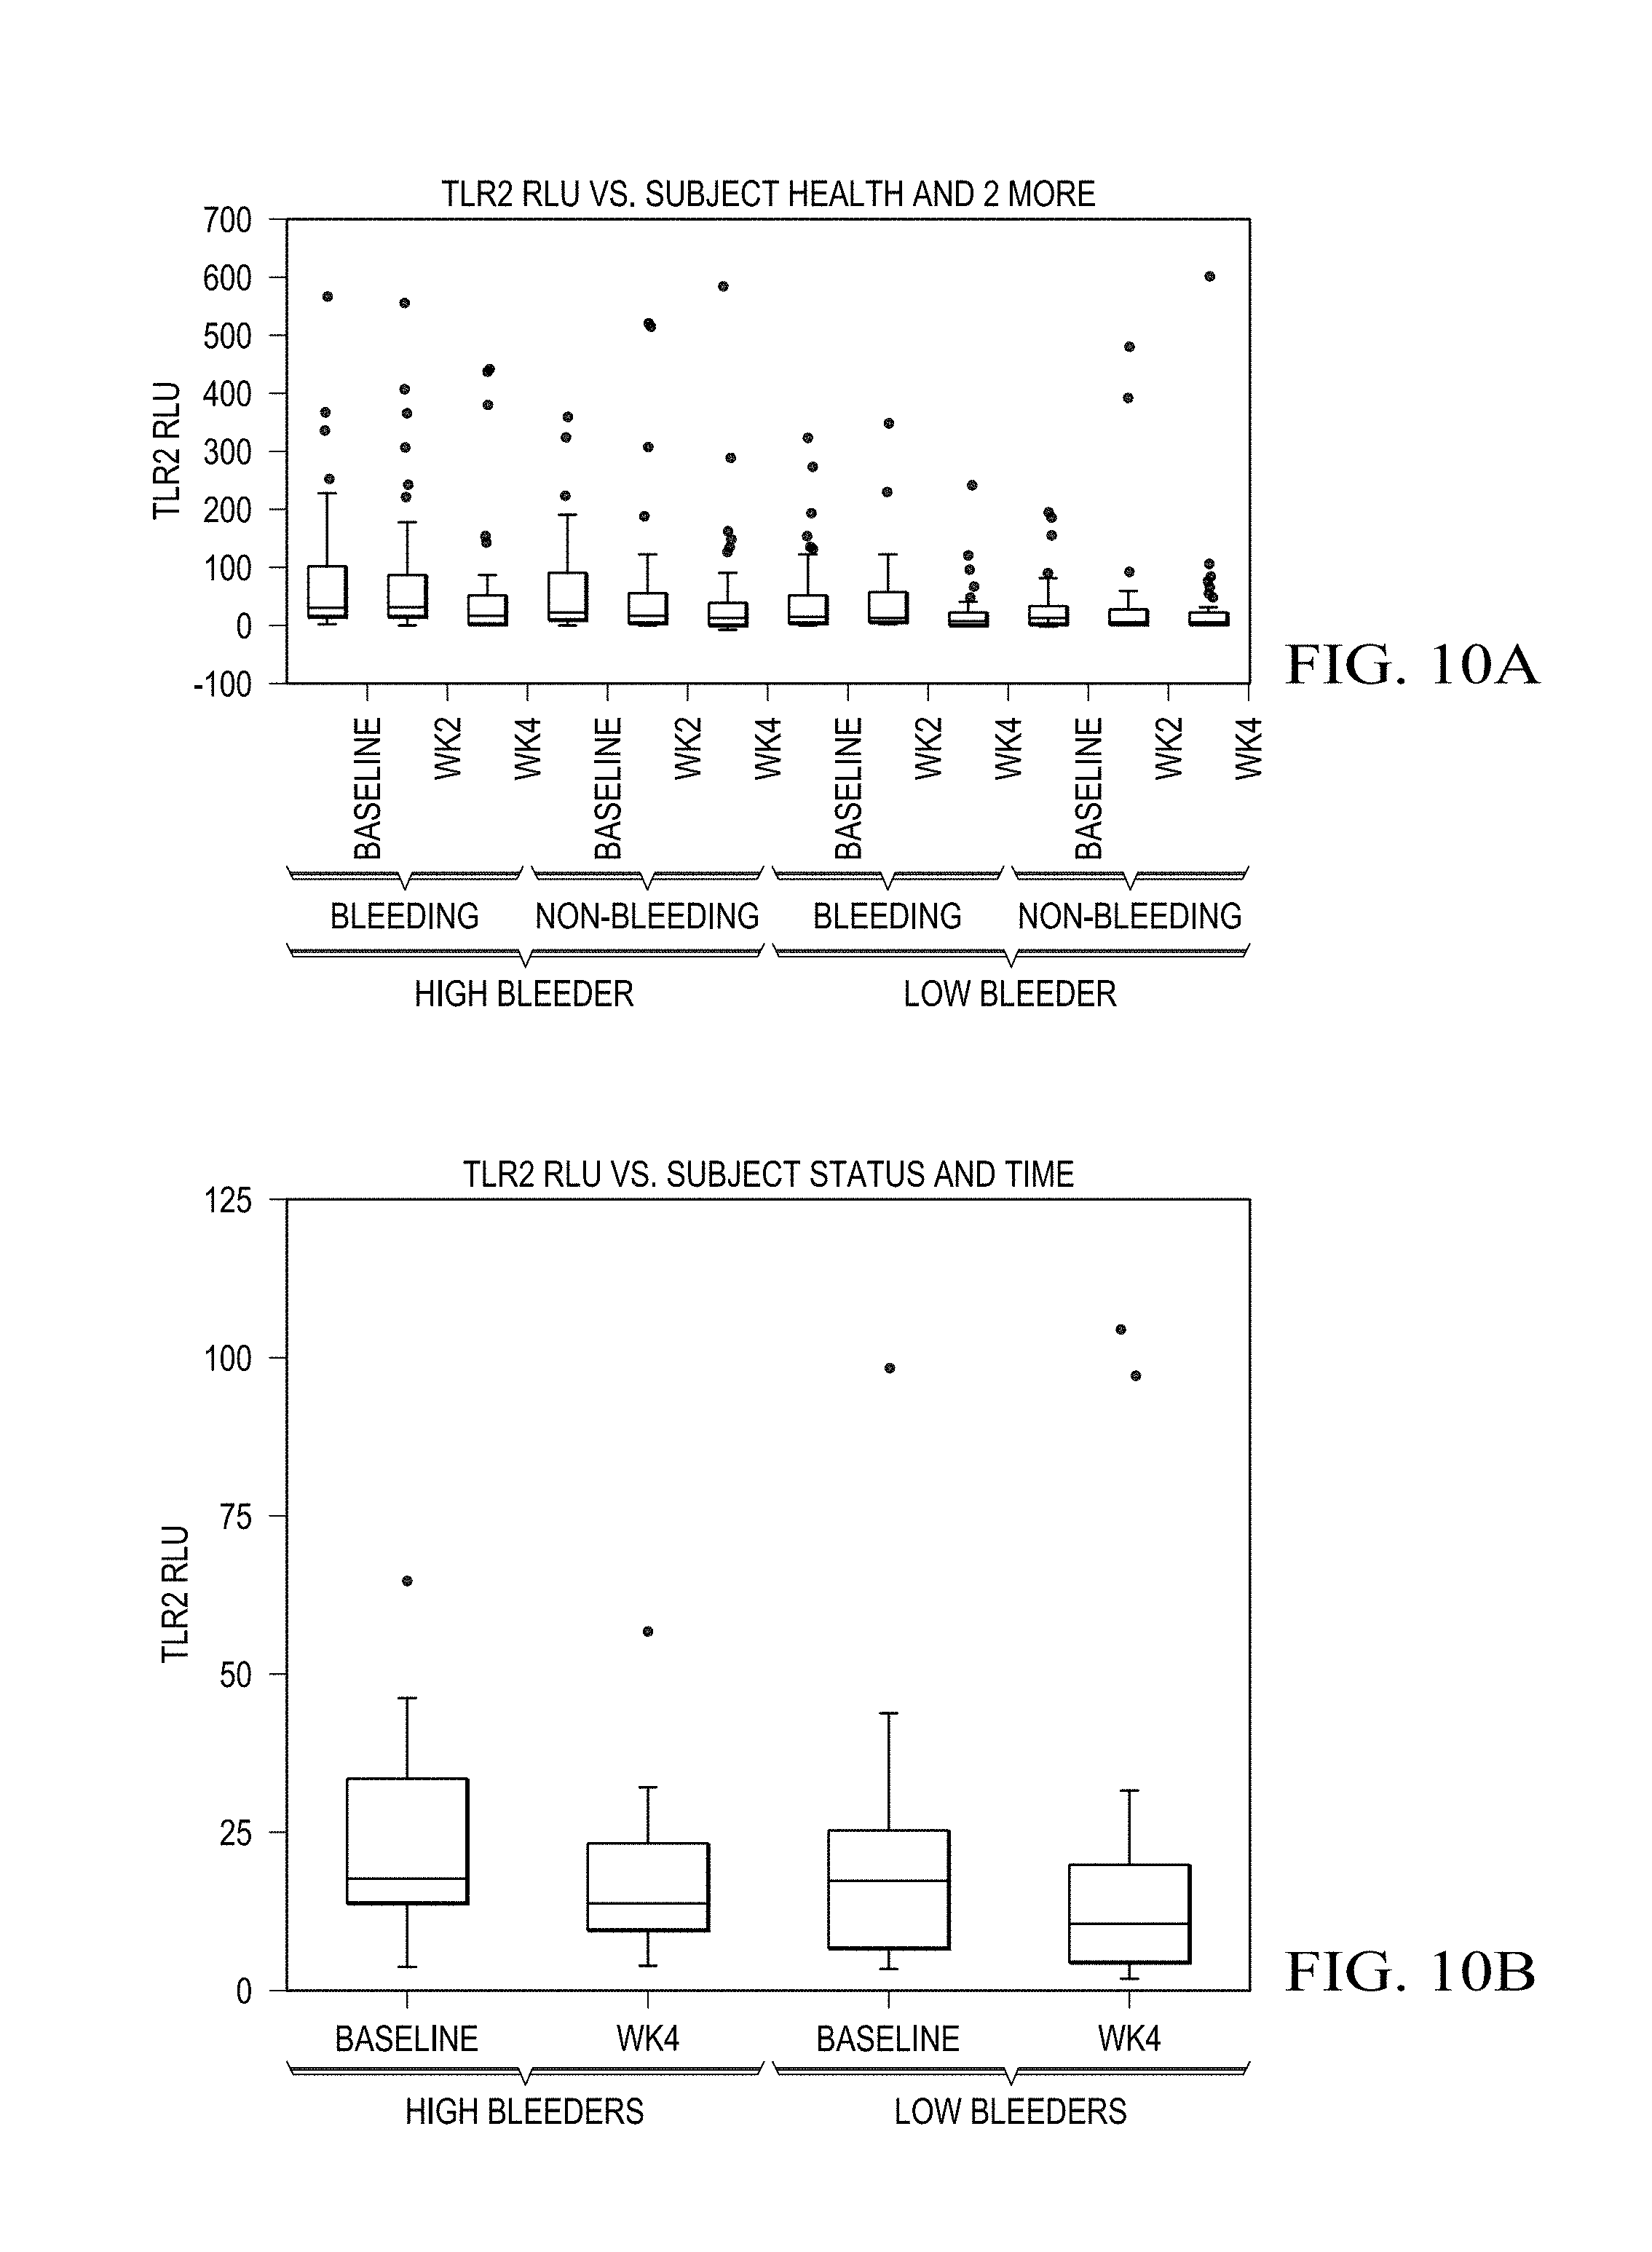
FIG. 10A is a graph showing TLR2 Evaluation of Human Subgingival Plaque (Healthy vs. Gingivitis).
FIG. 10B is a graph showing TLR2 Evaluation of Human oral lavage (Healthy vs. Gingivitis).
FIG. 11 is a graph showing cell culture and virulence determination of flagellins from different bacteria.
FIG. 12A is a graph showing LPS Stimulated TLR Activity in Human Monocytes THP-1.
FIG. 12B is a graph showing Evaluation of Human oral lavage (Healthy vs. Gingivitis) using the IRF-Luc reporter gene in THP-1 cells.
FIG. 12C is a graph showing Evaluation of Human Subgingival Plaque (Healthy vs. Gingivitis) in THP-1 cells using the NFkB reporter gene.
FIG. 13 is a graph showing detection of LTA of different bacteria in THP1 dual reporter cells.
FIG. 14 is a graph showing clinical measurements.
FIG. 15 is graphs showing decreases in bacterial abundance in the supragingival plaques during six weeks of regimen treatment.
FIG. 16 is a graph showing citrulline concentrations in Buccal-brush samples over a six-week regimen treatment.
FIG. 16A is a figure showing the relationship between FIG. 16A-1, FIG. 16A-2, and FIG. 16A-3.
FIG. 16A-1 is graphs showing decreases in bacterial abundance in the supragingival plaques during six weeks of regimen treatment.
FIG. 16A-2 is graphs showing decreases in bacterial abundance in the supragingival plaques during six weeks of regimen treatment.
FIG. 16A-3 is graphs showing decreases in bacterial abundance in the supragingival plaques during six weeks of regimen treatment.
FIG. 17 is a graph showing protein bound ornithine in Buccal brush samples during treatment.
FIG. 18 is a diagram showing enzymes in the ornithine, citrulline and arginine cycle.
FIG. 19 is a graph showing expression of ornithine, citrulline and arginine genes during a 6-week treatment.
FIG. 20 is a graph showing citrulline concentrations increased in Buccal-brush samples in experimental gingivitis.
FIG. 21 is graphs showing protein bound citrulline in Buccal brush samples in experimentally induced gingivitis.
FIG. 22 is graphs showing concentrations of protein bound ornithine in Buccal-brush samples in experimentally induced gingivitis.
FIG. 23 is graphs showing concentrations of total ornithine in Buccal-brush samples in experimentally induced gingivitis.
FIG. 24 is graphs showing concentrations of protein bound arginine in Buccal-brush samples in experimentally induced gingivitis.
FIG. 25 is a graph showing concentrations of total arginine in Buccal-brush samples in experimentally induced gingivitis.
FIG. 26 is a graph showing citrulline inhibited cytokine production stimulated by P. gingivalis LPS 1690 in THP-1 cells.
FIG. 27 is graphs showing bacterial LTA reduces fluorescent intensity of BC in a dose dependent manner.
FIG. 28 is graphs showing LPS reduces the fluorescent intensity of BC in a dose-dependent manner.
FIG. 29 is graphs showing the supernatant of bacterial culture reduces the fluorescent intensity of BC in a dose-dependent manner.
FIG. 30 is graphs showing bacteria reduce the fluorescent intensity of BC in a dose-dependent manner.
FIG. 31 is graphs showing EC50 values.
DETAILED DESCRIPTION OF THE INVENTION
As disclosed herein, it was surprisingly discovered that one or more methods could be used to detect and quantify the virulence in subgingival and supragingival plaques, thus distinguishing healthy gingivae from an inflamed site suffering from the symptoms of gingivitis. The state of health of the gingivae can be directly related to the level of bacterial toxins present, for example, endotoxins, and thus a reduction of these toxins, as discussed herein, in the oral cavity, as determined by screening on non-gingival engineered cells, would improve overall oral health. Additionally, the way an individual responds to the virulence factors can be quantified utilizing the individual's metabolic pathways, such as by quantifying products of the urea cycle.
Gingivitis is defined per the FDA monograph (12 CFR Part 356, Vol. 68, No. 103 (2003)) as "An inflammatory lesion of the gingiva that is most frequently caused by dental plaque. Gingivitis is characterized by tissue swelling and redness, loss of stippling (a normal state in which the surface of healthy gingiva is comprised of small lobes), glossy surface, and increased tissue temperature. The gingiva also may bleed upon gentle provocation, such as tooth brushing or may bleed spontaneously. Gingivitis is usually not painful." Within the monograph, plaque is defined as being composed of multiple bacterial species. Those species exert a constant inflammatory pressure on the host tissues.
When the inflammation progresses to the state of gingivitis, there exists a need to quantify how severe the gingivitis is and how effective treatments from oral hygiene products are in reducing the inflammatory response. The reduction in inflammatory response due to activation of membrane bound receptors across the gingival cells is termed detoxification; and measuring the level of detoxification, which is lacking in the art, is needed to educate consumers on the efficacy of their oral hygiene.
Pathogenesis of gingivitis involves both bacteria and host responses. The present invention discloses methodologies measuring the virulence factors in the dental plaques in vitro, and also measuring effects of virulence factors on gingival tissues in vivo. These methodologies allow understanding of what virulence factor types are present in the dental plaques, and how the host responds. Importantly, the measuring of virulence factors provides a detailed assessment on the severity of gingivitis in terms of virulence factors of the microbes in dental plaques and the health status of the host. In addition, these methods help evaluate the effectiveness of a technology in preventing and treating gingivitis.
The present invention includes a methodology comprising one or more of the following steps: (1) using the endotoxin detection assay kit or BODIPY-TR cadaverine method to quantify total LPS and LTA present in a biological sample and to detect technologies that inhibit the endotoxin detection assay; (2) using the Toll like receptor assays to determine potency of purified virulence and oral dental plaques, and to measure the efficacy of technologies that neutralize toxicity of virulence factors; (3) using meta-sequencing to identify and quantitate bacteria in supragingival plaques, (4) measuring ornithine and citrulline in gingival swab samples to determine the healthy status of gingival tissue, (5) measuring protein and mRNA levels to determine the levels of host responses, and determining citrulline activities in inhibiting LPS-induced production of proinflammatory cytokines.
The above-mentioned methods and chemistry may be applied in a strip form to the outer surface of the tooth and gumline. The strip may contain color or fluorescence reagents to interact with the virulence factors present and thus allow for semi-quantitative determination of the virulence present.
This would allow for rapid assessment of the level of severity of gingivitis and/or periodontal disease or to ascertain the effectiveness of oral products. This execution of the described methods allows for consumers to ascertain the state of their dental health at home or allows for professionals, such as dentists, to rapidly measure the state of a patient's oral health.
The methods described above can be used to determine the cellular impact of organic and inorganic molecules, as long as there is an interaction between the molecule and the targeted receptor. Further, the methods could be used to ascertain if a molecule would cause an irritation or inflammatory response. The receptor in question would be used in a reporter system, as described herein, and the molecular impact of the molecule in question determined. The EC50 value of the molecule in question would be determined using the receptor associated with the biological response, thus reducing or eliminating the need to do animal testing.
All percentages and ratios used hereinafter are by weight of total composition, unless otherwise indicated. All percentages, ratios, and levels of ingredients referred to herein are based on the actual amount of the ingredient, and do not include solvents, fillers, or other materials with which the ingredient may be combined as a commercially available product, unless otherwise indicated.
All measurements referred to herein are made at 25.degree. C. (i.e. room temperature) unless otherwise specified
As used herein, the word "include," and its variants, are intended to be non-limiting, such that recitation of items in a list is not to the exclusion of other like items that may also be useful in the materials, compositions, devices, and methods of this invention.
As used herein, the word "or" when used as a connector of two or more elements is meant to include the elements individually and in combination; for example X or Y, means X or Y or both.
By "personal care composition" is meant a product, which in the ordinary course of usage is applied to or contacted with a body surface to provide a beneficial effect. Body surface includes skin, for example dermal or mucosal; body surface also includes structures associated with the body surface for example hair, teeth, or nails. Examples of personal care compositions include a product applied to a human body for improving appearance, cleansing, and odor control or general aesthetics. Non-limiting examples of personal care compositions include hair coloring compositions, oral care compositions, after shave gels and creams, pre-shave preparations, shaving gels, creams, or foams, moisturizers and lotions, cough and cold compositions, leave-on skin lotions and creams, shampoos, conditioners, shower gels, bar soaps, toilet bars, antiperspirants, deodorants, depilatories, lipsticks, foundations, mascara, sunless tanners and sunscreen lotions.
By "oral care composition", as used herein, is meant a product, which in the ordinary course of usage, is not intentionally swallowed for purposes of systemic administration of particular therapeutic agents, but is rather retained in the oral cavity for a time sufficient to contact dental surfaces or oral tissues. Examples of oral care compositions include dentifrice, mouth rinse, mousse, foam, mouth spray, lozenge, chewable tablet, chewing gum, tooth whitening strips, floss and floss coatings, breath freshening dissolvable strips, or denture care or adhesive product. The oral care composition may also be incorporated onto strips or films for direct application or attachment to oral surfaces.
The term "dentifrice", as used herein, includes tooth or subgingival-paste, gel, or liquid formulations unless otherwise specified. The dentifrice composition may be a single phase composition or may be a combination of two or more separate dentifrice compositions. The dentifrice composition may be in any desired form, such as deep striped, surface striped, multilayered, having a gel surrounding a paste, or any combination thereof. Each dentifrice composition in a dentifrice comprising two or more separate dentifrice compositions may be contained in a physically separated compartment of a dispenser and dispensed side-by-side.
The term "teeth", as used herein, refers to natural teeth as well as artificial teeth or dental prosthesis.
Virulence factors are molecules produced by pathogenic microbes that contribute to the pathogenicity of the organism and enable them to invade and proliferate in the host, and evade host immune surveillance. Virulence factors include, but are not limited to the following: Gram positive and Gram negative cell wall components, such as lipopolysaccharide and lipoteichoic acids, bacterial DNA, flagellin, peptidoglycan, adhesins, invasins, and antiphagocytic factors, hemolysins, bacterial metabolites, fimbriae, outer membrane vesicles, bacterial proteins or bacterial enzymes. A reduction in virulence or "detoxification", based on reduced activation of Toll-like receptors, can be used to measure the effectiveness of various treatments.
The term "detoxification" or "detoxify" or "detox" as used herein, refers to the neutralization, reduction, or removal of microbial virulence factors as measured by a reduction in the activation of a receptor known to be responsive with a virulence factor from an engineered cell, such as a reporter cell line. In certain embodiments a determination of virulence is assigned based on the activation of one or more of the Toll-like receptors.
The present invention includes obtaining a sample of oral matter. The oral matter can include gum-line plaque, subgingival plaque, supragingival plaque, interstitial plaque, gingival crevicular fluid (GCF), gingival biopsy, saliva, or tongue swab. The oral matter may be obtained by any method known in the art, for example, subgingival plaque sample may be collected physically by scraping or by using paper points. The plaque may be collected off of the tooth beneath gums from the sulcus, the developed periodontal pocket, or at the gumline. For example, each paper point can be placed in the pocket between the tooth and the gingiva for 10 seconds. After 10 seconds, a paper point can be removed and placed into a pre-labeled 1.5 ml tube with 700 .mu.l phosphate-buffered saline. The sampling procedure can be repeated with three more paper points. After all four paper points are collected, the 1.5 ml tube will be closed, vortexed for 30 seconds and placed on dry ice until the samples are stored in a -80.degree. C. freezer. Other methods of collection could include a mechanical device to help release the plaque from the tooth surface, such as a sonic descaler. The oral matter may be obtained both before and after treatment of an oral site from which the oral matter is obtained. An oral site from which the oral matter is obtained includes host tissues and bacterial matters. Further treatment of an oral site may be more than once and may include multiple different treatments, for example a regimen, such as brushing teeth followed by mouthrinse. In addition to obtaining oral matter before and after completed treatments, oral matter may be obtained between separate treatments, for example between the brushing of teeth followed by the use of mouth rinse.
The sample of oral matter is combined with a Toll-like receptor in a reporter cell. Examples of Toll-like Receptors that can be used in the present invention include TLR 2, TLR 4, TLR 5, and TLR 9. Human TLR cDNA (TLR 1, 2, 3, 4, and 5) was first cloned in 1998 and their sequences were published (Rock F L, Hardiman G, Timans J C, Kastelein R A, Bazan J F. A family of human receptors structurally related to Drosophila Toll. Proc Natl Acad Sci USA. 1998 Jan. 20; 95:588-93). Rock et al. discovered that cytoplasmic domains of Drosophila Toll and human interleukin 1 receptors shared high sequence homology, and hypothesized that both molecules trigger related signaling pathways tied to the nuclear translocation of Rel-type transcription factors. They cloned a class of putative human receptors with a protein architecture that is similar to Drosophila Toll in both intra- and extracellular segments. They hypothesized that the five human Toll-like receptors--named TLRs 1-5--are probably the direct homologs of the fly molecule and, as such, could constitute an important and unrecognized component of innate immunity in humans. Soon after the DNA sequences for TLR1 to 5 were published, other TLR DNA sequences were also revealed. For example, TLR6 cDNA sequence was reported in 1999 (Takeuchi O1, Kawai T, Sanjo H, Copeland N G, Gilbert D J, Jenkins N A, Takeda K, Akira S. A novel member of an expanding toll-like receptor family. Gene. 1999 Apr. 29; 231(1-2):59-65). cDNA sequences of human TLR7, TLR8 and TLR9 were reported in 2000 (Chuang TH1, Ulevitch R J. Cloning and characterization of a sub-family of human toll-like receptors: hTLR7, hTLR8 and hTLR9. Eur Cytokine Netw. 2000 September; 11(3):372-8).
TABLE-US-00001 SEQ ID NO Sequence 1 Human Toll-Like Receptor 1 Amino Acid sequence 2 Human Toll-Like Receptor 2 Amino Acid sequence 3 Human Toll-Like Receptor 3 Amino Acid sequence 4 Human Toll-Like Receptor 4 Amino Acid sequence 5 Human Toll-Like Receptor 5 Amino Acid sequence 6 Human Toll-Like Receptor 6 Amino Acid sequence 7 Human Toll-Like Receptor 7 Amino Acid sequence 8 Human Toll-Like Receptor 8 Amino Acid sequence 9 Human Toll-Like Receptor 9 Amino Acid Sequence
A sequence listing that sets forth the amino acid sequences for SEQ ID NO: 1 to 9 herein is being filed concurrently with the present application as an ASCII text file titled "13837M_AA_Sequence_Listing_ST25." The ASCII text file was created on 29 Mar. 2016 and is 68 Kbytes in size. In accordance with MPEP .sctn. 605.08 and 37 CFR .sctn. 1.52(e), the subject matter in the ASCII text file is incorporated herein by reference.
TLR proteins can form heterodimers or homodimers. There are 10 TLR genes identified in humans. Their gene products form homodimers or heterodimers in cell membranes. For example, TLR1 can form heterodimers with TLR. Similarly, TLR6 also can assemble a heterodimer with TLR2. On other hand, TLR4 forms a homodimer. Toll-like receptors (TLRs) are a class of proteins that play a key role in the innate immune system as well as the digestive system. They are membrane-spanning, non-catalytic receptors usually expressed in cells such as macrophages, dendrite cells, and gingival epithelial cells that recognize structurally conserved molecules derived from microbes. Once these microbes have breached physical barriers such as the skin or intestinal tract mucosa or oral epithelial cells they are recognized by TLRs, which activate immune cell responses. Toll-like receptors were targeted because they are the primary sensors of virulence factors produced by the microbes in the dental plaques. TLR 1, 2, 4, 5 and 6 are expressed in the cell plasma membranes, providing easy access for the virulence factors to be sensed by the host receptors. TLR 3, 7, 8, and 9 are located on the membranes of endosomes; and as virulence factors are phagocytosed into the cells, they also gain access to TLR 3, 7, 8 and 9
A reporter cell refers to a eukaryotic cell, such as, but not limited to, HEK 293T, human monocyte (THP1), Chinese hamster ovary (CHO) cell, murine cells, or monkey kidney epithelial (Vero) cells engineered to express a predetermined number of TLR receptors, for example a single TLR receptor; which is in contrast to gingival cells that express multiple functional TLR receptors. Thus, one type of engineered reporter cells respond to only one type of virulence factors in the dental plaques. In contrast, gingival cells express several types of functional TLRs, and can't be used to identify a single type of virulence factor in dental plaques. The output from gingival cells is the sum of various virulence factors in the dental plaques. HEK 293T cells can be used as reporter cells, as they are easy to maintain and have similar gene expression profiles to oral epithelial cells, making them a closer match to the gene expression of gingival cells, such that the results will mirror in vivo results. In contrast to naturally occurring gingival cells the reporter cells of the present invention are easy to maintain in the lab, and stable in phenotypes. Further, the reporter cells make detection of virulence factors simpler, are more reproducible, increase accuracy, provide higher throughput are more specific and more quantifiable.
Individual TLR receptor genes are stably transfected to HEK 293 cells as described by Invivogen (/PDF/HEK_Blue_htlr4_TDS.pdf). HEK-Blue.TM. hTLR4 Cells are designed for studying the stimulation of human TLR4 (hTLR4) by monitoring the activation of NF-kB. HEK-Blue.TM. hTLR4 Cells were obtained by co-transfection of the hTLR4 gene, the MD-2/CD14 co-receptor genes and a secreted embryonic alkaline phosphatase (SEAP) reporter gene into HEK293 cells. The SEAP reporter gene is placed under the control of an IL-12 p40 minimal promoter fused to five NF-kB and AP-1-binding sites (Supplement 1. HEK-Blue.TM. hTLR4 Cells SEAP Reporter 293 cells expressing the human TLR4 gene, Catalog # hkb-htlr4, Version #15C04-MM (/PDF/HEK_Blue_htlr4_TDS.pdf). As compared to measuring an immune response the reporter genes of the present invention allow rapid, specific and reproducible measurements of virulence factors.
The level of receptor activation can be determined by any method known in the art for the type of reporter gene used. For example if an NFkB-SEAP reporter gene is used, one could measure the production of SEAP in the culture medium. The reporter cells can be treated with virulence factors, or dental plaque matters collected before or after treatments. Expression of the reporter gene will be stimulated and SEAP secreted into the medium when stimulated by virulence factors. The level of reporter gene product SEAP can be readily measured with commercial kits, and will be proportional to the amount of particular types of virulence factors. Similarly, if an NFkB-luciferase, NFkB-beta-lactamase, or other reporter genes are used, available kits can be used to measure the reporter gene products.
The potency can then be determined based on parameters such as, EC50 and fold of stimulation. EC50 provides a measurement on the amount of virulence factors needed to mount an inflammatory response, and the fold of stimulation is indicative of the severity of inflammatory responses the virulence factors cause. The EC50 is used to determine potency; wherein "potency" as defined by the Merck Manual, refers to the concentration (EC50) of a chemistry required to produce 50% of the chemistry's maximal effect as depicted by a graded dose-response curve. EC50 equals Kd (Dissociation constant, which is a measure of 50% of the substance in question bound to the receptor) when there is a linear relationship between occupancy and response. Often, signal amplification occurs between receptor occupancy and response, which results in the EC50 for response being much less (ie, positioned to the left on the abscissa of the log dose-response curve) than Kd for receptor occupancy. Potency depends on both the affinity of a compound for its receptor, and the efficiency with which a compound-receptor interaction is coupled to response. The dose of a compound required to produce an effect is inversely related to potency. In general, low potency is important only if it results in a need to administer a compound in large doses that are impractical. Quantal dose-response curves provide information on the potency of a compound that is different from the information derived from graded dose-response curves. In a quantal dose-response relationship, the EC50 is the dose at which 50% of individuals exhibit the specified quantal effect.
In the present invention, the activities of endotoxins or lipopolysaccharides can be measured using an endotoxin detection assay, or LAL assay. The Limulus Amebocyte Lysate (LAL) test has been used to detect LPS. LAL is derived from the blood cells, or amebocytes, of the horseshoe crab, Limulus polyphemus. At present, some main endotoxin detection agents are derived from recombinant proteins. Thereinafter, endotoxin detection assay and LAL assay are used interchangeably. A. A method of determining bacterial virulence in an oral cavity comprising: a. providing a reporter cell expressing at least one toll-like receptor; b. providing a sample of oral matter; c. combining the sample of oral matter and the reporter cell; d. measuring the toll-like receptor activation. B. The method of paragraph A, wherein the toll-like receptor is at least one of TLR1 to TLR9. C. The method according to paragraph A or B, wherein the reporter cell expresses at least of one TLR2 or TLR4. D. The method according to any one of paragraphs A to C, wherein the toll-like receptor activates a reporter gene, preferably wherein the reported gene is a secreted embryonic alkaline phosphatase (SEAP) reporter gene. E. The method according to any one of paragraphs A to D, wherein the sample of oral matter is at least one of gum-line plaque, subgingival plaque, supragingival plaque, interstitial plaque, gingival crevicular fluid (GCF), gingival biopsy, saliva, or tongue swab, preferably wherein the sample of oral matter comprises virulence factor that is at least one of Gram positive cell wall components, Gram negative cell wall components, bacterial DNA, flagellin, peptidoglycan, bacterial metabolites, fimbriae; outer membrane vesicles bacterial proteins, or bacterial enzymes. F. The method of paragraph E, wherein the sample of oral matter comprises virulence factor that is at least one of lipopolysaccharide or lipoteichoic acid. G. The method according to any of paragraphs A to F comprising the additional steps of: e. providing another sample of oral matter from an individual who used an oral care composition prior to providing another sample of oral matter; f. combining the another sample of oral matter and the reporter cell; g. measuring the toll-like receptor response; h. comparing the toll-like receptor response from the sample of oral matter and another sample of oral matter. H. The method of paragraph G, where the sample of oral matter and the another sample of oral matter are from the same individual. I. A method for determining the virulence of lipopolysaccharide comprising: a. providing a lipopolysaccharide; b. providing a reporter cell expressing at least one Toll-like receptor; c. combining the reporter cell with the lipopolysaccharide; d. measuring the toll-like receptor activation; e. quantifying the lipopolysaccharide. J. The method of paragraph I, wherein the Toll-like receptor activation is determined by measuring at least one of EC50 or fold of stimulation. K. The method according to paragraph I or J, wherein the Toll-like receptor is at least one of TLR1 to TLR9. L. The method according to any of paragraphs I to K, wherein the reporter cell expresses at least one of TLR2 or TLR4. M. The method according to any of paragraphs I to L, wherein the Toll-like receptor activates a reporter gene. N. The method according to paragraph M, wherein the reported gene is a secreted embryonic alkaline phosphatase (SEAP) reporter gene. O. The method according to any of paragraphs I to N, wherein the lipopolysaccharide is quantified using at least one of limulus amebocyte lysate assay or BODIPY TR cadaverine assay.
EXAMPLES
Example 1--Determination of Secreted Lipopolysaccharide by Bacteria
Growth of bacteria: A 1 ml aliquot of a 24 hour culture of E. coli ATCC 8739 was used to inoculate 100 ml of Luria-Bertani (LB) broth in a 250 ml baffled flask. This culture was then incubated at 37.degree. C. with agitation (220 rpm) and sampled at 30 minute intervals. Samples were assessed for turbidity (OD.sub.600) in a SpectraMax platereader M3 (Molecular Devices, Sunnydale, Calif.), which is one method of monitoring the growth and physiological state of microorganisms. The sample turbidity was then recorded and the samples were centrifuged at 5000 RPM for 10 min at room temperature. The supernatant, thereinafter referred to as "supernatant of bacterial culture", was subsequently analyzed for LPS content using the procedure as described below.
Twenty ml aliquots of MTGE broth (Anaerobe Systems, Morgan Hill, Calif.) were inoculated with P. gingivalis ATCC 33277, P. pallens ATCC 700821, or P. nigrescens ATCC 25261. These cultures were incubated overnight in a Whitely A45 Anaerobic Workstation (Don Whitley Scientific, Frederick, Md.) at 37.degree. C. with an 85:10:5 N.sub.2:CO.sub.2:H.sub.2 gas ratio. One ml aliquots of these starter cultures were then used to inoculate 99 ml of membrane-Tryptone Glucose Extract (m-TGE) broth in a 250 ml baffled flask. These cultures were then incubated under agitation (200 rpm) as previously described and sampled at regular intervals. Samples were assessed for turbidity (OD.sub.600) in a Tecan Infinite m200 Pro (Tecan Trading AG, Switzerland) and then centrifuged at 16,100.times.g for 10 min at room temperature. Supernatants were decanted and passed through a 0.22 .mu.M filter prior to analysis for LPS content.
In the experiment, only OD600 was measured. For the sake of consistency in following experiments, we converted OD600 readings into bacterial numbers, even though the relationship between OD600 readings and bacterial numbers is varied for each bacterium. The number of bacteria was estimated based on spectrophotometer readings at OD.sub.600 (OD.sub.600 of 1.0=8.times.10.sup.8 cells/ml).
The Limulus Amebocyte Lysate Assay (LAL) is an assay to determine the total amount of lipopolysaccharide (LPS) in the sample tested (Pierce LAL Chromogenic Endotoxin Quantitation Kit, ThermoFischer Scientific, Waltham, Mass.). The assay was performed following manufacturer's instruction. Ninety-six-well microplates were first equilibrated in a heating block for 10 min at 37.degree. C. Fifty .mu.l each of standard or sample was dispensed into the microplate wells and incubated with plate covered for 5 min at 37.degree. C. Then 50 .mu.l LAL was added to each well. Plates were shaken gently and incubated for 10 min at 37.degree. C. 100 .mu.l of chromogenic substrate was added and incubated for 6 min at 37.degree. C. Finally, 50 .mu.l Stop Reagent was added and the absorbance was measured at 405-410 nm on Spectramax M3 platereader (Molecular Device, Sunnyvale, Calif.).
FIGS. 1A, 1C, and 1D show the ability of microbes to shed LPS as part of their normal growth cycle. This data shows the need to deliver chemistry to the subgingival plaque to effectively mitigate the LPS, since tooth brushing generally does not remove the subgingival plaque.
The LPS, as measured by the LAL kit reported in endotoxin unit per ml (EU/ml), was shed by the bacteria (E. coli K12) as depicted in FIG. 1A. The growth media began to be depleted of complex sugars around 120 minutes, as reflected in the bacterial growth curve in FIG. 1B, where the LPS shedding started to decline. This data gave a reason to believe that a mature biofilm/plaque could supply a constant level of LPS to the host cells, if food sources were present. The LPS would then have the ability to induce an inflammatory response from the host cells.
Importantly, LPS are secreted into the supernatant of bacterial culture (FIG. 1D). LPS also exists in bacterial walls (FIG. 1E). Again, this data further enforce the need to deliver chemistry to the subgingival plaque to effectively mitigate the LPS, since tooth brushing generally does not remove the subgingival plaque.
Example 2--LAL Assay to Quantify Virulence Factors in Dental Plaques
Seven panelists, with at least three bleeding sites, took part in the testing. A licensed dental hygienist collected subgingival plaque samples. Samples were taken at the tooth/gum interface (buccal surfaces only) using care to avoid contact with the oral soft tissues. Six subgingival plaque sites were sampled from each panelist (3 healthy and 3 unhealthy sites). Unhealthy teeth had bleeding sites with pockets greater than 3 mm and healthy sites had no bleeding with pocket depth less than 2 mm Prior to sampling, panelists were instructed to abstain for 12 hours from oral hygiene and refrain from eating, chewing gum, drinking (except small sips of water). Next, panelists had their marginal plaque collected with a curette at the sampling sites. Then, from the same site, subgingival plaque samples were collected with 3 consecutive paper points as shown in FIG. 1F. The sampling sites were isolated with cotton rolls and gently air-dried. Paper points (PROFLOW incorporated, Amityville, N.Y.) were gently placed for 10 seconds into the pocket until a minimum of resistance was felt. After 10 seconds, paper points were removed and placed into pre-labeled 1.5 ml tubes. The same sampling procedure was repeated with 2 more paper points (paper points go into separate tubes). The first, second and third sample paper points from a healthy site of all panelists were pooled separately into three tubes, labeled as paper point 1, 2 and 3, respectively. Similarly the unhealthy site samples were also pooled.
TABLE 1 showed that unhealthy dental plaques contained more endotoxins than the healthy dental plaques. One m1 PBS was added to each pooled sample in the 1.5 ml tube. Bacteria were lysed in a MolBio Fast Prep bead beater (MP Biomedicals, Santa Ana, Calif.). Samples were centrifuged for 10 min at 10,000 RPM at 4.degree. C., supernatants were collected and analyzed with LAL assay kits following manufacturer's instruction as described in EXAMPLE 1.
TABLE-US-00002 TABLE 1 Protein concentrations and endotoxin levels in the pooled dental plaque samples. Endotoxin Dental plaque (endotoxin unit) Healthy paperpoint 1 sub plaque 1284 Healthy paperpoint 2 sub plaque 476 Healthy paperpoint 3 sub plaque 361 Healthy Marginal Plaque 23180 Unhealthy paperpoint 1 sub plaque 3371 Unhealthy paperpoint 2 sub plaque 1732 Unhealthy paperpoint 3 sub plaque 16111 Unhealthy Marginal Plaque 80277
It was expected that the marginal plaques in unhealthy sites had more endotoxins than those in the healthy sites (TABLE1) within the same subjects. Three samples were taken from subgingival pockets with three paper points sequentially, named paper point 1, 2 and 3. Again, the subgingival plaques taken by the paper point 1 had more endotoxins in the unhealthy sites than in the healthy sites (TABLE 1). The same is true for the samples taken by paper point 2 and 3. Importantly, dental plaques in the unhealthy subgingival pockets possessed more endotoxins than plaques from healthy pockets. This may explain why unhealthy gingiva are prone to bleeding upon probing.
Example 3--Technology Development Using the LAL Assay Kit
The LAL assay, as described in EXAMPLE 1, was modified for development of technology which inhibits LPS from activating a proenzyme in the LAL assay. The Thermo Scientific Pierce LAL Chromogenic Endotoxin Quantitation Kit is a quantitative endpoint assay for the detection of LPS, which catalyzes the activation of a proenzyme in the modified Limulus Amebocyte Lysate (LAL). The activated proenzyme then splits p-Nitroaniline (pNA) from the colorless substrate, Ac-Ile-Glu-Ala-Arg-pNA. The product pNA is photometrically measured at 405-410 nm. If SnF2 binds to LPS, the latter can't react with the proenzyme in the LAL kit. Consequently, the proenzyme is not activated, and the colorless substrate Ac-Ile-Glu-Ala-Arg-pNA will not split and no color product is produced. P. gingivalis LPS 1690 (1 ng/ml), or E. coli LPS (1 ng/ml), and stannous fluoride and other materials (50 and 500 .mu.M), as listed in TABLE 2, were dissolved in endotoxin-free water. Then 50 .mu.l LAL was added to each well. Plates were shaken gently and incubated for 10 min at 37.degree. C. 100 .mu.l of chromogenic substrate was added and incubated for 6 min at 37.degree. C. Finally, 50 .mu.l Stop Reagent was added and the absorbance was measured at 405-410 nm on Spectramax M3 plate reader (Molecular Device, Sunnyvale, Calif.).
As shown in TABLE 2, SnF2 and some other compounds inhibited LPS activities in LAL assays
TABLE-US-00003 TABLE 2 Inhibition of LPS activities on LAL Assays Inhibition of LAL activity % P. gingivalis LPS E. coli LPS 1690 1 ng/ml 1 ng/ml Samples 500 uM 50 uM 500 uM 50 uM Tin (II) fluoride 60 49 92 87 stannous chloride 48 21 89 65 Cetylpyridinium chloride 103 77 103 46 monohydrate Chlorhexidine 102 38 97 57 zinc citrate, dihydrate 104 57 104 82 zinc lactate 58 0 66 0 potassium oxalate 8 0 1 6 Triclosan (irgasan) 0 0 10 0 1-Hydroxypyridine-2-thone 0 0 2 6 zinc salt sodium fluoride 0 0 4 5 Carboxymethyl cellulose 0 0 2 0 sodium
Example 4--Binding of BODIPY-TR-Cadaverine to LPS and Displacement of LPS Binding by Stannous Fluoride
In addition to LAL quantification of LPS, the BODIPY method can be utilized to assess the level of LPS. Detoxifying technologies are able to target and neutralize bacterial virulence factors, such as LPS and LTA. To develop such LPS and LTA sequestration technologies, a high throughput screening was employed to identify molecules that disrupt the activation of a Toll-like receptor by LPS and LTA, and other virulence factors. The high throughput screen utilizes the fluorescent dye BODIPY-TR-cadaverine 5-(((4-(4,4-difluoro-5-(2-thienyl)-4-bora-3a,4a-diaza-s-indacene-3-yl)phe- noxy)acetyl)amino)pentylamine hydrochloride (BC fluorescent dye), purchased from Life Technologies (Carlsbad, Calif.), as described previously by Wood, Miller and David (2004) (Comb Chem High Throughput Screen 2004 May; 7(3):239-49. Anti-endotoxin agents. 1. Development of a fluorescent probe displacement method optimized for the rapid identification of lipopolysaccharide-binding agents.). The experiment was carried out at 22.degree. C. E. coli LPS (15 .mu.g/ml) was mixed in a well of a 96-well solid black flat bottom plate (Corning Incorporated, Corning, N.Y.) with SNF2 and cetylpyridinium chloride in 30 .mu.l of 50 mM Tris buffer at pH 7.4 for 10 mM, and then 20 .mu.l of 60 .mu.M BC fluorescent dye was added right before fluorescence measurement at 22.degree. C., or room temperature. Fluorescence measurements were performed in a SpectraMax M3 automated 96 well plate reader (Molecular Device, Sunnyvale, Calif.). The excitation wavelength was 580 nM and the fluorescence emission was measured at 620 nM.
As shown in TABLE 3, leading anti-gingivitis technologies, such as stannous fluoride, displaced LPS from BODIPY TR cadaverine.
TABLE-US-00004 TABLE 3 Displacement of LPS from binding to BODIPY TR cadaverine Concentrations Displacement % mM Stannous fluoride Cetylpyridinium chloride 0.16 2.45 9.98 0.31 2.79 31.11 0.63 12.69 68.05 1.25 49.44 91.12
Example 5--Cell Culture and Virulence Determination of Lipopolysaccharide from Different Bacteria
Reporter gene cell lines, human HEK 293T cells, were purchased from Invivogen of San Diego, Calif. The HEK 293T cells were stably transfected with at least two exogenous genes, a TLR4 structural gene, and a SEAP reporter gene, which is under the control of NFkB transcriptional factors. The cell line is named here as TLR4-SEAP. The reporter gene encodes a secreted enzyme, called embryonic alkaline phosphatase or SEAP. The SEAP reporter is placed under the control of the interferon-.beta. minimal promoter fused to five NFkB and AP-1-binding sites. Furthermore, the TLR4-SEAP cell line also contains a CD14 co-receptor gene, which is needed to transfer LPS to TLR4 receptors. The recombinant TLR binds its ligand, or distinct pathogen-associated molecule, initiates a chain of responses, leading to recruitment of NFkB and AP1 transcription factors to the reporter gene promoter, which induce expression of SEAP.
Cell culture and treatment: 500,000 gene reporter cells were grown and maintained in 15 ml growth medium, comprised of DMEM medium supplemented with 10% fetal calf serum in T75 flasks for three days at 37.degree. C., 5% CO.sub.2, and 95% humidity. For treatment, wells of a 96-well plate were seeded with 10,000 cells/well in 100 .mu.L of growth medium. The cells were incubated for 72 hours at 37.degree. C., 5% CO.sub.2, and 95% humidity until day 4. On day 4, medium was changed to assay medium (90 .mu.l), which is the DMEM medium without fetal calf serum. LPS, bacteria and the culture medium of bacterial growth, as described in EXAMPLE 1, were first resolved or mixed with the assay medium. 10 .mu.l of the bacteria, LPS and culture medium of bacterial growth were added to the TLR4-SEAP cells. Samples were taken 24 hours later, following addition of LPS, bacteria, and culture medium. Expression of the reporter gene (SEAP) was quantified with a commercially available kit (SEAP Reporter Gene Assay of Cayman Chemical Co., Ann Arbor, Mich.).
EC50 was calculated using GraphPad Prism software (GraphPad Software, La Jolla, Calif.). Samples with lower EC50 are more potent in activating the TLR4 reporter gene than those with higher EC50. As shown in FIG. 2A, LPS from E. coli has lower EC50 than P. gingivalis, thus, was far more potent than P. gingivalis (Pg). Salmonella Minnesota LPS is not as potent as that of E. coli, but is far more potent than those of P. gingivalis LPS 1690 and 1435. Each species of bacteria produces multiple forms of LPS. Each form of LPS from the same species of bacteria has different potency in stimulating TLR4-downstream signaling pathways. For example, Pg 1690 LPS is more potent than Pg1435/50. LPS is a component in bacterial cell walls. Likely, E. coli cell wall is more virulent in inducing production of proinflammatory cytokines in host cells than P. gingivalis when they are in direct contact with host blood cells. P. gingivalis had far higher EC50 than P. pallens and P. nigrescens as shown in FIG. 2B in stimulating TLR4 reporter gene expression, suggesting that P. pallens and P. nigrescens are more likely to promote production of proinflammatory cytokines in host cells than P. gingivalis.
Bacteria release LPS into the supernatant of bacterial culture. As shown in FIG. 2C, the supernatant of P. pallens has an EC50 that is similar to that of P. nigrescens, but far lower than that of P. gingivalis, in stimulating expression of TLR4 reporter gene. Again, those results imply that the products of P. pallens and P. nigrescens are more likely to promote production of proinflammatory cytokines in host cells than those of P. gingivalis.
Example 6--Development of Technology for Inhibition of LPS Effects on Stimulating Expression of NFkB-Regulated Reporter Genes
Stannous fluoride is a leading anti-gingivitis technology in P&G toothpaste products. Tests were conducted to understand whether stannous fluoride could reduce LPS's ability to trigger proinflammatory responses in host cells. TLR4-SEAP reporter cells were prepared using the same conditions as described in EXAMPLE 5 in the presence or absence of LPS. Production of SEAP was quantified also as described in EXAMPLE 5.
FIG. 3 shows the effect of stannous at various concentrations from 62.5 uM to 1,000 uM on 100 ng/ml E. coli LPS, as reported by activation of TLR-4. At stannous concentrations of 500 uM or higher, the level of E. coli induction of TLR-4 was decreased.
FIG. 4 shows the effects of stannous at various concentrations from 62.5 uM to 1,000 uM on P. gingivalis LPS, as reported by activation of TLR-2. At stannous concentrations of 1000 uM, the level of P. gingivalis induction of TLR-2 was decreased.
The data in FIG. 5 shows reduction of LPS activity by the stannous ion, from a stannous fluoride salt. The data showed that stannous fluoride, at 1.6 mM and 3.2 mM, reduce about 50% of P. gingivalis LPS (500 ng/ml) activation on the TLR4 reporter system (One asterisk means P<0.05, two asterisks mean P<0.01).
Example 7--Cell Culture and Virulence Determination of EC50 in Activation of TLR4-SEAP Signal Transduction by Clinical Samples
The method described in EXAMPLE 5 is effective at determining the potency of LPS from different bacteria. The same method was used to determine the EC50 of clinical samples, as described in EXAMPLE 2. As shown in FIG. 6, dental plaques from unhealthy sites had a smaller EC50 than those from healthy sites, suggesting the dental plaques from unhealthy sites contain more virulence factors.
The same method described in EXAMPLE 5 was used to examine the clinical samples in another study. A clinical study was conducted to evaluate sample collection methods and measurement procedures. It was a controlled, examiner-blind study. Forty panelists met the inclusion criteria, wherein in order to be included in the study, each panelist must: Provide written informed consent to participate in the study; Be 18 years of age or older; Agree not to participate in any other oral/dental product studies during the course of this study; Agree to delay any elective dentistry (including dental prophylaxis) until the study has been completed; Agree to refrain from any form of non-specified oral hygiene during the treatment periods, including but not limited to the use of products such as floss or whitening products; Agree to return for all scheduled visits and follow study procedures; Must have at least 16 natural teeth; Be in good general health, as determined by the Investigator/designee based on a review of the health history/update for participation in the study.
For Unhealthy Group (high bleeder group): Have at least 20 bleeding sites (sites with a score of 1 or 2 on the GBI index); Have minimum 3 sampling sites with bleeding and pocket depth >3 mm but not deeper than 4 mm; Have minimum 3 sampling sites without bleeding and with pocket depth <2 mm
For Healthy Group (low bleeder group): Have maximum 3 bleeding sites (sites with a score of 1 or 2 on the GBI index); No pockets deeper than 2 mm. Twenty (20) panelists were qualified as healthy--with up to 3 bleeding sites and with all pockets less than or equal to 2 mm deep and twenty (20) panelists were qualified as unhealthy--with greater than 20 bleeding sites with at least 3 pockets greater than or equal to 3 mm but not deeper than 4 mm with bleeding, and at least 3 pockets less than or equal to 2 mm deep with no bleeding for sampling. All panelists had up to 6 sites identified as "sampling sites." The "sampling sites" had supragingival and subgingival plaque collected at Baseline, Week 2 and Week 4. Subgingival plaque samples were taken from a gingival sulcus from the pre-identified sites. Prior to sample collection, the site had supragingival plaque removed with a curette. The site was dried and subgingival plaque samples were collected with another dental curette (e.g., Gracey 13/14, 15/16, 11/12, 7/8, 1/2.) Each Gracey curette is designed to adapt to a specific area or tooth surface. For example, Gracey 13/14 is designed to adapt to the distal surfaces of posterior teeth. Samples from each site were placed in a pre-labeled 2.0 ml sterile tube containing 300 .mu.l of DPBS buffer with about 50 of sterile 1 mm glass beads. Samples were stored at 4.degree. C. The subgingival samples were stored at -80.degree. C. until analyzed. The samples were thawed at room temperature and dispersed in a TissueLyser II (Qiagen, Valencia, Calif., USA) at 30 shakes per second for 3 min. Protein concentrations of the dispersed subgingival samples were measured using a Pierce microBCA Protein kit (ThermoFisher Scientific, Grand Island, N.Y., USA) following the manufacturer's instruction.
Oral lavage samples were collected at wake up (one per panelist) by rinsing with 4 ml of water for 30 seconds and then expectorating the contents of the mouth into a centrifuge tube. These samples were frozen at home until they were brought into the site in a cold pack. Each panelist collected up to 15 samples throughout the study. Saliva samples were frozen at -70.degree. C. from submission.
All panelists were given investigational products: Crest.RTM. Pro-Health Clinical Gum Protection Toothpaste (0.454% stannous fluoride) and Oral-B.RTM. Indicator Soft Manual Toothbrush. Panelists continued their regular oral hygiene routine, and did not use any new products starting from the baseline to the end of four week treatment study. During the four week treatment period, panelists brushed their teeth twice daily, morning and evening, in their customary manner using the assigned dentifrice and soft manual toothbrush.
The subgingival plaques from the above clinical study were applied to the TLR4 reporter cells in a procedure as described in EXAMPLE 5. FIG. 7A shows the results of a four-week study of 40 panelists going from baseline out over four weeks of treatment with Crest ProHealth Clinical toothpaste. The subgingival plaque samples in bleeding sites on the high bleeders group stimulated high expression of TLR4 reporter gene. More virulence in a sample elicits higher RLU (relative luminescent units) readings in the TLR4 reporter gene assay. As shown in FIG. 7A, the baseline samples of the high bleeders group had higher RLU than those of the low bleeders on both the bleeding and non-bleeding sites. After treatment with Crest.RTM. Pro-Health Clinical Gum Protection Toothpaste (0.454% stannous fluoride) and Oral-B.RTM. Indicator Soft Manual Toothbrush for four weeks, the virulence was reduced at week 4 in both high and lower bleeders groups at both bleeding and non-bleeding sites.
The oral lavage samples were applied to the TLR4 reporter cells in a procedure as described in EXAMPLE 5. As shown in FIG. 7B, oral lavage (Healthy vs. Gingivitis) samples were evaluated in the TLR4-SEAP reporter assay. The baseline samples of the high bleeders group had higher RLU than those of the low bleeders. After treatment with Crest.RTM. Pro-Health Clinical Gum Protection Toothpaste (0.454% stannous fluoride) and Oral-B.RTM. Indicator Soft Manual Toothbrush for four weeks, the virulence was reduced at week 4 in the high bleeder group.
Example 8--Cell Culture and Virulence Determination of Lipoteichoic Acids from Different Bacteria
The reporter gene cell lines, human HEK 293T cells, were purchased from Invivogen of San Diego, Calif. The HEK 293T cells were stably transfected with at least two exogenous genes, a TLR2 structural gene, and SEAP reporter gene which is under the control of NFkB transcriptional factors. The cell line is named here as TLR2-SEAP. The reporter gene encodes a secreted enzyme, called embryonic alkaline phosphatase or SEAP. The SEAP reporter is placed under the control of the interferon-.beta. minimal promoter fused to five NFkB and AP-1-binding sites. Furthermore, a CD14 co-receptor gene was transfected into the reporter gene cells expressing TLR2, as CD14 has been identified as a co-receptor for TLR2 ligands to enhance the TLR response. The CD14 co-receptor is needed to transfer LTA to TLR2 receptors. The recombinant TLR2 binds its ligand, or distinct pathogen-associated molecule, initiates a chain of responses, leading to recruitment of NFkB and AP1 transcription factors to the reporter gene promoter, which induce expression of SEAP.
Cell culture and treatment: 500,000 gene reporter cells were grown and maintained in 15 ml growth medium, comprising DMEM medium supplemented with 10% fetal calf serum in T75 flasks for three days at 37.degree. C., 5% CO.sub.2, and 95% humidity. For treatment with LTA, wells of a 96-well plate were seeded with 10,000 cells/well in 100 .mu.L of growth medium. The cells were incubated for 72 hours at 37.degree. C., 5% CO.sub.2, and 95% humidity until day 4. On day 4, medium (100 .mu.L) was changed to DMEM medium without fetal calf serum. LTA, LPS and bacterial cells, as described in EXAMPLE 7, were added. Samples were taken 24 hours later, following addition of samples. Expression of the reporter gene (SEAP) was quantified with a commercially available kit (SEAP Reporter Gene Assay of Cayman Chemical Co., Ann Arbor, Mich.).
As shown in FIGS. 8A, 8B, 8C and 8D, LTA, LPS, bacteria and the supernatant of bacterial culture could bind to TLR2 and activate TLR2 downstream signaling pathways in a dose-dependent manner. As shown in FIG. 8A, B. subtilis (BS) LTA is more potent than that of Enterococccus hirae. As shown in FIG. 8B, P. gingivalis LPS also activated expression of the TLR2 reporter gene. For example, Pg1690, as shown in FIG. 8B, activated TLR2-SEAP signal transduction, and stimulated SEAP production. But as shown in FIG. 8B, E. coli LPS did not activate the TLR2-SEAP reporter cells. It should also be noted that P. pallens, P. nigrescens and P. gingivalis have similar EC50 in stimulating expression of TLR2 reporter gene (FIG. 8C). However, the released TLR2 ligands from the three different bacteria have very different EC50 on activation of TLR2 reporter gene (FIG. 8D).
Example 9--Cell Culture and Virulence Determination of EC50 in Activation of TLR2-SEAP Signal Transduction by Clinical Samples
The method described in EXAMPLE 8 is effective in determining the EC50 of LTA and other TLR2 ligands from different bacteria. The same method was used to determine the EC50 of clinical samples, as described in EXAMPLE 2. As shown in FIG. 9, dental plaques from unhealthy (bleeding) sites had smaller EC50 than those from healthy (non-bleeding) sites, suggesting the dental plaques from unhealthy sites contain more virulence factors.
Clinical samples as described for FIG. 7A of EXAMPLE 7 were examined using the TLR2-SEAP reporter gene assay. The results are shown in FIG. 10A. The subgingival samples in unhealthy (bleeding) sites from the unhealthy group (high bleeders) had more virulence factors than other sites. The baseline samples of the high bleeders group had higher RLU than those of the low bleeders on both the bleeding and non-bleeding sites. After treatment with Crest.RTM. Pro-Health Clinical Gum Protection Toothpaste (0.454% stannous fluoride) and Oral-B.RTM. Indicator Soft Manual Toothbrush for four weeks, the virulence was reduced at week 4 in both high and low bleeders groups at both bleeding sites.
The clinical samples as described for FIG. 7B of EXAMPLE 7 were examined using the TLR2-SEAP reporter gene assay. As shown in FIG. 10B, oral lavage (Healthy vs. Gingivitis) was evaluated. After treatment with Crest.RTM. Pro-Health Clinical Gum Protection Toothpaste (0.454% stannous fluoride) and Oral-B.RTM. Indicator Soft Manual Toothbrush for four weeks, the virulence was reduced at week 4 in the high bleeder group.
Example 10--Cell Culture and Virulence Determination of Flagellins from Different Bacteria
The reporter gene cell lines, human HEK 293T cells, were purchased from Invivogen of San Diego Calif. The HEK 293T cells were stably transfected with two exogenous genes, a TLR5 structural gene, and SEAP reporter gene which is under the control of NFkB transcriptional factors. The cell line was named as TLR5-NFkB-SEAP. The reporter gene encodes a secreted enzyme, called embryonic alkaline phosphatase or SEAP. The SEAP reporter is placed under the control of the interferon-.beta. minimal promoter fused to five NFkB and AP-1-binding sites. The recombinant TLR5 binds to its ligand, or distinct pathogen-associated molecule, and initiates a chain of responses leading to recruitment of NFkB and AP1 transcription factors to the reporter gene promoter, which induce expression of SEAP.
Cell culture and treatment: 500,000 gene reporter cells were grown and maintained in DMEM medium supplemented with 10% fetal calf serum in T75 flasks for three days at 37.degree. C., 5% CO.sub.2, and 95% humidity. For treatment with flagellin, wells of a 96-well plate were seeded with 10,000 cells/well in 100 .mu.L of growth medium. The cells were incubated for 72 hours at 37.degree. C., 5% CO.sub.2, 95% humidity until day 4 after cells were seeded onto wells of a 96-well plate. On day 4, medium (100 .mu.L) was changed to DMEM medium without fetal calf serum. S. subtilis and S. aureus flagellin were added at a range of concentration from 0.97 ng to 1 .mu.g/ml. Samples were taken at 6 and 24 hours later after adding flagellin. Expression of reporter gene (SEAP) was quantified with a commercially available kit (SEAP Reporter Gene Assay of Cayman Chemical Co., Ann Arbor, Mich.).
FIG. 11 shows both flagellins (B. subtilis and P. aeruginosa) could activate TLR5 downstream signaling pathways. Flagellin from B. subtilis stimulated TLR5-SEAP signaling transduction in a dose-dependent manner. The EC50 of flagellin on TLR5 was 0.02 ng/ml at 5 hours and 0.014 ng/ml at 23 hours. The EC50 of flagellin from Pseudomonas aeruginosa on TLR5 was 0.0049 at 5 hours and 0.0019 at 23 hours. Flagellin from P. aeruginosa was more potent on stimulating TLR5 signaling pathways.
Example 11--Cell Culture and Virulence Determination of LPS from Different Bacteria in THP1 Dual Reporter Cells
Bacterial cell wall and membrane components are recognized by TLR2. TLR2 recognizes the microbial motifs PGN (peptidoglycan)/lipoproteins/dectin and LPS. TLR1 and TLR6 form heterodimers with TLR2 and bind to triacylated lipoproteins and diacylated lipoproteins, respectively. THP1 NFkB-SEAP and IRF-Lucia.TM. Reporter Monocytes were purchased from Invivogen, San Diego, Calif. THP1-Dual cells were derived from the human THP-1 monocyte cell line by stable integration of two inducible reporter constructs. THP1-Dual cells feature the Lucia gene under the control of an ISG54 (interferon-stimulated gene) minimal promoter in conjunction with five interferon-stimulated response elements. THP1-Dual cells also express a SEAP reporter gene driven by an IFN-b minimal promoter fused to five copies of the NF-kB consensus transcriptional response element and three copies of the c-Rel binding site. As a result, THP1-Dual cells allow the simultaneous study of the NFkB pathway, by monitoring the activity of SEAP, and the interferon regulatory factor (IRF) pathway, by assessing the activity of Lucia (IRF-Luc). Both reporter proteins are readily measurable in the cell culture supernatant. This THP-1 cell line possesses functional TLR1, TLR2, TLR4, TLR5, TLR6 and TLR8, purchased from Invivogen. TLR4 senses LPS from Gram-negative bacteria while TLR5 recognizes bacterial flagellin from both Gram-positive and Gram-negative bacteria, TLR8 detects long single-stranded RNA.
Culture and treatment: The THP1-dual cells were cultured in 15 ml growth medium (RPMI 1640 with 10% heat-inactivated fetal bovine serum) in a T75 flask at 37.degree. C. and 5% CO.sub.2. Cells were passed every 3 to 4 days by inoculating 300,000-500,000 cells/ml into a fresh T75 flask with 15 ml of fresh growth medium. To determine the effect of bacterial components on reporter gene expression, wells in 96-well plates were seeded at 100,000 cells in 90 .mu.l of growth medium. 10 .mu.l of bacterial wall and membrane components, or heat-killed whole bacteria, were added to each well. After incubation for 18 hours at 37.degree. C. and 5% CO.sub.2, secreted luciferase and SEAP were quantified with commercially available assay kits (QUANTI-Luc of Invivogen, San Diego, Calif. for luciferase; SEAP Reporter Gene Assay of Cayman Chemical Co., Ann Arbor, Mich. for SEAP).
DHP1-dual reporter cells were treated with three different preparations of LPS as shown in FIG. 12A. All three LPS (ng/ml) activated production of NFkB-SEAP reporter genes in a dose-dependent manner. In addition, Pg 1690 LPS and E. coli LPS also stimulated expression of the IRF-luciferase reporter gene. TLR4 ligands, upon binding to TLR4 receptors, activate at least two signaling pathways. One is a common pathway NFkB-SEAP, which can be activated by all TLR ligands upon binding to their specific receptors. For example, TLR2 ligand, LTA, can bind to TLR2 receptors and activate the NFkB-SEAP signaling pathway. Similarly, TLR4 ligand, LPS, upon binding to TLR4 receptors, also is able to activate the NFkB-SEAP signaling transduction. As shown in FIG. 12A, E. coli LPS is a more potent ligand than P. gingivalis 1690 LPS on activation of both NFkB-SEAP and IRF-luciferase signaling transduction. THP-1 cells produce several functional TLR receptors. And all TLR receptors can activate the NFkB pathway, thus promoting expression of the NFkB-SEAP reporter gene. The reading of NFkB-SEAP is the collective actions of all TLR receptors, such as TLR2, TLR1, TLR6 and TLR4. All LPS from different bacteria stimulated NFkB-SEAP reporter gene. IRF-luciferase reporter gene, on the other hand, is driven by a limited number of TLR receptors, primarily TLR3, TLR4, TLR7, TLR8 and TLR9. Both P. gingivalis LPS 1690 and E. coli LPS stimulated expression of IRF-luciferase in a dose-dependent fashion.
The THP-1 reporter cells were used to examine the clinical samples as described for FIG. 7B of EXAMPLE 7. As shown in FIG. 12B, oral lavage (Healthy vs. Gingivitis) was evaluated using the IRF-Luc reporter gene in THP-1 cells. After treatment with Crest.RTM. Pro-Health Clinical Gum Protection Toothpaste (0.454% stannous fluoride) and Oral-B.RTM. Indicator Soft Manual Toothbrush for four weeks, the virulence was reduced at week 4 in both high and lower bleeders groups.
The THP-1 reporter cells were used to examine the clinical samples as described for FIG. 7A of EXAMPLE 7. As shown in FIG. 12C, the subgingival Plaque (Healthy vs. Gingivitis) was examined using the NFkB reporter gene in THP-1 cells. The baseline samples of the high bleeders group had higher RLU than those of the low bleeders. After treatment with Crest.RTM. Pro-Health Clinical Gum Protection Toothpaste (0.454% stannous fluoride) and Oral-B.RTM. Indicator Soft Manual Toothbrush for four weeks, the virulence was reduced at week 4 in the bleeding sites in both high and lower bleeders groups.
Example 12--Cell Culture and Virulence Determination of LTA from Different Bacteria and Biofilms in THP1 Dual Reporter Cells
THP1 dual reporter cells also express TLR2, TLR1 and TLR6 receptors. Bacterial cell wall and some membrane components are recognized by TLR2, TLR1 and TLR6. TLR2 recognizes the microbial motifs PGN (peptidoglycan)/lipoproteins/dectin and LPS. To determine whether LTA from different bacteria have different effects on stimulating NFkB-SEAP reporter gene expression in the THP1 dual reporter cells, the cells were prepared and treated in the same procedures as described in EXAMPLE 11. As shown in FIG. 13, LTA from both B. subtilis and S. aureus had similar potency in promoting reporter gene expression in the THP1 dual reporter cells.
Example 13--Distinguishing Bacterial Components from Different Bacteria in Human Primary Gingival Epithelial Cells
Primary human gingival epithelial cells were purchased from Zen-bio (Research Triangle Park, N.C.), and maintained in 15 ml of growth medium (CellnTec medium supplemented with CellnTec Growth Supplement, purchased from CellnTec Advanced Cell Systems AG, Bern, Switzerland) in T75 flasks at 37.degree. C. under a 5% CO2 atmosphere. As the experiment was done at 24 h, 48 h and 72 h time point and with assay media, CellnTec medium alone or with supplements, six 96 well plates were seeded with 7,500 cells/well in 100 .mu.l of CELLnTEC growth medium at 37.degree. C. under a 5% CO2 atmosphere. The growth medium was changed to assay medium right before adding LPS or bacterial DNA. For example, if the assay medium was CellnTec medium without supplements, 100 .mu.l of CellnTec medium was added without supplements in each well. If the assay medium was the growth medium, 100 .mu.l of growth medium was added to each well. The P. gingivalis LPS and bacterial DNA were added to the cells. At 24 h, 48 h and 72 h, medium was collected for analysis. Cytokines were measured using Elisa kits from Meso Scale Discovery (Rockville, Md.), as per the manufacturer's instructions.
As shown in TABLE 4, human primary gingival epithelial cells were treated with P. gingivalis DNA at 0, 0.3, 1 and 2 .mu.g/ml. The cultures were harvested at 24 and 48 hours after treatment and six proinflammatory cytokines (interferon-.gamma., IL-1.beta., IL-2, IL-10, IL-12p70 and TNF-.alpha.) were analyzed using ELISA kits from Meso Scale Discovery. As shown in TABLE 4, expression of interferon-.gamma., IL-1.beta., IL-2, IL-10, IL-12p70 and TNF-.alpha. was low, or almost undetectable (each value is the mean of three replicate in one experiment). They were not viable biomarkers in distinguishing bacterial DNA. The results in TABLE 4 illustrate the lack of inflammatory response from human gingival epithelial cells, thus demonstrating the need to use an engineered cell.
TABLE-US-00005 TABLE 4 Screening of Human Gingival Epithelial Cells for Inflammatory Markers treated with P. gingivalis DNA Production of cytokines (pg/ml) in primary human gingival epithelial cells treated with P. gingivalis genomic DNA P. P. gingivalis gingivalis genomic 24 48 genomic 24 48 DNA hours hours DNA hours hours Interferon 0 ug 0 0.25 IL-1 0 ug 0 0.5 gamma 0.3 ug 0 0.33 beta 0.3 ug 0 0.33 1 ug 0 0 1 ug 0 0 2 ug 0.33 0.67 2 ug 0 0 IL-10 PG DNA 0.5 1 IL- PG DNA 0 0.25 0 ug 12p70 0 ug PG DNA 0.67 0.33 PG DNA 0.67 0 0.3 ug 0.3 ug PG DNA 0 0 PG DNA 0 0.67 1 ug 1 ug PG DNA 0.33 0.33 PG DNA 0 0.33 2 ug 2 ug IL-2 PG DNA 0.5 1 TNF- PG DNA 1 1.5 0 ug alpha 0 ug PG DNA 0 0.67 PG DNA 1.67 1.33 0.3 ug 0.3 ug PG DNA 0.33 1 PG DNA 0.67 1 1 ug 1 ug PG DNA 0.33 0.67 PG DNA 1.33 1.33 2 ug 2 ug
Human primary gingival epithelial cells were treated with P. gingivalis LPS at 0, 0.3, 1 and 2 .mu.g/ml in the procedures described above. As shown in TABLE 5, again, expression of interferon-.gamma., IL-1.beta., IL-2, IL-10, IL-12p70 and TNF-.alpha. was low, or almost undetectable. They were not viable biomarkers in distinguishing bacterial LPS in primary human gingival epithelial cells. The results in TABLE 5 further illustrate how human gingival cells were not sufficiently sensitive to bacterial virulence factors for an assay, and thus the need to utilize a cell line capable of demonstrating a dose dependent response to virulence factors.
TABLE-US-00006 TABLE 5 Screening of Human Gingival Epithelial Cells for Inflammatory Markers treated with P. gingivalis LPS Production of cytokines (pg/ml) in primary human gingival epithelial cells treated with P. gingivalis LPS 24 h 48 h 24 h 48 h Interferon PG lPS 0 ug 0.00 0.25 IL-1 PG lPS 0 ug 0.00 0.50 gamma PG LPS 0.3 ug 0.00 0.00 beta PG LPS 0.3 ug 0.00 0.67 PG LPS 1 ug 0.33 0.33 PG LPS 1 ug 0.00 0.00 PG LPS 2 ug 0.00 0.00 PG LPS 2 ug 0.00 1.00 IL-10 PG lPS 0 ug 0.50 1.00 IL- PG lPS 0 ug 0.00 0.25 PG LPS 0.3 ug 0.67 0.67 12p70 PG LPS 0.3 ug 0.00 0.00 PG LPS 1 ug 0.00 0.67 PG LPS 1 ug 0.00 0.33 PG LPS 2 ug 0.33 0.67 PG LPS 2 ug 0.67 0.00 IL-2 PG lPS 0 ug 0.50 1.00 TNF- PG lPS 0 ug 1.00 1.50 PG LPS 0.3 ug 0.33 0.67 alpha PG LPS 0.3 ug 1.33 0.67 PG LPS 1 ug 0.33 1.00 PG LPS 1 ug 2.00 1.33 PG LPS 2 ug 1.33 1.00 PG LPS 2 ug 0.67 1.33
Example 14--Gingivitis-Enriched Bacteria Reduced in Abundance in Six Weeks of Gingivitis Treatment
A randomized, two-group clinical study was conducted with 69 panelists (35 in the negative control group and 34 in the test regimen group). Panelists were 39 years old on average, ranging from 20 to 69, and 46% of the panelists were female. Treatment groups were well balanced, since there were no statistically significant (p.gtoreq.0.395) differences for demographic characteristics (age, ethnicity, gender) or starting measurements for Gingival Bleeding Index (GBI); mean=29.957 with at least 20 bleeding sites, and Modified Gingival Index (MGI); mean=2.086. All sixty-nine panelists attended each visit and completed the treatment process. The following treatment groups were compared over a 6-week period:
Test regimen: Crest.RTM. Pro-Health Clinical Plaque Control (0.454% stannous fluoride) dentifrice, Oral-B.RTM. Professional Care 1000 with Precision Clean brush head and Crest.RTM. Pro-Health Refreshing Clean Mint (0.07% CPC) mouth rinse. Control regimen: Crest.RTM. Cavity Protection (0.243% sodium fluoride) dentifrice and Oral-B.RTM. Indicator Soft Manual toothbrush.
Dental plaques were collected from the same panelists in the test regimen in the clinical study as described in EXAMPLE 2. A supragingival sample was taken from each panelist with a sterile curette at the tooth/gum interface, using care to avoid contact with the oral soft tissue. Plaques were sampled from all available natural teeth (upper arch only) until no plaque was visible. Following sampling, the plaque samples were placed into a pre-labeled (panelist ID, sample initials, visit, and date) Eppendorf tube with 1 ml of PBS/Glycerol buffer and about 50 of sterile 1 mm glass beads, stored on ice until all samples were collected. The samples were then transferred to a -70.degree. C. freezer for storage until further processing. Genomic DNA was isolated from supragingival plaque samples using QIAamp.RTM. genomic DNA kits (Qiagen, Germany) following manufacturer's instruction. Metasequencing was carried out at BGI Americas Corporation (Cambridge, Mass.). All data were analyzed at Global Biotech of Procter & Gamble Company in Mason, Ohio.
Clinical measurements: Bleeding sites (GBI) were decreased in the test regimen significantly on week 1, 3 and 6 in comparison to the control regimen (FIG. 14). Similarly, Inflammation (MGI) grades also decreased in the test regimen (FIG. 14).
Genomic DNA of the supragingival plaques in the test regimen was sequenced. As shown in FIG. 15, abundance of certain bacteria in the supragingival plaques changed in the six week treatments. Certain bacteria, such as Porphyromonas sp oral taxon 279 and Prevotella pallens, were decreased in weeks 1 and 3 (FIG. 15). The amount of each bacterial species was plotted over the four time periods of the treatment. The amount of certain bacteria, such as Peptostreptococcus stomatis and Prevotella intermedia, was reduced during the six week of treatment as shown in FIG. 15. This is also shown in FIG. 16A-1, FIG. 16A-2, and FIG. 16A-3.
Example 15--Production of Cytokines, Chemokines and Other Bioactive Proteins Decreased as Gingivitis Symptoms were Alleviated During 6 Week of Treatment
In the same clinical study as described in EXAMPLE 14, gingival-brush samples were collected from the same panelists as in EXAMPLE 14. Before sampling, panelists rinsed their mouths for 30 seconds with water. A dental hygienist then sampled the area just above the gumline using a buccal swab brush (Epicentre Biotechnologies cat.# MB100SP). The swab was immediately placed into 1 ml extraction buffer [PBS, 0.25M NaCl, 1.times. Halt.TM. Protease Inhibitor Single-Use Cocktail (Lifetechnologies, Grand Island, N.Y.)] in a 1.5 ml Eppendorf tube vortexed for 30 seconds, and immediately frozen on dry ice and stored in a -80 C freezer until analysis. The samples were taken out of freezer, thawed and extracted by placing the samples on a tube shaker for 30 minutes at 4.degree. C. The tubes were centrifuged at 15000 RPM for 10 min in Eppendorf Centrifuge 5417R (Eppendorf, Ontario, Canada) to pellet any debris. The extract (800 .mu.l) was analyzed for protein concentrations using the Bio-Rad protein assay (BioRad, Hercules, Calif.).
Forty proteins were measured in the gingival samples using V-PLEX Human Biomarker 40-Plex Kit (Meso Scale Diagnostics Rockville, Md.). The assay was performed following the manufacturer's instruction.
Among the proteins measured in the gingival samples, most proteins in the Proinflammatory Panel 1 (human), Cytokine Panel 1 (human), Chemokine Panel 1 (human), Angiogenesis Panel 1 (human), and Vascular Injury Panel 2 (human) had significant changes in their abundance during the 6-week treatment (TABLE 6). Those include FN-.gamma., IL-1.beta., IL-2, IL-4, IL-6, IL-8, IL-10, IL-12p70, IL-13, TNF-.alpha., GM-CSF, IL-5, IL-16, IL-7, IL-12/IL-23p40, IL-1.alpha., VEGF-A, IL-17A, IL-15, TNF-.beta., IL-8 (HA), MCP-1, MCP-4, Eotaxin, IP-10, MDC, Eotaxin-3, TARC, MIP-1.alpha., MIP-1.beta., VEGF-C, VEGF-D, Tie-2, Flt-1/VEGFR1, PlGF, FGF (basic), SAA, CRP, VCAM-1, and ICAM-1.
TABLE-US-00007 TABLE 6 Changes in abundance of proteins in the gingival-brush samples Mean .alpha. = 0.05 Baseline Week 1 Week 3 Week 6 Baseline Week 1 Week 3 Week 6 ICAM-1 16.035 12.209 10.090 9.767 A B B, C C IL-1.alpha. 3.554 2.331 2.181 1.891 A A, B B, C C IL-1.beta. 53.666 35.575 24.295 24.440 A B C C TNF-.beta. 0.0013 0.0010 0.0008 0.0007 A B C C IL-12p70 0.172 0.148 0.118 0.127 A A, B C B, C IL-13 0.805 0.762 0.624 0.648 A A, B C B, C IL-4 0.127 0.115 0.090 0.096 A A, B C B, C IL-5 0.004 0.003 0.002 0.003 A B C B, C CRP 15.637 12.743 12.385 5.809 A A A B Eotaxin 0.077 0.064 0.059 0.059 A A, B B B GM-CSF 0.010 0.008 0.008 0.008 A B B B IFN 0.530 0.446 0.378 0.386 A A, B B B IL-10 0.875 0.490 0.423 0.244 A A, B B B IL-15 0.005 0.003 0.003 0.003 A B B B IL-16 0.466 0.345 0.342 0.295 A B B B IL-6 0.196 0.192 0.168 0.150 A A A, B B IL-7 0.004 0.003 0.003 0.003 A B B B IL-8 856.276 652.066 567.361 572.602 A B B B MCP-1 0.053 0.047 0.039 0.039 A A, B B B MDC 0.399 0.407 0.345 0.339 A A B B Mean .alpha. = 0.05 Baseline Week 1 Week 3 Week 6 Baseline Week 1 Week 3 Week 6 SAA 7.039 6.905 6.092 5.162 A A A, B B Tie-2 0.273 0.239 0.267 0.221 A A, B A B VCAM-1 4.971 3.706 3.156 2.892 A B B B VEGF 0.625 0.511 0.478 0.480 A B B B VEGF 2 0.772 0.661 0.620 0.582 A B B B VEGF-D 0.057 0.052 0.051 0.045 A A, B A, B B VEGF-C 0.145 0.149 0.125 0.137 A, B A B A, B TARC 0.020 0.029 0.019 0.019 A B A A bFGF 0.020 0.015 0.012 0.013 A A A A Eotaxin-3 0.095 0.108 0.091 0.094 A A A A Flt-1 0.390 0.518 0.433 0.415 A B A, B A IL-12p40 0.039 0.031 0.028 0.031 A A A A IL-2 0.166 0.199 0.210 0.162 A A A A IL-8 (HA) 47.508 44.362 41.260 39.119 A A A A IP-10 0.540 1.688 0.740 0.606 A A A A MCP-4 0.023 0.023 0.020 0.022 A A A A MIP-1.alpha. 0.091 0.091 0.084 0.080 A A A A MIP-1.beta. 0.091 0.100 0.110 0.094 A A A A TNF.alpha. 2.009 2.067 2.021 1.670 A A A A
Example 16--One Hundred Seventy Metabolites were Identified in Gingival Samples
The same gingival-brush samples as described in EXAMPLE 15 were used for metabonomic analyses. Fourteen panelists were selected randomly from each treatment group to determine if any metabolite concentrations were changed in gingival samples during the first 3 weeks of treatment. Both baseline and week 3 samples were sent to Metabolon, Inc. (Durham, N.C.) for metabonomic measurement. 170 metabolites were identified and quantified. As shown in TABLE 7, some metabolite concentrations were changed during the first 3 weeks of treatment. Citrulline concentrations in the gingival samples were reduced after three weeks of treatment in the treatment regimen group. Similarly, ornithine was also reduced in the treatment regimen group after three weeks of treatment. Reduction of citrulline and ornithine was likely associated with alleviation of gingivitis.
TABLE-US-00008 TABLE 7 Comparison of metabolites in gingival brush samples between baseline and week 3 during gingivitis treatment Baseline 3 week 3 week/ Biochemical Name mean mean baseline p-value q-value Mass 13-HODE + 9-HODE 1.0877 0.7088 0.65 0.0601 0.1338 295.2 1- 1.2294 0.8274 0.67 0.038 0.1035 500.3 arachidonoylglycerophosphoethanolamine 1- 0.7378 1.0747 1.46 0.0767 0.1548 478.3 oleoylglycerophosphoethanolamine 2-methylbutyrylcarnitine 1.7769 0.6997 0.39 0.0034 0.0546 246.1 (C5) adenosine 5'- 1.4092 0.8451 0.6 0.0295 0.0956 348.1 monophosphate (AMP) alanine 0.8721 1.102 1.26 0.0318 0.0973 115.9 arginylleucine 1.4447 0.6819 0.47 0.0084 0.0777 288.3 arginylphenylalanine 0.9616 0.3335 0.35 0.0119 0.0777 322.2 asparagylleucine 0.9295 0.6122 0.66 0.0698 0.1465 246.2 citrulline 1.0147 0.71 0.7 0.0104 0.0777 176.1 deoxycarnitine 3.2381 0.6088 0.19 0.0003 0.0168 146.1 EDTA 1.5985 0.8384 0.52 0.0138 0.0777 291.1 erythritol 1.625 0.8085 0.5 0.0582 0.1325 217 fructose 1.9933 1.1106 0.56 0.0847 0.1605 217 glutamine 1.2459 0.8366 0.67 0.0374 0.1035 147.2 glutathione, oxidized 1.0161 1.4669 1.44 0.087 0.1605 613.1 (GSSG) glycerol 1.3783 0.8308 0.6 0.0391 0.1035 205 lauryl sulfate 1.685 0.8623 0.51 0.0397 0.1035 265.2 leucine 1.2158 0.9359 0.77 0.0613 0.1338 132.2 leucylleucine 0.9505 0.4393 0.46 0.0251 0.0877 245.1 lysylleucine 1.2009 0.5275 0.44 0.0036 0.0546 260.2 lysylphenylalanine 1.1682 0.4563 0.39 0.0095 0.0777 294.3 maltose 0.8727 1.4481 1.66 0.022 0.0877 204.1 maltotriose 1.0456 1.8347 1.75 0.0858 0.1605 204 mannitol 1.3004 0.7982 0.61 0.042 0.107 319.1 ornithine 1.2916 0.7069 0.55 0.0367 0.1035 141.9 palatinitol 1.4395 0.8272 0.57 0.0782 0.1549 204 phosphate 1.4008 0.8376 0.6 0.0208 0.0877 298.9 proline 1.405 0.99 0.7 0.0033 0.0546 116.1 propionylcarnitine 1.2565 0.7688 0.61 0.0201 0.0877 218.2 pyroglutamine 1.3424 0.7873 0.59 0.0136 0.0777 129.2 serylisoleucine 1.1753 0.7169 0.61 0.0814 0.1583 219.2 spermidine 1.1613 0.8678 0.75 0.0687 0.1465 146.2 succinate 1.2929 0.8113 0.63 0.0754 0.1548 247 threonylleucine 1.1513 0.4931 0.43 0.0044 0.0594 231.2 threonylphenylalanine 1.7693 0.918 0.52 0.0233 0.0877 267.2 trehalose 2.3563 0.9084 0.39 0.0054 0.0647 361.2 tryptophan 1.1518 0.9089 0.79 0.0487 0.1185 205.1 tyrosine 1.383 1.0299 0.74 0.0161 0.0787 182.1 valine 1.1598 0.9271 0.8 0.0304 0.0956 118.1 valylvaline 0.9347 0.8231 0.88 0.0508 0.1207 215.2 X-13671 0.5035 0.918 1.82 0.0545 0.1267 315.3 X-14588 1.3647 0.8378 0.61 0.024 0.0877 151 X-16103 1.3643 0.8461 0.62 0.0297 0.0956 99.3 X-17266 1.3158 0.576 0.44 0.0003 0.0168 530.4 X-17375 1.4785 0.8387 0.57 0.0189 0.0877 357.1 X-18472 0.6138 1.1441 1.86 0.0011 0.0405 827.1 X-18779 1.3756 0.8035 0.58 0.0162 0.0787 209.1 X-19607 1.5237 0.7167 0.47 0.002 0.0537 366.1 X-19609 1.3284 0.7721 0.58 0.016 0.0787 204 X-19612 1.3896 0.7843 0.56 0.01 0.0777 427.2 X-19613 1.3412 0.7535 0.56 0.0099 0.0777 429.3 X-19614 1.3378 0.7343 0.55 0.0454 0.113 570.1 X-19807 1.3478 0.8411 0.62 0.0244 0.0877 93 X-19808 1.3348 0.8368 0.63 0.0254 0.0877 95 X-19850 1.3576 0.7519 0.55 0.011 0.0777 334.2 X-19857 1.3357 0.8032 0.6 0.038 0.1035 230 X-20000 1.2784 0.7536 0.59 0.0133 0.0777 81.2
Example 17--Citrulline was Reduced in Regimen Treatment Over 6 Weeks
Quantitation of citrulline and ornithine from the extracts of the Gingival-brush samples was conducted using gradient hydrophilic interaction liquid chromatography with tandem mass spectrometry (HILIC/MS/MS). Gingival-brush samples were obtained from the same human panelists in the clinical study as described in EXAMPLE 14, and were placed into extraction buffer as described in EXAMPLE 15. The supernatants were subject to both HILIC/MS/MS and BCA analysis. For free citrulline and ornithine analysis, the extracts of the Gingival-brush samples were analyzed either directly (50 .mu.l undiluted sample solution) in 50/50 acetonitrile/ultra-pure water with 0.754% formic acid or diluted fivefold. For total citrulline and ornithine analysis, the extracts of the Gingival-brush samples were first hydrolyzed using 6 N HCl (50 .mu.L of extract with 450 .mu.L of 6N HCl), no shaking, and placed on a hot plate at 110.degree. C. for 16 hours. The hydrolyzed samples were then dried down under vacuum at room temperature (Savant speedvac of Lifetechnology, Grand Island, N.Y.) and then reconstituted in 1 ml of dilution solution (50/50 acetonitrile/ultra-pure water with 0.754% formic acid) for analysis. The standards and the samples were analyzed using gradient hydrophilic interaction liquid chromatography with tandem mass spectrometry (HILIC/MS/MS). Analytes and the corresponding ISTDs (stable isotope labeled internal standard) were monitored by electrospray ionization (ESI) in positive mode using the selected-reaction-monitoring schemes shown in TABLE 8. A standard curve was constructed by plotting the signal, defined here as the peak area ratio (peak area analyte/peak area ISTD), for each standard versus the mass of each analyte for the corresponding standard. The mass of each analyte in the calibration standards and Gingival-brush extract samples were then back-calculated using the generated regression equation. The concentration of protein bound citrulline or ornithine was calculated as the result of subtracting the concentration of free citrulline or ornithine from the concentration of total citrulline or ornithine, respectively. The result was reported as the concentration of citrulline or ornithine or the result was standardized by dividing by the amount of citrulline or ornithine by the amount of the total proteins that were found in the extract.
TABLE-US-00009 TABLE 8 Multiple Reaction Monitoring (MRM) transitions for analytes and their corresponding stable isotope labeled internal standards Analytes MRM Internal Standards MRM Citrulline 176 .fwdarw. 159 d.sub.7-Citrulline 181 .fwdarw. 164 Ornithine 133 .fwdarw. 70 d.sub.6-Ornithine 139 .fwdarw. 76
All samples from all panelists of the Test regimen [Crest.RTM. Pro-Health Clinical Plaque Control (0.454% stannous fluoride) dentifrice, Oral-B.RTM. Professional Care 1000 with Precision Clean brush head and Crest.RTM. Pro-Health Refreshing Clean Mint (0.07% CPC) mouth rinse] were analyzed. As shown in FIG. 16, citrulline levels reduced rapidly in the first week of treatment, and then continued to decline gradually in weeks 3 and 6 of treatment. These results are consistent with clinical observations, where gingival bleeding sites (GBI) and the gingival inflammation (MGI) were reduced over the 6-week treatment period.
Example 18--Levels of Proteins Containing Ornithine Decreased Over 6 Week Treatment
The same samples as described in EXAMPLE 17 were analyzed using procedures as described in EXAMPLE 17. Gingivitis was treated for 6 weeks. Baseline (BL) represents diseased status. Symptoms of gingivitis were alleviated from week 1 to week 6 treatments. Protein bound ornithine (the difference between total and the free ornithine) was higher in gingivitis as shown in FIG. 17. Protein bound ornithine was reduced gradually as gingivitis was decreased in severity.
Example 19--Expression of Enzymes in the Ornithine-Citrulline-Arginine Cycle was Changed in Gingival Samples During the 6 Week Treatment
Gingival samples were collected as described in EXAMPLES 15, from the same panelists as in EXAMPLE 15, and were used to examine the expression of genes during 6 weeks of treatments with Test regimen [Crest.RTM. Pro-Health Clinical Plaque Control (0.454% stannous fluoride) dentifrice, Oral-B.RTM. Professional Care 1000 with Precision Clean brush head and Crest.RTM. Pro-Health Refreshing Clean Mint (0.07% CPC) mouth rinse] and Control regimen [Crest.RTM. Cavity Protection (0.243% sodium fluoride) dentifrice and Oral-B.RTM. Indicator Soft Manual toothbrush].
After harvesting the samples, the brush was completely immersed in the RNAlater solution (1 ml in a 1.5 ml Eppendorf tube) for keeping RNA from degrading during transport and storage (Qiagen, Valencia, Calif.). The microcentrifuge tubes were vortexed/mixed for 30 seconds, immediately frozen on dry ice, stored and transferred on dry ice to the lab for biomarker analysis. RNA isolation and microarray analysis were performed as described previously in a publication (Offenbacher S, Barros S P, Paquette D W, Winston J L, Biesbrock A R, Thomason R G, Gibb R D, Fulmer A W, Tiesman J P, Juhlin K D, Wang S L, Reichling T D, Chen K S, Ho B. J Periodontol. 2009 December; 80(12):1963-82. doi: 10.1902/jop.2009.080645. Gingival transcriptome patterns during induction and resolution of experimental gingivitis in humans).
The ornithine-citrulline-arginine cycle consists of four enzymes (FIG. 18). The main feature of the cycle is that three amino acids (arginine, ornithine, and citrulline) can be converted to each other. The first enzyme is ornithine transcarbamoylase, which transfers a carbamoyl group from carbamoyl phosphate to ornithine to generate citrulline. This reaction occurs in the matrix of the mitochondria. Expression of ornithine transcarbamoylase was reduced in the treatment (FIG. 19). The second enzyme is argininosuccinate synthetase. This enzyme uses ATP to activate citrulline by forming a citrullyl-AMP intermediate, which is attacked by the amino group of an aspartate residue to generate argininosuccinate. This and subsequent two reactions occur in the cytosol. Again, expression of argininosuccinate synthetase decreased during the treatment. The third enzyme is argininosuccinate lyase, which catalyzes cleavage of argininosuccinate into fumarate and arginine. The last enzyme is argininase. Argininases cleave arginine to produce urea and ornithine. In a contrast to the decreased expression of ornithine transcarbamoylase and argininosuccinate synthetase genes, argininase I and II increased (FIG. 19).
Arginine is also a substrate for nitric oxide synthase, which oxidizes arginine to produce citrulline and nitric oxide. Expression of nitric oxide synthase gene increased too (FIG. 19).
Example 20--Citrulline Increased in Gingival Samples in Experiment Gingivitis
Experimental gingivitis: Another clinical study was carried out to determine whether citrulline is increased in experimentally induced gingivitis in healthy human panelists. This was a case-control study enrolling 60 panelists. The study population included two groups as follows: Group 1 or high bleeders group, thirty (30) panelists with at least 20 bleeding sites, where bleeding is a GBI site score of 1 or 2 at baseline. Group 2 or low bleeders group, thirty (30) panelists with 2 or less bleeding sites, where bleeding is a GBI site score of 1 or 2.
The study consisted of two Phases: Health/Rigorous Hygiene Phase with dental prophylaxis, polishing and rigorous oral hygiene; and Induced Gingivitis Phase without oral hygiene. At the Screening visit, panelists underwent an oral soft tissue assessment and had a gingivitis evaluation (Modified Gingival Index (MGI) and Gingival Bleeding Index (GBI). At Visit 2 qualifying panelists received an oral soft tissue exam followed by a gingivitis evaluation and gingival plaques and gum swabs were collected for the qPCR, protein and RNA host biomarker analysis. Following that, all panelists received dental prophylaxis and entered the Health/Rigorous Hygiene Phase, lasting two weeks. After two weeks of rigorous hygiene, panelists entered the Induced Gingivitis Phase, lasting for three weeks. Oral soft tissue exams and gingivitis were re-evaluated and all samples (gum swabs) were collected at Baseline, WK0 and WK2.
Gingival sample collection--A gum swab was collected from each side of the upper arch using the procedures as described in EXAMPLE 15. Gum swabs were collected close to the gum line from the buccal sites only (preferably from four adjacent teeth--preferably from premolar and molar areas). Panelists rinsed for 30 seconds with 15 ml of Listerine rinse to clean the surface of sampling area. After the Listerine rinse, panelists rinsed for 30 seconds with 20 ml of water. Following that, selected sites were isolated with a cotton roll and gently dried with an air syringe and two gum swabs were taken with collection brushes/swabs from the gingiva region close to the gumline of the selected teeth. The samples were placed in a pre-labeled (panelist ID, sample ID, visit, and date) 1.5 ml micro-centrifuge tube containing 800 ul DPBS (Dulbecco's phosphate-buffered saline) (Lifetechnologies, Grand Island, N.Y.) with protease inhibitors, including AEBSF (4-(2-Aminoethyl) benzenesulfonyl fluoride hydrochloride) 2 mM, aprotinin 0.3 .mu.M, Bestatin 130 .mu.M, EDTA (Ethylenediaminetetraacetic acid) 1 mM, E-64 1 .mu.M, and leupeptin 1 .mu.M. The vials were vortexed/mixed for 30 seconds, immediately frozen on dry ice, stored and transferred on dry ice to the lab for biomarker analysis. Samples from three visits were analyzed using the procedures described in EXAMPLE 17, and shown in FIG. 20. Those three visits were baseline, Week 0, (right after the Health/Rigorous Hygiene Phase and before the induced gingivitis phase) and week 2 (at the end of Induced Gingivitis Phase). Free citrulline levels were low in both the high and low bleeders groups at the baseline and week 0, but rose quickly in the induced gingivitis in both groups at week 2.
Example 21--Levels of Proteins Containing Citrulline Decreased in Experimentally Induced Gingivitis
The same procedures were used as described in EXAMPLE 17. The samples were the same as described in EXAMPLE 20. Protein bound citrulline was lower at the baseline than that at week 0 in both high and low bleeders groups as shown in FIG. 21 in gingival tissue. It was low in experimental gingivitis in both groups at week 2.
Example 22--Levels of Proteins Containing Ornithine Increased in Gingival Samples in Experiment Gingivitis
The same clinical samples from experimental gingivitis (EXAMPLE 20) were analyzed using the procedures described in EXAMPLE 17. The bound ornithine was the lowest at week 0 (FIG. 22) in both groups. Its levels at the baseline were higher than those at week 0. The bound ornithine reached peaks when gingivitis was induced in both groups at week 2. Also it is worth noting the total ornithine (Free and protein bound ornithine) was increased in the induced gingivitis (FIG. 23) in both groups.
Example 23--Levels of Proteins Containing Arginine Decreased in Gingival Samples in Experimentally Induced Gingivitis
The same procedures were used as described in EXAMPLE 17. The samples were the same as described in EXAMPLE 20. The protein bound arginine was the lowest in induced gingivitis (FIG. 24) in both groups. Its levels were higher in WK0 than at Baseline in both groups. The total arginine in the gingival brush samples displayed the same patterns as the protein bound one (FIG. 25).
Example 24--Citrulline Inhibited LPS Stimulated Production of Proinflammatory Cytokine in Human THP-1 Cells
Citrulline was purchased from Sigma-Aldrich (St. Louis, Mo.). THP1-Dual.TM. cells were purchased from Invivogen (San Diego, Calif.). Cells were cultured following the manufacturer's instruction, as described in EXAMPLE 11. For treatment, 0.3 mM to 9 mM of citrulline were first added to the culture medium. Then, 300 ng/ml of P. gingivalis LPS 1690 were added 60 minutes later. After 24 hours of treatment, media was collected and analyzed for cytokine production using 9-plex kit (Meso Scale Diagnostics Rockville, Md.).
P. gingivalis LPS 1690 stimulated cytokine production, as shown in FIG. 26. Citrulline inhibited P. gingivalis LPS 1690 effects on proinflammatory cytokine production in a dose-dependent manner. Those cytokines include IL-6, TNF-.alpha., IL-12p70, IL-10, IL-2, IFN-r and IL-1.beta..
Example 25--Binding of BODIPY-TR-Cadaverine to Bacteria and their Products
Bacteria and their products can activate TLR2 and TLR4 reporter genes as described in EXAMPLES 5 and 8. Here, experiments were carried out to determine whether different bacteria and their products have different IC50 in reducing fluorescent intensity of BODIPY-TR-cadaverine, hereinafter referred to as BC, in a procedure as described in EXAMPLE 4. Briefly, high throughput screen utilizes the fluorescent dye BODIPY-TR-cadaverine 5-(((4-(4,4-difluoro--(2-thienyl)-4-bora-3a,4a-diaza-s-indacene-3-yl)phen- oxy)acetyl)amino)pentylamine hydrochloride (BC fluorescent dye), purchased from Life Technologies (Carlsbad, Calif.), as described previously by Wood, Miller and David (2004) (Comb Chem High Throughput Screen 2004 May; 7(3):239-49. Anti-endotoxin agents. 1. Development of a fluorescent probe displacement method optimized for the rapid identification of lipopolysaccharide-binding agents.). The experiment was carried out at room temperature. E. coli LPS (15 .mu.g/ml) was mixed in a well of a 96-well solid black flat bottom plate (Corning Incorporated, Corning, N.Y.) with SnF2 and cetylpyridinium chloride in 30 .mu.l of 50 mM Tris buffer at pH 7.4 for 10 min, and then 20 .mu.l of 60 .mu.M BC fluorescent dye was added right before fluorescence measurement at 21.degree. C., or room temperature. Fluorescent measurements were performed in a SpectraMax M3 automated 96 well plate reader (Molecular Device, Sunnyvale, Calif.). The excitation wavelength was 580 nM and the fluorescence emission was measured at 620 nM. The half maximal inhibitory concentration (IC.sub.50) is a measure of the effectiveness of bacterial products inhibiting BC emitting fluorescence. It indicates how much of a bacterial material is needed to inhibit BC fluorescence by half using GraphPad Prism software (GraphPad Software, La Jolla, Calif.). As shown in FIGS. 27 and 28, each bacterial product decreases the fluorescent intensity of BC in a dose-dependent manner. Similarly, the whole bacterial cells and the supernatant of bacterial growth also reduced the fluorescence of BC in a dose-dependent fashion (FIGS. 29 and 30).
Example 26--Determination of Bacterial Virulence
Growth of bacteria: Two bacteria, Bacterium A and Bacterium B, were cultured in Tryptic Soy Broth medium (Sigma-Aldrich, St. Louis, Mo.) at 37.degree. C. with shaking at 200 rpm. The bacteria were harvested at 24 hours, and suspended in 0.5 ml of phosphate-buffered saline, labeled "live". Half ml of "Live" bacteria was transferred to a 1.5 ml microtube, and heated to 80.degree. C. for 30 min. The heat-treated bacteria were labeled "Heat-Inactivated", or "Dead".
Measurement of TLR responses in THP-1 gene reporter cells (NFkB-SEAP): The Live and Heat-Inactivated bacteria were applied to THP-1 cells as described in EXAMPLE 11. As shown in FIG. 31, EC50 of Bacterium A and B on activation of NFkB-SEAP reporter gene in THP-1 cells was determined. Both Live and Heat-inactivated (Dead) bacteria stimulated expression of the NFkB-SEAP reporter gene. Bacterium B had a lower EC50 than Bacterium A in activating expression of the NFkB-SEAP reporter gene.
Cytokine production and measurement: Human peripheral bleed mononuclear cells (hPBMC) were obtained from All Cells company (All Cells, Alameda, Calif.) as Leukapheresed blood. Leukapheresed blood was mixed with an equal part of DMEM+glutaGRO supplemented with 9.1% fetal bovine serum and 1% penicillin/streptomycin (Thermo Fisher, Waltham, Mass.). hPBMC were isolated from the 1:1 mixture of blood and culture medium by collecting the buffy coat of a centrifuged Histopaque.RTM.-1077 (Sigma-Aldrich, St. Louis, Mo.) buffer density gradient. The cells (200,000 cells) were cultured in 200 .mu.l of DMEM+glutaGRO supplemented with 9.1% fetal bovine serum and 1% penicillin/streptomycin, and treated with Live and Heat-Inactive bacteria (6,250,000 colony-forming units). The medium was harvested at 24 hours after adding the bacteria, and analyzed for proinflammatory cytokines in a kit following manufacturer's instruction (Meso Scale Diagnostics, Rockville, Md.).
As shown in TABLE 9, both live bacterium A and B stimulated production of cytokines in hPBMC. Bacteriun B was far more potent than Bacterium A in promoting production of IFN-.gamma., IL-10, IL-12p70, IL-1.beta., IL-6, IL-8 and TNF-.alpha. in hPBMC.
TABLE-US-00010 Live Live Statistics Cytokines Bacterium A Bacterium Mean IFN-.gamma. 867.16 12734.36 Mean IL-10 68.35 412.51 Mean IL-12p70 23.75 253.47 Mean IL-1.beta. 2300.86 6969.31 Mean IL-2 44.24 65.17 Mean IL-6 3431.05 9963.84 Mean IL-8 65742.91 70357.25 Mean TNF-.alpha. 3710.66 13825.49 Std Dev IFN-.gamma. 488.11 8200.13 Std Dev IL-10 33.56 314.23 Std Dev IL-12p70 14.71 283.33 Std Dev IL-1.beta. 1569.72 7691.93 Std Dev IL-2 32.97 36.29 Std Dev IL-6 2212.62 6552.12 Std Dev IL-8 18689.24 13669.28 Std Dev TNF-.alpha. 2503.25 8302.26
The dimensions and values disclosed herein are not to be understood as being strictly limited to the exact numerical values recited. Instead, unless otherwise specified, each such dimension is intended to mean both the recited value and a functionally equivalent range surrounding that value. For example, a dimension disclosed as "40 mm" is intended to mean "about 40 mm."
Every document cited herein, including any cross referenced or related patent or application and any patent application or patent to which this application claims priority or benefit thereof, is hereby incorporated herein by reference in its entirety unless expressly excluded or otherwise limited. The citation of any document is not an admission that it is prior art with respect to any invention disclosed or claimed herein or that it alone, or in any combination with any other reference or references, teaches, suggests or discloses any such invention. Further, to the extent that any meaning or definition of a term in this document conflicts with any meaning or definition of the same term in a document incorporated by reference, the meaning or definition assigned to that term in this document shall govern.
While particular embodiments of the present invention have been illustrated and described, it would be obvious to those skilled in the art that various other changes and modifications can be made without departing from the spirit and scope of the invention. It is therefore intended to cover in the appended claims all such changes and modifications that are within the scope of this invention.
SEQUENCE LISTINGS
1
91786PRTHomo sapiens 1Met Thr Ser Ile Phe His Phe Ala Ile Ile Phe Met Leu Ile Leu Gln1 5 10 15Ile Arg Ile Gln Leu Ser Glu Glu Ser Glu Phe Leu Val Asp Arg Ser 20 25 30Lys Asn Gly Leu Ile His Val Pro Lys Asp Leu Ser Gln Lys Thr Thr 35 40 45Ile Leu Asn Ile Ser Gln Asn Tyr Ile Ser Glu Leu Trp Thr Ser Asp 50 55 60Ile Leu Ser Leu Ser Lys Leu Arg Ile Leu Ile Ile Ser His Asn Arg65 70 75 80Ile Gln Tyr Leu Asp Ile Ser Val Phe Lys Phe Asn Gln Glu Leu Glu 85 90 95Tyr Leu Asp Leu Ser His Asn Lys Leu Val Lys Ile Ser Cys His Pro 100 105 110Thr Val Asn Leu Lys His Leu Asp Leu Ser Phe Asn Ala Phe Asp Ala 115 120 125Leu Pro Ile Cys Lys Glu Phe Gly Asn Met Ser Gln Leu Lys Phe Leu 130 135 140Gly Leu Ser Thr Thr His Leu Glu Lys Ser Ser Val Leu Pro Ile Ala145 150 155 160His Leu Asn Ile Ser Lys Val Leu Leu Val Leu Gly Glu Thr Tyr Gly 165 170 175Glu Lys Glu Asp Pro Glu Gly Leu Gln Asp Phe Asn Thr Glu Ser Leu 180 185 190His Ile Val Phe Pro Thr Asn Lys Glu Phe His Phe Ile Leu Asp Val 195 200 205Ser Val Lys Thr Val Ala Asn Leu Glu Leu Ser Asn Ile Lys Cys Val 210 215 220Leu Glu Asp Asn Lys Cys Ser Tyr Phe Leu Ser Ile Leu Ala Lys Leu225 230 235 240Gln Thr Asn Pro Lys Leu Ser Asn Leu Thr Leu Asn Asn Ile Glu Thr 245 250 255Thr Trp Asn Ser Phe Ile Arg Ile Leu Gln Leu Val Trp His Thr Thr 260 265 270Val Trp Tyr Phe Ser Ile Ser Asn Val Lys Leu Gln Gly Gln Leu Asp 275 280 285Phe Arg Asp Phe Asp Tyr Ser Gly Thr Ser Leu Lys Ala Leu Ser Ile 290 295 300His Gln Val Val Ser Asp Val Phe Gly Phe Pro Gln Ser Tyr Ile Tyr305 310 315 320Glu Ile Phe Ser Asn Met Asn Ile Lys Asn Phe Thr Val Ser Gly Thr 325 330 335Arg Met Val His Met Leu Cys Pro Ser Lys Ile Ser Pro Phe Leu His 340 345 350Leu Asp Phe Ser Asn Asn Leu Leu Thr Asp Thr Val Phe Glu Asn Cys 355 360 365Gly His Leu Thr Glu Leu Glu Thr Leu Ile Leu Gln Met Asn Gln Leu 370 375 380Lys Glu Leu Ser Lys Ile Ala Glu Met Thr Thr Gln Met Lys Ser Leu385 390 395 400Gln Gln Leu Asp Ile Ser Gln Asn Ser Val Ser Tyr Asp Glu Lys Lys 405 410 415Gly Asp Cys Ser Trp Thr Lys Ser Leu Leu Ser Leu Asn Met Ser Ser 420 425 430Asn Ile Leu Thr Asp Thr Ile Phe Arg Cys Leu Pro Pro Arg Ile Lys 435 440 445Val Leu Asp Leu His Ser Asn Lys Ile Lys Ser Ile Pro Lys Gln Val 450 455 460Val Lys Leu Glu Ala Leu Gln Glu Leu Asn Val Ala Phe Asn Ser Leu465 470 475 480Thr Asp Leu Pro Gly Cys Gly Ser Phe Ser Ser Leu Ser Val Leu Ile 485 490 495Ile Asp His Asn Ser Val Ser His Pro Ser Ala Asp Phe Phe Gln Ser 500 505 510Cys Gln Lys Met Arg Ser Ile Lys Ala Gly Asp Asn Pro Phe Gln Cys 515 520 525Thr Cys Glu Leu Gly Glu Phe Val Lys Asn Ile Asp Gln Val Ser Ser 530 535 540Glu Val Leu Glu Gly Trp Pro Asp Ser Tyr Lys Cys Asp Tyr Pro Glu545 550 555 560Ser Tyr Arg Gly Thr Leu Leu Lys Asp Phe His Met Ser Glu Leu Ser 565 570 575Cys Asn Ile Thr Leu Leu Ile Val Thr Ile Val Ala Thr Met Leu Val 580 585 590Leu Ala Val Thr Val Thr Ser Leu Cys Ser Tyr Leu Asp Leu Pro Trp 595 600 605Tyr Leu Arg Met Val Cys Gln Trp Thr Gln Thr Arg Arg Arg Ala Arg 610 615 620Asn Ile Pro Leu Glu Glu Leu Gln Arg Asn Leu Gln Phe His Ala Phe625 630 635 640Ile Ser Tyr Ser Gly His Asp Ser Phe Trp Val Lys Asn Glu Leu Leu 645 650 655Pro Asn Leu Glu Lys Glu Gly Met Gln Ile Cys Leu His Glu Arg Asn 660 665 670Phe Val Pro Gly Lys Ser Ile Val Glu Asn Ile Ile Thr Cys Ile Glu 675 680 685Lys Ser Tyr Lys Ser Ile Phe Val Leu Ser Pro Asn Phe Val Gln Ser 690 695 700Glu Trp Cys His Tyr Glu Leu Tyr Phe Ala His His Asn Leu Phe His705 710 715 720Glu Gly Ser Asn Ser Leu Ile Leu Ile Leu Leu Glu Pro Ile Pro Gln 725 730 735Tyr Ser Ile Pro Ser Ser Tyr His Lys Leu Lys Ser Leu Met Ala Arg 740 745 750Arg Thr Tyr Leu Glu Trp Pro Lys Glu Lys Ser Lys Arg Gly Leu Phe 755 760 765Trp Ala Asn Leu Arg Ala Ala Ile Asn Ile Lys Leu Thr Glu Gln Ala 770 775 780Lys Lys7852784PRTHomo sapiens 2Met Pro His Thr Leu Trp Met Val Trp Val Leu Gly Val Ile Ile Ser1 5 10 15Leu Ser Lys Glu Glu Ser Ser Asn Gln Ala Ser Leu Ser Cys Asp Arg 20 25 30Asn Gly Ile Cys Lys Gly Ser Ser Gly Ser Leu Asn Ser Ile Pro Ser 35 40 45Gly Leu Thr Glu Ala Val Lys Ser Leu Asp Leu Ser Asn Asn Arg Ile 50 55 60Thr Tyr Ile Ser Asn Ser Asp Leu Gln Arg Cys Val Asn Leu Gln Ala65 70 75 80Leu Val Leu Thr Ser Asn Gly Ile Asn Thr Ile Glu Glu Asp Ser Phe 85 90 95Ser Ser Leu Gly Ser Leu Glu His Leu Asp Leu Ser Tyr Asn Tyr Leu 100 105 110Ser Asn Leu Ser Ser Ser Trp Phe Lys Pro Leu Ser Ser Leu Thr Phe 115 120 125Leu Asn Leu Leu Gly Asn Pro Tyr Lys Thr Leu Gly Glu Thr Ser Leu 130 135 140Phe Ser His Leu Thr Lys Leu Gln Ile Leu Arg Val Gly Asn Met Asp145 150 155 160Thr Phe Thr Lys Ile Gln Arg Lys Asp Phe Ala Gly Leu Thr Phe Leu 165 170 175Glu Glu Leu Glu Ile Asp Ala Ser Asp Leu Gln Ser Tyr Glu Pro Lys 180 185 190Ser Leu Lys Ser Ile Gln Asn Val Ser His Leu Ile Leu His Met Lys 195 200 205Gln His Ile Leu Leu Leu Glu Ile Phe Val Asp Val Thr Ser Ser Val 210 215 220Glu Cys Leu Glu Leu Arg Asp Thr Asp Leu Asp Thr Phe His Phe Ser225 230 235 240Glu Leu Ser Thr Gly Glu Thr Asn Ser Leu Ile Lys Lys Phe Thr Phe 245 250 255Arg Asn Val Lys Ile Thr Asp Glu Ser Leu Phe Gln Val Met Lys Leu 260 265 270Leu Asn Gln Ile Ser Gly Leu Leu Glu Leu Glu Phe Asp Asp Cys Thr 275 280 285Leu Asn Gly Val Gly Asn Phe Arg Ala Ser Asp Asn Asp Arg Val Ile 290 295 300Asp Pro Gly Lys Val Glu Thr Leu Thr Ile Arg Arg Leu His Ile Pro305 310 315 320Arg Phe Tyr Leu Phe Tyr Asp Leu Ser Thr Leu Tyr Ser Leu Thr Glu 325 330 335Arg Val Lys Arg Ile Thr Val Glu Asn Ser Lys Val Phe Leu Val Pro 340 345 350Cys Leu Leu Ser Gln His Leu Lys Ser Leu Glu Tyr Leu Asp Leu Ser 355 360 365Glu Asn Leu Met Val Glu Glu Tyr Leu Lys Asn Ser Ala Cys Glu Asp 370 375 380Ala Trp Pro Ser Leu Gln Thr Leu Ile Leu Arg Gln Asn His Leu Ala385 390 395 400Ser Leu Glu Lys Thr Gly Glu Thr Leu Leu Thr Leu Lys Asn Leu Thr 405 410 415Asn Ile Asp Ile Ser Lys Asn Ser Phe His Ser Met Pro Glu Thr Cys 420 425 430Gln Trp Pro Glu Lys Met Lys Tyr Leu Asn Leu Ser Ser Thr Arg Ile 435 440 445His Ser Val Thr Gly Cys Ile Pro Lys Thr Leu Glu Ile Leu Asp Val 450 455 460Ser Asn Asn Asn Leu Asn Leu Phe Ser Leu Asn Leu Pro Gln Leu Lys465 470 475 480Glu Leu Tyr Ile Ser Arg Asn Lys Leu Met Thr Leu Pro Asp Ala Ser 485 490 495Leu Leu Pro Met Leu Leu Val Leu Lys Ile Ser Arg Asn Ala Ile Thr 500 505 510Thr Phe Ser Lys Glu Gln Leu Asp Ser Phe His Thr Leu Lys Thr Leu 515 520 525Glu Ala Gly Gly Asn Asn Phe Ile Cys Ser Cys Glu Phe Leu Ser Phe 530 535 540Thr Gln Glu Gln Gln Ala Leu Ala Lys Val Leu Ile Asp Trp Pro Ala545 550 555 560Asn Tyr Leu Cys Asp Ser Pro Ser His Val Arg Gly Gln Gln Val Gln 565 570 575Asp Val Arg Leu Ser Val Ser Glu Cys His Arg Thr Ala Leu Val Ser 580 585 590Gly Met Cys Cys Ala Leu Phe Leu Leu Ile Leu Leu Thr Gly Val Leu 595 600 605Cys His Arg Phe His Gly Leu Trp Tyr Met Lys Met Met Trp Ala Trp 610 615 620Leu Gln Ala Lys Arg Lys Pro Arg Lys Ala Pro Ser Arg Asn Ile Cys625 630 635 640Tyr Asp Ala Phe Val Ser Tyr Ser Glu Arg Asp Ala Tyr Trp Val Glu 645 650 655Asn Leu Met Val Gln Glu Leu Glu Asn Phe Asn Pro Pro Phe Lys Leu 660 665 670Cys Leu His Lys Arg Asp Phe Ile Pro Gly Lys Trp Ile Ile Asp Asn 675 680 685Ile Ile Asp Ser Ile Glu Lys Ser His Lys Thr Val Phe Val Leu Ser 690 695 700Glu Asn Phe Val Lys Ser Glu Trp Cys Lys Tyr Glu Leu Asp Phe Ser705 710 715 720His Phe Arg Leu Phe Asp Glu Asn Asn Asp Ala Ala Ile Leu Ile Leu 725 730 735Leu Glu Pro Ile Glu Lys Lys Ala Ile Pro Gln Arg Phe Cys Lys Leu 740 745 750Arg Lys Ile Met Asn Thr Lys Thr Tyr Leu Glu Trp Pro Met Asp Glu 755 760 765Ala Gln Arg Glu Gly Phe Trp Val Asn Leu Arg Ala Ala Ile Lys Ser 770 775 7803904PRTHomo sapiens 3Met Arg Gln Thr Leu Pro Cys Ile Tyr Phe Trp Gly Gly Leu Leu Pro1 5 10 15Phe Gly Met Leu Cys Ala Ser Ser Thr Thr Lys Cys Thr Val Ser His 20 25 30Glu Val Ala Asp Cys Ser His Leu Lys Leu Thr Gln Val Pro Asp Asp 35 40 45Leu Pro Thr Asn Ile Thr Val Leu Asn Leu Thr His Asn Gln Leu Arg 50 55 60Arg Leu Pro Ala Ala Asn Phe Thr Arg Tyr Ser Gln Leu Thr Ser Leu65 70 75 80Asp Val Gly Phe Asn Thr Ile Ser Lys Leu Glu Pro Glu Leu Cys Gln 85 90 95Lys Leu Pro Met Leu Lys Val Leu Asn Leu Gln His Asn Glu Leu Ser 100 105 110Gln Leu Ser Asp Lys Thr Phe Ala Phe Cys Thr Asn Leu Thr Glu Leu 115 120 125His Leu Met Ser Asn Ser Ile Gln Lys Ile Lys Asn Asn Pro Phe Val 130 135 140Lys Gln Lys Asn Leu Ile Thr Leu Asp Leu Ser His Asn Gly Leu Ser145 150 155 160Ser Thr Lys Leu Gly Thr Gln Val Gln Leu Glu Asn Leu Gln Glu Leu 165 170 175Leu Leu Ser Asn Asn Lys Ile Gln Ala Leu Lys Ser Glu Glu Leu Asp 180 185 190Ile Phe Ala Asn Ser Ser Leu Lys Lys Leu Glu Leu Ser Ser Asn Gln 195 200 205Ile Lys Glu Phe Ser Pro Gly Cys Phe His Ala Ile Gly Arg Leu Phe 210 215 220Gly Leu Phe Leu Asn Asn Val Gln Leu Gly Pro Ser Leu Thr Glu Lys225 230 235 240Leu Cys Leu Glu Leu Ala Asn Thr Ser Ile Arg Asn Leu Ser Leu Ser 245 250 255Asn Ser Gln Leu Ser Thr Thr Ser Asn Thr Thr Phe Leu Gly Leu Lys 260 265 270Trp Thr Asn Leu Thr Met Leu Asp Leu Ser Tyr Asn Asn Leu Asn Val 275 280 285Val Gly Asn Asp Ser Phe Ala Trp Leu Pro Gln Leu Glu Tyr Phe Phe 290 295 300Leu Glu Tyr Asn Asn Ile Gln His Leu Phe Ser His Ser Leu His Gly305 310 315 320Leu Phe Asn Val Arg Tyr Leu Asn Leu Lys Arg Ser Phe Thr Lys Gln 325 330 335Ser Ile Ser Leu Ala Ser Leu Pro Lys Ile Asp Asp Phe Ser Phe Gln 340 345 350Trp Leu Lys Cys Leu Glu His Leu Asn Met Glu Asp Asn Asp Ile Pro 355 360 365Gly Ile Lys Ser Asn Met Phe Thr Gly Leu Ile Asn Leu Lys Tyr Leu 370 375 380Ser Leu Ser Asn Ser Phe Thr Ser Leu Arg Thr Leu Thr Asn Glu Thr385 390 395 400Phe Val Ser Leu Ala His Ser Pro Leu His Ile Leu Asn Leu Thr Lys 405 410 415Asn Lys Ile Ser Lys Ile Glu Ser Asp Ala Phe Ser Trp Leu Gly His 420 425 430Leu Glu Val Leu Asp Leu Gly Leu Asn Glu Ile Gly Gln Glu Leu Thr 435 440 445Gly Gln Glu Trp Arg Gly Leu Glu Asn Ile Phe Glu Ile Tyr Leu Ser 450 455 460Tyr Asn Lys Tyr Leu Gln Leu Thr Arg Asn Ser Phe Ala Leu Val Pro465 470 475 480Ser Leu Gln Arg Leu Met Leu Arg Arg Val Ala Leu Lys Asn Val Asp 485 490 495Ser Ser Pro Ser Pro Phe Gln Pro Leu Arg Asn Leu Thr Ile Leu Asp 500 505 510Leu Ser Asn Asn Asn Ile Ala Asn Ile Asn Asp Asp Met Leu Glu Gly 515 520 525Leu Glu Lys Leu Glu Ile Leu Asp Leu Gln His Asn Asn Leu Ala Arg 530 535 540Leu Trp Lys His Ala Asn Pro Gly Gly Pro Ile Tyr Phe Leu Lys Gly545 550 555 560Leu Ser His Leu His Ile Leu Asn Leu Glu Ser Asn Gly Phe Asp Glu 565 570 575Ile Pro Val Glu Val Phe Lys Asp Leu Phe Glu Leu Lys Ile Ile Asp 580 585 590Leu Gly Leu Asn Asn Leu Asn Thr Leu Pro Ala Ser Val Phe Asn Asn 595 600 605Gln Val Ser Leu Lys Ser Leu Asn Leu Gln Lys Asn Leu Ile Thr Ser 610 615 620Val Glu Lys Lys Val Phe Gly Pro Ala Phe Arg Asn Leu Thr Glu Leu625 630 635 640Asp Met Arg Phe Asn Pro Phe Asp Cys Thr Cys Glu Ser Ile Ala Trp 645 650 655Phe Val Asn Trp Ile Asn Glu Thr His Thr Asn Ile Pro Glu Leu Ser 660 665 670Ser His Tyr Leu Cys Asn Thr Pro Pro His Tyr His Gly Phe Pro Val 675 680 685Arg Leu Phe Asp Thr Ser Ser Cys Lys Asp Ser Ala Pro Phe Glu Leu 690 695 700Phe Phe Met Ile Asn Thr Ser Ile Leu Leu Ile Phe Ile Phe Ile Val705 710 715 720Leu Leu Ile His Phe Glu Gly Trp Arg Ile Ser Phe Tyr Trp Asn Val 725 730 735Ser Val His Arg Val Leu Gly Phe Lys Glu Ile Asp Arg Gln Thr Glu 740 745 750Gln Phe Glu Tyr Ala Ala Tyr Ile Ile His Ala Tyr Lys Asp Lys Asp 755 760 765Trp Val Trp Glu His Phe Ser Ser Met Glu Lys Glu Asp Gln Ser Leu 770 775 780Lys Phe Cys Leu Glu Glu Arg Asp Phe Glu Ala Gly Val Phe Glu Leu785 790 795 800Glu Ala Ile Val Asn Ser Ile Lys Arg Ser Arg Lys Ile Ile Phe Val 805 810 815Ile Thr His His Leu Leu Lys Asp Pro Leu Cys Lys Arg Phe Lys Val 820 825 830His His Ala Val Gln Gln Ala Ile Glu Gln Asn Leu Asp Ser Ile Ile 835 840 845Leu Val Phe Leu Glu Glu Ile Pro Asp Tyr Lys Leu Asn His Ala Leu 850 855 860Cys Leu Arg Arg Gly Met Phe Lys Ser His Cys Ile Leu Asn Trp Pro865 870 875 880Val Gln Lys Glu Arg Ile Gly Ala Phe Arg His Lys Leu Gln Val Ala 885 890 895Leu Gly Ser Lys Asn
Ser Val His 9004798PRTHomo sapiens 4Met Glu Leu Asn Phe Tyr Lys Ile Pro Asp Asn Leu Pro Phe Ser Thr1 5 10 15Lys Asn Leu Asp Leu Ser Phe Asn Pro Leu Arg His Leu Gly Ser Tyr 20 25 30Ser Phe Phe Ser Phe Pro Glu Leu Gln Val Leu Asp Leu Ser Arg Cys 35 40 45Glu Ile Gln Thr Ile Glu Asp Gly Ala Tyr Gln Ser Leu Ser His Leu 50 55 60Ser Thr Leu Ile Leu Thr Gly Asn Pro Ile Gln Ser Leu Ala Leu Gly65 70 75 80Ala Phe Ser Gly Leu Ser Ser Leu Gln Lys Leu Val Ala Val Glu Thr 85 90 95Asn Leu Ala Ser Leu Glu Asn Phe Pro Ile Gly His Leu Lys Thr Leu 100 105 110Lys Glu Leu Asn Val Ala His Asn Leu Ile Gln Ser Phe Lys Leu Pro 115 120 125Glu Tyr Phe Ser Asn Leu Thr Asn Leu Glu His Leu Asp Leu Ser Ser 130 135 140Asn Lys Ile Gln Ser Ile Tyr Cys Thr Asp Leu Arg Val Leu His Gln145 150 155 160Met Pro Leu Leu Asn Leu Ser Leu Asp Leu Ser Leu Asn Pro Met Asn 165 170 175Phe Ile Gln Pro Gly Ala Phe Lys Glu Ile Arg Leu His Lys Leu Thr 180 185 190Leu Arg Asn Asn Phe Asp Ser Leu Asn Val Met Lys Thr Cys Ile Gln 195 200 205Gly Leu Ala Gly Leu Glu Val His Arg Leu Val Leu Gly Glu Phe Arg 210 215 220Asn Glu Gly Asn Leu Glu Lys Phe Asp Lys Ser Ala Leu Glu Gly Leu225 230 235 240Cys Asn Leu Thr Ile Glu Glu Phe Arg Leu Ala Tyr Leu Asp Tyr Tyr 245 250 255Leu Asp Asp Ile Ile Asp Leu Phe Asn Cys Leu Thr Asn Val Ser Ser 260 265 270Phe Ser Leu Val Ser Val Thr Ile Glu Arg Val Lys Asp Phe Ser Tyr 275 280 285Asn Phe Gly Trp Gln His Leu Glu Leu Val Asn Cys Lys Phe Gly Gln 290 295 300Phe Pro Thr Leu Lys Leu Lys Ser Leu Lys Arg Leu Thr Phe Thr Ser305 310 315 320Asn Lys Gly Gly Asn Ala Phe Ser Glu Val Asp Leu Pro Ser Leu Glu 325 330 335Phe Leu Asp Leu Ser Arg Asn Gly Leu Ser Phe Lys Gly Cys Cys Ser 340 345 350Gln Ser Asp Phe Gly Thr Thr Ser Leu Lys Tyr Leu Asp Leu Ser Phe 355 360 365Asn Gly Val Ile Thr Met Ser Ser Asn Phe Leu Gly Leu Glu Gln Leu 370 375 380Glu His Leu Asp Phe Gln His Ser Asn Leu Lys Gln Met Ser Glu Phe385 390 395 400Ser Val Phe Leu Ser Leu Arg Asn Leu Ile Tyr Leu Asp Ile Ser His 405 410 415Thr His Thr Arg Val Ala Phe Asn Gly Ile Phe Asn Gly Leu Ser Ser 420 425 430Leu Glu Val Leu Lys Met Ala Gly Asn Ser Phe Gln Glu Asn Phe Leu 435 440 445Pro Asp Ile Phe Thr Glu Leu Arg Asn Leu Thr Phe Leu Asp Leu Ser 450 455 460Gln Cys Gln Leu Glu Gln Leu Ser Pro Thr Ala Phe Asn Ser Leu Ser465 470 475 480Ser Leu Gln Val Leu Asn Met Ser His Asn Asn Phe Phe Ser Leu Asp 485 490 495Thr Phe Pro Tyr Lys Cys Leu Asn Ser Leu Gln Val Leu Asp Tyr Ser 500 505 510Leu Asn His Ile Met Thr Ser Lys Lys Gln Glu Leu Gln His Phe Pro 515 520 525Ser Ser Leu Ala Phe Leu Asn Leu Thr Gln Asn Asp Phe Ala Cys Thr 530 535 540Cys Glu His Gln Ser Phe Leu Gln Trp Ile Lys Asp Gln Arg Gln Leu545 550 555 560Leu Val Glu Val Glu Arg Met Glu Cys Ala Thr Pro Ser Asp Lys Gln 565 570 575Gly Met Pro Val Leu Ser Leu Asn Ile Thr Cys Gln Met Asn Lys Thr 580 585 590Ile Ile Gly Val Ser Val Leu Ser Val Leu Val Val Ser Val Val Ala 595 600 605Val Leu Val Tyr Lys Phe Tyr Phe His Leu Met Leu Leu Ala Gly Cys 610 615 620Ile Lys Tyr Gly Arg Gly Glu Asn Ile Tyr Asp Ala Phe Val Ile Tyr625 630 635 640Ser Ser Gln Asp Glu Asp Trp Val Arg Asn Glu Leu Val Lys Asn Leu 645 650 655Glu Glu Gly Val Pro Pro Phe Gln Leu Cys Leu His Tyr Arg Asp Phe 660 665 670Ile Pro Gly Val Ala Ile Ala Ala Asn Ile Ile His Glu Gly Phe His 675 680 685Lys Ser Arg Lys Val Ile Val Val Val Ser Gln His Phe Ile Gln Ser 690 695 700Arg Trp Cys Ile Phe Glu Tyr Glu Ile Ala Gln Thr Trp Gln Phe Leu705 710 715 720Ser Ser Arg Ala Gly Ile Ile Phe Ile Val Leu Gln Lys Val Glu Lys 725 730 735Thr Leu Leu Arg Gln Gln Val Glu Leu Tyr Arg Leu Leu Ser Arg Asn 740 745 750Thr Tyr Leu Glu Trp Glu Asp Ser Val Leu Gly Arg His Ile Phe Trp 755 760 765Arg Arg Leu Arg Lys Ala Leu Leu Asp Gly Lys Ser Trp Asn Pro Glu 770 775 780Gly Thr Val Gly Thr Gly Cys Asn Trp Gln Glu Ala Thr Ser785 790 7955858PRTHomo sapiens 5Met Gly Asp His Leu Asp Leu Leu Leu Gly Val Val Leu Met Ala Gly1 5 10 15Pro Val Phe Gly Ile Pro Ser Cys Ser Phe Asp Gly Arg Ile Ala Phe 20 25 30Tyr Arg Phe Cys Asn Leu Thr Gln Val Pro Gln Val Leu Asn Thr Thr 35 40 45Glu Arg Leu Leu Leu Ser Phe Asn Tyr Ile Arg Thr Val Thr Ala Ser 50 55 60Ser Phe Pro Phe Leu Glu Gln Leu Gln Leu Leu Glu Leu Gly Ser Gln65 70 75 80Tyr Thr Pro Leu Thr Ile Asp Lys Glu Ala Phe Arg Asn Leu Pro Asn 85 90 95Leu Arg Ile Leu Asp Leu Gly Ser Ser Lys Ile Tyr Phe Leu His Pro 100 105 110Asp Ala Phe Gln Gly Leu Phe His Leu Phe Glu Leu Arg Leu Tyr Phe 115 120 125Cys Gly Leu Ser Asp Ala Val Leu Lys Asp Gly Tyr Phe Arg Asn Leu 130 135 140Lys Ala Leu Thr Arg Leu Asp Leu Ser Lys Asn Gln Ile Arg Ser Leu145 150 155 160Tyr Leu His Pro Ser Phe Gly Lys Leu Asn Ser Leu Lys Ser Ile Asp 165 170 175Phe Ser Ser Asn Gln Ile Phe Leu Val Cys Glu His Glu Leu Glu Pro 180 185 190Leu Gln Gly Lys Thr Leu Ser Phe Phe Ser Leu Ala Ala Asn Ser Leu 195 200 205Tyr Ser Arg Val Ser Val Asp Trp Gly Lys Cys Met Asn Pro Phe Arg 210 215 220Asn Met Val Leu Glu Ile Leu Asp Val Ser Gly Asn Gly Trp Thr Val225 230 235 240Asp Ile Thr Gly Asn Phe Ser Asn Ala Ile Ser Lys Ser Gln Ala Phe 245 250 255Ser Leu Ile Leu Ala His His Ile Met Gly Ala Gly Phe Gly Phe His 260 265 270Asn Ile Lys Asp Pro Asp Gln Asn Thr Phe Ala Gly Leu Ala Arg Ser 275 280 285Ser Val Arg His Leu Asp Leu Ser His Gly Phe Val Phe Ser Leu Asn 290 295 300Ser Arg Val Phe Glu Thr Leu Lys Asp Leu Lys Val Leu Asn Leu Ala305 310 315 320Tyr Asn Lys Ile Asn Lys Ile Ala Asp Glu Ala Phe Tyr Gly Leu Asp 325 330 335Asn Leu Gln Val Leu Asn Leu Ser Tyr Asn Leu Leu Gly Glu Leu Tyr 340 345 350Ser Ser Asn Phe Tyr Gly Leu Pro Lys Val Ala Tyr Ile Asp Leu Gln 355 360 365Lys Asn His Ile Ala Ile Ile Gln Asp Gln Thr Phe Lys Phe Leu Glu 370 375 380Lys Leu Gln Thr Leu Asp Leu Arg Asp Asn Ala Leu Thr Thr Ile His385 390 395 400Phe Ile Pro Ser Ile Pro Asp Ile Phe Leu Ser Gly Asn Lys Leu Val 405 410 415Thr Leu Pro Lys Ile Asn Leu Thr Ala Asn Leu Ile His Leu Ser Glu 420 425 430Asn Arg Leu Glu Asn Leu Asp Ile Leu Tyr Phe Leu Leu Arg Val Pro 435 440 445His Leu Gln Ile Leu Ile Leu Asn Gln Asn Arg Phe Ser Ser Cys Ser 450 455 460Gly Asp Gln Thr Pro Ser Glu Asn Pro Ser Leu Glu Gln Leu Phe Leu465 470 475 480Gly Glu Asn Met Leu Gln Leu Ala Trp Glu Thr Glu Leu Cys Trp Asp 485 490 495Val Phe Glu Gly Leu Ser His Leu Gln Val Leu Tyr Leu Asn His Asn 500 505 510Tyr Leu Asn Ser Leu Pro Pro Gly Val Phe Ser His Leu Thr Ala Leu 515 520 525Arg Gly Leu Ser Leu Asn Ser Asn Arg Leu Thr Val Leu Ser His Asn 530 535 540Asp Leu Pro Ala Asn Leu Glu Ile Leu Asp Ile Ser Arg Asn Gln Leu545 550 555 560Leu Ala Pro Asn Pro Asp Val Phe Val Ser Leu Ser Val Leu Asp Ile 565 570 575Thr His Asn Lys Phe Ile Cys Glu Cys Glu Leu Ser Thr Phe Ile Asn 580 585 590Trp Leu Asn His Thr Asn Val Thr Ile Ala Gly Pro Pro Ala Asp Ile 595 600 605Tyr Cys Val Tyr Pro Asp Ser Phe Ser Gly Val Ser Leu Phe Ser Leu 610 615 620Ser Thr Glu Gly Cys Asp Glu Glu Glu Val Leu Lys Ser Leu Lys Phe625 630 635 640Ser Leu Phe Ile Val Cys Thr Val Thr Leu Thr Leu Phe Leu Met Thr 645 650 655Ile Leu Thr Val Thr Lys Phe Arg Gly Phe Cys Phe Ile Cys Tyr Lys 660 665 670Thr Ala Gln Arg Leu Val Phe Lys Asp His Pro Gln Gly Thr Glu Pro 675 680 685Asp Met Tyr Lys Tyr Asp Ala Tyr Leu Cys Phe Ser Ser Lys Asp Phe 690 695 700Thr Trp Val Gln Asn Ala Leu Leu Lys His Leu Asp Thr Gln Tyr Ser705 710 715 720Asp Gln Asn Arg Phe Asn Leu Cys Phe Glu Glu Arg Asp Phe Val Pro 725 730 735Gly Glu Asn Arg Ile Ala Asn Ile Gln Asp Ala Ile Trp Asn Ser Arg 740 745 750Lys Ile Val Cys Leu Val Ser Arg His Phe Leu Arg Asp Gly Trp Cys 755 760 765Leu Glu Ala Phe Ser Tyr Ala Gln Gly Arg Cys Leu Ser Asp Leu Asn 770 775 780Ser Ala Leu Ile Met Val Val Val Gly Ser Leu Ser Gln Tyr Gln Leu785 790 795 800Met Lys His Gln Ser Ile Arg Gly Phe Val Gln Lys Gln Gln Tyr Leu 805 810 815Arg Trp Pro Glu Asp Leu Gln Asp Val Gly Trp Phe Leu His Lys Leu 820 825 830Ser Gln Gln Ile Leu Lys Lys Glu Lys Glu Lys Lys Lys Asp Asn Asn 835 840 845Ile Pro Leu Gln Thr Val Ala Thr Ile Ser 850 8556796PRTHomo sapiens 6Met Thr Lys Asp Lys Glu Pro Ile Val Lys Ser Phe His Phe Val Cys1 5 10 15Leu Met Ile Ile Ile Val Gly Thr Arg Ile Gln Phe Ser Asp Gly Asn 20 25 30Glu Phe Ala Val Asp Lys Ser Lys Arg Gly Leu Ile His Val Pro Lys 35 40 45Asp Leu Pro Leu Lys Thr Lys Val Leu Asp Met Ser Gln Asn Tyr Ile 50 55 60Ala Glu Leu Gln Val Ser Asp Met Ser Phe Leu Ser Glu Leu Thr Val65 70 75 80Leu Arg Leu Ser His Asn Arg Ile Gln Leu Leu Asp Leu Ser Val Phe 85 90 95Lys Phe Asn Gln Asp Leu Glu Tyr Leu Asp Leu Ser His Asn Gln Leu 100 105 110Gln Lys Ile Ser Cys His Pro Ile Val Ser Phe Arg His Leu Asp Leu 115 120 125Ser Phe Asn Asp Phe Lys Ala Leu Pro Ile Cys Lys Glu Phe Gly Asn 130 135 140Leu Ser Gln Leu Asn Phe Leu Gly Leu Ser Ala Met Lys Leu Gln Lys145 150 155 160Leu Asp Leu Leu Pro Ile Ala His Leu His Leu Ser Tyr Ile Leu Leu 165 170 175Asp Leu Arg Asn Tyr Tyr Ile Lys Glu Asn Glu Thr Glu Ser Leu Gln 180 185 190Ile Leu Asn Ala Lys Thr Leu His Leu Val Phe His Pro Thr Ser Leu 195 200 205Phe Ala Ile Gln Val Asn Ile Ser Val Asn Thr Leu Gly Cys Leu Gln 210 215 220Leu Thr Asn Ile Lys Leu Asn Asp Asp Asn Cys Gln Val Phe Ile Lys225 230 235 240Phe Leu Ser Glu Leu Thr Arg Gly Pro Thr Leu Leu Asn Phe Thr Leu 245 250 255Asn His Ile Glu Thr Thr Trp Lys Cys Leu Val Arg Val Phe Gln Phe 260 265 270Leu Trp Pro Lys Pro Val Glu Tyr Leu Asn Ile Tyr Asn Leu Thr Ile 275 280 285Ile Glu Ser Ile Arg Glu Glu Asp Phe Thr Tyr Ser Lys Thr Thr Leu 290 295 300Lys Ala Leu Thr Ile Glu His Ile Thr Asn Gln Val Phe Leu Phe Ser305 310 315 320Gln Thr Ala Leu Tyr Thr Val Phe Ser Glu Met Asn Ile Met Met Leu 325 330 335Thr Ile Ser Asp Thr Pro Phe Ile His Met Leu Cys Pro His Ala Pro 340 345 350Ser Thr Phe Lys Phe Leu Asn Phe Thr Gln Asn Val Phe Thr Asp Ser 355 360 365Ile Phe Glu Lys Cys Ser Thr Leu Val Lys Leu Glu Thr Leu Ile Leu 370 375 380Gln Lys Asn Gly Leu Lys Asp Leu Phe Lys Val Gly Leu Met Thr Lys385 390 395 400Asp Met Pro Ser Leu Glu Ile Leu Asp Val Ser Trp Asn Ser Leu Glu 405 410 415Ser Gly Arg His Lys Glu Asn Cys Thr Trp Val Glu Ser Ile Val Val 420 425 430Leu Asn Leu Ser Ser Asn Met Leu Thr Asp Ser Val Phe Arg Cys Leu 435 440 445Pro Pro Arg Ile Lys Val Leu Asp Leu His Ser Asn Lys Ile Lys Ser 450 455 460Val Pro Lys Gln Val Val Lys Leu Glu Ala Leu Gln Glu Leu Asn Val465 470 475 480Ala Phe Asn Ser Leu Thr Asp Leu Pro Gly Cys Gly Ser Phe Ser Ser 485 490 495Leu Ser Val Leu Ile Ile Asp His Asn Ser Val Ser His Pro Ser Ala 500 505 510Asp Phe Phe Gln Ser Cys Gln Lys Met Arg Ser Ile Lys Ala Gly Asp 515 520 525Asn Pro Phe Gln Cys Thr Cys Glu Leu Arg Glu Phe Val Lys Asn Ile 530 535 540Asp Gln Val Ser Ser Glu Val Leu Glu Gly Trp Pro Asp Ser Tyr Lys545 550 555 560Cys Asp Tyr Pro Glu Ser Tyr Arg Gly Ser Pro Leu Lys Asp Phe His 565 570 575Met Ser Glu Leu Ser Cys Asn Ile Thr Leu Leu Ile Val Thr Ile Gly 580 585 590Ala Thr Met Leu Val Leu Ala Val Thr Val Thr Ser Leu Cys Ile Tyr 595 600 605Leu Asp Leu Pro Trp Tyr Leu Arg Met Val Cys Gln Trp Thr Gln Thr 610 615 620Arg Arg Arg Ala Arg Asn Ile Pro Leu Glu Glu Leu Gln Arg Asn Leu625 630 635 640Gln Phe His Ala Phe Ile Ser Tyr Ser Glu His Asp Ser Ala Trp Val 645 650 655Lys Ser Glu Leu Val Pro Tyr Leu Glu Lys Glu Asp Ile Gln Ile Cys 660 665 670Leu His Glu Arg Asn Phe Val Pro Gly Lys Ser Ile Val Glu Asn Ile 675 680 685Ile Asn Cys Ile Glu Lys Ser Tyr Lys Ser Ile Phe Val Leu Ser Pro 690 695 700Asn Phe Val Gln Ser Glu Trp Cys His Tyr Glu Leu Tyr Phe Ala His705 710 715 720His Asn Leu Phe His Glu Gly Ser Asn Asn Leu Ile Leu Ile Leu Leu 725 730 735Glu Pro Ile Pro Gln Asn Ser Ile Pro Asn Lys Tyr His Lys Leu Lys 740 745 750Ala Leu Met Thr Gln Arg Thr Tyr Leu Gln Trp Pro Lys Glu Lys Ser 755 760 765Lys Arg Gly Leu Phe Trp Ala Asn Ile Arg Ala Ala Phe Asn Met Lys 770 775 780Leu Thr Leu Val Thr Glu Asn Asn Asp Val Lys Ser785 790 79571049PRTHomo sapiens 7Met Val Phe Pro Met Trp Thr Leu Lys Arg Gln Ile Leu Ile Leu Phe1
5 10 15Asn Ile Ile Leu Ile Ser Lys Leu Leu Gly Ala Arg Trp Phe Pro Lys 20 25 30Thr Leu Pro Cys Asp Val Thr Leu Asp Val Pro Lys Asn His Val Ile 35 40 45Val Asp Cys Thr Asp Lys His Leu Thr Glu Ile Pro Gly Gly Ile Pro 50 55 60Thr Asn Thr Thr Asn Leu Thr Leu Thr Ile Asn His Ile Pro Asp Ile65 70 75 80Ser Pro Ala Ser Phe His Arg Leu Asp His Leu Val Glu Ile Asp Phe 85 90 95Arg Cys Asn Cys Val Pro Ile Pro Leu Gly Ser Lys Asn Asn Met Cys 100 105 110Ile Lys Arg Leu Gln Ile Lys Pro Arg Ser Phe Ser Gly Leu Thr Tyr 115 120 125Leu Lys Ser Leu Tyr Leu Asp Gly Asn Gln Leu Leu Glu Ile Pro Gln 130 135 140Gly Leu Pro Pro Ser Leu Gln Leu Leu Ser Leu Glu Ala Asn Asn Ile145 150 155 160Phe Ser Ile Arg Lys Glu Asn Leu Thr Glu Leu Ala Asn Ile Glu Ile 165 170 175Leu Tyr Leu Gly Gln Asn Cys Tyr Tyr Arg Asn Pro Cys Tyr Val Ser 180 185 190Tyr Ser Ile Glu Lys Asp Ala Phe Leu Asn Leu Thr Lys Leu Lys Val 195 200 205Leu Ser Leu Lys Asp Asn Asn Val Thr Ala Val Pro Thr Val Leu Pro 210 215 220Ser Thr Leu Thr Glu Leu Tyr Leu Tyr Asn Asn Met Ile Ala Lys Ile225 230 235 240Gln Glu Asp Asp Phe Asn Asn Leu Asn Gln Leu Gln Ile Leu Asp Leu 245 250 255Ser Gly Asn Cys Pro Arg Cys Tyr Asn Ala Pro Phe Pro Cys Ala Pro 260 265 270Cys Lys Asn Asn Ser Pro Leu Gln Ile Pro Val Asn Ala Phe Asp Ala 275 280 285Leu Thr Glu Leu Lys Val Leu Arg Leu His Ser Asn Ser Leu Gln His 290 295 300Val Pro Pro Arg Trp Phe Lys Asn Ile Asn Lys Leu Gln Glu Leu Asp305 310 315 320Leu Ser Gln Asn Phe Leu Ala Lys Glu Ile Gly Asp Ala Lys Phe Leu 325 330 335His Phe Leu Pro Ser Leu Ile Gln Leu Asp Leu Ser Phe Asn Phe Glu 340 345 350Leu Gln Val Tyr Arg Ala Ser Met Asn Leu Ser Gln Ala Phe Ser Ser 355 360 365Leu Lys Ser Leu Lys Ile Leu Arg Ile Arg Gly Tyr Val Phe Lys Glu 370 375 380Leu Lys Ser Phe Asn Leu Ser Pro Leu His Asn Leu Gln Asn Leu Glu385 390 395 400Val Leu Asp Leu Gly Thr Asn Phe Ile Lys Ile Ala Asn Leu Ser Met 405 410 415Phe Lys Gln Phe Lys Arg Leu Lys Val Ile Asp Leu Ser Val Asn Lys 420 425 430Ile Ser Pro Ser Gly Asp Ser Ser Glu Val Gly Phe Cys Ser Asn Ala 435 440 445Arg Thr Ser Val Glu Ser Tyr Glu Pro Gln Val Leu Glu Gln Leu His 450 455 460Tyr Phe Arg Tyr Asp Lys Tyr Ala Arg Ser Cys Arg Phe Lys Asn Lys465 470 475 480Glu Ala Ser Phe Met Ser Val Asn Glu Ser Cys Tyr Lys Tyr Gly Gln 485 490 495Thr Leu Asp Leu Ser Lys Asn Ser Ile Phe Phe Val Lys Ser Ser Asp 500 505 510Phe Gln His Leu Ser Phe Leu Lys Cys Leu Asn Leu Ser Gly Asn Leu 515 520 525Ile Ser Gln Thr Leu Asn Gly Ser Glu Phe Gln Pro Leu Ala Glu Leu 530 535 540Arg Tyr Leu Asp Phe Ser Asn Asn Arg Leu Asp Leu Leu His Ser Thr545 550 555 560Ala Phe Glu Glu Leu His Lys Leu Glu Val Leu Asp Ile Ser Ser Asn 565 570 575Ser His Tyr Phe Gln Ser Glu Gly Ile Thr His Met Leu Asn Phe Thr 580 585 590Lys Asn Leu Lys Val Leu Gln Lys Leu Met Met Asn Asp Asn Asp Ile 595 600 605Ser Ser Ser Thr Ser Arg Thr Met Glu Ser Glu Ser Leu Arg Thr Leu 610 615 620Glu Phe Arg Gly Asn His Leu Asp Val Leu Trp Arg Glu Gly Asp Asn625 630 635 640Arg Tyr Leu Gln Leu Phe Lys Asn Leu Leu Lys Leu Glu Glu Leu Asp 645 650 655Ile Ser Lys Asn Ser Leu Ser Phe Leu Pro Ser Gly Val Phe Asp Gly 660 665 670Met Pro Pro Asn Leu Lys Asn Leu Ser Leu Ala Lys Asn Gly Leu Lys 675 680 685Ser Phe Ser Trp Lys Lys Leu Gln Cys Leu Lys Asn Leu Glu Thr Leu 690 695 700Asp Leu Ser His Asn Gln Leu Thr Thr Val Pro Glu Arg Leu Ser Asn705 710 715 720Cys Ser Arg Ser Leu Lys Asn Leu Ile Leu Lys Asn Asn Gln Ile Arg 725 730 735Ser Leu Thr Lys Tyr Phe Leu Gln Asp Ala Phe Gln Leu Arg Tyr Leu 740 745 750Asp Leu Ser Ser Asn Lys Ile Gln Met Ile Gln Lys Thr Ser Phe Pro 755 760 765Glu Asn Val Leu Asn Asn Leu Lys Met Leu Leu Leu His His Asn Arg 770 775 780Phe Leu Cys Thr Cys Asp Ala Val Trp Phe Val Trp Trp Val Asn His785 790 795 800Thr Glu Val Thr Ile Pro Tyr Leu Ala Thr Asp Val Thr Cys Val Gly 805 810 815Pro Gly Ala His Lys Gly Gln Ser Val Ile Ser Leu Asp Leu Tyr Thr 820 825 830Cys Glu Leu Asp Leu Thr Asn Leu Ile Leu Phe Ser Leu Ser Ile Ser 835 840 845Val Ser Leu Phe Leu Met Val Met Met Thr Ala Ser His Leu Tyr Phe 850 855 860Trp Asp Val Trp Tyr Ile Tyr His Phe Cys Lys Ala Lys Ile Lys Gly865 870 875 880Tyr Gln Arg Leu Ile Ser Pro Asp Cys Cys Tyr Asp Ala Phe Ile Val 885 890 895Tyr Asp Thr Lys Asp Pro Ala Val Thr Glu Trp Val Leu Ala Glu Leu 900 905 910Val Ala Lys Leu Glu Asp Pro Arg Glu Lys His Phe Asn Leu Cys Leu 915 920 925Glu Glu Arg Asp Trp Leu Pro Gly Gln Pro Val Leu Glu Asn Leu Ser 930 935 940Gln Ser Ile Gln Leu Ser Lys Lys Thr Val Phe Val Met Thr Asp Lys945 950 955 960Tyr Ala Lys Thr Glu Asn Phe Lys Ile Ala Phe Tyr Leu Ser His Gln 965 970 975Arg Leu Met Asp Glu Lys Val Asp Val Ile Ile Leu Ile Phe Leu Glu 980 985 990Lys Pro Phe Gln Lys Ser Lys Phe Leu Gln Leu Arg Lys Arg Leu Cys 995 1000 1005Gly Ser Ser Val Leu Glu Trp Pro Thr Asn Pro Gln Ala His Pro 1010 1015 1020Tyr Phe Trp Gln Cys Leu Lys Asn Ala Leu Ala Thr Asp Asn His 1025 1030 1035Val Ala Tyr Ser Gln Val Phe Lys Glu Thr Val 1040 104581041PRTHomo sapiens 8Met Glu Asn Met Phe Leu Gln Ser Ser Met Leu Thr Cys Ile Phe Leu1 5 10 15Leu Ile Ser Gly Ser Cys Glu Leu Cys Ala Glu Glu Asn Phe Ser Arg 20 25 30Ser Tyr Pro Cys Asp Glu Lys Lys Gln Asn Asp Ser Val Ile Ala Glu 35 40 45Cys Ser Asn Arg Arg Leu Gln Glu Val Pro Gln Thr Val Gly Lys Tyr 50 55 60Val Thr Glu Leu Asp Leu Ser Asp Asn Phe Ile Thr His Ile Thr Asn65 70 75 80Glu Ser Phe Gln Gly Leu Gln Asn Leu Thr Lys Ile Asn Leu Asn His 85 90 95Asn Pro Asn Val Gln His Gln Asn Gly Asn Pro Gly Ile Gln Ser Asn 100 105 110Gly Leu Asn Ile Thr Asp Gly Ala Phe Leu Asn Leu Lys Asn Leu Arg 115 120 125Glu Leu Leu Leu Glu Asp Asn Gln Leu Pro Gln Ile Pro Ser Gly Leu 130 135 140Pro Glu Ser Leu Thr Glu Leu Ser Leu Ile Gln Asn Asn Ile Tyr Asn145 150 155 160Ile Thr Lys Glu Gly Ile Ser Arg Leu Ile Asn Leu Lys Asn Leu Tyr 165 170 175Leu Ala Trp Asn Cys Tyr Phe Asn Lys Val Cys Glu Lys Thr Asn Ile 180 185 190Glu Asp Gly Val Phe Glu Thr Leu Thr Asn Leu Glu Leu Leu Ser Leu 195 200 205Ser Phe Asn Ser Leu Ser His Val Pro Pro Lys Leu Pro Ser Ser Leu 210 215 220Arg Lys Leu Phe Leu Ser Asn Thr Gln Ile Lys Tyr Ile Ser Glu Glu225 230 235 240Asp Phe Lys Gly Leu Ile Asn Leu Thr Leu Leu Asp Leu Ser Gly Asn 245 250 255Cys Pro Arg Cys Phe Asn Ala Pro Phe Pro Cys Val Pro Cys Asp Gly 260 265 270Gly Ala Ser Ile Asn Ile Asp Arg Phe Ala Phe Gln Asn Leu Thr Gln 275 280 285Leu Arg Tyr Leu Asn Leu Ser Ser Thr Ser Leu Arg Lys Ile Asn Ala 290 295 300Ala Trp Phe Lys Asn Met Pro His Leu Lys Val Leu Asp Leu Glu Phe305 310 315 320Asn Tyr Leu Val Gly Glu Ile Ala Ser Gly Ala Phe Leu Thr Met Leu 325 330 335Pro Arg Leu Glu Ile Leu Asp Leu Ser Phe Asn Tyr Ile Lys Gly Ser 340 345 350Tyr Pro Gln His Ile Asn Ile Ser Arg Asn Phe Ser Lys Leu Leu Ser 355 360 365Leu Arg Ala Leu His Leu Arg Gly Tyr Val Phe Gln Glu Leu Arg Glu 370 375 380Asp Asp Phe Gln Pro Leu Met Gln Leu Pro Asn Leu Ser Thr Ile Asn385 390 395 400Leu Gly Ile Asn Phe Ile Lys Gln Ile Asp Phe Lys Leu Phe Gln Asn 405 410 415Phe Ser Asn Leu Glu Ile Ile Tyr Leu Ser Glu Asn Arg Ile Ser Pro 420 425 430Leu Val Lys Asp Thr Arg Gln Ser Tyr Ala Asn Ser Ser Ser Phe Gln 435 440 445Arg His Ile Arg Lys Arg Arg Ser Thr Asp Phe Glu Phe Asp Pro His 450 455 460Ser Asn Phe Tyr His Phe Thr Arg Pro Leu Ile Lys Pro Gln Cys Ala465 470 475 480Ala Tyr Gly Lys Ala Leu Asp Leu Ser Leu Asn Ser Ile Phe Phe Ile 485 490 495Gly Pro Asn Gln Phe Glu Asn Leu Pro Asp Ile Ala Cys Leu Asn Leu 500 505 510Ser Ala Asn Ser Asn Ala Gln Val Leu Ser Gly Thr Glu Phe Ser Ala 515 520 525Ile Pro His Val Lys Tyr Leu Asp Leu Thr Asn Asn Arg Leu Asp Phe 530 535 540Asp Asn Ala Ser Ala Leu Thr Glu Leu Ser Asp Leu Glu Val Leu Asp545 550 555 560Leu Ser Tyr Asn Ser His Tyr Phe Arg Ile Ala Gly Val Thr His His 565 570 575Leu Glu Phe Ile Gln Asn Phe Thr Asn Leu Lys Val Leu Asn Leu Ser 580 585 590His Asn Asn Ile Tyr Thr Leu Thr Asp Lys Tyr Asn Leu Glu Ser Lys 595 600 605Ser Leu Val Glu Leu Val Phe Ser Gly Asn Arg Leu Asp Ile Leu Trp 610 615 620Asn Asp Asp Asp Asn Arg Tyr Ile Ser Ile Phe Lys Gly Leu Lys Asn625 630 635 640Leu Thr Arg Leu Asp Leu Ser Leu Asn Arg Leu Lys His Ile Pro Asn 645 650 655Glu Ala Phe Leu Asn Leu Pro Ala Ser Leu Thr Glu Leu His Ile Asn 660 665 670Asp Asn Met Leu Lys Phe Phe Asn Trp Thr Leu Leu Gln Gln Phe Pro 675 680 685Arg Leu Glu Leu Leu Asp Leu Arg Gly Asn Lys Leu Leu Phe Leu Thr 690 695 700Asp Ser Leu Ser Asp Phe Thr Ser Ser Leu Arg Thr Leu Leu Leu Ser705 710 715 720His Asn Arg Ile Ser His Leu Pro Ser Gly Phe Leu Ser Glu Val Ser 725 730 735Ser Leu Lys His Leu Asp Leu Ser Ser Asn Leu Leu Lys Thr Ile Asn 740 745 750Lys Ser Ala Leu Glu Thr Lys Thr Thr Thr Lys Leu Ser Met Leu Glu 755 760 765Leu His Gly Asn Pro Phe Glu Cys Thr Cys Asp Ile Gly Asp Phe Arg 770 775 780Arg Trp Met Asp Glu His Leu Asn Val Lys Ile Pro Arg Leu Val Asp785 790 795 800Val Ile Cys Ala Ser Pro Gly Asp Gln Arg Gly Lys Ser Ile Val Ser 805 810 815Leu Glu Leu Thr Thr Cys Val Ser Asp Val Thr Ala Val Ile Leu Phe 820 825 830Phe Phe Thr Phe Phe Ile Thr Thr Met Val Met Leu Ala Ala Leu Ala 835 840 845His His Leu Phe Tyr Trp Asp Val Trp Phe Ile Tyr Asn Val Cys Leu 850 855 860Ala Lys Val Lys Gly Tyr Arg Ser Leu Ser Thr Ser Gln Thr Phe Tyr865 870 875 880Asp Ala Tyr Ile Ser Tyr Asp Thr Lys Asp Ala Ser Val Thr Asp Trp 885 890 895Val Ile Asn Glu Leu Arg Tyr His Leu Glu Glu Ser Arg Asp Lys Asn 900 905 910Val Leu Leu Cys Leu Glu Glu Arg Asp Trp Asp Pro Gly Leu Ala Ile 915 920 925Ile Asp Asn Leu Met Gln Ser Ile Asn Gln Ser Lys Lys Thr Val Phe 930 935 940Val Leu Thr Lys Lys Tyr Ala Lys Ser Trp Asn Phe Lys Thr Ala Phe945 950 955 960Tyr Leu Ala Leu Gln Arg Leu Met Asp Glu Asn Met Asp Val Ile Ile 965 970 975Phe Ile Leu Leu Glu Pro Val Leu Gln His Ser Gln Tyr Leu Arg Leu 980 985 990Arg Gln Arg Ile Cys Lys Ser Ser Ile Leu Gln Trp Pro Asp Asn Pro 995 1000 1005Lys Ala Glu Gly Leu Phe Trp Gln Thr Leu Arg Asn Val Val Leu 1010 1015 1020Thr Glu Asn Asp Ser Arg Tyr Asn Asn Met Tyr Val Asp Ser Ile 1025 1030 1035Lys Gln Tyr 104091032PRTHomo sapiens 9Met Gly Phe Cys Arg Ser Ala Leu His Pro Leu Ser Leu Leu Val Gln1 5 10 15Ala Ile Met Leu Ala Met Thr Leu Ala Leu Gly Thr Leu Pro Ala Phe 20 25 30Leu Pro Cys Glu Leu Gln Pro His Gly Leu Val Asn Cys Asn Trp Leu 35 40 45Phe Leu Lys Ser Val Pro His Phe Ser Met Ala Ala Pro Arg Gly Asn 50 55 60Val Thr Ser Leu Ser Leu Ser Ser Asn Arg Ile His His Leu His Asp65 70 75 80Ser Asp Phe Ala His Leu Pro Ser Leu Arg His Leu Asn Leu Lys Trp 85 90 95Asn Cys Pro Pro Val Gly Leu Ser Pro Met His Phe Pro Cys His Met 100 105 110Thr Ile Glu Pro Ser Thr Phe Leu Ala Val Pro Thr Leu Glu Glu Leu 115 120 125Asn Leu Ser Tyr Asn Asn Ile Met Thr Val Pro Ala Leu Pro Lys Ser 130 135 140Leu Ile Ser Leu Ser Leu Ser His Thr Asn Ile Leu Met Leu Asp Ser145 150 155 160Ala Ser Leu Ala Gly Leu His Ala Leu Arg Phe Leu Phe Met Asp Gly 165 170 175Asn Cys Tyr Tyr Lys Asn Pro Cys Arg Gln Ala Leu Glu Val Ala Pro 180 185 190Gly Ala Leu Leu Gly Leu Gly Asn Leu Thr His Leu Ser Leu Lys Tyr 195 200 205Asn Asn Leu Thr Val Val Pro Arg Asn Leu Pro Ser Ser Leu Glu Tyr 210 215 220Leu Leu Leu Ser Tyr Asn Arg Ile Val Lys Leu Ala Pro Glu Asp Leu225 230 235 240Ala Asn Leu Thr Ala Leu Arg Val Leu Asp Val Gly Gly Asn Cys Arg 245 250 255Arg Cys Asp His Ala Pro Asn Pro Cys Met Glu Cys Pro Arg His Phe 260 265 270Pro Gln Leu His Pro Asp Thr Phe Ser His Leu Ser Arg Leu Glu Gly 275 280 285Leu Val Leu Lys Asp Ser Ser Leu Ser Trp Leu Asn Ala Ser Trp Phe 290 295 300Arg Gly Leu Gly Asn Leu Arg Val Leu Asp Leu Ser Glu Asn Phe Leu305 310 315 320Tyr Lys Cys Ile Thr Lys Thr Lys Ala Phe Gln Gly Leu Thr Gln Leu 325 330 335Arg Lys Leu Asn Leu Ser Phe Asn Tyr Gln Lys Arg Val Ser Phe Ala 340 345 350His Leu Ser Leu Ala Pro Ser Phe Gly Ser Leu Val Ala Leu Lys Glu 355 360 365Leu Asp Met His Gly Ile Phe Phe Arg Ser Leu Asp Glu Thr Thr Leu 370 375 380Arg Pro Leu Ala Arg Leu Pro Met Leu Gln
Thr Leu Arg Leu Gln Met385 390 395 400Asn Phe Ile Asn Gln Ala Gln Leu Gly Ile Phe Arg Ala Phe Pro Gly 405 410 415Leu Arg Tyr Val Asp Leu Ser Asp Asn Arg Ile Ser Gly Ala Ser Glu 420 425 430Leu Thr Ala Thr Met Gly Glu Ala Asp Gly Gly Glu Lys Val Trp Leu 435 440 445Gln Pro Gly Asp Leu Ala Pro Ala Pro Val Asp Thr Pro Ser Ser Glu 450 455 460Asp Phe Arg Pro Asn Cys Ser Thr Leu Asn Phe Thr Leu Asp Leu Ser465 470 475 480Arg Asn Asn Leu Val Thr Val Gln Pro Glu Met Phe Ala Gln Leu Ser 485 490 495His Leu Gln Cys Leu Arg Leu Ser His Asn Cys Ile Ser Gln Ala Val 500 505 510Asn Gly Ser Gln Phe Leu Pro Leu Thr Gly Leu Gln Val Leu Asp Leu 515 520 525Ser His Asn Lys Leu Asp Leu Tyr His Glu His Ser Phe Thr Glu Leu 530 535 540Pro Arg Leu Glu Ala Leu Asp Leu Ser Tyr Asn Ser Gln Pro Phe Gly545 550 555 560Met Gln Gly Val Gly His Asn Phe Ser Phe Val Ala His Leu Arg Thr 565 570 575Leu Arg His Leu Ser Leu Ala His Asn Asn Ile His Ser Gln Val Ser 580 585 590Gln Gln Leu Cys Ser Thr Ser Leu Arg Ala Leu Asp Phe Ser Gly Asn 595 600 605Ala Leu Gly His Met Trp Ala Glu Gly Asp Leu Tyr Leu His Phe Phe 610 615 620Gln Gly Leu Ser Gly Leu Ile Trp Leu Asp Leu Ser Gln Asn Arg Leu625 630 635 640His Thr Leu Leu Pro Gln Thr Leu Arg Asn Leu Pro Lys Ser Leu Gln 645 650 655Val Leu Arg Leu Arg Asp Asn Tyr Leu Ala Phe Phe Lys Trp Trp Ser 660 665 670Leu His Phe Leu Pro Lys Leu Glu Val Leu Asp Leu Ala Gly Asn Gln 675 680 685Leu Lys Ala Leu Thr Asn Gly Ser Leu Pro Ala Gly Thr Arg Leu Arg 690 695 700Arg Leu Asp Val Ser Cys Asn Ser Ile Ser Phe Val Ala Pro Gly Phe705 710 715 720Phe Ser Lys Ala Lys Glu Leu Arg Glu Leu Asn Leu Ser Ala Asn Ala 725 730 735Leu Lys Thr Val Asp His Ser Trp Phe Gly Pro Leu Ala Ser Ala Leu 740 745 750Gln Ile Leu Asp Val Ser Ala Asn Pro Leu His Cys Ala Cys Gly Ala 755 760 765Ala Phe Met Asp Phe Leu Leu Glu Val Gln Ala Ala Val Pro Gly Leu 770 775 780Pro Ser Arg Val Lys Cys Gly Ser Pro Gly Gln Leu Gln Gly Leu Ser785 790 795 800Ile Phe Ala Gln Asp Leu Arg Leu Cys Leu Asp Glu Ala Leu Ser Trp 805 810 815Asp Cys Phe Ala Leu Ser Leu Leu Ala Val Ala Leu Gly Leu Gly Val 820 825 830Pro Met Leu His His Leu Cys Gly Trp Asp Leu Trp Tyr Cys Phe His 835 840 845Leu Cys Leu Ala Trp Leu Pro Trp Arg Gly Arg Gln Ser Gly Arg Asp 850 855 860Glu Asp Ala Leu Pro Tyr Asp Ala Phe Val Val Phe Asp Lys Thr Gln865 870 875 880Ser Ala Val Ala Asp Trp Val Tyr Asn Glu Leu Arg Gly Gln Leu Glu 885 890 895Glu Cys Arg Gly Arg Trp Ala Leu Arg Leu Cys Leu Glu Glu Arg Asp 900 905 910Trp Leu Pro Gly Lys Thr Leu Phe Glu Asn Leu Trp Ala Ser Val Tyr 915 920 925Gly Ser Arg Lys Thr Leu Phe Val Leu Ala His Thr Asp Arg Val Ser 930 935 940Gly Leu Leu Arg Ala Ser Phe Leu Leu Ala Gln Gln Arg Leu Leu Glu945 950 955 960Asp Arg Lys Asp Val Val Val Leu Val Ile Leu Ser Pro Asp Gly Arg 965 970 975Arg Ser Arg Tyr Val Arg Leu Arg Gln Arg Leu Cys Arg Gln Ser Val 980 985 990Leu Leu Trp Pro His Gln Pro Ser Gly Gln Arg Ser Phe Trp Ala Gln 995 1000 1005Leu Gly Met Ala Leu Thr Arg Asp Asn His His Phe Tyr Asn Arg 1010 1015 1020Asn Phe Cys Gln Gly Pro Thr Ala Glu 1025 1030
* * * * *
References
D00001
D00002
D00003
D00004
D00005
D00006
D00007
D00008
D00009
D00010
D00011
D00012
D00013
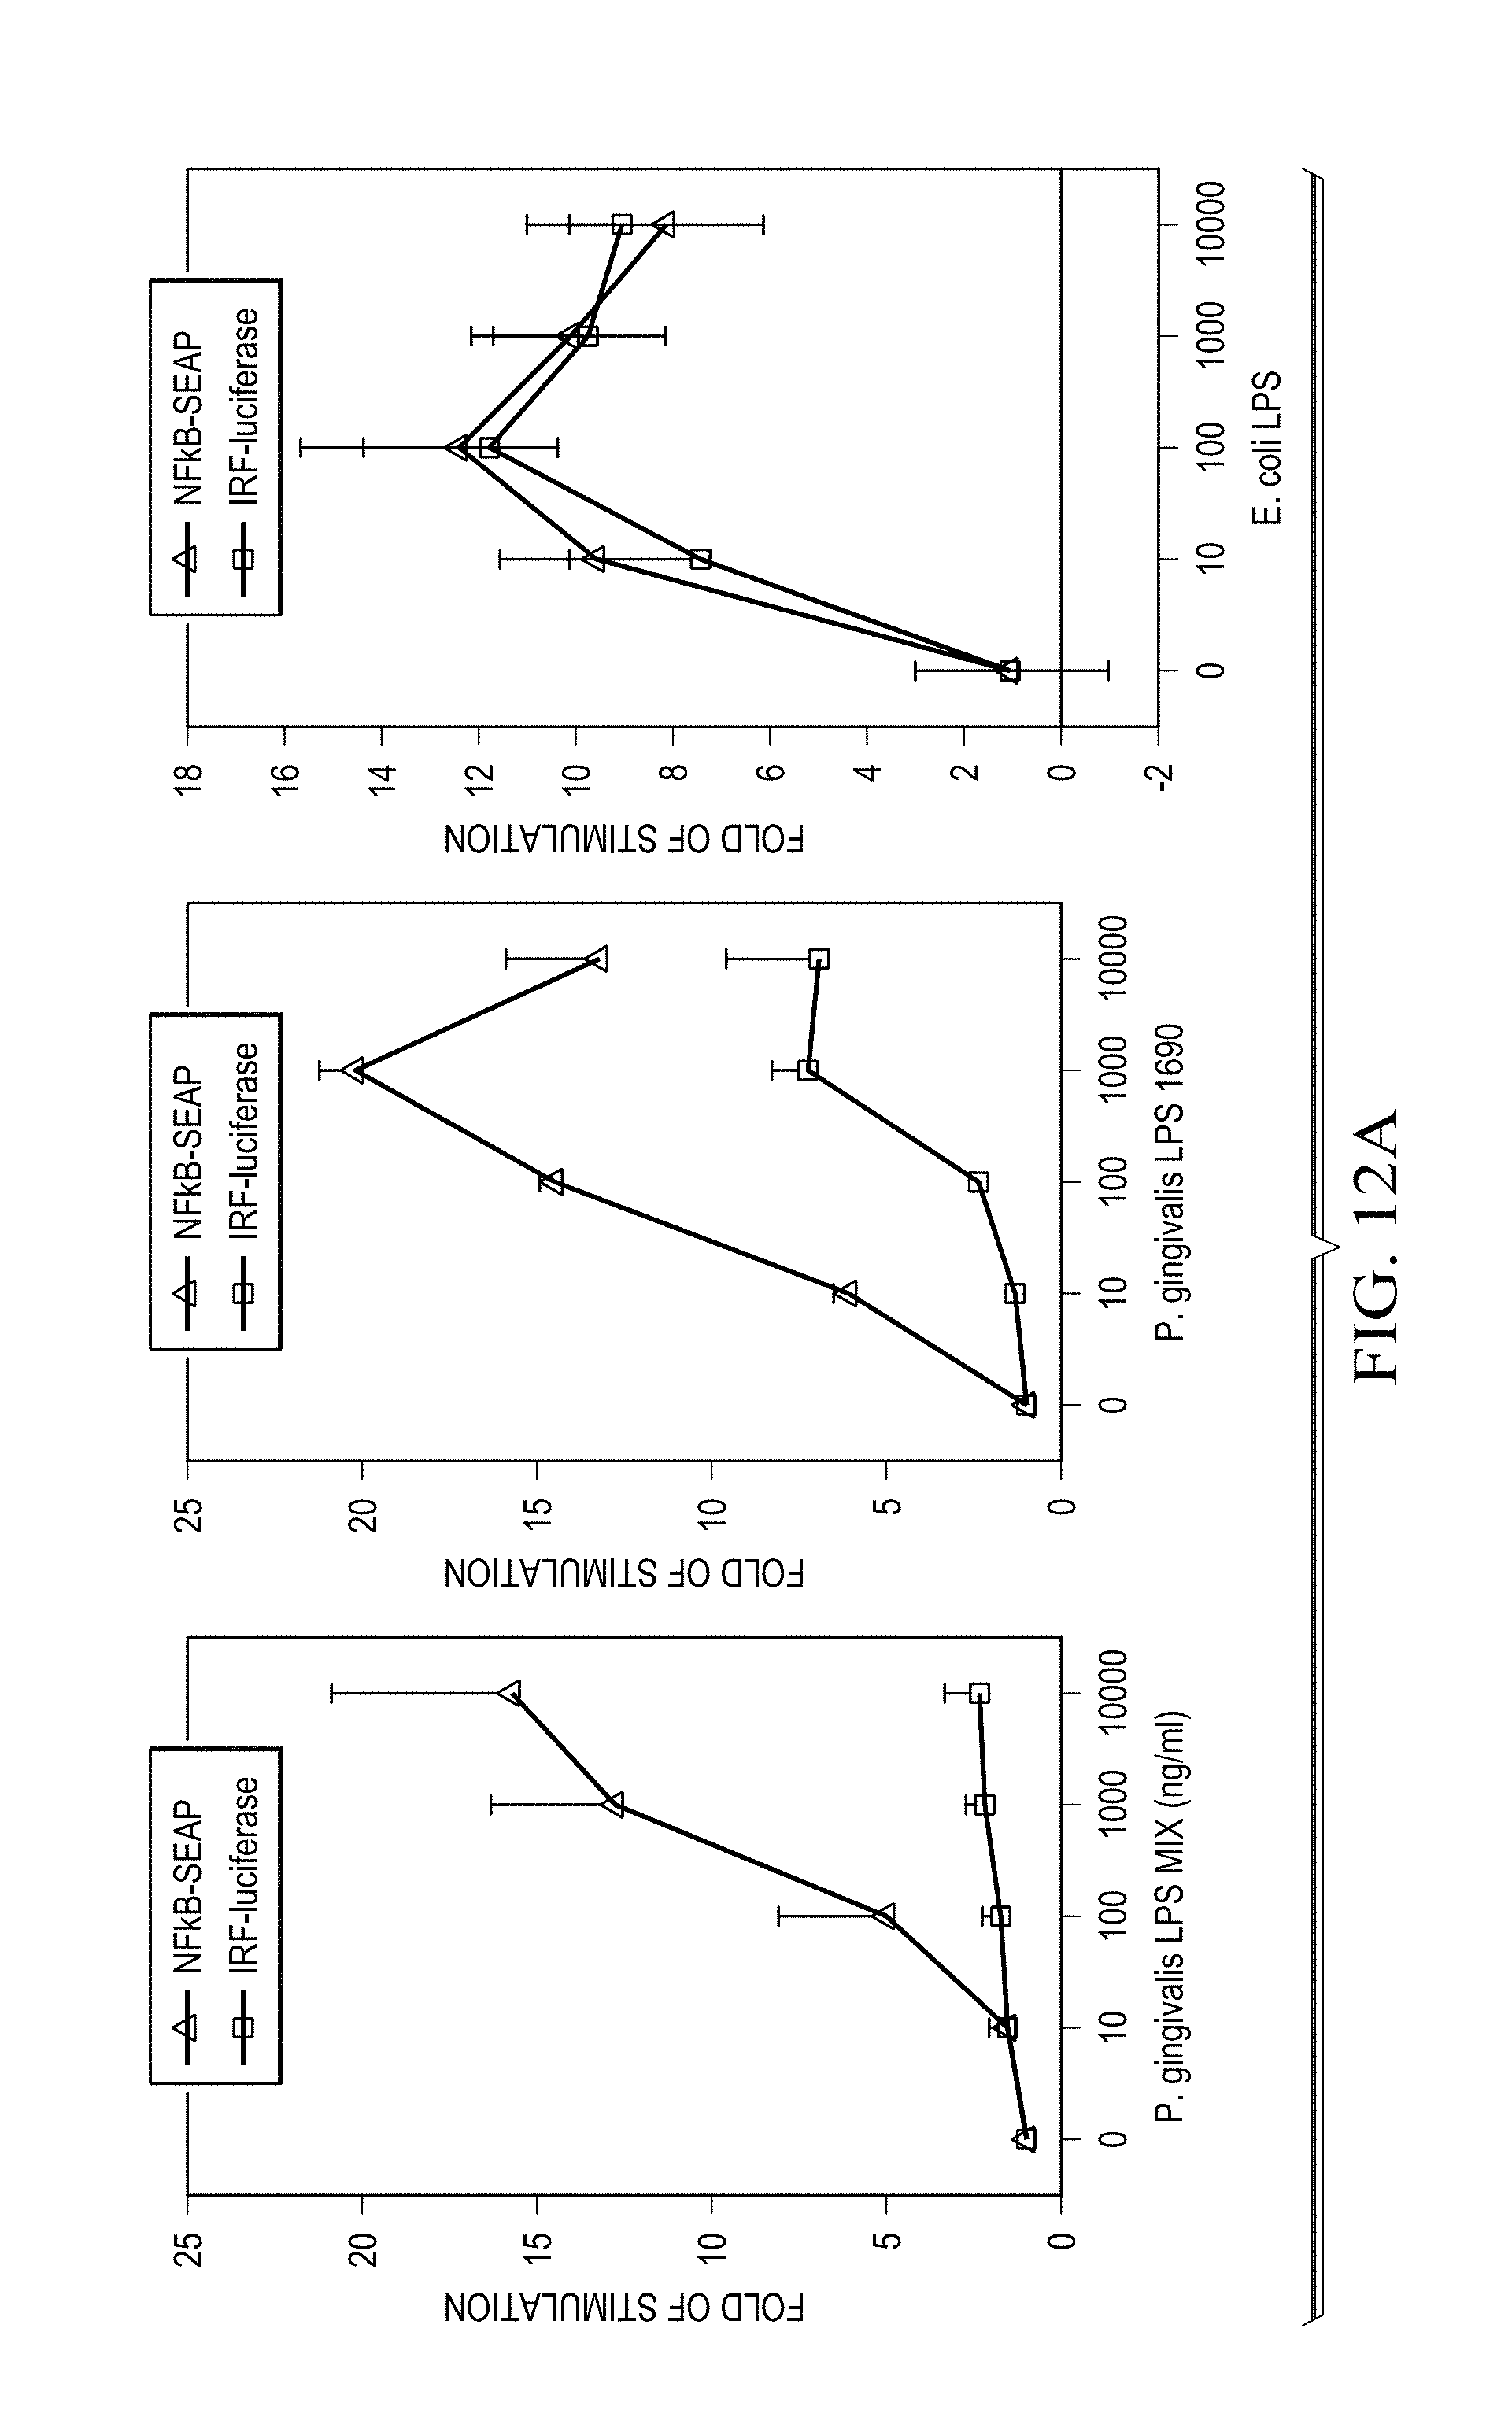
D00014
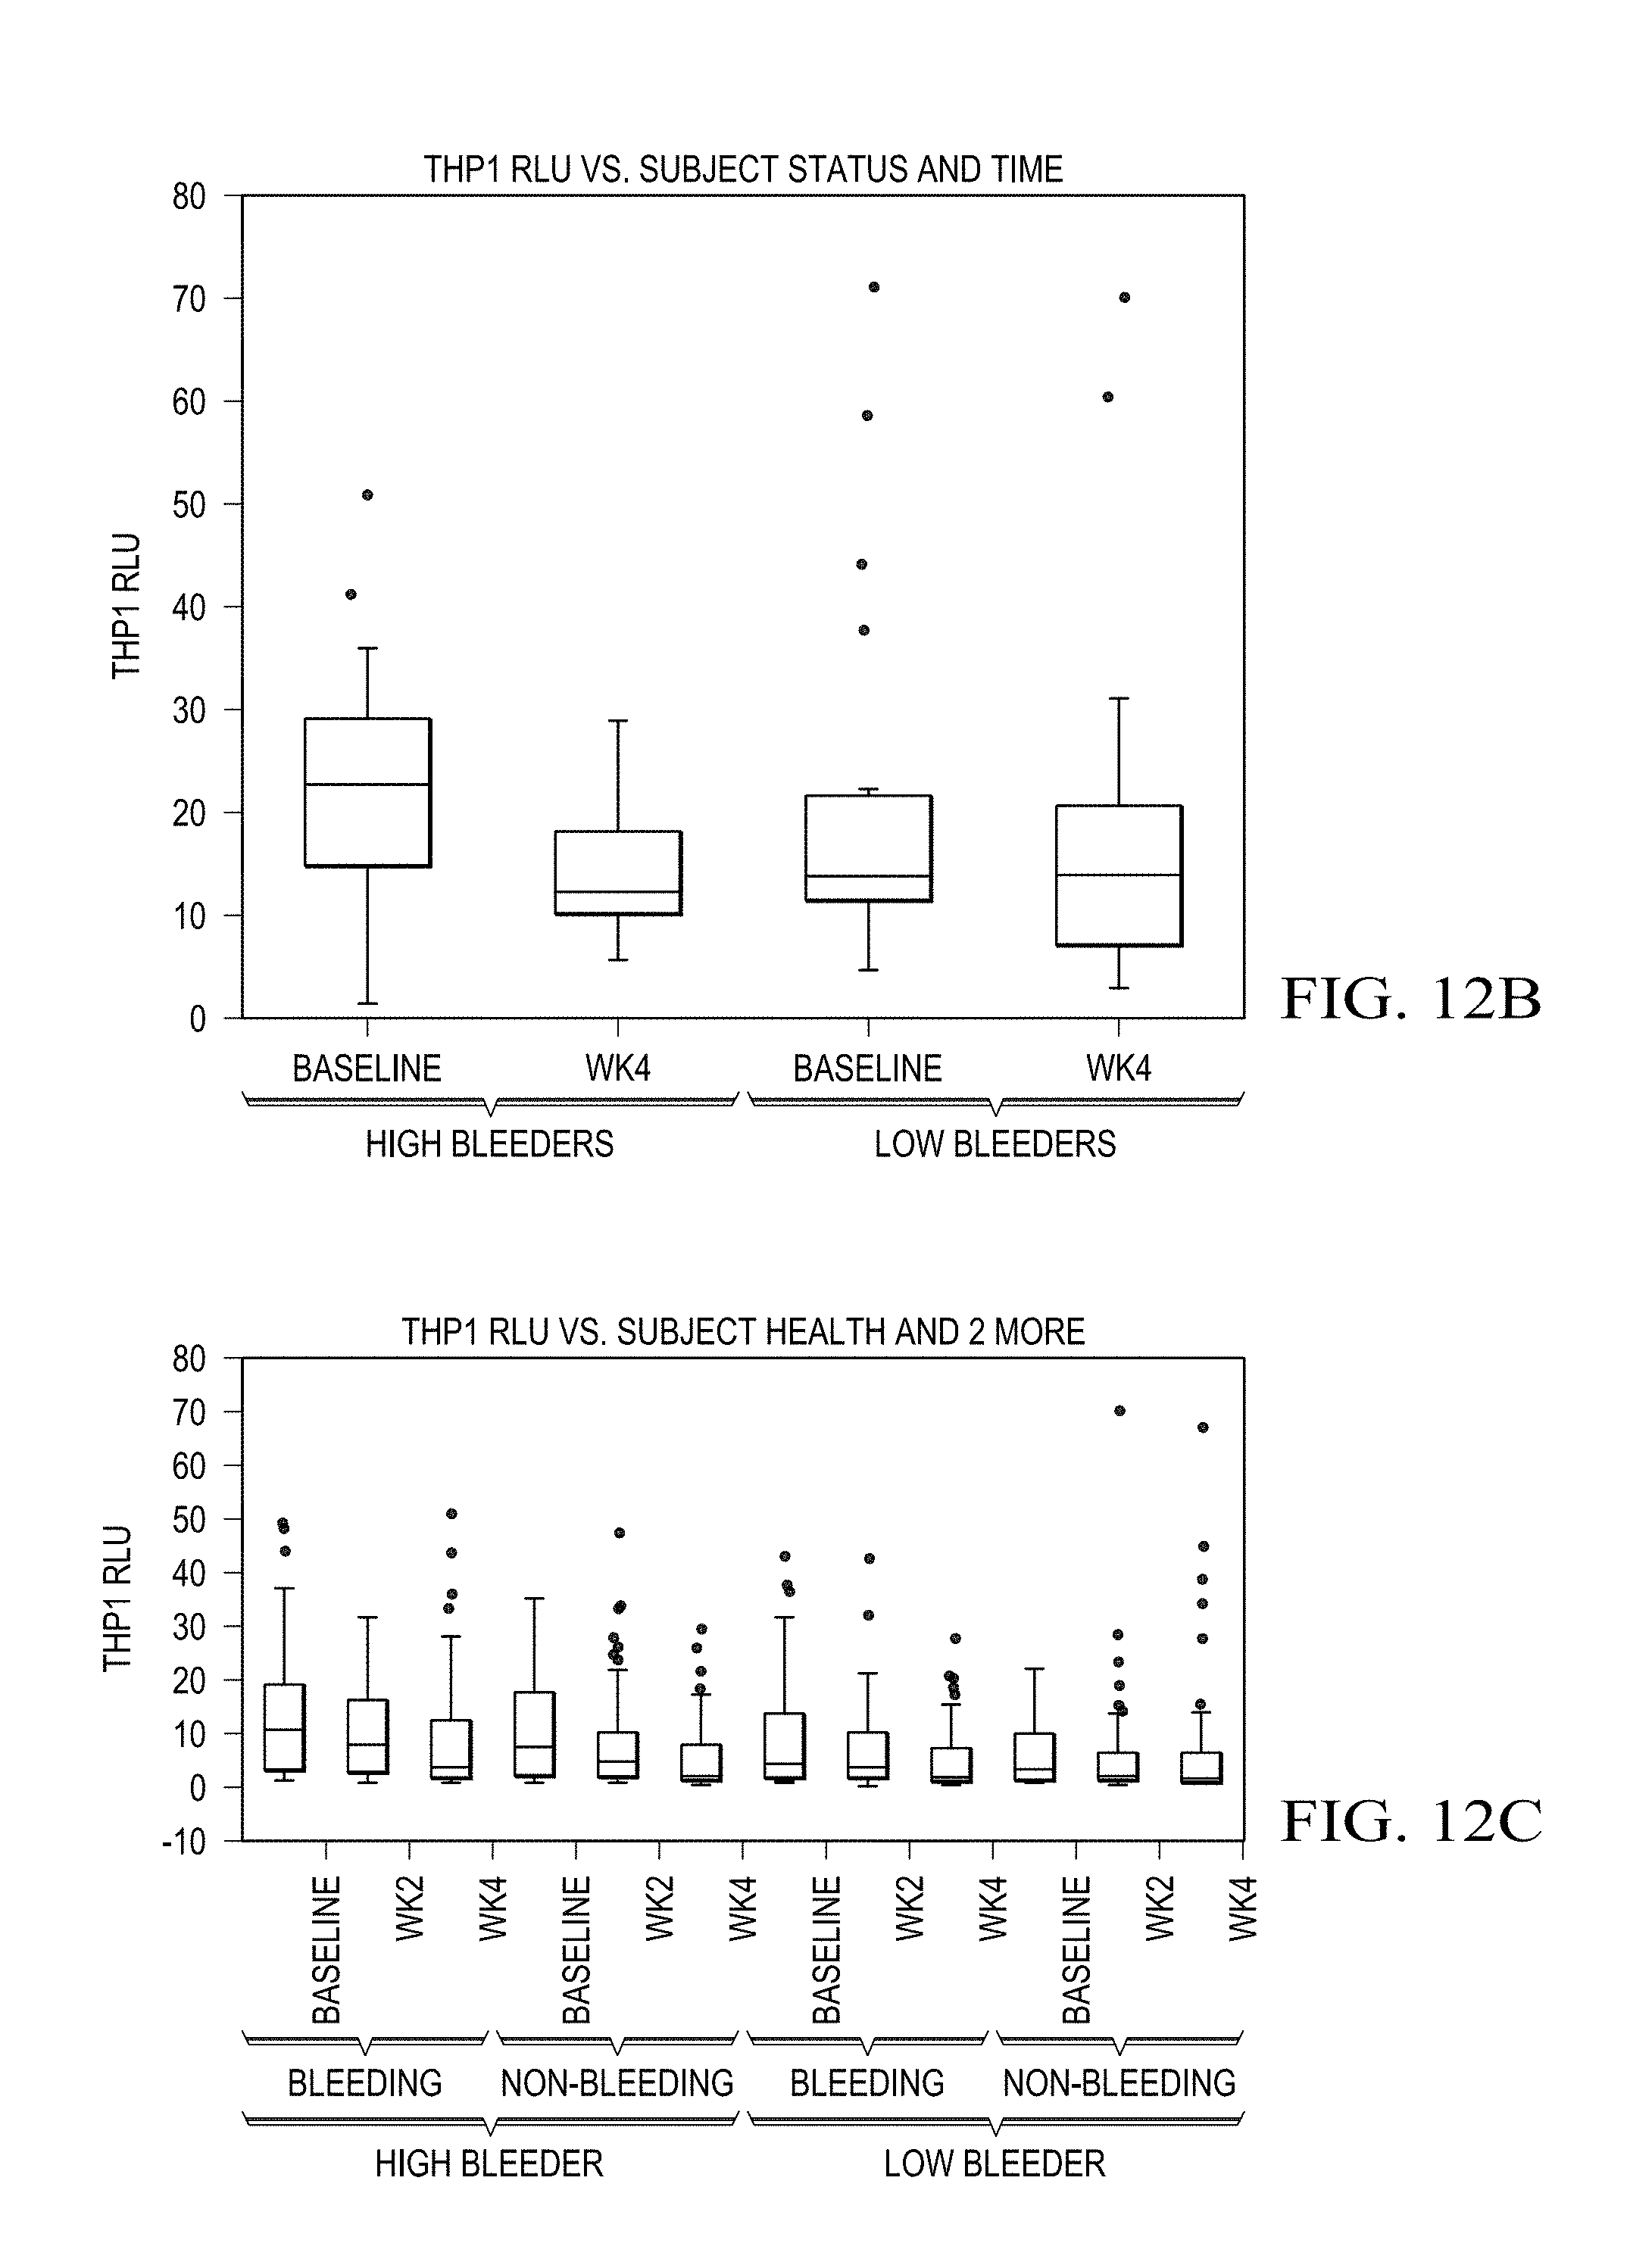
D00015

D00016

D00017

D00018

D00019

D00020

D00021

D00022

D00023

D00024

D00025

D00026
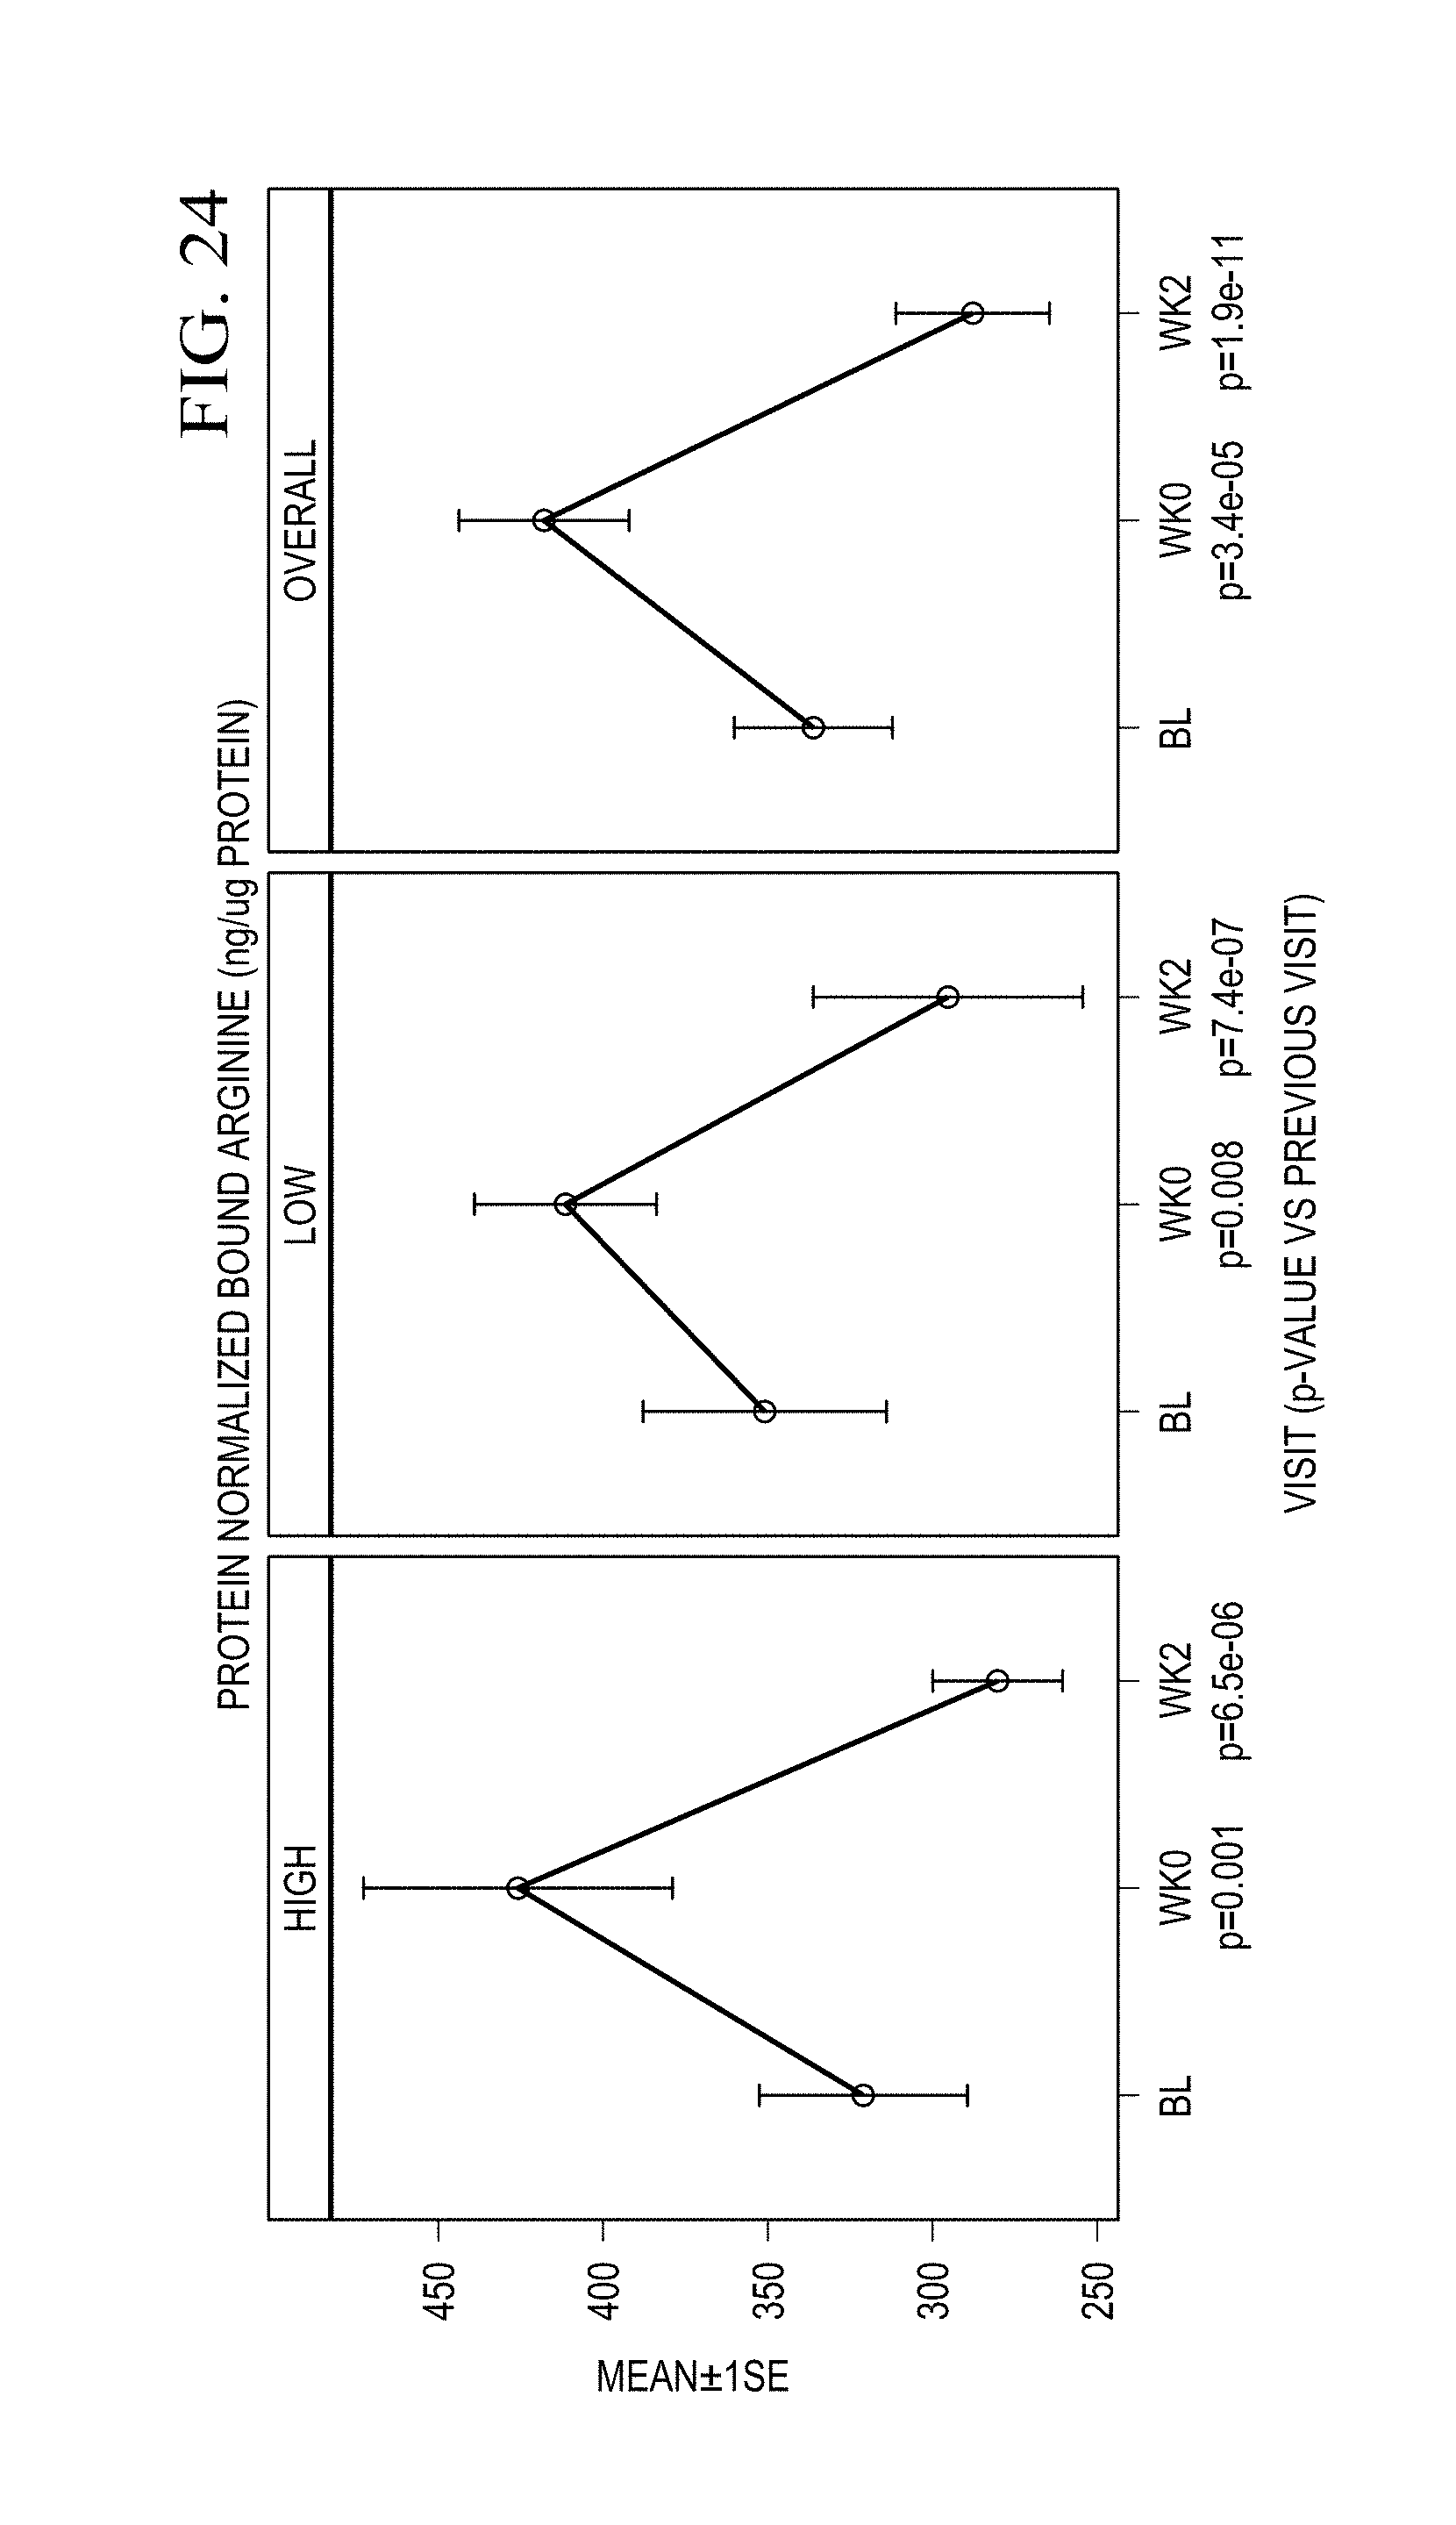
D00027

D00028

D00029

D00030

D00031

P00001

S00001
XML
uspto.report is an independent third-party trademark research tool that is not affiliated, endorsed, or sponsored by the United States Patent and Trademark Office (USPTO) or any other governmental organization. The information provided by uspto.report is based on publicly available data at the time of writing and is intended for informational purposes only.
While we strive to provide accurate and up-to-date information, we do not guarantee the accuracy, completeness, reliability, or suitability of the information displayed on this site. The use of this site is at your own risk. Any reliance you place on such information is therefore strictly at your own risk.
All official trademark data, including owner information, should be verified by visiting the official USPTO website at www.uspto.gov. This site is not intended to replace professional legal advice and should not be used as a substitute for consulting with a legal professional who is knowledgeable about trademark law.