Quality inspection data distributed ledger
Peeters , et al.
U.S. patent number 10,257,496 [Application Number 16/031,956] was granted by the patent office on 2019-04-09 for quality inspection data distributed ledger. This patent grant is currently assigned to Qcify Inc.. The grantee listed for this patent is Qcify Inc.. Invention is credited to Bert Peelaers, Raf Peeters.

View All Diagrams
| United States Patent | 10,257,496 |
| Peeters , et al. | April 9, 2019 |
Quality inspection data distributed ledger
Abstract
A method for generating a quality inspection data block for a distributed ledger includes: determining an identification code associated with a sample to be inspected, inspecting the sample and thereby generating quality inspection data associated with the sample, and after completion of the inspecting of the sample combining the identification code and the quality inspection data into the quality inspection data block. The method also includes adding the quality inspection data block to the distributed ledger. An inspector including a sensor that senses a characteristic of a sample, a memory that stores sensor output data, and a processor configured to: determine an identification code associated with a sample to be inspected, generate quality inspection data based on the sensor output data, and combine the identification code and the quality inspection data into a quality inspection data block. In one example, the inspector is an in-flight 3D inspector.
| Inventors: | Peeters; Raf (San Mateo, CA), Peelaers; Bert (Herentals, BE) | ||||||||||
|---|---|---|---|---|---|---|---|---|---|---|---|
| Applicant: |
|
||||||||||
| Assignee: | Qcify Inc. (San Mateo,
CA) |
||||||||||
| Family ID: | 64014252 | ||||||||||
| Appl. No.: | 16/031,956 | ||||||||||
| Filed: | July 10, 2018 |
Prior Publication Data
| Document Identifier | Publication Date | |
|---|---|---|
| US 20180324407 A1 | Nov 8, 2018 | |
Related U.S. Patent Documents
| Application Number | Filing Date | Patent Number | Issue Date | ||
|---|---|---|---|---|---|
| 15995126 | Jun 1, 2018 | ||||
| 15817240 | Jul 10, 2018 | 10021370 | |||
| 15219870 | Jul 10, 2018 | 10021369 | |||
| Current U.S. Class: | 1/1 |
| Current CPC Class: | H04N 5/247 (20130101); H04N 13/243 (20180501); H04N 13/254 (20180501); G06T 7/0008 (20130101); G06T 7/0004 (20130101); H04N 5/23203 (20130101); H04N 5/2256 (20130101); G06T 2207/30128 (20130101); G06T 2207/10021 (20130101) |
| Current International Class: | H04N 13/243 (20180101); G06T 7/00 (20170101); H04N 5/232 (20060101); H04N 13/254 (20180101); H04N 5/247 (20060101); H04N 5/225 (20060101) |
References Cited [Referenced By]
U.S. Patent Documents
| 2007/0140423 | June 2007 | Foland |
| 2013/0067245 | March 2013 | Horovitz |
| 2016/0033465 | February 2016 | Schreiber |
| 2016/0283904 | September 2016 | Siegel |
| 2017/0061350 | March 2017 | Smith |
Attorney, Agent or Firm: Imperium Patent Works LLP Marrello; Mark D.
Parent Case Text
CROSS REFERENCE TO RELATED APPLICATIONS
This application is a continuation-in-part and claims priority under 35 U.S.C. 120 from nonprovisional U.S. patent application Ser. No. 15/995,126, entitled "INSPECTION DEVICE CONTROLLED PROCESSING LINE SYSTEM", filed on Jun. 1, 2018, the subject matter of which is incorporated by reference. Application Ser. No. 15/995,126, in turn is a continuation and claims priority under 35 U.S.C. .sctn. 120 from nonprovisional U.S. patent application Ser. No. 15/817,240, entitled "INSPECTION DEVICE CONTROLLED PROCESSING LINE SYSTEM," filed on Nov. 19, 2017, the subject matter of which is incorporated herein by reference. Application Ser. No. 15/817,240, in turn, is a continuation-in-part and claims priority under 35 U.S.C. 120 from nonprovisional U.S. patent application Ser. No. 15/219,870, entitled "IN-FLIGHT 3D INSPECTOR", filed on Jul. 26, 2016, the subject matter of which is incorporated by reference.
Claims
What is claimed is:
1. A method for generating a quality inspection data block for a distributed ledger, comprising: (a) determining an identification code associated with a sample to be inspected; (b) inspecting the sample and thereby generating quality inspection data associated with the sample; and (c) after completion of the inspecting of (b), combining the identification code and the quality inspection data into the quality inspection data block, wherein the inspecting of (b) is performed by one of the group consisting of: an optical sensor, a moisture sensor, a microtoxin sensor, a thermometer sensor, a pH sensor, a microwave sensor, a pressure sensor, a level sensor, an ultrasonic sensor, a flow sensor, a viscosity sensor, a conductance/impedance sensor, a electronic nose (sniffing) sensor, an X-ray sensor, a multi spectral (visual/non-visual) sensor, a weight sensor, a refractometer sensor, a tenderometer sensor, a firmness sensor, and a hardness sensor.
2. The method of claim 1, wherein the determining of an identification code associated with the sample of (a) includes reading one of the following: a Quick Response (QR) code, a bar code, a printed text, a Near Field Communication (NFC), and Radio Frequency Identification (RFID) tag.
3. The method of claim 1, wherein the inspecting of (b) is performed by an in-flight 3D inspector.
4. The method of claim 1, further comprising: (d) adding the quality inspection data block to the distributed ledger.
5. The method of claim 1, wherein the determining of (a), the inspecting of (b), and the combining of (c) are performed automatically by an inspection device.
6. The method of claim 5, further comprising: (d) adding the quality inspection data block to the distributed ledger via a network connection.
7. The method of claim 6, wherein the determining of (a), the inspecting of (b), the combining of (c), and the adding of (d) are performed automatically by the inspection device.
8. A method for generating a quality inspection data block for a distributed ledger, comprising: (a) determining an identification code associated with a sample to be inspected; (b) inspecting the sample and thereby generating quality inspection data associated with the sample; and (c) after completion of the inspecting of (b), combining the identification code and the quality inspection data into the quality inspection data block, wherein the quality inspection data block includes an indication of at least one of the group consisting of: an inspection entity, an inspection location, a sensor identification number, a lot number, a total weight value, an analysis timestamp, an amount of product analyzed value, a moisture content value, a kernel size value, a uniformity ratio, a percentage or number of passing samples, a percentage or number of dissimilar samples, a percentage or number of chipped and scratched samples, a percentage or number of samples that have serious damage, a quality grade value, a color value, a microtoxin value, a temperature value, an acidity value, a pressure value, a volume per unit time value, an amount of discolored product value, an amount of broken product value, an amount of rancid product value, an amount of moldy product value, an amount of immature product value, an amount of unripe product value, and an amount of rotten soft product value.
9. A method for generating a quality inspection data block for a distributed ledger, comprising: (a) determining an identification code associated with a sample to be inspected; (b) inspecting the sample and thereby generating quality inspection data associated with the sample; and (c) after completion of the inspecting of (b), combining the identification code and the quality inspection data into the quality inspection data block, wherein the quality inspection data block includes an indication of at least one of the group consisting of: a present block hash value, a previous block hash value, and a next block hash value.
10. An inspector, comprising: a sensor that senses a characteristic of a sample; a memory that stores sensor output data; and a processor configured to: (a) determine an identification code associated with a sample to be inspected; (b) generate quality inspection data based on the sensor output data; and (c) combine the identification code and the quality inspection data into a quality inspection data block, wherein the sensor is one of the group consisting of: an optical sensor, a moisture sensor, a microtoxin sensor, a thermometer sensor, an acidity sensor, a microwave sensor, a pressure sensor, a level sensor, an ultrasonic sensor, a flow sensor, a viscosity sensor, a conductance/impedance sensor, an electronic nose (sniffing) sensor, an X-ray sensor, a multi spectral (visual/non visual) sensor, a weight sensor, a refractometer sensor, a tenderometer sensor, a firmness sensor, and a hardness sensor.
11. The inspector of claim 10, wherein the determine of an identification code associated with the sample of (a) includes reading one of the following: a Quick Response (QR) code, a bar code, a printed text, a Near Field Communication (NFC) signal, and Radio Frequency Identification (RFID) tag.
12. The inspector of claim 10, wherein the inspector is an in-flight 3D inspector.
13. The inspector of claim 10, wherein the processor is further configured to: (d) add the quality inspection data block to the distributed ledger.
14. The method of claim 13, wherein the determine of (a), the generate of (b), the combine of (c), and the add of (d) are performed automatically by the inspector.
15. The inspector of claim 10, wherein the determine of (a), the generate of (b), and the combine of (c) are performed automatically by the inspector.
16. The inspector of claim 10, further comprising: a network interface circuit, wherein the quality inspection data block is added to the distributed ledger via the network interface circuit.
17. An inspector, comprising: a sensor that senses a characteristic of a sample; a memory that stores sensor output data; and a processor configured to: (a) determine an identification code associated with a sample to be inspected; (b) generate quality inspection data based on the sensor output data; and (c) combine the identification code and the quality inspection data into a quality inspection data block, wherein the quality inspection data block includes an indication of at least one of the group consisting of: an inspection entity, an inspection location, a sensor identification number, a lot number, a total weight value, an analysis completion timestamp, an amount of product analyzed value, a moisture content value, a kernel size value, a uniformity ratio, a percentage or number of passing samples, a percentage or number of dissimilar samples, a percentage or number of chipped and scratched samples, a percentage or number of samples that have serious damage, and a quality grade value.
18. An inspector, comprising: a sensor that senses a characteristic of a sample; a memory that stores sensor output data; and a processor configured to: (a) determine an identification code associated with a sample to be inspected; (b) generate quality inspection data based on the sensor output data; and (c) combine the identification code and the quality inspection data into a quality inspection data block, wherein the quality inspection data block includes an indication of at least one of the group consisting of: a present block hash value, a previous block hash value, and a next block hash value.
Description
TECHNICAL FIELD
The present invention generally relates to systems and methods for the application of distributed ledgers for storing, tracking, verifying and publishing quality inspection data and source data related to agricultural, pharmaceutical, and manufactured products.
BACKGROUND INFORMATION
Distributed ledgers, such as Blockchain, provide a new system for recording transactions and storing data. In general, distributed ledgers hold a log of transaction events that may be replicated across a public or private distributed network. Cryptography and digital signatures may be used to determine valid parties and transactions such that all parties/observers agree on the order and the state of the ledger in real-time without having to rely of a trusted third party to hold the true "golden copy." The distributed ledger thus provides a practically unchangeable, verifiably true audit trail.
To date the focus of distributed ledgers, such as Blockchain, has been on financial transactions. For example, crypto currency, such as Bitcoin, uses a public ledger to make and track financial transactions between different parties around the world without the need of a central bank to validate and process the transaction.
SUMMARY
In a first novel aspect, a method for generating a quality inspection data block for a distributed ledger includes: (a) determining an identification code associated with a sample to be inspected, (b) inspecting the sample and thereby generating quality inspection data associated with the sample, and (c) after completion of the inspecting of (b) combining the identification code and the quality inspection data into the quality inspection data block.
In one example, the inspecting of (b) is performed by one of the group consisting of: an optical sensor, a moisture sensor, a microtoxin sensor, a thermometer sensor, an acidity sensor, a microwave sensor, a pressure sensor, a level sensor, an ultrasonic sensor, a flow sensor, a viscosity sensor, a conductance/impedance sensor, a electronic nose (sniffing) sensor, an X-ray sensor, a multi spectral (visual/non-visual) sensor, a weight sensor, a refractometer sensor, a tenderometer sensor, a firmness sensor, and a hardness sensor.
In another example, the determining of an identification code associated with the sample of (a) includes reading one of the group consisting of: a Quick Response (QR) code, a bar code, a printed text, Radio Frequency Identification (RFID) tag, a Near Field Communication (NFC) signal, and a token.
In yet another example, the inspecting of (b) is performed by an in-flight 3D inspector.
In a different example, the method also includes (d) adding the quality inspection data block to the distributed ledger. The quality inspection data block may include an indication of at least one of the group consisting of: an inspection entity, an inspection location, a sensor identification number, a lot number, a total weight value, an analysis timestamp, an amount of product analyzed value, a moisture content value, a kernel size value, a uniformity ratio, a percentage or number of passing samples, a percentage or number of dissimilar samples, a percentage or number of chipped and scratched samples, a percentage or number of samples that have serious damage, a quality grade value, a color value, a microtoxin value (milligram/kg, microgram/kg, Parts Per Million, Parts Per Billion . . . ), a temperature value, a pH value, a pressure value (kPA, PSI . . . ), a volume per unit time (cubic meters per second), an amount of discolored product (number of percentage), an amount of broken product (number or percentage), an amount of rancid product (number or percentage), an amount of moldy product (number of percentage), an amount of immature product (number or percentage), an amount of unripe product (number or percentage), an amount of rotten soft product (number or percentage), an amount of a chemical substance (number or percent), a density (number or percentage, a brix level (number or percentage), an amount of good product (number or percentage), a bitterness value (number or percentage), and a physical appearance value (number or percentage).
The quality inspection data block may also include an indication of at least one of the group consisting of: a present block hash value, a previous block hash value, and a next block hash value.
In a final example, the method also includes (d) adding the quality inspection data block to the distributed ledger via a network connection. The determining of (a), the inspecting of (b), the combining of (c), and the adding of (d) are performed automatically by the inspection device.
In a second novel aspect, an inspector includes: a sensor that senses a characteristic of a sample, a memory that stores the characteristic of the sample, and a processor configured to: (a) determine an identification code associated with a sample to be inspected, (b) generate quality inspection data based on the characteristic of the sample, and (c) combine the identification code and the quality inspection data into a quality inspection data block.
Further details and embodiments and techniques are described in the detailed description below. This summary does not purport to define the invention. The invention is defined by the claims.
BRIEF DESCRIPTION OF THE DRAWINGS
The accompanying drawings, where like numerals indicate like components, illustrate embodiments of the invention.
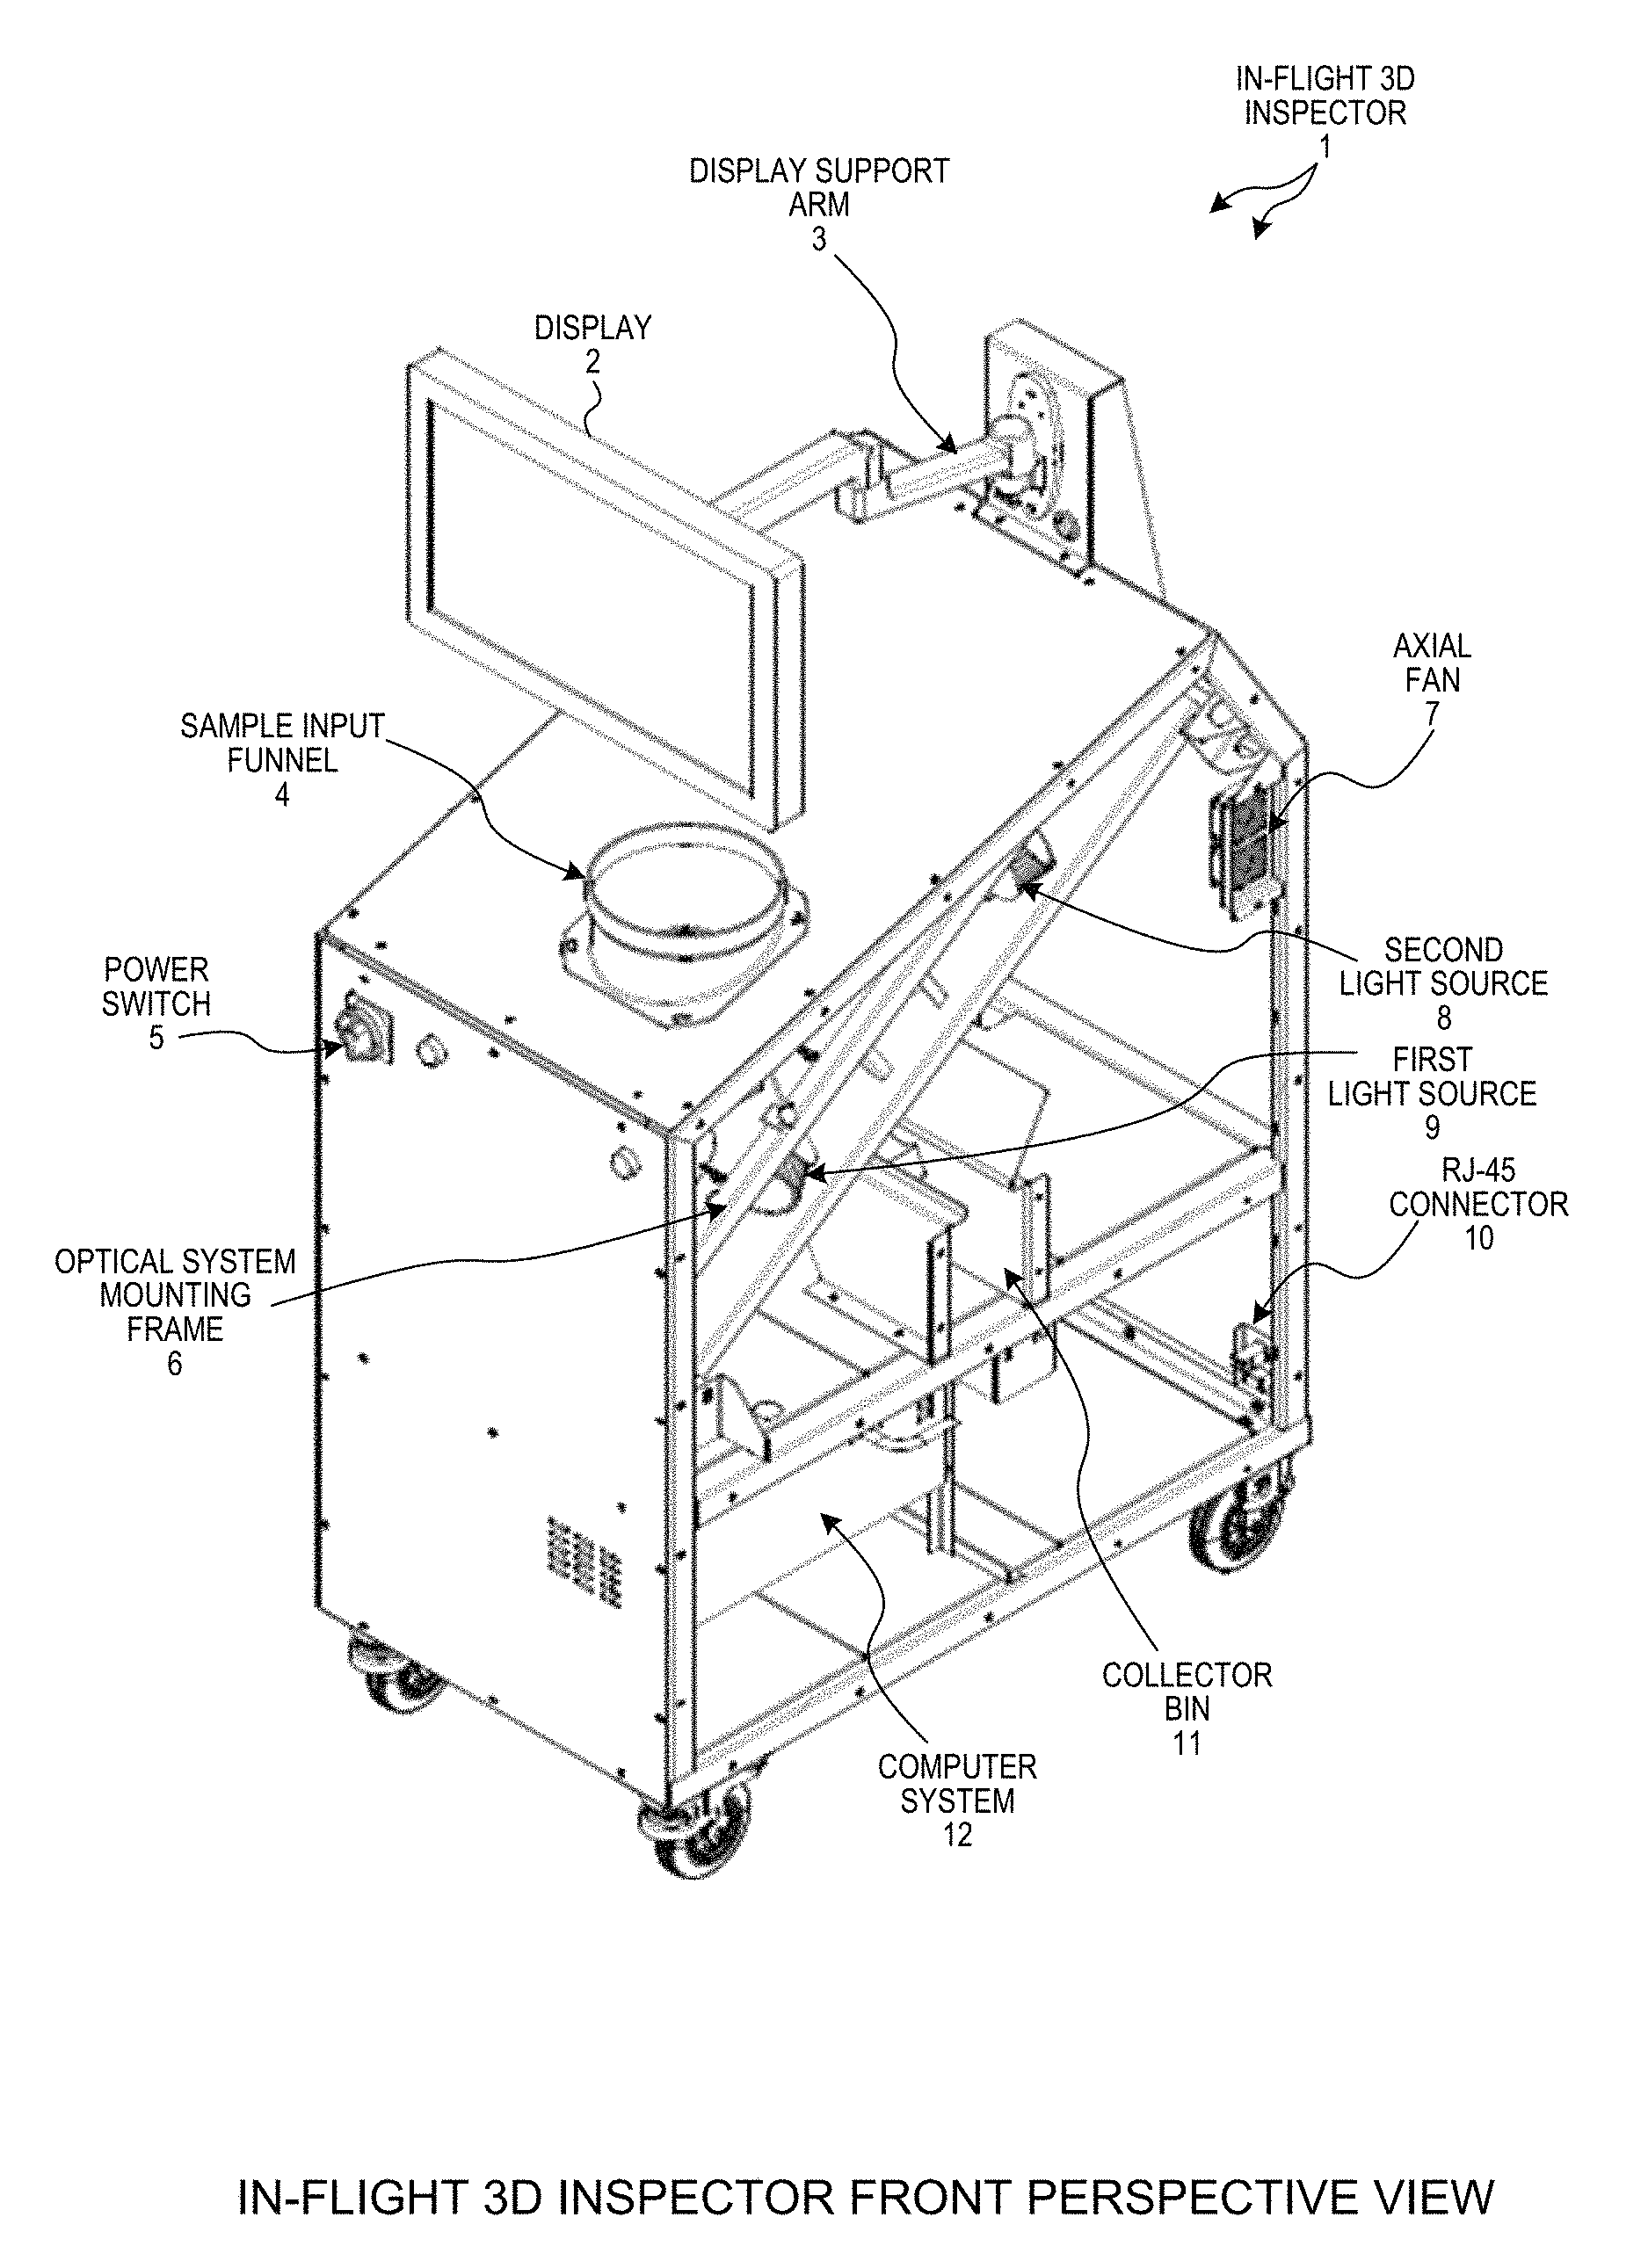
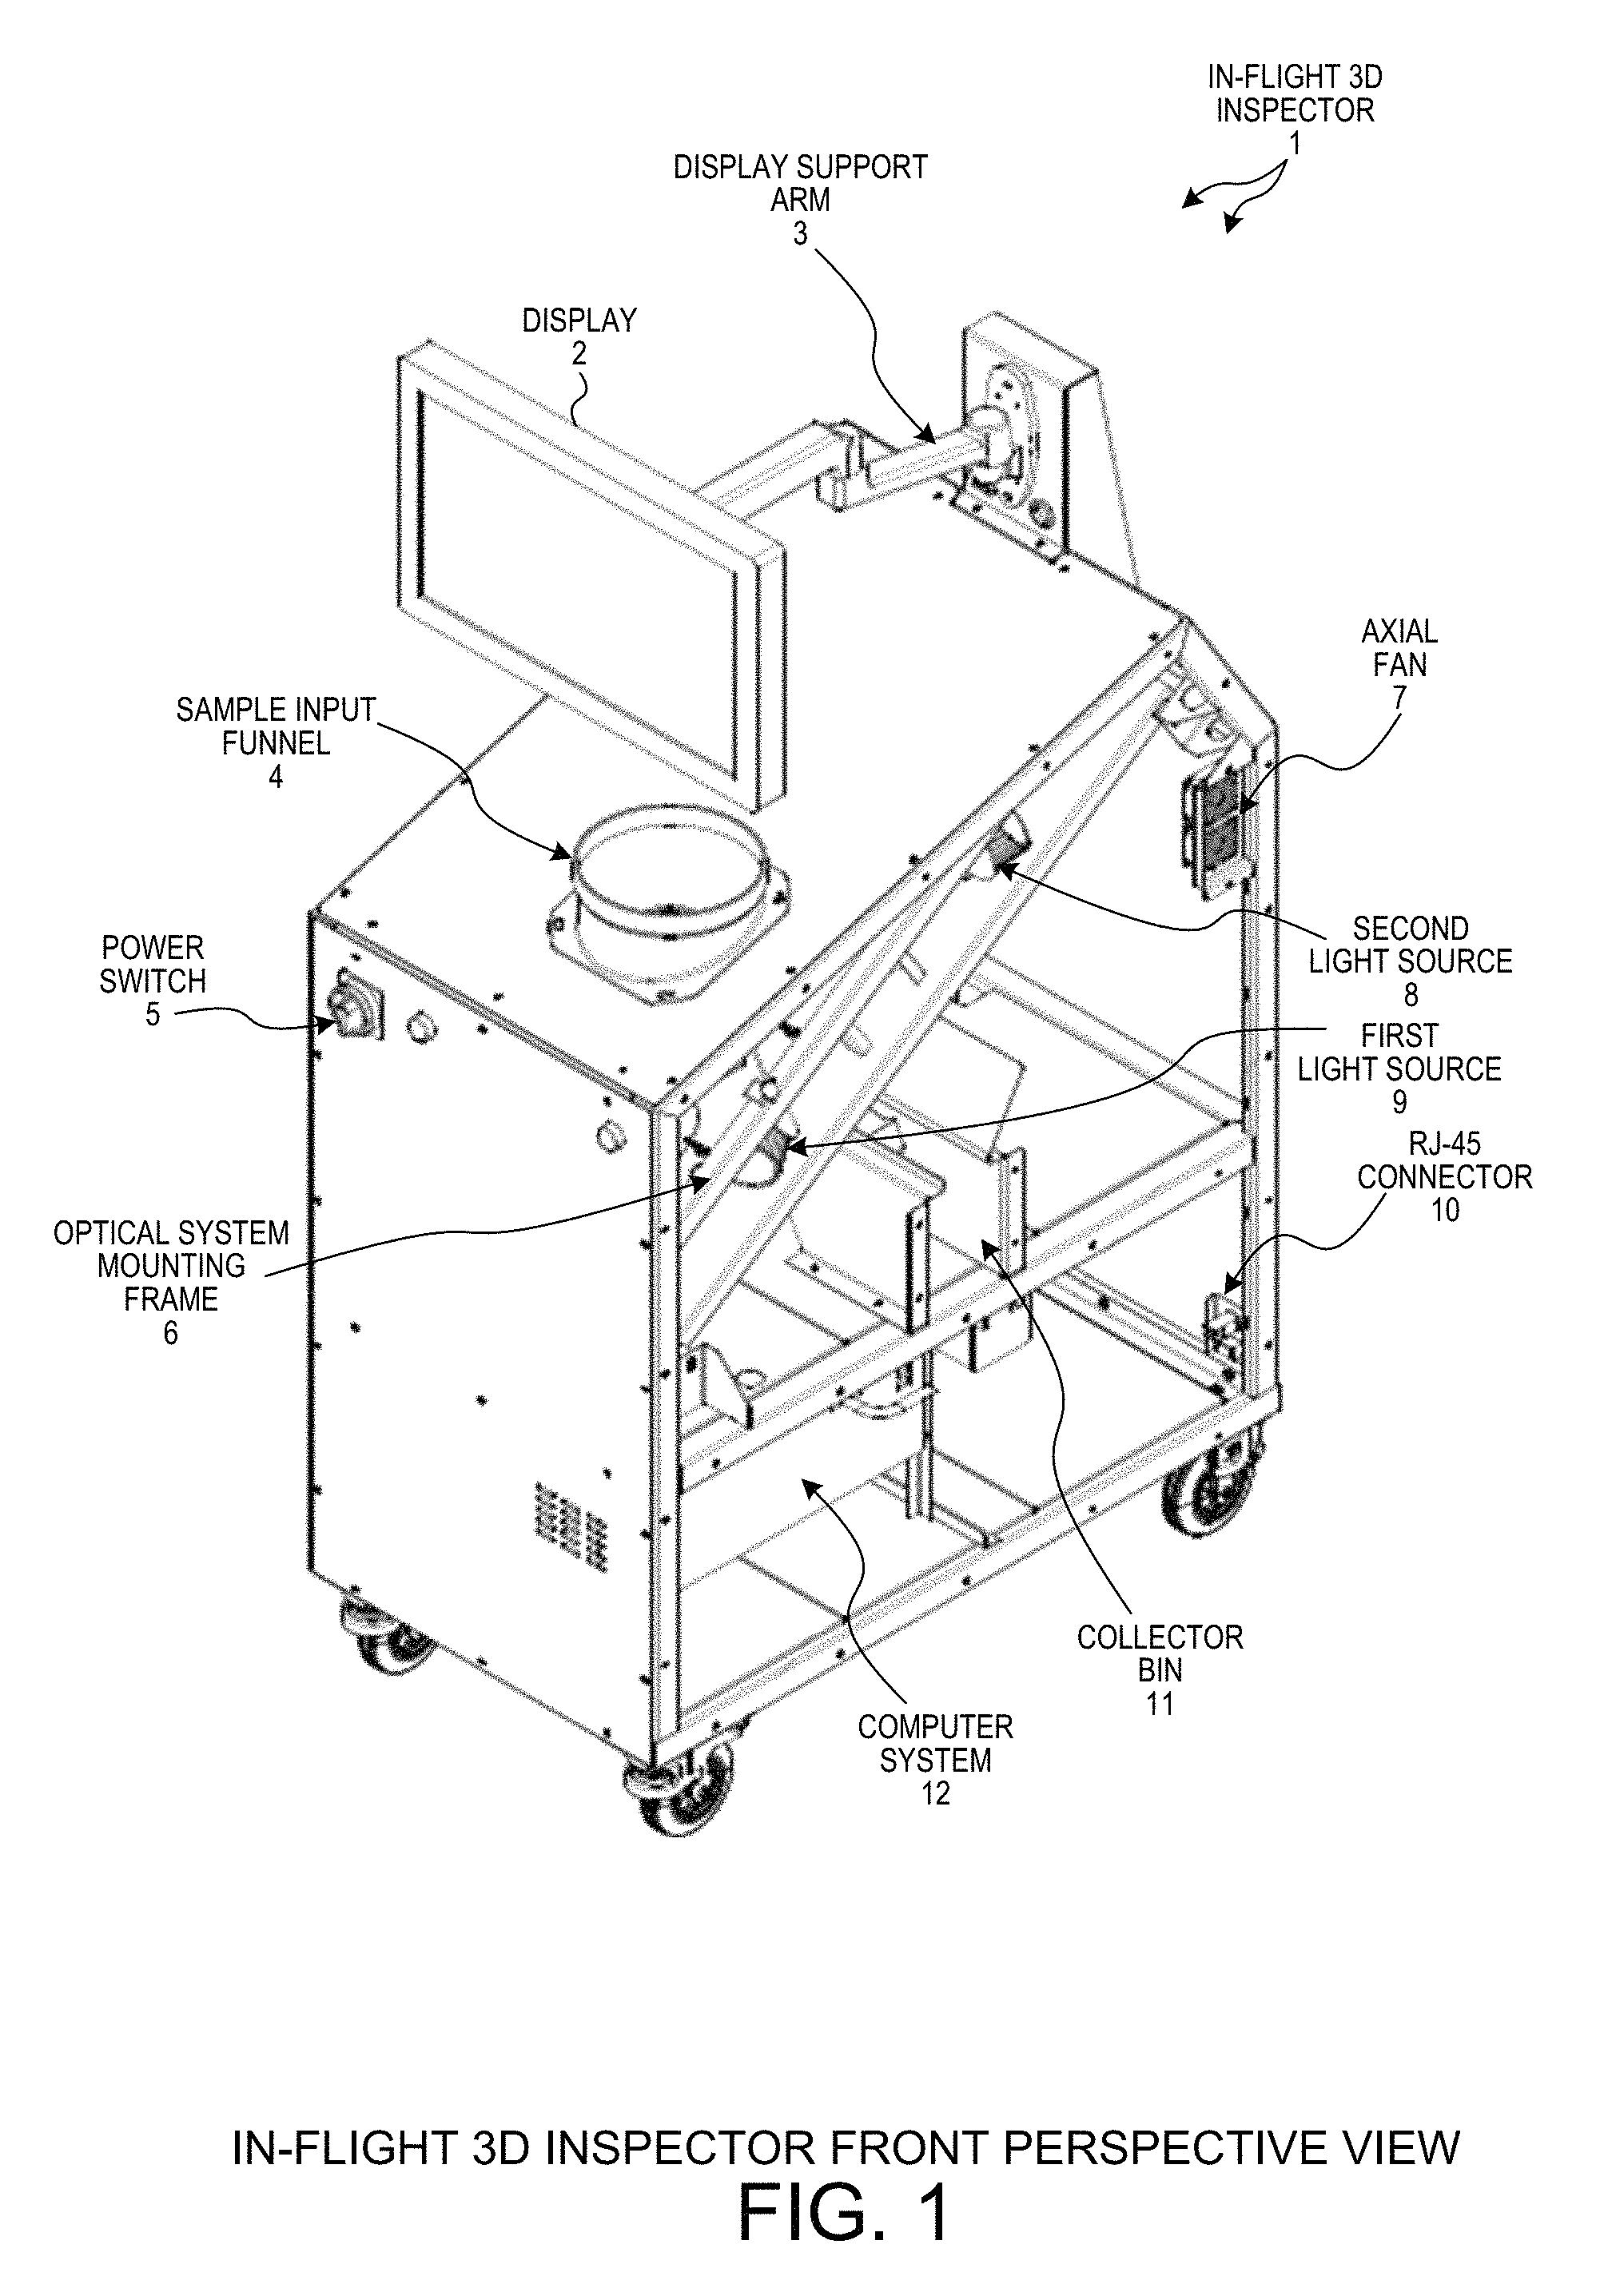
FIG. 1 is a first diagram of the in-flight 3D inspector 1 view from a first perspective.
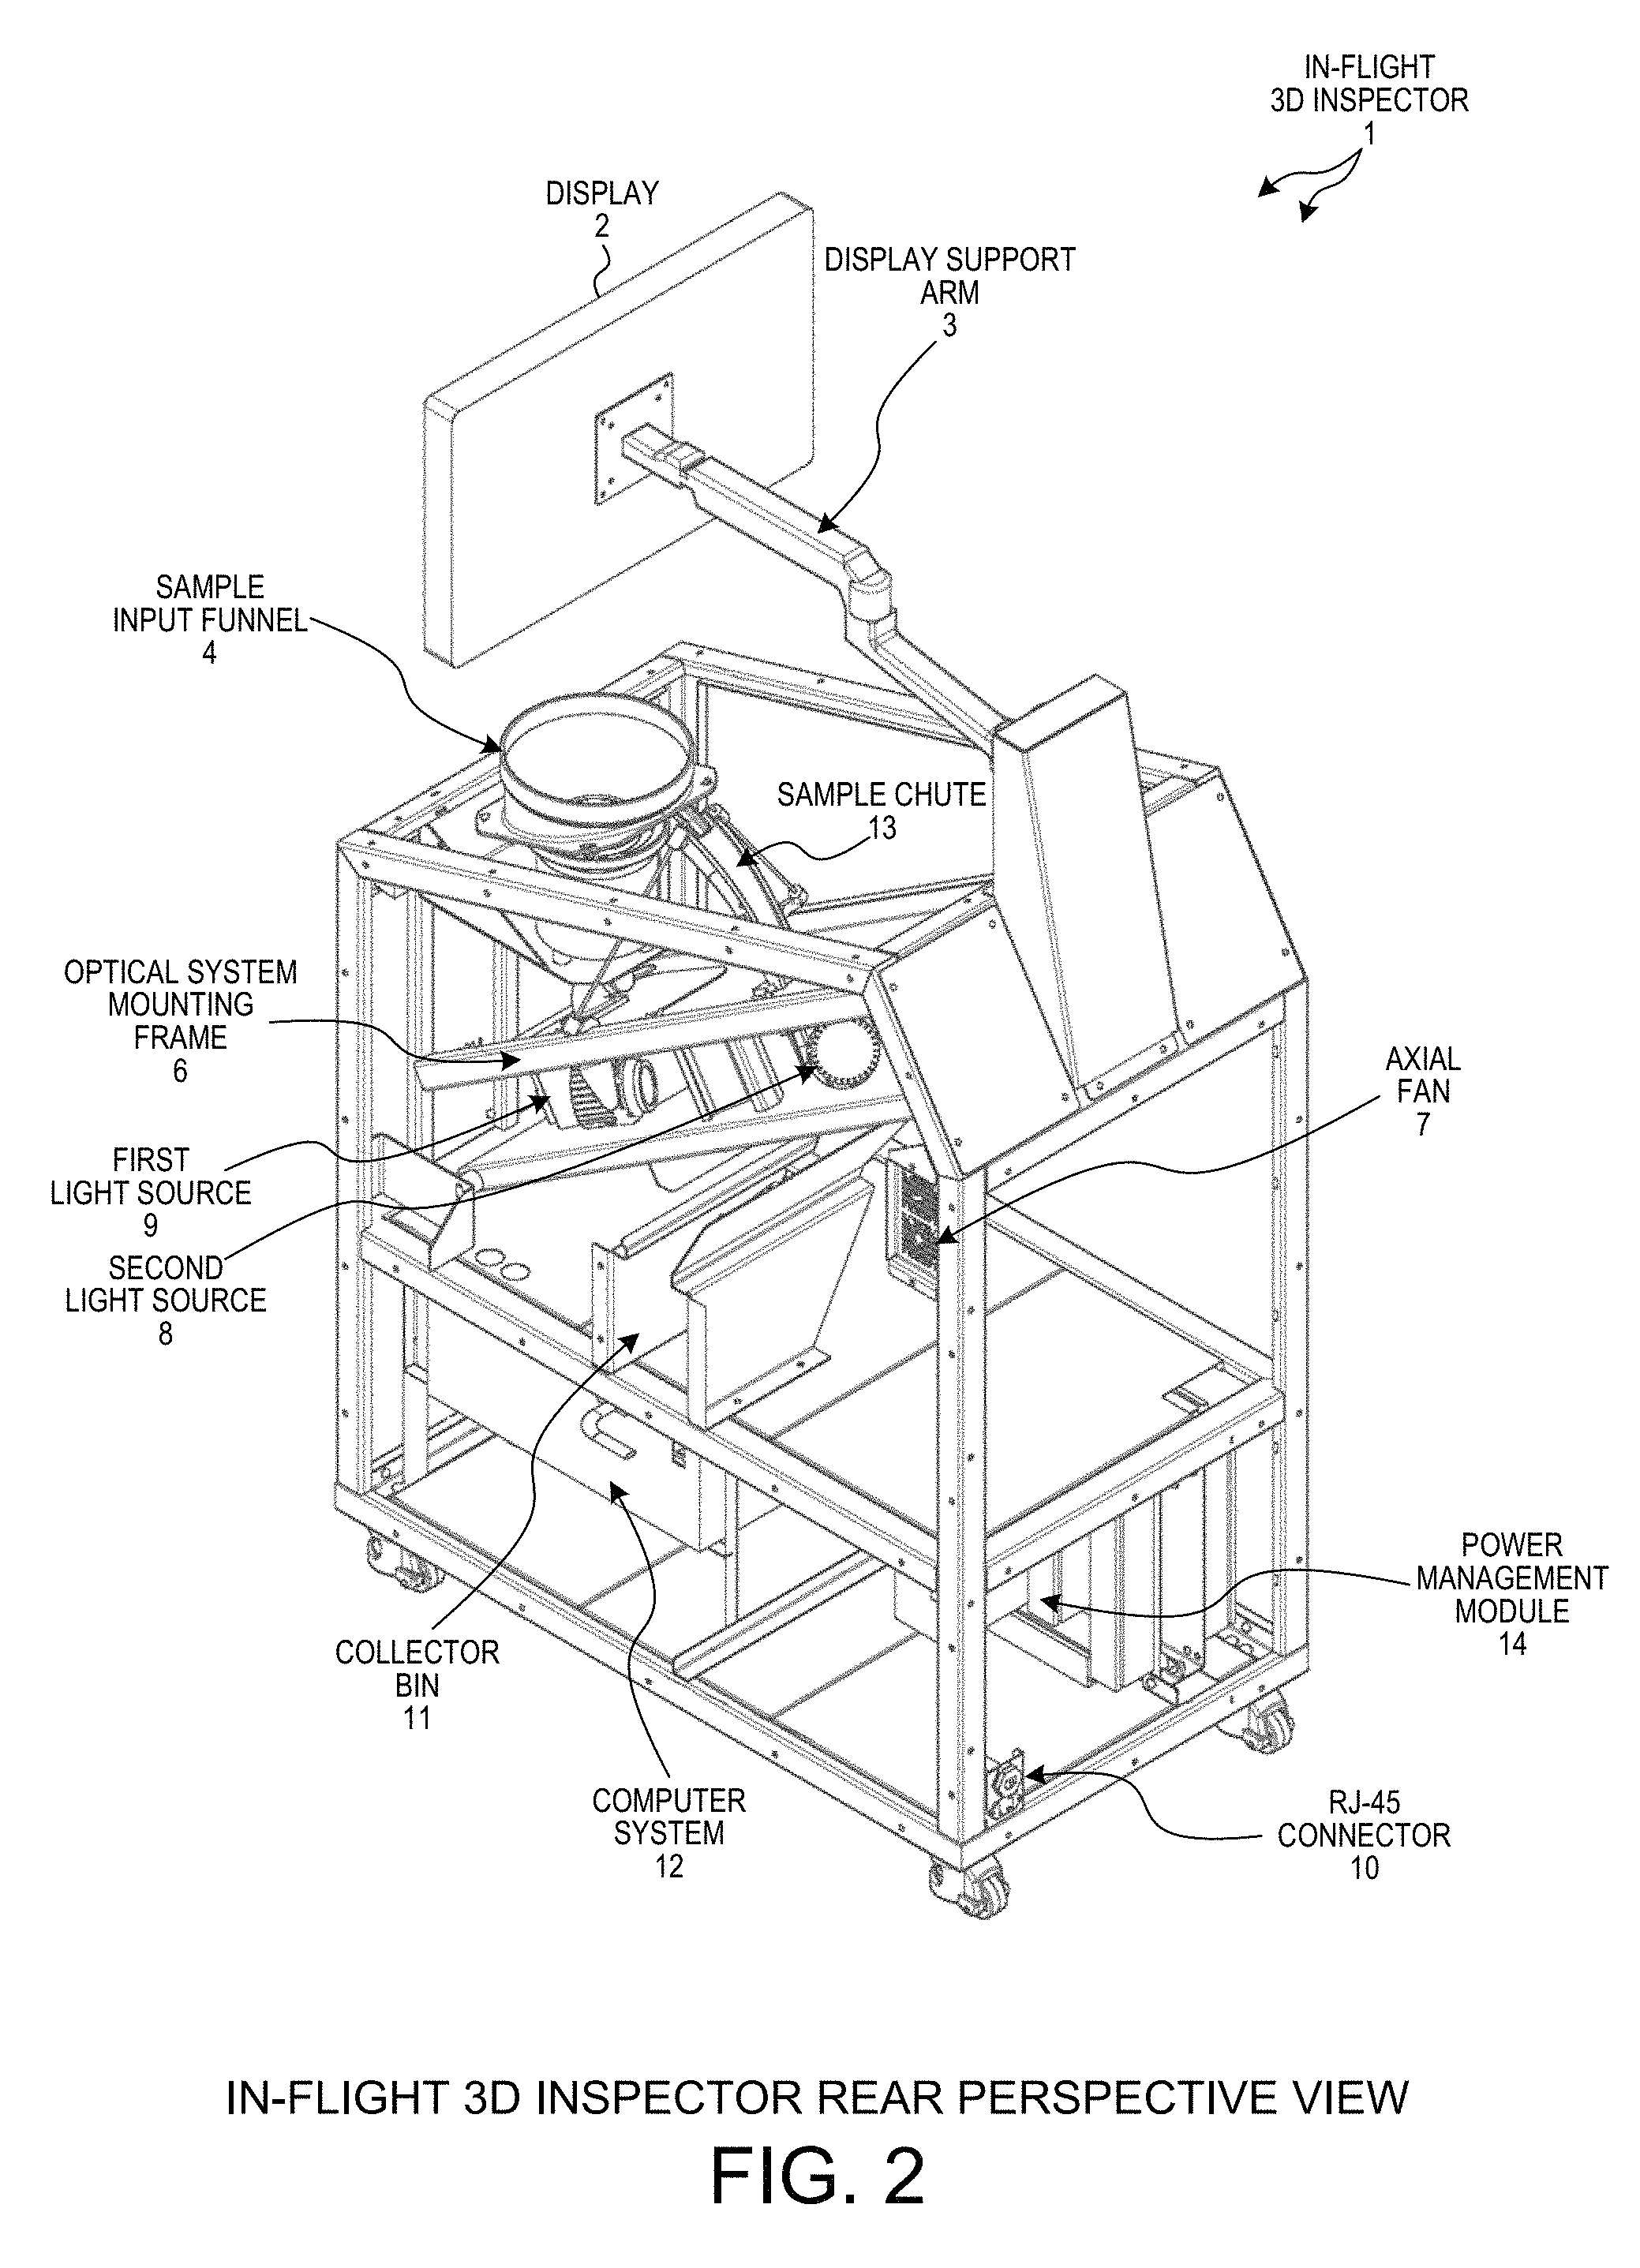
FIG. 2 is a second diagram of the in-flight 3D inspector 1 view from a second perspective.
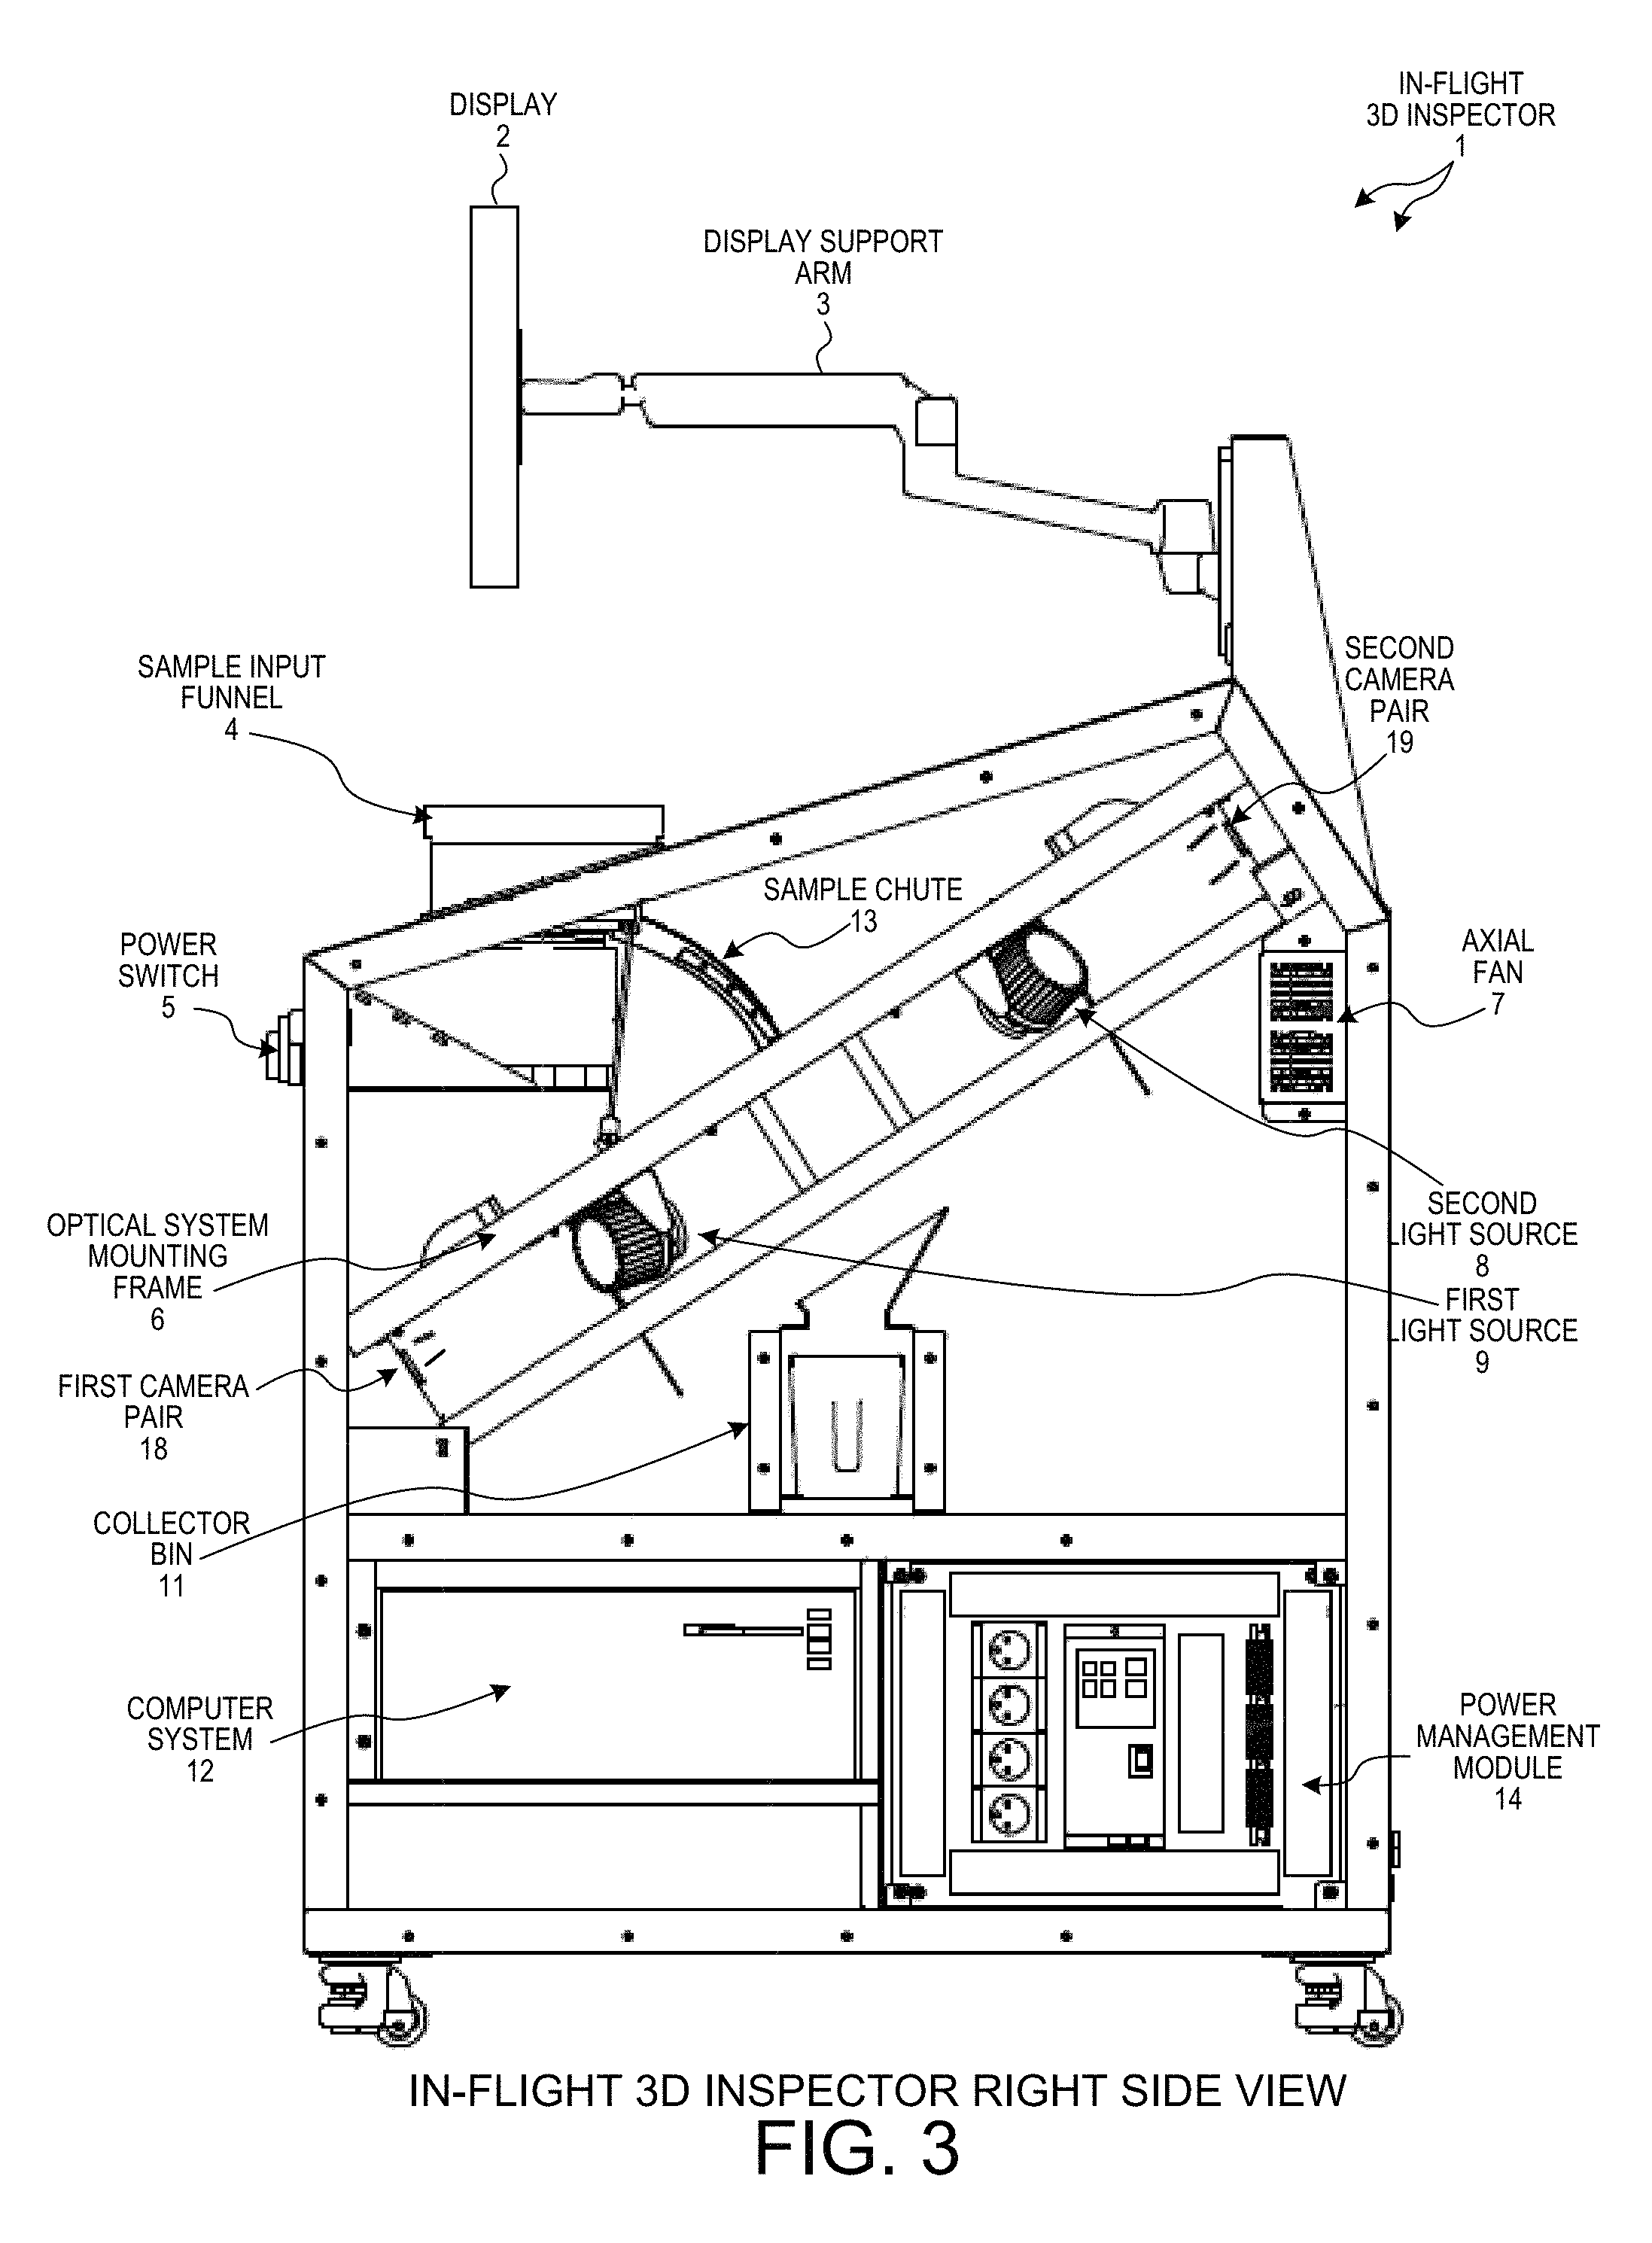
FIG. 3 is a third diagram of the in-flight 3D inspector 1 view from a right side view.
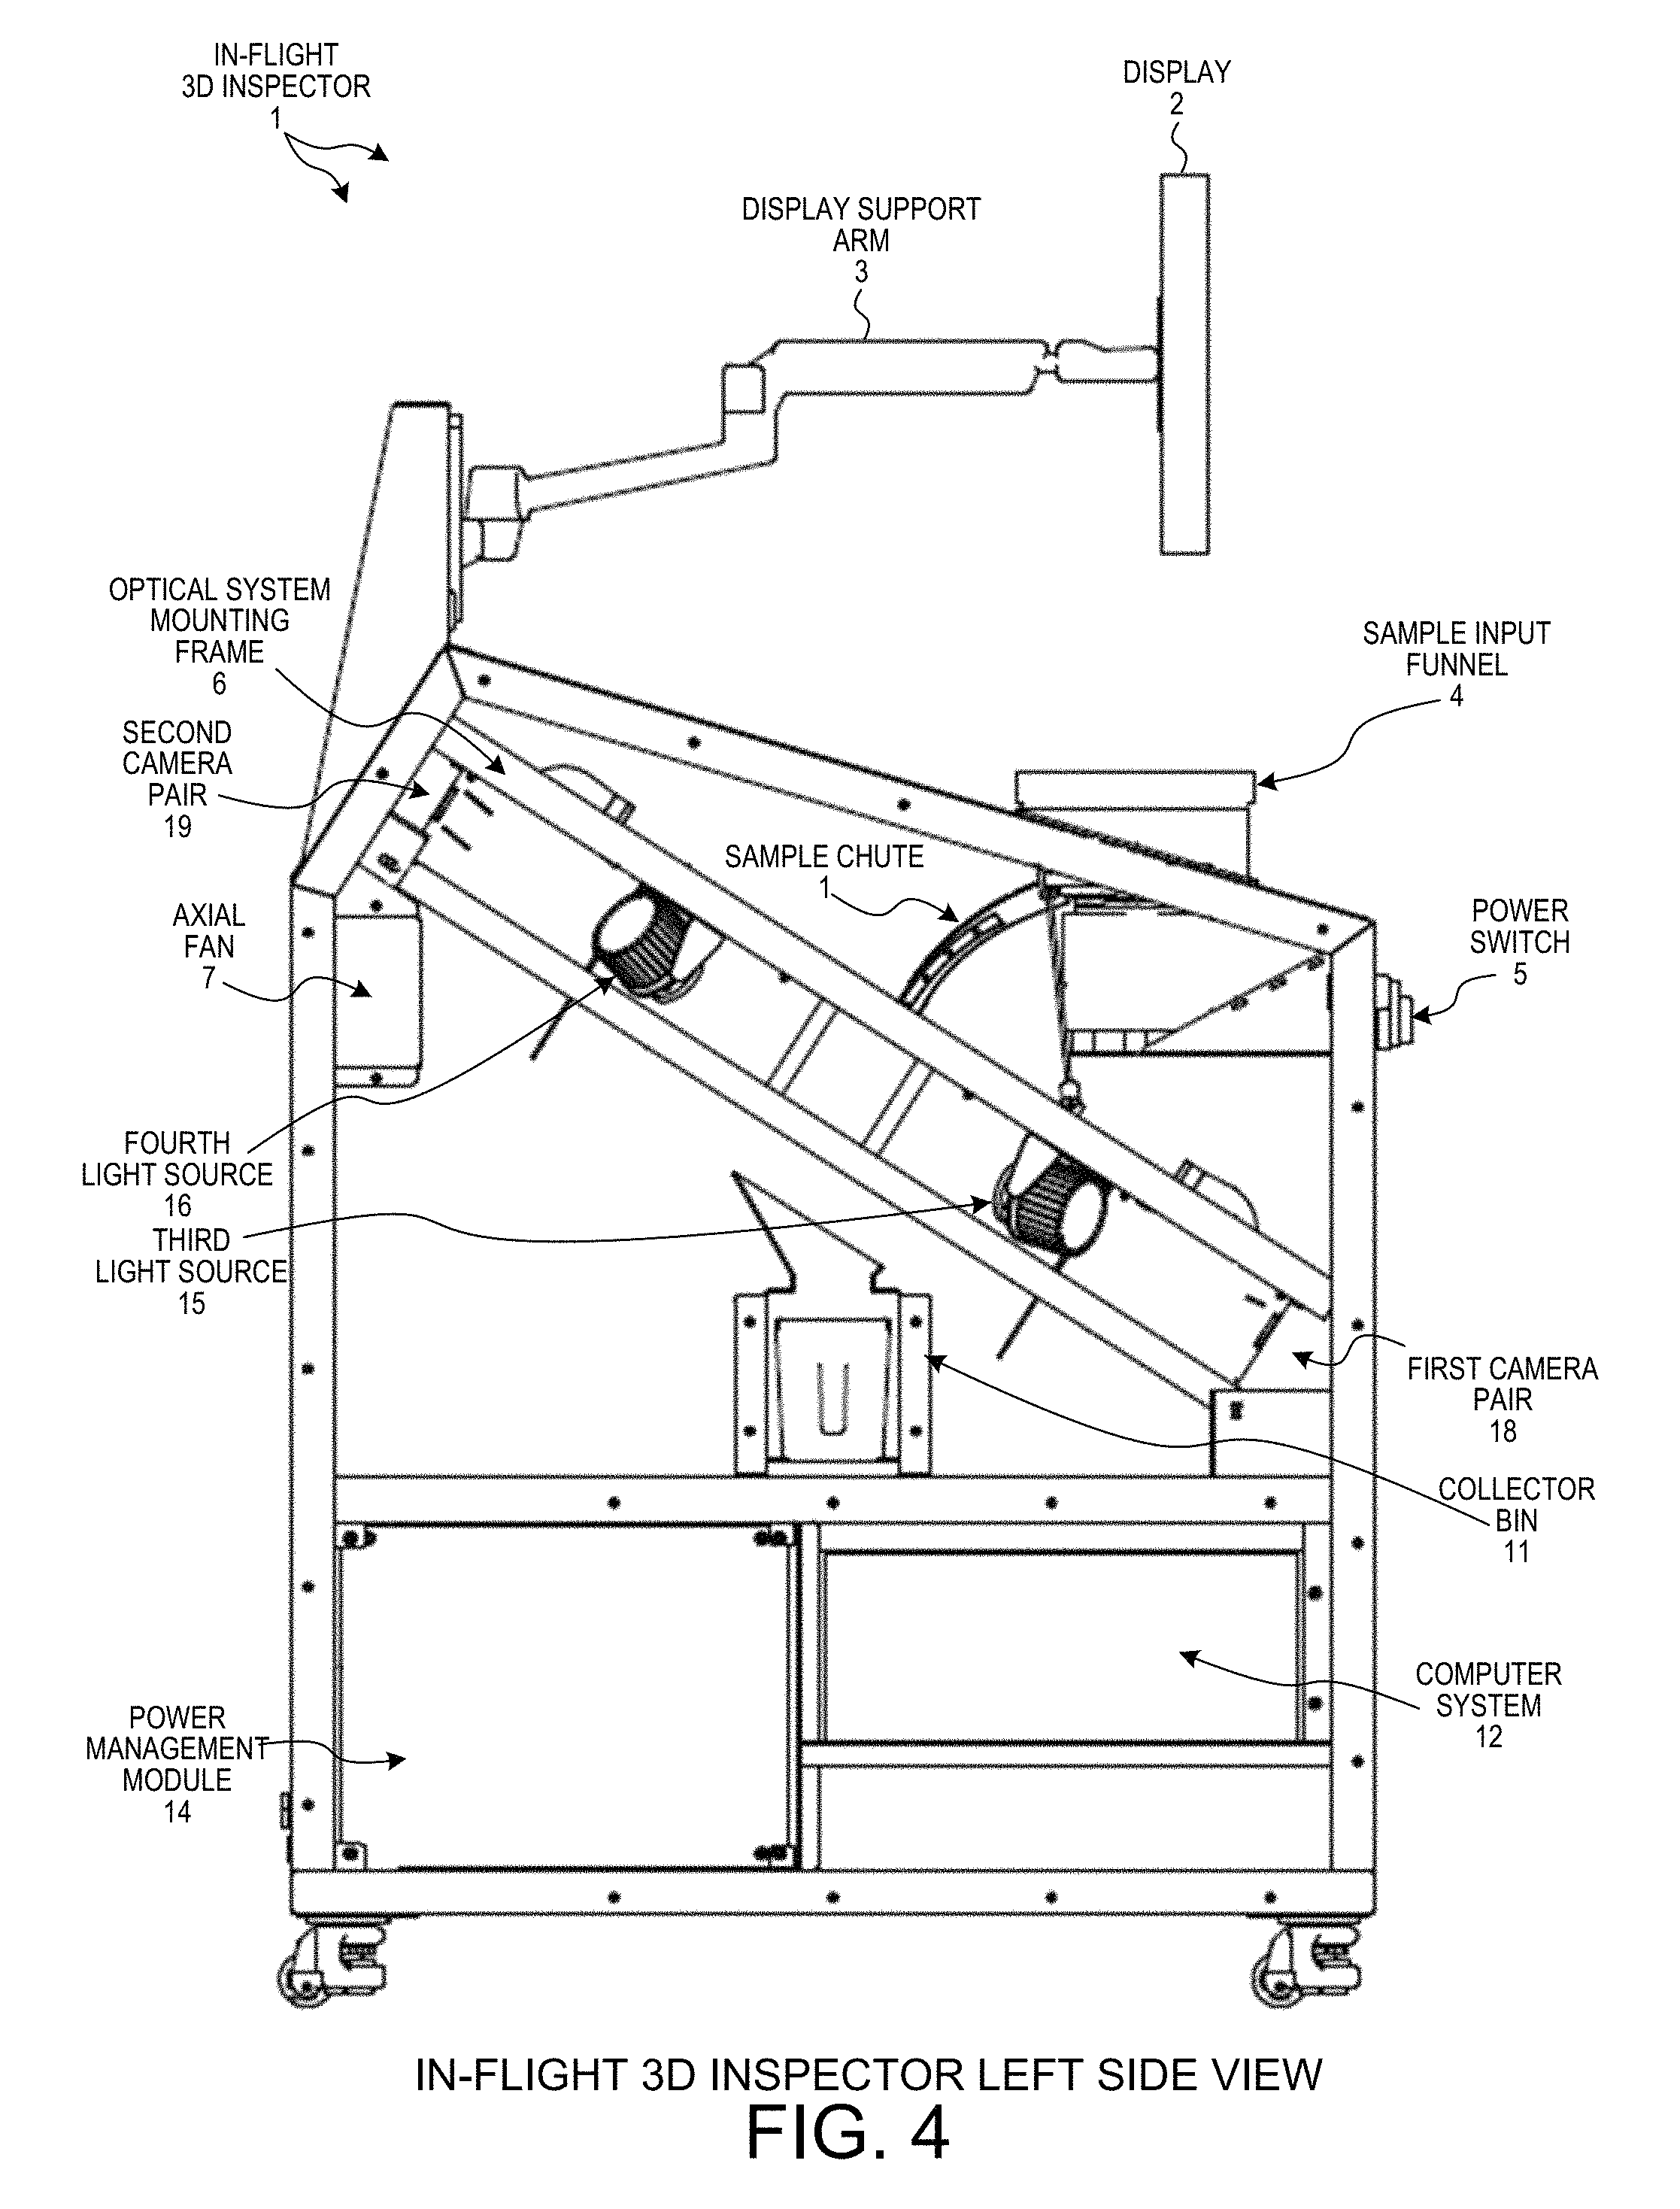
FIG. 4 is a fourth diagram of the in-flight 3D inspector 1 view from a left side view.
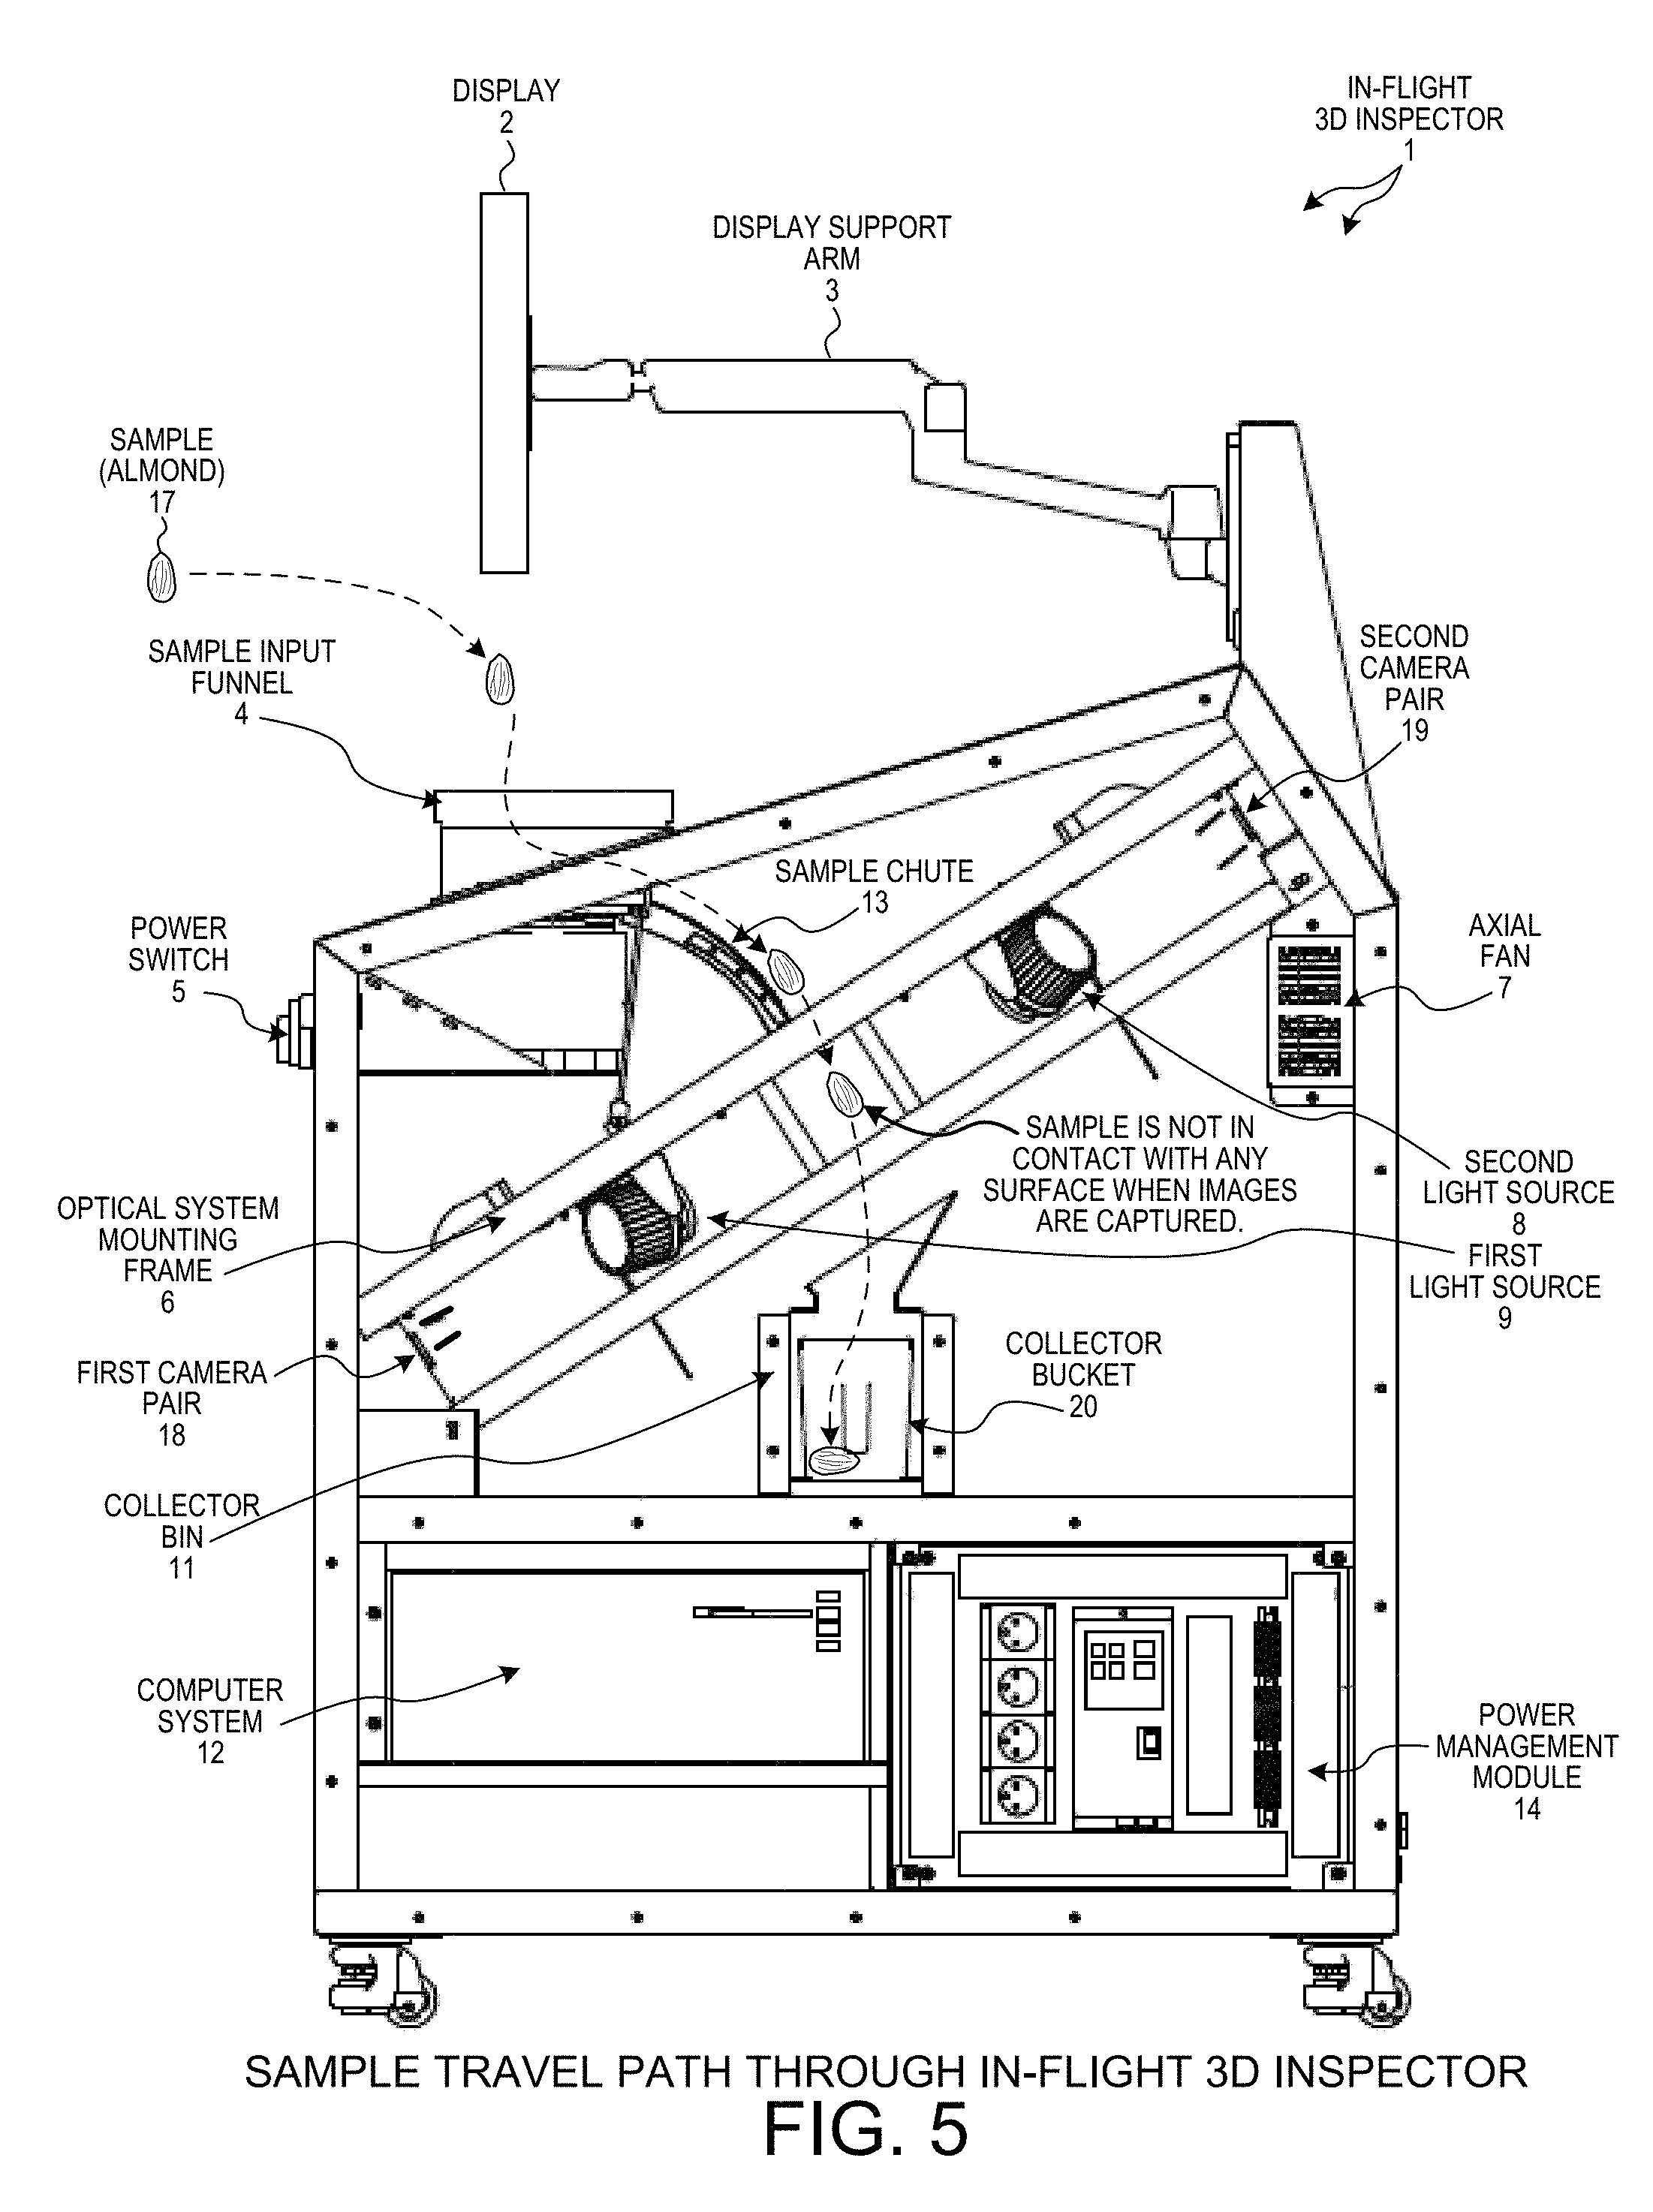
FIG. 5 is a diagram of the in-flight 3D inspector 1 illustrating the path a sample travels through the in-flight 3D inspector 1.
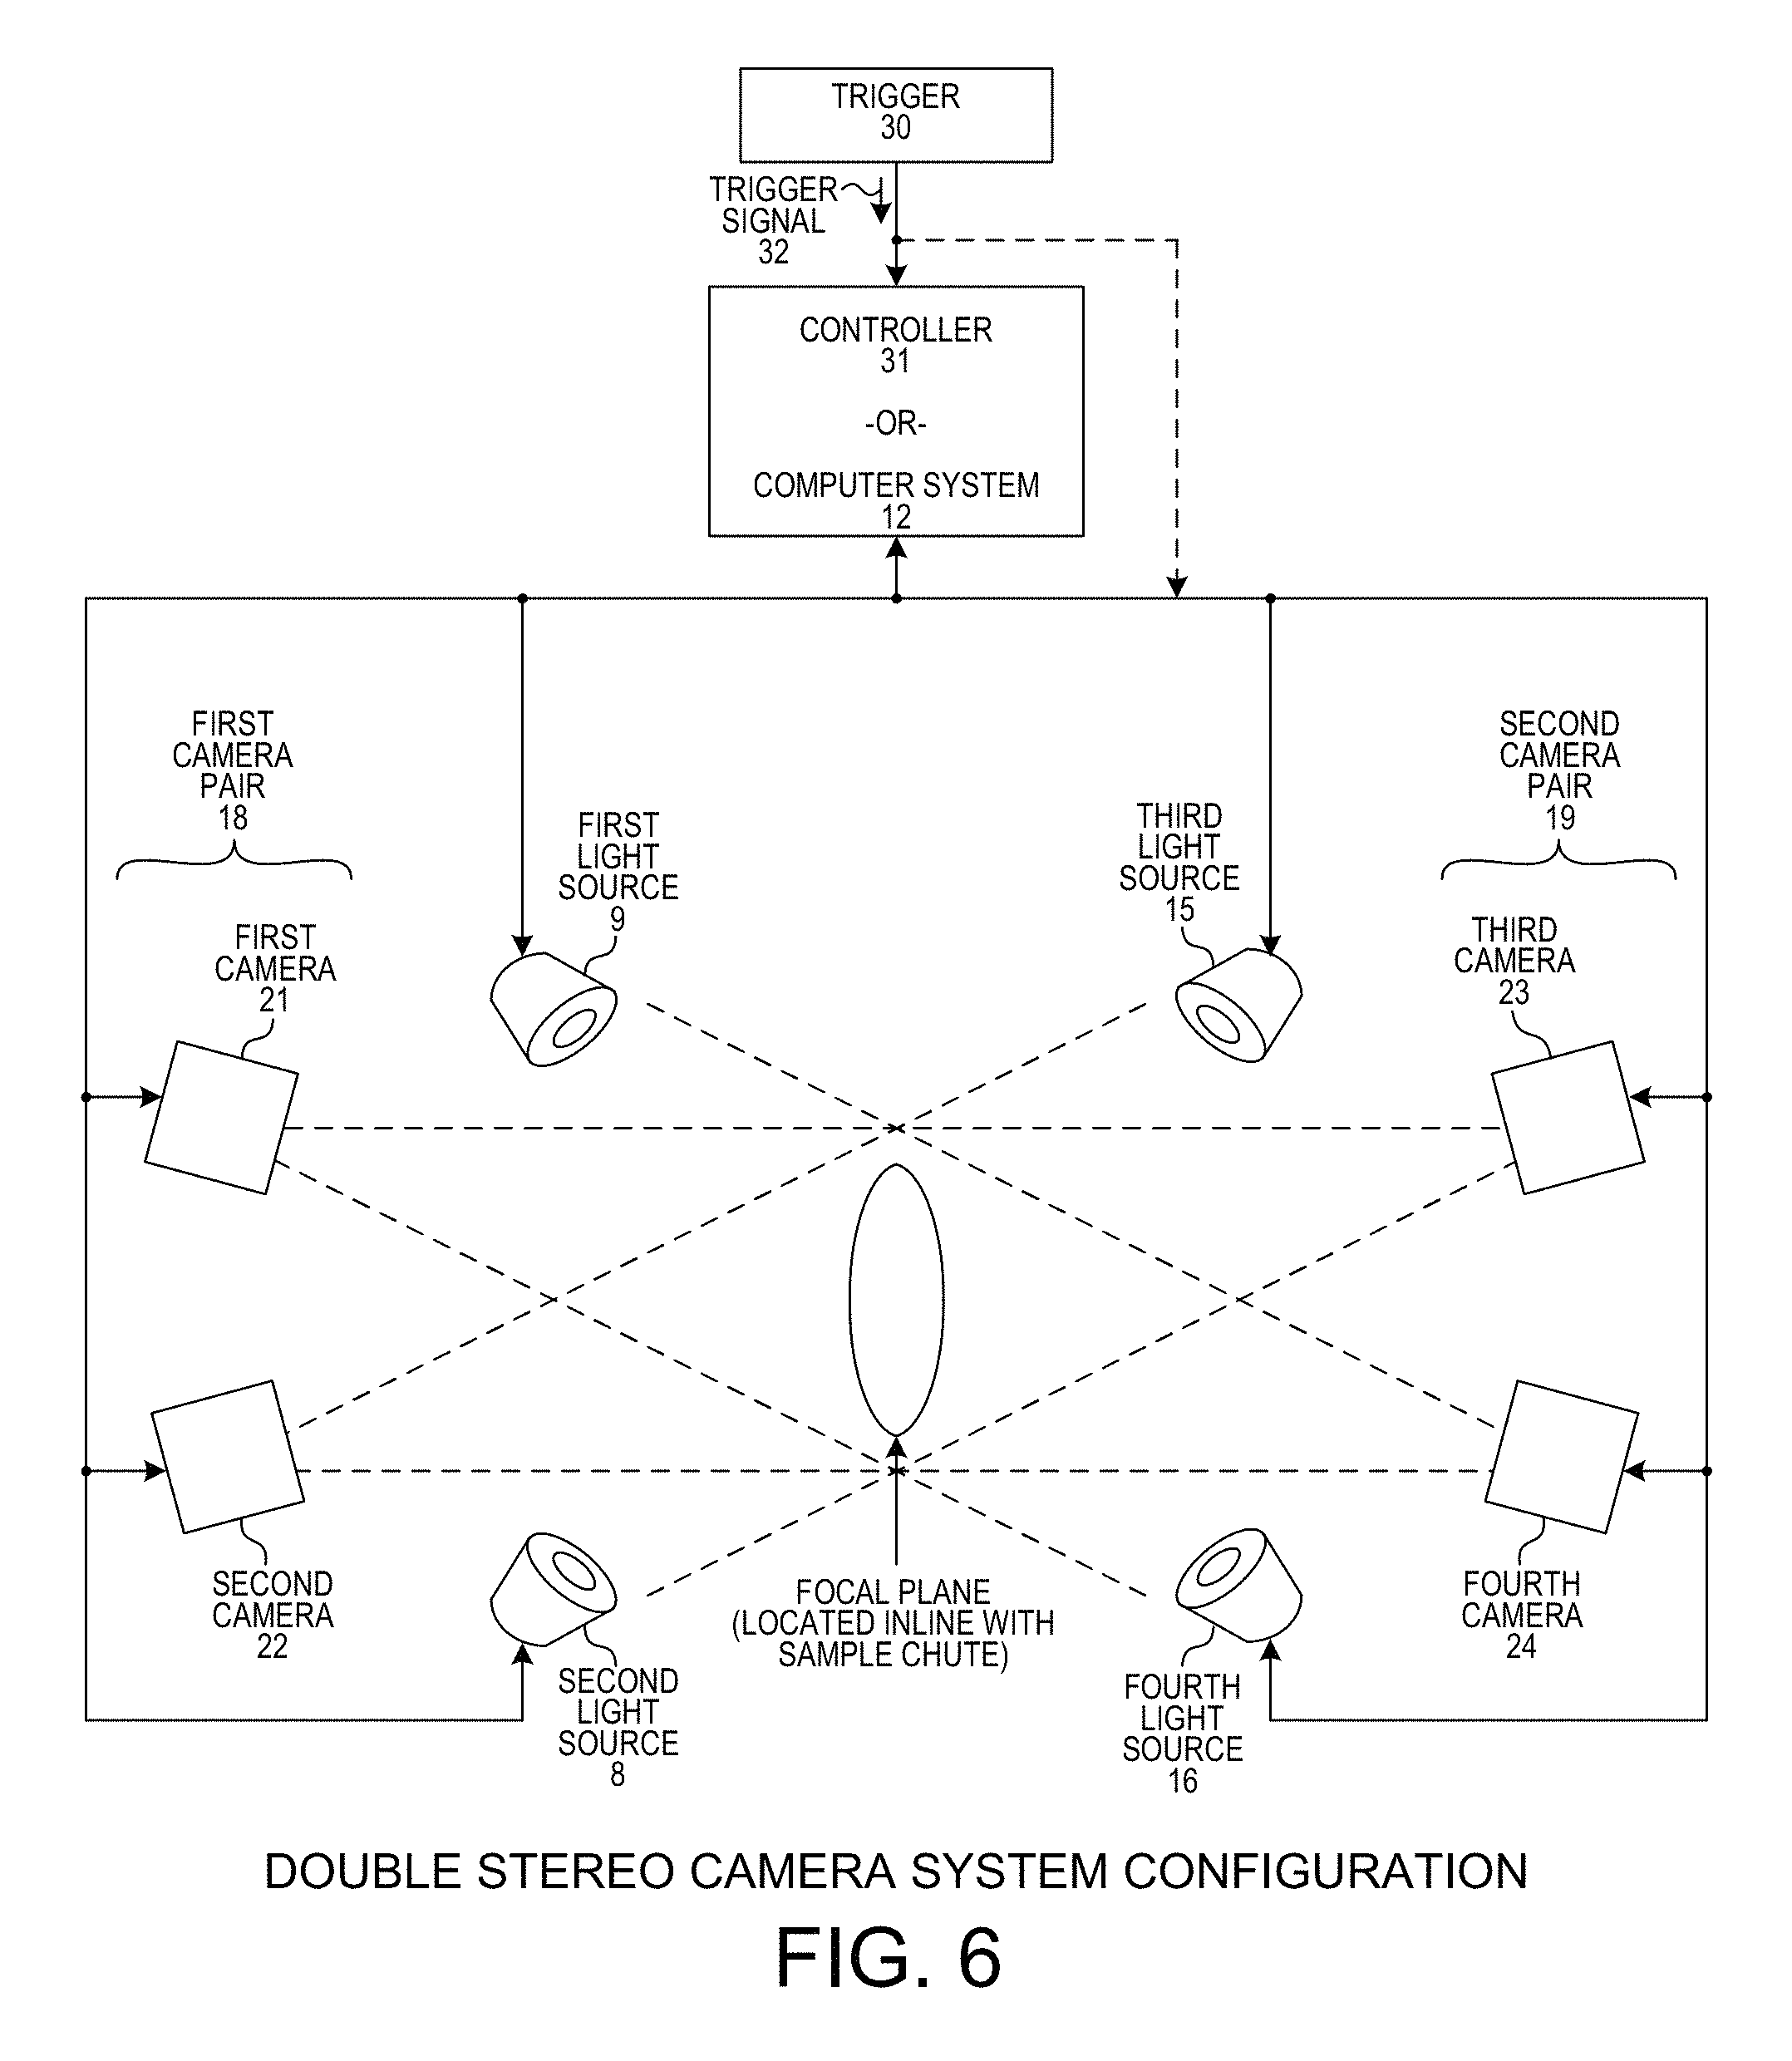
FIG. 6 is a diagram of a double stereo camera system configuration with triggering.
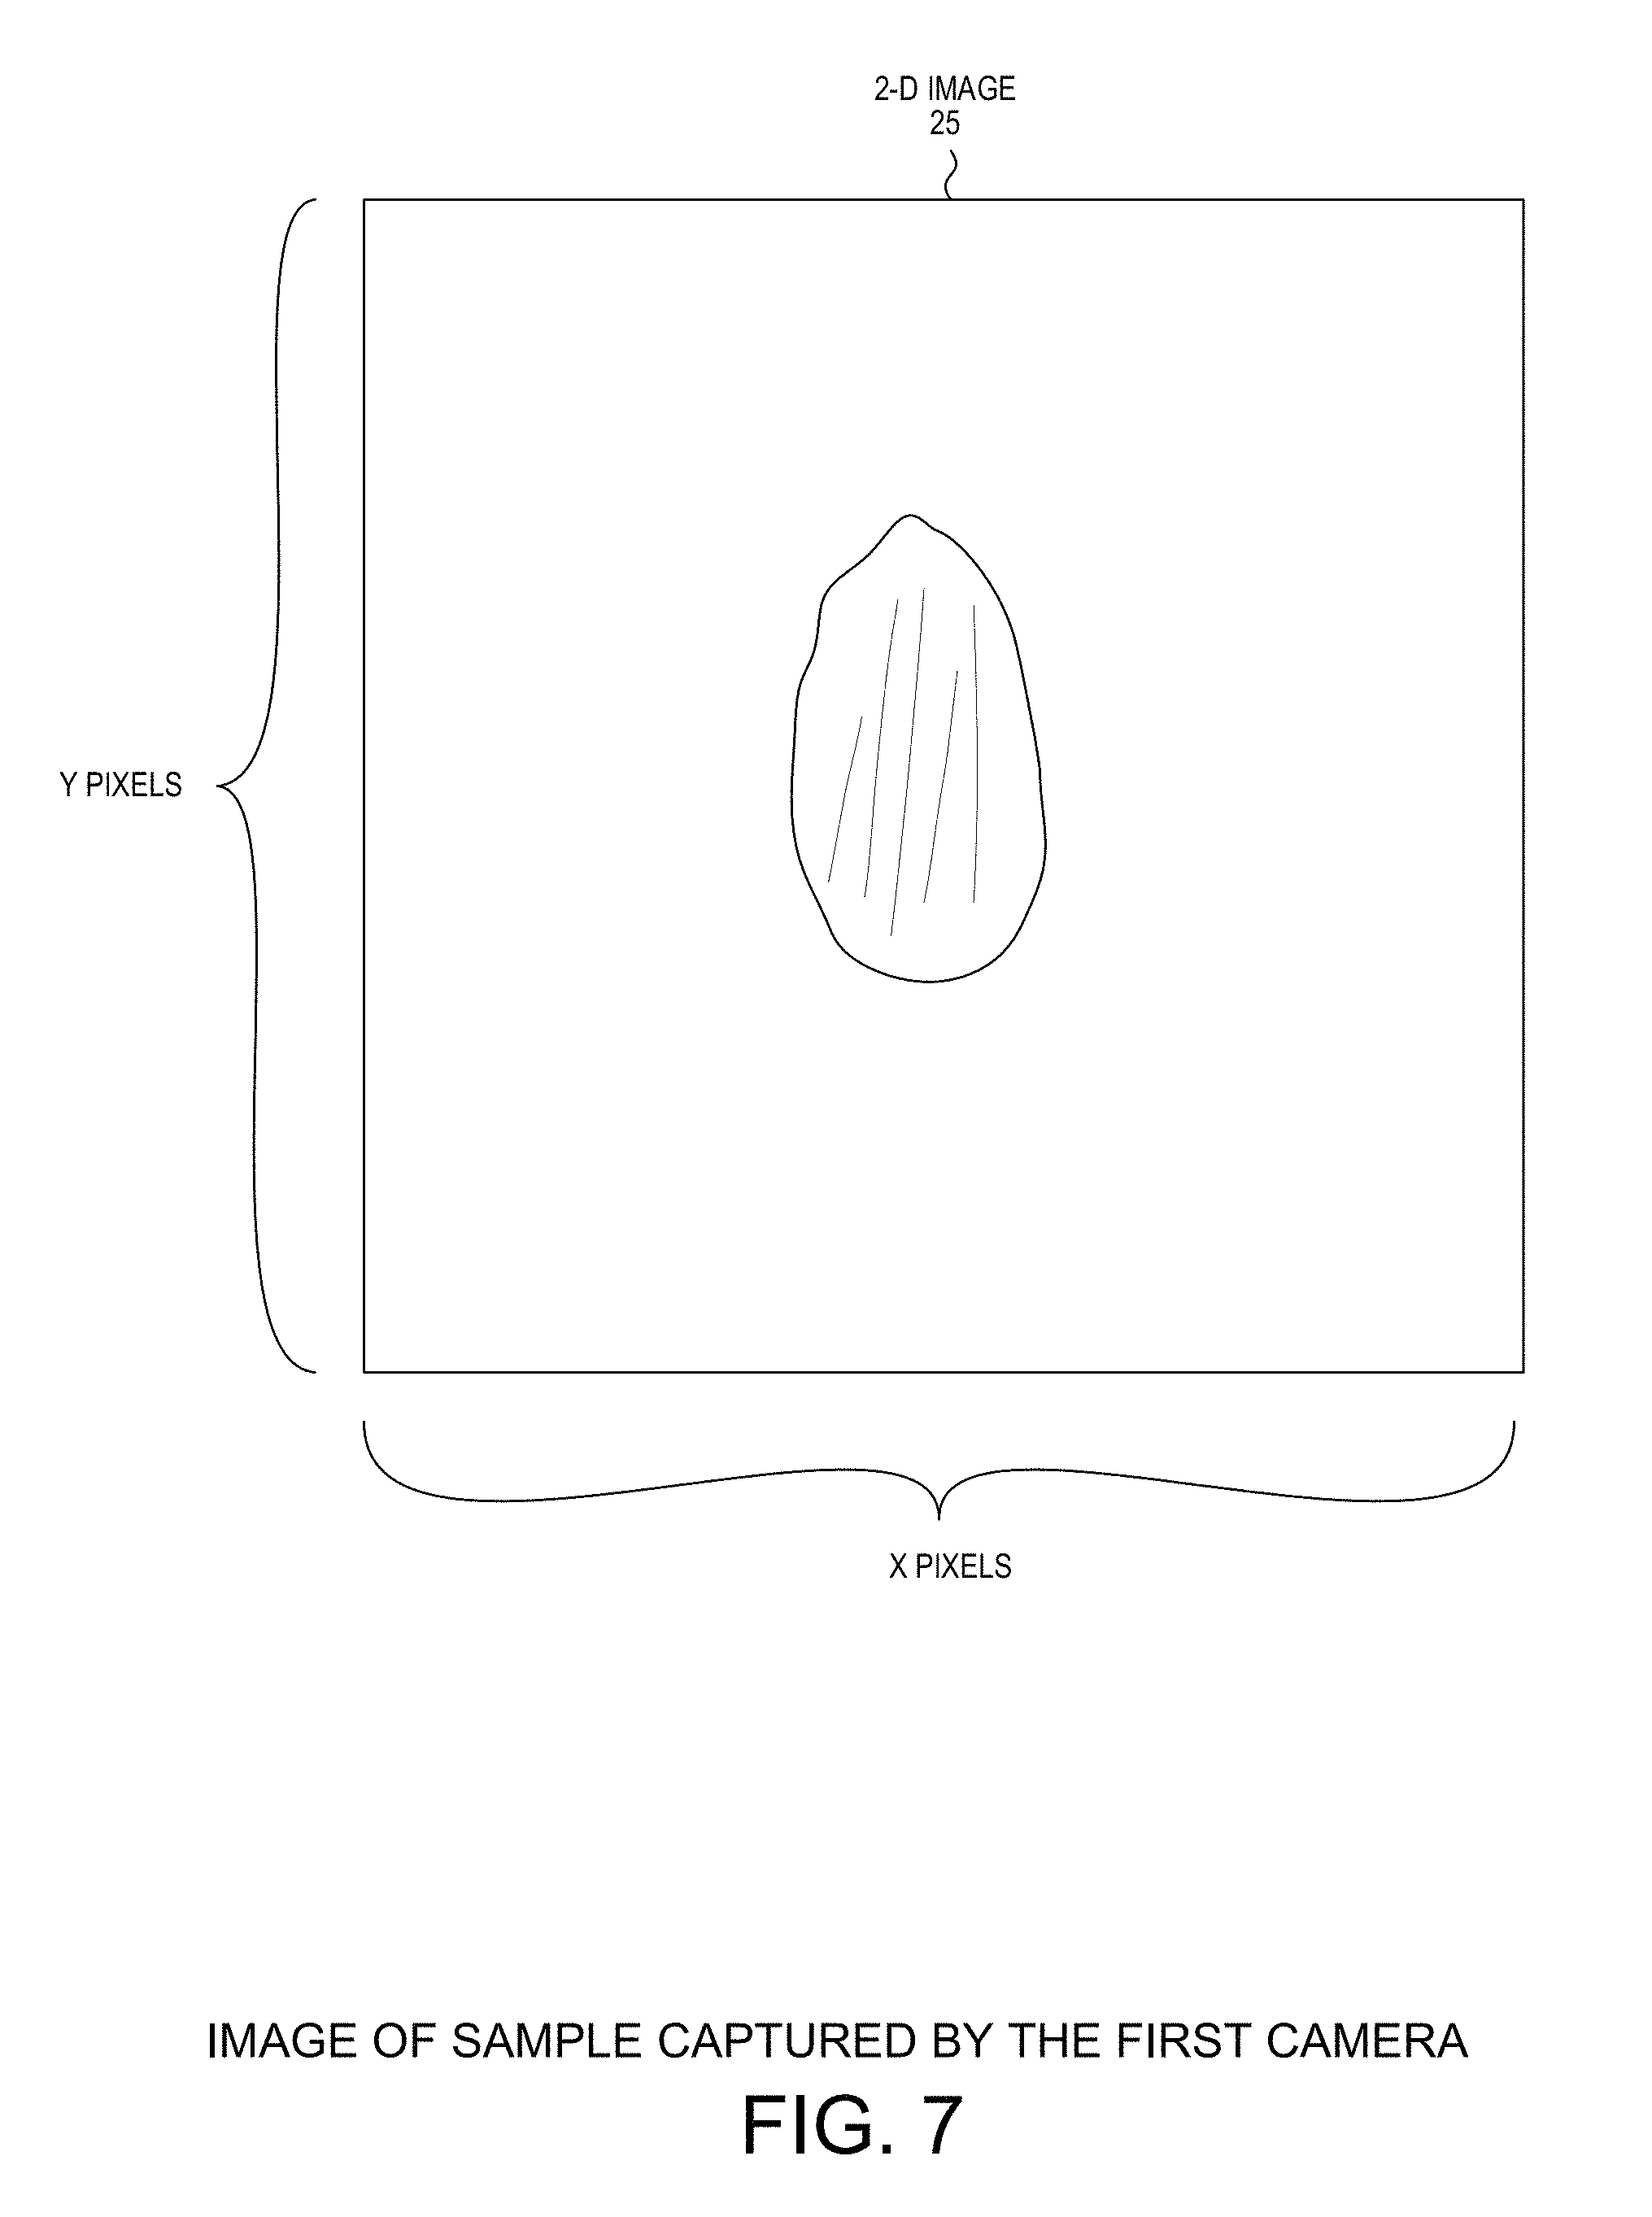
FIG. 7 is an image captured by a first camera of the double stereo camera system.
FIG. 8 is an image captured by a second camera of the double stereo camera system.
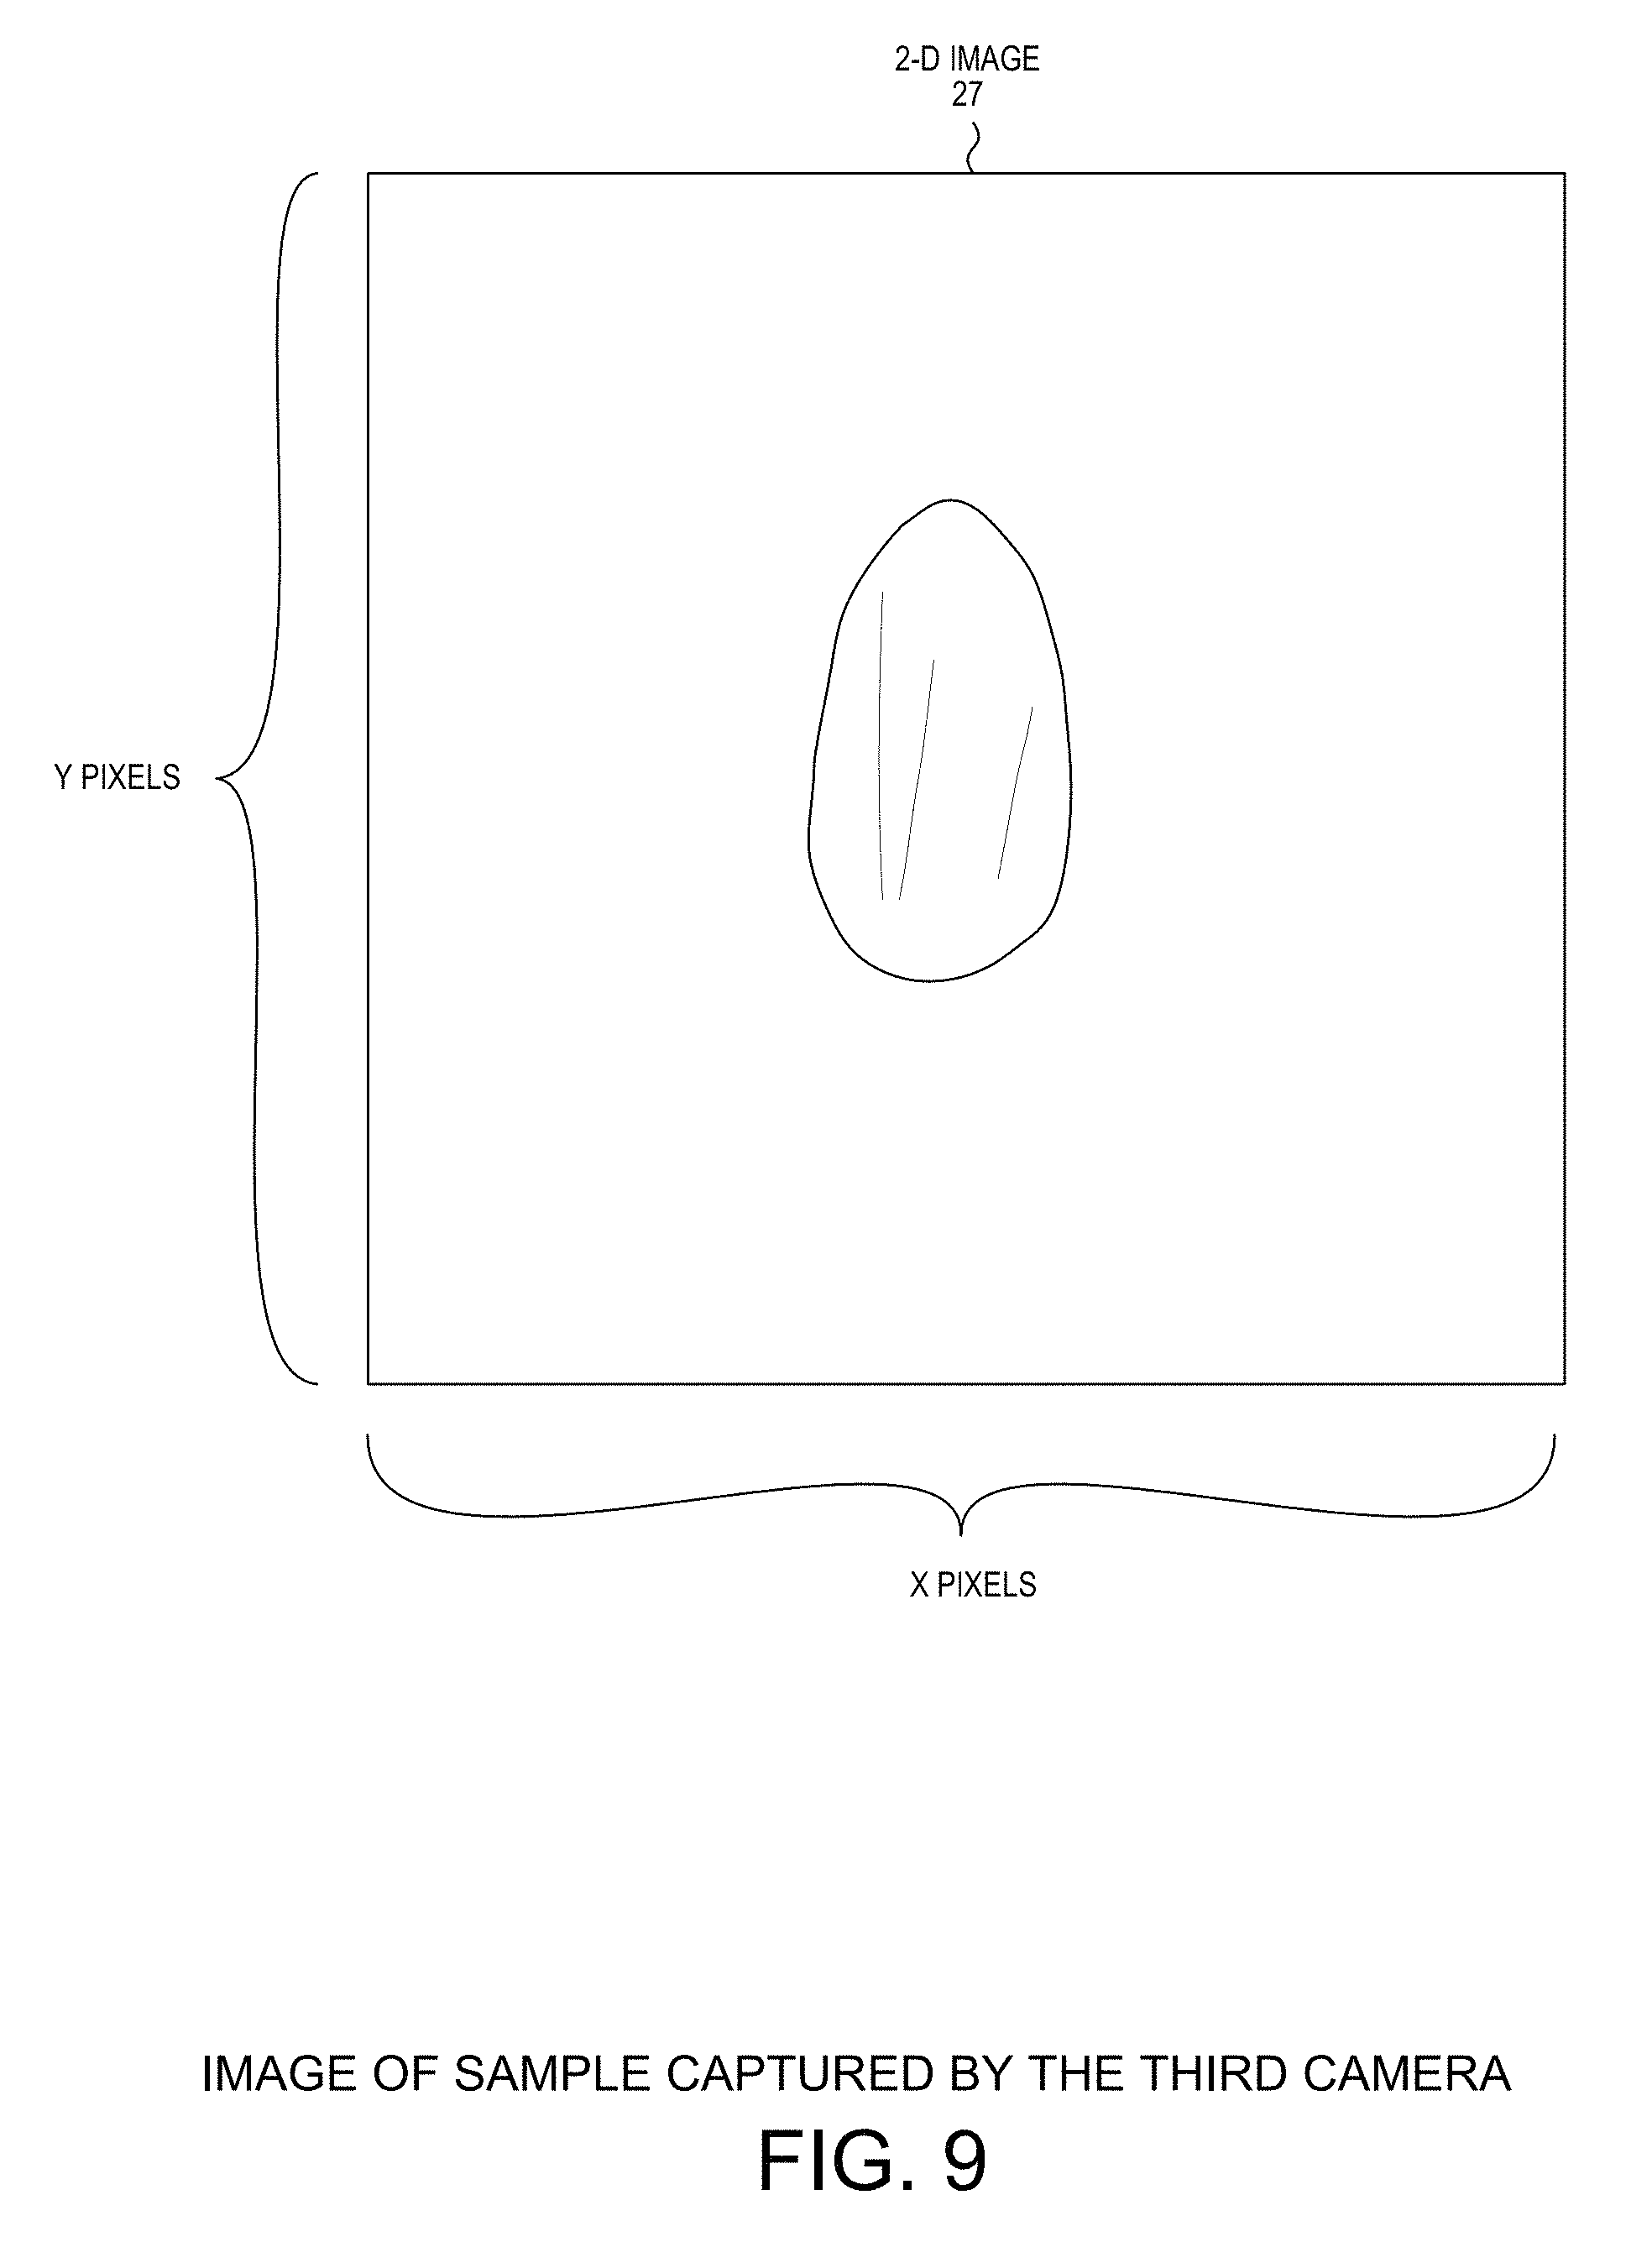
FIG. 9 is an image captured by a third camera of the double stereo camera system.
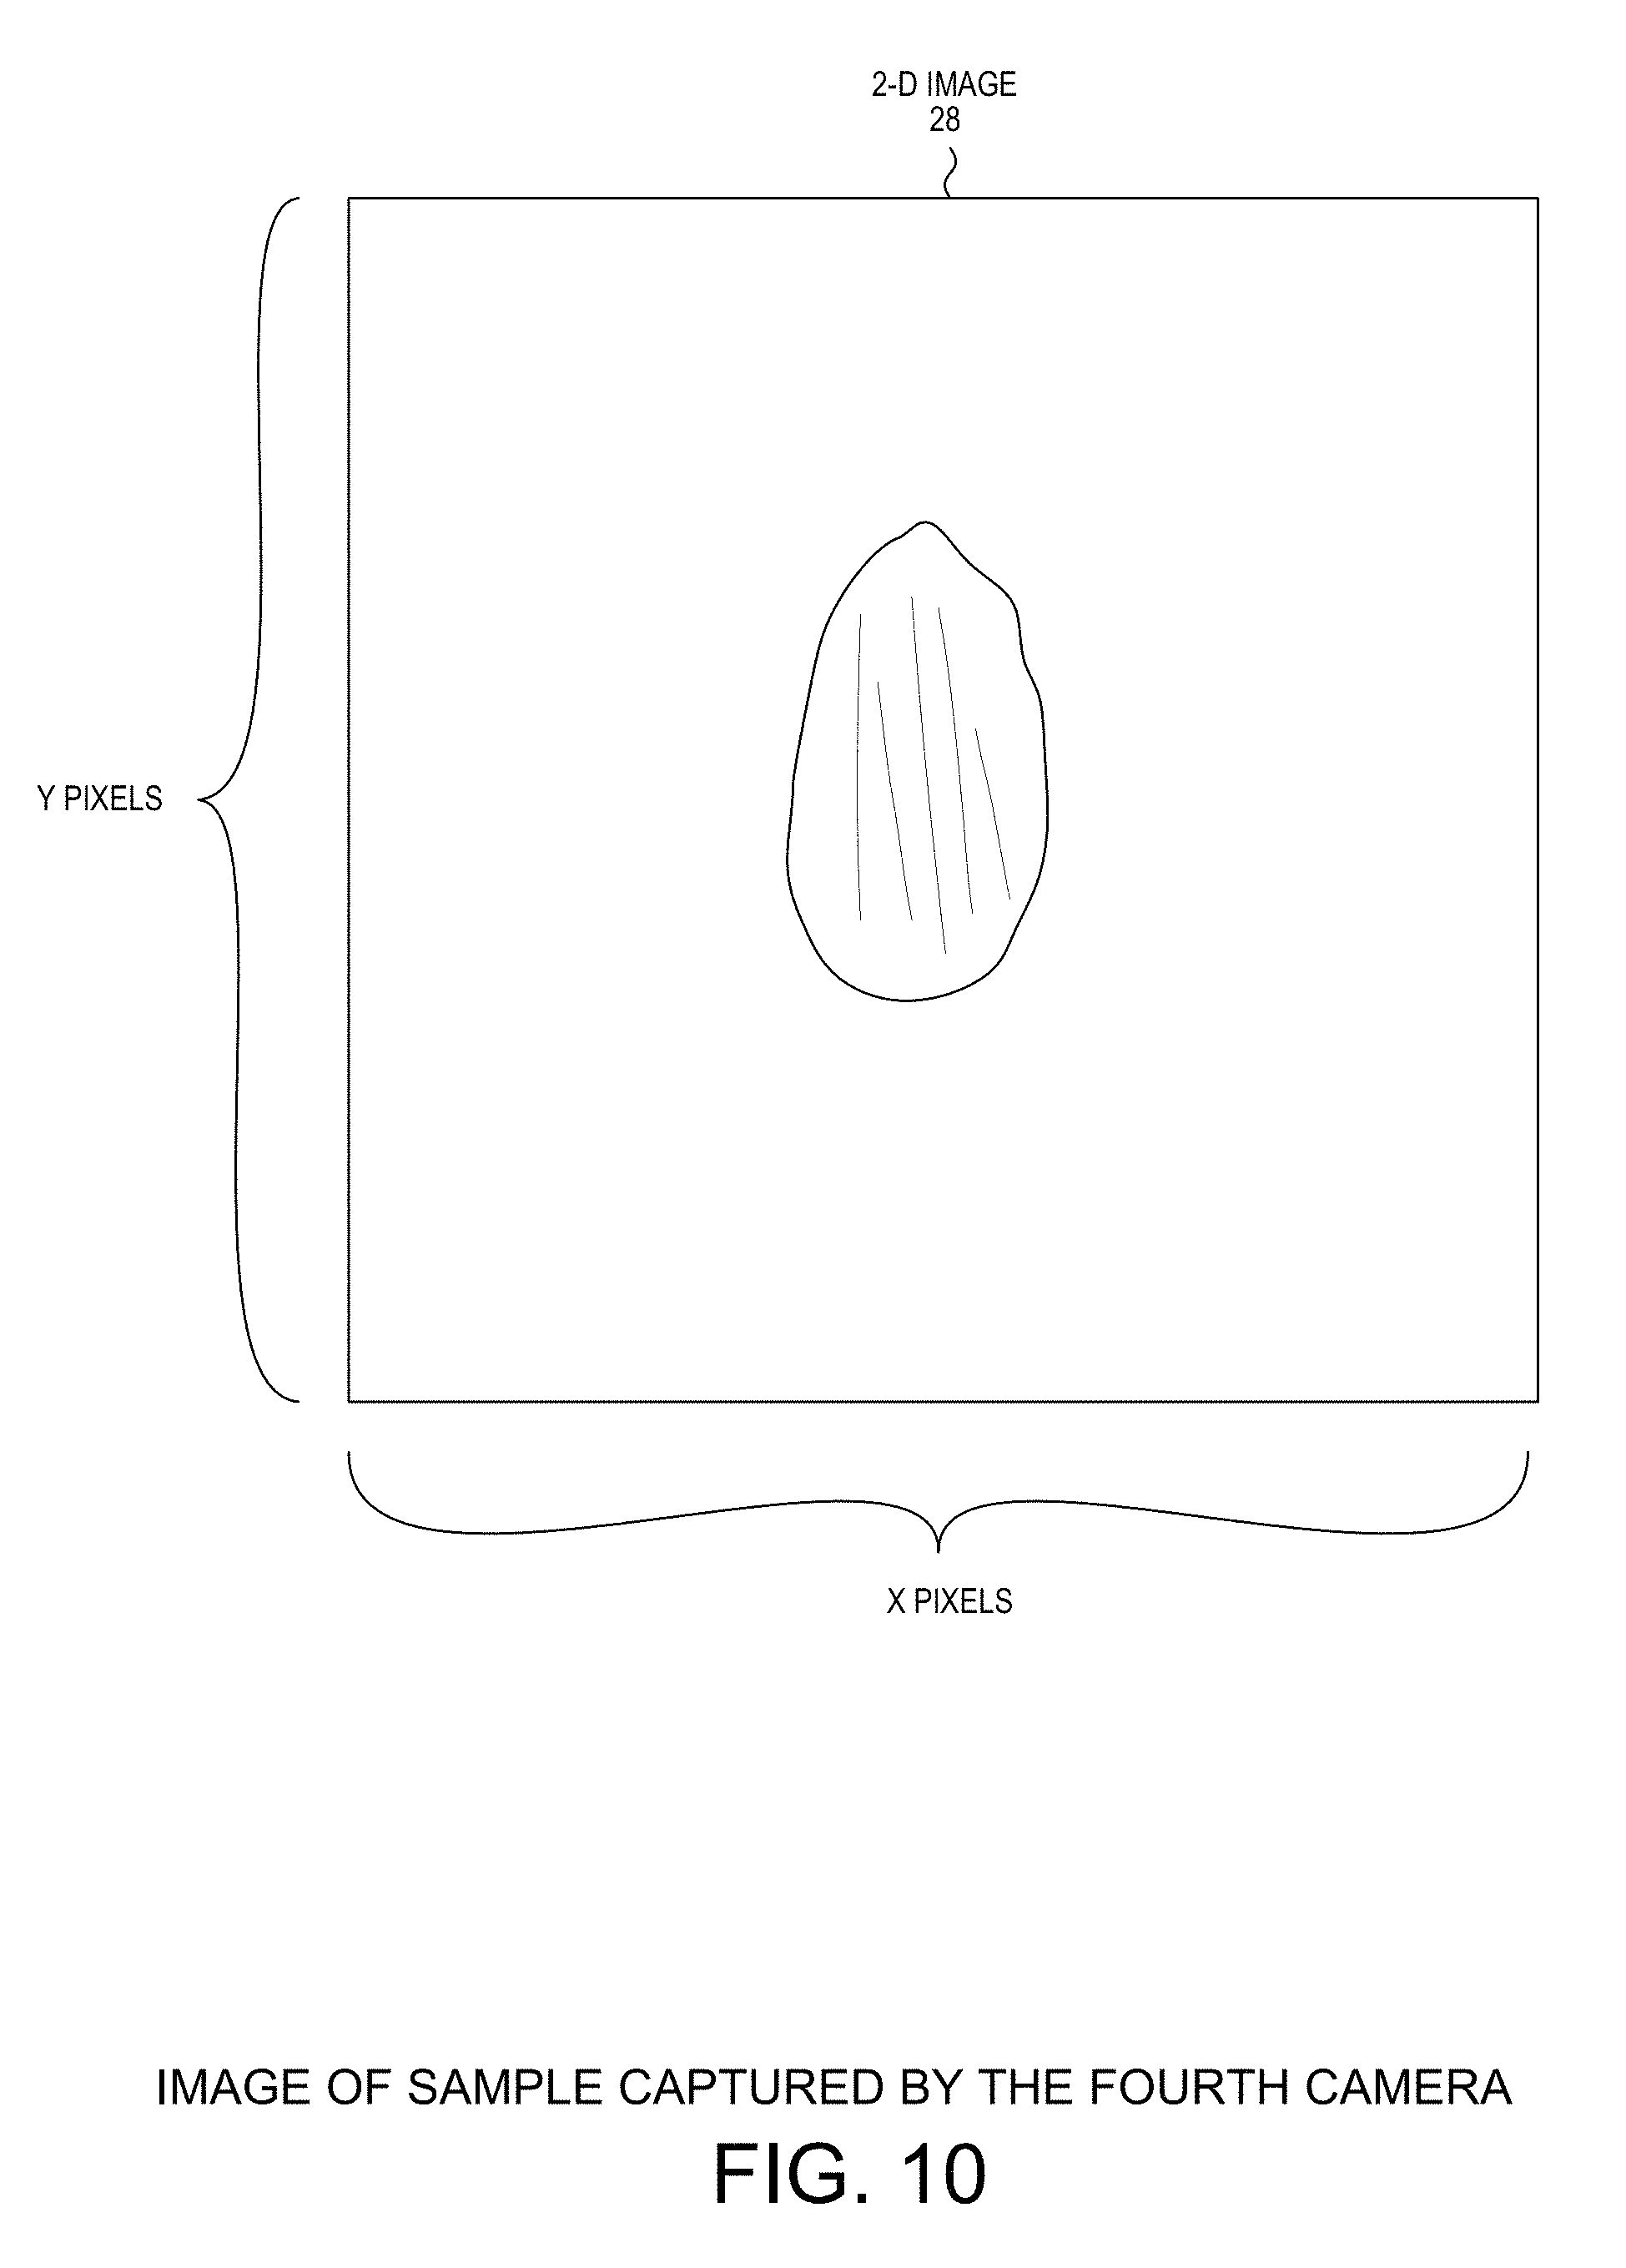
FIG. 10 is an image captured by a fourth camera of the double stereo camera system.
FIG. 11 is a flowchart of an in-flight 3D inspector.
FIG. 12 is a flowchart of an in-flight 3D inspector with defect processing.
FIG. 13 is a diagram of an inspection device.
FIG. 14 is a diagram of an inspection data communication system.
FIG. 15 is a diagram of a command communication system.
FIG. 16 is a diagram of an inspection data control system using a remote computing device.
FIG. 17 is a diagram of an inspection data control system of multiple processing lines using a remote computing device.
FIG. 18 is a diagram of a first example of inspection data.
FIG. 19 is a diagram of a second example of inspection data.
FIG. 20 is a diagram of a third example of inspection data.
FIG. 21 is a diagram of a first example of a command based on inspection data.
FIG. 22 is a diagram of a second example of a command based on inspection data.
FIG. 23 is a diagram of a third example of a command based on inspection data.
FIG. 24 is a flowchart illustrating the operation of an inspection data communication system.
FIG. 25 is a flowchart illustrating the operation of a command communication system.
FIG. 26 is a flowchart illustrating a first example of the operation of an inspection data communication system using a remote computing device.
FIG. 27 is a flowchart illustrating a second example of the operation of an inspection data communication system.
FIG. 28 is a quality inspection data distributed ledger flowchart.
FIG. 29 is a quality inspection data block in a quality inspection distributed ledger.
DETAILED DESCRIPTION
Reference will now be made in detail to background examples and some embodiments of the invention, examples of which are illustrated in the accompanying drawings. In the description and claims below, relational terms such as "top", "down", "upper", "lower", "top", "bottom", "left" and "right" may be used to describe relative orientations between different parts of a structure being described, and it is to be understood that the overall structure being described can actually be oriented in any way in three-dimensional space.
Due to the drawbacks of human visual inspection, an automated inspector is needed to quickly, inexpensively and accurately detect defects present in objects such as tree nuts, tablets, screws and many other types of objects. Some of the most important features of such an automatic inspector include: cost, number of objects inspected per minute, accuracy of defect detection, reliability of defect detection and ease of use with minimal user training.
FIG. 1 is a first diagram of the in-flight 3D inspector 1 view from a first perspective. The in-flight 3D inspector 1 includes a display 2, a display support arm 3, a sample input funnel 4, a power switch 5, an optical system mounting frame 6, an axial fan 7, a first light source 9, a second light source 8, an RJ-45 connector 10, a collector bin 11, and a computer system 12. The display 2 outputs information from the computer system 12 to a human user looking at the display. The display support arm 3 attaches the display 2 to the in-flight 3D inspector 1. In one example, the display support arm is adjustable with two hinges as shown in FIG. 1. In another example, the display support arm 3 is adjustable in additional dimensions (not shown in FIG. 1). The sample input funnel 4 is where samples are input to the in-flight 3D inspector. Power switch 5 is used by a human user to turn on (or off) the in-flight 3D inspector. The light sources are mounted to the optical system mounting frame 6. The axial fan 7 is used to create positive pressure in a camera enclosure (not shown in FIG. 1). In one example, the axial fan 7 is coupled to a first hose that directs air flow to a first camera enclosure and is coupled to a second hose that directs air flow to a second camera enclosure (not shown). The hoses can be fixed or flexible hoses made of various materials including various plastics, fiberglass and metal materials. In this fashion, positive pressure in each camera enclosure is created. The positive pressure prevents debris from entering the camera enclosures and settling on any of the cameras. RJ-45 connector 10 is configured to receive an RJ-45 cable connected to a local network and electrically connect the RJ-45 cable to a network input port included on the computer system 12. The RJ-45 cable may be an ethernet cable (not shown). Via the RJ-45 connector 10 and a RJ-45 ethernet cable, the computer system 12 can connect to a local network or the public Internet. The computer system 12 may also include a wireless networking card (not shown) that allows computer system 12 to wirelessly communicate (i.e. WiFi or cellular connection) with a network without the need for a wired connection. The collector bin 11 is configured to collect samples that have completed their path through the in-flight 3D inspector.
FIG. 2 is a second diagram of the in-flight 3D inspector 1 view from a second perspective. FIG. 2 illustrates a sample chute 13 that is configured to guide a sample from the sample input funnel 4. The location of a power management module 14 is also shown in FIG. 14. The power management module 14 receives input power from the local power grid and generates power signals for the various electrical components operating within the in-flight 3D inspector 1. For example, the power management module 14 generates a power signal that is used to power the various light sources, the various cameras (not shown), the axial fan, the display and the computer system. In one example, the power management module 14 includes a battery which can be used to operate the in-flight 3D inspector when power from the local power grid is lost.
FIG. 3 is a third diagram of the in-flight 3D inspector 1 view from a right side view. FIG. 3 shows a first camera pair 18 and a second camera pair 19. FIG. 3 also illustrates that sample chute 13 is aligned with the midpoint between the first camera pair 18 and the second camera pair 19. The physical arrangement of the first camera pair 18 and the second camera pair 19 is illustrated in FIG. 6. FIG. 6 illustrates that the first camera pair 18 includes a first camera 21 and a second camera 22. The second camera pair 19 includes a third camera 23 and a fourth camera 24. All four cameras are focused on the same focal plane. The focal plane is located at the midpoint between the first camera pair 18 and the second camera pair 19. As discussed above regarding FIG. 3, the chute is also aligned with the midpoint between the first camera pair 18 and the second camera pair 19.
Camera Positioning
The four cameras are positioned such that each camera is focused on the focal plane. Each camera utilizes a lens to focus on the focal plane. In one example, wide angle lenses are used by each camera. One example of a wide angle lens is FL-BC1618-9M Ricoh lens. This wide angle lens has a format size of 1'' format, a focal length of sixteen millimeters, a maximum aperture ratio of 1:1.8, an iris range of 1.8 to 16, and a resolution of nine mega-pixels. Other types of lenses may be used to achieve the necessary focus of each camera on the focal plane.
FIG. 4 is a fourth diagram of the in-flight 3D inspector 1 view from a left side view. FIG. 4 illustrates that a third light source 15 and a fourth light source 16 are also included in the in-flight 3D inspector 1. In one example, the first, second, third and fourth light sources are mounted to the optical system mounting frame 6. In another example, the light sources are mounted directly to outer frame of the in-flight 3D inspector 1 (not shown). After reading of the present disclosure, one skilled in the art will readily appreciate the various ways that light sources and cameras can be physically mounted within the in-flight 3D inspector 1.
FIG. 5 is a diagram of the in-flight 3D inspector 1 illustrating the path a sample travels through the in-flight 3D inspector 1. First, a sample 17 is placed into the sample input funnel 4. The sample input funnel 4 directs the sample 17 to sample chute 13. In one example, the sample input funnel 4 is configured to vibrate such that sample 17 is directed toward sample chute 13. Sample chute 13 directs the sample 17 to a focal plane where the first camera pair 18 and the second camera pair 19 are both focused. In-flight 3D inspector 1 may be used to generate images of various types of samples, such as tree nuts, a peanuts, tablets, screws and washers.
Triggering System
Before the sample 17 reaches the focal plane, a trigger senses the presence of the sample 17 near the sample chute 13 and generates a trigger signal. In one example, the trigger is attached to the sample chute 13 and includes an optical transmitter and an optical receiver. In operation, the sample 17 interferes with the light traveling between the optical transmitter and the optical receiver as sample 17 travels along sample chute 13. This interference in received light is sensed by the optical receiver when the transmitted light does not irradiate the optical receiver. In response to detecting the interference in received light, the trigger generates a trigger signal. The trigger signal can be an electric signal that propagates along a conductor, or the trigger signal can be an electro-magnetic signal that propagates across free space to a receiving terminal. The duration between the time when the trigger signal is generated and the time when the sample 17 intersects the focal plane is based on where the trigger is located relative to the focal plane of the camera pairs. Once the trigger location is selected the duration between the time when the trigger signal is generated and the time when the sample 17 intersects the focal plane can be empirically measured or calculated. Once the duration between when the trigger signal is generated and the time when the sample 17 intersects the focal plane has been determined, the trigger signal can be used to determine the future time when the sample 17 will intersect the focal plane. This timing information can be used to properly control the various light sources and cameras in the in-flight 3D inspector.
The trigger is not shown in FIG. 5. However, a system diagram of the triggering system is illustrated in FIG. 6. FIG. 6 is a diagram of a double stereo camera system configuration with triggering. The triggering system includes trigger 30, controller 31 and/or computer system 12, cameras 21-24 and light sources 8-9 and 15-16. In one example, the trigger signal 32 (i) causes light sources 8, 9, 15, and 16 to turn on, and (ii) causes the first camera pair 18 and the camera pair 19 to capture an image when the sample 17 intersects in the focal plane. In another example, light sources 8, 9, 15 and 16 are already on and the trigger signal 32 only causes the first camera pair 18 and the camera pair 19 to capture an image when the sample 17 intersects in the focal plane.
In a first embodiment, the trigger signal is communicated from the trigger 30 to a controller 31 that controls when the first camera pair 18 and the second camera pair 19 capture images. In a second embodiment, the trigger signal 32 is communicated from the trigger 30 directly to the first camera pair 18 and the second camera pair 19 and causes the camera pairs 18 and 19 to capture images. In a third embodiment, the trigger signal 32 is communicated from the trigger 30 to computer system 12 that controls when the first camera pair 18 and the second camera pair 19 capture images.
In a fourth embodiment, the trigger signal is communicated from the trigger 30 to a controller 31 that controls when the light sources 8-9 and 15-16 are turned on. The controller 31 acts as a switch that connects an output power terminal of a power supply included in power management module 14 to a power input terminal of each light source 8-9 and 15-16. The controller switch turns ON the light sources in response to receiving the trigger signal. After the sample has passed though the focal plane, the controller turns OFF the light sources by disconnecting the output power terminal of the power supply from the power input terminal of each light source.
In a fifth embodiment, the trigger signal 32 is communicated from the trigger 30 directly to the light sources 8-9 and 15-16 and causes the light sources 8-9 and 15-16 to turn ON. In this embodiment, each light source 8-9 and 15-16 is configured to receive a power signal and an ON/OFF signal. The ON/OFF signal is controlled by the trigger signal. The light sources may include a timer circuit that is used to turn OFF the light sources after the sample has passed through the focal plane.
In a sixth embodiment, the trigger signal 32 is communicated from the trigger 30 to computer system 12 that controls when the light sources 8-9 and 15-16 are turn on. In this embodiment, each light source 8-9 and 15-16 is configured to receive a power signal and an ON/OFF signal. The ON/OFF signal is output by the computer system 12 in response to receiving the trigger signal from the trigger.
The light sources may be controlled such that the light sources turn on after the camera shutters are opened and turn off before the camera shutters are closed.
Controller 31 may be configured to communicate with computer system 12 via an RS232 communication link, an ethernet communication link, an Universal Serial Bus (USB) communication link, or any other available data communication links.
When the sample 17 travels through the focal plane, sample 17 is not contacting any surface. At this point in time, the light sources 8-9 and 15-16 are turned on and the first camera pair 18 and the second camera pair 19 capture at least one image of the sample. Each camera captures an image from a unique angle at the same moment in time as the sample travels through the focal plane. FIG. 7 is an image captured by a first camera of the double stereo camera system. FIG. 8 is an image captured by a second camera of the double stereo camera system. FIG. 9 is an image captured by a third camera of the double stereo camera system. FIG. 10 is an image captured by a fourth camera of the double stereo camera system. Each of these images is stored on a memory device located on the in-flight 3D inspector. On one example, the memory device is located within the computer system 12. It is noted that the captured images may only be temporarily stored on a memory device within the in-flight 3D inspector before being communicated across a network to another storage device located outside of the in-flight 3D inspector. For example, the captured images stored on a storage device within the computer system 12 may be communicated across RJ-45 connector 10 and a local network to another storage device not included in the in-flight 3D inspector. In this fashion, multiple images of the sample 17 are captured from four different angles at the same moment while the sample 17 is traveling through the focal plane while not in contact with any surface.
Capturing of images while the sample is not contacting any surface provides a great benefit. When the sample is not contacting any surface, images of each surface of the sample can be collected at the same moment in time. This is not possible in other image capturing systems. For example, when a sample is moved along a conveyer belt image of only one side of the sample may be captured at any one moment in time. View of the other side of the sample is blocked by the conveyer belt and therefore cannot be captured at the same moment in time. Capturing images of all surfaces of the sample at the same moment in time allows for generation of high quality 3D images of the sample. When images of various surfaces of the sample are taken at different moments in time, proper alignment of images is very difficult, requires additional processing and result in 3D images with lower quality due to introduced error.
The cameras communicate the captured images to the controller 31 or computer system 12 via bus. In one example, the bus is an Universal Serial Bus (USB). In another example, the bus is an IEEE 1394 "FireWire" bus.
In one example, the cameras are Charged Coupled Device (CCD) cameras. In another example, the cameras are Complementary Metal-Oxide Semiconductor (CMOS) cameras. In yet another example, the cameras are Indium Gallium Arsenide (InGaAs) cameras that are capable of measuring Short Wave Infra Red (SWIR) light.
Either line scan cameras and area scan cameras can be used to implement an in-flight 3D inspector. A line scan cameras contain a single row of pixels used to capture data very quickly. As the object moves past the camera, a complete image can be reconstructed in software line by line. Area scan cameras contain a matrix of pixels that capture an image of a given scene. They are more general purpose than line scan cameras, and offer easier setup and alignment.
It is noted herein that the light sources may each include a separate power source that drives the light when a control signal is received. Alternatively, each light source may be configured in an always on state where the power input terminal on each light source is coupled to an output terminal of a power supply where the output of the power supply is controlled by a control signal.
It is noted that the sample chute 13 is only one example how the sample can be directed to the focal plane. In a first alternative embodiment, the sample can be directed to the focal plane by use of a conveyer belt. In this first alternative embodiment, the sample would be directed from the sample input funnel to the conveyer belt, which in turn would propel the sample off the edge of the conveyer belt toward the focal plane. In a second alternative embodiment, the sample can be directed to the focal plane by use of an airburst. In this second alternative embodiment, the sample would be directed proximate to an airburst source, which in turn would propel the sample toward the focal plane. One example of an airburst source is a highly pressurized air tank connected to an electronically controlled valve, which outputs an airburst momentarily while the valve is open.
Sample Collection/Sorting
Once the sample 17 passes the focal plane, the sample 17 falls into collector bin 11. In one example, a collector bucket 20 is placed in collector bin 11. In this example, the sample 17 falls into the collector bucket 20. Additional samples placed into sample input funnel 4 make their way through the in-flight 3D inspector and eventually also fall into collector bucket 20. Once all samples have passed through the in-flight 3D inspector, a user can remove all samples by removing the collector bucket 20 from the collector bin 11.
In another example, a collector bucket 20 is not placed in collector bin 11. Rather, collector bin 11 is coupled to a sample sorting machine (not shown). In this example, the samples that pass through the in-flight 3D inspector are routed into different bins. The bin each sample is routed into is based on the images captured of the sample. In the event that the images of the sample indicate that the sample has a first type of defect, then the sample is routed to a first bin. In the event that the images of the sample indicate that the sample has a second type of defect, then the sample is routed into a second bin. Alternatively, in the event that the images of the sample indicate that the sample does not have any defects, then the sample is routed to a third bin. The sorting machine can route the samples using various different methods. A first method of routing includes using a burst of air to redirect the trajectory of a sample as it falls into the collector bin. A second method of routing includes using a mechanically controlled flap to redirect the trajectory of a sample as it falls into the collector bin.
3D Image Generation
Once the images are captured from each of the cameras, a 3D image of the sample can be created. In one example, the 3D image is generated by the computer system 12 included in the in-flight 3D inspector. In another example, the 3D image is generated by another computer system not included in the in-flight 3D inspector after the images are communicated across a network from the in-flight 3D inspector to the computer system not included in the in-flight 3D inspector.
The images captured by the first camera pair 18 are used to create a 3D image of a first side of the sample. The images captured by the second camera pair 19 are used to create a 3D image of the second side of the sample. In one example, data included in the captured 2D images are combined into a new dataset and missing information is added to complete the 3D information of the object: depth (distance). By using triangulation on matching pixels of the multiple 2D images captured by the in-flight 3D inspector, the depth component is derived and added to the dataset. This new dataset describes the object in 3D. This dataset is then used by advanced mathematical algorithms to describe the characteristics of the objects. The 3D images of the first and second sides of the sample are combined to create a 3D image of the entire sample. Once the 3D image of the entire sample is constructed, the 3D image can be analyzed to determine if various types of defects are present on the sample. For example, if the 3D image does not match a predetermined shape within a specified tolerance, then the sample is determined to be defective with respect to shape. In another example, if the 3D image shows a flat surface greater than a specified area, then the sample is determined to be defective with respect to surface contour.
Once the defect information is determined based on the 3D image of the sample, the defect information is stored with the 3D image. The defect information can be displayed on display 2 to a user of the in-flight 3D inspector. The defect information can also be used to generate a report indicating the number of defects detected across a multiple samples that have been inspected. The defect information for each sample can be used by a sorting machine attached to the collector bin 11 of the in-flight 3D inspector to determine how the sample is to be routed. The defect information for multiple samples can be used to generate a quality report indicating the quality grade of the multiple samples.
Various calibrations of the cameras may be performed. An internal calibration may be performed for each camera. Internal calibration includes calibration of principle points, focal lengths, pixel size ratios, and radial parameters. A stereo calibration may be performed as well. A stereo calibration addresses the external 3D rotation and translation between individual cameras of a stereo system. An inter-stereo calibration may also be performed to address the external 3D rotation and translation between the two stereo systems. In an inter-stereo calibration, a transformation is performed that stitches two different side reconstructions into one 3D model.
Capturing Images of Multiple Samples in a Single Image
The single sample chute 13 illustrated in FIG. 5 illustrates one embodiment of the present invention. In another embodiment (not shown in FIG. 5) the sample chute may be configured to direct multiple samples through the focal plane at the same moment in time. In this embodiment, the sample chute would cause multiple samples to fall through the focal plane along a single axis at the same time. Aligning the samples along a single axis prevents one sample from blocking a camera's view of another sample. The first and second camera pairs would then capture an image including multiple samples instead of just one. Said another way, a single image would include multiple samples instead of just one. Once the images of the multiple samples are captured, the computer system 12 would (i) determine which portions of each image are of each sample, and (ii) only use the portions of each image that are of the same sample to generate the 3D image of the sample.
This configuration would greatly accelerate the rate at which the in-flight 3D inspector can capture images of multiple samples. For example, if the sample chute directed ten samples through the focal plane as the same time instead of only one sample, then the in-flight 3D inspector would be able to collect images of samples ten times faster. Said another way, the in-flight 3D inspector would only require one-tenth the amount of time to collect images of a set of samples.
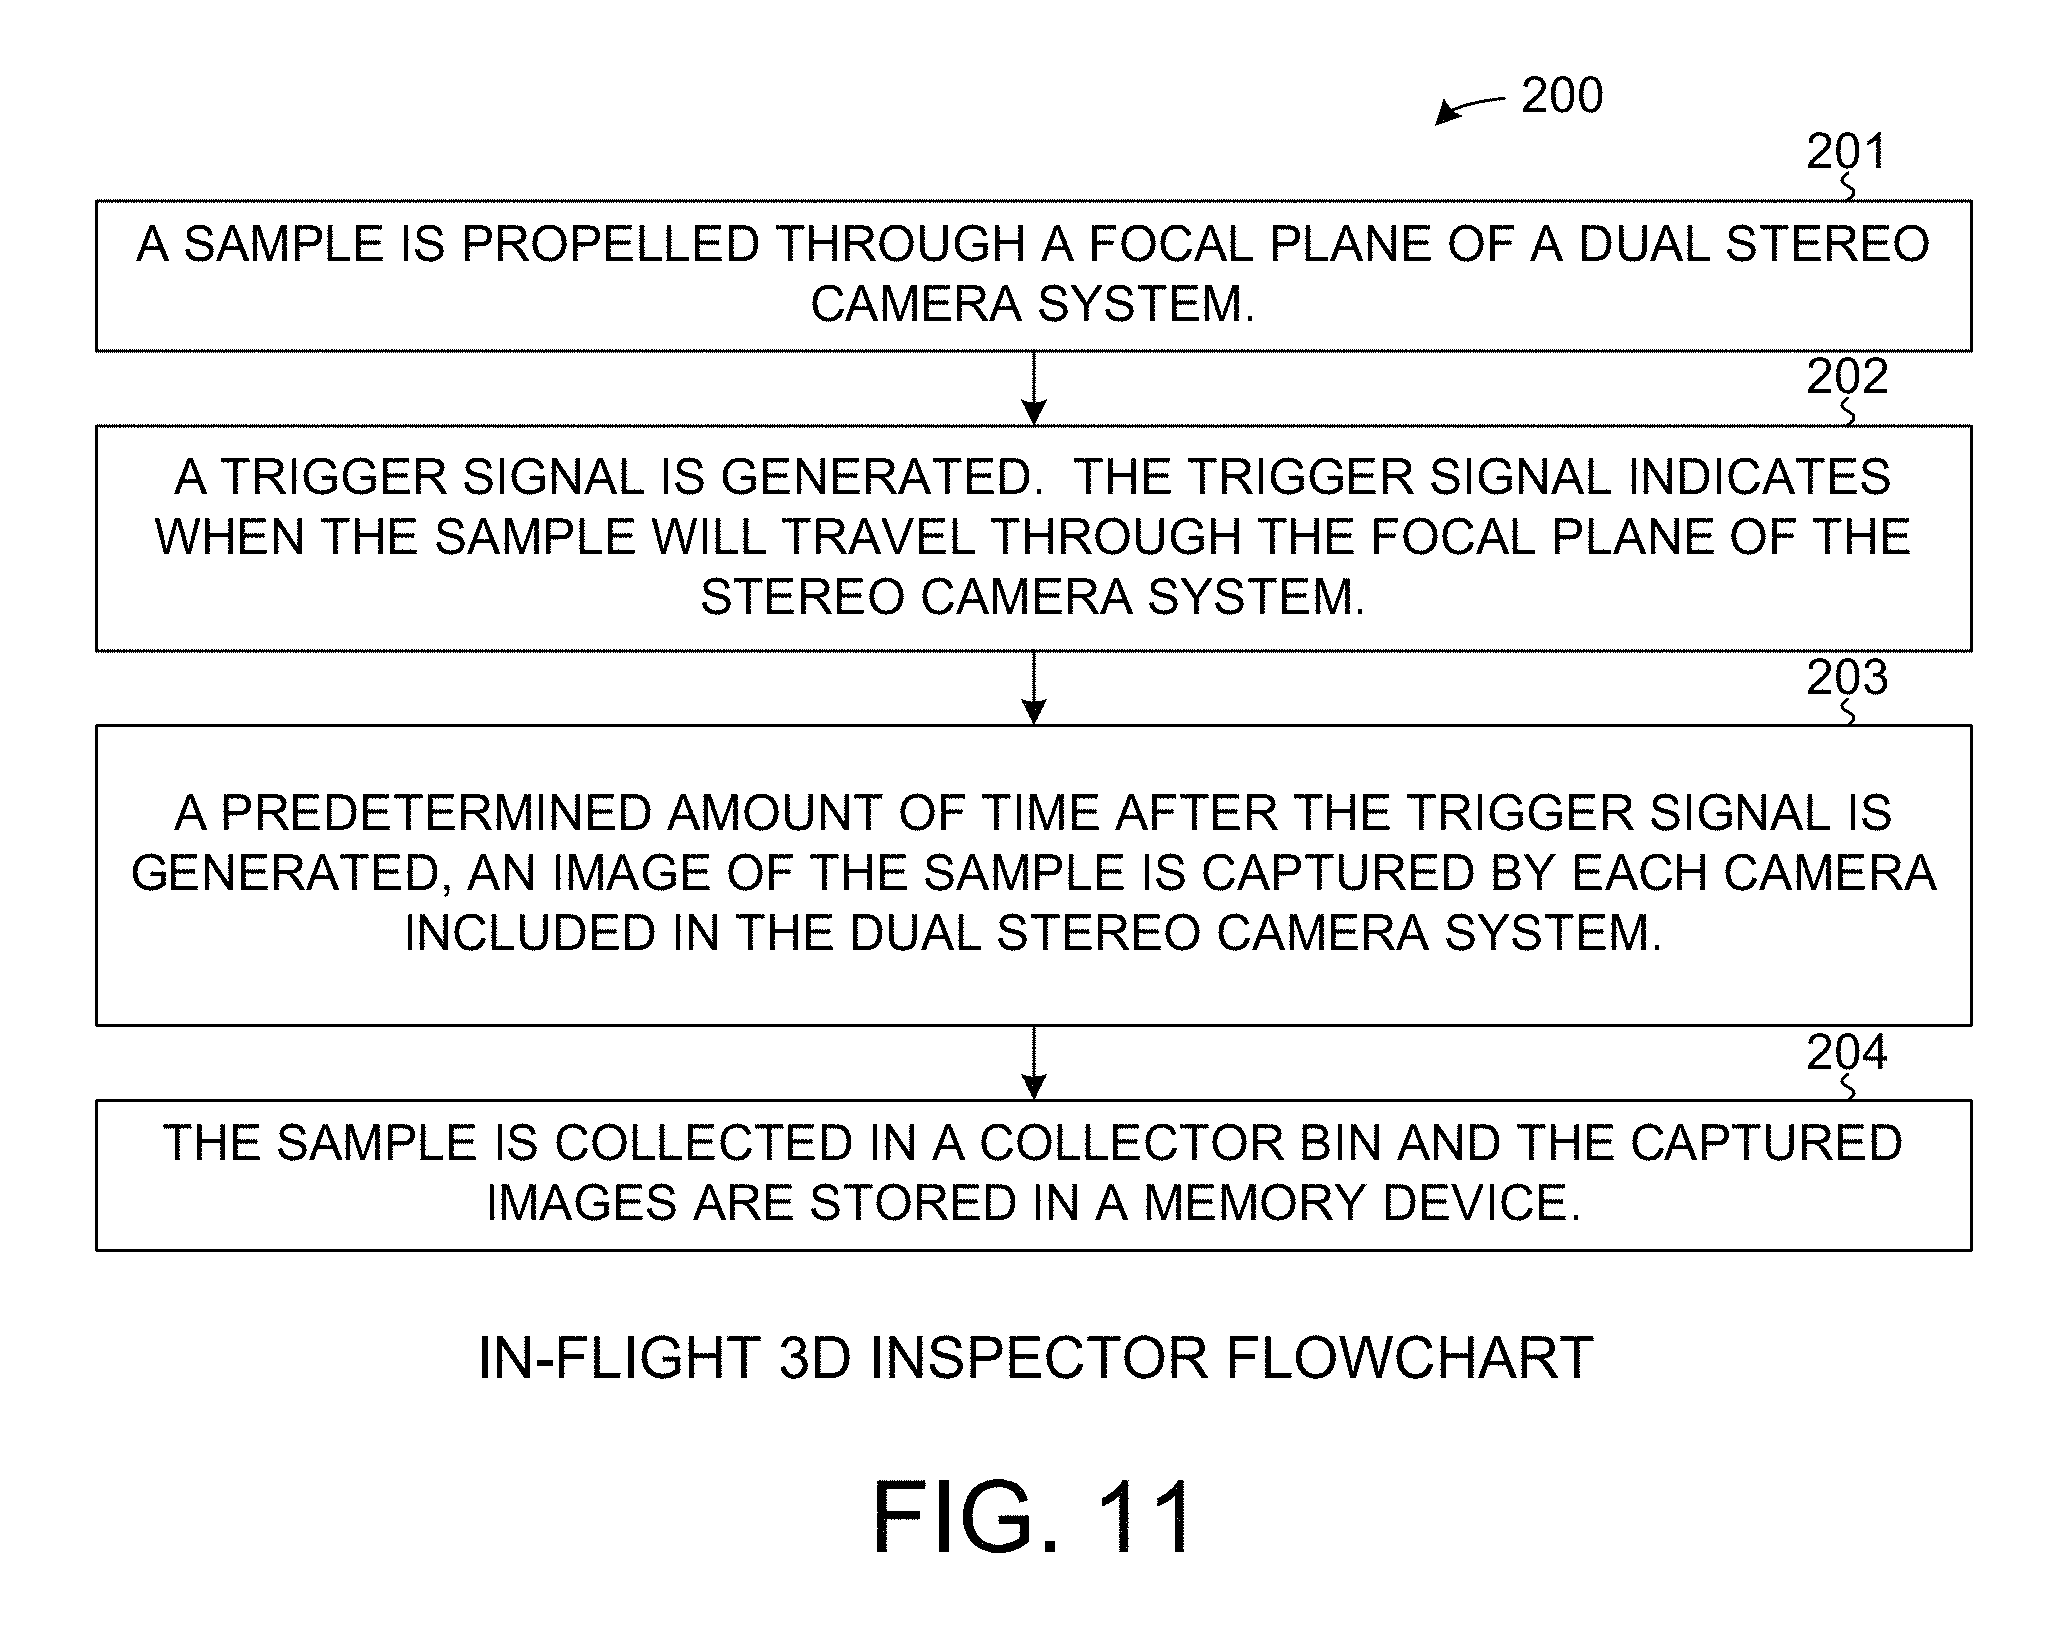
FIG. 11 is a flowchart 200 of an in-flight 3D inspector. In step 201, a sample is propelled through a focal plane of a dual stereo camera system. In step 202, a trigger signal is generated. The trigger signal indicates when the sample will travel through the focal plane of the stereo camera system. In step 203, a predetermined amount of time after the trigger signal is generated, an image of the sample is captured by each camera included in the dual stereo camera system. The sample is illuminated by a light source while the image of the sample is captured. In step 204, the sample is collected in a collector bin and the captured images are stored in a memory device.
FIG. 12 is a flowchart 300 of an in-flight 3D inspector with defect processing. In step 301, a sample is propelled through a focal plane of a dual stereo camera system. In step 302, a trigger signal is generated. The trigger signal indicates when the sample will travel through the focal plane of the stereo camera system. In step 303, a predetermined amount of time after the trigger signal is generated, an image of the sample is captured by each camera included in the dual stereo camera system. The sample is illuminated by a light source while the image of the sample is captured. In step 304, the sample is collected in a collector bin and the captured images are stored in a memory device. In step 305, the captured images are stitched together to generate a 3D image of the sample. In step 306, the 3D image of the sample is used to determine one or more characteristics of the sample.
Various Numbers of Cameras can be Used
The two pairs of cameras 18-19 discussed above are used in a first embodiment of the present invention. In other embodiments, various other numbers of cameras may be used. For example, in another embodiment, the in-flight 3D inspector may include only one pair of stereo cameras that capture two images of the sample and the images are used to construct a 3D image of the sample from only one point of view. In another embodiment, three pairs of stereo cameras can be used to capture six images of the sample and the images are used to construct a 3D image of the sample from three points of view. After review of this disclosure, the reader will appreciate that additional cameras will provide additional accuracy of the 3D image created by the in-flight 3D inspector.
Inspection Device Controlled Processing Line System
FIG. 13 is a diagram of an inspection device 400. Inspection device 400 includes a processor 401, a storage device 402, an interface circuit 403, an optical device 404 and/or other sensors 405. The various parts of inspection device 400 communicate with each other across a bus 406. On skilled in the art will note that various known bus architectures can be used to implement inspection device 400. One example of a bus architecture is Peripheral Component Interconnect Express (PCIe), which provides standardized communication between various device components. However, many other possible options exist, such as: Ethernet for Control Automation Technology (EtherCAT), Ethernet Industrial Protocol (EtherNet/IP), Process Field Net (PROFINET), Ethernet Powerlink, Third Generation of the Sercos Interface (SERCOS III), Control and Communication Link (CC-Link IE), and Modbus/TCP, Modbus, Sinec H1, Process Field Bus (Profibus), Controller Area Network Protocol (CANopen), DeviceNet, and FOUNDATION Fieldbus. One example of a processor is an intel x86 processor. One example of a storage device is a NAND flash based solid state drive. One example of an interface circuit is a Network Interface Card (NIC) that communicates across a physically connected cable to a network switch or router. Another example of an interface circuit is a Wireless Network Interface Controller (WNIC) that communicates across standards such as WiFi (802.11 protocols), Bluetooth and other such protocols. Another example of an interface circuit is a cellular communication device that communicates across cellular networks that use protocols such as GSM, WCDMA, CDMA2000, LTE, etc. An example of an optical device is a high shutter speed, high resolution digital camera that is controllable by a computer across a standardized data port, such as USB. Other examples of optical devices include, but are not limited to, millimeter wave cameras, Near-Infr-Red (NIR) cameras, hyper-spectral cameras, and x-ray cameras. Other sensors 405 may include audio, electromagnetic, and odor sensors that are controllable by a computer across a standardized bus, such as USB. Other examples of sensors include, but are not limited to weight scale sensors, proximity sensors, temperature sensors, humidity sensors, texture sensors, and moisture sensors.
FIG. 14 illustrates an inspection data communication system. The inspection data communication can be between inspection device 412 and upstream slave device 411 or between inspection device 412 and downstream slave device 413. The terms upstream indicates that sample pass through the slave device before passing through the inspection device 412. The term downstream indicates that samples pass through the inspection device 412 before passing through the salve device.
It is noted herein, that a slave device is any device located along the sample processing line. Examples of a slave devices includes, but is not limited to: a sorting device, a mixing device, a display device, a sizing device, a blanching device, a feeding device, a cutting, a slicing device, a baking device, a drying device, a freezing device, a coating device, a washing device.
In one scenario, a sample passes through the slave device 411 and then passes through the inspection device 412. Within the inspection device 412, the optical device 404 of the inspection device 400 is triggered by the processor 401 to capture an image. The triggering by the processor 401 is executed when a sample is within the field of view of the optical device 404. The image captured by the optical device 404 is then stored into storage device 402. The processor 401 then processes the captured image and determines one or more quality characteristics of the sample in the captured image. Many different quality characteristics may be determined from the captured image. Some examples of possible quality characteristics includes, but are not limited to: shape quality (based on matching a predetermined shape within a specified tolerance, then the sample is determined to be defective with respect to shape), surface contour quality (when a flat surface is greater than a specified area, then the sample is determined to be defective with respect to surface contour), hole quality (presence of holes in the sample), pest quality (presence of insects in/or on the sample), color quality (irregular color of the sample), size quality (irregular size of the sample), moisture level, oil content, fat content, and mycotoxin content. In one example, a group of quality characteristics are referred to as inspection data 415. FIG. 18, FIG. 19, and FIG. 20 illustrate various examples of inspection data. Communication medium 417 can be a wired medium such as ethernet or RS-232. Alternatively, communication medium 417 can be wireless medium such as WiFi (802.11) or a cellular link. The inspection data 415 is then communicated to slave device 411. In this fashion, the slave device 411 can then analyze the inspection data and adjust the operation of slave device 411 such that more desirable samples are output from slave device 411. This scenario requires that slave device 411 include some local knowledge and processing capability to analyze the received inspection data and to adjust the operations of the slave device 411 based on the analysis.
It is noted herein, the inspection device 400 illustrated in FIG. 13 is only one example of an inspection device. Another example of an inspection device is the in-flight 3D inspector 1 illustrated in FIGS. 1-5.
It is also noted herein, that multiple samples may be within the field of view of the optical device 404 when an image is captured and therefore quality characteristics of multiple samples may be determined using a single captured image.
In another scenario, a sample passes through the inspection device 412 and then passes through the slave device 413. Within the inspection device 412, the optical device 404 of the inspection device 400 is triggered by the processor 401 to capture an image. The triggering by the processor 401 is executed when a sample is within the field of view of the optical device 404. The image captured by the optical device 404 is then stored into storage device 402. The processor 401 then processes the captured image and determines one or more quality characteristics of the sample in the captured image. Many different quality characteristics may be determined from the captured image. In one example, multiple quality characteristics are referred to as inspection data 415. The inspection data 415 is then communicated to slave device 413 via communication medium 417. Communication medium 417 can be a wired medium such as ethernet or RS-232. Alternatively, communication medium can be wireless medium such as WiFi (802.11) or cellular link In this fashion, the slave device 413 can then analyze the inspection data and adjust the operation of slave device 413 such that more desirable samples are output from slave device 413. This scenario requires that slave device 413 include some local knowledge and processing capability to analyze the received inspection data and to adjust the operations of the slave device 413 based on the analysis.
While the scenario illustrated in FIG. 14 provides the slave devices 411 and 413 with the most control over how they operate, in many instances slave devices 411 and 413 will not have the necessary knowledge and processing power to analyze the inspection data generated by the inspection device 412. This problem is addressed by moving the processing of the inspection data to the inspection device 412. This solution is illustrated in FIG. 15.
FIG. 15 illustrates a command communication system. The terms upstream indicates that sample pass through the slave device before passing through the inspection device 422. The term downstream indicates that samples pass through the inspection device 422 before passing through the slave device. In this system, a sample passes through the slave device 411 and then passes through the inspection device 412. Within the inspection device 412, the optical device 404 of the inspection device 400 is triggered by the processor 401 to capture an image. The triggering by the processor 401 is executed when a sample is within the field of view of the optical device 404. The image captured by the optical device 404 is then stored into storage device 402. The processor 401 then processes the captured image and determines one or more quality characteristics of the sample in the captured image. In one example, multiple quality characteristics are referred to as inspection data. Instead of communicating the raw inspection data to the slave device 421, the inspection device 422 performs the analysis of the inspection data and generates a command 425 to adjust the operation of slave device 421. FIG. 21, FIG. 22, and FIG. 23 illustrate various examples of commands that are generated based on inspection data. For example, a command may be to set a threshold value to be used by a slave device. In another example, a command may be to set a mixing ratio value in a slave device. In yet another example, the command may be to adjust a set-point value in a slave device. The command 425 is then communicated to slave device 421 via communication medium 427. Slave device 421 then adjusts operation as commanded such that more desirable samples are output from slave device 421. This scenario does not require that slave device 421 include some local knowledge and processing capability to analyze inspection data and to adjust the operations of the slave device 421 based on the analysis. Rather, this scenario does not require any local knowledge or processing capability to be present on the slave device 421, because all the necessary analysis is performed by the inspection device 422. Slave device 421 can operate as a "dumb" terminal that simply adjusts operation based on received commands from the inspection device 422. This solution may be very valuable as it reduces the number of devices that are required to have local processing capability and knowledge, which in turn reduces the cost of the overall system.
In another scenario, a sample passes through the inspection device 422 and then passes through the slave device 423. Within the inspection device 412, the optical device 404 of the inspection device 400 is triggered by the processor 401 to capture an image. The triggering by the processor 401 is executed when a sample is within the field of view of the optical device 404. The image captured by the optical device 404 is then stored into storage device 402. The processor 401 then processes the captured image and determines one or more quality characteristics of the sample in the captured image. In one example, multiple quality characteristics are referred to as inspection data. Instead of communicating the raw inspection data to the slave device 423, the inspection device 422 performs the analysis of the inspection data and generates a command 426 to adjust the operation of slave device 423. The command 426 is then communicated to slave device 423 via a communication medium. Slave device 423 then adjusts operation as commanded such that more desirable samples are output from slave device 423. This scenario does not require that slave device 423 include some local knowledge and processing capability to analyze inspection data and to adjust the operations of the slave device 423 based on the analysis. Rather, this scenario does not require any local knowledge or processing capability to be present on the slave device 423, because all the necessary analysis is performed by the inspection device 422. Slave device 423 can operate as a "dumb" terminal that simply adjusts operation based on received commands from the inspection device 422. This solution may be very valuable as it reduces the number of devices that are required to have local processing capability and knowledge, which in turn reduces the cost of the overall system.
While the scenario illustrated in FIG. 15 provides cost saving by only requiring a single device in the system to have the necessary knowledge and processing power, it may be even more advantageous if the none of the devices in the system are required to have local processing capability and knowledge to analyze the captured images. FIG. 16 illustrates an inspection data control system using a remote computing device.
FIG. 16 illustrates an inspection data control system using a remote computing device. The terms upstream indicates that sample pass through the slave device before passing through the inspection device 432. The term downstream indicates that samples pass through the inspection device 432 before passing through the salve device. In this system, a sample passes through the slave device 431 and then passes through the inspection device 432. Within the inspection device 432, the optical device 404 of the inspection device 400 is triggered by the processor 401 to capture an image 438. The triggering by the processor 401 is executed when a sample is within the field of view of the optical device 404. The image 438 captured by the optical device 404 is then stored into storage device 402. The processor 401 does not process the captured image 438 to determine one or more quality characteristics of the sample in the captured image 438. Rather, the inspection device 432 communicates the captured image 438 to a remote computing device 434. In one example, remote computing device 434 is a remote computer or server that is not part of any machine through which the sample flows. In response to receiving the captured image 438, the remote computing device 434 performs the analysis of the captured image 438 and generates a command 436 to adjust the operation of slave device 431. The command 436 is then communicated to slave device 431 via communication medium 437. Slave device 431 then adjusts operation as commanded such that more desirable samples are output from slave device 431. This scenario does not require any local knowledge or processing capability to be present on the slave device 431, because all the necessary analysis is performed by the remote computing device 434. Likewise, this scenario does not require any local knowledge or processing capability to be present on the inspection device 432, because all the necessary analysis is performed by the remote computing device 434. Both slave device 431 and inspection device 432 can operate as "dumb" terminals that simply adjust operation based on received commands from the remote computing device 434. This solution may be very valuable as it does not require any devices through which the sample passes to have local processing capability and knowledge, which in turn reduces the cost of the overall system.
In another scenario, a sample passes through the inspection device 432 and then passes through the slave device 433. Within the inspection device 432, the optical device 404 of the inspection device 400 is triggered by the processor 401 to capture an image 438. The triggering by the processor 401 is executed when a sample is within the field of view of the optical device 404. The image 438 captured by the optical device 404 is then stored into storage device 402. The processor 401 does not process the captured image 438 to determine one or more quality characteristics of the sample in the captured image. Rather, the inspection device 432 communicates the captured image 438 to a remote computing device 434. In one example, remote computing device 434 is a remote computer or server that is not part of any machine through which the sample flows. In response to receiving the captured image 438, the remote computing device 434 performs the analysis of the captured image 438 and generates a command 437 to adjust the operation of slave device 433. The command 437 is then communicated to slave device 433 via communication medium. Slave device 433 then adjusts operation as commanded such that more desirable samples are output from slave device 433. This scenario does not require any local knowledge or processing capability to be present on the slave device 433, because all the necessary analysis is performed by the remote computing device 434. Likewise, this scenario does not require any local knowledge or processing capability to be present on the inspection device 432, because all the necessary analysis is performed by the remote computing device 434. Both slave device 433 and inspection device 432 can operate as "dumb" terminals that simply adjust operation based on received commands from the remote computing device 434. This solution may be very valuable as it does not require any devices through which the sample passes to have local processing capability and knowledge, which in turn reduces the cost of the overall system.
In another example, captured image 438 is not communicated from the inspection device 432 to the remote computing device 434, but rather inspection data 435 is communicated from the inspection device 432 to remote computing device 434. In this scenario, the inspection device 432 captures an image of the sample and from the captured image determines quality characteristic(s) of the sample. The inspection data (grouping of quality characteristics) is then communicated to the remote computing device 434. In response to receiving the inspection data, the remote computing device 434 generates one or more commands to adjust one or more slave devices. In this example, the inspection device 432 requires the processing capability to determine the quality characteristics, but does not require the capability to determine commands for adjusting slave devices.
While the scenario illustrated in FIG. 16 a great improvement, a remote computing device can be used in an even more beneficial way. This improved use is illustrated in FIG. 17.
FIG. 17 illustrates an inspection data control system of multiple processing lines using a remote computing device. Each processing line 441-446 includes at least one inspection device that is capable of capturing an image and sending the capture image and/or inspection data based on the captured image to a remote computing device 440.
The in response to receiving only the captured image data 448, the remote computing device 440 determines quality characteristics and then based on those quality characteristics ("inspection data") the remote computing device 440 generates command(s) to adjust the operation of slave device(s) in the processing line from which the image was captured.
In response to receiving the inspection data 447, the remote computing device 440 generates command(s) to adjust the operation of slave device(s) in the processing line from which the image was captured.
This scenario also reduces the complication of managing multiple sample processing lines. A single remote computing device 440 could receive inspection data from various inspection devices included in various processing lines 441-446. In this fashion, the single remote computing device 440 could monitor and adjust all the various slave devices in processing lines 441-446. This scenario can also provide for advanced learning because all inspection data from all processing lines 441-446 are received by the remote computing device 440, which in turn allows for improved artificial intelligence learning by way of access to larger sets of relevant inspection data.
This scenario also allows for real-time monitoring and adjusting of multiple processing lines located at various locations around the world.
FIG. 24 is a flowchart 300 of an inspection data communication system. In step 301, an image of a sample is captured by an inspection device as the sample travels along a processing line. In step 302, the captured image is processed with respect to quality characteristic(s) and inspection data is generated. In step 303, the inspection data is communicated from the inspection device to another device located along the sample processing line. In step 304, the device receives the inspection data and in response adjusts the operation of the device based at least in part on the inspection data received.
FIG. 25 is a flowchart 400 of a command communication system. In step 401, an image of a sample is captured by an inspection device as the sample travels along a processing line. In step 402, the captured image is processed with respect to quality characteristic(s) and inspection data is generated. In step 403, a command is generated based at least in part on the inspection data. In step 404, the command is then communicated from the inspection device to another device located along the sample processing line. In step 405, the device receives the command and in response adjusts the operation of the device based at least in part on the command received.
FIG. 26 is a flowchart 500 of an inspection data control system using a remote computing device. In step 501, an image of a sample is captured by the inspection device as the sample travels along a processing line. In step 502, the captured image is communicated to the remote computing device. In step 503, in response to receiving the captured image, the remote computing device determines quality characteristic(s) and generates inspection data. In step 504, the remote computing device processes the inspection data and generates a command. In step 505, the command is communicated from the remote computing device to a device located along the sample processing line. In step 506, the device receives the command and in response adjusts the operation of the device based at least in part on the command received.
FIG. 27 is a flowchart 600 of an inspection data control system using a remote computing device. In step 601, an image of a sample is captured by the inspection device as the sample travels along the processing line. In step 602, the captured image is processed with respect to quality characteristic(s) and inspection data is generated. In step 603, the inspection data is communicated from the inspection device to a remote computing device and in response to receiving the inspection data, the remote computing device processes the inspection data and generates a command. In step 604, the command is communicated from the remote computing device to another device located along the sample processing line. In step 605, the device receives the command and in response adjusts the operation of the device based at least in part on the command received.
Distributed Ledger
A distributed ledger, sometimes referred to as "Blockchain", is a shared public ledger on which a system relies. The distributed ledger has a linked list data structure, with each block containing a hash of the previous block. Each block is formed by a proof-of-work algorithm, through which consensus of this distributed ledger could be obtained via the longest possible chain. The distributed ledger provides the basis for a distributed system that does not require trust between various users and is extendable in many ways through modifications of the parameters of the chain.
A block is an aggregated set of data. Data are collected and processed to fit in a block through a process called mining. Each block could be identified using a cryptographic hash (also known as a digital fingerprint). The formed block will contain a hash of the previous block, so that blocks can form a chain from the first block ever (known as the Genesis Block) to the newly formed block. In this way, all the data could be connected via a linked list structure.
Data are contained inside blocks as well as an arbitrary integer (called nounce) that is necessary for producing the proof-of-work. In the example of Bitcoin, a block contains a header and relevant transaction data. A merkle tree of transactions is created and the hash of the root is included in the header. A merkle tree is a full binary tree of a hash values. At the bottom level of the tree, each transaction has a node containing its hash value. The tree is constructed in a way such that the parent node has a value of the hash of the data contained in its children concatenating together. The merkle tree data structure allows fast validation by constructing a merkle tree path from the bottom level of the tree up to the root node. Since each bitcoin transaction output can be spent only once, as long as the output is spent, it could be erased out of the tree structure using some pruning algorithms. In this way, disk usage is reduced while the validation functions are preserved.
Various blocks in the blockchain are connected to specific other blocks in the blockchain. In one example, each block contains a hash of its previous block. In bitcoin blockchain for example, the block header has a field for previous block hash. Therefore all blocks will contain a reference of its previous block thereby enabling the chain to be build up to the genesis block.
A fork on the block chain may occur. A fork in the block chain occurs due to two blocks computed at a very short time interval. The subsequent blocks may build upon both blocks and both of the chains remain valid. In subsequent process of mining, one fork would be longer than the other fork, in this case, the longer chain would be accepted by the network and the short would not be used unless its length exceeds the longer chain in the future.
Many distributed ledgers, such as Bitcoin blockchain, use a proof-of-work algorithm for reaching a consensus. The cryptographic hash function of each block must be smaller than a specific value in order to be considered value. A nonce is therefore included in the block for this feature. By using the proof-of-work method, in order to change the data in one block, all successors of that block must be re-written and a huge amount of calculation is necessary. In addition, the longest chain would be accepted by the network whereas the shorter ones would be discarded at the situation of branches of the chain. This makes the data in blocks practically unmodifiable. Further, the more blocks that are built upon the block in which the data is contained, more processing is required to overwrite the data.
However, the blockchain may use other methods of consensus. For example, a blockchain may use Scrypt for proof-of-work algorithm instead of hash functions. In addition, the blockchain could be extended for scientific computation where a correct solution to a certain problem could act a validation method. In this way, the computation power may be used to help solving scientific problems and contribute to scientific researches.
In a distributed ledger, each user running a full node on the computer will download a full copy of the whole blockchain, which will include data of all events, such as transactions, recorded on the blockchain. After that, each node can run independently to process any incoming events, such as transactions, and propagate the event further. The node can also contribute to the establishment of the consensus by mining to include event data in a block and then to find a proof-of-work for the block. There is not a central node processing the data and distributing the data, rather every node can run independently and broadcast any work that is proved. This model of distributed computation could be extended to many other services such as Domain Name Server.
Quality Inspection Data Distributed Ledger
While distributed ledgers have been utilized to perform financial transactions, distributed ledgers have not been utilized to perform recordation and distribution of quality inspection data.
Quality inspection data is measured and recorded for many different items around the world, such as pharmaceuticals, mechanical hardware, agricultural foods and many, many more.
One challenge is the acquisition of quality inspection data. For example, some quality inspection data is generated by humans reviewing items manually. This process is prone to large variances depending on the human conducting the inspection as well as the state of the human when the inspection is conducted. In other examples, computer automation is used to help, or entirely, acquire the quality inspection data as disclosed above.
Regardless of the method in which the quality inspection data is acquired, a second challenge is the integrity of the quality data that is reported to interested parties, such as owners, purchasers, manufacturers, etc. For example, in the almond industry many purchasers are weary of the quality data that is alleged by various almond providers. The uncertainty spawns from various sources. First, was the quality inspection data reliable? Second, was the quality inspection data accurately managed and is it accurately aligned with the product being offered? Third, was the quality inspection data intentionally tampered with to increase the market price of the product being sold? Fourth, difficulty to gain access to the data regardless of the three concerns listed above. All of these uncertainties lead to time and cost inefficiencies. A trust worthy, reliable and cost efficient solution is provided herein.
Regarding the reliability of the quality inspection data, as discussed above, an automated system such as the in-flight optical inspector can be used to acquire reliable and consistent quality inspection data.
Regarding the management, possible tampering, and access to the acquired quality inspection data a new quality inspection data distributed ledger is disclosed. This quality inspection data distributed ledger does not perform financial transactions. Rather, the quality inspection data distributed ledger validates the source, timing, product association, and integrity of the quality inspection data.
FIG. 28 is a diagram of a quality inspection data distributed ledger flowchart 620. In step 621, one or more samples to be inspected are collected. In step 622, the one or more samples are assigned a unique identification code. In one example, the identification code is affixed to a container containing the one or more samples. In another example, the code is affixed to the one or more samples themselves. The code may be communicated by use of a Quick Response (QR) code, a bar code, printed text, Radio Frequency Identification (RFID) tag, human manual entry, a Near Field Communication (NFC) signal, a token, or any other method of communication known to one of skill in the art.
Once the identification code has been assigned to the one or more samples, the one or more samples are inspected in step 623. This inspection can be performed by any possible method. In one example, the inspection can be performed by human inspection. In another example, the inspection can be performed by an automated inspection. In yet another example, the inspection can be performed by an in-flight 3D inspector as disclosed above.
Upon completion of the inspection of the one or more samples, in step 624 the resulting inspection data and the identification code are written into a new quality inspection data block. An example of a quality inspection data block is illustrated in FIG. 29. The exemplary quality inspection data block of FIG. 29 may include the following data fields: an inspection entity that conducted the inspection, inspection location where the inspection was conducted, the sensor identification number that identifies the sensor or inspection device that performed the inspection, the lot number of the one or more samples, the total weight of the lot of samples, analysis completion timestamp indicating when the inspection was performed or completed, the amount of product analyzed (for example in weight or quantity), the moisture content of the samples, the kernel size of the samples, the uniformity ratio of the samples (average, median, variance, etc.), the percentage or number of "good" samples or samples that pass all required characteristics, the percentage or number of dissimilar samples, the percentage or number of chipped and scratched samples, the percentage or number of samples including another type of defect, the percentage or number of samples that have serious damage, and the quality grade of the one or more samples, such as U.S. Extra #1 grade.
The exemplary quality inspection data block of FIG. 29 may also include the following data fields: a color value, a microtoxin value (milligram/kg, microgram/kg, Parts Per Million, Parts Per Billion . . . ), a temperature value, an acidity (pH) value, a pressure value (kPA, PSI . . . ), a volume per unit time (cubic meters per second), an amount of discolored product (number of percentage), an amount of broken product (number or percentage), an amount of rancid product (number or percentage), an amount of moldy product (number of percentage), an amount of immature product (number or percentage), an amount of unripe product (number or percentage), or an amount of rotten soft product (number or percentage).
The inspection data fields listed above are only provided to be exemplary. One skilled in the art will appreciate that any other characteristic determined during inspection can be included in the quality inspection data block. Likewise, any of the inspection data fields listed can be omitted from the quality inspection data block as well. A list of other possible inspection devices are listed below. Optical sensors Moisture sensors Microtoxin sensors Thermometer sensors Acidity (pH) sensors Microwave sensors Pressure sensors Level sensors Ultrasonic sensors Flow sensors Viscosity sensors Conductance/Impedance sensors Electronic nose (sniffing) sensors X-ray sensors multi spectral (visual/non visual) sensors weight sensors refractometers sensors tenderometer sensors firmness sensors hardness sensors
The quality inspection data block may also include hash information. The quality inspection data block may include any of the following hash information: Hash of the quality inspection data block itself, hash of the previous quality inspection data block, hash of the next quality inspection data block, or a Merkle root.
In the example where an inspector with computational capabilities performs the inspection, the inspector may create the quality inspection data block itself upon completion of the inspection process. In the example where the inspector does not have computational capabilities, the data collected by the inspector can be manually entered into computationally capable device to create the quality inspection data block.
In step 625, after the quality inspection data block is created, the quality inspection data block is added to the distributed ledger. In one example, the distributed ledger is referred to as a blockchain. In the example where an inspector includes networking capabilities, the inspector can add the new quality inspection data block to the distributed ledger via a network. Once the quality inspection data block has been added to the distributed ledger, the quality inspection data block is available for viewing by anyone on the network and cannot easily be changed.
This quality inspection data distributed ledger will solve the problems currently facing the consumers of quality inspection data. Consumers of quality inspection data will now have a single source of trustworthy quality inspection data that is easy to access.
Although certain specific embodiments are described above for instructional purposes, the teachings of this patent document have general applicability and are not limited to the specific embodiments described above. Accordingly, various modifications, adaptations, and combinations of various features of the described embodiments can be practiced without departing from the scope of the invention as set forth in the claims.
* * * * *
D00000
D00001
D00002
D00003
D00004
D00005
D00006
D00007
D00008
D00009
D00010
D00011
D00012

D00013

D00014

D00015
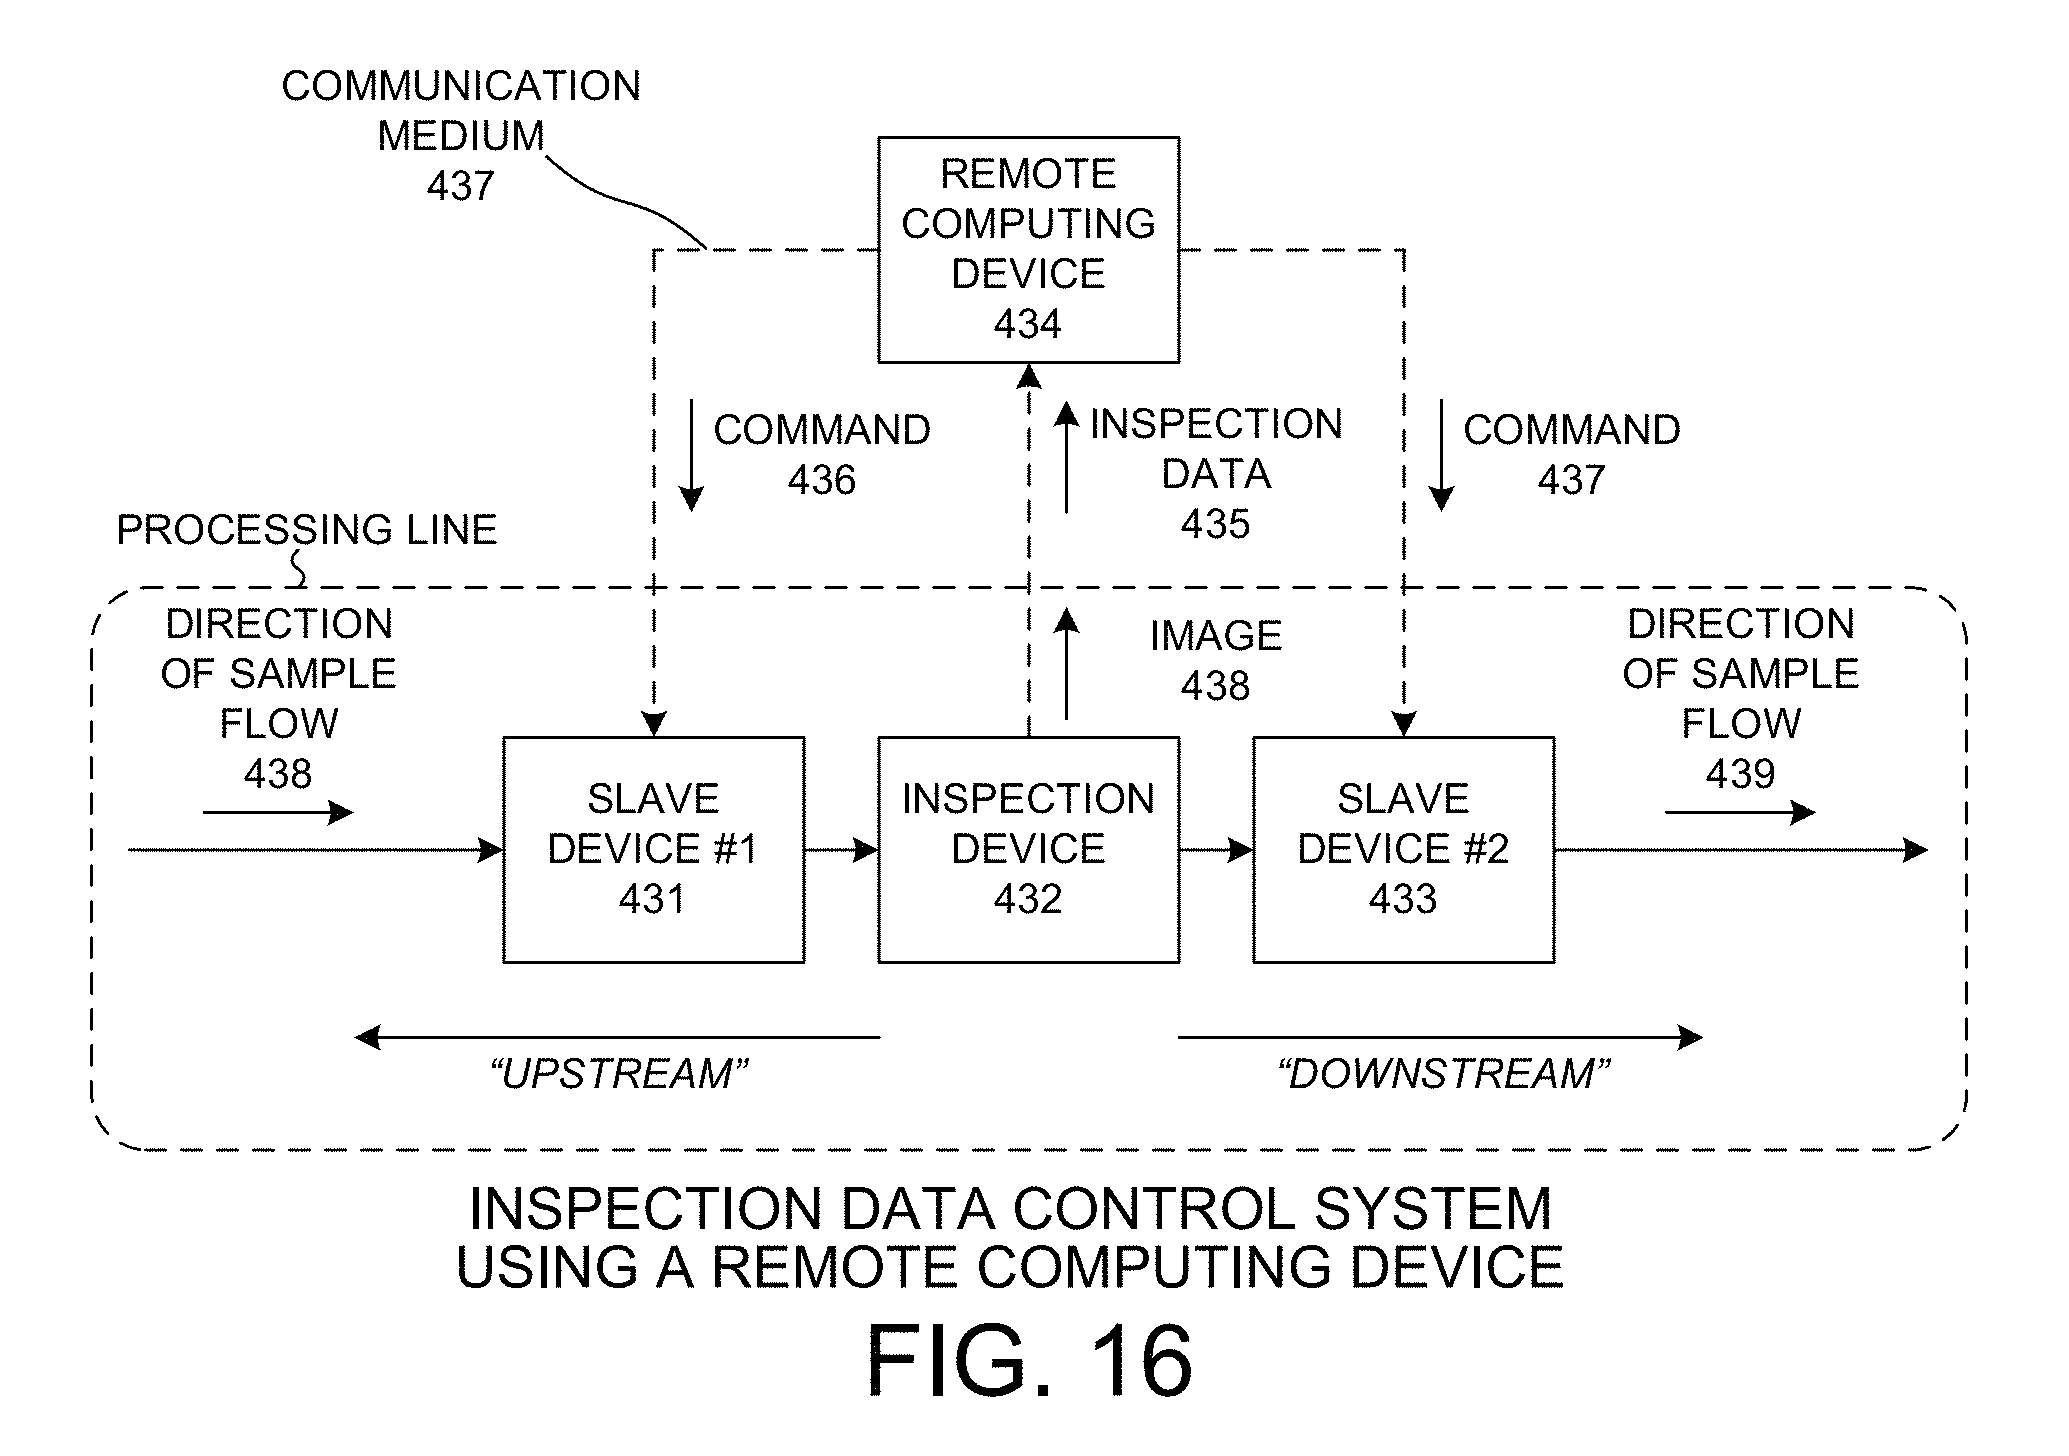
D00016
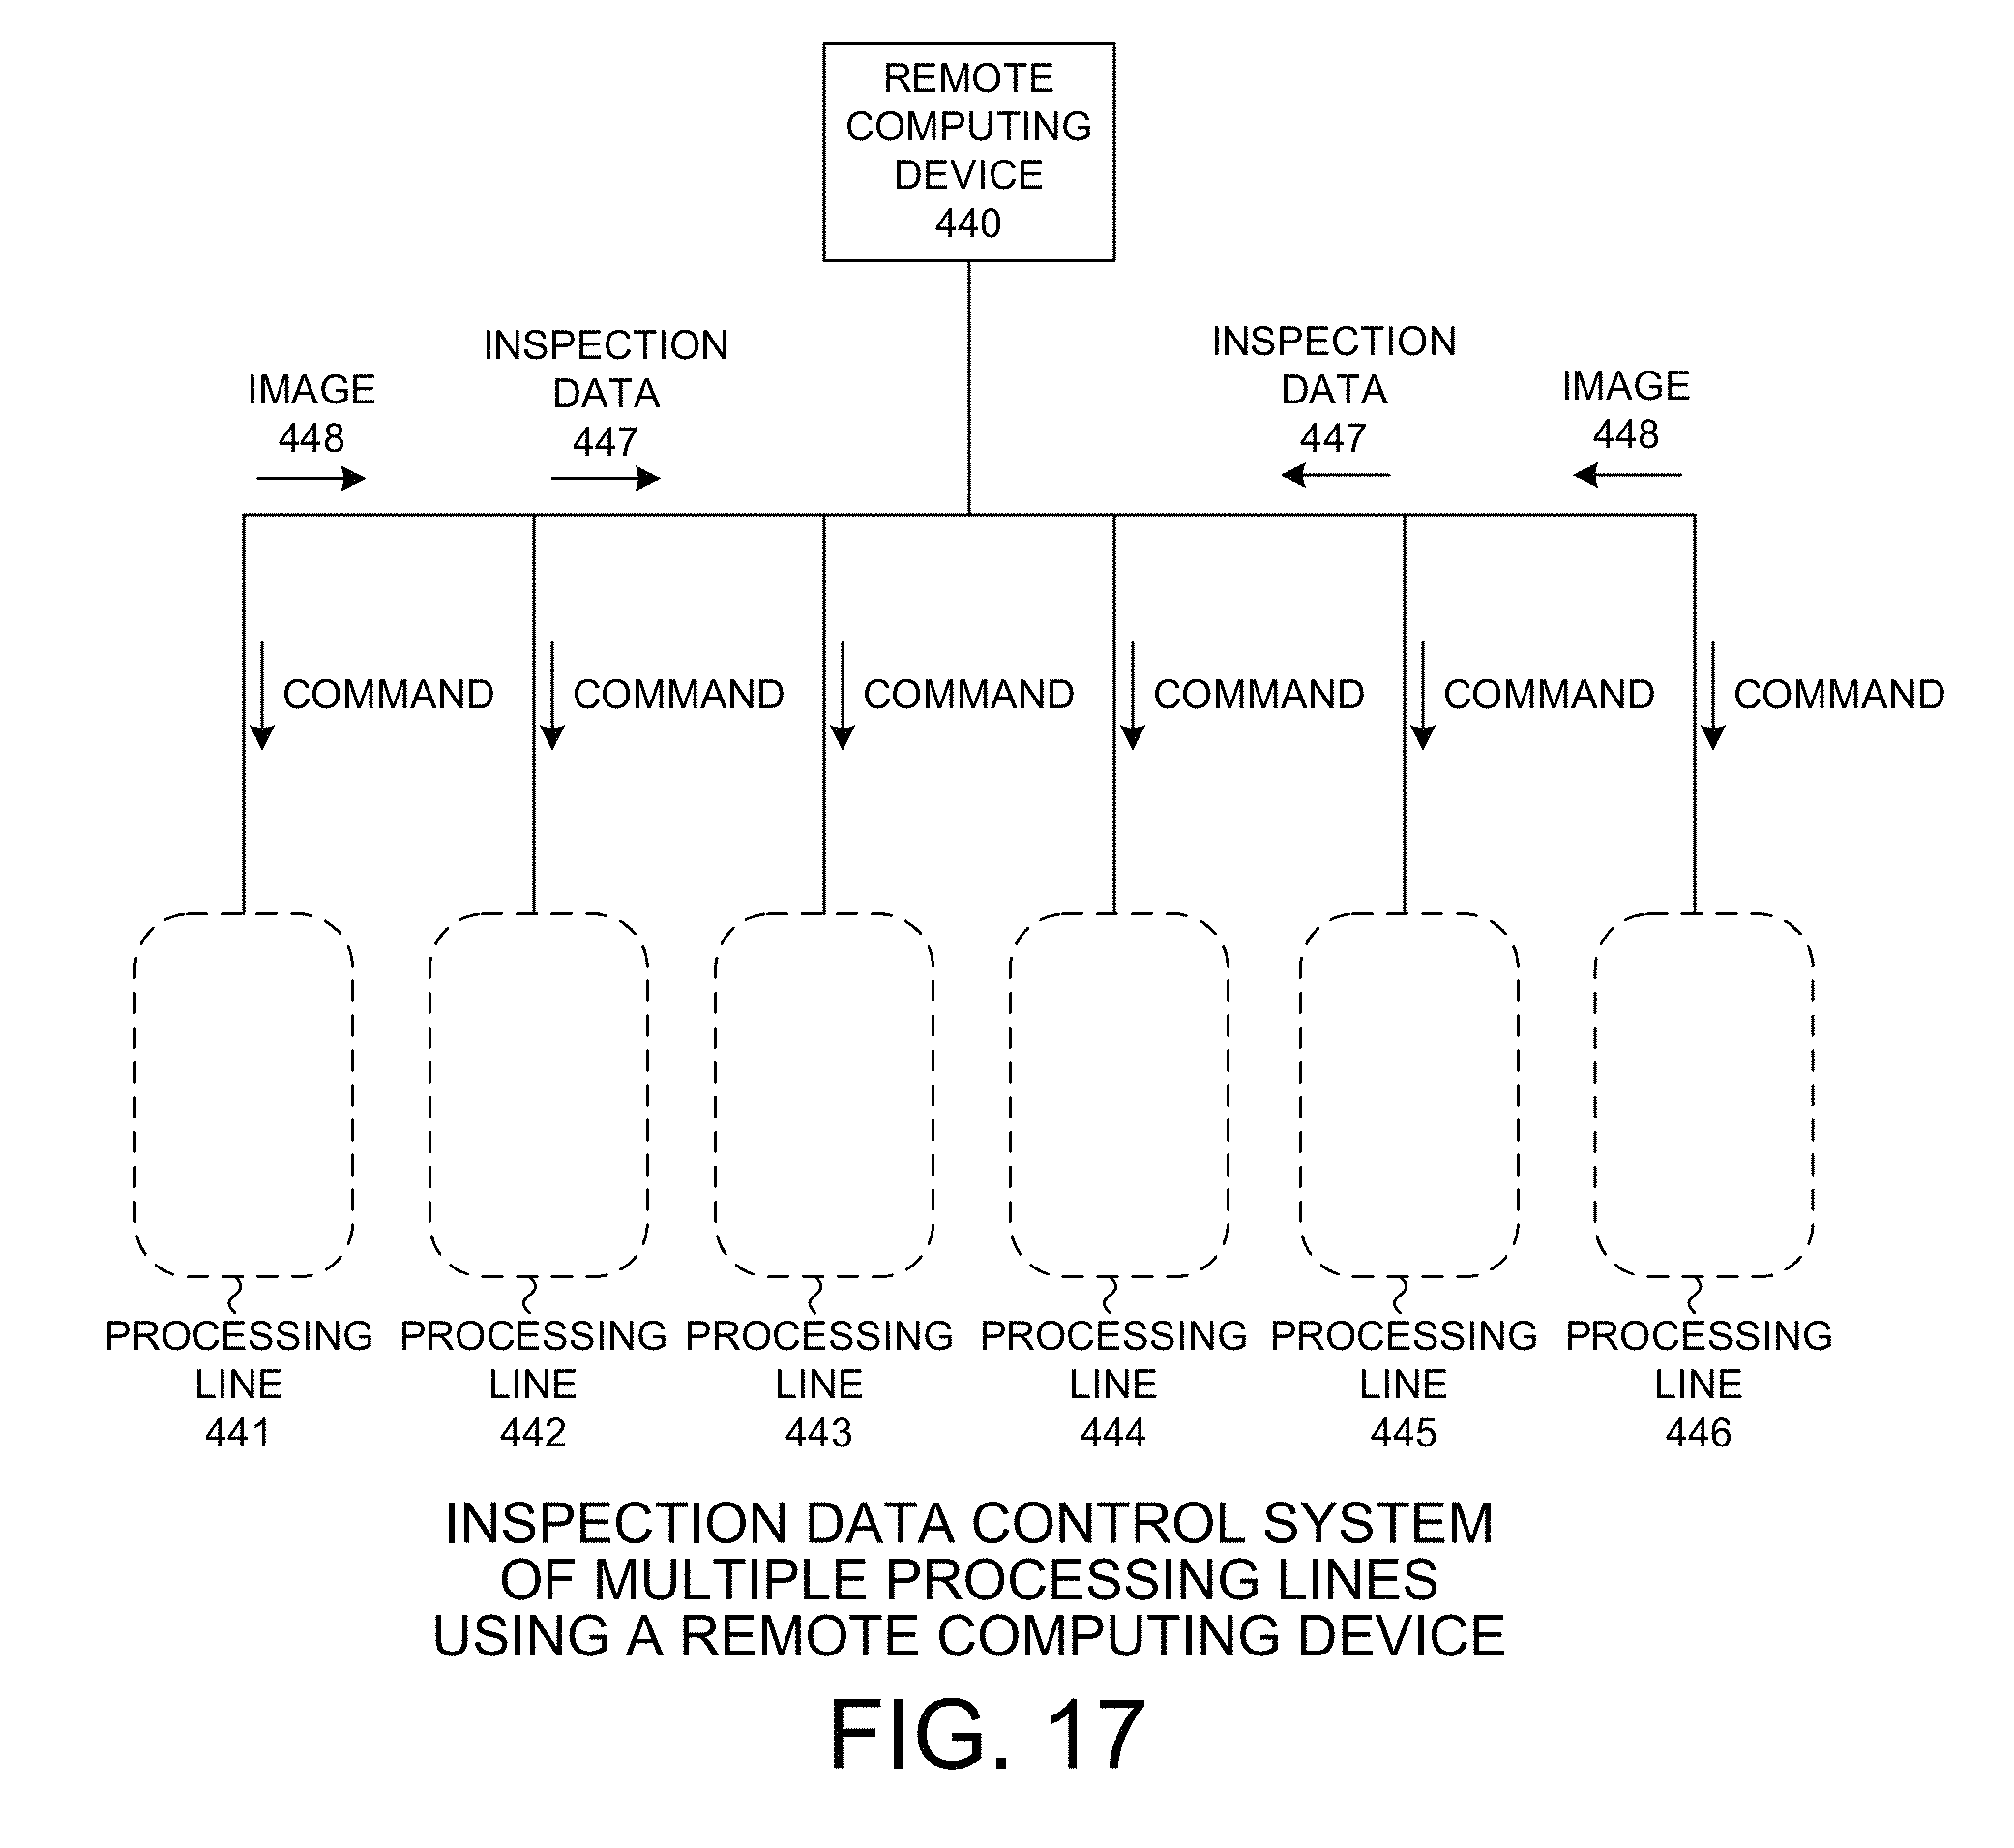
D00017

D00018
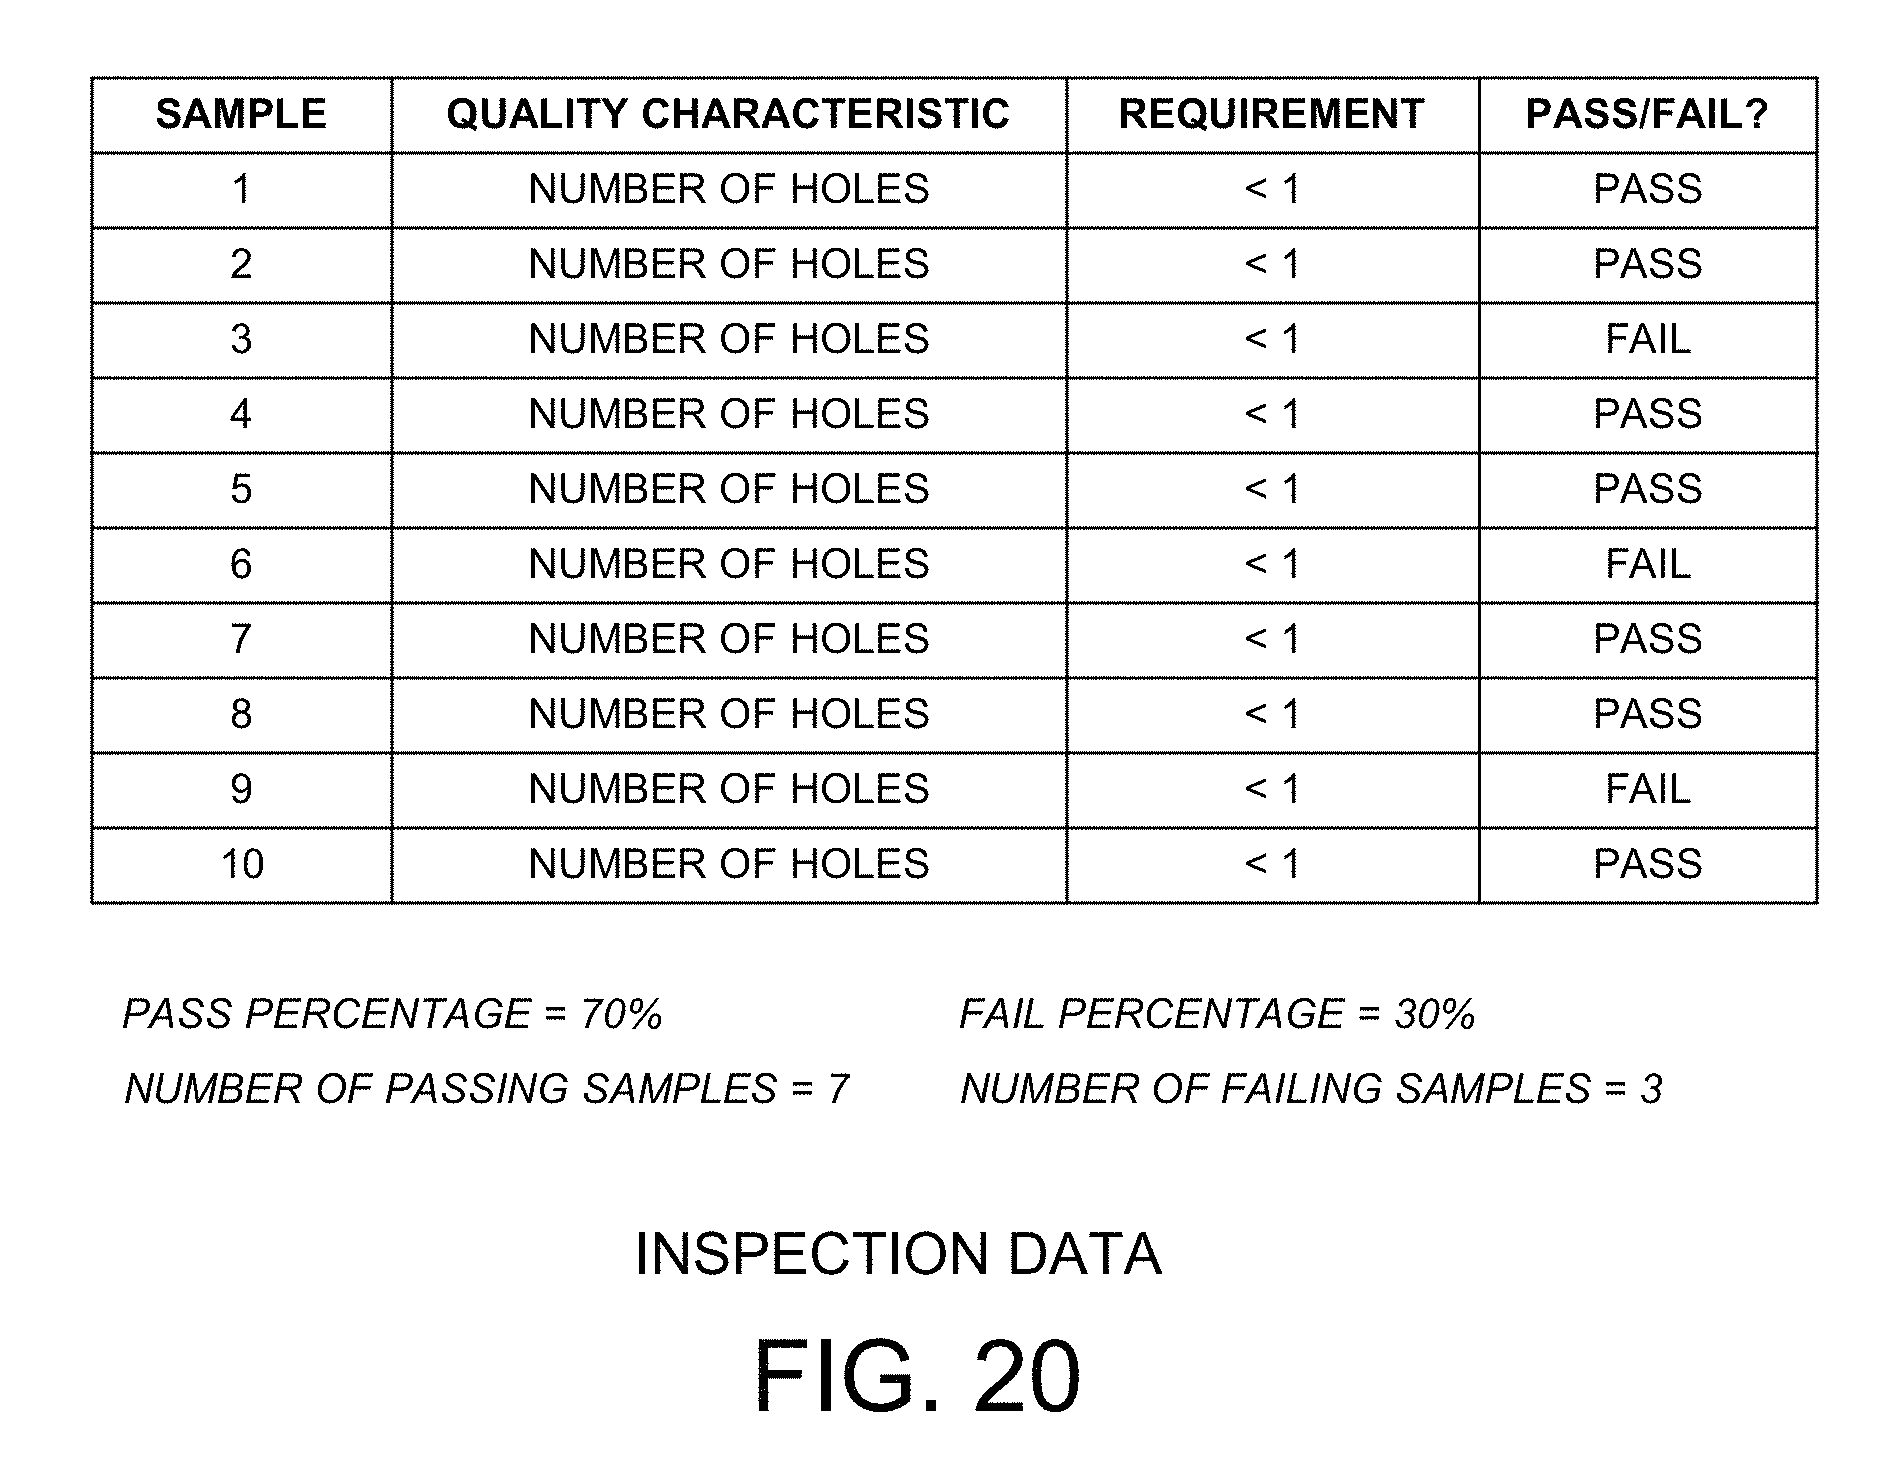
D00019

D00020
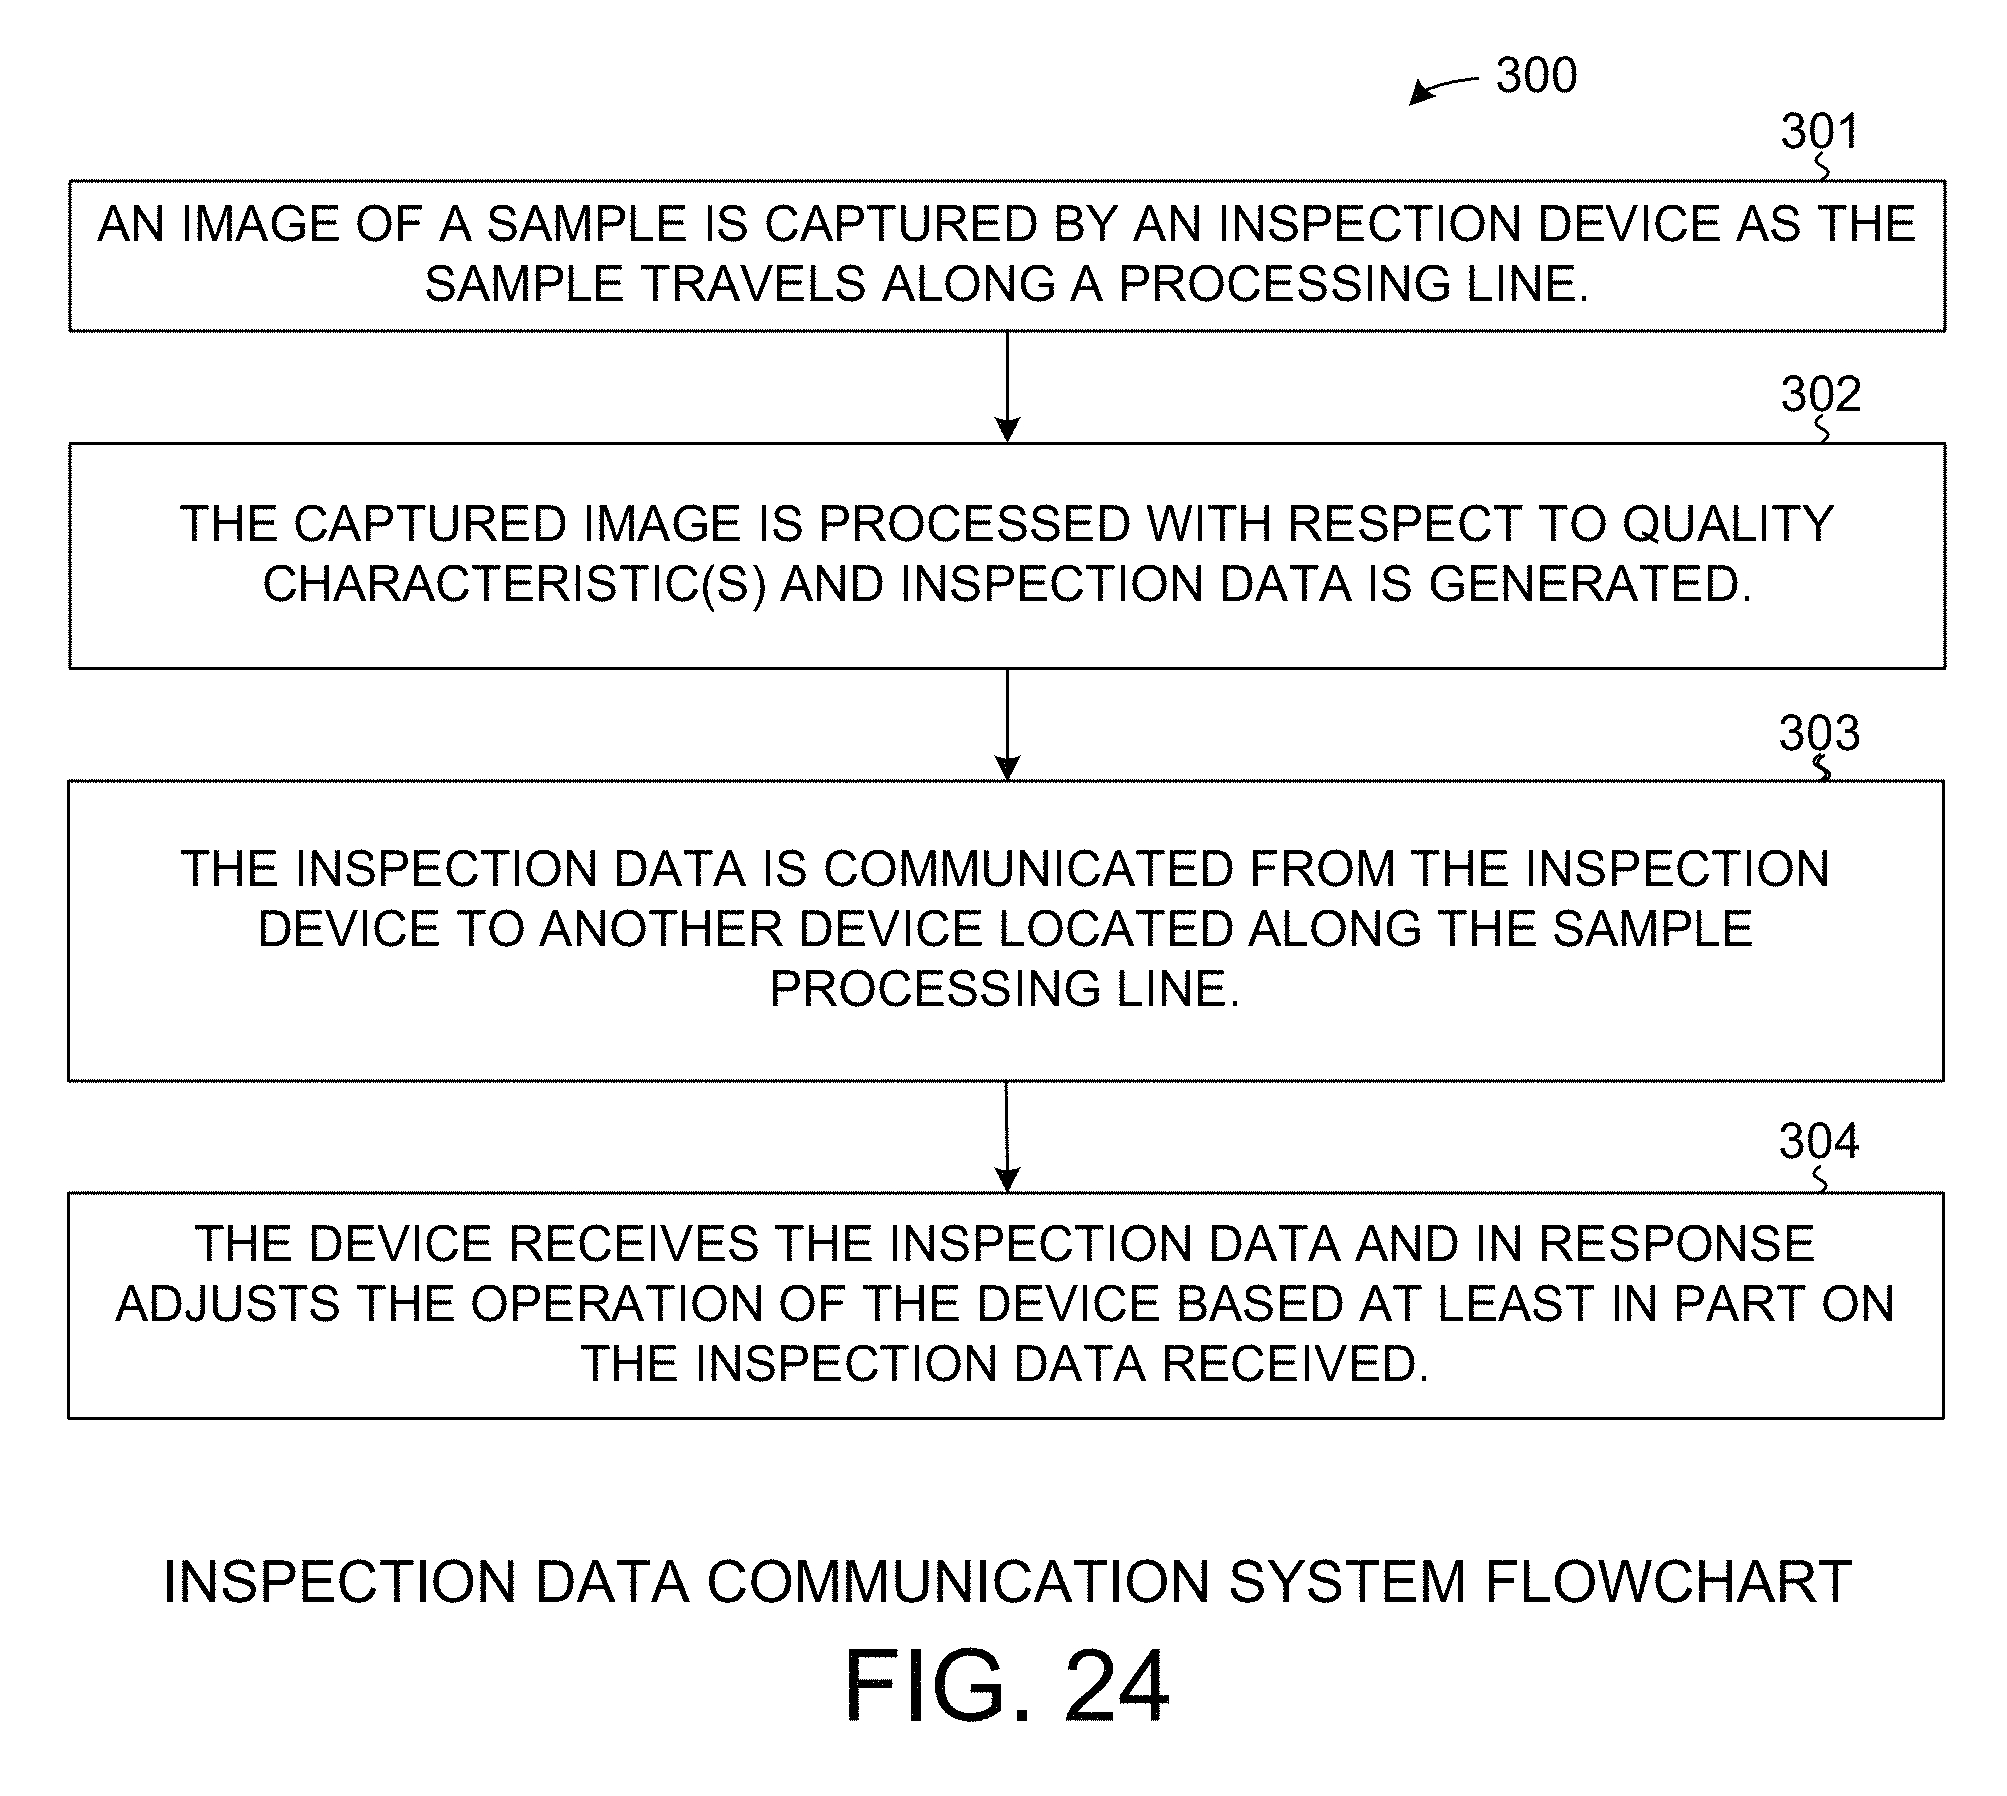
D00021
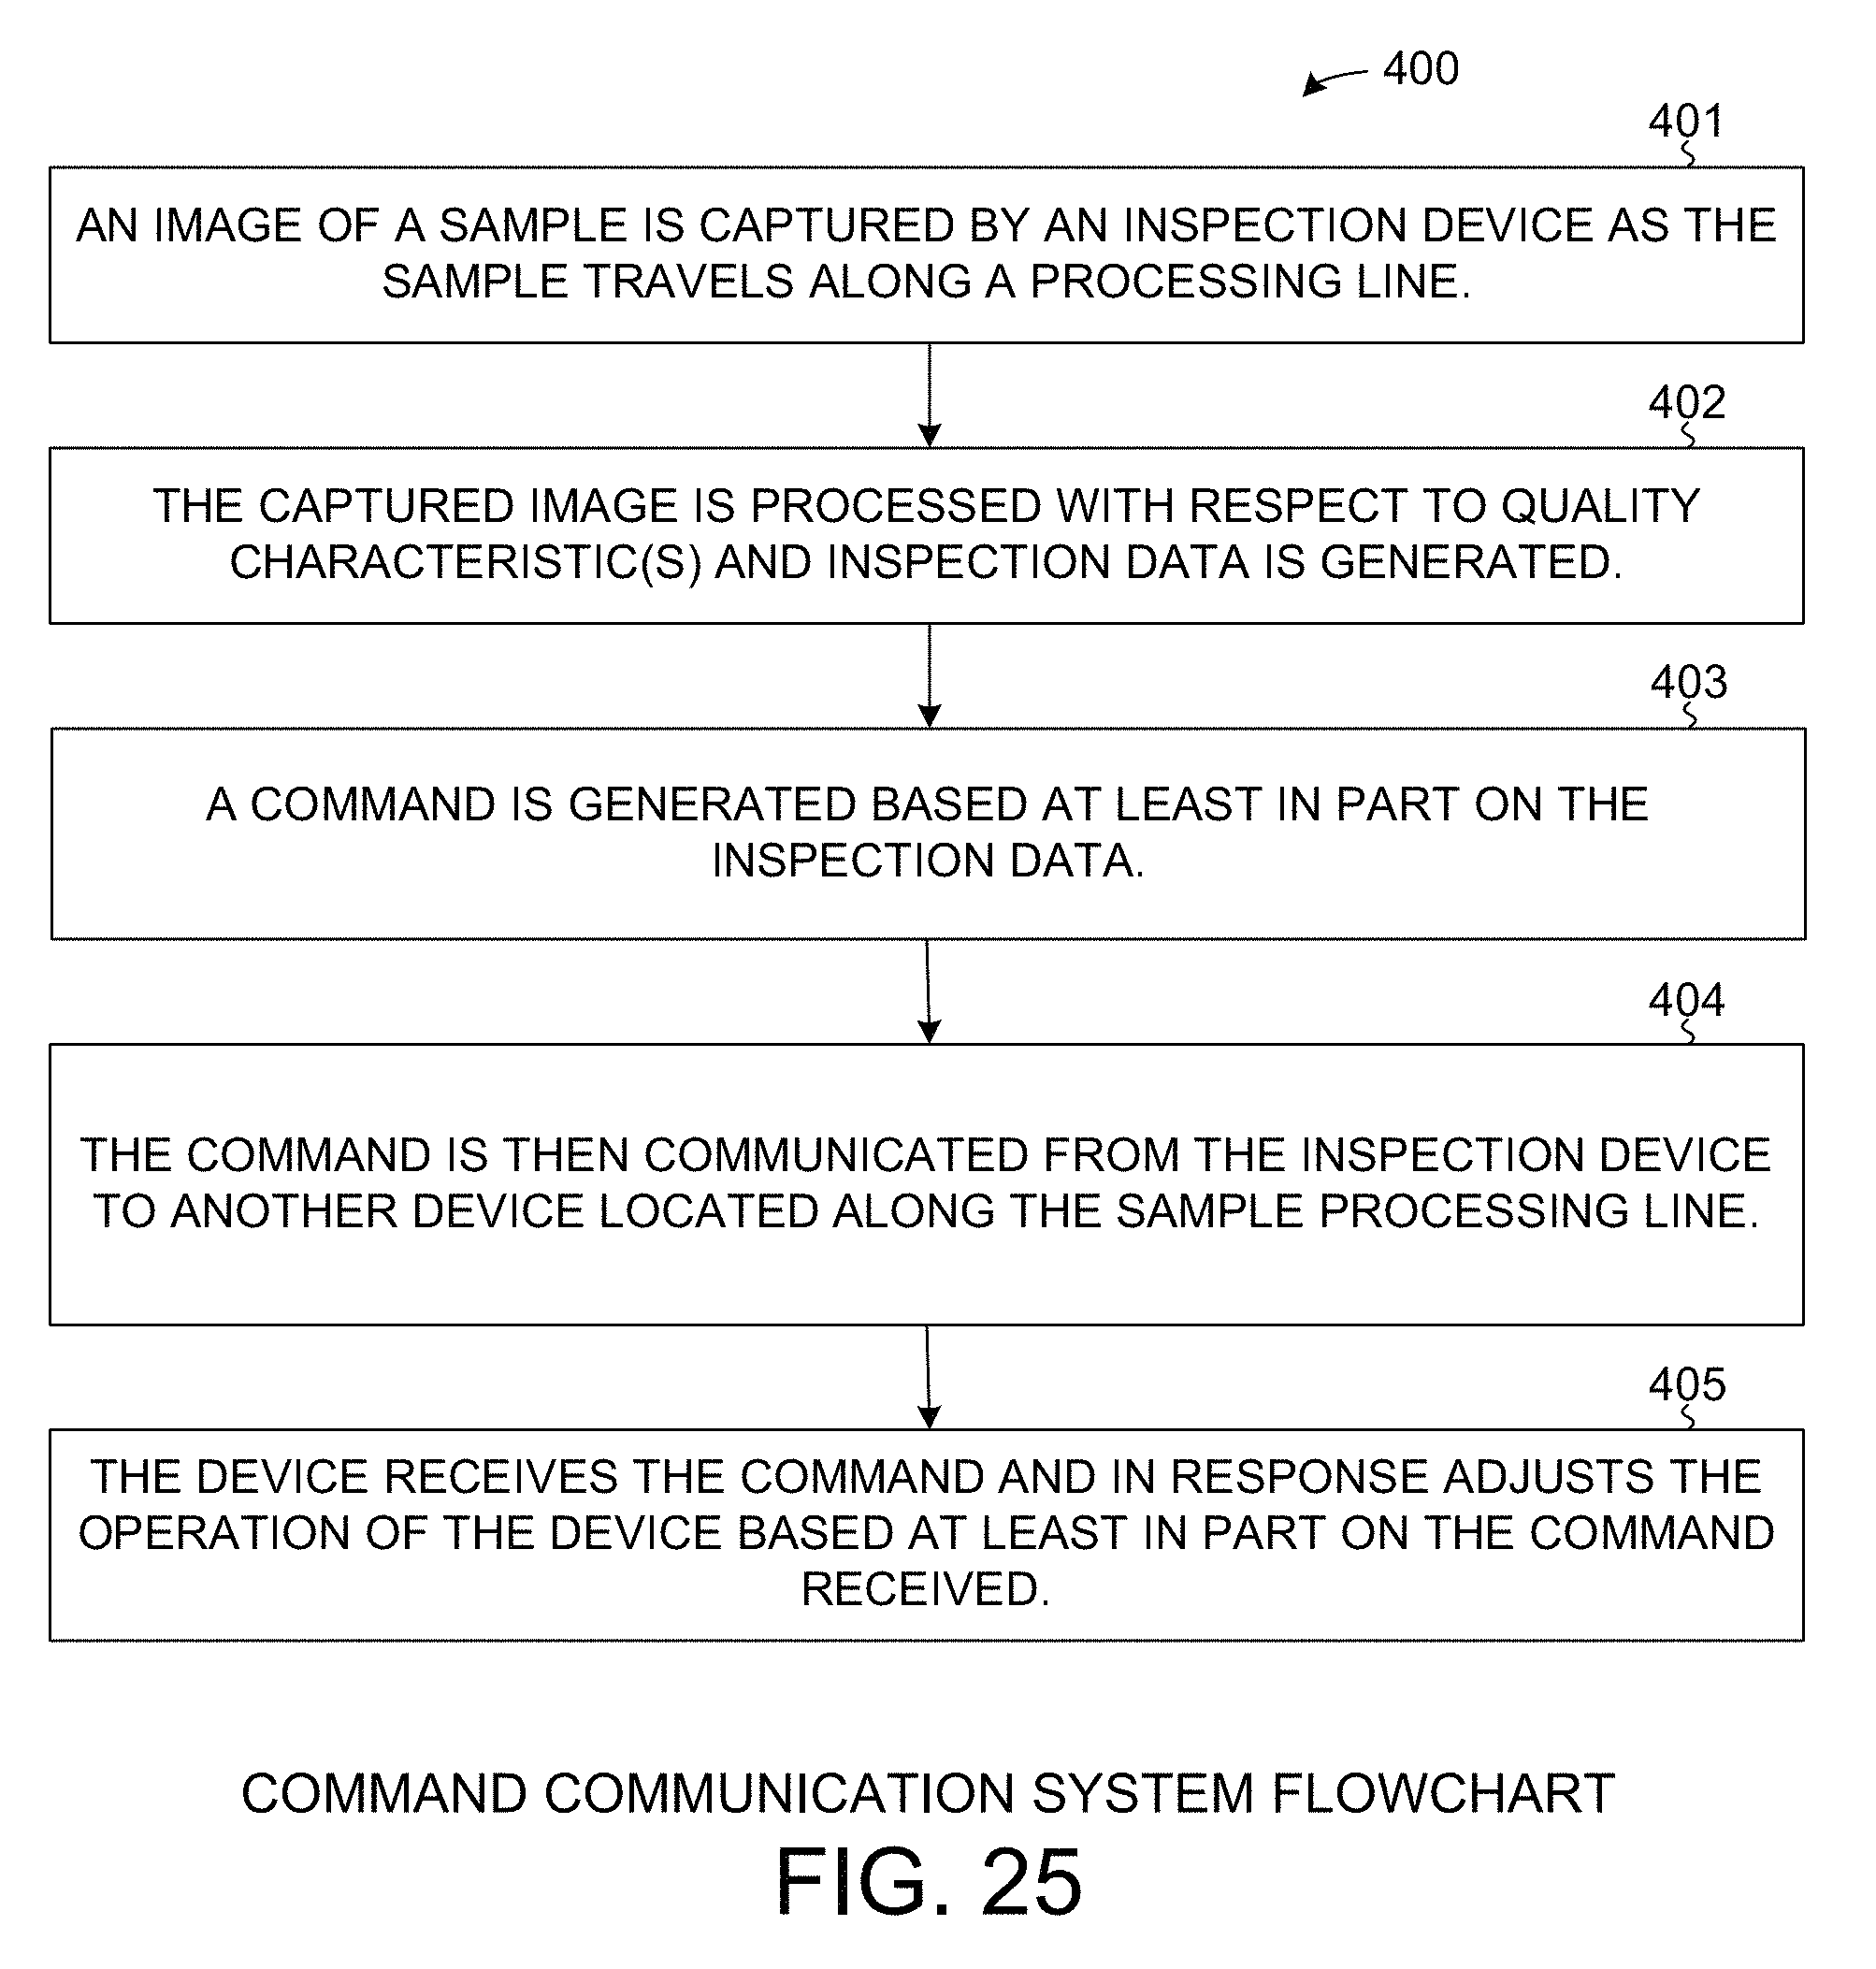
D00022
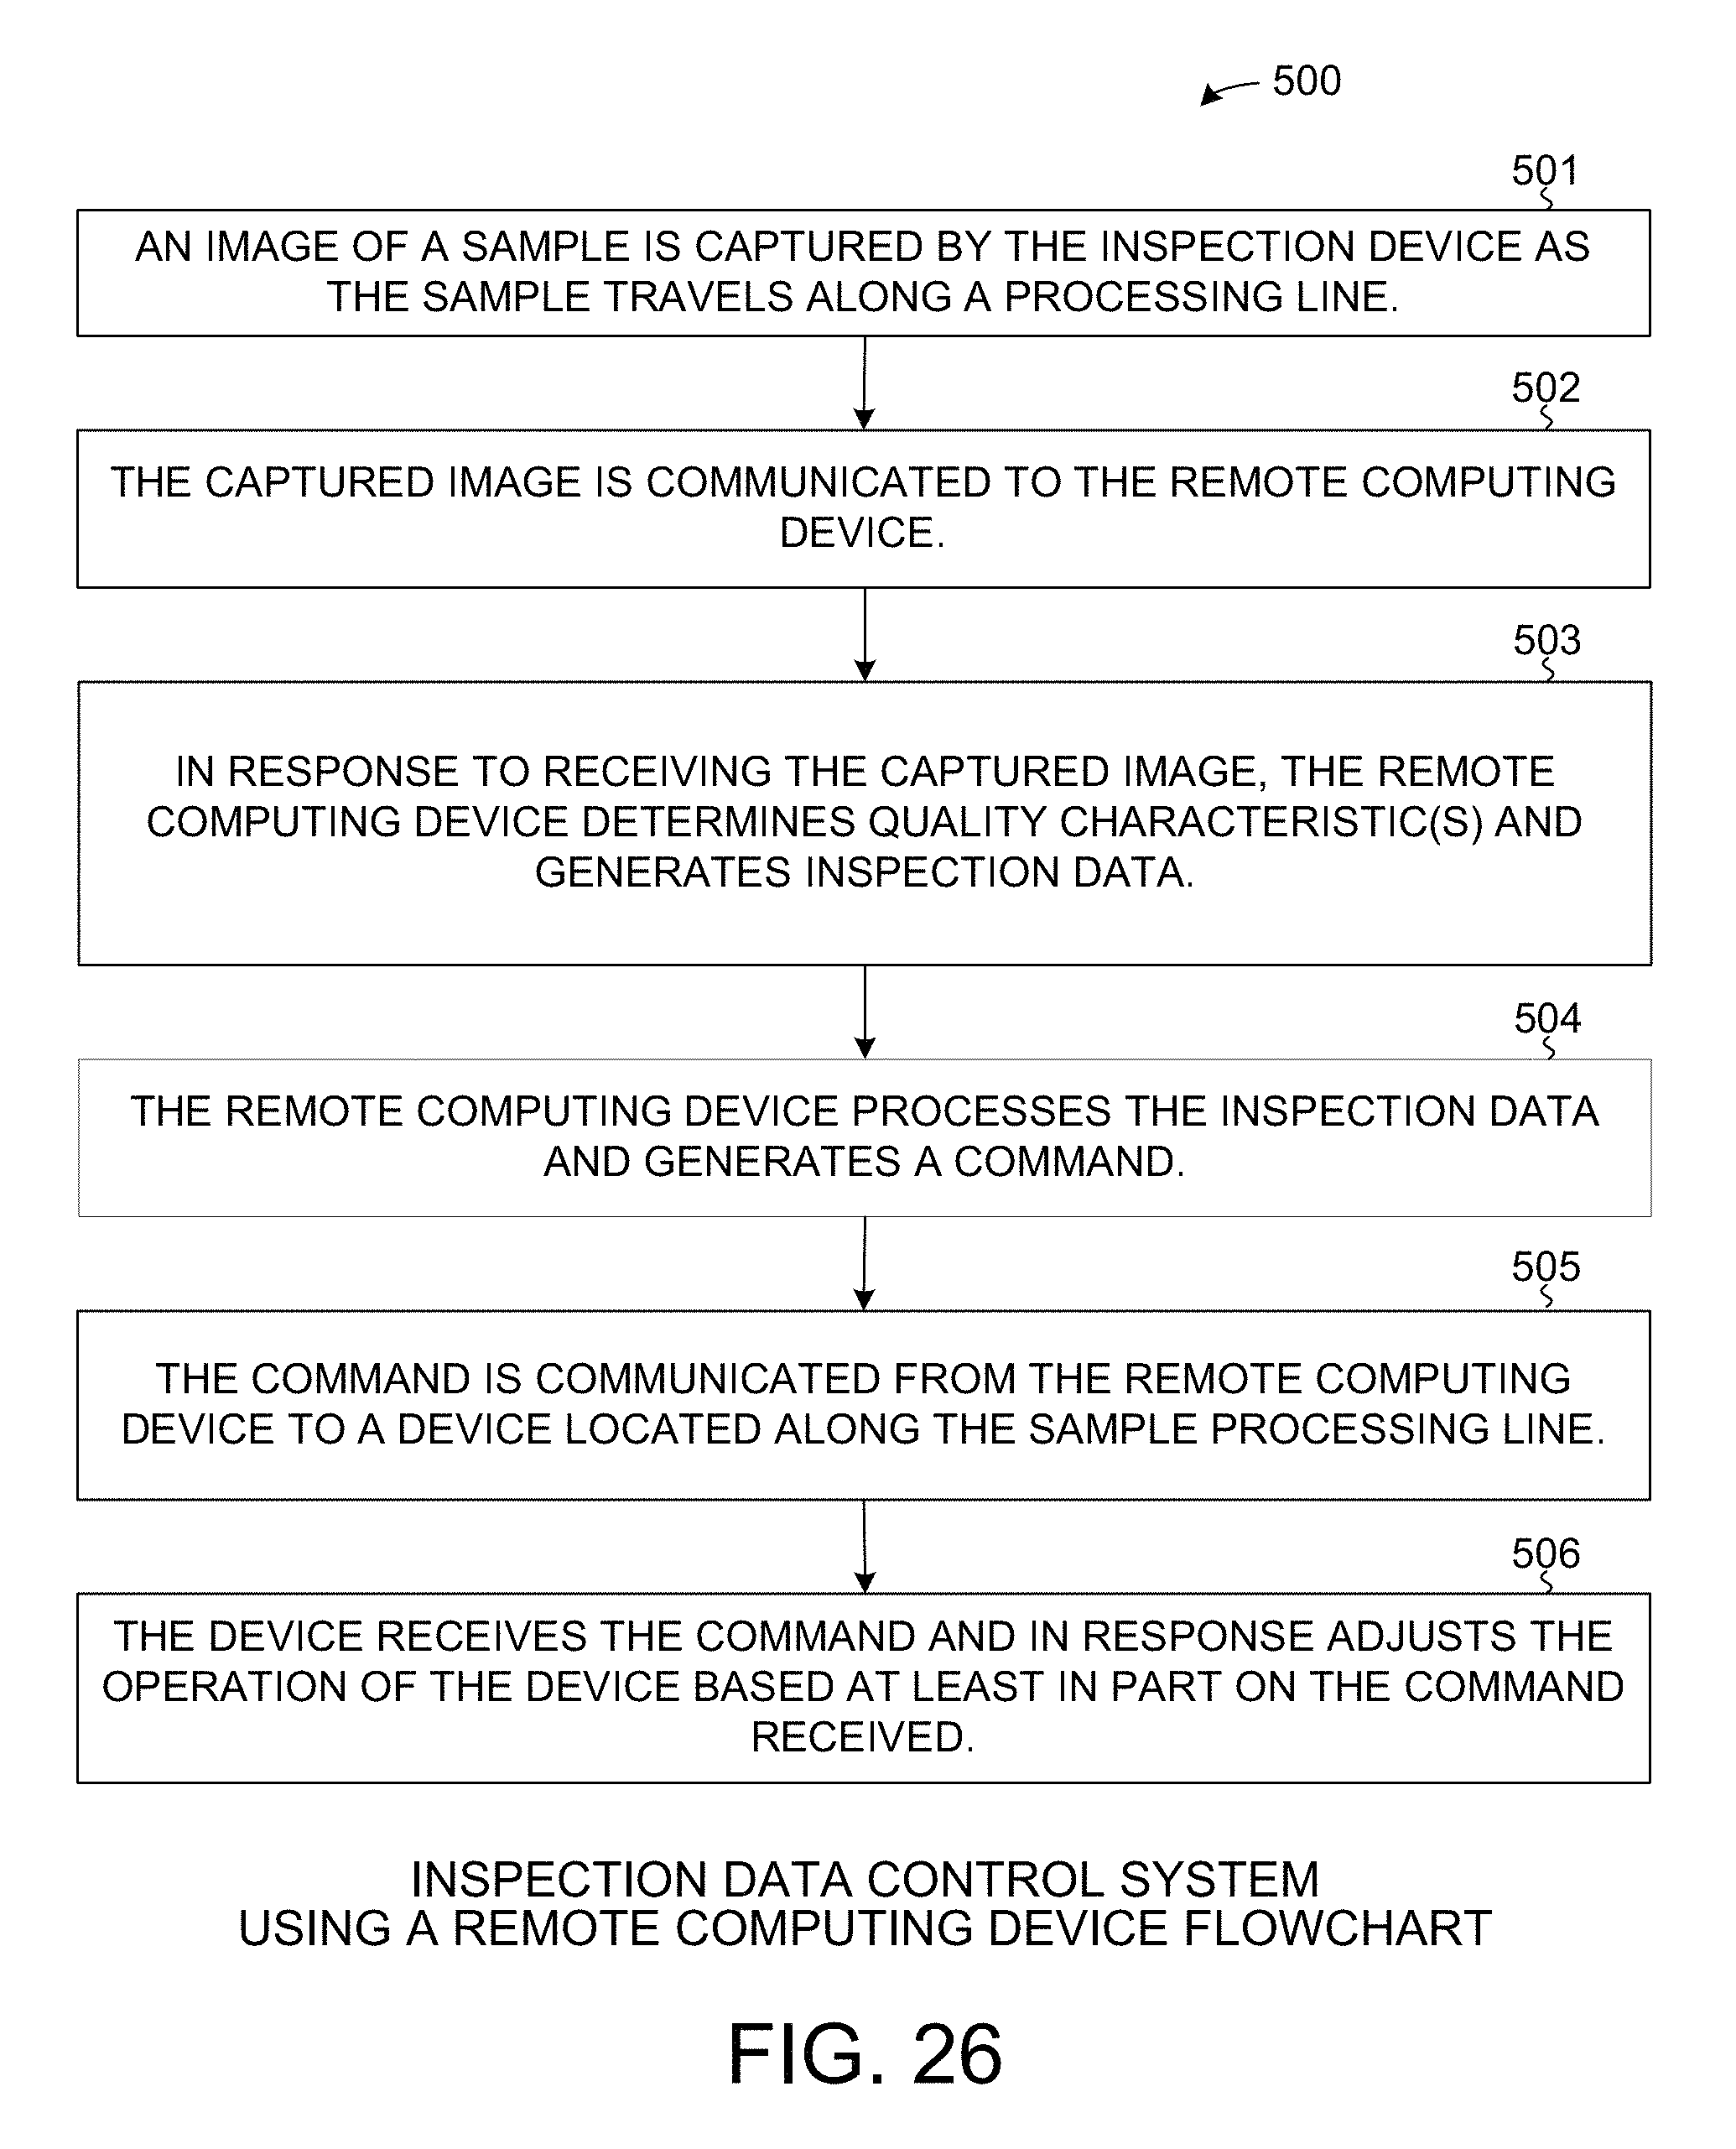
D00023
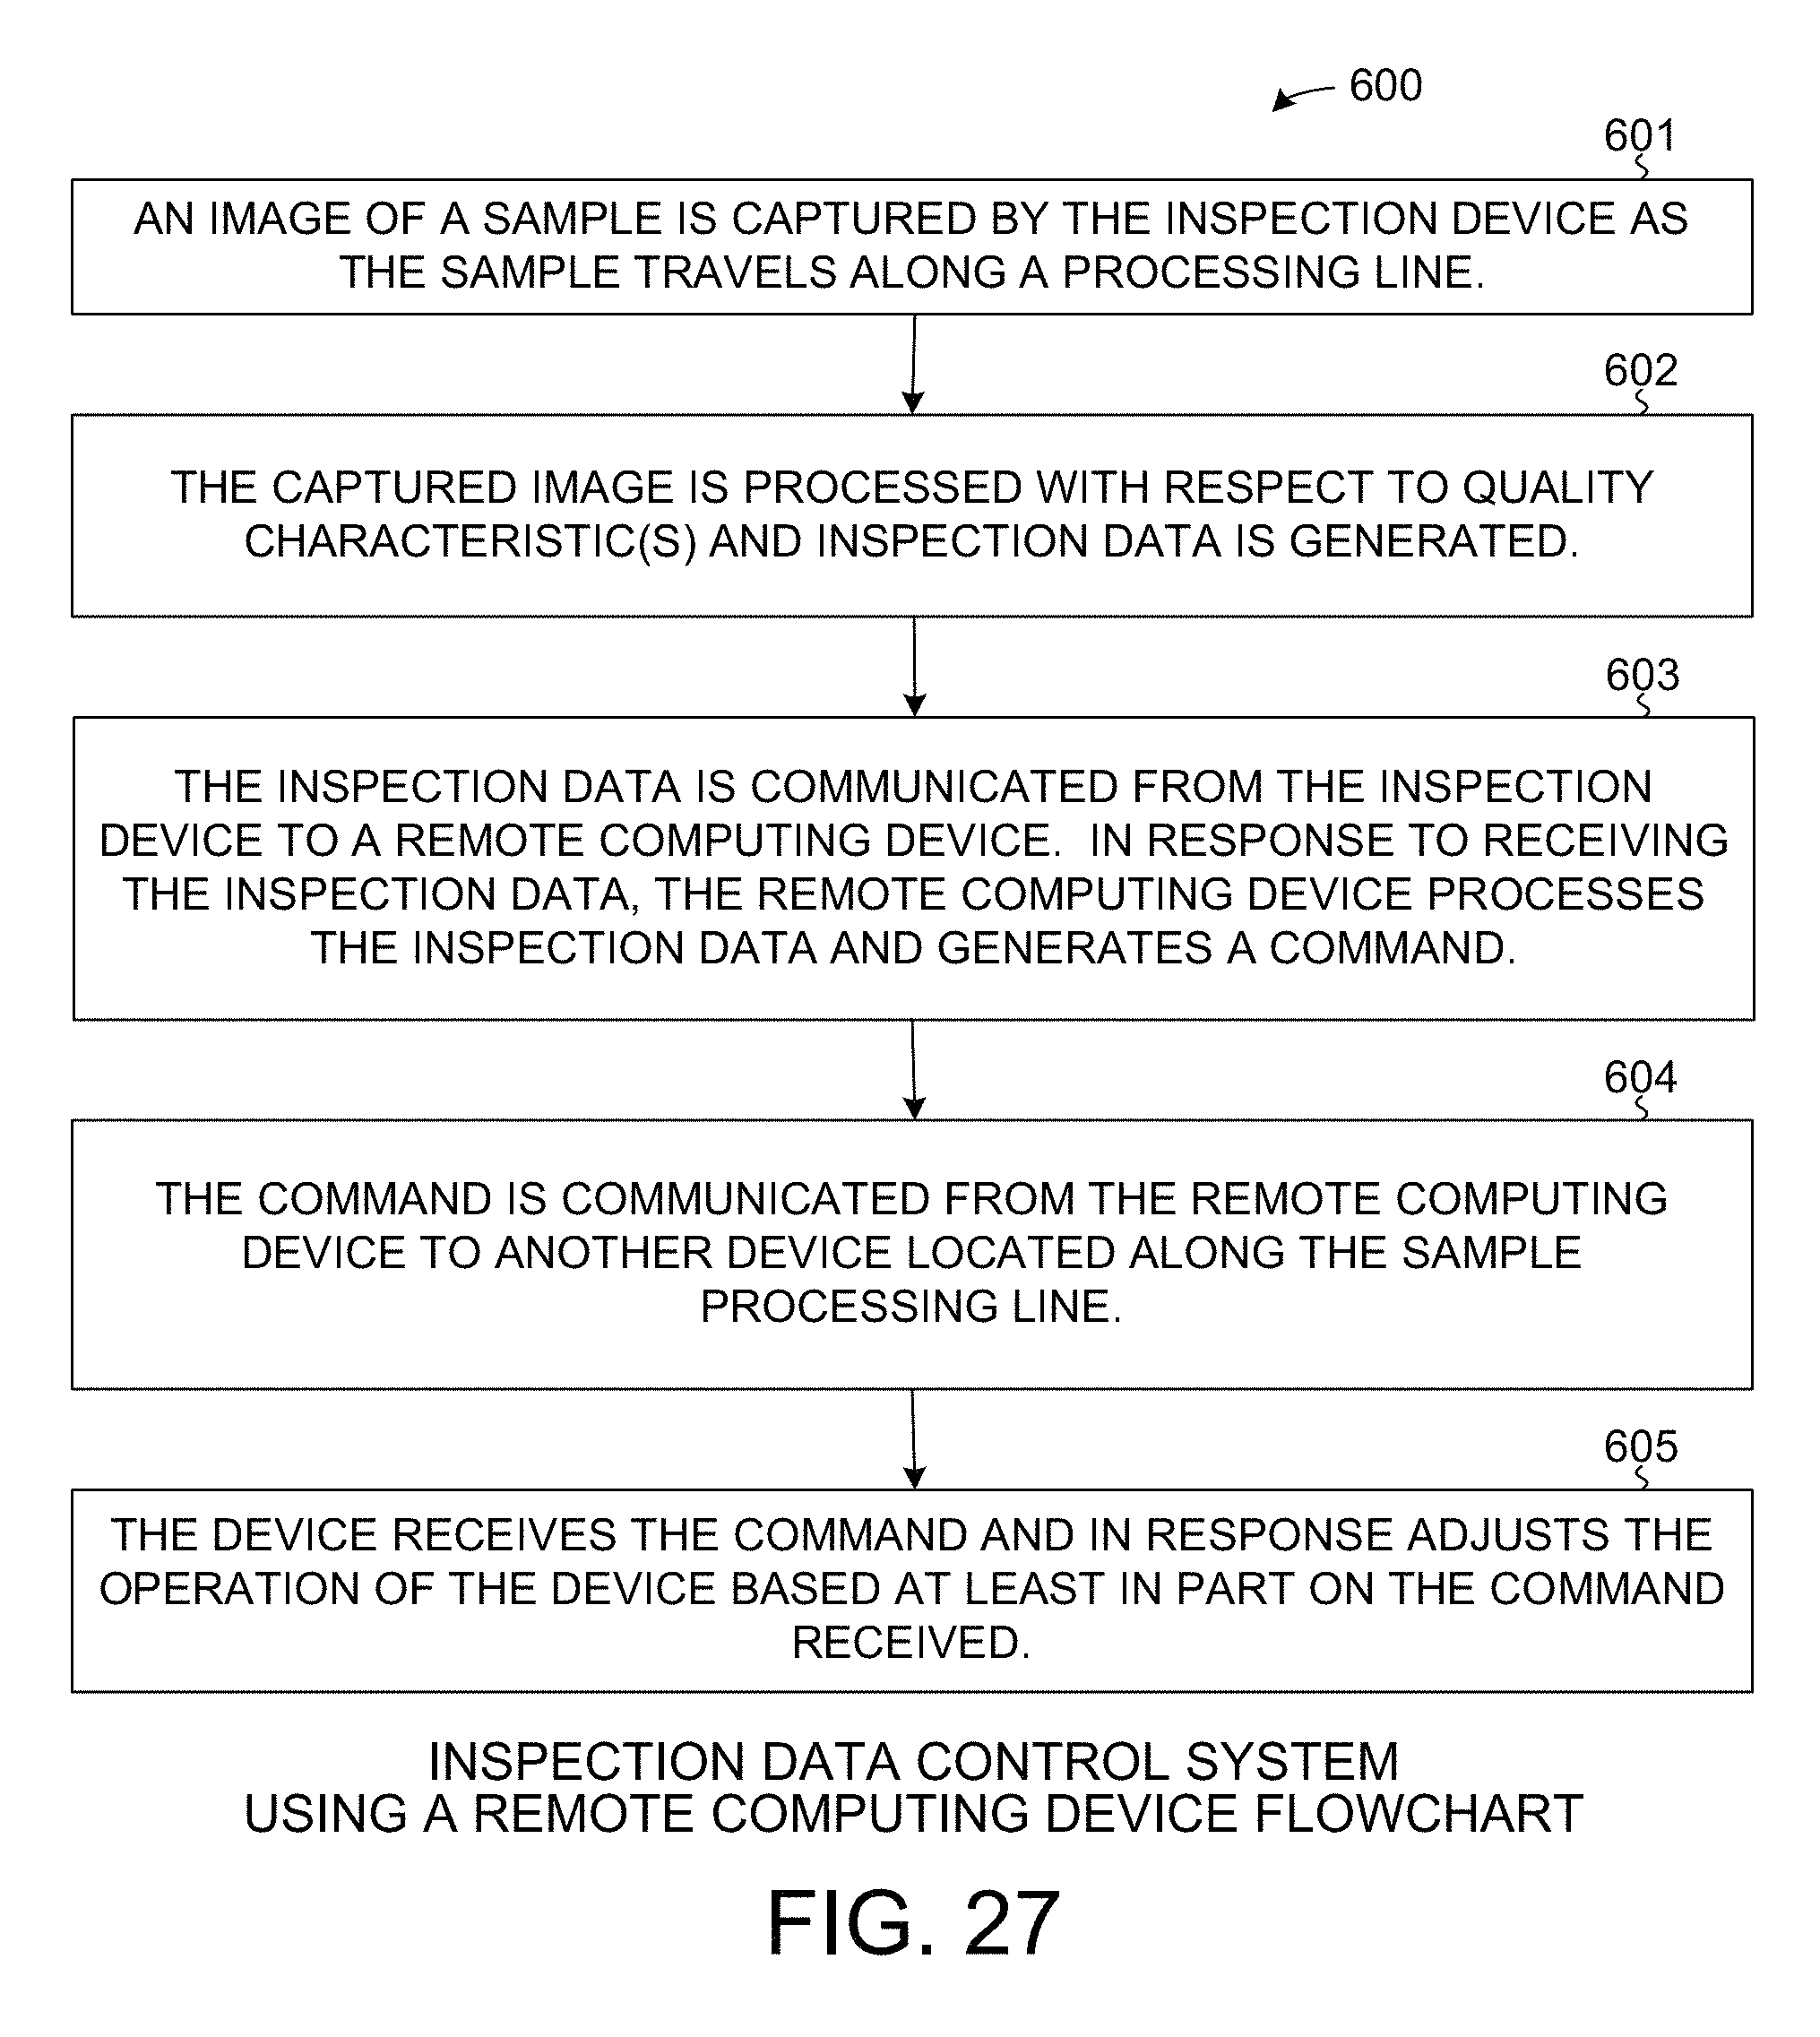
D00024
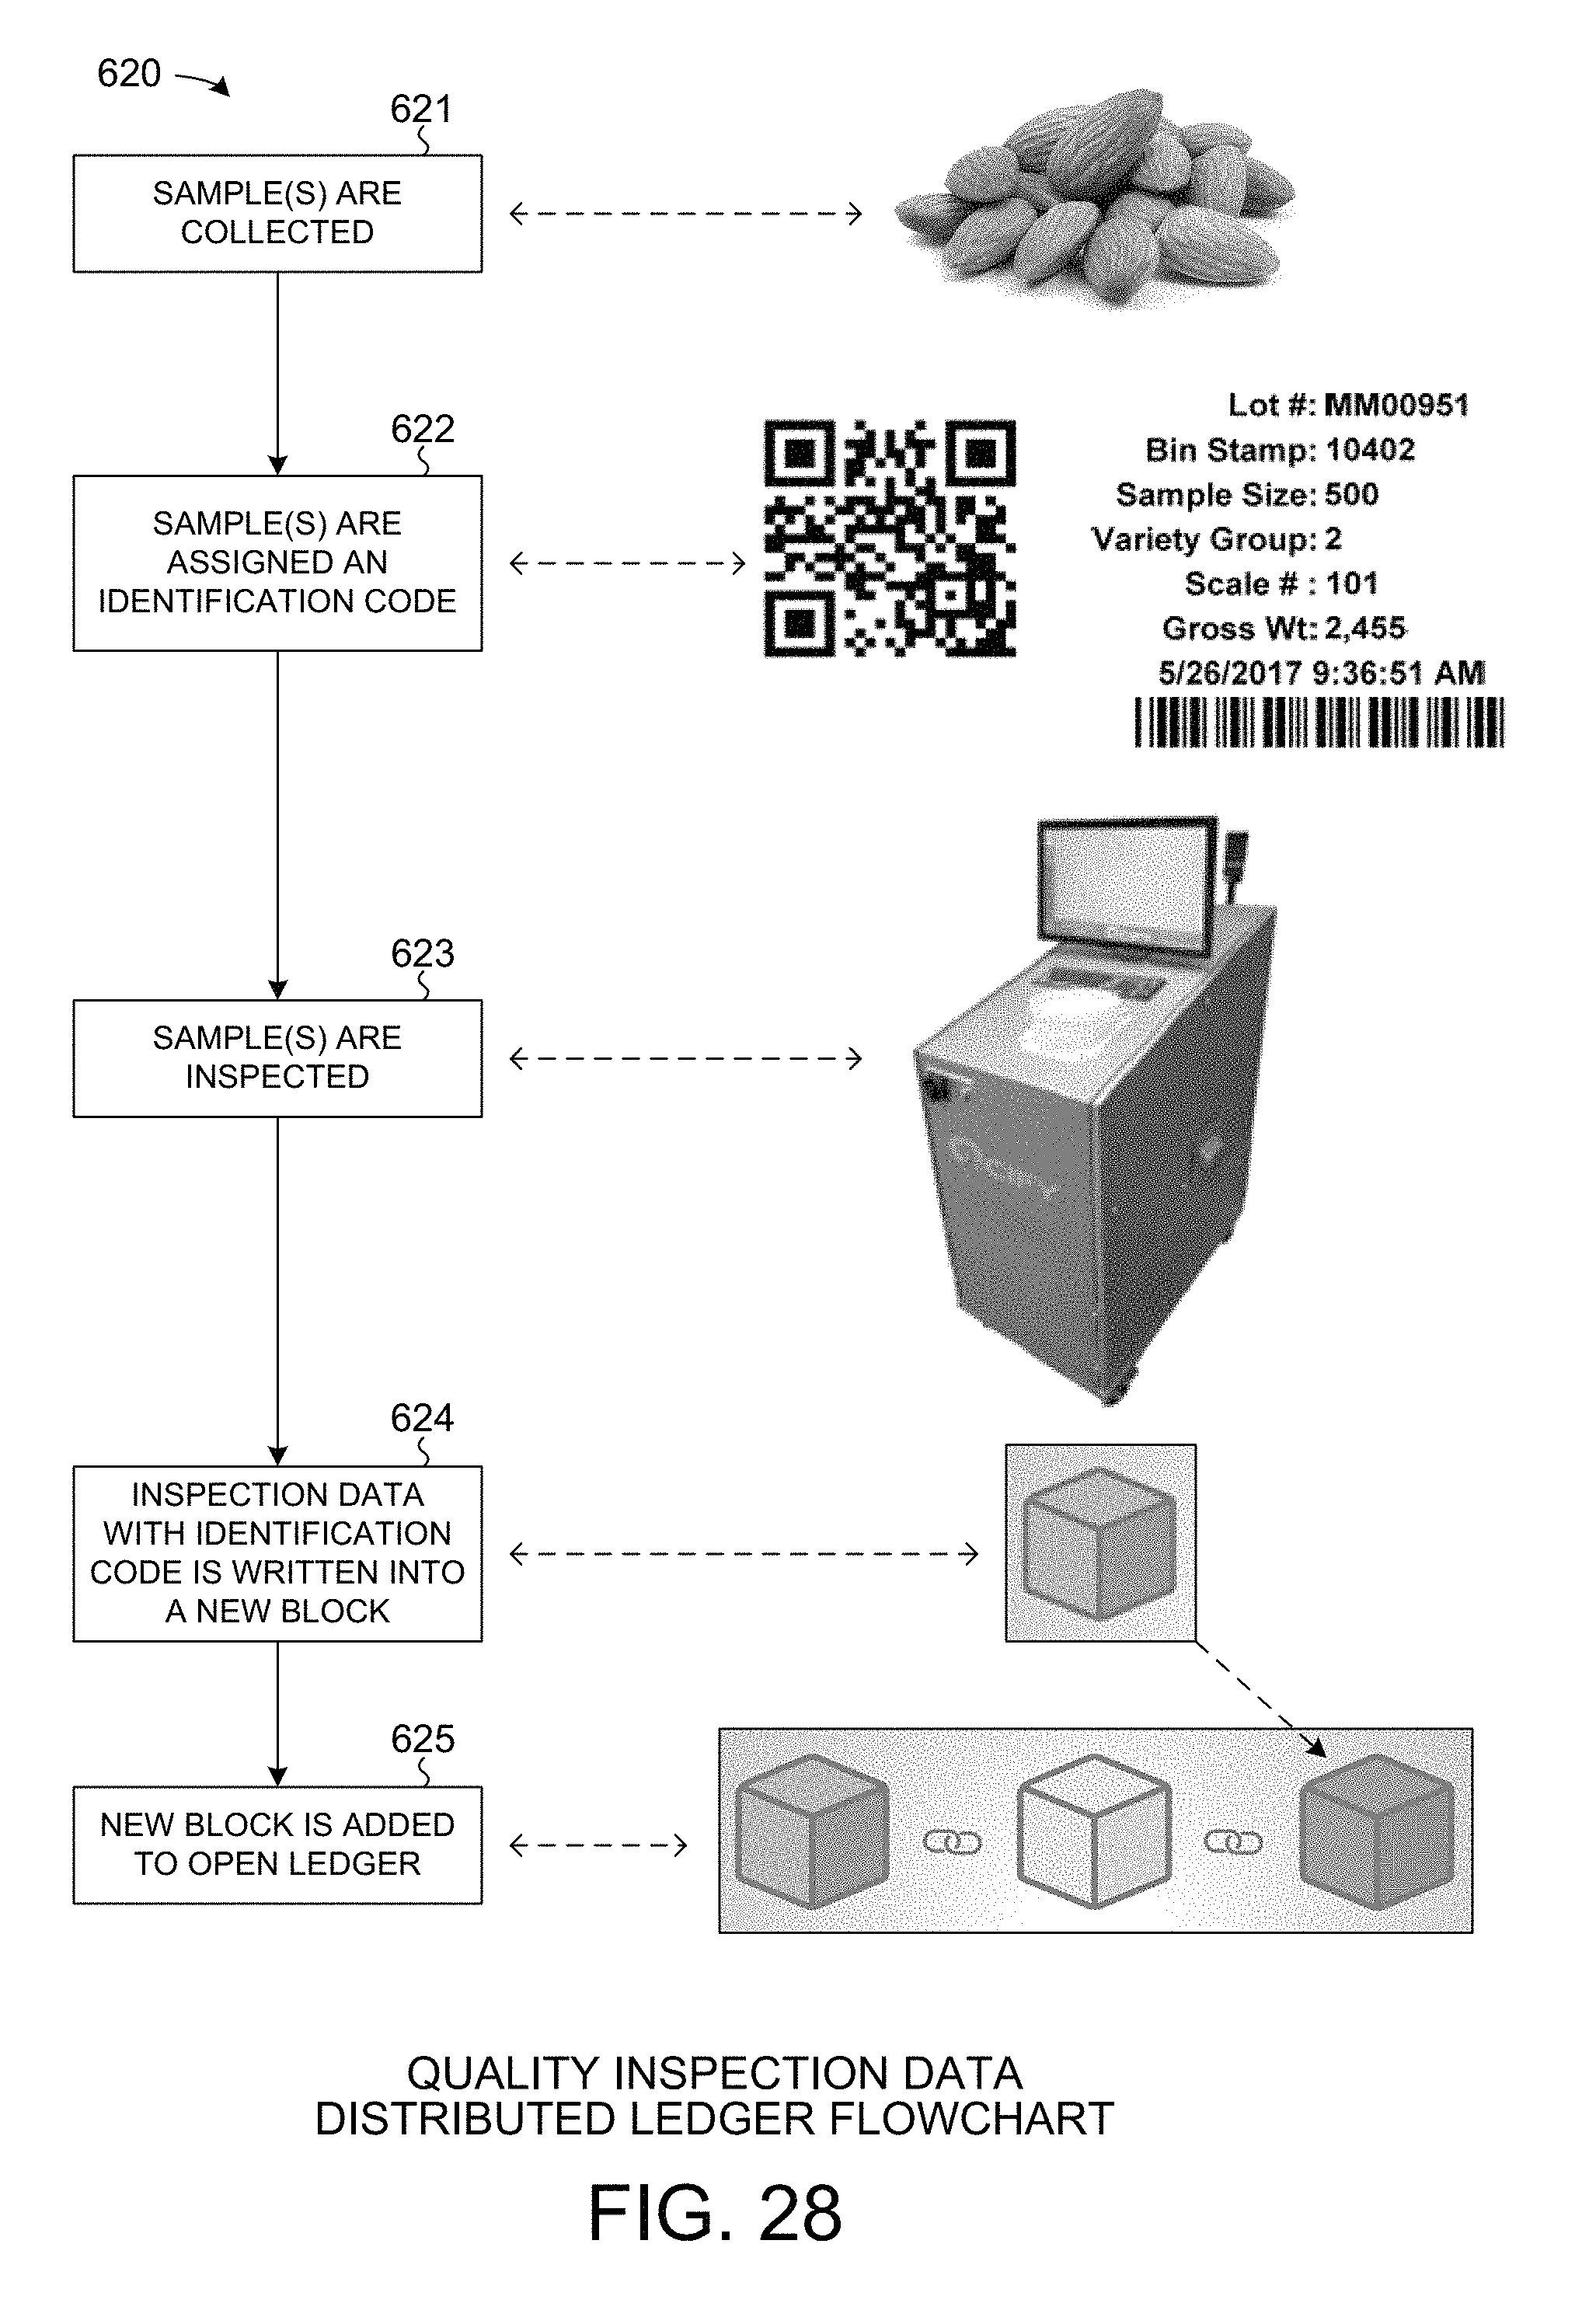
D00025
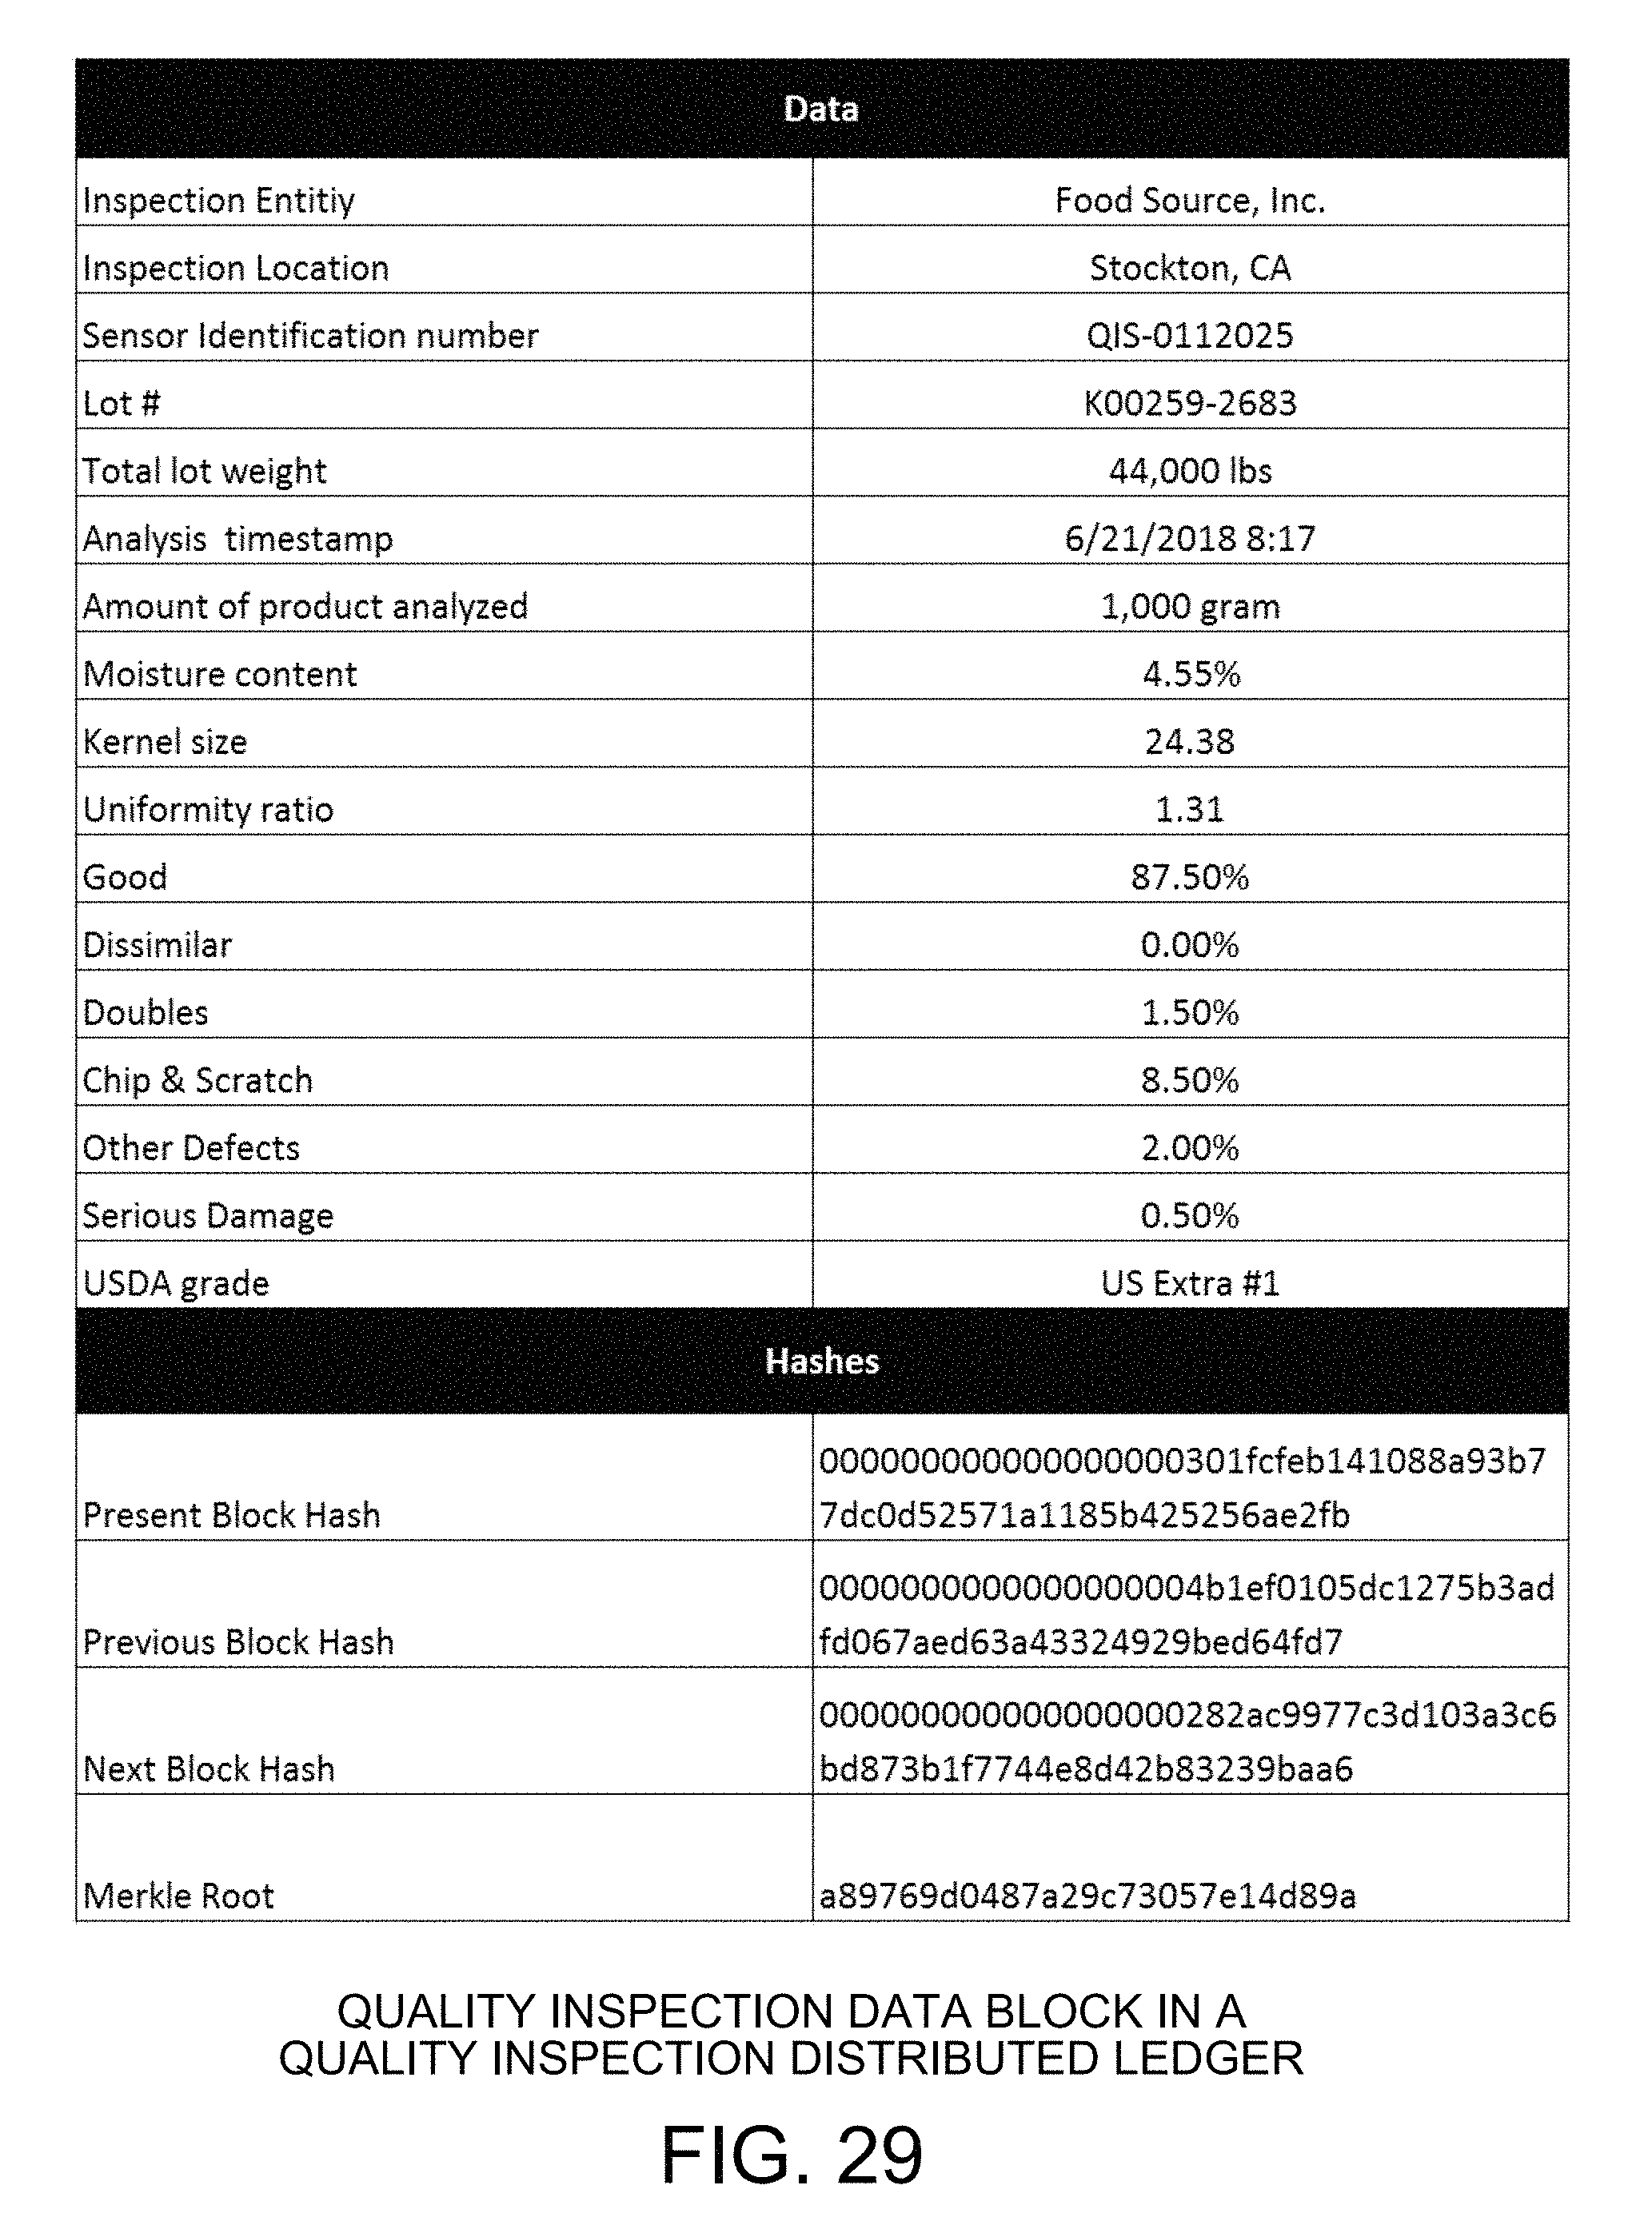
XML
uspto.report is an independent third-party trademark research tool that is not affiliated, endorsed, or sponsored by the United States Patent and Trademark Office (USPTO) or any other governmental organization. The information provided by uspto.report is based on publicly available data at the time of writing and is intended for informational purposes only.
While we strive to provide accurate and up-to-date information, we do not guarantee the accuracy, completeness, reliability, or suitability of the information displayed on this site. The use of this site is at your own risk. Any reliance you place on such information is therefore strictly at your own risk.
All official trademark data, including owner information, should be verified by visiting the official USPTO website at www.uspto.gov. This site is not intended to replace professional legal advice and should not be used as a substitute for consulting with a legal professional who is knowledgeable about trademark law.