Lactic acid bacteria and use thereof
Huang , et al.
U.S. patent number 10,238,696 [Application Number 15/369,441] was granted by the patent office on 2019-03-26 for lactic acid bacteria and use thereof. This patent grant is currently assigned to NEW BELLUS ENTERPRISES CO., LTD.. The grantee listed for this patent is New Bellus Enterprises Co., Ltd.. Invention is credited to Chun-Chih Huang, Wen-Ying Huang, Paik Seong Lim, Pin Hsiu Liu, Hsueh Fang Wang.

| United States Patent | 10,238,696 |
| Huang , et al. | March 26, 2019 |
Lactic acid bacteria and use thereof
Abstract
Lactic acid bacteria, which are isolated Lactococcus lactis subsp. lactis LL358 and isolated Lactobacillus salivarius LS159 respectively. By administering a composition comprising the lactic acid bacteria of the invention, renal injury, metabolic syndrome, hyperuricemia, hypocalcemia, and other disorders can be effectively ameliorated or treated.
| Inventors: | Huang; Chun-Chih (Tainan, TW), Huang; Wen-Ying (Tainan, TW), Wang; Hsueh Fang (Taichung, TW), Lim; Paik Seong (Taichung, TW), Liu; Pin Hsiu (Taichung, TW) | ||||||||||
|---|---|---|---|---|---|---|---|---|---|---|---|
| Applicant: |
|
||||||||||
| Assignee: | NEW BELLUS ENTERPRISES CO.,
LTD. (Tainan, TW) |
||||||||||
| Family ID: | 58408007 | ||||||||||
| Appl. No.: | 15/369,441 | ||||||||||
| Filed: | December 5, 2016 |
Prior Publication Data
| Document Identifier | Publication Date | |
|---|---|---|
| US 20170157183 A1 | Jun 8, 2017 | |
Foreign Application Priority Data
| Dec 7, 2015 [TW] | 104140983 A | |||
| Current U.S. Class: | 1/1 |
| Current CPC Class: | C12R 1/225 (20130101); C12N 1/20 (20130101); A23L 33/135 (20160801); A61K 35/744 (20130101); A61K 35/747 (20130101); C12R 1/46 (20130101); A23V 2002/00 (20130101); A23V 2002/00 (20130101); A23V 2200/32 (20130101); A23Y 2220/49 (20130101); A23V 2002/00 (20130101); A23V 2200/32 (20130101); A23Y 2220/79 (20130101) |
| Current International Class: | A61K 35/744 (20150101); C12N 1/20 (20060101); A23L 33/135 (20160101); A61K 35/747 (20150101) |
References Cited [Referenced By]
U.S. Patent Documents
| 8541223 | September 2013 | Tsuboi |
| 2112217 | Oct 2009 | EP | |||
| WO2011078781 | Jun 2011 | WO | |||
Other References
|
GenBank: CP010050.1, Dec. 23, 2014. cited by applicant . GenBank: KF879109.1, Nov. 30, 2014. cited by applicant . GenBank: AB911506.1, Feb. 26, 2014. cited by applicant . GenBank: AB911465.1, Feb. 26, 2014. cited by applicant . http://newbellus.en.taiwantrade.com/product/probio-o-complex-powder-828315- .html, Mar. 17, 2015. cited by applicant. |
Primary Examiner: Ware; Deborah K
Attorney, Agent or Firm: Chow; Ming Sinorica, LLC
Claims
What is claimed is:
1. A composition of lactic acid bacteria comprising an isolated Lactococcus lactis subsp. lactis LL358 having Accession Number CGMCC 13317 and 16S rDNA of SEQ ID NO:1, an isolated Lactobacillus salivarius LS159 having Accession Number CGMCC 13316 and 16S rDNA of SEQ ID NO:2, and Lactobacillus pentosus, wherein the proportion of Lactococcus lactis subsp. lactis LL358, Lactobacillus salivarius LS159, and Lactobacillus pentosus in the composition is 1:1:1.
2. The composition according to claim 1, which is a pharmaceutical composition.
3. The composition according to claim 1, which is a dietary supplement.
4. A method of treating chronic kidney disease in a subject, the method comprising administering to the subject an effective amount of the composition according to claim 1 in the maintenance of renal functions of impaired kidneys.
5. A method of treating metabolic syndrome in a subject, the method comprising administering to the subject an effective amount of the composition according to claim 1 in the amelioration of metabolic syndrome.
6. A method of ameliorating hyperuricemia in a subject, the method comprising administering to the subject an effective amount of the composition according to claim 1 in the amelioration of hyperuricemia.
7. A method of ameliorating hypocalcemia in a subject, the method comprising administering to the subject an effective amount of the composition according to claim 1 in the amelioration of hypocalcemia.
Description
TECHNICAL FIELD
The present invention relates to probiotics, and particularly to novel lactic acid bacteria and use thereof.
PRIOR ART
The chronic kidney disease is classified into 5 stages according to the estimated Glomerular Filtration Rate (eGFR) and the injury to the kidney, where in stages 1-2 (eGFR>60 mL/min/1.73 m.sup.2), no obvious symptoms are present; in stages 3-4 (eGFR 15-60 mL/min/1.73 m.sup.2), mild or moderate anaemia, fatigue, edema, and itchy skin occur, so that the chronic kidney disease has generally been progressed to stages 3-4 when the symptoms are manifested; and in stage 5 (eGFR<15 mL/min/1.73 m.sup.2), moderate or severe anaemia, edema, and inappetence take place. Generally, the patients in stage 3 or higher need to be treated with drugs actively, and dialysis treatment is necessitated in case of persistent deterioration.
It can be known from the statistical data above that the chronic kidney disease causes a threat to personal health, and also the high expense for treating chronic kidney disease becomes a family, social and national issue.
Although treatment with drugs can greatly control and slow down the progression of chronic kidney disease, the side effects of the drugs makes the patients incompliant. The problem generally encountered during the treatment of chronic kidney disease is that most of the patients with stages 3-4 chronic kidney disease do not receive any or consecutive treatment with drugs, such that the chronic kidney disease is deteriorated rapidly into end-stage renal disease, which can only be treated by dialysis. This not only has a great impact on the quality of life and health condition of the patients, but also causes a heavy burden to the family and society.
Lactic acid bacteria are microorganisms able to produce lactic acid through fermentation of hydrocarbons. It is confirmed in literatures that lactic acid bacteria have a variety of healthcare effects for human, including maintaining the intestinal microflora, increasing the immune function, improving the metabolism, and others. Therefore, lactic acid bacteria are considered to be vital probiotics in the intestinal microflora. Wastes are failed to be cleared from the patients with chronic kidney disease frequently due to the loss of normal kidney function, such that toxins such as uremic substances enter the body through the gastrointestinal tract, thereby affecting the health of patients. Therefore, recent studies are focused on exploration of the use of lactic acid bacteria in improvement of the renal functions, and it is expected to obtain a method for effectively delay or treat chronic kidney disease.
SUMMARY OF THE INVENTION
The present invention mainly aims at providing a novel lactic acid bacterium, which is isolated Accession Number, deposited in Institute of Microbiology Chinese Academy of Science (China) under Accession Number CGMCC 13317, on 2016/11/18. Lactococcus lactis subsp. lactis LL358 is also deposited in Food Industry Research and Development Institute (Taiwan) under Accession Number BCRC910699, on 2015/9/4.
The present invention further aims at providing a novel lactic acid bacterium, which is isolated Lactobacillus salivarius L5159, deposited in Institute of Microbiology Chinese Academy of Science (China) under Accession Number CGMCC 13316, on 2016 Nov. 18. Lactobacillus salivarius L5159 is also deposited in Food Industry Research and Development Institute (Taiwan) under Accession Number BCRC910700, on 2015 Sep. 4.
The novel lactic acid bacteria are isolated from pickles, and are a Gram positive bacterium which have no catalyst, but have an oxidase and mobility, produce no endospores, and are able to grow in aerobic and anaerobic environments and allowed to be cultured in a Lactobacillus MRS medium at a temperature of 37.degree. C.
The present invention further aims at providing a composition, which comprises at least the novel lactic acid bacteria, and can modify the occurrence or delay the progression of a diseases when administered in an effective amount to a subject.
In an embodiment of the present invention, the composition disclosed in the present invention comprises at least one of Lactococcus lactis subsp. Lactis LL358 CGMCC 13317, Lactobacillus salivarius LS159 CGMCC 13316, and Lactobacillus pentosus. Preferably, the composition comprises Lactococcus lactis subsp. lactis LL358, Lactobacillus salivarius LS159, and Lactobacillus pentosus.
In an embodiment of the present invention, the composition is a pharmaceutical composition.
In an embodiment of the present invention, the composition is a dietary supplement.
The composition is provided for treating or preventing chronic kidney disease in a subject suffering from the chronic kidney disease. That is, the use in maintaining the renal function of the impaired kidney, treating and/or preventing metabolic syndrome and its signs, preventing hyperuricemia, and ameliorating and/or preventing hypocalcemia, as well as in slowing down or avoiding symptoms elicited by chronic kidney disease, reducing the mortality, maintaining a good quality of life, and delaying the deterioration of the kidney disease can be achieved, by administering effective amount of the composition to the subject.
Preferably, the composition can be prepared into various forms as desired by the consumer, for example, a solid state, a liquid state, a powder, tablets, or a gel; or be processed into various products, for example, food, food additives, and beverages.
BRIEF DESCRIPTION OF THE DRAWINGS
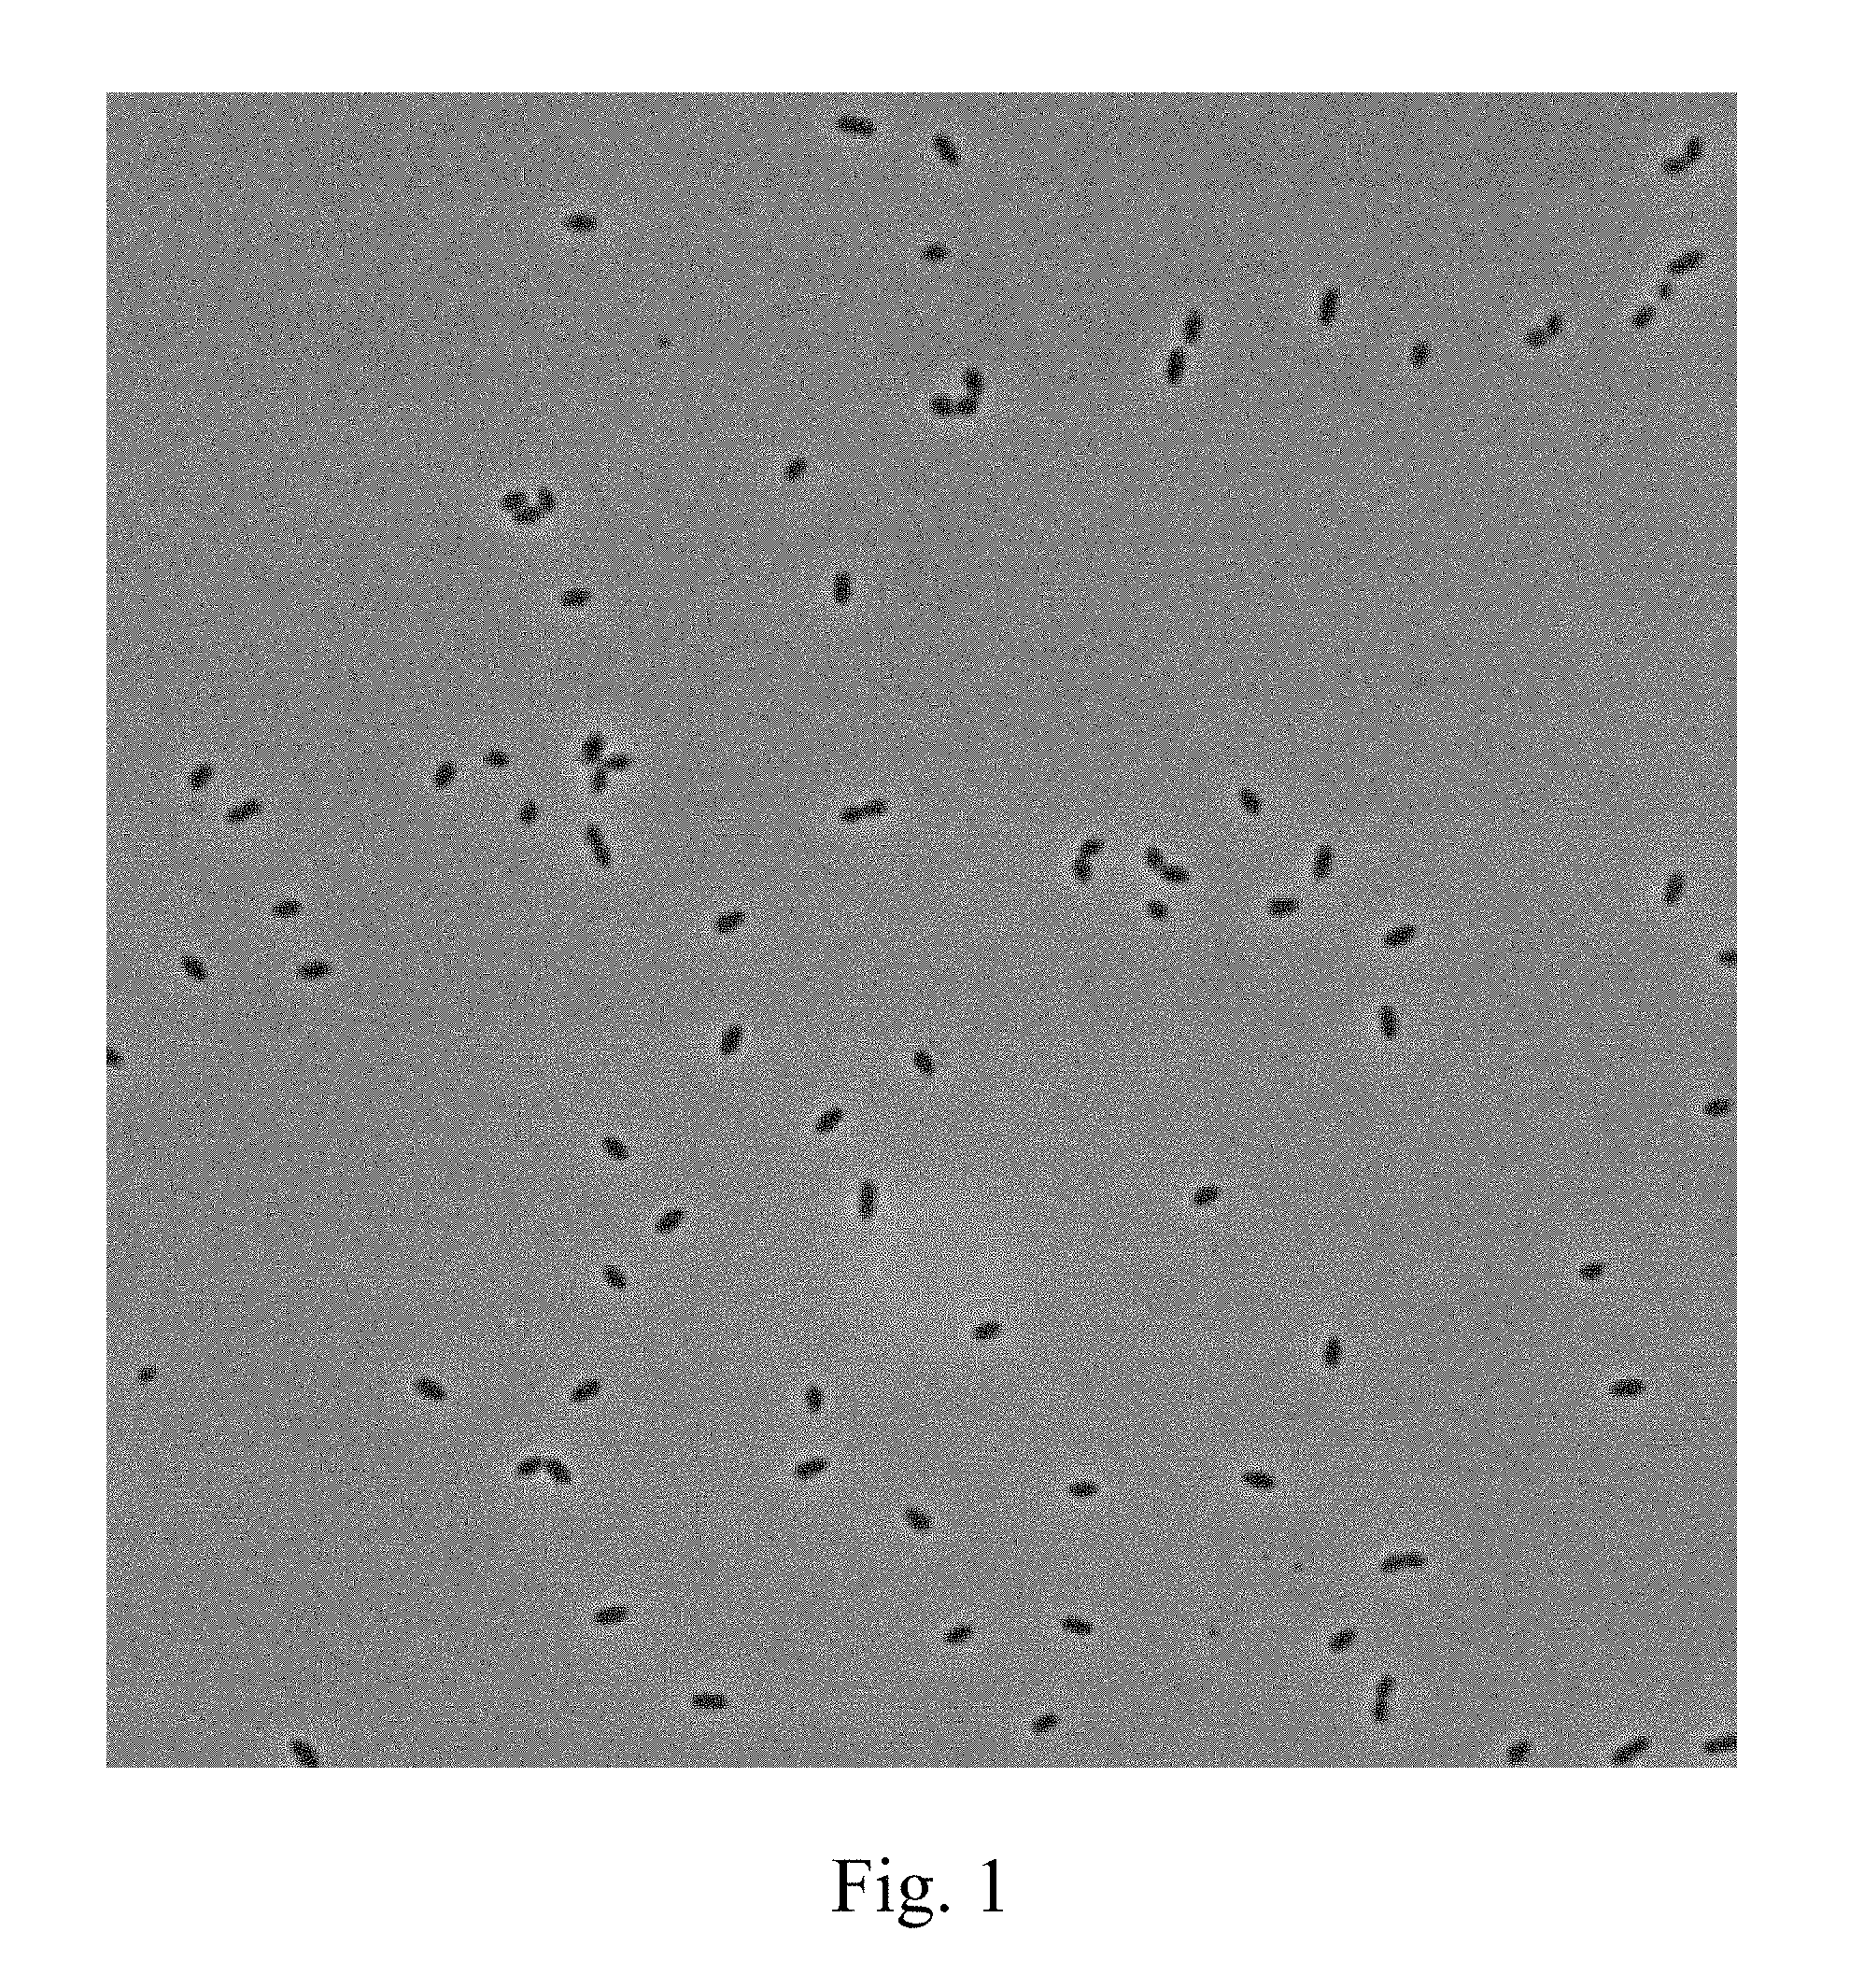
FIG. 1 shows Lactococcus lactis subsp. lactis LL358 observed under a microscope.
FIG. 2 shows Lactobacillus salivarius LS159 observed under a microscope.
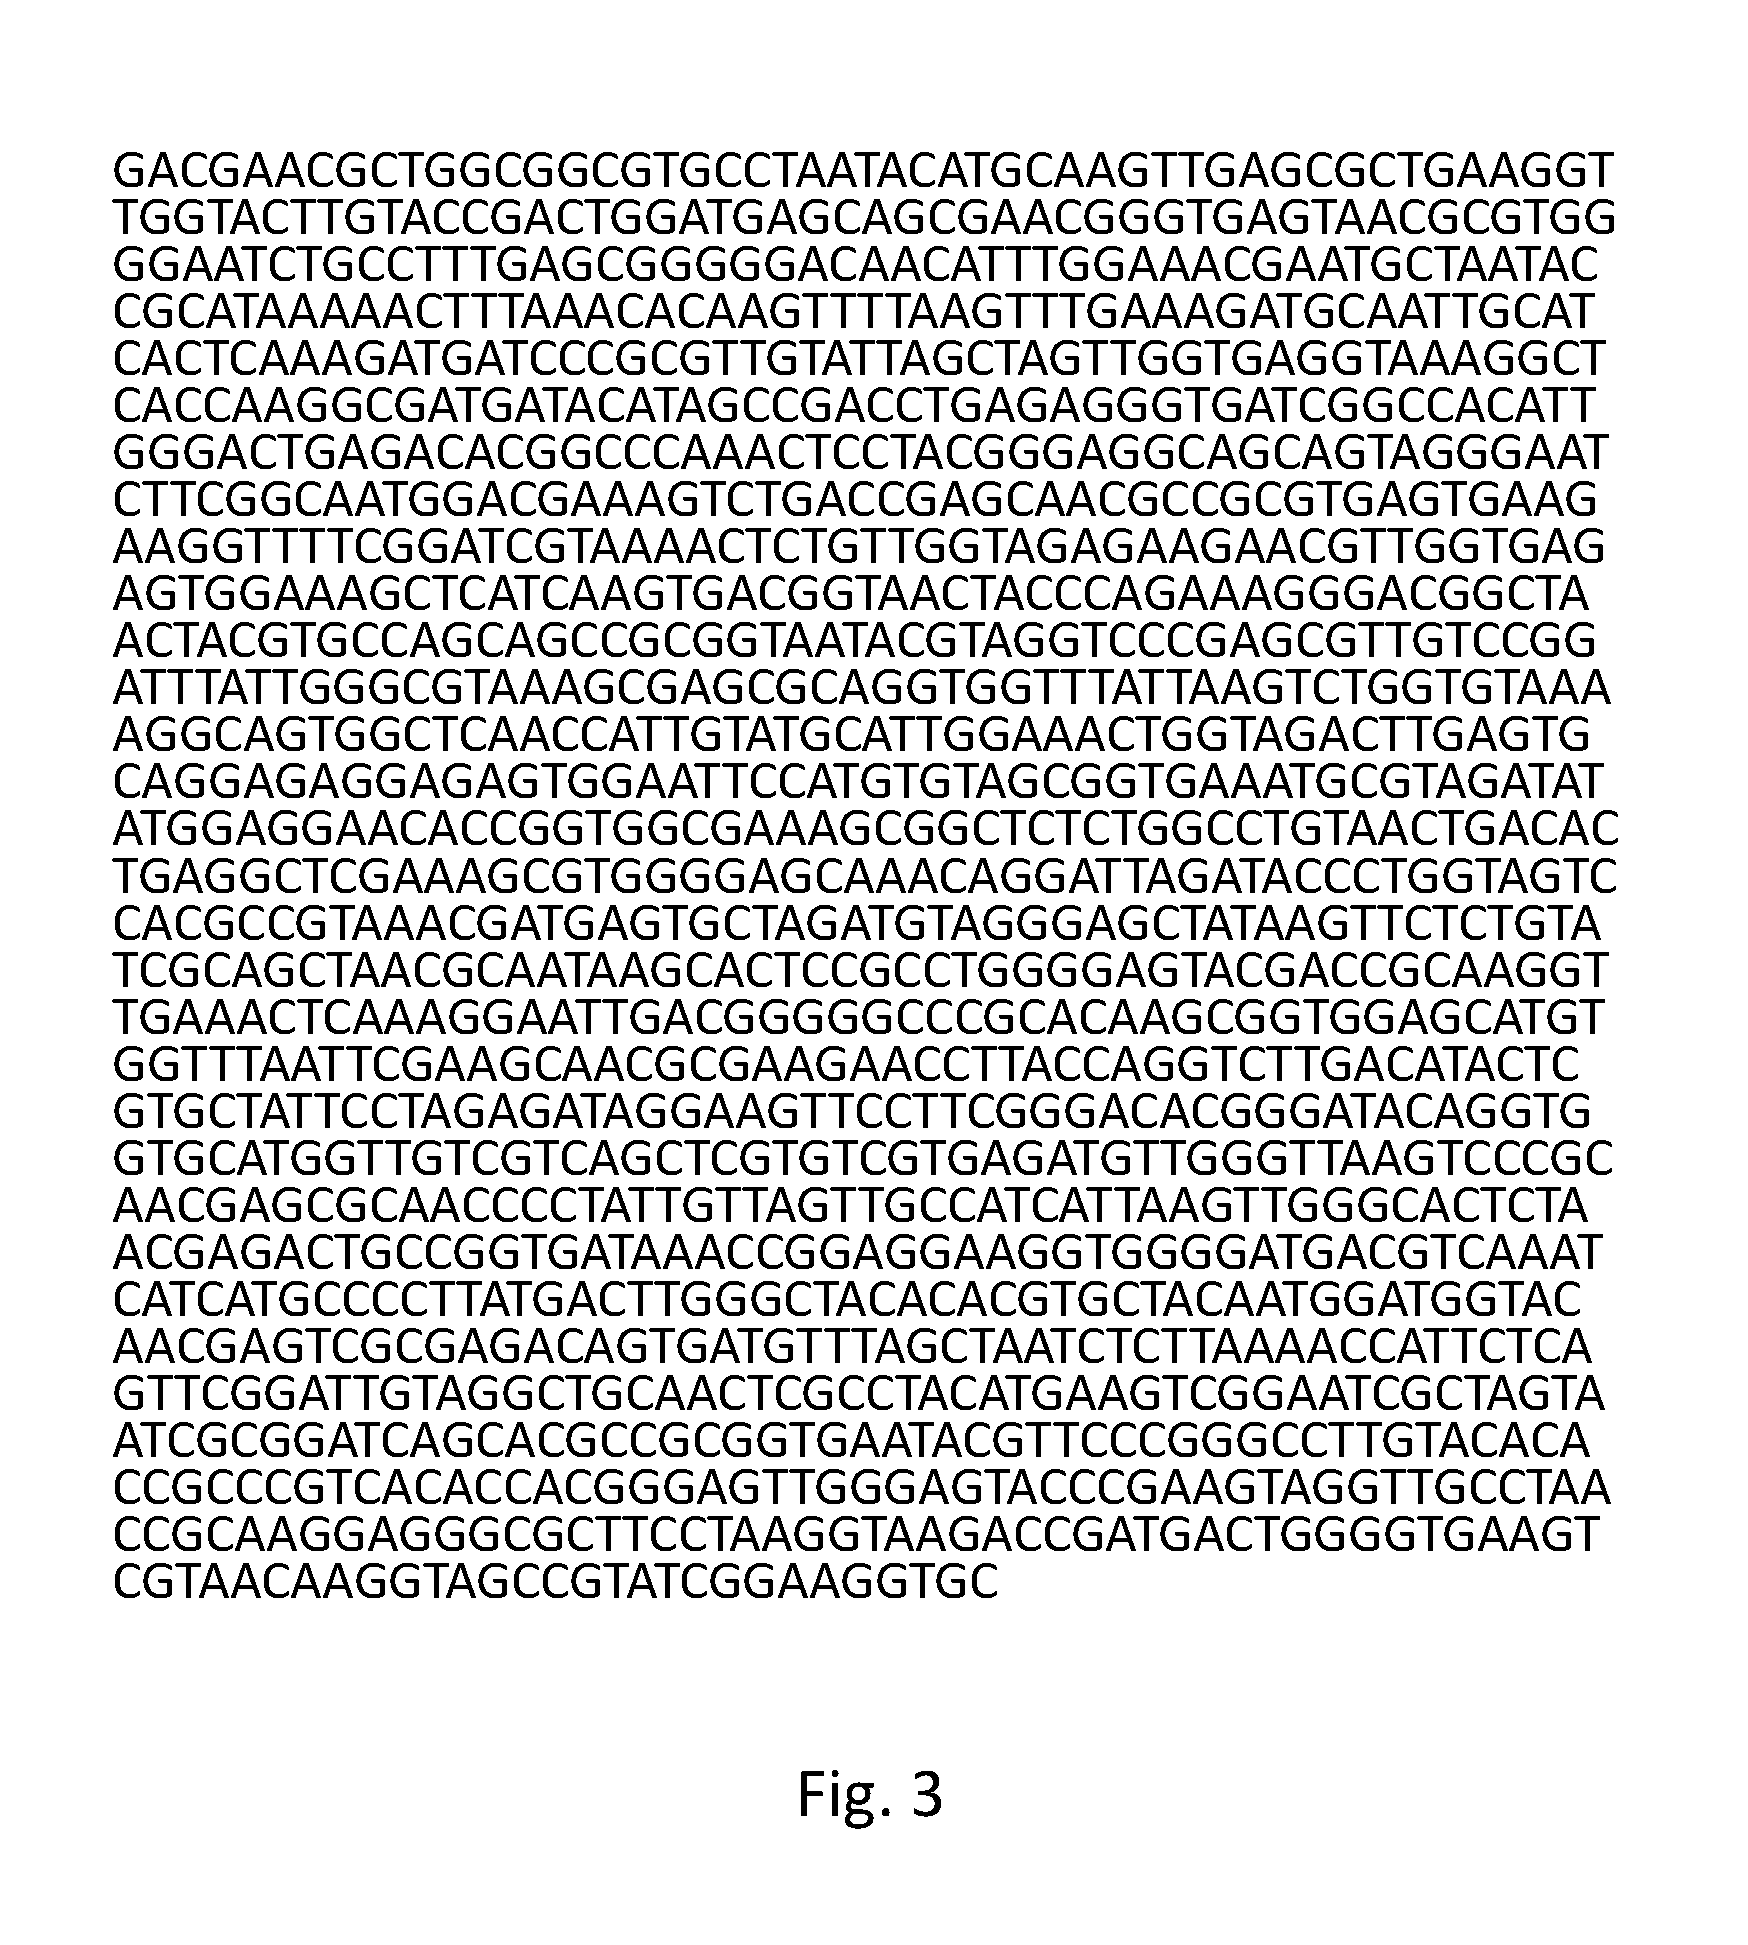
FIG. 3 shows a 16S rDNA sequence of Lactococcus lactis subsp. lactis LL358.
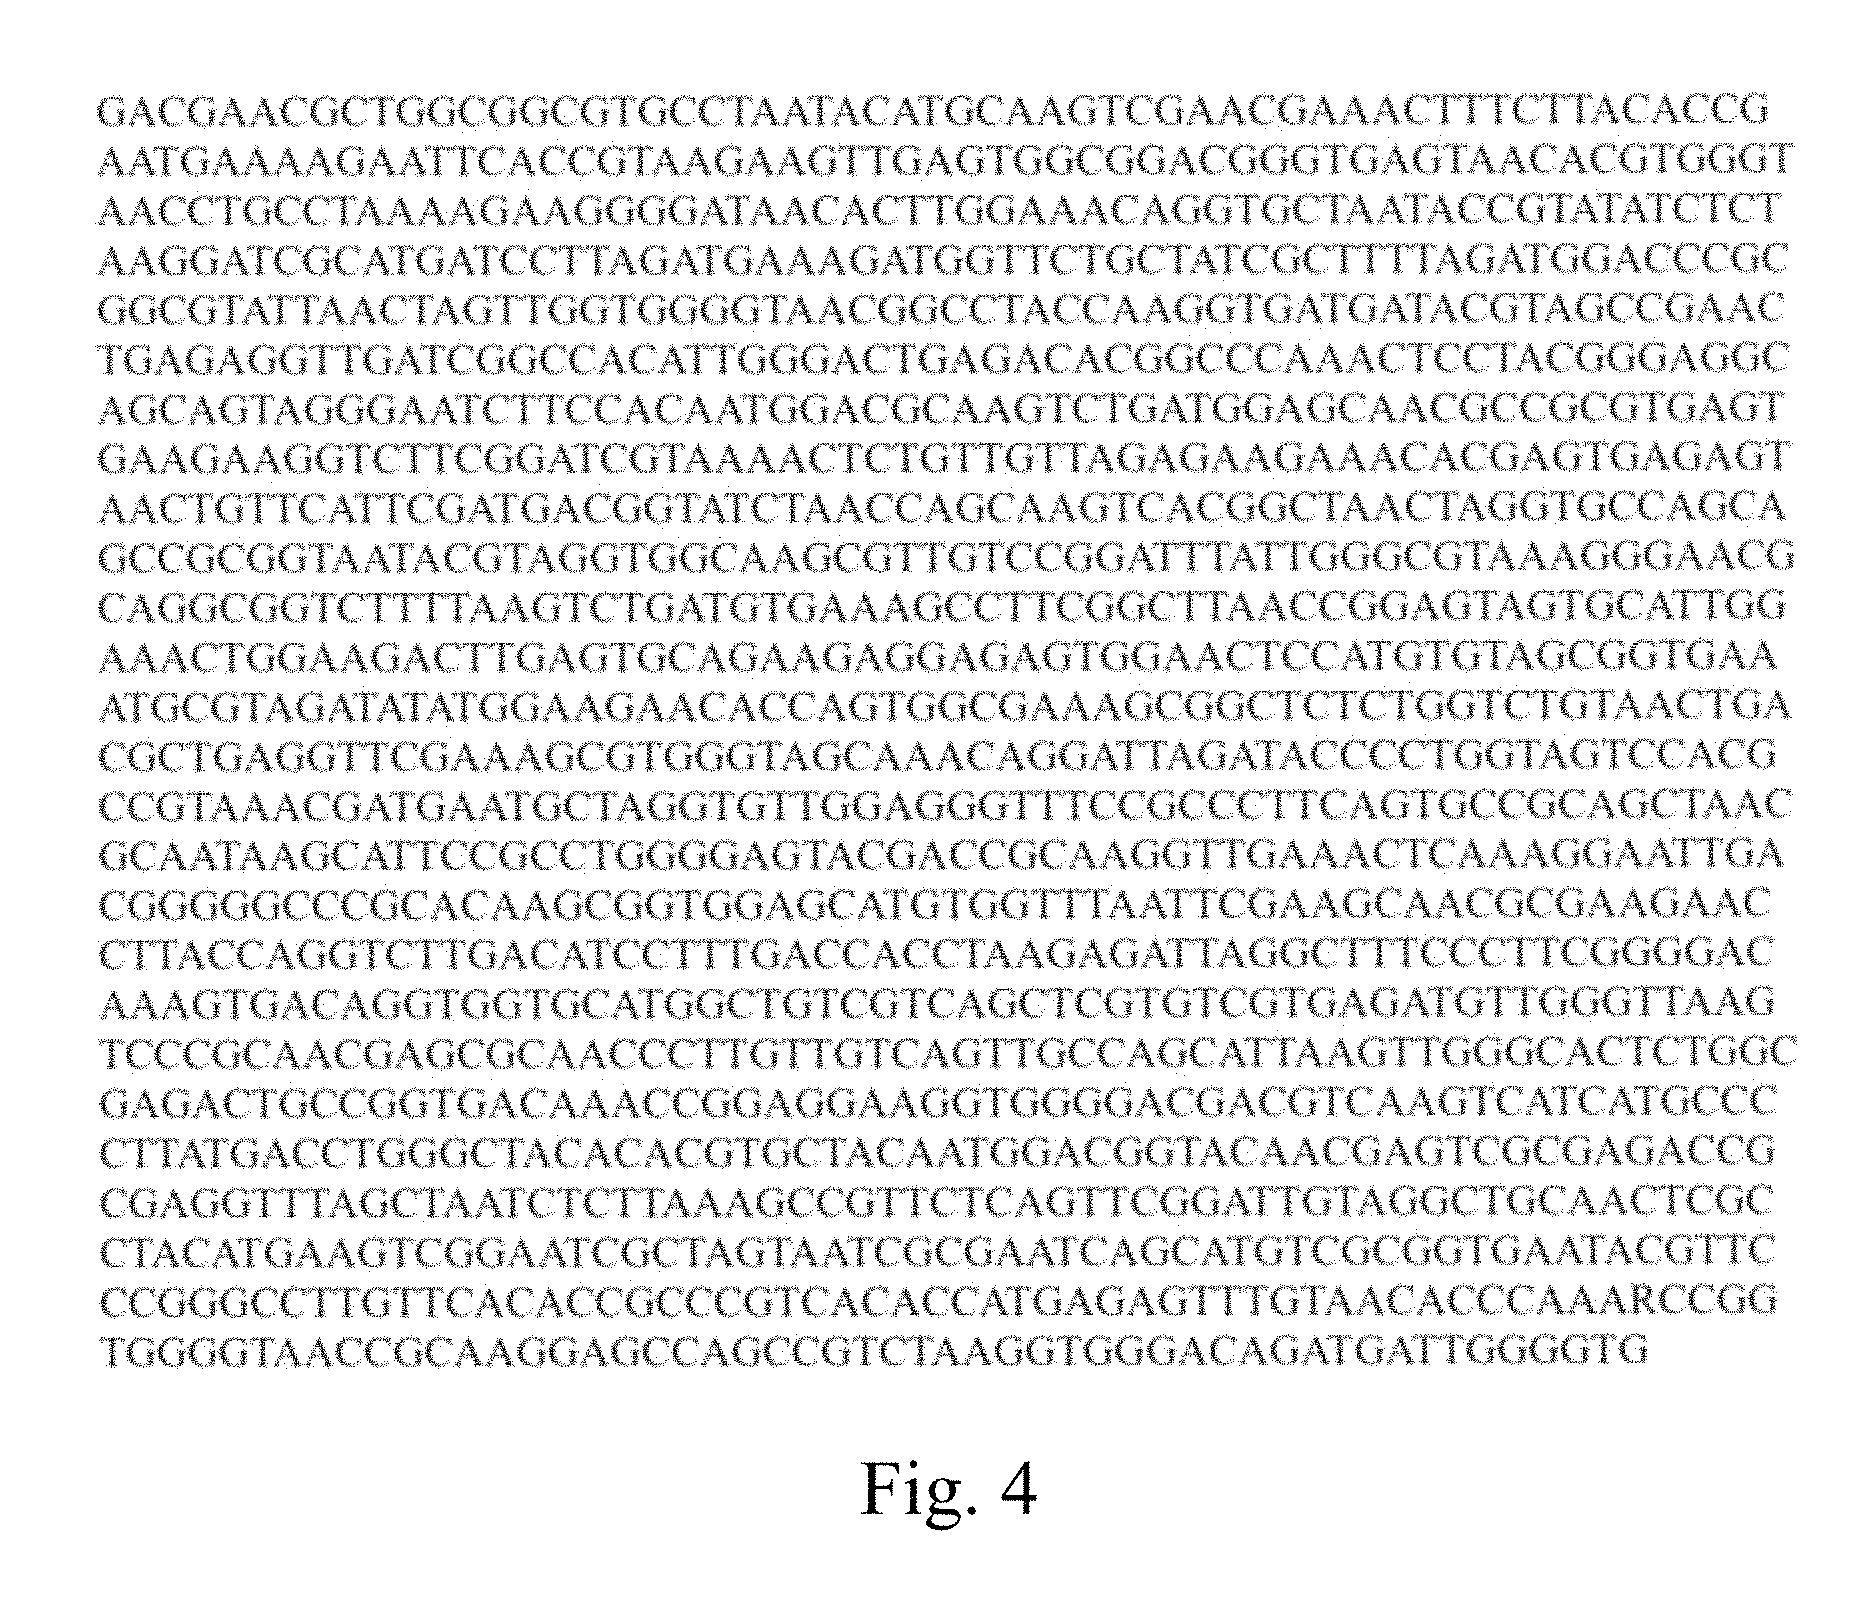
FIG. 4 shows a 16S rDNA sequence of Lactobacillus salivarius LS159.
DETAILED DESCRIPTION
Unless otherwise defined, the technical and scientific terms used in the specification and claims have the same meanings as those generally understood by persons of ordinary skill in the art to which the present invention pertains. In case of contradiction, the present invention shall prevail.
The term "pharmaceutical composition" as used herein comprises an effective amount of a desired compound or active ingredient intended for producing a particular effect, and/or at least a pharmaceutically acceptable carrier. It can be appreciated by those ordinarily skilled in the art to which the present invention pertains that the form of the pharmaceutical composition varies with the route of administration intended for producing a particular effect, including, for example, tablets, powders and injections; and the carrier can be in a solid state, a semi-solid state or a liquid state, depending on the form of the pharmaceutical composition. For example, the carrier includes, but is not limited to, gelatin, an emulsifier, a hydrocarbon mixture, water, glycerin, saline, buffered saline, lanolin, paraffin, beeswax, dimethylsilicone, and ethanol.
The term "effective amount" as used herein refers to an amount of the desired compound or active ingredient intended for producing a particular effect, and expressed in percentages by weight present in the composition. It can be appreciated by those ordinarily skilled in the art to which the present invention pertains that the effective amount varies with the route of administration intended for eliciting a particular effect. Generally, the amount of the active ingredient or compound in the composition may account for about 1% to about 100%, and preferably about 30% to about 100% by weight of the composition.
The term "pharmaceutically acceptable carrier" as used herein is one which is compatible with the active ingredient in the pharmaceutical composition and preferably enhances the stability of the pharmaceutical composition, and is non-hazardous to the subject. The pharmaceutically acceptable carrier varies with the dosage form, including, but not limited to, corn starch, lactose, cellulose, magnesium stearate, colloidal silica, maltodextrin, water, and so on.
Hereinafter, for the purpose of further explaining the efficacy of the present invention, the present invention is described in detail by way of examples. However, the examples are illustrative and any language used therein is not intended to limit the specification and the scope and meaning of the claims of the present invention.
Example 1: Strain Isolation and Identification
Lactococcus lactis subsp. lactis LL358, and Lactobacillus salivarius L5159 are isolated from vegetable pickles, which are as shown in FIGS. 1 and 2.
It can be known from the result of identification by Food Industry Research and Development Institute (Taiwan) that Lactococcus lactis subsp. lactis LL358 and Lactobacillus salivarius L5159 are characterized in that they are Gram positive bacteria, have no catalyst, but have an oxidase and mobility, produce no endospores, and are able to grow in aerobic and anaerobic environments and allowed to be cultured in a Lactobacillus MRS medium at a temperature of 37.degree. C.
Referring to FIG. 3, the 16S rDNA sequence of Lactococcus lactis subsp. lactis LL358 is as shown in SEQ ID No. 1. Based on 16S rDNA sequencing, it can be known that Lactococcus lactis subsp. lactis LL358 has 98% or more similarity to Lactococcus lactis subsp. lactis, Lactococcus lactis subsp. hordniae, Lactococcus lactis subsp. tructae, Lactococcus lactis subsp. Cremoris, and Lactococcus lactis subsp. Taiwanensis. It is confirmed by API microbial identification system that Lactococcus lactis subsp. lactis LL358 is mostly closest to Lactococcus lactis subsp. lactis. Therefore, the identification result shows that Lactococcus lactis subsp. lactis LL358 is a new strain of Lactococcus lactis subsp. lactis.
Referring to FIG. 4, the 16S rDNA sequence of Lactobacillus salivarius LS159 is as shown in SEQ ID No. 2. Based on 16S rDNA sequencing, it can be known that Lactobacillus salivarius L5159 has up to 99.4% similarity to Lactobacillus salivarius. It is confirmed by API microbial identification system that Lactobacillus salivarius LS159 is mostly closest to Lactobacillus salivarius. Therefore, the identification result shows that Lactobacillus salivarius L5159 is a new strain of Lactobacillus salivarius.
Example 2: Preparation of Lactic Acid Bacteria Containing Composition
Lactococcus lactis subsp. lactis LL358 and Lactobacillus salivarius L5159 obtained in Example 1 were mixed with Lactobacillus pentosus to prepare a lactic acid bacteria containing composition, where the proportion of Lactococcus lactis subsp. lactis LL358, Lactobacillus salivarius LS159, and Lactobacillus pentosus was 1:1:1.
Example 3: Test in Human
It should be noted that this test was examined and approved by the Member of Institutional Review Board, Tungs' Taichung MetroHarbor Hospital, Taiwan (IRB No. TTMH: 102023).
A total of 80 patients with stages 3 and 4 chronic kidney disease were screened out in out-patient clinic, department of nephrology, Tungs' Taichung MetroHarbor Hospital, 29 patients dropped out from the test due to personal reasons, and the remaining patients signed the information consent form and became a subject.
The subjects were randomized to a test group and a placebo group. The subjects in the test group were each given a pack of the lactic acid bacteria containing composition (3 g/pack, and having a total bacterial count of 1.times.10.sup.11 CFU/pack) at the morning and evening every day, and the subjects in the placebo group were given equal dosage of resistant starch at the morning and evening. During the test (weeks 0 to 12) and 4-week (weeks 13 to 16) follow-up after withdrawal, the subjects were still administered with the prescribed drugs and continued the original diet, and collected for basic data, blood and urine specimens, and gastrointestinal symptoms rating scale for analysis respectively at weeks 0, 12, and 16 (that is, 4 weeks after withdrawal).
A total of 41 subjects completed the test, of which 26 had stage 3 chronic kidney disease, and 15 had stage 4 chronic kidney disease, and the average age was 60.32.+-.8.26 years. The subjects had estimated Glomerular Filtration Rate (eGFR) of 44.74.+-.8.65 ml/min/1.73 m.sup.2 and 43.53.+-.8.55 ml/min/1.73 m.sup.2, and 22.85.+-.3.81 ml/min/1.73 m.sup.2 and 21.73.+-.3.65 ml/min/1.73 m.sup.2, by using Modification of Diet in Renal Disease (MDRD) formula and by using Chronic Kidney Disease Epidemiology Collaboration (CKD-EPI) formula respectively.
Example 4: Physical Condition Analysis
The body condition data of the 41 subjects who had completed the test is shown in Tables 1 and 2 below. Tables 1 and 2 compare the difference between the two groups by Chi-square test, and the values are expressed as numbers and percentages. Except for genders, the difference between the two groups is compared by 2-Independent-Samples t-test, and the values are expressed as mean, standard deviation, and minimum-maximum. In the tables, the symbol "#" indicates that there is significant difference between those with different genders or with different courses of disease in the same group (p<0.05); and the symbol "*" indicates that there is significant difference between different groups (p<0.05). It can be known from the statistical results in Table 1 that the patients with stages 3 and 4 chronic kidney disease have a BMI values of 27.98.+-.5.62 kg/m2 and 27.03.+-.4.00 kg/m2 respectively, and they are all of obesity (BMI value 27 kg/m2). The average body fat percentage of these subjects is 29.55.+-.5.79%, which is close to the obesity standard for women (body fat percentage of 30%); and the average visceral fat percentage is 16.16.+-.7.24%, which is greater than the standard (12%). Moreover, the waist circumference, hip circumference and waist-hip ratio of the patients with stage 3 chronic kidney disease are all higher than those of the patients with stage 4 chronic kidney disease, and the average waist circumferences of the male and female patients are 96.06.+-.11.75 cm and 95.79.+-.14.22 cm respectively, which are both larger than the standards for metabolic syndrome (male .gtoreq.90 cm, and female .gtoreq.80 cm).
Further, Tables 3 and 4 compare the difference between the two groups by Wilcoxon rank-sum test, and the values are expressed as mean, standard deviation, and minimum-maximum. In the tables, the symbol "*" indicates that there is significant difference between different groups (p<0.05); and the symbol "#" indicates that there is difference between those with different courses of disease in the same group (p<0.05).
It can be known from Tables 3 and 4 that before test, the mean waist circumference and waist-hip ratio of the patients in the test group and the placebo group are 95.67.+-.14.79 and 97.00.+-.10.52 cm, and 0.96.+-.0.08 and 0.98.+-.0.06 respectively. It can be found through comparison of the subjects in the test group and the placebo group that there is no significant difference between the body conditions in terms of the body weight, BMI, body fat ratio, visceral fat ratio, subcutaneous body fat percentage, total body skeletal muscle, waist circumference, and waist-hip ratio (P>0.05), prior to and post test. However, the patients with stage 4 chronic kidney disease in the test group have obviously reduced visceral fat percentage during the test, as compared with the patients in the placebo group.
TABLE-US-00001 TABLE 1 Basic data and body condition analysis of all the subjects before test Standard Mean Deviation (SD) Range Sex (n, %) Male 33 80.5.sup.# Female 8 19.5 Age (years) 61.32 8.26 44-75 High (cm) 162.64 7.02 150-180 Weight (kg) 73.39 15.40 45.3-116.8 BMI, (kg/m.sup.2) 27.66 5.08 18.5-40.5 Body fat ratio (%) 29.46 6.55 16.3-44.4 visceral fat ratio (%) 15.13 6.63 3-30 subcutaneous body fat 20.87 8.07 4-43.4 percentage (%) total body skeletal muscle 28.21 5.29 20.3-49.4 (%) waist circumference (cm) 96.26 12.95 73-128 Hip circumference (cm) 99.49 8.11 84-120 waist-hip ratio 0.96 0.07 0.84-1.13
TABLE-US-00002 TABLE 2 Basic data and body condition analysis of subjects with stages 3 and 4 chronic kidney disease before test stage 3 (n = 26) stage 4 (n = 15) Mean SD Range Mean SD Range Sex (n, %) Male 24 (92.3).sup.# 9 (60.0)* Female 2 (7.7) 6 (40.0) Age(years) 61.31 7.68 45-74 61.33 9.47 44-75 High(cm) 163.02 7.19 150-180 161.92 6.90 153-172 Weight(kg) 74.74 17.42 45.3-116.8 70.78 10.65 .sup. 51-92.1 BMI, (kg/m.sup.2) 27.98 5.62 18.5-40.5 27.03 4.00 21.8-37.4 Body fat ratio (%) 29.55 5.79 16.3-41.1 29.28 8.07 18.3-44.4 visceral fat ratio (%) 16.16 7.24 3-30 13.15 4.93 4-25 subcutaneous body fat 21.18 6.55 .sup. 10-40.1 20.28 10.68 4-43.4 percentage (%) total body 26.92 2.87 21.8-31.7 30.68 7.74 20.3-49.4 skeletal muscle (%) waist circumference(cm) 97.08 13.38 73-128 94.83 12.50 77-122 Hip circumference(cm) 99.21 8.87 84-120 99.97 6.85 90-113 waist-hip ratio 0.98 0.07 0.87-1.13 0.95 0.07 0.84-1.08
TABLE-US-00003 TABLE 3 Body condition analysis of all the subjects during weeks 0 to 16 of the test Test group Placebo group Mean SD Mean SD Weight Week 0 72.49 16.88 74.49 13.80 Week 12 72.93 17.31 75.59 14.47 Week 16 72.64 17.46 74.43 13.96 BMI Week 0 27.38 5.00 27.99 5.31 Week 12 27.53 5.19 28.01 5.14 Week 16 27.47 5.18 28.04 5.31 Body fat ratio Week 0 29.00 6.64 30.02 6.58 Week 12 29.35 6.35 29.68 6.11 Week 16 29.32 6.50 29.99 6.58 visceral fat ratio Week 0 14.71 7.40 15.65 5.71 Week 12 15.00 7.52 16.12 5.38 Week 16 15.05 7.58 16.13 5.64 waist circumference Week 0 95.67 14.79 97.00 10.52 Week 12 95.85 14.55 97.21 10.24 Week 16 95.83 14.53 96.69 10.41 Hip circumference Week 0 99.54 8.27 99.42 8.14 Week 12 99.70 8.03 100.03 7.94 Week 16 99.83 7.91 99.69 8.10 waist-hip ratio Week 0 0.96 0.08 0.98 0.06 Week 12 0.96 0.08 0.97 0.06 Week 16 0.96 0.08 0.97 0.06
TABLE-US-00004 TABLE 4 Body condition analysis of subjects with stages 3 and 4 chronic kidney disease during weeks 0 to 16 of the test stage 3 stage 4 Test group Placebo group Test group Placebo group Mean SD Mean SD Mean SD Mean SD Weight Week 0 76.44 20.36 73.17 14.89 67.22 9.36 78.80 9.81 Week 12 77.29 20.58 74.48 15.69 67.11 10.01 79.20 10.46 Week 16 77.03 20.77 72.70 14.50 66.78 10.04 81.90 9.80 BMI Week 0 28.49 6.01 27.51 5.43 25.90 2.94 29.58 5.33 Week 12 28.80 6.16 27.52 5.17 25.83 3.08 29.60 5.46 Week 16 28.78 6.11 27.33 5.29 25.72 3.11 31.10 5.14 Body fat ratio Week 0 29.49 5.79 29.60 6.02 28.34 7.97 31.40 9.09 Week 12 29.70 5.35 28.99 5.59 28.89 7.80 31.90 8.09 Week 16 30.00 5.62 29.41 6.01 28.41 7.78 32.50 9.82 visceral fat ratio Week 0 17.33 8.55.sup.# 15.08 5.92 11.22 3.53 17.50 5.26* Week 12 17.92 8.50.sup.# 15.77 5.80 11.11 3.52 17.25 4.19* Week 16 17.92 8.62.sup.# 15.46 5.84 11.22 3.56 19.00 4.36* waist circumference Week 0 99.13 17.07 95.32 9.50 91.91 11.43 102.88 13.27 Week 12 99.25 16.72 95.50 9.67 92.14 11.36 102.75 11.50 Week 16 99.25 16.81 95.15 9.44 92.09 11.15 103.33 14.01 Hip circumference Week 0 100.08 9.73 98.46 8.37 98.96 6.74 102.75 7.32 Week 12 100.21 9.44 99.31 8.47 99.14 6.57 102.38 6.29 Week 16 100.38 9.33 99.12 8.38 99.23 6.40 102.17 7.69 waist-hip ratio Week 0 0.98 0.09 0.97 0.06 0.93 0.06 1.00 0.06 Week 12 0.99 0.09 0.96 0.06 0.93 0.06 1.00 0.05 Week 16 0.98 0.09 0.96 0.06 0.93 0.06 1.01 0.06
Example 5: Blood Pressure Analysis
Tables 5 and 6 compare the difference between the two groups by Wilcoxon rank-sum test, and the values are expressed as mean, standard deviation, and minimum-maximum. The mean systolic and diastolic blood pressure, pulse rate and mean arterial pressure of the 41 subjects measured before test are 136.56.+-.15.04 mmHg, 84.66.+-.9.98 mmHg, 79.56.+-.11.61 pulse/min, and 101.96.+-.10.35 mmHg respectively. Subjects with stage 4 chronic kidney disease have a mean systolic blood pressure of 138.33.+-.15.57 mmHg and a pulse rate of 80.27.+-.11.39 pulse/min, which are higher than the mean systolic blood pressure of 135.54.+-.14.93 mmHg and the pulse rate of 79.15.+-.11.65 pulse/min of the subjects with stage 3 chronic kidney disease.
Tables 7 and 8 compare the difference between the two groups by Wilcoxon rank-sum test, and the values are expressed as mean, standard deviation, and minimum-maximum. It can be known from Tables 7 and 8 that the patients in both the placebo group and the test group have a systolic blood pressure and pulse rate that are higher than the standards for metabolic syndrome (130 mmHg, and 72 pulse/min), and have a diastolic blood pressure and a mean arterial pressure falling in a normal range (85 mmHg, and 80-95 mmHg). Moreover, there is no significant difference between the test group and the placebo group before test (P>0.05).
At week 12 of the test, the systolic blood pressure is measured. The systolic blood pressure of the subjects in the test group is increased by 1.61 mmHg, and the systolic blood pressure of the subjects in the placebo group is increased by 3.65 mmHg. At week 16 of the test, the systolic blood pressure of the subjects in the test group is decreased by 4.57 mmHg. This suggests that administration of the lactic acid bacteria containing composition according to the present invention results in a reduced elevation in the systolic blood pressure, and is still effective in controlling and reducing the systolic blood pressure after withdrawal.
Moreover, at week 12 of the test, the systolic blood pressure of the subjects with stage 4 chronic kidney disease in the test group is decreased by 0.73 mmHg, which is higher than the decrease (3.75.+-.17.52 mmHg) in the systolic blood pressure of the subjects with stage 3 chronic kidney disease. Furthermore, after 4-week withdrawal, the systolic blood pressure of the subjects with stages 3 and 4 chronic kidney disease in the test group trends to further decrease, and is reduced by 6.64.+-.10.63 and 2.67.+-.18.62 mmHg respectively. In contrast, at week 12 of the test, the systolic blood pressure of the subjects with stages 3 and 4 chronic kidney disease in the placebo group is increased by 3.75.+-.6.99 and 3.62.+-.9.24 mmHg respectively. Furthermore, after 4-week withdrawal, the increase (1.15 mmHg) in the systolic blood pressure in the subjects with stage 3 chronic kidney disease is higher than that in the subjects with stage 4 chronic kidney disease (-2.33 mmHg).
At week 12 of the test, the diastolic blood pressure of the subjects in the test group is decreased by 1.09 mmHg on average, and the diastolic blood pressure of the subjects in the placebo group is decreased by 1.41 mmHg on average. The diastolic blood pressure of the subjects with stage 3 chronic kidney disease in the test group is decreased by 2.33 mmHg on average, which is advantageous over the average decrease (1.77 mmHg) in the diastolic blood pressure of the subjects with stage 3 chronic kidney disease in the placebo group. After 4-week withdrawal, the diastolic blood pressure of the subjects in the placebo group is increased by 1.56 mmHg on average, which is 3 times of the increase (0.39 mmHg) in the diastolic blood pressure of the subjects in the test group. Moreover, the diastolic blood pressure of the subjects with stage 4 chronic kidney disease in the test group is further decreased by 2.33 mmHg, which is approximately 3 times higher than the decrease in the subjects with stage 4 chronic kidney disease in the placebo group.
With respect to the mean arterial pressure, at weeks 12 and 16 of the test, the mean arterial pressure of the subjects in the test group is decreased by 0.19.+-.12.46 and 0.71.+-.10.22 mmHg respectively, and the mean arterial pressure of the subjects in the placebo group is increased by 0.27.+-.7.55 and 1.21.+-.7.03 mmHg respectively. The mean arterial pressure of the subjects with stages 3 and 4 chronic kidney disease in the test group trends to decrease after week 12 of the test, and is decreased by 0.3.+-.13.00 and 0.06.+-.12.43 mmHg respectively.
At week 12 of the test, the variation in pulse rate of the subjects in the placebo group is 0.12 pulse/min, which is approximately 2 times higher than that in the test group (-1.57 pulse/min). The decrease (-2.08 pulse/min) in the pulse rate of the subjects with stage 3 chronic kidney disease in the test group is higher than that (-1.00 pulse/min) of the subjects with stage 4 chronic kidney disease; and at week 16 of the test, the decrease (-4.45 pulse/min) in the pulse rate of the subjects with stage 4 chronic kidney disease in the test group is higher than that (0.08 pulse/min) of the subjects with stage 3 chronic kidney disease.
Tables 9 and 10 compare the difference between the two groups by Fisher's exact test, and the values are expressed as numbers (percentages). At weeks 12 and 16 of the test, the percentages of persons with reduced pulse rate among the subjects with stages 3 and 4 chronic kidney disease in the test group are 41.67% and 41.67%, and 45.45% and 54.55% respectively. It can be known from further analysis that at week 12 of the test, over 50% of the subjects with stage 3 chronic kidney disease in the test group have a systolic blood pressure, a diastolic blood pressure, and a mean arterial pressure decreased by more than 2 mmHg; and at week 16 of the test, over 50% of the subject still have a persistently decreased systolic blood pressure and mean arterial pressure (50% and 58%), and the decreases are higher than those in the placebo group. Compared with the placebo group, more subjects with stage 4 chronic kidney disease in the test group have a more profound decrease in the systolic blood pressure, the diastolic blood pressure and the mean arterial pressure.
It can be known from above data that administration of the lactic acid bacteria containing composition disclosed in the present invention can effectively reduce the systolic blood pressure, the diastolic blood pressure, and the mean arterial pressure in patients with chronic kidney disease, and has a better improvement effect in terms of the reduction in the systolic blood pressure, the mean arterial pressure and the pulse of the patients with stage 4 chronic kidney disease.
TABLE-US-00005 TABLE 5 Blood and pulse rate of all the subjects before test Mean SD Range Systolic pressure 136.56 15.04 108-172 (mmHg) diastolic blood 84.66 9.98 60-111 pressure (mmHg) mean arterial 101.96 10.30 84-131.33 pressure (mmHg) pulse (pulse/min) 79.56 11.61 54-106
TABLE-US-00006 TABLE 6 Blood and pulse rate of subjects with stages 3 and 4 chronic kidney disease before test stage 3 (n = 26) stage 4 (n = 15) Mean SD Range Mean SD Range Systolic 135.54 14.93 108-170 138.33 15.57 116-172 pressure (mmHg) diastolic 86.69 8.20 73-101 81.13 11.98 60-111 blood pressure (mmHg) mean arterial 102.97 9.21 89-124 100.20 12.10 84-131.33 pressure (mmHg) pulse 79.15 11.65 54-106 80.27 11.93 60-102 (pulse/min)
TABLE-US-00007 TABLE 7 Blood and pulse rate of all the subjects during weeks 0 to 16 of the test Test group Placebo group Mean SD Mean SD Systolic pressure Week 0 139.52 18.07 132.78 9.07 Week 12 141.13 20.51 136.24 8.89 Week 16 136.57 19.51 136.50 12.75 diastolic blood pressure Week 0 85.13 11.04 84.06 8.71 Week 12 84.04 12.50 82.53 8.09 Week 16 84.43 13.35 83.63 8.62 mean arterial pressure Week 0 103.26 12.04 100.30 7.52 Week 12 103.07 14.45 100.43 7.70 Week 16 102.36 14.07 101.25 9.41 pulse Week 0 77.52 13.09 82.17 9.10 Week 12 75.96 14.39 82.76 7.07* Week 16 73.87 15.23 80.13 9.31
TABLE-US-00008 TABLE 8 Blood and pulse rate of subjects with stages 3 and 4 chronic kidney disease during weeks 0 to 16 of the test stage 3 stage 4 Test group Placebo group Test group Placebo group Mean SD Mean SD Mean SD Mean SD Systolic pressure Week 0 139.50 19.86 132.14 8.26 139.55 16.88 135.00 12.70 Week 12 143.25 23.43 135.46 8.54 138.82 17.63 138.75 10.90 Week 16 140.58 16.38 136.62 13.59 132.18 22.40 136.00 10.58 diastolic blood pressure Week 0 88.25 8.85 85.36 7.66 81.73 12.55 79.50 11.82 Week 12 85.92 13.42 83.54 8.04 82.00 11.70 79.25 8.46 Week 16 87.83 10.43 85.00 8.83 80.73 15.60 77.67 4.93 mean arterial pressure Week 0 105.3 11.4 101.0 6.5 101.00 12.82 98.00 11.25 Week 12 105.0 15.9 100.8 7.9 100.94 13.14 99.08 8.14 Week 16 105.4 11.3 102.2 9.9 99.03 16.51 97.11 6.81 pulse Week 0 77.75 14.81 80.36 8.48 77.27 11.64 88.50 9.43 Week 12 75.67 15.52 81.92 7.61 76.27 13.79 85.50 4.65 Week 16 75.75 16.25 79.38 9.79 71.82 14.52 83.33 7.51
TABLE-US-00009 TABLE 9 Distribution of the number of persons with improvement among all the subjects prior to and post test Placebo Test group (n, %) group (n, %) Decrease of Systolic pressure more than 2 mmHg Week 12 9 (39.13) 5 (29.41) Week 16 12 (52.17) 4 (25.00) Decrease of diastolic blood pressure more than 2 mmHg Week 12 11 (47.83) 8 (47.06) Week 16 10 (43.38) 3 (18.75) Decrease of mean arterial pressure more than 2 mmHg Week 12 10 (43.48) 7 (41.18) Week 16 11 (47.83) 5 (31.25) Decrease of pulse more than 2 mmHg Week 12 10 (43.48) 6 (35.29) Week 16 11 (47.83) 10 (62.50)
TABLE-US-00010 TABLE 10 Distribution of the number of persons with improvement among subjects with stages 3 and 4 chronic kidney disease prior to and post test stage 3 (n, %) stage 4 (n, %) Placebo Placebo Test group group Test group group Decrease of Systolic pressure more than 2 mmHg Week 12 6 (50.00) 4 (30.77) 3 (27.27) 1 (25.00) Week 16 6 (50.00) 3 (23.08) 6 (54.55) 1 (33.33) Decrease of diastolic blood pressure more than 2 mmHg Week 12 7 (58.33) 7 (53.85) 4 (36.36) 1 (25.00) Week 16 5 (41.67) 3 (23.08) 5 (45.45) 0 (0.00) Decrease of mean arterial pressure more than 2 mmHg Week 12 7 (58.33) 6 (46.15) 3 (27.27) 1 (25.00) Week 16 7 (58.33) 4 (30.77) 4 (36.36) 1 (33.33) Decrease of pulse more than 2 mmHg Week 12 5 (41.67) 5 (38.46) 5 (45.45) 1 (25.00) Week 16 5 (41.67) 7 (53.85) 6 (54.55) 3 (100.00)
Example 6: Hematological Analysis
Tables 11 and 12 compare the difference between the two groups by Wilcoxon rank-sum test, and the values are expressed as mean, standard deviation, and minimum-maximum. In the tables, the symbol "*" indicates that there is significant difference between different groups (p<0.05); and the symbol "#" indicates that there is difference between those with different courses of disease in the same group (p<0.05). It can be known from Tables 11 and 12 that the mean triglyceride and blood glucose level of the 41 subjects are 179.27.+-.105.33 mg/dL and 141.45.+-.78.80 mg/dL respectively. The subjects with stage 3 chronic kidney disease have a mean triglyceride and blood glucose level of 174.04.+-.106.14 mg/dL and 146.69.+-.81.69 mg/dL, the subjects with stage 4 chronic kidney disease have a mean triglyceride and blood glucose of 188.33.+-.106.96 mg/dL and 131.71.+-.75.09 mg/dL, and thus the mean triglyceride and blood glucose of the subjects with stages 3 and 4 chronic kidney disease are both higher than the standards for metabolic syndrome (triglyceride .gtoreq.150 mg/dL, and blood glucose .gtoreq.100 mg/dL). Moreover, the mean plasma total cholesterol, low-density lipoprotein cholesterol, high-density lipoprotein cholesterol, and thyroid function of the subject fall within a normal range. The subjects with stage 4 chronic kidney disease have a high-density lipoprotein cholesterol level of 48.07.+-.14.67 .mu.g/dL, which is lower than that (52.19.+-.14.10 .mu.g/dL) of the subjects with stage 3 chronic kidney disease, but have a higher plasma total cholesterol, triglyceride, and low-density lipoprotein cholesterol level compared with the subjects with stage 3 chronic kidney disease.
Further, at week 12 of the test, the average reduction in the blood glucose level of the subjects in the test group is 22.78.+-.74.29 mg/dL, which is approximately 2 times higher than that (-11.24.+-.49.93 mg/dL) of the subjects in the placebo group. The blood glucose level of the subjects with stage 3 chronic kidney disease in the test group is decreased by -54.17.+-.81.83 mg/dL, which is superior to that (3.36.+-.33.89 mg/dL) of the subjects with stage 3 chronic kidney disease in the placebo group. The decrease (11.45.+-.48.00 mg/dL) in the blood glucose level of the subjects with stage 4 chronic kidney disease in the test group is obviously higher than that (-79.33.+-.63.52 mg/dL) of the subjects with stage 4 chronic kidney disease in the placebo group.
At week 12 of the test, the plasma triglyceride level of the subjects in the test group is decreased by -3.86.+-.84.09 mg/dL, and the plasma triglyceride level of the subjects in the placebo group is decreased by -13.56.+-.113.15 mg/dL. The plasma triglyceride level of the subjects with stage 3 chronic kidney disease in the test group is decreased by -28.17.+-.59.59 mg/dL, which is obviously advantageous over that (12.14.+-.73.65 mg/dL) of the subjects with stage 3 chronic kidney disease in the placebo group. At week 16 of the test, the plasma triglyceride level of the subjects in the test group is increased by 8.00 mg/dL, and the plasma triglyceride level of the subjects in the placebo group is increased by 17.11 mg/dL. The plasma triglyceride level of the subjects with stage 4 chronic kidney disease in the placebo group is increased significantly by up to 12.+-.54.31 mg/dL.
At week 0 of the test, the mean plasma cholesterol level of the subjects in the test group and the placebo group is 164.52.+-.35.44 mg/dL and 172.44.+-.39.92 mg/dL respectively, the mean low-density lipoprotein cholesterol (LDL-C) level is 77.22.+-.30.14 mg/dL and 88.72.+-.31.08 mg/dL respectively, and the mean high-density lipoprotein cholesterol (HDL-C) level is 50.61.+-.13.15 mg/dL and 50.78.+-.15.97 mg/dL respectively.
At week 12 of the test, the mean LDL-C level of the subjects in the test group and the placebo group is increased by 8.09.+-.32.67 mg/dL and 9.89.+-.34.65 mg/dL respectively, and still falls within a normal range (plasma cholesterol <200 mg/dL, and LDL-C<100 mg/dL). The increase in the test group is lower than that in the placebo group (P>0.05). The mean HDL-C level of the subjects in the test group and the placebo group is decreased by -4.96.+-.9.28 mg/dL and -2.22.+-.8.19 mg/dL respectively, and still falls within a normal range 40 mg/dL).
At week 12 of the test, the thyroxine of the subjects is 8.40.+-.1.56 .mu.g/dL in the test group, and is 7.38.+-.1.33 .mu.g/dL in the placebo group, both of which fall within a normal range (4.5-12 .mu.g/dL).
Tables 13 and 14 compare the difference between the two groups by Fisher's exact test, and the values are expressed as numbers (percentages). At week 12 of the test, improvements are made in 65.22% and 63.00% on average of the subjects in the test group in terms of blood glucose and triglyceride levels, and the improvement rates are still 43.00% and 47.80% after 4-week withdrawal. Up to 83% of the subjects with stage 3 chronic kidney disease have ameliorated blood glucose and triglyceride level, and the improvement effects on the subjects with stage 3 chronic kidney disease are better than those on the subjects with stage 4 chronic kidney disease.
The above results show that the blood glucose and triglyceride levels of the subjects all reach the standards for metabolic syndrome, which can be obviously ameliorated by administering the lactic acid bacteria containing composition disclosed in the present invention, while the LDL-C, HDL-C and T4 levels of the subject are maintained in a normal range. The improvement effect is better with respect to the blood glucose and triglyceride levels of the subjects with stage 3 chronic kidney disease. Therefore, the lactic acid bacteria containing composition disclosed in the present invention can definitely effectively reduce the blood glucose and triglyceride levels in the patients with chronic kidney disease, without affecting the plasma cholesterol, LDL-C, HDL-C, and T4 levels in the patients.
TABLE-US-00011 TABLE 11 Hematological analysis of all the subjects during weeks 0 to 16 of the test Test group Placebo group Mean SD Mean SD blood sugar Week 0 143.74 82.83 138.35 75.38 Week 12 120.96 31.01 124.28 59.65 Week 16 133.13 45.89 116.00 49.52 triglyceride Week 0 188.50 90.19 174.06 133.06 Week 12 183.35 80.31 160.50 80.84 Week 16 192.70 112.69 177.61 127.09 cholesterol Week 0 164.52 35.44 172.44 32.92 Week 12 171.09 30.79 178.56 37.09 Week 16 173.04 35.08 178.00 37.10 LDL-C Week 0 77.22 30.14 88.72 31.08 Week 12 85.30 24.69 98.61 38.02 Week 16 88.17 27.88 99.76 38.72 HDL-C Week 0 50.61 13.15 50.78 15.97 Week 12 45.65 13.03 48.56 16.31 Week 16 47.57 12.48 54.53 35.01 T4 Week 0 8.40 1.56 7.38 1.33* Week 12 7.78 1.63 7.43 1.50 Week 16 7.68 1.47 7.48 1.42
TABLE-US-00012 TABLE 12 Hematological analysis of subjects with stages 3 and 4 chronic kidney disease during weeks 0 to 16 of the test stage 3 stage 4 Test group Placebo group Test group Placebo group Mean SD Mean SD Mean SD Mean SD blood sugar Week 0 177.50 101.99 120.29 49.02 106.91 28.14 222.67 129.98* Week 12 123.33 32.51 123.64 60.60 118.36 30.63 126.50 65.10 Week 16 144.75 52.61 112.79 54.20 120.46 35.34 127.25 30.80 triglyceride Week 0 206.33 90.99 146.36 113.46 158.27 61.29 271.00 168.64 Week 12 178.17 87.42 158.50 89.88 200.90 96.58 267.50 44.11 Week 16 211.75 134.51 148.50 89.93 171.91 84.42 279.50 196.71 cholesterol Week 0 164.83 46.68 167.36 30.33 164.18 19.13 190.25 40.14 Week 12 166.00 29.88 174.07 33.72 176.64 32.23 194.25 49.47 Week 16 173.00 36.70 173.29 31.82 173.09 35.01 194.50 54.30 LDL-C Week 0 74.08 39.74 83.93 31.46 80.64 15.38 105.50 26.49 Week 12 83.08 25.50 92.14 33.98 87.73 24.77 121.25 48.07 Week 16 86.58 32.51 96.79 31.36 89.91 23.25 113.67 72.45 HDL-C Week 0 49.50 11.37 54.50 16.13 51.82 15.34 37.75 5.12 Week 12 46.83 14.34 51.14 17.57 44.36 11.99 39.50 5.45 Week 16 47.08 13.14 59.14 37.11 48.09 12.33 33.00 2.65 T4 Week 0 8.38 1.46 7.42 1.44* 8.43 1.75 7.23 0.95 Week 12 7.77 1.65 7.56 1.59 7.79 1.71 6.98 1.23 Week 16 7.17 1.15 7.65 1.53 8.23 1.65 6.83 0.75
TABLE-US-00013 TABLE 13 Distribution of the number of persons with improvement among all the subjects prior to and post test Test group (n, %) Placebo group (n, %) blood sugar Week 12 15 (65.22) 9 (52.94) Week 16 10 (43.48) 8 (47.06) triglyceride Week 12 14 (63.64) 9 (50.00) Week 16 11 (47.83) 10 (55.56) cholesterol Week 12 9 (39.13) 6 (33.33) Week 16 7 (30.43) 11 (61.11) LDL-C Week 12 6 (26.09) 7 (38.89) Week 16 7 (30.43) 9 (52.94) HDL-C Week 12 17 (73.91) 11 (61.11) Week 16 16 (69.57) 11 (64.71
TABLE-US-00014 TABLE 14 Distribution of the number of persons with improvement among subjects with stages 3 and 4 chronic kidney disease prior to and post test stage 3 (n, %) stage 4 (n, %) Placebo Placebo Test group group Test group group blood sugar Week 12 10 (83.33) 6 (42.86) 5 (45.450 3 (100.0) Week 16 6 (50.00) 5 (35.71) 4 (36.36) 3 (100.0) triglyceride Week 12 10 (83.33) 7 (50.00) 4 (40.00) 2 (50.00) Week 16 6 (50.00) 8 (57.14) 5 (45.45) 2 (50.00) cholesterol Week 12 4 (33.33) 4 (28.57) 5 (45.45) 2 (50.00) Week 16 4 (33.33) 9 (64.29) 3 (27.27) 2 (50.00) LDL-C Week 12 3 (25.00) 6 (42.86) 3 (27.27) 1 (25.00) Week 16 4 (33.33) 8 (57.14) 3 (27.270 1 (33.33) HDL-C Week 12 8 (66.67) 9 (64.29) 9 (81.82) 2 (50.00) Week 16 7 (58.33) 10 (71.43) 9 (81.82) 1 (31.33)
Example 7: Analysis of Renal Function Indices
The analysis results of renal function indices for 41 subjects are shown in Tables 15 and 16, in which the difference between the two groups are compared by Wilcoxon rank-sum test, and the values are expressed as mean, standard deviation, and minimum-maximum. It can be known from Tables 15 and 16 that the chronic kidney disease classification index MDRD-eGFR of the subjects is 36.73.+-.12.87 mL/min/1.73 m.sup.2, and the CKD-EPI value is 35.55.+-.12.78 mL/min/1.73 m.sup.2, which are both below the normal value (90-120 mL/min/1.73 m.sup.2). The mean MDRD-eGFR value of the subjects with stage 4 chronic kidney disease is 22.85.+-.3.81 mL/min/1.73 m.sup.2, and the CKD-EPI value is 21.73.+-.3.65 mL/min/1.73 m.sup.2, which are both greatly lower than the mean MDRD-eGFR value (44.74.+-.8.65 mL/min/1.73 m.sup.2) and the CKD-EPI value (43.53.+-.8.55 mL/min/1.73 m.sup.2) of the subjects with stage 3 chronic kidney disease. Accordingly, the subjects meet the classification criteria of stages 3 and 4 chronic kidney disease.
The subjects have an average blood urea nitrogen (BUN) level of 30.53.+-.12.23 mg/dL, a creatinine level of 2.09.+-.0.68 mg/dL, a uric acid (UA) level of 7.34.+-.2.18 mg/dL, an indolyl sulfate (IS) level of 1.97.+-.1.70 mg/L, and a p-cresol sulfate (PCS) level of 3.45.+-.2.73 mg/L, which are all above the normal values (7-25 mg/dL, <0.6-1.3 mg/dL, 1.5-8 mg/dL, 0.6.+-.0.2 mg/L, and <0.5 mg/L). Before test, the subjects with stage 4 chronic kidney disease have an average BUN of 41.59.+-.9.23 mg/dL, a creatinine level of 2.79.+-.0.59 mg/dL, an IS level of 3.05.+-.2.22 mg/L, and a PCS level of 4.55.+-.3.13 mg/L, which are all higher than the values of the subjects with stage 3 chronic kidney disease (24.16.+-.8.72 mg/dL, 1.68.+-.0.29 mg/dL, 1.35.+-.0.87 mg/L, and 2.81.+-.2.30 mg/L); and there is no obvious difference between the serum UA level of the subjects with stages 3 and 4 chronic kidney disease.
Tables 17 and 18 compare the difference between the two groups by Wilcoxon rank-sum test, and the values are expressed as mean, standard deviation, and minimum-maximum. In the tables, the symbol "*" indicates that there is significant difference between different groups (p<0.05); the symbol "#" indicates that there is difference between those with different courses of disease in the same group (p<0.05); and the symbol "##" indicates that there is significant difference between those with different courses of disease in the same group (p<0.01). At week 12 of the test, the decrease in the MDRD-eGFR and CKD-EPI values of test group is higher than that of the placebo group. After 4-week withdrawal, the increase in the MDRD-eGFR and CKD-EPI values of the placebo group is higher than that of the test group. At week 12 of the test, the subjects with stage 3 chronic kidney disease in the test group have a MDRD-eGFR and CKD-EP value decreased by 2.58.+-.5.57 mL/min/1.73 m.sup.2 and 2.63.+-.5.68 mL/min/1.73 m.sup.2 respectively, and the decreases are larger than those (-1.61.+-.6.89 mL/min/1.73 m.sup.2 and -16.2.+-.6.88 mL/min/1.73 m.sup.2) of the placebo group. Although at weeks 12 and 16 of the test, the MDRD-eGFR and CKD-EPI values of the subjects with stage 4 chronic kidney disease in the test group and the placebo group are increased, the increase in the placebo group at week 16 of the test is ten times of that in the test group.
At week 12 of the test, the serum UA levels (7.37.+-.1.93 mg/dL, and 7.31.+-.2.53 mg/dL) in the test group and the placebo group are decreased by 0.51.+-.2.09 mg/dL and 0.73.+-.1.68 mg/dL. At week 16 of the test, the serum UA level is further decreased by 0.18.+-.1.16 mg/dL in the test group, and trends to increase in the placebo group. At week 12 of the test, the serum UA levels of the subjects with stage 3 chronic kidney disease in the test group and the placebo group are both decreased; and at week 16 of the test, the increase in the test group is lower than that in the placebo group.
With respect to serum nephrotoxins, at week 12 of the test, the subjects with stage 4 chronic kidney disease have a BUN level of 31.55.+-.14.12 mg/dL, a creatinine level of 2.19.+-.0.80 mg/dL, an IS level of 2.29.+-.2.06 mg/L, and a PCS level of 4.09.+-.2.90 mg/L, all of which have no significant difference from the values determined at week 0 of the test (P>0.05). For the subjects with stage 3 chronic kidney disease in the test group, except that the PCS level is higher than that in the placebo group, the BUN level (22.10.+-.9.67 mg/dL), the creatinine level (1.57.+-.0.20 mg/dL), and the IS level (1.27.+-.0.66 mg/L) are all increased by a value lower than that of the placebo group (0.02.+-.5.11 mg/dL, 0.13.+-.0.25 mg/dL, 0.13.+-.0.82 mg/dL). Moreover, after 4-week withdrawal, the BUN level, the creatinine level, and the PCS level are decreased by 0.19.+-.5.11 mg/L, 0.07.+-.0.20 mg/L, and 0.25.+-.2.04 mg/L respectively. For the subjects with stage 4 chronic kidney disease in the test group, except for the serum creatinine level (2.86.+-.0.64 mg/dL), the BUN level (41.85.+-.10.58 mg/dL), the IS level (3.40.+-.2.49 mg/L), and the PCS level (5.55.+-.3.05 mg/L) are all slightly increased (by 0.03.+-.11.99 mg/L, 0.69.+-.2.52 mg/L, and 2.69.+-.7.15 mg/L). However, after 4-week withdrawal, the BUN and IS level are persistently decreased. The BUN, creatinine, and UA levels in the test group continuously decrease on a whole after withdrawal.
At week 12 of the test, the percentages of subjects with improvement in the test group and the placebo group are statistically calculated, and the results show that the percentages of subjects with improvements in MDRD-eGFR and CKD-EPI values in the test group are up to 36.84% on average. The improvement rate (45.45%) of the subjects with stage 3 chronic kidney disease is higher than that (25.00%) of the subjects with stage 4 chronic kidney disease. Moreover, the percentages of subjects with stage 3 chronic kidney disease in the test group that are improved in terms of the UA and IS levels are 54.50% and 41.67% on average respectively, which are higher than the placebo group (50.00%, and 35.71%). Furthermore, at week 16 of the test, the number of persons with persistent improvements in the mean BUN and UA levels, the serum UA level of the subjects with stage 3 chronic kidney disease, and the BUN level, the creatinine level, and the UA level of the subjects with stage 4 chronic kidney disease in the test group are all higher than that in the placebo group.
It can be known from the results above that the lactic acid bacteria containing composition disclosed in the present invention has the effect of maintaining renal functions. The improvement effects on the creatinine level of the subjects with stage 4 chronic kidney disease and on the serum IS and UA levels of the subjects with stage 3 chronic kidney disease are all better than those before the lactic acid bacteria containing composition disclosed in the present invention is administered. Moreover, after withdrawal, the increase in the indices with administration of the lactic acid bacteria containing composition disclosed in the present invention is obviously lower than that found without administration. Therefore, it can be known that administration of the lactic acid bacteria containing composition disclosed in the present invention has the effect of maintaining renal functions, efficacy of ameliorating the serum UA level, and thus the capability of preventing hyperuricemia.
TABLE-US-00015 TABLE 15 Analysis of renal function indices of all the subjects before test Mean SD Range MDRD-eGFR 36.73 12.87 17.31-59.85 (mL/min/1.73 m.sup.2) CKD-EPI 35.55 12.78 16.33-59.31 (mL/min/1.73 m.sup.2) BUN (mg/dL) 30.53 12.23 13.5-60.8 Creatinine (mg/dL) 2.09 0.68 1.3-3.8 IS (mg/L) 1.97 1.70 0.05-8.9 PCS (mg/L) 3.45 2.73 0.28-9.99 UA (mg/L) 7.34 2.18 3.3-12.4
TABLE-US-00016 TABLE 16 Analysis of renal function indices of subjects with stages 3 and 4 chronic kidney disease before test stage 3 (n = 26) stage 4 (n = 15) Mean SD Range Mean SD Range MDRD-eGFR 44.74 8.65 30.02-59.85 22.85 3.81 17.31-29.15 (mL/min/1.73 m.sup.2) CKD-EPI 43.53 8.55 27.73-59.31 21.73 3.65 16.33-27.14 (mL/min/1.73 m.sup.2) BUN (mg/dL) 24.16 8.72 13.5-48.9 41.59 9.23 25.2-60.8 Creatinine 1.68 0.29 1.3-2.4 2.79 0.59 1.8-3.8 (mg/dL) IS (mg/L) 1.35 0.87 0.05-4.28 3.05 2.22 0.96-8.90 PCS (mg/L) 2.81 2.30 0.28-8.32 4.55 3.13 0.78-9.99 UA (mg/L) 7.22 2.52 3.3-12.4 7.55 1.49 4.3-9.9
TABLE-US-00017 TABLE 17 Analysis of renal function indices of all the subjects during weeks 0 to 16 of the test Test group Placebo group Mean SD Mean SD MDRD-eGFR Week 0 35.83 14.55 37.87 10.65 Week 12 35.85 15.55 36.75 12.75 Week 16 35.40 15.66 39.00 12.44 CKD-EPI Week 0 34.72 14.50 36.63 10.50 Week 12 34.76 15.46 35.51 12.56 Week 16 34.41 15.69 37.86 12.58 BUN Week 0 31.55 14.12 29.24 9.52 Week 12 30.62 14.97 28.87 11.77 Week 16 31.33 11.73 27.81 9.48 Creatinine Week 0 2.19 0.80 1.96 0.47 Week 12 2.17 0.77 2.13 0.85 Week 16 2.20 0.80 1.99 0.69 IS Week 0 2.29 2.06 1.56 0.99 Week 12 2.60 2.20 1.77 1.19 Week 16 2.94 2.57 1.89 1.41 PCS Week 0 4.09 2.90 2.62 2.33 Week 12 6.05 5.55 2.64 2.74* Week 16 6.22 7.01 3.01 2.66 UA Week 0 7.37 1.93 7.31 2.53 Week 12 6.54 1.65 6.57 1.68 Week 16 6.67 1.59 6.88 2.20
TABLE-US-00018 TABLE 18 Analysis of renal function indices of subjects with stages 3 and 4 chronic kidney disease during weeks 0 to 16 of the test stage 3 stage 3 Test group Placebo group Test group Placebo group Mean SD Mean SD Mean SD Mean SD MDRD-eGFR Week 0 48.00 8.37.sup.## 41.94 8.14.sup.## 22.57 4.19 23.64 2.85 Week 12 46.27 11.99.sup.## 40.33 11.70.sup.# 21.53 3.37 24.20 7.61 Week 16 48.10 11.72.sup.## 42.84 10.73.sup.# 22.70 4.53 25.56 8.24 CKD-EPI Week 0 46.91 8.19.sup.## 40.64 8.01.sup.## 21.42 3.99 22.57 2.81 Week 12 45.14 11.90.sup.## 39.02 11.49.sup.# 20.50 3.27 23.24 7.99 Week 16 47.25 11.54.sup.## 41.65 10.95.sup.# 21.57 4.30 24.61 8.70 BUN Week 0 22.10 9.67.sup.## 25.92 7.73.sup.# 41.85 10.58 40.85 4.90 Week 12 22.84 9.75.sup.## 26.43 11.35.sup.# 42.86 13.83 37.43 10.08 Week 16 24.29 6.87.sup.## 24.67 7.06.sup.# 38.38 11.56 38.80 9.30 Creatinine Week 0 1.57 0.20.sup.## 1.79 0.32.sup.## 2.86 0.64 2.58 0.41 Week 12 1.66 0.35.sup.## 1.97 0.81 2.97 0.52 2.68 0.86 Week 16 1.60 0.33.sup.## 1.83 0.60 2.80 0.67 2.55 0.79 IS Week 0 1.27 0.66.sup.## 1.42 1.03 3.40 2.49 2.06 0.69 Week 12 1.39 1.15.sup.## 1.77 1.21 4.06 2.32 1.76 1.31 Week 16 2.00 2.28.sup.# 1.89 1.20 4.06 2.54 1.90 2.22 PCS Week 0 2.76 2.06.sup.# 2.86 2.56 5.55 3.05 1.80 1.00* Week 12 3.62 1.72 3.00 3.06 8.48 6.98 1.46 0.44* Week 16 3.13 3.11.sup.# 3.62 2.83 9.92 8.66 1.20 0.43* UA Week 0 7.28 2.23 7.17 2.83 7.47 1.65 7.78 1.11 Week 12 6.45 1.86 6.44 1.80 6.69 1.36 7.03 1.23 Week 16 6.83 1.91 6.82 2.44 6.50 1.29 7.10 1.25
Example 8: Analysis of Liver Function Indices
The liver function indices of the 41 subjects are detected before test, and the analysis results are shown in Tables 19 and 20 below. Tables 19 and 20 compare the difference between the two groups by Wilcoxon rank-sum test, and the values are expressed as mean, standard deviation, and minimum-maximum. Tables 19 and 20 shows that the aspartate aminotransferase (AST), alanine aminotransferase (ALT), alkaline phosphatase (ALP), total proteins (TP), albumin (ALB), globulin, A/G (albumin/globulin) ratio, r-GT, total bilirubin (TB), and direct bilirubin (DB) all fall thin normal range. The subjects with stage 4 chronic kidney disease have an obviously lower ALT level, compared with the subjects with stage 3 chronic kidney disease.
Table 21 and 22 compare the difference between the two groups by Wilcoxon rank-sum test, and the values are expressed as mean, standard deviation, and minimum-maximum. In the tables, the symbol "*" indicates that there is significant difference between different groups (p<0.05); the symbol "#" indicates that there is difference between those with different courses of disease in the same group (p<0.05); and the symbol "##" indicates that there is significant difference between those with different courses of disease in the same group (p<0.01). At week 0 of the test, the average serum globulin level in the test group is 3.43.+-.0.35 g/dL, and the average total protein and average globulin levels of the subjects with stage 4 chronic kidney disease in the test group are 7.71.+-.0.46 g/dL, and 3.51.+-.0.38 g/dL respectively. The average serum globulin level in the placebo group is 3.19.+-.0.22 g/dL, and the average total protein and average globulin levels of the subjects with stage 4 chronic kidney disease in the test group are 7.08.+-.0.22 g/dL and 3.03.+-.0.22 g/dL respectively. It can be known from comparison of above data that the average total protein and globulin levels in the test group are higher than those in the placebo group.
The average A/G ratio in the test group is 1.22.+-.0.17. The subjects with stage 3 chronic kidney disease have an albumin level of 4.07.+-.0.24 g/dL, and an A/G ratio of 1.22.+-.0.14; and the subjects with stage 4 chronic kidney disease have an aspartate aminotransferase level of 19.45.+-.5.34 U/dL. In contrast, in the placebo group, the average A/G ratio is 1.33.+-.0.11, the subjects with stage 3 chronic kidney disease have an albumin level of 4.29.+-.0.27 g/dL and an A/G ratio of 1.33.+-.0.09, and the subjects with stage 4 chronic kidney disease has an aspartate aminotransferase level of 28.00.+-.7.62 U/dL, which are all higher than the test group.
At week 12 of the test, the serum aspartate aminotransferase, alanine aminotransferase, alkaline phosphatase and r-GT levels in the test group and the placebo group trend to decrease. The decrease in the alanine aminotransferase, alkaline phosphatase and r-GT levels of the test group is larger than that of the placebo group. The average decrease in the albumin, globulin, and A/G ratio of the test group is greatly lower than that of the placebo group (P<0.05). The increase in the serum A/G ratio of the subjects with stage 3 chronic kidney disease in the test group is larger than that of the placebo group, and the increase in the serum alanine aminotransferase level of the subjects with stage 4 chronic kidney disease is obviously lower than that of the placebo group. Moreover, the serum DB and r-GT levels in the subjects with stage 3 chronic kidney disease in the test group are higher than those of the subjects with stage 4 chronic kidney disease in the test group. At week 16 of the test, the A/G ratio and DB level of the test group are further decreased.
It can be known from above data that administration of the lactic acid bacteria containing composition disclosed in the present invention is effective in reducing the values of liver function indices, and the effect in patients with stage 3 chronic kidney disease is better.
TABLE-US-00019 TABLE 19 Blood biochemistry of all the subjects before test Mean SD Range AST (U/dL) 24.27 11.32 11-62 ALT (U/dL) 22.59 15.82 7-81 ALP(U/dL) 63.29 16.49 37-101 TP (g/dL) 7.50 0.42 6.8-8.6 ALB (g/dL) 4.19 0.30 3.6-5.1 Globulin (g/dL) 3.32 0.32 2.8-4.2 A/G ratio 1.27 0.16 0.95-1.70 r-GT (g/dL) 34.41 36.71 12-222 TB (mg/dL) 0.51 0.23 0.2-1.4 DB (mg/dL) 0.17 0.09 0.1-0.5
TABLE-US-00020 TABLE 20 Blood biochemistry of subjects with stages 3 and 4 chronic kidney disease before test stage 3 (n = 26) stage 4 (n = 15) Mean SD Range Mean SD Range AST (U/dL) 25.73 13.12 11-62 21.73 6.93 12-39 ALT (U/dL) 26.31 18.30 9-81 16.13 6.85 7-34 ALP(U/dL) 61.65 15.67 37-97 66.13 18.03 44-101 TP (g/dL) 7.48 0.37 6.9-8.4 7.54 0.49 6.8-8.6 ALB (g/dL) 4.18 0.27 3.6-4.7 4.19 0.34 3.7-5.1 Globulin 3.29 0.26 2.8-3.8 3.38 0.40 2.8-4.2 (g/dL) A/G ratio 1.28 0.13 0.95-1.46 1.26 0.20 0.95-1.70 r-GT (g/dL) 38.19 42.41 14-222 27.87 23.78 12-104 TB (mg/dL) 0.56 0.25 0.2-1.4 0.43 0.16 0.3-0.7 DB (mg/dL) 0.19 0.10 0.1-0.5 0.14 0.06 0.1-0.3
TABLE-US-00021 TABLE 21 Blood biochemistry of all the subjects during weeks 0 to 16 of the test Test group Placebo group Mean SD Mean SD TP Week 0 7.56 0.43 7.42 0.40 Week 12 7.54 0.36 7.51 0.49 Week 16 7.64 0.42 7.50 0.48 ALB Week 0 4.15 0.31 4.23 0.28 Week 12 4.30 0.30 4.21 0.36 Week 16 4.25 0.25 4.28 0.28 Globulin Week 0 3.43 0.35 3.19 0.22* Week 12 3.28 0.35 3.30 0.36 Week 16 3.37 0.34 3.27 0.30 A/G ratio Week 0 1.22 0.17 1.33 0.11* Week 12 1.31 0.17 1.29 0.19 Week 16 1.28 0.15 1.32 0.15 AST Week 0 23.78 11.37 24.89 11.55 Week 12 23.32 8.48 23.61 9.19 Week 16 20.73 6.15 25.19 8.84 ALT Week 0 23.35 18.83 21.61 11.34 Week 12 18.59 7.93 20.11 8.41 Week 16 18.41 8.03 21.56 10.56 ALP Week 0 63.87 16.33 62.56 17.14 Week 12 59.73 14.28 60.17 16.71 Week 16 59.91 15.50 60.56 16.52 r-GT Week 0 36.87 44.90 31.28 23.29 Week 12 27.82 14.93 28.94 14.33 Week 16 28.64 16.32 29.19 15.63 TB Week 0 0.49 0.24 0.54 0.21 Week 12 0.50 0.27 0.54 0.26 Week 16 0.52 0.24 0.51 0.22 DB Week 0 0.17 0.09 0.18 0.09 Week 12 0.18 0.09 0.16 0.08 Week 16 0.15 0.08 0.17 0.08
TABLE-US-00022 TABLE 22 Blood biochemistry of subjects with stages 3 and 4 chronic kidney disease during weeks 0 to 16 of the test stage 3 stage 4 Placebo Placebo Test group group Test group group Mean SD Mean SD Mean SD Mean SD TP Week 0 7.43 0.36 7.52 0.39.sup.# 7.71 0.46 7.08 0.22* Week 12 7.50 0.43 7.56 0.52 7.59 0.28 7.33 0.34 Week 16 7.59 0.45 7.45 0.53 7.69 0.40 7.70 0.17 ALB Week 0 4.07 0.24 4.29 0.27* 4.24 0.36 4.05 0.29 Week 12 4.28 0.24 4.26 0.38 4.33 0.36 4.03 0.21 Week 16 4.28 0.25 4.28 0.32 4.22 0.25 4.28 0.05 Globulin Week 0 3.36 0.31 3.24 0.20 3.51 0.38 3.03 0.22* Week 12 3.22 0.36 3.30 0.38 3.36 0.33 3.30 0.37 Week 16 3.31 0.33 3.23 0.32 3.45 0.35 3.43 0.15 A/G ratio Week 0 1.22 0.14 1.33 0.09* 1.23 0.21 1.35 0.17 Week 12 1.35 0.18 1.31 0.19 1.27 0.16 1.23 0.18 Week 16 1.31 0.14 1.34 0.16 1.24 0.16 1.24 0.05 AST Week 0 27.75 14.03 24.00 12.54 19.45 5.34 28.00 7.62* Week 12 24.67 9.80 23.36 9.77 21.70 6.72 24.50 7.94 Week 16 21.33 6.75 24.62 9.73 20.00 5.62 27.67 2.52 ALT Week 0 31.83 22.79.sup.# 21.57 12.33 14.09 5.26 21.75 8.34 Week 12 22.67 8.25.sup.## 20.14 8.91 13.70 3.86 20.00 7.53 Week 16 22.58 8.40.sup.## 21.15 11.36 13.40 3.60 23.33 7.51* ALP Week 0 60.42 14.50 62.71 17.08 67.64 18.04 62.00 20.02 Week 12 54.42 12.44 61.71 15.94 66.10 14.28 54.75 20.77 Week 16 56.67 16.72 61.00 15.32 63.80 13.73 58.67 25.17 r-GT Week 0 52.17 58.90 26.21 13.73 20.18 5.67 49.00 41.46 Week 12 33.42 17.95 26.50 10.70 21.10 5.88 37.50 23.27 Week 16 35.50 19.28.sup.# 24.85 7.81 20.40 5.38 48.00 28.51 TB Week 0 0.55 0.30 0.57 0.21 0.43 0.16 0.43 0.19 Week 12 0.62 0.30 0.59 0.28 0.35 0.11 0.40 0.08 Week 16 0.63 0.27 0.55 0.23 0.39 0.11 0.33 0.06 DB Week 0 0.20 0.11 0.19 0.09 0.14 0.05 0.15 0.10 Week 12 0.22 0.09.sup.# 0.17 0.08 0.13 0.05 0.13 0.05 Week 16 0.18 0.09 0.18 0.08 0.12 0.04 0.10 0.00
Example 9: Analysis of Serum Minerals
Tables 24 to 26 compare the difference between the two groups by Wilcoxon rank-sum test, and the values are expressed as mean, standard deviation, and minimum-maximum. In Table 26, the symbol "*" indicates that there is significant difference between those having the same course of disease in different groups (p<0.05); and the symbol "#" indicates that there is difference between those with different courses of disease in the same group (p<0.05). It can be known from comparison of the data before and after test that all the values fall within normal ranges. There is no significant difference between the serum potassium, chloride, calcium, phosphorus, and magnesium levels of the subjects with stages 3 and 4 chronic kidney disease; however, the serum magnesium level in subjects with stage 3 chronic kidney disease in the test group is higher than that in the placebo group. The serum potassium level in subjects with stage 3 chronic kidney disease in the placebo group is significantly higher than that in the subjects with stage 4 chronic kidney disease. The serum chloride, phosphorus, and magnesium levels in subjects with stage 3 chronic kidney disease in the test group are obviously lower than those in subjects with stage 4 chronic kidney disease.
At week 12 of the test, the serum sodium, chloride, calcium, and phosphorus levels in the test group tend to decrease. Only the serum chloride level in the patients with stage 3 chronic kidney disease in the test group tends to decrease, and other minerals trend to increase. The serum potassium, chloride, and calcium levels in the placebo group all tend to decrease.
At week 16 of the test, serum sodium, calcium, phosphorus, and magnesium levels tend to persistent decrease. The serum sodium, potassium, chloride, calcium, phosphorus, and magnesium levels in subjects with stage 4 chronic kidney disease in the test group and the potassium and calcium levels in the placebo group all tend to decrease. Compared with the subjects with stage 4 chronic kidney disease in the test group, the serum calcium and magnesium levels of the subjects with stage 3 chronic kidney disease in the test group are increased considerably, and the case in the placebo group is on the contrary.
It can be known from above that the serum sodium, potassium, and chloride levels in the test group tend to decrease, and the chloride and calcium levels in the placebo group also tend to decrease. The results suggest that administration of the lactic acid bacteria containing composition disclosed in the present invention is effective in improving the serum sodium, potassium, calcium, phosphorus, and magnesium levels in the patients with stage 3 chronic kidney disease. In other words, the lactic acid bacteria containing composition disclosed in the present invention can maintain blood calcium level, and thus be useful as a composition for preventing hypocalcemia.
TABLE-US-00023 TABLE 23 Analysis of serum minerals in all the subjects before test Mean SD Range sodium 140.15 2.98 134-149 (meq/L) potassium 4.34 0.76 3.4-7.5 (meq/L) chloride 105.05 2.74 98.3-109.5 (meq/L) calcium 9.52 0.56 8.8-12.1 (mg/L) phosphorus 3.36 1.18 1.6-9.3 (mg/L) magnesium 2.19 0.31 1.4-2.8 (mg/L)
TABLE-US-00024 TABLE 24 Analysis of serum minerals in subjects with stages 3 and 4 chronic kidney disease before test Stage 3 (n = 26) Stage 4 (n = 15) Mean SD Range Mean SD Range sodium 140.31 2.92 134-149 139.87 3.16 134-146 (meq/L) potassium 4.21 0.78 3.4-7.5 4.57 0.69 3.7-5.7 (meq/L) chloride 104.59 2.49 98.3-108.7 105.84 3.05 98.3-109.5 (meq/L) calcium 9.42 0.40 8.8-10.5 9.69 0.75 8.9-12.1 (mg/L) phosphorus 3.03 0.50 1.6-3.9 3.93 1.72 2.3-9.3 (mg/L) magnesium 2.17 0.27 1.7-2.8 2.22 0.37 1.4-2.7 (mg/L)
TABLE-US-00025 TABLE 25 Analysis of serum minerals in all the subjects during weeks 0 to 16 of the test Test group Placebo group Mean SD Mean SD sodium Week 0 140.00 2.61 140.33 3.46 Week 12 139.77 2.64 141.06 3.06 Week 16 140.13 2.60 140.31 3.24 potassium Week 0 4.19 0.54 4.54 0.96 Week 12 4.39 0.57 4.26 0.54 Week 16 4.52 0.80 4.25 0.46 chloride Week 0 104.94 2.82 105.18 2.71 Week 12 104.07 2.31 104.67 2.85 Week 16 105.10 2.42 106.16 1.91 calcium Week 0 9.48 0.36 9.57 0.75 Week 12 9.40 0.45 9.38 0.76 Week 16 9.33 0.52 9.53 0.84 phosphorus Week 0 3.57 1.38 3.09 0.82 Week 12 3.27 0.65 3.14 0.62 Week 16 3.18 0.48 3.01 0.54 magnesium Week 0 2.20 0.31 2.18 0.31 Week 12 2.26 0.30 2.28 0.33 Week 16 2.19 0.46 2.09 0.26
TABLE-US-00026 TABLE 26 Analysis of serum minerals in subjects with stages 3 and 4 chronic kidney disease during weeks 0 to 16 of the test stage 3 stage 4 Test group Placebo group Test group Placebo group Mean SD Mean SD Mean SD Mean SD sodium Week 0 139.58 2.50 140.93 3.20 140.46 2.77 138.25 4.03 Week 12 140.00 2.86 141.00 2.96 139.50 2.46 141.25 3.86 Week 16 139.42 2.23 140.15 3.39 140.91 2.84 141.00 3.00 potassium Week 0 4.04 0.45 4.36 0.98.sup.# 4.35 0.59 5.18 0.62 Week 12 4.22 0.44 4.11 0.37 4.60 0.65 4.75 0.79 Week 16 4.51 0.93 4.18 0.47 4.53 0.67 4.53 0.42 chloride Week 0 103.76 2.73.sup.# 105.30 2.10 106.23 2.41 104.78 4.70 Week 12 103.35 2.08 104.15 2.43 104.93 2.37 106.48 3.87 Week 16 104.87 2.33 105.88 1.96 105.36 2.59 107.30 1.40 calcium Week 0 9.38 0.37 9.46 0.44 9.59 0.34 9.95 1.46 Week 12 9.52 0.51 9.29 0.46 9.25 0.33 9.68 1.49 Week 16 9.40 0.65 9.31 0.43 9.26 0.35 10.50 1.56 phosphorus Week 0 3.05 0.44.sup.# 3.02 0.57 4.15 1.81 3.33 1.53 Week 12 3.10 0.48 3.07 0.42 3.47 0.79 3.38 1.14 Week 16 3.03 0.37 2.98 0.43 3.35 0.56 3.17 1.03 magnesium Week 0 2.07 0.28.sup.# 2.26 0.23* 2.35 0.27 1.88 0.41* Week 12 2.23 0.32 2.32 0.32 2.31 0.28 2.13 0.38 Week 16 2.12 0.33 2.16 0.19 2.27 0.59 1.77 0.32
Example 10: Analysis of Blood Cell Characteristics
The analysis results of blood cell characteristics of the subjects before test are shown in Tables 27 and 28, in which the difference between the two groups are compared by Wilcoxon rank-sum test, and the values are expressed as mean, standard deviation, and minimum-maximum. In the tables, the symbol "*" indicates that there is significant difference between different groups (p<0.05); and the symbol "#" indicates that there is difference between those with different courses of disease in the same group (p<0.05). Tables 27 and 28 show that except for subjects with stage 4 chronic kidney disease, the average hematocrit in other subjects is lower than the lowest standard, and other average values fall within normal ranges. Moreover, the leukocyte and erythrocyte counts, hematocrit, hematochrome level, mean hemoglobin concentration, platelet and lymphocyte counts in subjects with stage 4 chronic kidney disease are all lower than those in subjects with stage 3 chronic kidney disease, and there is difference between the erythrocyte counts, hematochrome and hematocrit, and lymphocyte counts.
Table 29 and 30 compare the difference between the two groups by Wilcoxon rank-sum test, and the values are expressed as mean, standard deviation, and minimum-maximum. In the tables, the symbol "*" indicates that there is significant difference between those with the same courses of disease in different groups (p<0.05); and the symbol "#" indicates that there is difference between those with different courses of disease in the same group (p<0.05). At week 12 of the test, the decrease in leukocyte and lobulated leukocyte counts of the subjects with stage 3 chronic kidney disease in the test group is significantly larger than that in the placebo group, and the increase in the lymphocyte counts is obviously higher than that in the placebo group.
At week 0 of the test, the lobulated leukocyte counts in the subjects with stage 4 chronic kidney disease in the test group are considerably lower than those in the placebo group; however, at week 16 of the test, there is no obvious difference from the placebo group. Furthermore, at week 16 of the test, the mean corpuscular volume in the test group is significantly higher than that in the placebo group, and the case is on the contrary for platelets.
Before test, the hematocrit in the subjects with stage 3 chronic kidney disease in the test group is higher than that in the subjects with stage 4 chronic kidney disease; and at weeks 12 and 16 of the test, the erythrocyte counts, hemoglobin concentration, hematocrit, and lymphocyte counts are higher than those in subjects with stage 4 chronic kidney disease. At week 0 of the test, the erythrocyte counts, hemoglobin concentration, hematocrit, lymphocyte and lobulated leukocyte counts in the subjects with stage 3 chronic kidney disease in the placebo group are significantly higher than those in subjects with stage 4 chronic kidney disease in the placebo group. At week 16 of the test, the erythrocyte counts, hematocrit and monocyte counts in the subjects with stage 3 chronic kidney disease in the placebo group are also significantly higher than those in subjects with stage 4 chronic kidney disease in the placebo group. However, at weeks 12 and 16 of the test, the variation in platelets of the subjects with stage 3 chronic kidney disease in the placebo group is obviously lower than that of the subjects with stage 4 chronic kidney disease in the placebo group.
The above results show that in a severe course of chronic kidney disease, nutrient-related average erythrocyte counts, hematochrome concentration, hematocrit, and lymphocyte counts are reduced, while inflammation-related mean corpuscular volume, and eosinophil, lymphocyte, monocyte and basophil counts are increased. By administering the lactic acid bacteria containing composition disclosed in the present invention, the symptoms can be improved.
TABLE-US-00027 TABLE 27 Analysis of blood cell characteristics in all the subject before test Mean SD Range leukocyte (.times.10.sup.3/uL) 6.89 2.03 3.1-14.6 erythrocyte (.times.10.sup.6/dL) 4.38 0.62 3.26-5.81 hematochrome (g/dL) 13.14 1.81 9.6-17.4 hematocrit (%) 38.89 4.86 28.5-48.7 mean corpuscular 89.10 4.45 73.46-96.11 volume (fL) mean corpuscular 30.07 1.65 23.55-32.67 hemoglobin (pg) mean hemoglobin 33.72 1.20 31.50-36.10 concentration (%) platelet (.times.10.sup.3/uL) 215.20 68.30 111-502 eosinophil (%) 2.94 1.92 0.12-8.31 lymphocyte (K/uL) 26.37 8.02 7.52-40.90 monocyte (K/uL) 6.04 1.94 1.12-9.80 lobulated leukocyte 64.18 9.73 50.2-91.21 (K/uL) basophil (K/uL) 0.47 0.26 0.1-1.3
TABLE-US-00028 TABLE 28 Analysis of blood cell characteristics in subjects with stages 3 and 4 chronic kidney disease before test Stage 3 (n = 26) Stage 4 (n = 15) Mean SD Range Mean SD Range leukocyte (.times.10.sup.3/uL) 7.01 2.18 3.8-14.6 6.69 1.81 3.1-10.5 erythrocyte (.times.10.sup.6/dL) 4.61 0.58 3.46-5.81 3.98 0.47 3.26-4.99 hematochrome (g/dL) 13.78 1.73 9.9-17.4 12.01 1.36 9.6-15.0 hematocrit (%) 40.67 4.39 31.3-48.7 35.81 4.12 28.5-44.1 mean corpuscular 88.55 5.01 73.46-95.59 90.04 3.18 85.49-96.11 volume (fL) mean corpuscular 29.97 1.93 23.55-32.67 30.25 1.01 28.35-32.13 hemoglobin (pg) mean hemoglobin 33.78 1.24 31.57-36.10 33.61 1.16 31.50-35.52 concentration (%) platelet (.times.10.sup.3/uL) 219.35 79.20 111-502 208.00 45.16 140-279 eosinophil (%) 2.72 1.65 0.2-5.5 3.34 2.32 0.12-8.31 lymphocyte (K/uL) 28.23 7.52 12.02-40.9 23.14 8.08 7.52-35.0 monocyte (K/uL) 5.97 1.81 2.9-9.4 6.17 2.22 1.12-9.8 lobulated leukocyte (K/uL) 62.62 9.30 50.2-82.91 66.87 10.19 50.2-91.21 basophil (K/uL) 0.46 0.22 0.1-1.0 0.48 0.32 0.1-1.3
TABLE-US-00029 TABLE 29 Analysis of blood cell characteristics in all the subject during weeks 0 to 16 of the test Test group Placebo group Mean SD Mean SD leukocyte Week 0 6.73 1.47 7.10 2.61 Week 12 6.27 1.58 7.44 2.64 Week 16 6.24 1.78 6.84 2.28 erythrocyte Week 0 4.32 0.62 4.45 0.63 Week 12 4.28 0.63 4.49 0.58 Week 16 4.27 0.64 4.55 0.59 hematochrome Week 0 13.06 2.00 13.23 1.59 Week 12 12.98 2.03 13.26 1.67 Week 16 13.04 2.07 13.32 1.56 hematocrit Week 0 38.74 5.04 39.08 4.75 Week 12 38.40 5.26 39.26 4.78 Week 16 38.76 5.21 39.47 4.84 mean corpuscular volume Week 0 89.85 3.50 88.14 5.38 Week 12 89.92 3.00 87.67 5.83 Week 16 90.97 2.95 87.48 5.39* mean corpuscular hemoglobin Week 0 30.22 1.05 29.88 2.21 Week 12 30.33 1.30 29.62 2.44 Week 16 30.53 1.27 29.40 2.46 mean hemoglobin concentration Week 0 33.58 1.19 33.89 1.21 Week 12 33.73 1.15 33.77 1.21 Week 16 33.58 1.29 33.58 1.42 platelet Week 0 209.26 74.88 222.78 60.10 Week 12 206.48 71.33 218.78 63.47 Week 16 211.04 73.10 221.33 69.11 eosinophil Week 0 3.13 2.08 2.70 1.73 Week 12 3.83 2.48 3.09 1.87 Week 16 3.17 2.16 7.59 15.41 lymphocyte Week 0 26.17 4.71 26.63 11.07 Week 12 29.29 6.79 26.90 7.98 Week 16 28.12 5.83 29.72 8.38 monocyte Week 0 5.59 1.61 6.63 2.21 Week 12 6.49 1.85 6.74 1.39 Week 16 5.97 2.13 6.39 1.51 lobulated leukocyte Week 0 64.62 6.50 63.62 12.95 Week 12 59.87 6.32 62.85 8.99 Week 16 56.96 17.97 51.59 20.86 basophil Week 0 0.50 0.26 0.42 0.26 Week 12 0.52 0.24 0.44 0.21 Week 16 0.44 0.20 0.52 0.28
TABLE-US-00030 TABLE 30 Analysis of blood cell characteristics in subjects with stages 3 and 4 chronic kidney disease during weeks 0 to 16 of the test Stage 3 Stage 4 Test group Placebo group Test group Placebo group Mean Mean Mean SD Mean SD Mean SD leukocyte Week 0 7.10 1.16 6.94 2.82 6.33 1.72 7.68 1.91 Week 12 6.14 1.14 7.04 2.66 6.40 2.01 8.83 2.33 Week 16 6.58 1.26 6.59 2.14 5.88 2.22 7.73 2.85 erythrocyte Week 0 4.58 0.65 4.64 0.55.sup.# 4.04 0.48 3.80 0.46 Week 12 4.61 0.60.sup.# 4.64 0.53 3.92 0.44 3.98 0.46 Week 16 4.61 0.63.sup.# 4.72 0.55.sup.# 3.90 0.43 3.97 0.34 hematochrome Week 0 13.90 2.18 13.69 1.32.sup.# 12.14 1.33 11.65 1.59 Week 12 14.01 2.03.sup.# 13.59 1.53 11.85 1.35 12.10 1.81 Week 16 14.13 2.09.sup.# 13.69 1.40 11.86 1.29 12.05 1.61 hematocrit Week 0 40.91 5.12.sup.# 40.46 3.84.sup.# 36.37 3.91 34.25 4.89 Week 12 41.33 4.79.sup.# 40.27 4.36 35.19 3.72 35.73 5.08 Week 16 41.59 4.77.sup.# 40.89 4.09.sup.# 35.66 3.82 34.53 4.29 mean corpuscular volume Week 0 89.62 3.56 87.63 5.97 90.09 3.59 89.90 2.07 Week 12 89.86 3.17 87.10 6.41 89.98 2.96 89.65 2.79 Week 16 90.57 3.33 86.93 5.94 91.40 2.57 89.39 2.36 mean corpuscular hemoglobin Week 0 30.31 1.08 29.67 2.45 30.12 1.05 30.59 0.92 Week 12 30.35 1.32 29.41 2.67 30.30 1.35 30.36 1.41 Week 16 30.62 1.13 29.15 2.66 30.42 1.45 30.27 1.52 mean hemoglobin concentration Week 0 33.70 1.18 33.84 1.32 33.45 1.25 34.04 0.85 Week 12 33.79 1.29 33.75 1.35 33.67 1.02 33.85 0.64 Week 16 33.84 1.38 33.50 1.55 33.29 1.19 33.86 0.95 platelet Week 0 222.75 96.17 216.43 64.94 194.55 41.30 245.00 36.65 Week 12 227.00 87.95 217.21 67.92 184.09 40.36 224.25 52.77 Week 16 236.42 88.78 214.36 72.83 183.36 38.33 245.75 55.27 eosinophil Week 0 2.51 1.72 2.89 1.64 3.81 2.30 2.03 2.12 Week 12 3.04 1.78 3.54 1.85* 4.77 2.95 1.51 0.82* Week 16 2.51 2.07 8.74 17.17 3.89 2.12 3.03 1.62 lymphocyte Week 0 25.89 4.07 30.24 9.23.sup.#* 26.47 5.52 14.01 7.17* Week 12 32.39 4.98.sup.# 28.35 7.11 25.57 7.01 21.82 9.87 Week 16 30.02 4.87 30.85 8.02 25.85 6.31 24.81 9.81 monocyte Week 0 5.11 1.61 6.71 1.68* 6.11 1.52 6.36 3.90 Week 12 5.88 1.72 6.71 1.47 7.22 1.80 6.84 1.25 Week 16 5.38 1.52 6.75 1.45#* 6.68 2.61 4.87 0.47 lobulated leukocyte Week 0 66.04 5.91 59.69 10.81#* 63.06 7.03 77.35 10.96* Week 12 58.13 4.75 60.93 8.06 61.96 7.53 69.56 9.97 Week 16 56.71 17.08 48.06 21.40 57.27 19.91 66.87 9.10 basophil Week 0 0.45 0.19 0.46 0.26 0.55 0.33 0.28 0.22 Week 12 0.55 0.24 0.47 0.22 0.48 0.25 0.33 0.05 Week 16 0.47 0.17 0.54 0.30 0.41 0.23 0.43 0.15
Example 11: Urine Analysis
The urine analysis results of the 41 subjects before test are shown in Tables 31 and 32, where the difference between the two groups is compared by Wilcoxon rank-sum test, and the values are expressed as mean, standard deviation, and minimum-maximum. In the tables, the symbols "(+), (++), (+++) and (++++)" indicating urine positive are represented by "1, 2, 3, and 4" sequentially. It can be known from the detection results that the average UPro (Urinary protein), UG (Urine glucose), UOB (Urine occult blood), and ULE (Urine leukocyte lipase) positive reaction rates in subjects with chronic kidney disease are greater than "0". Except for the UG and SG, other indices in subjects with stage 4 chronic kidney disease are higher than those in subjects with stage 3 chronic kidney disease. The subjects with stage 4 chronic kidney disease has an average Upro of 60.7%, and the positive reaction rate before test is obviously higher than that of the subjects with stage 3 chronic kidney disease (18.2%). The quantified values are 1.33.+-.0.82 and 0.69.+-.0.97 on average respectively, suggesting that the subjects with stage 4 chronic kidney disease has a more serious UPro than the subjects with stage 3 chronic kidney disease. However, the SG value of the subjects with stage 4 chronic kidney disease is considerably lower than that of the subjects with stage 3 chronic kidney disease (P<0.05).
Tables 33 and 34 compare the difference between the two groups by Wilcoxon rank-sum test, and the values are expressed as mean, standard deviation, and minimum-maximum. In the tables, the symbol "#" indicates that there is difference between those with different courses of disease in the same group (p<0.05). At week 12 of the test, the UG value of the subjects with stage 3 chronic kidney disease in the test group is decreased by 0.83.+-.1.40, and is obviously lower than that of the placebo group (0.36.+-.0.93) (P<0.05). The UPro, UOB and ULE of the subjects with stage 4 chronic kidney disease in the test group are also decreased and are lower than those of the placebo group.
As can be known from the results above, the UPro, UG, UOB, and ULE of the test group are all reduced and are lower than those of the placebo group. At weeks 0, 12, and 16 of the test and after withdrawal (weeks 16 to 12), the variation in UPro of the subjects with stage 3 chronic kidney disease in the test group is lower than that of the subjects with stage 4 chronic kidney disease; and there is significant difference between the values at week 0 and 16 of the test. The variation in the UG value (weeks 16 to 12) is obviously higher than that of the subjects with stage 4 chronic kidney disease, and the case is on the contrary after withdrawal. These suggest that the lactic acid bacteria containing composition disclosed in the present invention can reduce the UPro, UG, UOB, and ULE values of the patients with stages 3 and 4 chronic kidney disease, and effect is more preferable upon consecutive administration. The effect is better in patients with stage 3 chronic kidney disease.
TABLE-US-00031 TABLE 31 Urine analysis of all the subjects before test Mean SD Range PH 5.60 0.62 5-8 UPro 0.93 0.96 0-3 UG 0.49 1.14 0-4 UOB 0.17 0.44 0-2 ULE 0.10 0.49 0-3 Urine specific 1.01 0.01 1.00-1.03 gravity
TABLE-US-00032 TABLE 32 Urine analysis of subjects with stages 3 and 4 chronic kidney disease before test Stage 3 (n = 26) Stage 4 (n = 15) Mean SD Range Mean SD Range PH 5.58 0.70 5-8 5.63 0.48 5-6.5 UPro 0.69 0.97 0-3 1.33 0.82 0-3 UG 0.69 1.35 0-4 0.13 0.52 0-2 UOB 0.12 0.43 0-2 0.27 0.46 0-1 ULE 0.00 0.00 0-0 0.27 0.80 0-3 Urine 1.02 0.015 1.01-1.03 1.01 0.003 1.00-1.02 specific gravity
TABLE-US-00033 TABLE 33 Urine analysis of all the subjects during weeks 0 to 16 of the test Test group Placebo group Mean SD Mean SD PH Week 0 5.74 0.77 5.75 0.97 Week 12 5.87 0.89 5.96 0.99 Week 16 5.68 0.76 5.63 0.74 Upro Week 0 1.13 0.92 0.75 0.97 Week 12 1.09 1.04 0.92 1.00 Week 16 1.23 0.97 0.83 0.94 UG Week 0 0.57 1.31 1.08 1.68 Week 12 0.17 0.65 0.25 0.87 Week 16 0.36 1.05 0.67 1.37 UOB Week 0 0.13 0.34 0.00 0.00 Week 12 0.04 0.21 0.00 0.00 Week 16 0.09 0.29 0.00 0.00 ULE Week 0 0.13 0.63 0.00 0.00 Week 12 0.09 0.29 0.00 0.00 Week 16 0.09 0.29 0.00 0.00 Urine specific gravity Week 0 1.01 0.01 1.02 0.01 Week 12 1.01 0.01 1.02 0.01 Week 16 1.01 0.01 1.02 0.01
TABLE-US-00034 TABLE 34 Urine analysis of subjects with stages 3 and 4 chronic kidney disease during weeks 0 to 16 of the test Stage 3 Stage 4 Placebo Placebo Test group group Test group group Mean SD Mean SD Mean SD Mean SD PH Week 0 5.75 0.97 5.43 0.33 5.73 0.52 5.38 0.25 Week 12 5.96 0.99 5.50 0.44 5.77 0.82 5.75 0.65 Week 16 5.63 0.74 5.62 0.51 5.75 0.82 5.75 0.65 Upro Week 0 0.75 0.97.sup.# 0.64 1.01 1.55 0.69 0.75 0.96 Week 12 0.92 1.00 0.64 0.93 1.27 1.10 1.25 1.26 Week 16 0.83 0.94.sup.# 0.77 0.93 1.70 0.82 1.00 0.82 UG Week 0 1.08 1.68 0.36 0.93 0.00 0.00 0.50 1.00 Week 12 0.25 0.87 0.71 1.44 0.09 0.30 0.00 0.00 Week 16 0.67 1.37 0.46 1.13 0.00 0.00 0.00 0.00 UOB Week 0 0.00 0.00 0.21 0.58 0.27 0.47 0.25 0.50 Week 12 0.00 0.00 0.14 0.36 0.09 0.30 0.25 0.50 Week 16 0.00 0.00 0.23 0.44 0.20 0.42 0.25 0.50 ULE Week 0 0.00 0.00 0.00 0.00 0.27 0.90 0.25 0.50 Week 12 0.00 0.00 0.00 0.00 0.18 0.40 0.25 0.50 Week 16 0.00 0.00 0.00 0.00 0.20 0.42 0.25 0.50 Urine specific gravity Week 0 1.02 0.01.sup.# 1.01 0.00 1.01 0.00 1.01 0.01 Week 12 1.02 0.01 1.01 0.01 1.01 0.00 1.01 0.00 Week 16 1.02 0.01 1.01 0.00 1.01 0.00 1.01 0.01
Example 12: Analysis of Clinical Symptoms and Gastrointestinal Symptoms
One week before test, the 41 subjects experience the clinical symptoms including fatigue, dyskoimesis, dry mouth, chills, dizziness, breathlessness, chest distress, nausea, vomit, loss of appetite, diarrhea, constipation, dry skin, itchy skin, muscle weakness, numbness of limbs, cramps, joint pain, and sexual problems.
After test, the incidence of the clinical symptoms to the subjects is analyzed. The results are shown in Table 35 and 36, where the incidences of the symptoms in the two groups are compared by Fisher's exact test. The improvement rate is calculated by a formula: (week 12-week 0)*100. In the tables, the symbol "*" indicates that there is significant difference between the improvement rats before and after test (p<0.05). The improvement rate is the incidence at week 12 minus the incidence at week 0 of the test (W12-W0). The results show that at week 12 of the test, the incidences of fatigue, dyskoimesis, dry mouth, dizziness, breathlessness, nausea, diarrhea, constipation, dry skin, muscle weakness, cramps, joint pain, sexual problems, and other symptoms in the test group are reduced; and the improvement effect (in terms of proportions of persons) on dyskoimesis, dry mouth, dizziness, breathlessness, nausea, diarrhea, dry skin, cramps, joint pain, sexual problems, and other symptoms are superior to that in the placebo group.
Further, after consuming the lactic acid bacteria containing composition, the incidences of fatigue, dizziness, breathlessness, nausea, diarrhea, constipation, dry skin, itchy skin, muscle weakness, joint pain, sexual problems, and other symptoms to the subjects with stage 3 chronic kidney disease in the test group are reduced, and the improvement effect (in terms of proportions of persons) on dyskoimesis, breathlessness, nausea, diarrhea, constipation and sexual problems is superior to that in the placebo group. After consuming the lactic acid bacteria containing composition, the incidences of fatigue, dyskoimesis, dry mouth, dizziness, chest distress, diarrhea, constipation, muscle weakness, cramps, joint pain, and other symptoms to the subjects with stage 4 chronic kidney disease in the test group are reduced, and the improvement effect (in terms of proportions of persons) on dyskoimesis, dry mouth, nausea, loss of appetite, diarrhea, constipation, dry skin, itchy skin, muscle weakness, numbness of limbs, cramps, joint pain and other symptoms is also superior to that in the placebo group.
Tables 37 and 38 compare the difference between the two groups by Wilcoxon rank-sum test, and the values are expressed as mean, standard deviation, and minimum-maximum. The improvement rate is calculated by a formula: (week 12-week 0)*100. In the tables, the symbol "*" indicates that there is significant difference between those with the same course of disease in different groups (p<0.05). The results show that by using the lactic acid bacteria containing composition disclosed in the present invention, the clinical symptoms including fatigue, cramps, dyskoimesis, constipation, muscle weakness, dry mouth, breathlessness, dry skin, joint pain, dizziness, diarrhea, and sexual problems can be ameliorated. With respect to the patients with stage 3 chronic kidney disease, dizziness, dry mouth, breathlessness, diarrhea, constipation and other symptoms are reduced. With respect to the patients with stage 4 chronic kidney disease, dizziness, dry mouth, breathlessness, loss of appetite, constipation and other symptoms are reduced.
It can be known from the results above that by administering the lactic acid bacteria containing composition disclosed in the present invention, the improvement rate is 52.17% for the fatigue symptom of the patients with chronic kidney disease, 47.83% for the cramp symptom, and over 30% for dyskoimesis, dry mouth, itchy skin, muscle weakness, dizziness, constipation, dry skin, joint pain, and other symptoms. In particular, by administering the lactic acid bacteria containing composition disclosed in the present invention, the improvement rate is 50% for the fatigue symptom of the patient with stage 3 chronic kidney disease; over 40% for dyskoimesis, muscle weakness, cramps, joint pain, sexual problems, and other symptoms, and over 30% for itchy skin, dizziness, breathlessness, constipation and other symptoms. By administering the lactic acid bacteria containing composition disclosed in the present invention, the improvement rate is over 50% for fatigue, dry mouth, cramps, and other symptoms of the patients with stage 4 chronic kidney disease; over 40% for dry skin, joint pain, and other symptoms; and over 30% for dyskoimesis, muscle weakness, constipation, and other symptoms.
Accordingly, it can be known that the lactic acid bacteria containing composition disclosed in the present invention is useful in ameliorating the clinical symptoms in patients with chronic kidney disease, including for example fatigue, cramps, dyskoimesis, dyspnea, dry mouth, itchy skin, muscle weakness, dizziness, tachypnea, chest tightness, sexual problems, constipation, dry skin, and joint pain, as well as in ameliorating dyskoimesis, dry mouth, nausea, loss of appetite, diarrhea, constipation, dry skin, itchy skin, muscle weakness, numbness of limbs, cramps, joint pain, and other symptoms.
TABLE-US-00035 TABLE 35 Number analysis of persons with clinical symptoms among all the subjects during week 0 to 12 of the test clinical symptoms Test group (n, %) Placebo group (n, %) fatigue Week 0 19 (82.6) 15 (83.3) Week 12 14 (60.9) 12 (66.)7 Improvement 12 (52.17) 11 (61.11) rate dyscoimesis Week 0 12 (52.2) 10 (55.6) Week 12 10 (43.5) 11 (61.1) Improvement 9 (39.13) 3 (16.67) rate dry mouth Week 0 12 (52.2) 12 (66.7) Week 12 11 (47.8) 12 (66.7) Improvement 9 (39.13) 5 (27.78) rate itchy skin Week 0 13 (56.5) 9 (50.0) Week 12 13 (56.5) 5 (27.8) Improvement 7 (30.43) 8 (44.44) rate muscle Week 0 13 (56.5) 10 (55.6) weakness Week 12 10 (43.5) 4 (22.2) Improvement 9 (39.13) 8 (44.44) rate numbness Week 0 13 (56.5) 11 (61.1) of limbs Week 12 13 (56.5) 8 (44.4) Improvement 6 (26.09) 7 (38.89) rate cramps Week 0 17 (73.9) 12 (66.7) Week 12 13 (56.5) 6 (33.3) Improvement 11 (47.83) 8 (44.44) rate feel cold Week 0 2 (8.7) 4 (22.2) Week 12 5 (21.7) 3 (16.7) Improvement 1 (4.35) 4 (22.22) rate dizziness Week 0 10 (43.5) 11 (61.1) Week 12 8 (34.8) 7 (38.9) Improvement 7 (30.43) 8 (44.44) rate dyspnea Week 0 9 (39.1) 6 (33.3) Week 12 7 (30.4) 4 (22.2) Improvement 5 (27.74) 5 (27.78) rate chest Week 0 7 (30.4) 7 (38.9) tightness Week 12 7 (30.4) 5 (27.8) Improvement 3 (13.04) 3 (16.67) rate sexual Week 0 9 (39.1) 6 (33.3) problems Week 12 8 (34.8) 6 (33.3) Improvement 5 (27.74 3 (16.67) rate nausea Week 0 5 (21.7) 4 (22.2) Week 12 4 (17.4) 4 (22.2) Improvement 4 (17.39) 2 (11.11) rate loss of Week 0 4 (17.4) 3 (16.7) appetite Week 12 4 (17.4) 3 (16.7) Improvement 4 (17.39) 2 (11.11) rate diarrhea Week 0 8 (34.8) 4 (22.2) Week 12 6 (26.1) 9 (50.0) Improvement 5 (21.74) 2 (11.11) rate constipation Week 0 15 (65.2) 7 (38.9) Week 12 10 (43.5) 4 (22.2) Improvement 8 (34.78) 4 (22.22) rate vomiting Week 0 3 (13.0) 3 (16.7) Week 12 4 (17.4) 2 (11.1) Improvement 0 (0.00) 1 (5.56) rate dry skin Week 0 13 (56.5) 6 (33.3) Week 12 12 (52.2) 7 (38.9) Improvement 8 (34.78) 5 (27.78) rate joint pain Week 0 17 (73.9) 14 (77.8) Week 12 13 (56.5) 11 (61.1) Improvement 9 (39.13) 7 (38.89) rate
TABLE-US-00036 TABLE 36 Number analysis of persons with clinical symptoms among subjects with stages 3 and 4 chronic kidney disease during weeks 0 to 12 of the test Stage 3 (n, %) Stage 4 (n, %) Test Placebo Test Placebo (n = 12) (n = 14) (n = 11) (n = 4) fatigue Week 0 10 (83.3) 11 (78.6) 9 (81.8) 4 (100.0) Week 12 8 (66.7) 9 (64.3) 6 (54.5) 3 (75.0) Improvement 6 (50.0) 7 (50.00) 6 (54.55) 4 (100.0) rate dyscoimesis Week 0 6 (50.0) 8 (57.1) 6 (54.5) 2 (50.0) Week 12 6 (50.0) 9 (64.3) 4 (36.4) 2 (50.0) Improvement 5 (41.67) 2 (14.29) 4 (36.36) 1 (25.00) rate dry mouth Week 0 5 (41.7) 11 (78.6) 7 (63.6) 1 (25.0) Week 12 7 (58.3) 9 (64.3) 4 (36.4) 3 (75.0) Improvement 3 (25.00) 5 (35.71) 6 (54.550 0 (0.00) rate itchy skin Week 0 7 (58.3) 7 (50.0) 6 (54.5) 2 (50.0) Week 12 6 (50.0) 4 (28.6) 7 (63.6) 1 (25.0) Improvement 4 (33.33) 7 (50.00) 3 (27.27) 1 (25.00) rate muscle Week 0 8 (66.7) 7 (50.0) 5 (45.5) 3 (75.0) weakness Week 12 6 (50.0) 2 (14.3) 4 (36.4) 2 (50.0) Improvement 5 (41.67) 7 (50.00) 4 (36.36) 1 (25.00) rate numbness Week 0 7 (58.3) 9 (64.3) 6 (54.5) 2 (50.0) of limbs Week 12 7 (58.3) 6 (42.9) 6 (54.5) 2 (50.0) Improvement 3 (25.00) 6 (42.86) 3 (27.270 1 (25.00) rate cramps Week 0 7 (58.3) 10 (71.4) 10 (90.9) 2 (50.0) Week 12 7 (58.3) 4 (28.6) 6 (54.5) 2 (50.0) Improvement 5 (41.67) 8 (57.14) 6 (54.55) 0 (0.00) rate feel cold Week 0 2 (16.7) 3 (21.4) 0 (0.0) 1 (25.0) Week 12 3 (25.0) 1 (7.10) 2 (18.2) 2 (50.0) Improvement 1 (8.33) 3 (21.43) 0 (0.00) 1 (25.00) rate dizziness Week 0 7 (58.3) 8 (57.1) 3 (27.3) 3 (75.0) Week 12 6 (50.0) 5 (35.7) 2 (18.2) 2 (50.0) Improvement 4 (33.33) 6 (42.86) 3 (27.27) 2 (50.00) rate dyspnea Week 0 7 (58.3) 5 (35.7) 2 (18.2) 1 (25.0) Week 12 5 (41.7) 3 (21.4) 2 (18.2) 1 (25.0) Improvement 4 (33.33) 4 (25.57) 1 (9.09) 1 (25.00) rate chest Week 0 3 (25.0) 6 (42.9) 4 (36.4) 1 (25.0) tightness Week 12 4 (33.3) 5 (35.7) 3 (27.3) 0 (0.0) Improvement 1 (8.33) 2 (14.29) 2 (18.18) 1 (25.00) rate sexual Week 0 6 (50.0) 4 (28.6) 3 (27.3) 2 (50.0) problems Week 12 4 (33.3) 6 (42.9) 4 (36.4) 0 (0.0) Improvement 5 (41.67) 1 (7.14) 0 (0.00) 2 (50.00) rate nausea Week 0 3 (25.0) 3 (21.4) 2 (18.2) 1 (25.0) Week 12 2 (16.7) 3 (21.4) 2 (18.2) 1 (25.0) Improvement 2 (16.67) 2 (14.29) 2 (18.18) 0 (0.00) rate loss of Week 0 1 (8.3) 3 (21.4) 3 (27.3) 0 (0.0) appetite Week 12 2 (16.7) 3 (21.4) 2 (18.2) 0 (0.0) Improvement 1 (8.33) 2 (14.49) 3 (27.27) 0 (0.00) rate diarrhea Week 0 3 (25.0) 4 (28.6) 5 (45.5) 0 (0.0) Week 12 2 (16.7) 8 (57.1)* 4 (36.4) 1 (25.0) Improvement 3 (25.00) 2 (14.29) 2 (18.18) 0 (0.00) rate constipation Week 0 8 (66.7) 5 (35.7) 7 (63.6) 2 (50.0) Week 12 5 (41.7) 3 (21.4) 5 (45.5) 1 (25.0) Improvement 4 (33.33) 3 (21.43) 4 (36.36) 1 (25.00) rate vomiting Week 0 2 (16.7) 2 (14.3) 1 (9.1) 1 (25.0) Week 12 3 (25.0) 1 (7.1) 1 (9.1) 1 (25.0) Improvement 0 (0.00) 1 (7.14) 0 (0.00) 0 (0.00) rate dry skin Week 0 7 (58.3) 5 (35.7) 6 (54.5) 1 (25.0) Week 12 6 (50.0) 5 (35.7) 6 (54.5) 2 (50.0) Improvement 3 (25.00) 5 (35.71) 5 (45.45) 0 (0.00) rate joint pain Week 0 9 (75.0) 12 (85.7) 8 (72.7) 2 (50.0) Week 12 8 (66.7) 9 (64.3) 5 (45.5) 2 (50.0) Improvement 5 (41.67) 7 (50.00) 4 (36.36) 0 (0.00) rate
TABLE-US-00037 TABLE 37 Incidence rate of clinical symptoms in subjects in the two groups Test group Placebo group Mean SD Mean SD fatigue Week 0 0.65 0.88 1.28 1.27 Week 12 0.43 0.73 0.61 0.85 Improvement 22 109 67 108 rate dyscoimesis Week 0 1.00 1.17 1.17 1.04 Week 12 0.65 0.78 1.00 0.97 Improvement 35 127 17 99 rate dry mouth Week 0 0.30 0.47 0.56 0.86 Week 12 0.35 0.57 0.44 0.78 Improvement -4 56 11 96 rate itchy skin Week 0 0.74 1.10 0.50 0.79 Week 12 0.43 0.79 0.28 0.57 Improvement 30 115 22 88 rate muscle Week 0 0.22 0.42 0.33 0.77 weakness Week 12 0.26 0.62 0.28 0.57 Improvement -4 71 6 94 rate numbness Week 0 0.17 0.49 0.17 0.38 of limbs Week 12 0.26 0.62 0.11 0.32 Improvement -9 -42 6 -24 rate cramps Week 0 0.22 0.52 0.22 0.55 Week 12 0.26 0.69 0.17 0.38 Improvement -4 -82 6 -42 rate feel cold Week 0 0.43 0.66 0.50 0.99 Week 12 0.35 0.71 0.72 0.89 Improvement 9 -100 -22 -88 rate dizziness Week 0 1.26 1.21 0.50 0.71* Week 12 0.87 1.18 0.33 0.77 Improvement 39 -89 17 -71 rate dyspnea Week 0 1.22 1.24 0.89 1.02 Week 12 0.87 1.14 0.44 0.98 Improvement 35 -130 44 -120 rate chest Week 0 1.04 1.15 0.94 1.00 tightness Week 12 1.13 1.25 0.89 1.18 Improvement -9 -104 6 -111 rate sexual Week 0 1.26 1.01 1.22 1.17 problems Week 12 0.78 0.85 0.50 0.86 Improvement 48 -95 72 -102 rate nausea Week 0 1.43 1.12 1.72 1.13 Week 12 1.17 1.23 1.28 1.27 Improvement 26 -114 44 -110 rate loss of Week 0 1.61 1.03 1.56 1.10 appetite Week 12 1.04 1.07 0.78 0.65 Improvement 57 -104 78 -106 rate diarrhea Week 0 1.13 1.25 0.67 1.08 Week 12 0.87 1.06 0.61 0.98 Improvement 26 -136 6 -116 rate constipation Week 0 0.91 1.00 0.61 0.70 Week 12 0.91 0.95 0.28 0.46* Improvement 0 -117 33 -84 rate vomiting Week 0 0.09 0.29 0.50 1.04 Week 12 0.26 0.54 0.22 0.55 Improvement -17 -58 28 -127 rate dry skin Week 0 1.00 1.13 1.00 1.08 Week 12 0.57 0.79 1.00 1.03 Improvement 43 -120 0 -77 rate joint pain Week 0 0.74 1.10 0.67 1.03 Week 12 0.65 1.03 0.50 0.86 Improvement 9 -128 17 -99 rate
TABLE-US-00038 TABLE 38 Incidence rate of clinical symptoms in subjects with stages 3 and 4 chronic kidney disease Stage 3 Stage 4 Test Placebo Test Placebo Mean SD Mean SD Mean SD Mean SD fatigue Week 0 0.83 0.94 1.21 1.31 0.45 0.82 1.50 1.29 Week 12 0.67 0.89 0.50 0.76 0.18 0.40 1.00 1.15 Improvement 17 134 71 120 27 79 50 58 rate dyscoimesis Week 0 0.92 1.31 1.36 1.01 1.09 1.04 0.50 1.00 Week 12 0.83 0.83 1.00 1.04 0.45 0.69 1.00 0.82 Improvement 8 124 36 101 64 129 -50 58 rate dry mouth Week 0 0.25 0.45 0.50 0.65 0.36 0.50 0.75 1.50 Week 12 0.33 0.49 0.57 0.85 0.36 0.67 0.00 0.00 Improvement -8 51 -7 73 0 63 75 150 rate itchy skin Week 0 0.92 1.00 0.57 0.85 0.55 1.21 0.25 0.50 Week 12 0.50 0.67 0.29 0.61 0.36 0.92 0.25 0.50 Improvement 42 131 29 91 18 98 0 82 rate muscle Week 0 0.25 0.45 0.36 0.84 0.18 0.40 0.25 0.50 weakness Week 12 0.33 0.78 0.29 0.61 0.18 0.40 0.25 0.50 Improvement -8 79 7 107 0 63 0 0 rate numbness Week 0 0.25 0.62 0.14 0.36 0.09 0.30 0.25 0.50 of limbs Week 12 0.42 0.79 0.07 0.27 0.09 0.30 0.25 0.50 Improvement -17 58 7 27 0 0 0 0 rate cramps Week 0 0.08 0.29 0.29 0.61 0.36 0.67 0.00 0.00 Week 12 0.33 0.89 0.21 0.43 0.18 0.40 0.00 0.00 Improvement -25 97 7 47 18 60 0 0 rate feel cold Week 0 0.33 0.65 0.64 1.08 0.55 0.69 0.00 0.00 Week 12 0.17 0.39 0.79 0.89* 0.55 0.93 0.50 1.00 Improvement 17 83 -14 86 0 118 -50 100 rate dizziness Week 0 1.33 1.30 0.50 0.76 1.18 1.17 0.50 0.58 Week 12 0.83 1.19 0.36 0.84 0.91 1.22 0.25 0.50 Improvement 50 90 14 77 27 90 25 50 rate dyspnea Week 0 1.58 1.24 0.71 0.91 0.82 1.17 1.50 1.29 Week 12 1.17 1.27 0.29 0.83* 0.55 0.93 1.00 1.41 Improvement 42 144 43 128 27 119 50 100 rate chest Week 0 1.17 1.19 1.07 1.07 0.91 1.14 0.50 0.58 tightness Week 12 1.17 1.27 0.79 1.12 1.09 1.30 1.25 1.50 Improvement 0 85 -29 83 18 125 75 171 rate sexual Week 0 1.17 1.19 1.43 1.22 1.36 0.81 0.50 0.58 problems Week 12 0.92 1.00 0.50 0.94 0.64 0.67 0.50 0.58 Improvement -25 106 -93 107 -73 79 0 0 rate nausea Week 0 1.67 1.23 1.93 1.07 1.18 0.98 1.00 1.15 Week 12 1.25 1.14 1.29 1.27 1.09 1.38 1.25 1.50 Improvement -42 124 -64 115 -9 104 25 50 rate loss of Week 0 1.75 1.14 1.29 1.07 1.45 0.93 2.50 0.58 appetite Week 12 1.25 1.14 0.79 0.70 0.82 0.98 0.75 0.50 Improvement -50 117 -50 102 -64 92 -175 50* rate diarrhea Week 0 1.25 1.36 0.64 1.01 1.00 1.18 0.75 1.50 Week 12 1.00 1.28 0.50 0.85 0.73 0.79 1.00 1.41 Improvement -25 148 -14 129 -27 127 25 50 rate constipation Week 0 0.92 1.00 0.64 0.74 0.91 1.04 0.50 0.58 Week 12 0.83 0.94 0.29 0.47 1.00 1.00 0.25 0.50 Improvement -8 124 -36 93 9 114 -25 50 rate vomiting Week 0 0.17 0.39 0.50 1.09 0.00 0.00 0.50 1.00 Week 12 0.25 0.45 0.14 0.53 0.27 0.65 0.50 0.58 Improvement 8 51 -36 128 27 65 0 141 rate dry skin Week 0 1.08 1.24 1.00 1.11 0.91 1.04 1.00 1.15 Week 12 0.75 0.97 1.07 1.07 0.36 0.50 0.75 0.96 Improvement -33 130 7 62 -55 113 -25 126 rate joint pain Week 0 1.00 1.21 0.50 0.85 0.45 0.93 1.25 1.50 Week 12 0.58 1.00 0.64 0.93 0.73 1.10 0.00 0.00 Improvement -42 162 14 53 27 65 -125 150* rate
TABLE-US-00039 TABLE 39 Distribution of the number of persons with improved symptoms among subjects at week 12 of the test, as compared with the situations before test All Subjects Test group Placebo group P-value n (%) fatigue 12 (52.17) 11 (61.11) 0.752 dyscoimesis 9 (39.13) 3 (16.67) 0.171 dry mouth 9 (39.13) 5 (27.78) 0.520 itchy skin 7 (30.43) 8 (44.44) 0.514 muscle 9 (39.13) 8 (44.44) 0.759 weakness numbness of 6 (26.09) 7 (38.89) 0.503 limbs cramps 11 (47.83) 8 (44.44) 1.000 feel cold 1 (4.35) 4 (22.22) 0.150 dizziness 7 (30.43) 8 (44.44) 0.514 dyspnea 5 (27.74) 5 (27.78) 0.724 chest 3 (13.04) 3 (16.67) 1.000 tightness sexual 5 (27.74 3 (16.67) 1.000 problems nausea 4 (17.39) 2 (11.11) 0.678 loss of 4 (17.39) 2 (11.11) 0.678 appetite diarrhea 5 (21.74) 2 (11.11) 0.438 constipation 8 (34.78) 4 (22.22) 0.496 vomiting 0 (0.00) 1 (5.56) 0.439 dry skin 8 (34.78) 5 (27.78) 0.741 joint pain 9 (39.13) 7 (38.89) 1.000
TABLE-US-00040 TABLE 40 Distribution of the number of persons with improved symptoms among subjects with stages 3 and 4 chronic kidney disease at week 12 of the test, as compared with the situations before test Stage 3 Stage 4 n (%) Test Placebo P-value Test Placebo P-value fatigue 6 (50.0) 7 (50.00) 1.000 6 (54.55) 4 (100.0) 0.230 dyscoimesis 5 (41.67) 2 (14.29) 0.190 4 (36.36) 1 (25.00) 1.000 dry mouth 3 (25.00) 5 (35.71) 0.682 6 (54.550 0 (0.00) 0.103 itchy skin 4 (33.33) 7 (50.00) 0.452 3 (27.27) 1 (25.00) 1.000 muscle weakness 5 (41.67) 7 (50.00) 0.713 4 (36.36) 1 (25.00) 1.000 numbness of limbs 3 (25.00) 6 (42.86) 0.429 3 (27.270 1 (25.00) 1.000 cramps 5 (41.67) 8 (57.14) 0.695 6 (54.55) 0 (0.00) 0.103 feel cold 1 (8.33) 3 (21.43) 0.598 0 (0.00) 1 (25.00) 0.267 dizziness 4 (33.33) 6 (42.86) 0.701 3 (27.27) 2 (50.00) 0.560 dyspnea 4 (33.33) 4 (25.57) 1.000 1 (9.09) 1 (25.00) 0.476 chest tightness 1 (8.33) 2 (14.29) 1.000 2 (18.18) 1 (25.00) 1.000 sexual problems 5 (41.67) 1 (7.14) 0.652 0 (0.00) 2 (50.00) 0.049 nausea 2 (16.67) 2 (14.29) 1.000 2 (18.18) 0 (0.00) 1.000 loss of appetite 1 (8.33) 2 (14.49) 1.000 3 (27.27) 0 (0.00) 0.516 diarrhea 3 (25.00) 2 (14.29) 0.634 2 (18.18) 0 (0.00) 1.000 constipation 4 (33.33) 3 (21.43) 0.665 4 (36.36) 1 (25.00) 1.000 vomiting 0 (0.00) 1 (7.14) 1.000 0 (0.00) 0 (0.00) -- dry skin 3 (25.00) 5 (35.71) 0.683 5 (45.45) 0 (0.00) 0.231 joint pain 5 (41.67) 7 (50.00) 0.713 4 (36.36) 0 (0.00) 0.517
Example 13: Analysis of the Lactic Acid Bacteria Containing Composition and Renal Function Indices
The renal function indices and other factors of the subjects are analyzed. The results are shown in Tables 41 and 42. The correlation between the renal function indices and other items of analysis is determined by Pearson correlation coefficients. In the tables, the symbol "*" indicates p<0.05; and the symbol "**" indicates p<0.01.
At week 0 of the test, the MDR-eGFR and CKD-EPI negatively correlate with the total body skeletal muscle, BS, TG, CHOL, LDL, IS, PCS, TP, ALB, Globulin, ALP, mean corpuscular volume, mean hemoglobin concentration, PH, UPro, UOB, and ULE, suggesting that when the MDR-eGFR and CKD-EPI in patients with progressive chronic kidney disease are reduced, the IS, PCS and urine protein are increased, and the correlation with the IS, PCS, and urine protein are significant. The cases for other items are on the contrary. However, the MDR-eGFR and CKD-EPI are in obviously positive correlation with the erythrocyte count, hemoglobin concentration, hematocrit, ALT, and specific gravity of urine.
The IS value is in obviously negative correlation with the erythrocyte counts, hematocrit, and specific gravity of urine, and in obviously positive correlation with the TP, Globulin, dry skin, and sexual problems. The PCS value is in obviously positive correlation with the problem of itchy skin.
The BUN value is in obviously negative correlation with the erythrocyte counts, hematocrit and specific gravity of urine, in obviously negative correlation with the MDR-eGFR, CKD-EPI, TP, Globulin, dry skin, and sexual problems, but in obviously positive correlation with the IS, PCS, creatinine, and urine protein.
The creatinine value is in obviously negative correlation with the MDR-eGFR, CKD-EPI, erythrocyte counts, hematocrit, ALT, and specific gravity of urine, in obviously negative correlation with the MDR-eGFR, CKD-EPI, TP, Globulin, dry skin, and sexual problems, but in obviously positive correlation with the IS, PCS, and urine protein.
Further, the data above is analyzed by Pearson correlation coefficients. The results are shown in Table 43 and 44. The correlation between the renal function indices and other items of analysis is determined by Pearson correlation coefficients. In the tables, the symbol "*" indicates p<0.05; and the symbol "**" indicates p<0.01. Tables 43 and 44 show that the decrease (week 12-week 0 of the test) in MDR-eGFR D and CKD-EPI of the patients with chronic kidney disease negatively correlates with the body weight, BMI, total body skeletal muscle, TG, BS (week 12-week 0 of the test), ALP, TP, ALB, A/G Ratio, erythrocyte counts, hemoglobin concentration, hematocrit, average corpuscular volume, and variations in PH (week 12-week 0 of the test), GLU (week 12-week 0 of the test), and SG (week 12-week 0 of the test), as well as other items, but the correlation is insignificant.
The decrease in serum BUN is in obviously negative correlation with the body fat percentage, visceral fat percentage, and subcutaneous body fat percentage, suggesting that the more the decrease in BUN is, the lower the values are, and there is significant difference with respect to the body fat percentage. The decrease in serum BUN is in positive correlation with the body weight, BMI, WHR, specific gravity of urine, total body skeletal muscle, waist circumference, and waist-hip ratio, and the correlation with the waist-hip ratio is significant.
The decrease in serum creatinine level is in negative correlation with subcutaneous body fat percentage, waist circumference, waist-hip ratio, HDL, variation in T4 (week 12-week 0 of the test), ALT, Globulin, A/G Ratio, erythrocyte counts, hemoglobin concentration, hematocrit, mean corpuscular-hemoglobin, mean hemoglobin concentration, platelets, and variations in PH (week 12-week 0 of the test) and GLU (week 12-week 0 of the test), and the correlation with the body fat percentage is significant. The decrease in serum creatinine level positively correlates with other items, and the correlation with the erythrocyte counts and hematocrit are significant.
The decrease in serum uric acid (UA) is in positive correlation with the total body skeletal muscle, waist-hip ratio, TG, AST, globulin counts, RBC, hemoglobin concentration, mean corpuscular hemoglobin, mean hemoglobin concentration, variation in PH (week 12-week 0 of the test), proteins (week 12-week 0 of the test), GLU (week 12-week 0 of the test), urine occult blood (W12-W0), and specific gravity of urine (Week 12-week 0 of the test), and in negative correlation with other items; however, the correlation is insignificant.
The decrease in IS is in negative correlation with the body weight, BMI, visceral fat percentage, total body skeletal muscle, waist circumference, waist-hip ratio, CHOL, TG, variations in LDL (week 12-week 0 of the test) and T4 (week 12-week 0 of the test), AST, ALT, A/G Ratio, erythrocyte counts, hemoglobin concentration, hematocrit, mean corpuscular volume, platelets, and variations in PH (week 12-week 0 of the test) and PRO (week 12-week 0 of the test), and in positive correlation with other items. The correlation with the body weight, BMI, hematocrit, platelet counts, and mean hemoglobin concentration is significant.
The decrease in PCS is in negative correlation with the body weight, BMI, visceral fat percentage, subcutaneous body fat percentage, CHOL, variations in LDL (week 12-week 0 of the test) and T4 (week 12-week 0 of the test), AST, ALT, ALP, TP, ALB, Globulin, A/G Ratio, erythrocyte counts, hemoglobin concentration, hematocrit, mean corpuscular volume, platelets, erythrocyte, hemoglobin concentration, hematocrit, mean corpuscular volume, platelets, and variations in PH (week 12-week 0 of the test), PRO (week 12-week 0 of the test) and SG (week 12-week 0 of the test), in positive correlation with other items, and in obviously positive correlation with urine occult blood.
The analysis results above show that after administering the lactic acid bacteria containing composition disclosed in the present invention, for the patients with chronic kidney disease who have a large decrease in body weight and BMI, the MDRD-eGFR and CKD-EPI value, and the serum IS, PCS, and UA levels are low, indicating that consumption of the lactic acid bacteria containing composition disclosed in the present invention enables the body weight and renal function indices to be improved. The decrease in body fat percentage has the same effect in amelioration of the serum creatinine level; however, the case for the erythrocyte counts and hematocrit is on the contrary, suggesting that consumption of the lactic acid bacteria containing composition disclosed in the present invention has the effect of improving the anemia indices including erythrocyte counts and hematocrit. The increase in the IS level leads to the decrease of the mean hemoglobin concentration, hematocrit, and serum creatinine level; however, the case for the platelet counts is on the contrary. Therefore, long-term consumption of the lactic acid bacteria containing composition disclosed in the present invention definitely has the efficacy of increasing the MDRD-eGFR, CKD-EPI, erythrocyte counts, and hematocrit, and ameliorating the serum BUN, creatinine, IS, and PCS levels.
TABLE-US-00041 TABLE 41 Pearson correlation coefficient analysis of renal function indices with other items of analysis of the subjects before test BUN Creatinint UA MDRD-eGFR CKD-EPI IS PCS Age -0.147 -0.180 0.071 0.116 0.041 -0.030 -0.215 Weight -0.241 -0.186 -0.056 0.240 0.261 0.016 -0.055 BMI -0.265 -0.244 -0.055 0.177 0.204 -0.072 -0.028 Body fat ratio -0.053 -0.360* 0.133 0.119 0.137 0.036 -0.073 visceral fat -0.350* -0.291 -0.072 0.292 0.310 -0.103 -0.054 total body -0.176 -0.250 -0.105 0.094 0.112 -0.105 -0.186 skeletal muscle total body 0.328* 0.295 0.174 -0.295 -0.288 0.237 0.318 skeletal muscle waist -0.144 -0.196 0.062 0.187 0.194 -0.055 -0.038 circumference waist-hip ratio -0.147 -0.189 0.159 0.201 0.190 -0.062 -0.014 triglyceride -0.065 -0.039 0.072 -0.023 -0.021 -0.081 -0.135 triglyceride 0.138 0.156 0.248 -0.140 -0.120 -0.055 -0.073 cholesterol 0.115 0.148 0.210 -0.238 -0.242 -0.132 0.068 LDL-C 0.134 0.233 0.174 -0.289 -0.307 -0.065 0.166 HDL-C -0.158 -0.299 -0.187 0.200 0.197 -0.123 -0.111 T4 -0.180 -0.073 0.027 0.177 0.168 0.027 0.191 MDRD-eGFR -0.750** -0.887** -0.102 -- -- -- -- CKD-EPI -0.747** -0.886** -0.107 0.997** -- -- Creatinint 0.701** -- -- -- -- -- -- UA 0.158 -0.016 -- -- -- -- -- IS 0.507** 0.522** 0.180 -0.472** -0.473** -- -- PCS 0.324* 0.336* 0.126 -0.341* -0.330* 0.160 -- TP 0.135 0.108 0.048 -0.048 -0.048 0.510** 0.111 ALB -0.027 -0.042 0.130 -0.018 -0.031 0.253 -0.050 Globulin 0.187 0.166 -0.040 -0.065 -0.055 0.430** 0.184 A/G ratio -0.132 -0.108 0.100 0.002 -0.014 -0.157 -0.147 AST -0.273 -0.285 0.054 0.263 0.253 -0.232 -0.189 ALT -0.415** -0.338* 0.046 0.327* 0.326* -0.298 -0.212 ALP 0.043 0.104 -0.113 -0.088 -0.100 0.050 0.115 erythrocyte -0.466** -0.465** -0.084 0.641** 0.647** -0.343* -0.090 hemoglobin -0.448** -0.426** -0.029 0.594** 0.592** -0.290 -0.184 hematocrit -0.470** -0.431** -0.047 0.584** 0.589** -0.367* -0.136 mean 0.119 0.202 0.062 -0.306 -0.309* 0.034 -0.104 corpuscular volume mean 0.070 0.137 0.074 -0.142 -0.163 0.170 -0.249 corpuscular hemoglobin mean -0.017 -0.022 0.091 0.136 0.107 0.237 -0.204 hemoglobin concentration platelet 0.206 -0.004 0.045 -0.088 -0.065 0.024 -0.079 Blood PH -0.110 0.076 0.048 -0.050 -0.054 -0.230 -0.004 Upro 0.261 0.539** 0.077 -0.490** -0.473** 0.112 0.302 UG -0.173 -0.140 -0.019 0.099 0.108 -0.222 -0.108 UOB 0.364* 0.282 0.062 -0.269 -0.252 0.255 0.131 Urine specific -0.036 -0.064 0.104 -0.135 -0.143 -0.002 -0.040 gravity Urine PH -0.331* -0.364* 0.056 0.411** 0.432** -0.321* -0.061
TABLE-US-00042 TABLE 42 Spearman correlation coefficient analysis of the severity of the clinical symptoms with renal function indices after week 12 of the test BUN Creatinint UA MDRD-eGFR CKD-EPI IS PCS fatigue -0.096 -0.127 0.047 0.039 0.076 0.085 -0.089 dyscoimesis -0.088 -0.038 0.080 0.003 -0.008 -0.108 0.018 dry mouth -0.067 -0.092 0.278 0.104 0.104 0.124 -0.174 itchy skin 0.096 0.102 -0.244 -0.119 -0.108 0.285 0.317* muscle -0.122 -0.204 -0.188 0.202 0.224 0.083 0.199 weakness numbness of -0.024 -0.016 0.021 0.023 0.023 0.065 0.137 limbs cramps 0.206 0.215 0.188 -0.249 -0.279 0.165 0.146 feel cold 0.237 0.029 0.004 -0.041 -0.048 -0.020 0.237 dizziness -0.109 -0.204 -0.006 0.122 0.138 -0.159 0.000 dyspnea -0.170 -0.097 -0.229 0.097 0.103 -0.158 -0.041 chest -0.090 0.065 0.111 -0.046 -0.040 0.080 0.173 tightness sexual -0.060 -0.091 -0.028 0.222 0.205 0.345* -0.019 problems nausea 0.017 -0.024 -0.176 0.039 0.078 0.237 0.214 loss of -0.321 -0.175 0.089 0.048 0.069 0.123 -0.051 appetite diarrhea -0.204 -0.177 0.068 0.080 0.111 0.110 0.076 constipation 0.284 -0.021 -0.027 -0.114 -0.102 0.305 0.285 vomiting -0.035 -0.148 -0.012 0.111 0.104 0.146 0.152 dry skin 0.218 0.149 0.256 -0.178 -0.168 0.335* 0.077 joint pain -0.071 -0.207 -0.144 0.174 0.164 -0.267 -0.092
TABLE-US-00043 TABLE 43 Correlation analysis of renal function indices with other items of analysis of the subject in the test group after week 12 of the test Test Group BUN Creatinint UA MDRD-eGFR CKD-EPI IS PCS Weight (Kg) 0.169 0.326 -0.278 -0.069 -0.072 -0.485* -0.091 BMI (kg/m.sup.2) 0.175 0.273 -0.238 -0.020 -0.022 -0.470* -0.074 Body fat ratio (%) -0.150 -0.515* -0.117 0.414 0.418 0.190 0.130 visceral fat ratio -0.116 0.097 -0.451 0.203 0.198 -0.315 -0.204 (%) subcutaneous body -0.317 -0.081 -0.055 0.103 0.104 0.155 -0.201 fat percentage (%) total body skeletal 0.285 0.103 0.085 -0.152 -0.149 -0.185 0.147 muscle (%) waist 0.418 -0.153 -0.002 0.228 0.227 -0.165 0.493* circumference (cm) waist-hip ratio 0.471* -0.139 0.179 0.169 0.170 -0.190 0.280 BS (W12-W0) 0.161 0.031 -0.075 -0.100 -0.100 0.237 0.218 TG -0.043 0.139 0.038 -0.188 -0.189 -0.020 0.001 CHOL 0.258 0.064 -0.177 0.162 0.159 -0.207 -0.030 HDL 0.224 -0.269 -0.031 0.278 0.279 0.053 0.121 LDL (W12-W0) 0.276 0.058 -0.162 0.110 0.106 -0.234 -0.065 T4 (W12-W0) 0.227 -0.193 -0.295 0.301 0.302 -0.096 0.006 AST -0.135 0.005 0.147 0.037 0.035 -0.025 -0.060 ALT -0.159 -0.008 -0.169 0.063 0.063 -0.102 -0.031 ALP -0.253 0.277 -0.393 -0.322 -0.324 0.107 -0.054 TP -0.330 0.159 -0.192 -0.090 -0.093 0.215 -0.137 ALB -0.303 0.365 -0.293 -0.340 -0.343 0.184 -0.182 Globulin -0.133 -0.075 0.000 0.129 0.128 0.128 -0.019 A/G Ratio -0.023 0.204 -0.123 -0.226 -0.225 -0.019 -0.051 erythrocyte -0.206 0.546* -0.035 -0.225 -0.222 -0.316 -0.147 hemoglobin -0.219 0.410 0.097 -0.145 -0.144 -0.204 -0.091 hematocrit -0.271 0.653** -0.181 -0.318 -0.317 -0.454* -0.227 mean corpuscular -0.123 0.260 -0.308 -0.250 -0.255 -0.337 -0.206 volume mean corpuscular -0.017 -0.262 0.421 0.226 0.222 0.244 0.212 hemoglobin mean hemoglobin 0.058 -0.342 0.433 0.323 0.324 0.426* 0.310 concentration platelet 0.291 -0.013 -0.098 0.085 0.090 -0.508* -0.137 PH -0.022 -0.017 0.030 -0.020 -0.020 -0.158 -0.059 Upro -0.034 0.000 0.380 0.062 0.062 -0.017 -0.012 UG -0.011 -0.015 -0.145 -0.048 -0.048 0.333 0.318 UOB -0.257 0.000 0.281 0.111 0.111 0.174 0.474* Urine specific 0.473* 0.240 0.441 -0.364 -0.364 0.122 -0.093 gravity
TABLE-US-00044 TABLE 44 Correlation analysis of renal function indices with other items of analysis of the subjects in the placebo group after week 12 of the test placebo group BUN Creatinint UA MDRD-eGFR CKD-EPI IS PCS Weight (Kg) -0.061 -0.033 -0.085 0.000 0.007 0.182 0.039 BMI (kg/m.sup.2) 0.233 0.208 0.336 -0.311 -0.296 -0.063 0.000 Body fat ratio (%) 0.148 0.208 -0.158 -0.168 -0.172 -0.028 0.012 visceral fat ratio 0.038 0.168 0.192 -0.078 -0.072 -0.276 0.073 (%) subcutaneous body 0.037 0.072 -0.344 -0.017 -0.021 -0.148 0.041 fat percentage (%) total body skeletal -0.311 -0.223 -0.042 0.327 0.330 -0.154 0.139 muscle (%) waist 0.295 0.345 0.359 -0.359 -0.361 -0.106 0.171 circumference (cm) waist-hip ratio 0.081 0.302 0.403 -0.298 -0.295 -0.143 0.415 BS (W12-W0) 0.177 0.201 0.065 -0.280 -0.291 0.139 -0.161 TG -0.031 0.093 0.102 -0.191 -0.199 -0.189 0.394 CHOL 0.141 0.008 0.005 -0.227 -0.237 0.026 0.073 HDL -0.245 -0.342 -0.207 0.382 0.386 0.188 0.167 LDL (W12-W0) 0.144 -0.016 -0.028 -0.153 -0.159 0.172 -0.186 T4 (W12-W0) 0.133 0.239 0.200 -0.112 -0.117 0.262 0.216 AST 0.360 0.116 -0.056 -0.029 -0.041 0.068 0.153 ALT 0.035 -0.147 -0.309 0.378 0.362 0.278 0.204 ALP 0.193 0.038 -0.356 0.150 0.135 0.029 -0.358 TP 0.393 0.449 0.434 -0.326 -0.328 0.168 0.003 ALB 0.246 0.407 0.432 -0.424 -0.428 0.141 0.218 Globulin 0.280 0.207 0.166 -0.034 -0.034 0.087 -0.190 A/G Ratio -0.044 0.074 0.107 -0.226 -0.229 -0.001 0.286 erythrocyte 0.099 0.165 -0.094 -0.212 -0.214 -0.101 -0.169 hemoglobin 0.002 0.133 -0.014 -0.138 -0.141 0.148 0.014 hematocrit 0.007 0.200 -0.029 -0.254 -0.252 -0.135 -0.095 mean corpuscular -0.200 0.101 0.230 -0.151 -0.142 -0.046 0.249 volume mean corpuscular -0.146 -0.024 0.151 0.085 0.082 0.489* 0.351 hemoglobin mean hemoglobin -0.001 -0.094 0.029 0.186 0.175 0.653** 0.227 concentration platelet 0.131 0.171 -0.129 -0.044 -0.045 -0.068 -0.464 PH -0.163 -0.071 0.576* 0.063 0.063 -0.016 0.161 Upro -0.169 0.084 0.259 -0.076 -0.076 -0.037 -0.029 UG 0.284 -0.092 0.038 0.024 0.024 0.202 -0.085 UOB 0.117 0.213 0.305 -0.210 -0.210 -0.304 -0.153 Urine specific 0.049 0.110 0.498* -0.095 -0.095 0.007 0.171 gravity
Example 14: Analysis of Nutrient Intake from Diets
The nutrient intake from diets of the subjects is analyzed at about week 12 of the test. The results are shown in Tables 45 and 46, where the difference between the two groups is compared by 2-Independent-Samples t-test, and the values are expressed as mean, standard deviation, and minimum-maximum. In the tables, the symbol "*" indicates p<0.05. It can be known from Tables 45 and 46 that there are no significant differences in the intake of calories, three main nutrients (in percentages), saturated fat, dietary fiber, ash and sodium before and after test (P>0.05), and between the subjects with stages 3 and 4 chronic kidney disease (P>0.05).
Compared with the recommends for patients with stages 3-4 chronic kidney disease in Clinical Practice Guidelines For Chronic Kidney Disease (K/DOQI), except that the fat intake in percentages from the diet is above the recommended value 30%, the protein intake before and after test is about 0.80 kg/kg/day (58.47 kg/73.39 kg; 13.41%) and 0.78 kg/kg/day (57.78 kg/74.26 kg; 13.48%) respectively, which conform to the recommends for patients with stages 3-4 chronic kidney disease: 0.6-0.8 kg/kg/day. Following the recommends for patients with stages 3-4 chronic kidney disease in the Clinical Practice Guidelines: about 1500-1800 kcal/day for those weighed 50-60 kg, the total intake of calories from the diet is 1746.+-.565 kcal/day and 1746.+-.565 kcal/day before and after test. The intake of the dietary fiber of the subjects is only 16.39.+-.7.61 g/day and 15.27.+-.6.92 g/day on average before and after test, which are below the recommend 20 g/day.
TABLE-US-00045 TABLE 45 Analysis of daily main nutrient intake of all the subjects Mean SD Range Calorie Week 0 1746 565 707-3133 Week 12 1761 515 536-2866 Crude Week 0 58.47 20.81 19.25-104.37 protein Week 12 57.78 17.46 16.84-93.38 Crude Week 0 13.41 2.57 9.76-19.94 protein % Week 12 13.48 3.61 4.60-25.29 P Crude Week 0 65.21 26.55 20.95-138.19 protein Week 12 63.92 25.27 10.32-110.87 Crude Week 0 33.40 7.77 13.70-53.23 protein Week 12 32.72 11.02 8.51-58.05 Carbohydrates Week 0 232.59 83.31 110.85-443.96 Week 12 233.72 90.45 69.82-413.78 pCHO Week 0 53.58 8.08 36.15-69.40 Week 12 52.90 12.18 26.26-73.33 Saturated Week 0 16.23 8.19 3.24-38.27 fat Week 12 17.69 9.45 2.28-45.27 Dietary fiber Week 0 16.39 7.61 5.18-31.08 Week 12 15.27 6.92 3.72-32.15 Ash Week 0 10.05 3.73 4.25-19.91 Week 12 9.77 3.72 4.19-20.71
TABLE-US-00046 TABLE 46 Analysis of daily main nutrient intake of subjects in the two groups Test Group Placebo Group Mean SD Range Mean SD Range Calorie Week 0 1661 469 915-2457 1853 666 707-3133 Week 12 1593 408 1013-2308 1919 565 536-2866 Crude Week 0 55.60 19.30 22.34-97.54 62.15 22.60 19.25-104.37 protein Week 12 53.77 16.49 21.67-76.10 61.57 17.95 16.84-93.38 Crude Week 0 13.32 2.50 9.76-19.51 13.52 2.73 10.01-19.94 protein % Week 12 13.96 4.61 4.60-25.29 13.02 2.38 9.82-21.14 P Crude Week 0 63.19 25.37 21.19-138.19 67.80 28.52 20.95-125.04 protein Week 12 57.57 27.07 10.32-110.62 69.91 22.57 11.21-110.87 Crude Week 0 34.04 8.21 20.83-53.23 32.59 7.32 13.70-44.46 protein Week 12 32.22 13.04 8.51-58.05 33.19 9.07 18.81-49.77 Carbohydrates Week 0 219.32 71.16 117.29-379.38 249.55 96.10 110.85-443.96 Week 12 206.87 72.22 69.82-356.43 259.07 100.27 88.04-413.78 pCHO Week 0 53.11 8.70 36.15-69.40 54.18 7.42 42.89-67.65 Week 12 52.42 14.80 26.26-73.33 53.34 9.50 37.38-68.21 Saturated Week 0 16.49 8.72 3.24-38.27 15.91 7.68 3.48-32.03 fat Week 12 16.35 11.58 2.28-45.27 18.96 6.99 4.77-31.37 Dietary Week 0 15.94 7.40 5.18-29.65 16.96 8.06 6.59-31.08 fiber Week 12 14.88 7.62 4.86-32.15 15.63 6.38 3.72-27.81 Ash Week 0 9.23 2.74 4.25-14.84 11.11 4.58 4.93-19.91 Week 12 10.22 4.59 4.19-20.71 9.34 2.72 4.34-14.59
It can be known from the results above that administration of the lactic acid bacteria containing composition disclosed in the present invention has no impact on the daily diet and nutrient uptake of the subjects. In other words, dietary factors do not affect the test results. This suggests that the lactic acid bacteria containing composition disclosed in the present invention has very good safety, does not affect the daily diet and nutrient uptake of the subjects, and does not cause any side effects, thus being useful as a dietary supplement, food, or a food additive, for maintaining the renal functions and delaying the occurrence of metabolic syndrome.
Taken together, it can be known that the lactic acid bacteria containing composition disclosed in the present invention has the efficacy of ameliorating metabolic syndrome and maintaining the renal function in patients with chronic kidney disease, and can effectively slow down the progression of the disease in patients with chronic kidney disease, reduce the potential of the patients undergoing dialysis treatment, and considerably reduce the risk of cardiovascular disease and stroke resulting from metabolic syndrome, thus reducing the mortality caused by chronic kidney disease.
Furthermore, the lactic acid bacteria containing composition disclosed in the present invention can not only maintain the renal functions, but also improve the liver functions and urine UPro, UG, UOB, and ULE levels, and enhance the serum calcium and magnesium levels. Therefore, for patients with chronic kidney disease, the lactic acid bacteria containing composition disclosed in the present invention is effective in the prevention of hypocalcemia, improvement of abnormalities in urine, and maintenance of liver functions. Also, the lactic acid bacteria containing composition disclosed in the present invention has good improvement effect on clinical symptoms of the patients with chronic kidney disease, thus being useful as a pharmaceutical composition or dietary supplement for improving the quality of life of the patients with chronic kidney disease.
In addition, the lactic acid bacteria containing composition disclosed in the present invention has very good safety, thus being useful as a pharmaceutical composition, daily dietary supplement, nutrient supplement, or other forms of food or compositions for being administered to subjects with chronic kidney disease for a prolonged period of time.
The present invention is described in detail by way of examples. It should be understood that any simple modifications or changes can be made by those skilled in the art without departing from the spirit of the present invention, which are all embraced in the protection scope of the claims of the present invention.
SEQUENCE LISTINGS
1
211502DNALactococcus lactis subsp. lactis 1gacgaacgct ggcggcgtgc ctaatacatg caagttgagc gctgaaggtt ggtacttgta 60ccgactggat gagcagcgaa cgggtgagta acgcgtgggg aatctgcctt tgagcggggg 120acaacatttg gaaacgaatg ctaataccgc ataaaaactt taaacacaag ttttaagttt 180gaaagatgca attgcatcac tcaaagatga tcccgcgttg tattagctag ttggtgaggt 240aaaggctcac caaggcgatg atacatagcc gacctgagag ggtgatcggc cacattggga 300ctgagacacg gcccaaactc ctacgggagg cagcagtagg gaatcttcgg caatggacga 360aagtctgacc gagcaacgcc gcgtgagtga agaaggtttt cggatcgtaa aactctgttg 420gtagagaaga acgttggtga gagtggaaag ctcatcaagt gacggtaact acccagaaag 480ggacggctaa ctacgtgcca gcagccgcgg taatacgtag gtcccgagcg ttgtccggat 540ttattgggcg taaagcgagc gcaggtggtt tattaagtct ggtgtaaaag gcagtggctc 600aaccattgta tgcattggaa actggtagtc ttgagtgcag gagaggagag tggaattcca 660tgtgtagcgg tgaaatgcgt agatatatgg aggaacaccg gtggcgaaag cggctctctg 720gcctgtaact gacactgagg ctcgaaagcg tggggagcaa acaggattag ataccctggt 780agtccacgcc gtaaacgatg agtgctagat gtagggagct ataagttctc tgtatcgcag 840ctaacgcaat aagcactccg cctggggagt acgaccgcaa ggttgaaact caaaggaatt 900gacgggggcc cgcacaagcg gtggagcatg tggtttaatt cgaagcaacg cgaagaacct 960taccaggtct tgacatactc gtgctattcc tagagatagg aagttccttc gggacacggg 1020atacaggtgg tgcatggttg tcgtcagctc gtgtcgtgag atgttgggtt aagtcccgca 1080acgagcgcaa cccctattgt tagttgccat cattaagttg ggcactctaa cgagactgcc 1140ggtgataaac cggaggaagg tggggatgac gtcaaatcat catgcccctt atgacctggg 1200ctacacacgt gctacaatgg atggtacaac gagtcgcgag acagtgatgt ttagctaatc 1260tcttaaaacc attctcagtt cggattgtag gctgcaactc gcctacatga agtcggaatc 1320gctagtaatc gcggatcagc acgccgcggt gaatacgttc ccgggccttg tacacaccgc 1380ccgtcacacc acgggagttg ggagtacccg aagtaggttg cctaaccgca aggagggcgc 1440ttcctaaggt aagaccgatg actggggtga agtcgtaaca aggtagccgt atcggaaggt 1500gc 150221487DNALactobacillus salivarius 2gacgaacgct ggcggcgtgc ctaatacatg caagtcgaac gaaactttct tacaccgaat 60gaaaagaatt caccgtaaga agttgagtgg cggacgggtg agtaacacgt gggtaacctg 120cctaaaagaa ggggataaca cttggaaaca ggtgctaata ccgtatatct ctaaggatcg 180catgatcctt agatgaaaga tggttctgct atcgctttta gatggacccg cggcgtatta 240actagttggt ggggtaacgg cctaccaagg tgatgatacg tagccgaact gagaggttga 300tcggccacat tgggactgag acacggccca aactcctacg ggaggcagca gtagggaatc 360ttccacaatg gacgcaagtc tgatggagca acgccgcgtg agtgaagaag gtcttcggat 420cgtaaaactc tgttgttaga gaagaaacac gagtgagagt aactgttcat tcgatgacgg 480tatctaacca gcaagtcacg gctaactagg tgccagcagc cgcggtaata ggtaggtggc 540aagcgttgtc cggatttatt gggcgtaaag ggaacgcagg cggtctttta agtctgatgt 600gaaagccttc ggcttaaccg gagtagtgca ttggaaactg gaagacttga gtgcagaaga 660ggagagtgga actccatgtg tagcggtgaa atgcgtagat atatggaaga acaccagtgg 720cgaaagcggc tctctggtct gtaactgacg ctgaggttcg aaagcgtggg tagcaaacag 780gattagatac ccctggtagt ccacgccgta aacgatgaat gctaggtgtt ggagggtttc 840cgcccttcag tgccgcagct aacgcaataa gcattccgcc tggggagtac gaccgcaagg 900ttgaaactca aaggaattga cgggggcccg cacaagcggt ggagcatgtg gtttaattcg 960aagcaacgcg aagaacctta ccaggtcttg acatcctttg accacctaag agattaggct 1020ttcccttcgg ggacaaagtg acaggtggtg catggctgtc gtcagctcgt gtcgtgagat 1080gttgggttaa gtcccgcaac gagcgcaacc cttgttgtca gttgccagga ttaagttggg 1140cactctggcg agactgccgg tgacaaaccg gaggaaggtg gggacgacgt caagtcatca 1200tgccccttat gacctgggct acacacgtgc tacaatggac ggtacaacga gtcgcgagac 1260cgcgaggttt agcataatct cttaaagccg ttctcagttc ggattgtagg ctgcaactcg 1320cctacatgaa gtcggaatcg ctagtaatcg cgaatcagca tgtcgcggtg aatacgttcc 1380cgggccttgt tcacaccgcc cgtcacacca tgagatttgt aacacccaaa rccggtgggg 1440taaccgcaag gagccagccg tctaaggtgg gacagatgat tggggtg 1487
* * * * *
References
D00001
D00002
D00003
D00004
S00001
XML
uspto.report is an independent third-party trademark research tool that is not affiliated, endorsed, or sponsored by the United States Patent and Trademark Office (USPTO) or any other governmental organization. The information provided by uspto.report is based on publicly available data at the time of writing and is intended for informational purposes only.
While we strive to provide accurate and up-to-date information, we do not guarantee the accuracy, completeness, reliability, or suitability of the information displayed on this site. The use of this site is at your own risk. Any reliance you place on such information is therefore strictly at your own risk.
All official trademark data, including owner information, should be verified by visiting the official USPTO website at www.uspto.gov. This site is not intended to replace professional legal advice and should not be used as a substitute for consulting with a legal professional who is knowledgeable about trademark law.