Anti-human TROP-2 antibody having an antitumor activity in vivo
Nakamura , et al. Feb
U.S. patent number 10,202,461 [Application Number 15/169,109] was granted by the patent office on 2019-02-12 for anti-human trop-2 antibody having an antitumor activity in vivo. This patent grant is currently assigned to Chiome Bioscience Inc.. The grantee listed for this patent is CHIOME BIOSCIENCE INC.. Invention is credited to Toru Kanke, Shankar Kumar, Koji Nakamura, Kentaro Okamura, Maki Tamura, Naoya Tsurushita, Hiroyuki Yanai.


View All Diagrams
| United States Patent | 10,202,461 |
| Nakamura , et al. | February 12, 2019 |
Anti-human TROP-2 antibody having an antitumor activity in vivo
Abstract
The present invention provides: an antibody which specifically reacts with hTROP-2 and has anti-tumor activity in vivo (particularly, a humanized antibody); a hybridoma which produces the aforementioned antibody; a conjugate of the aforementioned antibody and a drug; a pharmaceutical composition for diagnosing or treating a tumor; a method for detecting a tumor; and a kit for detecting or diagnosing a tumor.
| Inventors: | Nakamura; Koji (Tokyo, JP), Okamura; Kentaro (Kanagawa, JP), Tamura; Maki (Kanagawa, JP), Yanai; Hiroyuki (Kanagawa, JP), Kanke; Toru (Kanagawa, JP), Tsurushita; Naoya (Palo Alto, CA), Kumar; Shankar (Pleasanton, CA) | ||||||||||
|---|---|---|---|---|---|---|---|---|---|---|---|
| Applicant: |
|
||||||||||
| Assignee: | Chiome Bioscience Inc. (Tokyo,
JP) |
||||||||||
| Family ID: | 48469894 | ||||||||||
| Appl. No.: | 15/169,109 | ||||||||||
| Filed: | May 31, 2016 |
Prior Publication Data
| Document Identifier | Publication Date | |
|---|---|---|
| US 20160333110 A1 | Nov 17, 2016 | |
Related U.S. Patent Documents
| Application Number | Filing Date | Patent Number | Issue Date | ||
|---|---|---|---|---|---|
| 13682319 | Nov 20, 2012 | 9427464 | |||
| 61562672 | Nov 22, 2011 | ||||
| Current U.S. Class: | 1/1 |
| Current CPC Class: | C07K 16/3023 (20130101); A61K 47/6851 (20170801); C07K 16/3076 (20130101); C07K 16/30 (20130101); C07K 16/303 (20130101); A61P 35/04 (20180101); C07K 16/3053 (20130101); A61K 39/39558 (20130101); C07K 16/3046 (20130101); G01N 33/57438 (20130101); C07K 16/3038 (20130101); G01N 33/57492 (20130101); C07K 16/3069 (20130101); G01N 33/57488 (20130101); A61P 35/00 (20180101); A61K 2039/545 (20130101); C07K 2317/56 (20130101); C07K 2317/24 (20130101); C07K 2317/92 (20130101); C07K 2317/33 (20130101); C07K 2317/732 (20130101); C07K 2317/34 (20130101); C07K 2317/73 (20130101); A61K 2039/505 (20130101) |
| Current International Class: | G01N 33/574 (20060101); C07K 16/30 (20060101); C07K 16/28 (20060101); A61K 47/68 (20170101); A61K 39/395 (20060101); A61K 39/00 (20060101) |
References Cited [Referenced By]
U.S. Patent Documents
| 5840854 | November 1998 | Hellstrom et al. |
| 6653104 | November 2003 | Goldenberg |
| 7420040 | September 2008 | Young et al. |
| 7420041 | September 2008 | Young et al. |
| 2004/0001825 | January 2004 | Govindan et al. |
| 2007/0202043 | August 2007 | Young et al. |
| 2007/0202113 | August 2007 | Young et al. |
| 2008/0131428 | June 2008 | Young et al. |
| 2013/0089872 | April 2013 | Nakamura et al. |
| 2573120 | Mar 2013 | EP | |||
| 2001-501801 | Feb 2001 | JP | |||
| 2006-502698 | Jan 2006 | JP | |||
| 2009-527230 | Jul 2009 | JP | |||
| 2009-528995 | Aug 2009 | JP | |||
| 2010-528056 | Aug 2010 | JP | |||
| 97/14796 | Apr 1997 | WO | |||
| 03074566 | Sep 2003 | WO | |||
| 2007095748 | Aug 2007 | WO | |||
| 2007095749 | Aug 2007 | WO | |||
| 2008144891 | Dec 2008 | WO | |||
| 2010089782 | Aug 2010 | WO | |||
| 2011145744 | Nov 2011 | WO | |||
Other References
|
Maynard, J. et al., "Antibody Engineering", Annual Review of Biomedical Engineering, vol. 2, Jan. 1, 2000, pp. 339-376, XP009039750. cited by applicant . Panka, D.J. et al., "Variable region framework differences result in decreased or increased affinity of variant anti-digoxin antibodies", Proceedings of the National Academy of Sciences, vol. 85, No. 9, May 1, 1988, pp. 3080-3084, XP000611718. cited by applicant . Summons to attend oral proceedings pursuant to Rule 115(1) EPC issued in European Application No. 11783675.9, dated Nov. 4, 2016. cited by applicant . Paul, W.E. "Fundamental Immunology", 3rd Edition, 1993, pp. 292-295. cited by applicant . Rudikoff, S. et al. "Single amino acid substitution altering antigen-binding specificity", Proc. Natl. Acad. Sci. USA, 1982, vol. 79, pp. 1979-1983. cited by applicant . De Pascalis, R. et al. "Grafting of `Abbreviated`Complementarity-Determining Regions Containing Specificity-Determining Residues Essential for Ligand Contact to Engineer a Less Immunogenic Humanized Monoclonal Antibody", The Journal of Immunology, 2002, vol. 169, pp. 3076-3084. cited by applicant . Casset, F. et al. "A peptide mimetic of an anti-CD4 monoclonal antibody by rational design", Biochemical and Biophysical Research Communications, 2003, 307, pp. 198-205. cited by applicant . U.S. Office Action issued in U.S. Appl. No. 14/729,953 dated Sep. 13, 2016. cited by applicant . W. P. Faulk, et al., Antigens of human trophoblasts: A working hypothesis for their role in normal and abnormal pregnancies, Proc. Natl. Acad. Sci. USA, vol. 75, No. 4, pp. 1947-1951, Apr. 1978. cited by applicant . M. Lipinski, et al., Human trophoblast cell-surface antigens defined by monolonal antibodies, Proc. Natl. Acad. Sci. USA, vol. 78, No. 8, pp. 5147-5150, Aug. 1981. cited by applicant . A. J. Linnenbach, et al., Sequence investigation of the major gastrointestinal tumor-associated antigen gene family, GA733, Proc. Natl. Acad. Sci. USA, vol. 86, pp. 27-31, Jan. 1989. cited by applicant . A. Basu, et al., The epithelial/carcinoma antigen EGP-1, recognized by monoclonal antibody RS7-3G11, is phosphorylated on Serine 303, Int. J. Cancer: 62, pp. 472-479, 1995. cited by applicant . M. Fornaro, et al., Cloning of the gene encoding TROP-2, a cell-surface glycoprotein expressed by human carcinomas, Intl. J. Cancer: 62, pp. 610-618, 1995. cited by applicant . E. Ripani, et al., Human TROP-2 is a tumor-associated calcium signal transducer, Intl. J. Cancer: 76, pp. 671-676, 1998. cited by applicant . G. Calabrese, et al., Assignment of TACSTD1 (alias TROP1, M4S1) to human chromosome 2p21 and refinement of mapping of TACSTD2 (alias TROP2, M1S1) to human chromosome 1p32 by in situ hybridization, Cytogenet Cell Genet 92: pp. 164-165, 2001. cited by applicant . T. E. Sewedy, et al., Cloning of the murine TROP2 gene: conservation of a PIP2- binding sequence in the cytoplasmic domain of TROP-2, Intl. J. Cancer: 75, pp. 324-330, 1998. cited by applicant . R. Cubas, et al., Trop2: A possible therapeutic target for late stage epithelial carcinomas, Biochimica et Biophysica Acta, 1796, pp. 309-314, 2009. cited by applicant . T. Ohmachi, et al., Clinical Significance of TROP2 Expression in Colorectal Cancer, Clin. Cancer Res., 12, pp. 3057-3063, 2006. cited by applicant . Y. J. Fang, et al., Elevated expressions of MMP7, TROP2, and survivin are associated with survival, disease recurrence, and liver metastasis of colon cancer, Int. J. Colorectal Dis., 24, pp. 875-884, 2009. cited by applicant . D. Fong., et al., High expression of TROP2 correlates with poor prognosis in pancreatic cancer, British Journal of Cancer, 99, pp. 1290-1295, 2008. cited by applicant . D. Fong, et al., TROP2: a novel prognostic marker in squamous cell carcinoma of the oral cavity, Modem Pathology, 21, pp. 186-191, 2008. cited by applicant . A. D. Santin, et al., Gene expression profiles in primary ovarian serous papillary tumors and normal ovarian epithelium: identification of candidate molecular markers for ovarian cancer diagnosis and therapy, Intl. J. Cancer: 112, pp. 14-25, 2004. cited by applicant . J. Wang, et al., Identification of TROP-2 as an oncogene and an attractive therapeutic target in colon cancers, Mol. Cancer Ther., 7(2), pp. 280-285, Feb. 2008. cited by applicant . An International Search Report, dated Mar. 12, 2013, which issued during the prosecution of International Application No. PCT/JP2012/080800, which corresponds to the present application. cited by applicant . A Supplementary European Search Report, dated Sep. 12, 2013, which issued during the prosecution of European Application No. 11 78 3675.9, which is related to the present application. cited by applicant . Truong et al., "520 Poster, A monoclonal antibody targeting Trop-2 exhibits anti-tumor efficacy in human cancer models as a monotherapy and demonstrates efficacy in combination therapy", European Journal of Cancer, Supplement, Pergamon, Oxford, GB, vol. 6, No. 12, Oct. 1, 2008, pp. 165, XP025534584. cited by applicant . Truong et al., "AR47A6.4.2, a naked monoclonal antibody targeting Trop-2, exhibits anti-tumor efficacy in multiple human cancer models as a monotherapeutic agent and demonstrates efficacy in combination therapy", American Association for Cancer Research, Proceedings of the Annual Meeting, vol. 49, Apr. 1, 2008, pp. 948, XP001539271. cited by applicant . Truong et al., "Functional antibodies targeting Trop-2 demonstrate in vivo efficacy in human pancreatic and other solid tumor xenograft models", Americal Association for Cancer Research, Proceedings of the Annual Meeting, vol. 48, Apr. 1, 2007, pp. 217, XP001539272. cited by applicant . Hahn et al., "Antibodies targeting the tumor-associated antigen TROP-2 demonstrate anti-tumor effects in human pancreatic cancer models", Proceedings of the American Association for Cancer Research Annual Meeting & 97th Annual Meeting of the American-Association-for-Cancer-Research (AACR), vol. 47, Apr. 1, 2006, pp. 877, XP001525503. cited by applicant . S. V. Govindan et al., Poster Presentations--Monoclonal Antibodies 1, Abstract 2438: Efficacious therapies of two human pancreatic cancer xenografts and an aggressive human lymphoma xenograft with redesigned antibody-SN-38 conjugates, Cancer Research, Apr. 2010, vol. 70, Issue 8, Supplement 1, Abstract 2438. cited by applicant . Office Action, dated Feb. 5, 2014, which issued during the prosecution of U.S. Appl. No. 13/698,201, which is related to the present application. cited by applicant . Communication pursuant to Article 94(3) EPC, dated Jun. 25, 2014, which issued during the prosecution of European Patent Application No. 11 783 675.9, which is related to the present application. cited by applicant . Holt et al., "Domain antibodies: proteins for therapy," Trends in Biotechnology vol. 21, No. 11, Nov. 2003, pp. 484-490. cited by applicant . Notice of Allowance, dated Feb. 12, 2015, which issued during the prosecution of U.S. Appl. No. 13/698,201, which is related to the present application. cited by applicant . European Search Report dated Jun. 15, 2015 issued in corresponding EP Application No. 12852269.5. cited by applicant . J. Varughese et al., Gynecologic Oncology, Academic Press, London, GB, vol. 122, No. 1, Mar. 3, 2011, pp. 171-177. cited by applicant . J. Varughese et al., Cancer, vol. 117, No. 14, Jul. 15, 2011, pp. 3163-3172. cited by applicant . Rhoda Raji et al., Journal of Experimental & Clinical Cancer Research, vol. 30, No. 1, Jan. 1, 2011, p. 106. cited by applicant . J. Varughese et al., American Journal of Obstetrics & Gynecology, Mosby, St. Louis, MO, US, vol. 205, No. 6, Jun. 29, 2011, pp. 567.eI567.e7. cited by applicant . T.M. Cardillo et al., Clinical Cancer Research, vol. 17, No. 10, Mar. 3, 2011, pp. 3157-3169. cited by applicant . Alberti, S., et al. "Biochemical Characterization of Trop-2, a Cell Surface Molecule Expressed by Human Carcinomas: Formal Proof that the Monoclonal Antibodies T16 and MOv-16 Recognize Trop-2", HYBRIDOMA, vol. 11, No. 5, 1992, pp. 539-545. cited by applicant . Eurasian Search Report issued in Eurasian Application No. 201500219, dated Oct. 30, 2015. cited by applicant . Paul, Fundamental Immunology, 3rd Edition, 1993, pp. 292-295. cited by applicant . Bendig M. M. (Methods: A Companion to Methods in Enzymology, 1995, 8:83-93. cited by applicant . U.S. Office Action issued in U.S. Appl. No. 13/682,319 dated May 12, 2014. cited by applicant . U.S. Office Action issued in U.S. Appl. No. 13/682,319 dated Feb. 12, 2015. cited by applicant . U.S. Office Action issued in U.S. Appl. No. 13/682,319 dated Oct. 22, 2015. cited by applicant . U.S. Notice of Allowance issued in U.S. Appl. No. 13/682,319 dated Mar. 4, 2016. cited by applicant. |
Primary Examiner: Allen; Michael
Attorney, Agent or Firm: McDermott Will & Emery LLP
Parent Case Text
CROSS REFERENCE TO RELATED APPLICATIONS
The application is a Continuation of U.S. application Ser. No. 13/682,319, filed on Nov. 20, 2012, which claims priority under 35 U.S.C. .sctn. 119 to U.S. Provisional Patent Application No. 61/562,672, filed Nov. 22, 2011, the disclosures of which are incorporated herein by reference.
Claims
The invention claimed is:
1. An isolated antibody that binds human TROP-2 comprising a heavy chain variable region comprising the amino acid sequence of SEQ ID NO: 92 or SEQ ID NO: 98, and a light chain variable region comprising the amino acid sequence of SEQ ID NO: 93, wherein the heavy chain variable region and the light chain variable region together form an antigen-binding site.
2. The isolated antibody of claim 1, wherein said antibody comprises the heavy chain variable region comprising the amino acid sequence of SEQ ID NO:92.
3. The isolated antibody of claim 1, wherein the antibody comprises the heavy chain variable region comprising the amino acid sequence of SEQ ID NO:98.
4. The isolated antibody of claim 1, wherein the antibody is a monoclonal antibody.
5. The isolated antibody of claim 1 conjugated to an agent having anti-tumor activity and/or tumor cell killing activity.
6. An antibody antigen-binding fragment, comprising (i) the amino acid sequence of SEQ ID NO: 92 or SEQ ID NO: 98 and (ii) the amino acid sequence of SEQ ID NO: 93, wherein (i) and (ii) together form an antigen-binding site.
7. The antibody antigen-binding fragment of claim 6 conjugated to an agent having anti-tumor activity and/or tumor cell killing activity.
8. A pharmaceutical composition comprising an antibody that binds human TROP-2 and a pharmaceutically acceptable carrier, wherein said antibody comprises (i) a heavy chain variable region consisting of the amino acid sequence of SEQ ID NO: 92 or SEQ ID NO: 98, and (ii) a light chain variable region consisting of the amino acid sequence of SEQ ID NO: 93, wherein the heavy chain variable region and the light chain variable region together form an antigen-binding site.
9. The pharmaceutical composition of claim 8, wherein the antibody is conjugated to an agent having anti-tumor activity and/or tumor cell killing activity.
10. A pharmaceutical composition comprising an antibody antigen-binding fragment and a pharmaceutically acceptable carrier, wherein said antibody antigen-binding fragment comprises (i) the amino acid sequence of SEQ ID NO: 92 or SEQ ID NO: 98 and (ii) the amino acid sequence of SEQ ID NO: 93, wherein (i) and (ii) together form an antigen-binding site.
11. The pharmaceutical composition of claim 10, wherein the antibody antigen-binding fragment is conjugated to an agent having anti-tumor activity and/or tumor cell killing activity.
12. A diagnostic agent comprising an antibody that binds human TROP-2, said antibody comprising (1) a heavy chain variable region consisting of the amino acid sequence of SEQ ID NO: 92 or SEQ ID NO: 98 and (2) a light chain variable region consisting of the amino acid sequence of SEQ ID NO: 93, and a detectable label, wherein the heavy chain variable region and the light chain variable region together form an antigen-binding site.
13. A diagnostic agent comprising an antibody antigen-binding fragment comprising (i) the amino acid sequence of SEQ ID NO: 92 or SEQ ID NO: 98 and (ii) the amino acid sequence of SEQ ID NO: 93, and a detectable label, wherein (i) and (ii) together form an antigen-binding site.
14. A kit for treating, diagnosing or detecting a tumor, comprising the isolated antibody of claim 1.
Description
SEQUENCE LISTING
The instant application contains a Sequence Listing which has been submitted electronically in ASCII format and is hereby incorporated by reference in its entirety. Said ASCII copy, created on Jan. 23, 2015, is named 086268-0136_SL.txt and is 130,893 bytes in size.
FIELD OF THE INVENTION
The present invention relates to an anti-human TROP-2 antibody having anti-tumor activity, and particularly, to an anti-human TROP-2 antibody having anti-tumor activity in vivo. In addition, the present invention relates to a hybridoma, which produces the aforementioned antibody, and a use of the aforementioned antibody.
BACKGROUND OF THE INVENTION
Human TROP-2 (Tacstd2, GA733-1 and EGP-1) (hereinafter also referred to as "hTROP-2") is a single transmembrane, type 1 cell membrane protein consisting of 323 amino acid residues (see SEQ ID NO: 2), and this protein has been known to be overexpressed in various types of epidermal cell carcinomas. The presence of a cell membrane protein associated with immunological resistance, which is commonly expressed in both human trophoblasts and cancer cells, had been long suggested (Non-Patent Document 1). An antigen molecule recognized by mouse monoclonal antibodies (162-25.3, 162-46.2) reacting with the cell membrane protein of a human choriocarcinoma cell line BeWo was identified. This antigen molecule was considered as one of the molecules expressed in human trophoblasts, and was named as Trop-2 (Non-Patent Document 2). Thereafter, the same molecule was discovered by other researchers. That is to say, a tumor antigen recognized by a mouse monoclonal antibody GA733 which is obtained by immunization with stomach cancer cells SW948 was named as GA733-1 (Non-Patent Document 3), and an epithelial glycoprotein recognized by a mouse monoclonal antibody RS7-3G11 which is obtained by immunization with non-small cell lung cancer cells was named as an epithelial/carcinoma antigen, EGP-1 (Non-Patent Document 4). In 1995, the Trop-2 gene was cloned, and as a result, it was confirmed that these are the same molecules (Non-Patent Document 5). Moreover, it was clarified that the molecule has a function to amplify intracellular calcium signals in cancer cells (Non-Patent Document 6), and therefore, it is also referred to as a tumor-associated calcium signal transducer 2 (TACSTD2).
The hTROP-2 gene is mapped on chromosome 1p32, and it constitutes a TACSTD gene family together with GA733-2 having a homology of approximately 50% therewith (which has been known as "TACSTD1," "epithelial glycoprotein EGP-2," "EpCAM" or "Trop-1") (Non-Patent Document 7). The hTROP-2 protein (323 amino acid residues; SEQ ID NO: 2) has a molecular weight of approximately 36K Dalton, and this protein consists of a hydrophilic signal peptide (1.sup.st to 26.sup.th amino acids), an extracellular domain (27.sup.th to 274.sup.th amino acids), a transmembrane domain (275.sup.th to 297.sup.th amino acids) and an intracellular domain (298.sup.th to 323.sup.rd amino acids). The extracellular domain has four heterogeneous N-linked glycosylation sites, and its apparent molecular weight is increased by 11 to 13K Dalton due to addition of sugar chains (Non-Patent Document 5). It is considered that TACSTD gene family has a characteristic thyroglobulin (TY) sequence in the extracellular domain and is associated with the proliferation, invasion and metastasis of cancer cells.
To date, a physiological ligand of hTROP-2 has not been identified, and the molecular function thereof has not been clarified. However, it has been described that hTROP-2 transmits a calcium signal in tumor cells (Non-Patent Document 6). In addition, from the facts that intracellular serine 303 is phosphorylated by protein kinase C (PKC) that is Ca.sup.2+-dependent kinase (Non-Patent Document 4) and that hTROP-2 has a PIP2-binding sequence in its intracellular domain, it has been suggested that hTROP-2 has a signaling function in tumor cells (Non-Patent Document 8).
As a result of analyses such as immunohistochemistry (IHC) and flow cytometry, overexpression of hTROP-2 in many types of epithelium-derived carcinomas such as stomach cancer, lung cancer, colorectal cancer, ovarian cancer, breast cancer, prostate cancer, pancreatic cancer, liver cancer and esophagus cancer has been reported. In contrast, the expression of hTROP-2 in normal tissues is limited to cells in the epithelial region, and the expression level of hTROP-2 in normal cells is lower than that in cancer cells. Thus, the association of TROP-2 with tumor formation is suggested (Patent Documents 1-3 and 9).
Moreover, it has been demonstrated that the expression of hTROP-2 used as a biomarker in clinical samples correlates with the malignancy of colorectal cancer (Non-Patent Documents 10 and 11), pancreatic cancer (Non-Patent Document 12) or oral cancer (Non-Patent Document 13), and that when hTROP-2 is overexpressed, the possibility of metastasis or recurrence of such cancer is significantly high. Furthermore, in a large-scale gene expression analysis using a cDNA microarray technique, hTROP-2 has been identified as a gene cluster, which is overexpressed at the highest level in severe papillary adenocarcinoma of the ovary, in comparison with in normal ovary epithelium (Non-Patent Document 14).
Still further, in recent years, an important role of hTROP-2 in tumor formation has been demonstrated in the models by using colon cancer cells (Non-Patent Document 15). Since the expression of hTROP-2 promotes the anchorage-independent cell proliferation of tumor cells and is required for the tumor formation and proliferation of cancer cells subcutaneously transplanted in immunodeficient mice, it raised the possibility that hTROP-2 would act as a functional tumor antigen and would be used as a new therapeutic target.
To date, studies regarding the anti-tumor effects of several anti-hTROP-2 antibodies have been reported. An RS7 antibody (Patent Document 1) has been examined by employing in vivo models, in which radioactive substance-labeled antibodies were used, and anti-tumor activity was demonstrated in nude mouse xenograft models. However, the anti-tumor effects by antibody alone (a naked antibody) have not been reported.
In addition, the cytotoxicity of a cytotoxin-attached anti-hTROP-2 monoclonal antibody BR110 (Patent Document 2) on human cancer cell lines H3619, H2987, MCF-7, H3396 and H2981 in in vitro experiments has been reported. However, the cytotoxicity of a naked antibody or an immunoconjugate of BR110 in vivo has not been disclosed.
In recent years, it has been reported that an isolated monoclonal antibody, which was produced from a hybridoma cell line AR47A6.4.2 or AR52A301.5 obtained by immunizing mice with human ovarian cancer tissues, bound to hTROP-2, and that, for the first time, it exhibited, as a naked antibody, anti-tumor activity on nude mouse xenograft models, as well as cytotoxicity in vitro (Patent Documents 3 and 4). In these patent documents, the aforementioned antibody exhibited anti-tumor effects by treatment with antibody alone in mouse xenograft models, into which pancreatic cancer cell lines BxPC-3 and PL45, a prostate cancer cell line PC-3, a breast cancer cell line MCF-7 and a colon cancer cell line Colo205 had been transplanted. The therapeutic effects of the antibody have appeared in the models, into which BxPC-3 cells had been transplanted. Other than this, tumor formation and proliferation were only partially (approximately 40% to 60%) suppressed by the preventive administration of the antibody, and an extremely large amount (approximately 20 mg/kg) of the antibody was necessary for such suppression of tumor formation and proliferation.
Based on the above-mentioned previous findings, the potential use of the anti-hTROP-2 antibody as an anti-tumor antibody has been suggested. However, not all of the anti-hTROP-2 antibodies exhibit anti-tumor effects by treatment with antibody alone as naked antibodies in vivo. The antibodies exhibit different actions on hTROP-2, depending on a binding site, affinity and the properties of a monoclonal antibody. Patent Document 1: U.S. Pat. No. 6,653,104 Patent Document 2: U.S. Pat. No. 5,840,854 Patent Document 3: U.S. Pat. No. 7,420,040 Patent Document 4: U.S. Pat. No. 7,420,041 Non-Patent Document 1: Faulk W P, et al., Proc. Natl. Acad. Sci. U.S.A., 75(4), pp. 1947-1951 (1978) Non-Patent Document 2: Lipinski M, et al., Proc. Natl. Acad. Sci. U.S.A., 78(8), pp. 5147-5150 (1981) Non-Patent Document 3: Linnenbach A J, et al., Proc. Natl. Acad. Sci. U.S.A., 86(1), pp. 27-31 (1989) Non-Patent Document 4: Basu A, et al., Int. J. Cancer, 62(4), pp. 472-479 (1995) Non-Patent Document 5: Fornaro M, et al., Int. J. Cancer, 62(5), pp. 610-618 (1995) Non-Patent Document 6: Ripani E, et al., Int. J. Cancer, 76(5), pp. 671-676 (1998) Non-Patent Document 7: Calabrese G, et al., Cell Genet., 92(1-2), pp. 164-165 (2001) Non-Patent Document 8: El Sewedy T et al., Int. J. Cancer, 75(2), pp. 324-330 (1998) Non-Patent Document 9: Cubas R, et al., Biochim. Biophys. Acta., 1796(2), pp. 309-314 (2009) Non-Patent Document 10: Ohmachi T et al., Clin. Cancer Res., 12(10), pp. 3057-3063 (2006) Non-Patent Document 11: Fang Y J, et al., Int. J. Colorectal Dis., 24(8), pp. 875-884 (2009) Non-Patent Document 12: Fong D, et al., Br. J. Cancer, 99(8), pp. 1290-1295 (2008) Non-Patent Document 13: Fong D, et al., Mod. Pathol., 21(2), pp. 186-191 (2008) Non-Patent Document 14: Santin A D, et al., Int. J. Cancer, 112(1), pp. 14-25 (2004) Non-Patent Document 15: Wang J, et al., Mol. Cancer Ther., 7(2), pp. 280-285 (2008)
SUMMARY OF THE INVENTION
Under the aforementioned circumstances, it has been desired to develop an anti-hTROP-2 antibody (an anti-hTROP-2 monoclonal antibody) having high anti-tumor activity in vivo, and specifically, an anti-hTROP-2 antibody or the like, which has an anti-tumor effect as a naked antibody alone in vivo and further, which has the anti-tumor effect at a low dose, and particularly, such an anti-hTROP-2 antibody, which is a humanized antibody.
The present invention has been completed, while taking into consideration the aforementioned circumstances. The present invention provides an anti-hTROP-2 antibody (an anti-hTROP-2 monoclonal antibody), a hybridoma, which produces the antibody, a fragment of the antibody, a conjugate (an immunoconjugate) of the antibody or the like and a drug, a pharmaceutical composition for diagnosing or treating a tumor, a method for detecting a tumor, a kit for detecting or diagnosing a tumor, and the like, which will be described below.
(1) An antibody against human TROP-2 in which an H chain V region of the antibody consists of the amino acid sequence shown in SEQ ID NO: 92 or 98, and an L chain V region of the antibody consists of the amino acid sequence shown in SEQ ID NO: 93.
In the antibody according to (1) above, the amino acid sequences of CDR 1 to 3 of the H chain V region of the antibody are shown in SEQ ID NOS: 36 to 38, respectively, and/or the amino acid sequences of CDR 1 to 3 of the L chain V region of the antibody are shown in SEQ ID NOS: 41 to 43, respectively.
(2) An antibody against human TROP-2 in which an H chain V region of the antibody consists of the amino acid sequence shown in SEQ ID NO: 94 or 95, and an L chain V region of the antibody consists of the amino acid sequence shown in SEQ ID NO: 96.
In the antibody according to (2) above, the amino acid sequences of CDR 1 to 3 of the H chain V region of the antibody are shown in SEQ ID NOS: 66 to 68, respectively, and/or the amino acid sequences of CDR 1 to 3 of the L chain V region of the antibody are shown in SEQ ID NOS: 71 to 73, respectively.
An example of the antibody according to (1) and (2) above is a humanized antibody.
An example of the antibody according to (1) and (2) above is an antibody having anti-tumor activity in vivo.
An example of the antibody according to (1) and (2) above is an antibody exhibiting 50% or more of tumor growth inhibitory activity at a dosage of 5 to 20 mg/kg body weight. Herein, the frequency of administration for exhibiting the tumor growth inhibitory activity is, for example, at most once a week.
An example of the antibody according to (1) and (2) above is an antibody exhibiting 50% or more of the tumor growth inhibitory activity by a single administration of the antibody at a dosage of 10 mg/kg body weight.
An example of the antibody according to (1) and (2) above is an antibody having anti-tumor activity on two or more types of human tumor cell lines.
An example of the antibody according to (1) and (2) above is an antibody having a dissociation constant (Kd value) of 1.0.times.10.sup.-10 M or less.
An example of the antibody according to (1) and (2) above is a monoclonal antibody.
Herein, the tumor is at least one type selected from the group consisting of human pancreatic cancer, human prostate cancer, human colorectal cancer, human breast cancer, human ovarian cancer, human lung cancer and human bile duct cancer. The tumor is preferably at least one type selected from the group consisting of human pancreatic cancer, human colorectal cancer, human breast cancer, human lung cancer and human ovarian cancer.
In addition, the tumor is, for example, a recurrent cancer or a metastatic cancer.
Moreover, the tumor cell lines are, for example, at least two types selected from the group consisting of a human pancreatic cancer cell line PK-59, a human pancreatic cancer cell line BxPC-3, a human pancreatic cancer cell line KP-3L, a human pancreatic cancer cell line KP-2, a human pancreatic cancer cell line PK-1, a human pancreatic cancer cell line PK-45H, a human pancreatic cancer cell line PK-45P, a human pancreatic cancer cell line TCC-PAN2, a human pancreatic cancer cell line SUIT-2, a human colon cancer cell line CACO-2, a human colon cancer cell line SW480, a human colon cancer cell line DLD-1, a human colon cancer cell line HCT116, a human breast cancer cell line JIMT-1, a human breast cancer cell line HCC1143, a human breast cancer cell line MCF-7, a human breast cancer cell line MDA-MB-468, a human prostate cancer cell line DU145, a human prostate cancer cell line PC-3, a human lung cancer cell line Calu-3, a human ovarian cancer cell line SK-OV-3 and a human bile duct cancer cell line TFK-1. Among others, the tumor cell lines are preferably at least two types selected from the group consisting of a human pancreatic cancer cell line PK-59, a human pancreatic cancer cell line BxPC-3, a human colon cancer cell line SW480, a human lung cancer cell line Calu-3, a human breast cancer cell line MDA-MB-468 and a human ovarian cancer cell line SK-OV-3.
(3) An antibody fragment derived from the antibody according to (1) and (2) above.
Examples of the antibody fragment according to (3) above include an antibody fragment comprising the amino acid sequence shown in SEQ ID NO: 92 or 98 and/or the amino acid sequence shown in SEQ ID NO: 93, or an antibody fragment comprising the amino acid sequence shown in SEQ ID NO: 94 or 95 and/or the amino acid sequence shown in SEQ ID NO: 96.
(4) An antibody-drug conjugate, which comprises the antibody according to (1) and (2) above and a substance having anti-tumor activity and/or cell-killing activity.
(5) An antibody fragment-drug conjugate, which comprises the antibody fragment according to (3) above and a substance having anti-tumor activity and/or cell-killing activity.
In the conjugate according to (4) and (5) above, the tumor is, for example, at least one type selected from the group consisting of human pancreatic cancer, human prostate cancer, human colorectal cancer, human breast cancer, human ovarian cancer, human lung cancer and human bile duct cancer. Among others, the tumor is preferably at least one type selected from the group consisting of human pancreatic cancer, human colorectal cancer, human breast cancer, human lung cancer and human ovarian cancer. Moreover, the tumor is, for example, a recurrent cancer or a metastatic cancer.
(6) A pharmaceutical composition, which comprises at least one type selected from the group consisting of the antibody according to (1) and (2) above, the antibody fragment according to (3) above and the conjugate according to (4) and (5) above.
Examples of the composition according to (6) above include a composition which is used in the treatment of tumor, a composition which does not cause weight reduction as a side effect and a composition which is used in the diagnosis of tumor. Herein, the tumor is, for example, at least one type selected from the group consisting of human pancreatic cancer, human prostate cancer, human colorectal cancer, human breast cancer, human ovarian cancer, human lung cancer and human bile duct cancer. Among others, the tumor is preferably at least one selected from the group consisting of human pancreatic cancer, human colorectal cancer, human breast cancer, human lung cancer and human ovarian cancer. Moreover, the tumor is, for example, a recurrent cancer or a metastatic cancer
(7) A tumor therapeutic agent, which comprises at least one type selected from the group consisting of the antibody according to (1) and (2) above, the antibody fragment according to (3) above and the conjugate according to (4) and (5) above.
An example of the tumor therapeutic agent according to (7) above is a tumor therapeutic agent which does not cause weight reduction as a side effect. Herein, the tumor is, for example, at least one type selected from the group consisting of human pancreatic cancer, human prostate cancer, human colorectal cancer, human breast cancer, human ovarian cancer, human lung cancer and human bile duct cancer. Among others, the tumor is preferably at least one selected from the group consisting of human pancreatic cancer, human colorectal cancer, human breast cancer, human lung cancer and human ovarian cancer.
(8) A tumor diagnostic agent, which comprises at least one type selected from the group consisting of the antibody according to (1) and (2) above, the antibody fragment according to (3) above and the conjugate according to (4) and (5) above.
In the tumor diagnostic agent according to (8) above, the tumor is, for example, at least one type selected from the group consisting of human pancreatic cancer, human prostate cancer, human colorectal cancer, human breast cancer, human ovarian cancer, human lung cancer and human bile duct cancer. Among others, the tumor is preferably at least one selected from the group consisting of human pancreatic cancer, human colorectal cancer, human breast cancer, human lung cancer and human ovarian cancer.
(9) A method for detecting a tumor, which comprises: allowing at least one type selected from the group consisting of the antibody according to (1) and (2) above, the antibody fragment according to (3) above and the conjugate according to (4) and (5) above, to react with a sample collected from a living body; and then detecting a signal(s) of the reacted antibody and/or antibody fragment.
In the method for detecting a tumor according to (9) above, the tumor is, for example, at least one type selected from the group consisting of human pancreatic cancer, human prostate cancer, human colorectal cancer, human breast cancer, human ovarian cancer, human lung cancer and human bile duct cancer. Among others, the tumor is preferably at least one selected from the group consisting of human pancreatic cancer, human colorectal cancer, human breast cancer, human lung cancer and human ovarian cancer.
(10) A kit for treating, diagnosing or detecting a tumor, which comprises at least one type selected from the group consisting of the antibody according to (1) and (2) above, the antibody fragment according to (3) above and the conjugate according to (4) and (5) above.
In the kit for treating, diagnosing or detecting a tumor according to (10) above, the tumor is, for example, at least one type selected from the group consisting of human pancreatic cancer, human prostate cancer, human colorectal cancer, human breast cancer, human ovarian cancer, human lung cancer and human bile duct cancer. Among others, the tumor is preferably at least one selected from the group consisting of human pancreatic cancer, human colorectal cancer, human breast cancer, human lung cancer and human ovarian cancer.
(11) A polynucleotide encoding the antibody according to (1) and (2) above.
(12) A polynucleotide encoding the antibody fragment according to (3) above.
(13) A recombinant vector comprising the polynucleotide according to (11) or (12) above.
(14) A transformant comprising the recombinant vector according to (13) above.
BRIEF DESCRIPTION OF THE DRAWINGS
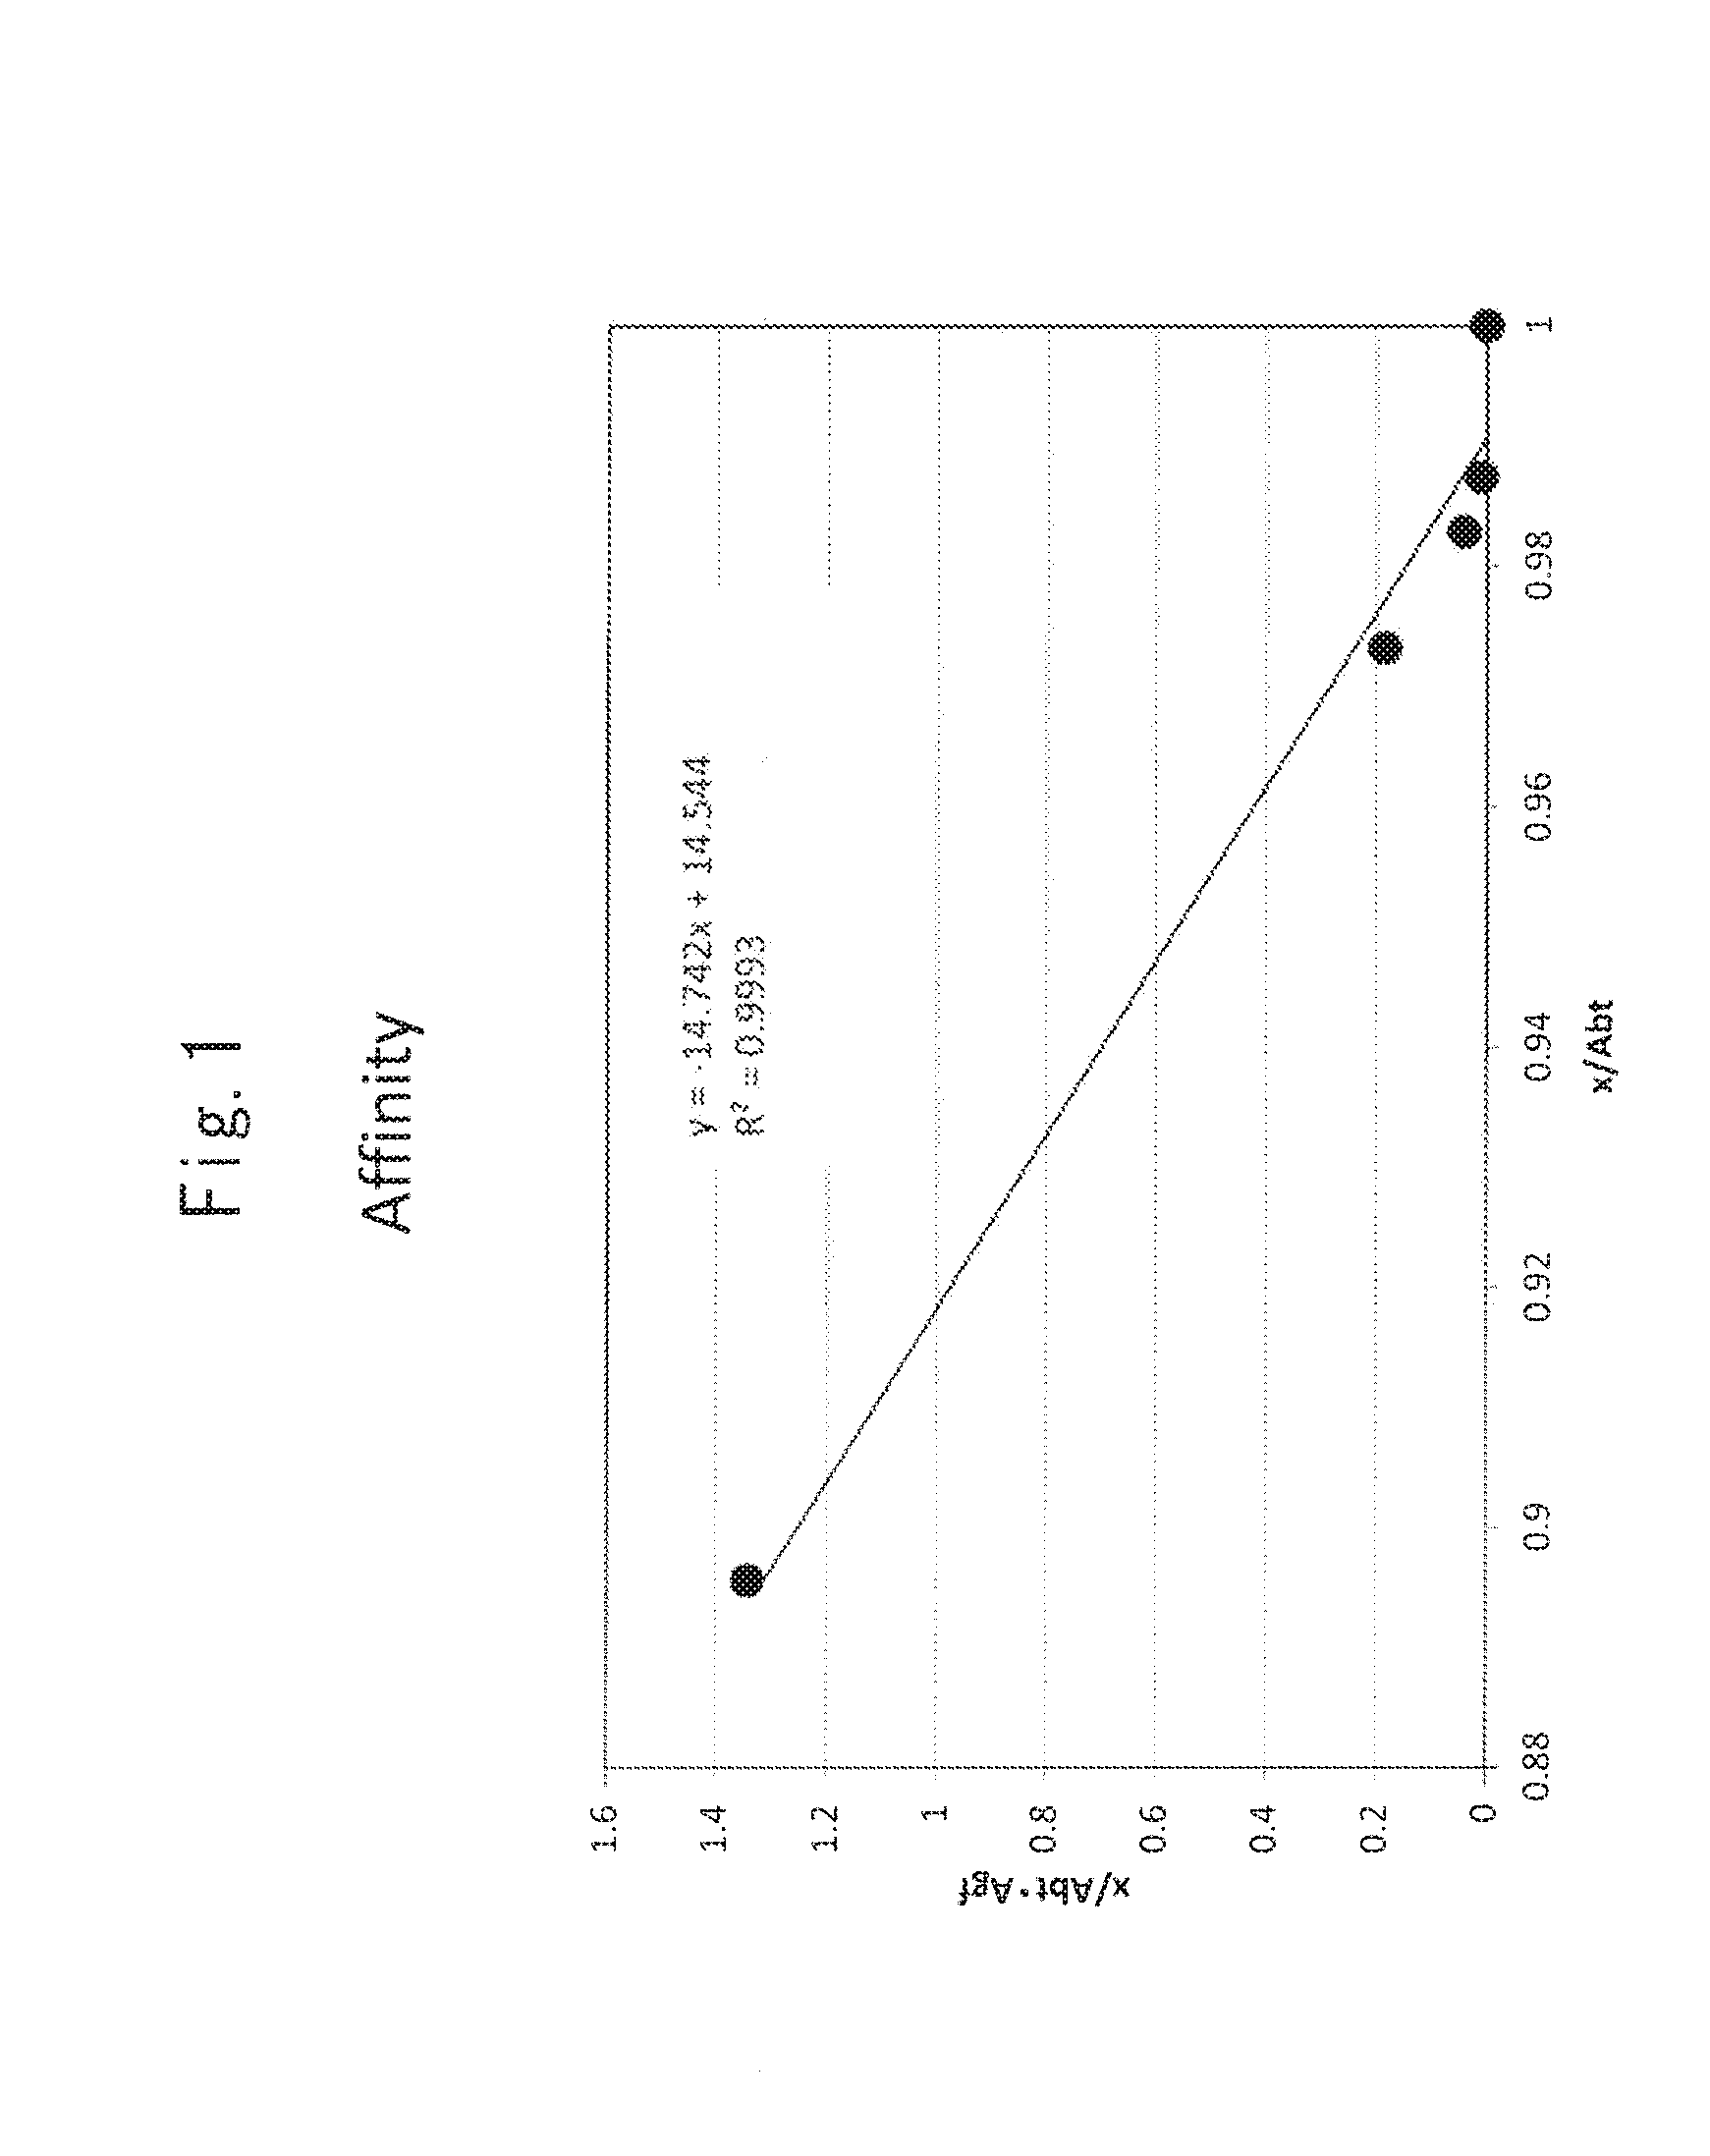
FIG. 1 shows the measurement of the antigen binding affinity (Kd: dissociation constant) of an anti-hTROP-2 monoclonal antibody (K5-70). Abt: Antibody (total); Agf: Antigen (free).
FIG. 2 shows the reactivity of a culture supernatant of hybridoma producing an anti-hTROP-2 monoclonal antibody, with HuH-7 cells (hTROP-2-negative) and HuH-7-hTROP-2 cells. The filled histogram indicates HuH-7 cells, and the open histogram indicates HuH-7-hTROP-2 cells.
FIG. 3 shows the reactivity of an anti-hTROP-2 monoclonal antibody with a human pancreatic cancer cell line (PK-59 cells), which endogenously expresses hTROP-2 on the cell surface. The filled histogram indicates the reaction of the cell line only with a secondary antibody (PE-labeled anti-mouse IgG), and the open histogram indicates the reaction of the cell line with each anti-hTROP-2 monoclonal antibody.
FIG. 4 shows the reactivity of an anti-hTROP-2 monoclonal antibody with a human pancreatic cancer cell line (BxPC-3 cells), which endogenously expresses hTROP-2 on the cell surface. The filled histogram indicates the reaction of the cell line only with a secondary antibody (PE-labeled anti-mouse IgG), and the open histogram indicates the reaction of the cell line with each anti-hTROP-2 monoclonal antibody.
FIG. 5 shows the reactivity of an anti-hTROP-2 monoclonal antibody (K5-70) with human pancreatic cancer cell lines. The filled histogram indicates the reaction of the cell line only with a secondary antibody (PE-labeled anti-mouse IgG), and the open histogram indicates the reaction of the cell line with each anti-hTROP-2 monoclonal antibody.
FIG. 6 shows the reactivity of an anti-hTROP-2 monoclonal antibody (K5-70) with human colon cancer cell lines (Colo320, CACO2, SW480, DLD1, CW2 and HCT 116), human breast cancer cell lines (JIMT-1 and HCC1143) and human prostate cancer cell lines (PC-3 and DU145). The filled histogram indicates the reaction of the cell line only with a secondary antibody (PE-labeled anti-mouse IgG), and the open histogram indicates the reaction of the cell line with the anti-hTROP-2 monoclonal antibody.
FIG. 7 shows the cross-reactivity of anti-hTROP-2 monoclonal antibodies with mouse TROP-2. Cells prepared by allowing a mouse TROP-2 gene to be transiently expressed in CHO-K1 cells were used, and a T2-102 antibody (mouse IgG1) exhibiting cross-reactivity with mouse TROP-2 was used as a positive control antibody. The filled histogram indicates the reaction of the cells only with a secondary antibody (PE-labeled anti-mouse IgG), and the open histogram indicates the reaction of the cells with each anti-hTROP-2 monoclonal antibody.
FIG. 8 shows the cross-reactivity of anti-hTROP-2 monoclonal antibodies with human EpCAM/TROP-1. Cells prepared by allowing a human EpCAM/TROP-1 gene to be transiently expressed in CHO-K1 cells were used, and a PE-labeled anti-human EpCAM monoclonal antibody (Becton, Dickinson and Company) was used as a positive control antibody. The filled histogram indicates the reaction of the cells only with a secondary antibody (PE-labeled anti-mouse IgG), and the open histogram indicates the reaction of the cells with each anti-hTROP-2 monoclonal antibody.
FIG. 9 shows the cell growth inhibitory activity of anti-hTROP-2 antibodies (T6-16, T5-86, K5-70 and K5-107) on a human pancreatic cancer cell line (PK-59 cells). mIgG indicates a control antibody (mouse IgG), and YY01 indicates a commercially available anti-hTROP-2 antibody (Santa Cruz). White column: 0 .mu.g/mL; gray column: 0.1 .mu.g/mL; black column: 1 .mu.g/mL. The activity level was expressed as a ratio of the actual value to the value obtained when an antibody had not been added (0 .mu.g/mL). The error bar indicates a standard deviation. *P<0.05, **P<0.01 (by Student's t-test).
FIG. 10 shows a scratch assay of a human pancreatic cancer cell line (PK-59 cells) in the presence of anti-hTROP-2 antibodies (T6-16 and K5-70).
FIG. 10A shows representative examples of photographs of the scratch regions of PK-59 cells. Day 0 shows a representative example immediately after scratching. mIgG (Day 1) shows a photograph taken 1 day (24 hours) after scratching and then adding a control antibody (mouse IgG, 1 .mu.g/mL) to the medium. K5-70 (Day 1) shows a photograph taken 1 day (24 hours) after scratching and then adding a K5-70 antibody (1 .mu.g/mL) to the medium. T6-16 (Day 1) shows a photograph taken 1 day (24 hours) after scratching and then adding a T6-16 antibody (1 .mu.g/mL) to the medium. Each arrow in each photograph indicates the width of a scratch region.
FIG. 10B. The area of a scratch region was analyzed using image analysis software (Scion Image), and based on the obtained value, the value of each test antibody was calculated using the value obtained on Day 0 of the control antibody (mIgG) addition group as a standard value of 1.
*P<0.05, **P<0.01 (by Student's t-Test).
FIG. 11 is a view illustrating FACS showing the expression of a stem cell marker in a human pancreatic cancer cell line PK-59. FIG. 11A is a view illustrating FACS showing the expression of EpCAM in the PK-59 cells. The filled histogram indicates the reaction of the cells only with a secondary antibody (PE-labeled anti-mouse IgG), and the open histogram indicates the reaction of the cells with an anti-human EpCAM antibody (Becton, Dickinson and Company). FIGS. 11B and C are views illustrating FACS showing the expression of P-glycoprotein/MCR1 in the PK-59 cells (FIG. 11B), and the expression of ABCG2 in the PK-59 cells (FIG. 11C). The blue histogram indicates the reaction of the cells only with a secondary antibody, and the red histogram indicates the reaction of the cells with an anti-human P-glycoprotein/MDR1 antibody (BD Biosciences Pharmingen) (FIG. 11B), or with an anti-human ABCG2 antibody (BD Biosciences Pharmingen) (FIG. 11C). FIG. 11D shows FACS analysis, in which the PK-59 cells were double stained with pancreatic cancer stem cell markers, an FITC-labeled anti-human CD24 antibody (BD Biosciences Pharmingen) and a PE-labeled anti-human CD44 antibody (BD Biosciences Pharmingen). Each number in FIG. 11D indicates the existing ratio of the cells in each fraction.
FIG. 12 shows the evaluation of the anti-tumor activity of a novel anti-hTROP-2 monoclonal antibody clone K5-70 (mouse IgG2a) on xenograft treatment models using PK-59 cells.
FIG. 12A shows the time course of tumor growth of a control group (.circle-solid.: mouse IgG) and a K5-70 antibody (10 mg/kg body weight) administration group (.largecircle.) (a mean value.+-.standard deviation). The arrow indicates an antibody administration period. * P<0.05, ** P<0.01 (by Student's t-test).
FIG. 12B shows the plotted tumor weight of each mouse at the time of the 21.sup.st day (Day 21) (the final day of experiment) in the test of FIG. 12A. The numerical value on each plot indicates a mean value.+-.standard deviation. ** P<0.01 (by Student's t-test).
FIG. 13 shows the evaluation of the anti-tumor activity of a clone K5-107 (A), a clone T6-16 (B) and a clone K5-116-2-1 (C) on xenograft treatment models using PK-59 cells. The symbol ".circle-solid." indicates a control group (mouse IgG), and the symbol ".largecircle." indicates an anti-hTROP-2 antibody (10 mg/kg body weight) administration group. The arrow in the graph indicates an antibody administration period, and the numerical value on each plot indicates a mean value.+-.standard deviation. * P<0.05 (by Student's t-test).
FIG. 14 shows the evaluation of the anti-tumor activity of a clone K5-70 (FIG. 14A), a clone T6-16 (FIG. 14B) and a clone K5-116-2-1 (FIG. 14C) in xenograft prevention models using PK-59 cells. The symbol ".circle-solid." indicates a control group (mouse IgG), and the symbol ".largecircle." indicates an anti-hTROP-2 antibody (10 mg/kg body weight) administration group. The arrow in the graph indicates an antibody administration period, and the numerical value on each plot indicates a mean value.+-.standard deviation. ** P<0.01 (by Student's t-test).
FIG. 15 shows the evaluation of the anti-tumor activity of a clone K5-70 on xenograft prevention and treatment models using BxPC-3 cells. FIG. 15A shows the time course of tumor growth of a control group (.circle-solid.: mouse IgG) and a K5-70 antibody (10 mg/kg body weight) administration group (.largecircle.) in prevention models (a mean value.+-.standard deviation). The arrow indicates an antibody administration period. ** P<0.01 (by Student's t-test). FIG. 15B shows the time course of tumor growth of a control group (.circle-solid.: mouse IgG) and a K5-70 antibody (10 mg/kg body weight) administration group (.largecircle.) in treatment models (a mean value.+-.standard deviation). The arrow indicates an antibody administration period. * P<0.05 (by Student's t-test).
FIG. 16 shows the dose-dependent anti-tumor activity of a clone K5-70 on xenograft prevention models using PK-59 cells. The volume of a tumor is expressed as a mean value.+-.standard deviation.
FIG. 16A shows the time course of tumor growth of a control group (.circle-solid.: mouse IgG) and K5-70 antibody administration groups (.quadrature.: 1 mg/kg body weight, .DELTA.: 5 mg/kg body weight) at different doses (a mean value.+-.standard deviation). The arrow indicates an antibody administration period. * P<0.05 (by Student's t-test), ** P<0.01 (by Student's t-test).
FIG. 16B shows the plotted tumor weight of each mouse at the time of the 17.sup.th day (Day 17) (the final day of experiment) in the test of FIG. 16A. The numerical number on each plot indicates a mean value.+-.standard deviation. ** P<0.01 (by Student's t-test).
FIG. 17 is a schematic view of a human/mouse chimeric TROP-2 protein used in the experiment. SP: signal sequence; TY domain: thyroglobulin type 1 region; TM: transmembrane region; C: intracellular region, wherein the filled region is a polypeptide derived from hTROP-2, whereas the open region is a polypeptide derived from mouse TROP-2. The number in the upper position of the schematic view of the chimeric protein indicates the amino acid number of a mouse TROP-2 protein, and the number in the lower position thereof indicates the amino acid number of an hTROP-2 protein.
FIG. 18 shows the results obtained by identifying an anti-hTROP-2 monoclonal antibody-binding region, using human/mouse chimeric TROP-2. Using HEK293 cells, which constantly express either human/mouse chimeric TROP-2-C (hmTROP-2-C) or mouse/human chimeric TROP-2-D (mhTROP-2-D) proteins, the reactivity with the anti-hTROP-2 monoclonal antibodies shown in the figure was studied. As a negative control, mouse IgG2b was used.
FIG. 19 shows the results obtained by identifying the antibody-binding region of an anti-hTROP-2 monoclonal antibody.
An hTROP-2 gene and each human/mouse chimeric TROP-2 gene were introduced into HEK293 cells, and FACS analysis was then carried out using the cells, in which the genes were transiently expressed. In FIG. 19(A), the reactivity of K5-70, K5-107, T5-86 and K5-116-2-1 antibodies with hTROP-2 (upper case), with hmTROP-2-A (middle case) and with hmTROP-2-B (lower case) was studied. As a negative control, mouse IgG2b was used. In FIG. 19(B), the reactivity of T6-4 and T6-16 antibodies with hTROP-2 (upper case), with mhTROP-2-E (middle case) and with mhTROP-2-F (lower case) was studied. As a negative control, mouse IgG2b was used.
FIG. 20 shows the expression of hTROP-2 in human normal tissues. Human normal tissue arrays were immunostained with an anti-hTROP-2 monoclonal antibody clone K5-63-17. (A) skin, (B) esophagus, (C) kidney (cortex), (D) kidney (medulla), (E) pancreas, (F) prostate, (G) bladder, (H) tonsil, (I) heart, (J) liver (magnification: .times.200)
FIG. 21 shows the expression of hTROP-2 in cancer tissues. Human cancer tissue arrays were immunostained with an anti-hTROP-2 monoclonal antibody clone K5-63-17. (A) breast cancer, (B) lung cancer, (C) esophagus cancer, (D) stomach cancer, (E) pancreatic cancer, (F) colorectal cancer, (G) bladder cancer, (H) prostate cancer, (I) ovarian cancer (magnification: .times.100)
FIG. 22 shows the anti-tumor activity of a clone K5-70 by a single administration on xenograft prevention models using PK-59 cells.
FIG. 22A shows the time course of tumor formation in a control group (.circle-solid.: mouse IgG) and in a K5-70 antibody (10 mg/kg body weight) administration group (.largecircle.) (a mean value.+-.standard deviation). The arrow indicates antibody administration. * P<0.05 (by Student's t-test), ** P<0.01 (by Student's t-test).
FIG. 22B shows the plotted tumor weight of each mouse at the time of the 28.sup.th day (Day 28) (the final day of experiment) in the test of FIG. 22A. ** P<0.01 (by Student's t-test).
FIG. 22C shows the time course of tumor formation in each mouse in a control group (.circle-solid.: mouse IgG) and in a K5-70 antibody (10 mg/kg body weight) administration group (.largecircle.). The arrow indicates antibody administration.
FIG. 23 shows the anti-tumor activity of a clone K5-70 on xenograft treatment models using human colon cancer SW480 cells.
FIG. 23A shows the time course of tumor formation in a control group (.circle-solid.: mouse IgG) and in a K5-70 antibody (10 mg/kg body weight) administration group (.largecircle.) (a mean value.+-.standard deviation). The arrow indicates an antibody administration period. ** P<0.01 (by Student's t-test).
FIG. 23B shows the plotted tumor weight of each mouse at the time of the 44.sup.th day (Day 44) (the final day of experiment) in the test of FIG. 23A. ** P<0.01 (by Student's t-test).
FIG. 24 shows the anti-tumor activity of a clone K5-116-2-1 on xenograft treatment models using SW480 cells.
FIG. 24A shows the time course of tumor formation in a control group (.circle-solid.: mouse IgG) and in a K5-116-2-1 antibody (10 mg/kg body weight) administration group (.largecircle.) (a mean value.+-.standard deviation). The arrow indicates an antibody administration period. ** P<0.01 (by Student's t-test).
FIG. 24B shows the plotted tumor weight of each mouse at the time of the 42.sup.nd day (Day 42) (the final day of experiment) in the test of FIG. 24A. ** P<0.01 (by Student's t-test).
FIG. 25 shows the anti-tumor activity of a clone T6-16 on xenograft treatment models using SW480 cells.
FIG. 25A shows the time course of tumor formation in a control group (.circle-solid.: mouse IgG) and in a T6-16 antibody (10 mg/kg body weight) administration group (.largecircle.) (a mean value.+-.standard deviation). The arrow indicates an antibody administration period. * P<0.05 (by Student's t-test).
FIG. 25B shows the plotted tumor weight of each mouse at the time of the 42.sup.nd day (Day 42) (the final day of experiment) in the test of FIG. 25A. * P<0.05 (by Student's t-test).
FIG. 26 shows the dose-dependent anti-tumor activity of a clone K5-70 on xenograft treatment models using SW480 cells.
FIG. 26A shows the time course of tumor formation in a control group (.circle-solid.: mouse IgG) and in a K5-70 antibody administration group (.largecircle.: 1 mg/kg body weight, .DELTA.: 5 mg/kg body weight, .quadrature.: 10 mg/kg body weight) (a mean value.+-.standard deviation). The arrow indicates an antibody administration period. * P<0.05 (by Student's t-test).
FIG. 26B shows the plotted tumor weight of each mouse at the time of the 42.sup.nd day (Day 42) (the final day of experiment) in the test of FIG. 26A. * P<0.05 (by Student's t-test).
FIG. 27 shows the anti-tumor activity of a clone K5-70 on xenograft treatment models using SW480 cells.
FIG. 27A shows the anti-tumor activity of a K5-70 antibody at administration intervals of once a week. Time course of tumor formation in a control group (.circle-solid.: mouse IgG) and in a K5-70 antibody (10 mg/kg body weight) administration group (.largecircle.: 10 mg/kg) is shown (a mean value.+-.standard deviation). The arrow heads (Days 10, 17, 24, 31, and 38) indicate administration of a K5-70 antibody. * P<0.05 by Student's t-test.
FIG. 27B is a view showing the anti-tumor activity of a K5-70 antibody at administration intervals of once every ten days (q10d) or once every two weeks (q14d). The figure shows the time course of tumor formation in a control group (.circle-solid.: mouse IgG, 10 mg/kg) and in a K5-70 antibody administration group (.largecircle.: q10d, 10 mg/kg, .DELTA.: q14d, 10 mg/kg) (a mean value.+-.standard deviation). The filled arrowheads (: Days 9, 19, and 29) and the open arrowheads (.gradient.: Days 9, 23, and 37) indicate administration of a K5-70 antibody. * P<0.05, ** P<0.01 by Student's t-test.
FIG. 28 shows the dose-dependent anti-tumor activity of a clone T6-16 on xenograft treatment models using SW480 cells.
FIG. 28A shows the time course of tumor formation in a control group (.circle-solid.: mouse IgG) and in a T6-16 antibody administration group (.largecircle.: 1 mg/kg body weight, .DELTA.: 5 mg/kg body weight, .quadrature.: 10 mg/kg body weight) (a mean value.+-.standard deviation). The arrow indicates an antibody administration period. ** P<0.01 (by Student's t-test).
FIG. 28B shows the plotted tumor weight of each mouse at the time of the 43.sup.rd day (Day 43) (the final day of experiment) in the test of FIG. 28A. ** P<0.01 (by Student's t-test).
FIG. 29 shows the anti-tumor activity of a clone T6-16 on xenograft treatment models using SW480 cells. Time course of tumor formation in a control group (.circle-solid.: mouse IgG, 10 mg/kg body weight) and in a T6-16 antibody (10 mg/kg body weight) administration group (.largecircle.: q7d, .DELTA.: q10d) is shown (a mean value.+-.standard deviation). The arrowheads (Days 10, 17, 24, 31, and 38) and the arrows (Days 10, 20, 30, and 40) indicate administration of a T6-16 antibody. Administration was carried out once every three days to the control group. * P<0.05, ** P<0.01 by Student's t-test.
FIG. 30 shows the anti-tumor activity of a clone K5-70 on xenograft prevention models using human prostate DU-145 cells.
FIG. 30A shows the time course of tumor formation in a control group (.circle-solid.: mouse IgG) and in a K5-70 antibody (10 mg/kg body weight) administration group (.largecircle.) (a mean value.+-.standard deviation). The arrow indicates an antibody administration period. * P<0.05 (by Student's t-test). FIG. 30B shows the plotted tumor weight of each mouse at the time of the 40.sup.th day (Day 40) (the final day of experiment) in the test of FIG. 30A. * P<0.05 (by Student's t-test).
FIG. 31 shows the metastasis-inhibitory activity of a clone K5-70 on liver metastatic models using PK-59 cells.
FIGS. 31A and 31B show the excised liver image of a control group (.circle-solid.: mouse IgG) (A) and a K5-70 antibody (10 mg/kg body weight) administration group (B), which were taken 6 weeks after the cell transplantation. The arrows indicate liver metastatic foci.
FIG. 32 shows the anti-tumor activity of K5-70 on xenograft models using SW480 cells, which are recurrent cancer models after administration of irinotecan hydrochloride. This figure shows the time course of tumor formation in a non-treat group (.diamond-solid.), in an irinotecan hydrochloride (40 mg/kg body weight)+K5-70 antibody (.largecircle.: 10 mg/kg body weight) administration group, and in an irinotecan hydrochloride (40 mg/kg body weight)+mouse IgG (.circle-solid.: 10 mg/kg body weight) administration group (a mean value.+-.standard deviation). The arrowheads (Days 11, 14, and 17) indicate administration of irinotecan hydrochloride. The K-70 antibody or the mouse IgG was administered once every three days from Day 20. The arrow indicates an antibody administration period. *P<0.05, **P<0.01 by Student's t-test.
FIG. 33 shows the cDNA nucleotide sequence of a clone K5-70 H chain variable region (VH) (SEQ ID NO: 34) and the deduced amino acid sequence (SEQ ID NO: 35). A signal peptide is shown in italics. The double-underlined glutamine (Q) indicates the N-terminal amino acid residue of a mature peptide. The CDR sequences (underlined; IYWIN (SEQ ID NO: 36), NIYPSDSYTNYNQKFKD (SEQ ID NO: 37), and TSMADY (SEQ ID NO: 38)) were determined in accordance with the definitions of Kabat et al. (Sequences of Proteins of Immunological Interests, Fifth edition, NIH Publication No. 91-3242, U.S. Department of Health and Human Services, 1991). The amino acid sequences of CDR 1 to 3 of the clone K5-70 VH are shown in SEQ ID NOS: 36 to 38, respectively.
FIG. 34 shows the cDNA nucleotide sequence of a clone K5-70 L chain variable region (VL) (SEQ ID NO: 39) and the deduced amino acid sequence (SEQ ID NO: 40). A signal peptide is shown in italics. The double-underlined aspartic acid (D) indicates the N-terminal amino acid residue of a mature peptide. The CDR sequences (underlined; RASQSIGTSIH (SEQ ID NO: 41), YASESIS (SEQ ID NO: 42), and QQSNSWPFT (SEQ ID NO: 43)) were determined in accordance with the definitions of Kabat et al. (as described above; U.S. Department of Health and Human Services, 1991). The amino acid sequences of CDR 1 to 3 of the clone K5-70 VL are shown in SEQ ID NOS: 41 to 43, respectively.
FIG. 35 shows the cDNA nucleotide sequence of a clone K5-107 H chain variable region (VH) (SEQ ID NO: 44) and the deuced amino acid sequence (SEQ ID NO: 45). A signal peptide is shown in italics. The double-underlined glutamine (Q) indicates the N-terminal amino acid residue of a mature peptide. The CDR sequences (underlined; SYWMH (SEQ ID NO: 46), NIYPGGGYTNYDEKFKS (SEQ ID NO: 47), and SSVFDY (SEQ ID NO: 48)) were determined in accordance with the definitions of Kabat et al. (as described above; U.S. Department of Health and Human Services, 1991). The amino acid sequences of CDR 1 to 3 of the clone K5-107 VH are shown in SEQ ID NOS: 46 to 48, respectively.
FIG. 36 shows the cDNA nucleotide sequence of a clone K5-107 L chain variable region (VL) (SEQ ID NO: 49) and the deduced amino acid sequence (SEQ ID NO: 50). A signal peptide is shown in italics. The double-underlined aspartic acid (D) indicates the N-terminal amino acid residue of a mature peptide. The CDR sequences (underlined; RASQNIGTSIH (SEQ ID NO: 51), YASESIS (SEQ ID NO: 52), and QQSNSWPFT (SEQ ID NO: 53)) were determined in accordance with the definitions of Kabat et al. (as described above; U.S. Department of Health and Human Services, 1991). The amino acid sequences of CDR 1 to 3 of the clone K5-107 VL are shown in SEQ ID NOS: 51 to 53, respectively.
FIG. 37 shows the cDNA nucleotide sequence of a clone K5-116-2-1 H chain variable region (VH) (SEQ ID NO: 54) and the deduced amino acid sequence (SEQ ID NO: 55). A signal peptide is shown in italics. The double-underlined glutamine (Q) indicates the N-terminal amino acid residue of a mature peptide. The CDR sequences (underlined; SYWIT (SEQ ID NO: 56), NIYPSDSYTNYNQKFRD (SEQ ID NO: 57), and LFDY (SEQ ID NO: 58)) were determined in accordance with the definitions of Kabat et al. (as described above; U.S. Department of Health and Human Services, 1991). The amino acid sequences of CDR 1 to 3 of the clone K5-116-2-1 VH are shown in SEQ ID NOS: 56 to 58, respectively.
FIG. 38 shows the cDNA nucleotide sequence of a clone K5-116-2-1 L chain variable region (VL) (SEQ ID NO: 59) and the deduced amino acid sequence (SEQ ID NO: 60). A signal peptide is shown in italics. The double-underlined aspartic acid (D) indicates the N-terminal amino acid residue of a mature peptide. The CDR sequences (underlined; RASQSIGTSIH (SEQ ID NO: 61), YASESIS (SEQ ID NO: 62), and QQSNSWPFT (SEQ ID NO: 63)) were determined in accordance with the definitions of Kabat et al. (as described above; U.S. Department of Health and Human Services, 1991). The amino acid sequences of CDR 1 to 3 of the clone K5-116-2-1 VL are shown in SEQ ID NOS: 61 to 63, respectively.
FIG. 39 shows the cDNA nucleotide sequence of a clone T6-16 H chain variable region (VH) (SEQ ID NO: 64) and the deduced amino acid sequence (SEQ ID NO: 65). A signal peptide is shown in italics. The double-underlined glutamic acid (E) indicates the N-terminal amino acid residue of a mature peptide. The CDR sequences (underlined; DYNMH (SEQ ID NO: 66), YIYPYNGGTGYNQRFKS (SEQ ID NO: 67), and EDYGSSPSYAMDY (SEQ ID NO: 68)) were determined in accordance with the definitions of Kabat et al. (as described above; U.S. Department of Health and Human Services, 1991). The amino acid sequences of CDR 1 to 3 of the clone T6-16 VH are shown in SEQ ID NOS: 66 to 68, respectively.
FIG. 40 shows the cDNA nucleotide sequence of a clone T6-16 L chain variable region (VL) (SEQ ID NO: 69) and the deduced amino acid sequence (SEQ ID NO: 70). A signal peptide is shown in italics. The double-underlined aspartic acid (D) indicates the N-terminal amino acid residue of a mature peptide. The CDR sequences (underlined; RSSQSLVHGNGNTYLH (SEQ ID NO: 71), KVSNRFS (SEQ ID NO: 72), and SQTTHVPT (SEQ ID NO: 73)) were determined in accordance with the definitions of Kabat et al. (as described above; U.S. Department of Health and Human Services, 1991). The amino acid sequences of CDR 1 to 3 of the clone T6-16 VL are shown in SEQ ID NOS: 71 to 73, respectively.
FIG. 41 shows an alignment of the amino acid sequence (SEQ ID NO: 35) of the H chain variable region of a clone K5-70 (K5-70 VH), the amino acid sequence (SEQ ID NO: 75) of the H chain variable region of a humanized K5-70 (HuK5-70 VH), and the amino acid sequence (SEQ ID NO: 85) of the H chain variable region of an acceptor (Genbank accession No. DA980102; SEQ ID NO: 84) used for the production of the humanized antibody (DA980102 VH). (It is to be noted that each of the amino acid sequences shown in the figure indicates a portion of the amino acid sequence of each H chain variable region (specifically, the amino acid sequence of a mature protein portion from which a signal peptide portion is removed)).
The amino acid sequence underlined in the K5-70 VH indicates a CDR sequence determined in accordance with the definitions of Kabat et al. (as described above; U.S. Department of Health and Human Services, 1991). In addition, the number in the upper position of the amino acid sequence indicates the position number of an amino acid determined in accordance with the aforementioned definitions of Kabat et al. Each CDR sequence in the DA980102 VH is expressed with the symbol "---," and thus the description is omitted. Since the amino acid underlined in the HuK5-70 VH was assumed to be important for the maintenance of the structure of CDR, the sequence of the K5-70 VH was maintained. In addition, with regard to the amino acid double-underlined in the HuK5-70 VH, the amino acid of the corresponding DA980102 VH (methionine (M)) is rarely found at this position. Hence, for the purpose of decreasing antigenicity, the amino acid double-underlined in the HuK5-70 VH was substituted with leucine (L) as a representative amino acid belonging to the same subgroup.
FIG. 42 shows an alignment of the amino acid sequence (SEQ ID NO: 40) of the L chain variable region of a clone K5-70 (K5-70 VL), the amino acid sequence (SEQ ID NO: 77) of the L chain variable region of a humanized K5-70 (HuK5-70 VL), and the amino acid sequence (SEQ ID NO: 87; Genbank accession No. AAA64877) of the L chain variable region of an acceptor (Genbank accession No. L41174; SEQ ID NO: 86) used for the production of the humanized antibody (L41174 VL). (It is to be noted that each of the amino acid sequences shown in the figure indicates a portion of the amino acid sequence of each L chain variable region (specifically, the amino acid sequence of a mature protein portion from which a signal peptide portion is removed)).
The amino acid sequence underlined in the K5-70 VL indicates a CDR sequence determined in accordance with the definitions of Kabat et al. (as described above; U.S. Department of Health and Human Services, 1991). In addition, the number in the upper position of the amino acid sequence indicates the position number of an amino acid determined in accordance with the aforementioned definitions of Kabat et al. Each CDR sequence in the L41174 VL is expressed with the symbol "---," and thus the description is omitted. Since the amino acid underlined in the HuK5-70 VL was assumed to be important for the maintenance of the structure of CDR, the sequence of the K5-70 VL was maintained.
FIG. 43 shows an alignment of the amino acid sequence (SEQ ID NO: 65) of the H chain variable region of a clone T6-16 (T6-16 VH), the amino acid sequences (SEQ ID NOS: 79 and 81, respectively) of the H chain variable regions of two types of humanized T6-16 (HuT6-16 VH1 and HuT6-16 VH2), and the amino acid sequence (SEQ ID NO: 89) of the H chain variable region of an acceptor (Genbank accession No. DA935238; SEQ ID NO: 88) used for the production of the humanized antibody (DA935238 VH). (It is to be noted that each of the amino acid sequences shown in the figure indicates a portion of the amino acid sequence of each H chain variable region (specifically, the amino acid sequence of a mature protein portion from which a signal peptide portion is removed)).
The amino acid sequence underlined in the HuT6-16 VH indicates a CDR sequence determined in accordance with the definitions of Kabat et al. (as described above; U.S. Department of Health and Human Services, 1991). In addition, the number in the upper position of the amino acid sequence indicates the position number of an amino acid determined in accordance with the aforementioned definitions of Kabat et al. Each CDR sequence in the DA935238 VH is expressed with the symbol "---," and thus the description is omitted. Since the amino acids underlined in the HuT6-16 VH1 and HuT6-16 VH2 were assumed to be important for the maintenance of the structure of CDR, the sequence of the T6-16 VH was maintained. In addition, the lysine (K) at position 73 in the HuT6-16 VH1 was substituted with a threonine (T) derived from DA935238 as an acceptor sequence in the HuT6-16 VH2.
FIG. 44 shows an alignment of the amino acid sequence (SEQ ID NO: 70) of the L chain variable region of a clone T6-16 (T6-16 VL), the amino acid sequence (SEQ ID NO: 83) of the L chain variable region of a humanized T6-16 (HuT6-16 VL), and the amino acid sequence (SEQ ID NO: 91; Genbank accession No. AAA60341) of the L chain variable region of an acceptor (Genbank accession No. M99608; SEQ ID NO: 90) used for the production of the humanized antibody (M99608 VL). (It is to be noted that each of the amino acid sequences shown in the figure indicates a portion of the amino acid sequence of each L chain variable region (specifically, the amino acid sequence of a mature protein portion from which a signal peptide portion is removed)).
The amino acid sequence underlined in the T6-16 VL indicates a CDR sequence determined in accordance with the definitions of Kabat et al. (as described above; U.S. Department of Health and Human Services, 1991). In addition, the number in the upper position of the amino acid sequence indicates the position number of an amino acid determined in accordance with the aforementioned definitions of Kabat et al. Each CDR sequence in the M99608 VL is expressed with the symbol "---," and thus the description is omitted.
FIG. 45 shows the gene sequence (SEQ ID NO: 74) and amino acid sequence (SEQ ID NO: 75) of HuK5-70 VH.
The upper position of each line indicates the gene sequence (cDNA sequence) and the lower position thereof indicates the amino acid sequence. In the amino acid sequence, a signal peptide portion is underlined with a dashed line and each CDR sequence (CDR 1 to 3) is underlined with a solid line (the amino acid sequence of only the mature protein portion, from which the signal peptide portion is removed, is shown in SEQ ID NO: 92). An EcoRI site (GAA TTC) and a Kozak sequence (ACC ACC) were added to the 5' end of the HuK5-70 VH gene, and an NheI site (GCT AGC) was added to the 3' end thereof.
FIG. 46 shows the gene sequence (SEQ ID NO: 76) and amino acid sequence (SEQ ID NO: 77) of HuK5-70 VL.
The upper position of each line indicates the gene sequence (cDNA sequence) and the lower position thereof indicates the amino acid sequence. In the amino acid sequence, a signal peptide portion is underlined with a dashed line and each CDR sequence (CDR 1 to 3) is underlined with a solid line (the amino acid sequence of only the mature protein portion, from which the signal peptide portion is removed, is shown in SEQ ID NO: 93). An AgeI site (ACC GGT) and a Kozak sequence (ACC ACC) were added to the 5' end of the HuK5-70 VL gene, and a BsiWI site (CGT ACG) was added to the 3' end thereof.
FIG. 47 shows the gene sequence (SEQ ID NO: 78) and amino acid sequence (SEQ ID NO: 79) of HuT6-16 VH1.
The upper position of each line indicates the gene sequence (cDNA sequence) and the lower position thereof indicates the amino acid sequence. In the amino acid sequence, a signal peptide portion is underlined with a dashed line and each CDR sequence (CDR 1 to 3) is underlined with a solid line (the amino acid sequence of only the mature protein portion, from which the signal peptide portion is removed, is shown in SEQ ID NO: 94). An EcoRI site (GAA TTC) and a Kozak sequence (ACC ACC) were added to the 5' end of the HuT6-16 VH1 gene, and an NheI site (GCT AGC) was added to the 3' end thereof.
FIG. 48 shows the gene sequence (SEQ ID NO: 80) and amino acid sequence (SEQ ID NO: 81) of HuT6-16 VH2.
The upper position of each line indicates the gene sequence (cDNA sequence) and the lower position thereof indicates the amino acid sequence. In the amino acid sequence, a signal peptide portion is underlined with a dashed line and each CDR sequence (CDR 1 to 3) is underlined with a solid line (the amino acid sequence of only the mature protein portion, from which the signal peptide portion is removed, is shown in SEQ ID NO: 95). An EcoRI site (GAA TTC) and a Kozak sequence (ACC ACC) were added to the 5' end of the HuT6-16 VH2 gene, and an NheI site (GCT AGC) was added to the 3' end thereof.
FIG. 49 shows the gene sequence (SEQ ID NO: 82) and amino acid sequence (SEQ ID NO: 83) of HuT6-16 VL.
The upper position of each line indicates the gene sequence (cDNA sequence) and the lower position thereof indicates the amino acid sequence. In the amino acid sequence, a signal peptide portion is underlined with a dashed line and each CDR sequence (CDR 1 to 3) is underlined with a solid line (the amino acid sequence of only the mature protein portion, from which the signal peptide portion is removed, is shown in SEQ ID NO: 96). An AgeI site (ACC GGT) and a Kozak sequence (ACC ACC) were added to the 5' end of the HuT6-16 VL gene, and a BsiWI site (CGT ACG) was added to the 3' end thereof.
FIG. 50 shows the results obtained by confirming the expression of the HuK5-70 antibody, HuT6-16-1 antibody and HuT6-16-2 antibody.
FIG. 50(A) The expression vectors pFUSE-CHIg-HuK5-70 and pFUSE2-CLIg-HuK5-70 were introduced into 293F cells, and the expression of the HuK5-70 antibody in the culture supernatant was analyzed by Western blotting. Lane 1 indicates the culture supernatant of 293F cells into which no genes were introduced (negative control), and lane 2 indicates the culture supernatant of 293F cells into which the aforementioned expression vectors were introduced. The heavy chain and light chain proteins of the HuK5-70 antibody were detected with a biotin-labeled anti-human IgG F(ab').sup.2 antibody.
FIG. 50(B) The expression vectors pFUSE-CHIg-HuT6-16-1 and pFUSE2-CLIg-HuT6-16 (lane 3), and the expression vectors pFUSE-CHIg-HuT6-16-2 and pFUSE2-CLIg-HuT6-16 (lane 4), were introduced into 293F cells in these combinations. Then, the expression of the HuT6-16-1 antibody and HuT6-16-2 antibody was analyzed by Western blotting. The heavy chain proteins of the HuT6-16-1 antibody and HuT6-16-2 antibody were detected with a biotin-labeled anti-human IgG Fc antibody, and the light chain proteins of the HuT6-16-1 antibody and HuT6-16-2 antibody were detected with a biotin-labeled anti-human IgG F(ab').sup.2 antibody.
FIG. 51 shows the results obtained by staining the purified HuK5-70 antibody, HuT6-16-1 antibody and HuT6-16-2 antibody with Coomassie.
The purified HuK5-70 antibody (lane 1), HuT6-16-1 antibody (lane 2) and HuT6-16-2 antibody (lane 3) were loaded in amounts of 1 .mu.g each on SDS-PAGE, and were then stained with Coomassie.
FIG. 52 shows the results obtained by analyzing the antigen-binding ability of the HuK5-70 antibody, HuT6-16-1 antibody and HuT6-16-2 antibody, using a flow cytometer.
The reactivity of each antibody shown in the figure with HEK293-hTROP-2 cells (FIG. 52A) and PK-59 cells (FIG. 52B) was analyzed by FACS. Secondary antibody alone was used as a negative control (filled), and the reactivity of each antibody was indicated with a gray line.
FIG. 53 shows the results obtained by measuring the antigen-binding ability of the HuK5-70 antibody according to an ELISA method.
The antigen-binding ability of the K5-70 antibody and HuK5-70 antibody was analyzed according to an antigen-coated ELISA method. The symbol .tangle-solidup. indicates the measurement results of the K5-70 antibody, and the symbol .circle-solid. indicates the measurement results of the HuK5-70 antibody.
FIG. 54 shows the results obtained by measuring the antigen-binding ability of the HuT6-16-1 antibody and HuT6-16-2 antibody according to an ELISA method.
The antigen-binding ability of the T6-16 antibody, HuT6-16-1 antibody and HuT6-16-2 was analyzed according to an antigen-coated ELISA method. The symbol .tangle-solidup. indicates the measurement results of the T6-16 antibody, the symbol .circle-solid. indicates the measurement results of the HuT6-16-1 antibody, and the symbol .box-solid. indicates the measurement results of the HuT6-16-2 antibody.
FIG. 55 shows the anti-tumor activity of a humanized anti-hTROP-2 antibody (HuK5-70 antibody) on xenograft treatment models using human colon cancer SW480 cells.
FIG. 55A shows the time course of tumor formation in a control group (.circle-solid.: PBS) and in a HuK5-70 antibody (10 mg/kg body weight) administration group (.largecircle.) (a mean value.+-.standard deviation). The arrow indicates an antibody administration period. * P<0.05, ** P<0.01 (by Student's t-test).
FIG. 55B shows the plotted tumor weight of each mouse at the time of the 39.sup.th day (Day 39) (the final day of experiment) in the test of FIG. 55A. * P<0.05 (by Student's t-test).
FIG. 56 shows the dose-dependent anti-tumor activity of a humanized anti-hTROP-2 antibody (HuK5-70) on xenograft treatment models using human colon cancer SW480 cells.
FIG. 56A shows the time course of tumor formation in a control group (.circle-solid.: PBS) and in a HuK5-70 antibody administration groups (.largecircle.: 1 mg/kg body weight, .DELTA.: 5 mg/kg body weight, .quadrature.: 10 mg/kg body weight) (a mean value.+-.standard deviation). The arrow indicates an antibody administration period. ** P<0.01 (by Student's t-test).
FIG. 56B shows the plotted tumor weight of each mouse at the time of the 48.sup.th day (Day 48) (the final day of experiment) after cancer cell transplantation in the test of FIG. 56A. ** P<0.01 (by Student's t-test).
FIG. 57 shows the dose-dependent anti-tumor activity of a humanized anti-hTROP-2 antibody (HuT6-16-2) on xenograft treatment models using human colon cancer SW480 cells.
FIG. 57A shows the time course of tumor formation in a control group (.circle-solid.: PBS) and in a HuT6-16-2 antibody administration groups (.largecircle.: 1 mg/kg body weight, .DELTA.: 5 mg/kg body weight, .quadrature.: 10 mg/kg body weight) (a mean value.+-.standard deviation). The arrow indicates an antibody administration period. ** P<0.01 (by Student's t-test).
FIG. 57B shows the plotted tumor weight of each mouse at the time of the 48.sup.th day (Day 48) (the final day of experiment) after cancer cell transplantation in the test of FIG. 57A. * P<0.05 (by Student's t-test).
FIG. 58 shows the anti-tumor activity of mouse anti-hTROP-2 antibodies (K5-70 and T6-16) on xenograft treatment models using human ovarian cancer SK-OV-3 cells.
FIG. 58A shows the time course of tumor formation in a control group (.circle-solid.: PBS), in a K5-70 antibody (10 mg/kg body weight) administration group (.largecircle.), and in a T6-16 antibody (10 mg/kg body weight) administration group (.DELTA.) (a mean value.+-.standard deviation). The arrow indicates an antibody administration period. * P<0.01 (by Student's t-test).
FIG. 58B shows the plotted tumor weight of each mouse at the time of the 56.sup.th day (Day 56) (the final day of experiment) after cancer cell transplantation in the test of FIG. 58A. * P<0.05 (by Student's t-test).
FIG. 59 shows the anti-tumor activity of mouse anti-hTROP-2 antibodies (K5-70 and T6-16) on xenograft treatment models using human breast cancer MDA-MB-468 cells.
FIG. 59A shows the time course of tumor formation in a control group (.circle-solid.: PBS), in a K5-70 antibody (10 mg/kg body weight) administration group (.largecircle.), and in a T6-16 antibody (10 mg/kg body weight) administration group (.DELTA.) (a mean value.+-.standard deviation). The arrow indicates an antibody administration period. ** P<0.01 (by Student's t-test).
FIG. 59B shows the plotted tumor weight of each mouse at the time of the 54.sup.th day (Day 54) (the final day of experiment) after cancer cell transplantation in the test of FIG. 59A. * P<0.05, ** P<0.01 (by Student's t-test).
FIG. 60 shows the anti-tumor activity of mouse anti-hTROP-2 antibodies (K5-70 and T6-16) on xenograft treatment models using human lung cancer Calu-3 cells.
FIG. 60A shows the time course of tumor formation in a control group (.circle-solid.: PBS), in a K5-70 antibody (10 mg/kg body weight) administration group (.largecircle.), and in a T6-16 antibody (10 mg/kg body weight) administration group (.DELTA.) (a mean value.+-.standard deviation). The arrow indicates an antibody administration period. * P<0.05, ** P<0.01 (by Student's t-test).
FIG. 60B shows the plotted tumor weight of each mouse at the time of the 41.sup.st day (Day 41) (the final day of experiment) after cancer cell transplantation in the test of FIG. 60A. * P<0.05, ** P<0.01 (by Student's t-test).
FIG. 61 shows the anti-tumor activity of a mouse anti-hTROP-2 antibody K5-70 on xenograft prevention models using human bile duct cancer TFK-1 cells.
FIG. 61A shows the time course of tumor formation in a control group (.circle-solid.: PBS) and in a K5-70 antibody (10 mg/kg body weight) administration group (.largecircle.) (a mean value.+-.standard deviation). The arrow indicates an antibody administration period. ** P<0.01 (by Student's t-test).
FIG. 61B shows the plotted tumor weight of each mouse at the time of the 31.sup.st day (Day 31) (the final day of experiment) after cancer cell transplantation in the test of FIG. 61A. ** P<0.01 (by Student's t-test).
FIG. 62 shows the results obtained by analyzing the binding activity of the HuK5-70 and HuT6-16-2 antibodies according to low-density antigen-coated ELISA. A 96-well plate was coated with a 0.1 .mu.g/mL recombinant hTACSTD2-Fc-His protein, and thereafter, test antibodies (K5-70, HuK5-70, T6-16 and HuT6-16-2 antibodies), which had been prepared in concentrations from 20 .mu.g/mL to a series of two-fold dilutions, were allowed to react with the protein. In FIG. 62(A), K5-70 (.tangle-solidup.) and HuK5-70 (.circle-solid.) antibodies were used as test antibodies, and in FIG. 62(B), T6-16 (.tangle-solidup.) and HuT6-16-2 antibody (.circle-solid.) were used as test antibodies.
FIG. 63 shows the results obtained by analyzing the binding activity of hTROP-2 to K5-70 and HuK5-70 antibodies by ELISA. A 96-well plate was coated with the K5-70 and HuK5-70 antibodies via anti-mouse IgG (.gamma. chain specific) and anti-human IgG1 (Fc.gamma. specific), and thereafter, these antibodies were allowed to react with hTROP-2-EC-His proteins, which had been prepared in concentrations from 5 .mu.g/mL to a series of two-fold dilutions. The binding of such a hTROP-2-EC-His protein was detected using an anti-His tag antibody. (.tangle-solidup.) K5-70 antibody and (.circle-solid.) HuK5-70 antibody.
FIG. 64 shows the nucleotide sequence (upper case; SEQ ID NO: 99) and amino acid sequence (lower case; SEQ ID NO: 35) of a K5-70 VH gene that was prepared by gene synthesis. With regard to this nucleotide sequence, an EcoRI site (GAA TTC) and a Kozak sequence (ACC ACC) were added to the 5' end, and an NheI site (GCT AGC) was added to the 3' end. The amino acid sequence is shown by single letter code. A signal peptide on the N-terminal side is shown in italics. The double-underlined glutamine (Q) indicates the N-terminal amino acid residue of a mature peptide. The CDR sequences (underlined; IYWIN (SEQ ID NO: 36), NIYPSDSYTNYNQKFKD (SEQ ID NO: 37), and TSMADY (SEQ ID NO: 38)) were determined in accordance with the definitions of Kabat et al. (Sequences of Proteins of Immunological Interests, Fifth edition, NIH Publication No. 91-3242, U.S. Department of Health and Human Services, 1991). The amino acid sequences of CDR 1 to 3 of the clone K5-70 VH are shown in SEQ ID NOS: 36 to 38, respectively.
FIG. 65 shows the nucleotide sequence (upper case; SEQ ID NO: 100) and amino acid sequence (lower case; SEQ ID NO: 40) of a K5-70 VL gene that was prepared by gene synthesis. With regard to this nucleotide sequence, an AgeI site (ACC GGT) and a Kozak sequence (ACC ACC) were added to the 5' end, and a BsiWI site (CGT ACG) was added to the 3' end. The amino acid sequence is shown by single letter code. A signal peptide on the N-terminal side is shown in italics. The double-underlined aspartic acid (D) indicates the N-terminal amino acid residue of a mature peptide. The CDR sequences (underlined; RASQSIGTSIH (SEQ ID NO: 41), YASESIS (SEQ ID NO: 42), and QQSNSWPFT (SEQ ID NO: 43)) were determined in accordance with the definitions of Kabat et al. (as described above, U.S. Department of Health and Human Services, 1991). The amino acid sequences of CDR 1 to 3 of the clone K5-70 VL are shown in SEQ ID NOS: 41 to 43, respectively.
FIG. 66 shows the binding activity of ChK5-70, HuK5-70, HuVH/MuVL (in which the VL of the HuK5-70 antibody is substituted with the VL of the K5-70 antibody) and MuVH/HuVL (in which the VH of the HuK5-70 antibody is substituted with the VH of the K5-70 antibody) antibodies to hTROP-2. A 96-well plate was coated with a 0.1 .mu.g/mL recombinant hTACSTD2-Fc-His protein. A culture supernatant of cells, in which test antibodies (ChK5-70, HuK5-70, HuVH/MuVL and MuVH/HuVL antibodies) had been transiently expressed, was diluted to result in antibody concentrations of 1, 0.1, 0.01 and 0.001 .mu.g/mL. Thus, the diluted test antibodies were allowed to react with the antigen. (.tangle-solidup.) ChK5-70 antibody, (.DELTA.) MuVH/HuVL antibody, (.largecircle.) HuVH/MuVL antibody and (.circle-solid.) HuK5-70 antibody.
FIG. 67 shows the amino acid sequences of HuK5-70 VH (SEQ ID NO: 75) and its amino acid substitution mutants. Amino acids are shown by single letter code. The amino acid of each amino acid substitution mutant, which is the same as that of the HuK5-70 VH, is indicated with the symbol "-," and only the substituted amino acids are shown by single letter code. The number in the upper position of the sequence indicates an amino acid number (Kabat et al., 1991).
FIG. 68 shows the binding activity of ChK5-70, HuK5-70, HuK5-70 VH A40R (a mutant in which the alanine at position 40 of the VH of the HuK5-70 antibody is substituted with an arginine) and HuK5-70 VH R44G (a mutant in which the arginine at position 44 of the VH of the HuK5-70 antibody is substituted with a glycine) antibodies to hTROP-2. A 96-well plate was coated with a 0.1 .mu.g/mL recombinant hTACSTD2-Fc-His protein. A culture supernatant of cells, in which test antibodies (ChK5-70, HuK5-70, HuK5-70 VH A40R and HuK5-70 VH R44G antibodies) had been transiently expressed, was diluted to result in concentrations from 0.5 .mu.g/mL to a series of two-fold dilutions (six samples). Thus, the diluted test antibodies were allowed to react with the antigen. (.tangle-solidup.) ChK5-70 antibody, (.DELTA.) HuK5-70 VH R44G antibody, (.largecircle.) HuK5-70 VH A40R antibody and (.circle-solid.) HuK5-70 antibody.
FIG. 69 shows the nucleotide sequence (upper case) and amino acid sequence (lower case) of a HuK5-70 VH R44G gene (a mutant in which the arginine at position 44 of the VH of the HuK5-70 antibody, SEQ ID NO: 75, is substituted with a glycine that was prepared by gene synthesis. With regard to this nucleotide sequence (SEQ ID NO: 74), an EcoRI site (GAA TTC) and a Kozak sequence (ACC ACC) were added to the 5' end, and an NheI site (GCT AGC) was added to the 3' end. The amino acid sequence is shown by single letter code. A signal peptide on the N-terminal side is shown in italics. The amino acid (Q: glutamine) on the N-terminal side of mature VH is double-underlined, and the CDR sequence (Kabat et al., 1991) is underlined.
FIG. 70 shows SDS-PAGE performed on a purified HuK5-70-2 antibody. The HuK5-70-2 antibody (1 .mu.g) was loaded on a 11% SDS-PAGE gel under reducing conditions. Lane 1: a molecular weight marker (Precision Plus Dual Standard (BIO-RAD)), lane 2: a HuK5-70-2 antibody. The numerical value on the left side of the figure indicates a molecular weight.
FIG. 71 shows the binding activity of K5-70, HuK5-70 and HuK5-70-2 antibodies to hTROP-2. A 96-well plate was coated with a 0.1 .mu.g/mL recombinant hTACSTD2-Fc-His protein. The purified test antibodies (K5-70, HuK5-70 and HuK5-70-2 antibodies) were diluted to result in concentrations from 1 .mu.g/mL to a series of two-fold dilutions (ten samples). Thus, the diluted test antibodies were allowed to react with the antigen. (.box-solid.) K5-70 antibody, (.DELTA.) HuK5-70-2 antibody, and (.circle-solid.) HuK5-70 antibody.
FIG. 72A shows the ADCC activity of humanized anti-hTROP-2 antibodies (open column: HuK5-70, and filled column: HuT6-16-2). More specifically, a HuK5-70 antibody and a HuT6-16-2 antibody (all of which were in concentrations of 0, 0.1, 0.3, 1, 3, and 10 .mu.g/mL) and healthy human peripheral blood monocytes were added to a human colon cancer cell line SW480, and they were then cultured for 6 hours. Thereafter, the activity of LDH released into the culture supernatant was measured, so that the ADCC activity could be measured (a mean value.+-.standard deviation (N=3), effector/target (E/T)=40). The antibody concentration that is 0 indicates non-addition of the antibody. *P<0.05, **P<0.01 (by Student's t-test).
FIG. 72B shows the ADCC activity of humanized anti-hTROP-2 antibodies (open column: HuK5-70, gray column: HuK5-70-2, and filled column: HuT6-16-2). More specifically, a HuK5-70 antibody, a HuK5-70-2 antibody and a HuT6-16-2 antibody (all of which were in concentrations of 0, 0.3, 1, 3, 10 and 30 .mu.g/mL) and healthy human peripheral blood monocytes were added to a human pancreatic cancer cell line (PK-59), and they were then cultured for 6 hours. Thereafter, the activity of LDH released into the culture supernatant was measured, so that the ADCC activity could be measured (a mean value.+-.standard deviation (N=3), effector/target (E/T)=40). The antibody concentration that is 0 indicates non-addition of the antibody. **P<0.01 (by Student's t-test).
FIG. 72C shows the ADCC activity of humanized anti-hTROP-2 antibodies (open column: HuK5-70, gray column: HuK5-70-2, and filled column: HuT6-16-2). More specifically, a HuK5-70 antibody, a HuK5-70-2 antibody and a HuT6-16-2 antibody (all of which were in concentrations of 0, 0.3, 1, 3, 10 and 30 .mu.g/mL) and healthy human peripheral blood monocytes were added to a human prostate cancer cell line (PC-3), and they were then cultured for 6 hours. Thereafter, the activity of LDH released into the culture supernatant was measured, so that the ADCC activity could be measured (a mean value.+-.standard deviation (N=3), effector/target (E/T)=40). The antibody concentration that is 0 indicates non-addition of the antibody. **P<0.01 (by Student's t-test).
DETAILED DESCRIPTION OF THE INVENTION
Hereinafter, the present invention will be described in detail. The following descriptions are not intended to limit the scope of the present invention. Other than the following examples, the present invention may be modified and may be carried out, as appropriate, within a range that does not impair the intention of the present invention
The present specification includes all of the contents as disclosed in the specification of U.S. Provisional Patent Application No. 61/562,672 (filed on Nov. 22, 2011), which is a priority document of the present application.
In addition, all publications cited in the present specification, which include prior art documents and patent documents such as laid-open application publications and patent publications, are incorporated herein by reference in their entirety.
1. Summary of the Present Invention
As mentioned above, human TROP-2 (hTROP-2) is a single transmembrane, type 1 membrane protein having a full length of 323 amino acid residues. It has been known that an hTROP-2 gene and a gene product thereof are expressed in various types of cancer cells.
As mentioned above, it has been desired to develop an anti-hTROP-2 antibody (an anti-hTROP-2 monoclonal antibody) or the like having high anti-tumor activity in vivo. Under such circumstances, the present inventor performed a screening through an extremely large number of clones, and as a result, the inventor succeeded in obtaining a clone having high anti-tumor activity in vivo. Specifically, the present invention provides a monoclonal antibody, which specifically recognizes the extracellular region of hTROP-2 in vivo, and particularly, a monoclonal antibody exhibiting high affinity at a picomole (pM) order. The antibody of the present invention is extremely useful in that it is an anti-hTROP-2 monoclonal antibody (particularly, a humanized antibody), which exhibits significant tumor growth inhibitory activity at a lower dose than that of the existing anti-hTROP-2 antibody (for example, at a dosage of 1/20) when it is administered singly as a naked antibody, and which also exhibits significant tumor growth inhibitory activity on tumor-bearing mouse treatment models, in which multiple types of human cancer cells are used.
2. Production of Anti-hTROP-2 Antibody
(1) Preparation of Antigen
Information regarding the amino acid sequence (SEQ ID NO: 2) of hTROP-2 is disclosed under "Accession number NP_002344" in the website of, for example, NCBI (GenBank). Information regarding a nucleotide sequence (SEQ ID NO: 1) encoding the amino acid sequence of hTROP-2 is disclosed under "Accession number NM_002353" in the same website as described above.
As an antigen, a polypeptide or peptide (which is also simply referred to as a peptide) comprising at least a portion (the entire or a part) of the amino acid sequence of hTROP-2 can be used, and preferably, a peptide comprising at least a portion (the entire or a part) of the amino acid sequence of the extracellular region of hTROP-2 can be used. The extracellular region (including a signal peptide) of hTROP-2 indicates a region comprising the amino acids at positions 1 to 274 from the amino acid sequence shown in SEQ ID NO: 2 (the signal peptide: the amino acids at positions 1 to 26). Herein, with regard to a peptide used as an antigen, the above description "at least a portion of the amino acid sequence" is not particularly limited in terms of length. For example, a region comprising the amino acids at positions 1 to 145 from the amino acid sequence shown in SEQ ID NO: 2, a region comprising the amino acids at positions 146 to 274 from the same amino acid sequence as described above, and the like are preferable.
A peptide used as an antigen may be produced either by chemical synthesis, or by synthesis according to a genetic engineering method using Escherichia coli or the like. A method well known to persons skilled in the art may be applied.
When a peptide is produced by chemical synthesis, it can be synthesized by a well known peptide synthesis method. In addition, either a solid-phase synthesis method or a liquid-phase synthesis method can be applied to the peptide synthesis. A commercially available peptide synthesizer (for example, PSSM-8 manufactured by Shimadzu Corporation, etc.) may also be used.
When a peptide is synthesized by a genetic engineering method, first, DNA encoding the peptide is designed and synthesized. The design and synthesis of such DNA can be carried out according to a PCR method, using a vector comprising an entire-length hTROP-2 gene or the like as a template, and also using primers designed to be able to synthesize a desired DNA region. Thereafter, the DNA is ligated to a suitable vector to obtain a recombinant vector used for protein expression, and this recombinant vector is then introduced into a host so that a gene of interest can be expressed therein, thereby obtaining a transformant (Sambrook J. et al., Molecular Cloning, A Laboratory Manual, 3rd edition, Cold Spring Harbor Laboratory Press, 2001).
As a vector, a phage or a plasmid capable of autonomously replicating in a host microorganism is used. Further, an animal virus or an insect virus vector can also be used. To produce a recombinant vector, a purified DNA may be cleaved with suitable restriction enzymes, and the thus cleaved DNA portion may be then inserted into the restriction enzyme site or the like of a suitable vector DNA, so as to ligate it to the vector. The type of a host used in transformation is not particularly limited, as long as it is able to express a gene of interest. Examples of such a host include bacteria (Escherichia coli, Bacillus subtilis, etc.), yeasts, animal cells (COS cells, CHO cells, etc.), insect cells, and insects. A mammal such as a goat may also be used as such a host. A method of introducing a recombinant vector into a host is publicly known.
The above-described transformant is cultured, and a peptide used as an antigen is then collected from the culture. The term "culture" is used herein to mean both (a) a culture supernatant, and (b) cultured cells, a cultured cell mass or a disintegrated product thereof.
After completion of the culture, when a peptide of interest is produced in a cell mass or in cells, the peptide is extracted by disintegrating the cell mass or the cells. On the other hand, when a peptide of interest is produced outside a cell mass or outside cells, a culture solution is directly used, or the cell mass or the cells are removed from the culture solution by centrifugation or the like. Thereafter, the peptide of interest can be isolated and purified by a single use of biochemical methods commonly used in the isolation and purification of peptides, such as ammonium sulfate precipitation, gel filtration, ion exchange chromatography and affinity chromatography, or by appropriately combining the aforementioned biochemical methods.
In the present invention, a peptide used as an antigen can also be obtained by in vitro translation using a cell-free synthesis system. In this case, two methods, namely, a method using RNA as a template and a method using DNA as a template (transcription/translation) can be applied. As such a cell-free synthesis system, a commercially available system, such as EXPRESSWAY.TM. system (Invitrogen), PURESYSTEM.RTM. (Post Genome Institute) or TNT.RTM. system (Promega) can be used.
The thus obtained peptide may bind to a suitable carrier protein such as bovine serum albumin (BSA), keyhole limpet hemocyanin (KLH), human thyroglobulin or chicken .gamma.-globulin.
Moreover, the antigen may be a peptide consisting of an amino acid sequence comprising a deletion, substitution or addition of one or more amino acids with respect to the amino acid sequence of hTROP-2 (SEQ ID NO: 2) or a partial sequence thereof as described above. There can be used, for example, a peptide consisting of an amino acid sequence, in which one or more (preferably one or several (for example, 1 to 10, and more preferably 1 to 5)) amino acids are deleted, or one or more (preferably one or several (for example, 1 to 10, and more preferably 1 to 5)) amino acids are substituted with other amino acids, or one or more (preferably one or several (for example, 1 to 10, and more preferably 1 to 5)) other amino acids are added, with respect to the amino acid sequence of hTROP-2 or a partial sequence thereof.
In the present invention, a gene to be introduced into a cell or the like is a gene encoding an hTROP-2 protein or a partial fragment thereof, or a mutant protein thereof or a fragment thereof. As such a gene, a gene having the nucleotide sequence shown in SEQ ID NO: 1 or a partial sequence thereof can be used, for example.
Furthermore, as a gene to be introduced into a cell or the like, there may also be used a nucleotide sequence hybridizing under stringent conditions with a sequence complementary to the nucleotide sequence shown in SEQ ID NO: 1 and encoding a protein having hTROP-2 activity, or a partial sequence thereof.
The description "stringent conditions" is used herein to mean washing conditions after completion of the hybridization. As such stringent conditions, a salt (sodium) concentration in buffer is 10 to 500 mM and a temperature is 42.degree. C. to 72.degree. C., and preferably, the aforementioned salt condition is 50 to 300 mM and a temperature is 55.degree. C. to 68.degree. C.
Mutation can be introduced into a gene according to a known method such as a Kunkel method or a Gapped duplex method, using, for example, a mutation introduction kit which utilizes site-directed mutagenesis, such as GeneTailor.TM. Site-Directed Mutagenesis System (manufactured by Invitrogen) or TaKaRa Site-Directed Mutagenesis System (Mutan-K, Mutan-Super Express Km, etc.; manufactured by Takara Bio Inc.).
(2) Production of Polyclonal Antibody
The prepared antigen is administered to a mammal for immunization. The type of such a mammal is not particularly limited. For example, a rat, a mouse and a rabbit can be used, and among them, a mouse is preferable.
The dosage of the antigen per animal can be determined, as appropriate, depending on the presence or absence of an adjuvant. Examples of such an adjuvant include a Freund's complete adjuvant (FCA), a Freund's incomplete adjuvant (FIA) and an aluminum hydroxide adjuvant. Immunization can be carried out mainly by injecting the antigen into the vein, footpad, subcutis or abdominal cavity of an animal. In addition, immunization interval is not particularly limited, and immunization is carried out at intervals of several days to several weeks, preferably at intervals of 1 week, 1 to 10 times, and preferably 2 or 3 times. Three to seven days after the final immunization day, an antibody titer is measured by enzyme immunoassay (ELISA or EIA), radioimmunoassay (RIA) or other methods. On the date at which a desired antibody titer is obtained, blood can be collected to obtain antiserum. In the above-described method of collecting an antibody, if it is necessary to purify the antibody, the antibody can be purified by selecting a suitable method from known methods such as ammonium sulfate precipitation, ion exchange chromatography, gel filtration chromatography and affinity chromatography, or by combining the above-mentioned methods, as appropriate. Thereafter, the reactivity of a polyclonal antibody in the antiserum is measured by the ELISA method or the like.
(3) Production of Monoclonal Antibody
(3-1) Collection of Antibody-Producing Cells
The anti-hTROP-2 antibody of the present invention is not limited, but it is preferably a monoclonal antibody.
The prepared antigen is administered to a mammal, such as a rat, a mouse or a rabbit, for immunization. The dosage of the antigen per animal can be determined, as appropriate, depending on the presence or absence of an adjuvant. The same adjuvants as described above can be used herein. Also, the same immunization methods as described above can be applied herein. One to sixty days, and preferably, one to fourteen days after the final immunization day, antibody-producing cells are collected. Examples of such antibody-producing cells include splenic cells, lymph node cells and peripheral blood cells. Of these, lymph node cells and splenic cells are preferable.
(3-2) Cell Fusion
In order to obtain hybridomas (an antibody-producing cell line), the cell fusion of antibody-producing cells with myeloma cells is carried out. As myeloma cells to be fused with antibody-producing cells, commonly available established cells from animals such as mice can be used. The cell line used herein is preferably a cell line, which has drug selectivity, cannot survive in an unfused state in a HAT selective medium (containing hypoxanthine, aminopterin and thymidine), and can survive only in a state fused with antibody-producing cells.
Examples of myeloma cells include mouse myeloma cell lines such as P3-X63-Ag8.653, P3-X63-Ag8(X63), P3-X63-Ag8.U1(P3U1), P3/NS I/1-Ag4-1(NS1) and Sp2/0-Ag14(Sp2/0). Myeloma cells can be selected, while taking into consideration the compatibility with antibody-producing cells, as appropriate.
Subsequently, myeloma cells are fused with antibody-producing cells. For such cell fusion, antibody-producing cells (1.times.10.sup.6 to 1.times.10.sup.7 cells/mL) are mixed with myeloma cells (2.times.10.sup.5 to 2.times.10.sup.6 cells/mL) in a medium for animal cells, such as DMEM or an RPMI-1640 medium containing no serum. The cell ratio between the antibody-producing cells and the myeloma cells (antibody-producing cells:myeloma cells) is not limited. In general, the cell ratio is preferably 1:1 to 10:1, and more preferably 3:1. Thereafter, a fusion reaction is carried out in the presence of a cell fusion promoter. As such a cell fusion promoter, polyethylene glycol having a mean molecular weight of 1,000 to 6,000 Dalton (D) or the like can be used. In addition, it is also possible to fuse antibody-producing cells with myeloma cells, employing a commercially available cell fusion apparatus which utilizes electrical stimulation (for example, electroporation).
(3-3) Selection and Cloning of Hybridomas
Hybridomas of interest are selected from the cells after the cell fusion treatment. As a method of selecting hybridomas, the cell suspension is appropriately diluted with, for example, a fetal bovine serum-containing RPMI-1640 medium, and the diluted solution is then dispersed on a microtiter plate. Thereafter, a selective medium is added to each well. While the selective medium is appropriately exchanged with a fresh one, culture is carried out. As a result, approximately 14 days after initiation of the culture on the selective medium, cells growing from the selective medium can be obtained as hybridomas.
Subsequently, screening is carried out to examine whether or not an antibody reacting with hTROP-2 is present in a culture supernatant of the growing hybridomas. The screening of hybridomas may be carried out according to an ordinary method, and thus, the screening method is not particularly limited. For example, an aliquot is collected from the culture supernatant of the growing hybridomas contained in the well, and screening is then carried out by ELISA, EIA, RIA or the like.
The cloning of the fused cells can be carried out by a limiting dilution method or the like. An antibody showing high reactivity with hTROP-2 is determined by flow cytometry or the like, and a hybridoma producing this antibody is then selected. The selected hybridoma is established as a clone.
(3-4) Collection of Monoclonal Antibody
As a method of culturing the established hybridoma and then collecting a monoclonal antibody from the obtained culture, a common cell culture method, an ascites formation method or the like can be adopted. The term "culture" is used herein to mean allowing hybridomas to grow in a culture dish or a culture bottle, or allowing hybridomas to grow in the abdominal cavity of an animal, as described below.
In the case of the cell culture method, hybridomas are cultured in a medium for animal cells, such as a 10% fetal bovine serum-containing RPMI-1640 medium, an MEM medium or a serum-free medium, under common culture conditions (for example, 37.degree. C., 5% CO.sub.2 concentration) for 7 to 14 days, and thereafter, an antibody can be obtained from the culture supernatant.
In the case of the ascites formation method, approximately 1.times.10.sup.7 hybridomas are administered into the abdominal cavity of an animal of the same species as the mammal from which myeloma cells are derived, so that large quantities of hybridomas are allowed to proliferate. Thereafter, 2 to 3 weeks later, ascites is preferably collected.
In the above-described antibody collection methods, if it is necessary to purify the antibody, the antibody can be purified by appropriately selecting a suitable method from known methods such as ammonium sulfate precipitation, ion exchange chromatography, gel filtration and affinity chromatography, or by combining the above-mentioned methods.
(3-5) Selection of Clone Having Anti-Tumor Activity
The anti-hTROP-2 antibody of the present invention is an antibody having anti-tumor activity in vivo.
The term "anti-tumor activity" is used herein to mean activity of killing tumor cells (cancer cells) or activity of inhibiting tumor growth. Preferred examples of such anti-tumor activity include activity of inhibiting the growth of cancer cells and activity of inhibiting tumor angiogenesis. The type of human tumor (tumor cells), on which the antibody of the present invention is able to exhibit anti-tumor activity, includes various types of known human tumors, in which the expression of hTROP-2 has been confirmed. The type of such human tumor is not particularly limited. For example, one or two or more types selected from various human tumors such as human pancreatic cancer, human prostate cancer, human colorectal cancer, human breast cancer, human ovarian cancer, human lung cancer and human bile duct cancer are preferable; and one or two or more types selected from human pancreatic cancer, human colorectal cancer, human prostate cancer, human colorectal cancer, human breast cancer, human ovarian cancer and human lung cancer are more preferable. Human pancreatic cancer and/or human colorectal cancer are further preferable.
Moreover, the above-described tumor may be a recurrent cancer or a metastatic cancer. The antibody of the present invention is also able to exhibit excellent anti-tumor activity on these types of tumors.
The presence of anti-tumor activity in vivo can be confirmed, for example, by employing a tumor-bearing mouse (a mouse xenograft model), into the subcutis of which desired tumor cells have been transplanted, and then by administering the antibody as obtained above to the mouse. In this case, the antibody may be administered immediately after the transplantation of tumor cells (prevention models). Alternatively, it may be administered after confirming that the transplanted tumor has reached a predetermined volume (treatment models). The administration method is not limited. For example, the antibody may be administered once every three days, every one week, every ten days, or every two weeks, or by a single administration (only one time), at a dosage of 5 to 20 mg/kg body weight, via intraperitoneal administration or the like. In the case of prevention models, the presence or absence of anti-tumor activity and the level thereof can be evaluated based on tumor formation frequency and tumor volume. In the case of treatment models, the presence or absence of anti-tumor activity and the level thereof can be evaluated based on tumor volume.
In the present invention, a preferred example of the anti-hTROP-2 antibody having anti-tumor activity in vivo is an antibody in which the amino acid sequences of CDR 1 to 3 of the H chain V region thereof are shown in SEQ ID NOS: 36 to 38, respectively, and/or the amino acid sequences of CDR 1 to 3 of the L chain V region thereof are shown in SEQ ID NOS: 41 to 43, respectively. A preferred example of the H chain V region is an H chain V region consisting of the amino acid sequence shown in SEQ ID NO: 35. A preferred example of the L chain V region is an L chain V region consisting of the amino acid sequence shown in SEQ ID NO: 40.
As another embodiment of the anti-hTROP-2 antibody of the present invention, a preferred example is an antibody in which the amino acid sequences of CDR 1 to 3 of the H chain V region thereof are shown in SEQ ID NOS: 46 to 48, respectively, and/or the amino acid sequences of CDR 1 to 3 of the L chain V region thereof are shown in SEQ ID NOS: 51 to 53, respectively. A preferred example of the H chain V region is an H chain V region consisting of the amino acid sequence shown in SEQ ID NO: 45. A preferred example of the L chain V region is an L chain V region consisting of the amino acid sequence shown in SEQ ID NO: 50.
Likewise, as a further embodiment of the anti-hTROP-2 antibody of the present invention, a preferred example is an antibody in which the amino acid sequences of CDR 1 to 3 of the H chain V region thereof are shown in SEQ ID NOS: 56 to 58, respectively, and/or the amino acid sequences of CDR 1 to 3 of the L chain V region thereof are shown in SEQ ID NOS: 61 to 63, respectively. A preferred example of the H chain V region is an H chain V region consisting of the amino acid sequence shown in SEQ ID NO: 55. A preferred example of the L chain V region is an L chain V region consisting of the amino acid sequence shown in SEQ ID NO: 60.
Likewise, as a further embodiment of the anti-hTROP-2 antibody of the present invention, a preferred example is an antibody in which the amino acid sequences of CDR 1 to 3 of the H chain V region thereof are shown in SEQ ID NOS: 66 to 68, respectively, and/or the amino acid sequences of CDR 1 to 3 of the L chain V region thereof are shown in SEQ ID NOS: 71 to 73, respectively. A preferred example of the H chain V region is an H chain V region consisting of the amino acid sequence shown in SEQ ID NO: 65. A preferred example of the L chain V region is an L chain V region consisting of the amino acid sequence shown in SEQ ID NO: 70.
In the present invention, more specifically, preferred examples of an anti-hTROP-2 antibody having anti-tumor activity in vivo include: an anti-hTROP-2 monoclonal antibody (clone name: K5-70) produced by a hybridoma with Accession number FERM BP-11251; an anti-hTROP-2 monoclonal antibody (clone name: K5-107) produced by a hybridoma with Accession number FERM BP-11252; an anti-hTROP-2 monoclonal antibody (clone name: K5-116-2-1) produced by a hybridoma with Accession number FERM BP-11253; an anti-hTROP-2 monoclonal antibody (clone name: T6-16) produced by a hybridoma with Accession number FERM BP-11346; and an anti-hTROP-2 monoclonal antibody (clone name: T5-86) produced by a hybridoma with Accession number FERM BP-11254.
Herein, the hybridoma with Accession number FERM BP-11251 was named as "Mouse-Mouse Hybridoma K5-70" and was deposited on May 12, 2010; the hybridoma with Accession number FERM BP-11252 was named as "Mouse-Mouse Hybridoma K5-107" and was deposited on May 12, 2010; the hybridoma with Accession number FERM BP-11253 was named as "Mouse-Mouse Hybridoma K5-116-2-1" and was deposited on May 12, 2010; the hybridoma with Accession number FERM BP-11346 was named as "Mouse-Mouse Hybridoma T6-16" and was deposited on Mar. 1, 2011; and the hybridoma with Accession number FERM BP-11254 was named as "Mouse-Mouse Hybridoma T5-86" and was deposited on May 12, 2010. All of these hybridomas were deposited with the International Patent Organism Depositary (IPOD), the National Institute of Advanced Industrial Science and Technology, an Independent Administrative Institution under the Ministry of Economy, Trade and Industry (the AIST, Tsukuba Central 6, Higashi 1-1-1, Tsukuba, Ibaraki, Japan, postal code: 305-8566).
Still further, another preferred example of the anti-hTROP-2 antibody of the present invention is an anti-hTROP-2 antibody that binds to a site (e.g. an epitope), to which a monoclonal antibody produced by the hybridoma having accession No. FERM BP-11251, FERM BP-11252, FERM BP-11253, FERM BP-11346 or FERM BP-11254 binds (recognizes).
Preferred examples of such an epitope will be given in (3-6) below.
(3-6) Epitope of Anti-hTROP-2 Antibody
The type of an epitope (an antigenic determinant) of the anti-hTROP-2 antibody of the present invention is not limited, as long as it is at least a portion of hTROP-2 as an antigen. For example, such an epitope is preferably at least a portion of a region formed by removing a region consisting of amino acids at positions 252 to 260 from the amino acid sequence of hTROP-2 shown in SEQ ID NO: 2, more preferably at least a portion of a region consisting of amino acids at positions 1 to 69 or at least a portion of a region consisting of amino acids at positions 100 to 274 (except for a region consisting of amino acids at position 252 to 260), and further preferably at least a portion of a region consisting of amino acids at positions 27 to 69 or a region consisting of amino acids at positions 109 to 206. Particularly preferred examples of the above-described epitope include a region consisting of amino acids at positions 43 to 65, a region consisting of amino acids at positions 152 to 165, a region consisting of amino acids at positions 171 to 183, a region consisting of amino acids at positions 109 to 120, a region consisting of amino acids at positions 194 to 207, a region consisting of amino acids at positions 43 to 56, and a portion comprising such a region, in the amino acid sequence of hTROP-2 shown in SEQ ID NO: 2. Further particularly preferred examples include a region consisting of amino acids at positions 43 to 65, a region consisting of amino acids at positions 152 to 165, a region consisting of amino acids at positions 171 to 183, a region consisting of amino acids at positions 109 to 120, and a portion comprising such a region. An anti-hTROP-2 antibody, which recognizes the above-described regions (binds to the above-described regions or portions comprising such regions), has high internalization activity into tumor cells, for example, and thus it is extremely useful as an immunoconjugate as described later.
(3-7) Characteristics of Anti-hTROP-2 Antibody
As described above, the anti-hTROP-2 antibody of the present invention is an antibody having high anti-tumor activity in vivo at a low dose. Specifically, it is preferable that the present anti-hTROP-2 antibody exhibits tumor growth inhibitory activity of 50% or more (preferably 80% or more, more preferably 90% or more, further preferably 95% or more, and particularly preferably almost 100% (for example, 98% or more, or 99% or more)) at a dose (as a naked antibody) of 20 mg/kg body weight or less (preferably 10 mg/kg body weight or less, more preferably 5 mg/kg body weight or less, and further preferably 1 mg/kg body weight or less) with respect to a tumor-bearing animal model.
Herein, the tumor growth inhibitory activity (%) can be calculated, for example, by the following formula: Tumor growth inhibitory activity (%)=100-[(tumor volume or tumor weight of antibody administration group)/(tumor volume or tumor weight of control group)].times.100
In addition, the anti-hTROP-2 antibody of the present invention preferably has anti-tumor activity on two or more types of human tumor cell lines. The type of such a human tumor cell line is not limited. For example, such human tumor cell lines are at least two types selected from the group consisting of various types of human pancreatic cancer cell lines, human prostate cancer cell lines, human colorectal cancer cell lines, human breast cancer cell lines, human ovarian cancer cell lines, human lung cancer cell lines and human bile duct cancer cell lines. Specifically, preferred examples of such human tumor cell lines include at least two types selected from the group consisting of a human pancreatic cancer cell line PK-59, a human pancreatic cancer cell line BxPC-3, a human pancreatic cancer cell line KP-3L, a human pancreatic cancer cell line KP-2, a human pancreatic cancer cell line PK-1, a human pancreatic cancer cell line PK-45H, a human pancreatic cancer cell line PK-45P, a human pancreatic cancer cell line TCC-PAN2, a human pancreatic cancer cell line SUIT-2, a human colon cancer cell line CACO-2, a human colon cancer cell line SW480, a human colon cancer cell line DLD-1, a human colon cancer cell line HCT 116, a human breast cancer cell line JIMT-1, a human breast cancer cell line HCC1143, a human breast cancer cell line MCF-7, a human breast cancer cell line MDA-MB-468, a human prostate cancer cell line DU145, a human prostate cancer cell line PC-3, a human ovarian cancer cell line SK-OV-3, a human lung cancer cell line Calu-3 and a human bile duct cancer cell line TFK-1. Of these, as the above-described two or more types of human tumor cell lines, at least two types selected from the group consisting of the human pancreatic cancer cell line PK-59, the human pancreatic cancer cell line BxPC-3, the human colon cancer cell line SW480, the human lung cancer cell line Calu-3, the human breast cancer cell line MDA-MB-468 and the human ovarian cancer cell line SK-OV-3 are more preferable.
Moreover, the anti-hTROP-2 antibody of the present invention has a dissociation constant (Kd value) of preferably 1.0.times.10.sup.-10 M or less, more preferably 1.0.times.10.sup.-11 M or less, and further preferably 1.0.times.10.sup.-12 M or less. Herein, the binding ability (affinity) of the antibody can be measured in the form of a dissociation constant (Kd value), a dissociation rate constant (Kdiss [1/Sec]) or an association rate constant (Kass [1/M.Sec]), for example, by Scatchard analysis or surface plasmon resonance sensor called Biacore. As such Biacore apparatuses, Biacore 3000, Biacore 2000, Biacore X, Biacore J and Biacore Q (all of which were manufactured by Biacore) may be used, for example. It is preferable that the antibody have a dissociation constant (Kd value) that is as small as possible because it could have high binding ability (affinity). The Kd value is determined based on the two parameters of Kdiss and Kass, and it can be expressed in the formula: Kd[M]=Kdiss/Kass. As a method of calculating the Kd value, the method described in the Examples as described later (specifically, Example 10) can be preferably adopted.
(4) Genetically Recombinant Antibody and Antibody Fragment
(4-1) Genetically Recombinant Antibody
In a preferred embodiment of the anti-hTROP-2 antibody of the present invention, there is provided a genetically recombinant antibody. The type of such a genetically recombinant antibody is not limited. Examples include a chimeric antibody, a humanized antibody, and a human antibody.
A chimeric antibody (that is, a humanized chimeric antibody) is an antibody formed by ligating (conjugating) the variable region of a mouse-derived antibody to the constant region of a human-derived antibody (please refer to Proc. Natl. Acad. Sci. U.S.A. 81, 6851-6855, (1984), etc.). When such a chimeric antibody is produced, the thus ligated antibody can be easily constructed by a genetic recombination technique.
When a humanized antibody is produced, a complementarity determining region (CDR) is transplanted from the variable region of a mouse antibody into the variable region of a human antibody, so as to produce a reconstructed variable region, in which a framework region (FR) is derived from the human and CDR is derived from the mouse (what is called CDR grafting (CDR transplantation)). Subsequently, the thus humanized, reconstructed human variable region is ligated to a human constant region. Such a method for producing a humanized antibody is well known in the present technical field (please refer to see Nature, 321, 522-525 (1986); J. Mol. Biol., 196, 901-917 (1987); Queen C et al., Proc. Natl. Acad. Sci. USA, 86: 10029-10033 (1989); J P Patent Publication (Kohyo) No. 4-502408 A (1992) (Japanese Patent No. 2828340; Queen et al.), etc.).
Herein, the type of a CDR sequence derived from the mouse, which can be used in the humanized anti-hTROP-2 antibody of the present invention, is not particularly limited. For example, the amino acid sequences shown in SEQ ID NOS: 36 to 38 or the amino acid sequences shown in SEQ ID NO: 66 to 68 are preferably used as the CDR 1 to 3 of the H chain V region (VH), respectively. The amino acid sequences shown in SEQ ID NOS: 41 to 43 or the amino acid sequences shown in SEQ ID NO: 71 to 73 are preferably used as the CDR 1 to 3 of the L chain V region (VL), respectively.
In addition, preferred examples of the amino acid sequence of an H chain V region in a humanized reconstructed human variable region include: the amino acid sequence shown in SEQ ID NO: 92 (comprising CDR 1 to 3 consisting of the amino acid sequences shown in SEQ ID NOS: 36 to 38; the amino acid sequence further comprising a signal peptide is shown in SEQ ID NO: 75); the amino acid sequence shown in SEQ ID NO: 98 (comprising CDR 1 to 3 consisting of the amino acid sequences shown in SEQ ID NOS: 36 to 38; the amino acid sequence further comprising a signal peptide is shown in SEQ ID NO: 97); the amino acid sequence shown in SEQ ID NO: 94 (comprising CDR 1 to 3 consisting of the amino acid sequences shown in SEQ ID NOS: 66 to 68; the amino acid sequence further comprising a signal peptide is shown in SEQ ID NO: 79); and the amino acid sequence shown in SEQ ID NO: 95 (comprising CDR 1 to 3 consisting of the amino acid sequences shown in SEQ ID NOS: 66 to 68; the amino acid sequence further comprising a signal peptide is shown in SEQ ID NO: 81). Herein, the above-mentioned amino acid sequence of the H chain V region shown in SEQ ID NO: 98 is a modified amino acid sequence in which the arginine (R) at position 44 of the above-mentioned amino acid sequence of the H chain V region shown in SEQ ID NO: 92 is substituted with a glycine (G).
Likewise, preferred examples of the amino acid sequence of an L chain V region in a humanized reconstructed human variable region include: the amino acid sequence shown in SEQ ID NO: 93 (comprising CDR 1 to 3 consisting of the amino acid sequences shown in SEQ ID NOS: 41 to 43; and the amino acid sequence further comprising a signal peptide is shown in SEQ ID NO: 77); and the amino acid sequence shown in SEQ ID NO: 96 (comprising CDR 1 to 3 consisting of the amino acid sequences shown in SEQ ID NOS: 71 to 73; the amino acid sequence further comprising a signal peptide is shown in SEQ ID NO: 83).
Herein, preferred examples of the humanized anti-hTROP-2 antibody of the present invention include: (i) a humanized anti-hTROP-2 antibody, in which the amino acid sequence of the H chain V region is shown in SEQ ID NO: 92 and the amino acid sequence of the L chain V region is shown in SEQ ID NO: 93; and (ii) a humanized anti-hTROP-2 antibody, in which the amino acid sequence of the H chain V region is shown in SEQ ID NO: 98 and the amino acid sequence of the L chain V region is shown in SEQ ID NO: 93. In particular, the humanized anti-hTROP-2 antibody described in (ii) above, in which the amino acid sequence of the H chain V region is shown in SEQ ID NO: 98, has an improved avidity (that is flexibility of the movement of two antigen-binding arms) and has high antigen-binding activity, and thus, this antibody is particularly preferable.
Also, other preferred examples of the humanized anti-hTROP-2 antibody of the present invention include: (iii) a humanized anti-hTROP-2 antibody, in which the amino acid sequence of the H chain V region is shown in SEQ ID NO: 94 and the amino acid sequence of the L chain V region is shown in SEQ ID NO: 96; and (ii) a humanized anti-hTROP-2 antibody, in which the amino acid sequence of the H chain V region is shown in SEQ ID NO: 95 and the amino acid sequence of the L chain V region is shown in SEQ ID NO: 96.
In general, in the case of a human antibody (a complete human antibody), its structure comprising a Hyper Variable region that is the antigen-binding site of a V region, other parts of the V region, and a constant region is the same as the structure of the antibody of a human. However, such a Hyper Variable site may also be derived from other animals. A technique of producing a human antibody is publicly known, and a method for producing gene sequences that are common in humans by genetic engineering has been established. A human antibody can be obtained, for example, by a method using a human antibody-producing mouse that has human chromosomal fragments comprising the genes of the H chain and L chain of the human antibody (please refer to Tomizuka, K. et al., Nature Genetics, (1977) 16, 133-143; Kuroiwa, Y. et. al., Nuc. Acids Res., (1998) 26, 3447-3448; Yoshida, H. et. al., Animal Cell Technology: Basic and Applied Aspects, (1999) 10, 69-73 (Kitagawa, Y., Matsuda, T. and Iijima, S. eds.), Kluwer Academic Publishers; Tomizuka, K. et. al., Proc. Natl. Acad. Sci. USA, (2000) 97, 722-727, etc.), or by a method of obtaining a phage display-derived human antibody selected from a human antibody library (please refer to Wormstone, I. M. et. al, Investigative Ophthalmology & Visual Science., (2002) 43 (7), 2301-8; Carmen, S. et. al., Briefings in Functional Genomics and Proteomics, (2002) 1 (2), 189-203; Siriwardena, D. et. al., Opthalmology, (2002) 109 (3), 427-431, etc.).
In the case of the aforementioned chimeric antibody, humanized antibody and human antibody, the N-glycoside-linked sugar chain in the antibody Fc region is preferably a sugar chain, in which fucose does not bind to N-acetylglucosamine at the reducing terminal thereof. A specific example is an antibody consisting of genetically recombinant antibody molecules, which has, in the Fc region of the antibody molecules, a sugar chain in which the position 1 of the fucose does not bind to the position 6 of the N-acetylglucosamine at the reducing terminal of the N-glycoside-linked sugar chain via an a bond. Such an antibody is able to significantly improve ADCC activity. This point (the characteristics of the N-glycoside-linked sugar chain in the antibody Fc region) is preferable also for the aforementioned polyclonal antibody and monoclonal antibody.
(4-2) Antibody Fragment
The anti-hTROP-2 antibody fragment (partial fragment) of the present invention is included in the antibody of the present invention. Herein, the antibody fragment of the present invention has binding activity to hTROP-2 (namely, it is able to bind to hTROP-2) and also has anti-tumor activity in vivo, as in the case of the anti-hTROP-2 antibody of the present invention.
The fragment of the antibody means a region of a portion of an anti-hTROP-2 polyclonal antibody or anti-hTROP-2 monoclonal antibody (namely, an antibody fragment derived from the anti-hTROP-2 antibody of the present invention). Examples of such an antibody fragment include peptides comprising, as at least a portion thereof, Fab, Fab', F(ab').sub.2, Fv (variable fragment of antibody), a single-stranded antibody (an H chain, an L chain, an H chain V region, and an L chain V region, etc.), scFv, diabody (scFv dimer), dsFv (a disulfide-stabilized V region), and a complementarity determining region (CDR).
Fab is an antibody fragment with a molecular weight of approximately 50,000 having antigen-binding activity, which is formed by binding about a half on the N-terminal side of the H chain to the entire L chain via a disulfide bond, among fragments obtained by treating antibody molecules with a protease, papain. In addition, it is also possible to produce such Fab by inserting DNA encoding the Fab of an antibody into a prokaryote expression vector or a eukaryote expression vector, and then introducing the vector into a prokaryote or a eukaryote so as to allow the DNA to express therein.
F(ab').sub.2 is an antibody fragment with a molecular weight of approximately 100,000 having antigen-binding activity, whose size is slightly greater than Fab that binds to Fab via disulfide bond in the hinge region, among fragments obtained by treating antibody molecules with a protease, pepsin. In addition, it is also possible to produce such F(ab').sub.2 by the thioether bond or disulfide bond of Fab, as described later.
Fab' is an antibody fragment with a molecular weight of approximately 50,000 having antigen-binding activity, which is formed by cleaving the disulfide bond in the hinge region of the aforementioned F(ab').sub.2. In addition, it is also possible to produce such Fab' by inserting DNA encoding the Fab' fragment of an antibody into a prokaryote expression vector or a eukaryote expression vector, and then introducing the vector into a prokaryote or a eukaryote so as to allow the DNA to express therein.
scFv is an antibody fragment having antigen-binding activity, which is a VH-P-VL or VL-P-VH polypeptide formed by ligating a single H chain V region (VH) to a single L chain V region (VL) using a suitable peptide linker (P). Such scFv can be produced by obtaining cDNA encoding the VH and VL of an antibody, constructing DNA encoding scFv, inserting the DNA into a prokaryote expression vector or a eukaryote expression vector, and then introducing the vector into a prokaryote or a eukaryote so as to allow the DNA to express therein.
Diabody is an antibody fragment formed by dimerization of scFv, which has divalent antigen-binding activities. Such divalent antigen-binding activities may be identical to each other, or they may also be different from each other. Such diabody can be produced by obtaining cDNA encoding the VH and VL of an antibody, constructing DNA encoding scFv such that the length of the amino acid sequence of P is 8 residues or less, inserting the DNA into a prokaryote expression vector or a eukaryote expression vector, and then introducing the vector into a prokaryote or a eukaryote so as to allow the DNA to express therein.
dsFv is an antibody fragment formed by binding polypeptides, in which one amino acid residue in each of VH and VL has been substituted with a cysteine residue, to each other via a disulfide bond between the cysteine residues. The amino acid residue to be substituted with cysteine residues can be selected based on estimation of the three-dimensional structure of the antibody according to the method of Reiter et al. (Protein Engineering, 7, 697-704, 1994). Such dsFv can be produced by obtaining cDNA encoding the VH and VL of an antibody, constructing DNA encoding dsFv, inserting the DNA into a prokaryote expression vector or a eukaryote expression vector, and then introducing the vector into a prokaryote or a eukaryote so as to allow the DNA to express therein.
A peptide comprising a CDR comprises at least one region of CDRs of VH (CDR 1 to 3) and CDRs of VL (CDR 1 to 3). More preferred examples of such a peptide include a peptide comprising all of the CDRs of VH and a peptide comprising all of the CDRs of VL. A particularly preferred example of the peptide is a peptide comprising all of the CDRs of VH and VL (total 6 regions). Preferred examples of the amino acid sequence of such a CDR include the amino acid sequences shown in SEQ ID NOS: 36 to 38, 41 to 43, 46 to 48, 51 to 53, 56 to 58, 61 to 63, 66 to 68, and 71 to 73, as described above. A peptide comprising multiple CDRs can be bound to one another, directly or via a suitable peptide linker. Such a peptide comprising CDR can be produced by constructing DNA encoding the VH and VL of an antibody, inserting the DNA into a prokaryote expression vector or a eukaryote expression vector, and then introducing the expression vector into a prokaryote or a eukaryote so as to allow the DNA to express therein. Moreover, such a peptide comprising CDR can also be produced by chemical synthesis methods such as a Fmoc method (a fluorenylmethyloxycarbonyl method) and a tBoc method (a t-butyloxycarbonyl method).
The antibody fragment of the present invention, as is, may be an antibody fragment, which comprises a part of or the entire antibody Fc region in which fucose does not bind to N-acetylglucosamine at the reducing terminal of an N-glycoside-linked sugar chain. Otherwise, the antibody fragment of the present invention may also be a fusion protein, in which the aforementioned antibody fragment is fused with a part of or the entire antibody Fc region in which fucose does not bind to N-acetylglucosamine at the reducing terminal of an N-glycoside-linked sugar chain. Such an antibody fragment is able to significantly improve ADCC activity, and thus it is preferable.
Hereinafter, in the descriptions of the present specification, the aforementioned antibody fragments are also included in the anti-hTROP-2 antibody of the present invention.
3. Polynucleotide, Recombinant Vector and Transformant
In the present invention, a polynucleotide (a gene, DNA) encoding the above-described anti-hTROP-2 antibody of the present invention or an antibody fragment thereof can also be provided. Specifically, the present polynucleotide is preferably a polynucleotide which comprises a nucleotide sequence encoding each amino acid sequence exemplified as the above-described anti-hTROP-2 antibody of the present invention or an antibody fragment thereof. Moreover, the polynucleotide of the present invention may be either a polynucleotide consisting of a polynucleotide alone encoding the anti-hTROP-2 antibody of the present invention or an antibody fragment thereof, or a polynucleotide which comprises the present polynucleotide as a portion thereof and also comprises known nucleotide sequences necessary for gene expression (e.g. a transcriptional promoter, an SD sequence, a Kozak sequence, a terminator, etc.). Thus, the type of the present polynucleotide is not limited.
With regard to the polynucleotide encoding the anti-hTROP-2 antibody of the present invention or an antibody fragment thereof, the codon corresponding to individual amino acids after translation is not particularly limited. The polynucleotide may comprise nucleotide DNA showing a codon commonly used in mammals such as a human (preferably, a frequently-used codon), or may also comprise nucleotide DNA showing a codon commonly used in microorganisms such as Escherichia coli or yeast, plants and the like (preferably, a frequently-used codon).
In the present invention, a recombinant vector comprising the above-described polynucleotide of the present invention, or a transformant comprising the recombinant vector, can also be provided.
A transcriptional promoter, an SD sequence (in a case in which the host is a prokaryotic cell) and a Kozak sequence (in a case in which the host is a eukaryotic cell) may previously be ligated to the upstream of a polynucleotide (a gene, DNA) to be incorporated into an expression vector used as a recombinant vector. Moreover, a terminator may be ligated to the downstream of the polynucleotide. Furthermore, an enhancer, a splicing signal, a poly(A) additional signal, a selective marker and the like may also be ligated to the polynucleotide. Individual elements necessary for gene expression, such as the above-described transcriptional promoter, may be comprised in the present polynucleotide from the beginning. When these elements are originally comprised in an expression vector, they may be used. Thus, the usage of individual elements is not particularly limited.
As methods of incorporating the present polynucleotide into an expression vector, various types of methods utilizing known genetic recombination techniques, such as a method using restriction enzymes or a method using topoisomerase, can be adopted. The type of an expression vector is not limited, as long as it is able to retain a polynucleotide (a gene, DNA) encoding the anti-hTROP-2 antibody of the present invention or an antibody fragment thereof, and a vector suitable for host cells to be used can be selected, as appropriate, and can be used. Examples of such an expression vector include plasmid DNA, bacteriophage DNA, retrotransposon DNA, a retrovirus vector and artificial chromosomal DNA.
Subsequently, the thus constructed recombinant vector is introduced into a host to obtain a transformant, and the obtained transformant is then cultured, so that the anti-hTROP-2 antibody of the present invention or an antibody fragment thereof can be expressed. It is to be noted that the term "transformant" is used in the present invention to mean a host into which a foreign gene has been introduced. Examples of such a transformant include: a host into which a foreign gene has been introduced by introduction of plasmid DNA or the like (transformation); and a host into which a foreign gene has been introduced by infecting the host with various types of viruses and phages (transduction).
The type of a host is not limited, as long as it is able to express the anti-hTROP-2 antibody of the present invention or an antibody fragment thereof, after the above-described recombinant vector has been introduced into the host. Thus, a host can be selected, as appropriate. Examples of such a host include known hosts such as various types of animal cells such as a human or a mouse, and various types of plant cells, bacteria, yeasts and plant cells.
When animal cells are used as host cells, examples of such animal cells include: human fibroblasts, human embryonic kidney cells, HEK293 cells, 293F cells, CHO cells, monkey COS-7 cells, Vero, mouse L cells, rat GH3 and human FL cells. Moreover, insect cells such as Sf9 cells or Sf21 cells may also be used as host cells.
When bacteria are used as hosts, examples of such bacteria include Escherichia coli and Bacillus subtilis.
When yeast is used as a host, examples of such yeast include Saccharomyces cerevisiae and Schizosaccharomyces pombe.
When plant cells are used as host cells, tobacco BY-2 cells are used for example.
The method of obtaining a transformant is not limited, and it can be selected, as appropriate, while taking into consideration a combination of the type of a host and the type of an expression vector. Preferred examples of the method of obtaining a transformant include electroporation, lipofection, a heat shock method, PEG, a calcium phosphate method, a DEAE dextran method, and a method of infecting a host with various types of viruses such as DNA virus or RNA virus.
In the obtained transformant, the codon type of a polynucleotide contained in a recombinant vector comprised may be identical to or different from the codon type of a host used. Thus, the codon type is not limited.
4. Preparation of Antibody-Drug Conjugate
As an immunoconjugate prepared using the aforementioned anti-hTROP-2 antibody of the present invention, there can be provided an antibody-drug conjugate, which comprises the aforementioned antibody and a substance (a compound, etc.) having anti-tumor activity and/or cell-killing activity. It is to be noted that a conjugate formed by previously preparing each of the aforementioned antibody molecule and the aforementioned substance having anti-tumor activity and/or cell-killing activity, separately, and then combining them, is generally referred to as an immunoconjugate. On the other hand, a conjugate obtained by ligating a protein toxin used as such a substance having anti-tumor activity and/or cell-killing activity to an antibody gene on a gene according to a genetic recombination technique, so as to allow it to express as a single protein (a fusion protein), is generally referred to as an immunotoxin.
Examples of a substance having anti-tumor activity include doxorubicin, calicheamicin, mitomycin C, Auristatin E and radioactive isotope (RI). Examples of a substance having cell-killing activity include saporin, lysine, pseudomonas exotoxin, diphtheria toxin and radioactive isotope (RI). Of these, saporin and pseudomonas exotoxin are preferably used. The type of RI having anti-tumor activity and/or cell-killing activity is not particularly limited, and examples of such RI include .sup.90Y, .sup.111In, .sup.125I, .sup.3H, .sup.35S, .sup.14C, .sup.186Re, .sup.188Re, .sup.189Re, .sup.177Lu, .sup.67Cu, .sup.212Bi, .sup.213Bi, .sup.211At, .sup.198Au, .sup.224Ac, .sup.126I, .sup.133I, .sup.77Br, .sup.113mIn, .sup.95Ru, .sup.97Ru, .sup.103Ru, .sup.105Ru, .sup.107Hg, .sup.203Hg, .sup.94mTc, .sup.121mTe, .sup.122mTe, .sup.125mTe, .sup.165Tm, .sup.167Tm, .sup.168Tm, .sup.111Ag, .sup.197Pt, .sup.109Pd, .sup.32P, .sup.33P, .sup.47Sc, .sup.153Sm, .sup.177Lu, .sup.105Rh, .sup.142Pr, .sup.143Pr, .sup.161Tb, .sup.166Ho, .sup.199Au, .sup.57Co, .sup.58Co, .sup.51Cr, .sup.59Fe, .sup.18F, .sup.75Se, .sup.201Tl, .sup.225Ac, .sup.76Br, .sup.86Y, .sup.169Yb, .sup.166Dy, .sup.212Pb and .sup.223Ra.
A method for producing an antibody-drug conjugate is not limited. For example, a method of coupling an antibody with a drug via a disulfide bond or a hydrazone bond is applied.
The aforementioned anti-hTROP-2 antibody of the present invention is excellent in terms of internalization activity into target tumor cells that express hTROP-2. Thus, by previously combining a substance having anti-tumor activity and cell-killing activity with the anti-hTROP-2 antibody, it becomes possible to allow such a substance to directly and highly selectively act on the tumor cells. The antibody-drug conjugate of the present invention is extremely excellent in terms of ability to deliver the agent to the target tumor cells.
The internalization activity into cells can be evaluated by fluorescently labeling an antibody with rhodamine or the like and then observing the migratory behavior and localization of the antibody using a fluorescence microscope or the like.
Moreover, in the present invention, in addition to the aforementioned antibody-drug conjugate, there can also be provided an antibody fragment-drug conjugate, in which the aforementioned antibody fragment is used instead of an antibody. With regard to the details of such an antibody fragment-drug conjugate, the descriptions of the aforementioned antibody-drug conjugate can be applied, as appropriate.
Hereinafter, in the descriptions of the present specification, such an antibody fragment-drug conjugate is also included in the antibody-drug conjugate of the present invention.
5. Pharmaceutical Composition
The anti-hTROP-2 antibody and antibody-drug conjugate of the present invention are useful as active ingredients contained in a pharmaceutical composition.
The pharmaceutical composition is useful as a pharmaceutical composition for treating and/or diagnosing a tumor. In particular, since the anti-hTROP-2 antibody of the present invention and an antibody-drug conjugate comprising the aforementioned antibody have excellent tumor growth inhibitory activity as such anti-tumor activity, they are preferably used in the treatment of tumor. That is to say, the anti-hTROP-2 antibody and antibody-drug conjugate of the present invention are useful as active ingredients contained in a tumor therapeutic agent and a tumor diagnostic agent. It is to be noted that the above-described treatment of tumor includes inhibition of tumor growth and suppression of tumor growth. Specifically, if it is a tumor therapeutic agent, examples of the tumor therapeutic agent include a tumor growth inhibitor and a tumor growth suppressor.
It is preferable to provide the pharmaceutical composition of the present invention in the form of a pharmaceutical composition comprising the anti-hTROP-2 antibody and/or antibody-drug conjugate of the present invention as active ingredient(s), and further comprising a pharmacologically acceptable carrier. In addition, the pharmaceutical composition of the present invention can be used in combination with known anti-tumor agents. By such a combined use, a higher anti-tumor effect can be obtained.
Target diseases (tumors), to which the pharmaceutical composition of the present invention is applied, include: the aforementioned various types of known human tumors, in which the expression of hTROP-2 has previously been confirmed. Among others, one or two or more types selected from various types of human tumors such as human pancreatic cancer, human prostate cancer, human colorectal cancer, human breast cancer, human ovarian cancer, human lung cancer and human bile duct cancer are particularly preferable. Such target disease may be a single disease, or two or more diseases may be developed in combination. Moreover, the target tumor may be a recurrent cancer or a metastatic cancer. The pharmaceutical composition of the present invention (further, the anti-hTROP-2 antibody and/or antibody-drug conjugate of the present invention) can be effectively used as a therapeutic agent and a diagnostic agent for a recurrent cancer or a metastatic cancer.
Examples of the "pharmacologically acceptable carrier" include an excipient, a diluent, an extender, a disintegrator, a stabilizer, a preservative, a buffer, an emulsifier, an aromatic, a coloring agent, a sweetener, a thickener, a corrigent, a solubilizer and other additives. Using one or more types of such carriers, a pharmaceutical composition can be prepared in the form of an injection, a liquid agent, a capsule, a suspension, an emulsion, a syrup, etc. These pharmaceutical compositions can be administered orally or parenterally. Another form for parenteral administration is, for example, an injection comprising one or more active ingredients, which is prepared by an ordinary method. Such an injection can be produced by dissolving or suspending the present antibody in a pharmacologically acceptable carrier such as a normal saline solution or a commercially available distilled water used for injection.
In particular, when an antibody fragment derived from the anti-hTROP-2 antibody of the present invention (particularly, an antibody fragment with a low molecular weight) is administered into a living body, a colloidal dispersion system can be used in addition to the aforementioned components. Such a colloidal dispersion system is anticipated to have an effect of enhancing the stability of a compound (an antibody fragment) in a living body or an effect of efficiently transporting such a compound to a specific organ, tissue, or cell. The type of such a colloidal dispersion system is not limited, as long as it is commonly used. Examples of such a colloidal dispersion system include dispersion systems comprising, as bases, polyethylene glycol, a macromolecular conjugate, a macromolecular aggregate, a nanocapsule, microsphere, beads, and lipids including an oil in water emulsifier, micelle, mixed micelle and liposome. Preferred examples of such a colloidal dispersion system include multiple liposomes and the vesicles of artificial membrane, which have an effect of efficiently transporting such a compound to a specific organ, tissue, or cell (Mannino et al., Biotechniques, 1988, 6, 682; Blume and Cevc, Biochem. et Biophys. Acta, 1990, 1029, 91; Lappalainen et al., Antiviral Res., 1994, 23, 119; Chonn and Cullis, Current Op. Biotech., 1995, 6, 698).
The dosage of the pharmaceutical composition of the present invention differs depending on the age, sex, body weight and symptoms of a patient, therapeutic effects, an administration method, a treatment time, the types of the anti-hTROP-2 antibody and antibody-drug conjugate of the present invention contained in the pharmaceutical composition, etc. In general, the present pharmaceutical composition may be administered within the range between 600 .mu.g and 6,000 mg per adult per administration. However, the dose is not limited to the aforementioned range.
In a case in which the pharmaceutical composition is administered in the form of an injection, for example, it may be administered at a dosage of 100 .mu.g to 100 mg, per administration, per body weight of a human patient, once or divided over several administrations, as an average daily dose. Preferably, the pharmaceutical composition may be administered once every three days, once a week, once every ten days, or once every two weeks, or by a single administration (wherein the total number of administrations is 1). Examples of the dosage form include intravenous injection, subcutaneous injection, intradermal injection, intramuscular injection and intraperitoneal injection. Of these, intravenous injection is preferable. In addition, such an injection may be prepared in the form of a nonaqueous diluent (e.g. polyethylene glycol, vegetable oil such as olive oil, alcohols such as ethanol, etc.), a suspension, or an emulsion. Such an injection can be sterilized by mechanical sterilization using a filter, the mixing of a microbicide, etc. The injection can be produced in the form of an injection to be prepared before using. That is, a sterilized solid composition is prepared by a freeze-drying method or the like, and the composition is then dissolved in sterilized distilled water used for injection or other solvents before it is used, so that it can be then used.
The present invention provides a use of the aforementioned anti-hTROP-2 antibody and/or antibody-drug conjugate of the present invention in the production of a pharmaceutical agent (a drug) for treating and/or diagnosing a tumor. In addition, the present invention provides the aforementioned anti-hTROP-2 antibody and/or antibody-drug conjugate of the present invention, which are used for treating and/or diagnosing a tumor.
Moreover, the present invention provides a method for treating and/or diagnosing a tumor, which is characterized in that it comprises using (namely, administering to patients) the aforementioned anti-hTROP-2 antibody and/or antibody-drug conjugate of the present invention. Furthermore, the present invention also provides the use of the aforementioned anti-hTROP-2 antibody and/or antibody-drug conjugate of the present invention in the treatment and/or diagnosis of tumor.
6. Method for Detecting Tumor
The method for detecting a tumor of the present invention is characterized in that it comprises allowing the aforementioned anti-hTROP-2 antibody of the present invention to react with a sample collected from a living body (hereinafter referred to as a biological sample), and detecting a signal(s) of the reacted antibody.
As described above, hTROP-2 has been confirmed to be specifically expressed in various types of tumor cells. Thus, hTROP-2, and particularly, free hTROP-2 (an extracellular region portion of hTROP-2) can be used as a marker for various types of tumors. In particular, such hTROP-2 can be preferably used as a marker for human pancreatic cancer, human prostate cancer, human colorectal cancer and human breast cancer.
Hence, the anti-hTROP-2 antibody of the present invention is allowed to react with a biological sample, and a signal of the reacted antibody is then detected, so as to detect a tumor. The obtained antibody signal can be used as an indicator of the amount of an antigen in the biological sample (that is, an hTROP-2 amount or a free hTROP-2 amount). In detection of a tumor using the antibody of the present invention, first, a biological sample collected as an analyte from a subject, such as a tissue section or blood used as a test target, is allowed to bind to the antibody of the present invention by an antigen-antibody reaction. Subsequently, based on the measurement results of the amount of the bound antibody, the amount of an antigen of interest contained in the biological sample is measured. This measurement may be carried out in accordance with known immunoassay methods. For example, an immunoprecipitation method, an immunoagglutination method, radioimmunoassay, immunonephelometry, a Western blot method, flow cytometry and the like can be used. In radioimmunoassay, a labeled antibody is used, and thus an antibody signal is expressed as the amount of the labeled antibody that is directly detected. Otherwise, an antibody whose concentration or antibody titer has been known may be used as a standard solution, and thus a signal of the target antibody may be expressed as a relative value. That is, both the standard solution and the analyte may be measured using a measurement device, and an antibody signal in a biological sample may be expressed as a value relative to the value of the standard solution used as a criterion. Examples of such radioimmunoassay include the ELISA method, the EI method, the RIA method, fluorescence immunoassay (FIA), and luminescence immunoassay. Of these, the ELISA method is particularly preferable in that it is simple and highly sensitive.
In the present invention, the state of a tumor can be evaluated or diagnosed, using the detection result obtained by the aforementioned detection method as an indicator. For example, when the detection result exceeds a predetermined standard value, the state of a tumor is defined as tumor positive, and when the detection result is less than the predetermined standard value, it is defined as tumor negative. In the case of tumor positive, it is determined that a certain type of tumor could have been developed, and thus the tumor state can be evaluated. The term "the state of a tumor" is used herein to mean the presence or absence of the development of a tumor, or the progression degree thereof. Thus, specific examples of the state of a tumor include the presence or absence of the development of a tumor, the progression degree thereof, the degree of malignancy, the presence or absence of metastasis, and the presence or absence of recurrence.
In the aforementioned evaluation, as a state of a tumor to be evaluated, only one state may be selected from the aforementioned examples, or multiple examples may be combined and selected. The presence or absence of a tumor can be evaluated by determining whether or not the tumor has been developed, with reference to the predetermined standard value used as a boundary, based on the obtained detection result. The degree of malignancy is used as an indicator that indicates the progression degree of a cancer. Based on the detection result, the target tumor can be classified into a certain disease stage and it can be evaluated. Otherwise, an early cancer and an advanced cancer can be distinguished from each other, and then they can be evaluated. For example, it is also possible to determine the target tumor as an early cancer or an advanced cancer, using the detection result as an indicator. The metastasis of tumor can be evaluated by determining whether or not neoplasm has appeared at a site apart from the position of the initial lesion, using the detection result as an indicator. The recurrence can be evaluated by determining whether or not the detection result has exceeded the predetermined standard value again after interval stage or remission.
7. Kit for Detecting or Diagnosing Tumor
The anti-hTROP-2 antibody of the present invention can be provided in the form of a kit for detecting or diagnosing a tumor. The kit of the present invention comprises a labeling substance, a solid-phase reagent on which the antibody or the labeled antibody has been immobilized, etc., as well as the aforementioned antibody. A labeling substance that labels the antibody means a substance labeled with an enzyme, a radioisotope, a fluorescent compound, a chemiluminescent compound, etc. The kit of the present invention may also comprise other reagents used for carrying out the detection of the present invention, in addition to the aforementioned constitutional elements. For example, when such a labeling substance is an enzyme labeling substance, the kit of the present invention may comprise an enzyme substrate (a chromogenic substrate, etc.), an enzyme substrate-solving solution, an enzyme reaction stop solution, a diluent used for analytes, etc. Moreover, the present kit may further comprise various types of buffers, sterilized water, various types of cell culture vessels, various types of reactors (an Eppendorf tube, etc.), a blocking agent (a serum component such as bovine serum albumin (BSA), skim milk, or goat serum), a washing agent, a surfactant, various types of plates, an antiseptic such as sodium azide, an experimental operation manual (instruction), etc.
The kit of the present invention can be effectively used to carry out the aforementioned detection method of the present invention, and thus it is extremely useful.
Hereinafter, the present invention will be more specifically described in the following examples. However, these examples are not intended to limit the scope of the present invention.
Example 1
[Cloning of hTROP-2 Gene]
A full-length hTROP-2 gene was isolated from human fetal liver (10-week-old embryo) according to an RT-PCR method. First, the following PCR primers were designed based on the sequence of an hTROP-2 gene (Genbank accession No. NM_002353).
Forward primer: 5'-ttcctccgccccaccatggc-3' (SEQ ID NO: 3)
Reverse primer: 5'-ctcgagcaagctcggttcctttctc-3' (SEQ ID NO: 4)
When these primers were designed, a XhoI restriction enzyme-digested sequence except for a stop codon was added to the reverse primer. cDNA was synthesized from total RNA (TAKARA) prepared from human fetal liver (10-week-old embryo). Using this cDNA as a template, a PCR reaction was carried out with the aforementioned primers. Thereafter, development by agarose gel electrophoresis and extraction of a band of interest were carried out, and it was then cloned into a pCRII vector (Invitrogen) (pCRII-hTROP-2). The cloned hTROP-2 cDNA was confirmed by sequencing.
An expression vector was constructed by cleaving a EcoRI/XhoI fragment comprising an hTROP-2 gene from pCRII-hTROP-2, and then inserting the fragment into the EcoRI/XhoI site of a pcDNA4/myc-His.COPYRGT. A vector (Invitrogen) (pcDNA4-hTROP-2-myc/His). Moreover, a HindIII/PmeI fragment comprising an hTROP-2 gene was cut out of pcDNA4-hTROP-2-myc/His (wherein the HindIII cleavage portion was blunt-ended), and the fragment was then inserted into a PmeI site of a pcDNA3.1(+) vector (Invitrogen), so as to construct an expression vector comprising a neomycin resistance gene (pcDNA3.1-hTROP-2-myc/His).
Example 2
[Construction of Cell Line Capable of Stably Expressing hTROP-2 Gene]
The expression vector (pcDNA3.1-hTROP-2-myc/His) encoding the full-length cDNA of hTROP-2, which had been produced by the above-described method, was introduced into HEK293 cells (RIKEN), HuH-7 cells (HSRRB), 7E2-C cells (described in WO 2005/052156) and CHO-K1 cells (HSRRB), using a lipofectamine 2000 reagent (Invitrogen), and selection was then carried out using an antibiotic G418 (geneticin; GIBCO BRL). Thereafter, a cell line, which stably expressed hTROP-2, was established and obtained.
Example 3
[Production of Recombinant Protein of hTROP-2 Extracellular Region]
A gene fragment encoding a portion of the extracellular region of hTROP-2 (specifically, a region consisting of amino acids at positions 1 to 263 from the amino acid sequence shown in SEQ ID NO: 2) was amplified by a PCR method. The following primers were used in the amplification.
Forward primer: 5'-ttcctccgccccaccatggc-3' (SEQ ID NO: 3)
Reverse primer: 5'-ctcgagctcgtccaggtaatagatgagcg-3' (SEQ ID NO: 5)
In this operation, a XhoI restriction enzyme-digested sequence was added to the reverse primer. The DNA fragment amplified by the PCR method was developed by agarose gel electrophoresis, and it was then purified using QIAquick.RTM. Gel Extraction Kit (QIAGEN.RTM.). The purified DNA fragment was subcloned into a pCR.RTM.-Blunt vector (Invitrogen) (pCRB-hTROP-2 EC), and the gene sequence was confirmed. Subsequently, a EcoRI/XhoI fragment comprising the gene fragment encoding the extracellular region of hTROP-2 was cut out of the pCRB-hTROP-2 EC, and it was then inserted into the EcoRI/XhoI site of a pcDNA4/myc-His.COPYRGT. A vector (Invitrogen) (pcDNA4mH-hTROP-2 EC). Further, in order to produce a NruI restriction enzyme cleavage site, the following oligonucleotides were associated and inserted into the BamHI/EcoRI site of the pcDNA4mH-hTROP-2 EC.
Oligonucleotide 1: 5'-gatccactagtcgcgagtggtgg-3' (SEQ ID NO: 6)
Oligonucleotide 2: 5'-aattccaccactcgcgactagtg-3' (SEQ ID NO: 7)
Likewise, a pBgl II linker (TAKARA) was inserted into the PmeI site of the pcDNA4mH-hTROP-2 EC (pcDNA4mH-NB-hTROP-2 EC). In order to produce a recombinant protein using baculovirus, a NruI/BglII fragment comprising the gene fragment encoding the extracellular region of hTROP-2 was cut out of the pcDNA4mH-NB-hTROP-2 EC, and it was then inserted into the NruI/BglII site of a pPSC8 vector (Nosan Corporation) (pPSC8-hTROP-2 EC). The production of the recombinant protein of the extracellular region of hTROP-2 using baculovirus was delegated to Nosan Corporation.
The recombinant protein of the extracellular region of hTROP-2 was purified as follows. Ni Sepharose 6 Fast Flow (GE Healthcare Biosciences) was added to a culture supernatant comprising the recombinant protein, so that they were allowed to bind to each other at 4.degree. C. for 2 hours. Thereafter, the resultant was washed with a phosphate buffer containing 20 mM imidazole, employing EconoColumn (BIO RAD), and it was then eluted with a phosphate buffer containing 300 mM imidazole, so that it was purified.
Example 4
[Isolation of Human EpCAM cDNA and Construction of Expression Vector]
A full-length human EpCAM gene was isolated from human fetal liver (10-week-old embryo) according to an RT-PCR method. First, the following PCR primers were designed based on the sequence of a human EpCAM gene (Genbank accession No. NM_002354).
Forward primer: 5'-tcctcgtgtcccactcccgg-3' (SEQ ID NO: 8)
Reverse primer: 5'-ctcgagtgcattgagttccctatgc-3' (SEQ ID NO: 9)
When these primers were designed, a XhoI restriction enzyme-digested sequence except for a stop codon was added to the reverse primer. cDNA was synthesized from total RNA (TAKARA) from human fetal liver (10-week-old embryo). Using this cDNA as a template, a PCR reaction was carried out with the aforementioned primers. Thereafter, development by agarose gel electrophoresis and extraction of a band of interest were carried out, and it was then cloned into a pCRII vector (Invitrogen) (pCRII-hEpCAM). The cloned human EpCAM cDNA was confirmed by sequencing.
An expression vector was constructed by cleaving a EcoRI/XhoI fragment comprising a human EpCAM gene from pCRII-hEpCAM, and then inserting the fragment into the EcoRI/XhoI site of a pcDNA4/myc-His.COPYRGT. A vector (Invitrogen) (pcDNA4-hEpCAM-myc/His). Moreover, a HindIII/PmeI fragment comprising a human EpCAM gene was cut out of pcDNA4-hEpCAM-myc/His (wherein the HindIII cleavage portion was blunt-ended), and the fragment was then inserted into the PmeI site of a pcDNA3.1(+) vector (Invitrogen), so as to construct an expression vector comprising a neomycin resistance gene (pcDNA3.1-hEpCAM-myc/His).
Example 5
[Production of Anti-hTROP-2 Monoclonal Antibody]
As immunogens, there were used cell lines capable of stably expressing hTROP-2 (HEK293-hTROP-2 cells, CHO-K1-hTROP-2 cells and 7E2-C-hTROP-2 cells); human pancreatic cancer cell line endogenously expressing an hTROP-2 protein on the cell surface (PK-59, RCB1901; purchased from RIKEN cell bank); and the recombinant protein of the extracellular region of hTROP-2 produced by the above-described method.
In the case of the cell lines capable of stably expressing hTROP-2, 1.times.10.sup.7 cells were used, and in the case of the recombinant hTROP-2 protein, 20 .mu.g of the protein was used. The cell lines or the recombinant protein was mixed with an adjuvant TiterMax Gold (Funakoshi Corporation) at a mixing ratio of 1:1, so as to prepare an emulsion. The emulsion was then injected into the two footpads or abdominal cavity of a mouse (C57/BL6, Balb/c) (initial immunization). When immunization was carried out by injection into the two footpads for a short period of time, booster was carried out three to ten days after the initial immunization. On the day following the final immunization, lymph nodes were collected from both knees, and lymphocytes were then prepared. When immunization was carried out by injection into the abdominal cavity for a long period of time, boosters were carried out at intervals of once a week after the initial immunization (wherein boosters were carried out for 1 to 2 months). Thereafter, B cells were isolated from the spleen according to an ordinary method. In the case of immunization using cells as immunogens, a cell suspension which was PBS containing 5.times.10.sup.6 cells was used for boosters. In the case of using a protein as an immunogen, 5 .mu.g of a PBS solution was used.
The prepared lymphocytes were mixed with a mouse myeloma cell line (P3-X63-Ag8.653) at a mixing ratio of 3:1, and cell fusion was then carried out according to a polyethylene glycol method. Thereafter, the fused cells were cultured for 7 to 28 days in a methyl cellulose medium (trade name: ClonaCell-HY Cloning Medium D; Stem Cell), which contained HAT (hypoxanthine, aminopterin and thymidine). Single colonies of growing hybridomas were each picked up and placed on a 96-well flat-bottom plate, and using a liquid selective medium containing HAT, the hybridomas were cultured in a 5% CO.sub.2 incubator. A culture supernatant of growing hybridomas from single colonies was subjected to a primary screening via Cell ELISA (described later) and then to a secondary screening via FACS analysis using HuH-7-hTROP-2 cells, PK-59, thereby establishing 300 types of hybridomas, which produce anti-hTROP-2 monoclonal antibodies recognizing hTROP-2 proteins expressed on the cell surface of living cells.
Example 6
[Primary Screening Using Cell ELISA]
CHO-K1 cells (hTROP-2 negative control; purchased from Japan Health Sciences Foundation) and CHO-K1-hTROP-2 cells (or HUH-7 cells (hTROP-2 negative control; purchased from Japan Health Sciences Foundation) and HuH-7-hTROP-2 cells) were alternately inoculated on a 96-well culture plate (BD Falcon) at a cell density of 3.times.10.sup.4 cells/well, and the cells were then cultured in a 5% CO.sup.2 atmosphere at 37.degree. C. for 1 to 2 days. The cell culture medium was removed by decantation. Thereafter, the cells were washed with ice-cold PBS, and were then treated with 4% paraformaldehyde-PBS for 5 minutes, so that the cells were immobilized. The cells were washed with PBS which had been cooled on ice, and an ELISA plate was then prepared. Thereafter, ELISA was carried out according to an ordinary method. Specific procedures will be described below.
First, blocking with a 2% skim milk-PBS solution was carried out at room temperature for 30 minutes to 1 hour. Subsequently, the hybridoma culture supernatant was added thereto, and they were then reacted at room temperature for 1 hour. Thereafter, the resultant was washed with a 0.1% TWEEN20 (polyoxyethylenesorbitan monolaurate)-PBS solution three times. As a secondary antibody, Horseradish peroxidase (HRP)-labeled anti-mouse IgG (GE Healthcare Biosciences), which had been 1000 times diluted with a blocking solution, was added to the resultant, and they were then reacted at room temperature for 1 hour. Thereafter, the resultant was washed with a 0.1% TWEEN20-PBS solution three times. A TMB (3,3',5,5'-tetramethylbenzidine: SIGMA) substrate solution was added to the reaction solution to carry out a color reaction, and the reaction was then terminated by adding 1 M sulfuric acid. Thereafter, absorbance (405 nm) was measured using Microplate reader Model 550 (BIO RAD). Hybridomas corresponding to a hybridoma culture supernatant exhibiting a high absorbance value to the negative control were subjected to a large-scale culture on a 24-well flat-bottom plate, and were then subjected to a secondary screening using FACS analysis.
Example 7
[Secondary Screening Using FACS Analysis]
Hybridomas, which were found positive in the above-described primary screening using Cell ELISA, were subjected to a secondary screening using FACS analysis. In the evaluation of Hybridoma cells, HuH-7 cells, which were human liver cancer cells which did not express hTROP-2, were used as negative control cells and the reactivity with HuH-7-hTROP-2 cells, which were stably expressing hTROP-2, was used as an indicator. Then, the evaluation was carried out based on the reactivity with PK-59 cells (RCB1901; purchased from RIKEN cell bank), which were human pancreatic cancer cells endogenously expressing an hTROP-2 protein on the cell surface.
The cells were removed from the culture dish by a trypsin treatment, and a cell suspension was then prepared (cell density: 2.times.10.sup.6 cells/mL). The hybridoma culture supernatant, which exhibited positive in the primary screening using Cell ELISA, was reacted with 100 .mu.L of the cell suspension at 4.degree. C. for 20 minutes. The reaction mixture was washed with PBS, and it was then reacted with PE-labeled mouse IgG (BD Pharmingen) (0.1 .mu.g) (4.degree. C., 30 minutes). Thereafter, the reaction mixture was analyzed using FACSCalibur (Becton, Dickinson and Company).
Eventually, approximately 300 types of hybridomas, which produce an anti-hTROP-2 monoclonal antibody recognizing an hTROP-2 protein expressed on the cell surface of living cells, were established.
Example 8
[Identification of Isotype]
The isotype of the produced anti-hTROP-2 monoclonal antibody was identified using MOUSE MONOCLONAL ANTIBODY ISOTYPING TEST KIT (Serotec) in accordance with a method included with the above-mentioned kit.
Example 9
[Ascites Formation and Purification of TROP-2 Antibody]
The hybridoma clones produced by the above-described method were administered at a density of 3.times.10.sup.6 clones into the abdominal cavity of a BALB/c nude mouse, to which 2,6,10,14-tetramethylpentadecane (pristane) had previously (seven days before) been administered. Two weeks later, ascites was collected. Moreover, this ascites was subjected to caprylic acid precipitation, and then to affinity purification using a protein G column (HiTrap protein G; GE Healthcare Biosciences) or a protein A column (HiTrap protein A; GE Healthcare Biosciences), so as to obtain anti-hTROP-2 monoclonal antibodies from individual hybridoma clones.
Example 10
[Measurement of Antigen Binding Affinity (Measurement of Kd Value)]
The antigen binding affinity (Kd value) of the generated anti-hTROP-2 monoclonal antibody was calculated by a method using ELISA (Djavadi-Ohaniance L. et al (1996), In Antibody Engineering, Chapter 4, pp. 77-97. IRL Press, Oxford).
Specifically, the purified recombinant hTROP-2 protein (0.1 .mu.g/mL) was added to a 96-well culture plate (Corning) so that the plate was coated with the antigen (at room temperature for 1 hour, or at 4.degree. C. overnight). Subsequently, the resultant was washed with PBS three times, and 2% skim milk (PBS solution) was then added thereto to block it (at room temperature for 1 hour). The resultant was washed with PBS twice. Thereafter, an antigen-antibody complex which had previously been formed by mixing an antigen solution (a purified hTROP-2 protein; 50, 25, 12.5, 6.25, or 3.125 nM) with each clone (0.5 nM) of the anti-hTROP-2 monoclonal antibody and then equilibrating the mixture, was added to the above-described ELISA plate, and they were reacted (at room temperature for 1 hour). The reaction product was washed with PBS three times, and it was then reacted with HRP-labeled anti-mouse IgG (final concentration: 1 .mu.g/mL) (GE Healthcare Biosciences) diluted with a blocking solution (at room temperature for 1 hour). Subsequently, the reaction product was washed with a 0.1% TWEEN20-PBS solution three times, and a TMB (3,3',5,5'-tetramethylbenzidine: SIGMA) substrate solution was then added to the resultant to carry out a color reaction. Then, 1 M sulfuric acid was added to the reaction product to terminate the reaction. Using Microplate reader Model 550 (BIO RAD), absorbance was measured.
The following calculation expressions were used to measure dissociation constant (Kd).
In accordance with the law of mass action, an antigen-antibody reaction is represented by the following expressions.
.function..function..times..revreaction..times..times..times..times..time- s..function..times..times..times..times..times..times..times..times..times- . ##EQU00001## In the expression (2), Agf represents the concentration of a free antigen, Abf represents the concentration of a free antibody, and Ag-Ab represents the concentration of an antigen-antibody complex. If Ag-Ab=x, the free antibody concentration is represented by the following expression. Abf=Abt-x (3)
The above expression (2) therefore can be Kd=Agf.times.(Abt-x)/x (4)
If both terms of the expression (4) are multiplied by x/Kd.times.Abt, x/Abt=Agf.times.(1-x/Abt).times.1/Kd x/Abt.times.1/Agf=(1-x/Abt).times.1/Kd (5)
If X=x/Abt and Y=x/Abt.times.Agf in the expression (5), Y=(1-X).times.1/Kd (6)
Based on the expression (6), the Kd value was calculated.
The Kd values of the generated 300 anti-hTROP-2 monoclonal antibody clones were measured by the above-described method. As a result, there were 133 clones exhibiting a Kd value of 1.times.10.sup.-10 (M) or less, 59 clones exhibiting a Kd value of 1.times.10.sup.-11 (M) or less, and 2 clones exhibiting a Kd value of 1.times.10.sup.-12 (M) or less.
Among the anti-hTROP-2 monoclonal antibodies, which exhibited tumor growth inhibitory activity in vivo, the Kd values of K5-70 (mouse IgG2a), T6-16 (mouse IgG2a), K5-107 (mouse IgG1), K5-116-2-1 (mouse IgG2a) and T5-86 (mouse IgG1) were found to be 6.8.times.10.sup.-12 (M), 4.3.times.10.sup.-12 (M), 4.7.times.10.sup.-12 (M), 2.69.times.10.sup.-11 (M) and 8.49.times.10.sup.-11 (M), respectively (FIG. 1 and Table 1).
TABLE-US-00001 TABLE 1 Kd values of anti-hTROP-2 monoclonal antibodies Clone No. K5-70 T6-16 K5-107 K5-116-2-1 T5-86 Kd (.times.10.sup.-12M) 6.8 4.3 4.7 26.9 84.9
Example 11
[Reactivity of Anti-hTROP-2 Monoclonal Antibodies with Human Cancer Cell Lines]
The human cancer cell lines (human tumor cell lines) used in this studies were acquired from Health Science Research Resources Bank (HSRRB), RIKEN cell bank (RIKEN), ATCC (American Type Culture Collection), ECACC (European Collection of Cell Cultures) and DSMZ (German Collection of Microorganisms and Cell Cultures). Specifically, the following cancer cell lines were used.
huH-1 (HSRRB), HUH-6 (HSRRB), HuH-7 (HSRRB), JHH-5 (HSRRB), JHH-6 (HSRRB), JHH-7(HSRRB), HLE (HSRRB), HLF (HSRRB), HepG2 (HSRRB), Alexander (HSRRB), KP-1N (HSRRB), KP-1NL (HSRRB), KP-2 (HSRRB), KP-3 (HSRRB), KP-3L (HSRRB), PK-1 (RIKEN), PANC-1 (RIKEN), MIA PaCa-2 (HSRRB), PK-59 (RIKEN), PK-45H (RIKEN), PK-45P (RIKEN), BxPC-3 (ATCC), SUIT-2 (HSRRB), TCC-PAN2 (HSRRB), SW480 (ATCC), DLD-1 (HSRRB), LoVo (HSRRB), COLO-320 (RIKEN), CACO-2 (RIKEN), CW-2 (RIKEN), HCT 116 (ATCC), HCC-56 (HSRRB), MCF-7 (HSRRB), JIMT-1 (DSMZ), HCC1143 (ATCC), A549 (HSRRB), DU145 (RIKEN) and PC-3 (HSRRB).
Cancer cells were removed from a culture dish by a trypsin treatment, and a cell suspension was then prepared (cell density: 2.times.10.sup.6 cells/mL). An anti-hTROP-2 monoclonal antibody (0.1 .mu.g) was added to 100 .mu.L of the cell suspension, and they were then reacted at 4.degree. C. for 20 minutes. The reaction solution was washed with PBS, and it was then reacted with PE-labeled anti-mouse IgG (BD Biosciences Pharmingen) (0.1 .mu.g) (at 4.degree. C. for 30 minutes). Thereafter, the resultant was analyzed by FACSCalibur (Becton, Dickinson and Company).
All of the generated anti-hTROP-2 antibodies did not bind to a human liver cancer cell line HuH-7, which did not endogenously express hTROP-2. On the other hand, the anti-hTROP-2 antibodies bound to HuH-7-hTROP-2 cells, in which an hTROP-2 gene was stably expressed (FIG. 2). Subsequently, the reactivity of the generated anti-hTROP-2 monoclonal antibodies with human cancer cell lines (in which an hTROP-2 protein was endogenously expressed on the cell surface) was examined by FACS analysis. As a result, the generated 300 types of anti-hTROP-2 monoclonal antibodies all bound to human pancreatic cancer cell lines (PK-59 and BxPC-3). In particular, K5-70, T6-16, K5-107, K5-116-2-1 and T5-86 antibodies, which exhibited tumor growth inhibitory activity in vivo, all bound to human cancer cell lines at high levels. For example, when compared with a case in which cancer cell lines were reacted with only PE-labeled anti-mouse IgG (BD Biosciences Pharmingen), the aforementioned antibodies exhibited the following binding ability to PK-59 cells and to BxPC-3 cells at mean fluorescence intensity: K5-70 (44 times), T6-16 (59 times), K5-107 (89 times), K5-116-2-1 (122 times) and T5-86 (15 times) (to PK-59 cells; FIG. 3); and K5-70 (45 times), T6-16 (25 times), K5-107 (90 times), K5-116-2-1 (121 times) and T5-86 (10 times) (to BxPC-3 cells; FIG. 4).
With regard to human cancer cell lines other than PK-59 and BxPC-3, among 12 types of pancreatic cancer cell lines, the anti-hTROP-2 monoclonal antibodies bound to KP-2, KP-3L, PK-1, PK-45H, SUIT-2 and TCC-PAN2, and did not bind to KP-1N, KP-1NL, KP-3, PANC-1 and MIA-PaCa2 (FIG. 5). Among human colon cancer cell lines, the anti-hTROP-2 monoclonal antibodies bound to CACO-2, SW480, DLD-1 and HCT 116, and did not bind to COLO-320 and CW-2 (FIG. 6). Furthermore, the anti-hTROP-2 monoclonal antibodies bound to JIMT-1 and HCC1143 (which were both human breast cancer cell lines) and to PC-3 and DU145 (which were both human prostate cancer cell lines). Thus, they recognized hTROP-2 proteins endogenously expressing on the cell surface of many types of human cancer cell lines (FIG. 6).
Example 12
[Cross-Reactivity with Mouse TROP-2 Protein and Human Trop-1/EpCAM Protein]
For the purpose of examining the specificity of the generated anti-hTROP-2 monoclonal antibodies, the reactivity of the antibodies with a mouse TROP-2 protein showing homology of 80% at the amino acid sequence level with the hTROP-2 protein, and with a human TROP-1/EpCAM protein showing homology of 50% at the amino acid sequence level with the hTROP-2 protein, was examined by FACS analysis.
Specifically, each of an expression vector (mouse TROP-2-pcDNA3.1(+), furnished by the Institute of Molecular and Cellular Biosciences, the University of Tokyo) comprising the full-length cDNA of a mouse TROP-2 gene (GenBank accession No. NM_020047, Y08830), and an expression vector (pcDNA3.1-hEpCAM-myc/His) comprising the full-length cDNA of a human TROP-1/EpCAM gene (GenBank accession No. NM_002354), was transiently introduced into CHO-K1 cells, using Lipofectamine2000 reagent (Invitrogen). Thereafter, 24 to 48 hours later, the cells were removed from a culture dish by treating them with trypsin, and a cell suspension was then prepared. The thus prepared cell suspension was successively reacted with the produced anti-hTROP-2 monoclonal antibody (0.1 .mu.g) and with PE-labeled anti-mouse IgG, and it was then analyzed by FACSCalibur.
A T2-102 antibody (mouse IgG1) used as a positive control, which showed cross-reactivity with mouse TROP-2, exhibited high binding ability to the CHO-K1 cells in which the mouse TROP-2 gene was transiently expressed. On the other hand, K5-70, T6-16, K5-107, K5-116-2-1 and T5-86 antibodies did not show such cross-reactivity with mouse TROP-2 (FIG. 7).
Similarly, an anti-human EpCAM monoclonal antibody (BD Biosciences Pharmingen) used as a positive control exhibited high binding ability to the CHO-K1 cells in which the human EpCAM/TROP-1 was transiently expressed. On the other hand, K5-70, T6-16, K5-107, K5-116-2-1 and T5-86 antibodies did not show such cross-reactivity with human EpCAM/TROP-1 (FIG. 8).
The aforementioned results demonstrated that the generated anti-hTROP-2 monoclonal antibodies, and in particular, K5-70, T6-16, K5-107, K5-116-2-1 and T5-86 antibodies, which exhibited anti-tumor activity in vivo, specifically bound to hTROP-2.
Example 13
[Measurement of Cell Growth Inhibitory Activity]
As a method of examining the activity of the anti-hTROP-2 monoclonal antibody to inhibit the function of hTROP-2, the influence of the antibody on the cell growth of human cancer cells, which endogenously express hTROP-2 on the cell surface, was evaluated by measuring the number of living cells using TetraColor ONE (Seikagaku Corporation). Specifically, PK-59 cells were suspended in an RPMI1640 medium containing 0.5% fetal bovine serum (manufactured by BioWest) at a cell concentration of 2.times.10.sup.5 cells/mL, and 100 .mu.L of the prepared cell suspension was then added to each well of a 96-well culture plate. Subsequently, mouse IgG (negative control) and anti-hTROP-2 monoclonal antibodies (final concentrations: 0.1 and 1 .mu.g/mL) were added to the wells, and the mixtures were then cultured at 37.degree. C. in a 5% CO.sub.2 incubator for 72 hours. As a control, a commercially available anti-hTROP-2 monoclonal antibody (clone YY01, Santa Cruz) was used. TetraColor ONE (Seikagaku Corporation) was added to the wells, and they were then reacted in a 5% CO.sub.2 incubator for 1 to 2 hours. After completion of the reaction, the 96-well culture plate was directly subjected to the measurement of absorbance at a wavelength of 490 nm (control wavelength: 655 nm), using Microplate Reader. The experiment was carried out using 3 wells for each group. A significant difference test was carried out according to Student's t-test, and P<0.05 was determined to be statistically significant.
Among anti-hTROP-2 monoclonal antibodies, which had been generated by our own company so far, approximately 160 clones were examined by the above-described method, in terms of their effect on the cell growth of PK-59 cells. As a result, T6-16, T5-86, K5-70 and K5-107, which had exhibited tumor growth inhibitory activity in vivo, were confirmed to have cell growth inhibitory activity of 20% to 40%, when compared with mouse IgG (negative control). It became clear that these anti-hTROP-2 antibodies have activity to bind to hTROP-2 proteins, which were expressed on the surface of human cancer cells, to neutralize the hTROP-2 proteins, and to inhibit the growth of the cancer cells (FIG. 9).
Example 14
[Scratch Assay]
The effect of an anti-hTROP-2 monoclonal antibody on the migratory ability of human cancer cells was evaluated by a scratch assay. PK-59 cells were suspended in an RPMI1640 medium containing 10% fetal bovine serum at a cell concentration of 3.times.10.sup.5 cells/mL, and 100 .mu.L of the prepared cell suspension was then added to each well of a 96-well culture plate. When the cells became confluent, a portion of the monolayer-cultured cells was peeled, such that the plate was scratched in a longitudinal direction with the end of a tip. An anti-hTROP-2 monoclonal antibody and mouse IgG used as a negative control were added to the medium to final concentrations of 0.1 and 1 .mu.g/mL, respectively, and culture was then carried out for 24 hours. Before addition of the antibody (Day 0) and 24 hours after the culture (Day 1), the cell peeled region was photographed, and the distance between the cells was then measured. Moreover, the area of such a peeled region was quantified using Scion Image software. The experiment was carried out using 8 wells for each group. A significant difference test was carried out according to Student's t-test, and P<0.05 was determined to be statistically significant.
The effect of an hTROP-2 antibody on the migratory ability of the cells invading the scratch region was examined. As with the cell growth inhibition assay, antibodies having beneficial effects were evaluated. As an evaluation method, the cells were photographed on Day 0 (when the antibody was added) and on Day 1 (24 hours after the addition of the antibody), and the migratory distance (.mu.m) and the area of a scratch region were determined by image analysis. As a result, as shown in FIG. 10, clear differences were observed in terms of the migratory ability of the cells. The antibodies T6-16 and K5-70, which were used in the present test, had significant cell growth inhibitory activity, when compared with the control. Even in a reproducibility test, the same tendency was observed. Particularly, T6-16 had a result of P<0.01 (by Student's t-test), and there was found correlation with the in vivo test.
Example 15
[Evaluation of Beneficial Effects of Anti-hTROP-2 Monoclonal Antibody on Tumor-Bearing Mice]
Prevention Model
Pancreatic cancer cell lines (PK-59 and BxPC-3), which expressed hTROP-2, were harvested by treatment with trypsin, and PBS was added to them to prepare a cell suspension having a concentration of 1.times.10.sup.8 cells/mL. The thus prepared cell suspension was mixed with an equal amount of Matrigel (BD Biosciences Pharmingen) on ice. Using a 26 G syringe, 100 .mu.L of the obtained mixture (5.times.10.sup.6 cells) was injected into the subcutis of the right flank of each of 6-week-old female nude mouse (Balb/c, nu/nu). On the day of the transplantation of the cancer cells (Day 1), the mice were divided into groups, and administration of the antibody (1, 5 or 10 mg/kg body weight, intraperitoneal administration) was initiated. Thereafter, administration of the antibody was continued at intervals of once every three days. Anti-tumor activity was evaluated based on tumor formation frequency and tumor volume. The tumor volume was calculated by the following formula. Tumor volume (mm.sup.3)=(minor axis).sup.2.times.(major axis).times..pi./6 Treatment Model
Pancreatic cancer cell lines (PK-59 and BxPC-3), which expressed hTROP-2, were harvested by treatment with trypsin, and PBS was added to them to prepare a cell suspension having a concentration of 1.times.10.sup.8 cells/mL. The thus prepared cell suspension was mixed with an equal amount of Matrigel (BD Biosciences Pharmingen) on ice. Using a 26 G syringe, 100 .mu.L of the obtained mixture (5.times.10.sup.6 cells) was injected into the subcutis of the right flank of each of 6-week-old female nude mouse (Balb/c, nu/nu). Five to six days after the transplantation of the cancer cells, mice whose tumor volume had increased to 50 to 150 mm.sup.3 (mean value: approximately 100 mm.sup.3) were divided into groups. The day on which the mice were divided into groups was defined as a first day (Day 1), and administration of the antibody was initiated. The antibody was intraperitoneally administered at intervals of once every three days (10 mg/kg body weight). Anti-tumor activity was evaluated by measuring tumor volume. A significant difference test was carried out according to Student's t-test, and P<0.05 was determined to be statistically significant.
Example 16
[Analysis of In Vivo Anti-Tumor Activity of Anti-hTROP-2 Monoclonal Antibody on Human Pancreatic Cancer Cell Xenograft Model]
It is essential for an antibody used for the treatment of cancer, which targets hTROP-2, to have the activity of specifically killing tumor tissues expressing hTROP-2 or inhibiting the growth of tumor in a xenograft model.
Anti-hTROP-2 monoclonal antibodies (approximately 160 clones), which were newly produced in the present invention, were evaluated using the xenograft treatment models of a pancreatic cancer cell line PK-59. The PK-59 cells express, on the surface thereof, EpCAM (FIG. 11A) acting as a pancreatic cancer stem cell marker (Chenwei Li, et al. Cancer Res 2007; 67: (3). 1030-1037), and also express P-glycoprotein/MDR1 (FIG. 11B) and ABCG2/CDw338 (FIG. 11C) (Chen, C. J. et al. Cell 47 (3), 381-389 (1986), Allikmets, R., et al. Hum. Mol. Genet. 5 (10), 1649-1655 (1996)), which are ABC transporters associated with drug resistance. In addition, the PK-59 cells contain a cell fraction (8.93%) (FIG. 11D) positive for both CD24 and CD44, which is characteristic for pancreatic cancer stem cells, and they are assumed to be a highly malignant human pancreatic cancer cell line (Chenwei Li, et al. Cancer Res 2007; 67: (3). 1030-1037, Jane E. Visvader and Geoffrey J. Lindeman. Nat Rev Cancer. Vol. 8(10):755-68, 2008).
Most of the newly generated approximately 160 clones did not exhibit beneficial effects on the xenograft treatment models of PK-59 cells. Among such clones, clones exhibiting significant tumor growth inhibitory activity, namely clones K5-70, T6-16, K5-107, T5-86 and K5-116-2-1 could be obtained.
In a clone K5-70 (mouse IgG2a) administration group, tumor growth rate is statistically significantly inhibited. On the 21.sup.st day after initiation of the administration (day 21), the tumor volume of a control group (N=14) was 1200.8.+-.377.3 mm.sup.3, whereas the tumor volume of the clone K5-70 administration group was 748.7.+-.175.0 mm.sup.3 (P<0.01 by Student's t-test) (FIG. 12A). When the tumor volume at the time of initiation of the administration of the antibody was defined as 1.0, the tumor volume on the 21.sup.st day (Day 21) was 7.8 in the clone K5-70 administration group, whereas the tumor volume of the control group was 12.5 (FIG. 12A). The weight of the tumor excised was 0.43.+-.0.14 g (P<0.01 by Student's t-test) in the clone K5-70 administration group, whereas that of the control group was 0.73.+-.0.26 g. Thus, the clone K5-70 exhibited inhibitory activity of approximately 60% (FIG. 12B).
Similarly, tumor growth rate was statistically significantly inhibited even in a clone K5-107 (mouse IgG1) administration group (N=8), a clone T6-16 (mouse IgG2a) administration group (N=8), a clone T5-86 (mouse IgG1) administration group and a clone K5-116-2-1 (mouse IgG2a) administration group (N=8). On the 17.sup.th day after initiation of the administration (Day 17), the tumor volumes of the clone K5-107 administration group (N=8) and the clone T6-16 administration group (N=8) were 698.2.+-.175.9 mm.sup.3 (P<0.05 by Student's t-test) and 707.2.+-.254.5 mm.sup.3 (P<0.05 by Student's t-test), respectively, whereas the tumor volume of the control group was 1039.3.+-.271.6 mm.sup.3. Likewise, on the 16.sup.th day after initiation of the administration (Day 16), the tumor volume of the clone K5-116-2-1 administration group (N=8) was 508.5.+-.225.2 mm.sup.3 (P<0.05 by Student's t-test), whereas the tumor volume of the control group (N=8) was 797.0.+-.172.9 mm.sup.3 (FIG. 13).
On the other hand, in the case of the clone T5-86, on the 15.sup.th day after initiation of the administration (Day 15), the tumor of the clone T5-86 administration group (N=8) was 744.1.+-.289.1 mm.sup.3, whereas the tumor volume of the control group (N=8) was 1033.2.+-.319.4 mm.sup.3. Thus, there was found no significant difference in terms of tumor volume. However, in the comparison of tumor weight, which was performed on the same day, the tumor weight of the clone T5-86 administration group was 0.44.+-.0.13 g (P<0.05 by Student's t-test), whereas the tumor weight of the control group was 0.62.+-.0.14 g. Thus, the clone T5-86 exhibited significant inhibitory activity.
Moreover, in terms of both tumor volume and tumor weight, the ratio (T/C) of each clone antibody administration group to the control group on the final day of experiment is shown in Table 2 below. As shown in Table 2, each clone antibody exhibited significant inhibitory activity (T/C=62% to 72%) on each clone antibody administration group.
TABLE-US-00002 TABLE 2 Tumor Tumor Group N (number of mice) volume T/C (%) weight T/C (%) K5-70 14 62.3** 58.8** K5-107 8 67.2* 65.0* T6-16 8 68.0* 64.7* T5-86 8 72.0 70.5* K5-116-2-1 8 63.8* 60.5* *P < 0.05, **P < 0.01 (by Student's t-test)
Furthermore, the anti-tumor activity of each of the clones K5-70, T6-16 and K5-116-2-1 on the xenograft prevention models of the pancreatic cancer cell line PK-59 was analyzed. After completion of the administration of each antibody clone, tumor growth was inhibited in all individuals (N=8). On the 18.sup.th day after initiation of the administration (Day 18), the tumor volume of the clone K5-70 administration group (10 mg/kg body weight) was 62.4.+-.80.4 mm.sup.3 (P<0.01 by Student's t-test), whereas the tumor volume of the control group (N=8) was 880.8.+-.206.4 mm.sup.3. Thus, the clone K5-70 exhibited tumor growth inhibitory activity of 92.9%. On the 28.sup.th day after initiation of the administration (Day 28), the tumor volume of the clone T6-16 administration group (10 mg/kg body weight) was 152.14.+-.122.3 mm.sup.3 (P<0.01 by Student's t-test), whereas the tumor volume of the control group (N=8) was 992.3.+-.250.8 mm.sup.3. Thus, the clone T6-16 exhibited tumor growth inhibitory activity of 84.6%. On the 20.sup.th day after initiation of the administration (Day 20), the tumor volume of the clone K5-116-2-1 administration group (10 mg/kg body weight) was 207.7.+-.319 2 mm.sup.3 (P<0.01 by Student's t-test), whereas the tumor volume of the control group (N=8) was 1159.4.+-.413.3 mm.sup.3. Thus, the clone K5-116-2-1 exhibited tumor growth inhibitory activity of 82.1% (FIG. 14 and Table 3). Moreover, in all of the experiments, there was no significant difference between the control group and each anti-hTROP-2 antibody administration group in terms of a change in mean body weight throughout the test period.
In terms of both tumor volume and tumor weight, the ratio (T/C) of each clone antibody administration group to the control group on the final day of experiment is shown in Table 3 below. As shown in Table 3, significant tumor growth inhibition was observed in each clone antibody administration group, and in particular, a significant effect such as T/C=10% or less was confirmed in the clone K5-70 administration group.
TABLE-US-00003 TABLE 3 Tumor Tumor Group N (number of mice) volume T/C (%) weight T/C (%) K5-70 8 7.1** 5.8** T6-16 8 15.3** 10.5** K5-116-2-1 8 23.2** 21.5** **P < 0.01 (by Student's t-test)
The known anti-TROP-2 antibody AR47A6.4.2 (U.S. Pat. No. 7,420,041) has exhibited the effect of inhibiting tumor growth, at a dosage of 20 mg/kg, on xenograft prevention models using various human cancer cell lines. This anti-TROP-2 antibody AR47A6.4.2 has inhibited the tumor growth of a human pancreatic cancer cell line PL45 at a percentage of almost 100%. However, this antibody has had the effect of inhibiting tumor on a pancreatic cancer cell line BxPC-3 at a percentage of approximately 50%, on a prostate cancer cell line PC-3 at a percentage of approximately 40%, on a breast cancer cell line MCF-7 at a percentage of approximately 60%, and on a colon cancer cell line Colo205 at a percentage of approximately 40%. In contrast, the anti-hTROP-2 antibody of the invention of the present application has exhibited a higher tumor growth inhibitory effect at a dosage of half the aforementioned dose (10 mg/kg body weight).
Example 17
[Analysis of Anti-Tumor Activity on Xenograft Models (Prevention Models and Treatment Models) of Human Pancreatic Cancer Cell Line BxPC-3]
As in the case of using the above-described xenograft treatment models of the human pancreatic cancer cell line PK-59, the anti-tumor activity of the clone K5-70 on xenograft prevention models and xenograft treatment models of a human pancreatic cancer cell line BxPC-3 was analyzed.
When compared with a control group (N=8), the tumor growth of the clone K-70 administration group was significantly inhibited. On the 52.sup.nd day (Day 52), the tumor volume of the clone K5-70 administration group (N=8) was 236.0.+-.136 4 mm.sup.3, whereas the tumor volume of the control group (N=8) was 616.3.+-.266.8 mm.sup.3. Thus, the clone K-70 exhibited a tumor growth inhibitory effect of 61.7% (P<0.01 by Student's t-test) (FIG. 15).
From the aforementioned results, it became clear that the anti-hTROP-2 monoclonal antibody exhibits significant tumor growth inhibitory activity in vivo on at least two cancer cell species.
Example 18
[Dose-Dependent Anti-Tumor Activity of Anti-hTROP-2 Antibody (Clone K5-70) on Xenograft Prevention Models of hTROP-2-Expressing Pancreatic Cancer Cell Line (PK-59 Cells)]
For the purpose of analyzing more in detail the tumor growth inhibitory activity in vivo of the anti-hTROP-2 antibody, a dose-dependent test was carried out. As shown in FIG. 16, the tumor growth of PK-59 cells was dose-dependently inhibited by administration of the K5-70 antibody. On the 21.sup.st day after administration of the antibody (Day 21), the tumor volume of the control group (N=8) was 937.8.+-.295.3 mm.sup.3. On the other hand, the tumor volume of the K5-70 antibody (1 mg/kg body weight) administration group (N=8) was 493.5.+-.305.1 mm.sup.3, showing an inhibitory rate of 50%, and the tumor volume of the K5-70 antibody (5 mg/kg body weight) administration group (N=8) was 124.7.+-.89.0 mm.sup.3, showing an inhibitory rate of 90%. Thus, it became clear that, when compared with the known anti-TROP-2 antibody AR47A6.4.2 (U.S. Pat. No. 7,420,041), the anti-hTROP-2 antibody of the present invention exhibits in vivo a tumor growth inhibitory effect equivalent to that of the anti-TROP-2 antibody AR47A6.4.2 at a dosage of one-twentieth the anti-TROP-2 antibody AR47A6.4.2, and that it exhibits a higher inhibitory effect of 90% at a dosage of one-fourth thereof.
Example 19
[Epitope Assay]
Preparation of Human/Mouse Chimeric TROP-2 Protein
A human/mouse TROP-2 gene was prepared according to a PCR method. PCR primers as shown below were designed based on a human TROP-2 gene sequence and a mouse TROP-2 gene sequence (Genbank accession No. NM_020047).
TABLE-US-00004 Human/mouse TROP-2-C primers Y606 (forward side): (SEQ ID NO: 10) 5'-cctgagcctacgctgcgacgaagtggtgcg-3' Y607 (reverse side): (SEQ ID NO: 11) 5'-cgcaccacttcgtcgcagcgtaggctcagg-3' Human/mouse TROP-2-A primers Y612 (forward side): (SEQ ID NO: 12) 5'-gactgctccacgctgacttccaagtgcctg-3' Y613 (reverse side): SEQ ID NO: 13) 5'-caggcacttggaagtcagcgtggagcagtc-3' Human/mouse TROP-2-B primers Y614 (forward side): (SEQ ID NO: 14) 5'-ctcgtggacaacgatggcctctacgacccg-3' Y615 (reverse side): (SEQ ID NO: 15) 5'-cgggtcgtagaggccatcgttgtccacgag-3' Mouse/human TROP-2-D primers Y608 (forward side): (SEQ ID NO: 16) 5'-ccaaagcctgcgctgcgatgagctggtgcgc-3' Y609 (reverse side): (SEQ ID NO: 17) 5'-gcgcaccagctcatcgcagcgcaggctttgg-3' Mouse/human TROP-2-E primers Y616 (forward side): (SEQ ID NO: 18) 5'-agcttcctatccgcggtgcactacgagcag-3' Y617 (reverse side): (SEQ ID NO: 19) 5'-ctgctcgtagtgcaccgcggataggaagct-3' Mouse/human TROP-2-F primers Y618 (forward side): (SEQ ID NO: 20) 5'-gacattaaaggcgagtctctattccagggc-3' Y619 (reverse side): (SEQ ID NO: 21) 5'-gccctggaatagagactcgcctttaatgtc-3' Mouse TROP-2 primers Forward primer: (SEQ ID NO: 22) 5-ctactccaccccaccctggcg-3' Reverse primer: (SEQ ID NO: 23) 5'-ctcgagcaagctaggttcgcttctc-3'
To the mouse TROP-2 reverse primer, a XhoI restriction enzyme-digested sequence except for a stop codon was added. A schematic view of the prepared human/mouse chimeric TROP-2 proteins is shown in FIG. 17.
The hmTROP-2-A chimeric protein is a chimeric protein, which consists of a polypeptide ranging from the N-terminus to the amino acid at position 69 of the hTROP-2 protein and a polypeptide ranging from the amino acid at position 64 to the C-terminus of the mouse TROP-2 protein. The hmTROP-2-B chimeric protein is a chimeric protein, which consists of a polypeptide ranging from the N-terminus to the amino acid at position 101 of the hTROP-2 protein and a polypeptide ranging from the amino acid at position 96 to the C-terminus of the mouse TROP-2 protein. The hmTROP-2-C chimeric protein is a chimeric protein, which consists of a polypeptide ranging from the N-terminus to the amino acid at position 145 of the hTROP-2 protein and a polypeptide ranging from the amino acid at position 140 to the C-terminus of the mouse TROP-2 protein. The mhTROP-2-D chimeric protein is a chimeric protein, which consists of a polypeptide ranging from the N-terminus to the amino acid at position 139 of the mouse TROP-2 protein and a polypeptide ranging from the amino acid at position 146 to the C-terminus of the hTROP-2 protein. The mhTROP-2-E chimeric protein is a chimeric protein, which consists of a polypeptide ranging from the N-terminus to the amino acid at position 187 of the mouse TROP-2 protein and a polypeptide ranging from the amino acid at position 194 to the C-terminus of the hTROP-2 protein. The mhTROP-2-F chimeric protein is a chimeric protein, which consists of a polypeptide ranging from the N-terminus to the amino acid at position 227 of the mouse TROP-2 protein and a polypeptide ranging from the amino acid at position 234 to the C-terminus of the hTROP-2 protein.
Expression vectors used in the preparation of the above-described chimeric proteins were specifically constructed by the following methods. In order to prepare an hmTROP-2-A chimeric gene, the hTROP-2 gene was used as a template, and PCR was carried out using the hTROP-2 forward primer and the human/mouse TROP-2-A primer Y613. Likewise, the mouse TROP-2 gene was used as a template, and PCR was carried out using the human/mouse TROP-2-A primer Y612 and the mouse TROP-2 reverse primer. A DNA fragment amplified by the PCR was developed using acrylamide gel, and a band of interest was then recovered by extraction. Subsequently, the extracted two types of DNA fragments were mixed to prepare a template, and PCR was then carried out using the hTROP-2 forward primer and the mouse TROP-2 reverse primer. A PCR product was developed by agarose gel electrophoresis, and a DNA fragment of interest was then extracted. The extracted DNA fragment was cloned into a pCR.RTM.-Blunt vector (Invitrogen) (pCRB-hmTROP-2-A), and a gene sequence was then confirmed. An expression vector for animal cells was produced by removing the hTROP-2 gene from pcDNA3.1-hTROP-2-myc/His by EcoRI/XhoI digestion, and then inserting therein an EcoRI/XhoI fragment containing an hmTROP-2-A chimeric gene prepared from pCRB-hmTROP-2-A (pcDNA3.1-hmTROP-2-A-myc/His). Additionally, the following chimeric genes were prepared by the same method as described above, and expression vectors were constructed: hmTROP-2-B (using a human TROP-2 forward primer, a human/mouse TROP-2-B primer Y615, a human/mouse TROP-2-B primer Y614 and a mouse TROP-2 reverse primer), hmTROP-2-C (using a human TROP-2 forward primer, a human/mouse TROP-2-C primer Y607, a human/mouse TROP-2-C primer Y606 and a mouse TROP-2 reverse primer), mhTROP-2-D (using a mouse TROP-2 forward primer, a mouse/human TROP-2-D primer Y609, a mouse/human TROP-2-D primer Y608 and a human TROP-2 reverse primer), mhTROP-2-E (using a mouse TROP-2 forward primer, a mouse/human TROP-2-E primer Y617, a mouse/human TROP-2-E primer Y616 and a human TROP-2 reverse primer), mhTROP-2-F (using a mouse TROP-2 forward primer, a mouse/human TROP-2-F primer Y619, a mouse/human TROP-2-F primer Y618 and a human TROP-2 reverse primer) (pcDNA3.1-hmTROP-2-B-myc/His, pcDNA3.1-hmTROP-2-C-myc/His, pcDNA3.1-mhTROP-2-D-myc/His, pcDNA3.1-mhTROP-2-E-myc/His, and pcDNA3.1-mhTROP-2-F-myc/His).
Establishment of HEK293 Cell Lines, which Constitutively Express hTROP-2, Human/Mouse TROP-2-C and Mouse/Human TROP-2-D Chimeric Proteins
The above-described expression vectors pcDNA3.1-hTROP-2-myc/His, pcDNA3.1-hmTROP-2-C-myc/His and pcDNA3.1-mhTROP-2-D-myc/His were each introduced into HEK293 cells. Selection was carried out using an antibiotic G418 (Calbiochem), and HEK293 cell lines constitutively expressing the hTROP-2 protein, the hmTROP-2-C chimeric protein and the mhTROP-2-D chimeric protein were established.
The binding regions of the anti-hTROP-2 monoclonal antibodies K5-70, T5-86, K5-107, T6-4, T6-16 and K5-116-2-1, which had exhibited beneficial effects on the xenograft treatment models of the pancreatic cancer cell line PK-59, were identified. First, the reactivity of the anti-hTROP-2 monoclonal antibodies exhibiting beneficial effects with HEK293 cells, which constantly express the chimeric proteins hmTROP-2-C and mhTROP-2-D, was examined by FACS analysis (FIG. 18). As a result, it was found that the K5-70, K5-107, T5-86 and K5-116-2-1 antibodies reacted with hmTROP-2-C, but that these antibodies did not react with mhTROP-2-D. On the other hand, the T6-4 and T6-16 antibodies reacted with mhTROP-2-D, but they did not react with hmTROP-2-C. From these results, the binding region of each of the K5-70, K5-107, T5-84 and K5-116-2-1 antibodies was limited to a region ranging from the N-terminus to the amino acid at position 145 of hTROP-2, and the binding region of each of the T6-4 and T6-16 antibodies was limited to a region ranging from the amino acid at position 146 to the C-terminal region of hTROP-2 (FIG. 18).
In order to analyze the binding regions more in detail, vectors used in the expression of hmTROP-2-A, hmTROP-2-B, mhTROP-2-E and mhTROP-2-F chimeric proteins were prepared, and the reactivity of the chimeric proteins with the anti-hTROP-2 monoclonal antibodies exhibiting beneficial effects was analyzed (FIG. 19). The newly prepared expression vectors, which were to be used in the expression of the chimeric proteins, were each introduced into HEK293 cells, and FACS analysis was then carried out, using the cells which transiently expressed the chimeric proteins. The K5-70, K5-107, T5-86 and K5-116-2-1 antibodies reacted with hmTROP-2-A, but did not react with mhTROP-2-B. The examined 6 types of monoclonal antibodies all reacted with hTROP-2. These results clearly showed that the binding region of the K5-70, K5-107, T5-86 and K5-116-2-1 antibodies is present in a region ranging from the N-terminus to the amino acid at position 69 of hTROP-2. Moreover, the T6-4 and T6-16 antibodies reacted with neither mhTROP-2-E nor mhTROP-2-F. This suggested that these antibodies recognize a region ranging from the amino acid at position 146 to the amino acid at position 193 of hTROP-2.
Example 20
[Immunohistochemistry]
<Materials/Method>
The following normal and cancer tissue arrays were used in immunohistostaining.
Human Normal Tissue Arrays:
Human, normal organs in duplicates (Catalog No.: AB1, Super Bio Chips)
Normal tissues more than single spots (Catalog No.: A103(VI), ISU ABXIS)
Lung Cancer Tissue Arrays:
Human lung cancer-metastasis-normal (Catalog No.: CCA3, Super Bio Chips)
Human lung carcinoma tissue with margin tissue, 2 location cores (Catalog No.: OD-CT-RsLug03-002, Shanghai Outdo Biotech)
Pancreatic Cancer Tissue Array:
Human pancreas carcinoma tissue with mono-pathological type from 60 cases, 2 location cores (Catalog No.: OD-CT-DgPan03-001, Shanghai Outdo Biotech)
Liver Cancer Tissue Arrays:
Hepatocellular carcinoma, grades I to III with normal tissue controls, 63 cases tissue arrays (Catalog No.: CS03-01-002U, Cybrdi)
Human liver carcinoma tissue with mono-pathological type from 30 cases, 2 location cores (Catalog No.: OD-CT-DgLiv02-002, Shanghai Outdo Biotech)
Colorectal Cancer Tissue Arrays:
Human, colorectal cancer (Catalog No.: CD3, Super Bio Chips)
Human colon carcinoma with margin tissue, 2 location cores (Catalog No.: OD-CT-DgCo103-002, Shanghai Outdo Biotech)
Colorectal Cancer Lymph Node Metastasis and Liver Metastasis Tissue Arrays:
Colorectal (colon and rectum) cancer with matched lymph node metastasis tissue array, 44 cases/99 cores, trial slide (Catalog No.: C0991t, Biomax us)
Colorectal (colon and rectum) cancer with matched lymph node metastasis and normal adjacent tissue array, 43 cases/99 cores (Catalog No.: C0992, Biomax us)
Colon cancer tissues liver metastasis (Catalog No.: A203(IV), ISU ABXIS)
Breast Cancer Tissue Arrays:
Human, breast cancer-metastasis-normal (Catalog No.: CBA3, Super Bio Chips)
Human breast carcinoma with margin tissue, 2 location cores (Catalog No.: OD-CT-RpBre03-002, Shanghai Outdo Biotech)
Stomach Cancer Tissue Arrays:
Human, stomach cancer (Catalog No.: CQ1, Super Bio Chips)
Human gastric carcinoma with margin tissue, 2 location cores (Catalog No.: OD-CT-DgStm03-002, Shanghai Outdo Biotech)
Esophagus Cancer Tissue Array:
Human, esophagus cancer (Catalog No.: CR1, Super Bio Chips)
Human esophagus carcinoma with margin tissue, 2 location cores (Catalog No.: OD-CT-DgEso03-002, Shanghai Outdo Biotech)
Ovarian Cancer Tissue Array:
Human, ovary cancer (Catalog No.: CJ1, Super Bio Chips)
Prostate Cancer Tissue Array:
Human, prostate cancer-normal (Catalog No.: CA3, Super Bio Chips)
Bladder Cancer Tissue Array:
Bladder carcinoma/transitional cell carcinoma, grades I to III with normal tissue arrays (Catalog No.: CC12-01-001U, Cybrdi)
Patient information and clinical information regarding the above-described tissue arrays were obtained from data sheets attached herewith and the homepages of individual companies.
Immunohistostaining Method
After completion of a deparaffinization treatment, the tissue array slides of human normal tissues and cancer tissues were subjected to a protease treatment with pepsin at 37.degree. C. for 5 minutes. Thereafter, the sections were used in immunostaining using an anti-hTROP-2 monoclonal antibody. A color reaction was carried out using DAB(3,3'-diaminobenzidine) as a substrate, and as a counter staining, nuclear staining was then carried out using hematoxylin.
More specifically, these operations were carried out as follows. A paraffin-embedded section was subjected to a deparaffinization treatment, and was then subjected to a protease treatment with pepsin (DAKO) at 37.degree. C. for 5 minutes. After activation of the antigen, the section was treated at room temperature for 20 minutes using a solution prepared by adding a hydrogen peroxide solution to methanol to a final concentration of 0.3%, so that endogenous peroxidase activity was eliminated. The resultant was washed with PBS at room temperature for 5 minutes twice, and it was then blocked at room temperature for 30 minutes using a PBS solution containing 1.5% normal horse serum (DAKO), so as to carry out an operation to block non-specific binding in the tissues. Subsequently, the resultant was reacted with anti-hTROP-2 monoclonal antibody clone K5-63-17 (final concentration: 10 .mu.g/ml), which had been diluted with a PBS solution containing 1.5% normal horse serum, at room temperature for 1 hour, and was then washed with PBS at room temperature for 5 minutes three times. Thereafter, a biotinylated anti-mouse IgG antibody (Vector), which had been 200 times diluted with a PBS solution containing 1.5% normal horse serum, was reacted at room temperature for 30 minutes. The reaction product was washed with PBS at room temperature for 5 minutes three times, and a reagent of Vectastain ABC kit (Vector) was mixed in accordance with the instruction manual included therewith, so as to prepare an ABC complex. This ABC complex was reacted at room temperature for 30 minutes. The reaction product was washed with PBS at room temperature for 5 minutes three times, and color development was then carried out using Histofine Peroxidase Substrate Simple Stain DAB solution (Nichirei Biosciences). After completion of the color development, the reaction product was washed with deionized water for 5 minutes, and the nucleus was stained with Mayer's hematoxylin solution (Wako Pure Chemical Industries, Ltd.). Thereafter, dehydration was carried out with alcohol, followed by penetration with xylene and mounting in Entellan New (Merck Japan).
<Results>
Expression of hTROP-2 in Human Normal Tissues
The expression pattern of hTROP-2 in human normal tissues was analyzed using the anti-hTROP-2 monoclonal antibody clone K5-63-17. A human normal tissue array (Catalog No.: AB1, Super Bio Chips) was deparaffinized, and was then subjected to a hydrophilic treatment. Thereafter, the antigen was activated with a protease, pepsin, and immunostaining was then carried out using the anti-hTROP-2 monoclonal antibody clone K5-63-17 (FIG. 20). As a result, staining was observed in the skin, esophagus, kidney (cortex and medulla), pancreas, prostate, bladder and tonsil. A majority of stained images localized in the cell membrane (FIGS. 20A, B, C, D, F, G and H), but hTROP-2 expression was partially observed even in the cytoplasm (FIGS. 20E and H). On the other hand, such staining was not observed in the heart, liver, stomach, small intestine, large intestine, skeletal muscle, lung, spleen, thymus gland and the like (FIGS. 20I and J).
Expression of hTROP-2 in Human Cancer Tissues
In order to examine the expression of hTROP-2 (hTROP-2-positive rate) in human cancer tissues, the cancer tissue arrays of various human cancer species were immunostained using the anti-hTROP-2 monoclonal antibody clone K5-63-17. A tissue section, in which 10% or more of cancer cells were stained, was defined as hTROP-2-positive. The staining results are shown in Table 4.
TABLE-US-00005 TABLE 4 number of TROP-2-positive cases/ TROP-2-positive rate Cancer tissues total number of cases (%) Breast cancer 32/80 40 Lung cancer 53/81 65.4 Esophagus cancer 69/90 76.7 Stomach cancer 25/90 27.8 Colon cancer 29/178 16.3 Pancreatic cancer 26/62 41.9 Liver cancer 7/92 7.61 Bladder cancer 42/59 71.2 Prostate cancer 35/38 92.1 Ovary cancer 14/58 24.1
Representative stained images are shown in FIG. 21. Among cancer species, regarding which the expression of hTROP-2 had been analyzed, prostate cancer had the highest positive rate (92.1%), and also, lung cancer (65.4%), esophagus cancer (76.7%), bladder cancer (71.2%) and the like had high positive rates. Liver cancer had the lowest positive rate (7.61%). It was observed from stained images that, as with in normal cells, hTROP-2 was highly localized in the cell membrane even in the case of cancer cells (FIGS. 21 A to F, H and I). In addition, hTROP-2 was also localized in the cytoplasm in some cases (FIGS. 21A, B, E and G).
The hTROP-2-positive rate in pancreatic cancer was 41.9%. The relationship between this hTROP-2-positive rate and the grade (degree of differentiation) of pancreatic cancer was analyzed. As a result, hTROP-2 was expressed at high frequency in pancreatic cancer with a high grade, namely, with a low degree of differentiation (Table 5).
TABLE-US-00006 TABLE 5 Pancreatic cancer hTROP-2-positive spots 26/62 (41.94%) Grade - + Positive rate I 8 0 0% I-II 5 0 0% II 19 21 52.5% II-III 4 5 55.6% p < 0.01 total 36 26
Example 21
[Anti-Tumor Activity of K5-70 Antibody by Single Administration on Xenograft Prevention Models of Human Pancreatic Cancer Cell Line PK-59]
Strong anti-tumor activity in vivo of a clone K5-70 (mouse IgG2a) was exhibited even by a single administration of K5-70 at a dosage of 10 mg/kg body weight to xenograft prevention models using a human pancreatic cancer cell line PK-59. In a control group (mouse IgG, 10 mg/kg body weight, N=3), tumor formation was observed in all of the individuals, and the tumor volume on the 28.sup.th day after cell transplantation (Day 28) was 781.7.+-.74.5 mm.sup.3. On the other hand, in a group in which the K5-70 antibody was administered only once on the day of transplantation of the cancer cells (Day 1) (10 mg/kg body weight, N=3), the tumor volume on Day 28 was 144.4.+-.176.9 mm.sup.3 (P<0.05 by Student's t-test), showing tumor growth inhibitory activity of 81.5% (FIG. 22A). With regard to tumor weight, the tumor weight of the control group on Day 28 was 0.59.+-.0.06 g. In contrast, the tumor weight of the clone K5-70 antibody administration group was 0.07.+-.0.10 g (P<0.01 by Student's t-test), showing an inhibitory activity of 88% (FIG. 22B). With regard to both tumor volume and tumor weight, tumor formation was completely inhibited in 2 out of 3 individuals in the K5-70 antibody administration group at a dosage of 10 mg/kg body weight per administration (FIG. 22C).
Example 22
[Anti-Tumor Activity of Anti-hTROP-2 Monoclonal Antibody on Xenograft Treatment Models of Human Colon Cancer Cell Line SW480]
The anti-tumor activity of each of anti-hTROP-2 monoclonal antibodies (clones K5-70, K5-116-2-1, and T6-16) was examined with xenograft treatment models using a human colon cancer cell line SW480. SW480 cells (5.times.10.sup.6 cells) were subcutaneously transplanted into the right flank of each of 6-week-old female NOD-scid mouse (Day 1). When the mean tumor volume reached 100 mm.sup.3, grouping was carried out (Day 7 or Day 10). From Day 7 or Day 10, intraperitoneal administration of the antibody was carried out at administration intervals of once every three days. The anti-tumor activity of the clone K5-70 antibody and the anti-tumor activities of the clone K5-116-2-1 antibody and the clone T6-16 antibody were evaluated by independent studies, separately. In the study of evaluating the anti-tumor activity of the K5-70 antibody, the tumor volume of a control group (mouse IgG (10 mg/kg body weight), N=8) on the 44.sup.th day after cancer cell transplantation (Day 44) was 365.4.+-.214.6 mm.sup.3. On the other hand, the tumor volume of a K5-70 antibody (10 mg/kg body weight) administration group was 27.4.+-.29.4 mm.sup.3 (P<0.01 by Student's t-test), and thus, tumor formation was significantly inhibited in the K5-70 administration group (inhibitory rate: 92.5%) (FIG. 23A). With regard to tumor weight, the tumor weight of the control group was 0.11.+-.0.07 g, whereas the tumor weight of the K5-70 antibody administration group was 0.005.+-.0.007 (g) (P<0.01 by Student's t-test), showing an inhibitory rate of 95.5% (FIG. 23B). In particular, in two out of the eight individual mice in the K5-70 antibody administration group, tumor formation was completely inhibited, and the presence of tumor could not be confirmed.
In the study of evaluating the anti-tumor activities of the K5-116-2-1 antibody and the T6-16 antibody, which was carried out separately, the tumor volume of the control group on Day 42 was 713.8.+-.354.5 mm.sup.3 (N=8). In contrast, the tumor volume of the K5-116-2-1 antibody administration group (10 mg/kg body weight) was 188.9.+-.97.4 mm.sup.3 (N=8, P<0.01 by Student's t-test) (FIG. 24A), and the tumor volume of the T6-16 antibody administration group (10 mg/kg body weight) was 292.8.+-.199.7 mm.sup.3 (N=8, P<0.05 by Student's t-test) (FIG. 25A). Thus, the two above administration groups showed inhibitory rates of 73.5% and 59.0%, respectively. With regard to tumor weight as well, the tumor weight of the control group was 0.39.+-.0.19 g. In contrast, the tumor weight of the K5-116-2-1 antibody administration group was 0.10.+-.0.07 g (P<0.01 by Student's t-test), and the tumor weight of the T6-16 antibody administration group was 0.17.+-.0.14 g (P<0.05 by Student's t-test). Thus, the two above administration groups showed inhibitory rates of 72.2% and 56.4%, respectively (FIG. 24B and FIG. 25B).
Example 23
[Dose-Dependent Anti-Tumor Activity of Clone K5-70 on Xenograft Treatment Models Using Human Colon Cancer Cell Line SW480]
Subsequently, the dose-dependent anti-tumor activity of the K5-70 antibody was examined with xenograft treatment models using a human colon cancer cell line SW480. SW480 cells (5.times.10.sup.6 cells) were subcutaneously transplanted into the right flank of each of 6-week-old female NOD-scid mouse. Ten days after the transplantation (Day 10) at which the mean tumor volume reached 100 mm.sup.3, the mice were divided into a control group (mouse IgG, 10 mg/kg body weight administration group, N=8, 104.4.+-.17.6 mm.sup.3), a K5-70 antibody (1 mg/kg body weight) administration group (N=8, 104.3.+-.16.1 mm.sup.3), a K5-70 antibody (5 mg/kg body weight) administration group (N=8, 104.6.+-.15 9 mm.sup.3), and a K5-70 antibody (10 mg/kg body weight) administration group (N=8, 104.8.+-.14.9 mm.sup.3) Then, intraperitoneal administration was carried out at administration intervals of once every three days. On Day 42, the tumor volume of the control group was 713.8.+-.354.5 mm.sup.3. On the other hand, in the K5-70 antibody administration groups, dose-dependent tumor formation inhibitory activity was observed. That is, the tumor volume of the 1 mg/kg body weight administration group was 485.0.+-.207.3 mm.sup.3 (inhibitory rate: 32.1%), the tumor volume of the 5 mg/kg body weight administration group was 339.5.+-.253.2 mm.sup.3 (inhibitory rate: 52.4%), and the tumor volume of the 10 mg/kg body weight administration group was 355.4.+-.202.8 mm.sup.3 (inhibitory rate: 50.2%, P<0.05 by Student's t-test) (FIG. 26A). Likewise, with regard to tumor weight on Day 42, the tumor weight of the control group was 0.39.+-.0.19 g. On the other hand, the tumor weight of the K5-70 antibody (1 mg/kg body weight) administration group was 0.24.+-.0.11 g (inhibitory rate: 37.8%), the tumor weight of the 5 mg/kg body weight administration group was 0.17.+-.0.14 g (inhibitory rate: 55.8%, P<0.05 by Student's t-test), and the tumor weight of the 10 mg/kg body weight administration group was 0.20.+-.0.13 g (inhibitory rate: 47.1%). Thus, dose-dependent anti-tumor activity was confirmed (FIG. 26B).
Example 24
[Analysis of Administration Intervals of K5-70 Antibody to Xenograft Treatment Models Using Human Colon Cancer Cell Line SW480]
Subsequently, in order to analyze optimal administration intervals of the K5-70 antibody, the anti-tumor activity of the clone K5-70 when it was administered once a week (once every 7 days) was examined with xenograft treatment models using a human colon cancer cell line SW480. SW480 cells (5.times.10.sup.6 cells) were subcutaneously transplanted into the right flank of each of 6-week-old female NOD-scid mouse. Ten days after the transplantation (Day 10) at which the mean tumor volume reached 100 mm.sup.3, the mice were divided into a control group (mouse IgG, 10 mg/kg body weight, N=8, 104.42.+-.15.1 mm.sup.3) and a K5-70 antibody administration group (10 mg/kg body weight, N=8, 104.3.+-.16.1 mm.sup.3) Then, intraperitoneal administration was carried out once every 7 days. On Day 42, the tumor volume of the control group was 713.8.+-.354.5 mm.sup.3, whereas the tumor volume of the K5-70 antibody administration group (administered once a week) was 332.3.+-.239.9 mm.sup.3 (inhibitory rate: 55%, P<0.05 by Student's t-test) (FIG. 27A). Moreover, when the administration interval was increased to once every 10 days and to once every two weeks, the tumor volume of the control group on Day 39 was 956.9.+-.367.8 mm.sup.3. On the other hand, the tumor volume of the K5-70 antibody administration group (administered once every 10 days) on Day 39 was 525.4.+-.180.6 mm.sup.3 (inhibitory rate: 45.1%, P<0.01 by Student's t-test), and the tumor volume of the K5-70 antibody administration group (administered once every 2 weeks) was 459.4.+-.217.6 mm.sup.3 (inhibitory rate: 52.0%, P<0.01 by Student's t-test) (FIG. 27B). In the prior arts (U.S. Pat. No. 7,420,040 and U.S. Pat. No. 7,420,041), when antibodies were administered to xenograft treatment models using a pancreatic cancer cell line (BxPC-3) at a dosage of 20 mg/kg body weight, three times a week (at administration intervals of 2 days), the antibodies exhibited anti-tumor activity at an inhibitory rate of 50% to 60%. In contrast, the K5-70 antibody exhibited anti-tumor activity equivalent to those of the prior arts, at a dosage of half of the prior arts (10 mg/kg body weight), once every 2 weeks (at administration intervals of 13 days). Accordingly, it became clear that that the K5-70 antibody exhibited significant anti-tumor activity at a total dosage of at least one twelfth of those of the prior-arts.
Example 251
[Dose-Dependent Anti-Tumor Activity of T6-16 Antibody on Xenograft Treatment Models Using Human Colon Cancer Cell Line SW480]
Subsequently, the dose-dependent anti-tumor activity of the T6-16 antibody was examined with xenograft treatment models using a human colon cancer cell line SW480. SW480 cells (5.times.10.sup.6 cells) were subcutaneously transplanted into the right flank of each of 6-week-old female NOD-scid mice. Ten days after the transplantation (Day 10) at which the mean tumor volume reached 100 mm.sup.3, the mice were divided into a control group (mouse IgG, 10 mg/kg body weight, N=8, 105.8.+-.9.9 mm.sup.3), a T6-16 antibody administration group (1 mg/kg body weight, N=8, 104.4.+-.13.3 mm.sup.3), a T6-16 antibody administration group (5 mg/kg body weight, N=8, 104.7.+-.13.0 mm.sup.3), and a T6-16 antibody administration group (10 mg/kg body weight, N=8, 104.8.+-.12.4 mm.sup.3) Then, intraperitoneal administration was carried out at administration intervals of once every three days. On Day 43, the tumor volume of the control group was 473.5.+-.137.0 mm.sup.3. On the other hand, in the T6-16 antibody administration groups, dose-dependent tumor formation inhibitory activity was observed. That is, the tumor volume of the 1 mg/kg body weight administration group was 397.9.+-.97.5 mm.sup.3 (inhibitory rate: 16.0%), the tumor volume of the 5 mg/kg body weight administration group was 195.9.+-.89.7 mm.sup.3 (inhibitory rate: 58.7%, P<0.01 by Student's t-test), and the tumor volume of the 10 mg/kg body weight administration group was 190.2.+-.56.5 mm.sup.3 (inhibitory rate: 59.8%, P<0.01 by Student's t-test) (FIG. 28A). Likewise, with regard to tumor weight on Day 43, the tumor weight of the control group was 0.19.+-.0.07 g. On the other hand, the tumor weight of the T6-16 antibody (1 mg/kg body weight) administration group was 0.20.+-.0.08 g, the tumor weight of the T6-16 antibody (5 mg/kg body weight) administration group was 0.08.+-.0.04 g (inhibitory rate: 57.9%, P<0.01 by Student's t-test), and the tumor weight of the T6-16 antibody (10 mg/kg body weight) administration group was 0.09.+-.0.04 g (inhibitory rate: 52.6%, P<0.01 by Student's t-test). Thus, dose-dependent anti-tumor activity was confirmed (FIG. 28B).
Example 26
[Analysis of Administration Intervals of T6-16 Antibody to Xenograft Treatment Models Using Human Colon Cancer Cell Line SW480]
Subsequently, in order to analyze optimal administration intervals of the T6-16 antibody, the anti-tumor activity of the clone T6-16 when it was administered at administration intervals of once a week (once every 7 days) and once every 10 days was examined with xenograft treatment models using a human colon cancer cell line SW480. SW480 cells (5.times.10.sup.6 cells) were subcutaneously transplanted into the right flank of each of 6-week-old female NOD-scid mouse. Ten days after the transplantation (Day 10) at which the mean tumor volume reached 100 mm.sup.3, the mice were divided into a control group (mouse IgG, 10 mg/kg body weight, N=8, 105.8.+-.9 9 mm.sup.3), a T6-16 antibody (once a week) administration group (10 mg/kg body weight, N=8, 105.0.+-.11.6 mm.sup.3), and a T6-16 antibody (once every 10 days) administration group (10 mg/kg body weight, N=5, 130.8.+-.2.4 mm.sup.3) Then, administration was initiated. On Day 43, the tumor volume of the control group was 473.5.+-.137.0 mm.sup.3. On the other hand, the tumor volume of the T6-16 antibody (once a week) administration group was 243.7.+-.65.3 mm.sup.3 (inhibitory rate: 48.5%, P<0.01 by Student's t-test), and the tumor volume of the T6-16 antibody (once every 10 days) administration group was 297.8.+-.54 4 mm.sup.3 (inhibitory rate: 37.1%, P<0.05 by Student's t-test) (FIG. 29). In the prior arts (U.S. Pat. No. 7,420,040 and U.S. Pat. No. 7,420,041), when antibodies were administered to xenograft treatment models using a pancreatic cancer cell line (BxPC-3) at a dosage of 20 mg/kg body weight, three times a week (at administration intervals of 2 days), the antibodies exhibited anti-tumor activity at an inhibitory rate of 50% to 60%. In contrast, the T6-16 antibody exhibited significant anti-tumor activity, when it was administered at a dosage of half of the prior arts and at a frequency of once every 10 day (at administration intervals of 9 days). Accordingly, it became clear that that the T6-16 antibody exhibited significant anti-tumor activity at a total dosage of at least one eighth of those of the prior-arts.
Example 27
[Analysis of Anti-Tumor Activity of Clone K5-70 on Xenograft Prevention Models Using Human Prostate Cancer Cell Line DU-145]
The anti-tumor activity of clone K5-70 on human prostate cancer was evaluated with xenograft prevention models using DU-145 cells (RIKEN Cell Bank, RCB2143). DU-145 cells (5.times.10.sup.6 cells) were subcutaneously transplanted into each of 6-week-old female nude mouse (Balb/c, nu/nu). The day on which the transplantation was carried out was defined as Day 1. The mice were divided into a control group (mouse IgG) (N=8) and a K5-70 antibody administration group (N=8). From Day 1, the K-70 antibody and the control antibody were intraperitoneally administered to the mice at a frequency of once every 3 days at a dosage of 10 mg/kg body weight. On Day 40, the tumor volume of the control group was 368.2.+-.307.8 mm.sup.3. On the other hand, the tumor volume of the K5-70 antibody administration group was 30.6.+-.29 6 mm.sup.3 (P<0.05 by Student's t-test), showing a tumor formation inhibitory activity of approximately 90% (FIG. 30A). With regard to tumor weight, further significant anti-tumor activity was observed. The tumor weight of the control group on Day 40 was 0.18.+-.0.18 g. In contrast, in the K5-70 antibody administration group, tumors disappeared from all of the 8 individual mice, and thus, tumor formation was completely inhibited (FIG. 30B). From the above-mentioned results, it became clear that the anti-human TROP-2 monoclonal antibody clone K5-70 shows strong anti-tumor activity even on human prostate cancer cells.
Example 28
[Metastasis-Inhibitory Activity of K5-70 Antibody on Liver Metastasis Models Using Human Pancreatic Cancer Cell Line PK-59]
Cancer metastasis is an important factor that influences clinical prognosis in the treatment of gastrointestinal cancer. The control of metastasis is therapeutically significantly important. If not only tumor formation but also the metastasis of cancer to other organs could be suppressed by administering an antibody for use in cancer therapy that targets to TROP-2, high clinical usefulness would be anticipated. Thus, this is a desired property as a cancer therapeutic antibody.
The expression of TROP-2 was confirmed in many types of carcinomas. It was reported that TROP-2 was expressed at a high level particularly in metastatic foci (Br. J. Cancer (2008); 99: 1290-1295, Clin. Cancer Res. (2006); 12: 3057-3063, Mod. Pathol. (2008); 21: 186-191). Moreover, it was also reported that, when Trop-2-gene-introduced cancer cells were transplanted into nude mice via transsplenic or transpancreastic administration, the incidence of liver metastasis increased (WO 2010/089782, Molecular Cancer (2010); 9: 253), and thus, the report suggested the importance of TROP-2 in the cancer metastasis process. However, to date, there have been no reports specifically describing that an antibody that targets TROP-2 has metastasis-inhibitory action in vivo.
The anti-hTROP-2 mouse monoclonal antibody K5-70, which was discovered by the present invention, exhibits high therapeutic effects on xenograft models, into the subcutis of which human pancreatic cancer cells had been transplanted. It was demonstrated by a scratch assay performed in vitro that the antibody K5-70 is able to suppress the migration ability of a human pancreatic cancer cell line PK-59, in addition to the effect of suppressing the growth of cancer cells. Thus, it was considered that the antibody K5-70 could inhibit cancer metastasis in vivo. Hence, the metastasis-inhibitory effect of an anti-hTROP-2 mouse monoclonal antibody was examined, using models in which the PK-59 cells were injected into the spleen of nude mice so that liver metastasis was developed.
On the day before cancer cell transplantation, the mice were divided into groups. Then, an anti-hTROP-2 monoclonal antibody (K5-70) or a control antibody (purified mouse IgG) was intraperitoneally administered to the mice at a dosage of 10 mg/kg body weight. On the following day, a human pancreatic cancer cell line (PK-59) endogenously expressing hTROP-2 was harvested by treatment with trypsin, and a 2.times.10.sup.7 cells/mL cell suspension was then prepared with PBS. The cell suspension was preserved on ice until transplantation. Each of 6- or 7-week-old female nude mouse (Balb/c, nu/nu) was anesthetized by intraperitoneal administration of pentobarbital, and 10 to 15 mm of the left flank thereof was excised under anesthesia. The spleen was taken out of the abdominal cavity, and 50 .mu.L of the cell suspension (1.times.10.sup.6 cells) was then injected into the spleen using a 27G syringe. Four minutes after injection of the cells, the hilum of spleen was ligated with 5-0 silk sutures, and the spleen was then excised. The cut peritoneum was closed with 4-0 silk sutures, and the surgical site was then closed with Wound Clips (AUTOCLIP 9 mm, Becton Dickinson). In addition, seven days after the cancer cell transplantation, the K-70 antibody and the control antibody were administered to the mice at a dosage of 10 mg/kg body weight. Four to six weeks after the cancer cell transplantation, the mice were subjected to euthanasia by cervical dislocation. Then, the liver was excised from each mouse, and the presence or absence of metastatic foci was confirmed.
In the control group in which the mouse IgG was administered to the mice, in 4 out of the 6 mice into which PK-59 cells had been transplanted, apparent metastatic foci (2 to 7 foci) were observed around the liver lobe four to six weeks after the transplantation (FIG. 31A, incidence of metastasis: 67%, Table 6). In contrast, in four mice in the K5-70 antibody administration group, into which the PK-59 cells had also been transplanted, such metastatic foci were not observed in the liver of all of the mice, and thus, an incidence of metastasis was 0% (FIG. 31B, Table 6).
TABLE-US-00007 TABLE 6 Metastasis-suppressing effect of clone K5-70 on liver metastasis models produced by transsplenic transplantation of PK-59 cells into nude mice Administration Weeks Number of Determination of group after transplantation Individual No. metastatic foci metastasis Control group 4 W C-1 0 - 4 W C-2 5 ++ 6 W C-3 7 ++ 6 W C-4 7 ++ 6 W C-5 2 + 6 W C-6 0 - Average number 3.5 Incidence 67% of metastatic foci of metastasis K5-70 administration 4 W K-1 0 - group 6 W K-2 0 - 6 W K-3 0 - 6 W K-4 0 - Average number 0 Incidence 0% of metastatic foci of metastasis
From these results, it became clear that the anti-hTROP-2 antibody K5-70 has extremely strong inhibitory action on the liver metastasis of the human pancreatic cancer cell line PK-59.
Example 29
[Anti-Tumor Activity of K5-70 Antibody on Xenograft Models Using Human Colon Cancer Cell Line SW480, which are Recurrent Cancer Models after Administration of Irinotecan Hydrochloride]
In recent years, many chemotherapeutical drugs for suppressing the growth of cancer cells have been developed as cancer therapeutic drugs. These drugs have achieved certain treatment results. However, these chemotherapeutical drugs have been problematic in terms of side effects associated with the growth suppressive action thereof on normal cells other than cancer cells and the recurrence of cancer after suspension of the treatment. Accordingly, if tumor recurrence after completion of the treatment with chemotherapeutical drugs could be suppressed by administration of a cancer therapeutic antibody targeting to TROP-2, high clinical usefulness would be anticipated. Thus, this is a desired property as a cancer therapeutic antibody.
As therapeutic agents for colorectal cancer, in addition to 5-FU and platinum-containing drugs, irinotecan hydrochloride (Topotecin, Daiichi Sankyo Co., Ltd.) having a topoisomerase inhibitory effect has been recently applied to clinical sites. With regard to animal models as well, the anti-tumor effect of irinotecan hydrochloride on mouse models, into which various types of human tumor cells including colon cancer as a typical example had been transplanted, has been reported (Cancer Chemother Pharmacol. (1991); 28(3):192-8). Thus, the recurrence-preventing effect of the anti-hTROP-2 antibody clone K5-70 (mouse IgG2a) on recurrent tumor after administration of irinotecan hydrochloride has been examined with xenograft models using a human colon cancer cell line SW480. SW480 cells (5.times.10.sup.6 cells) were subcutaneously transplanted into the right flank of 8-week-old female NOD-scid mice. Eleven days after the transplantation (Day 11) at which the mean tumor volume reached 100 mm.sup.3, the mice were divided into a non-treat group (normal saline administration group, N=8, 130.7.+-.16 2 mm.sup.3) and an irinotecan hydrochloride (CPT-11, Topotecin, Daiichi Sankyo Co., Ltd.) administration group (N=16, 123.0.+-.21.4 mm.sup.3) Thereafter, irinotecan hydrochloride was intraperitoneally administered to the mice at a dosage of 40 mg/kg body weight, once every 3 days, total 3 times (Days 11, 14, and 17). On the third day after the final administration of irinotecan hydrochloride (Day 20), the tumor volume of the non-treat group reached 232.1.+-.21.1 mm.sup.3. On the other hand, the tumor volume of the irinotecan hydrochloride administration group was 126.6.+-.26.6 mm.sup.3 (P<0.01 by Student's t-test), and thus, an apparent tumor-suppressing effect was observed. At this stage, the irinotecan hydrochloride administration group was divided into two groups based on tumor size. One group was defined as a K5-70 antibody administration group (10 mg/kg body weight, N=8, tumor volume on Day 20: 126.0.+-.28 0 mm.sup.3), and the other group was defined as a mouse IgG administration group (10 mg/kg body weight, N=8, tumor volume on Day 20: 127.2.+-.27.0 mm.sup.3) Intraperitoneal administration of the antibodies and the measurement of a tumor volume were carried out on each group once every 3 days, so that the recurrence of a tumor was evaluated (FIG. 32). In the mouse IgG administration group, from the 18.sup.th day after the final administration of irinotecan hydrochloride (Day 35), several mice having an apparent recurrent tumor with a tumor volume of greater than 300 mm.sup.3 were observed. On the 30.sup.th day after the final administration of irinotecan hydrochloride (Day 47), a tumor with a tumor volume of greater than 300 mm.sup.3 was observed in 5 out of the 8 mice (mean tumor volume: 401.7.+-.172.7 mm.sup.3) In contrast, in the K5-70 antibody administration group, tumor recurrence was significantly suppressed, and the mean tumor volume was 180.5.+-.142.1 mm.sup.3 (P<0.05 by Student's t-test) (FIG. 32). In particular, in the K5-70 antibody administration group, the tumor volume on Day 47 became smaller than the tumor volume when the mice were divided into groups (126.0.+-.28.0 mm.sup.3) The tumor volume became less than 100 mm.sup.3 in 4 out of the 8 mice. From these results, it became clear that the anti-hTROP-2 antibody K5-70 has extremely strong suppressive action even on recurrent tumor after administration of irinotecan hydrochloride.
Example 30
[Epitope Mapping Using CLIPS Technology]
<Materials and Methods>
Peptide Synthesis
15-mer and 30-mer of linear peptides derived from TROP-2 extracellular domains, which were used in the present experiment, were obtained by solid-phase synthesis according to a Fmoc (9-Fluorenylmethoxycarbonyl) method. In addition, for discontinuous epitope analysis, a 17-mer peptides derived from a TROP-2 extracellular domain, to both ends of which cysteine residues had been added, was synthesized, and a conformation having one or two loop structures was reconstructed by CLIPS technology (Chemically Linked Peptides on Scaffolds technology). When another cysteine residue was present close to the added cysteine residue, it was substituted with alanine.
Epitope Screening ELISA
5034 types of the synthesized peptides were covalently bound to PEPSCAN cards (455 peptides/card), and the binding of the synthesized peptides to antibodies was then analyzed by the ELISA method. The PEPSCAN cards were allowed to react with anti-human TROP-2 monoclonal antibodies (K5-70, K5-107, K5-116-2-1, T5-86, and T6-16) that had been diluted to a concentration of 1 .mu.g/mL with a blocking buffer (a phosphate buffer containing 4% horse serum, 5% ovalbumin, and 1% TWEEN). After washing, the resultant was allowed to react with a 1000-fold diluted peroxidase-secondary antibody complex at 25.degree. C. for 1 hour. After washing, a substrate solution (a solution containing 2,2'-azino-di-3-ethylbenzthiazoline sulfonate (ABTS) and 2 .mu.L of 3% hydrogen peroxide solution) was added to the reaction solution, followed by a chromogenic reaction for 1 hour. The binding activity of the antibodies was quantified by photographing with a CCD camera and then performing an image analysis.
<Results>
The anti-hTROP-2 monoclonal antibodies K5-70, K5-107, K5-116-2-1, T5-86 and T6-16, which exhibited beneficial effects, were subjected to epitope analysis using CLIPS (Chemically Linked Peptides on Scaffolds) technology. It is to be noted that the term "amino acid number" is used in the present examples to mean the amino acid number in the amino acid sequence shown in SEQ ID NO: 2 (hTROP-2 protein (323 amino acid residues)).
The result of analysis for the K5-70 antibody is shown in Table 7 below. As a result, it was found that 33 peptides exhibit strong binding activity to the K5-70 antibody. In these 33 peptides, a sequence comprising VCSPDGPGGRCQCRALGSGMAVD (amino acid numbers 43-65 of SEQ ID NO: 2) (peptide Nos. 1-7 and 9 shown in Table 7), a sequence comprising HHILIDLRHRPTAG (amino acid numbers 152-165 of SEQ ID NO: 2) (peptide Nos. 14, 22-24 and 28 shown in Table 7), a sequence comprising VHYEQPTIQIELRQ (amino acid numbers 194-207 of SEQ ID NO: 2) (peptide Nos. 10, 12, 13, 18, 20, 21, 23, 26-28, 30 and 32 shown in Table 7), and a sequence comprising DLDLDAELRRLFRER (amino acid numbers 171-183 of SEQ ID NO: 2) (peptide Nos. 11, 16, 18, 19, 21, 22, 29, 31 and 33 shown in Table 7) appeared repeatedly. The K5-70 antibody particularly strongly bound to the sequence comprising VCSPDGPGGRCQCRALGSGMAVD (amino acid numbers 43-65 of SEQ ID NO: 2). From these results, it was suggested that, in the hTROP-2 protein, the aforementioned 4 types of peptide sequence regions are likely to be epitopes of the K5-70 antibody.
TABLE-US-00008 TABLE 7 Binding of K5-70 antibody to CLIPS peptides derived from human TROP-2 extracellular domains binding number peptide of K5-70 SEQ ID No. 1 NKMTVCSPDGPGGRCQCRALGSGMAVDCST 2742 101 2 TVCSPDGPGGRCQCRALGSGMAVDCSTLTS 2604 102 3 TNKMTVCSPDGPGGRCQCRALGSGMAVDCS 2562 103 4 MTVCSPDGPGGRCQCRALGSGMAVDCSTLT 2402 104 5 KMTVCSPDGPGGRCQCRALGSGMAVDCSTL 1770 105 6 PTNKMTVCSPDGPGGRCQCRALGSGMAVDC 1391 106 7 VCSPDGPGGRCQCRALGSGMAVDCSTLTSK 932 107 8 CAAVHYEQPTIQIELRCAAVHYEQPTIQIELRC 876 108 9 CPTNKMTVCSPDGPGGRCQCRALGSGMAVD 839 109 10 CVHYEQPTIQIELRQNCVHYEQPTIQIELRQNC 825 110 11 HSDLDAELRRLFRERCHSDLDAELRRLFRERC 725 111 12 RLFRERYRLHPKFVAAVHYEQPTIQIELRQ 687 112 13 AVHYEQPTIQIELRQ 642 113 14 CAGAFNHSDLDAELRRCHHILIDLRHRPTAGAC 624 114 15 CPKFVAAVHYEQPTIQCGLDLRVRGEPLQVERC 579 115 16 CHSDLDAELRRLFRERCGLDLRV 538 116 17 FQGRGGLDLRVRGEP 538 117 18 CVHYEQPTIQIELRQNCDLDAELRRLFRERYRC 524 118 19 CHSDLDAELRRLFRERCRGEPLQ 519 119 20 CFIQIELRQNTSQKAACVHYEQPTIQIELRQNC 513 120 21 CVHYEQPTIQIELRQNCHSDLDAELRRLFRERC 511 121 22 CHHILIDLRHRPTAGACHSDLDAELRRLFRERC 489 122 23 CHHILIDLRHRPTAGACVHYEQPTIQIELRQNC 489 123 24 CHHILIDLRHRPTAGACGLDLRVRGEPLQVERC 488 124 25 CDAELRRLFRERYRLHCDELVRTHHILIDLRHC 483 125 26 CVHYEQPTIQIELRQNC 483 126 27 CAFNHSDLDAELRRLFCVHYEQPTIQIELRQNC 478 127 28 CVHYEQPTIQIELRQNCHHILIDLRHRPTAGAC 473 128 29 CDLDAELRRLFRERYRCDELVRTHHILIDLRHC 472 129 30 VHYEQPTIQIELRQNCGLDLRVRGEPLQVERC 470 130 31 CDELVRTHHILIDLRHCDLDAELRRLFRERYRC 469 131 32 AVHYEQPTIQIELRQCAVHYEQPTIQIELRQC 468 132 33 CHSDLDAELRRLFRERCDELVRTHHILIDLRHC 466 133
The result of analysis for the K5-107 antibody is shown in Table 8 below. As a result, it was found that a sequence comprising VCSPDGPGGRCQCRALGSGMAVD (amino acid numbers 43-65 of SEQ ID NO: 2) was comprised in 9 out of the 20 peptides (peptide Nos. 1-6, 8, 9 and 17 shown in Table 8) (Table 8).
Accordingly, it was suggested that, in the hTROP-2 protein, the aforementioned peptide sequence region consisting of VCSPDGPGGRCQCRALGSGMAVD (amino acid numbers 43-65 of SEQ ID NO: 2) may be an epitope of the K5-107 antibody.
TABLE-US-00009 TABLE 8 Binding of K5-107 antibody to CLIPS pevides derived from human TROP-2 extracellular domains binding SEQ number peptide K5-107 ID No 1 TNKMTVCSPDGPGGRCQCRALGSGMAVDCS 2763 134 2 NKMTVCSPDGPGGRCQCRALGSGMAVDCST 2761 135 3 KMTVCSPDGPGGRCQCRALGSGMAVDCSTL 2752 136 4 MTVCSPDGPGGRCQCRALGSGMAVDCSTLT 272 137 5 CPTNKMTVCSPDGPGGRCQCRALGSGMAVD 2723 138 6 TVCSPDGPGGRCQCRALGSGMAVDCSTLTS 2720 139 7 TCPTNKMTVCSPDGPGGRCQCRALGSGMAV 2716 140 8 VCSPDGPGGRCQCRALGSGMAVDCSTLTSK 2689 141 9 CSPDGPGGRCQCRALGSGMAVDCSTLTSKC 2655 142 10 CTCPTNKMTVCSPDGPGGRCQCRALSGSMA 2655 143 11 NCTCPTNKMTVCSPDGPGGRCQCRALGSGM 2207 144 12 DNCTCPTNKMTVCSPDGPGGRCQCRALGSG 1816 145 13 TNKMTVCSPDGPGGRCQCRALSGSMAVDCS 1525 146 14 CTVCSPDGPGGRCQCRALGSGMAVDASTLTSKC 1118 147 15 QDNCTCPTNKMTVCSPDGPGGRCQCRALGS 574 148 16 SPDGPGGRCQCRALGSGMAVDCSTLTSKCL 561 149 17 CTNKMTVCSPDGPGGRCQCRALGSGMAVDASTC 380 150 18 TVCSPDGPGGRCQCR 312 151 19 CAPKNARTLVRPSEHACARTLVRPSHEALVDNC 284 152 20 HSDLDAELRRLFRFRCHSDLDAELRRLFRERC 272 153
The result of analysis for the K5-116-2-1 antibody is shown in Table 9 below. In this analysis, three types of peptide sequences, namely, a sequence comprising VCSPDGPGGRCQCRALGSGMAVD (amino acid numbers 43-65 of SEQ ID NO: 2) (peptide Nos. 1-7, and 15 shown in Table 9), a sequence comprising HHILIDLRHRPTAG (amino acid numbers 152-165 of SEQ ID NO: 2) (peptide Nos. 8-11, 16, 20, 22, 24, and 27-28 shown in Table 9), and a sequence comprising DLDAELRRLFRER (amino acid numbers 171-183 of SEQ ID NO: 2) (peptide Nos. 11-13, 17, 21, and 29 shown in Table 9) appeared several times (Table 9). Accordingly, it was suggested that, in the hTROP-2 protein, these three types of peptide sequence regions may be epitopes of the K5-116-2-1 antibody.
TABLE-US-00010 TABLE 9 Binding of K5-116-2-1 antibody to CLIPS peptides derived from human TROP-2 extracellular domains binding of SEQ number peptide K5-116-2-1 ID No. 1 TVCSPDGPGGRCQCRALGSGMAVDCSTLTS 2672 154 2 NKMTVCSPDGPGGRCQCRALGSGMAVDCST 2613 155 3 TNKMTVCSPDGPGGRCQCRALGSGMAVDCS 2482 156 4 MTVCSPDGPGGRCQCRALGSGMAVDCSTLT 2440 157 5 KMTVCSPDGPGGRCQCRALGSGMAVDCSTL 2423 158 6 CPTNKMTVCSPDGPGGRCQCRALGSGMAVD 2136 159 7 PTNKMTVCSPDGPGGRCQCRALGSGMAVDC 1723 160 8 CAGAFNHSDLDAELRRCHHILIDLRHRPTAGAC 1643 161 9 CTHHILIDLRHRPTAGC 1586 162 10 CVHYEQPTIQIELRQNCHHILIDLRHRPTAGAC 1504 163 11 CHHILIDLRHRPTAGACHSDLDAELRRLFRERC 1475 164 12 HSDLDAELRRLFRERCHSDLDAELRRLFRERC 1467 165 13 CDAELRRLFRERYRLHCHSDLDAELRRLFRERC 1462 166 14 CDAELRRLFRERYRLHCPK 1442 167 15 VCSPDGPGGRCQCRALGSGMAVDCSTLTSK 1432 168 16 DLSLRCDELVRTHHILIDLRHRPTAGAFNH 1421 169 17 CDELVRTHHILIDLRHCDLDAELRRLFRERYRC 1392 170 18 CFQGRGGLDLRVRGEPC 1376 171 19 CDAELRRLFRERYRLHCDELVRTHHILIDLRHC 1366 172 20 CGLDLRVRGEPLQVERCHHILIDLRHRPTAGAC 1342 173 21 CHSDLDAELRRLFRERCHSDLDAELRRLFRERC 1331 174 22 CDELVRTHHILIDLRHCHHILIDLRHRPTAGAC 1323 175 23 CDAELRRLFRERYRLHCDELVRTHHILIDLRHC 1266 176 24 CHHILIDLRHRPTAGACRGEPLQVERTLIYYLC 1229 177 25 CSPDGPGGRCQCRAL 1227 178 26 CTVASPDGPGGRAQARCVHYEQPTIQIELRQNC 1223 179 27 CHHILIDLRHRPTAGACVHYEQPTIQIELRQNC 1222 180 28 LSLRCDELVRTHHILIDLRHRPTAGAFNHS 1220 181 29 CDELVRTHHILIDLRHCHSDLDAELRRLFRERC 1205 182
The results of analysis for the T5-86 and T6-16 antibodies are shown in Table 10 and Table 11 below, respectively. In these analyses, the antibodies strongly bound to a peptide comprising a sequence consisting of DPEGRFKARQCN (amino acid numbers 109-120 of SEQ ID NO: 2). The above-mentioned peptide sequence was comprised in several peptides binding to the T5-86 antibody as shown in Table 10, and it was comprised in several peptides binding to the T6-16 antibody as shown in Table 11. Moreover, in the analysis regarding the T5-86 antibody, other than the sequence comprising DPEGRFKARQCN[ ] (amino acid numbers 109-120 of SEQ ID NO: 2), a sequence comprising VCSPDGPGGRCQCRA (amino acid numbers 43-57 of SEQ ID NO: 2) appeared several times (as shown in Table 10). Furthermore, in the analysis regarding the T6-16 antibody as well, another sequence comprising HHILIDLRHRPTAG (amino acid numbers 152-165 of SEQ ID NO: 2) (shown in Table 11) was found several times. Accordingly, it was suggested that, in the hTROP-2 protein, two types of peptide sequence regions, namely, DPEGRFKARQCN (amino acid numbers 109-120 of SEQ ID NO: 2) and VCSPDGPGGRCQCRA (amino acid numbers 43-57 of SEQ ID NO: 2), may be epitopes of the K5-86 antibody. It was also suggested that, in the hTROP-2 protein, two types of peptide sequence regions, namely, DPEGRFKARQCN (amino acid numbers 109-120 of SEQ ID NO: 2) and HHILIDLRHRPTAG (amino acid numbers 152-165 of SEQ ID NO: 2), may be epitopes of the T6-16 antibody.
TABLE-US-00011 TABLE 10 Binding of TS-86 antibody to CLTS peptides derived from human TROP-2 extracellular domains binding SEQ ID number peptide of TS-86 NO. 1 CYDPDADPEGRFKARQCADFEGRFKAPQANCTC 2306 183 2 PDCEPFGRFKARQCN 2292 184 3 CARPFGRFKARQANCPDAADPEGRFKARQANC 2287 185 4 VCSPDGPGRCQCRA 2263 186 5 CYDPDADPFGRFKARQCPFADPEGR 2260 187 FKARQANC 6 CADPEGRFKARQANQTCTDPDADFEGRFKARQ 2240 188 7 CADPEGRFKARQANQTCTDPDADFEGRFKARQ 2208 189 8 DCDPEGRFKARQ 2150 190 9 CTVASPDGPGGRAQARCHSDLDAELRRLFRERC 2086 191 10 CDADPFGRFKARQANQCDADPEGRFKARQANQC 2035 192 11 DGRFKARQANQTSVAWCARTLVRPSEHALVDNC 2019 193 12 DADPEGRFKARQANQTCPDADPEDRFKARQANC 1980 194 13 CPDADPEGRFKARQANCPDADPEGFRKARQANC 1950 195 14 CSPEDGPGGRQCRAL 1946 196 15 CEGRFKARQANQTSVACEGRFKARQANQTSVAC 1895 197 16 CfVASPDGPGGRAQARCPDADPEGRFKARQANC 1890 198 17 CGLYDPDADPFGRFKACPDADPEGRFKARQANC 1857 199 18 DPDCDPEGRFKARQCNCQTSVCWCVNSVGVR 1850 200 19 CPEDRFKARQAQNQTSVCDELVRHHILIDIRHC 1841 201 20 CPDGPGGRAQARALGSCHSDLDAELRRLFRERC 1830 202 21 CTLVRPSEHALVDNDGCGRFKARQANQSVAWC 1820 203 22 CPDADPEGRFKARQANCYDPDADPEGRFKARQC 1795 204 23 CGLYDPDADPEDRFKACPEDRFKARQANQTSVC 1793 205 24 YDPDCDPEGRFKARC 1775 206 25 CPDADPDFRFKARQANCADPEFRFKARQAHQTC 1773 207 26 CDPEGRFKARQCNQ 1772 208
TABLE-US-00012 TABLE 11 Binding of T6-16 antibody to CLIPS peptides derived from human TROP-2 extracellular domains binding SEQ number peptide of 16-16 ID No. 1 CVNSVGVRRTDKGDLSCYDPDADPEGRFKARQC 1072 209 2 CSVGVRRTDKGDLSLRCYDPDADPEGRFKARQC 786 210 3 HSDLDAELRRLFRERCHSDLDAELRRLFRERC 714 211 4 CDELVRTHHILIDLRHCDLDAELRRLFRERYRC 713 212 5 CVNSVGVRRTDKGDLSLRCDELVRTHHILI 688 213 6 VRRTDKGDLSLRCDELVRTHHILIDLRHRP 670 214 7 CVERTLIYYLDEIPPKCHHILIDLRHRPTAGAC 626 215 8 CHHILIDLRHRPTAGACHSDLDAELRRLFRERC 620 216 9 CVNSVGVRRTDKGDLSCPDADPEGRFKARQANC 611 217 10 CVHYEQPTIQIELRQNCHHILIDLRHRPTAGAC 602 218 11 VGVRRTDKGDLSLRCDELVRTHHILIDLRH 601 219 12 CAGAFNHSDLDAELRRCHHILIDLRHRPTAGAC 592 220 13 CSVGVRRTDKGDLSLRCPDADPEGRFKARQANC 585 221 14 CVRPSEHALVDNDGLYCSVGVRRTDKGDLSLRC 573 222 15 CDAELRRLFRERYRLHCHSDLDAELRRLFRERC 566 223 16 CSVGVRRTDKGDLSLRCNDGLYDPDADPEGRFC 559 224 17 CVNSVGVRRTDKGDLSCGLYDPDADPEGRFKAC 553 225 18 CDLDAELRRLFRERYRCHSDLDAELRRLFRERC 534 226 19 CDELVRTHHILIDLRHCHHILIDLRHRPTAGAC 534 227 20 CAGAFNHSDLDAELRRCDLDAELRRLFRERYRC 529 228 21 CDAELRRLFRERYRLHCDELVRTHHILIDLRHC 527 229 22 CVHYEQPTIQIELRQNCDLDAELRRLFRERYRC 526 230 23 CHHILIDLRHRPTAGACVHYEQPTIQIELRQNC 524 231 24 CGVRRTDKGDLSLRADCGVRRTDKGDLSLRADC 524 232 25 CGLDLRVRGEPLQVERCHHILIDLRHRPTAGAC 521 233 26 CDLDAELRRLFRERYRCDELVRTHHILIDLRHC 516 234
Example 311
[Sequencing of Variable Regions of Antibody Genes of Mouse Anti-hTROP-2 Antibodies (Clones K5-70, K5-107, K5-116-2-1 and T6-16)]
Total RNA was extracted from 3.times.10.sup.6 mouse anti-TROP-2 monoclonal antibody-producing hybridomas, using TRIzol reagent (Invitrogen). With regard to the clone K5-70, clone K5-107 and clone K5-116-2-1, cDNA was synthesized employing SMARTer.TM. RACE cDNA Amplification kit (Clontech) according to the method included with the kit, using a mouse IgG H chain-specific primer (5'-TCCAKAGTTCCA-3' (SEQ ID NO: 24)) and a mouse IgG L chain-specific primer (5'-GCTGTCCTGATC-3' (SEQ ID NO: 25)). With regard to the clone T6-16, cDNA was synthesized employing GeneRacer kit (Invitrogen) according to the method included with the kit, using an oligo dT primer. Genes encoding the variable regions (VH, VL) of the H and L chains of clone K5-70 (mouse IgG2a), clone K5-107 (mouse IgG1) and clone K5-116-2-1 (mouse IgG2a) were each cloned by a PCR method using the above-synthesized cDNA as a template. In this operation, 10.times. Universal Primer A Mix (UPM) included with SMARTer.TM. RACE cDNA Amplification kit was used as a 5'-primer. On the other hand, as a 3'-primer for VH amplification, a primer having a sequence specific to the mouse IgG H chain was used, and as a 3'-primer for VL amplification, a primer having a sequence specific to the mouse IgG L chain was used.
TABLE-US-00013 5'-Primer (10 .times. Universal Primer A Mix (UPM)): Long (0.4 .mu.M) (SEQ ID NO: 26) 5'-CTAATACGACTCACTATAGGGCAAGCAGTGGTATCAACGCAGAGT- 3' Short (2 .mu.M) (SEQ ID NO: 27) 5'-CTAATACGACTCACTATAGGGC-3' 3'-Primer (R primer): VH: (SEQ ID NO: 28) 5'-GGGAARTARCCCTTGACCAGGCA-3' (SEQ ID NO: 29) 5'-GGGAARTAGCCTTTGACAAGGCA-3' VL: (SEQ ID NO: 30) 5'-CACTGCCATCAATVCTCCACTTGACA-3'
Using each of the above-described primers, PCR was carried out under the following composition of reaction solution and reaction conditions. In addition, a R primer for amplification of VH cDNA was prepared by mixing the two above sequences with each other at an equimolar ratio and was then used.
TABLE-US-00014 <Composition of reaction solution> Template cDNA: 2.5 .mu.L 5 .times. PrimeSTAR buffer (Mg.sup.2+ plus): 10 .mu.L 2.5 mM dNTP: 4 .mu.L PrimeSTAR HS DNA polymerase (2.5 U/.mu.L): 0.5 .mu.L 10 .times. Universal Primer A Mix (UPM): 5 .mu.L R primer (10 .mu.M): 1 .mu.L Sterilized water: 27 .mu.L Total: 50 .mu.L
<Reaction Conditions>
A reaction was carried out at 94.degree. C. (10 sec), and thereafter, a cycle consisting of "heat denaturation/dissociation at 98.degree. C. (10 sec).fwdarw.annealing at 60.degree. C. (5 sec).fwdarw.synthesis/elongation at 72.degree. C. (60 sec)" was carried out 30 times in total. Finally, a reaction was carried out at 72.degree. C. (3 min).
The synthesized VH and VL cDNAs were subcloned into a pMD20-T vector (Takara Bio Inc.), and the nucleotide sequences thereof were determined. The nucleotide sequences of a plurality of VH clones and VL clones were decoded, and nucleotide sequences specific to the variable regions of mouse H chain and L chain were identified. FIG. 33 and FIG. 34 show the consensus cDNA nucleotide sequences of the VH and VL of K5-70, and putative amino acid sequences. FIG. 35 and FIG. 36 show the consensus cDNA nucleotide sequences of the VH and VL of K5-107, and putative amino acid sequences. FIG. 37 and FIG. 38 show the consensus cDNA nucleotide sequences of the VH and VL of K5-116-2-1, and putative amino acid sequences.
Genes encoding the variable regions (VH, VL) of the H and L chains of clone T6-16 were cloned by a PCR method using the above-synthesized cDNA as a template. In this operation, a primer included with GeneRacer kit was used as a 5'-primer. On the other hand, as a 3'-primer for VH amplification, a primer having a sequence specific to the mouse IgG H chain was used, and as a 3'-primer for VL amplification, a primer having a sequence specific to the mouse IgG L chain was used.
TABLE-US-00015 5'-Primer (F primer): (SEQ ID NO: 31) 5'-CGACTGGAGCACGAGGACACTGA-3' 3'-Primer (R primer): VH: (SEQ ID NO: 32) 5'-GCCAGTGGATAGACAGATGG-3' VL: (SEQ ID NO: 33) 5'-GATGGATACAGTTGGTGCAGC-3'
Using each of the above-described primers, PCR was carried out under the following composition of reaction solution and reaction conditions.
<Composition of Reaction Solution>
TABLE-US-00016 Template cDNA: 1.0 .mu.L 5 .times. PrimeSTAR buffer (Mg.sup.2+ plus): 10 .mu.L 2.5 mM dNTP: 4 .mu.L PrimeSTAR HS DNA polymerase (2.5 U/.mu.L): 0.5 .mu.L F primer (10 .mu.M): 3 .mu.L R primer (10 .mu.M): 1.0 .mu.L Sterilized water: 30.5 .mu.L Total: 50 .mu.L
<Reaction Conditions>
A cycle consisting of "heat denaturation/dissociation at 98.degree. C. (10 sec).fwdarw.annealing at 57.degree. C. (10 sec).fwdarw.synthesis/elongation at 72.degree. C. (60 sec)" was carried out 35 times in total.
The synthesized VH and VL cDNAs were subcloned into a pCR.TM.4 Blunt-TOPO.RTM. vector (Invitrogen), and the nucleotide sequences thereof were determined. The nucleotide sequences of a plurality of VH clones and VL clones were decoded, and nucleotide sequences specific to the variable regions of mouse H chain and L chain were identified. FIG. 39 and FIG. 40 show the consensus cDNA nucleotide sequences of the VH and VL of T6-16, and putative amino acid sequences.
Example 32
[Design of Humanized K5-70 Antibody]
Humanization of the variable regions (VH, VL) of the K5-70 antibody prepared in the previous Examples was carried out as follows according to the method of Queen et al. (Proc. Natl. Acad. Sci. USA 86: 10029-10033, 1989). First, the molecular modeling of the three-dimentional structure of each K5-70 antibody variable region was carried out using a computer. Subsequently, homology search was performed with the variable region sequences of human antibody genes. As a result, a cDNA sequence (DA980102 VH) with GenBank accession number of DA980102 was selected as an acceptor that provides a framework region (FR) necessary for humanization of the K5-70 VH (Genome Res. 16:55-65, 2006). Likewise, a cDNA sequence (L41174 VL) with GenBank accession number of L41174 was selected as an acceptor that provides a framework region (FR) necessary for humanization of the K5-70 VL (J. Biol. Chem. 270:12457-12465, 1995).
For humanization of the K5-70 VH, the CDR sequence of the K5-70 VH was substituted with the corresponding position of the DA980102 VH used as an acceptor. As a result of the analysis of the three-dimensional structure according to computer modeling, with regard to amino acid residues (isoleucine (I) at position 48, lysine (K) at position 66, alanine (A) at position 67, valine (V) at position 71 and threonine (T) at position 93) that are adjacent to the CDR of the K5-70 VH and are assumed to play important roles for the maintenance of the structure, those of the K5-70 VH were retained, and the residual FR region was substituted with the acceptor sequence. The amino acid residue position numbers in VH and VL were used in accordance with the definitions of Kabat et al. (Sequences of Proteins of Immunological Interests, Fifth edition, NIH Publication No. 91-3242, U.S. Department of Health and Human Services, 1991).
Moreover, the methionine (M) as an amino acid residue at position 82 of the acceptor sequence DA980102 VH was highly likely to be a special amino acid residue caused by somatic hypermutation. Thus, in order to decrease potential antigenicity, the aforementioned methionine was substituted with leucine (L) that is most common as an amino acid residue at position 82. An alignment of the amino acid sequences of the thus designed humanized K5-70 VH (HuK5-70 VH), K5-70 VH and DA980102 VH is shown in FIG. 41.
With regard to the design of humanized K5-70 VL as well, the same transplantation of a CDR sequence as described above was carried out. As an amino acid residue (lysine (K) at position 49) important for the maintenance of the structure of CDR, that of the K5-70 VL was retained, and the residual FR region was substituted with the acceptor sequence (HuK5-70 VL). An alignment of the amino acid sequences of the HuK5-70 VL, K5-70 VL and L41174 VL is shown in FIG. 42.
Example 33
[Design of Humanized T6-16 Antibody]
Humanization of the variable regions (VH, VL) of the T6-16 antibody prepared in the previous Examples was carried out as follows according to the method of Queen et al. (Proc. Natl. Acad. Sci. USA 86: 10029-10033, 1989). First, the molecular modeling of the three-dimentional structure of each T6-16 antibody variable region was carried out using a computer. Subsequently, homology search was performed with the variable region sequences of human antibody genes. As a result, a cDNA sequence (DA935238 VH) with GenBank accession number of DA935238 was selected as an acceptor that provides a framework region (FR) necessary for humanization of the T6-16 VH (Genome Res. 16:55-65, 2006). Likewise, a cDNA sequence (M99608 VL) with GenBank accession number of M99608 was selected as an acceptor that provides a framework region (FR) necessary for humanization of the T6-16 VL (J. Immunol. 149:2518-2529, 1992).
For humanization of the T6-16 VH, the CDR sequence of the T6-16 VH was substituted with the corresponding position of the DA935238 VH used as an acceptor. As a result of the analysis of the three-dimensional structure according to computer modeling, with regard to amino acid residues (isoleucine (I) at position 48, alanine (A) at position 67 and lysine (K) at position 73) that are adjacent to the CDR of the T6-16 VH and are assumed to play important roles for the maintenance of the structure, those of the T6-16 VH were retained, and the residual FR region was substituted with the acceptor sequence (HuT6-16 VH1). In addition, the lysine residue (K) at position 73 was unlikely to have influence on appropriate formation of an antigen-binding site, and thus, an amino acid sequence, in which the lysine residue of the HuT6-16 VH1 was substituted with threonine (T) as a more generous amino acid residue, was designed, separately (HuT6-16 VH2). An alignment of the amino acid sequences of the thus designed humanized T6-16 VH (HuT6-16 VH1 and HuT6-16 VH2), T6-16 VH and DA935238 VH is shown in FIG. 43.
With regard to the design of humanized T6-16 VL as well, the same transplantation of a CDR sequence as described above was carried out. Amino acid residues important for the maintenance of the structure of CDR were retained also in the acceptor sequence, and as a FR sequence, the same sequence as the acceptor sequence was used (HuT6-16 VL). An alignment of the amino acid sequences of the HuT6-16 VL, T6-16 VL and L41174 VL is shown in FIG. 44.
Example 34
[Synthesis of Humanized K5-70 VH and VL Genes]
Genes encoding HuK5-70 VH and HuK5-70 VL were prepared as follows. The gene were synthesized based on an amino acid sequence in which a signal peptide sequence derived from K5-70 VH or VL had been added to the N-terminal side of each of the above-designed HuK5-70 VH and VL (Operon). In this gene synthetic operation, a Kozak sequence (ACC ACC) was added to the 5'-terminal side of the gene sequence of each of the synthesized HuK5-70 VH and HuK5-70 VL. In addition, an EcoRI site (GAA TTC) was added as a restriction enzyme site to the 5' end of the HuK5-70 VH, and an NheI site (GCT AGC) was added to the 3' end thereof. Likewise, an AgeI site (ACC GGT) was added as a restriction enzyme site to the 5' end of the HuK5-70 VL, and a BsiWI site (CGT ACG) was added to the 3' end thereof. The synthesized HuK5-70 VH gene and HuK5-70 VL gene were incorporated into a pCR2.1 vector (Invitrogen) according to TA cloning. The gene sequences of the HuK5-70 VH and VL prepared by the gene synthesis are shown in FIGS. 45 and 46, respectively.
Example 35
[Synthesis of Humanized T6-16 VH1, T6-16 VH2 and T6-16 VL Genes]
Genes encoding HuT6-16 VH1, HuT6-16 VH2 and HuT6-16 VL were prepared as follows. The gene were synthesized, based on an amino acid sequence in which a signal peptide sequence derived from T6-16 VH had been added to the N-terminal side of each of the above-designed HuT6-16 VH1 and HuT6-16 VH2, and an amino acid sequence in which a signal peptide sequence derived from T6-16 VL had been added to the N-terminal side of the HuT6-16 VL (Operon). In this gene synthetic operation, a Kozak sequence (ACC ACC) was added to the 5'-terminal side of the gene sequence of each of the synthesized HuT6-16 VH1, HuT6-16 VH2 and HuT6-16 VL. In addition, an EcoRI site (GAA TTC) was added as a restriction enzyme site to the 5' end of each of the HuT6-16 VH1 and HuT6-16 VH2, and an NheI site (GCT AGC) was added to the 3' end thereof. Likewise, an AgeI site (ACC GGT) was added as a restriction enzyme site to the 5' end of the humanized T6-16VL, and a BsiWI site (CGT ACG) was added to the 3' end thereof. The synthesized HuT6-16 VH1 gene, HuT6-16 VH2 gene and HuT6-16 VL gene were incorporated into a pCR2.1 vector (Invitrogen) according to TA cloning.
The gene sequences of the HuT6-16 VH1, HuT6-16 VH2 and HuT6-16 VL prepared by the gene synthesis are shown in FIGS. 47 to 49, respectively.
Example 36
[Construction of Gene Expression Vectors for Humanized K5-70 VH and VL Genes]
The HuK5-70 VH and VL genes, which had been each incorporated into the pCR2.1 vector (Invitrogen), were digested with the restriction enzymes EcoRI and NheI, and AgeI and BsiWI, respectively, and gene fragments were then recovered. Subsequently, the cleaved HuK5-70 VH gene was inserted into the EcoRI/NheI site of a pFUSE-CHIg-hG1 vector (InvivoGen) as an animal cell expression vector for the expression of a human IgG1 form (pFUSE-CHIg-HuK5-70), whereas the HuK5-70 VL gene was inserted into the AgeI/BsiWI site of a pFUSE2-CLIg-hk vector (InvivoGen) as a human Ig.kappa. form expression vector (pFUSE2-CLIg-HuK5-70). Thus, each construct was completed.
Example 37
[Construction of Gene Expression Vectors for Humanized T6-16 VH1, T6-16 VH2 and T6-16 VL Genes]
The T6-16 VH1 and T6-16 VH2 genes, which had been each incorporated into the pCR2.1 vector (Invitrogen), were digested with the restriction enzymes EcoRI and NheI, and the T6-16 VL gene was digested with the restriction enzymes AgeI and BsiWI. Then, gene fragments were recovered. Subsequently, the cleaved T6-16 VH1 gene was inserted into the EcoRI/NheI site of a pFUSE-CHIg-hG1 vector (InvivoGen) (pFUSE-CHIg-HuT6-16-1), and the T6-16 VH2 gene was also inserted into the EcoRI/NheI site of a pFUSE-CHIg-hG1 vector (pFUSE-CHIg-HuT6-16-2). The T6-16 VL gene was inserted into the AgeI/BsiWI site of a pFUSE2-CLIg-hk vector (InvivoGen) (pFUSE2-CLIg-HuT6-16). Thus, each construct was completed.
Example 38
[Establishment of 293F Cell Line Capable of Stably Expressing HuK5-70 Antibody, HuT6-16-1 Antibody and HuT6-16-2 Antibody]
293F cells (Invitrogen) were maintained and cultured in FreeStyle 293 Expression Medium (Invitrogen). Genes were introduced into the 293F cells using a 293 fectin reagent (Invitrogen) in accordance with protocols included therewith. That is, pFUSE-CHIg-HuK5-70 and pFUSE2-CLIg-HuK5-70 were both introduced into the 293F cells, and drug selection was then carried out using Zeocin (InvivoGen) and Blasticidin (InvivoGen), so as to establish a cell line capable of stably expressing a HuK5-70 antibody. Also, pFUSE-CHIg-HuT6-16-1 and pFUSE2-CLIg-HuT6-16 were both introduced into the 293F cells, and the above-mentioned drug selection was then carried out, so as to establish a cell line capable of stably expressing a HuT6-16-1 antibody. Also, pFUSE-CHIg-HuT6-16-2 and pFUSE2-CLIg-HuT6-16 were both introduced into the 293F cells, and the above-mentioned drug selection was then carried out, so as to establish a cell line capable of stably expressing a HuT6-16-2 antibody.
Example 39
[Purification of HuK5-70 Antibody, HuT6-16-1 Antibody and HuT6-16-2 Antibody Proteins]
The established antibody-expressing cell lines were each inoculated on FreeStyle 293 Expression Medium (Invitrogen) at a cell density of 1 to 2.5.times.10.sup.5 cells/ml, and thereafter, roller bottle culture was carried out for 6 to 8 days. Thereafter, a culture supernatant was recovered, and each humanized antibody was then purified using rProtein A Sepharose Fast Flow (GE Healthcare) according to an ordinary method.
FIG. 50 shows the results obtained by confirming by Western blotting the expression of each humanized antibody protein in a culture supernatant of the 293F cells, in which a HuK5-70 antibody, a HuT6-16-1 antibody and a HuT6-16-2 antibody were expressed. Specifically, after completion of SDS-PAGE, each protein was transferred on a PVDF membrane (Immobilon-P, Millipore, IPVH00010). The membrane was blocked at room temperature for 30 minutes using TBS (Tris-buffered saline) containing 5% skim milk. The resultant was washed with 0.1% TBST (TBS containing 0.1% TWEEN 20) for 5 minutes three times, and was then allowed to react with a primary antibody.
Lane 1 indicates a culture supernatant of 293F cells into which no genes had been introduced (negative control), and lane 2 indicates a culture supernatant of 293F cells into which pFUSE-CHIg-HuK5-70 and pFUSE2-CLIg-HuK5-70 had been introduced. For detection of the heavy chain and light chain proteins of the HuK5-70 antibody, a biotin-labeled anti-human IgG F(ab').sup.2 antibody (Rockland) was used. Lane 3 indicates a culture supernatant of 293F cells into which pFUSE-CHIg-HuT6-16-1 and pFUSE2-CLIg-HuT6-16 had been introduced, and lane 4 indicates a culture supernatant of 293F cells into which pFUSE-CHIg-HuT6-16-2 and pFUSE2-CLIg-HuT6-16 had been introduced. The heavy chain proteins of the HuT6-16-1 antibody and the HuT6-16-2 antibody were detected with a biotin-labeled anti-human IgG Fc antibody (Rockland), whereas the light chain proteins of the HuT6-16-1 antibody and the HuT6-16-2 antibody were detected with a biotin-labeled anti-human IgG F(ab').sup.2 antibody (Rockland).
As a result, in all cases of the HuK5-70 antibody, the HuT6-16-1 antibody and the HuT6-16-2 antibody, the expression of heavy chain and light chain proteins was confirmed in each culture supernatant.
Moreover, FIG. 51 shows the results obtained by loading the purified HuK5-70 antibody, HuT6-16-1 antibody and HuT6-16-2 antibody on SDS-PAGE and then staining them with CBB. In all of the cases, a heavy chain of approximately 50 kD and a light chain of approximately 25 kD were detected under reducing conditions, and bands were confirmed in the same positions as the heavy chain and light chain detected by the above-described Western blotting. From these results, it was confirmed that a HuK5-70 antibody protein, a HuT6-16-1 antibody protein and a HuT6-16-2 antibody protein were generated.
Example 40
[Antigen Affinity of Humanized K5-70 Antibody (HuK5-70) and Humanized T6-16 Antibodies (HuT6-16-1 and HuT6-16-2)]
The antigen affinity of the purified HuK5-70 antibody, HuT6-16-1 antibody and HuT6-16-2 antibody was examined by methods using FACS and ELISA.
FACS was carried out, using HEK293-hTROP-2 cells in which a full-length human TROP-2 gene was stably expressed in HEK293 cells, and a pancreatic cancer cell line PK-59 which endogenously expressed a human TROP-2 protein on the cell surface. 100 .mu.l of an antibody solution used as a primary antibody, which had been diluted to 1 .mu.g/ml with a medium containing 10% FCS, was added to a suspension (5.times.10.sup.5 cells) of cells (HEK293-hTROP-2 cells or PK-59 cells), which had been removed from a culture dish by treatment with trypsin, and the obtained mixture was then incubated at 4.degree. C. for 20 minutes. Thereafter, the resultant was washed with 1 ml of a medium containing 10% FCS. Then, secondary antibody (100 .mu.l each), in which a phycoerythrin (PE)-labeled anti-mouse IgG antibody (BD Pharmingen) or a biotin-labeled anti-human IgG Fc antibody (Rockland) was diluted up to 200 times or 2000 times, respectively, was added to the resultant. The obtained mixture was incubated at 4.degree. C. for 20 minutes, and was then washed with 1 ml of a medium containing 10% FCS again. In a case in which the biotin-labeled anti-human IgG Fc antibody was used as a secondary antibody, 100 .mu.l of a labeling solution, in which streptavidin-labeled PE (BD Pharmingen) was diluted up to 400 times, was added thereto as a fluorescence labeling reagent. Thereafter, the obtained mixture was incubated at 4.degree. C. for 20 minutes, and was then washed with 1 ml of a medium containing 10% FCS. Subsequently, the sample containing labeled cells was suspended in 1 ml of PBS containing 1% FCS and 2 mM EDTA, and the obtained suspension was then analyzed using FACSCalibur (Becton Dickinson). As a result, it was found that the HuK5-70 antibody showed reactivity equivalent to that of a mouse K5-70 antibody both in the HEK293-hTROP-2 cells and in the PK-59 cells. Likewise, the HuT6-16-1 antibody and the HuT6-16-2 antibody showed reactivity equivalent to that of a T6-16 antibody (FIG. 52).
Furthermore, antigen affinity was also examined by an ELISA method. ELISA was carried out using an ELISA plate which was coated with the recombinant protein of the hTROP-2 extracellular region as described in Example 3. Specifically, a 96-well plate (BD FALCON) was coated with a 50 .mu.l/well recombinant protein of a hTROP-2 extracellular region that had been diluted with PBS to 0.5 .mu.g/ml (at 4.degree. C. overnight). Thereafter, the resultant was washed with a washing buffer (PBS containing 0.05% TWEEN 20), and a blocking buffer (PBS containing 2% skim milk and 0.05% TWEEN 20) was then added thereto (200 .mu.l/well) to block it (at room temperature for 1 hour). The resultant was washed with a washing buffer. Thereafter, a HuK5-70 antibody, a HuT6-16-1 antibody, a HuT6-16-2 antibody, a K5-70 antibody and a T6-16 antibody were diluted with an ELISA buffer (PBS containing 1% skim milk and 0.025% TWEEN 20) in a concentration range from 3.05.times.10.sup.-4 to 5 .mu.g/ml, so as to prepare a series of two-fold dilution samples. The obtained dilution samples were each added in an amount of 50 .mu.l/well to the above-described ELISA plate (at room temperature for 2 hours). The reaction product was washed with a washing buffer, and thereafter, a HRP-labeled goat anti-human .kappa. chain antibody (SouthernBiotech) or a HRP-labeled sheep anti-mouse IgG antibody (GE Healthcare), each of which had been diluted to 2000 times with an ELISA buffer, was added (50 .mu.l/well) as a detection antibody to the reaction product (at room temperature for 1 hour). After the mixture had been washed with a washing buffer, a TMB (3,3',5,5'-tetramethylbenzidine: SIGMA) substrate solution was added (50 .mu.l/well) to the resultant to carry out a color reaction. Then, 1 M sulfuric acid (25 .mu.l/well) was added to the reaction product to terminate the reaction. Using Microplate reader Model 550 (BioRad), an absorbance at 450 nm was measured with an absorbance at 655 nm used as a reference. As a result, the reaction curves of K5-70 and HuK5-70 were almost overlapped with each other, and the EC50 values thereof were 27 ng/ml and 22 ng/ml, respectively (FIG. 53). Also, the reaction curves of T6-16, HuT6-16-1 and HuT6-16-2 were almost overlapped with one another, and the EC50 values thereof were 30 ng/ml, 27 ng/ml and 27 ng/ml, respectively (FIG. 54). From these results, it became clear that all of the HuK5-70 antibody, the HuT6-16-1 antibody and the HuT6-16-2 antibody exhibit antigen affinity equivalent to that of the K5-70 or T6-16 antibody that is a parent antibody before humanization.
Example 41
[Anti-Tumor Activity of Humanized Anti-hTROP-2 Antibody (HuK5-70) In Vivo]
Subsequently, the anti-tumor activity of a HuK5-70 antibody in vivo was examined with xenograft treatment models using a human colon cancer cell line SW480, which endogenously expresses human TROP-2 on the cell surface. SW480 cells (5.times.10.sup.6 cells) were subcutaneously transplanted into the right flank of each of 7-week-old female NOD-scid mice (Day 1). When the mean tumor volume reached 100 mm.sup.3, grouping was carried out (Day 9). From Day 9, intraperitoneal administration of the antibody was carried out at administration intervals of once every three days. On the 39.sup.th day after the cancer cell transplantation (Day 39), the tumor volume of a control group (PBS administration, N=8) was 824.3.+-.188.8 mm.sup.3. On the other hand, the tumor volume of a HuK5-70 antibody administration group (10 mg/kg body weight, N=8) was 455.5.+-.208.6 mm.sup.3 (P<0.01 by Student's t-test), and thus, tumor formation was significantly inhibited in the HuK5-70 antibody administration group (inhibitory rate: 44.7%) (FIG. 55A). With regard to tumor weight, the tumor weight of the control group was 0.509.+-.0.161 g. In contrast, in the HuK5-70 antibody administration group, the tumor weight of the control group was 0.272.+-.0.162 g (P<0.05 by Student's t-test), showing an inhibitory rate of 46.6% (FIG. 55B).
Example 42
[Dose-Dependent Anti-Tumor Activity of Humanized Anti-hTROP-2 Antibodies (HuK5-70 and HuT6-16-2) on Xenograft Treatment Models Using Human Colon Cancer Cell Line SW480]
The dose-dependent anti-tumor activity of HuK5-70 and HuT6-16-2 antibodies was examined with xenograft treatment models using a human colon cancer cell line SW480. SW480 cells (5.times.10.sup.6 cells) were subcutaneously transplanted into the right flank of each of 7-week-old female NOD-scid mice (Day 1). On the 9.sup.th day after the cancer cell transplantation (Day 9) at which the mean tumor volume reached 100 mm.sup.3, the mice were divided into a control group (PBS administration group, N=8, 101.65.+-.8.35 mm.sup.3), a 1 mg/kg body weight HuK5-70 antibody administration group (N=8, 103.18.+-.9.86 mm.sup.3), a 5 mg/kg body weight HuK5-70 antibody administration group (N=8, 101.34.+-.8.94 mm.sup.3), a 10 mg/kg body weight HuK5-70 antibody administration group (N=8, 101.53.+-.8.98 mm.sup.3), a 1 mg/kg body weight HuT6-16-2 antibody administration group (N=8, 103.18.+-.9.86 mm.sup.3), a 5 mg/kg body weight HuT6-16-2 antibody administration group (N=8, 101.34.+-.8.94 mm.sup.3), and a 10 mg/kg body weight HuT6-16-2 antibody administration group (N=8, 101.53.+-.8.98 mm.sup.3) Then, from Day 9, intraperitoneal administration of each antibody was carried out at administration intervals of once every three days. On the 48.sup.th day after the cancer cell transplantation (Day 48), the tumor volume of the control group was 754.67.+-.276.05 mm.sup.3. On the other hand, in the HuK5-70 antibody administration groups, the tumor volume of the 1 mg/kg body weight administration group was 521.81.+-.183.45 mm.sup.3 (inhibitory rate: 30.9%), the body volume of the 5 mg/kg body weight administration group was 258.78.+-.137.02 mm.sup.3 (inhibitory rate: 65.7%, P<0.01 by Student's t-test), and the tumor volume of the 10 mg/kg body weight administration group was 314.60.+-.152.89 mm.sup.3 (inhibitory rate: 58.3%, P<0.01 by Student's t-test) (FIG. 56A). In the HuT6-16-2 antibody administration groups, the tumor volume of the 1 mg/kg body weight administration group was 600.41.+-.319.84 mm.sup.3 (inhibitory rate: 20.4%), the tumor volume of the 5 mg/kg body weight administration group was 315.32.+-.189.02 mm.sup.3 (inhibitory rate: 58.2%, P<0.01 by Student's t-test), and the tumor volume of the 10 mg/kg body weight administration group was 270.79.+-.266.71 mm.sup.3 (inhibitory rate: 64.1%, P<0.01 by Student's t-test) (FIG. 57A). With regard to tumor weight on Day 48, the tumor weight of the control group was 0.422.+-.0.201 g. On the other hand, in the HuK5-70 antibody administration groups, the tumor weight of the 1 mg/kg body weight administration group was 0.301.+-.0.160 g (inhibitory rate: 28.7%), the tumor weight of the 5 mg/kg body weight administration group was 0.115.+-.0.083 g (inhibitory rate: 72.7%, P<0.01 by Student's t-test), and the tumor weight of the 10 mg/kg body weight administration group was 0.244.+-.0.181 g (inhibitory rate: 42.2%) (FIG. 56B). In the HuT6-16-2 antibody administration groups, the tumor weight of the 1 mg/kg body weight administration group was 0.422.+-.0.255 g (inhibitory rate: 0%), the tumor weight of the 5 mg/kg body weight administration group was 0.247.+-.0.151 g (inhibitory rate: 41.5%), and the tumor weight of the 10 mg/kg body weight administration group was 0.190.+-.0.190 g (inhibitory rate: 53.1%, P<0.01 by Student's t-test) (FIG. 57B). From these results, it was confirmed that the HuK5-70 and HuT6-16-2 antibodies have dose-dependent anti-tumor activity.
Example 43
[Anti-Tumor Activity of Anti-hTROP-2 Mouse Monoclonal Antibodies K5-70 and T6-16 on Xenograft Treatment Models Using Human Ovarian Cancer Cell Line SK-OV-3]
The anti-tumor activity of K5-70 and T6-16 antibodies as parent antibodies in vivo was examined with xenograft treatment models using a human ovarian cancer cell line SK-OV-3, which endogenously expresses hTROP-2 on the cell surface. SK-OV-3 cells (5.times.10.sup.6 cells) were subcutaneously transplanted into the right flank of each of 7-week-old female nude mice (Day 1). On the 11.sup.th day after the cancer cell transplantation (Day 11), individuals mice, in which clear tumor formation was observed (mean tumor volume: approximately 50 mm.sup.3), were divided into groups. Then, from Day 11, intraperitoneal administration of each antibody was carried out at administration intervals of twice a week. On the 56.sup.th day after the cancer cell transplantation (Day 56), the tumor volume of a control group (PBS administration, N=8) was 652.6.+-.349.1 mm.sup.3. On the other hand, the tumor volume of a K5-70 antibody administration group (10 mg/kg body weight, N=8) was 253.7.+-.137.3 mm.sup.3 (P<0.01 by Student's t-test), and thus, tumor formation was significantly inhibited (inhibitory rate: 61.1%); and the tumor volume of a T6-16 antibody administration group (10 mg/kg body weight, N=8) was 214.6.+-.98.6 mm.sup.3 (P<0.01 by Student's t-test), and thus, tumor formation was significantly inhibited (inhibitory rate: 67.1%) (FIG. 58A). With regard to tumor weight, the tumor weight of the control group was 0.413.+-.0.218 g. In contrast, the tumor weight of the K5-70 antibody administration group was 0.194.+-.0.112 (g) (P<0.05 by Student's t-test), showing an inhibitory rate of 53.0%; and the tumor weight of the T6-16 antibody administration group was 0.183.+-.0.093 (g) (P<0.05 by Student's t-test), showing an inhibitory rate of 55.7% (FIG. 58B).
Example 44
[Anti-Tumor Activity of Anti-hTROP-2 Mouse Monoclonal Antibodies K5-70 and T6-16 on Xenograft Treatment Models Using Human Breast Cancer Cell Line MDA-MB-468]
Likewise, the anti-tumor activity of K5-70 and T6-16 antibodies in vivo was examined with xenograft treatment models using a human breast cancer cell line MDA-MB-468, which endogenously expresses hTROP-2 on the cell surface. MDA-MB-468 cells (5.times.10.sup.6 cells) were subcutaneously transplanted into the right flank of each of 7-week-old female nude mice (Day 1). On the 12.sup.th day after the cancer cell transplantation (Day 12), individuals mice, in which clear tumor formation was observed (mean tumor volume: approximately 50 mm.sup.3), were divided into groups. Then, from Day 12, intraperitoneal administration of each antibody was carried out at administration intervals of twice a week. On the 54.sup.th day after the cancer cell transplantation (Day 54), the tumor volume of a control group (PBS administration, N=8) was 218.6.+-.75.5 mm.sup.3. On the other hand, the tumor volume of a K5-70 antibody administration group (10 mg/kg body weight, N=8) was 70.2.+-.37.4 mm.sup.3 (P<0.01 by Student's t-test), and thus, tumor formation was significantly inhibited (inhibitory rate: 67.9%); and the tumor volume of a T6-16 antibody administration group (10 mg/kg body weight, N=8) was 88.3.+-.42.9 mm.sup.3 (P<0.01 by Student's t-test), and thus, tumor formation was significantly inhibited (inhibitory rate: 59.6%) (FIG. 59A). With regard to tumor weight on Day 54, the tumor weight of the control group was 0.142.+-.0.049 g. In contrast, the tumor weight of the K5-70 antibody administration group was 0.050.+-.0.033 (g) (P<0.01 by Student's t-test), showing an inhibitory rate of 64.8%; and the tumor weight of the T6-16 antibody administration group was 0.077.+-.0.046 (g) (P<0.05 by Student's t-test), showing an inhibitory rate of 45.8% (FIG. 59B).
Example 451
[Anti-Tumor Activity of Anti-hTROP-2 Mouse Monoclonal Antibodies K5-70 and T6-16 on Xenograft Treatment Models Using Human Lung Cancer Cell Line Calu-3]
Likewise, the anti-tumor activity of K5-70 and T6-16 antibodies in vivo was examined with xenograft treatment models using a human lung cancer cell line Calu-3, which endogenously expresses hTROP-2 on the cell surface. Calu-3 cells (5.times.10.sup.6 cells) were subcutaneously transplanted into the right flank of each of 7-week-old female nude mice (Day 1). On the 9.sup.th day after the cancer cell transplantation (Day 9), individuals mice, in which clear tumor formation was observed (mean tumor volume: approximately 100 mm.sup.3), were divided into groups. Then, from Day 9, intraperitoneal administration of each antibody was carried out at administration intervals of twice a week. On the 41.sup.st day after the cancer cell transplantation (Day 41), the tumor volume of a control group (PBS administration, N=8) was 395.7.+-.221.2 mm.sup.3. On the other hand, the tumor volume of a K5-70 antibody administration group (10 mg/kg body weight, N=8) was 120.7.+-.125.6 mm.sup.3 (P<0.01 by Student's t-test), and thus, tumor formation was significantly inhibited (inhibitory rate: 69.5%); and the tumor volume of a T6-16 antibody administration group (10 mg/kg body weight, N=8) was 146.3.+-.128.4 mm.sup.3 (P<0.05 by Student's t-test), and thus, tumor formation was significantly inhibited (inhibitory rate: 63.0%) (FIG. 60A). With regard to tumor weight, the tumor weight of the control group was 0.301.+-.0.189 g. In contrast, the tumor weight of the K5-70 antibody administration group was 0.08.+-.0.085 (g) (P<0.01 by Student's t-test), showing an inhibitory rate of 73.5%; and the tumor weight of the T6-16 antibody administration group was 0.106.+-.0.096 (g) (P<0.05 by Student's t-test), showing an inhibitory rate of 64.9% (FIG. 60B).
Example 46
[Anti-Tumor Activity of Anti-hTROP-2 Mouse Monoclonal Antibody K5-70 on Xenograft Prevention Models Using Human Bile Duct Cancer Cell Line TFK-1]
Likewise, the anti-tumor activity of a K5-70 antibody in vivo was examined with xenograft prevention models using a human bile duct cancer cell line TFK-1, which endogenously expresses hTROP-2 on the cell surface. TFK-1 cells (5.times.10.sup.6 cells) were subcutaneously transplanted into the right flank of each of 7-week-old female nude mice (Day 1), and from the same day, intraperitoneal administration of the antibody was initiated at administration intervals of twice a week. On the 31.sup.st day after the cancer cell transplantation (Day 31), the tumor volume of a control group (PBS administration, N=5) was 1000.4.+-.268.9 mm.sup.3. On the other hand, the tumor volume of a K5-70 antibody administration group (10 mg/kg body weight, N=5) was 197.2.+-.215 5 mm.sup.3 (P<0.01 by Student's t-test), and thus, tumor formation was significantly inhibited (inhibitory rate: 80.3%) (FIG. 61A). With regard to tumor weight, the tumor weight of the control group was 0.443.+-.0.070 g. In contrast, the tumor weight of the K5-70 antibody administration group was 0.063.+-.0.052 (g) (P<0.01 by Student's t-test), showing an inhibitory rate of 85.8% (FIG. 61B).
Example 47
[Analysis of Avidity of HuK5-70 and HuT6-16-2 Antibodies]
The antigen-binding activity of HuK5-70 and HuT6-16-2 antibodies was examined according to an ELISA method (low-density antigen-coated ELISA) using a 96-well plate on which a low-density antigen has been coated. A recombinant hTACSTD2-Fc-His protein (Creative BioMart), which had been prepared to a concentration of 0.1 .mu.g/mL with a 0.1 M acetate buffer (pH 5.3), was added in an amount of 50 .mu.L/well to a 96-well plate, and coating was carried out at 4.degree. C. overnight. Thereafter, the same analysis as that in Example 40 was carried out. Test antibodies were diluted with an ELISA buffer (PBS containing 1% skim milk and 0.025% TWEEN 20), so as to prepare samples with a concentration range from 20 .mu.g/mL to a series of two-fold dilutions (15 samples) and to use them. As a result, it was found that the HuT6-16-2 antibody had binding activity that was almost equivalent to that of the T6-16 antibody (wherein their EC50 values were 49 ng/mL and 41 ng/mL, respectively), but that the EC50 value of the HuK5-70 antibody was approximately 20 times higher than that of the K5-70 antibody (wherein their EC50 values were 222 ng/mL and 12 ng/mL, respectively; FIG. 62).
Subsequently, the antigen-binding activity of HuK5-70 and K5-70 antibodies was examined by ELISA for analyzing a monovalent antigen-antibody reaction. Goat anti-human IgG (Fc.gamma. specific) (Southern Biotech) which had been diluted to 1 .mu.g/mL with a 0.1 M acetate buffer (pH 5.3) and Goat anti-mouse IgG (.gamma. chain specific) (Southern Biotech) which had been diluted to 3 .mu.g/mL were added in each amount of 50 .mu.L/well to a 96-well plate. Thereafter, coating was carried out at 4.degree. C. overnight. Thereafter, the reaction product was washed with a washing buffer (PBS containing 0.05% TWEEN 20), and a blocking buffer (PBS containing 2% skim milk and 0.05% TWEEN 20) was then added thereto (200 .mu.L/well) to block it (at room temperature for 1 hour). The resultant was washed with a washing buffer. Thereafter, the test antibody, which had been diluted to 1 .mu.g/mL with an ELISA buffer (PBS containing 1% skim milk and 0.025% TWEEN 20), was added in an amount of 50 .mu.L/well to the above-described plate. During this operation, a HuK5-70 antibody was added to a well coated with Goat anti-human IgG (Fc.gamma. specific), and a K5-70 antibody was added to a well coated with Goat anti-mouse IgG (.gamma. chain specific). The mixture was left at rest at room temperature for 1 hour, and the reaction product was then washed with a washing buffer. The recombinant protein of the hTROP-2 extracellular region described in Example 3 (hTROP-2 EC) was diluted with an ELISA buffer to prepare samples with a concentration range from 5 .mu.g/mL to a series of three-fold dilutions (10 samples). The thus obtained sample was added in each amount of 50 .mu.L/well to the plate. The mixture was left at rest at room temperature for 1 hour, and the reaction product was then washed with a washing buffer. Then, anti-His (G-18) (Santa Cruz), which had been diluted to 2 .mu.g/mL with an ELISA buffer, was added as a primary antibody to the reaction product (50 .mu.L/well). The obtained mixture was left at rest at room temperature for 1 hour, and it was then washed with a washing buffer. Thereafter, HRP-labeled anti-rabbit IgG (GE Healthcare), which had been diluted to 1000 times with an ELISA buffer, was added as a secondary antibody to the reaction product (50 .mu.L/well). The obtained mixture was left at rest at room temperature for 1 hour, and it was then washed with a washing buffer. Thereafter, a TMB (3,3',5,5'-tetramethylbenzidine: SIGMA) substrate solution was added in an amount of 50 .mu.L/well to the resultant to carry out a color reaction. Then, 1 M sulfuric acid (25 .mu.L/well) was added to the reaction product to terminate the reaction. Using Microplate reader Model 550 (BioRad), an absorbance at 450 nm was measured with an absorbance at 655 nm used as a reference. As a result, the EC50 values calculated from the binding curves of the hTROP-2EC protein with the K5-70 and HuK5-70 antibodies were 7 ng/mL and 6 ng/mL, respectively (FIG. 63). These results demonstrated that the HuK5-70 antibody and the K5-70 antibody have equivalent antigen affinity in a monovalent antigen-antibody reaction.
As described in Example 40, in an ELISA method using a 96-well plate on which a high-density antigen (0.5 .mu.g/mL) had been coated (antigen-coated ELISA), the antigen affinity of the K5-70 antibody was equivalent to the antigen affinity of the HuK5-70 antibody (FIG. 53). Thus, it was considered that the antigen-binding activity of the HuK5-70 antibody that is relatively lower than that of the K5-70 antibody in an ELISA method, in which a low-density antigen (0.1 .mu.g/mL) has been coated on a plate, may be caused by the fact that flexibility of the movement of two antigen-binding arms, namely, "avidity" is relatively lower in the HuK7-50 antibody than that in the K5-70 antibody.
Example 48
[Preparation and Characterization of Humanized K5-70 Antibody Mutants]
For the purpose of improving the "avidity" of a HuK5-70 antibody, the following experiment was carried out.
Whether the above-mentioned relatively low "avidity" of the HuK5-70 antibody is caused by VH or by VL was examined by the following experiment. First, genes encoding the H chain variable region (K5-70 VH) and L chain variable region (K5-70 VL) of a K5-70 antibody as a parent antibody were prepared by gene synthesis (Operon). During the gene synthesis, a Kozak sequence (ACC ACC) was added to the 5'-terminal side of the gene sequence of each of the K5-70 VH and the K5-70 VL. Further, an EcoRI site (GAA TTC) was added as a restriction enzyme site to the 5' end of the K5-70 VH, and an NheI site (GCT AGC) was added as a restriction enzyme site to the 3' end thereof. Likewise, an AgeI site (ACC GGT) was added as a restriction enzyme site to the 5' end of the K5-70 VL, and a BsiWI site (CGT ACG) was added as a restriction enzyme site to the 3' end thereof. The thus synthesized K5-70 VH gene and K5-70 VL gene were each incorporated into a pCR2.1 vector (Invitrogen). The gene sequences of the K5-70 VH and VL prepared by the gene synthesis are shown in FIG. 64 and FIG. 65, respectively. The K5-70 VH and K5-70 VL genes incorporated into the pCR2.1 vector were digested with the restriction enzymes EcoRI and NheI, and AgeI and BsiWI, respectively, and gene fragments were then recovered. Subsequently, the cleaved K5-70 VH gene was inserted into the EcoRI/NheI site of a pFUSE-CHIg-hG1 vector (InvivoGen) as an expression vector for the expression of a human IgG1 form, whereas the K5-70 VL gene was inserted into the AgeI/BsiWI site of a pFUSE2-CLIg-hk vector (InvivoGen) as a human Ig.kappa. form expression vector, thereby completing mouse-human chimeric constructs (pFUSE-CHIg-MuK5-70 and pFUSE2-CLIg-MuK5-70).
The thus prepared constructs, and the HuK5-70 H chain expression vector (pFUSE-CHIg-HuK5-70) and the HuK5-70 L chain expression vector (pFUSE2-CLIg-HuK5-70), which had been prepared in Example 36, were allowed to co-express in 293F cells (Invitrogen) by combinations 1 to 4 in the following table.
TABLE-US-00017 Antibody H chain L chain generated Remarks 1 pFUSE-CHIg-HuK5-70 pFUSE2-CLIg-HuK5-70 HuK5-70 Humanized antibody K5-70 antibody 2 pFUSE-CHIg-HuK5-70 pFUSE2-CLIg-MuK5-70 HuVH/MuVL Humanized antibody K5-70 VH/ Mouse K5-70 VL 3 pFUSE-CHIg-MuK5-70 pFUSE2-CLIg-HuK5-70 MuVH/HuVL Mouse K5-70 VH/ antibody Humanized K5-70 VL 4 pFUSE-CHIg-MuK5-70 pFUSE2-CLIg-MuK5-70 ChK5-70 Chimeric antibody K5-70 antibody
Transfection of the expression vectors described above into 293F cells (Invitrogen) was carried out using NeoFection reagent (Astec) in accordance with the method described in instructions included therewith. After completion of the transfection, the resultant was cultured for 5 days using FreeStyle 293 Expression Medium (Invitrogen) at 37.degree. C. in a CO.sub.2 incubator with a CO.sub.2 concentration of 8%. Thereafter, a culture supernatant was recovered. The antibody concentration in the culture supernatant was measured by a sandwich ELISA method. Specifically, Goat anti-human IgG (Fc.gamma. specific) (Southern Biotech), which had been diluted to 1 .mu.g/mL with PBS, was added in an amount of 50 .mu.L/well to a 96-well plate. Thereafter, coating was carried out at 4.degree. C. overnight. Thereafter, the reaction product was washed with a washing buffer (PBS containing 0.05% TWEEN 20), and a blocking buffer (PBS containing 2% skim milk and 0.05% TWEEN 20) was then added thereto (200 .mu.L/well) to block it at room temperature for 1 hour. The resultant was washed with a washing buffer. Thereafter, a culture supernatant, which had been diluted to an appropriate dilution magnification with an ELISA buffer (PBS containing 1% skim milk and 0.025% TWEEN 20), was added in an amount of 50 .mu.L/well to the above-described plate, and a reaction was then carried out at room temperature for 2 hours. As a standard preparation, a HuK5-70 antibody was used. The reaction product was then washed with a washing buffer. As a detection antibody, HRP-labeled Goat anti-human kappa (.kappa. chain specific) (Southern Biotech), which had been diluted to 1,000 times with an ELISA buffer, was added in an amount of 50 .mu.L/well to the reaction product, and a reaction was then carried out at room temperature for 1 hour. The reaction product was washed with a washing buffer, and thereafter, a TMB (3,3',5,5'-tetramethylbenzidine: SIGMA) substrate solution was added in an amount of 50 .mu.L/well to the resultant to carry out a color reaction. Then, 1 M sulfuric acid (25 .mu.L/well) was added to the reaction product to terminate the reaction. Using iMark Microplate reader (BioRad), an absorbance at 450 nm was measured with an absorbance at 655 nm used as a reference. The binding of the 4 types of antibodies contained in the culture supernatants to hTROP-2 was measured by the above-described low-density antigen-coated ELISA. As a result, it was found that the binding activity of a MuVH/HuVL antibody constituted with mouse K5-70 VH and HuK5-70 VL to hTROP-2 was equivalent to that of a ChK5-70 antibody, but that the binding activity of a HuVH/MuVL antibody constituted with HuK5-70 VH and mouse K5-70 VL was relatively lower than that of the ChK5-70 (FIG. 66). These results suggested that HuK5-70 VH be involved in the "avidity" of HuK5-70. Hence, in order to prepare modified antibodies, in which the "avidity" of the Huk5-70 antibody has been improved, amino acid substitution was carried out on the HuK5-70 VH. As is found from a alignment of the amino acid sequences of HuK5-70 VH and K5-70 VH as shown in FIG. 41, a total of 17 amino acids with amino acid numbers 5, 7, 11, 12, 13, 20, 38, 40, 44, 73, 75, 81, 82c, 83, 87, 108 and 109 are different between HuK5-70 VH and K5-70 VH (wherein the amino acid numbers are used in accordance with the definitions of Kabat et al. (1991)). The aforementioned amino acids of HuK5-70 VH were substituted with the corresponding amino acids of K5-70 VH, so that mutants were prepared according to gene synthesis. Then, an expression vector (a pFUSE-CHIg-HuK5-70 mutant) was prepared. According to the report by Landolfi et al. (J. Immunol. 166:1748, 2001), it has been reported that the amino acids at positions 11 and 38 of VH are involved in the avidity of a humanized antibody, and that avidity and biological activity are improved by substituting the two above amino acids with the corresponding amino acids derived from mouse. Hence, a double mutant comprising substitution of the amino acids at positions 11 and 38 was also prepared. The names of the thus prepared 18 types of HuK5-70 VH mutants and their amino acid sequences are shown in FIG. 67.
The prepared 18 types of HuK5-70 VH mutants (expression vectors for pFUSE-CHIg-HuK5-70 mutants) were each combined with a HuK5-70 L chain expression vector (pFUSE2-CLIg-HuK5-70), and the thus obtained expression vectors were each transfected into HEK293 cells. Then, using the obtained culture supernatant, the binding activity of each amino acid substitution antibody to hTROP-2 was examined by low-density antigen-coated ELISA. As a result, among the 18 types of HuK5-70 VH mutants, an R44G mutant, in which the R (arginine) at position 44 of HuK5-70 VH had been substituted with G (glycine) (HuK5-70 R44G; which is hereafter referred to as HuK5-70-2), was observed to have an apparently improved antigen-binding activity (FIG. 68). The sequence of a HuK5-70 VH R44G (hereinafter referred to as HuK5-70 VH2) gene is shown in FIG. 69.
Example 49
[Purification and Characterization of HuK5-70-2 Antibody]
The HuK5-70-2 antibody that is a HuK5-70 R44G mutant antibody was purified as follows. That is, pFUSE-CHIg-HuK5-70 R44G and pFUSE2-CLIg-HuK5-70 were transfected into 293F cells, and the resultant was then cultured for 5 days. Thereafter, a culture supernatant was recovered. The HuK5-70-2 antibody was purified from the recovered culture supernatant, using rProtein A sepharose Fast Flow (GE Healthcare). The purified HuK5-70-2 antibody was loaded on SDS-PAGE under reducing conditions. As a result, an H chain of approximately 50 kDa and an L chain of approximately 25 kDa were found. The purity of each antibody was 95% or more (FIG. 70).
The binding activity of the purified HuK5-70-2 and HuK5-70 antibodies to hTROP-2 was examined by high-density antigen-coated ELISA and low-density antigen-coated ELISA. The affinity of the antibodies was examined by the high-density antigen-coated ELISA (using a 96-well plate which was coated with 1 .mu.g/mL hTROP-2). As a result, it was found that the binding curve of the HuK5-70 antibody was almost overlapped with the binding curve of the HuK5-70-2 antibody, and that their affinity was equivalent to each other. Subsequently, the avidity of the antibodies was examined by the low-density antigen-coated ELISA (using a 96-well plate which was coated with 0.1 .mu.g/mL hTROP-2). As a result, it was found that, as same the case with using a culture supernatant, the antigen-binding activity of the HuK5-70-2 antibody was clearly higher than the antigen-binding activity of the HuK5-70 antibody (FIG. 71). Specifically, the EC.sub.50 value of a K5-70 antibody was 11.4 ng/mL, that of a HuK5-70 antibody was 33.4 ng/mL, and that of a HuK5-70-2 antibody was 11.4 ng/mL. Thus, it was demonstrated that the HuK5-70-2 antibody has an improved avidity in comparison with the HuK5-70 antibody, and that the HuK5-70-2 antibody has activity equivalent to that of the K5-70 antibody.
Example 50
[Measurement of Antibody-Dependent Cellular Cytotoxicity (ADCC) Activity of Humanized Anti-hTROP-2 Antibodies]
(1) Preparation of Target Cell Solution
As target cells, a human colon cancer cell line SW480, a human pancreatic cancer cell line PK-59, and a human prostate cancer cell line PC-3, each of which endogenously expresses hTROP-2, were used. Target cells cultured on a 10-cm cell culture dish were harvested from the plate by treatment with trypsin, and were then suspended in an assay medium. A Leivovitz L-15 medium (for SW480 cells) or an RPMI-1640 medium (for PK-59 and PC-3 cells), to which 0.5% FBS had been added, was used for ADCC assay. After completion of centrifugation (at 1000 rpm for 3 minutes at room temperature), pellets were prepared at a cell density of 2.times.10.sup.5 cells/mL with the same medium as that used above, and thus a target cell solution was prepared.
(2) Separation of Human Peripheral Blood Mononuclear Cells
Healthy venous blood was collected with heparin, and was then diluted to 2 times with PBS. Thereafter, the diluted blood was layered on Lymphoprep (Daiichi Kagaku Yakuhin K. K.) and was then centrifuged (at room temperature at 750 rpm for 5 minutes, and then at 2000 rpm for 20 minutes). After completion of the centrifugation, mononuclear cells (healthy peripheral blood monocytes) were recovered from an intermediate layer fraction, and were then washed with PBS three times. Thereafter, a cell suspension was prepared with an assay medium, and the prepared cells were used as effector cells.
(3) ADCC Activity of Humanized Anti-hTROP-2 Antibodies (HuK5-70, HuK5-70-2 and HuT6-16-2 Antibodies)
100 .mu.L (2.times.10.sup.4 cells/well) of the prepared target cell solution was dispensed in a 96-well flat bottom plate (manufactured by FALCON). Subsequently, human peripheral blood mononuclear cells (effector cells) were added to the plate, so that the ratio between the effector cells and the target cells could be 40:1. Thereafter, humanized anti-hTROP-2 antibodies (HuK5-70, HuK5-70-2 and HuT6-16-2 antibodies) were each added as test antibodies to the plate to a final concentration of 0.1 to 30 .mu.g/mL. The mixture was adjusted to a total amount of 200 .mu.L, and it was then cultured in a CO.sub.2 incubator (at 37.degree. C. in 5% CO.sub.2) for 6 hours. After completion of the culture, the activity of lactate dehydrogenase released from the cytoplasm of the target cells damaged by the effector cells was measured using Cytotoxicity Detection Kit (LDH) (Roche, Cat. No. 11 644 793 001) in accordance with protocols included with the kit, and ADCC activity was then evaluated using the measurement result as an indicator.
As shown in FIGS. 72A to 72C, it became clear that the HuK5-70 and HuT6-16-2 antibodies dose-dependently exhibit ADCC activity on a human colon cancer cell line SW480 (FIG. 72A), a human pancreatic cancer cell line PK-59 (FIG. 72B) and a human prostate cancer cell line PC-3 (FIG. 72C), each of which expresses hTROP-2 on the cell surface. In addition, as shown in FIGS. 72B and 72C, it became clear that the HuK5-70-2 antibody exhibits ADCC activity on the pancreatic cancer cell line PK-59 and the human prostate cancer cell line PC-3, wherein the above-mentioned ADCC activity is stronger than that of the HuK5-70 antibody. As mentioned above, the HuK5-70-2 antibody is an antibody whose binding ability (avidity) to hTROP-2 has been improved by substituting the R (arginine) at position 44 of HuK5-70 VH with G (glycine). It was demonstrated that the avidity of the HuK5-70-2 antibody, which had been improved when compared with the HuK5-70 antibody, is reflected in ADCC activity. Therefore, it is assumed that the HuK5-70-2 antibody has excellent anti-tumor activity even in vivo, as with the HuK5-70 antibody (wherein the HuK5-70-2 antibody can preferably have anti-tumor activity higher than that of the HuK5-70 antibody). From the above-described results, it was suggested that the HuK5-70, HuK5-70-2 and HuT6-16-2 antibodies become therapeutic antibodies useful for cancer that expresses hTROP-2 on the cell surface.
INDUSTRIAL APPLICABILITY
The present invention is able to provide an antibody, which specifically reacts with hTROP-2 and has high anti-tumor activity in vivo, and specifically, a monoclonal antibody having high anti-tumor activity in vivo at a low dose, and particularly, such an antibody, which is a humanized antibody. In addition, the present invention is able to provide a hybridoma, which produces the antibody, a fragment of the antibody, a complex of the antibody or the like and various types of drugs, a pharmaceutical composition for diagnosing or treating a tumor, a method for detecting a tumor, and a kit for detecting or diagnosing a tumor.
SEQUENCE LISTING FREE TEXT
SEQ ID NO: 3 Synthetic DNA SEQ ID NO: 4 Synthetic DNA SEQ ID NO: 5 Synthetic DNA SEQ ID NO: 6 Synthetic DNA SEQ ID NO: 7 Synthetic DNA SEQ ID NO: 8 Synthetic DNA SEQ ID NO: 9 Synthetic DNA SEQ ID NO: 10 Synthetic DNA SEQ ID NO: 11 Synthetic DNA SEQ ID NO: 12 Synthetic DNA SEQ ID NO: 13 Synthetic DNA SEQ ID NO: 14 Synthetic DNA SEQ ID NO: 15 Synthetic DNA SEQ ID NO: 16 Synthetic DNA SEQ ID NO: 17 Synthetic DNA SEQ ID NO: 18 Synthetic DNA SEQ ID NO: 19 Synthetic DNA SEQ ID NO: 20 Synthetic DNA SEQ ID NO: 21 Synthetic DNA SEQ ID NO: 22 Synthetic DNA SEQ ID NO: 23 Synthetic DNA SEQ ID NO: 24 Synthetic DNA SEQ ID NO: 25 Synthetic DNA SEQ ID NO: 26 Synthetic DNA SEQ ID NO: 27 Synthetic DNA SEQ ID NO: 28 Synthetic DNA SEQ ID NO: 29 Synthetic DNA SEQ ID NO: 30 Synthetic DNA SEQ ID NO: 31 Synthetic DNA SEQ ID NO: 32 Synthetic DNA SEQ ID NO: 33 Synthetic DNA SEQ ID NO: 74 Recombinant DNA SEQ ID NO: 75 Synthetic construct (recombinant protein) SEQ ID NO: 76 Recombinant DNA SEQ ID NO: 77 Synthetic construct (recombinant protein) SEQ ID NO: 78 Recombinant DNA SEQ ID NO: 79 Synthetic construct (recombinant protein) SEQ ID NO: 80 Recombinant DNA SEQ ID NO: 81 Synthetic construct (recombinant protein) SEQ ID NO: 82 Recombinant DNA SEQ ID NO: 83 Synthetic construct (recombinant protein) SEQ ID NO: 92 Recombinant protein SEQ ID NO: 93 Recombinant protein SEQ ID NO: 94 Recombinant protein SEQ ID NO: 95 Recombinant protein SEQ ID NO: 96 Recombinant protein SEQ ID NO: 97 Recombinant protein SEQ ID NO: 98 Recombinant protein SEQ ID NO: 99 Recombinant DNA SEQ ID NO: 100 Recombinant DNA
SEQUENCE LISTINGS
1
23412080DNAhomo sapiensCDS(339)..(1310) 1gcgggtcccc agaagcctac aggtgagtat cggttctccc cttcccggct ttcggtccgg 60aggaggcggg agcagcttcc ctgttctgat cctatcgcgg gcggcgcagg gccggcttgg 120ccttccgtgg gacggggagg ggggcgggat gtgtcaccca aataccagtg gggacggtcg 180gtggtggaac cagccgggca ggtcgggtag agtataagag ccggagggag cggccgggcg 240gcagacgcct gcagaccatc ccagacgccg gagcccgagc cccgacgagt ccccgcgcct 300catccgcccg cgtccggtcc gcgttcctcc gccccacc atg gct cgg ggc ccc ggc 356 Met Ala Arg Gly Pro Gly 1 5 ctc gcg ccg cca ccg ctg cgg ctg ccg ctg ctg ctg ctg gtg ctg gcg 404Leu Ala Pro Pro Pro Leu Arg Leu Pro Leu Leu Leu Leu Val Leu Ala 10 15 20 gcg gtg acc ggc cac acg gcc gcg cag gac aac tgc acg tgt ccc acc 452Ala Val Thr Gly His Thr Ala Ala Gln Asp Asn Cys Thr Cys Pro Thr 25 30 35 aac aag atg acc gtg tgc agc ccc gac ggc ccc ggc ggc cgc tgc cag 500Asn Lys Met Thr Val Cys Ser Pro Asp Gly Pro Gly Gly Arg Cys Gln 40 45 50 tgc cgc gcg ctg ggc tcg ggc atg gcg gtc gac tgc tcc acg ctg acc 548Cys Arg Ala Leu Gly Ser Gly Met Ala Val Asp Cys Ser Thr Leu Thr 55 60 65 70 tcc aag tgt ctg ctg ctc aag gcg cgc atg agc gcc ccc aag aac gcc 596Ser Lys Cys Leu Leu Leu Lys Ala Arg Met Ser Ala Pro Lys Asn Ala 75 80 85 cgc acg ctg gtg cgg ccg agt gag cac gcg ctc gtg gac aac gat ggc 644Arg Thr Leu Val Arg Pro Ser Glu His Ala Leu Val Asp Asn Asp Gly 90 95 100 ctc tac gac ccc gac tgc gac ccc gag ggc cgc ttc aag gcg cgc cag 692Leu Tyr Asp Pro Asp Cys Asp Pro Glu Gly Arg Phe Lys Ala Arg Gln 105 110 115 tgc aac cag acg tcg gtg tgc tgg tgc gtg aac tcg gtg ggc gtg cgc 740Cys Asn Gln Thr Ser Val Cys Trp Cys Val Asn Ser Val Gly Val Arg 120 125 130 cgc acg gac aag ggc gac ctg agc cta cgc tgc gat gag ctg gtg cgc 788Arg Thr Asp Lys Gly Asp Leu Ser Leu Arg Cys Asp Glu Leu Val Arg 135 140 145 150 acc cac cac atc ctc att gac ctg cgc cac cgc ccc acc gcc ggc gcc 836Thr His His Ile Leu Ile Asp Leu Arg His Arg Pro Thr Ala Gly Ala 155 160 165 ttc aac cac tca gac ctg gac gcc gag ctg agg cgg ctc ttc cgc gag 884Phe Asn His Ser Asp Leu Asp Ala Glu Leu Arg Arg Leu Phe Arg Glu 170 175 180 cgc tat cgg ctg cac ccc aag ttc gtg gcg gcc gtg cac tac gag cag 932Arg Tyr Arg Leu His Pro Lys Phe Val Ala Ala Val His Tyr Glu Gln 185 190 195 ccc acc atc cag atc gag ctg cgg cag aac acg tct cag aag gcc gcc 980Pro Thr Ile Gln Ile Glu Leu Arg Gln Asn Thr Ser Gln Lys Ala Ala 200 205 210 ggt gac gtg gat atc ggc gat gcc gcc tac tac ttc gag agg gac atc 1028Gly Asp Val Asp Ile Gly Asp Ala Ala Tyr Tyr Phe Glu Arg Asp Ile 215 220 225 230 aag ggc gag tct cta ttc cag ggc cgc ggc ggc ctg gac ttg cgc gtg 1076Lys Gly Glu Ser Leu Phe Gln Gly Arg Gly Gly Leu Asp Leu Arg Val 235 240 245 cgc gga gaa ccc ctg cag gtg gag cgc acg ctc atc tat tac ctg gac 1124Arg Gly Glu Pro Leu Gln Val Glu Arg Thr Leu Ile Tyr Tyr Leu Asp 250 255 260 gag att ccc ccg aag ttc tcc atg aag cgc ctc acc gcc ggc ctc atc 1172Glu Ile Pro Pro Lys Phe Ser Met Lys Arg Leu Thr Ala Gly Leu Ile 265 270 275 gcc gtc atc gtg gtg gtc gtg gtg gcc ctc gtc gcc ggc atg gcc gtc 1220Ala Val Ile Val Val Val Val Val Ala Leu Val Ala Gly Met Ala Val 280 285 290 ctg gtg atc acc aac cgg aga aag tcg ggg aag tac aag aag gtg gag 1268Leu Val Ile Thr Asn Arg Arg Lys Ser Gly Lys Tyr Lys Lys Val Glu 295 300 305 310 atc aag gaa ctg ggg gag ttg aga aag gaa ccg agc ttg tag 1310Ile Lys Glu Leu Gly Glu Leu Arg Lys Glu Pro Ser Leu 315 320 gtacccggcg gggcagggga tggggtgggg taccggattt cggtatcgtc ccagacccaa 1370gtgagtcacg cttcctgatt cctcggcgca aaggagacgt ttatcctttc aaattcctgc 1430cttccccctc ccttttgcgc acacaccagg tttaatagat cctggcctca gggtctcctt 1490tctttctcac ttctgtcttg aaggaagcat ttctaaaatg tatccccttt cggtccaaca 1550acaggaaacc tgactggggc agtgaaggaa gggatggcat agcgttatgt gtaaaaaaca 1610agtatctgta tgacaacccg ggatcgtttg caagtaactg aatccattgc gacattgtga 1670aggcttaaat gagtttagat gggaaatagc gttgttatcg ccttgggttt aaattatttg 1730atgagttcca cttgtatcat ggcctacccg aggagaagag gagtttgtta actgggccta 1790tgtagtagcc tcatttacca tcgtttgtat tactgaccac atatgcttgt cactgggaaa 1850gaagcctgtt tcagctgcct gaacgcagtt tggatgtctt tgaggacaga cattgcccgg 1910aaactcagtc tatttattct tcagcttgcc cttactgcca ctgatattgg taatgttctt 1970ttttgtaaaa tgtttgtaca tatgttgtct ttgataatgt tgctgtaatt ttttaaaata 2030aaacacgaat ttaataaaat atgggaaagg cacaaaccag aaaaaaaaaa 20802323PRThomo sapiens 2Met Ala Arg Gly Pro Gly Leu Ala Pro Pro Pro Leu Arg Leu Pro Leu 1 5 10 15 Leu Leu Leu Val Leu Ala Ala Val Thr Gly His Thr Ala Ala Gln Asp 20 25 30 Asn Cys Thr Cys Pro Thr Asn Lys Met Thr Val Cys Ser Pro Asp Gly 35 40 45 Pro Gly Gly Arg Cys Gln Cys Arg Ala Leu Gly Ser Gly Met Ala Val 50 55 60 Asp Cys Ser Thr Leu Thr Ser Lys Cys Leu Leu Leu Lys Ala Arg Met 65 70 75 80 Ser Ala Pro Lys Asn Ala Arg Thr Leu Val Arg Pro Ser Glu His Ala 85 90 95 Leu Val Asp Asn Asp Gly Leu Tyr Asp Pro Asp Cys Asp Pro Glu Gly 100 105 110 Arg Phe Lys Ala Arg Gln Cys Asn Gln Thr Ser Val Cys Trp Cys Val 115 120 125 Asn Ser Val Gly Val Arg Arg Thr Asp Lys Gly Asp Leu Ser Leu Arg 130 135 140 Cys Asp Glu Leu Val Arg Thr His His Ile Leu Ile Asp Leu Arg His 145 150 155 160 Arg Pro Thr Ala Gly Ala Phe Asn His Ser Asp Leu Asp Ala Glu Leu 165 170 175 Arg Arg Leu Phe Arg Glu Arg Tyr Arg Leu His Pro Lys Phe Val Ala 180 185 190 Ala Val His Tyr Glu Gln Pro Thr Ile Gln Ile Glu Leu Arg Gln Asn 195 200 205 Thr Ser Gln Lys Ala Ala Gly Asp Val Asp Ile Gly Asp Ala Ala Tyr 210 215 220 Tyr Phe Glu Arg Asp Ile Lys Gly Glu Ser Leu Phe Gln Gly Arg Gly 225 230 235 240 Gly Leu Asp Leu Arg Val Arg Gly Glu Pro Leu Gln Val Glu Arg Thr 245 250 255 Leu Ile Tyr Tyr Leu Asp Glu Ile Pro Pro Lys Phe Ser Met Lys Arg 260 265 270 Leu Thr Ala Gly Leu Ile Ala Val Ile Val Val Val Val Val Ala Leu 275 280 285 Val Ala Gly Met Ala Val Leu Val Ile Thr Asn Arg Arg Lys Ser Gly 290 295 300 Lys Tyr Lys Lys Val Glu Ile Lys Glu Leu Gly Glu Leu Arg Lys Glu 305 310 315 320 Pro Ser Leu 320DNAArtificialsynthetic DNA 3ttcctccgcc ccaccatggc 20425DNAArtificialsynthetic DNA 4ctcgagcaag ctcggttcct ttctc 25529DNAArtificialsynthetic DNA 5ctcgagctcg tccaggtaat agatgagcg 29623DNAArtificialsynthetic DNA 6gatccactag tcgcgagtgg tgg 23723DNAArtificialsynthetic DNA 7aattccacca ctcgcgacta gtg 23820DNAArtificialsynthetic DNA 8tcctcgtgtc ccactcccgg 20925DNAArtificialsynthetic DNA 9ctcgagtgca ttgagttccc tatgc 251030DNAArtificialsynthetic DNA 10cctgagccta cgctgcgacg aagtggtgcg 301130DNAArtificialsynthetic DNA 11cgcaccactt cgtcgcagcg taggctcagg 301230DNAArtificialsynthetic DNA 12gactgctcca cgctgacttc caagtgcctg 301330DNAArtificialsynthetic DNA 13caggcacttg gaagtcagcg tggagcagtc 301430DNAArtificialsynthetic DNA 14ctcgtggaca acgatggcct ctacgacccg 301530DNAArtificialsynthetic DNA 15cgggtcgtag aggccatcgt tgtccacgag 301631DNAArtificialsynthetic DNA 16ccaaagcctg cgctgcgatg agctggtgcg c 311731DNAArtificialsynthetic DNA 17gcgcaccagc tcatcgcagc gcaggctttg g 311830DNAArtificialsynthetic DNA 18agcttcctat ccgcggtgca ctacgagcag 301930DNAArtificialsynthetic DNA 19ctgctcgtag tgcaccgcgg ataggaagct 302030DNAArtificialsynthetic DNA 20gacattaaag gcgagtctct attccagggc 302130DNAArtificialsynthetic DNA 21gccctggaat agagactcgc ctttaatgtc 302221DNAArtificialsynthetic DNA 22ctactccacc ccaccctggc g 212325DNAArtificialsynthetic DNA 23ctcgagcaag ctaggttcgc ttctc 252412DNAArtificialsynthetic DNA 24tccakagttcca 122512DNAArtificialsynthetic DNA 25gctgtcctga tc 122645DNAArtificialsynthetic DNA 26ctaatacgac tcactatagg gcaagcagtg gtatcaacgc agagt 452722DNAArtificialsynthetic DNA 27ctaatacgac tcactatagg gc 222823DNAArtificialsynthetic DNA 28gggaartarc ccttgaccag gca 232923DNAArtificialsynthetic DNA 29gggaartagc ctttgacaag gca 233026DNAArtificialsynthetic DNA 30cactgccatc aatvctccac ttgaca 263123DNAArtificialsynthetic DNA 31cgactggagc acgaggacac tga 233220DNAArtificialsynthetic DNA 32gccagtggat agacagatgg 203321DNAArtificialsynthetic DNA 33gatggataca gttggtgcag c 2134402DNAhomo sapiensCDS(1)..(402) 34atg gga tgg agc tgt atc atc ctc ttc ttg gta gca aca gct aca ggt 48Met Gly Trp Ser Cys Ile Ile Leu Phe Leu Val Ala Thr Ala Thr Gly 1 5 10 15 gtc cac tcc cag gtc caa ctg cag cag cct ggg gct gag ctg gtg agg 96Val His Ser Gln Val Gln Leu Gln Gln Pro Gly Ala Glu Leu Val Arg 20 25 30 cct ggg gct tca gtg aag ctg tcc tgc aag gct tct ggc tac acc ttc 144Pro Gly Ala Ser Val Lys Leu Ser Cys Lys Ala Ser Gly Tyr Thr Phe 35 40 45 acc atc tac tgg ata aac tgg gtg aaa cag agg cct gga caa ggc ctt 192Thr Ile Tyr Trp Ile Asn Trp Val Lys Gln Arg Pro Gly Gln Gly Leu 50 55 60 gag tgg atc gga aat att tat cct tct gat agt tat act aac tac aat 240Glu Trp Ile Gly Asn Ile Tyr Pro Ser Asp Ser Tyr Thr Asn Tyr Asn 65 70 75 80 caa aag ttc aag gac aag gcc aca ttg act gta gac aaa tcc tcc agc 288Gln Lys Phe Lys Asp Lys Ala Thr Leu Thr Val Asp Lys Ser Ser Ser 85 90 95 aca gcc tac atg cag ctc agc agc ccg aca tct gag gac tct gcg gtc 336Thr Ala Tyr Met Gln Leu Ser Ser Pro Thr Ser Glu Asp Ser Ala Val 100 105 110 tat tac tgt aca aga acg tct atg gcg gac tac tgg ggc caa ggc acc 384Tyr Tyr Cys Thr Arg Thr Ser Met Ala Asp Tyr Trp Gly Gln Gly Thr 115 120 125 act ctc aca gtc tcc tca 402Thr Leu Thr Val Ser Ser 130 35134PRThomo sapiens 35Met Gly Trp Ser Cys Ile Ile Leu Phe Leu Val Ala Thr Ala Thr Gly 1 5 10 15 Val His Ser Gln Val Gln Leu Gln Gln Pro Gly Ala Glu Leu Val Arg 20 25 30 Pro Gly Ala Ser Val Lys Leu Ser Cys Lys Ala Ser Gly Tyr Thr Phe 35 40 45 Thr Ile Tyr Trp Ile Asn Trp Val Lys Gln Arg Pro Gly Gln Gly Leu 50 55 60 Glu Trp Ile Gly Asn Ile Tyr Pro Ser Asp Ser Tyr Thr Asn Tyr Asn 65 70 75 80 Gln Lys Phe Lys Asp Lys Ala Thr Leu Thr Val Asp Lys Ser Ser Ser 85 90 95 Thr Ala Tyr Met Gln Leu Ser Ser Pro Thr Ser Glu Asp Ser Ala Val 100 105 110 Tyr Tyr Cys Thr Arg Thr Ser Met Ala Asp Tyr Trp Gly Gln Gly Thr 115 120 125 Thr Leu Thr Val Ser Ser 130 365PRThomo sapiens 36Ile Tyr Trp Ile Asn 1 5 3717PRThomo sapiens 37Asn Ile Tyr Pro Ser Asp Ser Tyr Thr Asn Tyr Asn Gln Lys Phe Lys 1 5 10 15 Asp 386PRThomo sapiens 38Thr Ser Met Ala Asp Tyr 1 5 39381DNAhomo sapiensCDS(1)..(381) 39atg gta tcc aca cct cag ttc ctt gta ttt ttg ctt ttc tgg att cca 48Met Val Ser Thr Pro Gln Phe Leu Val Phe Leu Leu Phe Trp Ile Pro 1 5 10 15 gcc tcc aga ggt gac atc ttg ctg act cag tct cca gcc atc ctg tct 96Ala Ser Arg Gly Asp Ile Leu Leu Thr Gln Ser Pro Ala Ile Leu Ser 20 25 30 gtg agt cca gga gaa aga gtc agt ttc tcc tgc agg gcc agt cag agc 144Val Ser Pro Gly Glu Arg Val Ser Phe Ser Cys Arg Ala Ser Gln Ser 35 40 45 att ggc aca agc ata cac tgg tat cag caa aga aca aat ggt tct cca 192Ile Gly Thr Ser Ile His Trp Tyr Gln Gln Arg Thr Asn Gly Ser Pro 50 55 60 agg ctt ctc ata aag tat gct tct gag tct atc tct ggg atc cct tcc 240Arg Leu Leu Ile Lys Tyr Ala Ser Glu Ser Ile Ser Gly Ile Pro Ser 65 70 75 80 agg ttt agt ggc agt gga tca ggg aca gat ttt act ctt agc atc aac 288Arg Phe Ser Gly Ser Gly Ser Gly Thr Asp Phe Thr Leu Ser Ile Asn 85 90 95 agt gtg gag tct gaa gat att gca gat tat tac tgt caa caa agt aat 336Ser Val Glu Ser Glu Asp Ile Ala Asp Tyr Tyr Cys Gln Gln Ser Asn 100 105 110 agc tgg cca ttc acg ttc ggc tcg ggg aca aag ttg gaa ata aaa 381Ser Trp Pro Phe Thr Phe Gly Ser Gly Thr Lys Leu Glu Ile Lys 115 120 125 40127PRThomo sapiens 40Met Val Ser Thr Pro Gln Phe Leu Val Phe Leu Leu Phe Trp Ile Pro 1 5 10 15 Ala Ser Arg Gly Asp Ile Leu Leu Thr Gln Ser Pro Ala Ile Leu Ser 20 25 30 Val Ser Pro Gly Glu Arg Val Ser Phe Ser Cys Arg Ala Ser Gln Ser 35 40 45 Ile Gly Thr Ser Ile His Trp Tyr Gln Gln Arg Thr Asn Gly Ser Pro 50 55 60 Arg Leu Leu Ile Lys Tyr Ala Ser Glu Ser Ile Ser Gly Ile Pro Ser 65 70 75 80 Arg Phe Ser Gly Ser Gly Ser Gly Thr Asp Phe Thr Leu Ser Ile Asn 85 90 95 Ser Val Glu Ser Glu Asp Ile Ala Asp Tyr Tyr Cys Gln Gln Ser Asn 100 105 110 Ser Trp Pro Phe Thr Phe Gly Ser Gly Thr Lys Leu Glu Ile Lys 115 120 125 4111PRThomo sapiens 41Arg Ala Ser Gln Ser Ile Gly Thr Ser Ile His 1 5 10 427PRThomo sapiens 42Tyr Ala Ser Glu Ser Ile Ser 1 5 439PRThomo sapiens 43Gln Gln Ser Asn Ser Trp Pro Phe Thr 1 5 44402DNAhomo sapiensCDS(1)..(402) 44atg gga tgg
agc tgt atc atc ctc ttc ttg gta gca aca gct aca ggt 48Met Gly Trp Ser Cys Ile Ile Leu Phe Leu Val Ala Thr Ala Thr Gly 1 5 10 15 gtc cac tcc cag gtc caa ctg cag caa cct ggg tct gag ctg gtg agg 96Val His Ser Gln Val Gln Leu Gln Gln Pro Gly Ser Glu Leu Val Arg 20 25 30 cct gga gct tca gtg aag ctg tcc tgc aag gct tct ggc tac aca ttc 144Pro Gly Ala Ser Val Lys Leu Ser Cys Lys Ala Ser Gly Tyr Thr Phe 35 40 45 acc agc tac tgg atg cac tgg gtg aag cag agg cat gga caa ggc ctt 192Thr Ser Tyr Trp Met His Trp Val Lys Gln Arg His Gly Gln Gly Leu 50 55 60 gag tgg att gga aat att tat cct ggt ggt ggt tat act aac tac gat 240Glu Trp Ile Gly Asn Ile Tyr Pro Gly Gly Gly Tyr Thr Asn Tyr Asp 65 70 75 80 gag aag ttc aag agc aag ggc aca ctg act gta gac aca tcc tcc agc 288Glu Lys Phe Lys Ser Lys Gly Thr Leu Thr Val Asp Thr Ser Ser Ser 85 90 95 aca gcc tac atg cac ctc agc agc ctg aca tct gag gac tct gcg gtc 336Thr Ala Tyr Met His Leu Ser Ser Leu Thr Ser Glu Asp Ser Ala Val 100 105 110 tat tac tgt aca aga tca tcc gtt ttt gac tac tgg ggc caa ggc acc 384Tyr Tyr Cys Thr Arg Ser Ser Val Phe Asp Tyr Trp Gly Gln Gly Thr 115 120 125 act ctc aca gtc tcc tca 402Thr Leu Thr Val Ser Ser 130 45134PRThomo sapiens 45Met Gly Trp Ser Cys Ile Ile Leu Phe Leu Val Ala Thr Ala Thr Gly 1 5 10 15 Val His Ser Gln Val Gln Leu Gln Gln Pro Gly Ser Glu Leu Val Arg 20 25 30 Pro Gly Ala Ser Val Lys Leu Ser Cys Lys Ala Ser Gly Tyr Thr Phe 35 40 45 Thr Ser Tyr Trp Met His Trp Val Lys Gln Arg His Gly Gln Gly Leu 50 55 60 Glu Trp Ile Gly Asn Ile Tyr Pro Gly Gly Gly Tyr Thr Asn Tyr Asp 65 70 75 80 Glu Lys Phe Lys Ser Lys Gly Thr Leu Thr Val Asp Thr Ser Ser Ser 85 90 95 Thr Ala Tyr Met His Leu Ser Ser Leu Thr Ser Glu Asp Ser Ala Val 100 105 110 Tyr Tyr Cys Thr Arg Ser Ser Val Phe Asp Tyr Trp Gly Gln Gly Thr 115 120 125 Thr Leu Thr Val Ser Ser 130 465PRThomo sapiens 46Ser Tyr Trp Met His 1 5 4717PRThomo sapiens 47Asn Ile Tyr Pro Gly Gly Gly Tyr Thr Asn Tyr Asp Glu Lys Phe Lys 1 5 10 15 Ser 486PRThomo sapiens 48Ser Ser Val Phe Asp Tyr 1 5 49381DNAhomo sapiensCDS(1)..(381) 49atg gta tcc aca cct cag ttc ctt gta ttt ttg ctt ttc tgg att cca 48Met Val Ser Thr Pro Gln Phe Leu Val Phe Leu Leu Phe Trp Ile Pro 1 5 10 15 gcc tcc aga ggt gac atc ttg ctg act cag tct cca gcc atc ctg tct 96Ala Ser Arg Gly Asp Ile Leu Leu Thr Gln Ser Pro Ala Ile Leu Ser 20 25 30 gtg agt cca gga gaa aga gtc agt ttc tcc tgc agg gcc agt cag aac 144Val Ser Pro Gly Glu Arg Val Ser Phe Ser Cys Arg Ala Ser Gln Asn 35 40 45 att ggc aca agc ata cac tgg ttt cag caa aga aca aat ggt tct cca 192Ile Gly Thr Ser Ile His Trp Phe Gln Gln Arg Thr Asn Gly Ser Pro 50 55 60 agg ctt ctc ata aag tat gct tct gag tct atc tct ggg atc cct tcc 240Arg Leu Leu Ile Lys Tyr Ala Ser Glu Ser Ile Ser Gly Ile Pro Ser 65 70 75 80 agg ttt agt ggc agt gga tca ggg aca gat ttt act ctt agc atc aac 288Arg Phe Ser Gly Ser Gly Ser Gly Thr Asp Phe Thr Leu Ser Ile Asn 85 90 95 agt gtg gag tct gaa gat att gca gat tat tac tgt caa caa agt aat 336Ser Val Glu Ser Glu Asp Ile Ala Asp Tyr Tyr Cys Gln Gln Ser Asn 100 105 110 agc tgg cca ttc acg ttc ggc tcg ggg aca aag ttg gaa ata aaa 381Ser Trp Pro Phe Thr Phe Gly Ser Gly Thr Lys Leu Glu Ile Lys 115 120 125 50127PRThomo sapiens 50Met Val Ser Thr Pro Gln Phe Leu Val Phe Leu Leu Phe Trp Ile Pro 1 5 10 15 Ala Ser Arg Gly Asp Ile Leu Leu Thr Gln Ser Pro Ala Ile Leu Ser 20 25 30 Val Ser Pro Gly Glu Arg Val Ser Phe Ser Cys Arg Ala Ser Gln Asn 35 40 45 Ile Gly Thr Ser Ile His Trp Phe Gln Gln Arg Thr Asn Gly Ser Pro 50 55 60 Arg Leu Leu Ile Lys Tyr Ala Ser Glu Ser Ile Ser Gly Ile Pro Ser 65 70 75 80 Arg Phe Ser Gly Ser Gly Ser Gly Thr Asp Phe Thr Leu Ser Ile Asn 85 90 95 Ser Val Glu Ser Glu Asp Ile Ala Asp Tyr Tyr Cys Gln Gln Ser Asn 100 105 110 Ser Trp Pro Phe Thr Phe Gly Ser Gly Thr Lys Leu Glu Ile Lys 115 120 125 5111PRThomo sapiens 51Arg Ala Ser Gln Asn Ile Gly Thr Ser Ile His 1 5 10 527PRThomo sapiens 52Tyr Ala Ser Glu Ser Ile Ser 1 5 539PRThomo sapiens 53Gln Gln Ser Asn Ser Trp Pro Phe Thr 1 5 54396DNAhomo sapiensCDS(1)..(396) 54atg gga tgg agc tgt atc atc ctc ttc ttg gta gca aca gct aca ggt 48Met Gly Trp Ser Cys Ile Ile Leu Phe Leu Val Ala Thr Ala Thr Gly 1 5 10 15 gtc cac tcc cag gtc caa ctg cag cag cct ggg gct gag ctg gtg agg 96Val His Ser Gln Val Gln Leu Gln Gln Pro Gly Ala Glu Leu Val Arg 20 25 30 cct ggg gct tca gtg aag ctg tcc tgc aag gct tct ggc tac acc ttc 144Pro Gly Ala Ser Val Lys Leu Ser Cys Lys Ala Ser Gly Tyr Thr Phe 35 40 45 acc agc tac tgg ata acc tgg gtg aag cag agg cct gga caa ggc ctt 192Thr Ser Tyr Trp Ile Thr Trp Val Lys Gln Arg Pro Gly Gln Gly Leu 50 55 60 gag tgg atc gga aat att tat cct tct gat agt tat act aac tac aat 240Glu Trp Ile Gly Asn Ile Tyr Pro Ser Asp Ser Tyr Thr Asn Tyr Asn 65 70 75 80 caa aag ttc agg gac aag gcc aca ttg act gta gac aaa tcc tcc agt 288Gln Lys Phe Arg Asp Lys Ala Thr Leu Thr Val Asp Lys Ser Ser Ser 85 90 95 aca gcc tac atg cag ctc agc agc ccg aca tct gag gac tct gcg gtc 336Thr Ala Tyr Met Gln Leu Ser Ser Pro Thr Ser Glu Asp Ser Ala Val 100 105 110 tat tac tgt tca gcc ctc ttt gac tac tgg ggc caa ggc acc act ctc 384Tyr Tyr Cys Ser Ala Leu Phe Asp Tyr Trp Gly Gln Gly Thr Thr Leu 115 120 125 aca gtc tcc tca 396Thr Val Ser Ser 130 55132PRThomo sapiens 55Met Gly Trp Ser Cys Ile Ile Leu Phe Leu Val Ala Thr Ala Thr Gly 1 5 10 15 Val His Ser Gln Val Gln Leu Gln Gln Pro Gly Ala Glu Leu Val Arg 20 25 30 Pro Gly Ala Ser Val Lys Leu Ser Cys Lys Ala Ser Gly Tyr Thr Phe 35 40 45 Thr Ser Tyr Trp Ile Thr Trp Val Lys Gln Arg Pro Gly Gln Gly Leu 50 55 60 Glu Trp Ile Gly Asn Ile Tyr Pro Ser Asp Ser Tyr Thr Asn Tyr Asn 65 70 75 80 Gln Lys Phe Arg Asp Lys Ala Thr Leu Thr Val Asp Lys Ser Ser Ser 85 90 95 Thr Ala Tyr Met Gln Leu Ser Ser Pro Thr Ser Glu Asp Ser Ala Val 100 105 110 Tyr Tyr Cys Ser Ala Leu Phe Asp Tyr Trp Gly Gln Gly Thr Thr Leu 115 120 125 Thr Val Ser Ser 130 565PRThomo sapiens 56Ser Tyr Trp Ile Thr 1 5 5717PRThomo sapiens 57Asn Ile Tyr Pro Ser Asp Ser Tyr Thr Asn Tyr Asn Gln Lys Phe Arg 1 5 10 15 Asp 584PRThomo sapiens 58Leu Phe Asp Tyr 1 59381DNAhomo sapiensCDS(1)..(381) 59atg gta tcc aca cct cag ttc ctt gta ttt ttg ctt ttc tgg att cca 48Met Val Ser Thr Pro Gln Phe Leu Val Phe Leu Leu Phe Trp Ile Pro 1 5 10 15 gcc tcc aga ggt gac atc ttg ctg act cag tct cca gcc atc ctg tct 96Ala Ser Arg Gly Asp Ile Leu Leu Thr Gln Ser Pro Ala Ile Leu Ser 20 25 30 gtg agt cca gga gaa aga gtc agt ttc tcc tgc agg gcc agt cag agc 144Val Ser Pro Gly Glu Arg Val Ser Phe Ser Cys Arg Ala Ser Gln Ser 35 40 45 att ggc aca agc ata cac tgg tat cag caa aga aca aat ggt tct cca 192Ile Gly Thr Ser Ile His Trp Tyr Gln Gln Arg Thr Asn Gly Ser Pro 50 55 60 agg ctt ctc ata aag tat gct tct gag tct atc tct ggg atc cct tcc 240Arg Leu Leu Ile Lys Tyr Ala Ser Glu Ser Ile Ser Gly Ile Pro Ser 65 70 75 80 agg ttt agt ggc agt gga tca ggg aca gat ttt att ctt agc atc aac 288Arg Phe Ser Gly Ser Gly Ser Gly Thr Asp Phe Ile Leu Ser Ile Asn 85 90 95 agt gtg gag tct gaa gat att gca gat tat tac tgt caa caa agt aat 336Ser Val Glu Ser Glu Asp Ile Ala Asp Tyr Tyr Cys Gln Gln Ser Asn 100 105 110 agc tgg cca ttc acg ttc ggc tcg ggg aca aag ttg gaa ata aaa 381Ser Trp Pro Phe Thr Phe Gly Ser Gly Thr Lys Leu Glu Ile Lys 115 120 125 60127PRThomo sapiens 60Met Val Ser Thr Pro Gln Phe Leu Val Phe Leu Leu Phe Trp Ile Pro 1 5 10 15 Ala Ser Arg Gly Asp Ile Leu Leu Thr Gln Ser Pro Ala Ile Leu Ser 20 25 30 Val Ser Pro Gly Glu Arg Val Ser Phe Ser Cys Arg Ala Ser Gln Ser 35 40 45 Ile Gly Thr Ser Ile His Trp Tyr Gln Gln Arg Thr Asn Gly Ser Pro 50 55 60 Arg Leu Leu Ile Lys Tyr Ala Ser Glu Ser Ile Ser Gly Ile Pro Ser 65 70 75 80 Arg Phe Ser Gly Ser Gly Ser Gly Thr Asp Phe Ile Leu Ser Ile Asn 85 90 95 Ser Val Glu Ser Glu Asp Ile Ala Asp Tyr Tyr Cys Gln Gln Ser Asn 100 105 110 Ser Trp Pro Phe Thr Phe Gly Ser Gly Thr Lys Leu Glu Ile Lys 115 120 125 6111PRThomo sapiens 61Arg Ala Ser Gln Ser Ile Gly Thr Ser Ile His 1 5 10 627PRThomo sapiens 62Tyr Ala Ser Glu Ser Ile Ser 1 5 639PRThomo sapiens 63Gln Gln Ser Asn Ser Trp Pro Phe Thr 1 5 64423DNAhomo sapiensCDS(1)..(423) 64atg gga tgg agc tgg atc ttt ctc ttc ctc ctg tca gga act gca ggc 48Met Gly Trp Ser Trp Ile Phe Leu Phe Leu Leu Ser Gly Thr Ala Gly 1 5 10 15 gtc cac tct gag gtc cag ctt cag cag tca gga cct gag ctg gtg aaa 96Val His Ser Glu Val Gln Leu Gln Gln Ser Gly Pro Glu Leu Val Lys 20 25 30 cct ggg gcc tca gtg aag att tcc tgc aag gct tct gga tac aca ttc 144Pro Gly Ala Ser Val Lys Ile Ser Cys Lys Ala Ser Gly Tyr Thr Phe 35 40 45 act gac tac aat atg cac tgg gtg aag cag agc cat gga aag aac ctt 192Thr Asp Tyr Asn Met His Trp Val Lys Gln Ser His Gly Lys Asn Leu 50 55 60 gaa tgg att gga tat att tat cct tac aat ggt ggt act ggc tac aac 240Glu Trp Ile Gly Tyr Ile Tyr Pro Tyr Asn Gly Gly Thr Gly Tyr Asn 65 70 75 80 cag agg ttc aag agc agg gcc aca atg act gta gac aaa tcc tcc agc 288Gln Arg Phe Lys Ser Arg Ala Thr Met Thr Val Asp Lys Ser Ser Ser 85 90 95 aca gcc tac atg gag ctc cgc agc ctg aca tct gat gac tct gca gtc 336Thr Ala Tyr Met Glu Leu Arg Ser Leu Thr Ser Asp Asp Ser Ala Val 100 105 110 tat tac tgt gca aga gaa gac tac ggt agt agc ccc tct tat gct atg 384Tyr Tyr Cys Ala Arg Glu Asp Tyr Gly Ser Ser Pro Ser Tyr Ala Met 115 120 125 gac tat tgg ggt caa gga acc tca gtc atc gtc tcc tca 423Asp Tyr Trp Gly Gln Gly Thr Ser Val Ile Val Ser Ser 130 135 140 65141PRThomo sapiens 65Met Gly Trp Ser Trp Ile Phe Leu Phe Leu Leu Ser Gly Thr Ala Gly 1 5 10 15 Val His Ser Glu Val Gln Leu Gln Gln Ser Gly Pro Glu Leu Val Lys 20 25 30 Pro Gly Ala Ser Val Lys Ile Ser Cys Lys Ala Ser Gly Tyr Thr Phe 35 40 45 Thr Asp Tyr Asn Met His Trp Val Lys Gln Ser His Gly Lys Asn Leu 50 55 60 Glu Trp Ile Gly Tyr Ile Tyr Pro Tyr Asn Gly Gly Thr Gly Tyr Asn 65 70 75 80 Gln Arg Phe Lys Ser Arg Ala Thr Met Thr Val Asp Lys Ser Ser Ser 85 90 95 Thr Ala Tyr Met Glu Leu Arg Ser Leu Thr Ser Asp Asp Ser Ala Val 100 105 110 Tyr Tyr Cys Ala Arg Glu Asp Tyr Gly Ser Ser Pro Ser Tyr Ala Met 115 120 125 Asp Tyr Trp Gly Gln Gly Thr Ser Val Ile Val Ser Ser 130 135 140 665PRThomo sapiens 66Asp Tyr Asn Met His 1 5 6717PRThomo sapiens 67Tyr Ile Tyr Pro Tyr Asn Gly Gly Thr Gly Tyr Asn Gln Arg Phe Lys 1 5 10 15 Ser 6813PRThomo sapiens 68Glu Asp Tyr Gly Ser Ser Pro Ser Tyr Ala Met Asp Tyr 1 5 10 69390DNAhomo sapiensCDS(1)..(390) 69atg aag ttg cct gtt agg ctg ttg gtg ctg atg ttc tgg att cct gct 48Met Lys Leu Pro Val Arg Leu Leu Val Leu Met Phe Trp Ile Pro Ala 1 5 10 15 tcc agc agt gat gtt gtg atg acc caa act cca ctc tcc ctg cct gtc 96Ser Ser Ser Asp Val Val Met Thr Gln Thr Pro Leu Ser Leu Pro Val 20 25 30 agt ctt gga gat cag gcc tcc atc tct tgc aga tct agt cag agc ctt 144Ser Leu Gly Asp Gln Ala Ser Ile Ser Cys Arg Ser Ser Gln Ser Leu 35 40 45 gta cac ggt aat gga aac acc tat tta cat tgg tac ctg cag aag cca 192Val His Gly Asn Gly Asn Thr Tyr Leu His Trp Tyr Leu Gln Lys Pro 50 55 60 ggc cag tct cca aag ctc ctg atc tac aaa gtt tcc aac cga ttt tct 240Gly Gln Ser Pro Lys Leu Leu Ile Tyr Lys Val Ser Asn Arg Phe Ser 65 70 75 80 ggg gtc cca gac agg ttc agt ggc agt gga tca ggg acg gat ttc aca 288Gly Val Pro Asp Arg Phe Ser Gly Ser Gly Ser Gly Thr Asp Phe Thr 85 90 95 ctc aag atc agc aga gtg gag gct gag gat ctg gga gtt tat ttc tgc 336Leu Lys Ile Ser Arg Val Glu Ala Glu Asp Leu Gly Val Tyr Phe Cys 100 105 110 tct caa act aca cat gtt ccc acg ttc ggc tcg ggg aca aag ttg gaa 384Ser Gln Thr Thr His Val Pro Thr Phe Gly Ser Gly Thr Lys Leu Glu 115 120 125 ata aaa 390Ile Lys 130 70130PRThomo sapiens 70Met Lys Leu Pro Val Arg Leu Leu Val Leu Met Phe
Trp Ile Pro Ala 1 5 10 15 Ser Ser Ser Asp Val Val Met Thr Gln Thr Pro Leu Ser Leu Pro Val 20 25 30 Ser Leu Gly Asp Gln Ala Ser Ile Ser Cys Arg Ser Ser Gln Ser Leu 35 40 45 Val His Gly Asn Gly Asn Thr Tyr Leu His Trp Tyr Leu Gln Lys Pro 50 55 60 Gly Gln Ser Pro Lys Leu Leu Ile Tyr Lys Val Ser Asn Arg Phe Ser 65 70 75 80 Gly Val Pro Asp Arg Phe Ser Gly Ser Gly Ser Gly Thr Asp Phe Thr 85 90 95 Leu Lys Ile Ser Arg Val Glu Ala Glu Asp Leu Gly Val Tyr Phe Cys 100 105 110 Ser Gln Thr Thr His Val Pro Thr Phe Gly Ser Gly Thr Lys Leu Glu 115 120 125 Ile Lys 130 7116PRThomo sapiens 71Arg Ser Ser Gln Ser Leu Val His Gly Asn Gly Asn Thr Tyr Leu His 1 5 10 15 727PRThomo sapiens 72Lys Val Ser Asn Arg Phe Ser 1 5 738PRThomo sapiens 73Ser Gln Thr Thr His Val Pro Thr 1 5 74402DNAArtificialrecombinant DNACDS(1)..(402) 74atg ggg tgg agc tgc att atc ctg ttt ctt gtc gca act gca aca ggc 48Met Gly Trp Ser Cys Ile Ile Leu Phe Leu Val Ala Thr Ala Thr Gly 1 5 10 15 gtt cac tca cag gtt cag cta gtc cag tct gga gct gag gtg aag aaa 96Val His Ser Gln Val Gln Leu Val Gln Ser Gly Ala Glu Val Lys Lys 20 25 30 cca ggg gca tct gtc aaa gtg agc tgt aag gcc tct ggc tat acg ttc 144Pro Gly Ala Ser Val Lys Val Ser Cys Lys Ala Ser Gly Tyr Thr Phe 35 40 45 acg ata tac tgg atc aat tgg gtg agg caa gct cct gga caa cgg ttg 192Thr Ile Tyr Trp Ile Asn Trp Val Arg Gln Ala Pro Gly Gln Arg Leu 50 55 60 gaa tgg att ggc aac atc tat ccc tca gac tcc tac acc aac tac aat 240Glu Trp Ile Gly Asn Ile Tyr Pro Ser Asp Ser Tyr Thr Asn Tyr Asn 65 70 75 80 cag aag ttc aag gac aaa gcc act ctc acc gta gat acc agt gcc tcc 288Gln Lys Phe Lys Asp Lys Ala Thr Leu Thr Val Asp Thr Ser Ala Ser 85 90 95 aca gcc tat atg gag ctg agc agt tta cgc agc gaa gat aca gcg gtg 336Thr Ala Tyr Met Glu Leu Ser Ser Leu Arg Ser Glu Asp Thr Ala Val 100 105 110 tac tac tgc acc aga acc tcc atg gct gac tat tgg ggt cag ggt aca 384Tyr Tyr Cys Thr Arg Thr Ser Met Ala Asp Tyr Trp Gly Gln Gly Thr 115 120 125 ctg gtg act gtg agc tcc 402Leu Val Thr Val Ser Ser 130 75134PRTArtificialSynthetic Construct (recombinant protein) 75Met Gly Trp Ser Cys Ile Ile Leu Phe Leu Val Ala Thr Ala Thr Gly 1 5 10 15 Val His Ser Gln Val Gln Leu Val Gln Ser Gly Ala Glu Val Lys Lys 20 25 30 Pro Gly Ala Ser Val Lys Val Ser Cys Lys Ala Ser Gly Tyr Thr Phe 35 40 45 Thr Ile Tyr Trp Ile Asn Trp Val Arg Gln Ala Pro Gly Gln Arg Leu 50 55 60 Glu Trp Ile Gly Asn Ile Tyr Pro Ser Asp Ser Tyr Thr Asn Tyr Asn 65 70 75 80 Gln Lys Phe Lys Asp Lys Ala Thr Leu Thr Val Asp Thr Ser Ala Ser 85 90 95 Thr Ala Tyr Met Glu Leu Ser Ser Leu Arg Ser Glu Asp Thr Ala Val 100 105 110 Tyr Tyr Cys Thr Arg Thr Ser Met Ala Asp Tyr Trp Gly Gln Gly Thr 115 120 125 Leu Val Thr Val Ser Ser 130 76381DNAArtificialrecombinant DNACDS(1)..(381) 76atg gta agc aca ccc cag ttc ctc gtt ttc ctc ctg ttt tgg att ccc 48Met Val Ser Thr Pro Gln Phe Leu Val Phe Leu Leu Phe Trp Ile Pro 1 5 10 15 gca agt aga ggg gag atc gtc ttg act cag agt cct gcc aca ctg tct 96Ala Ser Arg Gly Glu Ile Val Leu Thr Gln Ser Pro Ala Thr Leu Ser 20 25 30 ctt tca cca gga gaa agg gcg aca ctt agc tgt cga gct tct cag agc 144Leu Ser Pro Gly Glu Arg Ala Thr Leu Ser Cys Arg Ala Ser Gln Ser 35 40 45 att ggc acg tcc ata cac tgg tat cag cag aaa ccg gga caa gct cca 192Ile Gly Thr Ser Ile His Trp Tyr Gln Gln Lys Pro Gly Gln Ala Pro 50 55 60 cgg tta ctg atc aag tat gcc tcc gaa agc atc tct ggg att cct gca 240Arg Leu Leu Ile Lys Tyr Ala Ser Glu Ser Ile Ser Gly Ile Pro Ala 65 70 75 80 cgc ttt agc gga agc ggt agt ggt acc gac ttc act ctg acc ata tcc 288Arg Phe Ser Gly Ser Gly Ser Gly Thr Asp Phe Thr Leu Thr Ile Ser 85 90 95 tca cta gaa ccc gag gat ttt gcc gtg tac tac tgc cag cag tcc aac 336Ser Leu Glu Pro Glu Asp Phe Ala Val Tyr Tyr Cys Gln Gln Ser Asn 100 105 110 tca tgg cct ttc acc ttt ggc caa ggc acc aaa gtg gag atc aag 381Ser Trp Pro Phe Thr Phe Gly Gln Gly Thr Lys Val Glu Ile Lys 115 120 125 77127PRTArtificialSynthetic Construct (recombinant protein) 77Met Val Ser Thr Pro Gln Phe Leu Val Phe Leu Leu Phe Trp Ile Pro 1 5 10 15 Ala Ser Arg Gly Glu Ile Val Leu Thr Gln Ser Pro Ala Thr Leu Ser 20 25 30 Leu Ser Pro Gly Glu Arg Ala Thr Leu Ser Cys Arg Ala Ser Gln Ser 35 40 45 Ile Gly Thr Ser Ile His Trp Tyr Gln Gln Lys Pro Gly Gln Ala Pro 50 55 60 Arg Leu Leu Ile Lys Tyr Ala Ser Glu Ser Ile Ser Gly Ile Pro Ala 65 70 75 80 Arg Phe Ser Gly Ser Gly Ser Gly Thr Asp Phe Thr Leu Thr Ile Ser 85 90 95 Ser Leu Glu Pro Glu Asp Phe Ala Val Tyr Tyr Cys Gln Gln Ser Asn 100 105 110 Ser Trp Pro Phe Thr Phe Gly Gln Gly Thr Lys Val Glu Ile Lys 115 120 125 78423DNAArtificialrecombinant DNACDS(1)..(423) 78atg gga tgg tct tgg atc ttt ctc ttc ctg ctg tct ggc aca gct gga 48Met Gly Trp Ser Trp Ile Phe Leu Phe Leu Leu Ser Gly Thr Ala Gly 1 5 10 15 gtg cat tcc caa gtt cag ctg gtc cag tcc gga gct gaa gtt aaa aag 96Val His Ser Gln Val Gln Leu Val Gln Ser Gly Ala Glu Val Lys Lys 20 25 30 ccc ggg gcc agc gtc aaa gtc tcc tgc aag gca tcc ggg tat act ttt 144Pro Gly Ala Ser Val Lys Val Ser Cys Lys Ala Ser Gly Tyr Thr Phe 35 40 45 acc gat tat aac atg cac tgg gtg cgc caa gca ccc ggc cag ggc ctg 192Thr Asp Tyr Asn Met His Trp Val Arg Gln Ala Pro Gly Gln Gly Leu 50 55 60 gag tgg att ggc tat atc tat cct tat aat gga ggg acc ggc tac aac 240Glu Trp Ile Gly Tyr Ile Tyr Pro Tyr Asn Gly Gly Thr Gly Tyr Asn 65 70 75 80 cag aga ttc aag agc aga gcc acc atg aca gtg gat aaa tct acc agc 288Gln Arg Phe Lys Ser Arg Ala Thr Met Thr Val Asp Lys Ser Thr Ser 85 90 95 act gcc tac atg gag ctg aga agc ctg cgg agc gac gac aca gcc gtg 336Thr Ala Tyr Met Glu Leu Arg Ser Leu Arg Ser Asp Asp Thr Ala Val 100 105 110 tac tac tgt gcc cgc gag gat tac gga agc agc cca agc tac gcc atg 384Tyr Tyr Cys Ala Arg Glu Asp Tyr Gly Ser Ser Pro Ser Tyr Ala Met 115 120 125 gat tac tgg ggc caa ggc act atg gtg acc gtg agc agc 423Asp Tyr Trp Gly Gln Gly Thr Met Val Thr Val Ser Ser 130 135 140 79141PRTArtificialSynthetic Construct (recombinant protein) 79Met Gly Trp Ser Trp Ile Phe Leu Phe Leu Leu Ser Gly Thr Ala Gly 1 5 10 15 Val His Ser Gln Val Gln Leu Val Gln Ser Gly Ala Glu Val Lys Lys 20 25 30 Pro Gly Ala Ser Val Lys Val Ser Cys Lys Ala Ser Gly Tyr Thr Phe 35 40 45 Thr Asp Tyr Asn Met His Trp Val Arg Gln Ala Pro Gly Gln Gly Leu 50 55 60 Glu Trp Ile Gly Tyr Ile Tyr Pro Tyr Asn Gly Gly Thr Gly Tyr Asn 65 70 75 80 Gln Arg Phe Lys Ser Arg Ala Thr Met Thr Val Asp Lys Ser Thr Ser 85 90 95 Thr Ala Tyr Met Glu Leu Arg Ser Leu Arg Ser Asp Asp Thr Ala Val 100 105 110 Tyr Tyr Cys Ala Arg Glu Asp Tyr Gly Ser Ser Pro Ser Tyr Ala Met 115 120 125 Asp Tyr Trp Gly Gln Gly Thr Met Val Thr Val Ser Ser 130 135 140 80423DNAArtificialrecombinant DNACDS(1)..(423) 80atg ggc tgg tct tgg atc ttc ctc ttc ctg ctg agc ggg acc gct gga 48Met Gly Trp Ser Trp Ile Phe Leu Phe Leu Leu Ser Gly Thr Ala Gly 1 5 10 15 gtc cat tct caa gtc caa ctg gtc cag tcc ggg gct gaa gtg aaa aaa 96Val His Ser Gln Val Gln Leu Val Gln Ser Gly Ala Glu Val Lys Lys 20 25 30 cca gga gca tcc gtt aag gtg tcc tgt aag gca agc gga tac acc ttt 144Pro Gly Ala Ser Val Lys Val Ser Cys Lys Ala Ser Gly Tyr Thr Phe 35 40 45 acc gac tat aac atg cac tgg gtg agg cag gcc ccc gga cag ggg ctg 192Thr Asp Tyr Asn Met His Trp Val Arg Gln Ala Pro Gly Gln Gly Leu 50 55 60 gag tgg atc ggc tat att tat cct tac aac ggg ggc act ggc tat aat 240Glu Trp Ile Gly Tyr Ile Tyr Pro Tyr Asn Gly Gly Thr Gly Tyr Asn 65 70 75 80 cag aga ttt aag agc cgc gct acc atg acc gtg gac acc tcc act tct 288Gln Arg Phe Lys Ser Arg Ala Thr Met Thr Val Asp Thr Ser Thr Ser 85 90 95 aca gcc tat atg gag ctg aga agc ctg cgg agc gat gat aca gcc gtg 336Thr Ala Tyr Met Glu Leu Arg Ser Leu Arg Ser Asp Asp Thr Ala Val 100 105 110 tac tac tgc gcc aga gaa gat tac ggc agc agc ccc agc tac gcc atg 384Tyr Tyr Cys Ala Arg Glu Asp Tyr Gly Ser Ser Pro Ser Tyr Ala Met 115 120 125 gac tac tgg ggc cag ggc aca atg gtt act gtg agc agc 423Asp Tyr Trp Gly Gln Gly Thr Met Val Thr Val Ser Ser 130 135 140 81141PRTArtificialSynthetic Construct (recombinant protein) 81Met Gly Trp Ser Trp Ile Phe Leu Phe Leu Leu Ser Gly Thr Ala Gly 1 5 10 15 Val His Ser Gln Val Gln Leu Val Gln Ser Gly Ala Glu Val Lys Lys 20 25 30 Pro Gly Ala Ser Val Lys Val Ser Cys Lys Ala Ser Gly Tyr Thr Phe 35 40 45 Thr Asp Tyr Asn Met His Trp Val Arg Gln Ala Pro Gly Gln Gly Leu 50 55 60 Glu Trp Ile Gly Tyr Ile Tyr Pro Tyr Asn Gly Gly Thr Gly Tyr Asn 65 70 75 80 Gln Arg Phe Lys Ser Arg Ala Thr Met Thr Val Asp Thr Ser Thr Ser 85 90 95 Thr Ala Tyr Met Glu Leu Arg Ser Leu Arg Ser Asp Asp Thr Ala Val 100 105 110 Tyr Tyr Cys Ala Arg Glu Asp Tyr Gly Ser Ser Pro Ser Tyr Ala Met 115 120 125 Asp Tyr Trp Gly Gln Gly Thr Met Val Thr Val Ser Ser 130 135 140 82390DNAArtificialrecombinant DNACDS(1)..(390) 82atg aag ctc cca gtg cgc ctc ctg gtc ctg atg ttc tgg att ccc gct 48Met Lys Leu Pro Val Arg Leu Leu Val Leu Met Phe Trp Ile Pro Ala 1 5 10 15 tcc tct agc gat atc gtc atg acc caa tcc cca ctg tct ctg cct gtg 96Ser Ser Ser Asp Ile Val Met Thr Gln Ser Pro Leu Ser Leu Pro Val 20 25 30 aca cca ggc gaa cct gca tct att agc tgt aga agc agc cag tcc ctg 144Thr Pro Gly Glu Pro Ala Ser Ile Ser Cys Arg Ser Ser Gln Ser Leu 35 40 45 gtg cac gga aac gga aac acc tat ctg cac tgg tac ctg caa aaa cct 192Val His Gly Asn Gly Asn Thr Tyr Leu His Trp Tyr Leu Gln Lys Pro 50 55 60 gga cag agc ccc cag ctg ctg atc tac aaa gtc agc aat aga ttt agc 240Gly Gln Ser Pro Gln Leu Leu Ile Tyr Lys Val Ser Asn Arg Phe Ser 65 70 75 80 ggg gtg ccc gac agg ttt agc ggc agc ggc agc ggc aca gat ttc acc 288Gly Val Pro Asp Arg Phe Ser Gly Ser Gly Ser Gly Thr Asp Phe Thr 85 90 95 ctg aaa atc tcc cgg gtg gaa gcc gag gac gtt ggg gtt tac tat tgc 336Leu Lys Ile Ser Arg Val Glu Ala Glu Asp Val Gly Val Tyr Tyr Cys 100 105 110 agc cag aca acc cat gtg ccc act ttc ggg ggc ggc act aag gtg gag 384Ser Gln Thr Thr His Val Pro Thr Phe Gly Gly Gly Thr Lys Val Glu 115 120 125 atc aag 390Ile Lys 130 83130PRTArtificialSynthetic Construct (recombinant protein) 83Met Lys Leu Pro Val Arg Leu Leu Val Leu Met Phe Trp Ile Pro Ala 1 5 10 15 Ser Ser Ser Asp Ile Val Met Thr Gln Ser Pro Leu Ser Leu Pro Val 20 25 30 Thr Pro Gly Glu Pro Ala Ser Ile Ser Cys Arg Ser Ser Gln Ser Leu 35 40 45 Val His Gly Asn Gly Asn Thr Tyr Leu His Trp Tyr Leu Gln Lys Pro 50 55 60 Gly Gln Ser Pro Gln Leu Leu Ile Tyr Lys Val Ser Asn Arg Phe Ser 65 70 75 80 Gly Val Pro Asp Arg Phe Ser Gly Ser Gly Ser Gly Thr Asp Phe Thr 85 90 95 Leu Lys Ile Ser Arg Val Glu Ala Glu Asp Val Gly Val Tyr Tyr Cys 100 105 110 Ser Gln Thr Thr His Val Pro Thr Phe Gly Gly Gly Thr Lys Val Glu 115 120 125 Ile Lys 13084563DNAHomo sapiensCDS(102)..(458) 84aaccacatcc ctcctcagaa gcccccagag cacaactcct taccatggac tggacctgga 60ggatcctctt tttggtggca gcagccacag gtgcccactc c cag gtc cag ctt gtg 116 Gln Val Gln Leu Val 1 5 cag tct ggg gct gag gtg aag aag cct ggg gcc tca gtg aag gtt tcc 164Gln Ser Gly Ala Glu Val Lys Lys Pro Gly Ala Ser Val Lys Val Ser 10 15 20 tgc aag gct tct gga tac acc ttc act aac tat gct ctg cat tgg gtg 212Cys Lys Ala Ser Gly Tyr Thr Phe Thr Asn Tyr Ala Leu His Trp Val 25 30 35 cgc cag gcc ccc gga caa agg ctt gag tgg atg gga tgg atc aac act 260Arg Gln Ala Pro Gly Gln Arg Leu Glu Trp Met Gly Trp Ile Asn Thr 40 45 50 ggc aat ggt aac aca aaa tat tca cag aag ttc cag ggc aga gtc acc 308Gly Asn Gly Asn Thr Lys Tyr Ser Gln Lys Phe Gln Gly Arg Val Thr 55 60 65 ctt acc agt gac aca tcc gcg agc aca gcc tac atg gag atg agc agc 356Leu Thr Ser Asp Thr Ser Ala Ser Thr Ala Tyr Met Glu Met Ser Ser 70 75 80 85 ctg aga tct gaa gac acg gct gtg tat tac tgt gcg agg agc agt ggc
404Leu Arg Ser Glu Asp Thr Ala Val Tyr Tyr Cys Ala Arg Ser Ser Gly 90 95 100 tgg tac gtt tgg ttc gac ccc tgg ggc cag gga acc ctg gtc acc gtc 452Trp Tyr Val Trp Phe Asp Pro Trp Gly Gln Gly Thr Leu Val Thr Val 105 110 115 tcc tca gcttccacca agggcccatc ggttttcccc ctggcgccct gctccaggag 508Ser Ser cacctctggg ggcacagcgg ccctgggctg cctggtcaag gactacttcc ccgaa 56385119PRTHomo sapiens 85Gln Val Gln Leu Val Gln Ser Gly Ala Glu Val Lys Lys Pro Gly Ala 1 5 10 15 Ser Val Lys Val Ser Cys Lys Ala Ser Gly Tyr Thr Phe Thr Asn Tyr 20 25 30 Ala Leu His Trp Val Arg Gln Ala Pro Gly Gln Arg Leu Glu Trp Met 35 40 45 Gly Trp Ile Asn Thr Gly Asn Gly Asn Thr Lys Tyr Ser Gln Lys Phe 50 55 60 Gln Gly Arg Val Thr Leu Thr Ser Asp Thr Ser Ala Ser Thr Ala Tyr 65 70 75 80 Met Glu Met Ser Ser Leu Arg Ser Glu Asp Thr Ala Val Tyr Tyr Cys 85 90 95 Ala Arg Ser Ser Gly Trp Tyr Val Trp Phe Asp Pro Trp Gly Gln Gly 100 105 110 Thr Leu Val Thr Val Ser Ser 115 86384DNAHomo sapiensCDS(1)..(384) 86atg gaa gtc ctc gtg cag ctt ctc ttc ctc ctg cta ctc tgg ctc cca 48Met Glu Val Leu Val Gln Leu Leu Phe Leu Leu Leu Leu Trp Leu Pro 1 5 10 15 gat acc acc gga gaa att gtg ttg aca cag tct cca gcc acc ctg tct 96Asp Thr Thr Gly Glu Ile Val Leu Thr Gln Ser Pro Ala Thr Leu Ser 20 25 30 ttg tct cca ggg gaa aga gcc acc ctc tcc tgc agg gcc agt cag agt 144Leu Ser Pro Gly Glu Arg Ala Thr Leu Ser Cys Arg Ala Ser Gln Ser 35 40 45 gtt agc agc tac tta gcc tgg tat caa cag aaa cct ggc cag gct ccc 192Val Ser Ser Tyr Leu Ala Trp Tyr Gln Gln Lys Pro Gly Gln Ala Pro 50 55 60 agg ctc ctc atc tat gat gca tcc aac agg gcc act ggc atc cca gcc 240Arg Leu Leu Ile Tyr Asp Ala Ser Asn Arg Ala Thr Gly Ile Pro Ala 65 70 75 80 agg ttc agt ggc agt ggg tct ggg aca gac ttc act ctc acc atc agc 288Arg Phe Ser Gly Ser Gly Ser Gly Thr Asp Phe Thr Leu Thr Ile Ser 85 90 95 agc cta gag cct gaa gat ttt gca gtt tat tac tgt cag cag cgt agc 336Ser Leu Glu Pro Glu Asp Phe Ala Val Tyr Tyr Cys Gln Gln Arg Ser 100 105 110 aac tgg cct cgg tcg ttc ggc caa ggg acc aag gtg gaa atc aaa cga 384Asn Trp Pro Arg Ser Phe Gly Gln Gly Thr Lys Val Glu Ile Lys Arg 115 120 125 87128PRTHomo sapiens 87Met Glu Val Leu Val Gln Leu Leu Phe Leu Leu Leu Leu Trp Leu Pro 1 5 10 15 Asp Thr Thr Gly Glu Ile Val Leu Thr Gln Ser Pro Ala Thr Leu Ser 20 25 30 Leu Ser Pro Gly Glu Arg Ala Thr Leu Ser Cys Arg Ala Ser Gln Ser 35 40 45 Val Ser Ser Tyr Leu Ala Trp Tyr Gln Gln Lys Pro Gly Gln Ala Pro 50 55 60 Arg Leu Leu Ile Tyr Asp Ala Ser Asn Arg Ala Thr Gly Ile Pro Ala 65 70 75 80 Arg Phe Ser Gly Ser Gly Ser Gly Thr Asp Phe Thr Leu Thr Ile Ser 85 90 95 Ser Leu Glu Pro Glu Asp Phe Ala Val Tyr Tyr Cys Gln Gln Arg Ser 100 105 110 Asn Trp Pro Arg Ser Phe Gly Gln Gly Thr Lys Val Glu Ile Lys Arg 115 120 125 88601DNAHomo sapiensCDS(112)..(477) 88acccaaaaac cacacccctc cttgggagaa tcccctagat cacagctcct caccatggac 60tggacctgga gcatcctttt cttggtggca gcagcaacag gtgcccactc c cag gtt 117 Gln Val 1 cag ctg gtg cag tct gga gct gag gtg aag aag cct ggg gcc tca gtg 165Gln Leu Val Gln Ser Gly Ala Glu Val Lys Lys Pro Gly Ala Ser Val 5 10 15 aag gtc tcc tgc aag gct tct ggt tac acc ttt acc agt tat ggt atc 213Lys Val Ser Cys Lys Ala Ser Gly Tyr Thr Phe Thr Ser Tyr Gly Ile 20 25 30 agt tgg gtg cgc cag gcc cct gga caa ggg ctt gag tgg atg gga ttg 261Ser Trp Val Arg Gln Ala Pro Gly Gln Gly Leu Glu Trp Met Gly Leu 35 40 45 50 atc agc gct tac aat ggt aac aca aac tat gca cag aag ctc cag ggc 309Ile Ser Ala Tyr Asn Gly Asn Thr Asn Tyr Ala Gln Lys Leu Gln Gly 55 60 65 aga gtc acc atg acc gta gac acg tct acg agc aca gcc tat atg gaa 357Arg Val Thr Met Thr Val Asp Thr Ser Thr Ser Thr Ala Tyr Met Glu 70 75 80 ctg agg agc ctg aga tct gac gac acg gcc gtc tat tac tgt gcg aga 405Leu Arg Ser Leu Arg Ser Asp Asp Thr Ala Val Tyr Tyr Cys Ala Arg 85 90 95 gat gga ata gca gtg gcg acc aaa gat gct ttt gat atc tgg ggc caa 453Asp Gly Ile Ala Val Ala Thr Lys Asp Ala Phe Asp Ile Trp Gly Gln 100 105 110 ggg aca atg gtc acc gtc tct tca gcacccacca aggctccgga tgtgttcccc 507Gly Thr Met Val Thr Val Ser Ser 115 120 atcatatcag ggtgcagaca cccaaaggat aacagccctg tggtcctggc atgcttgata 567actgggtacc acccaacgtc cgtgactgtc acct 60189122PRTHomo sapiens 89Gln Val Gln Leu Val Gln Ser Gly Ala Glu Val Lys Lys Pro Gly Ala 1 5 10 15 Ser Val Lys Val Ser Cys Lys Ala Ser Gly Tyr Thr Phe Thr Ser Tyr 20 25 30 Gly Ile Ser Trp Val Arg Gln Ala Pro Gly Gln Gly Leu Glu Trp Met 35 40 45 Gly Leu Ile Ser Ala Tyr Asn Gly Asn Thr Asn Tyr Ala Gln Lys Leu 50 55 60 Gln Gly Arg Val Thr Met Thr Val Asp Thr Ser Thr Ser Thr Ala Tyr 65 70 75 80 Met Glu Leu Arg Ser Leu Arg Ser Asp Asp Thr Ala Val Tyr Tyr Cys 85 90 95 Ala Arg Asp Gly Ile Ala Val Ala Thr Lys Asp Ala Phe Asp Ile Trp 100 105 110 Gly Gln Gly Thr Met Val Thr Val Ser Ser 115 120 90342DNAHomo sapiensCDS(1)..(342) 90gat att gtg atg act cag tct cca ctc tcc ctg ccc gtc acc cct gga 48Asp Ile Val Met Thr Gln Ser Pro Leu Ser Leu Pro Val Thr Pro Gly 1 5 10 15 gag ccg gcc tcc atc tcc tgc agg tct agt cag agc ctc ctg cat agt 96Glu Pro Ala Ser Ile Ser Cys Arg Ser Ser Gln Ser Leu Leu His Ser 20 25 30 aat gga tac aac tat ttg gat tgg tac ctg cag aag cca ggg cag tct 144Asn Gly Tyr Asn Tyr Leu Asp Trp Tyr Leu Gln Lys Pro Gly Gln Ser 35 40 45 cca cag ctc ctg atc tat ttg ggt tct aat cgg gcc tcc ggg gtc cct 192Pro Gln Leu Leu Ile Tyr Leu Gly Ser Asn Arg Ala Ser Gly Val Pro 50 55 60 gac agg ttc agt ggc agt gga tca ggc aca gat ttt aca ctg aaa atc 240Asp Arg Phe Ser Gly Ser Gly Ser Gly Thr Asp Phe Thr Leu Lys Ile 65 70 75 80 agc agg gtg gag gct gag gat gtt ggg gtt tat tac tgc atg caa gct 288Ser Arg Val Glu Ala Glu Asp Val Gly Val Tyr Tyr Cys Met Gln Ala 85 90 95 cta caa act ctg ggg ctc act ttc ggc gga ggg acc aag gtg gag atc 336Leu Gln Thr Leu Gly Leu Thr Phe Gly Gly Gly Thr Lys Val Glu Ile 100 105 110 aaa cga 342Lys Arg 91114PRTHomo sapiens 91Asp Ile Val Met Thr Gln Ser Pro Leu Ser Leu Pro Val Thr Pro Gly 1 5 10 15 Glu Pro Ala Ser Ile Ser Cys Arg Ser Ser Gln Ser Leu Leu His Ser 20 25 30 Asn Gly Tyr Asn Tyr Leu Asp Trp Tyr Leu Gln Lys Pro Gly Gln Ser 35 40 45 Pro Gln Leu Leu Ile Tyr Leu Gly Ser Asn Arg Ala Ser Gly Val Pro 50 55 60 Asp Arg Phe Ser Gly Ser Gly Ser Gly Thr Asp Phe Thr Leu Lys Ile 65 70 75 80 Ser Arg Val Glu Ala Glu Asp Val Gly Val Tyr Tyr Cys Met Gln Ala 85 90 95 Leu Gln Thr Leu Gly Leu Thr Phe Gly Gly Gly Thr Lys Val Glu Ile 100 105 110 Lys Arg 92115PRTArtificialrecombinant protein 92Gln Val Gln Leu Val Gln Ser Gly Ala Glu Val Lys Lys Pro Gly Ala 1 5 10 15 Ser Val Lys Val Ser Cys Lys Ala Ser Gly Tyr Thr Phe Thr Ile Tyr 20 25 30 Trp Ile Asn Trp Val Arg Gln Ala Pro Gly Gln Arg Leu Glu Trp Ile 35 40 45 Gly Asn Ile Tyr Pro Ser Asp Ser Tyr Thr Asn Tyr Asn Gln Lys Phe 50 55 60 Lys Asp Lys Ala Thr Leu Thr Val Asp Thr Ser Ala Ser Thr Ala Tyr 65 70 75 80 Met Glu Leu Ser Ser Leu Arg Ser Glu Asp Thr Ala Val Tyr Tyr Cys 85 90 95 Thr Arg Thr Ser Met Ala Asp Tyr Trp Gly Gln Gly Thr Leu Val Thr 100 105 110 Val Ser Ser 115 93107PRTArtificialrecombinant protein 93Glu Ile Val Leu Thr Gln Ser Pro Ala Thr Leu Ser Leu Ser Pro Gly 1 5 10 15 Glu Arg Ala Thr Leu Ser Cys Arg Ala Ser Gln Ser Ile Gly Thr Ser 20 25 30 Ile His Trp Tyr Gln Gln Lys Pro Gly Gln Ala Pro Arg Leu Leu Ile 35 40 45 Lys Tyr Ala Ser Glu Ser Ile Ser Gly Ile Pro Ala Arg Phe Ser Gly 50 55 60 Ser Gly Ser Gly Thr Asp Phe Thr Leu Thr Ile Ser Ser Leu Glu Pro 65 70 75 80 Glu Asp Phe Ala Val Tyr Tyr Cys Gln Gln Ser Asn Ser Trp Pro Phe 85 90 95 Thr Phe Gly Gln Gly Thr Lys Val Glu Ile Lys 100 105 94122PRTArtificialrecombinant protein 94Gln Val Gln Leu Val Gln Ser Gly Ala Glu Val Lys Lys Pro Gly Ala 1 5 10 15 Ser Val Lys Val Ser Cys Lys Ala Ser Gly Tyr Thr Phe Thr Asp Tyr 20 25 30 Asn Met His Trp Val Arg Gln Ala Pro Gly Gln Gly Leu Glu Trp Ile 35 40 45 Gly Tyr Ile Tyr Pro Tyr Asn Gly Gly Thr Gly Tyr Asn Gln Arg Phe 50 55 60 Lys Ser Arg Ala Thr Met Thr Val Asp Lys Ser Thr Ser Thr Ala Tyr 65 70 75 80 Met Glu Leu Arg Ser Leu Arg Ser Asp Asp Thr Ala Val Tyr Tyr Cys 85 90 95 Ala Arg Glu Asp Tyr Gly Ser Ser Pro Ser Tyr Ala Met Asp Tyr Trp 100 105 110 Gly Gln Gly Thr Met Val Thr Val Ser Ser 115 120 95122PRTArtificialrecombinant protein 95Gln Val Gln Leu Val Gln Ser Gly Ala Glu Val Lys Lys Pro Gly Ala 1 5 10 15 Ser Val Lys Val Ser Cys Lys Ala Ser Gly Tyr Thr Phe Thr Asp Tyr 20 25 30 Asn Met His Trp Val Arg Gln Ala Pro Gly Gln Gly Leu Glu Trp Ile 35 40 45 Gly Tyr Ile Tyr Pro Tyr Asn Gly Gly Thr Gly Tyr Asn Gln Arg Phe 50 55 60 Lys Ser Arg Ala Thr Met Thr Val Asp Thr Ser Thr Ser Thr Ala Tyr 65 70 75 80 Met Glu Leu Arg Ser Leu Arg Ser Asp Asp Thr Ala Val Tyr Tyr Cys 85 90 95 Ala Arg Glu Asp Tyr Gly Ser Ser Pro Ser Tyr Ala Met Asp Tyr Trp 100 105 110 Gly Gln Gly Thr Met Val Thr Val Ser Ser 115 120 96111PRTArtificialrecombinant protein 96Asp Ile Val Met Thr Gln Ser Pro Leu Ser Leu Pro Val Thr Pro Gly 1 5 10 15 Glu Pro Ala Ser Ile Ser Cys Arg Ser Ser Gln Ser Leu Val His Gly 20 25 30 Asn Gly Asn Thr Tyr Leu His Trp Tyr Leu Gln Lys Pro Gly Gln Ser 35 40 45 Pro Gln Leu Leu Ile Tyr Lys Val Ser Asn Arg Phe Ser Gly Val Pro 50 55 60 Asp Arg Phe Ser Gly Ser Gly Ser Gly Thr Asp Phe Thr Leu Lys Ile 65 70 75 80 Ser Arg Val Glu Ala Glu Asp Val Gly Val Tyr Tyr Cys Ser Gln Thr 85 90 95 Thr His Val Pro Thr Phe Gly Gly Gly Thr Lys Val Glu Ile Lys 100 105 110 97134PRTArtificialSynthetic Construct (recombinant protein) 97Met Gly Trp Ser Cys Ile Ile Leu Phe Leu Val Ala Thr Ala Thr Gly 1 5 10 15 Val His Ser Gln Val Gln Leu Val Gln Ser Gly Ala Glu Val Lys Lys 20 25 30 Pro Gly Ala Ser Val Lys Val Ser Cys Lys Ala Ser Gly Tyr Thr Phe 35 40 45 Thr Ile Tyr Trp Ile Asn Trp Val Arg Gln Ala Pro Gly Gln Gly Leu 50 55 60 Glu Trp Ile Gly Asn Ile Tyr Pro Ser Asp Ser Tyr Thr Asn Tyr Asn 65 70 75 80 Gln Lys Phe Lys Asp Lys Ala Thr Leu Thr Val Asp Thr Ser Ala Ser 85 90 95 Thr Ala Tyr Met Glu Leu Ser Ser Leu Arg Ser Glu Asp Thr Ala Val 100 105 110 Tyr Tyr Cys Thr Arg Thr Ser Met Ala Asp Tyr Trp Gly Gln Gly Thr 115 120 125 Leu Val Thr Val Ser Ser 130 98115PRTArtificialrecombinant protein 98Gln Val Gln Leu Val Gln Ser Gly Ala Glu Val Lys Lys Pro Gly Ala 1 5 10 15 Ser Val Lys Val Ser Cys Lys Ala Ser Gly Tyr Thr Phe Thr Ile Tyr 20 25 30 Trp Ile Asn Trp Val Arg Gln Ala Pro Gly Gln Gly Leu Glu Trp Ile 35 40 45 Gly Asn Ile Tyr Pro Ser Asp Ser Tyr Thr Asn Tyr Asn Gln Lys Phe 50 55 60 Lys Asp Lys Ala Thr Leu Thr Val Asp Thr Ser Ala Ser Thr Ala Tyr 65 70 75 80 Met Glu Leu Ser Ser Leu Arg Ser Glu Asp Thr Ala Val Tyr Tyr Cys 85 90 95 Thr Arg Thr Ser Met Ala Asp Tyr Trp Gly Gln Gly Thr Leu Val Thr 100 105 110 Val Ser Ser 115 99420DNAArtificialrecombinant DNACDS(13)..(414) 99gaattcacca cc atg gga tgg tcc tgc att att ctc ttt ctc gtc gcc acc 51 Met Gly Trp Ser Cys Ile Ile Leu Phe Leu Val Ala Thr 1 5 10 gcc aca ggc gtg cac agc cag gtt caa ctg cag caa cct ggg gca gag 99Ala Thr Gly Val His Ser Gln Val Gln Leu Gln Gln Pro Gly Ala Glu 15 20 25 ctg gtt cgg cca ggg gcc tcc gtc aaa ctg tcc tgc aaa gct tct ggc 147Leu Val Arg Pro Gly Ala Ser Val Lys Leu Ser Cys Lys Ala Ser Gly 30 35 40 45 tac act ttc acc atc tac tgg atc aac tgg gtg aag cag agg ccc ggc 195Tyr Thr Phe Thr Ile Tyr Trp Ile Asn Trp Val Lys Gln Arg Pro Gly 50 55 60 cag ggc ctg gaa tgg atc gga aat atc tat cct agc gat tct tac aca 243Gln Gly Leu Glu Trp Ile Gly Asn Ile Tyr Pro Ser Asp Ser Tyr Thr 65 70 75 aat tac aac cag aag ttc aag gac aag gct acc ctg acc gtg gac aaa 291Asn Tyr Asn Gln Lys Phe Lys Asp Lys Ala Thr Leu Thr
Val Asp Lys 80 85 90 tct agc tcc aca gcc tac atg cag ctg agc agc ccc act agc gag gat 339Ser Ser Ser Thr Ala Tyr Met Gln Leu Ser Ser Pro Thr Ser Glu Asp 95 100 105 agc gca gtg tat tat tgt acc aga acc agc atg gcc gac tat tgg gga 387Ser Ala Val Tyr Tyr Cys Thr Arg Thr Ser Met Ala Asp Tyr Trp Gly 110 115 120 125 cag ggc aca act ctg acc gtg agc agc gctagc 420Gln Gly Thr Thr Leu Thr Val Ser Ser 130 100399DNAArtificialrecombinant DNACDS(13)..(393) 100accggtacca cc atg gtt agc aca cct caa ttt ctg gtc ttc ctg ctc ttc 51 Met Val Ser Thr Pro Gln Phe Leu Val Phe Leu Leu Phe 1 5 10 tgg att cct gcc agc aga gga gat atc ctc ctg aca caa agc ccc gca 99Trp Ile Pro Ala Ser Arg Gly Asp Ile Leu Leu Thr Gln Ser Pro Ala 15 20 25 atc ctg agc gtg tcc ccc gga gag cgc gtg agc ttt agc tgc cgg gcc 147Ile Leu Ser Val Ser Pro Gly Glu Arg Val Ser Phe Ser Cys Arg Ala 30 35 40 45 agc cag agc att gga acc agc atc cac tgg tat cag cag aga acc aac 195Ser Gln Ser Ile Gly Thr Ser Ile His Trp Tyr Gln Gln Arg Thr Asn 50 55 60 ggg tct ccc agg ctg ctg att aaa tac gct tct gag tct att tcc ggg 243Gly Ser Pro Arg Leu Leu Ile Lys Tyr Ala Ser Glu Ser Ile Ser Gly 65 70 75 atc cca agc aga ttc tcc ggc tct ggc agc ggc act gat ttt act ctg 291Ile Pro Ser Arg Phe Ser Gly Ser Gly Ser Gly Thr Asp Phe Thr Leu 80 85 90 tct atc aac agc gtg gag tcc gaa gac atc gcc gac tac tat tgt cag 339Ser Ile Asn Ser Val Glu Ser Glu Asp Ile Ala Asp Tyr Tyr Cys Gln 95 100 105 cag agc aat tcc tgg cca ttc acc ttt ggc agc ggc acc aag ctg gaa 387Gln Ser Asn Ser Trp Pro Phe Thr Phe Gly Ser Gly Thr Lys Leu Glu 110 115 120 125 atc aag cgtacg 399Ile Lys 10130PRThomo sapiens 101Asn Lys Met Thr Val Cys Ser Pro Asp Gly Pro Gly Gly Arg Cys Gln 1 5 10 15 Cys Arg Ala Leu Gly Ser Gly Met Ala Val Asp Cys Ser Thr 20 25 30 10230PRThomo sapiens 102Thr Val Cys Ser Pro Asp Gly Pro Gly Gly Arg Cys Gln Cys Arg Ala 1 5 10 15 Leu Gly Ser Gly Met Ala Val Asp Cys Ser Thr Leu Thr Ser 20 25 30 10330PRThomo sapiens 103Thr Asn Lys Met Thr Val Cys Ser Pro Asp Gly Pro Gly Gly Arg Cys 1 5 10 15 Gln Cys Arg Ala Leu Gly Ser Gly Met Ala Val Asp Cys Ser 20 25 30 10430PRThomo sapiens 104Met Thr Val Cys Ser Pro Asp Gly Pro Gly Gly Arg Cys Gln Cys Arg 1 5 10 15 Ala Leu Gly Ser Gly Met Ala Val Asp Cys Ser Thr Leu Thr 20 25 30 10530PRThomo sapiens 105Lys Met Thr Val Cys Ser Pro Asp Gly Pro Gly Gly Arg Cys Gln Cys 1 5 10 15 Arg Ala Leu Gly Ser Gly Met Ala Val Asp Cys Ser Thr Leu 20 25 30 10630PRThomo sapiens 106Pro Thr Asn Lys Met Thr Val Cys Ser Pro Asp Gly Pro Gly Gly Arg 1 5 10 15 Cys Gln Cys Arg Ala Leu Gly Ser Gly Met Ala Val Asp Cys 20 25 30 10730PRThomo sapiens 107Val Cys Ser Pro Asp Gly Pro Gly Gly Arg Cys Gln Cys Arg Ala Leu 1 5 10 15 Gly Ser Gly Met Ala Val Asp Cys Ser Thr Leu Thr Ser Lys 20 25 30 10833PRThomo sapiens 108Cys Ala Ala Val His Tyr Glu Gln Pro Thr Ile Gln Ile Glu Leu Arg 1 5 10 15 Cys Ala Ala Val His Tyr Glu Gln Pro Thr Ile Gln Ile Glu Leu Arg 20 25 30 Cys 10930PRThomo sapiens 109Cys Pro Thr Asn Lys Met Thr Val Cys Ser Pro Asp Gly Pro Gly Gly 1 5 10 15 Arg Cys Gln Cys Arg Ala Leu Gly Ser Gly Met Ala Val Asp 20 25 30 11033PRThomo sapiens 110Cys Val His Tyr Glu Gln Pro Thr Ile Gln Ile Glu Leu Arg Gln Asn 1 5 10 15 Cys Val His Tyr Glu Gln Pro Thr Ile Gln Ile Glu Leu Arg Gln Asn 20 25 30 Cys 11132PRThomo sapiens 111His Ser Asp Leu Asp Ala Glu Leu Arg Arg Leu Phe Arg Glu Arg Cys 1 5 10 15 His Ser Asp Leu Asp Ala Glu Leu Arg Arg Leu Phe Arg Glu Arg Cys 20 25 30 11230PRThomo sapiens 112Arg Leu Phe Arg Glu Arg Tyr Arg Leu His Pro Lys Phe Val Ala Ala 1 5 10 15 Val His Tyr Glu Gln Pro Thr Ile Gln Ile Glu Leu Arg Gln 20 25 30 11315PRThomo sapiens 113Ala Val His Tyr Glu Gln Pro Thr Ile Gln Ile Glu Leu Arg Gln 1 5 10 15 11433PRThomo sapiens 114Cys Ala Gly Ala Phe Asn His Ser Asp Leu Asp Ala Glu Leu Arg Arg 1 5 10 15 Cys His His Ile Leu Ile Asp Leu Arg His Arg Pro Thr Ala Gly Ala 20 25 30 Cys 11533PRThomo sapiens 115Cys Pro Lys Phe Val Ala Ala Val His Tyr Glu Gln Pro Thr Ile Gln 1 5 10 15 Cys Gly Leu Asp Leu Arg Val Arg Gly Glu Pro Leu Gln Val Glu Arg 20 25 30 Cys 11623PRThomo sapiens 116Cys His Ser Asp Leu Asp Ala Glu Leu Arg Arg Leu Phe Arg Glu Arg 1 5 10 15 Cys Gly Leu Asp Leu Arg Val 20 11715PRThomo sapiens 117Phe Gln Gly Arg Gly Gly Leu Asp Leu Arg Val Arg Gly Glu Pro 1 5 10 15 11833PRThomo sapiens 118Cys Val His Tyr Glu Gln Pro Thr Ile Gln Ile Glu Leu Arg Gln Asn 1 5 10 15 Cys Asp Leu Asp Ala Glu Leu Arg Arg Leu Phe Arg Glu Arg Tyr Arg 20 25 30 Cys 11923PRThomo sapiens 119Cys His Ser Asp Leu Asp Ala Glu Leu Arg Arg Leu Phe Arg Glu Arg 1 5 10 15 Cys Arg Gly Glu Pro Leu Gln 20 12033PRThomo sapiens 120Cys Thr Ile Gln Ile Glu Leu Arg Gln Asn Thr Ser Gln Lys Ala Ala 1 5 10 15 Cys Val His Tyr Glu Gln Pro Thr Ile Gln Ile Glu Leu Arg Gln Asn 20 25 30 Cys 12133PRThomo sapiens 121Cys Val His Tyr Glu Gln Pro Thr Ile Gln Ile Glu Leu Arg Gln Asn 1 5 10 15 Cys His Ser Asp Leu Asp Ala Glu Leu Arg Arg Leu Phe Arg Glu Arg 20 25 30 Cys 12233PRThomo sapiens 122Cys His His Ile Leu Ile Asp Leu Arg His Arg Pro Thr Ala Gly Ala 1 5 10 15 Cys His Ser Asp Leu Asp Ala Glu Leu Arg Arg Leu Phe Arg Glu Arg 20 25 30 Cys 12333PRThomo sapiens 123Cys His His Ile Leu Ile Asp Leu Arg His Arg Pro Thr Ala Gly Ala 1 5 10 15 Cys Val His Tyr Glu Gln Pro Thr Ile Gln Ile Glu Leu Arg Gln Asn 20 25 30 Cys 12433PRThomo sapiens 124Cys His His Ile Leu Ile Asp Leu Arg His Arg Pro Thr Ala Gly Ala 1 5 10 15 Cys Gly Leu Asp Leu Arg Val Arg Gly Glu Pro Leu Gln Val Glu Arg 20 25 30 Cys 12533PRThomo sapiens 125Cys Asp Ala Glu Leu Arg Arg Leu Phe Arg Glu Arg Tyr Arg Leu His 1 5 10 15 Cys Asp Glu Leu Val Arg Thr His His Ile Leu Ile Asp Leu Arg His 20 25 30 Cys 12617PRThomo sapiens 126Cys Val His Tyr Glu Gln Pro Thr Ile Gln Ile Glu Leu Arg Gln Asn 1 5 10 15 Cys 12733PRThomo sapiens 127Cys Ala Phe Asn His Ser Asp Leu Asp Ala Glu Leu Arg Arg Leu Phe 1 5 10 15 Cys Val His Tyr Glu Gln Pro Thr Ile Gln Ile Glu Leu Arg Gln Asn 20 25 30 Cys 12833PRThomo sapiens 128Cys Val His Tyr Glu Gln Pro Thr Ile Gln Ile Glu Leu Arg Gln Asn 1 5 10 15 Cys His His Ile Leu Ile Asp Leu Arg His Arg Pro Thr Ala Gly Ala 20 25 30 Cys 12933PRThomo sapiens 129Cys Asp Leu Asp Ala Glu Leu Arg Arg Leu Phe Arg Glu Arg Tyr Arg 1 5 10 15 Cys Asp Glu Leu Val Arg Thr His His Ile Leu Ile Asp Leu Arg His 20 25 30 Cys 13032PRThomo sapiens 130Val His Tyr Glu Gln Pro Thr Ile Gln Ile Glu Leu Arg Gln Asn Cys 1 5 10 15 Gly Leu Asp Leu Arg Val Arg Gly Glu Pro Leu Gln Val Glu Arg Cys 20 25 30 13133PRThomo sapiens 131Cys Asp Glu Leu Val Arg Thr His His Ile Leu Ile Asp Leu Arg His 1 5 10 15 Cys Asp Leu Asp Ala Glu Leu Arg Arg Leu Phe Arg Glu Arg Tyr Arg 20 25 30 Cys 13232PRThomo sapiens 132Ala Val His Tyr Glu Gln Pro Thr Ile Gln Ile Glu Leu Arg Gln Cys 1 5 10 15 Ala Val His Tyr Glu Gln Pro Thr Ile Gln Ile Glu Leu Arg Gln Cys 20 25 30 13333PRThomo sapiens 133Cys His Ser Asp Leu Asp Ala Glu Leu Arg Arg Leu Phe Arg Glu Arg 1 5 10 15 Cys Asp Glu Leu Val Arg Thr His His Ile Leu Ile Asp Leu Arg His 20 25 30 Cys 13430PRThomo sapiens 134Thr Asn Lys Met Thr Val Cys Ser Pro Asp Gly Pro Gly Gly Arg Cys 1 5 10 15 Gln Cys Arg Ala Leu Gly Ser Gly Met Ala Val Asp Cys Ser 20 25 30 13530PRThomo sapiens 135Asn Lys Met Thr Val Cys Ser Pro Asp Gly Pro Gly Gly Arg Cys Gln 1 5 10 15 Cys Arg Ala Leu Gly Ser Gly Met Ala Val Asp Cys Ser Thr 20 25 30 13630PRThomo sapiens 136Lys Met Thr Val Cys Ser Pro Asp Gly Pro Gly Gly Arg Cys Gln Cys 1 5 10 15 Arg Ala Leu Gly Ser Gly Met Ala Val Asp Cys Ser Thr Leu 20 25 30 13730PRThomo sapiens 137Met Thr Val Cys Ser Pro Asp Gly Pro Gly Gly Arg Cys Gln Cys Arg 1 5 10 15 Ala Leu Gly Ser Gly Met Ala Val Asp Cys Ser Thr Leu Thr 20 25 30 13830PRThomo sapiens 138Cys Pro Thr Asn Lys Met Thr Val Cys Ser Pro Asp Gly Pro Gly Gly 1 5 10 15 Arg Cys Gln Cys Arg Ala Leu Gly Ser Gly Met Ala Val Asp 20 25 30 13930PRThomo sapiens 139Thr Val Cys Ser Pro Asp Gly Pro Gly Gly Arg Cys Gln Cys Arg Ala 1 5 10 15 Leu Gly Ser Gly Met Ala Val Asp Cys Ser Thr Leu Thr Ser 20 25 30 14030PRThomo sapiens 140Thr Cys Pro Thr Asn Lys Met Thr Val Cys Ser Pro Asp Gly Pro Gly 1 5 10 15 Gly Arg Cys Gln Cys Arg Ala Leu Gly Ser Gly Met Ala Val 20 25 30 14130PRThomo sapiens 141Pro Thr Asn Lys Met Thr Val Cys Ser Pro Asp Gly Pro Gly Gly Arg 1 5 10 15 Cys Gln Cys Arg Ala Leu Gly Ser Gly Met Ala Val Asp Cys 20 25 30 14230PRThomo sapiens 142Val Cys Ser Pro Asp Gly Pro Gly Gly Arg Cys Gln Cys Arg Ala Leu 1 5 10 15 Gly Ser Gly Met Ala Val Asp Cys Ser Thr Leu Thr Ser Lys 20 25 30 14330PRThomo sapiens 143Cys Ser Pro Asp Gly Pro Gly Gly Arg Cys Gln Cys Arg Ala Leu Gly 1 5 10 15 Ser Gly Met Ala Val Asp Cys Ser Thr Leu Thr Ser Lys Cys 20 25 30 14430PRThomo sapiens 144Cys Thr Cys Pro Thr Asn Lys Met Thr Val Cys Ser Pro Asp Gly Pro 1 5 10 15 Gly Gly Arg Cys Gln Cys Arg Ala Leu Gly Ser Gly Met Ala 20 25 30 14530PRThomo sapiens 145Asn Cys Thr Cys Pro Thr Asn Lys Met Thr Val Cys Ser Pro Asp Gly 1 5 10 15 Pro Gly Gly Arg Cys Gln Cys Arg Ala Leu Gly Ser Gly Met 20 25 30 14630PRThomo sapiens 146Asp Asn Cys Thr Cys Pro Thr Asn Lys Met Thr Val Cys Ser Pro Asp 1 5 10 15 Gly Pro Gly Gly Arg Cys Gln Cys Arg Ala Leu Gly Ser Gly 20 25 30 14733PRThomo sapiens 147Cys Thr Val Ala Ser Pro Asp Gly Pro Gly Gly Arg Ala Gln Ala Arg 1 5 10 15 Cys Leu Gly Ser Gly Met Ala Val Asp Ala Ser Thr Leu Thr Ser Lys 20 25 30 Cys 14830PRThomo sapiens 148Gln Asp Asn Cys Thr Cys Pro Thr Asn Lys Met Thr Val Cys Ser Pro 1 5 10 15 Asp Gly Pro Gly Gly Arg Cys Gln Cys Arg Ala Leu Gly Ser 20 25 30 14930PRThomo sapiens 149Ser Pro Asp Gly Pro Gly Gly Arg Cys Gln Cys Arg Ala Leu Gly Ser 1 5 10 15 Gly Met Ala Val Asp Cys Ser Thr Leu Thr Ser Lys Cys Leu 20 25 30 15033PRThomo sapiens 150Cys Thr Asn Lys Met Thr Val Cys Ser Pro Asp Gly Pro Gly Gly Arg 1 5 10 15 Cys Gln Cys Arg Ala Leu Gly Ser Gly Met Ala Val Asp Ala Ser Thr 20 25 30 Cys 15115PRThomo sapiens 151Thr Val Cys Ser Pro Asp Gly Pro Gly Gly Arg Cys Gln Cys Arg 1 5 10 15 15233PRThomo sapiens 152Cys Ala Pro Lys Asn Ala Arg Thr Leu Val Arg Pro Ser Glu His Ala 1 5 10 15 Cys Ala Arg Thr Leu Val Arg Pro Ser Glu His Ala Leu Val Asp Asn 20 25 30 Cys 15332PRThomo sapiens 153His Ser Asp Leu Asp Ala Glu Leu Arg Arg Leu Phe Arg Glu Arg Cys 1 5 10 15 His Ser Asp Leu Asp Ala Glu Leu Arg Arg Leu Phe Arg Glu Arg Cys 20 25 30 15430PRThomo sapiens 154Thr Val Cys Ser Pro Asp Gly Pro Gly Gly Arg Cys Gln Cys Arg Ala 1 5 10 15 Leu Gly Ser Gly Met Ala Val Asp Cys Ser Thr Leu Thr Ser 20 25 30 15530PRThomo sapiens 155Asn Lys Met Thr Val Cys Ser Pro Asp Gly Pro Gly Gly Arg Cys Gln 1 5 10 15 Cys Arg Ala Leu Gly Ser Gly Met Ala Val Asp Cys Ser Thr 20 25 30 15630PRThomo sapiens 156Thr Asn Lys Met Thr Val Cys Ser Pro Asp Gly Pro Gly Gly Arg Cys 1 5 10 15 Gln Cys Arg Ala Leu Gly Ser Gly Met Ala Val Asp Cys Ser 20 25 30 15730PRThomo sapiens 157Met Thr Val Cys Ser Pro Asp Gly Pro Gly Gly Arg Cys Gln Cys Arg 1 5 10 15 Ala Leu Gly Ser Gly Met Ala Val Asp Cys Ser Thr Leu Thr 20 25 30 15830PRThomo sapiens 158Lys Met Thr Val Cys Ser Pro Asp Gly Pro Gly Gly Arg Cys Gln Cys 1 5 10 15 Arg Ala Leu Gly Ser Gly Met Ala Val Asp Cys Ser Thr Leu 20 25 30 15930PRThomo sapiens 159Cys Pro Thr Asn Lys Met Thr Val Cys Ser Pro Asp Gly Pro Gly Gly 1 5 10 15 Arg Cys Gln Cys Arg Ala Leu Gly Ser Gly Met Ala Val Asp 20 25 30 16030PRThomo sapiens
160Pro Thr Asn Lys Met Thr Val Cys Ser Pro Asp Gly Pro Gly Gly Arg 1 5 10 15 Cys Gln Cys Arg Ala Leu Gly Ser Gly Met Ala Val Asp Cys 20 25 30 16133PRThomo sapiens 161Cys Ala Gly Ala Phe Asn His Ser Asp Leu Asp Ala Glu Leu Arg Arg 1 5 10 15 Cys His His Ile Leu Ile Asp Leu Arg His Arg Pro Thr Ala Gly Ala 20 25 30 Cys 16217PRThomo sapiens 162Cys Thr His His Ile Leu Ile Asp Leu Arg His Arg Pro Thr Ala Gly 1 5 10 15 Cys 16333PRThomo sapiens 163Cys Val His Tyr Glu Gln Pro Thr Ile Gln Ile Glu Leu Arg Gln Asn 1 5 10 15 Cys His His Ile Leu Ile Asp Leu Arg His Arg Pro Thr Ala Gly Ala 20 25 30 Cys 16433PRThomo sapiens 164Cys His His Ile Leu Ile Asp Leu Arg His Arg Pro Thr Ala Gly Ala 1 5 10 15 Cys His Ser Asp Leu Asp Ala Glu Leu Arg Arg Leu Phe Arg Glu Arg 20 25 30 Cys 16532PRThomo sapiens 165His Ser Asp Leu Asp Ala Glu Leu Arg Arg Leu Phe Arg Glu Arg Cys 1 5 10 15 His Ser Asp Leu Asp Ala Glu Leu Arg Arg Leu Phe Arg Glu Arg Cys 20 25 30 16633PRThomo sapiens 166Cys Asp Ala Glu Leu Arg Arg Leu Phe Arg Glu Arg Tyr Arg Leu His 1 5 10 15 Cys His Ser Asp Leu Asp Ala Glu Leu Arg Arg Leu Phe Arg Glu Arg 20 25 30 Cys 16719PRThomo sapiens 167Cys Asp Ala Glu Leu Arg Arg Leu Phe Arg Glu Arg Tyr Arg Leu His 1 5 10 15 Cys Pro Lys 16830PRThomo sapiens 168Val Cys Ser Pro Asp Gly Pro Gly Gly Arg Cys Gln Cys Arg Ala Leu 1 5 10 15 Gly Ser Gly Met Ala Val Asp Cys Ser Thr Leu Thr Ser Lys 20 25 30 16930PRThomo sapiens 169Asp Leu Ser Leu Arg Cys Asp Glu Leu Val Arg Thr His His Ile Leu 1 5 10 15 Ile Asp Leu Arg His Arg Pro Thr Ala Gly Ala Phe Asn His 20 25 30 17033PRThomo sapiens 170Cys Asp Glu Leu Val Arg Thr His His Ile Leu Ile Asp Leu Arg His 1 5 10 15 Cys Asp Leu Asp Ala Glu Leu Arg Arg Leu Phe Arg Glu Arg Tyr Arg 20 25 30 Cys 17117PRThomo sapiens 171Cys Phe Gln Gly Arg Gly Gly Leu Asp Leu Arg Val Arg Gly Glu Pro 1 5 10 15 Cys 17233PRThomo sapiens 172Cys Asp Ala Glu Leu Arg Arg Leu Phe Arg Glu Arg Tyr Arg Leu His 1 5 10 15 Cys Asp Glu Leu Val Arg Thr His His Ile Leu Ile Asp Leu Arg His 20 25 30 Cys 17333PRThomo sapiens 173Cys Gly Leu Asp Leu Arg Val Arg Gly Glu Pro Leu Gln Val Glu Arg 1 5 10 15 Cys His His Ile Leu Ile Asp Leu Arg His Arg Pro Thr Ala Gly Ala 20 25 30 Cys 17433PRThomo sapiens 174Cys His Ser Asp Leu Asp Ala Glu Leu Arg Arg Leu Phe Arg Glu Arg 1 5 10 15 Cys His Ser Asp Leu Asp Ala Glu Leu Arg Arg Leu Phe Arg Glu Arg 20 25 30 Cys 17533PRThomo sapiens 175Cys Asp Glu Leu Val Arg Thr His His Ile Leu Ile Asp Leu Arg His 1 5 10 15 Cys His His Ile Leu Ile Asp Leu Arg His Arg Pro Thr Ala Gly Ala 20 25 30 Cys 17633PRThomo sapiens 176Cys Asp Ala Glu Leu Arg Arg Leu Phe Arg Glu Arg Tyr Arg Leu His 1 5 10 15 Cys Asp Glu Leu Val Arg Thr His His Ile Leu Ile Asp Leu Arg His 20 25 30 Cys 17733PRThomo sapiens 177Cys His His Ile Leu Ile Asp Leu Arg His Arg Pro Thr Ala Gly Ala 1 5 10 15 Cys Arg Gly Glu Pro Leu Gln Val Glu Arg Thr Leu Ile Tyr Tyr Leu 20 25 30 Cys 17815PRThomo sapiens 178Cys Ser Pro Asp Gly Pro Gly Gly Arg Cys Gln Cys Arg Ala Leu 1 5 10 15 17933PRThomo sapiens 179Cys Thr Val Ala Ser Pro Asp Gly Pro Gly Gly Arg Ala Gln Ala Arg 1 5 10 15 Cys Val His Tyr Glu Gln Pro Thr Ile Gln Ile Glu Leu Arg Gln Asn 20 25 30 Cys 18033PRThomo sapiens 180Cys His His Ile Leu Ile Asp Leu Arg His Arg Pro Thr Ala Gly Ala 1 5 10 15 Cys Val His Tyr Glu Gln Pro Thr Ile Gln Ile Glu Leu Arg Gln Asn 20 25 30 Cys 18130PRThomo sapiens 181Leu Ser Leu Arg Cys Asp Glu Leu Val Arg Thr His His Ile Leu Ile 1 5 10 15 Asp Leu Arg His Arg Pro Thr Ala Gly Ala Phe Asn His Ser 20 25 30 18233PRThomo sapiens 182Cys Asp Glu Leu Val Arg Thr His His Ile Leu Ile Asp Leu Arg His 1 5 10 15 Cys His Ser Asp Leu Asp Ala Glu Leu Arg Arg Leu Phe Arg Glu Arg 20 25 30 Cys 18333PRThomo sapiens 183Cys Tyr Asp Pro Asp Ala Asp Pro Glu Gly Arg Phe Lys Ala Arg Gln 1 5 10 15 Cys Ala Asp Pro Glu Gly Arg Phe Lys Ala Arg Gln Ala Asn Gln Thr 20 25 30 Cys 18415PRThomo sapiens 184Pro Asp Cys Asp Pro Glu Gly Arg Phe Lys Ala Arg Gln Cys Asn 1 5 10 15 18531PRThomo sapiens 185Cys Ala Asp Pro Glu Gly Arg Phe Lys Ala Arg Gln Ala Asn Cys Pro 1 5 10 15 Asp Ala Asp Pro Glu Gly Arg Phe Lys Ala Arg Gln Ala Asn Cys 20 25 30 18633PRThomo sapiens 186Cys Pro Asp Ala Asp Pro Glu Gly Arg Phe Lys Ala Arg Gln Ala Asn 1 5 10 15 Cys Pro Asp Ala Asp Pro Glu Gly Arg Phe Lys Ala Arg Gln Ala Asn 20 25 30 Cys 18715PRThomo sapiens 187Val Cys Ser Pro Asp Gly Pro Gly Gly Arg Cys Gln Cys Arg Ala 1 5 10 15 18833PRThomo sapiens 188Cys Tyr Asp Pro Asp Ala Asp Pro Glu Gly Arg Phe Lys Ala Arg Gln 1 5 10 15 Cys Pro Asp Ala Asp Pro Glu Gly Arg Phe Lys Ala Arg Gln Ala Asn 20 25 30 Cys 18933PRThomo sapiens 189Cys Ala Asp Pro Glu Gly Arg Phe Lys Ala Arg Gln Ala Asn Gln Thr 1 5 10 15 Cys Tyr Asp Pro Asp Ala Asp Pro Glu Gly Arg Phe Lys Ala Arg Gln 20 25 30 Cys 19015PRThomo sapiens 190Asp Cys Asp Pro Glu Gly Arg Phe Lys Ala Arg Gln Cys Asn Gln 1 5 10 15 19133PRThomo sapiens 191Cys Thr Val Ala Ser Pro Asp Gly Pro Gly Gly Arg Ala Gln Ala Arg 1 5 10 15 Cys His Ser Asp Leu Asp Ala Glu Leu Arg Arg Leu Phe Arg Glu Arg 20 25 30 Cys 19233PRThomo sapiens 192Cys Asp Ala Asp Pro Glu Gly Arg Phe Lys Ala Arg Gln Ala Asn Gln 1 5 10 15 Cys Asp Ala Asp Pro Glu Gly Arg Phe Lys Ala Arg Gln Ala Asn Gln 20 25 30 Cys 19333PRThomo sapiens 193Cys Gly Arg Phe Lys Ala Arg Gln Ala Asn Gln Thr Ser Val Ala Trp 1 5 10 15 Cys Ala Arg Thr Leu Val Arg Pro Ser Glu His Ala Leu Val Asp Asn 20 25 30 Cys 19433PRThomo sapiens 194Cys Ala Asp Pro Glu Gly Arg Phe Lys Ala Arg Gln Ala Asn Gln Thr 1 5 10 15 Cys Pro Asp Ala Asp Pro Glu Gly Arg Phe Lys Ala Arg Gln Ala Asn 20 25 30 Cys 19533PRThomo sapiens 195Cys Pro Asp Ala Asp Pro Glu Gly Arg Phe Lys Ala Arg Gln Ala Asn 1 5 10 15 Cys Pro Asp Ala Asp Pro Glu Gly Arg Phe Lys Ala Arg Gln Ala Asn 20 25 30 Cys 19615PRThomo sapiens 196Cys Ser Pro Asp Gly Pro Gly Gly Arg Cys Gln Cys Arg Ala Leu 1 5 10 15 19733PRThomo sapiens 197Cys Glu Gly Arg Phe Lys Ala Arg Gln Ala Asn Gln Thr Ser Val Ala 1 5 10 15 Cys Glu Gly Arg Phe Lys Ala Arg Gln Ala Asn Gln Thr Ser Val Ala 20 25 30 Cys 19833PRThomo sapiens 198Cys Thr Val Ala Ser Pro Asp Gly Pro Gly Gly Arg Ala Gln Ala Arg 1 5 10 15 Cys Pro Asp Ala Asp Pro Glu Gly Arg Phe Lys Ala Arg Gln Ala Asn 20 25 30 Cys 19933PRThomo sapiens 199Cys Gly Leu Tyr Asp Pro Asp Ala Asp Pro Glu Gly Arg Phe Lys Ala 1 5 10 15 Cys Pro Asp Ala Asp Pro Glu Gly Arg Phe Lys Ala Arg Gln Ala Asn 20 25 30 Cys 20031PRThomo sapiens 200Asp Pro Asp Cys Asp Pro Glu Gly Arg Phe Lys Ala Arg Gln Cys Asn 1 5 10 15 Cys Gln Thr Ser Val Cys Trp Cys Val Asn Ser Val Gly Val Arg 20 25 30 20132PRThomo sapiens 201Cys Pro Glu Gly Arg Phe Lys Ala Arg Gln Ala Asn Gln Thr Ser Val 1 5 10 15 Cys Asp Glu Leu Val Arg His His Ile Leu Ile Asp Leu Arg His Cys 20 25 30 20233PRThomo sapiens 202Cys Pro Asp Gly Pro Gly Gly Arg Ala Gln Ala Arg Ala Leu Gly Ser 1 5 10 15 Cys His Ser Asp Leu Asp Ala Glu Leu Arg Arg Leu Phe Arg Glu Arg 20 25 30 Cys 20333PRThomo sapiens 203Cys Thr Leu Val Arg Pro Ser Glu His Ala Leu Val Asp Asn Asp Gly 1 5 10 15 Cys Gly Arg Phe Lys Ala Arg Gln Ala Asn Gln Thr Ser Val Ala Trp 20 25 30 Cys 20433PRThomo sapiens 204Cys Pro Asp Ala Asp Pro Glu Gly Arg Phe Lys Ala Arg Gln Ala Asn 1 5 10 15 Cys Tyr Asp Pro Asp Ala Asp Pro Glu Gly Arg Phe Lys Ala Arg Gln 20 25 30 Cys 20533PRThomo sapiens 205Cys Gly Leu Tyr Asp Pro Asp Ala Asp Pro Glu Gly Arg Phe Lys Ala 1 5 10 15 Cys Pro Glu Gly Arg Phe Lys Ala Arg Gln Ala Asn Gln Thr Ser Val 20 25 30 Cys 20615PRThomo sapiens 206Tyr Asp Pro Asp Cys Asp Pro Glu Gly Arg Phe Lys Ala Arg Gln 1 5 10 15 20733PRThomo sapiens 207Cys Pro Asp Ala Asp Pro Glu Gly Arg Phe Lys Ala Arg Gln Ala Asn 1 5 10 15 Cys Ala Asp Pro Glu Gly Arg Phe Lys Ala Arg Gln Ala Asn Gln Thr 20 25 30 Cys 20815PRThomo sapiens 208Cys Asp Pro Glu Gly Arg Phe Lys Ala Arg Gln Cys Asn Gln Thr 1 5 10 15 20933PRThomo sapiens 209Cys Val Asn Ser Val Gly Val Arg Arg Thr Asp Lys Gly Asp Leu Ser 1 5 10 15 Cys Tyr Asp Pro Asp Ala Asp Pro Glu Gly Arg Phe Lys Ala Arg Gln 20 25 30 Cys 21033PRThomo sapiens 210Cys Ser Val Gly Val Arg Arg Thr Asp Lys Gly Asp Leu Ser Leu Arg 1 5 10 15 Cys Tyr Asp Pro Asp Ala Asp Pro Glu Gly Arg Phe Lys Ala Arg Gln 20 25 30 Cys 21132PRThomo sapiens 211His Ser Asp Leu Asp Ala Glu Leu Arg Arg Leu Phe Arg Glu Arg Cys 1 5 10 15 His Ser Asp Leu Asp Ala Glu Leu Arg Arg Leu Phe Arg Glu Arg Cys 20 25 30 21233PRThomo sapiens 212Cys Asp Glu Leu Val Arg Thr His His Ile Leu Ile Asp Leu Arg His 1 5 10 15 Cys Asp Leu Asp Ala Glu Leu Arg Arg Leu Phe Arg Glu Arg Tyr Arg 20 25 30 Cys 21330PRThomo sapiens 213Cys Val Asn Ser Val Gly Val Arg Arg Thr Asp Lys Gly Asp Leu Ser 1 5 10 15 Leu Arg Cys Asp Glu Leu Val Arg Thr His His Ile Leu Ile 20 25 30 21430PRThomo sapiens 214Val Arg Arg Thr Asp Lys Gly Asp Leu Ser Leu Arg Cys Asp Glu Leu 1 5 10 15 Val Arg Thr His His Ile Leu Ile Asp Leu Arg His Arg Pro 20 25 30 21533PRThomo sapiens 215Cys Val Glu Arg Thr Leu Ile Tyr Tyr Leu Asp Glu Ile Pro Pro Lys 1 5 10 15 Cys His His Ile Leu Ile Asp Leu Arg His Arg Pro Thr Ala Gly Ala 20 25 30 Cys 21633PRThomo sapiens 216Cys His His Ile Leu Ile Asp Leu Arg His Arg Pro Thr Ala Gly Ala 1 5 10 15 Cys His Ser Asp Leu Asp Ala Glu Leu Arg Arg Leu Phe Arg Glu Arg 20 25 30 Cys 21733PRThomo sapiens 217Cys Val Asn Ser Val Gly Val Arg Arg Thr Asp Lys Gly Asp Leu Ser 1 5 10 15 Cys Pro Asp Ala Asp Pro Glu Gly Arg Phe Lys Ala Arg Gln Ala Asn 20 25 30 Cys 21833PRThomo sapiens 218Cys Val His Tyr Glu Gln Pro Thr Ile Gln Ile Glu Leu Arg Gln Asn 1 5 10 15 Cys His His Ile Leu Ile Asp Leu Arg His Arg Pro Thr Ala Gly Ala 20 25 30 Cys 21930PRThomo sapiens 219Val Gly Val Arg Arg Thr Asp Lys Gly Asp Leu Ser Leu Arg Cys Asp 1 5 10 15 Glu Leu Val Arg Thr His His Ile Leu Ile Asp Leu Arg His 20 25 30 22033PRThomo sapiens 220Cys Ala Gly Ala Phe Asn His Ser Asp Leu Asp Ala Glu Leu Arg Arg 1 5 10 15 Cys His His Ile Leu Ile Asp Leu Arg His Arg Pro Thr Ala Gly Ala 20 25 30 Cys 22133PRThomo sapiens 221Cys Ser Val Gly Val Arg Arg Thr Asp Lys Gly Asp Leu Ser Leu Arg 1 5 10 15 Cys Pro Asp Ala Asp Pro Glu Gly Arg Phe Lys Ala Arg Gln Ala Asn 20 25 30 Cys 22233PRThomo sapiens 222Cys Val Arg Pro Ser Glu His Ala Leu Val Asp Asn Asp Gly Leu Tyr 1 5 10 15 Cys Ser Val Gly Val Arg Arg Thr Asp Lys Gly Asp Leu Ser Leu Arg 20 25 30 Cys 22333PRThomo sapiens 223Cys Asp Ala Glu Leu Arg Arg Leu Phe Arg Glu Arg Tyr Arg Leu His 1 5 10 15 Cys His Ser Asp Leu Asp Ala Glu Leu Arg Arg Leu Phe Arg Glu Arg 20 25 30 Cys 22433PRThomo sapiens 224Cys Ser Val Gly Val Arg Arg Thr Asp Lys Gly Asp Leu Ser Leu Arg 1 5 10 15 Cys Asn Asp Gly Leu Tyr Asp Pro Asp Ala Asp Pro Glu Gly Arg Phe 20 25 30 Cys 22533PRThomo sapiens 225Cys Val Asn Ser Val Gly Val Arg Arg Thr Asp Lys Gly Asp Leu Ser 1 5 10 15 Cys Gly Leu Tyr Asp Pro Asp Ala Asp Pro Glu Gly Arg Phe Lys Ala 20 25 30 Cys 22633PRThomo sapiens 226Cys Asp Leu Asp Ala Glu Leu Arg Arg Leu Phe Arg Glu Arg Tyr Arg 1 5 10 15 Cys His Ser Asp Leu Asp Ala Glu Leu Arg Arg Leu Phe Arg Glu Arg 20 25 30 Cys 22733PRThomo sapiens 227Cys Asp Glu Leu Val Arg Thr His His Ile Leu Ile Asp Leu Arg His 1 5 10 15 Cys His His Ile Leu Ile Asp Leu Arg His Arg Pro Thr Ala Gly Ala 20 25 30 Cys 22833PRThomo sapiens 228Cys Ala Gly Ala Phe Asn His Ser Asp Leu Asp Ala Glu Leu Arg Arg 1 5 10 15 Cys Asp Leu Asp Ala Glu Leu Arg Arg Leu Phe Arg Glu Arg Tyr Arg 20 25 30 Cys 22933PRThomo sapiens 229Cys Asp Ala Glu Leu Arg Arg Leu Phe Arg Glu Arg
Tyr Arg Leu His 1 5 10 15 Cys Asp Glu Leu Val Arg Thr His His Ile Leu Ile Asp Leu Arg His 20 25 30 Cys 23033PRThomo sapiens 230Cys Val His Tyr Glu Gln Pro Thr Ile Gln Ile Glu Leu Arg Gln Asn 1 5 10 15 Cys Asp Leu Asp Ala Glu Leu Arg Arg Leu Phe Arg Glu Arg Tyr Arg 20 25 30 Cys 23133PRThomo sapiens 231Cys His His Ile Leu Ile Asp Leu Arg His Arg Pro Thr Ala Gly Ala 1 5 10 15 Cys Val His Tyr Glu Gln Pro Thr Ile Gln Ile Glu Leu Arg Gln Asn 20 25 30 Cys 23233PRThomo sapiens 232Cys Gly Val Arg Arg Thr Asp Lys Gly Asp Leu Ser Leu Arg Ala Asp 1 5 10 15 Cys Gly Val Arg Arg Thr Asp Lys Gly Asp Leu Ser Leu Arg Ala Asp 20 25 30 Cys 23333PRThomo sapiens 233Cys Gly Leu Asp Leu Arg Val Arg Gly Glu Pro Leu Gln Val Glu Arg 1 5 10 15 Cys His His Ile Leu Ile Asp Leu Arg His Arg Pro Thr Ala Gly Ala 20 25 30 Cys 23433PRThomo sapiens 234Cys Asp Leu Asp Ala Glu Leu Arg Arg Leu Phe Arg Glu Arg Tyr Arg 1 5 10 15 Cys Asp Glu Leu Val Arg Thr His His Ile Leu Ile Asp Leu Arg His 20 25 30 Cys
* * * * *
D00001
D00002
D00003
D00004
D00005
D00006
D00007
D00008
D00009
D00010
D00011
D00012
D00013

D00014

D00015

D00016

D00017

D00018

D00019

D00020

D00021

D00022

D00023

D00024

D00025

D00026

D00027

D00028

D00029

D00030

D00031

D00032
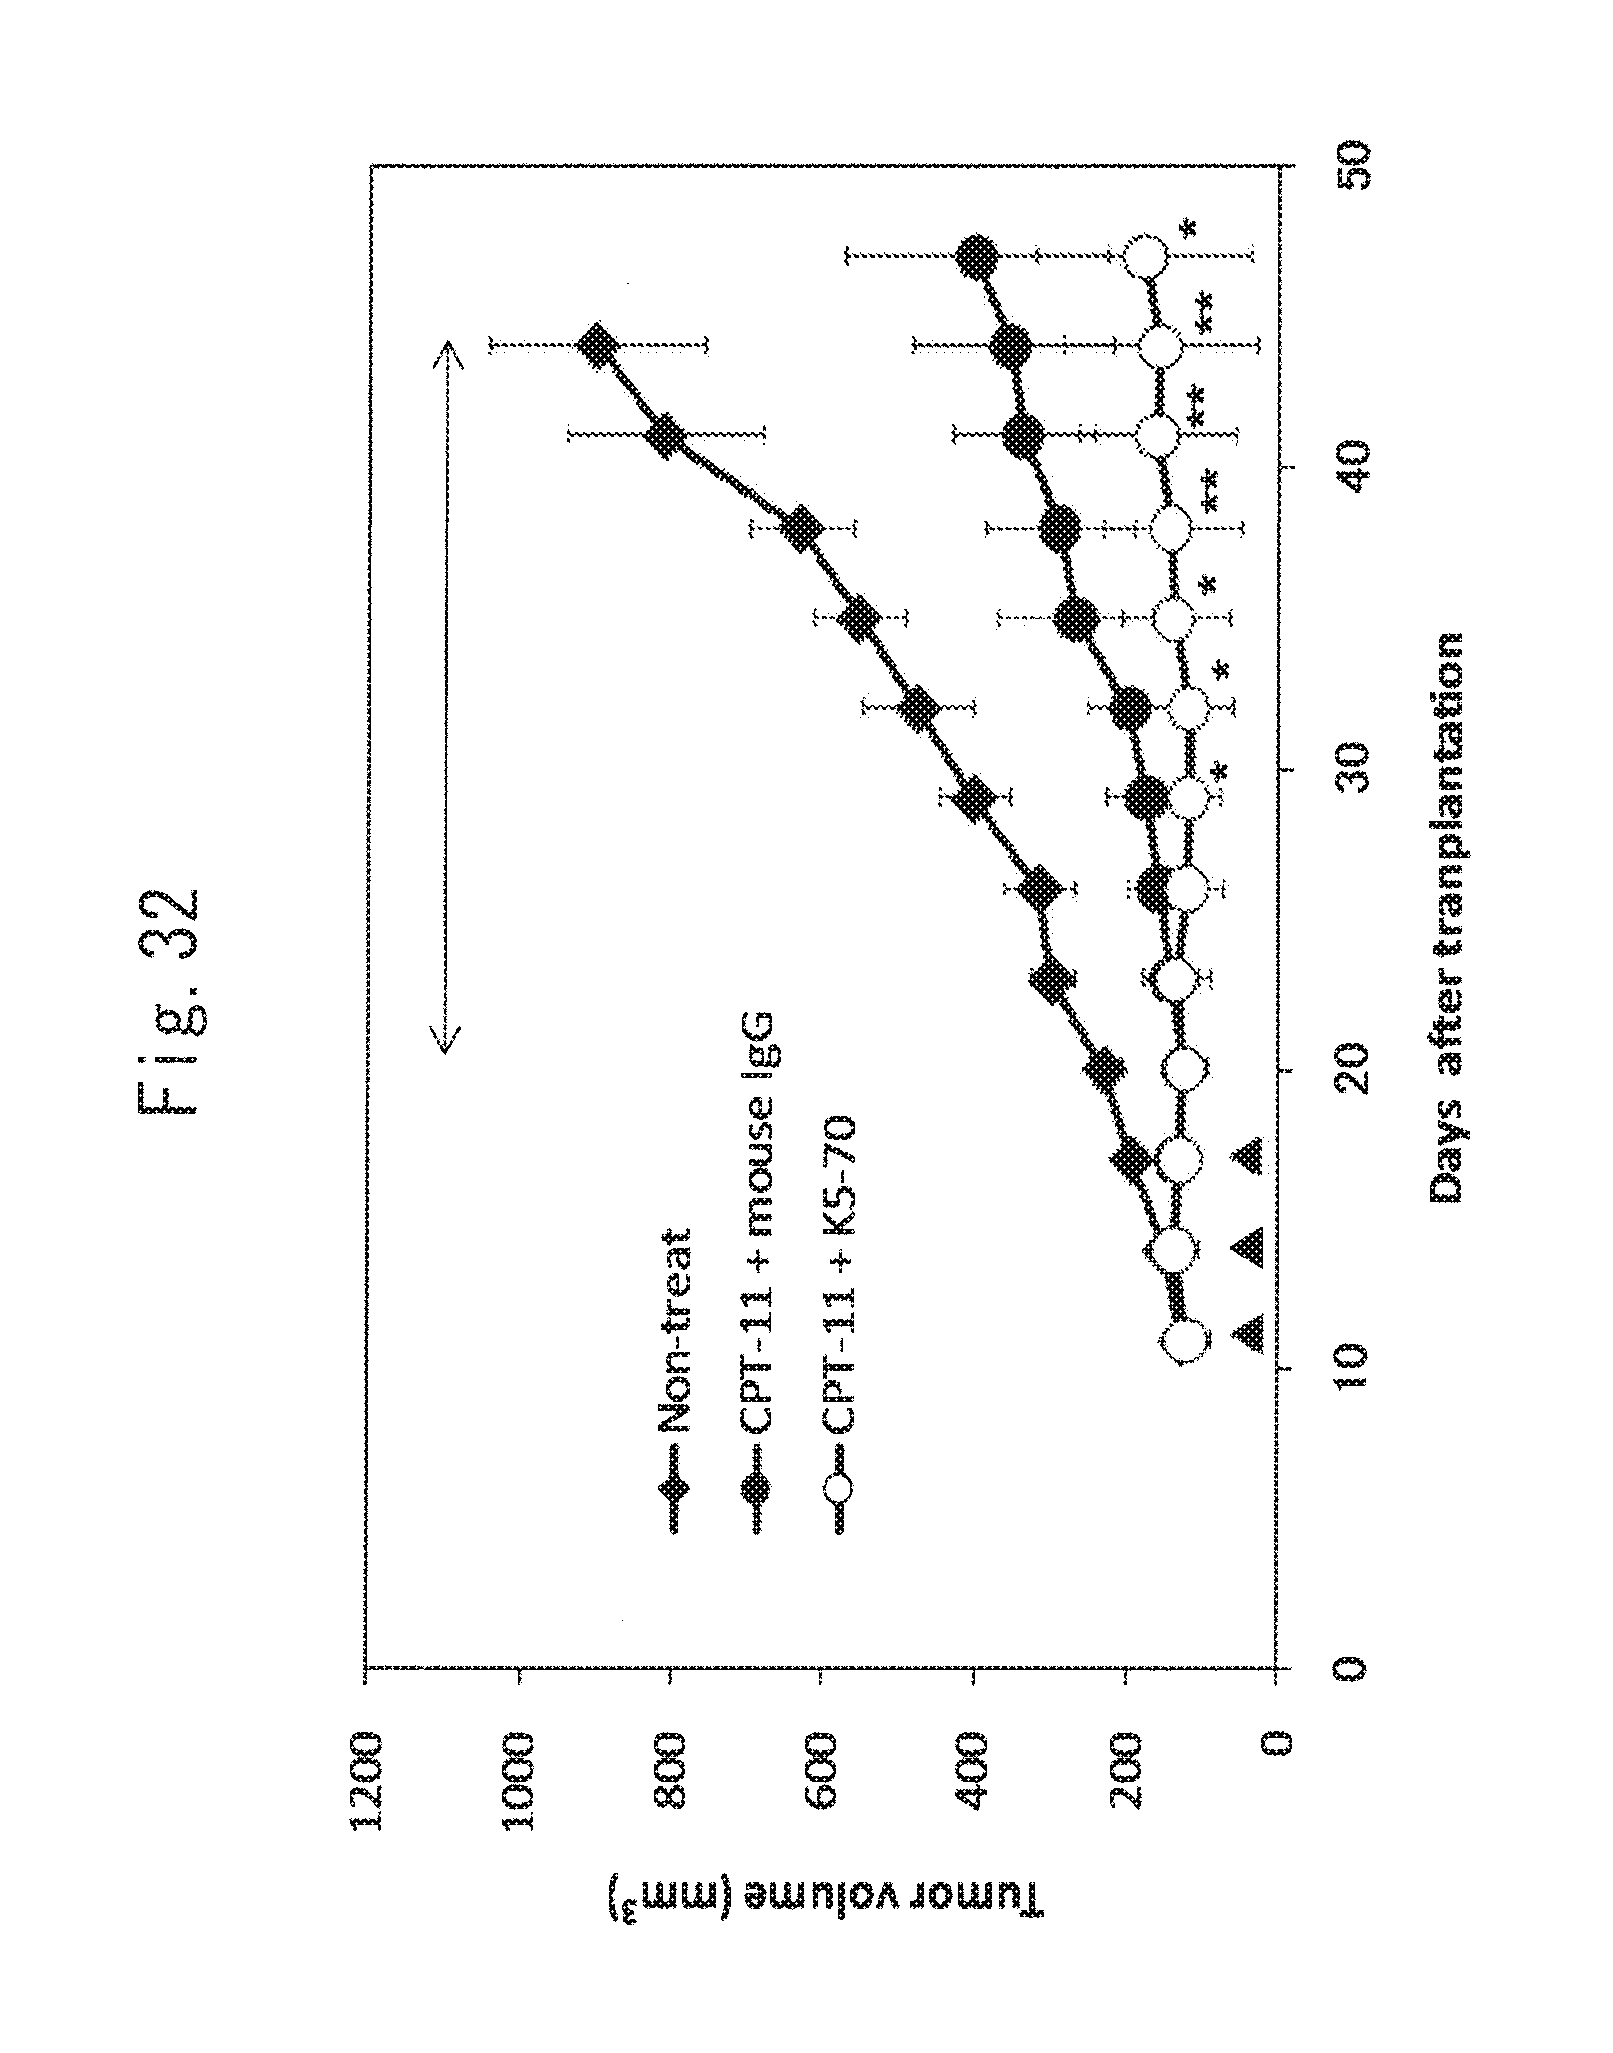
D00033

D00034

D00035

D00036

D00037

D00038

D00039

D00040

D00041

D00042

D00043
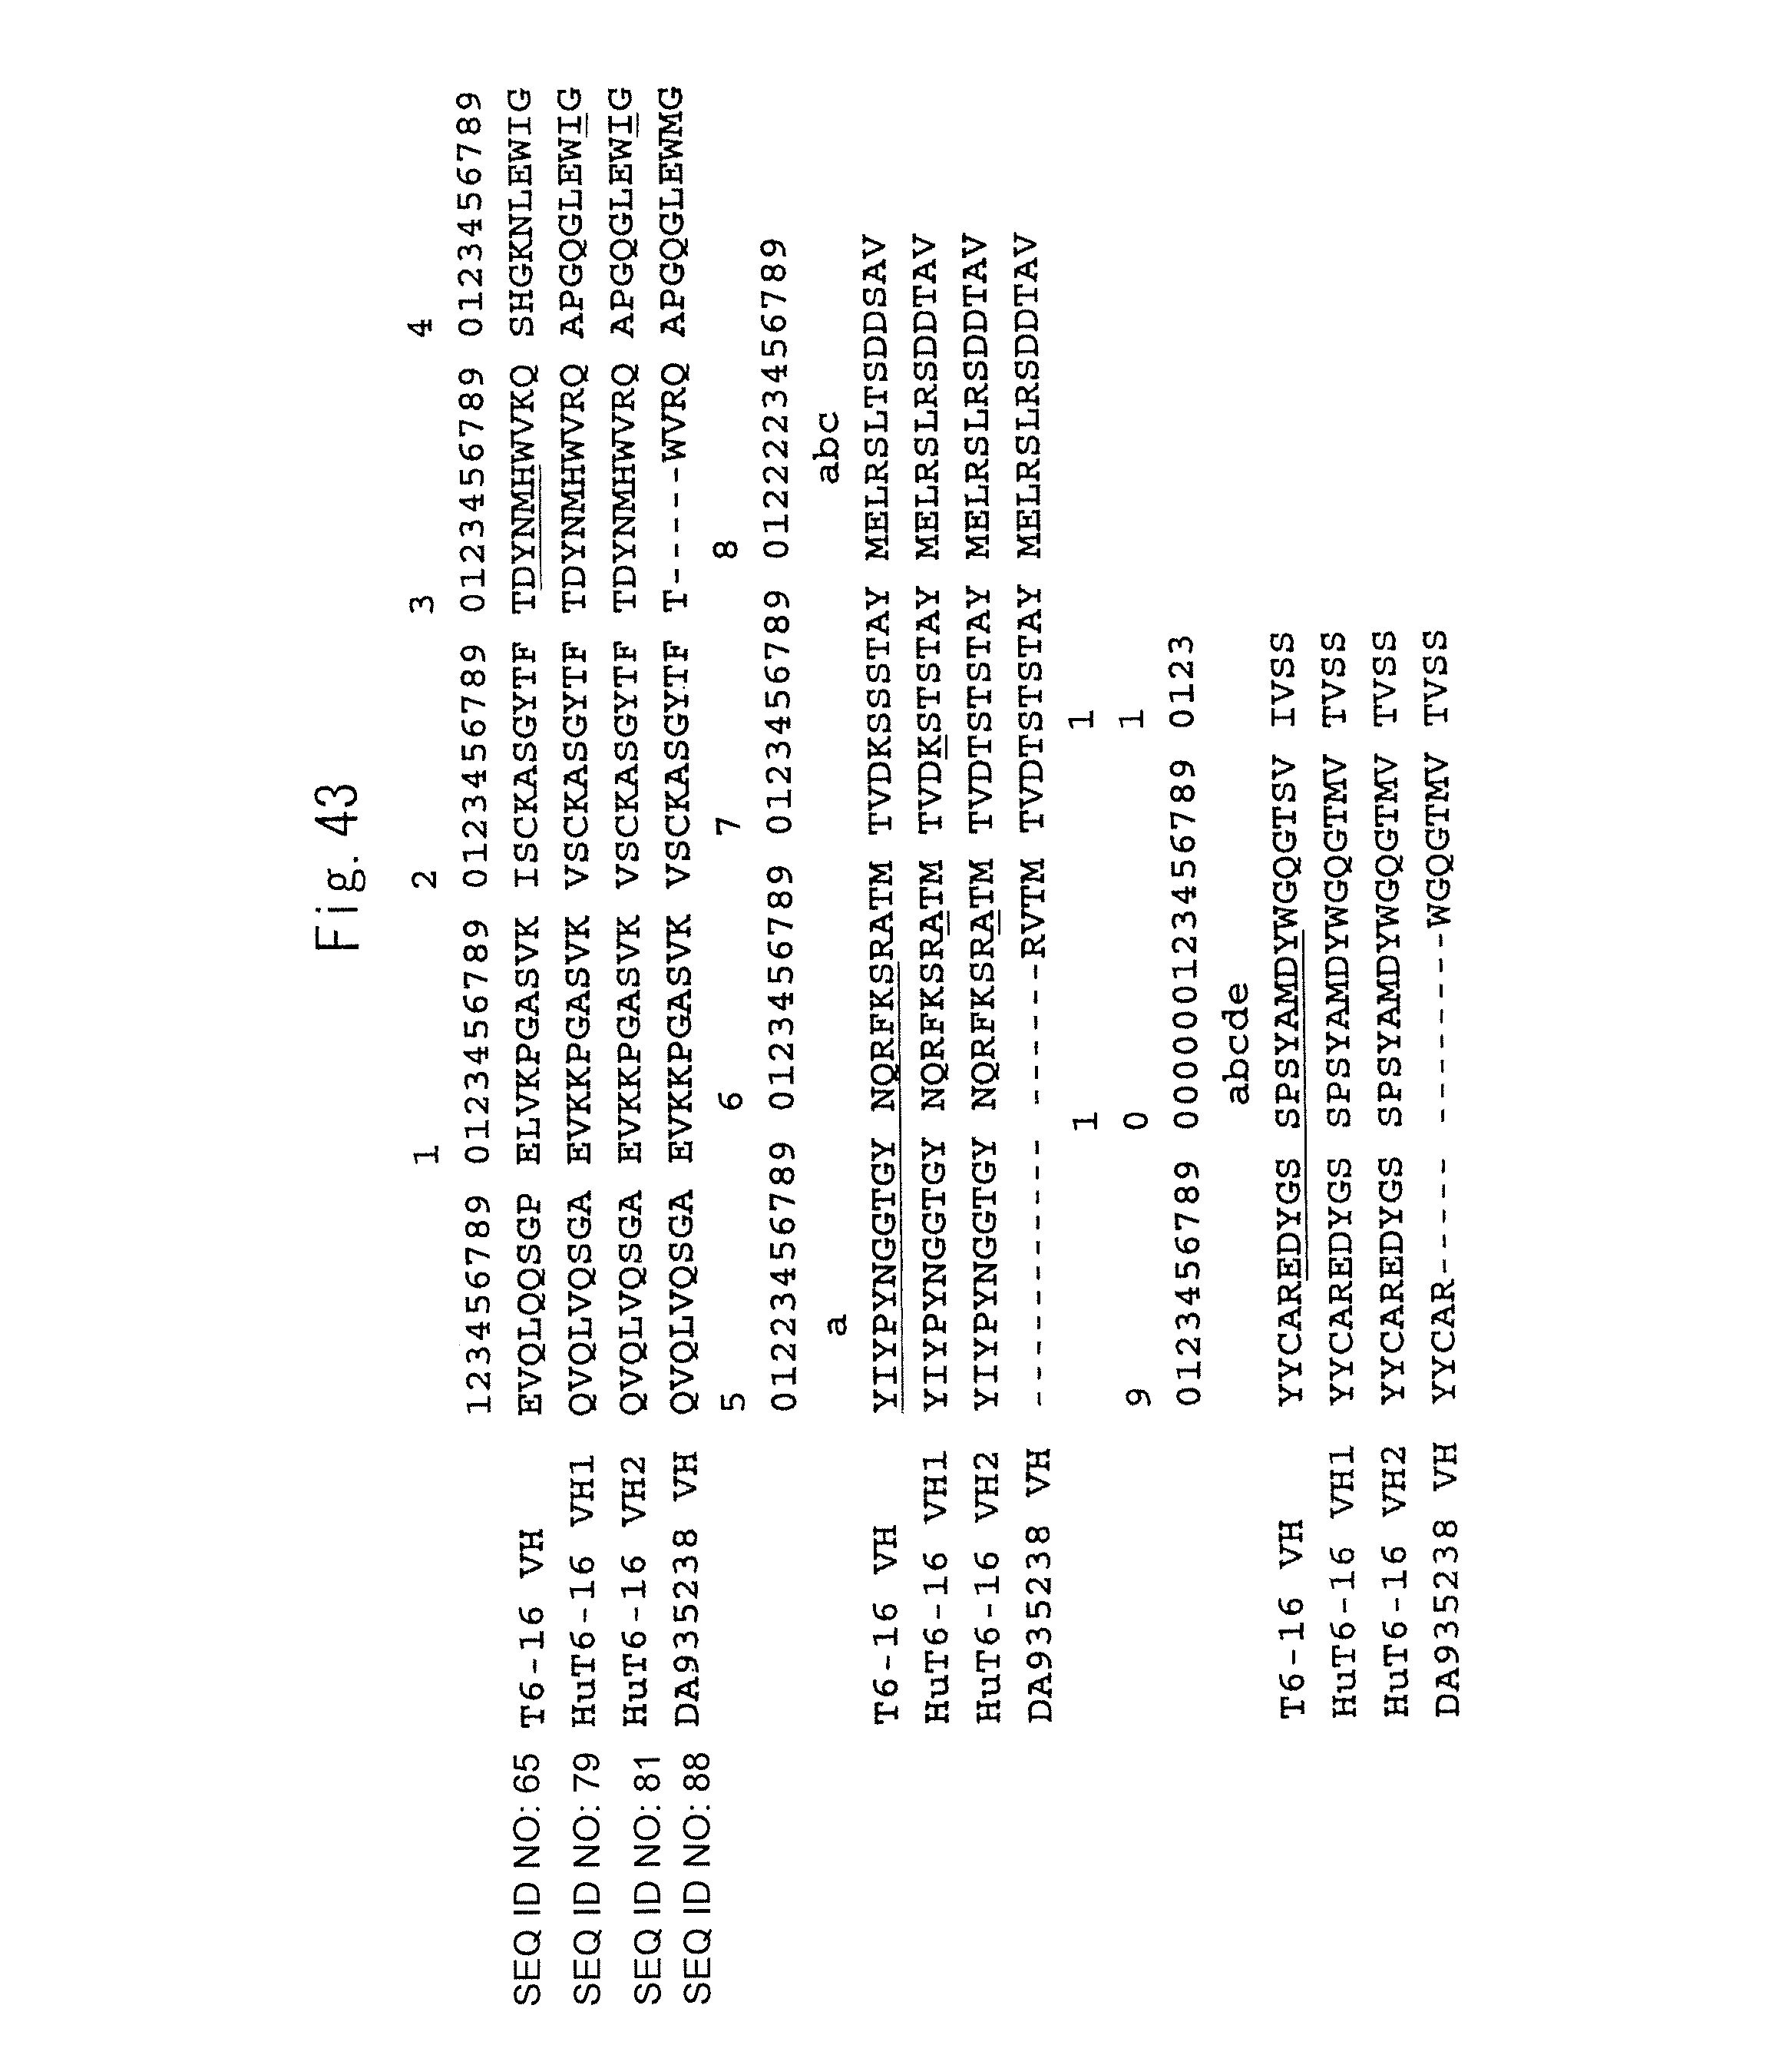
D00044

D00045

D00046
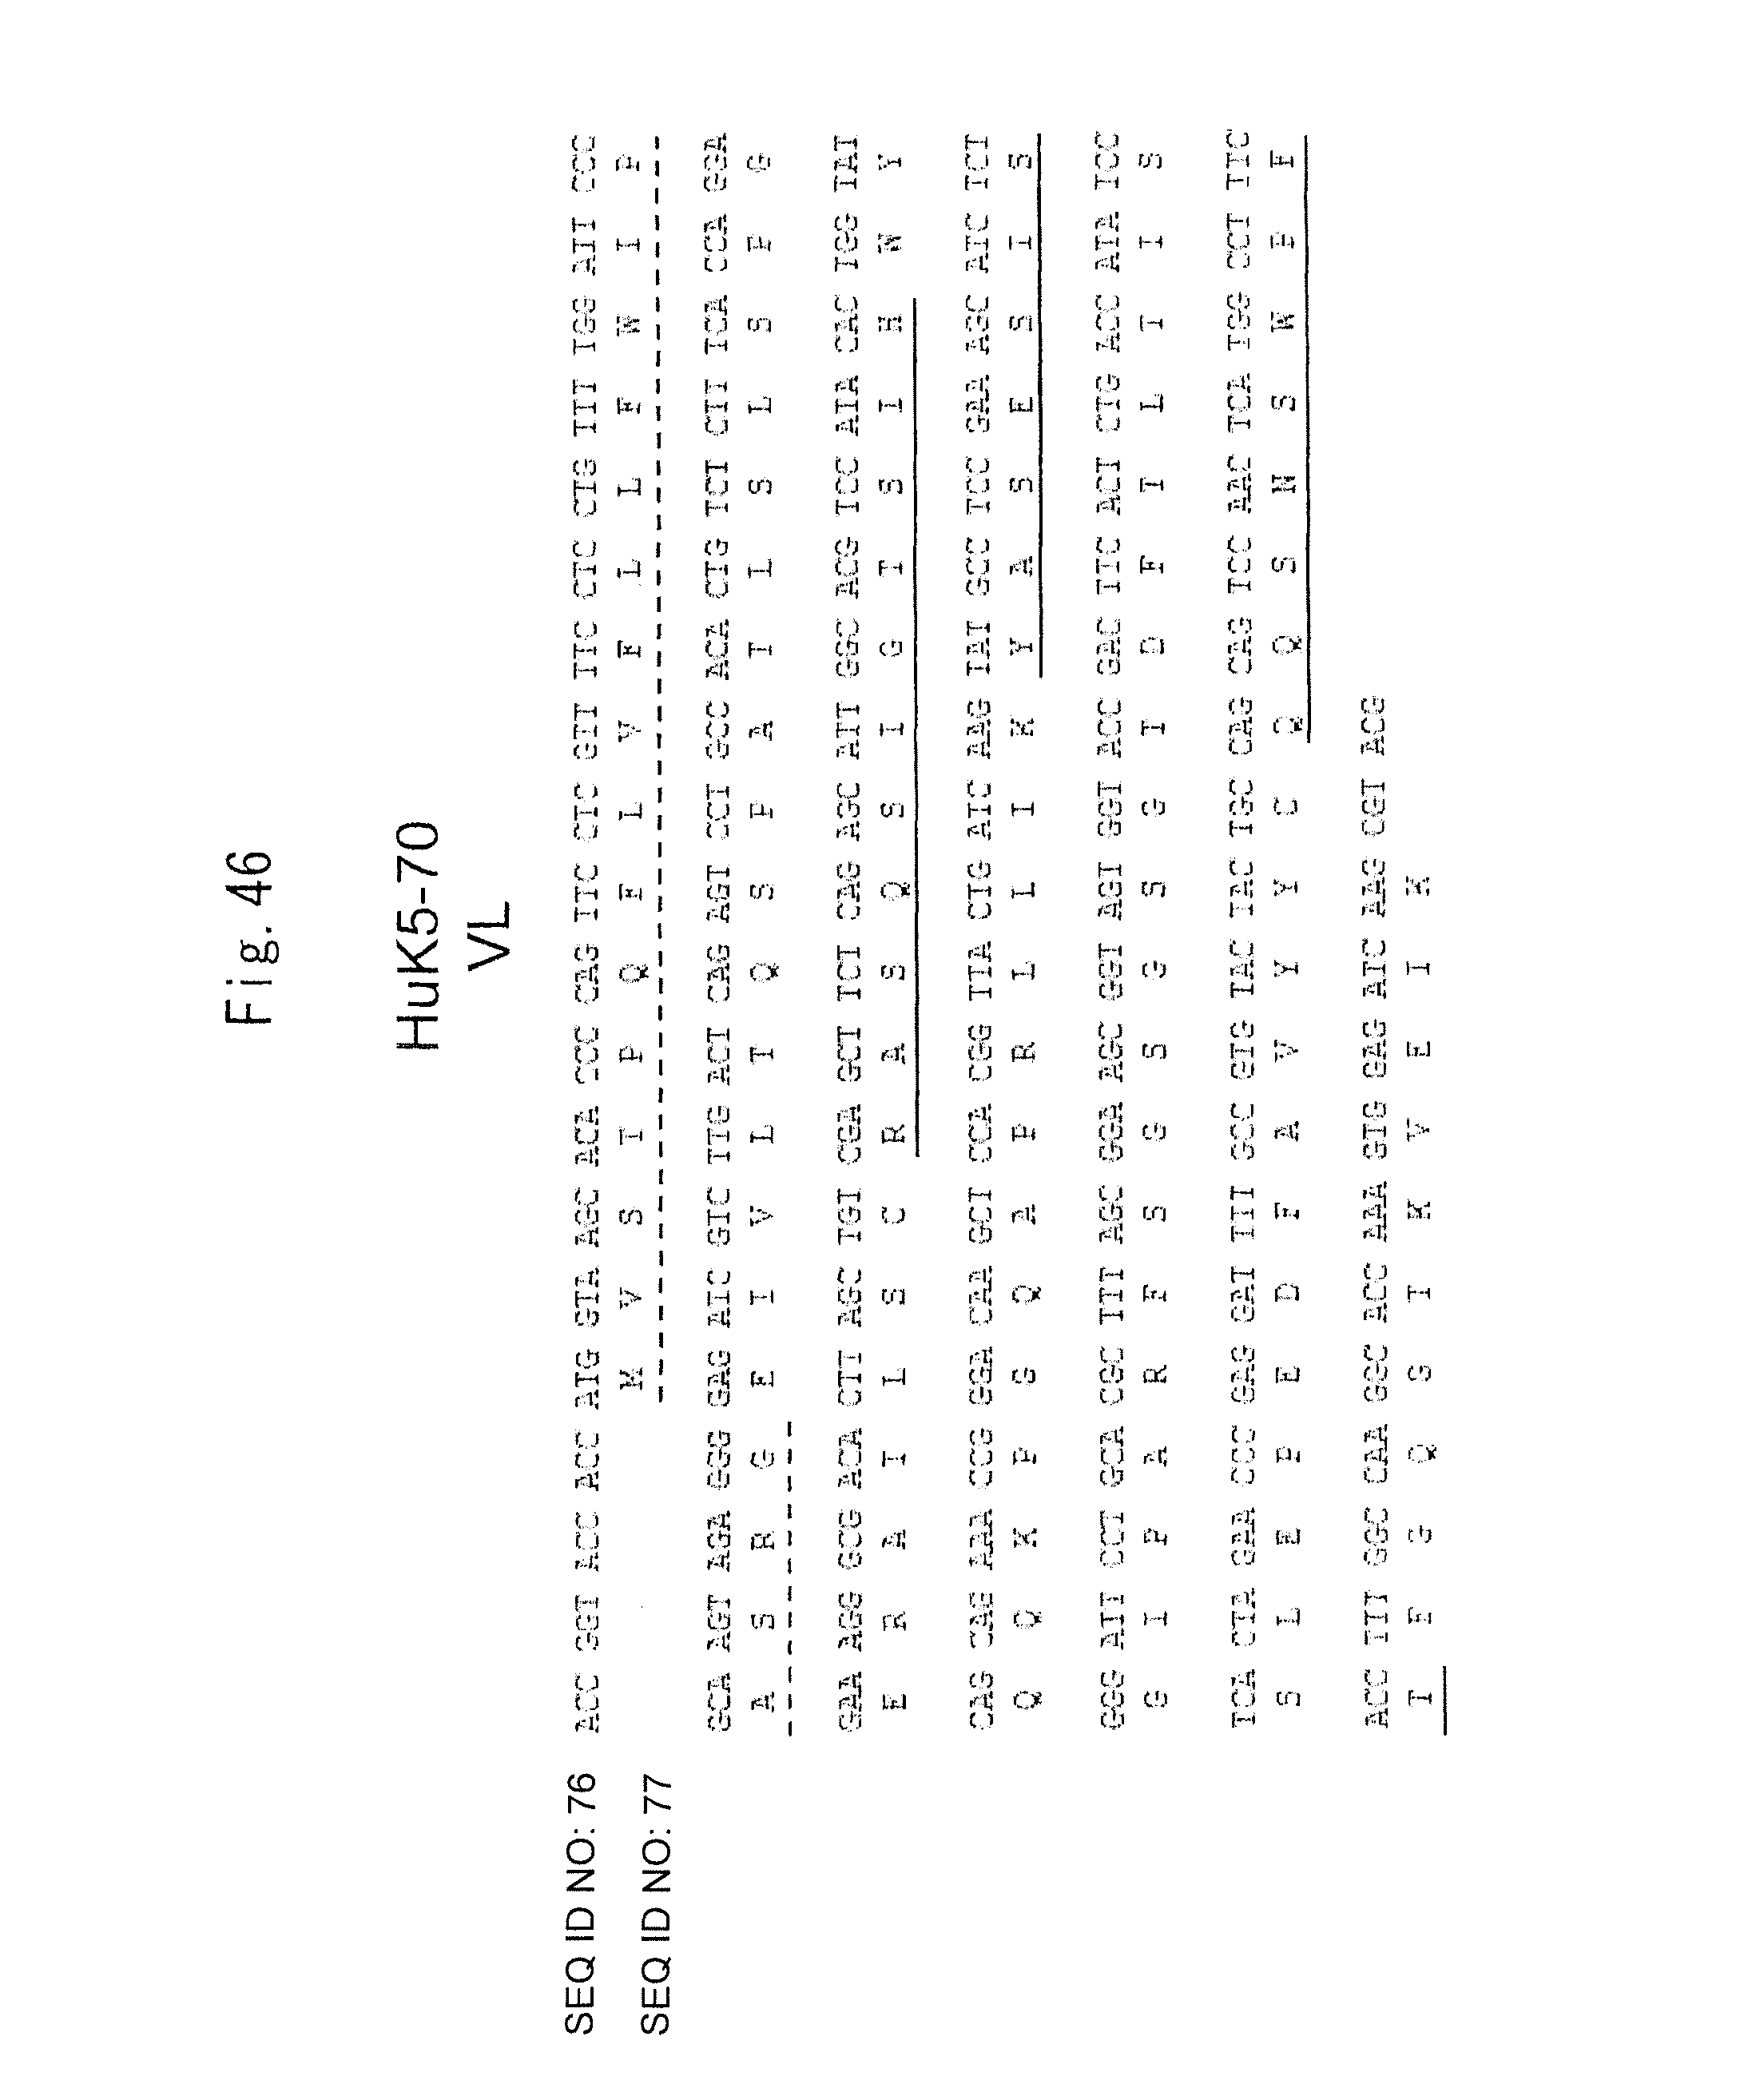
D00047

D00048
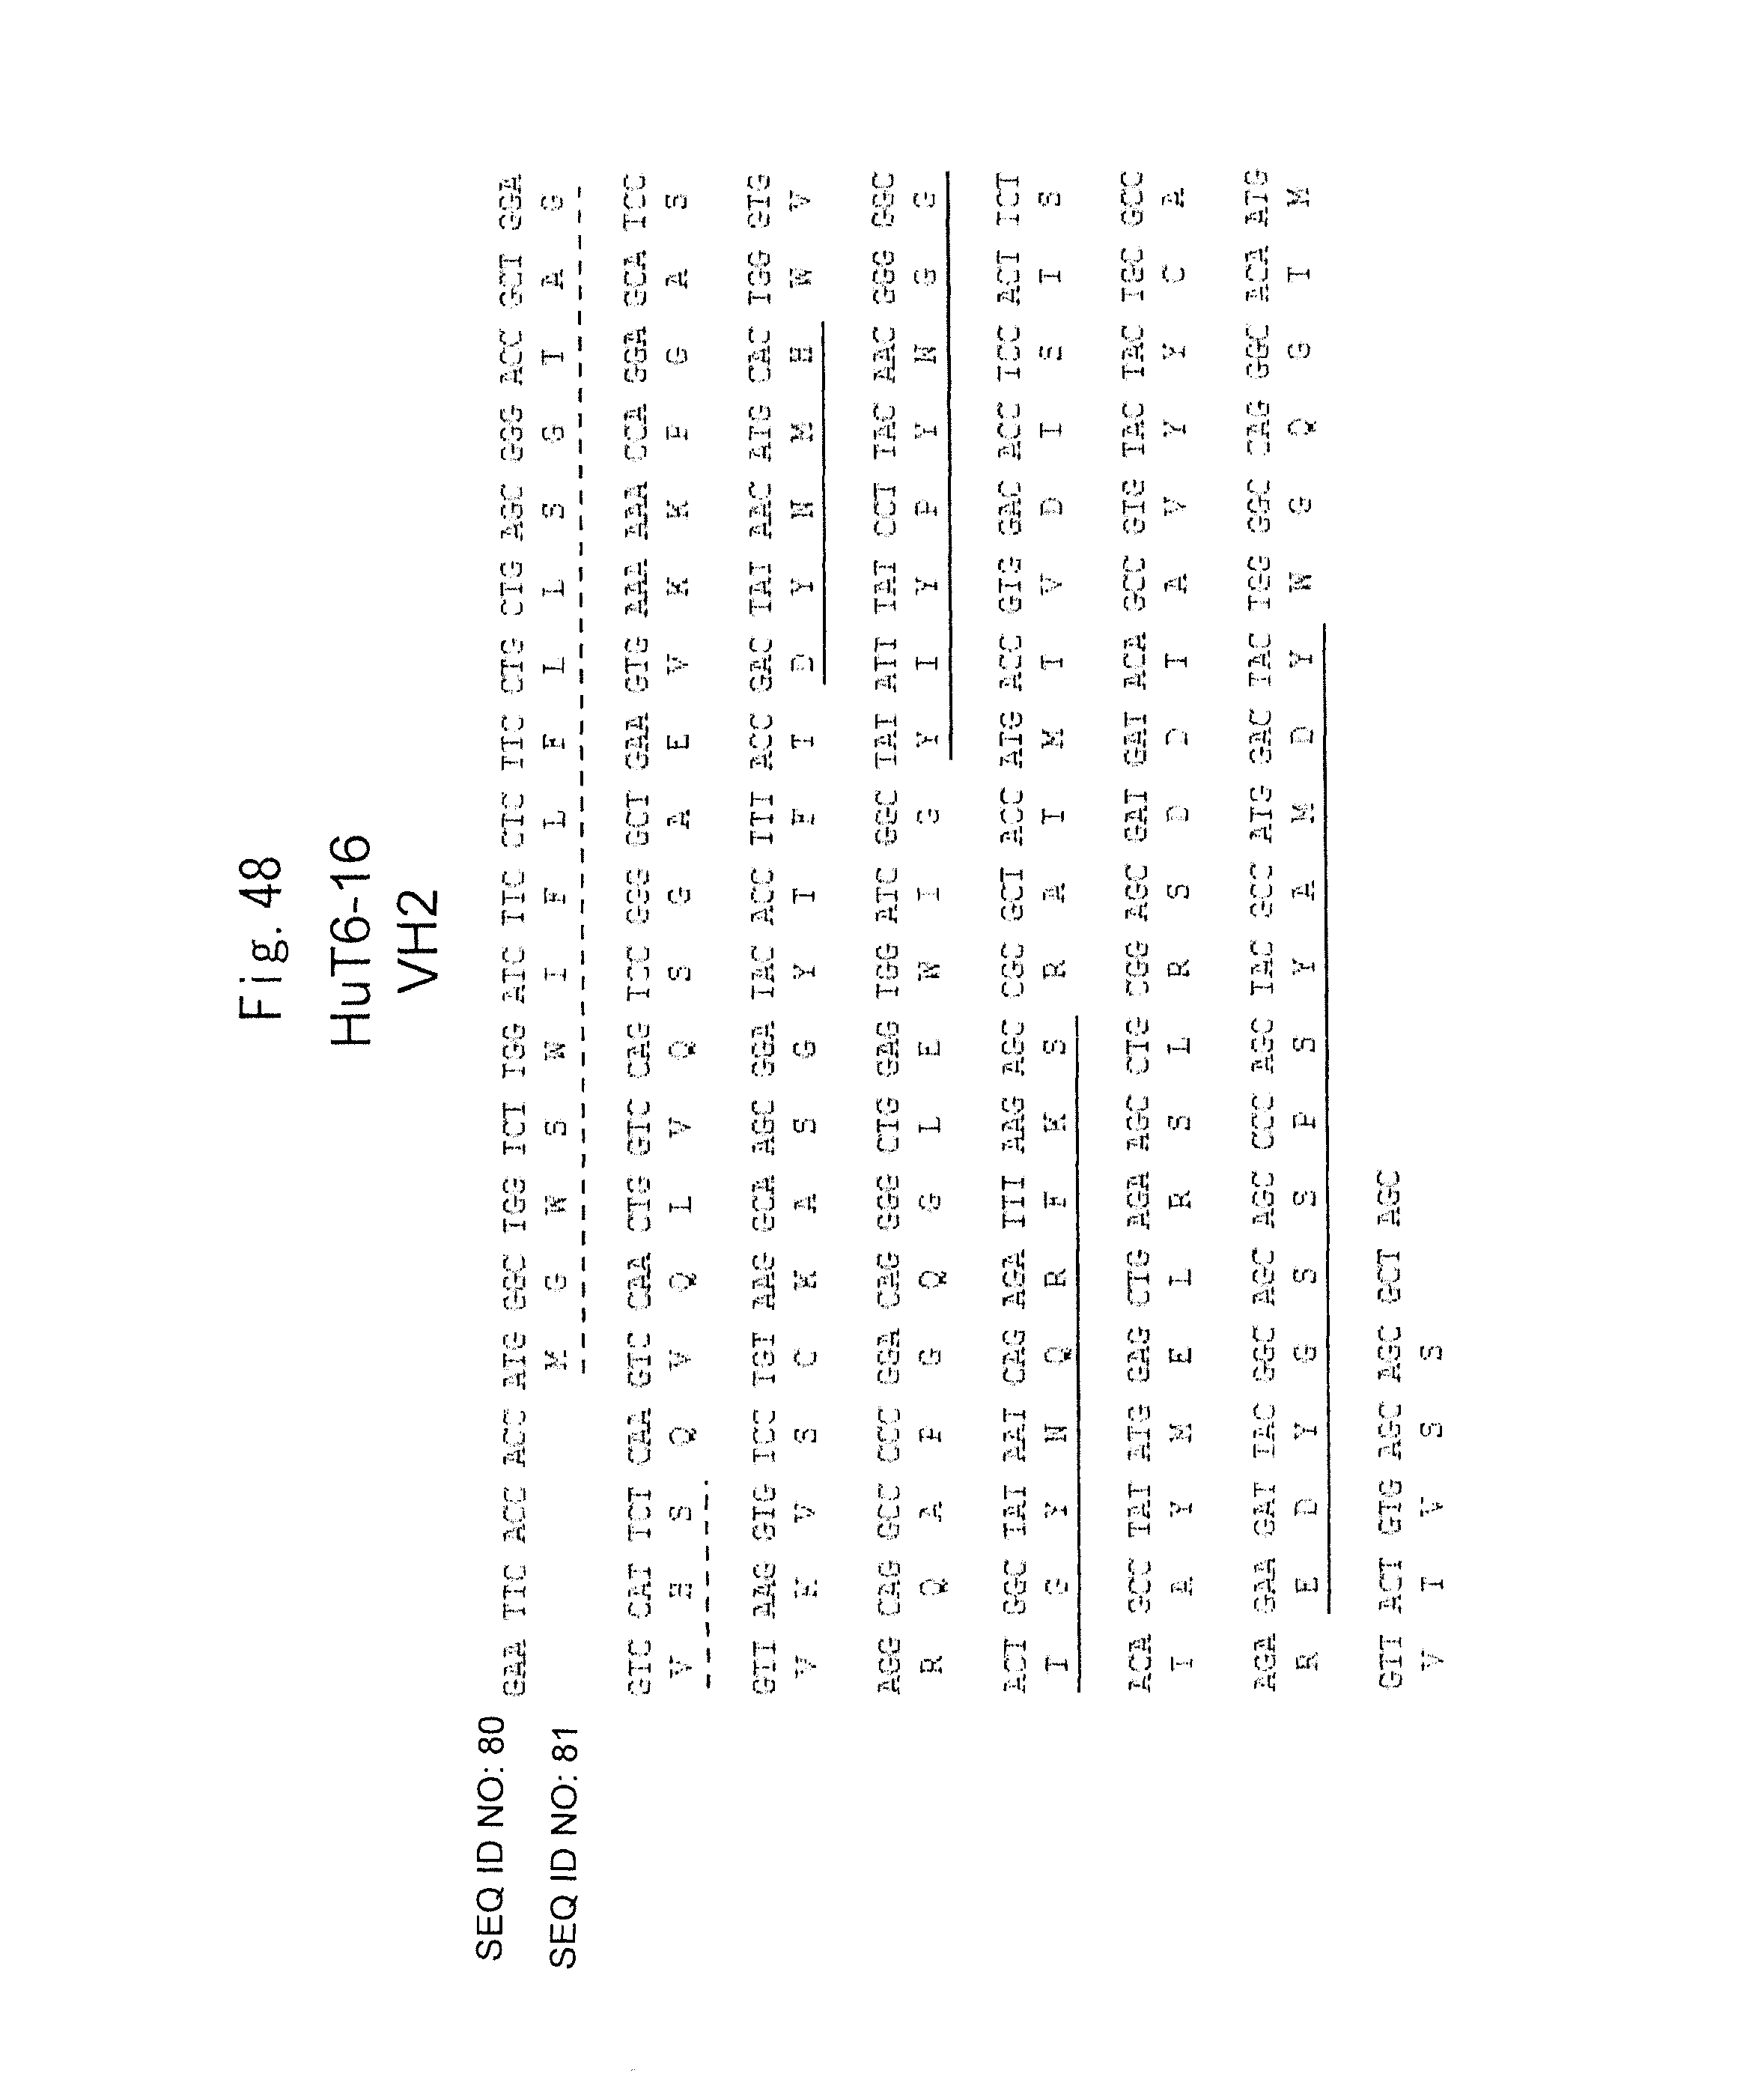
D00049

D00050

D00051

D00052
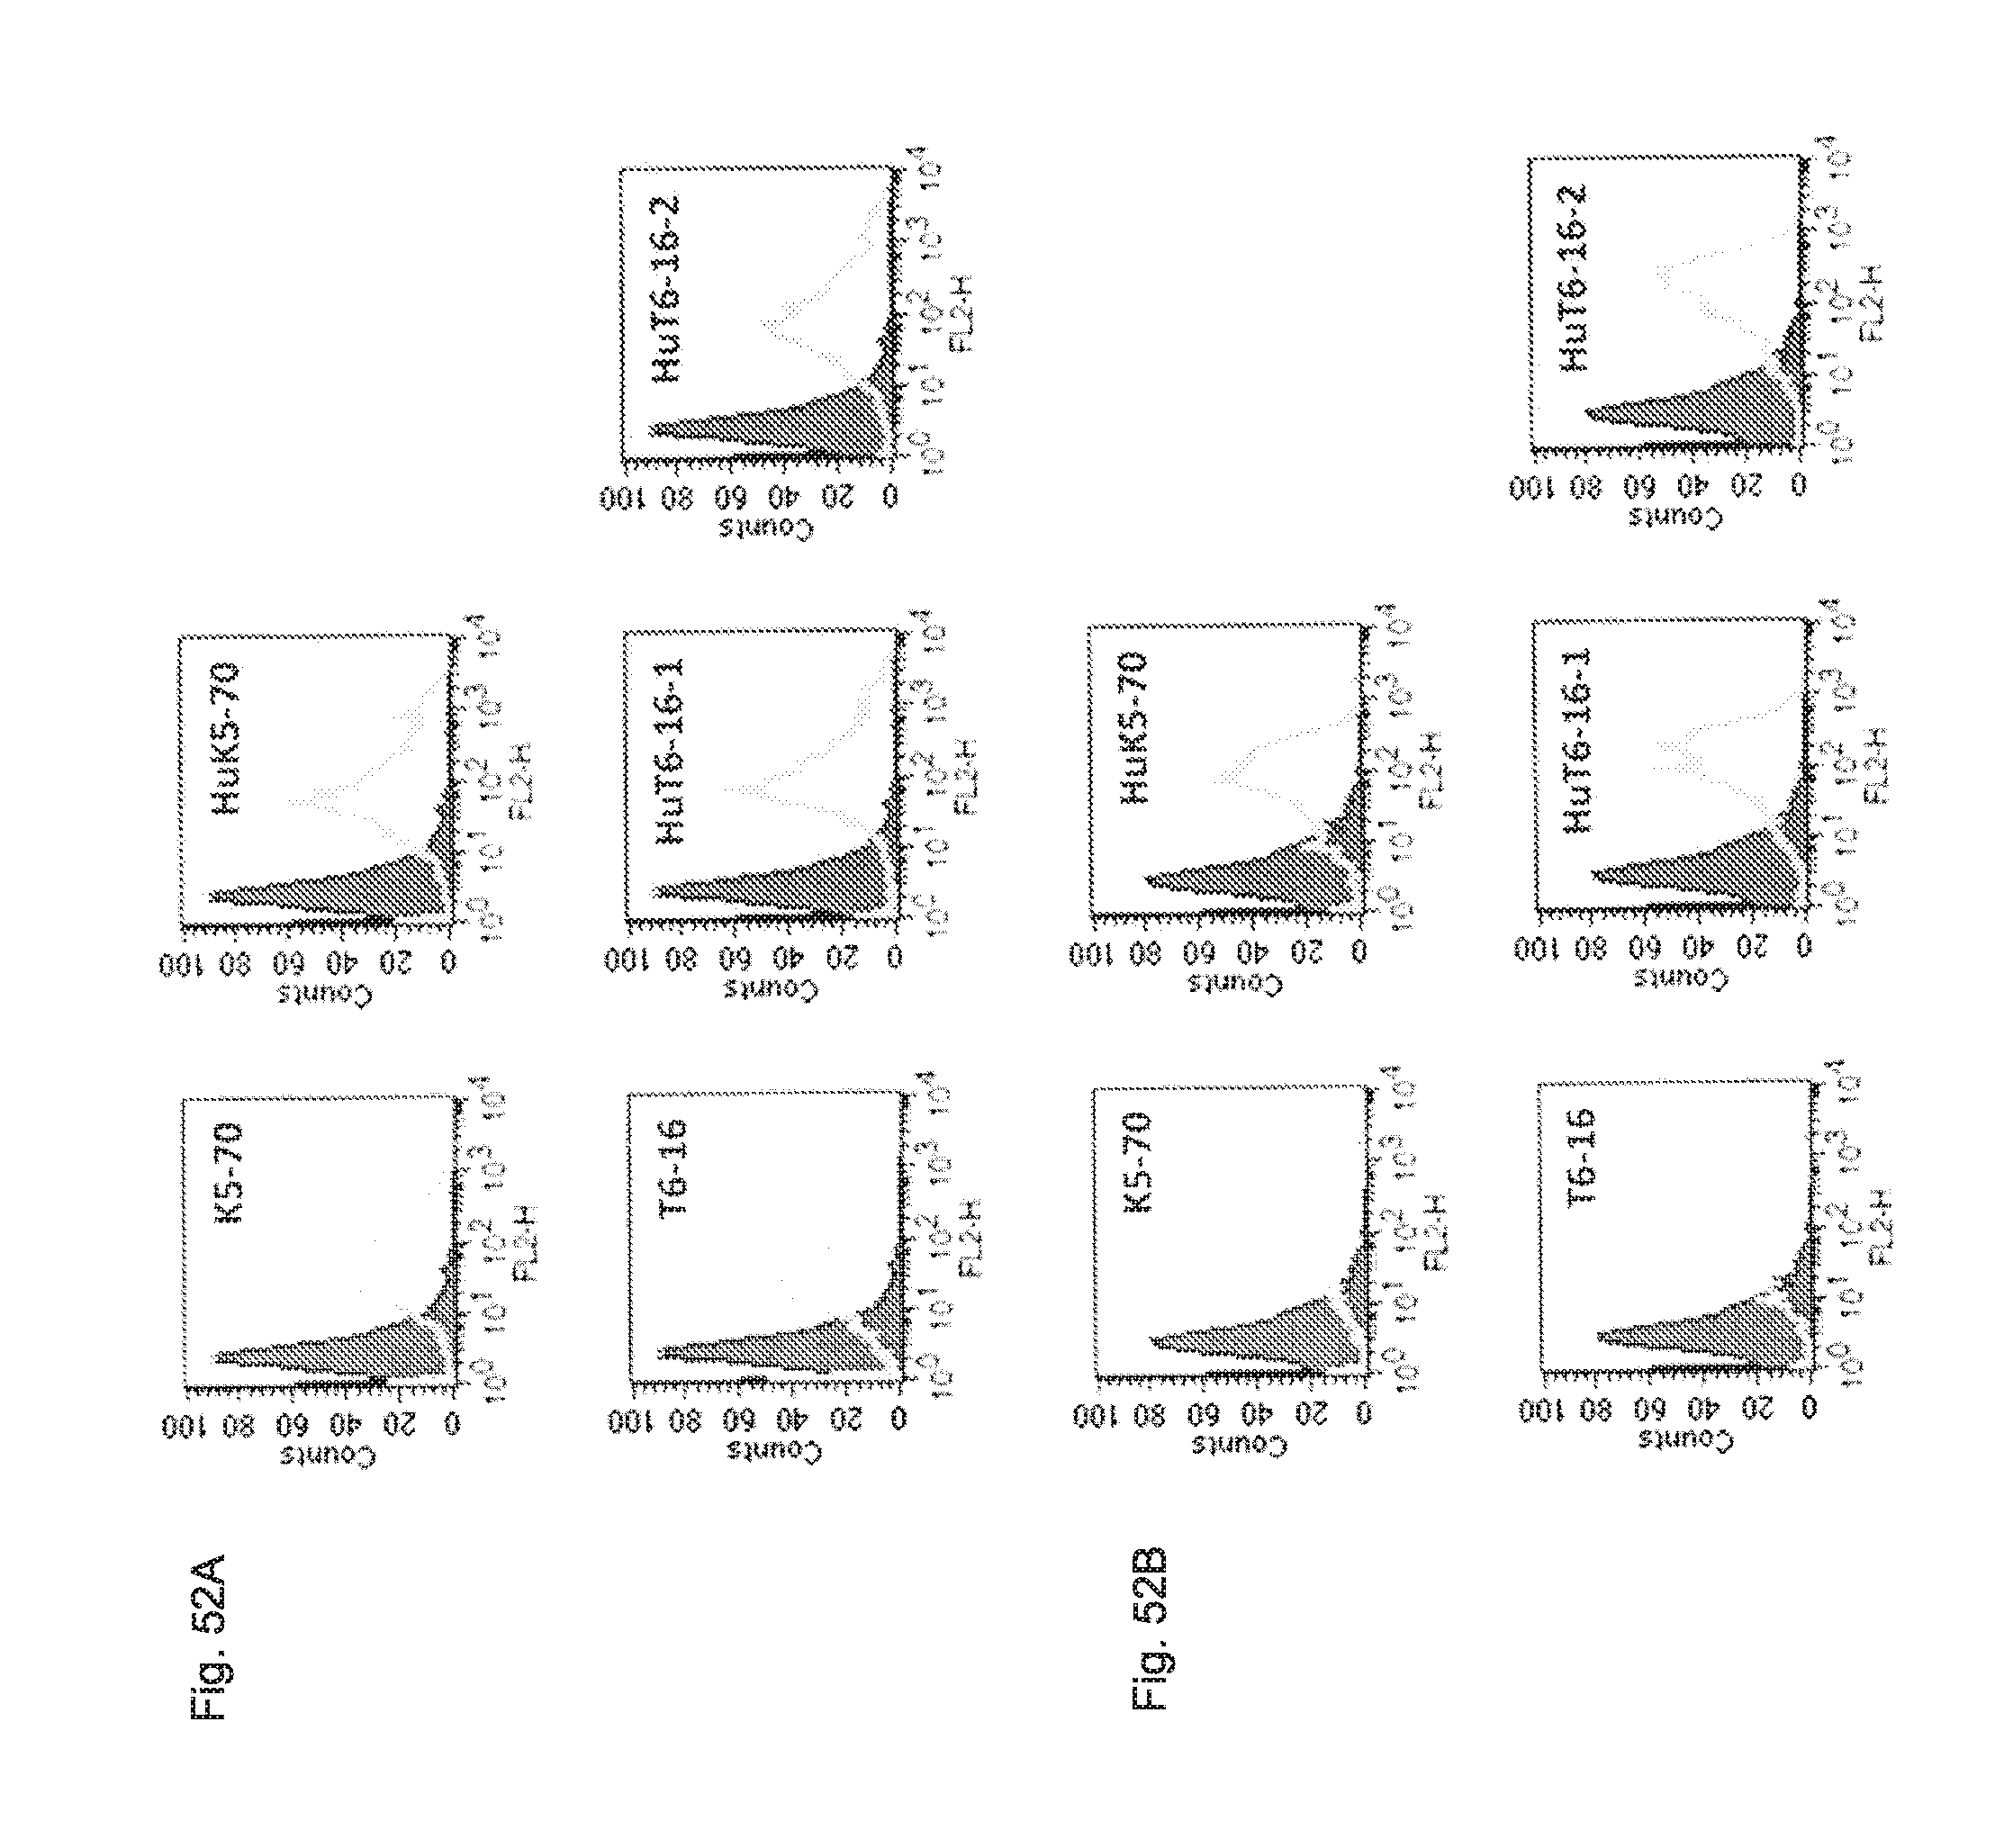
D00053

D00054

D00055

D00056

D00057
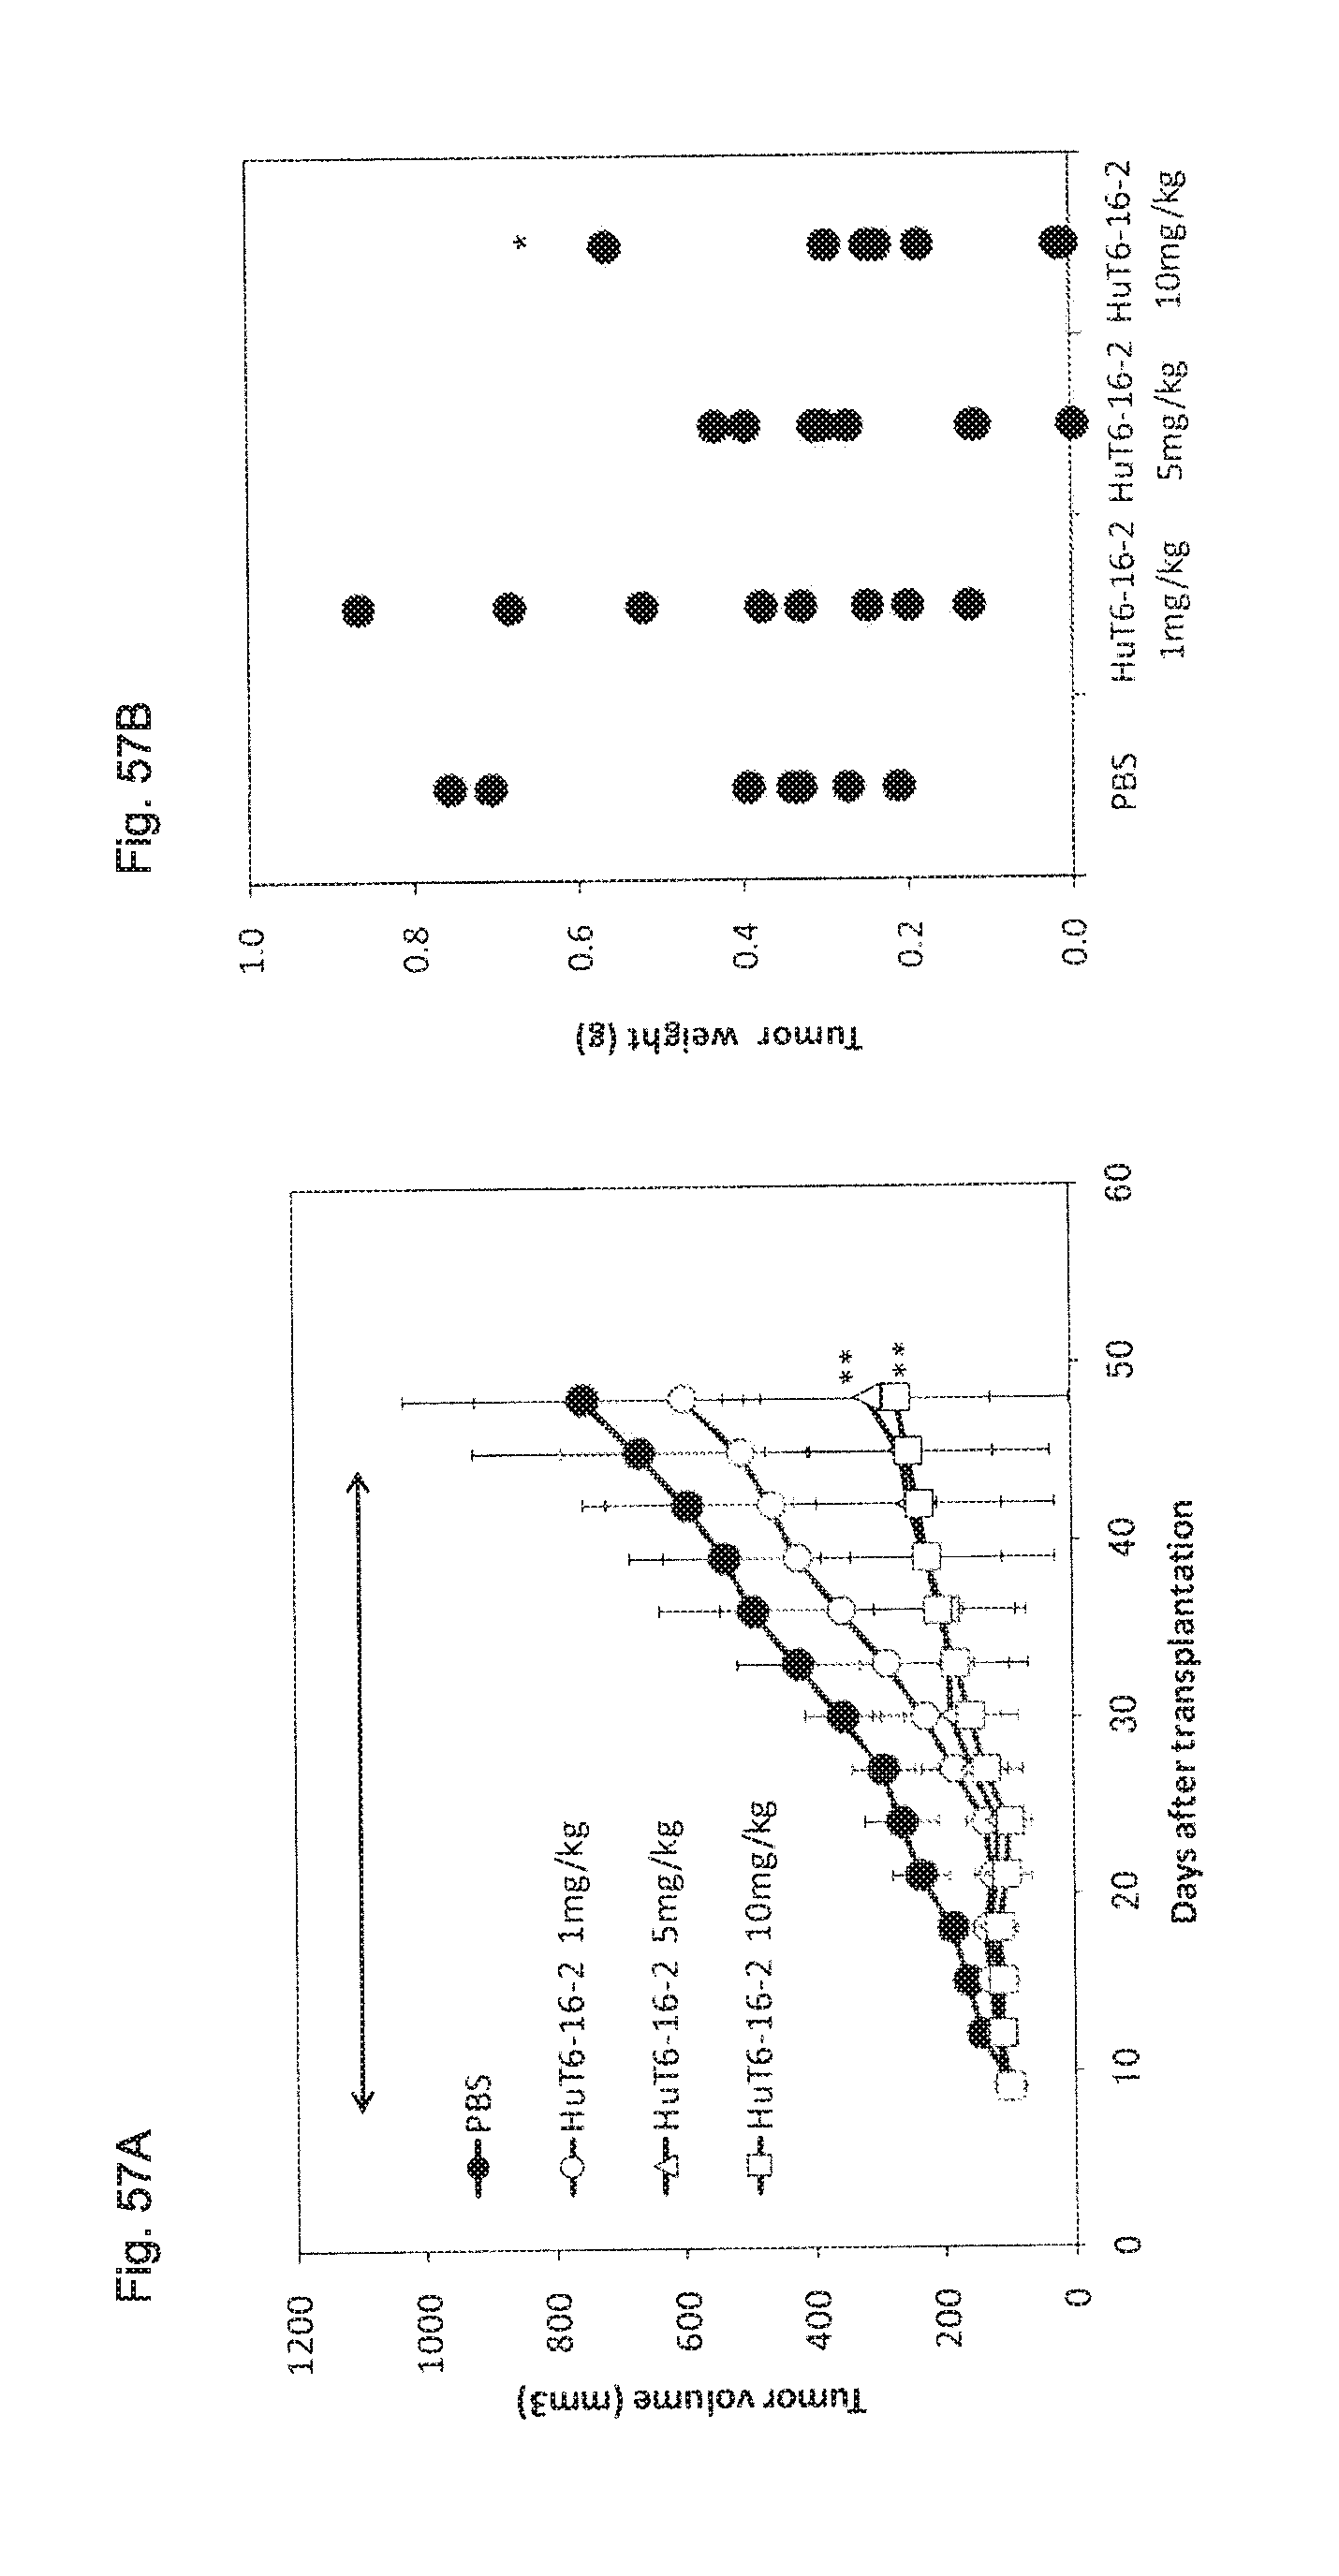
D00058

D00059

D00060

D00061

D00062

D00063

D00064
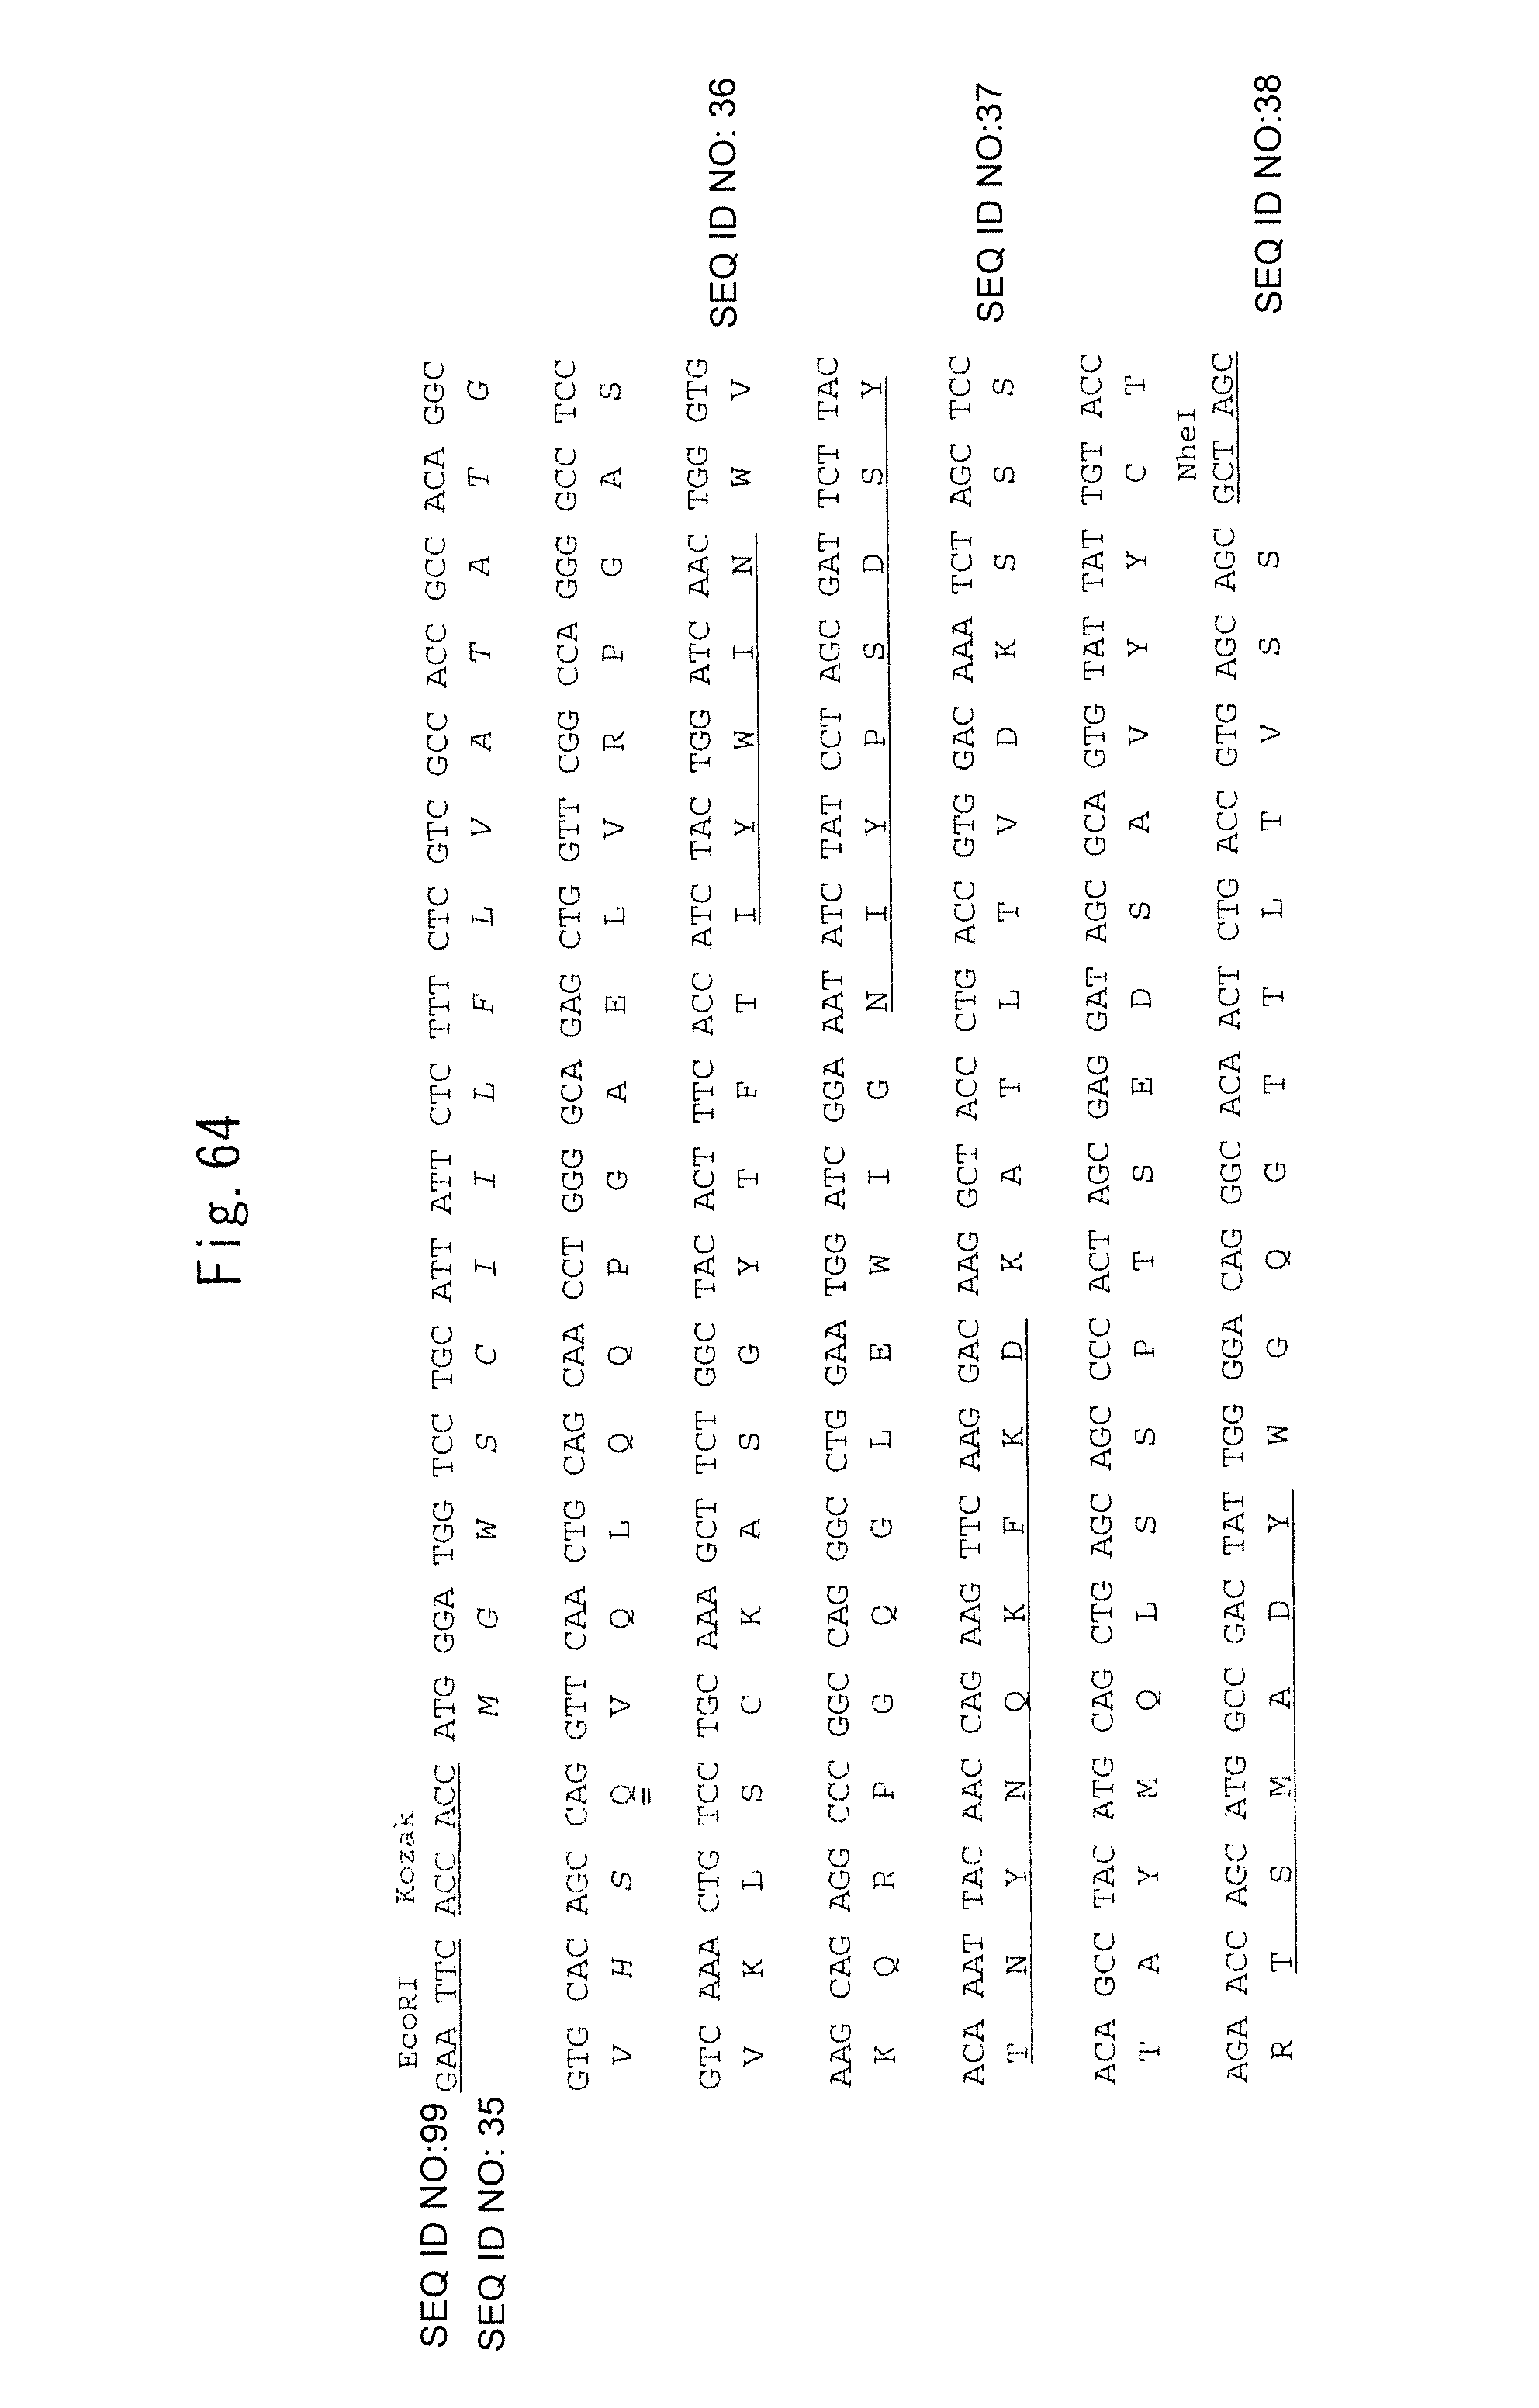
D00065

D00066

D00067

D00068

D00069

D00070

D00071

D00072

D00073

D00074

M00001

S00001
XML
uspto.report is an independent third-party trademark research tool that is not affiliated, endorsed, or sponsored by the United States Patent and Trademark Office (USPTO) or any other governmental organization. The information provided by uspto.report is based on publicly available data at the time of writing and is intended for informational purposes only.
While we strive to provide accurate and up-to-date information, we do not guarantee the accuracy, completeness, reliability, or suitability of the information displayed on this site. The use of this site is at your own risk. Any reliance you place on such information is therefore strictly at your own risk.
All official trademark data, including owner information, should be verified by visiting the official USPTO website at www.uspto.gov. This site is not intended to replace professional legal advice and should not be used as a substitute for consulting with a legal professional who is knowledgeable about trademark law.