System and method of integrating a fractional flow reserve device with a conventional hemodynamic monitoring system
McCaffrey , et al. Fe
U.S. patent number 10,194,812 [Application Number 14/568,466] was granted by the patent office on 2019-02-05 for system and method of integrating a fractional flow reserve device with a conventional hemodynamic monitoring system. This patent grant is currently assigned to Medtronic Vascular, Inc.. The grantee listed for this patent is Medtronic Vascular, Inc.. Invention is credited to Gerry McCaffrey, Christopher Murphy, Barry O'Connell, Fiachra Sweeney.


View All Diagrams
| United States Patent | 10,194,812 |
| McCaffrey , et al. | February 5, 2019 |
System and method of integrating a fractional flow reserve device with a conventional hemodynamic monitoring system
Abstract
A processing system received data from a Fractional Flow Reserve device and communicates data to a conventional hemodynamic monitoring system having pressure displays. The processing system receives proximal pressure measurement signal from an aortic pressure measurement device and a distal pressure measurement signal from a distal pressure measurement device. A processor computes an FFR ratio from the proximal pressure measurement signal and the distal pressure measurement signal, and converts FFR ratio to a pressure format such that the FFR ratio reads on the conventional hemodynamic monitoring system as a pressure in units of pressure. The processing system transmits the proximal pressure measurement signal, the distal pressure measurement signal, and the FFR ratio in pressure format to the conventional hemodynamic monitoring system.
| Inventors: | McCaffrey; Gerry (Ballybrit, IE), Sweeney; Fiachra (Ballybrit, IE), O'Connell; Barry (Ballybrit, IE), Murphy; Christopher (Ballybrit, IE) | ||||||||||
|---|---|---|---|---|---|---|---|---|---|---|---|
| Applicant: |
|
||||||||||
| Assignee: | Medtronic Vascular, Inc. (Santa
Rosa, CA) |
||||||||||
| Family ID: | 55025347 | ||||||||||
| Appl. No.: | 14/568,466 | ||||||||||
| Filed: | December 12, 2014 |
Prior Publication Data
| Document Identifier | Publication Date | |
|---|---|---|
| US 20160166158 A1 | Jun 16, 2016 | |
| Current U.S. Class: | 1/1 |
| Current CPC Class: | A61B 5/02007 (20130101); A61B 5/026 (20130101); A61B 5/02028 (20130101); A61B 5/742 (20130101); A61B 5/0004 (20130101); A61B 5/0215 (20130101); A61B 5/7278 (20130101); A61M 2025/0002 (20130101) |
| Current International Class: | A61B 5/0215 (20060101); A61B 5/00 (20060101); A61B 5/02 (20060101); A61B 5/026 (20060101); A61M 25/00 (20060101) |
References Cited [Referenced By]
U.S. Patent Documents
| 4718425 | January 1988 | Tanaka et al. |
| 4771782 | September 1988 | Millar |
| 4796641 | January 1989 | Mills |
| 4815472 | March 1989 | Wise |
| 4850358 | July 1989 | Millar |
| 4901731 | February 1990 | Millar |
| 4924877 | May 1990 | Brooks |
| 4928693 | May 1990 | Goodin |
| 4936310 | June 1990 | Engstrom et al. |
| 4941473 | July 1990 | Tenerz et al. |
| 4966148 | October 1990 | Millar |
| 4966156 | October 1990 | Perry et al. |
| 5029585 | July 1991 | Lieber et al. |
| 5046497 | September 1991 | Millar |
| 5050297 | September 1991 | Metzger |
| 5085223 | February 1992 | Lars et al. |
| 5125058 | June 1992 | Tenerz et al. |
| 5195375 | March 1993 | Tenerz et al. |
| 5267958 | December 1993 | Buchbinder et al. |
| 5280786 | January 1994 | Wlodarczyk et al. |
| 5427114 | June 1995 | Colliver et al. |
| 5451233 | September 1995 | Yock |
| 5466222 | November 1995 | Ressemann et al. |
| 5526820 | June 1996 | Khoury |
| 5542434 | August 1996 | Imran et al. |
| 5564425 | October 1996 | Tonokura |
| 5569219 | October 1996 | Hakki et al. |
| 5573007 | November 1996 | Bobo, Sr. |
| 5591129 | January 1997 | Shoup et al. |
| 5637091 | June 1997 | Hakky et al. |
| RE35648 | November 1997 | Tenerz et al. |
| 5694946 | December 1997 | Tenerz et al. |
| 5701905 | December 1997 | Esch |
| 5715827 | February 1998 | Corl et al. |
| 5813997 | September 1998 | Imran et al. |
| 5827243 | October 1998 | Palestrant |
| 5873835 | February 1999 | Hastings |
| 5902248 | May 1999 | Millar et al. |
| 5964714 | October 1999 | Lafontaine |
| 6033366 | March 2000 | Brockway |
| 6056719 | May 2000 | Mickley |
| 6089103 | July 2000 | Smith |
| 6106476 | August 2000 | Corl et al. |
| 6106486 | August 2000 | Tenerz et al. |
| 6112598 | September 2000 | Tenerz et al. |
| 6142958 | November 2000 | Hammarstrom et al. |
| 6167763 | January 2001 | Tenerz et al. |
| 6179856 | January 2001 | Barbere |
| 6182513 | February 2001 | Stemme et al. |
| 6193669 | February 2001 | Degany |
| 6224585 | May 2001 | Pfeiffer |
| 6248083 | June 2001 | Smith et al. |
| 6296615 | October 2001 | Brockway et al. |
| 6312380 | October 2001 | Brockway et al. |
| 6336906 | January 2002 | Hammarstrom et al. |
| 6354999 | March 2002 | Dgany |
| 6379308 | April 2002 | Brockway |
| 6394986 | May 2002 | Millar |
| 6409677 | June 2002 | Tulkki |
| 6471656 | October 2002 | Shalman et al. |
| 6517481 | February 2003 | Hoek et al. |
| 6546804 | April 2003 | Stemme et al. |
| 6551250 | April 2003 | Khalil |
| 6565514 | May 2003 | Svanerudh et al. |
| 6585660 | July 2003 | Dorando et al. |
| 6615067 | September 2003 | Hoek et al. |
| 6615667 | September 2003 | Smith |
| 6659957 | December 2003 | Vardi et al. |
| 6659959 | December 2003 | Brockway et al. |
| 6663570 | December 2003 | Mott et al. |
| 6716178 | April 2004 | Kilpatrick et al. |
| 6733459 | May 2004 | Atsumi |
| 6754608 | June 2004 | Svanrudh et al. |
| 6767327 | July 2004 | Corl et al. |
| 6821287 | November 2004 | Jang |
| 6860851 | March 2005 | Knudson et al. |
| 6868736 | March 2005 | Sawatari et al. |
| 6926674 | August 2005 | Tenerz et al. |
| 6938474 | September 2005 | Melvas |
| 6966890 | November 2005 | Coyle et al. |
| 6974422 | December 2005 | Millar |
| 6976965 | December 2005 | Corl et al. |
| 6993974 | February 2006 | Tenerz et al. |
| 6994695 | February 2006 | Millar |
| 7017416 | March 2006 | Liu et al. |
| 7021152 | April 2006 | Tenerz |
| 7025727 | April 2006 | Brockway |
| 7060038 | June 2006 | Letort et al. |
| 7097620 | August 2006 | Corl et al. |
| 7112170 | September 2006 | Schock |
| 7134994 | November 2006 | Alpert et al. |
| 7137953 | November 2006 | Eigler et al. |
| 7211048 | May 2007 | Najafi |
| 7222539 | May 2007 | Tulkki |
| 7229403 | June 2007 | Schock |
| 7245789 | July 2007 | Bates et al. |
| 7263894 | September 2007 | Tenerz |
| 7274956 | September 2007 | Mott et al. |
| RE39863 | October 2007 | Smith |
| 7294117 | November 2007 | Provost-tine et al. |
| 7329223 | February 2008 | Ainsworth et al. |
| 7331236 | February 2008 | Smith et al. |
| 7343811 | March 2008 | Tenerz et al. |
| 7347822 | March 2008 | Brockway |
| 7447388 | November 2008 | Bates et al. |
| 7450989 | November 2008 | Svanerudh |
| 7454244 | November 2008 | Kassab et al. |
| 7458938 | December 2008 | Patel et al. |
| 7472601 | January 2009 | Tenerz et al. |
| 7481774 | January 2009 | Brockway et al. |
| 7527594 | May 2009 | Vardi et al. |
| 7532920 | May 2009 | Ainsworth et al. |
| 7599588 | October 2009 | Eberle et al. |
| 7645233 | January 2010 | Tulkki et al. |
| 7660492 | February 2010 | Bates et al. |
| 7724148 | May 2010 | Samuelsson et al. |
| 7731664 | June 2010 | Millar |
| 7775988 | August 2010 | Pijls |
| 7783338 | August 2010 | Ainsworth et al. |
| 7837650 | November 2010 | Cox et al. |
| 7881573 | February 2011 | Eberle et al. |
| 7931603 | April 2011 | Von Malmborg et al. |
| 7946997 | May 2011 | Hubinette |
| 7967761 | June 2011 | Smith |
| 7967762 | June 2011 | Corl et al. |
| 7998089 | August 2011 | Smith |
| 8025623 | September 2011 | Millar |
| 8029447 | October 2011 | Kanz et al. |
| 8059923 | November 2011 | Bates et al. |
| 8140146 | March 2012 | Kim et al. |
| 8157742 | April 2012 | Taylor |
| 8162856 | April 2012 | Williams et al. |
| 8174395 | May 2012 | Samuelsson |
| 8187195 | May 2012 | Tulkki |
| 8216151 | July 2012 | Smith |
| 8231537 | July 2012 | Ahmed et al. |
| 8249815 | August 2012 | Taylor |
| 8277386 | October 2012 | Ahmed et al. |
| 8282565 | October 2012 | Mahapatra et al. |
| 8298156 | October 2012 | Manstrom et al. |
| 8311747 | November 2012 | Taylor |
| 8311748 | November 2012 | Taylor et al. |
| 8311750 | November 2012 | Taylor |
| 8315812 | November 2012 | Taylor |
| 8315813 | November 2012 | Taylor et al. |
| 8315814 | November 2012 | Taylor et al. |
| 8317715 | November 2012 | Belleville et al. |
| 8320723 | November 2012 | Eberle et al. |
| 8321150 | November 2012 | Taylor |
| 8410940 | April 2013 | Samuelsson |
| 8419647 | April 2013 | Corl et al. |
| 8419648 | April 2013 | Corl et al. |
| 8461997 | June 2013 | Samuelsson |
| 8485985 | July 2013 | Manstrom |
| 8556520 | October 2013 | Elenbaas et al. |
| 8562537 | October 2013 | Alpert et al. |
| 8636659 | January 2014 | Alpert et al. |
| 8641639 | February 2014 | Manstrom |
| 8696584 | April 2014 | Kassab |
| 8698638 | April 2014 | Samuelsson et al. |
| 8714021 | May 2014 | Gamage |
| 8797155 | August 2014 | Huennekens et al. |
| 8857264 | October 2014 | Gamage |
| 8958863 | February 2015 | Huennekens et al. |
| 8977336 | March 2015 | Huennekens et al. |
| 8998823 | April 2015 | Manstrom et al. |
| 9011342 | April 2015 | Manstrom et al. |
| 9113843 | August 2015 | Manstrom et al. |
| 9186072 | November 2015 | Manstrom et al. |
| 9220461 | December 2015 | Samuelsson et al. |
| 9259161 | February 2016 | Suchecki et al. |
| 9289137 | March 2016 | Corl |
| 9314584 | April 2016 | Riley et al. |
| 9332916 | May 2016 | Kassab |
| 9339348 | May 2016 | Davies et al. |
| 2001/0051769 | December 2001 | Hoek et al. |
| 2002/0013527 | January 2002 | Hoek et al. |
| 2002/0035331 | March 2002 | Brockway et al. |
| 2002/0059827 | May 2002 | Smith |
| 2002/0065472 | May 2002 | Brockway et al. |
| 2002/0072880 | June 2002 | Svanerudh et al. |
| 2002/0157473 | October 2002 | Stemme et al. |
| 2002/0173724 | November 2002 | Dorando et al. |
| 2003/0018273 | January 2003 | Corl et al. |
| 2003/0032886 | February 2003 | Dgany et al. |
| 2003/0033095 | February 2003 | Svanerudh et al. |
| 2003/0040674 | February 2003 | Cori et al. |
| 2003/0159518 | August 2003 | Sawatari et al. |
| 2003/0163052 | August 2003 | Mott et al. |
| 2003/0176850 | September 2003 | Melvas |
| 2003/0195428 | October 2003 | Brockway et al. |
| 2003/0216621 | November 2003 | Alpert et al. |
| 2004/0067000 | April 2004 | Bates et al. |
| 2004/0082844 | April 2004 | Vardi et al. |
| 2004/0082866 | April 2004 | Mott et al. |
| 2004/0116816 | June 2004 | Tenerz et al. |
| 2004/0143240 | July 2004 | Armstrong et al. |
| 2004/0143261 | July 2004 | Hartley et al. |
| 2004/0157790 | August 2004 | Herweijer et al. |
| 2004/0162548 | August 2004 | Reiser |
| 2004/0167385 | August 2004 | Rioux et al. |
| 2004/0176790 | September 2004 | Coyle |
| 2004/0230131 | November 2004 | Kassab et al. |
| 2004/0254442 | December 2004 | Williams et al. |
| 2005/0000294 | January 2005 | Tenerz et al. |
| 2005/0011272 | January 2005 | Tenerz |
| 2005/0043670 | February 2005 | Rosenberg |
| 2005/0049451 | March 2005 | Schock et al. |
| 2005/0187487 | August 2005 | Azizkhan |
| 2005/0268724 | December 2005 | Tenerz |
| 2005/0268725 | December 2005 | Tulkki |
| 2006/0005127 | January 2006 | Ferguson |
| 2006/0052700 | March 2006 | Svanerudh |
| 2006/0074318 | April 2006 | Ahmed et al. |
| 2006/0094966 | May 2006 | Brockway et al. |
| 2006/0094982 | May 2006 | Corl et al. |
| 2006/0142756 | June 2006 | Davies et al. |
| 2006/0207335 | September 2006 | Tenerz et al. |
| 2006/0241505 | October 2006 | Ahmed et al. |
| 2006/0287569 | December 2006 | Schock et al. |
| 2007/0060820 | March 2007 | Lofgren et al. |
| 2007/0060822 | March 2007 | Alpert et al. |
| 2007/0078352 | April 2007 | Pijls |
| 2007/0106142 | May 2007 | Von Malmborg et al. |
| 2007/0106165 | May 2007 | Tulkki |
| 2007/0116408 | May 2007 | Eberle et al. |
| 2007/0133925 | June 2007 | Bates et al. |
| 2007/0135718 | June 2007 | Corl et al. |
| 2007/0162106 | July 2007 | Evans et al. |
| 2007/0191717 | August 2007 | Rosen et al. |
| 2007/0220986 | September 2007 | Smith et al. |
| 2007/0255144 | November 2007 | Tulkki et al. |
| 2007/0255145 | November 2007 | Smith |
| 2008/0077085 | March 2008 | Eidenschink et al. |
| 2008/0119739 | May 2008 | Vardi et al. |
| 2008/0119758 | May 2008 | Samuelsson et al. |
| 2008/0132806 | June 2008 | Smith |
| 2008/0139897 | June 2008 | Ainsworth et al. |
| 2008/0146993 | June 2008 | Krishna |
| 2008/0200770 | August 2008 | Hubinette |
| 2008/0255471 | October 2008 | Maghavi et al. |
| 2008/0262470 | October 2008 | Lee et al. |
| 2008/0269572 | October 2008 | Kanz et al. |
| 2009/0059727 | March 2009 | Bates et al. |
| 2009/0082678 | March 2009 | Smith |
| 2009/0088609 | April 2009 | Schmitz-Rode et al. |
| 2009/0088650 | April 2009 | Corl |
| 2009/0124880 | May 2009 | Smith |
| 2009/0125007 | May 2009 | Splinter |
| 2009/0248049 | October 2009 | Perkins |
| 2009/0281394 | November 2009 | Russell |
| 2010/0014810 | January 2010 | Eberle et al. |
| 2010/0087732 | April 2010 | Eberle et al. |
| 2010/0109104 | May 2010 | Tiensuu et al. |
| 2010/0113942 | May 2010 | Eberle |
| 2010/0135111 | June 2010 | Bates et al. |
| 2010/0152607 | June 2010 | Kassab |
| 2010/0234698 | September 2010 | Manstrom et al. |
| 2010/0241008 | September 2010 | Belleville et al. |
| 2010/0280330 | November 2010 | Samuelsson et al. |
| 2010/0286536 | November 2010 | Samuelsson et al. |
| 2010/0286537 | November 2010 | Pijls |
| 2011/0004198 | January 2011 | Hoch |
| 2011/0060229 | March 2011 | Hulvershorn |
| 2011/0066047 | March 2011 | Belleville et al. |
| 2011/0071407 | March 2011 | Hubinette |
| 2011/0083521 | April 2011 | Hollander et al. |
| 2011/0123154 | May 2011 | Eberle et al. |
| 2011/0137140 | June 2011 | Tearney et al. |
| 2011/0178383 | July 2011 | Kassab |
| 2011/0178413 | July 2011 | Schmitt et al. |
| 2011/0178417 | July 2011 | Kassab |
| 2011/0196255 | August 2011 | Kassab |
| 2011/0245693 | October 2011 | Hastings et al. |
| 2011/0251497 | October 2011 | Corl et al. |
| 2011/0306867 | December 2011 | Gopinathan et al. |
| 2011/0319773 | December 2011 | Kanz et al. |
| 2012/0053918 | March 2012 | Taylor |
| 2012/0071782 | March 2012 | Patil et al. |
| 2012/0072190 | March 2012 | Sharma et al. |
| 2012/0101355 | April 2012 | Gopinathan et al. |
| 2012/0101369 | April 2012 | Patil et al. |
| 2012/0108943 | May 2012 | Bates et al. |
| 2012/0136244 | May 2012 | Manstrom et al. |
| 2012/0172731 | July 2012 | Smith |
| 2012/0172732 | July 2012 | Meyer |
| 2012/0203118 | August 2012 | Samuelsson et al. |
| 2012/0220836 | August 2012 | Alpert et al. |
| 2012/0220837 | August 2012 | Alpert et al. |
| 2012/0220883 | August 2012 | Manstrom et al. |
| 2012/0227505 | September 2012 | Belleville et al. |
| 2012/0271178 | October 2012 | Smith |
| 2012/0278008 | November 2012 | Davies et al. |
| 2012/0316419 | December 2012 | Chevalier |
| 2013/0015975 | January 2013 | Huennekens et al. |
| 2013/0023762 | January 2013 | Huennekens et al. |
| 2013/0023763 | January 2013 | Huennekens et al. |
| 2013/0046190 | February 2013 | Davies |
| 2013/0060133 | March 2013 | Kassab et al. |
| 2013/0090555 | April 2013 | Kassab |
| 2013/0096409 | April 2013 | Hiltner et al. |
| 2013/0109980 | May 2013 | Teo |
| 2013/0116579 | May 2013 | Svanerudh |
| 2013/0131523 | May 2013 | Suchecki |
| 2013/0190633 | July 2013 | Dorando et al. |
| 2013/0216481 | August 2013 | Rosenmeier |
| 2013/0303914 | November 2013 | Hiltner et al. |
| 2013/0324864 | December 2013 | Manstrom |
| 2014/0024235 | January 2014 | Russell |
| 2014/0024950 | January 2014 | Hiltner et al. |
| 2014/0086461 | March 2014 | Yao et al. |
| 2014/0180140 | June 2014 | Alpert |
| 2014/0180141 | June 2014 | Millett |
| 2014/0187980 | July 2014 | Burkett |
| 2014/0187984 | July 2014 | Burkett |
| 2014/0276142 | September 2014 | Dorando |
| 2014/0379269 | December 2014 | Schmitt |
| 2015/0032011 | January 2015 | McGowan et al. |
| 2015/0074995 | March 2015 | Patil et al. |
| 2015/0105673 | April 2015 | Gregorich |
| 2015/0112191 | April 2015 | Gilboa et al. |
| 2015/0141853 | May 2015 | Miller et al. |
| 2015/0148693 | May 2015 | Burkett |
| 2015/0157216 | June 2015 | Stigall et al. |
| 2015/0173722 | June 2015 | Huennekens et al. |
| 2015/0223707 | August 2015 | Ludoph |
| 2015/0265167 | September 2015 | McGowan et al. |
| 2015/0272449 | October 2015 | Meyer |
| 2015/0282765 | October 2015 | Goshen et al. |
| 2015/0313479 | November 2015 | Stigall et al. |
| 2015/0359438 | December 2015 | Mccaffrey et al. |
| 2015/0359439 | December 2015 | Manstrom et al. |
| 2016/0022153 | January 2016 | Dorando |
| 2016/0022956 | January 2016 | Purdy et al. |
| 2016/0066802 | March 2016 | Keller |
| 2016/0106321 | April 2016 | Sharma et al. |
| 102008045878 | Mar 2010 | DE | |||
| 0263190 | Oct 1986 | EP | |||
| 1658808 | Aug 1995 | EP | |||
| 1260175 | Nov 2002 | EP | |||
| 1493381 | Jan 2005 | EP | |||
| 1514512 | Mar 2005 | EP | |||
| 1702641 | Sep 2006 | EP | |||
| 01419796 | Mar 2008 | EP | |||
| 10033488 | Feb 1998 | JP | |||
| 10137199 | May 1998 | JP | |||
| 2000-333913 | Dec 2000 | JP | |||
| 2004194996 | Jul 2004 | JP | |||
| 2005-3638066 | Jan 2005 | JP | |||
| 2005-095603 | Apr 2005 | JP | |||
| 2005-3705458 | Aug 2005 | JP | |||
| 2006-204378 | Aug 2006 | JP | |||
| 2009285 | Aug 2012 | NL | |||
| WO1997/000641 | Jan 1997 | WO | |||
| WO1999/058059 | Nov 1999 | WO | |||
| WO2003/022122 | Mar 2003 | WO | |||
| WO2006/037082 | Apr 2006 | WO | |||
| WO2006/0117154 | Nov 2006 | WO | |||
| WO2011/0120565 | Oct 2011 | WO | |||
| WO2011/0161212 | Dec 2011 | WO | |||
| WO2012093260 | Jul 2012 | WO | |||
| WO2012173697 | Dec 2012 | WO | |||
| WO2013061281 | May 2013 | WO | |||
| WO2014/025255 | Feb 2014 | WO | |||
| WO2014/176448 | Oct 2014 | WO | |||
| WO2015/150128 | Oct 2015 | WO | |||
| WO2016/001017 | Jan 2016 | WO | |||
Other References
|
PCT/US2015/062866, The International Search Report and the Written Opinion, dated Mar. 22, 2016. cited by applicant. |
Primary Examiner: Weston; Tiffany
Assistant Examiner: Tran; Tho
Attorney, Agent or Firm: Medler Ferro Woodhouse & Mills PLLC
Claims
What is claimed is:
1. A processing system for receiving data from pressure measurement devices and communicating data to a conventional hemodynamic monitoring system having pressure displays, the processing system comprising: a first data input for receiving a proximal pressure measurement (P.sub.a) signal from an aortic pressure measurement device; a second data input for receiving a distal pressure measurement (P.sub.d) signal from a distal pressure measurement device; a controller configured to: compute a Fraction Flow Reserve (FFR) ratio from the proximal pressure measurement signal and the distal pressure measurement signal; convert the FFR ratio to a pressure format such that the FFR ratio reads on the conventional hemodynamic system as a pressure in units of pressure; transmit a first data output signal representing the proximal pressure measurement signal to the conventional hemodynamic monitoring system; transmit a second data output signal representing the distal pressure measurement signal to the conventional hemodynamic monitoring system; and transmit a third data output signal representing the FFR ratio in the pressure format to the conventional hemodynamic monitoring system, wherein the processing system is separate from the conventional hemodynamic monitoring system.
2. The processing system of claim 1, wherein the controller is further configured to scale the converted FFR ratio such that the converted FFR ratio is in a similar scale as the proximal pressure measurement and the distal pressure measurement.
3. The processing system of claim 1, further comprising a first analog-to-digital converter for converting the proximal pressure measurement signal into a proximal pressure digital signal.
4. The processing system of claim 3, further comprising a second analog-to-digital converter for converting the distal pressure measurement signal into a distal pressure digital signal.
5. The processing system of claim 4, wherein the first analog-to-digital converter and the second analog converter convert the proximal pressure measurement signal and the distal pressure measurement signal prior to the controller computing the FFR ratio.
6. The processing system of claim 5, further comprising a first digital-to-analog converter for converting the proximal pressure digital signal to the first data output signal for transmission to the conventional hemodynamic monitoring system.
7. The processing system of claim 6, further comprising a second digital-to-analog converter for converting the distal pressure digital signal to the first data output signal for transmission to the conventional hemodynamic monitoring system.
8. The processing system of claim 1, wherein the second data input comprises a wireless receiver for wirelessly receiving the distal pressure measurement signal.
9. The processing system of claim 1, wherein the second data input comprises an input jack for receiving the distal pressure measurement signal.
10. The processing system of claim 1, further comprising a wireless transmitter for wirelessly transmitting the first data output signal, the second data output signal, and the third data output signal to the conventional hemodynamic monitoring system.
11. The processing system of claim 1, wherein the pressure format is American National Standards Institute/Association for the Advancement of Medical Instrumentation (ANSI/AAMI) Blood Pressure Transducers, general (BP22)-1994 standard for blood pressure transducers.
12. A method of utilizing a conventional hemodynamic monitoring system to display data during a Fractional Flow Reserve (FFR) measurement procedure, the method comprising the steps of: receiving a proximal pressure measurement (Pa) signal from an aortic pressure measurement device; receiving a distal pressure measurement (Pd) signal from a distal pressure measurement device; processing the proximal pressure measurement signal and the distal pressure measurement signal to compute an FFR ratio; converting the FFR ratio to a pressure format such that the FFR ratio reads on the conventional hemodynamic system as a pressure in units of pressure; transmitting the proximal pressure measurement signal to the conventional hemodynamic monitoring system; transmitting the distal pressure measurement signal to the conventional hemodynamic monitoring system; and transmitting the FFR ratio in the pressure format to the conventional hemodynamic monitoring system.
13. The method of claim 12, further comprising steps of: converting the proximal pressure measurement signal from an analog signal to a proximal pressure measurement digital signal prior to the processing step; and converting the distal pressure measurement signal from an analog signal to a digital pressure measurement digital signal prior to the processing step.
14. The method of claim 13, further comprising the steps of: converting the proximal pressure measurement digital signal to a proximal pressure measurement analog output signal prior to transmitting the proximal pressure measurement analog output signal to the conventional hemodynamic monitoring system; and converting the distal pressure measurement digital signal to a distal pressure measurement analog output signal prior to transmitting the distal pressure measurement analog output signal to the conventional hemodynamic monitoring system.
15. The method of claim 12, wherein the distal pressure measurement signal is received from a catheter based distal pressure measurement device, further comprising the step of: applying a correction factor to the FFR ratio to adjust the FFR ratio to account for differences in blood flow around the catheter-based distal pressure measurement device and a wire-based distal pressure measurement device.
16. The method of claim 12, wherein the processing step further includes the steps of: selecting a type of distal pressure measurement device; and applying a correction factor to the FFR ratio based on the selected type of the distal pressure measurement device.
17. The method of claim 12, wherein the step of receiving the distal pressure measurement from the distal pressure measurement device comprises wirelessly receiving the distal pressure measurement from the distal pressure measurement device.
18. The method of claim 12, wherein the steps of transmitting the proximal pressure measurement signal, the distal pressure measurement signal, and the FFR ratio in pressure format to the conventional hemodynamic monitoring system comprises wirelessly transmitting the proximal pressure measurement signal, the distal pressure measurement signal, and the FFR ratio in pressure format to the conventional hemodynamic monitoring system.
19. The method of claim 12, further comprising scaling the converted FFR ratio such that the converted FFR ratio is in a similar scale as the proximal pressure measurement and the distal pressure measurement.
20. The method of claim 12, wherein the pressure format is American National Standards Institute/Association for the Advancement of Medical Instrumentation (ANSI/AAMI) Blood Pressure Transducers, general (BP22)-1994 standard for blood pressure transducers.
Description
FIELD OF THE INVENTION
The invention methods and systems for determining a pressure gradient across a lesion of a vessel for calculating a Fractional Flow Reserve.
BACKGROUND OF THE INVENTION
The severity of a stenosis or lesion in a blood vessel may be assessed by obtaining proximal and distal pressure measurements relative to the given stenosis and using those measurements for calculating a value of the Fractional Flow Reserve (FFR). FFR is defined as the ratio of a first pressure measurement (P.sub.d) taken on the distal side of the lesion to a second pressure measurement taken on the proximal side of the lesion usually within the aorta (P.sub.a). Conventionally, a sensor is placed on the distal portion of a guidewire or FFR wire to obtain the first pressure measurement P.sub.d, while an external pressure transducer is fluidly connected via tubing to a guide catheter for obtaining the second or aortic (AO) pressure measurement P.sub.a. Calculation of the FFR value provides a lesion specific index of the functional severity of the stenosis in order to determine whether the blockage limits blood flow within the vessel to an extent that treatment is needed. An optimal or normal value of FFR in a healthy vessel is 1.00, while values less than about 0.80 are generally deemed significant and in need of an interventional treatment. Common interventional treatment options include balloon angioplasty and/or stent implantation.
Conventional FFR devices require systems to process and display information received from the FFR device. Such systems generally include a processing system to process and record information and a console or display to display information to the physician. Such processing and display systems can be expensive and need to be integrated with hospital recording systems to keep accurate medical records. The cost of these separate systems used for FFR only can be prohibitive.
FFR procedures are generally performed in a catheterization laboratory ("cath-lab") of a hospital. A catheterization laboratory is an examination room in a hospital or clinic with diagnostic imaging equipment used to visualize the arteries of the heart and the chambers of the heart and treat any stenosis or abnormality found. A typical catheterization laboratory generally includes equipment, including a hemodynamic monitoring system. Hemodynamic monitoring systems directly measure blood pressure from inside the veins, heart and arteries. They also measure blood flow and how much oxygen is in the blood. In addition, these systems have interfaces to help document diagnostic catheterizations, coronary, peripheral and electrophysiology (EP) procedures.
It would be desirable to use existing hemodynamic monitoring systems to record and display information from an FFR device, without the need for a software addition to the hemodynamic monitoring system.
BRIEF SUMMARY OF THE INVENTION
Embodiments hereof relate to a processing system for receiving data from a Fractional Flow Reserve (FFR) device and communicating data to a conventional hemodynamic monitoring system having pressure displays. The processing system includes a first data input for receiving a proximal pressure measurement (P.sub.A) signal from an aortic pressure measurement device, a second data input for receiving a distal pressure measurement (P.sub.D) signal from a distal pressure measurement device, a processor for computing an FFR ratio from the proximal pressure measurement signal and the distal pressure measurement signal, and an FFR converter for converting the FFR ratio to a pressure format such that the FFR ratio reads on the conventional hemodynamic monitoring system as a pressure. The FFR converter in some embodiments multiplies the FFR ratio by 100 such that the pressure format is in a similar scale as the proximal pressure measurement and the distal pressure measurement. The processing system further includes a first data output signal for transmitting the proximal pressure measurement signal to the conventional hemodynamic monitoring system, a second data output signal for transmitting the distal pressure measurement signal to the conventional hemodynamic monitoring system, and a third data output signal for transmitting the FFR ratio in the pressure format to the conventional hemodynamic monitoring system. The processing system is separate from the conventional hemodynamic monitoring system.
Embodiments hereof also relate to a method of utilizing a conventional hemodynamic monitoring system to display data during a Fractional Flow Reserve (FFR) measurement procedure. The method includes receiving a proximal pressure measurement (P.sub.A) signal, receiving a distal pressure measurement (P.sub.D) signal, and processing the proximal pressure measurement signal and the distal pressure measurement signal to compute an FFR ratio. The method further includes converting the FFR ratio to a pressure format such that the FFR ratio reads on the conventional hemodynamic system as a pressure. In some embodiments, the converting step includes multiplying the FFR ratio in a decimal format by 100 such that the pressure format is in a similar scale as the proximal pressure measurement and the distal pressure measurement. The method further includes transmitting the proximal pressure measurement signal, the distal pressure measurement signal, and the converted FFR ratio in the pressure format to the conventional hemodynamic monitoring system.
BRIEF DESCRIPTION OF DRAWINGS
The foregoing and other features and advantages of the invention will be apparent from the following description of embodiments hereof as illustrated in the accompanying drawings. The accompanying drawings, which are incorporated herein and form a part of the specification, further serve to explain the principles of the invention and to enable a person skilled in the pertinent art to make and use the invention. The drawings are not to scale.
FIG. 1 is a schematic illustration of some equipment in a typical catheterization lab.
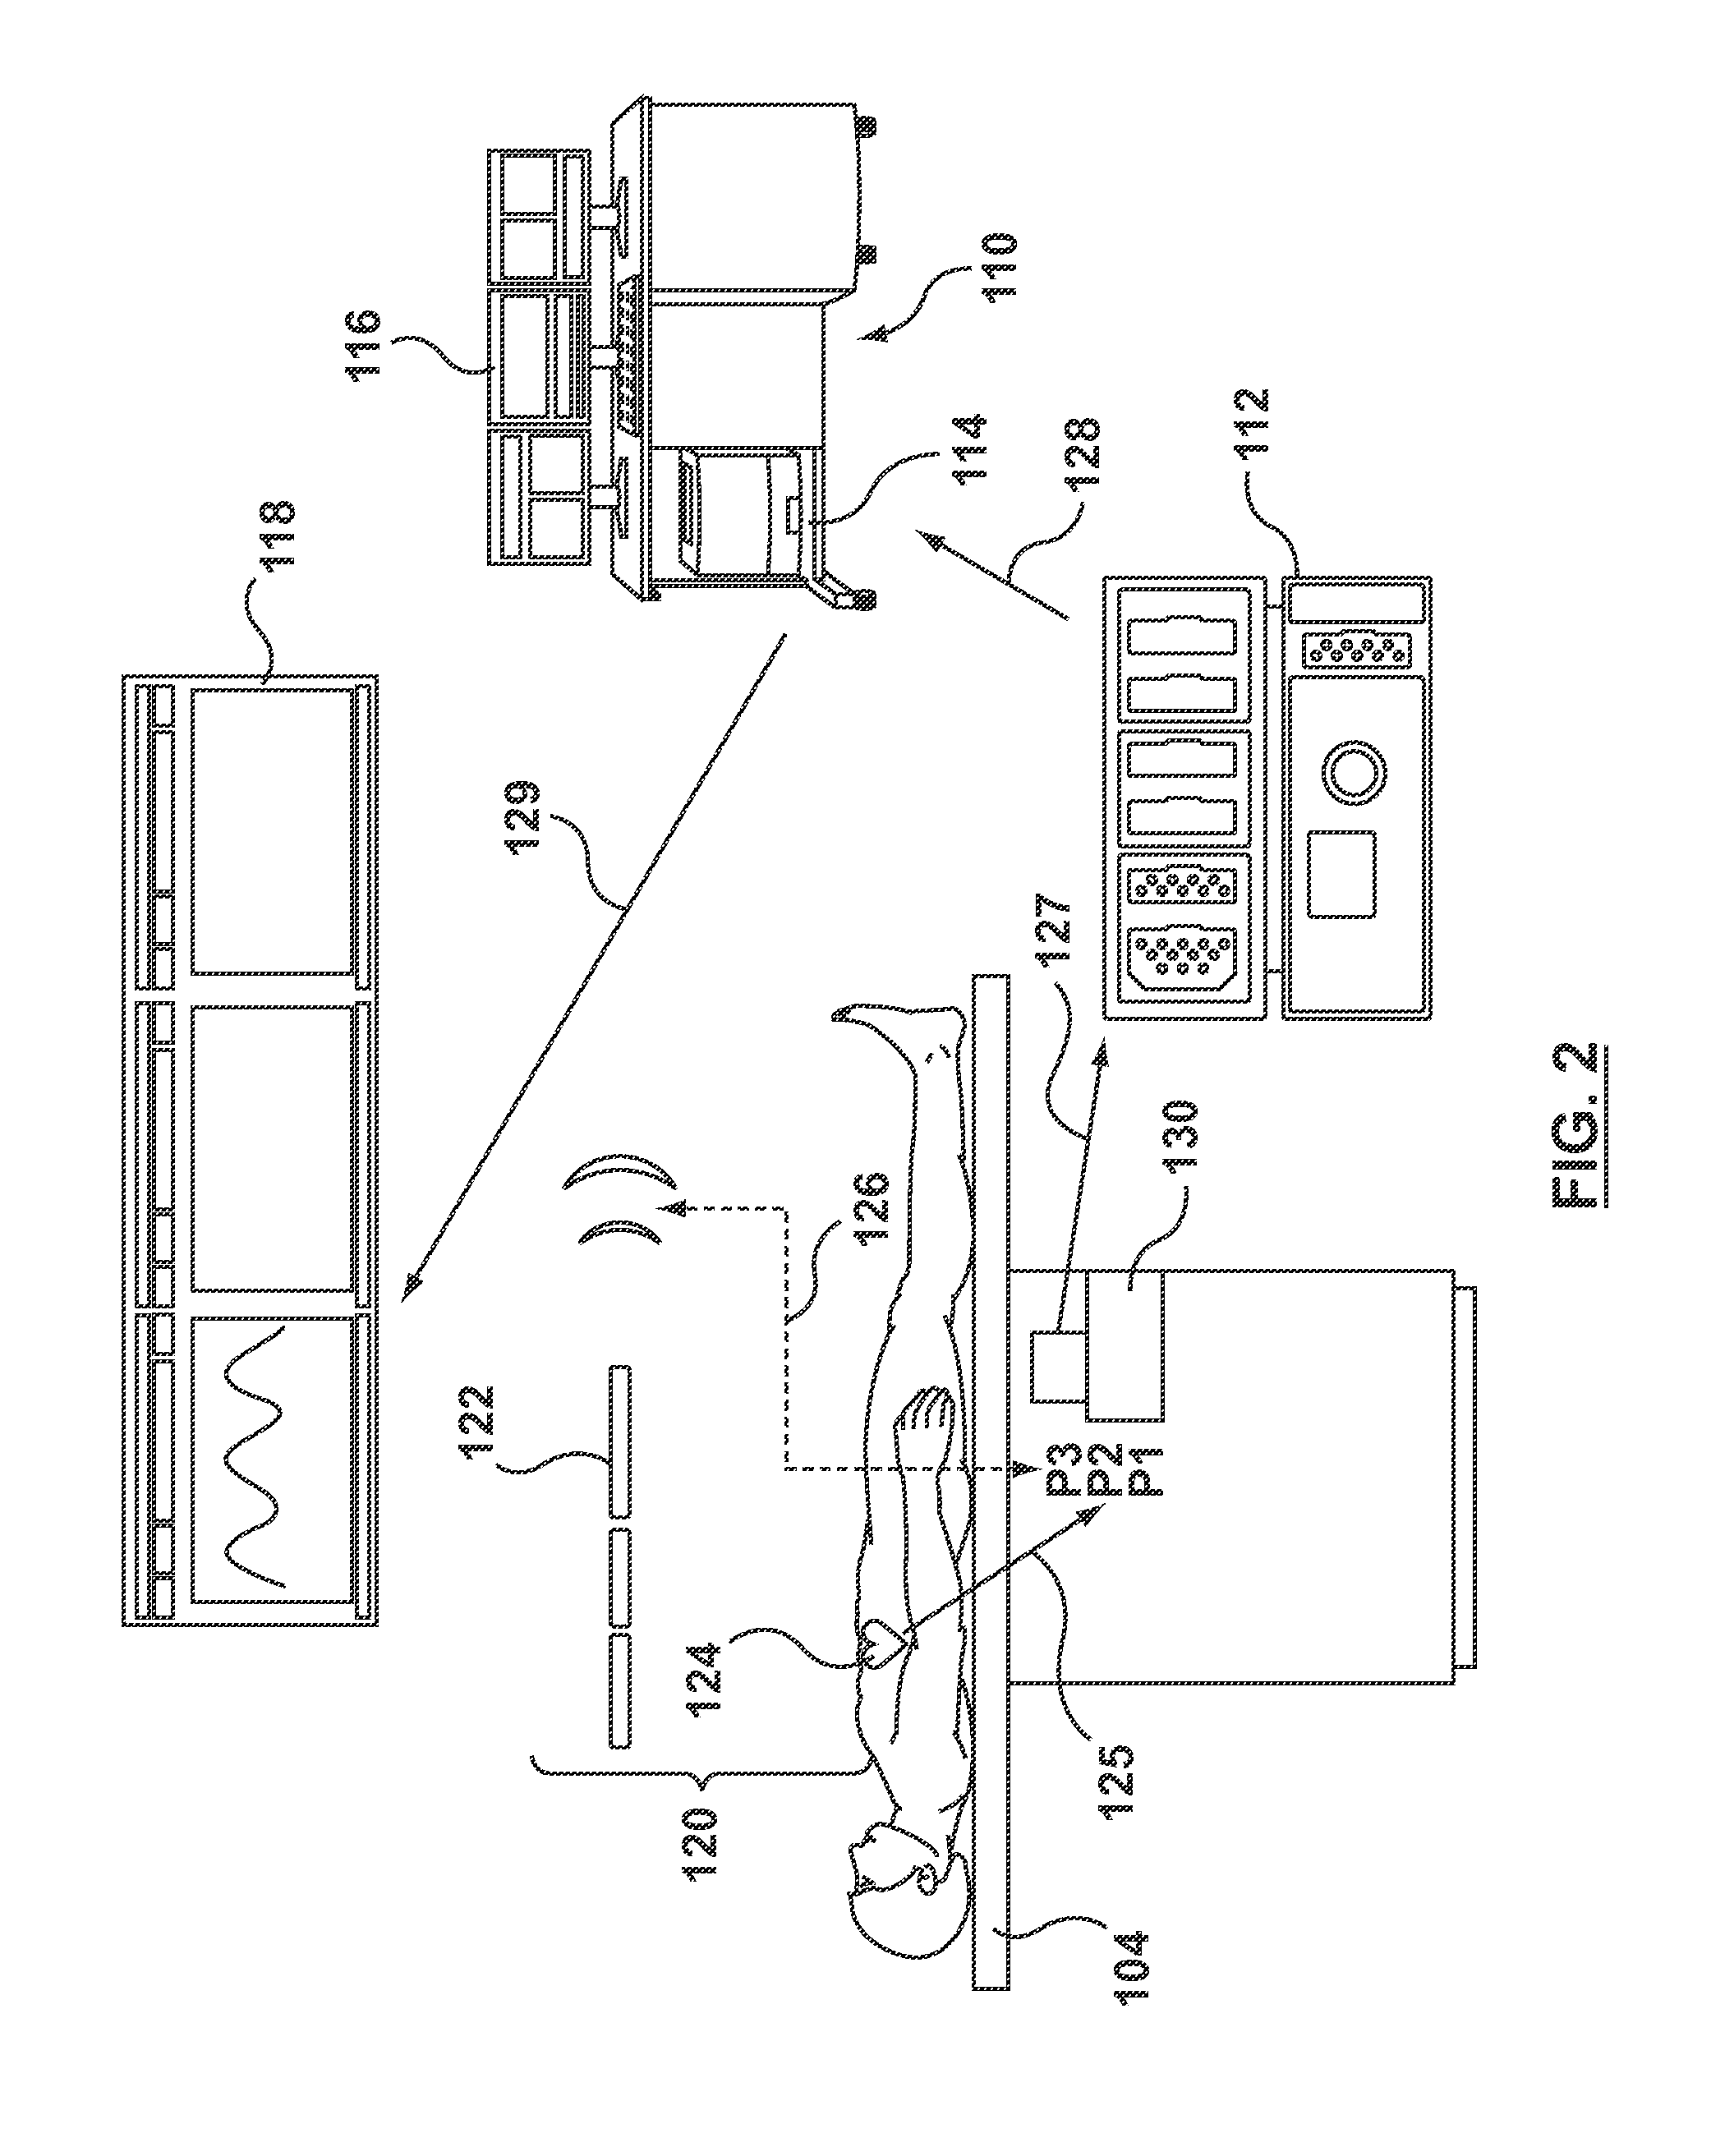
FIG. 2 is schematic illustration of selected equipment in a catheterization lab for an FFR measuring procedure including an embodiment of the processing system hereof.
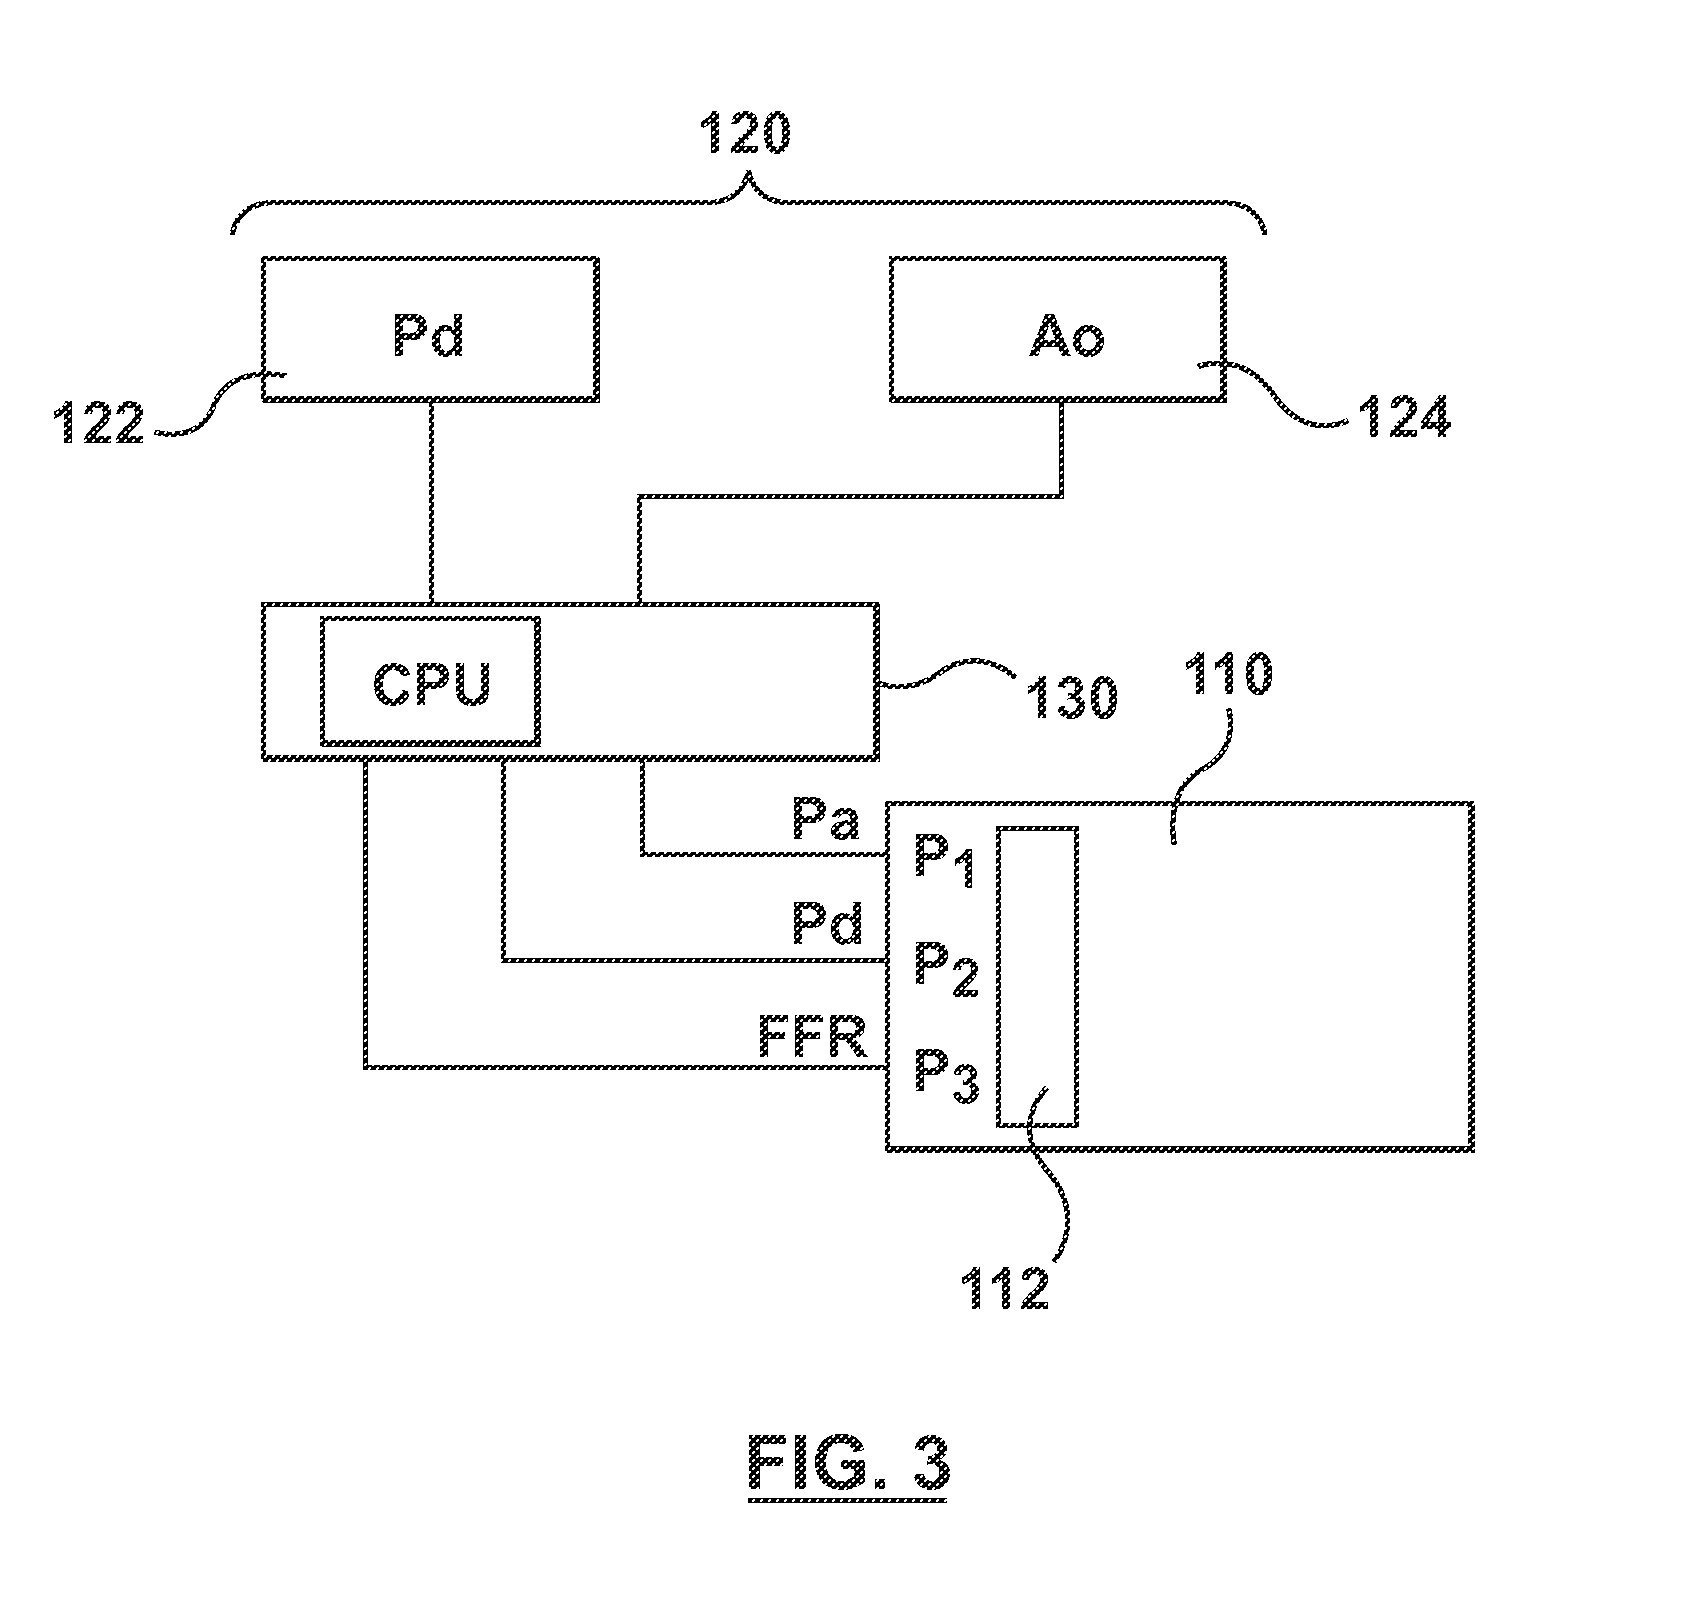
FIG. 3 is a block diagram of selected equipment of FIG. 2 including an embodiment of the processing system hereof.
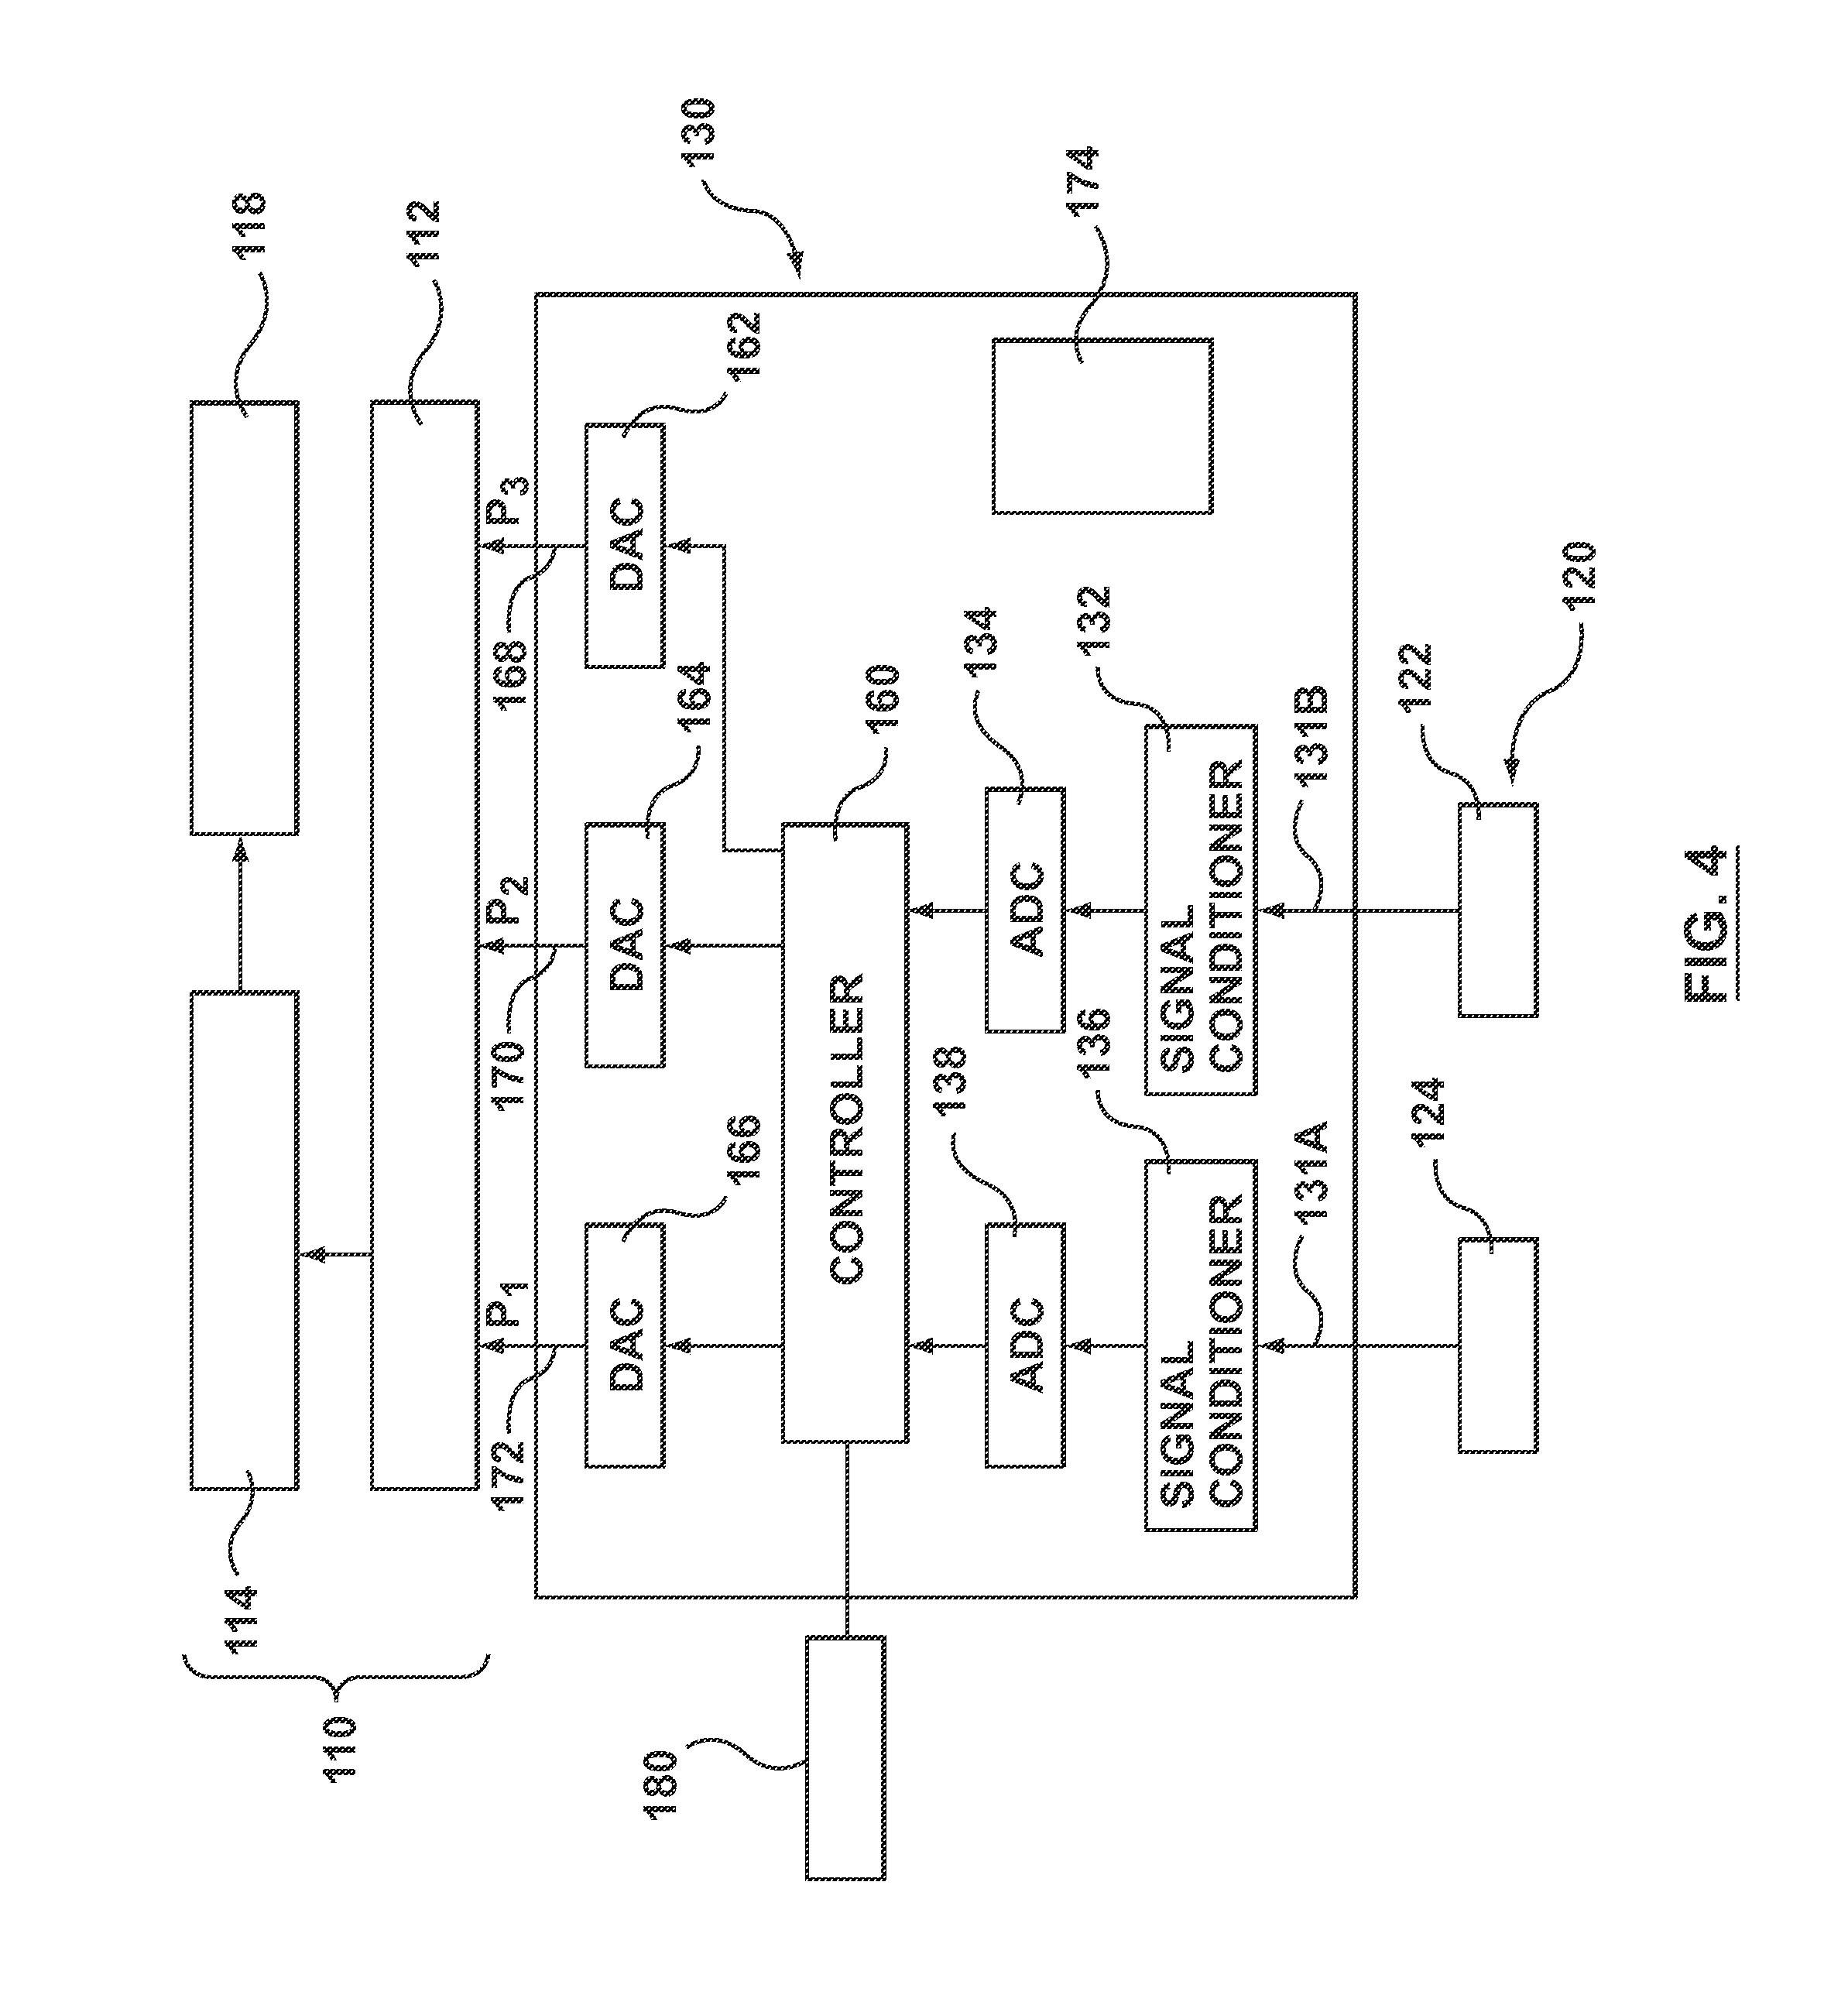
FIG. 4 is a block diagram of another embodiment of the equipment of FIG. 2 including an embodiment of the processing system hereof.
FIG. 4A is a block diagram of the equipment of FIG. 2 including another embodiment of the processing system hereof.
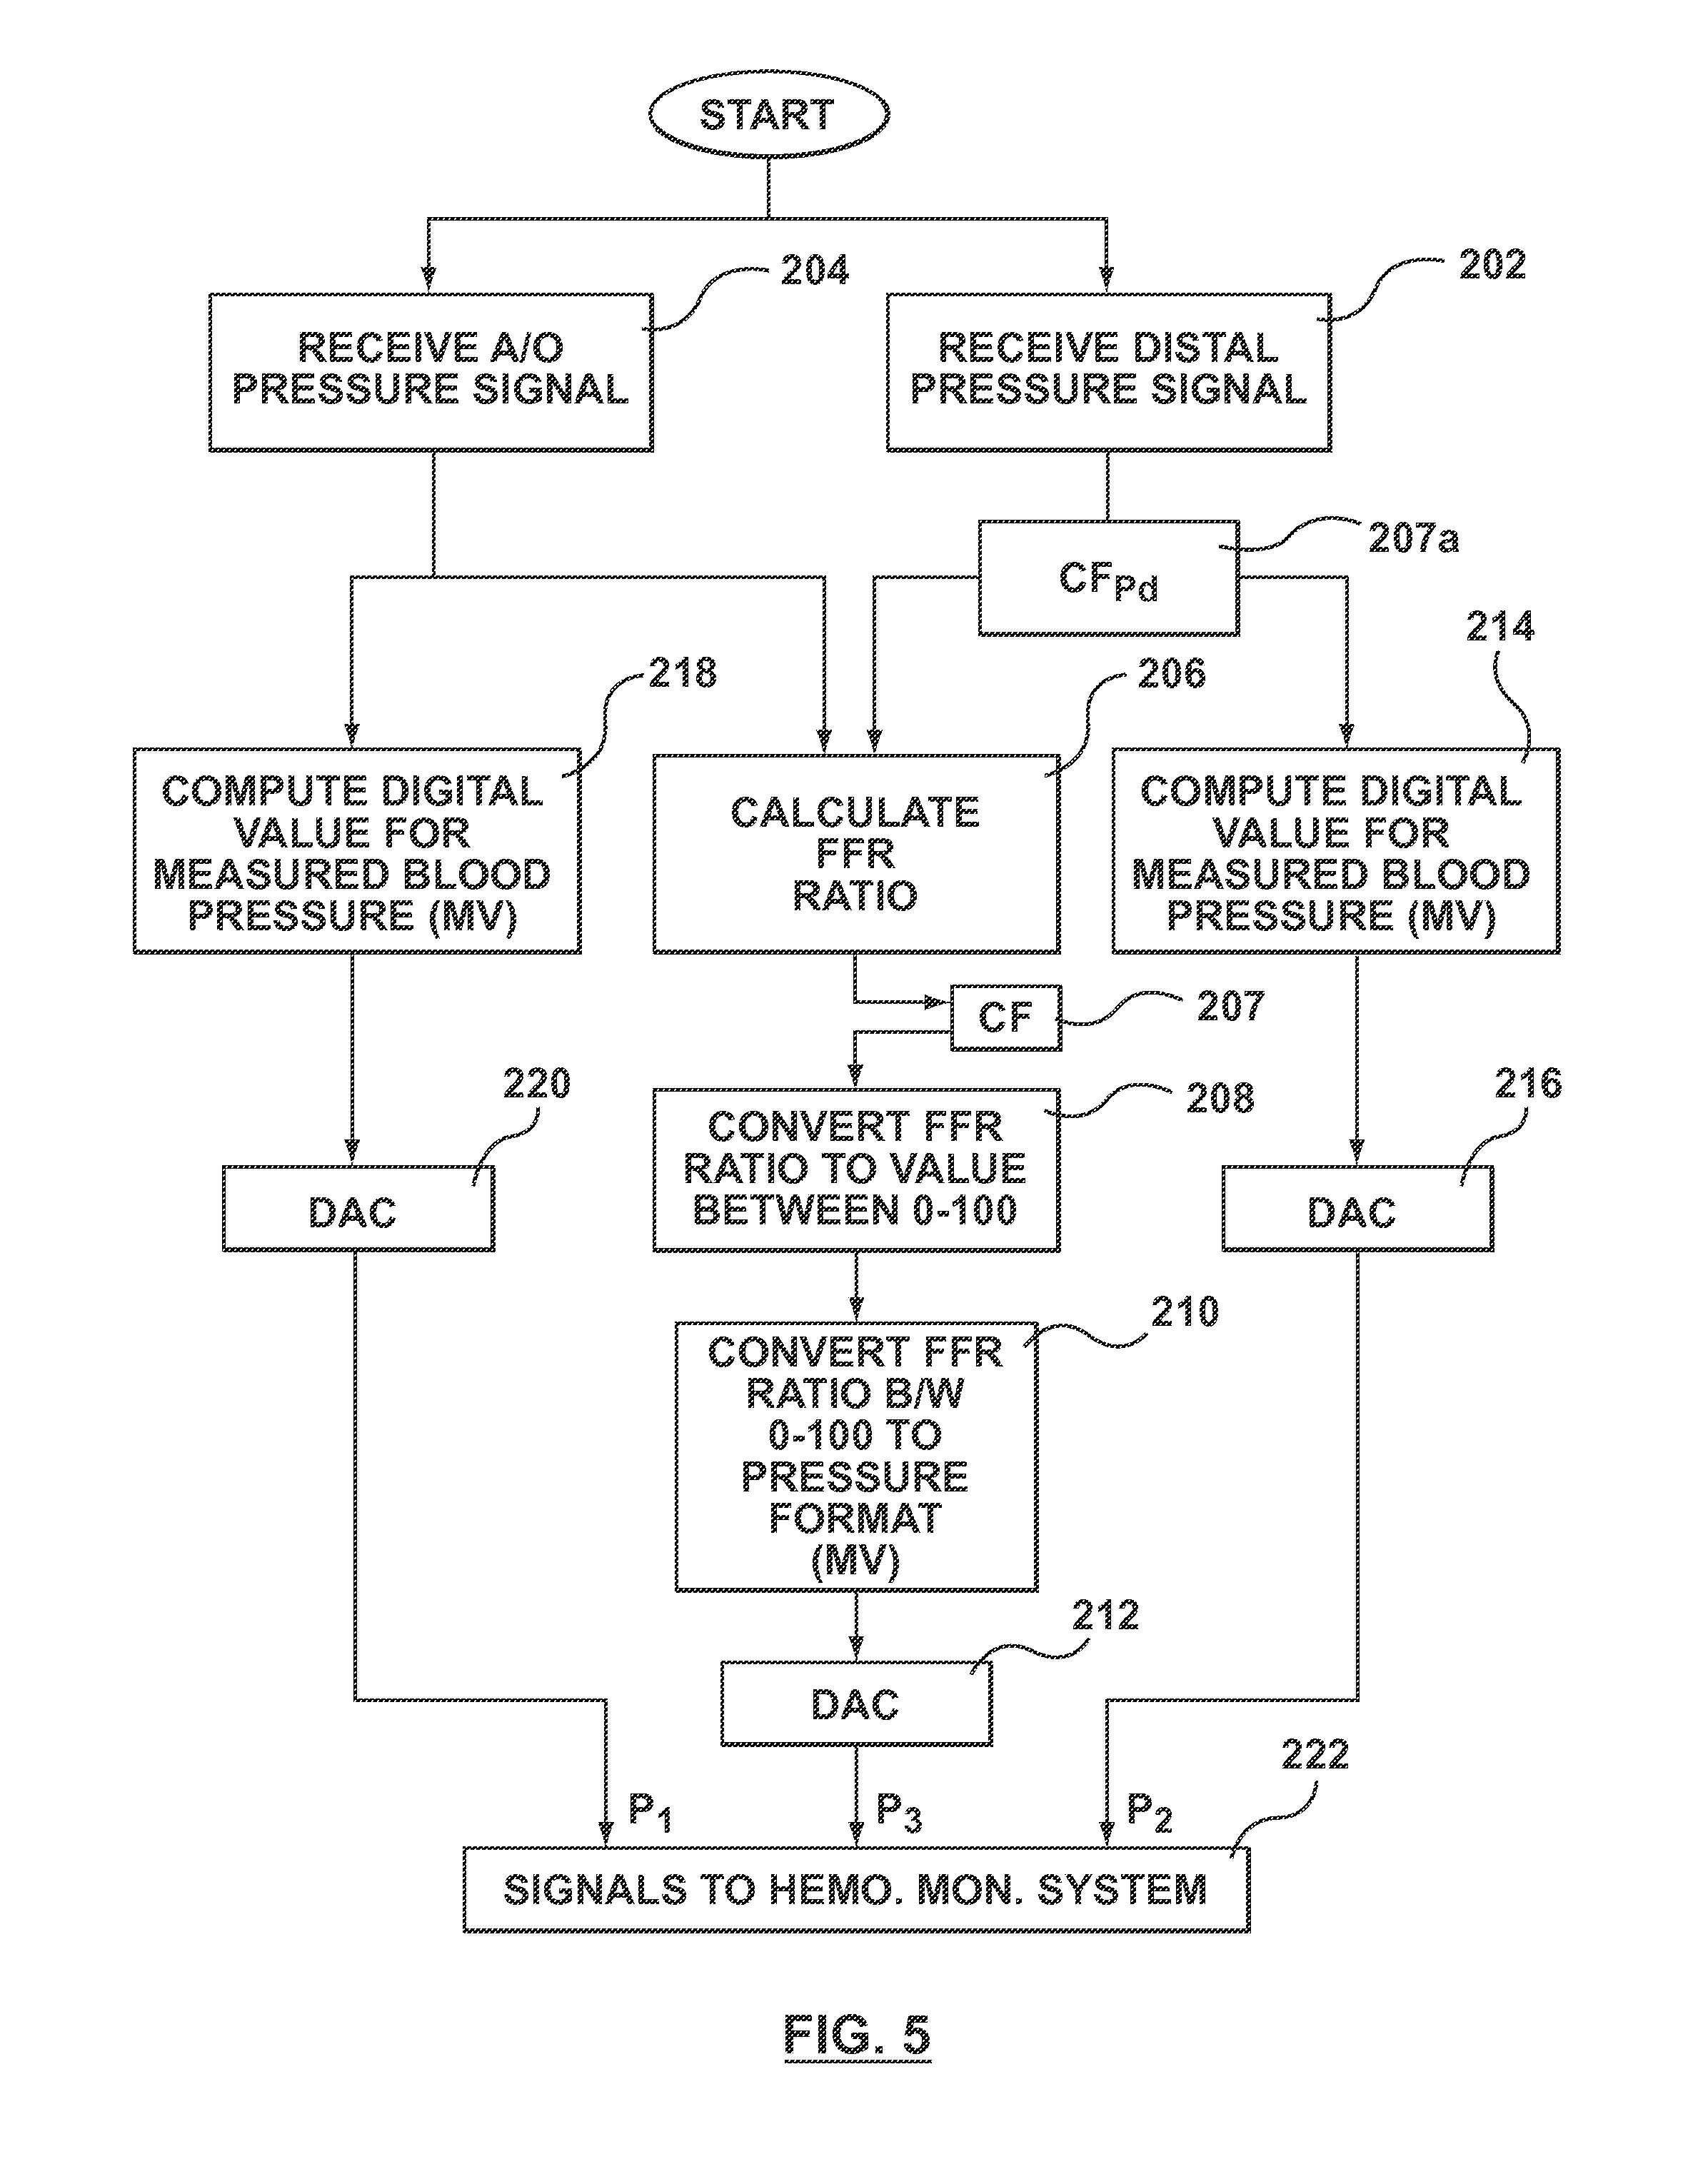
FIG. 5 is a block diagram of an embodiment of the processing system of FIG. 2.
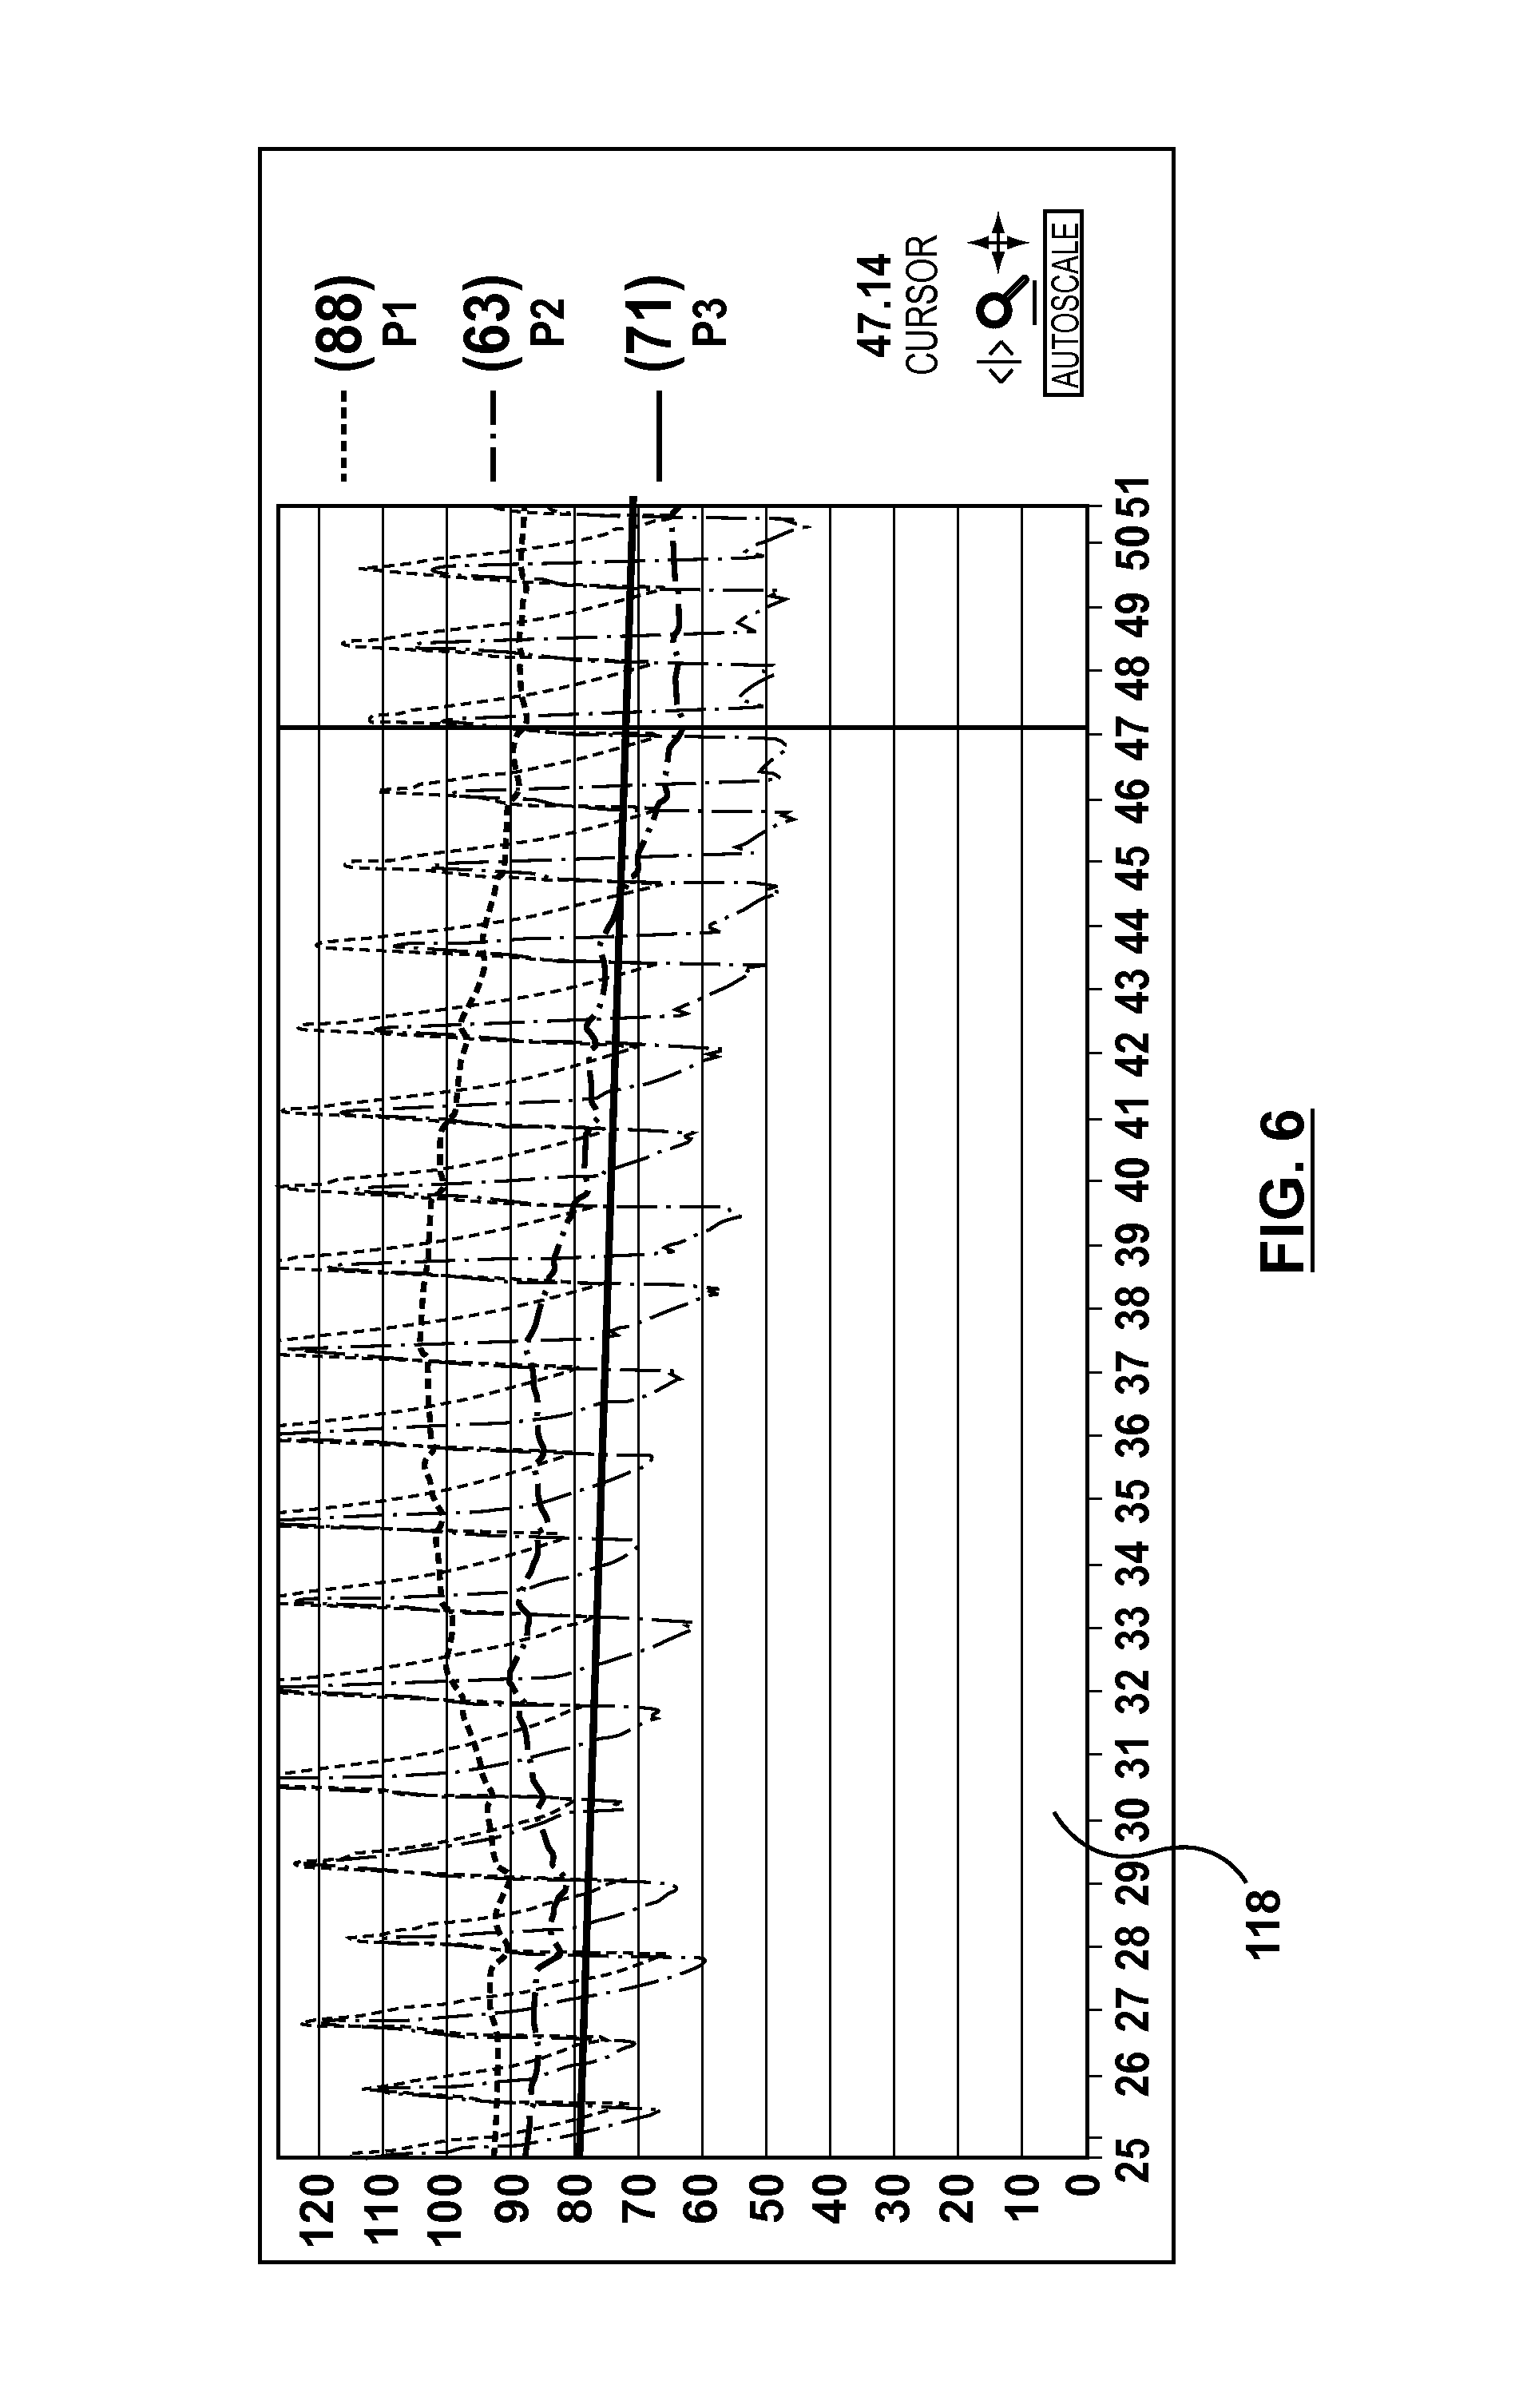
FIG. 6 is an exemplary screen shot of a cath-lab display monitor during an FFR procedure using an embodiment of the processing system hereof.
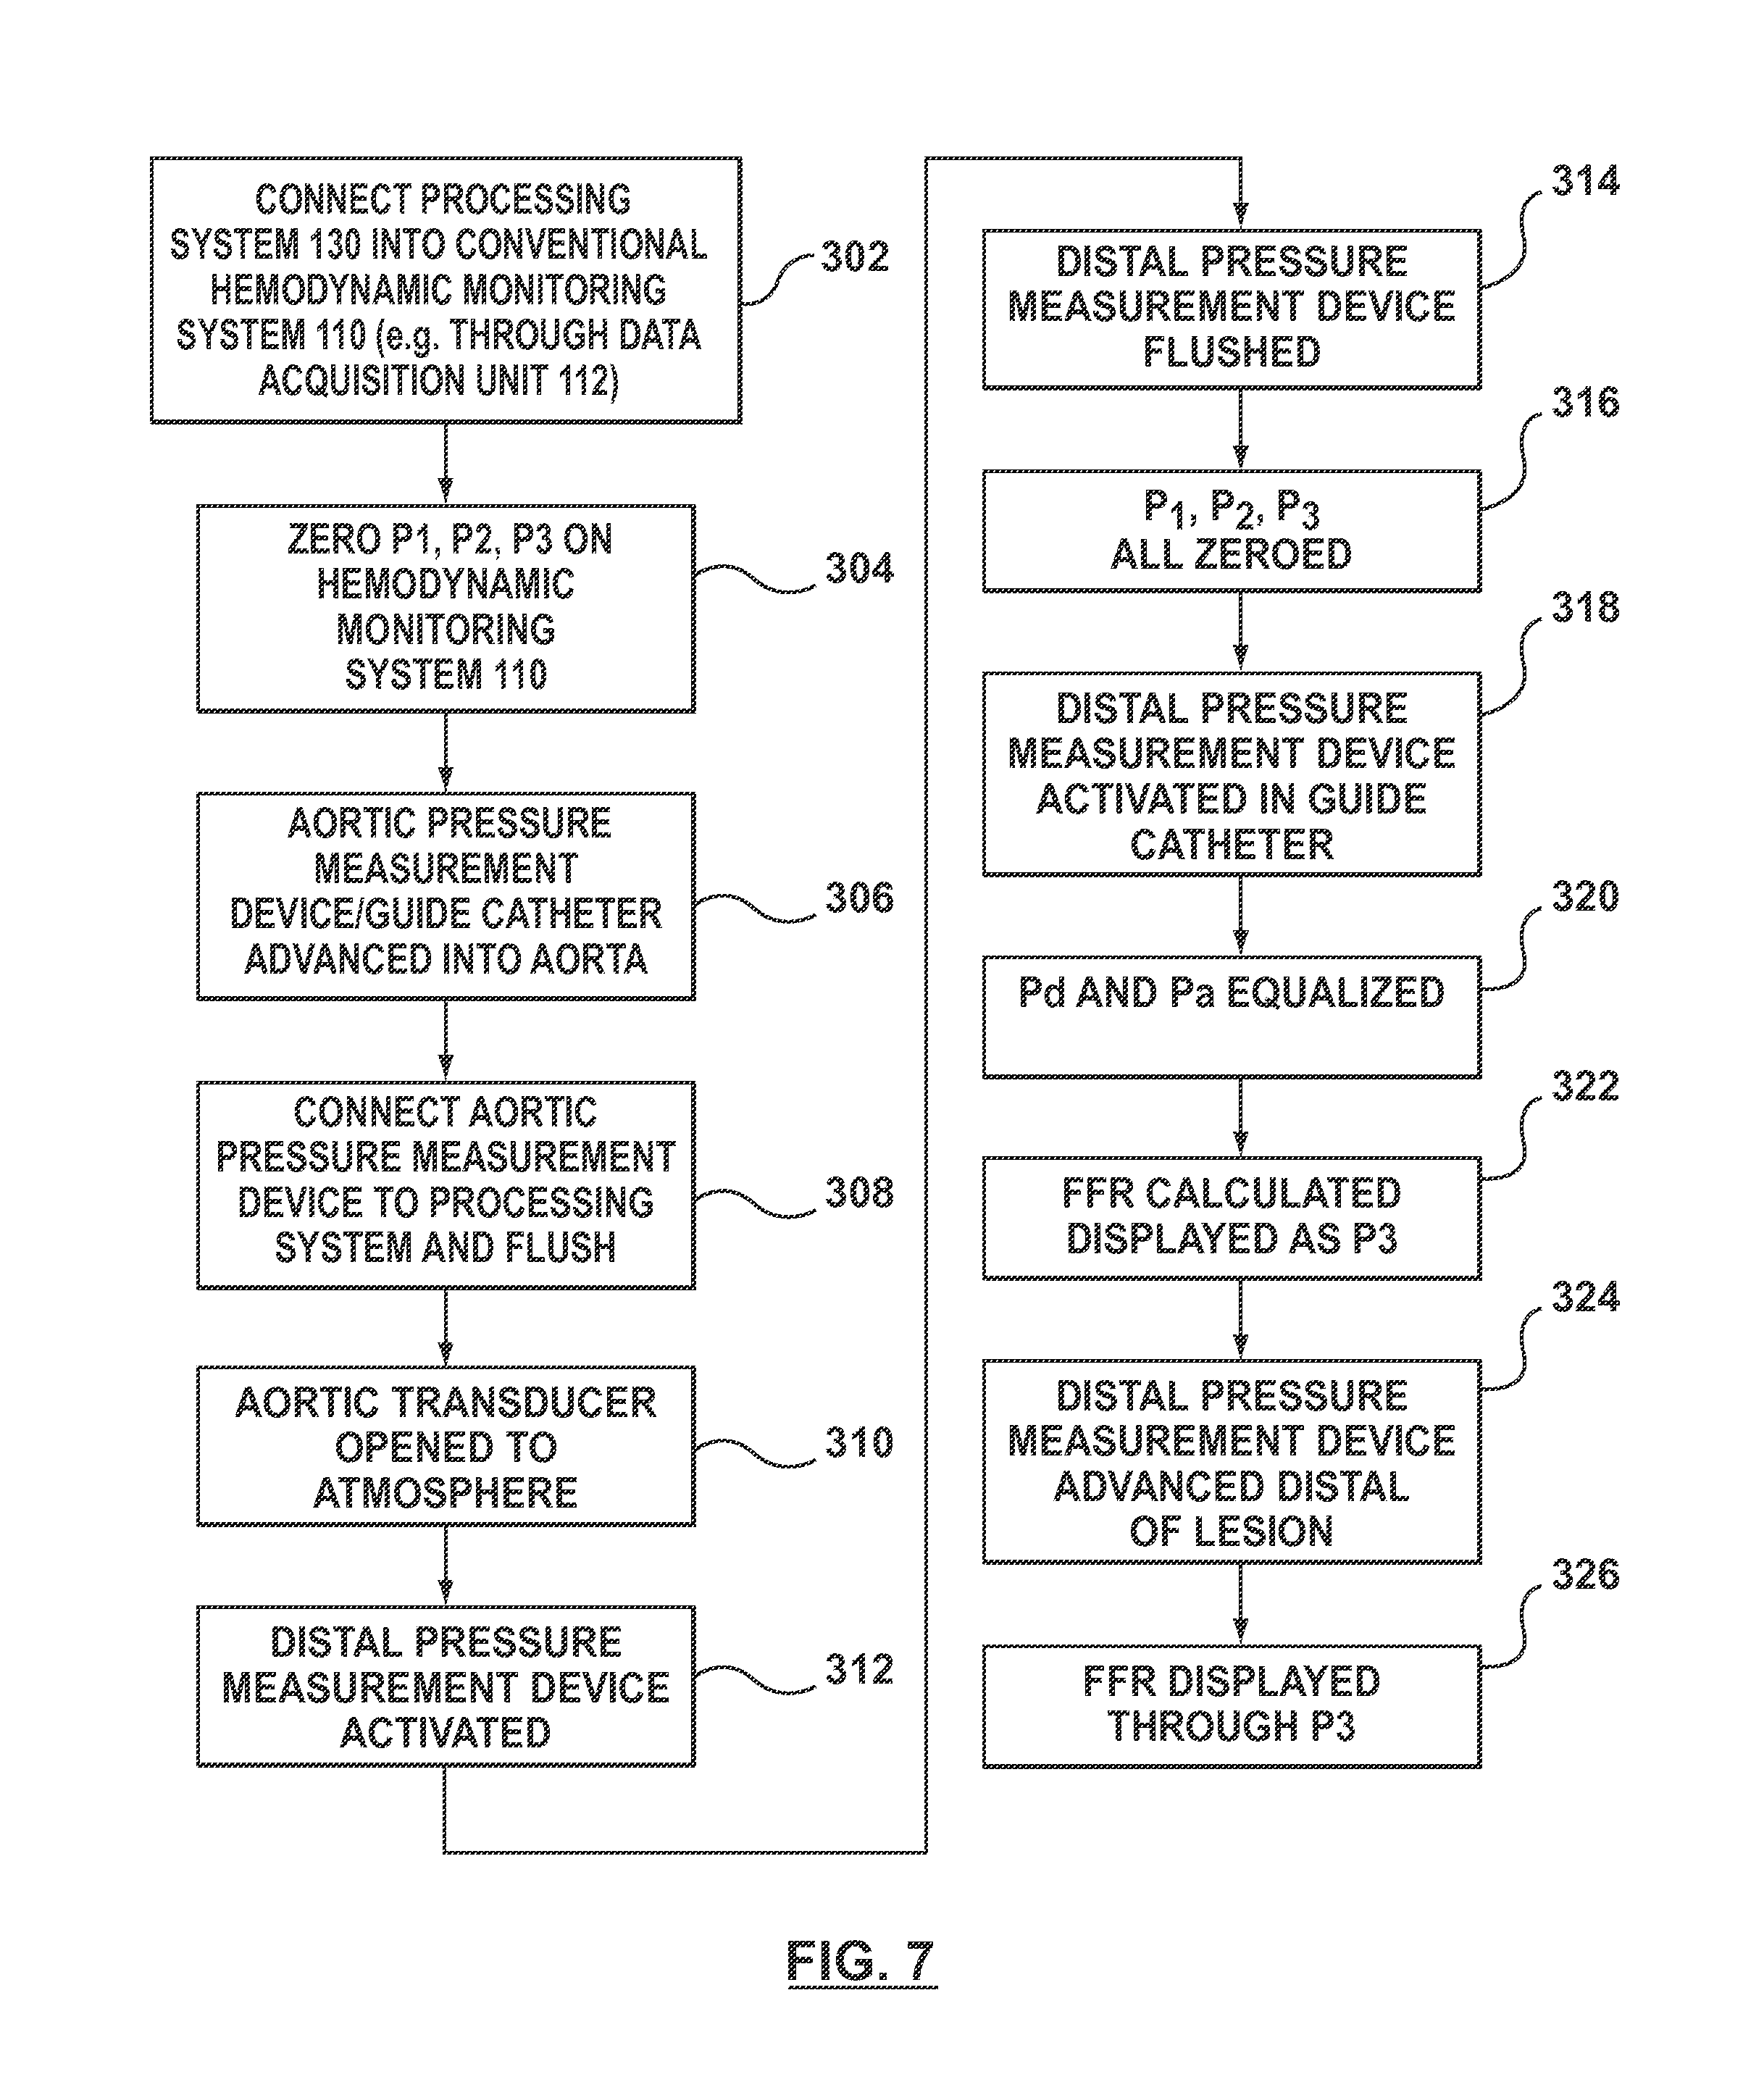
FIG. 7 is a block diagram of an embodiment of a method for preparing the systems hereof for an FFR procedure.
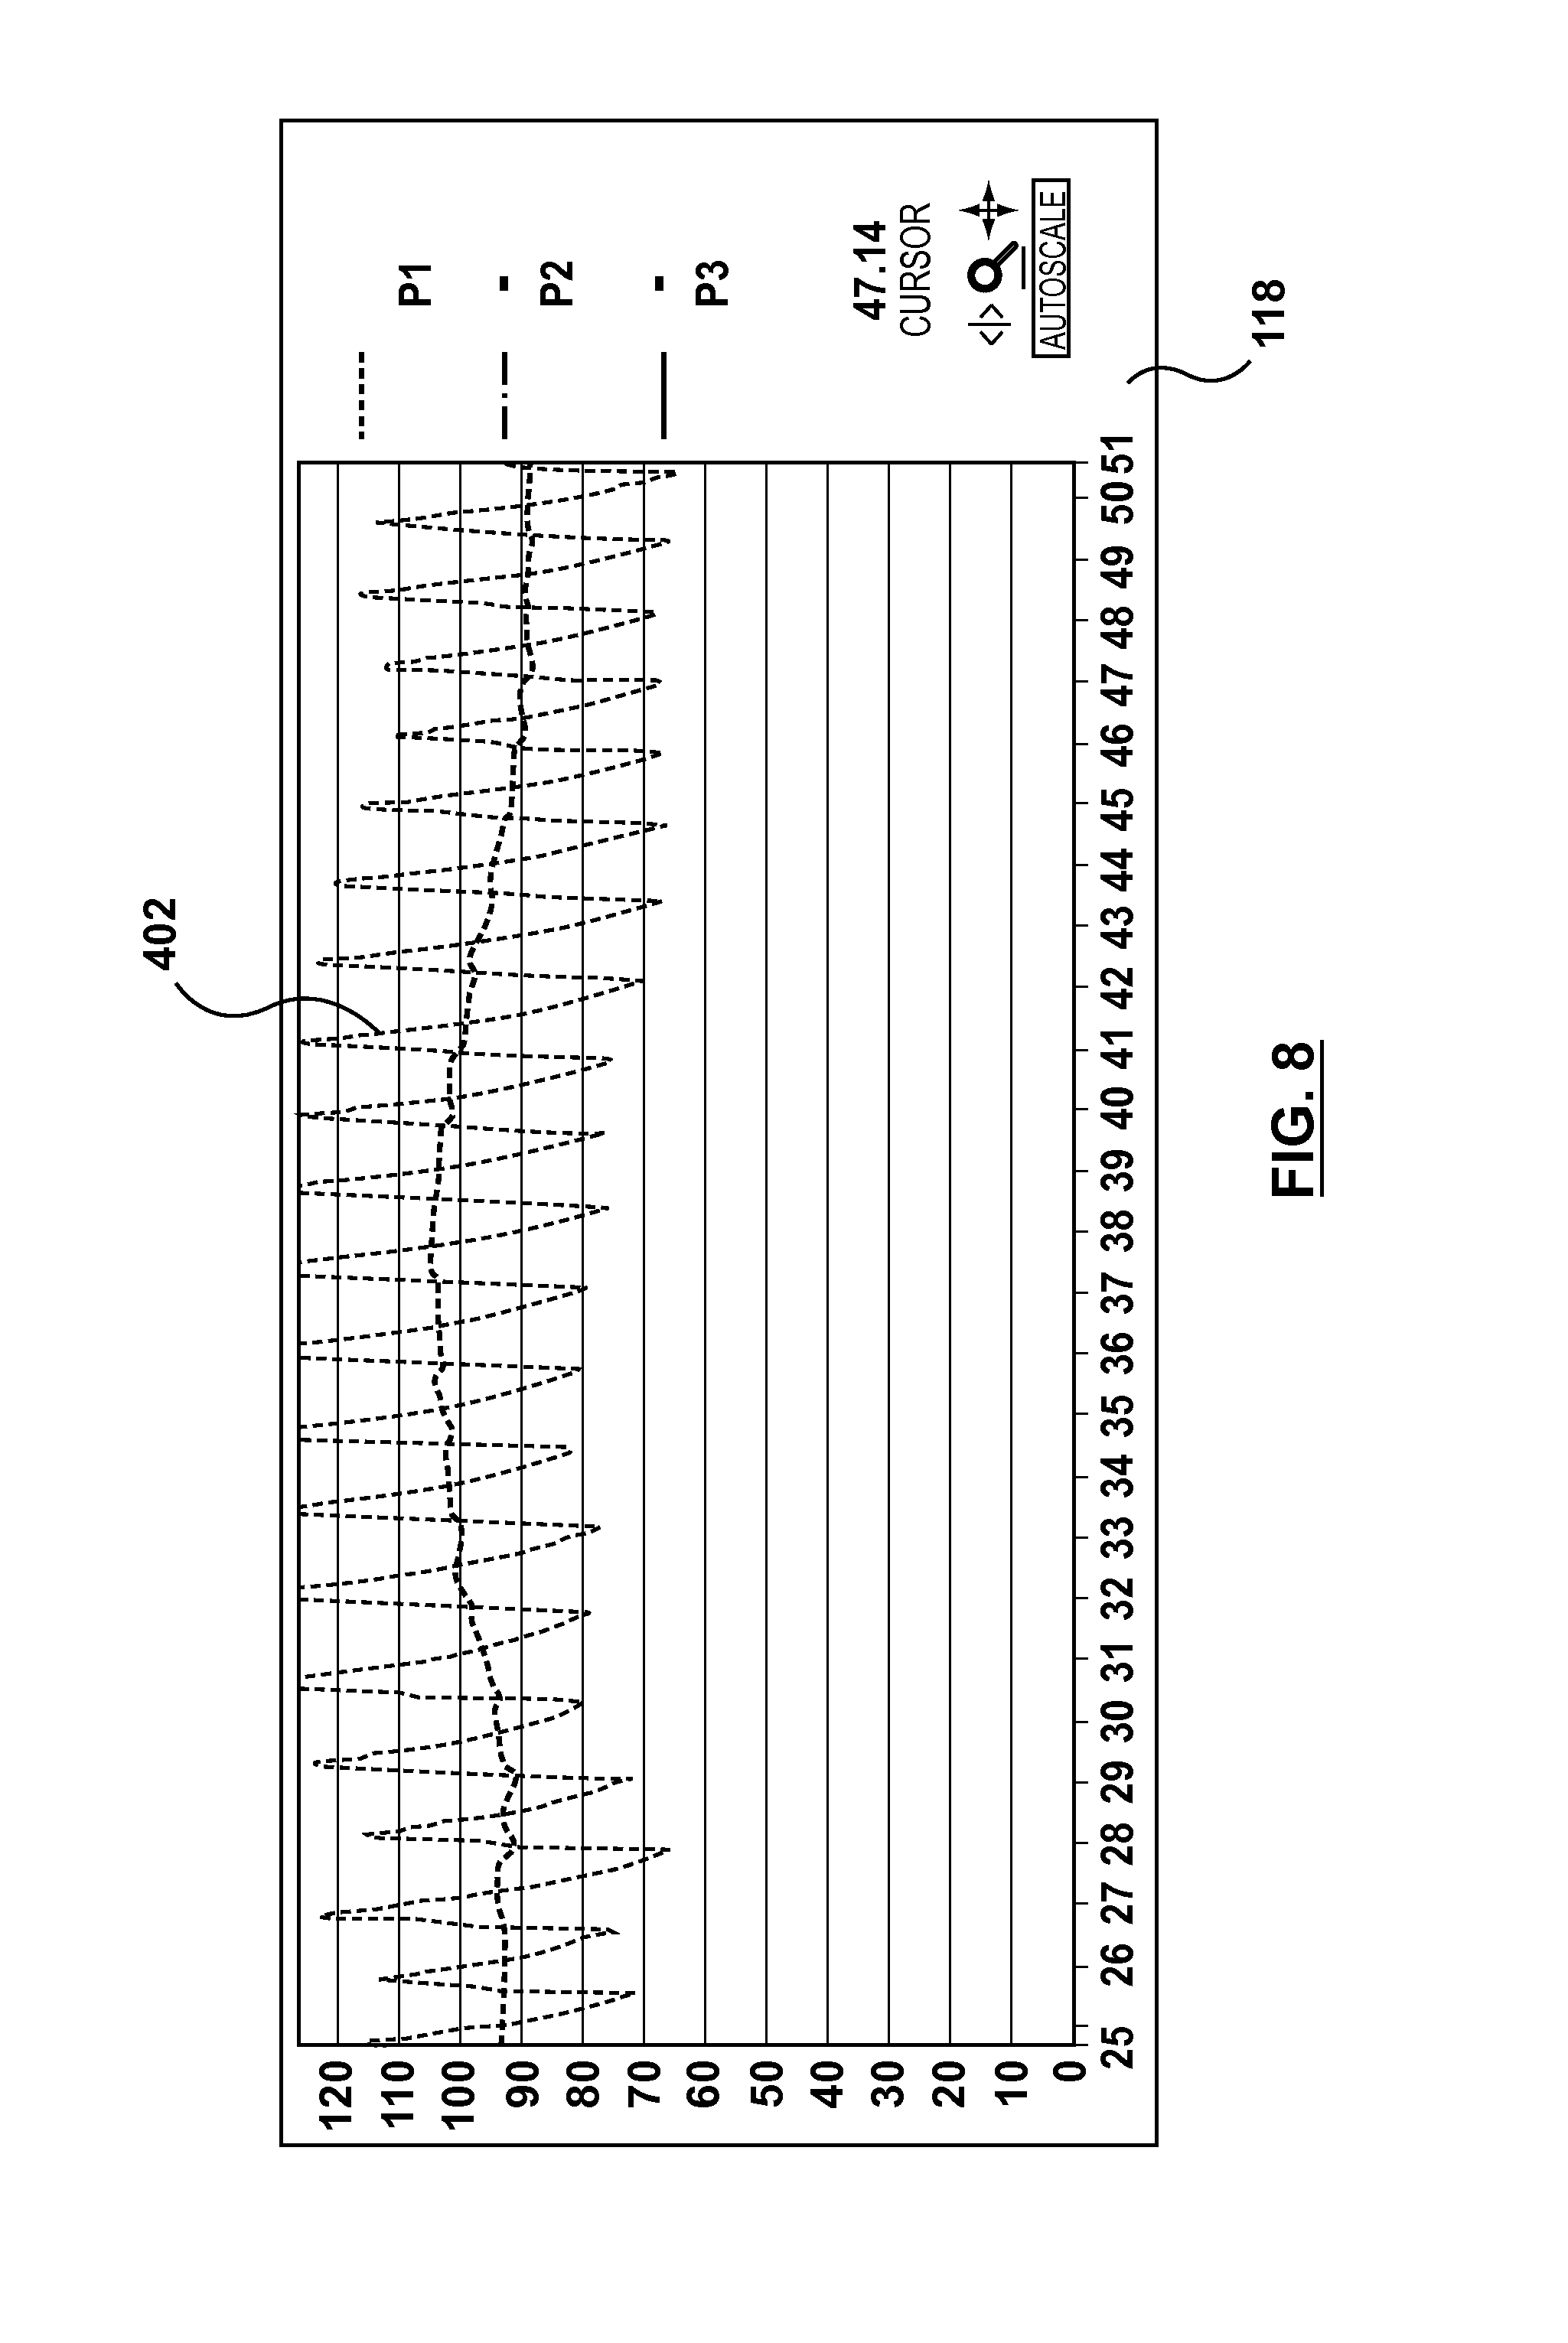
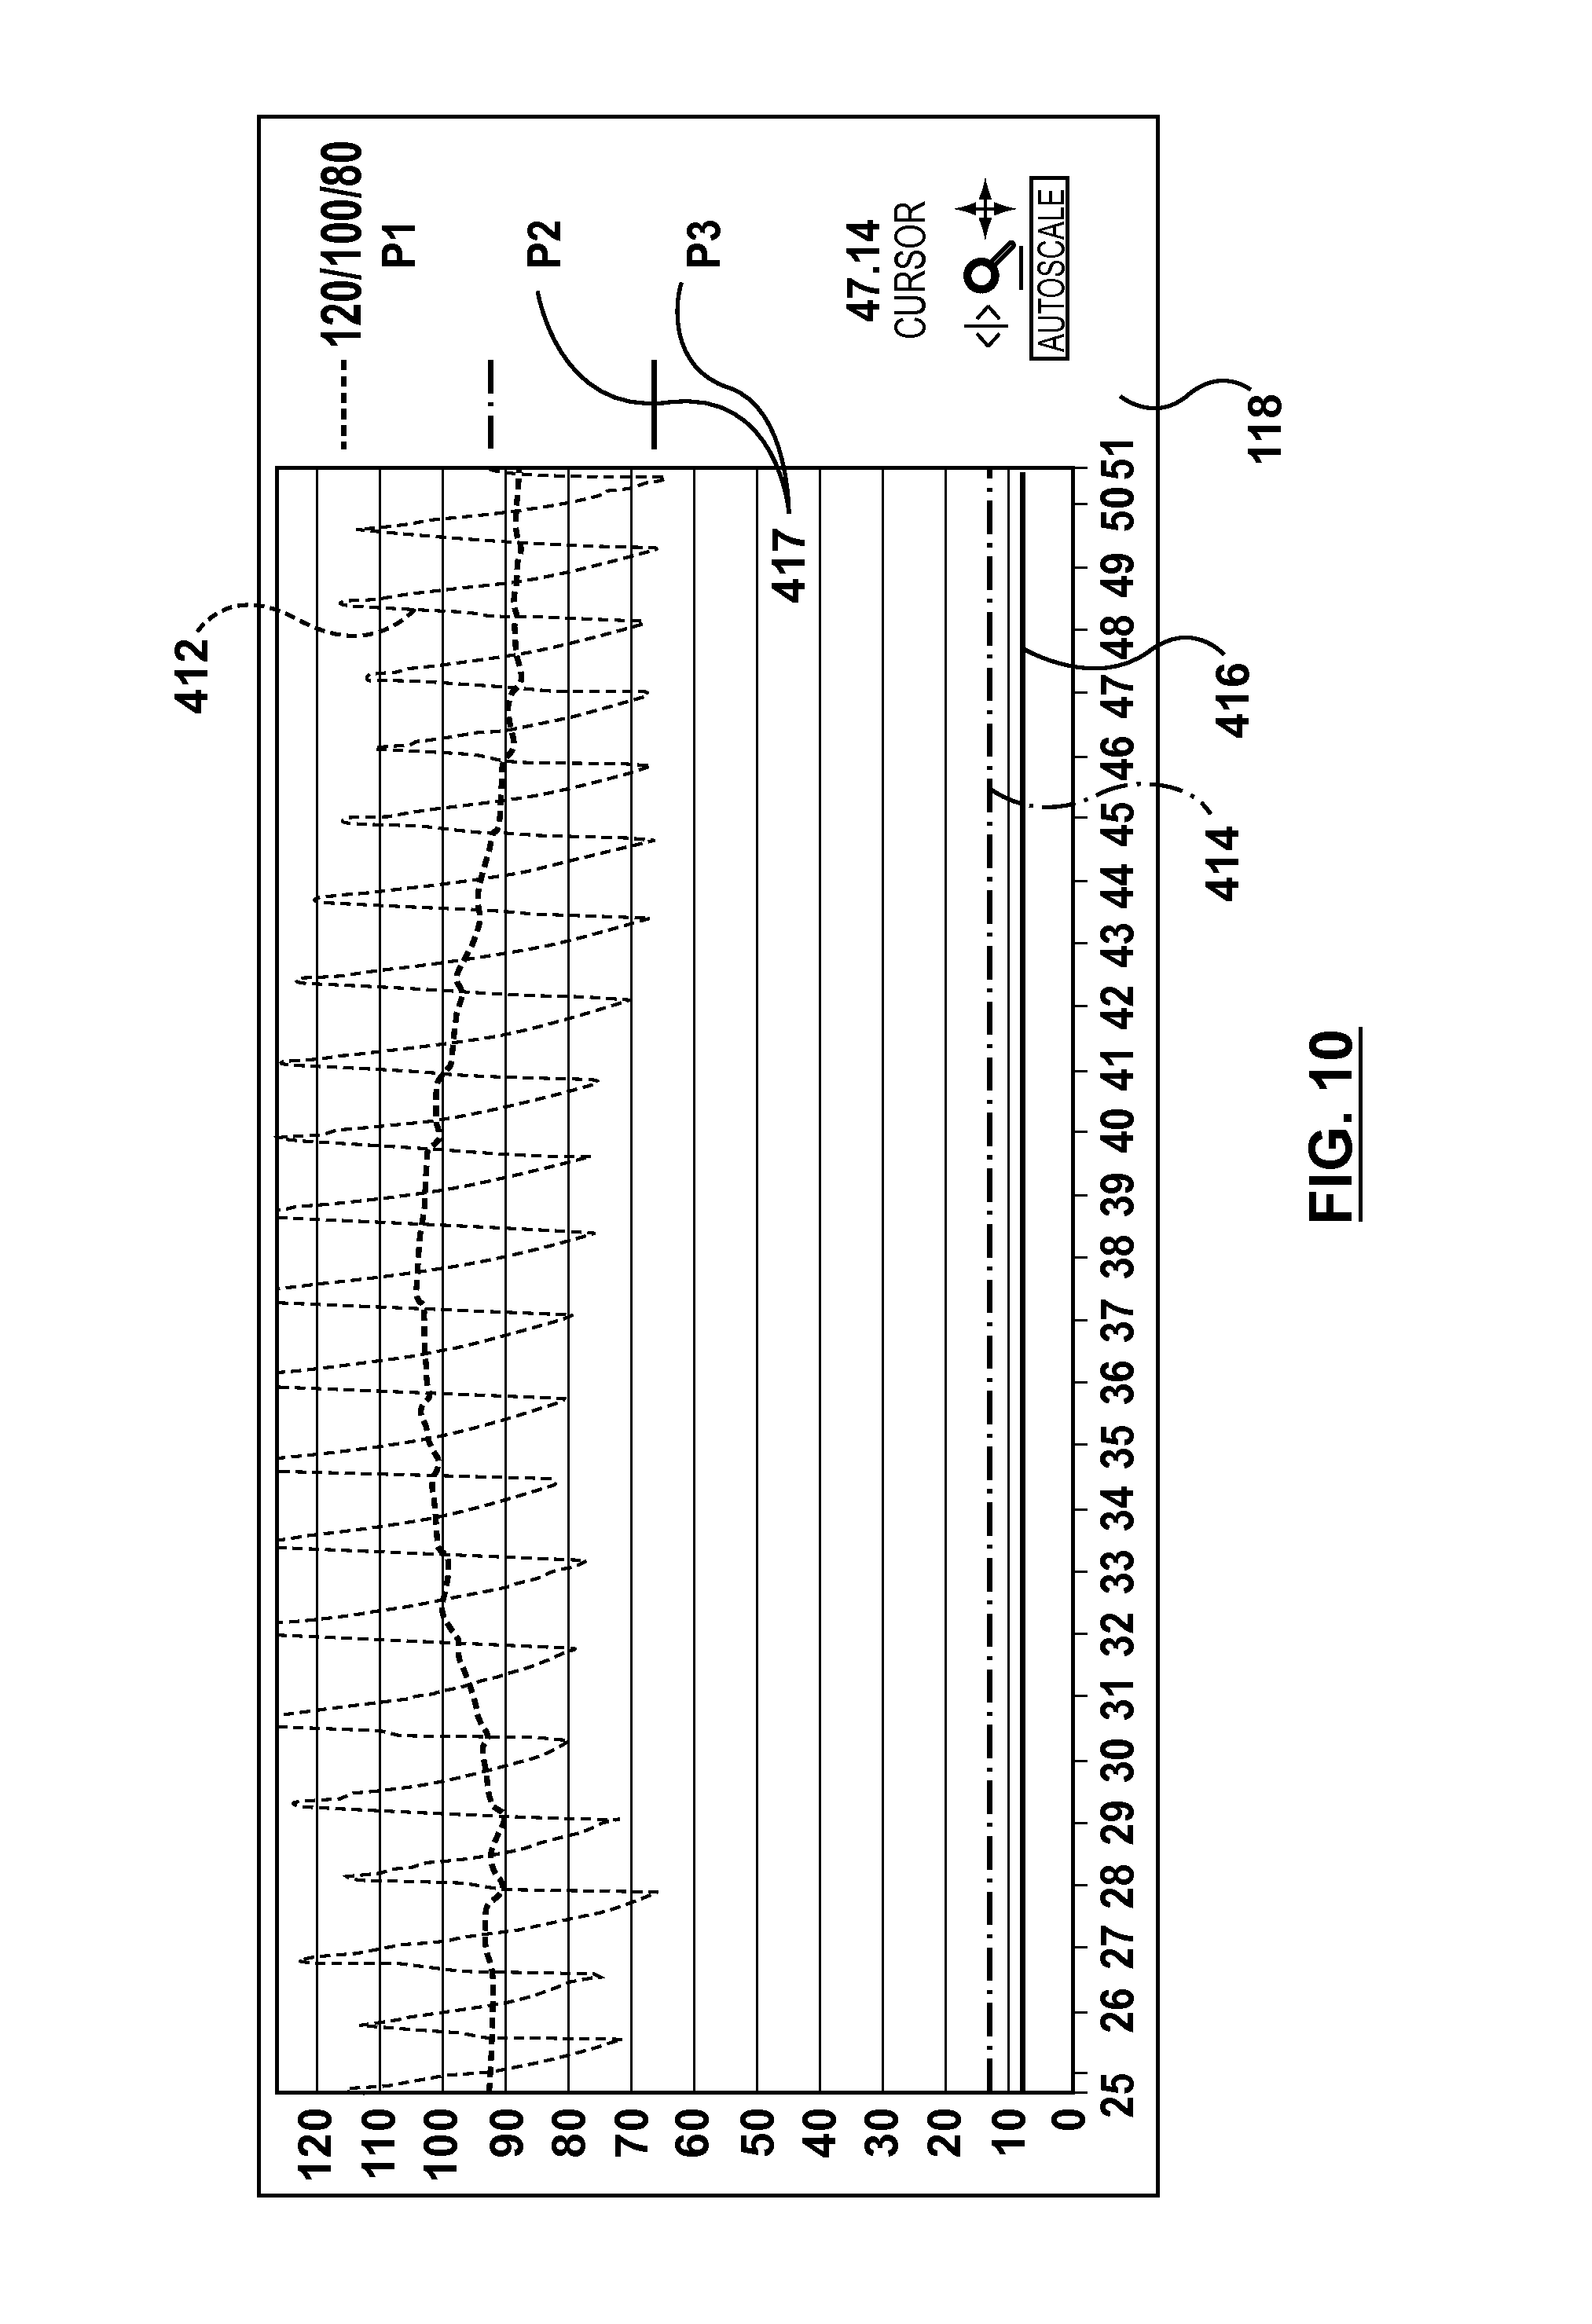
FIGS. 8-13 are an exemplary screen shots of a cath-lab display monitor during an FFR procedure using an embodiment of the processing system hereof.
DETAILED DESCRIPTION OF THE INVENTION
Specific embodiments of the present invention are now described with reference to the figures, wherein like reference numbers indicate identical or functionally similar elements. The terms "distal" and "proximal" are used in the following description with respect to a position or direction relative to the treating clinician when describing an object or device manipulated by the clinician. "Distal" and "distally" are positions distant from or in a direction away from the clinician. "Proximal" and "proximally" are positions near or in a direction toward the clinician. The terms "distal" and "proximal", when used with respect to a position in a vessel refer to a position or direction relative to the direction of blood flow. Accordingly, "distal" and "distally" are positions downstream of a reference position, and "proximal" and "proximally" are positions upstream of the reference position.
The following detailed description is merely exemplary in nature and is not intended to limit the invention or the application and uses of the invention. Although the description of the invention is in the context of treatment of blood vessels such as the coronary arteries, the invention may also be used in any other body passageways where it is deemed useful such as but not limited to peripheral arteries, carotid arteries, renal arteries, and/or venous applications. Furthermore, there is no intention to be bound by any expressed or implied theory presented in the preceding technical field, background, brief summary or the following detailed description.
With reference to FIG. 1, a conventional catheterization laboratory generally may include, but is not limited to, a patient table 104, an imaging device 102, and a hemodynamic monitoring system 110. Hemodynamic monitoring system 110 may include, for example and not by way of limitation, a data acquisition unit 112, a processor 114, display monitors 116, and cath-lab display monitors 118, as shown in FIG. 1. Other systems and sub-systems may also be included in a catheterization laboratory.
FIG. 2 shows a schematic illustration of some equipment in a catheterization laboratory of FIG. 1 according to an embodiment hereof. In particular, FIG. 2 shows patient table 104, hemodynamic monitoring system 110, an FFR measurement device 120 including a distal pressure measurement device 122, a proximal or aortic pressure measurement device 124, and a processing unit 130. As in FIG. 1, hemodynamic monitoring system 110 includes a data acquisition unit 112, a processor 114, display monitors 116, and cath-lab display monitors 118. Signals from distal pressure measurement device 122 and aortic pressure measurement device 124 as sent to processing unit 130 as indicated by arrows 126, 125, respectively, and as explained in more detail below. Output signals from processing unit 130 are sent to data acquisition unit 112 of hemodynamic monitoring system 110 as indicated by arrow 127. Data acquisition unit 112 sends data to hemodynamic monitoring system 110, as indicated by arrow 128. Further, information from hemodynamic monitoring system 110 is displayed on cathlab display monitors, as indicated by arrow 129.
As explained above, hemodynamic monitoring systems 110 are conventional devices generally found in catheterization laboratories. Conventional hemodynamic monitoring systems include, but are not limited to MAC-LAB IT, XT, and XT1 available from GE Healthcare USA, McKesson Cardiology Hemo available from McKesson, Merge Hemo available from Merge Healthcare, Xper Physiomonitoring available from Phillips Healthcare, and AXIOM Sensis XP Hemo available from Siemens Healthcare. Hemodynamic monitoring system 110 is not limited to the listed examples. Data acquisition unit 112 is a data acquisition unit associated with hemodynamic monitoring system 110. Data acquisition unit 112 provides ports for attachment to cables for devices which directly measure blood pressure from inside the veins, heart and arteries, and transmit such data to processor 114 of hemodynamic monitoring system 110. For example, and not by way of limitation, the GE Healthcare MAC-LAB hemodynamic recording system may include a TRAM module data acquisition unit.
As explained above, conventional hemodynamic monitoring systems 110 are used to measure, record, and display intra-arterial blood pressure (IBP) and other properties, such as the amount of oxygen in the blood. However, conventional hemodynamic monitoring systems 110 cannot be used to measure and display FFR values during FFR procedures. Instead, either a separate system or a software upgrade to conventional systems is required. In the embodiment of FIG. 2, however, a conventional hemodynamic monitoring system 110 receives data from interface or processing unit 130 such that FFR measurements may be recorded and displayed through hemodynamic monitoring system 110 and display monitors 116, 118. Accordingly, as shown schematically in FIG. 2, processing unit 130 receives data from FFR measurement device 120. Accordingly, for the purposes of this application, the term "conventional hemodynamic monitoring system" means a hemodynamic monitoring system that does not include specific FFR recording or displaying capabilities. Accordingly, hemodynamic systems that include such FFR recording or displaying capabilities or hemodynamic systems that have had a software upgraded to include such capabilities are not "conventional hemodynamic monitoring systems.
FFR measurement device 120 can be any device or system used to measure pressures to be used to calculate FFR. As explained above, FFR measurement device 120 generally includes distal pressure measurement (also referred to as P.sub.d) device 122. In some embodiments, FFR pressure measurement device may also include aortic or proximal pressure measurement (also referred to as P.sub.a) device 124. However, whether aortic pressure measurement device 124 is considered part of FFR pressure measurement device 120 or is considered a separate device does not affect the present disclosure. Aortic pressure measurement device 124 generally includes a guide catheter inserted into the aorta with an external AO pressure transducer. However, other devices can be used to for measuring the aortic or proximal pressure. Distal pressure measurement device 122 may be, for example and not by way of limitation, a guidewire with a pressure sensor disposed at a distal end thereof, a catheter configured to take a pressure measurement of blood distal to the target lesion, or any other device suitable to take the distal pressure measurement. For example, and not by way of limitation, distal pressure measurement device 122 may be any of the devices described in U.S. patent application Ser. No. 14/080,433; Ser. No. 14/080,484, both filed on Nov. 14, 2013; Ser. No. 14/155,723 filed Jan. 14, 2014; and Ser. No. 14/259,896 filed Apr. 23, 2014, each of which is incorporated by reference herein in its entirety.
FIG. 3 shows a block diagram of an embodiment of how processing unit 130 interacts with distal pressure measurement device 122, aortic pressure measurement device 124, and data acquisition unit 112 of hemodynamic monitoring system 110. In particular, processing unit 130 receives inputs from distal pressure measurement device 122 and aortic pressure measurement device 124. Processing unit 130 may receive such inputs by a cable connection to distal pressure measurement device 122 and aortic pressure measurement device 124. Alternatively, one or both of distal pressure measurement device 122 and aortic pressure measurement device 124 may include a wireless transmitter to wirelessly transmit a signal to processing unit 130, which in such an embodiment includes a wireless receiver (not shown).
After processing the data received from distal pressure measurement device 122 and aortic pressure measurement device 124, described in more detail below, processing unit 130 outputs data to data acquisition unit 112 of hemodynamic monitoring system 110. In particular, and as described in more detail below, a typical data acquisition unit 112 of hemodynamic monitoring system 110 includes at least three (3) pressure inputs or ports P1, P2, P3, as shown in FIG. 3. Pressure ports P1, P2, P3 are configured to receive data regarding blood pressure from devices typically used in catheterization laboratories, for example, and not by way of limitation, devices which measure intra-arterial blood pressure. Data acquisition unit 112 and processor 114, or, more generally, hemodynamic monitoring system 110, process the pressure data and display such pressure data on cath-lab display monitors 118. Accordingly, hemodynamic monitoring system 110 is configured to receive such pressure data from transducers in millivolts (mV) and to display such data as representative of pressure in millimeters of mercury (mmHg).
Accordingly, FIG. 4 shows a block diagram of the main elements of a processing unit 130 using a digital approach. FIG. 5 illustrates the steps in the general operation of processing unit 130. Processing unit 130 includes a first input 131a for receiving a signal from aortic pressure measurement device 124 and a second input 131b for receiving signals from distal pressure measurement device 122. However, the specific devices from which inputs receive signals may be varied depending on the FFR measurement device 120. For example, and not by way of limitation, the distal pressure measurement device in some embodiments may also measure proximal pressure such that only a single input is needed in processing unit 130. First input 131a and second input 131b may be any input suitable for use with aortic pressure measurement device 124 and distal pressure measurement device 122. For example, and not by way of limitation, first input 131a and second input 131b may each be a receptacle, socket or port configured to receive a plug or prong at an end of a cable coupled to aortic pressure measurement device 124 and distal pressure measurement device 122, respectively. In another non-limiting example, first input 131a and/or second input 131b may be a wireless receiver configured to receive a wireless signal from aortic pressure measurement device 124 and/or distal pressure measurement device 122, respectively.
As shown in FIGS. 4 and 5, the following steps are taken by a controller 160 of processing unit 130. In particular, in step 202, controller 160 receives a signal (Pd) from distal pressure measurement device 122 through a distal pressure measurement signal conditioner 132 and an analog-to-digital converter 134. Similarly, in step 204, controller 160 receives a signal (Pa) from aortic pressure measurement device 124 through an aortic pressure measurement signal conditioner 136 and an analog-to-digital converter 138. Analog-to-digital converters 134, 138 may not be included in processing unit 130. In particular, if the signals from distal pressure measurement device 122 and/or aortic pressure measurement device are received wirelessly, such signals may be converted to digital signals before being is sent to processing unit 130. For example, and not by way of limitation, the signal from distal pressure measurement device 122 may be converted to a digital signal within FFR measurement device 120 and then sent wirelessly to processing unit 130. Signal conditioners 132, 136 may be any devices or processes used to make the signals received by processing unit suitable for processing. For example and not by way of limitation, signal conditioners 132, 136 may condition the signals from distal pressure measurement device 122 and aortic pressure measurement device 124 through amplification, filtering, converting, range matching, isolation, and other similar processes or devices.
The signal from aortic pressure aortic pressure measurement device 124 is used both to calculate Pa, as described in more detail below (steps 218, 220), and to calculate FFR (step 206). Similarly, the signal from distal pressure measurement device 122 is used both for Pd, as described in more detail below (steps 214, 216), and to calculate FFR (step 206). In step 206, controller 160 calculates the FFR ratio. As explained above, the FFR ratio is a ratio of the distal pressure in relation to the aortic pressure. Thus, FFR is calculated as P.sub.d divided by P.sub.a. Accordingly, FFR is a ratio without units. Further, since the distal pressure is generally less than the aortic pressure, the FFR ratio is generally between 0.00 and 1.00, and more particularly, between 0.01 and 1.00.
Step 207 shown in FIG. 5 is an optional step of applying a correction factor to the calculated FFR. Step 207 is optional because the correction factor is not needed for a guidewire-based distal pressure measurement device. However, in some instances, with a catheter based distal pressure measurement device 122, it may be necessary to apply a correction factor to the FFR. This is due to the fact that a catheter-based distal pressure measurement device 122 may be larger in cross-section than a guidewire-based distal pressure measurement device 122. In such a situation, the larger crossing profile of the device itself may cause an obstruction and artificially increase the pressure drop across the lesion. Accordingly, in such a situation, the distal pressure measured may be lower than the distal pressure measured across the identical lesion with a guidewire-based distal pressure measurement device 122. Such an artificially lower distal pressure would also result in an artificially low FFR ratio. Thus, comparing an FFR measurement with a catheter-based distal pressure measurement device with traditional values of FFR with a guidewire-based distal pressure measurement device would result in interventional procedures for lesions that traditionally would not require intervention. Accordingly, in step 207, a correction factor CF may be applied to the calculated FFR. Such a correction factor CF is calculated using clinical data, mathematical formulas, or a combination of both. In another embodiment, the correction factor may instead be applied to the distal pressure measurement P.sub.d. Applying the correction factor to the distal pressure measurement P.sub.d provides for the correct value for FFR and also provides a distal pressure P.sub.d that is consistent with the distal pressure that would have been obtained with a guidewire-based distal pressure measurement device. In such a situation, the correction factor CF.sub.Pd may be applied after the digital pressure signal is received but prior to calculating FFR, as indicated in step 207a of FIG. 5. If CF.sub.Pd is used to correct the distal pressure measurement P.sub.d, the following formula would be used:
.times..times..times..times..times..times..times..times..times. ##EQU00001##
Many conventional hemodynamic monitoring systems do not include the ability to apply a correction factor to the FFR calculation or to the distal pressure measurement P.sub.d. Thus, processing system 130 as described herein provides the additional benefit of being compatible with a catheter-based distal pressure measurement device 122 without the need for costly software upgrades to conventional hemodynamic monitoring systems or the purchase of a separate system just for FFR measurements.
As explained in more detail below, the present application describes displaying FFR on a device configured to display blood pressure. Accordingly, in order to be meaningfully displayed, FFR should be in the same range or scale as normally observed for blood pressure. Most conventional hemodynamic recording systems do not have the ability to individually control the scale of the displays for P1, P2, and P3. In such systems, the graph displayed by cath-lab monitors 118 is generally from 0 to 120, as shown by the vertical axis in FIG. 6. However, with FFR calculated as a ratio between 0.00 and 1.00, displaying FFR on a scale of 0 to 120 would be hard to distinguish. Thus, in such cases, step 208 controller 160 converts FFR to a number from 0 to 100, although generally it will be at least 1. This is done by multiplying the FFR ratio by 100. For example, and not by way of limitation, if the aortic pressure P.sub.a is 88 mmHg and the distal pressure P.sub.d is 66 mmHg, controller 160 will calculate FFR as 0.75 in step 206. Controller 160 will further multiply 0.75 by 100 in optional step 208 such that FFR can be displayed as 75 mmHg in the same range as the aortic and distal pressures, as explained in more detail below. If FFR were displayed as 0.75, the FFR value would not be distinguishable in the graph of FFR on the cath-lab display monitors 118 due to the scale used for pressure readings, as will be apparent below. Some conventional hemodynamic recording systems allow a user to select individual scales for P1, P2, and P3. In such a situation, a scale of 0.00 to 1.00 can be used for P3 while the conventional scale of 0 to 120, as shown in FIG. 6, can be used for P1 and P2. In such a situation, step 208 is not necessary.
In step 210, the converted FFR value is converted to a "pressure format". The term "pressure format" as used herein means the format that conventional hemodynamic monitoring systems use to record and display pressures in mmHg. Thus, for example, the FFR ratio (which does not have a unit of measure) will be displayed on cath-lab monitors 118 as 75 mmHg on P3 (or 0.75 mmHg if step 208 is not utilized). Most pressure transducers in use conform to the ANSI/AAMI BP22-1994 standard for blood pressure transducers, accepting an excitation voltage of 4 to 8 VRM5 at a frequency of 0 to 5 kHz, and having a sensitivity of 5 .mu.V/V/mmHg (5 .mu.V output per volt of excitation voltage per mmHg of pressure), an input impedance greater than 200 ohms, an output impedance smaller than 3,000 ohms, and a zero balance within .+-.75 mmHg. Accordingly, the transducer aortic pressure measurement device 124 generally will conform to ANSI/AAMI BP22-1994. The transducers used in distal pressure measurement device 122 may conform to ANSI/AAMI BP22-1994, but need not. In particular, if controller 160 knows the pressure that corresponds to the signal it receives from distal pressure measurement device 122, then that is sufficient for performing the functions of controller 160. However, in order to properly communicate with hemodynamic monitoring system 110, the outputs from processing unit 130 must be in the above-referenced "pressure format", and such conventional hemodynamic monitoring systems 110 generally use this ANSI/AAMI BP22-1994. Thus, the outputs from processing unit 130 are in mV such that they can be recorded and displayed as mmHg in hemodynamic monitoring system 110. Thus, for the FFR ratio to be displayed in "pressure format", the signal sent to hemodynamic monitoring system 110 needs to be the signal that would have been produced by a pressure transducer detecting a blood pressure of the value of the converted FFR. For example, and not by way of limitation, for a transducer sensitivity of 5 .mu.V/V/mmHg, an excitation voltage of 5 V and a pressure of 100 mmHg, a pressure transducer will output a differential voltage of (5 .mu.V/V/mmHg).times.(5 V).times.(100 mmHg), or 2.5 mV. For the same combination of sensitivity, excitation voltage and pressure, the interface will also output the same differential voltage of 2.5 mV. This differential voltage can be expressed algebraicly as: V.sub.EXC.times.SENS.times.FFR, where V.sub.EXC is the root-mean-square (RMS) differential voltage across the excitation terminals, SENS is the transducer sensitivity which the hemodynamic monitoring system 140 is configured to work with, and FFR is the converted FFR value. Controller 160 also emulates the input and output impedances of a pressure transducer. In summary, in step 210, controller 160 computes the equivalent differential pressure transducer output voltage as the product of the transducer sensitivity, excitation voltage and converted FFR value, and computes an appropriate digital value that is proportional to the equivalent differential voltage.
After controller 160 has converted the FFR value to a pressure format, controller 160 sends the digital value to a digital-to-analog converter 162, as shown in FIG. 4 and step 212 in FIG. 5.
As described above, in step 202, controller 160 receives a signal from distal pressure measurement device 122 through distal pressure measurement signal conditioner 132 and analog-to-digital converter 134 (if necessary, see paragraph 0028 above). In step 214, controller 160 computes the digital value for the measured distal blood pressure. Step 214 is similar to step 210, except that instead of an FFR value, the measured distal blood pressure from distal pressure measurement device 122 is used. Controller 160 then sends this digital value to a digital-to-analog converter 164, as shown in FIG. 4 and step 216 in FIG. 5.
Similarly, and also as described above, in step 204, controller 160 receives a signal from aortic pressure measurement device 124 through aortic pressure measurement signal conditioner 136 and analog-to-digital converter 138. In step 218, controller 160 computes the digital value for the measured aortic blood pressure. Step 218 is similar to step 210, except that instead of an FFR value, the measured aortic pressure value from aortic pressure measurement device 124 is used. Controller 160 then sends this digital value to a digital-to-analog converter 166, as shown in FIG. 4 and step 220 in FIG. 5.
In step 222, the signals from digital-to-analog converters 162, 164, and 166 are sent to hemodynamic monitoring system 110. In an embodiment, the signals from digital-to-analog converters 162, 164, and 166 are sent to receptacles or ports P3, P2, and P1 of data acquisition unit 112, respectively, such as through outlets, plugs, or prongs 168, 170, and 172, as shown in FIG. 4. Data from data acquisition unit 112 is then utilized by the remainder of hemodynamic monitoring system 110, such as but not limited to, processor 114 and cath-lab display monitor 118, as shown in FIG. 4.
The resulting display on cath-lab display monitor 118 may be as depicted in FIG. 6. As can be seen in FIG. 6, the proximal or aortic pressure measurement is shown as P1, the distal pressure measurement is shown as P2, and the FFR value is shown in pressure format as mmHg as P3. A clinician viewing cath-lab display monitor 118 knows that the P3 reading of 71 mmHg in FIG. 6 means an FFR of 0.71.
Processing system 130 hereof may also include other features and devices as needed or desired. For example, and not by way of limitation, a power source 174 may be provided as part of processing system 130. Power source 174 may be a battery or a receptacle configured to receive power from another source, such as a power outlet. Other devices or features, such as but not limited to, wireless receivers and transmitters, indicators such as lights, alarms, and other similar features.
FIG. 4A shows a processing system 130a similar to processing system of FIG. 4. However, in processing system 130a, the aortic pressure signal from aortic pressure measurement device 124 is not converted to a digital signal and then converted back to an analog signal before being sent to port P1. Instead, second input 131b of processing unit 130 receives a signal from aortic pressure measurement device 124. The signal is conditioned by aortic pressure measurement signal conditioner 136 and is sent to receptacle or port P1 through outlet plug, or prong 172, as shown in FIG. 4A. Further, the signal is split and sent to controller 160 through analog-digital converted 138, as shown in FIG. 4A. The remainder of the processing through controller 160 and to ports P2 and P3 is as described above with respect to FIGS. 4 and 5.
FIG. 7 shows an embodiment of a method of preparing and using the systems described above for an FFR procedure. In particular, in step 302, processing system 130 is connected to conventional hemodynamic monitoring system 110. In the embodiment described above, step 302 may be accomplished by connecting outlets, plugs, or prongs 168, 170, and 172 of processing system 130 to inputs P3, P2, P1 of data acquisition unit 112 of conventional hemodynamic monitoring system 110.
With processing system 130 connecting to conventional hemodynamic monitoring system 110, channels for P1, P2, P3 are "zeroed". The conventional hemodynamic monitoring system 130 may prompt the user to zero the channels. "Zeroing" the channels sets "zero" for each port P1, P2, and P3. Since processing system 130 is not yet connected to aortic pressure measurement device 124 or distal pressure measurement device 122, ports P1, P2, and P3 should be recording a pressure of zero. Step 304 sets this zero.
Step 306 is inserting aortic pressure measurement device 124 into the blood stream. As noted above, aortic pressure measurement device 124 generally includes a guide catheter (not shown) inserted into the aorta with an external AO pressure transducer. In step 306, the guide catheter is advanced through the vasculature such that the guide catheter is disposed within the aorta with a distal end thereof disposed within the aorta at an ostium of the aorta adjacent the branch vessel within which a target lesion is located. Although step 306 is shown and described prior to steps 308-314, step 306 does not necessarily need to be before steps 308-314.
In step 308, aortic pressure measurement device 124 is connected to processing system 130 and activated. As explained above, aortic pressure measurement device 124 may be connected to processing system 130 by a cable or by a wireless connection. If a wireless connection is used, the wireless connection between aortic pressure measurement device 124 and processing system 130 is made automatically when aortic pressure measurement device 124 is activated, such as by turning aortic pressure measurement device "on". With aortic pressure measurement device 124 activated, hemodynamic monitoring system 110 displays the AO pressure as trace 402 on display monitor 118 of conventional hemodynamic monitoring system 110 at port P1 through processing system 130, as shown in FIG. 8. As also described in step 306, aortic pressure measurement device 124 is flushed. Aortic pressure measurement device 124 can be flushed with saline or other fluids. Pressure wave 402 represents the pressure recorded by the external AO pressure transducer of aortic pressure measurement device 124. Distal pressure measurement device 122 is not yet connected to the system. Accordingly, ports P2 and P3 are not recording any data.
Step 310 of shown in FIG. 7 is to open the stopcock of the AO pressure transducer of aortic pressure measurement device 124. With the AO pressure transducer opened to atmosphere, the pressure recorded by port P1 connected to aortic pressure measurement device 124 drops near zero, as shown by trace 406 in FIG. 9. Trace 406 may not drop all the way to 0 mmHg because aortic pressure measurement device 124 has not yet been "zeroed".
Step 312 shown in FIG. 7 is to activate distal pressure measurement device 122. Distal pressure measurement device 122 is activated while it is still outside of the body. Distal pressure measurement device 122 is also connected to processing system 130 and, because processing system 130 is connected to hemodynamic monitoring system 110, as explained above, distal pressure measurement device 122 is connected to hemodynamic monitoring system 110 through processing system 130. As explained above, distal pressure measurement device 122 may be connected to processing system 130 by a cable or by a wireless connection. If a wireless connection is used, the wireless connection between distal pressure measurement device 122 and processing system 130 is made automatically when activating distal pressure measurement device 122, such as by turning distal pressure measurement device "on". With distal pressure measurement device 122 activated and not inserted into the body, hemodynamic monitoring system 110 displays the AO pressure as trace 412, the pressure from distal pressure measurement device 122 as trace 414 through port P2, and trace 416 through port P3, as shown in FIG. 10. As explained above, port P3 is the FFR calculation converted to a pressure format. For the purposes of the example screens shown in the Figures, the FFR value has also been multiplied by 100 to put it the range from 1-100. However, as seen in FIG. 10, pressure trace 416 for port P3/FFR reads zero. This is a safety feature than may incorporated into controller 160 such that FFR is not outputted to hemodynamic system 110 until after the ports have been equalized, as explained in more detail below.
The user then flushes distal pressure measurement device 122, as shown in step 314. Distal pressure measurement device 122 can be flushed with saline or other fluids. Other steps to prepare distal pressure measurement device for insertion into the patient can also be performed, as necessary.
Ports P1, P2, and P3 are then "zeroed" in controller 160, as shown in step 316 of FIG. 7. To "zero" ports P1, P2, and P3, both the aortic transducer of aortic pressure measurement device 124 and distal pressure measurement device 122 are opened to atmosphere, such as by opening a stopcock of each device, as described above. Buttons or other devices on the distal pressure measurement device 122, aortic pressure measurement device 124, processing system 130, external interface 180 or other devices connected to controller 160 may be activated. "Zeroing" of the ports gives controller 160 control of the zero level for each device. Thus, the pressures for ports P1, P2, and P3 are all calibrated to zero when measuring atmospheric pressure. As shown in FIG. 11, the traces 420 for all three ports P1, P2, and P3 reflect a pressure of zero. Also, the pressures for each read zero at 418, as also shown in FIG. 11.
Step 318 of FIG. 7 is to insert distal pressure measurement device 122 in the patient and advance distal pressure measurement device 122 in the guide catheter of aortic pressure measurement device 124. Distal pressure measurement device 122 is generally advanced to a distal end of the guide catheter, which is where aortic pressure measurement device 124 is reading the aortic or proximal pressure. Accordingly, at this location, distal pressure measurement device 124 and aortic pressure measurement device 122 should read the same blood pressure. However, as shown in FIG. 12, the pressure trace 422 from the aortic pressure measurement device 124 and the pressure trace 424 from the distal pressure measurement device 122 often do not match up. Also, at this time, port P3 is not registering a pressure. As explained above, port P3, which is supposed to display the FFR value in pressure format, is not displaying a pressure despite port P1 (Pa) and port P2 (Pd) registering pressures. This is a safety feature that may be incorporated into controller 160 such that FFR is not outputted to hemodynamic system 110 until after the ports have been equalized.
Accordingly, aortic pressure measurement device 124 and distal pressure measurement device 122 are "equalized", as shown in step 320 of FIG. 7. This is accomplished by processing system 130 by calculating the average difference between the pressure measured by aortic pressure measurement device 124 and the pressure measured by distal pressure measurement device 122, and offsetting or applying a correction factor to the pressure measured by distal pressure measurement device 122 to equalize it with the pressure measured by aortic pressure measurement device. FIGS. 4 and 4A show an external interface 180 used to equalize the values for Pa and Pd when the distal pressure measurement device 122 and aortic pressure measurement device 124 are measuring pressure at the same location. In particular, external interface 180 may be a controller, such as an HIB controller, that is connected to controller 160 of processing unit 130. External interface 180 may be part of processing unit 130 or may be couple thereto.
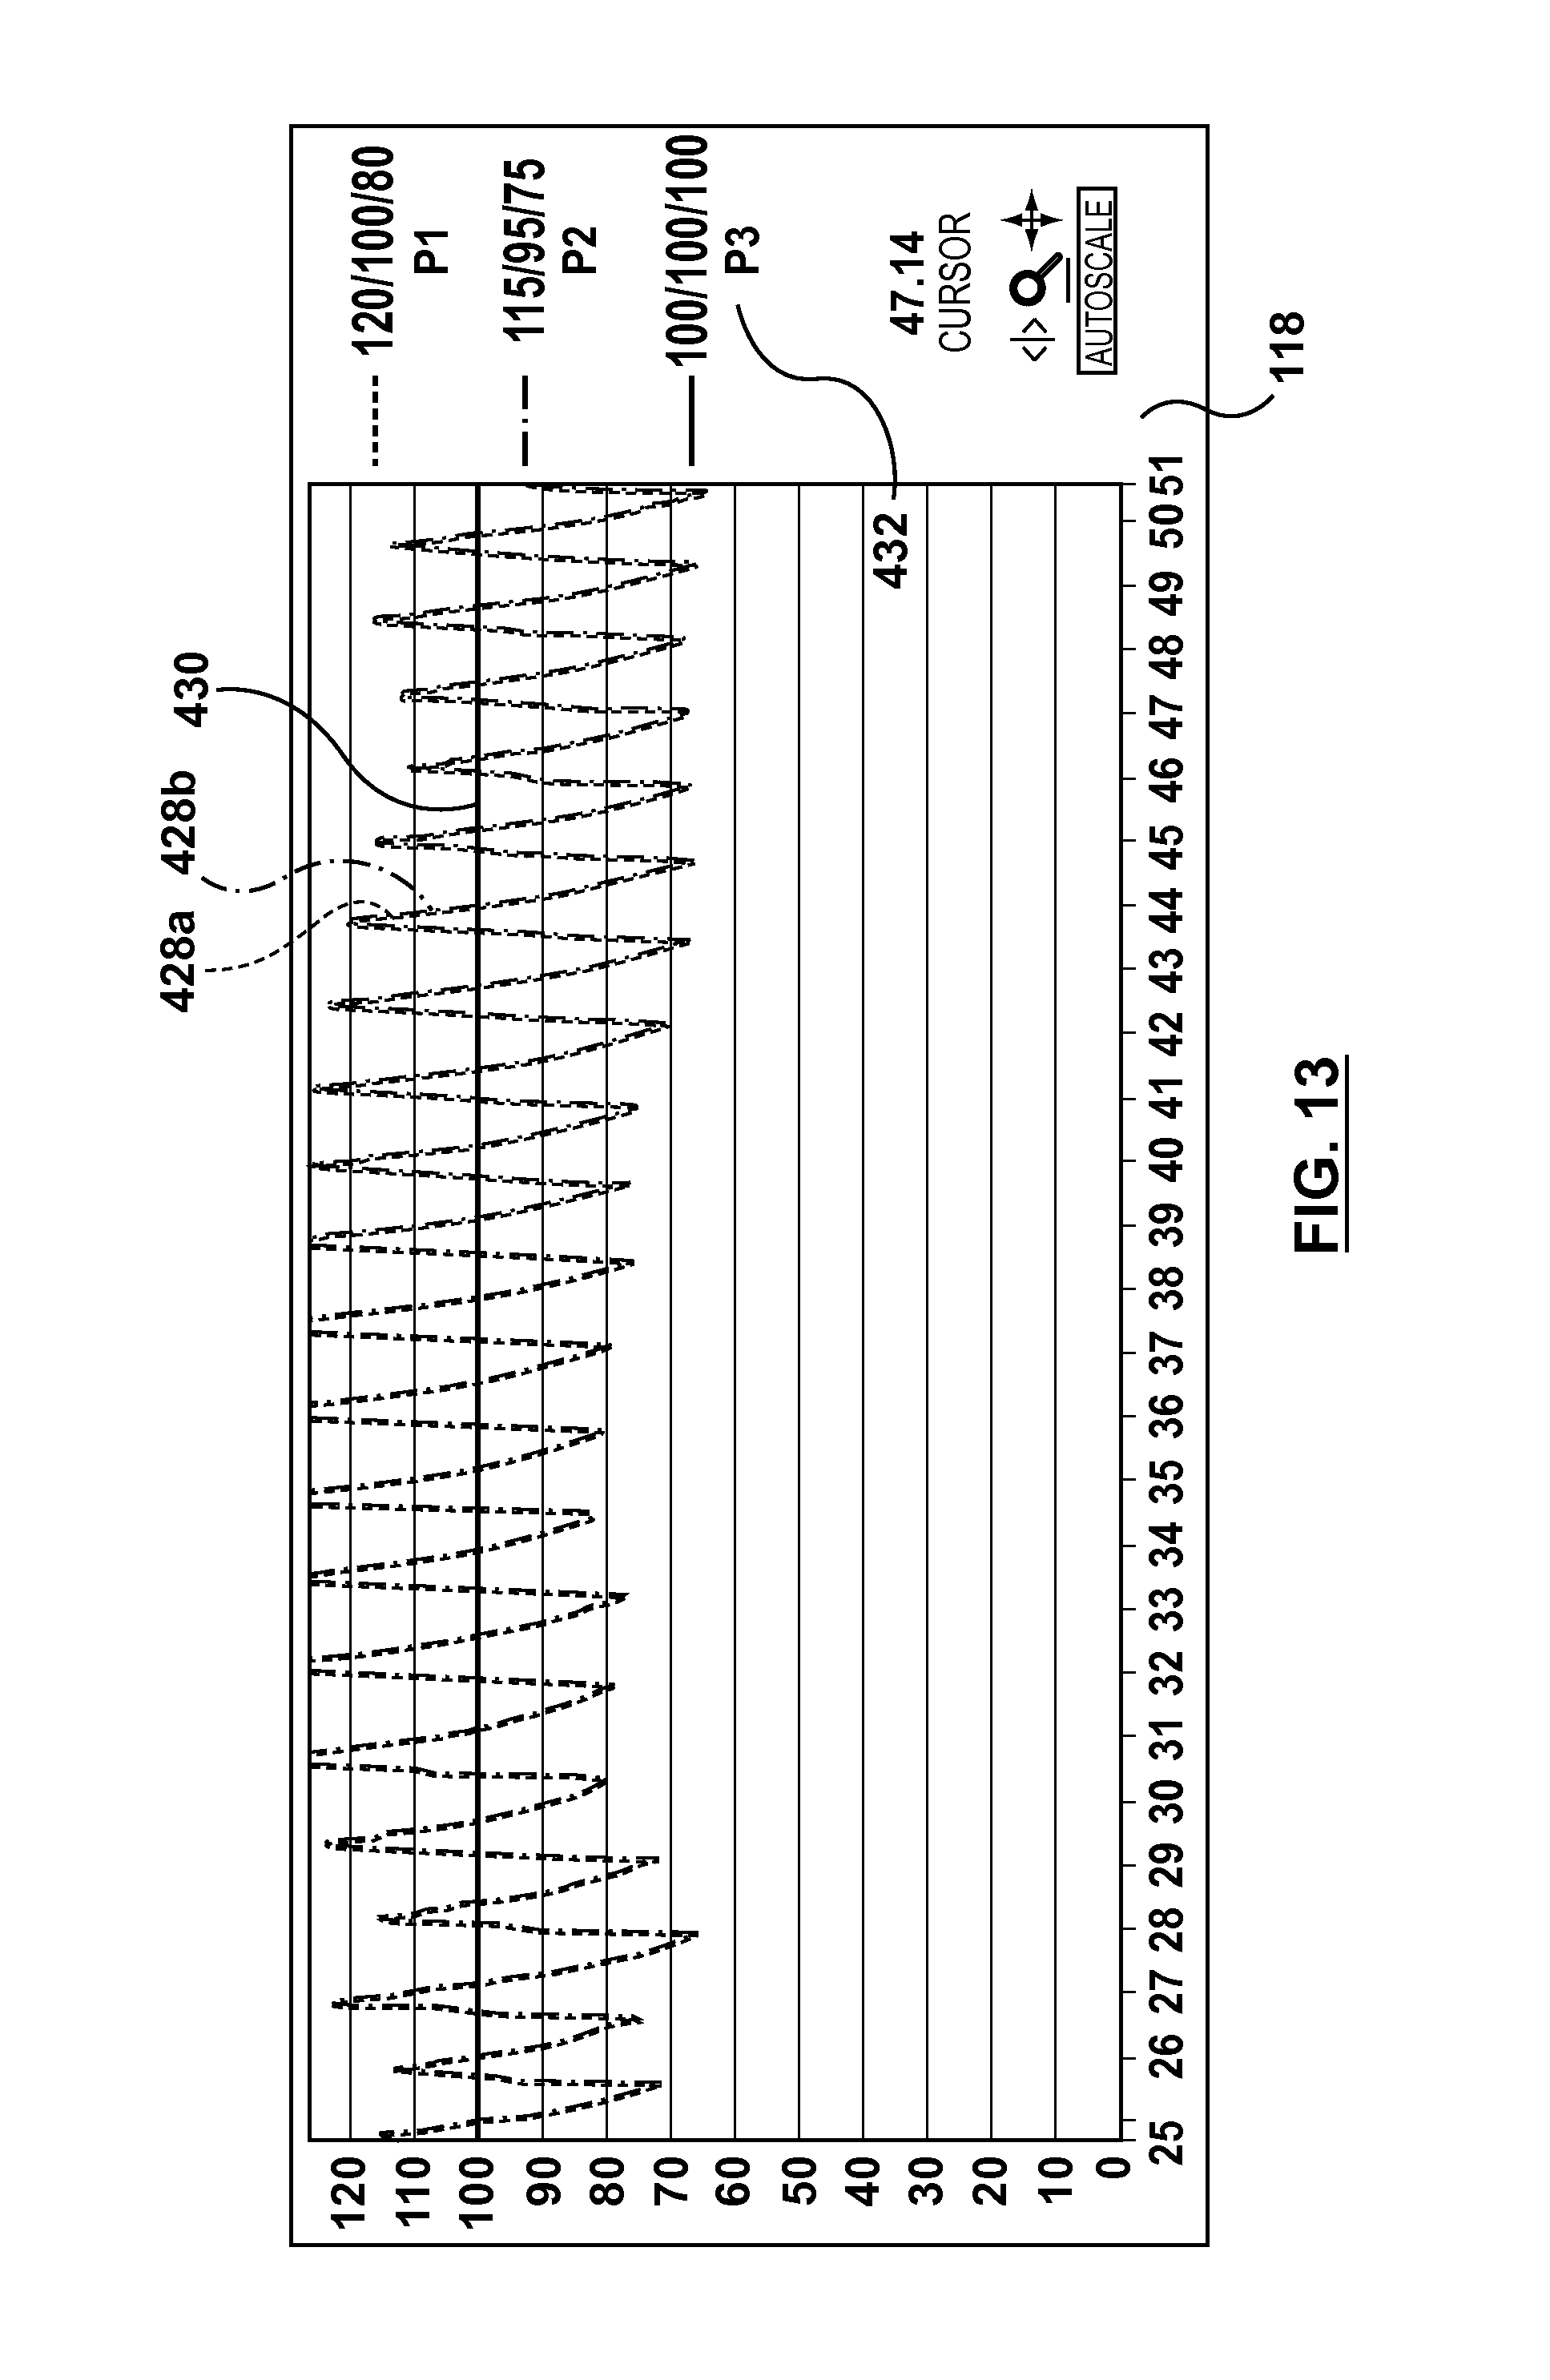
After the equalization step, with distal pressure measurement device 122 still located at the location where aortic pressure measurement device 124 takes the aortic pressure measurement (e.g., the distal end of the guide catheter), the pressure trace 428a aortic pressure measurement device 124 (Pa) and 428b for distal pressure measurement device 122 (P2) are the same, as shown in FIG. 13. Further, the pressures for both shown at 429 are the same. For clarity of visualization purposes, traces 428a/428b are shown side-by-side in FIG. 13 to represent P1 and P2. However, the traces would be nearly identical due the equalization step.
With the equalization step completed, controller 160 permits FFR to be calculated and displayed. Therefore, with distal pressure measurement device 122 still located at the location where aortic pressure measurement device 124 measures the aortic pressure, the FFR is also recorded and displayed through port P3, as explained above. Accordingly, with the distal pressure measurement device 122 and aortic pressure measurement device 122 measuring the same pressure, port P3 shows a pressure of 100 mmHg. However, as explained in detail above, while P3 displays a pressure, its value is not actually a pressure, but instead is FFR.times.100. Thus, as would be expected, when aortic pressure measurement device 124 and distal pressure measurement device 122 are measuring the same pressure, FFR would be 1.0. As explained above, in the embodiment where a separate scale is not used for port P3, FFR is multiplied by 100 in order to be within the same scale range as the measured pressures, and is converted to a pressure format. Thus, as shown in FIG. 13, FFR is displayed at trace 430 as 100 mmHg. However, a user knows that this trace is an FFR of 1.0. Further, P3 shows the FFR.times.100, as shown at 432 of FIG. 13.
With distal pressure measurement device 122 and aortic pressure measurement device 124 equalized and calibrated, distal pressure measurement device 122 is advanced into the target vessel such that distal pressure measurement device 122 measures blood pressure distal of the target lesion within the target blood vessel. For example, and not by way of limitation, a guidewire with a pressure transducer may be advanced such that the pressure transducer is located within the target blood vessel distal of the target lesion, in the direction of blood flow. In another example, and also not by way of limitation, distal pressure measurement device 122 is a catheter advanced over a guidewire, as described in co-pending U.S. application Ser. No. 14/259,896, incorporated by reference herein in its entirety above. The distal end of the catheter is advanced past the lesion such that the distal end of the catheter is located in the target blood vessel distal of the target lesion. Blood from distal of the target lesion is allowed to enter a distal opening of the catheter such that a transducer located within the catheter measures the pressure of blood distal of the target lesion. Other embodiments of distal pressure measurement device may also be used, as explained above. With distal pressure measure device 122 measuring blood pressure distal of the target lesion and aortic pressure measurement device 124 measuring blood pressure proximal of the target lesion, processing system 130 performs the steps described with respect to FIGS. 4-5 above, thereby resulting in a display such as shown on FIG. 6, with "P1" showing the aortic blood pressure (P.sub.a) in mmHg, "P2" showing the distal blood pressure (P.sub.d) in mmHg, and "P3" showing the FFR calculation multiplied 100 and shown in mmHg, despite FFR being unitless. Thus, a physician or other user knows that FFR for the display shown in FIG. 6, for example, is 0.71 merely by dividing P3 by 100.
While various embodiments according to the present invention have been described above, it should be understood that they have been presented by way of illustration and example only, and not limitation. It will be apparent to persons skilled in the relevant art that various changes in form and detail can be made therein without departing from the spirit and scope of the invention. Thus, the breadth and scope of the present invention should not be limited by any of the above-described exemplary embodiments, but should be defined only in accordance with the appended claims and their equivalents. It will also be understood that each feature of each embodiment discussed herein, and of each reference cited herein, can be used in combination with the features of any other embodiment.
* * * * *
D00000
D00001
D00002
D00003
D00004
D00005
D00006
D00007
D00008
D00009
D00010
D00011
D00012

D00013

D00014
M00001

XML
uspto.report is an independent third-party trademark research tool that is not affiliated, endorsed, or sponsored by the United States Patent and Trademark Office (USPTO) or any other governmental organization. The information provided by uspto.report is based on publicly available data at the time of writing and is intended for informational purposes only.
While we strive to provide accurate and up-to-date information, we do not guarantee the accuracy, completeness, reliability, or suitability of the information displayed on this site. The use of this site is at your own risk. Any reliance you place on such information is therefore strictly at your own risk.
All official trademark data, including owner information, should be verified by visiting the official USPTO website at www.uspto.gov. This site is not intended to replace professional legal advice and should not be used as a substitute for consulting with a legal professional who is knowledgeable about trademark law.